QuickLinks -- Click here to rapidly navigate through this document
Exhibit 99.3
The JBG Companies
The JBG Companies® is a trade name under which a collection of affiliated entities conducts business. Unless the context requires otherwise, references in this document to "we," "our," "us," "our company" and "JBG" refer to the real estate assets and the strategic capital business assets of the various entities comprising The JBG Companies® that will be contributed in the transaction (the "Combination Transactions") described in the Form 8-K to which this document is an exhibit. A number of terms used throughout this document are defined in the Glossary at the end of this document.
The composition of our portfolio and the nature and amount of our interests in the properties that comprise it are subject to change between now and the completion of the Combination Transactions. We can give no assurance that the Combination Transactions will close and, if it does, whether the properties described herein will be included as set forth herein, or at all.
For a discussion of the risks related to the JBG business, see exhibit 99.3 to this Current Report on Form 8-K (the "JBG Risk Factors").
Market Data
We use market data and industry forecasts throughout this document. We have obtained certain market and industry information from market research prepared for us by Jones Lang LaSalle Americas, Inc., or JLL, a nationally recognized real estate consulting firm. In addition, we have obtained certain market data from publicly available information and industry publications. These sources generally state that the information they provide has been obtained from sources believed to be reliable, but the accuracy and completeness of the information are not guaranteed. The forecasts and projections are based on industry surveys and the preparers' experience in the industry, and there is no assurance that any of the projections or forecasts will be achieved. We believe that the surveys and market research others have performed are reliable, but we have not independently verified this information.
Table of Contents
| | | | |
BUSINESS AND PROPERTIES | | | 3 | |
Overview | | | 3 | |
History | | | 4 | |
Our Portfolio Summary | | | 5 | |
All Assets | | | 5 | |
Operating Assets | | | 6 | |
Construction Assets | | | 7 | |
Pre-Development and Land Bank Assets | | | 7 | |
Our Competitive Strengths | | | 8 | |
Business and Growth Strategies | | | 16 | |
Case Studies | | | 27 | |
Our Assets | | | 41 | |
Office Assets | | | 42 | |
Multifamily Assets | | | 44 | |
Retail Assets | | | 46 | |
Land Bank | | | 48 | |
Our Office Assets | | | 51 | |
Office Assets—Government Services Administration | | | 56 | |
Our Multifamily Assets | | | 60 | |
Asset Revenue and Operating Expenses | | | 67 | |
Recent Developments | | | 83 | |
Our Strategic Capital Business | | | 83 | |
Outstanding Indebtedness | | | 86 | |
Our Joint Venture Arrangements | | | 88 | |
Non-Core Excluded Assets | | | 94 | |
INDUSTRY OVERVIEW AND MARKET OPPORTUNITY | | |
96 | |
JBG MANAGEMENT TEAM | | |
137 | |
GLOSSARY | | |
139 | |
INDEX TO FINANCIAL STATEMENTS | | |
F-1 | |
2
BUSINESS AND PROPERTIES
Overview
We are one of the premier real estate investment companies in the DC Metro area and own one of the largest high-quality portfolios of urban infill office, multifamily and retail assets in the region. We believe that our fully-integrated platform is capable of managing every aspect of real estate ownership, including investment, development, construction management, finance, asset management, property management and leasing. We have significant expertise in the DC Metro area across multiple asset classes and consider office, multifamily and retail to be our core asset classes. Our primary approach to value creation involves a series of complementary disciplines in a process that we call "Placemaking™." Placemaking™ involves strategically mixing high-quality multifamily and commercial buildings with anchor, specialty and neighborhood retail in a high density, thoughtfully planned and curated public space environment. Through this process, we are able to drive synergies across those varied uses and create unique, amenity-rich, walkable neighborhoods that are desirable and create significant tenant and investor demand.
As of March 31, 2016, our operating portfolio consisted of 72 assets with an aggregate of over 16.2 million rentable square feet, or RSF, predominantly located near major transportation nodes in some of the most attractive high-barrier to entry submarkets in the DC Metro area. Our operating portfolio is comprised of 38 office assets totaling over 9.1 million RSF, 19 multifamily assets totaling 6,517 units and over 5.6 million RSF and 15 retail assets totaling approximately 1.5 million RSF. Our office portfolio accounted for 72.2 percent of our share of annualized rent as of March 31, 2016, while our multifamily and retail portfolios accounted for 22.2 percent and 5.6 percent, respectively.
In addition to our operating portfolio, as of March 31, 2016, we controlled (i) a construction pipeline consisting of eight assets totaling approximately 537,000 RSF of office, 1,007 multifamily units and 147,000 RSF of retail with an estimated total development cost of approximately $813.9 million, (ii) a pre-development pipeline consisting of 12 assets totaling approximately 948,000 RSF of office, 932,000 RSF of multifamily and 86,000 RSF of retail with an estimated total development cost of over $1.1 billion and (iii) a land bank comprised of 41 future development parcels with an estimated potential density of approximately 19.5 million square feet. Of the 12 assets in our pre-development pipeline, we believe the majority have substantially completed the entitlement process, and we expect to be in a position to commence construction on six of these assets by March 31, 2017. We hold our interests in 40 of our operating assets, three of our construction assets, eight of our pre-development assets and 27 of our land bank assets through joint venture arrangements. See "—Our Joint Venture Arrangements." In addition to our portfolio, we have a management platform that provides fee-based real estate services to nine real estate investment funds, or the JBG funds, and joint ventures and, in certain limited cases, third parties. See "—Our Strategic Capital Business."
Our strategy is to invest in assets that we anticipate, by virtue of location, physical quality, amenities or other specific features, will possess a sustainable ability to outperform the market and maintain high occupancy levels through all market cycles, attract high-quality tenants and appeal to a broad range of buyers if offered for sale. Our operating portfolio is comprised of high-quality assets that generally share the following key attributes:
- •
- They have been recently constructed or renovated;
- •
- They provide an opportunity to integrate retail and other highly sought after amenities, including Metro access, which differentiates and adds value;
- •
- They are well-leased, with our stabilized portfolio approximately 94 percent leased as of March 31, 2016; and
- •
- They have a strong creditworthy office and retail tenant base.
3
We believe that we have invested in some of the most attractive submarkets within the DC Metro area, which is one of the highest barrier-to-entry markets in the United States. Our portfolio is concentrated in strategic submarkets within the DC Metro area, with over 86 percent of our operating assets, based on rentable square feet as of March 31, 2016, located inside the I-495 loop surrounding Washington, DC, which we refer to as the Beltway, and/or in locations within walking distance of an existing or planned Metro station, which we refer to as Metro-served locations. As of March 31, 2016, all of our construction pipeline and approximately 96 percent of our pre-development pipeline was located inside the Beltway and/or is Metro-served.
Our assets are located primarily within desirable submarkets such as: the Central Business District, Capitol Hill, Southwest, Southeast, Georgetown, NoMa and U Street/Shaw in Washington, DC; Reston, Rosslyn-Ballston Corridor, the I-395 Corridor and Tysons Corner in Northern Virginia; and Bethesda CBD, the Rockville Pike Corridor and Downtown Silver Spring in Suburban Maryland. Our current and target submarkets generally share the following key attributes that make them highly desirable and create significant tenant and investor demand:
- •
- They are densely populated urban infill submarkets;
- •
- They are Metro-served;
- •
- They exhibit high barriers to new development due to limited available land and/or entitlement constraints; and
- •
- They have a high degree of walkability and feature strong clusters of nearby amenities.
We are led by one of the most seasoned and experienced management teams in the industry. By combining our broad transactional skill sets, multi-asset class experience, deep organizational and financial expertise, and a long and successful track record built over 50 years, we are able to source and execute on a broad array of opportunities. We have developed an intimate knowledge of the DC Metro area and a detailed understanding of many submarkets on a block-by-block basis. We believe that our in-depth market knowledge and extensive network of long-standing relationships with real estate owners, developers, brokers, lenders, general contractors, municipalities, local community organizations, and other market participants provide us with a sustainable competitive advantage and the ability to source and execute on attractive value-creating investment opportunities.
In addition to our core asset classes, we have a history of developing, acquiring and operating other asset classes, including hotels, townhomes and condominiums. We believe that our expertise across multiple asset classes and our focus on Placemaking™ enable us to create valuable assets that outperform the market, diversify our investments, respond to changes in the marketplace, mitigate risk through market cycles and pursue opportunities that provide attractive risk-adjusted returns at any particular time. We believe that there are a limited number of competitors that possess all of these skill sets in-house. We believe that our diverse skill sets, relationships and expertise will enable us to maximize cash flow and real estate value through proactive asset management, completion of our construction pipeline, execution of our pre-development pipeline and pursuit of new investment opportunities.
History
The JBG Companies® is a trade name under which we conduct business. We refer to this group of affiliated entities collectively as JBG. Since JBG's establishment in 1960, it has invested almost exclusively in the DC Metro area and has established investment, development and operations expertise across a wide variety of asset classes and subcategories, including office (private sector trophy, GSA, loft/creative and suburban), residential (multifamily, condominiums, lofts and townhomes), retail (urban big-box, urban street retail, suburban strip center, power center and town center) and hotel (full service, boutique, limited service and extended stay).
4
Our management team is a proven steward of investor capital and has a long track record of creating value for investors through numerous economic cycles. The 22 owners and active managers of JBG possess an average of nearly 21 years of business experience and an average of nearly 14 years with JBG. In 1999, we created our first discretionary investment fund. As of March 31, 2016, we have raised over $3.6 billion of discretionary fund investment capital for nine real estate investment funds and have invested in more than 250 assets on behalf of these JBG funds. During this same period, we have realized 132 investments representing a total invested equity value of approximately $1.1 billion. Our 132 realized investments during this period have generated an aggregate gross levered IRR and equity multiple of 36.6 percent and 2.3x, respectively, while typically employing leverage of approximately 60 percent of gross asset value.
Our Portfolio Summary
The following tables provide information about our portfolio as of March 31, 2016.
All Assets
| | | | | | | | | | | | | |
| | Number of
Assets(1) | | Rentable Square
Feet(2) | | Number of
Units(3) | | Estimated Potential
Density(4) | |
|---|
Wholly Owned | | | | | | | | | | | | | |
Operating | | | 32 | | | 8,325,172 | | | 3,670 | | | — | |
Construction | | | 5 | | | 966,886 | | | 421 | | | — | |
Pre-Development(5) | | | 4 | | | 768,459 | | | — | | | — | |
Land Bank(6) | | | 14 | | | — | | | — | | | 10,151,500 | |
| | | | | | | | | | | | | | |
Total Wholly Owned | | | 55 | | | 10,060,517 | | | 4,091 | | | 10,151,500 | |
| | | | | | | | | | | | | | |
Joint Ventures (at 100 Percent Share) | | | | | | | | | | | | | |
Operating | | | 40 | | | 7,915,773 | | | 2,847 | | | — | |
Construction | | | 3 | | | 625,531 | | | 586 | | | — | |
Pre-Development(5) | | | 8 | | | 1,197,842 | | | — | | | — | |
Land Bank(6) | | | 27 | | | — | | | — | | | 9,344,500 | |
| | | | | | | | | | | | | | |
Total Joint Ventures | | | 78 | | | 9,739,146 | | | 3,433 | | | 9,344,500 | |
| | | | | | | | | | | | | | |
Total Portfolio | | | 133 | | | 19,799,662 | | | 7,524 | | | 19,496,000 | |
| | | | | | | | | | | | | | |
| | | | | | | | | | | | | | |
| | | | | | | | | | | | | | |
Total Portfolio (at JBG Share)(7) | | | 133 | | | 13,946,916 | | | 5,120 | | | 14,765,485 | |
| | | | | | | | | | | | | | |
| | | | | | | | | | | | | | |
| | | | | | | | | | | | | | |
- (1)
- In four mixed-use properties and large developments, we consider the retail space to be an asset separate from the office and/or multifamily spaces.
- (2)
- Refers to, (i) for operating office and retail assets, actual rentable square feet determined consistent with the Building Owners and Managers Association, or BOMA, measurement guidelines when available and management's estimate of approximate rentable square feet when a BOMA measurement is not available, (ii) for operating multifamily assets, management's estimate of actual rentable square feet, or (iii) for construction and pre-development assets, management's estimate of actual rentable square feet based on current design plans as of March 31, 2016.
- (3)
- For construction assets, represents estimated number of multifamily units based on current design plans as of March 31, 2016. Unit count for multifamily pre-development assets is omitted because projects are still in the design process.
- (4)
- Reflects management's estimate of developable square feet based on its current business plans as of March 31, 2016.
- (5)
- Refers to assets on which we expect to be in a position to commence construction within 24 months of March 31, 2016.
- (6)
- Refers to assets that are development opportunities where we (i) have an option to purchase, or enter into a leasehold interest with respect to, land; (ii) are under a long-term conditional contract to purchase land; (iii) control the land through a ground lease or (iv) own the land, and on which we do not expect to commence construction in the 24 months from March 31, 2016. Our land bank includes 11 parcels attached to our existing operating assets that would
5
require a redevelopment of approximately 532,000 office and/or retail square feet and 1,160 multifamily units in order to access approximately total 7.2 million square feet of total estimated potential density.
- (7)
- Reflects our pro rata share of joint venture assets.
Operating Assets
| | | | | | | | | | | | | | | | | | | | | | |
| | Number of
Assets(1) | | Rentable
Square
Feet | | Number of
Units | | Percent
Leased(2) | | Percent
Occupied(3) | | Annualized
Rent(4)
($000s) | | Annualized
Rent Per
Square Foot(5) | |
|---|
Office | | | | | | | | | | | | | | | | | | | | | | |
Stabilized(6) | | | 36 | | | 8,794,088 | | | — | | | 92.9 | % | | 92.1 | % | $ | 291,273 | | $ | 35.95 | |
Recently Acquired/Delivered/Renovated(7) | | | 2 | | | 354,137 | | | — | | | 75.0 | % | | 50.3 | % | | 7,653 | | | 42.94 | |
| | | | | | | | | | | | | | | | | | | | | | | |
Total | | | 38 | | | 9,148,225 | | | — | | | 92.2 | % | | 90.5 | % | $ | 298,926 | | $ | 36.10 | |
| | | | | | | | | | | | | | | | | | | | | | | |
Multifamily | | | | | | | | | | | | | | | | | | | | | | |
Stabilized—Mid/High-Rise(8) | | | 4 | | | 1,063,564 | | | 1,237 | | | 93.7 | % | | 89.7 | % | $ | 26,738 | | $ | 28.02 | |
Stabilized—Garden-Style(9) | | | 11 | | | 3,542,420 | | | 4,016 | | | 95.7 | % | | 93.7 | % | | 64,201 | | | 19.35 | |
Recently Acquired/Delivered/Renovated(7) | | | 4 | | | 1,002,742 | | | 1,264 | | | 48.4 | % | | 39.2 | % | | 9,539 | | | 24.24 | |
| | | | | | | | | | | | | | | | | | | | | | | |
Total | | | 19 | | | 5,608,726 | | | 6,517 | | | 86.1 | % | | 82.4 | % | $ | 100,478 | | $ | 19.87 | |
| | | | | | | | | | | | | | | | | | | | | | | |
Retail | | | | | | | | | | | | | | | | | | | | | | |
Stabilized(10) | | | 13 | | | 1,435,435 | | | — | | | 92.9 | % | | 88.7 | % | $ | 38,660 | | $ | 31.99 | |
Recently Acquired/Delivered/Renovated(7) | | | 2 | | | 48,559 | | | — | | | 64.1 | % | | 61.2 | % | | 1,616 | | | 54.39 | |
| | | | | | | | | | | | | | | | | | | | | | | |
Total | | | 15 | | | 1,483,994 | | | — | | | 91.9 | % | | 87.8 | % | $ | 40,276 | | $ | 32.52 | |
| | | | | | | | | | | | | | | | | | | | | | | |
Total/Weighted Average | | | 72 | | | 16,240,945 | | | 6,517 | | | 90.1 | % | | 87.5 | % | $ | 439,680 | | $ | 31.21 | |
| | | | | | | | | | | | | | | | | | | | | | | |
| | | | | | | | | | | | | | | | | | | | | | | |
| | | | | | | | | | | | | | | | | | | | | | | |
Note: Table shown at 100 percent share.
- (1)
- In four mixed-use properties and large developments, we consider the retail space to be an asset separate from the office and/or multifamily spaces.
- (2)
- Based on leases signed as of March 31, 2016, and is calculated as (i) for office assets and retail assets, total rentable square feet less rentable square feet available for lease divided by total rentable square feet, and (ii) for multifamily assets, total units less units available for lease divided by total units, expressed as a percentage. Percent leased may differ from percent occupied because percent leased includes leases that have been signed for space within the building, but that have not yet commenced.
- (3)
- Based on occupied rentable square feet/units as of March 31, 2016 and is calculated as (i) for office and retail assets, total rentable square feet less unoccupied square feet divided by total rentable square feet, or (ii) for multifamily assets, total units less unoccupied units divided by total units, expressed as a percentage.
- (4)
- Based on (i) for multifamily assets, or the multifamily component of mixed-use assets, the base rent before rent abatements for the quarter ended March 31, 2016, multiplied by four; (ii) for office and retail assets, or the retail component of mixed-use assets, the base rent and percentage rent before rent abatements, plus tenant reimbursements for the quarter ended March 31, 2016, multiplied by four. Triple net leases are converted to a gross basis by adding tenant reimbursements to base rent. See "—Our Office Assets—Contractual Rent Abatement in Our Office Portfolio" and "—Our Retail Assets—Contractual Rent Abatement in Our Retail Portfolio" for detail on rent abatements. Annualized rent is not presented for assets that were acquired or delivered in the first quarter of 2016.
- (5)
- Represents annualized rent divided by occupied square feet. Annualized rent per square foot calculation excludes assets that were acquired or delivered in the first quarter of 2016.
- (6)
- When used in connection with an office, multifamily or retail asset refers to an asset that is at or above 90 percent leased or has been an operating asset for longer than 12 months. Includes nine office assets with identified growth opportunities representing approximately 2.1 million rentable square feet that were 80.2 percent leased as of March 31, 2016. See "—Business and Growth Strategies—Drive Incremental Growth through Lease-up of Our Assets" for detail on these assets.
6
- (7)
- Refers to assets that have been acquired or delivered, or are undergoing or have completed significant renovation or redevelopment within the 12 months ended March 31, 2016 and are below 90 percent leased, or will undergo a significant redevelopment or renovation within the 12 months from March 31, 2016. See "—Business and Growth Strategies—Drive Incremental Growth through Lease-up of Our Assets" for detail on these assets.
- (8)
- Refers to multifamily assets that are mid and high-rise apartment communities, typically in urban settings.
- (9)
- Refers to multifamily assets that are garden-style apartment communities, consisting of multistory buildings in landscaped settings.
- (10)
- Includes one retail asset with an identified growth opportunity representing approximately 118,000 rentable square feet that was 66.5 percent leased as of March 31, 2016. See "—Business and Growth Strategies—Drive Incremental Growth through Lease-up of Our Assets" for detail on this asset.
Construction Assets
| | | | | | | | | | | | | |
| | Number of
Assets | | Estimated
Rentable Square Feet | | Estimated Number
of Units | | Percent
Pre-Leased(1) | |
|---|
Construction | | | | | | | | | | | | | |
Office | | | 1 | | | 536,710 | | | — | | | 65.0 | % |
Multifamily—Mid/High-Rise | | | 4 | | | 909,180 | | | 1,007 | | | N/A | |
Retail | | | 3 | | | 146,527 | | | — | | | 8.1 | % |
| | | | | | | | | | | | | | |
Total/Weighted Average | | | 8 | | | 1,592,417 | | | 1,007 | | | 52.8 | % |
| | | | | | | | | | | | | | |
| | | | | | | | | | | | | | |
| | | | | | | | | | | | | | |
Note: Table shown at 100 percent share.
- (1)
- Based on leases signed as of March 31, 2016 and is calculated as the estimated rentable square feet leased divided by total estimated rentable square feet. Weighted average calculation excludes multifamily assets.
Pre-Development and Land Bank Assets
| | | | | | | | | | |
| | Number of
Assets | | Estimated
Rentable Square
Feet | | Estimated
Potential
Density(1) | |
|---|
Pre-Development and Land Bank | | | | | | | | | | |
Pre-Development(2) | | | 12 | | | 1,966,301 | | | — | |
Land Bank(3) | | | 41 | | | — | | | 19,496,000 | |
| | | | | | | | | | | |
Total | | | 53 | | | 1,966,301 | | | 19,496,000 | |
| | | | | | | | | | | |
| | | | | | | | | | | |
| | | | | | | | | | | |
Note: Table shown at 100 percent share.
- (1)
- Reflects management's estimate of developable square feet based on its current business plans as of March 31, 2016.
- (2)
- Refers to assets on which we expect to be in a position to commence construction within 24 months of March 31, 2016.
- (3)
- Refers to assets that are development opportunities where we (i) have an option to purchase, or enter into a leasehold interest with respect to, land; (ii) are under a long-term conditional contract to purchase land; (iii) control the land through a ground lease or (iv) own the land, and on which we do not expect to commence construction in the 24 months from March 31, 2016. Our land bank includes 11 parcels attached to our existing operating assets that would require a redevelopment of approximately 532,000 office and/or retail square feet and 1,160 multifamily units in order to access approximately 7.2 million square feet of total estimated potential density.
7
Our Competitive Strengths
We believe that our extensive real estate investment and operating platform and our high-quality, urban infill portfolio provide us with competitive advantages, including the following:
Proven Platform for Value Creation with Investment, Development, Redevelopment and Repositioning Expertise. We have one of the largest real estate platforms in the DC Metro area and a long track record of value creation.
- •
- Integrated Platform with Scale. As one of the premier real estate investment companies in the DC Metro area, we operate a platform that is both vertically integrated across functions, including investment, development, construction management, finance, asset management, property management and leasing, and horizontally integrated across real estate asset classes, focusing primarily on office, multifamily and retail. Our integrated structure enables us to identify value-creation opportunities and realize significant operating efficiencies. Our organization is comprised of 612 employees, including 226 corporate employees in investment, development, construction management, finance, asset management, property management, leasing and other supporting functions. Through our complementary in-house disciplines, we seek to enhance asset value through proactive asset and property management.
- •
- Investment, Development and Leasing Expertise. Our extensive investment, development and leasing infrastructure facilitates our strategy of sourcing, designing, entitling, building, leasing and managing a large portfolio of properties across different asset classes and a variety of types of tenants.
- •
- Since 2000, we have invested in over 250 assets representing approximately $13.0 billion in gross asset value, including over 19.0 million RSF of office, 14,250 multifamily units, 4.0 million RSF of retail, 5,700 hotel rooms, 3,000 for sale residential units and townhomes and 25.0 million square feet of estimated potential land density. This includes the completion of more than 75 development projects with an associated cost of over $5.0 billion, consisting of over 9.5 million RSF of office, 6,100 multifamily units, 1.0 million RSF of retail, 2,100 hotel rooms and 2,000 for sale residential units and townhomes. In recognition of our experience, in 2012, NAIOP, a nationally known commercial real estate development association, named us the National Developer of the Year and recognized us with a Sustainable Development award in 2014.
- •
- Since 2000, we have sold over 90 assets for over $6.0 billion in gross asset value, including over 8.5 million RSF of office, 5,850 multifamily units, 2.0 million RSF of retail, 1,600 hotel rooms, 2,000 for sale residential units and townhomes, and 1.5 million square feet of estimated potential land density.
- •
- Over the three years ended December 31, 2015, we averaged an annual leasing volume of approximately 1.0 million RSF of office space, 7,230 multifamily leases, and approximately 764,000 RSF of retail space across our owned and managed portfolios.
- •
- We are one of the largest landlords to GSA, having developed over $2.0 billion of GSA assets and having completed over 5.2 million RSF of leases with GSA, including build-to-suit developments for the Department of Transportation, Social Security Administration, National Cancer Institute as well as several other agencies. We also have on-staff experts in GSA and government lease and development procurements, which we believe provides us with a competitive advantage in securing GSA leases and developments.
8
See "—Case Studies—51 Louisiana Avenue" on page 35, "—77 H Street" on page 29, "—U.S. Department of Transportation Headquarters" on page 20, "—Waterview" on page 36, "—The Woodley" on page 31 and "—5600 and 5601 Fishers Lane" on page 27.
- •
- Redevelopment and Repositioning Expertise. Our development and asset management teams have significant experience redeveloping and repositioning assets, having completed 40 redevelopment or repositioning projects since 2000, consisting of over 4.0 million RSF of office, 1,600 multifamily units, approximately 232,000 RSF of retail and 3,900 hotel rooms. Our experience owning, operating and managing a range of assets classes gives us a unique capability to identify redevelopment and adaptive reuse opportunities where we can create value.
Strong Management Team with Proven Track Record, Extensive Market Expertise and Interests Aligned with Shareholders. JBG is a fully integrated real estate investment company with over 50 years of single market focus led by a group of 22 owners and active managers with an average of nearly 21 years of business experience and an average of nearly 14 years with JBG. Our management team is a proven steward of investor capital and has a long track record of creating value for investors through numerous economic cycles. Since 1999, JBG has raised and invested nine real estate investment funds with over $3.6 billion of discretionary fund investment capital and has invested in over 250 assets on behalf of these JBG funds. Our 132 realized investments during this period have generated an aggregate gross levered IRR and an equity multiple of 36.6 percent and 2.3x, respectively, while typically employing leverage of approximately 60 percent of gross asset value.
Preqin Ltd., a leading fund management data and intelligence provider covering more than 5,300 private equity funds, has named us as one of the top Consistent Performing Closed-End Private Real Estate Fund Managers every year since 2011, making us the only real estate fund manager to receive this designation in each of the past five years. With 612 employees, 226 of which are in our corporate office, we have a deep and talented pool of real estate professionals. We were named by both the Washington Post in 2014 and the Washington Business Journal in 2015 as the Best Place to Work (Large Company Category) in the DC Metro area.
9
The following table sets forth information regarding the nine real estate investment funds that we have sponsored:
| | | | | | | | | | | | | | | | | | | | | | | | |
| |
| |
| |
| | Realized Investments(1) | |
|---|
| |
| | Total
Committed
Equity
($000s) | | Weighted
Average
Estimated
Leverage(3) | |
|---|
JBG Opportunity Fund | | Vintage(2) | | Number of
Investments | | Equity
Invested(4)
($000s) | | Average
Hold
Period(5) | | Gross
Levered
IRR(6) | | Equity
Multiple(7) | |
|---|
Fund I | | | 1999 | | $ | 28,030 | | 75.2% | | | 29 | | $ | 28,692 | | | 4.9 | | | 35.6 | % | | 5.0 | |
Fund II | | | 2002 | | | 28,785 | | 72.6% | | | 9 | | | 21,952 | | | 4.2 | | | 41.3 | % | | 3.4 | |
Fund III | | | 2002 | | | 210,000 | | 64.6% | | | 15 | | | 116,193 | | | 4.2 | | | 46.2 | % | | 4.3 | |
Fund IV | | | 2004 | | | 250,000 | | 66.1% | | | 14 | | | 157,300 | | | 4.4 | | | 31.8 | % | | 2.3 | |
Fund V | | | 2005 | | | 528,000 | | 58.9% | | | 30 | | | 434,044 | | | 2.6 | | | 39.6 | % | | 1.6 | |
Fund VI | | | 2007 | | | 600,000 | | 63.2% | | | 18 | | | 165,297 | | | 5.2 | | | 2.8 | % | | 1.2 | |
Fund VII | | | 2008 | | | 576,485 | | 55.9% | | | 13 | | | 86,517 | | | 4.1 | | | 36.9 | % | | 3.6 | |
Fund VIII | | | 2011 | | | 752,545 | | 55.6% | | | 4 | | | 75,472 | | | 3.1 | | | 34.8 | % | | 2.3 | |
Fund IX | | | 2014 | | | 680,005 | | — | | | — | | | — | | | — | | | — | | | — | |
| | | | | | | | | | | | | | | | | | | | | | | | | |
Total/Weighted Average | | | | | $ | 3,653,850 | | 59.7% | | | 132 | | $ | 1,085,469 | | | 4.1 | | | 36.6 | % | | 2.3 | |
| | | | | | | | | | | | | | | | | | | | | | | | | |
| | | | | | | | | | | | | | | | | | | | | | | | | |
| | | | | | | | | | | | | | | | | | | | | | | | | |
Note: Please refer to the risk factor captioned "Risk Factors—The historical 'gross levered IRRs' and 'equity multiples' achieved by the JBG funds with respect to investments sold on or before September 30, 2015 are not necessarily indicative of the future performance of our company, any property in our portfolio or an investment in our common shares," in the JBG Risk Factors for a discussion of the factors you should consider when evaluating gross levered IRR and equity multiple as return measures.
- (1)
- Represents investments that were sold by the fund on or before March 31, 2016.
- (2)
- Represents the year in which the fund made its first investment. Funds are generally fully committed within two years of the first investment.
- (3)
- Represents average leverage employed by each fund, observed on a semi-annual basis, weighted by management's estimate of the fair market value of invested equity at that time.
- (4)
- Represents the maximum equity invested by the applicable fund during its life, calculated on a quarterly basis, including only equity associated with a realized investment or realized investments, as the case may be.
- (5)
- Represents the average hold period, in years, of realized investments in each fund.
- (6)
- Represents the levered internal rate of return of a JBG fund's realized investments based on (i) equity invested and (ii) the total distributions from a realized investment or realized investments, as the case may be (including the return of equity investment), received by the applicable fund, less all sales costs, debt service and all other property level fees where applicable, but before deduction of carried interests and asset management fees where applicable. For realized investments that were subject to a joint venture, gross levered IRR reflects the impact of any promote that was either paid or earned. Returns shown relate to realized investments and not the returns of fund investors, which are also affected by asset management fees and carried interest paid by the JBG funds and by the JBG funds' unrealized investments. The returns shown were impacted by national and local economic trends that are unrelated to our management of the investments.
- (7)
- Represents the sum of the total contributions and distributions from a realized investment or realized investments, as the case may be, received by the applicable fund, calculated on a quarterly basis, only including such contributions and distributions from the realized investment or realized investments, as the case may be, plus the equity invested divided by the equity invested. Returns shown are not the returns of fund investors, which are also affected by asset management fees and carried interest paid by the JBG funds and by the JBG funds' unrealized investments. The returns shown were impacted by national and local economic trends that are unrelated to our management of the investments.
Premier Portfolio of Diversified, High-Quality Assets in Attractive Submarkets. Our diversified portfolio of high-quality assets is primarily located within urban infill and transit-oriented environments in some of the most attractive submarkets of the DC Metro area, one of the highest barrier-to-entry markets in the United States. As of March 31, 2016, our portfolio consists of 72 operating assets with an aggregate of over 16.2 million RSF, eight construction assets with an aggregate of approximately 1.6 million RSF, 12 pre-development assets with an aggregate of approximately
10
2.0 million RSF and 41 land parcels with an estimated potential density of approximately 19.5 million square feet. Our strategy is to invest in assets that we anticipate, by virtue of location, physical quality, amenities or other specific features, will possess a sustainable ability to outperform the market and maintain high occupancy levels through all market cycles, attract high-quality tenants and appeal to a broad range of buyers when offered for sale. We believe that given current market rents, construction costs and the lack of competitive development sites, our portfolio could not be replicated today on a cost competitive basis, if at all. As of March 31, 2016, our portfolio was comprised of the following:
- •
- 38 office assets totaling approximately 9.2 million RSF, including 36 stabilized assets that were 92.9 percent leased
- •
- 19 multifamily assets totaling 6,517 units and over 5.6 million RSF, including 15 stabilized assets that were 95.2 percent leased (based on units)
- •
- 15 retail assets totaling approximately 1.5 million RSF, including 13 stabilized assets that were 92.9 percent leased
- •
- One office asset totaling approximately 537,000 RSF, which was 65.0 percent pre-leased
- •
- Four mid/high-rise multifamily assets totaling 1,007 units and over 909,000 RSF
- •
- Three retail assets totaling approximately 147,000 RSF, which were 8.1 percent pre-leased
- •
- Four office assets totaling approximately 948,000 RSF
- •
- Six mid/high-rise multifamily assets totaling over 932,000 RSF
- •
- Two retail assets totaling over 86,000 RSF, which were 35.4 percent pre-leased
- •
- 10 land parcels in Washington, DC representing an estimated potential density of over 3.9 million square feet
- •
- 20 land parcels in Northern Virginia representing an estimated potential density of over 11.3 million square feet
- •
- 11 land parcels in Suburban Maryland representing an estimated potential density of approximately 4.3 million square feet
- •
- Of the above, our land bank includes 11 parcels that are attached to our existing operating assets that would require redevelopment of approximately 532,000 office and/or retail square feet and 1,160 multifamily units in order to access approximately 7.2 million square feet of estimated potential density
Our portfolio is comprised of high-quality assets, most which have been recently constructed or renovated and generally include a variety of services and amenities that are highly sought after by tenants. On average, based on rentable square feet, our portfolio was built or renovated within the last nine years, and excluding assets held for redevelopment, approximately 79 percent of operating rentable square feet was built or renovated since 2005. Furthermore, by the end of 2019, we expect to deliver all eight of our construction pipeline assets and 11 of our 12 pre-development pipeline assets, representing approximately 3.3 million RSF of new deliveries.
11
We believe that the young age and overall quality of our diversified portfolio across multiple asset classes, together with our experience and fully integrated in-house capabilities to own, develop and manage these assets, has enabled us to achieve strong leasing levels and tenant quality and diversity. As of March 31, 2016 our stabilized portfolio was approximately 94 percent leased, with our stabilized office assets being 92.9 percent leased, our stabilized multifamily assets being 95.2 percent leased and our stabilized retail assets being 92.9 percent leased. Moreover, we believe that we have a strong, creditworthy tenant base, with the U.S. government representing 56.6 percent of our share of the total annualized rent of our office portfolio and 51.3 percent of our share of the total annualized rent of our combined office and retail portfolio as of March 31, 2016. No other tenant accounted for more than 2.2 percent of our share of the total annualized rent of our combined office and retail portfolio as of March 31, 2016. We believe we have a high credit quality tenant base not only because the U.S. government represents over half of the annualized rent of our combined office and retail portfolio, but also because we evaluate a prospective tenant's creditworthiness by reviewing its financial statements, inquiring about trends in its revenues and expenses, making inquiries to the tenant's creditors and current landlords and, if available, credit ratings issued by credit agencies and other publicly available material. Once a lease is signed, we continue to monitor a tenant's credit quality through similar processes outlined above, the frequency of which we determine based on market trends within the relevant asset class, our knowledge of the particular tenant and the significance of investment or size of lease.
The majority of our non-GSA office and retail leases, and our largest GSA lease, contain contractual rent escalators based on increases in CPI or a fixed percentage, generally ranging from 2.0 to 3.0 percent per year. In addition, in our office portfolio, we benefit from high-quality long-term leases with a weighted average lease term (including leases signed but not commenced) of 7.0 years and the weighted average lease term of our build-to-suit GSA leases is 9.2 years.
We believe that we have invested in some of the most attractive submarkets within the DC Metro area. Our assets are generally located in submarkets which are high barrier to entry Metro-served locations, have a high degree of walkability and feature strong clusters of nearby amenities. Based on rentable square feet as of March 31, 2016, over 86 percent of our operating portfolio and approximately 98 percent of our construction and pre-development assets are located inside the Beltway and/or in Metro-served locations. This concentration of assets positions us well to capitalize on improving real estate market fundamentals, with over 93 percent of DC Metro area office leasing activity in 2015 and the first quarter of 2016, within 0.75 miles of a current or planned Metro station, according to JLL.
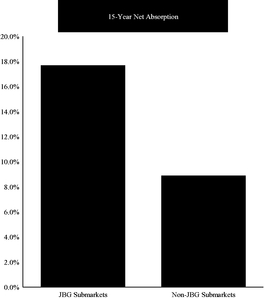
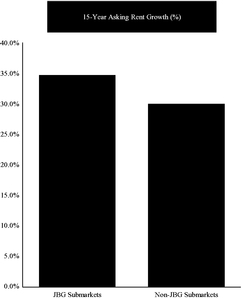
The office and multifamily submarkets in which we operate have historically outperformed other DC Metro area submarkets as evidenced by the following key metrics. According to JLL, the 15-year net absorption rate through the first quarter of 2016 for all classes of office space in our submarkets was 17.7 percent compared to 8.9 percent for other DC Metro area submarkets. Net absorption refers to the change in physically occupied space from one period to another period of time and takes into account newly constructed buildings and the conversion or demolition of buildings. We believe this metric is a key indicator of demand and that a high level of absorption in our submarkets may indicate robust demand for space from tenants. In addition, according to JLL, over the past 15 years ending with the first quarter of 2016, the asking rents for all classes of office space in our submarkets have grown nearly five percent more than the asking rents in other DC Metro area markets, growing 34.7 percent over that time period compared to 30.0 percent for other submarkets.
12
JBG's portfolio has outperformed the DC Metro office market
| | |
 | |
 |
| | |
| Source: JLL Research (data represents 2010-Q1 2016) | | |
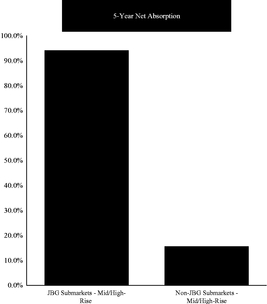
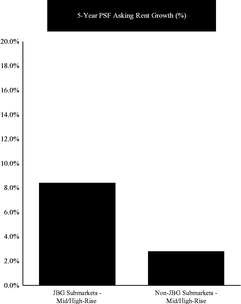
Similarly, our submarkets have outperformed other DC Metro area submarkets in key multifamily statistics. According to JLL, the five year net absorption rate through the first quarter of 2016 for mid/high-rise multifamily units in our submarkets was 94.1 percent compared to 15.6 percent for the other DC Metro area submarkets. In addition, according to JLL, over the past five years ending with the first quarter of 2016, our submarkets have experienced an 8.4 percent increase in asking rents for mid/high-rise units compared to a 2.8 percent increase in other DC Metro area submarkets.
JBG's portfolio has outperformed the DC Metro multifamily market
| | |
 | |
 |
| | |
| Source: JLL Research (data represents 2010-Q1 2016) | | |
We believe vacancy rates are a more appropriate metric for comparing our garden-style buildings' performance to market than absorption because there have been no new deliveries and
13
minimal net new absorption in this category. According to JLL, over the past five years ending with the first quarter of 2016, the submarkets where our garden-style assets are located have shed 1.3 percentage points of vacancy compared to 0.8 percentage points in non-JBG submarkets. As of March 31, 2016, JBG garden-style submarkets posted a point-in-time vacancy rate of 3.3 percent relative to 3.2 percent in the broader market according to JLL.
Ability to Create Value through Placemaking™. Our primary approach to creating the highest value for our assets is comprised of a series of complementary disciplines in a process that we call "Placemaking™." Placemaking™ involves strategically mixing high-quality multifamily and commercial buildings with anchor, specialty and neighborhood retail in a high-density, thoughtfully planned and curated public space environment. This approach is facilitated by our extensive proprietary research platform and deep understanding of submarket dynamics.
Through this process, we are able to drive synergies across varied uses and create unique, amenity-rich, walkable neighborhoods that are desirable and create significant tenant and investor demand. As part of this process, we build high-quality, distinctive and unique assets that allow the user experience to extend beyond street level into the building itself. As a result, we believe this approach leads to stronger office, multifamily and retail demand, leading to higher rents, stronger leasing velocity and, ultimately, greater asset values. We believe that our approach has helped mitigate the impact of new competitive supply on our projects and has allowed us to scale our success across neighborhoods.
We have successfully developed a number of differentiated projects that achieve top-of-market rental rates and sales prices, while also attracting a diverse group of sought-after retailers as tenants. We believe our Placemaking™ efforts can benefit entire neighborhoods, creating value across a broad base of assets and accelerating the transformation of submarkets into desirable environments for tenants and residents.
See "—Case Studies—77 H Street" on page 29, "—Waterview" on page 36, "—CEB Tower at Central Place" on page 37, "—RTC-West" on page 40 and "—Mark Center Portfolio" on page 33.
Extensive Market Knowledge and Long-Standing Relationships. With over 50 years of experience in the DC Metro area, our team possesses a deep and detailed understanding of our submarkets and has influenced the development of these communities through our Placemaking™ approach. Our primary focus is on developing, acquiring and operating assets in the DC Metro area, where our organization has significant expertise and relationships and our market knowledge is both broad and deep. Having developed or acquired over 19.0 million RSF of office, 14,250 multifamily units, over 4.0 million RSF of retail, 5,700 hotel rooms and 3,000 for sale residential units and townhomes in the region since 2000, representing approximately $13.0 billion in gross asset value, we believe that our significant expertise and relationships serve as a competitive advantage. Our in-depth market knowledge and extensive network of long-standing relationships with a broad range of real estate owners, developers, brokers, lenders, general contractors, municipalities, local community organizations and other market participants has consistently provided us with access to an ongoing pipeline of attractive acquisition and investment opportunities in our core submarkets that may not be available to our competitors. We believe that our reputation for performance and execution provides us with a competitive advantage over other market participants.
Additionally, we focus on establishing strong relationships with our tenants in order to understand their long-term business needs, which we believe enhances our ability to retain quality tenants, facilitates our leasing efforts and maximizes cash flow from our assets. Our senior management and our leasing team members have deep and long-standing relationships with key office and retail tenants and their representatives, which allows us to aggressively lease-up vacant space and identify pre-lease tenants for our buildings. For example, our relationship with a publicly-listed company and its representative, and previous experience building a corporate headquarters building for that tenant, facilitated us securing a pre-lease for 65.0 percent of CEB Tower at Central Place, which created
14
significant value and mitigated speculative development risk. Our leasing team has averaged an annual leasing volume of approximately 1.0 million RSF of office over the past three years. Furthermore, our team includes individuals with experience winning multiple competitive GSA lease procurements and building GSA-tenanted buildings. This experience, coupled with our experience delivering facilities that meet the needs of GSA tenants, helps to position us to compete for future GSA leasing business. In addition to our office and GSA leasing experience, our retail leasing teams have strong and deep retailer relationships with key anchor tenants that enhance our Placemaking™ activities, including Whole Foods Market, Starbucks, Harris Teeter, Trader Joe's, Walmart and multiple other local, regional and national tenants. These relationships have contributed to our average annual leasing volume over the past three years of approximately 764,000 RSF of retail space across our owned and managed portfolio.
See "—Case Studies—51 Louisiana Avenue" on page 35, "—CEB Tower at Central Place" on page 37, "—77 H Street" on page 29, "—Sky House" on page 30 and "—The Woodley" on page 31.
Experienced Capital Allocation Capabilities. We have a proven track record of managing our risk, cost of capital and capital sources by utilizing various capital allocation strategies across investment opportunities. We believe that we have the ability and expertise to use not only our own balance sheet but also to deploy capital from strategic third-party investors or through joint ventures. We have longstanding relationships and a long track record of success with many partners.
While we intend to use our own capital as our primary source of capital, we may continue to partner with such third parties in order to deliver mixed-use projects or access other opportunities. Additionally, we may in the future consider pursuing opportunities in the investment fund business to the extent that our management sees attractive opportunities. In addition to sources of equity capital, we have a variety of relationships with debt capital providers that we will continue to utilize.
We also use various capital allocation strategies to manage risks associated with our development activities. For example, we often use capital to option, rather than purchase, raw land positions until the property has received appropriate entitlements, allowing us to pre-lease these development projects prior to or soon after closing on the land.
See "—Case Studies—Waterview" on page 36, "—CEB Tower at Central Place" on page 37, "—The Woodley" on page 31, "—16th & I Street" on page 38 and "—5600 and 5601 Fishers Lane" on page 27.
Large and Successful Strategic Capital Business. Since 1999, JBG has served as the general partner and managing member of nine real estate investment funds for institutional investors and high net worth individuals with over $3.6 billion of discretionary fund investment capital and has invested in more than 250 assets on behalf of the JBG funds. The JBG strategic capital platform provides fee-based real estate services to the JBG funds. Although the majority of the JBG funds' assets and interests in assets will be contributed in the Combination Transactions, the JBG funds will retain certain assets that are primarily non-core and which we refer to collectively as non-core excluded assets. With respect to these non-core excluded assets and for most assets that we hold through joint ventures, we will continue to provide the same asset management, property management, construction management, leasing and other services that we currently provide and will continue to earn fees in connection with providing such services. We also expect to earn such fees from joint venture assets acquired in the future and any future funds that we establish. For the three months ended March 31, 2016 and the year ended December 31, 2015, including the revenue generated by the retail portion of our strategic capital business (which was acquired in January 2016), our strategic capital business generated approximately $23.9 million and $115.1 million of revenue, respectively. After elimination of the fee streams earned for management of assets which will be consolidated in the combined company's financial statements on a going forward basis, we would have earned approximately $9.8 million and $49.0 million in revenue from such fees for the three months ended March 31, 2016 and the year
15
ended December 31, 2015, respectively. We expect to earn similar fees in the future from the JBG funds and our joint venture arrangements currently in place, as well as any future joint ventures or funds that we establish. We expect that the fees we continue to earn in connection with providing such services will enhance our overall returns, and that our existing investment relationships will continue to provide potential capital sources and new investment opportunities. See "—Our Strategic Capital Business."
Business and Growth Strategies
Our primary business objectives are to maximize cash flow and generate strong risk-adjusted returns for our shareholders. We intend to pursue these objectives through the following business and growth strategies.
Drive Incremental Growth through Lease-up of Our Assets. As of March 31, 2016, we had 46 signed but not yet commenced leases totaling over $42.0 million ($35.4 million on a pro rata basis) of annualized rent, 37 of which are estimated to commence by March 31, 2017. In addition, we believe that we are well positioned to achieve significant internal growth through lease-up of our recently acquired, recently developed and recently renovated assets, given current strong tenant demand for high-quality space in our submarkets. Additionally, there are ten assets in our operating portfolio that we believe present embedded growth opportunities through the leasing up of vacant space generated through normal course lease expirations. As of March 31, 2016, these embedded growth and lease-up opportunities by asset type were as follows:
- •
- One office asset that was delivered in the first quarter of 2016 and one office asset that will undergo a significant renovation estimated to be completed within the next 15 months, totaling over 354,000 RSF, which were 75.0 percent leased, resulting in approximately 89,000 RSF available for lease.
- •
- Nine operating office assets totaling approximately 2.1 million RSF, which were on average 80.2 percent leased, resulting in over 410,000 RSF available for lease.
- •
- Four mid/high-rise multifamily assets that were recently delivered in 2015, totaling 1,264 units, which were on average 48.4 percent leased, resulting in 652 multifamily units available for lease.
- •
- One retail asset that was delivered in the third quarter of 2015 and one retail asset that was acquired in the second quarter of 2015, totaling approximately 49,000 RSF, which were on average 64.1 percent leased, resulting in over 17,000 RSF available for lease.
- •
- One operating retail asset totaling approximately 118,000 RSF, which was 66.5 percent leased, resulting in over 39,000 RSF available for lease.
We have experienced strong leasing velocity across our owned and managed portfolios for the twelve months ended March 31, 2016, leasing approximately 710,000 RSF of office, 9,112 multifamily units, and 491,000 RSF of retail. Based on current market demand in our submarkets and the efforts of our dedicated in-house leasing teams, we expect to increase our occupancy and revenue significantly across our portfolio generally, and in our lease-up properties in particular. For example, if we were able to lease-up these assets to their respective market comparable level percentages and rental rates, as estimated by management and JLL, then we estimate that we could generate incremental annualized
16
rent of approximately $13.8 million ($8.8 million on a pro rata basis) and over $15.7 million ($6.8 million on a pro rata basis) on our office and multifamily opportunities, respectively. If we are able to lease-up the retail assets identified in the table below to the market average percentage leases at the current weighted average in-place rent, we estimate that we could generate incremental annualized rent of approximately $2.2 million ($1.6 million on a pro rata basis). The total estimated incremental annualized rent from these office, multifamily and retail opportunities is approximately $31.7 million ($17.1 million on a pro rata basis).
See "—Case Studies—Jefferson Court and The Foundry" on page 39 and "—RTC West" on page 40.
The following table sets forth information with respect to our incremental and embedded lease-up opportunities.
Office Lease-up Opportunities
| | | | | | | | | | | | | | | | | | | | | | | | | | | |
Office Asset | | Submarket | | Percent
Ownership | | Delivery/
Renovation
Completion
Date(1) | | Rentable
Square
Feet | | Percent
Leased | | Submarket
Percentage
Leased(2) | | Weighted
Average
Comp Set
Rent Per
Square
Foot(3) | | Potential
Incremental
Annualized
Rent(4) | | Estimated
Cost to
Stabilize(5) | |
|---|
Recently Acquired/Delivered/Renovated | | | | | | | | | | | | | | | | | | | | | | | | | | | |
The Foundry(6) | | Georgetown | | | 9.9 | % | | Q2 2017 | | | 233,855 | | | 76.2 | % | | 89.8 | % | $ | 49.37 | | $ | 1,571,003 | | $ | 2,077,505 | |
16th & I Street(7) | | CBD | | | 71.9 | % | | Q1 2016 | | | 120,282 | | | 72.5 | % | | 89.1 | % | | 77.83 | | | 1,550,698 | | | 1,723,073 | |
| | | | | | | | | | | | | | | | | | | | | | | | | | | | |
Total/Weighted Average | | | | | | | | | | | 354,137 | | | 75.0 | % | | 89.6 | % | $ | 60.32 | | $ | 3,121,701 | | $ | 3,800,578 | |
| | | | | | | | | | | | | | | | | | | | | | | | | | | | |
Embedded Growth Opportunities | | | | | | | | | | | | | | | | | | | | | | | | | | | |
RTC—West(8) | | Reston | | | 100.0 | % | | | | | 495,348 | | | 83.0 | % | | 90.9 | % | $ | 32.80 | | $ | 1,275,802 | | $ | 2,389,419 | |
L'Enfant Plaza Office—East | | Southwest | | | 49.0 | % | | | | | 437,954 | | | 88.1 | % | | 97.0 | % | | 43.53 | | | 1,706,093 | | | 2,606,777 | |
800 North Glebe Road | | Ballston | | | 100.0 | % | | | | | 306,456 | | | 79.1 | % | | 85.9 | % | | 55.81 | | | 1,167,004 | | | 1,334,518 | |
L'Enfant Plaza Office—North(9) | | Southwest | | | 49.0 | % | | | | | 304,132 | | | 63.4 | % | | 97.0 | % | | 43.53 | | | 4,457,759 | | | 6,811,080 | |
1233 20th Street | | CBD | | | 100.0 | % | | | | | 154,584 | | | 88.8 | % | | 92.6 | % | | 50.57 | | | 291,573 | | | 454,936 | |
2121 Wisconsin Avenue | | Uptown | | | 100.0 | % | | | | | 110,241 | | | 88.2 | % | | 89.4 | % | | 41.81 | | | 56,133 | | | 87,660 | |
6862 Elm Street | | McLean | | | 100.0 | % | | | | | 103,556 | | | 79.7 | % | | 94.1 | % | | 34.73 | | | 518,014 | | | 990,101 | |
Reston Arboretum | | Reston | | | 100.0 | % | | | | | 95,666 | | | 81.8 | % | | 90.9 | % | | 32.80 | | | 285,029 | | | 533,835 | |
Old Dominion | | McLean | | | 100.0 | % | | | | | 66,826 | | | 55.8 | % | | 94.1 | % | | 34.73 | | | 888,264 | | | 1,697,767 | |
| | | | | | | | | | | | | | | | | | | | | | | | | | | | |
Total/Weighted Average | | | | | | | | | | | 2,074,763 | | | 80.2 | % | | 92.7 | % | $ | 41.31 | | $ | 10,645,671 | | $ | 16,906,093 | |
| | | | | | | | | | | | | | | | | | | | | | | | | | | | |
Total/Weighted Average | | | | | | | | | | | 2,428,900 | | | 79.5 | % | | 92.2 | % | $ | 44.49 | | $ | 13,767,372 | | $ | 20,706,671 | |
| | | | | | | | | | | | | | | | | | | | | | | | | | | | |
| | | | | | | | | | | | | | | | | | | | | | | | | | | | |
| | | | | | | | | | | | | | | | | | | | | | | | | | | | |
- (1)
- Future dates represent estimated renovation completion dates.
- (2)
- Source: JLL. Represents 10 year historical submarket average through March 31, 2016, except for 800 North Glebe, which is based on a competitive set of applicable Ballston, Rosslyn, and Clarendon office buildings. We believe the prior 10 years is an appropriate period over which to benchmark vacancy given JLL's view that the DC metro area is in the early stage of the recovery cycle and the long-term nature of our typical office leases.
- (3)
- Source: JLL. Represents the weighted average asking market rent per square foot as of March 31, 2016 based on a competitive set designated for each building by JLL. Triple net leases are converted to a gross basis by adding tenant reimbursements to base rent. We believe weighted average asking rents for the competitive set provides an appropriate data set against which to benchmark rental rates because we believe the competitive set, which is more narrow than submarket data, is representative of the quality and age of these office assets, which we believe are among the primary factors impacting rental rates for office assets, particularly in the submarkets in which these assets are located.
17
- (4)
- Calculated as the product of incremental square feet available for lease up to the submarket percentage leased and weighted average competitive set rent per square foot. Excludes potential revenue from leases signed but not commenced. See "—Our Office Assets—Signed But Not Commenced Leases in Our Office Portfolio" for detail on signed but not commenced leases.
- (5)
- Source: JLL. Represents submarket average tenant improvement allowance and typical tenant representation commission as estimated by JLL. Tenant improvement allowance figures based on lease comparables within the designated submarket for relocations of 10 years or longer, excluding renewals and subleases.
- (6)
- The Foundry was acquired in December 2014. We are in the planning and design stages of a $11.0 million renovation of the asset with an estimated completion date in the second quarter of 2017.
- (7)
- 16th & I Street delivered in the first quarter of 2016.
- (8)
- RTC—West was acquired in November 2012. In the first quarter of 2014, we completed a $6.4 million renovation of the asset. RTC—West is comprised of three neighboring office buildings. RTC—West was an operating office asset as of March 31, 2016; however, our development plan contemplates redeveloping approximately 19,500 square feet of the existing asset to construct the RTC—West Retail construction asset.
- (9)
- L'Enfant Plaza Office—North was acquired in November 2003. In the fourth quarter of 2014, we completed a $13.5 million renovation of the asset.
Multifamily Lease-up Opportunities
| | | | | | | | | | | | | | | | | | | | | | | | | | | |
Multifamily Asset | | Submarket | | Percent
Ownership | | Delivery
Date | | Units | | Rentable
Square
Feet(1) | | Percent
Leased | | Comp Set
Percentage
Leased(2) | | Weighted
Average
Comp Set
Rent Per
Unit(3) | | Potential
Incremental
Annualized
Rent(4) | |
|---|
Recently Acquired/Delivered/Renovated | | | | | | | | | | | | | | | | | | | | | | | | | | | |
Mid/High-Rise | | | | | | | | | | | | | | | | | | | | | | | | | | | |
Galvan(5) | | Rockville Pike Corridor | | | 1.8 | % | | Q4 2015 | | | 356 | | | 295,472 | | | 33.1 | % | | 94.3 | % | $ | 2,013 | | $ | 5,255,608 | |
Fort Totten Square(6) | | Brookland/Fort Totten | | | 99.4 | % | | Q2 2015 | | | 345 | | | 254,292 | | | 62.3 | % | | 94.8 | % | | 1,917 | | | 2,580,133 | |
Atlantic Plumbing | | U Street/Shaw | | | 64.0 | % | | Q4 2015 | | | 310 | | | 245,604 | | | 37.4 | % | | 94.4 | % | | 2,821 | | | 5,981,248 | |
Notch 8(7) | | Potomac Yard | | | 14.7 | % | | Q4 2015 | | | 253 | | | 207,374 | | | 64.4 | % | | 96.0 | % | | 1,999 | | | 1,913,341 | |
| | | | | | | | | | | | | | | | | | | | | | | | | | | | |
Total/Weighted Average | | | | | | | | | | | 1,264 | | | 1,002,742 | | | 48.4 | % | | 94.8 | % | $ | 2,236 | | $ | 15,730,330 | |
| | | | | | | | | | | | | | | | | | | | | | | | | | | | |
| | | | | | | | | | | | | | | | | | | | | | | | | | | | |
| | | | | | | | | | | | | | | | | | | | | | | | | | | | |
Note: Table shown at 100 percent share. As of March 31, 2016, there were no embedded growth opportunity multifamily assets.
- (1)
- Includes multifamily and retail square feet, unless otherwise noted.
- (2)
- Source: JLL. Represents percent leased as of March 31, 2016 for competitive set designated for each building by JLL. Includes stabilized assets only. We believe a competitive set data set as of March 31, 2016 is an appropriate time at which to benchmark vacancy given the short-term nature of our typical multifamily leases. In addition, we believe that the competitive set, which is more narrow than submarket data, is the appropriate data set against which to benchmark vacancy because it is representative of the quality and age of these multifamily assets, which we believe are among the primary factors impacting vacancy rates for multifamily assets, particularly in the submarkets in which these assets are located.
- (3)
- Source: JLL. Represents weighted average monthly asking rent per unit as of March 31, 2016 of competitive set designated for each building by JLL. Includes both stabilized assets and properties in lease-up. We believe weighted average asking rents for the competitive set provides an appropriate data set against which to benchmark rental rates because we believe the competitive set, which is more narrow than submarket data, is representative of the quality and age of these multifamily assets, which we believe are among the primary factors impacting rental rates for multifamily assets, particularly in the submarkets in which these assets are located.
- (4)
- Calculated as the product of incremental units available for lease up to the competitive set percentage leased and weighted average competitive set rent per unit, multiplied by 12. Excludes potential revenue from the lease up of retail space in these multifamily assets. See "—Our Retail Assets—Signed But Not Commenced Leases in Our Retail Portfolio" for detail on signed but not commenced leases.
- (5)
- Galvan is part of a mixed-use property that includes the Galvan Retail operating retail asset.
- (6)
- Fort Totten Square is part of a mixed-use property that includes the Fort Totten Square Retail operating retail asset. We are currently in negotiations with our joint venture partner to recapitalize the asset and increase our ownership to 100 percent.
- (7)
- Notch 8 is part of a mixed-use property that includes the Notch 8 Retail operating retail asset.
18
Retail Lease-up Opportunities
| | | | | | | | | | | | | | | | | | | | | | | | | | | |
Retail Asset | | Submarket | | Percent
Ownership | | Acquisition/
Delivery
Date | | Rentable
Square
Feet | | Percent
Leased | | Submarket
Percentage
Leased(1) | | Weighted
Average
In-Place
Rent Per
Square
Foot(2) | | Potential
Incremental
Annualized
Rent(3) | | Estimated
Cost to
Stabilize(4) | |
|---|
Recently Acquired/Delivered/Renovated | | | | | | | | | | | | | | | | | | | | | | | | | | | |
Pikesville Walgreens(5) | | Pikesville | | | 99.0 | % | | Q2 2015 | | | 25,476 | | | 78.0 | % | | 93.2 | % | $ | 40.31 | | $ | 156,006 | | $ | 218,409 | |
275 N. Washington(6) | | Rockville Pike Corridor | | | 100.0 | % | | Q3 2015 | | | 23,083 | | | 48.7 | % | | 94.1 | % | | 79.29 | | | 830,590 | | | 1,162,825 | |
| | | | | | | | | | | | | | | | | | | | | | | | | | | | |
Total/Weighted Average | | | | | | | | | | | 48,559 | | | 64.1 | % | | 93.6 | % | $ | 68.78 | | $ | 986,596 | | $ | 1,381,234 | |
| | | | | | | | | | | | | | | | | | | | | | | | | | | | |
Embedded Growth Opportunities | | | | | | | | | | | | | | | | | | | | | | | | | | | |
L'Enfant Plaza Retail—West(7) | | Southwest | | | 49.0 | % | | | | | 117,610 | | | 66.5 | % | | 97.1 | % | $ | 33.41 | | $ | 1,200,556 | | $ | 1,680,779 | |
| | | | | | | | | | | | | | | | | | | | | | | | | | | | |
Total/Weighted Average | | | | | | | | | | | 117,610 | | | 66.5 | % | | 97.1 | % | $ | 33.41 | | $ | 1,200,556 | | $ | 1,680,779 | |
| | | | | | | | | | | | | | | | | | | | | | | | | | | | |
Total/Weighted Average | | | | | | | | | | | 166,169 | | | 65.8 | % | | 96.1 | % | $ | 43.50 | | $ | 2,187,152 | | $ | 3,062,013 | |
| | | | | | | | | | | | | | | | | | | | | | | | | | | | |
| | | | | | | | | | | | | | | | | | | | | | | | | | | | |
| | | | | | | | | | | | | | | | | | | | | | | | | | | | |
Note: Table shown at 100 percent share.
- (1)
- Source: JLL. Represents 10 year historical submarket average through March 31, 2016. We believe the prior 10 years is an appropriate period over which to benchmark vacancy given JLL's view that the DC Metro area is in the early stage of the recovery cycle and the long-term nature of our typical retail leases.
- (2)
- Based on leases signed as of March 31, 2016 and calculated as annualized base rent and percentage rent before abatements divided by total leased square feet. Triple net leases are converted to a gross basis by adding tenant reimbursements to base rent. See "—Our Retail Assets—Contractual Rent Abatement in Our Retail Portfolio" for detail on rent abatements. We believe our weighted average in-place rents provide an appropriate data set against which to benchmark rental rates given the limited availability of representative submarket or competitive set data and that in-place rents of our retail assets are representative of the quality and positioning of these retail assets, which we believe are among the primary factors impacting rental rates for retail assets, particularly in the submarkets in which they are located.
- (3)
- Calculated as the product of incremental square feet available for lease up to the competitive set percentage leased and weighted average in-place rent per square foot. Excludes potential revenue from leases signed but not commenced. See "—Our Retail Assets—Signed But Not Commenced Leases in Our Retail Portfolio" for detail on signed but not commenced leases.
- (4)
- Source: JLL. Represents submarket average tenant improvement allowance and typical tenant representation commission as estimated by JLL. Tenant improvement allowance figures based on lease comparables within the designated submarket for relocations of 10 years or longer, excluding renewals and subleases.
- (5)
- Pikesville Walgreens was acquired in the second quarter of 2015. We are currently in negotiations with our joint venture partner to recapitalize the asset and increase our ownership to 100 percent.
- (6)
- 275 N. Washington delivered in the third quarter of 2015.
- (7)
- L'Enfant Plaza Retail—West was acquired in November 2003. In the second quarter of 2014, we completed a $30.0 million renovation of the asset.
Deliver Our Assets under Construction. As of March 31, 2016, we had eight high-quality assets under construction with an estimated total cost of approximately $813.3 million and an estimated $492.4 million of remaining cost to complete. Our construction pipeline consists of approximately 537,000 RSF of office space, 1,007 multifamily units, and approximately 147,000 RSF of retail space, all of which is inside the Beltway and/or in Metro-served locations. Four of these projects are scheduled to be completed in the next 24 months. We are targeting initial full year stabilized NOI yields-on-cost from these assets in the range of 7.1 - 7.6 percent, based on internal underwriting estimates. We believe these projects provide significant potential for value creation. As of March 31, 2016, approximately 349,000 RSF, or 65.0 percent, of our office construction pipeline was pre-leased and approximately 12,000 RSF, or 8.1 percent, of our retail construction pipeline was pre-leased.
19
We employ a strategy of pre-leasing space to anchor tenants to mitigate risk and generate demand, while leasing up high value space closer to or after delivery, when the space can be physically shown to the market. We also have mitigated our financial risks by executing guaranteed maximum price construction contracts with respect to each of these assets to mitigate potential cost overruns. The following tables provide information about our office, multifamily and retail assets under construction as of March 31, 2016.
See "Case Studies—CEB Tower at Central Place" on page 37, "—16th & I Street" on page 38 and "—13th and U Street" on page 32.
Office Assets Under Construction
| | | | | | | | | | | | | | | | | | | | | | | | | | | | | | | | | | | | |
| |
| |
| |
| |
| |
| | Weighted
Average
Pre-lease
Rent
Per
Square
Foot(3) | |
| |
| |
| |
| |
| |
| |
|
|---|
| |
| |
| |
| |
| |
| | Schedule | | Estimated
Remaining
Cost to
Complete(6)
($000s) | |
| |
|
|---|
| |
| |
| |
| | Estimated
Rentable
Square
Feet(1) | |
| | Estimated
Total
Cost(7)
($000s) | | Targeted
NOI
Yield
Range(8) |
|---|
Office Asset | | Location | | Submarket | | Percent
Ownership | | Percent
Pre-
leased(2) | | Initial
Control
Date(4) | | Construction
Start Date | | Estimated
Completion
Date | | Estimated
Stabilization
Date(5) |
|---|
Office—Construction | | | | | | | | | | | | | | | | | | | | | | | | | | | | | | | | | | | | |
CEB Tower at Central Place | | Arlington, VA | | Rosslyn | | | 100.0 | % | | 536,710 | | | 65.0 | % | $ | 62.00 | | | Q2 2003 | | | Q4 2014 | | | Q2 2018 | | | Q4 2019 | | $ | 219,719 | | $ | 340,930 | | 7.7% - 8.2% |
Note: Table shown at 100 percent share.
- (1)
- Includes office and retail square feet, unless otherwise noted.
- (2)
- Based on leases signed as of March 31, 2016 and is calculated as the total estimated rentable square feet leased divided by total estimated rentable square feet, expressed as a percentage.
- (3)
- Based on leases signed as of March 31, 2016 and is calculated as base rent before abatements, plus tenant reimbursements for the month in which the lease commences, multiplied by 12. Triple net leases are converted to a gross basis by adding tenant reimbursements to base rent. See "—Our Office Assets—Contractual Rent Abatement in Our Office Portfolio" for detail on rent abatements.
- (4)
- Represents the first quarter in which JBG controlled the land parcel, either through a contract, leasehold or fee simple ownership.
- (5)
- Represents management's estimate of the first quarter of operations in which the asset may be stabilized.
- (6)
- Based on management's estimates as of March 31, 2016 and includes all acquisition costs, hard costs, soft costs, tenant improvements and leasing costs to develop and stabilize the asset.
- (7)
- Represents management's estimate of cost incurred to date, plus the estimated remaining cost to complete the asset as of March 31, 2016. Management's estimate of cost incurred to date is based on the most recent transaction value, which may differ from JBG's original acquisition basis.
- (8)
- Represents our underwritten initial full year stabilized net operating income (NOI) as a percent of estimated total cost. We estimate a construction office asset's initial full year stabilized NOI as part of our standard development underwriting process and calculate it by subtracting our estimate of the asset's initial full year stabilized operating expenses (before interest, income taxes (if any), depreciation and amortization and related party management fees) from our estimate of its initial full year stabilized cash revenue. Actual initial full year stabilized NOI yield ranges may vary from the targeted NOI yield ranges based on the actual total cost to complete the asset and its actual initial full year stabilized NOI.
Multifamily Assets Under Construction
| | | | | | | | | | | | | | | | | | | | | | | | | | | | | | | | | |
| |
| |
| |
| |
| |
| | Schedule | | Estimated
Remaining
Cost to
Complete(2)
($000s) | |
| |
|
|---|
| |
| |
| |
| | Estimated
Rentable
Square
Feet(1) | |
| | Estimated
Total
Cost(3)
($000s) | | Targeted
NOI
Yield
Range(4) |
|---|
Multifamily Asset | | Location | | Submarket | | Percent
Ownership | | Estimated
Number
of Units | | Initial
Control
Date | | Construction
Start
Date | | Estimated
Completion
Date | | Estimated
Stabilization
Date |
|---|
Multifamily—Construction | | | | | | | | | | | | | | | | | | | | | | | | | | | | | | | | | |
Mid/High-Rise | | | | | | | | | | | | | | | | | | | | | | | | | | | | | | | | | |
Reston Heights—Phase I(5) | | Reston, VA | | Reston | | | 10.0 | % | | 327,163 | | | 386 | | | Q1 2006 | | | Q4 2015 | | | Q2 2018 | | | Q3 2019 | | $ | 72,680 | | $ | 94,037 | | 8.1% - 8.6% |
1244 South Capitol Street | | Washington, DC | | Southeast | | | 100.0 | % | | 226,283 | | | 291 | | | Q4 2013 | | | Q4 2015 | | | Q2 2018 | | | Q3 2019 | | | 76,631 | | | 105,938 | | 7.3% - 7.8% |
7770 Norfolk | | Bethesda, MD | | Bethesda CBD | | | 79.9 | % | | 208,678 | | | 200 | | | Q2 2011 | | | Q3 2013 | | | Q3 2016 | | | Q3 2017 | | | 8,319 | | | 101,331 | | 5.7% - 6.2% |
13th & U Street(6) | | Washington, DC | | U Street/Shaw | | | 100.0 | % | | 147,056 | | | 130 | | | Q3 2008 | | | Q1 2015 | | | Q3 2017 | | | Q2 2018 | | | 39,426 | | | 68,421 | | 7.8% - 8.3% |
| | | | | | | | | | | | | | | | | | | | | | | | | | | | | | | | | | |
Total/Weighted Average | | | | | | | | | | 909,180 | | | 1,007 | | | | | | | | | | | | | | $ | 197,056 | | $ | 369,727 | | 7.2% - 7.7% |
| | | | | | | | | | | | | | | | | | | | | | | | | | | | | | | | | | |
| | | | | | | | | | | | | | | | | | | | | | | | | | | | | | | | | | |
| | | | | | | | | | | | | | | | | | | | | | | | | | | | | | | | | | |
Note: Table shown at 100 percent share.
- (1)
- Includes multifamily and retail square feet, unless otherwise noted.
- (2)
- Based on management's estimates as of March 31, 2016 and includes all acquisition costs, hard costs, soft costs, tenant improvements and leasing costs to develop and stabilize the asset.
- (3)
- Represents management's estimate of cost incurred to date, plus the estimated remaining cost to complete the asset as of March 31, 2016. Management's estimate of cost incurred to date is based on the most recent transaction value, which may differ from JBG's original acquisition basis.
20
- (4)
- Represents our underwritten initial full year stabilized net operating income (NOI) as a percent of estimated total cost. We estimate a construction multifamily asset's initial full year stabilized NOI as part of our standard development underwriting process and calculate it by subtracting our estimate of the asset's initial full year stabilized operating expenses (before interest, income taxes (if any), depreciation and amortization and related party management fees) from our estimate of its initial full year stabilized cash revenue. Actual initial full year stabilized NOI yield ranges may vary from the targeted NOI yield ranges based on the actual total cost to complete the asset and its actual initial full year stabilized NOI.
- (5)
- Reston Heights—Phase I is part of a mixed-use property that includes the Reston Heights—Phase I Retail construction retail asset.
- (6)
- 13th & U Street is subject to a ground lease with an expiration date of July 31, 2107.
Retail Assets Under Construction
| | | | | | | | | | | | | | | | | | | | | | | | | | | | | | | | | | | | |
| |
| |
| |
| |
| |
| | Weighted
Average
Pre-lease
Rent Per
Square
Foot | |
| |
| |
| |
| |
| |
| |
|
|---|
| |
| |
| |
| |
| |
| | Schedule | | Estimated
Remaining
Cost to
Complete(1)
($000s) | |
| |
|
|---|
| |
| |
| |
| | Estimated
Rentable
Square
Feet | |
| | Estimated
Total
Cost(2)
($000s) | | Targeted
NOI
Yield
Range(3) |
|---|
Retail Asset | | Location | | Submarket | | Percent
Ownership | | Percent
Pre-
leased | | Initial
Control
Date | | Construction
Start
Date | | Estimated
Completion
Date | | Estimated
Stabilization
Date |
|---|
Retail—Construction | | | | | | | | | | | | | | | | | | | | | | | | | | | | | | | | | | | | |
Reston Heights—Phase I Retail(4) | | Reston, VA | | Reston | | | 10.0 | % | | 89,690 | | | 0.0 | % | $ | — | | | Q1 2006 | | | Q4 2015 | | | Q2 2018 | | | Q2 2019 | | $ | 37,468 | | $ | 43,352 | | 4.7% - 5.2% |
RTC—West Retail(5) | | Reston, VA | | Reston | | | 100.0 | % | | 40,100 | | | 29.4 | % | | 63.51 | | | Q4 2012 | | | Q4 2015 | | | Q2 2017 | | | Q1 2018 | | | 26,027 | | | 29,650 | | 6.6% - 7.1% |
4735 Bethesda Avenue Retail | | Bethesda, MD | | Bethesda CBD | | | 100.0 | % | | 16,737 | | | 0.0 | % | | — | | | Q2 2000 | | | Q4 2015 | | | Q3 2016 | | | Q3 2019 | | | 12,145 | | | 29,677 | | 3.0% - 3.5% |
| | | | | | | | | | | | | | | | | | | | | | | | | | | | | | | | | | | | | |
Total/Weighted Average | | | | | | | | | | 146,527 | | | 8.1 | % | $ | 63.51 | | | | | | | | | | | | | | $ | 75,640 | | $ | 102,679 | | 4.8% - 5.3% |
| | | | | | | | | | | | | | | | | | | | | | | | | | | | | | | | | | | | | |
| | | | | | | | | | | | | | | | | | | | | | | | | | | | | | | | | | | | | |
| | | | | | | | | | | | | | | | | | | | | | | | | | | | | | | | | | | | | |
Note: Table shown at 100 percent share.
- (1)
- Based on management's estimates as of March 31, 2016 and includes all acquisition costs, hard costs, soft costs, tenant improvements and leasing costs to develop and stabilize the asset.
- (2)
- Represents management's estimate of cost incurred to date, plus the estimated remaining cost to complete the asset as of March 31, 2016. Management's estimate of cost incurred to date is based on the most recent transaction value, which may differ from JBG's original acquisition basis.
- (3)
- Represents our underwritten initial full year stabilized net operating income (NOI) as a percent of estimated total cost. We estimate a construction retail asset's initial full year stabilized NOI as part of our standard development underwriting process and calculate it by subtracting our estimate of the asset's initial full year stabilized operating expenses (before interest, income taxes (if any), depreciation and amortization and related party management fees) from our estimate of its initial full year stabilized cash revenue. Actual initial full year stabilized NOI yield ranges may vary from the targeted NOI yield ranges based on actual total cost to complete the asset and its actual initial full year stabilized NOI.
- (4)
- Reston Heights—Phase I Retail is part of a mixed-use property that includes the Reston Heights—Phase I construction multifamily asset.
- (5)
- RTC—West Retail is part of a mixed-use property that includes the RTC—West operating office asset.
Develop Our Significant Future Pipeline. We have a significant pipeline of opportunities for value creation through ground-up development, with the goal of producing favorable risk-adjusted returns on our capital.
- •
- Robust near-term pre-development pipeline. In addition to the near-term growth contribution anticipated from our assets under construction, we have a pipeline of 12 high-quality pre-development assets that we expect to provide substantial medium and long-term growth for our portfolio. We estimate that this pre-development pipeline will have a total cost of over $1.1 billion with approximately $914.7 million of remaining cost to complete as of March 31, 2016. We are targeting initial full year stabilized NOI yields-on-cost from these assets in the range of 7.5 to 8.0 percent, based on internal underwriting estimates. We believe these projects provide significant potential for value creation. Of the 12 assets in our pre-development pipeline, we believe the majority have substantially completed the entitlement process, and we expect to be in a position to commence construction on six of these assets by March 31, 2017. Our pre-development pipeline will comprise approximately 948,000 RSF of office space, over 932,000 RSF of multifamily space and over 86,000 RSF of retail space, with 95.6 percent of this square footage inside the Beltway and/or in Metro-served locations.
21
Pre-Development Pipeline
| | | | | | | | | | | | | | | | | | | | | | | | | | | | | | | | | |
| |
| |
| |
| |
| |
| | Schedule | | Estimated
Remaining
Cost to
Complete(1)
($000s) | |
| |
|
|---|
| |
| |
| |
| | Estimated
Rentable
Square
Feet | |
| | Estimated
Total
Cost(2)
($000s) | | Targeted
NOI
Yield
Range(3) |
|---|
Pre-Development Asset | | Location | | Submarket | | Percent
Ownership | | Percent
Pre-
leased | | Initial
Control
Date | | Estimated
Construction
Start Date | | Estimated
Completion
Date | | Estimated
Stabilization
Date |
|---|
Office | | | | | | | | | | | | | | | | | | | | | | | | | | | | | | | | | |
1900 N Street(4) | | Washington, DC | | CBD | | | 100.0 | % | | 268,631 | | | — | | | Q2 2007 | | | Q3 2017 | | | Q1 2020 | | | Q3 2021 | | $ | 136,272 | | $ | 193,576 | | 7.7% - 8.2% |
4747 Bethesda Avenue | | Bethesda, MD | | Bethesda CBD | | | 100.0 | % | | 260,236 | | | — | | | Q2 2006 | | | Q3 2017 | | | Q3 2019 | | | Q1 2021 | | | 131,200 | | | 153,490 | | 8.3% - 8.8% |
1250 1st Street | | Washington, DC | | NoMa | | | 30.0 | % | | 251,491 | | | — | | | Q2 2005 | | | Q1 2017 | | | Q3 2020 | | | Q1 2022 | | | 111,862 | | | 132,277 | | 7.3% - 7.8% |
50 Patterson Street | | Washington, DC | | NoMa | | | 30.0 | % | | 167,350 | | | — | | | Q2 2005 | | | Q1 2017 | | | Q2 2019 | | | Q4 2019 | | | 63,660 | | | 75,819 | | 7.8% - 8.3% |
| | | | | | | | | | | | | | | | | | | | | | | | | | | | | | | | | | |
Total/Weighted Average | | | | | | | | | | 947,708 | | | | | | | | | | | | | | | | | $ | 442,994 | | $ | 555,162 | | 7.8% - 8.3% |
| | | | | | | | | | | | | | | | | | | | | | | | | | | | | | | | | | |
Multifamily | | | | | | | | | | | | | | | | | | | | | | | | | | | | | | | | | |
Georgetown Development Parcel(5) | | Washington, DC | | Georgetown Multifamily | | | 100.0 | % | | 204,892 | | | — | | | Q1 2015 | | | Q3 2017 | | | Q3 2019 | | | Q2 2020 | | $ | 102,914 | | $ | 104,855 | | 8.8% - 9.3% |
West Half II | | Washington, DC | | Southeast | | | 94.2 | % | | 173,947 | | | — | | | Q1 2015 | | | Q2 2017 | | | Q3 2019 | | | Q1 2020 | | | 88,585 | | | 99,407 | | 8.2% - 8.7% |
West Half III | | Washington, DC | | Southeast | | | 94.2 | % | | 208,783 | | | — | | | Q1 2015 | | | Q2 2017 | | | Q3 2019 | | | Q2 2020 | | | 87,060 | | | 124,970 | | 6.4% - 6.9% |
Atlantic Plumbing C—North | | Washington, DC | | U Street/Shaw | | | 60.0 | % | | 144,876 | | | — | | | Q4 2010 | | | Q1 2017 | | | Q2 2019 | | | Q1 2020 | | | 60,520 | | | 75,084 | | 7.5% - 8.0% |
51 N Street | | Washington, DC | | NoMa | | | 30.0 | % | | 119,981 | | | 26.7 | % | | Q2 2005 | | | Q1 2017 | | | Q2 2019 | | | Q4 2019 | | | 51,255 | | | 63,604 | | 5.8% - 6.3% |
Atlantic Plumbing C—South | | Washington, DC | | U Street/Shaw | | | 60.0 | % | | 79,676 | | | — | | | Q4 2010 | | | Q1 2017 | | | Q2 2019 | | | Q3 2019 | | | 34,750 | | | 43,525 | | 7.2% - 7.7% |
| | | | | | | | | | | | | | | | | | | | | | | | | | | | | | | | | | |
Total/Weighted Average | | | | | | | | | | 932,155 | | | | | | | | | | | | | | | | | $ | 425,084 | | $ | 511,445 | | 7.4% - 7.9% |
| | | | | | | | | | | | | | | | | | | | | | | | | | | | | | | | | | |
Retail | | | | | | | | | | | | | | | | | | | | | | | | | | | | | | | | | |
Stonebridge at Potomac Town Center—Phase II | | Woodbridge, VA | | Prince William County | | | 10.0 | % | | 51,738 | | | — | | | Q4 2015 | | | Q2 2017 | | | Q4 2018 | | | Q3 2019 | | $ | 30,646 | | $ | 33,226 | | 8.3% - 8.8% |
Upper Rock Retail | | Rockville, MD | | North Rockville | | | 100.0 | % | | 34,700 | | | 88.2 | % | | Q2 2003 | | | Q3 2016 | | | Q3 2017 | | | Q1 2018 | | | 15,986 | | | 29,911 | | 3.1% - 3.6% |
| | | | | | | | | | | | | | | | | | | | | | | | | | | | | | | | | | |
Total/Weighted Average | | | | | | | | | | 86,438 | | | | | | | | | | | | | | | | | $ | 46,632 | | $ | 63,137 | | 5.8% - 6.3% |
| | | | | | | | | | | | | | | | | | | | | | | | | | | | | | | | | | |
Total/Weighted Average | | | | | | | | | | 1,966,301 | | | | | | | | | | | | | | | | | $ | 914,710 | | $ | 1,129,744 | | 7.5% - 8.0% |
| | | | | | | | | | | | | | | | | | | | | | | | | | | | | | | | | | |
| | | | | | | | | | | | | | | | | | | | | | | | | | | | | | | | | | |
| | | | | | | | | | | | | | | | | | | | | | | | | | | | | | | | | | |
Note: Table shown at 100 percent share.
- (1)
- Based on management's estimates as of March 31, 2016 and includes all acquisition costs, hard costs, soft costs, tenant improvements and leasing costs to develop and stabilize the asset.
- (2)
- Represents management's estimate of cost incurred to date, plus the estimated remaining cost to complete the asset as of March 31, 2016. Management's estimate of cost incurred to date is based on the most recent transaction value, which may differ from JBG's original acquisition basis.
- (3)
- Represents our underwritten initial full year stabilized net operating income (NOI) as a percent of estimated total cost. We estimate a pre-development asset's initial full year stabilized NOI as part of our standard development underwriting process and calculate it by subtracting our estimate of the asset's initial full year stabilized operating expenses (before interest, income taxes (if any), depreciation and amortization and related party management fees) from our estimate of its initial full year stabilized cash revenue. Actual initial full year stabilized NOI yield ranges may vary from the targeted NOI yield ranges based on actual total cost to complete the asset and its actual initial full year stabilized NOI.
- (4)
- A portion of 1900 N Street is subject to a ground lease with an expiration date of May 31, 2106.
- (5)
- Georgetown Development Parcel is subject to a ground lease with an expiration date of August 31, 2073. Georgetown Development Parcel is currently under contract with an outside closing date of June 30, 2016.
22
- •
- Substantial Land Bank. We also have a land bank consisting of 41 future development land parcels with an estimated value as of March 31, 2016 of approximately $500.7 million. We estimate our land bank can support approximately 19.5 million square feet of estimated potential density, with approximately 92 percent of this potential density inside the Beltway and/or in Metro-served locations, which will continue to support incremental development activity well into the future. Our land bank is comprised of 19 standalone parcels that we estimate could support approximately 8.5 million square feet of estimated potential density, 11 parcels adjacent to our existing operating assets that we estimate could support approximately 3.9 million square feet of estimated potential density and 11 parcels attached to our existing operating assets that would require a redevelopment of approximately 532,000 office and/or retail square feet and 1,160 multifamily units in order to access approximately 7.2 million square feet of total estimated potential density. We strategically acquired this collection of land parcels over many years and believe it affords us substantial optionality and value.
The parcels in our land bank are located primarily within the desirable submarkets of NoMa, Capitol Hill, Southeast and Southwest in Washington, DC, Rosslyn-Ballston Corridor, I-395 Corridor, Reston and Tysons Corner in Northern Virginia, and the Rockville Pike Corridor and Downtown Silver Spring in Suburban Maryland.
The following table presents information about our land held for development.
Land Bank
| | | | | | | | | | | | | |
| | Weighted Average
Percentage
Ownership(1) | | Estimated
Value as of
March 31,
2016(2) ($000s) | | Estimated Potential
Density(3) | | Estimated Potential
Density as a
Percentage of Total | |
|---|
Virginia | | | 84.1 | % | $ | 276,217 | | | 11,314,000 | | | 58.0 | % |
Washington, DC | | | 71.4 | % | | 134,678 | | | 3,912,500 | | | 20.1 | % |
Maryland | | | 70.0 | % | | 89,756 | | | 4,269,500 | | | 21.9 | % |
| | | | | | | | | | | | | | |
Total/Weighted Average | | | 78.1 | % | $ | 500,651 | | | 19,496,000 | | | 100.0 | % |
| | | | | | | | | | | | | | |
| | | | | | | | | | | | | | |
| | | | | | | | | | | | | | |
Note: Table shown at 100 percent share.
- (1)
- Weighted average percent ownership is calculated based on estimated value.
- (2)
- Represents management's estimate of value as of March 31, 2016. The value contemplates management's estimate of any entitlement costs, option payments, ground lease payments or other costs required to access the estimated potential density. As these costs are incurred, the value may increase.
- (3)
- Reflects management's estimate of developable square feet based on its current business plans as of March 31, 2016. Our land bank is comprised of 41 parcels, including 19 standalone parcels that we estimate could support approximately 8.5 million square feet of estimated potential density, 11 parcels adjacent to our existing operating assets that we estimate could support approximately 3.9 million square feet of estimated potential density and 11 parcels attached to our existing operating assets that would require a redevelopment of approximately 532,000 office and/or retail square feet and 1,160 multifamily units in order to access approximately 7.2 million square feet of total estimated potential density.
Redevelop and Reposition of Assets. We intend to seek to increase occupancy, increase rents, improve tenant quality and enhance cash flow and value by completing the redevelopment and repositioning of a number of our assets. We evaluate our portfolio on an ongoing basis to identify value-creating redevelopment and renovation opportunities, including the addition of amenities, unit renovations and building and landscaping enhancements. Potential new projects include value-creation opportunities that we have identified within our portfolio, as well as new opportunities created by undermanaged acquisition opportunities. For example, we intend to redevelop and/or reposition 1,400
23
of our apartment units at 10 of our multifamily assets over the next few years. We estimate that we will achieve an average monthly rent premium per unit following renovation of approximately $210 and are targeting initial NOI yields on renovation costs for these units in the range of 10 to 20 percent, based on internal underwriting estimates. We believe these renovations provide potential for rent growth. The table below outlines the potential renovation premiums and incremental targeted yields on cost at our multifamily assets.
24
Potential Renovation Premiums for Multifamily Assets
| | | | | | | | | | | | | | | | | | | | | | | | | | | | | | | |
| |
| |
| |
| |
| | Per Unit | | Asset Totals | |
| |
|---|
| |
| |
| |
| | Estimated
Number
of Units
Renovated
Per Year(1) | |
| |
|---|
Multifamily Asset | | Percent
Ownership | | Total
Units | | Number of
Units to
Renovate | | In-Place
Monthly
Rents as of
March 31, 2016 | | Estimated
Monthly
Renovation
Premium(2) | | Estimated
Renovation
Cost | | Estimated
Annualized
Rent
Premium(3) | | Estimated
Total
Renovation
Cost | | Incremental
Targeted Yield
on Cost(3)(4) | |
|---|
Hillwood(5) | | | 100.0 | % | | 601 | | | 317 | | | 63 | | $ | 1,410 | | $ | 350 | | $ | 36,500 | | $ | 1,331,400 | | $ | 11,570,500 | | | 11.5 | % |
Lynbrook(5) | | | 100.0 | % | | 575 | | | 254 | | | 32 | | | 1,302 | | | 110 | | | 13,000 | | | 335,280 | | | 3,302,000 | | | 10.2 | % |
Falkland Chase—South & West | | | 100.0 | % | | 268 | | | 178 | | | 45 | | | 1,728 | | | 150 | | | 11,000 | | | 320,400 | | | 1,958,000 | | | 16.4 | % |
Meadowcreek(5) | | | 100.0 | % | | 416 | | | 144 | | | 18 | | | 1,279 | | | 110 | | | 13,000 | | | 190,080 | | | 1,872,000 | | | 10.2 | % |
Charter Oak(6) | | | 100.0 | % | | 262 | | | 124 | | | 62 | | | 1,546 | | | 242 | | | 16,000 | | | 360,818 | | | 1,984,000 | | | 18.2 | % |
The Gale | | | 5.0 | % | | 603 | | | 106 | | | 45 | | | 2,140 | | | 115 | | | 9,860 | | | 146,418 | | | 1,045,123 | | | 14.0 | % |
Fairway Apartments(7) | | | 10.0 | % | | 346 | | | 102 | | | 51 | | | 1,562 | | | 185 | | | 18,000 | | | 226,440 | | | 1,836,000 | | | 12.3 | % |
Brookdale(5) | | | 100.0 | % | | 472 | | | 86 | | | 22 | | | 1,290 | | | 350 | | | 36,500 | | | 361,200 | | | 3,139,000 | | | 11.5 | % |
Bennington Crossings | | | 100.0 | % | | 308 | | | 46 | | | 23 | | | 1,397 | | | 150 | | | 9,000 | | | 82,800 | | | 414,000 | | | 20.0 | % |
Stoneridge(5) | | | 100.0 | % | | 198 | | | 43 | | | 11 | | | 1,475 | | | 350 | | | 36,500 | | | 180,600 | | | 1,569,500 | | | 11.5 | % |
| | | | | | | | | | | | | | | | | | | | | | | | | | | | | | | | |
Total/Weighted Average | | | | | | 4,049 | | | 1,400 | | | 37 | | $ | 1,490 | | $ | 210 | | $ | 20,493 | | $ | 3,535,436 | | $ | 28,690,123 | | | 12.3 | % |
| | | | | | | | | | | | | | | | | | | | | | | | | | | | | | | | |
| | | | | | | | | | | | | | | | | | | | | | | | | | | | | | | | |
| | | | | | | | | | | | | | | | | | | | | | | | | | | | | | | | |
Note: Table shown at 100 percent share.
- (1)
- Estimated number of units renovated per year is based on management's estimate.
- (2)
- Estimated monthly renovation premium is based on management's estimate.
- (3)
- Figures assume assets are 100 percent leased and do not contemplate a vacancy factor.
- (4)
- Represents our underwritten initial annualized rent premium from redeveloped and/or repositioned units in the project as a percentage of the total estimated redevelopment and/or repositioning costs for the project, which we collectively refer to as "renovation costs." We estimate a renovated and/or repositioned unit's initial annualized rent premium as part of our standard redevelopment and repositioning underwriting process and calculate it by multiplying the estimated monthly renovation premium by 12.
- (5)
- Denotes assets that are part of Mark Center Portfolio. Mark Center assets were operating multifamily and retail assets as of March 31, 2016; however, our development plan contemplates a redevelopment of approximately 12,000 square feet of retail and 764 multifamily units, potentially generating 2.2 million square feet of developable density.
- (6)
- Charter Oak was an operating multifamily asset as of March 31, 2016; however, our development plan contemplates a redevelopment of approximately 60 multifamily units, potentially generating 399,000 square feet of developable density.
- (7)
- Fairway Apartments was an operating multifamily asset as of March 31, 2016; however, our development plan contemplates a redevelopment of approximately 154 multifamily units, potentially generating 521,500 square feet of developable density.
25
See "Case Studies—Jefferson Court and The Foundry" on page 39, "—RTC-West" on page 40, "—Mark Center Portfolio" on page 33 and "—5600 and 5601 Fishers Lane" on page 27.
Pursue GSA Development Opportunities. Federal government agencies, through GSA, occupy 50.6 million RSF of leased space in the DC Metro area and are anticipated to have lease expirations totaling 28.0 million RSF over the next five years, according to JLL. In certain cases, GSA seeks to consolidate their lease requirements into a new facility in which they can enjoy the benefits of new, efficient office space, meet the new federal government building security requirements and meet the new federal government building energy usage requirements, all in a single site. We believe we are well-positioned to capture opportunities related to these lease expirations, including build-to-suit and pre-leased GSA office opportunities that offer attractive, risk-adjusted returns and meet these federal requirements. We have in-house expertise in government lease procurements and have been awarded a number of previous GSA new building leases and anticipate pursuing similar opportunities in the future. See "—Case Studies—U.S. Department of Transportation Headquarters" on page 28 and "—5600 and 5601 Fishers Lane" on page 27.
Representative examples of building lease requirements over the next five years greater than 250,000 square feet, according to JLL, include:
| | | | |
Agency | | Required
Square Feet | |
|---|
Federal Bureau of Investigation (FBI) Headquarters | | | 2,100,000 | |
Federal Aviation Administration (FAA) | | | 1,000,000 | |
Department of Justice (DOJ) | | | 839,000 | |
FEMA | | | 750,000 | |
Department of Homeland Security—Citizenship and Immigration Service (CIS) | | | 670,000 | |
Navy | | | 600,000 | |
Federal Energy Regulatory Commission (FERC) | | | 504,000 | |
CyberComm | | | 500,000 | |
GPO | | | 400,000 | |
Department of Justice—Civil Division | | | 400,000 | |
National Institutes of Health (NIH) | | | 345,000 | |
Patent and Trademark Office (PTO) | | | 325,000 | |
Smithsonian Institution | | | 250,000 | |
Pursue Attractive Acquisition Opportunities. Since 2000, we have invested in over 250 assets representing approximately $13.0 billion in gross asset value, including over 19.0 million RSF of office, 14,250 multifamily units, 4.0 million RSF of retail, 5,700 hotel rooms, 3,000 for sale residential units and townhomes and 25.0 million square feet of estimated potential land density. We believe that our longstanding market relationships, reputation and expertise will continue to provide us with access to a pipeline of deals that are often compelling, off-market opportunities. We will continue to pursue acquisition opportunities with a disciplined approach and will place an emphasis on well-located, public transit-oriented assets in improving neighborhoods that have strong prospects for growth and where we believe that we can increase value through increasing occupancy and rental rates, re-marketing tenant space, enhancing public spaces, employing Placemaking™ strategies and improving building management. We also may pursue attractive income-producing opportunities that provide optionality with respect to redevelopment opportunities. See "—Case Studies—Jefferson Court and The Foundry" on page 39, "—RTC-West" on page 40, "—Sky House" on page 30 and "—5600 and 5601 Fishers Lane" on page 27.
26
Case Studies
We believe the following case studies are examples of our strengths and strategies and demonstrate how we believe that we can create value for our investors.
5600 and 5601 Fishers Lane, Rockville, Maryland
Office asset demonstrating redevelopment expertise, GSA portfolio, efficient capital allocation and acquisition abilities
5600 Fishers Lane is an approximately 1.3 million RSF office building located in the Twinbrook neighborhood of Rockville, Maryland, less than half a mile from the Twinbrook Metro station (red line). The building has served as a primary office facility for a U.S. Government GSA tenant since its completion in 1970. JBG initially invested in the property in 2009 by purchasing a $48 million secured mezzanine note for $12 million, or approximately 25 percent of the note's face value. We viewed the investment in the note as a low-cost option on the property that would provide the potential for current income with the opportunity for substantial longer term upside. In the 12 months following the initial investment, we received approximately $10 million in cash flow on the original $12 million investment.
During those 12 months, JBG negotiated with the senior lender to extend the existing debt to allow time for the pursuit of a lease extension and to provide interim cash flow to the property. We ultimately negotiated with the U.S. Government GSA tenant to extend the existing lease term for an intermediate term and in 2010, JBG converted the note into a majority equity position (66.6 percent) alongside the existing owner, who retained the balance of the equity. In 2011, following a competitive solicitation process, JBG was able to execute a new, long-term lease with the U.S. Government GSA tenant, which is now scheduled to expire in 2030, to remain at this location on terms which JBG believed provided appropriate risk-adjusted returns on its investment.
As part of the new long-term lease, JBG undertook an approximately 1.0 million RSF renovation of the property, constructing a new curtainwall façade, a light-filled 14-story atrium and completing a comprehensive overhaul of the building's systems. JBG devised a design and phasing strategy intended to minimize disruption during the extensive renovations which eliminated swing space rental costs, provided interim cash flow by maintaining tenancy during the renovation, and lowered the required equity in the project. JBG completed the first phase of the project in mid-2014 and completed the final phase at the end of 2015, one year ahead of schedule. We retained approximately 350,000 RSF that will be available for redevelopment, expansion by the current tenant or to lease to new tenants. We refer to this asset as 5600 Fishers Lane-Wing C in our land bank.
Our financing strategy improved our ability to secure an attractive long-term lease with the U.S. Government GSA tenant. We negotiated a firm fixed-rent start date on the tenancy and secured a AA credit rating on bonds issued to finance the property, which provided highly attractive borrowing costs. Additionally, we further improved our returns on the project by entering into a parking contract with the tenant.
In addition to the approximately 935,000 RSF lease of 5600 Fishers Lane, JBG pursued an additional opportunity in connection with the surface parking lots serving the building. Local zoning changes permitted the renovation of 5600 Fishers Lane to increase the parking for the building. As a result, one of the two existing surface parking lots was no longer needed to support the main building. JBG identified an opportunity with the federal government and commenced the design and site plan regulatory approval process of an approximately 491,000 RSF building on the site in advance of the federal government's solicitation for offers, with the goal of meeting strict occupancy dates imposed by the federal government. JBG was ultimately awarded a 15-year lease and delivered the 5601 Fishers Lane build-to-suit in early 2014.
27
U.S. Department of Transportation Headquarters, Washington, DC
Office asset demonstrating high quality, mission-critical GSA portfolio and build-to-suit development expertise
The U.S. Department of Transportation Headquarters is an approximately 1.5 million square foot office building complex developed by JBG and completed in 2006. The complex is located in the heart of the Capitol Riverfront neighborhood in Washington, DC, across the street from the Navy Yard Metro station (green line) and is the first trophy building in the Capitol Riverfront neighborhood. The Capitol Riverfront neighborhood is a vibrant mixed-use community and riverfront destination that includes restaurants and attractions surrounding Nationals Stadium, home of the Washington Nationals baseball team, which is two blocks away from the property. Since the completion of the building, the neighborhood has enjoyed a significant increase in retail amenities, including the addition of a grocer, a health and fitness club and several new restaurants immediately adjacent to the building. Additionally, the area has seen a significant increase in residential density over the past several years, further complementing the mixed-use community in the submarket.
JBG competed in a GSA managed RFP process and was awarded the opportunity to develop this build-to-suit facility for the U.S. Department of Transportation. The property was designed by award-winning architectural firm Michael Graves & Associates to meet GSA's high security standards. The facility is comprised of two interconnected office buildings and a modern fitness center and offers on-site dining and conference facilities. Each building features a full-height atrium that provides abundant natural light to building workspaces. The flexible architectural design is conducive to multi-tenant arrangements, should we desire to change the building's layout.
The entire facility is leased through 2021 to the U.S. Department of Transportation, net of utilities and taxes, with rents escalating at two percent per annum and an 11-year extension option. We believe GSA has invested significant capital above any landlord tenant improvement allowance for improvements and space customization, which increases the likelihood that the tenant will exercise its extension option.
We believe that the property has significant additional revenue potential if GSA renews its lease for several reasons. First, the actual BOMA measurement for the building is approximately 150,000 square feet more than the square footage agreed to in the original lease, so a significant increase in the lease square footage may be possible. Second, the existing lease renewal provision contemplates an increase in the rent to the greater of (i) 95 percent of a market rental rate, or (ii) the base rent in effect during the last year of the initial lease term, plus actual operating expenses for the first year of the renewal term. We estimate the minimum annualized base rent (not including operating expenses, taxes and electricity) for the first year of the renewal term would be no less than $29.48 per square foot based upon the current lease contractual rent increases (estimated to total no less than approximately $45.00 per square foot when including actual operating expenses and real estate taxes) as compared to a current annualized rent of $40.07 per square foot in 2015 (including actual operating expenses and real estate taxes). We believe the likelihood that GSA will renew based on its investment in the space coupled with the ability to capture additional BOMA measured square feet and mark the rental rate to market, provides an opportunity for a significant increase in revenue upon a renewal.
28
77 H Street, NW, Washington, DC
Multifamily and retail asset demonstrating extensive market knowledge and long-standing relationships and high quality mixed-use portfolio
In September 2010, we entered into a joint venture to pursue a multi-phased development of 3.7 acres of vacant land consisting of two adjacent parcels located at 801 New Jersey Avenue, NW and 77 H Street, NW in the Capitol Hill submarket of Washington, DC. Our joint venture partner had controlled the properties through a ground lease with the Washington, DC government since 1990, but the parcels remained undeveloped. Under the terms of the ground lease, failure to commence construction of the first phase of development by August 2013 would have constituted default. JBG was able to leverage its existing relationships with "big box" retailers to advance lease discussions quickly and start construction by February 2012 on what would eventually become the first ever urban-format Walmart-anchored mixed-use development to be located in a central business district in North America.
We completed the first phase of the development, the 77 H Street, NW parcel, in December 2013. This building consists of 303 residential units and nearly 100,000 RSF of retail, including the approximately 85,000 RSF Walmart. The property is located three quarters of a mile from the U.S. Capitol Building, four blocks from Union Station (red line) and within walking distance to the Gallery Place (red, green and yellow lines) and Judiciary Square (red line) Metro stations. Walmart serves as the anchor tenant, which we believe was helpful in attracting other tenants, such as Starbucks and Capital One, to the remaining retail space. Upon completion of construction in December 2013, we sold this property for $127 million, generating a gross levered IRR and equity multiple of 78.8 percent and 3.6x, respectively, for one of the JBG funds.
29
Sky House, Washington, DC
Multifamily asset demonstrating redevelopment expertise and extensive market knowledge and long-standing relationships
Sky House is a two-tower, 530-unit luxury apartment community located next to the Waterfront Metro station (green line) in Southwest Washington, DC. The property is conveniently located one block from a 27-acre mixed-use redevelopment known as The Wharf that is expected to comprise over 3 million square feet of residential, retail, office and hotel space upon completion. It also benefits from its proximity to nearby Nationals Stadium, the home of the Washington Nationals baseball team. The U.S. Capitol, a major federal employment center, is a half mile to the north, and the property is in close proximity to the Capitol Riverfront neighborhood in Southeast, which houses approximately eight million square feet of office space, including the Washington Navy Yard and the U.S. Department of Transportation.
Our investment in Sky House was the result of an off-market opportunity brought to us by a joint-venture partner, which planned to renovate and reposition the two 1970's era, I.M. Pei-designed office buildings into luxury residential units. We believe that our market knowledge and prior experience in the Capitol Riverfront neighborhood made us an attractive investment partner. Further, we believe that we were able to leverage our extensive research and previous experience in building smaller, non-traditional units to execute this complicated redevelopment of a post-tension concrete office building into residential apartment units with non-traditional dimensions.
The first of the two towers completed in 2014 was leased at rental rates and leasing velocity exceeding our initial expectations, at an average pace of 33 units per month and an average rent of $2,197 per unit per month or $3.24 per square foot per month for the market rate units (or $1,987 per unit per month or $2.96 per square foot per month, including affordable units, which represent 20.0 percent of the units). We believe that the strong leasing momentum was attributable to the project's desirable location, vast array of building amenities and distinctive unit features, including high ceiling heights and unobstructed views of the Potomac River and the U.S. Capitol Building.
We sold the first tower following stabilization in June 2015 and the second tower at delivery in January 2015 for a total of $171 million to an institutional investor, generating a gross levered IRR and equity multiple of 21.5 percent and 1.9x, respectively, for one of the JBG funds.
30
The Woodley, Washington, DC
Multifamily asset demonstrating development expertise, efficient capital allocation and extensive market knowledge and long-standing relationships
The Woodley is a 212-unit luxury apartment building located one block from the Woodley Park Metro station (red line) in the Connecticut Avenue Corridor submarket in Northwest, Washington, DC. The property is situated near the desirable residential neighborhoods of Cleveland Park, Massachusetts Avenue Heights and Kalorama and adjacent to the Marriott Wardman Park hotel, one of the largest hotels in the city and a well-known regional landmark.
JBG and its joint venture partner in the project purchased the Wardman Park Hotel campus in 2005, with the goal of creating a residential development opportunity. Our knowledge of zoning in the DC Metro area and expertise in accessing new density led us to pursue construction approval as a "by right" opportunity, which would be built as an addition to the existing Marriott Wardman Park Hotel. Our strategy was to utilize the adjacent Marriott hotel for its pedestrian and vehicular circulation but also to minimize other shared connections, with the intention of giving the residences a private, exclusive feel. We recapitalized the property in July 2010 and commenced construction in April 2012.
The site plan was designed to minimize local disruption and take advantage of the opportunity to develop a traditional property in a historic neighborhood with contemporary features and amenities. After thorough market review, JBG decided to design the building with large units, traditional finishes and a sophisticated motif, with the intent of targeting working professionals seeking a convenient and private residence. The property features outdoor amenity spaces, including a courtyard with a reflecting pool and roof deck, as well as a pool deck featuring an infinity edge pool. The building's top floors were designed to feature unrestricted views of the National Cathedral, the Washington Monument and green space along Rock Creek Park.
We sold the building at completion in June 2014 for $195 million, the highest per unit price in Washington, DC history at $919,811 per unit, generating a gross levered IRR and equity multiple of a 25.7 percent and 2.0x, respectively, for one of the JBG funds.
31
13th and U Street, Washington, DC
Multifamily asset demonstrating construction opportunity
The development planned for 13th and U Street will be an eight-story, 130-unit luxury apartment building with ground floor retail in the heart of Washington, DC's vibrant U Street Corridor and located across the street from the U Street Metro station (yellow and green lines). The neighborhood features an avant-garde atmosphere, offering art galleries, theatres, cultural events and numerous restaurants and cafes. The development is located within walking distance of the yellow, green, red and orange Metro lines, as well as multiple bus routes, leading it to be designated a "Walker's Paradise" by walkscore.com. In addition, the neighborhood hosts ZipCar docks and the Washington, DC government plans to install a new Capital Bikeshare rental station at the project.
Plans for the approximately 25,000 square foot site include an eight-story, 130 residential unit, approximately 147,000 RSF development that includes approximately 16,000 RSF of retail space and 48 underground parking spaces. We acquired control of the site through a ground lease in 2008, obtained regulatory approvals in 2013 and commenced construction in early 2015. Project completion is currently targeted for August 2017.
Fronted by a traditional-style brick and cast-stone façade designed by a prize-winning architectural firm, 13th and U Street will offer a boutique-scale project that features larger units than the surrounding area. The property will feature numerous premium amenities, including a rooftop terrace with unobstructed city views, a covered outdoor area overlooking U Street, a penthouse community room, a casual outdoor club room, a sundeck and a fitness center. Plans for the site contemplate more than 60 percent of the units having balconies or terraces, many with unobstructed views of the U.S. Capitol Building. We are targeting NOI yield-on-cost within a range of 7.8 percent to 8.3 percent for the project.
32
Mark Center Portfolio, Alexandria, Virginia
Multifamily and retail asset demonstrating development and redevelopment expertise and Placemaking™ opportunity
Mark Center Portfolio, which we refer to as Mark Center, is a large, income-producing property that also represents an attractive redevelopment opportunity. Mark Center currently consists of five garden-style apartment buildings (Hillwood, Lynbrook, Brookdale, Meadowcreek and Stoneridge) comprised of 2,260 garden-style apartment units, and the Mark Center Shops, an approximately 63,000 RSF retail shopping center. The property encompasses nearly 130 acres of contiguous land located inside the Beltway in the I-395 Corridor and has received regulatory approvals for increased density to effectively double its density. The property is located four miles from The Pentagon and five miles from Reagan National Airport, offering access to the region's major employment centers and retail amenities. The residential buildings onsite were constructed in the 1960's and 1970's and currently share residential amenities including a fitness center, business center, community room, movie theater, sun deck, swimming pools, tennis and volleyball courts and a shuttle to the Pentagon City Metro station (blue and yellow lines).
Following a multi-stage regulatory approval process over four years, JBG also obtained regulatory approvals for development of over 5,000 new residential units (multifamily and townhomes) and over 700,000 new commercial square feet (retail, office and hotel), effectively more than doubling the permitted density. As part of the regulatory approval process, we collaborated with the City of Alexandria, a team of award-winning designers and the community, to plan three new mixed-use neighborhood districts intended to eventually replace most of the existing assets with 25 new blocks featuring a mix of uses.
We intend to commence the first phase of our redevelopment strategy in the next 24-36 months by developing a mixed-use town center, including a grocery store, shops, restaurants, residential units and a town green in order to create a centralized amenity base that we expect to enhance the value of not only the development itself but also of the surrounding existing apartments and planned future development sites. Given the scope of the redevelopment, we formulated the plan to be phaseable, in order to preserve timing flexibility.
We plan to emphasize Placemaking™ during the planning and development process, with a distinct focus on open space uses (such as playgrounds and farmers markets), neighborhood branding, the retail mix (including the incorporation of the pedestrian friendly retail main street and grocery store) and other efforts designed to foster community. In designing the architecture for the town center, we emphasized varied building facades to foster the feeling of a traditional main street that has grown organically over time. We intend to incorporate landscape architecture that will complement the building design and connect the town center to the surrounding natural areas to create new public gathering areas within the town center.
In addition to the redevelopment of the town center and some of the surrounding blocks, our strategic plan for Mark Center includes a complementary renovation of the existing residential communities intended to create differentiated pricing tiers between the various communities and allow Mark Center to attract a wider target resident base.
Our strategic plan for Mark Center further contemplates exterior enhancements, especially in the neighborhoods surrounding the town center, where we believe changes to the exterior will provide an aesthetic more congruent with the new community. To maximize the value the town center will add to the existing apartment buildings, we have begun unit renovations in such apartment buildings and plan to continue to renovate units in coordination with the town center development. These unit renovations include upgrading kitchens with new appliances and cabinetry, as well as adding plank flooring throughout the living space. If, over the next several years, we renovate the 844 remaining
33
units at Mark Center at the underwritten economics, the potential annualized rent premium increase at Mark Center would be approximately $2.4 million assuming an average monthly rent premium of $237 per unit after renovation. We believe that the renovation and the redevelopment aspects of the strategic plan for Mark Center will create a more vibrant, walkable retail environment and a more congruent feel throughout the property.
34
51 Louisiana Avenue, Washington, DC
Office asset demonstrating development expertise and extensive market knowledge and long-standing relationships
In 2004, we acquired 51 Louisiana Avenue, an approximately 206,000 RSF office building located in the Capitol Hill submarket of Washington, DC. The property is immediately adjacent to the grounds of the U.S. Capitol Building, one block from Constitution Avenue and features unobstructed views of the U.S. Capitol Building. Built in the 1930s and renovated in 1999, 51 Louisiana has a limestone façade, a two-story marble lobby and 15-foot ceiling heights on every floor. JBG saw an opportunity to take advantage of unused density on the site by developing a second building that could be substantially pre-leased during construction to the existing law firm tenant. In order to extract that density, the property required regulatory approval from the Board of Zoning Adjustment, the Historical Preservation Review Board, the Architect of the Capitol, and the U.S. Commission of Fine Arts, an independent federal agency prior to commencement of construction. The 15-foot high ceilings in the existing structure and the need for the nine foot floors of the new structure to meet with those in the existing structure presented a challenge in creating expansion space for the existing law firm tenant, which wanted to create a "campus," rather than two separate buildings. JBG navigated these entitlement and design challenges to obtain the necessary regulatory approvals and ultimately pre-leased a significant amount of the space to the existing law firm tenant who was seeking additional space prior to commencing construction on the new 255,000 RSF office building.
The new 10-story building, 300 New Jersey Avenue, was completed in 2009 and is the first office building in Washington, DC designed by Lord Richard Rogers, a Pritzker Prize-winning architect experienced in working with new additions on historic structures. The project included a 10-story glass atrium with glass bridges creating connectivity between the two buildings, which totaled 461,000 RSF. We sold this investment in April 2008 for $375.0 million, or $813 per square foot, a record high at the time, generating a gross levered IRR and equity multiple of 32.8 percent and 2.7x, respectively, for one of the JBG funds.
35
Waterview, Arlington, VA
Office asset demonstrating construction expertise, efficient capital allocation and Placemaking™
In 2007, JBG developed Waterview, a 1.3 million square foot, mixed-use project located in Arlington, Virginia, a close-in suburb of Washington, DC in the Rosslyn submarket. Designed by award winning architects Pei Cobb Freed & Partners, Waterview consists of two towers, includes a 24-story, approximately 625,000 RSF office building in the first tower and a second tower housing a 154-room full-service hotel on the first 12 floors and 133 luxury for-sale condominium units on the top 12 floors.
The mixed-use project required an extensive regulatory approval process and land assemblage effort that entailed the purchase of three land parcels and demolition of several buildings over the course of several years. Prior to commencement of development, we recapitalized the investment and mitigated our exposure by entering into a joint venture with two partners where we retained additional upside through a promoted interest. Also, prior to commencement of development, we entered into a 20-year lease with a publicly traded consulting firm tenant for 100 percent of the office building portion of the project. In addition, we entered into a contract with Kimpton Hotel & Restaurants to manage the hotel, therefore incorporating a luxury brand into the project, which we believed would encourage interest in the condominium portion of the project. We sold the office building in June 2007 for $412 million, or $650 per square foot, a record per square foot price for an office building at the time for the Northern Virginia market. Settlement of the condominiums commenced in February 2007 and was substantially completed by December 2010 with an average sales price of $792 per square foot, with some units achieving prices in excess of $1,000 per square foot, on par with top condo developments in the region. Additionally, we sold the hotel portion of the project in February 2012 for $47.2 million, or $307,000 per room. On the overall mixed-use project, we generated a gross levered IRR and equity multiple of 18.3 percent and 3.4x, respectively, for one of the JBG funds and we generated a gross levered IRR and equity multiple of 53.8 percent and 3.9x, respectively, for another of the JBG funds.
Waterview was one of numerous investments we have made in the Rosslyn submarket, where we have developed over 3 million square feet and where our Placemaking™ approach has contributed to the revitalization of the area since the late 1990s. We identified Rosslyn as an attractive market for Placemaking™ in part due to its accessible location near two major commuter arteries (I-66 and US-50), and proximity to Ronald Reagan National Airport (four miles), the Rosslyn Metro station (blue, orange and silver lines) and the Potomac River, with many mid/high-rise buildings providing unobstructed views of the Potomac River, Georgetown and the Washington, DC skyline. In addition to Waterview, we developed 1801 N. Lynn Street, an approximately 350,000 RSF office tower that was 100 percent leased to GSA prior to completion and Sedona -- Slate, a two-building residential property comprised of 474 rental units and approximately 10,000 RSF of retail. We are currently developing CEB Tower at Central Place, an approximately 537,000 RSF, 31-story office building with approximately 12,000 RSF of retail space, which is 65 percent pre-leased to CEB, Inc., a publicly-traded, global consulting firm, and are also developing Central Place Residential, a 377-unit rental project with approximately 30,000 RSF of retail space, on the same site. Central Place Residential is one of the non-core excluded assets. Additionally, we control a future development opportunity at Rosslyn Gateway (North and South), an approximately 1 million RSF, three-building mixed-use project located one block from Waterview, which will include office, hotel, retail and residential uses.
36
CEB Tower at Central Place, Arlington, VA
Office asset demonstrating construction opportunity, efficient capital allocation, continued Placemaking™ and extensive market knowledge and long-standing relationships
CEB Tower at Central Place is an approximately 537,000 RSF office building currently under construction in the core submarket of Rosslyn, Arlington County, Virginia. CEB Tower at Central Place is expected to be one of the tallest buildings in the DC Metro area and will feature an observation deck open to the public that will offer unobstructed views of the National Mall and downtown Washington, DC. Prior to commencing construction, we executed a 15-year pre-lease with the publicly traded, global consulting firm, CEB, Inc., which we refer to as CEB, for approximately 350,000 square feet. The building is planned to serve as CEB's global corporate headquarters and home office for more than 2,000 DC Metro area employees. We believe that we were able to secure the CEB lease despite a competitive process because of our reputation for developing quality office buildings, including CEB's previous headquarters building, and our proposed building design. CEB will occupy the building's top two office floors and the bottom 13 office floors, leaving floors 21-28, each of which offers views of the Washington, DC skyline, available for lease to other tenants. CEB Tower at Central Place features nine-foot plus ceiling heights, floor-to-ceiling glass curtainwall and highly-efficient floor plates that are designed to maximize daylight and allow for tenant layouts that are more efficient than conventionally-designed buildings. In addition, because it was designed with LEED Gold building systems, CEB Tower at Central Place offers tenants significant savings on energy usage and operating expenses relative to buildings that lack such systems.
CEB Tower at Central Place is located directly adjacent to the Rosslyn Metro station entrance (blue, orange and silver lines) and is part of our Placemaking™ strategy in the Rosslyn submarket and, specifically, within our Central Place assemblage, which is also contemplated to include Central Place Residential, a 377 unit luxury apartment tower currently under construction. When complete, Central Place will deliver a variety of amenities to Rosslyn, including approximately 12,000 square feet of new retail space in CEB Tower at Central Place, approximately 30,000 square feet of new retail space in Central Place Residential, a new public plaza and three high speed elevators to provide direct access to the Rosslyn Metro station below. We believe that these amenities will result in a meaningful benefit to Rosslyn and drive further value to our properties in that submarket.
In 2001, we began acquiring control of land parcels in the city block that covers the land area for CEB Tower at Central Place and Central Place Residences and have spent more than a decade assembling and designing both CEB Tower at Central Place and Central Place Residences and navigating the regulatory approval processes. Central Place Residential is one of the non-core excluded assets. During this period, we maintained control of the site and carried it through the real estate market cycle through strategic recapitalizations. In 2014, we acquired the majority interest for CEB Tower at Central Place at an attractive basis through a structured deal that permitted us to defer closing on the acquisition until after we had executed the CEB lease, secured our construction loan and executed a guaranteed maximum price construction contract. This deal structure provided us with significant downside protection and allowed us to eliminate key deal risks before closing.
Substantial completion of CEB Tower at Central Place currently is scheduled for early 2018, after which we expect CEB to build out its tenant space for occupancy and rent commencement to begin in the second quarter of 2018. We anticipate an 18-24 month lease-up period for the balance of the space, with stabilization occurring in the fourth quarter of 2019. We are targeting a NOI yield-on-cost within a range of 7.7 percent to 8.2 percent for the project.
37
16th and I Street, Washington, DC (900 16th Street)
Office asset demonstrating construction opportunity and risk mitigation through efficient capital allocation
900 16th Street is a trophy office property located at the corner of 16th and I Streets in the CBD submarket of Washington, DC that delivered in the first quarter of 2016. The site is located two blocks from the White House, in close proximity to Farragut West (blue and orange lines) and Farragut North (red line) Metro stations, and is within walkable distance to several high-end retail stores and luxury and upper-upscale hotels.
Our investment in 900 16th Street was made through a joint venture with ICG Properties, or ICG, and the Third Church of Christ, Scientist, or the Church. ICG was seeking, but had not yet received, the necessary regulatory approvals for the development of a new office building on the site. Both ICG and the Church were seeking a partner for the project who possessed demonstrated regulatory approval expertise and a strong track record of successfully completing complicated construction projects. Furthermore, the Church had very specific space and design requirements for the building, which involved substantial design and execution complexity.
We were creatively able to design trophy, Class A office space while also meeting the complex design needs of the Church. As a result of close collaboration between the Church leadership and our award-winning architect, Robert A.M. Stern, the Church building has a crystalline façade along with a sanctuary and office space incorporated into the same structure as the office building and yet remains entirely separate from the office tenants. The building's exterior incorporates White Cherokee marble, Indiana limestone and statuary bronze, and the main lobby features walls of Nestos White marble from Greece and a gold and platinum mesh feature wall created by artisans in France.
Following receipt of required re-zoning and historic regulatory approvals, construction on the site commenced in March 2014 and was completed in the first quarter of 2016. The building is comprised of approximately 116,000 RSF of office space and approximately 4,000 RSF of retail space. As of March 31, 2016, the office space was 72.5 percent leased pursuant to a triple-net lease to a Washington, DC law firm.
We structured the investment to limit our upfront equity commitment to 50 percent of design and other costs associated with the regulatory approval process, providing protection in the event that the proposed increased density was not approved during the re-zoning process. We were able to secure the law firm tenant as the anchor tenant immediately following receipt of regulatory approvals, which further mitigated risk. As a result of the deal structure, we believe that the property was acquired at a significant discount to replacement cost for new office product in the CBD submarket at the time of its acquisition in August 2010.
38
Jefferson Court (1025 Thomas Jefferson Street) and The Foundry (1055 Thomas Jefferson Street), Washington, DC
Office assets demonstrating acquisition and redevelopment expertise, lease-up opportunity and further value-add opportunity
In February 2012, we acquired 1025 Thomas Jefferson Street, which we refer to as Jefferson Court, an approximately 317,000 RSF multi-tenant office building located in the heart of the affluent Georgetown submarket of downtown Washington, DC. Georgetown is an amenity-rich, nationally-designated historic district with more than 450 shopping, dining and entertainment options, including Washington Harbour, a popular, recreational waterfront located directly across the street from Jefferson Court. Upon acquiring the property, we implemented a plan to increase rental rates and occupancy through value-add renovations. We invested approximately $4.5 million to modernize the main lobby, secondary lobby, elevator cabs and certain tenant common lobbies and restrooms as well as to address deferred maintenance and other capital improvements to modernize the building, which was built in 1984. Following completion of these improvements, in February 2014, within two years of its acquisition, Jefferson Court achieved 95 percent occupancy as compared to 65 percent at time of acquisition, which was shortly followed by several lease renewals and tenant expansions that further stabilized the property and bolstered in-place income. Moreover, since acquisition, base rents before concessions have increased from $38.00 per square foot to $46.50 per square foot, or 22 percent, while effective rents (taking into account concessions) have increased by 36 percent from $22.89 per square foot to $31.16 per square foot.
In December 2014, we acquired 1055 Thomas Jefferson Street, which we refer to as The Foundry, an approximately 234,000 RSF multi-tenant office building located adjacent to Jefferson Court. At the time we acquired the property, it was 76 percent leased, with an average in-place rent of $44.53 per square foot and approximately 28,000 RSF of lease expirations scheduled to occur during the first three years following acquisition. Similar to Jefferson Court, we have embarked on a renovation program to capitalize on the potential for higher in-place rents and occupancy at this prime location which overlooks the historic C&O Canal. The first phase of the renovation, which we estimate will be completed in mid-2017, includes modernization and reconfiguration of the main entry vestibule and main lobby, elevator cabs, common area and restroom upgrades, and the addition of a new fitness center and a new conference center.
Our strategy behind the first phase of renovation at The Foundry is consistent with the plan we executed at Jefferson Court, which benefitted from significant occupancy gains following renovations. Leases totaling approximately 87,500 RSF are scheduled to expire in the 18 months following the June 2017 targeted completion for the first phase of renovation. We believe this positions The Foundry to capitalize on the potential for higher rents and occupancy post renovation.
39
RTC—West, Reston, Virginia
Office and retail asset demonstrating redevelopment expertise, Placemaking™ and lease-up opportunity
In November 2012, we acquired RTC—West, an approximately 495,000 RSF, three building asset located in Reston, Virginia, immediately adjacent to Reston Town Center and a planned Metro station (silver line). Our investment rationale was that renovations, repositioning, the introduction of retail amenities and proactive asset management and leasing could result in this asset having comparable performance metrics to those of adjacent buildings in the Reston Town Center, which had approximately 95 percent occupancy as compared to 76 percent for RTC—West and base rents of nearly $15 per square foot higher. Immediately upon acquisition, we launched an effort to rebrand the property from Reston Executive Center to RTC—West, reinforce to the market the property's proximity to Reston Town Center and provide a brand platform for the future addition of residential and retail space. Simultaneously, we commenced a lobby renovation program, which included an investment of $6.4 million to renovate the main lobby of each of the three buildings, including new wall finishes, flooring, column coverings, ceilings and light fixtures. Additionally, we upgraded the elevator cab interiors and added a new approximately 3,000 square foot fitness center with upgraded locker rooms to one building. Between acquisition in November 2012 and March 2015, we executed 24 new leases and achieved 23 percent rent growth to approximately $38.00 per square foot and a 9.2 percent increase in leased space.
Consistent with our Placemaking™ approach, JBG secured a special exception permitting the addition of approximately 20,500 RSF of retail and conversion of approximately 19,500 RSF of first floor office into retail space, which we refer to as RTC-West Retail, a construction retail asset. Concurrent with the construction of the retail space, we will add public spaces, including parks, enhanced sidewalks and outdoor dining. The project commenced construction in the fourth quarter of 2015 and is 29.4 percent pre-leased as of March 31, 2016. We have carefully cultivated the mixture of retail space with a specific focus on dining to further encourage leasing activity and rent growth for the office buildings.
Finally, we have been engaged in the recently-completed Reston Master Plan Special Study, a planning study prepared by Fairfax County, Virginia to help guide future development in Reston and adjoining areas located along the Dulles Airport Access and Toll Road, including the Reston Town Center, as well as the areas along the Dulles Toll Road adjacent to one existing and two planned Metro stations. RTC—West has been recommended for a 3.0-4.0 FAR by Fairfax County, Virginia's comprehensive plan for the area's development, which, if granted, would permit up to 2.4 million square feet of estimated potential density. We plan to submit a zoning application in mid-2016, requesting regulatory approval for three new office buildings and three new residential buildings totaling approximately 1.4 million square feet of new development.
40
Our Assets
The tables below provide information about each of our office, multifamily, retail and land portfolios as of March 31, 2016. In four mixed-use properties and large developments, we consider our retail space to be an asset separate from the office and multifamily spaces because the retail is a significant driver of value and could be sold separately from the other uses. In addition, many of our land parcels are adjacent to current office, multifamily or retail assets in our portfolio. Furthermore, a significant number of our assets included in the tables below will be held through joint ventures with third parties. The tables below indicate our percentage ownership as well as our preliminary conclusion as to whether we expect to consolidate or not consolidate the asset in our future financial statements. For more information about our joint ventures see "—Our Joint Venture Arrangements."
41
Office Assets
| | | | | | | | | | | | | | | | | | | | | | | | | | | | | | | | | | | |
Office Asset | | City | | Submarket | | Geographic
Classification | | Percent
Ownership | | Consolidated /
Unconsolidated(1) | | Year Built /
Renovated(2) | | Total
Rentable
Square
Feet | | Office
Rentable
Square
Feet | | Retail
Rentable
Square
Feet | | Percent
Leased(3) | | Percent
Occupied(4) | | Annualized
Rent(5)
($000s) | | Annualized
Rent Per
Square Foot(6) | |
|---|
Stabilized | | | | | | | | | | | | | | | | | | | | | | | | | | | | | | | | | | | |
DOT—U.S. Government Tenant (GSA)(7) | | Washington, DC | | Southeast | | Inside Beltway | | | 100.0 | % | Consolidated | | 2006 / N/A | | | 1,506,955 | | | 1,505,010 | | | 1,945 | | | 100.0 | % | | 100.0 | % | $ | 61,375 | | $ | 40.73 | |
5600 Fishers Lane—U.S. Government Tenant (GSA) | | Rockville, MD | | Rockville Pike Corridor | | Outside Beltway-Metro | | | 66.7 | % | Consolidated | | 1960 / 2015 | | | 935,386 | | | 935,386 | | | — | | | 100.0 | % | | 100.0 | % | | 29,334 | | | 31.36 | |
NCI—U.S. Government Tenant (GSA)(8) | | Rockville, MD | | Shady Grove | | Outside Beltway | | | 100.0 | % | Consolidated | | 2013 / N/A | | | 586,524 | | | 576,614 | | | 9,910 | | | 100.0 | % | | 100.0 | % | | 20,321 | | | 34.65 | |
RTC—West(9)(10) | | Reston, VA | | Reston | | Outside Beltway-Metro | | | 100.0 | % | Consolidated | | 1988 / 2014 | | | 495,348 | | | 478,584 | | | 16,764 | | | 83.0 | % | | 81.2 | % | | 11,597 | | | 28.83 | |
5601 Fishers Lane—U.S. Government Tenant (GSA) | | Rockville, MD | | Rockville Pike Corridor | | Outside Beltway-Metro | | | 66.7 | % | Consolidated | | 2014 / N/A | | | 490,998 | | | 490,998 | | | — | | | 100.0 | % | | 100.0 | % | | 14,122 | | | 28.76 | |
Jefferson Court | | Washington, DC | | Georgetown | | Inside Beltway | | | 100.0 | % | Consolidated | | 1984 / 2013 | | | 316,830 | | | 309,074 | | | 7,756 | | | 96.0 | % | | 94.7 | % | | 12,856 | | | 42.85 | |
800 North Glebe Road(10) | | Arlington, VA | | Ballston | | Inside Beltway | | | 100.0 | % | Consolidated | | 2012 / N/A | | | 306,456 | | | 280,106 | | | 26,350 | | | 79.1 | % | | 79.1 | % | | 11,326 | | | 46.75 | |
Artery Plaza | | Bethesda, MD | | Bethesda CBD | | Inside Beltway | | | 100.0 | % | Consolidated | | 1986 / 2015 | | | 272,874 | | | 254,741 | | | 18,133 | | | 92.6 | % | | 89.6 | % | | 10,960 | | | 44.82 | |
One Choke Cherry(11) | | Rockville, MD | | North Rockville | | Outside Beltway | | | 100.0 | % | Consolidated | | 2004 / N/A | | | 228,020 | | | 228,020 | | | — | | | 100.0 | % | | 100.0 | % | | 7,961 | | | 34.91 | |
2115 Wisconsin Avenue | | Washington, DC | | Uptown | | Inside Beltway | | | 100.0 | % | Consolidated | | 1988 / 2010 | | | 182,885 | | | 181,259 | | | 1,626 | | | 97.6 | % | | 97.6 | % | | 5,933 | | | 33.24 | |
1233 20th Street(10) | | Washington, DC | | CBD | | Inside Beltway | | | 100.0 | % | Consolidated | | 1984 / 2003 | | | 154,584 | | | 154,584 | | | — | | | 88.8 | % | | 88.8 | % | | 5,954 | | | 43.36 | |
Summit I(12) | | Reston, VA | | Reston | | Outside Beltway-Metro | | | 100.0 | % | Consolidated | | 1987 / 2012 | | | 145,768 | | | 145,768 | | | — | | | 100.0 | % | | 100.0 | % | | 4,437 | | | 30.44 | |
Summit II | | Reston, VA | | Reston | | Outside Beltway-Metro | | | 100.0 | % | Consolidated | | 1986 / 2012 | | | 144,830 | | | 143,358 | | | 1,472 | | | 94.4 | % | | 94.4 | % | | 3,892 | | | 28.48 | |
2121 Wisconsin Avenue(10) | | Washington, DC | | Uptown | | Inside Beltway | | | 100.0 | % | Consolidated | | 1960 / 2000 | | | 110,241 | | | 93,019 | | | 17,222 | | | 88.2 | % | | 88.2 | % | | 3,067 | | | 31.53 | |
6862 Elm Street(10) | | McLean, VA | | McLean | | Inside Beltway | | | 100.0 | % | Consolidated | | 1981 / 2009 | | | 103,556 | | | 103,556 | | | — | | | 79.7 | % | | 77.0 | % | | 3,157 | | | 39.60 | |
Reston Arboretum(10) | | Reston, VA | | Reston | | Outside Beltway-Metro | | | 100.0 | % | Consolidated | | 1999 / N/A | | | 95,666 | | | 95,666 | | | — | | | 81.8 | % | | 81.8 | % | | 2,658 | | | 33.97 | |
Hungerford Plaza(13) | | Rockville, MD | | Rockville Pike Corridor | | Outside Beltway-Metro | | | 100.0 | % | Consolidated | | 1968/1970 / N/A | | | 85,761 | | | 69,778 | | | 15,983 | | | 87.8 | % | | 86.7 | % | | 1,790 | | | 24.06 | |
1600 K Street | | Washington, DC | | CBD | | Inside Beltway | | | 100.0 | % | Consolidated | | 1950 / 2000 | | | 84,142 | | | 70,264 | | | 13,878 | | | 94.7 | % | | 94.4 | % | | 3,892 | | | 48.99 | |
Wiehle Avenue Office Building(14) | | Reston, VA | | Reston | | Outside Beltway-Metro | | | 100.0 | % | Consolidated | | 1984 / N/A | | | 77,528 | | | 77,528 | | | — | | | 89.8 | % | | 89.8 | % | | 1,443 | | | 20.73 | |
1831 Wiehle Avenue(15) | | Reston, VA | | Reston | | Outside Beltway-Metro | | | 100.0 | % | Consolidated | | 1983 / N/A | | | 75,191 | | | 75,191 | | | — | | | 98.2 | % | | 98.2 | % | | 2,063 | | | 27.93 | |
Old Dominion(10) | | McLean, VA | | McLean | | Inside Beltway | | | 100.0 | % | Consolidated | | 1974 / 2013 | | | 66,826 | | | 66,826 | | | — | | | 55.8 | % | | 55.8 | % | | 1,274 | | | 34.14 | |
5609 Fishers Lane | | Rockville, MD | | Rockville Pike Corridor | | Outside Beltway-Metro | | | 66.7 | % | Consolidated | | 1984 / N/A | | | 59,800 | | | 59,800 | | | — | | | 92.4 | % | | 92.4 | % | | 838 | | | 15.17 | |
L'Enfant Plaza Office—East(10) | | Washington, DC | | Southwest | | Inside Beltway | | | 49.0 | % | Unconsolidated | | 1972 / 2012 | | | 437,954 | | | 437,954 | | | — | | | 88.1 | % | | 88.1 | % | | 18,050 | | | 46.79 | |
L'Enfant Plaza Office—North(10) | | Washington, DC | | Southwest | | Inside Beltway | | | 49.0 | % | Unconsolidated | | 1969 / 2014 | | | 304,132 | | | 284,658 | | | 19,474 | | | 63.4 | % | | 52.4 | % | | 6,059 | | | 38.05 | |
Chase Tower(16) | | Chevy Chase, MD | | Chevy Chase | | Inside Beltway | | | 10.0 | % | Unconsolidated | | 2001 / N/A | | | 247,755 | | | 218,663 | | | 29,092 | | | 96.5 | % | | 94.3 | % | | 11,623 | | | 49.76 | |
Pickett Industrial Park | | Alexandria, VA | | Eisenhower Avenue | | Inside Beltway | | | 10.0 | % | Unconsolidated | | 1973 / N/A | | | 246,145 | | | 246,145 | | | — | | | 100.0 | % | | 100.0 | % | | 3,803 | | | 15.45 | |
5635 Fishers Lane(16) | | Rockville, MD | | Rockville Pike Corridor | | Outside Beltway-Metro | | | 10.0 | % | Unconsolidated | | 2003 / N/A | | | 185,511 | | | 180,402 | | | 5,109 | | | 100.0 | % | | 100.0 | % | | 7,015 | | | 37.82 | |
5625 Fishers Lane(16) | | Rockville, MD | | Rockville Pike Corridor | | Outside Beltway-Metro | | | 10.0 | % | Unconsolidated | | 2003 / N/A | | | 153,385 | | | 153,385 | | | — | | | 100.0 | % | | 100.0 | % | | 6,221 | | | 40.56 | |
Rosslyn Gateway—North(17) | | Arlington, VA | | Rosslyn | | Inside Beltway | | | 18.0 | % | Unconsolidated | | 1996 / 2014 | | | 144,830 | | | 131,288 | | | 13,542 | | | 87.6 | % | | 87.0 | % | | 4,922 | | | 39.05 | |
NoBe II Office(18) | | Rockville, MD | | Rockville Pike Corridor | | Outside Beltway-Metro | | | 18.0 | % | Unconsolidated | | 1965 / 2005 | | | 139,550 | | | 121,779 | | | 17,771 | | | 29.8 | % | | 29.8 | % | | 961 | | | 23.14 | |
Rosslyn Gateway—South(19) | | Arlington, VA | | Rosslyn | | Inside Beltway | | | 18.0 | % | Unconsolidated | | 1961 / N/A | | | 105,722 | | | 98,138 | | | 7,584 | | | 87.9 | % | | 87.9 | % | | 2,743 | | | 29.51 | |
12735 Twinbrook Parkway(16) | | Rockville, MD | | Rockville Pike Corridor | | Outside Beltway-Metro | | | 10.0 | % | Unconsolidated | | 2003 / N/A | | | 76,520 | | | 76,520 | | | — | | | 100.0 | % | | 100.0 | % | | 2,480 | | | 32.41 | |
5640 Fishers Lane(16) | | Rockville, MD | | Rockville Pike Corridor | | Outside Beltway-Metro | | | 10.0 | % | Unconsolidated | | 1968 / 1990 | | | 74,185 | | | 74,185 | | | — | | | 100.0 | % | | 100.0 | % | | 1,875 | | | 25.27 | |
11333 Woodglen Drive | | Rockville, MD | | Rockville Pike Corridor | | Outside Beltway-Metro | | | 18.0 | % | Unconsolidated | | 2004 / N/A | | | 63,650 | | | 55,077 | | | 8,573 | | | 94.9 | % | | 90.8 | % | | 2,176 | | | 37.64 | |
12725 Twinbrook Parkway(16) | | Rockville, MD | | Rockville Pike Corridor | | Outside Beltway-Metro | | | 10.0 | % | Unconsolidated | | 1968 / 1997 | | | 58,880 | | | 58,880 | | | — | | | 100.0 | % | | 100.0 | % | | 2,305 | | | 39.14 | |
12440 Parklawn | | Rockville, MD | | Rockville Pike Corridor | | Outside Beltway-Metro | | | 18.0 | % | Unconsolidated | | 1967 / 2013 | | | 29,700 | | | 29,700 | | | — | | | 100.0 | % | | 100.0 | % | | 789 | | | 26.57 | |
| | | | | | | | | | | | | | | | | | | | | | | | | | | | | | | | | | | | |
Total/Weighted Average | | | | | | | | | | | | | | | | 8,794,088 | | | 8,561,904 | | | 232,184 | | | 92.9 | % | | 92.1 | % | $ | 291,273 | | $ | 35.95 | |
| | | | | | | | | | | | | | | | | | | | | | | | | | | | | | | | | | | | |
Recently Acquired/Delivered/Renovated | | | | | | | | | | | | | | | | | | | | | | | | | | | | | | | | | | | |
16th & I Street(20) | | Washington, DC | | CBD | | Inside Beltway | | | 71.9 | % | Consolidated | | 2016 / N/A | | | 120,282 | | | 116,269 | | | 4,013 | | | 72.5 | % | | — | | $ | — | | $ | — | |
The Foundry | | Washington, DC | | Georgetown | | Inside Beltway | | | 9.9 | % | Unconsolidated | | 1973 / 2017 | | | 233,855 | | | 223,673 | | | 10,182 | | | 76.2 | % | | 76.2 | % | | 7,653 | | | 42.94 | |
| | | | | | | | | | | | | | | | | | | | | | | | | | | | | | | | | | | | |
Total/Weighted Average | | | | | | | | | | | | | | | | 354,137 | | | 339,942 | | | 14,195 | | | 75.0 | % | | 50.3 | % | $ | 7,653 | | $ | 42.94 | |
| | | | | | | | | | | | | | | | | | | | | | | | | | | | | | | | | | | | |
Total/Weighted Average | | | | | | | | | | | | | | | | 9,148,225 | | | 8,901,846 | | | 246,379 | | | 92.2 | % | | 90.5 | % | $ | 298,926 | | $ | 36.10 | |
| | | | | | | | | | | | | | | | | | | | | | | | | | | | | | | | | | | | |
| | | | | | | | | | | | | | | | | | | | | | | | | | | | | | | | | | | | |
| | | | | | | | | | | | | | | | | | | | | | | | | | | | | | | | | | | | |
Construction(21) | | | | | | | | | | | | | | | | | | | | | | | | | | | | | | | | | | | |
CEB Tower at Central Place | | Arlington, VA | | Rosslyn | | Inside Beltway | | | 100.0 | % | Consolidated | | | | | 536,710 | | | 524,325 | | | 12,385 | | | 65.0 | % | | | | | | | | | |
| | | | | | | | | | | | | | | | | | | | | | | | | | | | | | | | | | | | |
Total/Weighted Average | | | | | | | | | | | | | | | | 536,710 | | | 524,325 | | | 12,385 | | | 65.0 | % | | | | | | | | | |
| | | | | | | | | | | | | | | | | | | | | | | | | | | | | | | | | | | | |
Total/Weighted Average | | | | | | | | | | | | | | | | 9,684,935 | | | 9,426,171 | | | 258,764 | | | 90.7 | % | | | | | | | | | |
| | | | | | | | | | | | | | | | | | | | | | | | | | | | | | | | | | | | |
| | | | | | | | | | | | | | | | | | | | | | | | | | | | | | | | | | | | |
| | | | | | | | | | | | | | | | | | | | | | | | | | | | | | | | | | | | |
Pre-Development(21) | | | | | | | | | | | | | | | | | | | | | | | | | | | | | | | | | | | |
1900 N Street(22) | | Washington, DC | | CBD | | Inside Beltway | | | 100.0 | % | Consolidated | | | | | 268,631 | | | 254,981 | | | 13,650 | | | | | | | | | | | | | |
4747 Bethesda Avenue | | Bethesda, MD | | Bethesda CBD | | Inside Beltway | | | 100.0 | % | Consolidated | | | | | 260,236 | | | 251,587 | | | 8,649 | | | | | | | | | | | | | |
1250 1st Street | | Washington, DC | | NoMa | | Inside Beltway | | | 30.0 | % | Unconsolidated | | | | | 251,491 | | | 239,052 | | | 12,439 | | | | | | | | | | | | | |
50 Patterson Street | | Washington, DC | | NoMa | | Inside Beltway | | | 30.0 | % | Unconsolidated | | | | | 167,350 | | | 134,000 | | | 33,350 | | | | | | | | | | | | | |
| | | | | | | | | | | | | | | | | | | | | | | | | | | | | | | | | | | | |
Total | | | | | | | | | | | | | | | | 947,708 | | | 879,620 | | | 68,088 | | | | | | | | | | | | | |
| | | | | | | | | | | | | | | | | | | | | | | | | | | | | | | | | | | | |
| | | | | | | | | | | | | | | | | | | | | | | | | | | | | | | | | | | | |
| | | | | | | | | | | | | | | | | | | | | | | | | | | | | | | | | | | | |
Note: Table shown at 100 percent share.
42
- (1)
- Anticipated accounting treatment under U.S. GAAP upon completion of the Combination Transactions.
- (2)
- Future dates represent estimated renovation completion dates.
- (3)
- Based on leases signed as of March 31, 2016, and is calculated as total rentable square feet less rentable square feet available for lease divided by total rentable square feet.
- (4)
- Based on occupied rentable square feet as of March 31, 2016 and is calculated as total rentable square feet less unoccupied square feet divided by total rentable square feet.
- (5)
- Base rent before rent abatements, plus tenant reimbursements for the quarter ended March 31, 2016, multiplied by four. Triple net leases are converted to a gross basis by adding tenant reimbursements to base rent. See "—Our Office Assets—Contractual Rent Abatement in Our Office Portfolio" for detail on rent abatements. Figure includes approximately $7.6 million of retail annualized rent within our office portfolio.
- (6)
- Represents annualized rent divided by occupied square feet.
- (7)
- DOT currently pays rent on 1.35 million square feet of leasable space. We believe the asset has significant additional revenue potential if DOT renews its lease because the actual BOMA measurement is approximately 150,000 square feet more than the square footage agreed to in the current lease.
- (8)
- NCI—U.S. Government Tenant (GSA) is subject to a ground lease with an expiration date of November 11, 2109.
- (9)
- RTC—West is comprised of three neighboring office buildings. RTC—West was an operating office asset as of March 31, 2016; however, our development plan contemplates redeveloping approximately 19,500 square feet of the existing asset to construct RTC—West Retail construction retail asset.
- (10)
- Denotes embedded growth opportunity assets. See "—Business and Growth Strategies—Drive Incremental Growth through Lease-up of Our Assets" for detail on these assets.
- (11)
- One Choke Cherry has a known vacate that will reduce occupancy from 100.0 percent to 0.0 percent in August 2016.
- (12)
- Summit I was 100.0 percent leased to a single tenant that took occupancy in March 2016. Annualized rent for this asset represents in place base rent before abatements, plus tenant reimbursements for the month ended March 31, 2016 multiplied by 12.
- (13)
- Hungerford Plaza is comprised of two neighboring office buildings. Hungerford Plaza was an operating office asset as of March 31, 2016; however, our development plan contemplates a redevelopment of approximately 66,000 square feet, potentially generating 325,000 square feet of developable density.
- (14)
- Wiehle Avenue Office Building was an operating office asset as of March 31, 2016; however, our development plan contemplates a redevelopment of approximately 78,000 square feet, potentially generating 498,500 square feet of developable density.
- (15)
- 1831 Wiehle Avenue was an operating office asset as of March 31, 2016; however, our development plan contemplates a redevelopment of approximately 75,000 square feet, potentially generating 455,000 square feet of developable density.
- (16)
- Denotes assets that are part of the Wealth Capital Management portfolio. Our right to receive distributions from these assets is subordinate to our partner's right to receive a preferred return and the payment to us of a deferred asset management fee.
- (17)
- Rosslyn Gateway—North was an operating office asset as of March 31, 2016; however, our development plan contemplates a redevelopment of approximately 18,000 square feet, potentially generating 311,000 square feet of developable density.
- (18)
- Nobe II Office is comprised of three neighboring office buildings. Nobe II Office was an operating office asset as of March 31, 2016; however, our development plan contemplates a redevelopment of approximately 140,000 square feet, potentially generating 672,500 square feet of developable density.
- (19)
- Rosslyn Gateway—South was an operating office asset as of March 31, 2016; however, our development plan contemplates a redevelopment of approximately 106,000 square feet, potentially generating 498,500 square feet of developable density.
- (20)
- Annualized rent is not presented for 16th & I Street because it delivered in the first quarter of 2016.
- (21)
- For construction and pre-development assets, rentable square feet reflects management's estimate of actual rentable square feet based on current design plans as of March 31, 2016.
- (22)
- A portion of 1900 N Street is subject to a ground lease with an expiration date of May 31, 2106.
43
Multifamily Assets
| | | | | | | | | | | | | | | | | | | | | | | | | | | | | | | | | | | | | | | | |
Multifamily Asset | | City | | Submarket | | Geographic
Classification | | Product Type | | Percent
Ownership | | Consolidated /
Unconsolidated(1) | | Year Built /
Renovated(2) | | Number
of
Units | | Total
Rentable
Square
Feet | | Multifamily
Rentable
Square
Feet | | Retail
Rentable
Square
Feet | | Percent
Leased(3) | | Percent
Occupied(4) | | Annualized
Rent(5)
($000s) | | Average
Monthly
Rent
Per
Unit(6) | |
|---|
Stabilized | | | | | | | | | | | | | | | | | | | | | | | | | | | | | | | | | | | | | | | | |
Kennedy Row(7) | | Washington, DC | | Capitol Hill | | Inside Beltway | | Mid/High-Rise | | | 90.0 | % | Consolidated | | 2013 / N/A | | | 141 | | | 106,553 | | | 106,553 | | | — | | | 96.5 | % | | 92.9 | % | $ | 3,191 | | $ | 2,030 | |
Hillwood(8) | | Alexandria, VA | | I-395 Corridor | | Inside Beltway | | Garden-Style | | | 100.0 | % | Consolidated | | 1972 / 2005 | | | 601 | | | 520,828 | | | 520,828 | | | — | | | 96.5 | % | | 94.8 | % | | 9,535 | | | 1,394 | |
Lynbrook(8) | | Alexandria, VA | | I-395 Corridor | | Inside Beltway | | Garden-Style | | | 100.0 | % | Consolidated | | 1960 / 2005 | | | 575 | | | 479,080 | | | 479,080 | | | — | | | 97.0 | % | | 95.8 | % | | 8,472 | | | 1,281 | |
Brookdale(8) | | Alexandria, VA | | I-395 Corridor | | Inside Beltway | | Garden-Style | | | 100.0 | % | Consolidated | | 1960 / 2005 | | | 472 | | | 368,980 | | | 368,980 | | | — | | | 95.1 | % | | 92.2 | % | | 6,719 | | | 1,287 | |
Meadowcreek(8) | | Alexandria, VA | | I-395 Corridor | | Inside Beltway | | Garden-Style | | | 100.0 | % | Consolidated | | 1962 / 2005 | | | 416 | | | 342,160 | | | 342,160 | | | — | | | 95.4 | % | | 94.2 | % | | 6,093 | | | 1,295 | |
Fairmont Gardens | | Annandale, VA | | Annandale | | Inside Beltway | | Garden-Style | | | 100.0 | % | Consolidated | | 1964 / 1990 | | | 388 | | | 358,500 | | | 358,500 | | | — | | | 96.4 | % | | 92.8 | % | | 6,728 | | | 1,557 | |
Bennington Crossings | | Alexandria, VA | | I-395 Corridor | | Inside Beltway | | Garden-Style | | | 100.0 | % | Consolidated | | 1962 / 2008 | | | 308 | | | 290,505 | | | 290,505 | | | — | | | 91.6 | % | | 89.0 | % | | 4,734 | | | 1,440 | |
Falkland Chase—South & West | | Silver Spring, MD | | Downtown Silver Spring | | Inside Beltway | | Garden-Style | | | 100.0 | % | Consolidated | | 1938 / 2005 | | | 268 | | | 222,949 | | | 222,949 | | | — | | | 95.5 | % | | 94.0 | % | | 5,110 | | | 1,690 | |
Charter Oak(9) | | Reston, VA | | Reston | | Outside Beltway | | Garden-Style | | | 100.0 | % | Consolidated | | 1970 / 2012 | | | 262 | | | 287,520 | | | 287,520 | | | — | | | 94.3 | % | | 91.6 | % | | 4,450 | | | 1,545 | |
Stoneridge(8) | | Alexandria, VA | | I-395 Corridor | | Inside Beltway | | Garden-Style | | | 100.0 | % | Consolidated | | 1972 / 2005 | | | 198 | | | 181,251 | | | 181,251 | | | — | | | 96.5 | % | | 94.4 | % | | 3,335 | | | 1,486 | |
Falkland Chase—North(10) | | Silver Spring, MD | | Downtown Silver Spring | | Inside Beltway | | Garden-Style | | | 100.0 | % | Consolidated | | 1938 / 1986 | | | 182 | | | 119,443 | | | 119,443 | | | — | | | 96.7 | % | | 94.0 | % | | 2,804 | | | 1,366 | |
The Gale | | Washington, DC | | H Street/NoMa | | Inside Beltway | | Mid/High-Rise | | | 5.0 | % | Unconsolidated | | 2013 / 2017 | | | 603 | | | 466,852 | | | 465,652 | | | 1,200 | | | 91.9 | % | | 89.1 | % | | 13,652 | | | 2,119 | |
The Alaire(11) | | Rockville, MD | | Rockville Pike Corridor | | Outside Beltway-Metro | | Mid/High-Rise | | | 18.0 | % | Unconsolidated | | 2010 / N/A | | | 279 | | | 288,806 | | | 274,000 | | | 14,806 | | | 96.8 | % | | 91.0 | % | | 5,795 | | | 1,901 | |
The Terano(12) | | Rockville, MD | | Rockville Pike Corridor | | Outside Beltway-Metro | | Mid/High-Rise | | | 1.8 | % | Unconsolidated | | 2015 / N/A | | | 214 | | | 201,353 | | | 184,141 | | | 17,212 | | | 93.0 | % | | 87.9 | % | | 4,101 | | | 1,818 | |
Fairway Apartments(13) | | Reston, VA | | Reston | | Outside Beltway | | Garden-Style | | | 10.0 | % | Unconsolidated | | 1969 / 2005 | | | 346 | | | 371,204 | | | 371,204 | | | — | | | 96.2 | % | | 95.4 | % | | 6,219 | | | 1,571 | |
| | | | | | | | | | | | | | | | | | | | | | | | | | | | | | | | | | | | | | | | | |
Total/Weighted Average | | | | | | | | | | | | | | | | | | 5,253 | | | 4,605,984 | | | 4,572,766 | | | 33,218 | | | 95.2 | % | | 92.7 | % | $ | 90,939 | | $ | 1,555 | |
| | | | | | | | | | | | | | | | | | | | | | | | | | | | | | | | | | | | | | | | | |
Recently Acquired/Delivered/Renovated | | | | | | | | | | | | | | | | | | | | | | | | | | | | | | | | | | | | | | | | |
Fort Totten Square(14) | | Washington, DC | | Brookland/Fort Totten | | Inside Beltway | | Mid/High-Rise | | | 99.4 | % | Consolidated | | 2015 / N/A | | | 345 | | | 254,292 | | | 254,292 | | | — | | | 62.3 | % | | 56.5 | % | $ | 3,855 | | $ | 1,647 | |
Atlantic Plumbing(15) | | Washington, DC | | U Street/Shaw | | Inside Beltway | | Mid/High-Rise | | | 64.0 | % | Consolidated | | 2015 / N/A | | | 310 | | | 245,604 | | | 221,780 | | | 23,824 | | | 37.4 | % | | 26.1 | % | | 1,782 | | | 1,833 | |
Galvan(16) | | Rockville, MD | | Rockville Pike Corridor | | Outside Beltway-Metro | | Mid/High-Rise | | | 1.8 | % | Unconsolidated | | 2015 / N/A | | | 356 | | | 295,472 | | | 295,472 | | | — | | | 33.1 | % | | 23.0 | % | | 1,120 | | | 1,138 | |
Notch 8(17) | | Alexandria, VA | | Potomac Yard | | Inside Beltway | | Mid/High-Rise | | | 14.7 | % | Unconsolidated | | 2015 / N/A | | | 253 | | | 207,374 | | | 207,374 | | | — | | | 64.4 | % | | 54.5 | % | | 2,782 | | | 1,680 | |
| | | | | | | | | | | | | | | | | | | | | | | | | | | | | | | | | | | | | | | | | |
Total/Weighted Average | | | | | | | | | | | | | | | | | | 1,264 | | | 1,002,742 | | | 978,918 | | | 23,824 | | | 48.4 | % | | 39.2 | % | $ | 9,539 | | $ | 1,603 | |
| | | | | | | | | | | | | | | | | | | | | | | | | | | | | | | | | | | | | | | | | |
Total/Weighted Average | | | | | | | | | | | | | | | | | | 6,517 | | | 5,608,726 | | | 5,551,684 | | | 57,042 | | | 86.1 | % | | 82.4 | % | $ | 100,478 | | $ | 1,560 | |
| | | | | | | | | | | | | | | | | | | | | | | | | | | | | | | | | | | | | | | | | |
| | | | | | | | | | | | | | | | | | | | | | | | | | | | | | | | | | | | | | | | | |
| | | | | | | | | | | | | | | | | | | | | | | | | | | | | | | | | | | | | | | | | |
Construction(18) | | | | | | | | | | | | | | | | | | | | | | | | | | | | | | | | | | | | | | | | |
1244 South Capitol Street | | Washington, DC | | Southeast | | Inside Beltway | | Mid/High-Rise | | | 100.0 | % | Consolidated | | | | | 291 | | | 226,283 | | | 202,715 | | | 23,568 | | | | | | | | | | | | | |
7770 Norfolk | | Bethesda, MD | | Bethesda CBD | | Inside Beltway | | Mid/High-Rise | | | 79.9 | % | Consolidated | | | | | 200 | | | 208,678 | | | 203,036 | | | 5,642 | | | | | | | | | | | | | |
13th & U Street(19) | | Washington, DC | | U Street/Shaw | | Inside Beltway | | Mid/High-Rise | | | 100.0 | % | Consolidated | | | | | 130 | | | 147,056 | | | 131,306 | | | 15,750 | | | | | | | | | | | | | |
Reston Heights—Phase I(20) | | Reston, VA | | Reston | | Outside Beltway-Metro | | Mid/High-Rise | | | 10.0 | % | Unconsolidated | | | | | 386 | | | 327,163 | | | 327,163 | | | — | | | | | | | | | | | | | |
| | | | | | | | | | | | | | | | | | | | | | | | | | | | | | | | | | | | | | | | | |
Total/Weighted Average | | | | | | | | | | | | | | | | | | 1,007 | | | 909,180 | | | 864,220 | | | 44,960 | | | | | | | | | | | | | |
| | | | | | | | | | | | | | | | | | | | | | | | | | | | | | | | | | | | | | | | | |
Total/Weighted Average | | | | | | | | | | | | | | | | | | 7,524 | | | 6,517,906 | | | 6,415,904 | | | 102,002 | | | | | | | | | | | | | |
| | | | | | | | | | | | | | | | | | | | | | | | | | | | | | | | | | | | | | | | | |
| | | | | | | | | | | | | | | | | | | | | | | | | | | | | | | | | | | | | | | | | |
| | | | | | | | | | | | | | | | | | | | | | | | | | | | | | | | | | | | | | | | | |
Pre-Development(18) | | | | | | | | | | | | | | | | | | | | | | | | | | | | | | | | | | | | | | | | |
Georgetown Development Parcel(21) | | Washington, DC | | Georgetown Multifamily | | Inside Beltway | | Mid/High-Rise | | | 100.0 | % | Consolidated | | | | | | | | 204,892 | | | 184,392 | | | 20,500 | | | | | | | | | | | | | |
West Half II | | Washington, DC | | Southeast | | Inside Beltway | | Mid/High-Rise | | | 94.2 | % | Consolidated | | | | | | | | 173,947 | | | 115,802 | | | 58,145 | | | | | | | | | | | | | |
West Half III | | Washington, DC | | Southeast | | Inside Beltway | | Mid/High-Rise | | | 94.2 | % | Consolidated | | | | | | | | 208,783 | | | 208,783 | | | — | | | | | | | | | | | | | |
Atlantic Plumbing C—North | | Washington, DC | | U Street/Shaw | | Inside Beltway | | Mid/High-Rise | | | 60.0 | % | Consolidated | | | | | | | | 144,876 | | | 133,450 | | | 11,426 | | | | | | | | | | | | | |
Atlantic Plumbing C—South | | Washington, DC | | U Street/Shaw | | Inside Beltway | | Mid/High-Rise | | | 60.0 | % | Consolidated | | | | | | | | 79,676 | | | 71,630 | | | 8,046 | | | | | | | | | | | | | |
51 N Street | | Washington, DC | | NoMa | | Inside Beltway | | Mid/High-Rise | | | 30.0 | % | Unconsolidated | | | | | | | | 119,981 | | | 112,230 | | | 7,751 | | | | | | | | | | | | | |
| | | | | | | | | | | | | | | | | | | | | | | | | | | | | | | | | | | | | | | | | |
Total | | | | | | | | | | | | | | | | | | | | | 932,155 | | | 826,287 | | | 105,868 | | | | | | | | | | | | | |
| | | | | | | | | | | | | | | | | | | | | | | | | | | | | | | | | | | | | | | | | |
| | | | | | | | | | | | | | | | | | | | | | | | | | | | | | | | | | | | | | | | | |
| | | | | | | | | | | | | | | | | | | | | | | | | | | | | | | | | | | | | | | | | |
Note: Table shown at 100 percent share.
44
- (1)
- Anticipated accounting treatment under U.S. GAAP upon completion of the Combination Transactions.
- (2)
- Future dates represent estimated renovation completion dates.
- (3)
- Based on leases signed as of March 31, 2016, and is calculated as total units less units available for lease divided by total units, expressed as a percentage.
- (4)
- Based on occupied units as of March 31, 2016 and is calculated as total units less unoccupied units divided by total units, expressed as a percentage.
- (5)
- Based on (i) for multifamily assets, or the multifamily component of mixed-use assets, the base rent before rent abatements for the quarter ended March 31, 2016, multiplied by four; (ii) for retail components of multifamily assets, the base rent and percentage rent before rent abatements, plus tenant reimbursements for the quarter ended March 31, 2016, multiplied by four. Triple net leases are converted to a gross basis by adding tenant reimbursements to base rent. See "—Our Retail Assets—Contractual Rent Abatement in Our Retail Portfolio" for detail on rent abatements. Figure includes approximately $1.2 million of retail annualized rent within our multifamily portfolio.
- (6)
- Represents multifamily and retail annualized rent divided by number of occupied units, divided by 12.
- (7)
- We are currently in negotiations with our joint venture partner to recapitalize the asset and increase our ownership to 100 percent.
- (8)
- Denotes assets that are part of Mark Center Portfolio. Mark Center assets were operating multifamily and retail assets as of March 31, 2016; however, our development plan contemplates a redevelopment of approximately 12,000 square feet of retail and 764 multifamily units, potentially generating 2.2 million square feet of developable density.
- (9)
- Charter Oak was an operating multifamily asset as of March 31, 2016; however, our development plan contemplates a redevelopment of approximately 60 multifamily units, potentially generating 399,000 square feet of developable density.
- (10)
- Falkland Chase—North was an operating multifamily asset as of March 31, 2016; however, our development plan contemplates a redevelopment of approximately 182 multifamily units, potentially generating 1.3 million square feet of developable density.
- (11)
- The Alaire is subject to a ground lease with an expiration date of March 31, 2107.
- (12)
- The Terano is subject to a ground lease with an expiration date of August 31, 2112.
- (13)
- Fairway Apartments was an operating multifamily asset as of March 31, 2016; however, our development plan contemplates a redevelopment of approximately 154 multifamily units, potentially generating 521,500 square feet of developable density.
- (14)
- Fort Totten Square is part of a mixed-use property that includes the Fort Totten Square Retail operating retail asset. We are currently in negotiations with our joint venture partner to recapitalize the asset and increase our ownership to 100 percent.
- (15)
- Atlantic Plumbing is comprised of the multifamily and retail components of one building and the retail component of a neighboring condo building.
- (16)
- Galvan is part of a mixed-use property that includes the Galvan Retail operating retail asset.
- (17)
- Notch 8 is part of a mixed-use property that includes the Notch 8 Retail operating retail asset.
- (18)
- For construction and pre-development assets, rentable square feet reflects management's estimate of actual rentable square feet based on current design plans as of March 31, 2016.
- (19)
- 13th & U Street is subject to a ground lease with an expiration date of July 31, 2107.
- (20)
- Reston Heights—Phase I is part of a mixed-use property that includes the Reston Heights—Phase I Retail construction retail asset.
- (21)
- Georgetown Development Parcel is subject to a ground lease with an expiration date of August 31, 2073. Georgetown Development Parcel is currently under contract with an outside closing date of June 30, 2016.
45
Retail Assets
| | | | | | | | | | | | | | | | | | | | | | | | | | | | | |
Retail Asset | | City | | Submarket | | Geographic
Classification | | Percent
Ownership | | Consolidated /
Unconsolidated(1) | | Year
Built /
Renovated | | Total
Rentable
Square
Feet(2) | | Percent
Leased(3) | | Percent
Occupied(4) | | Annualized
Rent(5) ($000s) | | Annualized
Rent Per
Square
Foot(6) | |
|---|
Stabilized | | | | | | | | | | | | | | | | | | | | | | | | | | | | | |
Old Centreville Crossing(7) | | Centreville, VA | | Rt. 28 South/Chantilly | | Outside Beltway | | | 99.0 | % | Consolidated | | 1982 / N/A | | | 171,631 | | | 98.2 | % | | 97.5 | % | $ | 5,227 | | $ | 31.23 | |
Fort Totten Square Retail(8) | | Washington, DC | | Brookland/Fort Totten | | Inside Beltway | | | 99.4 | % | Consolidated | | 2015 / N/A | | | 130,664 | | | 98.7 | % | | 94.0 | % | | 1,700 | | | 13.85 | |
Takoma-Langley Crossroads Center(9) | | Takoma Park, MD | | Takoma | | Inside Beltway | | | 99.0 | % | Consolidated | | 1949 / 2012 | | | 125,245 | | | 95.0 | % | | 89.0 | % | | 3,727 | | | 33.45 | |
La Plata Shopping Center(7) | | La Plata, MD | | Suburban Maryland | | Outside Beltway | | | 99.0 | % | Consolidated | | 1972 / 2005 | | | 76,470 | | | 100.0 | % | | 100.0 | % | | 1,501 | | | 19.63 | |
The Shops At Mark Center(10) | | Alexandria, VA | | I-395 Corridor | | Inside Beltway | | | 100.0 | % | Consolidated | | 1974 / 1999 | | | 63,320 | | | 99.0 | % | | 99.0 | % | | 2,176 | | | 34.71 | |
North End Retail I(11) | | Washington, DC | | U Street/Shaw | | Inside Beltway | | | 100.0 | % | Consolidated | | 2015 / N/A | | | 27,568 | | | 95.8 | % | | 86.5 | % | | 661 | | | 27.73 | |
Vienna Walgreens(9) | | Vienna, VA | | Vienna | | Outside Beltway | | | 99.0 | % | Consolidated | | 1974 / 2009 | | | 25,500 | | | 100.0 | % | | 100.0 | % | | 1,062 | | | 41.65 | |
Leesburg Pike Retail(12) | | Vienna, VA | | Tysons Corner | | Outside Beltway-Metro | | | 99.0 | % | Consolidated | | 1973 / 2004 | | | 19,120 | | | 100.0 | % | | 100.0 | % | | 650 | | | 34.00 | |
Stonebridge at Potomac Town Center—Phase I | | Woodbridge, VA | | Prince William County | | Outside Beltway | | | 10.0 | % | Unconsolidated | | 2012 / N/A | | | 482,619 | | | 91.8 | % | | 90.5 | % | | 12,698 | | | 29.08 | |
L'Enfant Plaza Retail—West(13) | | Washington, DC | | Southwest | | Inside Beltway | | | 49.0 | % | Unconsolidated | | 1968 / 2014 | | | 117,610 | | | 66.5 | % | | 55.6 | % | | 3,202 | | | 48.98 | |
Galvan Retail(14) | | Rockville, MD | | Rockville Pike Corridor | | Outside Beltway-Metro | | | 1.8 | % | Unconsolidated | | 2015 / N/A | | | 95,147 | | | 92.5 | % | | 68.3 | % | | 1,755 | | | 27.01 | |
Notch 8 Retail(15) | | Alexandria, VA | | Potomac Yard | | Inside Beltway | | | 14.7 | % | Unconsolidated | | 2015 / N/A | | | 66,805 | | | 100.0 | % | | 100.0 | % | | 2,136 | | | 31.97 | |
L'Enfant Plaza Retail—East | | Washington, DC | | Southwest | | Inside Beltway | | | 49.0 | % | Unconsolidated | | 1968 / 2011 | | | 33,736 | | | 90.5 | % | | 90.5 | % | | 2,165 | | | 70.92 | |
| | | | | | | | | | | | | | | | | | | | | | | | | | | | | | |
Total/Weighted Average | | | | | | | | | | | | | | | | 1,435,435 | | | 92.9 | % | | 88.7 | % | $ | 38,660 | | $ | 31.99 | |
| | | | | | | | | | | | | | | | | | | | | | | | | | | | | | |
Recently Acquired/Delivered/Renovated | | | | | | | | | | | | | | | | | | | | | | | | | | | | | |
Pikesville Walgreens(9) | | Pikesville, MD | | Pikesville | | Outside Beltway | | | 99.0 | % | Consolidated | | 1964 / 2012 | | | 25,476 | | | 78.0 | % | | 72.5 | % | $ | 725 | | $ | 39.22 | |
275 N. Washington | | Rockville, MD | | Rockville Pike Corridor | | Outside Beltway-Metro | | | 100.0 | % | Consolidated | | 2015 / N/A | | | 23,083 | | | 48.7 | % | | 48.7 | % | | 891 | | | 79.29 | |
| | | | | | | | | | | | | | | | | | | | | | | | | | | | | | |
Total/Weighted Average | | | | | | | | | | | | | | | | 48,559 | | | 64.1 | % | | 61.2 | % | $ | 1,616 | | $ | 54.39 | |
| | | | | | | | | | | | | | | | | | | | | | | | | | | | | | |
Total/Weighted Average | | | | | | | | | | | | | | | | 1,483,994 | | | 91.9 | % | | 87.8 | % | $ | 40,276 | | $ | 32.52 | |
| | | | | | | | | | | | | | | | | | | | | | | | | | | | | | |
| | | | | | | | | | | | | | | | | | | | | | | | | | | | | | |
| | | | | | | | | | | | | | | | | | | | | | | | | | | | | | |
Construction(16) | | | | | | | | | | | | | | | | | | | | | | | | | | | | | |
RTC—West Retail(17) | | Reston, VA | | Reston | | Outside Beltway-Metro | | | 100.0 | % | Consolidated | | | | | 40,100 | | | 29.4 | % | | | | | | | | | |
4735 Bethesda Avenue Retail | | Bethesda, MD | | Bethesda CBD | | Inside Beltway | | | 100.0 | % | Consolidated | | | | | 16,737 | | | — | | | | | | | | | | |
Reston Heights—Phase I Retail(18) | | Reston, VA | | Reston | | Outside Beltway-Metro | | | 10.0 | % | Unconsolidated | | | | | 89,690 | | | — | | | | | | | | | | |
| | | | | | | | | | | | | | | | | | | | | | | | | | | | | | |
Total/Weighted Average | | | | | | | | | | | | | | | | 146,527 | | | 8.1 | % | | | | | | | | | |
| | | | | | | | | | | | | | | | | | | | | | | | | | | | | | |
Total/Weighted Average | | | | | | | | | | | | | | | | 1,630,521 | | | 84.4 | % | | | | | | | | | |
| | | | | | | | | | | | | | | | | | | | | | | | | | | | | | |
| | | | | | | | | | | | | | | | | | | | | | | | | | | | | | |
| | | | | | | | | | | | | | | | | | | | | | | | | | | | | | |
Pre-Development(16) | | | | | | | | | | | | | | | | | | | | | | | | | | | | | |
Stonebridge at Potomac Town Center—Phase II | | Woodbridge, VA | | Prince William County | | Outside Beltway | | | 10.0 | % | Unconsolidated | | | | | 51,738 | | | | | | | | | | | | | |
Upper Rock Retail | | Rockville, MD | | North Rockville | | Outside Beltway | | | 100.0 | % | Consolidated | | | | | 34,700 | | | | | | | | | | | | | |
| | | | | | | | | | | | | | | | | | | | | | | | | | | | | | |
Total | | | | | | | | | | | | | | | | 86,438 | | | | | | | | | | | | | |
| | | | | | | | | | | | | | | | | | | | | | | | | | | | | | |
| | | | | | | | | | | | | | | | | | | | | | | | | | | | | | |
| | | | | | | | | | | | | | | | | | | | | | | | | | | | | | |
Note: Table shown at 100 percent share.
- (1)
- Anticipated accounting treatment under U.S. GAAP upon completion of the Combination Transactions.
- (2)
- Figure does not include approximately 327,000 square feet of retail within our office portfolio and 208,000 square feet of retail within our multifamily portfolio.
46
- (3)
- Based on leases signed as of March 31, 2016, and is calculated as total rentable square feet less rentable square feet available for lease divided by total rentable square feet, expressed as a percentage.
- (4)
- Based on occupied rentable square feet as of March 31, 2016 and is calculated as total rentable square feet less unoccupied square feet divided by total rentable square feet, expressed as a percentage.
- (5)
- Represents the base rent and percentage rent before rent abatements, plus tenant reimbursements for the quarter ended March 31, 2016, multiplied by four. Triple net leases are converted to a gross basis by adding tenant reimbursements to base rent. See "—Our Retail Assets—Contractual Rent Abatement in Our Retail Portfolio" for detail on rent abatements. Figure does not include approximately $8.8 million of retail annualized rent within certain operating office and multifamily assets.
- (6)
- Represents annualized rent divided by occupied square feet. Weighted average calculation excludes assets that do not have annualized base rent metrics.
- (7)
- We are currently in negotiations with our joint venture partner to recapitalize the asset and increase our ownership to 100 percent.
- (8)
- Fort Totten Square Retail is part of a mixed-use property that includes the Fort Totten Square operating multifamily asset. We are currently in negotiations with our joint venture partner to recapitalize the asset and increase our ownership to 100 percent.
- (9)
- Denotes assets that are part of the Walgreens Portfolio. We are currently in negotiations with our joint venture partner to recapitalize the asset and increase our ownership to 100 percent.
- (10)
- Denotes assets that are part of Mark Center Portfolio. Mark Center assets were operating multifamily and retail assets as of March 31, 2016; however, our development plan contemplates a redevelopment of approximately 12,000 square feet of retail and 764 multifamily units, potentially generating 2.2 million square feet of developable density.
- (11)
- North End Retail I includes the retail components of two adjacent multifamily buildings. We believe the building has significant additional revenue potential because a substantial portion of the asset's rent comes from retail leases with percentage rent components.
- (12)
- Leesburg Pike Retail was an operating retail asset as of March 31, 2016; however, our development plan contemplates a redevelopment of approximately 19,000 square feet, potentially generating 34,000 square feet of developable density. We are currently in negotiations with our joint venture partner to recapitalize the asset and increase our ownership to 100 percent.
- (13)
- Denotes embedded growth opportunity asset. See "—Business and Growth Strategies—Drive Incremental Growth through Lease-up of Our Assets" for detail on this asset.
- (14)
- Galvan Retail is part of a mixed-use property that includes the Galvan operating multifamily asset.
- (15)
- Notch 8 Retail is part of a mixed-use property that includes the Notch 8 operating multifamily asset.
- (16)
- For construction and pre-development assets, rentable square feet reflects management's estimate of actual rentable square feet based on current design plans as of March 31, 2016.
- (17)
- RTC—West Retail is part of a mixed-use property that includes the RTC—West operating office asset.
- (18)
- Reston Heights—Phase I Retail is part of a mixed-use property that includes the Reston Heights—Phase I construction multifamily asset.
47
Land Bank
The table below provides information on our land bank, which is comprised of development opportunities on which we do not expect to commence construction in the 24 months from March 31, 2016 where we (i) have an option to purchase, or enter into a leasehold interest with respect to, land; (ii) are under a long-term conditional contract to purchase land; (iii) control land through a ground lease or (iv) own land.
| | | | | | | | | | | | | | | | | | | | | | | | | | | | | | | | | | | | | | | |
| |
| |
| |
| |
| |
| |
| |
| | Remaining Cost to Access Estimated
Potential Density | |
| |
| |
| |
| |
| |
|---|
| |
| |
| |
| |
| |
| |
| |
| | Share of
Corresponding
Adjusted
Historical
Asset-Level
NOI(2) ($000's) | |
| |
| |
| |
| |
| |
| |
|---|
| |
| |
| |
| |
| |
| |
| |
| |
| |
| |
| |
| |
| | Estimated
Value as of
March 31,
2016(5)
($000s) | |
|---|
| |
| |
| |
| |
| |
| | Estimated
Rentable Square
Feet to be
Redeveloped(1) | | Estimated
Units
to be
Redeveloped(1) | | Remaining
Acquisition
Cost(3)
($000s) | | Estimated Potential Density(4) | |
|---|
| |
| |
| | Geographic
Classification | | Percent
Ownership | |
| |
|---|
Land Asset | | City | | Submarket | | Status | | Office | | Multifamily | | Retail | | Total | |
|---|
Fee Simple | | | | | | | | | | | | | | | | | | | | | | | | | | | | | | | | | | | | | | | |
Mark Center(6) | | Alexandria, VA | | I-395 Corridor | | Inside Beltway | | | 100.0 | % | Owned | | | 12,418 | | | 764 | | $ | 6,644 | | $ | — | | | 471,000 | | | 1,572,000 | | | 152,500 | | | 2,195,500 | | $ | 16,300 | |
Falkland Chase—North Land | | Silver Spring, MD | | Downtown Silver Spring | | Inside Beltway | | | 100.0 | % | Owned | | | — | | | 182 | | | 1,832 | | | — | | | — | | | 1,156,000 | | | 120,000 | | | 1,276,000 | | | 32,700 | |
NoBe II Land | | Rockville, MD | | Rockville Pike Corridor | | Outside Beltway-Metro | | | 18.0 | % | Owned | | | 139,550 | | | — | | | (772 | ) | | — | | | — | | | 582,500 | | | 90,000 | | | 672,500 | | | 17,600 | |
Fairway Land | | Reston, VA | | Reston | | Outside Beltway | | | 10.0 | % | Owned | | | — | | | 154 | | | 1,636 | | | — | | | — | | | 521,500 | | | — | | | 521,500 | | | 4,500 | |
Rosslyn Gatweway—South Land | | Rosslyn, VA | | Rosslyn | | Inside Beltway | | | 18.0 | % | Owned | | | 105,722 | | | — | | | 1,536 | | | — | | | 490,000 | | | — | | | 8,500 | | | 498,500 | | | 9,500 | |
Wiehle Avenue Development Parcel | | Reston, VA | | Reston | | Outside Beltway-Metro | | | 100.0 | % | Under Contract | | | 77,528 | | | — | | | 596 | | | 17,850 | | | 195,000 | | | 248,500 | | | 55,000 | | | 498,500 | | | 8,874 | |
1831 Wiehle Avenue Land | | Reston, VA | | Reston | | Outside Beltway-Metro | | | 100.0 | % | Owned | | | 75,191 | | | — | | | 1,264 | | | — | | | — | | | 355,000 | | | 100,000 | | | 455,000 | | | 23,803 | |
Charter Oak Land | | Reston, VA | | Reston | | Outside Beltway | | | 100.0 | % | Owned | | | — | | | 60 | | | 585 | | | — | | | — | | | 399,000 | | | — | | | 399,000 | | | 9,500 | |
Hungerford Plaza Land | | Rockville, MD | | Rockville Pike Corridor | | Outside Beltway-Metro | | | 100.0 | % | Owned | | | 85,761 | | | — | | | 340 | | | — | | | — | | | 275,000 | | | 50,000 | | | 325,000 | | | 15,678 | |
Rosslyn Gateway—North Land | | Rosslyn, VA | | Rosslyn | | Inside Beltway | | | 18.0 | % | Owned | | | 17,626 | | | — | | | 406 | | | — | | | — | | | 300,000 | | | 11,000 | | | 311,000 | | | 13,800 | |
Leesburg Pike Land(7) | | Vienna, VA | | Tysons Corner | | Outside Beltway-Metro | | | 99.0 | % | Owned | | | 19,120 | | | — | | | 600 | | | — | | | — | | | — | | | 34,000 | | | 34,000 | | | 6,500 | |
RTC—West Land(8) | | Reston, VA | | Reston | | Outside Beltway-Metro | | | 100.0 | % | Owned | | | — | | | — | | | — | | | — | | | 648,000 | | | 650,000 | | | 52,000 | | | 1,350,000 | | | 39,400 | |
Potomac Yard Land Bay G | | Alexandria, VA | | Potomac Yard | | Inside Beltway | | | 98.0 | % | Owned | | | — | | | — | | | — | | | — | | | 500,000 | | | 273,500 | | | 49,500 | | | 823,000 | | | 44,600 | |
Stonebridge Land(9) | | Woodbridge, VA | | Prince William County | | Outside Beltway | | | 10.0 | % | Owned | | | — | | | — | | | — | | | — | | | 531,000 | | | 192,000 | | | 14,500 | | | 737,500 | | | 2,550 | |
Tysons West—Phase III(10) | | Vienna, VA | | Tysons Corner | | Outside Beltway-Metro | | | 86.8 | % | Owned | | | — | | | — | | | — | | | — | | | 380,000 | | | 300,000 | | | 50,000 | | | 730,000 | | | 25,300 | |
Summit I & II Land(11) | | Reston, VA | | Reston | | Outside Beltway-Metro | | | 100.0 | % | Owned | | | — | | | — | | | — | | | — | | | — | | | 700,000 | | | — | | | 700,000 | | | 15,900 | |
Hoffman Town Center | | Alexandria, VA | | Alexandria | | Inside Beltway | | | 100.0 | % | Under Contract | | | — | | | — | | | — | | | 20,500 | | | 625,000 | | | — | | | — | | | 625,000 | | | 489 | |
Naylor Station | | Temple Hills, MD | | Branch Avenue Corridor | | Inside Beltway | | | 100.0 | % | Under Contract | | | — | | | — | | | — | | | 16,550 | | | 574,500 | | | — | | | 14,000 | | | 588,500 | | | 578 | |
Potomac Yard Land Bay H | | Alexandria, VA | | Potomac Yard | | Inside Beltway | | | 80.0 | % | Under Contract | | | — | | | — | | | — | | | 19,380 | | | 550,000 | | | — | | | — | | | 550,000 | | | 8,800 | |
Tysons West—Phase II(11) | | Vienna, VA | | Tysons Corner | | Outside Beltway-Metro | | | 86.8 | % | Owned | | | — | | | — | | | — | | | — | | | — | | | 390,000 | | | 50,000 | | | 440,000 | | | 38,600 | |
Capitol Point—North Option | | Washington, DC | | NoMa | | Inside Beltway | | | 59.0 | % | Under Contract | | | — | | | — | | | — | | | 36,411 | | | 439,000 | | | — | | | — | | | 439,000 | | | 4,500 | |
Capitol Point—North(12) | | Washington, DC | | NoMa | | Inside Beltway | | | 16.9 | % | Owned | | | — | | | — | | | — | | | — | | | 409,000 | | | — | | | — | | | 409,000 | | | 20,000 | |
965 Florida Avenue | | Washington, DC | | U Street/Shaw | | Inside Beltway | | | 70.0 | % | Under Contract | | | — | | | — | | | — | | | 2,498 | | | — | | | 351,000 | | | 51,500 | | | 402,500 | | | 1,078 | |
Parklawn—South | | Rockville, MD | | Rockville Pike Corridor | | Outside Beltway-Metro | | | 66.7 | % | Owned | | | — | | | — | | | — | | | — | | | 396,000 | | | — | | | — | | | 396,000 | | | 4,400 | |
5600 Fishers Lane—Wing C(13) | | Rockville, MD | | Rockville Pike Corridor | | Outside Beltway-Metro | | | 66.7 | % | Owned | | | — | | | — | | | — | | | — | | | 350,000 | | | — | | | — | | | 350,000 | | | 9,000 | |
L'Enfant Plaza Office—Center | | Washington, DC | | Southwest | | Inside Beltway | | | 49.0 | % | Owned | | | — | | | — | | | — | | | 1,552 | | | 350,000 | | | — | | | — | | | 350,000 | | | 25,600 | |
DCDF—801 17th Street, NE | | Washington, DC | | H Street/NoMa | | Inside Beltway | | | 100.0 | % | Under Contract | | | — | | | — | | | — | | | 8,900 | | | — | | | 230,500 | | | 12,000 | | | 242,500 | | | 2,200 | |
L'Enfant Plaza Office—Southeast | | Washington, DC | | Southwest | | Inside Beltway | | | 49.0 | % | Owned | | | — | | | — | | | — | | | 776 | | | 223,000 | | | — | | | — | | | 223,000 | | | 12,300 | |
5615 Fishers Drive | | Rockville, MD | | Rockville Pike Corridor | | Outside Beltway-Metro | | | 18.0 | % | Owned | | | — | | | — | | | — | | | — | | | 106,500 | | | — | | | — | | | 106,500 | | | 2,500 | |
Reston Heights—Phase II | | Reston, VA | | Reston | | Outside Beltway-Metro | | | 10.0 | % | Owned | | | — | | | — | | | — | | | — | | | — | | | 94,000 | | | 2,500 | | | 96,500 | | | 2,700 | |
Courthouse Metro Land—Option | | Arlington, VA | | Clarendon/Courthouse | | Inside Beltway | | | 18.0 | % | Under Contract | | | — | | | — | | | — | | | 360 | | | — | | | 57,500 | | | 5,000 | | | 62,500 | | | 190 | |
Tingey | | Washington, DC | | Southeast | | Inside Beltway | | | 100.0 | % | Owned | | | — | | | — | | | — | | | — | | | — | | | — | | | 12,000 | | | 12,000 | | | 5,900 | |
12511 Parklawn Drive | | Rockville, MD | | Rockville Pike Corridor | | Outside Beltway-Metro | | | 18.0 | % | Owned | | | — | | | — | | | — | | | — | | | 6,500 | | | — | | | — | | | 6,500 | | | 100 | |
Potomac Yard Land Bay F(14) | | Alexandria, VA | | Potomac Yard | | Inside Beltway | | | — | | Master Developer | | | — | | | — | | | — | | | — | | | — | | | — | | | — | | | — | | | 4,202 | |
| | | | | | | | | | | | | | | | | | | | | | | | | | | | | | | | | | | | | | | | |
Total | | | | | | | | | | | | | | 532,916 | | | 1,160 | | $ | 14,667 | | $ | 124,777 | | | 7,244,500 | | | 8,648,000 | | | 934,000 | | | 16,826,500 | | $ | 429,642 | |
| | | | | | | | | | | | | | | | | | | | | | | | | | | | | | | | | | | | | | | | |
48
| | | | | | | | | | | | | | | | | | | | | | | | | | | | | | | | | | | | | | | |
| |
| |
| |
| |
| |
| |
| |
| | Remaining Cost to Access Estimated
Potential Density | |
| |
| |
| |
| |
| |
|---|
| |
| |
| |
| |
| |
| |
| |
| | Share of
Corresponding
Adjusted
Historical
Asset-Level
NOI(2) ($000's) | |
| |
| |
| |
| |
| |
| |
|---|
| |
| |
| |
| |
| |
| |
| |
| |
| |
| |
| |
| |
| | Estimated
Value as of
March 31,
2016(5)
($000s) | |
|---|
| |
| |
| |
| |
| |
| | Estimated
Rentable Square
Feet to be
Redeveloped(1) | |
| | Remaining
Acquisition
Cost(3)
($000s) | | Estimated Potential Density(4) | |
|---|
| |
| |
| | Geographic
Classification | | Percent
Ownership | |
| | Estimated Units
to be
Redeveloped(1) | |
|---|
Land Asset | | City | | Submarket | | Status | | Office | | Multifamily | | Retail | | Total | |
|---|
Leasehold | | | | | | | | | | | | | | | | | | | | | | | | | | | | | | | | | | | | | | | |
Gallaudet(15) | | Washington, DC | | NoMa | | Inside Beltway | | | 100.0 | % | Under Contract | | | — | | | — | | $ | — | | $ | 4,578 | | | 86,000 | | | 987,500 | | | 150,500 | | | 1,224,000 | | $ | 19,800 | |
Bethesda North Marriott Land(16) | | Rockville, MD | | Rockville Pike Corridor | | Outside Beltway-Metro | | | 18.0 | % | Owned | | | — | | | — | | | — | | | — | | | 548,500 | | | — | | | — | | | 548,500 | | | 4,300 | |
801 New Jersey Avenue(17) | | Washington, DC | | Capitol Hill | | Inside Beltway | | | 99.0 | % | Owned | | | — | | | — | | | — | | | 16,307 | | | 350,000 | | | — | | | — | | | 350,000 | | | 38,100 | |
55 H(18) | | Washington, DC | | Capitol Hill | | Inside Beltway | | | 100.0 | % | Under Contract | | | — | | | — | | | — | | | 1,467 | | | 260,500 | | | — | | | — | | | 260,500 | | | 5,200 | |
Courthouse Metro Land(19) | | Arlington, VA | | Clarendon/Courthouse | | Inside Beltway | | | 18.0 | % | Owned | | | — | | | — | | | — | | | — | | | — | | | 267,000 | | | 19,500 | | | 286,500 | | | 710 | |
Woodglen(20) | | Rockville, MD | | Rockville Pike Corridor | | Outside Beltway-Metro | | | 18.0 | % | Owned | | | — | | | — | | | — | | | — | | | — | | | — | | | — | | | — | | | 2,900 | |
Twinbrook(21) | | Rockville, MD | | Rockville Pike Corridor | | Outside Beltway-Metro | | | 18.0 | % | Under Contract | | | — | | | — | | | — | | | — | | | — | | | — | | | — | | | — | | | — | |
| | | | | | | | | | | | | | | | | | | | | | | | | | | | | | | | | | | | | | | | |
Total | | | | | | | | | | | | | | — | | | — | | $ | — | | $ | 22,352 | | | 1,245,000 | | | 1,254,500 | | | 170,000 | | | 2,669,500 | | $ | 71,010 | |
| | | | | | | | | | | | | | | | | | | | | | | | | | | | | | | | | | | | | | | | |
Total | | | | | | | | | | | | | | 532,916 | | | 1,160 | | $ | 14,667 | | $ | 147,129 | | $ | 8,489,500 | | | 9,902,500 | | | 1,104,000 | | | 19,496,000 | | $ | 509,051 | |
| | | | | | | | | | | | | | | | | | | | | | | | | | | | | | | | | | | | | | | | |
| | | | | | | | | | | | | | | | | | | | | | | | | | | | | | | | | | | | | | | | |
| | | | | | | | | | | | | | | | | | | | | | | | | | | | | | | | | | | | | | | | |
Totals by Region | | | | | | | | | | | | | | | | | | | | | | | | | | | | | | | | | | | | | | | |
Virginia Total | | | | | | | | | | | | | | 307,605 | | | 978 | | $ | 13,267 | | $ | 58,090 | | | 4,390,000 | | | 6,320,000 | | | 604,000 | | | 11,314,000 | | $ | 284,617 | |
| | | | | | | | | | | | | | | | | | | | | | | | | | | | | | | | | | | | | | | | |
| | | | | | | | | | | | | | | | | | | | | | | | | | | | | | | | | | | | | | | | |
| | | | | | | | | | | | | | | | | | | | | | | | | | | | | | | | | | | | | | | | |
Maryland Total | | | | | | | | | | | | | | 225,311 | | | 182 | | $ | 1,400 | | $ | 16,550 | | | 1,982,000 | | | 2,013,500 | | | 274,000 | | | 4,269,500 | | $ | 89,756 | |
| | | | | | | | | | | | | | | | | | | | | | | | | | | | | | | | | | | | | | | | |
| | | | | | | | | | | | | | | | | | | | | | | | | | | | | | | | | | | | | | | | |
| | | | | | | | | | | | | | | | | | | | | | | | | | | | | | | | | | | | | | | | |
Washington, DC Total | | | | | | | | | | | | | | — | | | — | | $ | — | | $ | 72,489 | | | 2,117,500 | | | 1,569,000 | | | 226,000 | | | 3,912,500 | | $ | 134,678 | |
| | | | | | | | | | | | | | | | | | | | | | | | | | | | | | | | | | | | | | | | |
| | | | | | | | | | | | | | | | | | | | | | | | | | | | | | | | | | | | | | | | |
| | | | | | | | | | | | | | | | | | | | | | | | | | | | | | | | | | | | | | | | |
Note: Table shown at 100 percent share.
- (1)
- Represents management's estimate of the total office and/or retail square feet and multifamily units that would need to be redeveloped in order to access the estimated potential density.
- (2)
- Represents the annualized adjusted historical asset-level NOI of corresponding operating asset(s) that would need to be redeveloped in order to access the estimated potential density. Calculated as (i) for office and retail assets, square feet to be redeveloped divided by total operating square feet, multiplied by the adjusted historical asset-level for the three months ended March 31, 2016, multiplied by four, and (ii) for multifamily assets, units to be redeveloped divided by total operating units, multiplied by adjusted historical asset-level for the three months ended March 31, 2016, multiplied by four.
- (3)
- Represents management's estimate of remaining deposits, option payments and option strike prices.
- (4)
- Reflects management's estimate of developable square feet based on its current business plans as of March 31, 2016. Management's estimates of potential densities are not, in all cases, the estimated maximum density, but rather are based on various factors, including market demand and current business plans. The estimated densities also are subject to final plan approvals by the relevant governmental authority in which the project is located. As a result of these densities being based on management's plans and final governmental approval, management cannot provide any assurances that the outlined allowable densities will be achieved. Our land bank includes 11 parcels attached to our existing operating assets that would require a redevelopment of approximately 532,000 office and/or retail square feet and 1,160 multifamily units in order to access approximately 7.2 million square feet of total estimated potential density.
- (5)
- Represents management's estimate of value as of March 31, 2016. The value contemplates management's estimate of any entitlement costs, option payments, ground lease payments or other costs required to access the estimated potential density. As these costs are incurred, the value may increase.
- (6)
- The following operating assets would need to be partially or fully redeveloped to access the Mark Center estimated potential density: Brookdale, Hillwood, Stoneridge and Mark Center Shops.
- (7)
- We are currently in negotiations with our joint venture partner to recapitalize the asset and increase our ownership to 100 percent.
- (8)
- RTC—West Land is part of a multi-asset property that includes the RTC—West operating office asset and RTC—West Retail construction retail asset.
- (9)
- Stonebridge Land is part of a multi-asset property that includes the Stonebridge at Potomac Town Center—Phase I operating retail asset and the Stonebridge at Potomac Town Center—Phase II pre-development retail asset.
- (10)
- Our joint venture partners' ownership is subordinate to a member loan and priority capital. We are currently in negotiations with our joint venture partners to recapitalize the asset and increase our ownership to 100 percent.
- (11)
- Summit I & II Land is part of a multi-asset property that includes the Summit I & II operating office assets.
49
- (12)
- With respect to Capitol Point—North, we have the option to increase our ownership percentage from 16.9 percent to 59.0 percent.
- (13)
- 5600 Fishers Lane—Wing C is part of a multi-asset property which includes the 5600 Fishers Lane—U.S. Government Tenant (GSA) operating office asset.
- (14)
- With respect to Potomac Yard Land Bay F, we act as master developer of the site and are entitled to receive promote distributions after satisfaction of our joint venture partner's internal rate of return.
- (15)
- With respect to Gallaudet, we have the right to enter into ground leases, each of which we expect to enter into upon commencement of construction on each parcel.
- (16)
- Bethesda North Marriott Land is subject to a ground lease with an initial term of twenty-five years and an expiration date of January 28, 2028 with two twenty-five year extension options and one additional twenty-four year extension option.
- (17)
- 801 New Jersey Avenue is subject to a ground lease with an expiration date of December 31, 2089. Our joint venture partner's ownership interest is based on its capital account, which is in part a function of built FAR.
- (18)
- With respect to 55 H, we have the right to enter into a ground lease, which we expect to enter into upon receipt of approved construction permits.
- (19)
- Courthouse Metro Land is subject to a ground lease with an expiration date of April 19, 2104.
- (20)
- Woodglen is subject to a ground lease with an expiration date of July 8, 2062.
- (21)
- Twinbrook is subject to a joint development agreement, which provides us with the option to enter into a ground lease. We are currently not in compliance with all of the terms of the existing joint development agreement, but continue to negotiate with the land owner. The estimated potential density of the site is 929,500, which includes approximately 196,000 square feet of office density, 642,000 square feet of multifamily density and 91,500 square feet of retail density.
50
Our Office Assets
We have a premier operating portfolio of office assets comprised of 38 assets and approximately 9.1 million RSF, representing 56.3 percent of our total operating portfolio square footage as of March 31, 2016. These assets were 92.2 percent leased and 90.5 percent occupied as of March 31, 2016. Approximately 91.1 percent of our operating office assets are located inside the Beltway and/or Metro-served locations based on rentable square feet as of March 31, 2016.
Additionally, our office portfolio has one asset under construction and four assets in pre-development representing approximately 1.5 million square feet. Our one office asset under construction was 65.0 percent pre-leased as of March 31, 2016.
As of March 31, 2016, the U.S. Government accounted for approximately 56.6 percent of our share of the annualized rent of our office portfolio while no other tenant accounted for more than 2.4 percent of our share of the annualized rent of our office portfolio. The following table sets forth information regarding the 20 largest tenants in our office portfolio based on annualized rent as of March 31, 2016:
| | | | | | | | | | | | | | | | | | | | | | | | | | | | | | |
| |
| |
| | At 100 Percent Share | | At JBG Share(1) | |
|---|
Tenant | | Number of
Leases | | Rentable
Square
Feet | | Percent of
Total
Rentable
Square Feet | | Annualized
Rent(2) | | Percent of
Total
Annualized
Rent | | Rentable
Square
Feet | | Percent of
Total
Rentable
Square Feet | | Annualized
Rent(2) | | Percent of
Total
Annualized
Rent | |
|---|
1 | | U.S. Government (GSA) | | | 24 | | | 4,647,088 | | | 56.7 | % | $ | 166,029,654 | | | 55.2 | % | | 3,485,829 | | | 57.3 | % | $ | 127,271,351 | | | 56.6 | % |
2 | | Accenture LLP | | | 1 | | | 102,818 | | | 1.3 | % | | 5,378,698 | | | 1.8 | % | | 102,818 | | | 1.7 | % | | 5,378,698 | | | 2.4 | % |
3 | | Noblis Inc | | | 2 | | | 160,503 | | | 2.0 | % | | 4,810,183 | | | 1.6 | % | | 160,503 | | | 2.6 | % | | 4,810,183 | | | 2.1 | % |
4 | | Georgetown University | | | 3 | | | 126,637 | | | 1.5 | % | | 4,640,784 | | | 1.5 | % | | 101,174 | | | 1.7 | % | | 3,772,391 | | | 1.7 | % |
5 | | Evolent Health LLC | | | 1 | | | 90,905 | | | 1.1 | % | | 4,529,715 | | | 1.5 | % | | 90,905 | | | 1.5 | % | | 4,529,715 | | | 2.0 | % |
6 | | JBG Properties Inc | | | 2 | | | 83,262 | | | 1.0 | % | | 4,034,861 | | | 1.3 | % | | 8,326 | | | 0.1 | % | | 403,486 | | | 0.2 | % |
7 | | University Research Co LLC | | | 2 | | | 63,391 | | | 0.8 | % | | 2,849,202 | | | 0.9 | % | | 63,391 | | | 1.0 | % | | 2,849,202 | | | 1.3 | % |
8 | | Palantir Technologies Inc | | | 1 | | | 65,781 | | | 0.8 | % | | 2,778,667 | | | 0.9 | % | | 65,781 | | | 1.1 | % | | 2,778,667 | | | 1.2 | % |
9 | | Fannie Mae (aka Federal National Mortgage Assn) | | | 1 | | | 87,137 | | | 1.1 | % | | 2,659,725 | | | 0.9 | % | | 87,137 | | | 1.4 | % | | 2,659,725 | | | 1.2 | % |
10 | | Reese Communications Companies Inc | | | 2 | | | 41,672 | | | 0.5 | % | | 2,349,646 | | | 0.8 | % | | 4,117 | | | 0.1 | % | | 232,150 | | | 0.1 | % |
11 | | American Institutes For Research In The Behavioral Sciences | | | 2 | | | 52,234 | | | 0.6 | % | | 2,292,654 | | | 0.8 | % | | 52,234 | | | 0.9 | % | | 2,292,654 | | | 1.0 | % |
12 | | The Ritz-Carlton Hotel Co LLC | | | 1 | | | 40,508 | | | 0.5 | % | | 2,063,630 | | | 0.7 | % | | 4,051 | | | 0.1 | % | | 206,363 | | | 0.1 | % |
13 | | Capitol One Services LLC | | | 1 | | | 36,089 | | | 0.4 | % | | 1,963,202 | | | 0.7 | % | | 3,609 | | | 0.1 | % | | 196,320 | | | 0.1 | % |
14 | | The Urban Land Institute | | | 1 | | | 38,905 | | | 0.5 | % | | 1,859,124 | | | 0.6 | % | | 38,905 | | | 0.6 | % | | 1,859,124 | | | 0.8 | % |
15 | | Vmware Inc | | | 1 | | | 52,885 | | | 0.6 | % | | 1,820,837 | | | 0.6 | % | | 52,885 | | | 0.9 | % | | 1,820,837 | | | 0.8 | % |
16 | | Elsevier Inc | | | 1 | | | 41,429 | | | 0.5 | % | | 1,782,272 | | | 0.6 | % | | 4,143 | | | 0.1 | % | | 178,227 | | | 0.1 | % |
17 | | Linowes & Blocher LLP | | | 1 | | | 34,919 | | | 0.4 | % | | 1,701,944 | | | 0.6 | % | | 34,919 | | | 0.6 | % | | 1,701,944 | | | 0.8 | % |
18 | | Enviva Holdings LP | | | 3 | | | 33,568 | | | 0.4 | % | | 1,632,309 | | | 0.5 | % | | 33,568 | | | 0.6 | % | | 1,632,309 | | | 0.7 | % |
19 | | Carlton Fields Jorden Burt Pa | | | 1 | | | 35,878 | | | 0.4 | % | | 1,627,080 | | | 0.5 | % | | 35,878 | | | 0.6 | % | | 1,627,080 | | | 0.7 | % |
20 | | SAP America Inc | | | 1 | | | 51,142 | | | 0.6 | % | | 1,617,006 | | | 0.5 | % | | 51,142 | | | 0.8 | % | | 1,617,006 | | | 0.7 | % |
| | Other | | | 379 | | | 2,312,518 | | | 28.2 | % | | 82,560,541 | | | 27.4 | % | | 1,601,839 | | | 26.3 | % | | 57,187,521 | | | 25.4 | % |
| | | | | | | | | | | | | | | | | | | | | | | | | | | | | | | |
| | Total In-Place Leases | | | 431 | | | 8,199,269 | | | 100.0 | % | $ | 300,981,734 | | | 100.0 | % | | 6,083,154 | | | 100.0 | % | $ | 225,004,953 | | | 100.0 | % |
| | | | | | | | | | | | | | | | | | | | | | | | | | | | | | | |
| | | | | | | | | | | | | | | | | | | | | | | | | | | | | | | |
| | | | | | | | | | | | | | | | | | | | | | | | | | | | | | | |
| | Available | | | — | | | 713,397 | | | | | | | | | | | | 453,050 | | | | | | | | | | |
| | Signed Leases Not Commenced | | | 11 | | | 166,624 | | | | | | | | | | | | 117,718 | | | | | | | | | | |
| | Building Management Use | | | 26 | | | 68,935 | | | | | | | | | | | | 41,267 | | | | | | | | | | |
| | | | | | | | | | | | | | | | | | | | | | | | | | | | | | | |
| | Total | | | 468 | | | 9,148,225 | | | | | | | | | | | | 6,695,189 | | | | | | | | | | |
| | | | | | | | | | | | | | | | | | | | | | | | | | | | | | | |
| | | | | | | | | | | | | | | | | | | | | | | | | | | | | | | |
| | | | | | | | | | | | | | | | | | | | | | | | | | | | | | | |
- (1)
- Reflects our pro rata share of joint venture assets.
- (2)
- Represents in place base rent before abatements, plus tenant reimbursements for the month ended March 31, 2016 multiplied by 12. Triple net leases are converted to a gross basis by adding tenant reimbursements to base rent. See "—Contractual Rent Abatement in Our Office Portfolio" for detail on rent abatements.
As of March 31, 2016, Government accounted for approximately 57.0 percent of our share of the annualized rent of our office portfolio. The next most represented industries within our portfolio as of March 31, 2016 were Business Services, Government Contractors and Health Services, representing
51
11.7 percent, 5.8 percent and 4.1 percent, respectively, of our share of the annualized rent of our office portfolio. The following table sets forth information regarding the ten largest industries in our office portfolio based on annualized rent as of March 31, 2016:
| | | | | | | | | | | | | | | | | | | | | | | | | | | | | | |
| |
| |
| | At 100 Percent Share | | At JBG Share(1) | |
|---|
Industry | | Number of
Leases | | Rentable
Square
Feet | | Percent of
Total
Rentable
Square Feet | | Annualized
Rent(2) | | Percent of
Total
Annualized
Rent | | Rentable
Square
Feet | | Percent of
Total
Rentable
Square Feet | | Annualized
Rent(2) | | Percent of
Total
Annualized
Rent | |
|---|
1 | | Government | | | 27 | | | 4,676,643 | | | 57.0 | % | $ | 167,368,347 | | | 55.6 | % | | 3,507,678 | | | 57.7 | % | $ | 128,306,395 | | | 57.0 | % |
2 | | Business Services | | | 81 | | | 854,809 | | | 10.4 | % | | 31,476,603 | | | 10.5 | % | | 734,736 | | | 12.1 | % | | 26,299,951 | | | 11.7 | % |
3 | | Government Contractors | | | 30 | | | 456,115 | | | 5.6 | % | | 18,351,604 | | | 6.1 | % | | 323,381 | | | 5.3 | % | | 13,132,216 | | | 5.8 | % |
4 | | Legal Services | | | 30 | | | 246,678 | | | 3.0 | % | | 10,241,376 | | | 3.4 | % | | 152,223 | | | 2.5 | % | | 5,943,799 | | | 2.6 | % |
5 | | Health Services | | | 31 | | | 250,278 | | | 3.1 | % | | 10,123,562 | | | 3.4 | % | | 232,034 | | | 3.8 | % | | 9,281,660 | | | 4.1 | % |
6 | | Real Estate | | | 27 | | | 236,587 | | | 2.9 | % | | 10,069,323 | | | 3.3 | % | | 198,376 | | | 3.3 | % | | 8,347,874 | | | 3.7 | % |
7 | | Engineering & Management Services | | | 39 | | | 250,044 | | | 3.0 | % | | 9,134,575 | | | 3.0 | % | | 180,839 | | | 3.0 | % | | 6,811,908 | | | 3.0 | % |
8 | | Educational Services | | | 14 | | | 232,164 | | | 2.8 | % | | 8,447,275 | | | 2.8 | % | | 176,967 | | | 2.9 | % | | 6,441,328 | | | 2.9 | % |
9 | | Food and Beverage | | | 26 | | | 107,623 | | | 1.3 | % | | 4,601,790 | | | 1.5 | % | | 54,873 | | | 0.9 | % | | 2,449,394 | | | 1.1 | % |
10 | | Printing and Publishing Services | | | 5 | | | 86,844 | | | 1.1 | % | | 3,552,989 | | | 1.2 | % | | 12,884 | | | 0.2 | % | | 497,011 | | | 0.2 | % |
| | Other | | | 121 | | | 801,484 | | | 9.8 | % | | 27,614,290 | | | 9.2 | % | | 509,163 | | | 8.4 | % | | 17,493,417 | | | 7.8 | % |
| | | | | | | | | | | | | | | | | | | | | | | | | | | | | | | |
| | Total In-Place Leases | | | 431 | | | 8,199,269 | | | 100.0 | % | $ | 300,981,734 | | | 100.0 | % | | 6,083,154 | | | 100.0 | % | $ | 225,004,953 | | | 100.0 | % |
| | | | | | | | | | | | | | | | | | | | | | | | | | | | | | | |
| | | | | | | | | | | | | | | | | | | | | | | | | | | | | | | |
| | | | | | | | | | | | | | | | | | | | | | | | | | | | | | | |
| | Available | | | — | | | 713,397 | | | | | | | | | | | | 453,050 | | | | | | | | | | |
| | Signed Leases Not Commenced | | | 11 | | | 166,624 | | | | | | | | | | | | 117,718 | | | | | | | | | | |
| | Building Management Use | | | 26 | | | 68,935 | | | | | | | | | | | | 41,267 | | | | | | | | | | |
| | | | | | | | | | | | | | | | | | | | | | | | | | | | | | | |
| | Total | | | 468 | | | 9,148,225 | | | | | | | | | | | | 6,695,189 | | | | | | | | | | |
| | | | | | | | | | | | | | | | | | | | | | | | | | | | | | | |
| | | | | | | | | | | | | | | | | | | | | | | | | | | | | | | |
| | | | | | | | | | | | | | | | | | | | | | | | | | | | | | | |
- (1)
- Reflects our pro rata share of joint venture assets.
- (2)
- Represents in place base rent before abatements, plus tenant reimbursements for the month ended March 31, 2016 multiplied by 12. Triple net leases are converted to a gross basis by adding tenant reimbursements to base rent. See "—Contractual Rent Abatement in Our Office Portfolio" for detail on rent abatements.
52
The following table sets forth a summary schedule of the lease expirations for leases in place as of March 31, 2016 at the assets in our office portfolio. The information set forth in the table assumes that tenants exercise no renewal options:
| | | | | | | | | | | | | | | | | | | | | | | | | |
| |
| | At 100
Percent
Share | | At JBG Share(1) | |
|---|
Year of Lease Expiration | | Number of
Leases | | Rentable
Square Feet | | Rentable
Square Feet | | Percent
of Total
Rentable
Square Feet | | Annualized
Rent(2) | | Percent
of Total
Annualized
Rent | | Annualized
Rent Per
Square Foot | | Estimated
Annualized
Rent Per
Square Foot
at Expiration(3) | |
|---|
Month to Month | | | 34 | | | 70,516 | | | 56,272 | | | 0.9 | % | $ | 1,916,167 | | | 0.9 | % | $ | 34.05 | | $ | 34.05 | |
2016 (April 1, 2016 to December 31, 2016) | | | 53 | | | 617,170 | | | 468,450 | | | 7.7 | % | | 17,308,771 | | | 7.7 | % | | 36.95 | | | 36.84 | |
2017 | | | 83 | | | 633,924 | | | 360,846 | | | 5.9 | % | | 12,221,336 | | | 5.4 | % | | 33.87 | | | 33.43 | |
2018 | | | 72 | | | 704,166 | | | 468,919 | | | 7.7 | % | | 17,244,868 | | | 7.7 | % | | 36.78 | | | 38.76 | |
2019 | | | 45 | | | 314,631 | | | 156,427 | | | 2.6 | % | | 6,276,638 | | | 2.8 | % | | 40.13 | | | 43.40 | |
2020 | | | 46 | | | 601,333 | | | 456,646 | | | 7.5 | % | | 18,067,386 | | | 8.0 | % | | 39.57 | | | 43.44 | |
2021 | | | 26 | | | 1,762,176 | | | 1,705,280 | | | 28.0 | % | | 68,820,415 | | | 30.6 | % | | 40.36 | | | 45.40 | |
2022 | | | 15 | | | 237,458 | | | 111,892 | | | 1.8 | % | | 3,875,284 | | | 1.7 | % | | 34.63 | | | 39.94 | |
2023 | | | 21 | | | 945,740 | | | 711,067 | | | 11.7 | % | | 24,925,992 | | | 11.1 | % | | 35.05 | | | 36.59 | |
2024 | | | 11 | | | 342,340 | | | 175,787 | | | 2.9 | % | | 8,404,852 | | | 3.7 | % | | 47.81 | | | 60.44 | |
Thereafter | | | 25 | | | 1,969,815 | | | 1,411,568 | | | 23.2 | % | | 45,943,243 | | | 20.4 | % | | 32.55 | | | 38.23 | |
| | | | | | | | | | | | | | | | | | | | | | | | | | |
Total In-Place Leases | | | 431 | | | 8,199,269 | | | 6,083,154 | | | 100.0 | % | $ | 225,004,952 | | | 100.0 | % | $ | 36.99 | | $ | 40.86 | |
| | | | | | | | | | | | | | | | | | | | | | | | | | |
| | | | | | | | | | | | | | | | | | | | | | | | | | |
| | | | | | | | | | | | | | | | | | | | | | | | | | |
Available | | | — | | | 713,397 | | | 453,050 | | | | | | | | | | | | | | | | |
Signed leases not commenced | | | 11 | | | 166,624 | | | 117,718 | | | | | | | | | | | | | | | | |
Building Management Use | | | 26 | | | 68,935 | | | 41,267 | | | | | | | | | | | | | | | | |
| | | | | | | | | | | | | | | | | | | | | | | | | | |
Total | | | 468 | | | 9,148,225 | | | 6,695,189 | | | | | | | | | | | | | | | | |
| | | | | | | | | | | | | | | | | | | | | | | | | | |
| | | | | | | | | | | | | | | | | | | | | | | | | | |
| | | | | | | | | | | | | | | | | | | | | | | | | | |
- (1)
- Reflects our pro rata share of joint venture assets.
- (2)
- Represents in place base rent before abatements, plus tenant reimbursements for the month ended March 31, 2016 multiplied by 12. Triple net leases are converted to a gross basis by adding tenant reimbursements to base rent. See "—Contractual Rent Abatement in Our Office Portfolio" for detail on rent abatements.
- (3)
- Represents in place base rent before abatements, plus management's estimate of tenant reimbursements, as of lease expiration multiplied by 12 and divided by rentable square feet. Triple net leases are converted to a gross basis by adding tenant reimbursements to base rent. Tenant reimbursements at lease expiration are estimated by escalating tenant reimbursements as of March 31, 2016, or management's estimate thereof, by two and three-quarters percent annually through the lease expiration year.
53
The following table sets forth information relating to leases signed but not commenced in our office portfolio as of March 31, 2016:
| | | | | | | | | | | | | | | | | | | | | | |
| |
| |
| |
| | At 100 Percent Share | | At JBG Share(1) | |
|---|
| |
| | Estimated
Lease
Commencement
Date | | Estimated
Lease
Expiration
Date | |
|---|
Office Asset | | Percent
Ownership | | Rentable
Square
Feet | | Annualized
Rent(2) | | Rentable
Square
Feet | | Annualized
Rent(2) | |
|---|
Stabilized | | | | | | | | | | | | | | | | | | | | | | |
L'Enfant Plaza Office—North | | | 49.0 | % | | Oct-16 | | | Sep-26 | | | 33,466 | | $ | 1,476,682 | | | 16,396 | | $ | 723,504 | |
RTC—West | | | 100.0 | % | | Aug-16 | | | May-26 | | | 23,480 | | | 817,772 | | | 23,480 | | | 817,772 | |
RTC—West | | | 100.0 | % | | Aug-16 | | | Jul-27 | | | 4,986 | | | 191,972 | | | 4,986 | | | 191,972 | |
Artery Plaza | | | 100.0 | % | | Jun-16 | | | May-26 | | | 5,388 | | | 275,606 | | | 5,388 | | | 275,606 | |
Artery Plaza | | | 100.0 | % | | Apr-16 | | | Sep-16 | | | 558 | | | 8,376 | | | 558 | | | 8,376 | |
Chase Tower | | | 10.0 | % | | Jul-16 | | | Jun-24 | | | 4,989 | | | 193,374 | | | 499 | | | 19,337 | |
6862 Elm Street | | | 100.0 | % | | Jun-16 | | | Oct-21 | | | 2,832 | | | 94,797 | | | 2,832 | | | 94,797 | |
11333 Woodglen Drive | | | 18.0 | % | | Apr-16 | | | Dec-23 | | | 2,603 | | | 72,884 | | | 469 | | | 13,119 | |
Rosslyn Gateway—North | | | 18.0 | % | | Jun-16 | | | Dec-21 | | | 834 | | | 32,882 | | | 150 | | | 5,919 | |
Hungerford Plaza | | | 100.0 | % | | Jun-16 | | | May-18 | | | 262 | | | 6,104 | | | 262 | | | 6,104 | |
| | | | | | | | | | | | | | | | | | | | | | | |
Total | | | | | | | | | | | | 79,398 | | $ | 3,170,449 | | | 55,020 | | $ | 2,156,506 | |
| | | | | | | | | | | | | | | | | | | | | | | |
Recently Acquired/Delivered/Renovated | | | | | | | | | | | | | | | | | | | | | | |
16th & I Street | | | 71.9 | % | | Apr-16 | | | Mar-31 | | | 87,226 | | $ | 7,774,453 | | | 62,698 | | $ | 5,588,265 | |
| | | | | | | | | | | | | | | | | | | | | | | |
Total | | | | | | | | | | | | 87,226 | | $ | 7,774,453 | | | 62,698 | | $ | 5,588,265 | |
| | | | | | | | | | | | | | | | | | | | | | | |
Total Operating | | | | | | | | | | | | 166,624 | | $ | 10,944,902 | | | 117,718 | | $ | 7,744,771 | |
| | | | | | | | | | | | | | | | | | | | | | | |
| | | | | | | | | | | | | | | | | | | | | | | |
| | | | | | | | | | | | | | | | | | | | | | | |
Construction | | | | | | | | | | | | | | | | | | | | | | |
CEB Tower at Central Place | | | 100.0 | % | | Apr-18 | | | Mar-33 | | | 348,847 | | $ | 21,628,514 | | | 348,847 | | $ | 21,628,514 | |
| | | | | | | | | | | | | | | | | | | | | | | |
Total | | | | | | | | | | | | 348,847 | | $ | 21,628,514 | | | 348,847 | | $ | 21,628,514 | |
| | | | | | | | | | | | | | | | | | | | | | | |
Total | | | | | | | | | | | | 515,471 | | $ | 32,573,416 | | | 466,565 | | $ | 29,373,285 | |
| | | | | | | | | | | | | | | | | | | | | | | |
| | | | | | | | | | | | | | | | | | | | | | | |
| | | | | | | | | | | | | | | | | | | | | | | |
Note: Table only includes leases for space that was vacant as of March 31, 2016.
- (1)
- Reflects our pro rata share of joint venture assets.
- (2)
- Represents base rent before abatements, plus tenant reimbursements for the month in which the lease commences, multiplied by 12. Triple net leases are converted to a gross basis by adding tenant reimbursements to base rent. See "—Contractual Rent Abatement in Our Office Portfolio" for detail on rent abatements.
54
The following tables set forth information relating to contractual rent abatements in our office portfolio as of March 31, 2016, at 100 percent share and our share, respectively:
| | | | | | | | | | | | | | | | | | | | | | |
| |
| | At 100 Percent Share | |
|---|
| |
| | Quarter Ending:(1) | |
|---|
Office Asset | | Percent
Ownership | | June 30,
2016 | | September 30,
2016 | | December 31,
2016 | | March 31,
2017 | | June 30,
2017 | | September 30,
2017 | |
|---|
Stabilized | | | | | | | | | | | | | | | | | | | | | | |
Jefferson Court | | | 100.0 | % | $ | 1,186,835 | | $ | 768,577 | | $ | 482,708 | | $ | 453,329 | | $ | 151,110 | | $ | — | |
Summit I | | | 100.0 | % | | 1,101,069 | | | 1,101,069 | | | 1,101,069 | | | 367,023 | | | — | | | — | |
RTC—West | | | 100.0 | % | | 456,075 | | | 251,363 | | | 313,129 | | | 286,831 | | | 270,026 | | | 84,469 | |
L'Enfant Plaza Office—North | | | 49.0 | % | | 415,227 | | | 294,702 | | | 646,055 | | | 646,055 | | | 457,980 | | | 363,943 | |
1233 20th Street | | | 100.0 | % | | 248,387 | | | 102,724 | | | 102,724 | | | 198,989 | | | 154,481 | | | — | |
800 North Glebe Road | | | 100.0 | % | | 157,231 | | | 83,450 | | | 30,523 | | | — | | | — | | | — | |
Reston Arboretum | | | 100.0 | % | | 107,991 | | | 107,991 | | | 71,994 | | | — | | | — | | | — | |
Rosslyn Gateway—North | | | 18.0 | % | | 105,910 | | | 102,382 | | | 120,070 | | | 140,258 | | | 130,947 | | | 130,947 | |
Summit II | | | 100.0 | % | | 92,346 | | | 92,346 | | | 92,345 | | | 30,782 | | | — | | | — | |
Artery Plaza | | | 100.0 | % | | 58,002 | | | 12,131 | | | 29,705 | | | 19,803 | | | — | | | — | |
12725 Twinbrook Parkway | | | 10.0 | % | | 40,150 | | | — | | | — | | | — | | | — | | | — | |
6862 Elm Street | | | 100.0 | % | | 20,945 | | | 11,682 | | | 11,682 | | | 8,522 | | | — | | | — | |
11333 Woodglen Drive | | | 18.0 | % | | 18,221 | | | 18,221 | | | 12,147 | | | — | | | — | | | — | |
NCI—U.S. Government Tenant (GSA) | | | 100.0 | % | | 11,561 | | | 11,561 | | | 11,353 | | | 11,792 | | | 12,011 | | | 12,011 | |
NoBe II Office | | | 18.0 | % | | 2,211 | | | — | | | — | | | — | | | — | | | — | |
2121 Wisconsin Avenue | | | 100.0 | % | | — | | | 69,641 | | | 104,462 | | | 69,641 | | | — | | | — | |
Chase Tower | | | 10.0 | % | | — | | | 48,019 | | | 48,019 | | | 28,840 | | | 19,250 | | | 19,780 | |
Hungerford Plaza | | | 100.0 | % | | — | | | 14,290 | | | — | | | — | | | — | | | — | |
5635 Fishers Lane | | | 10.0 | % | | — | | | 14,275 | | | 42,826 | | | 14,275 | | | — | | | — | |
Wiehle Avenue Office Building | | | 100.0 | % | | — | | | 8,715 | | | 17,430 | | | 48,162 | | | — | | | — | |
Rosslyn Gateway—South | | | 18.0 | % | | — | | | — | | | — | | | 16,373 | | | 16,373 | | | — | |
| | | | | | | | | | | | | | | | | | | | | | | |
Total | | | | | $ | 4,022,161 | | $ | 3,113,139 | | $ | 3,238,241 | | $ | 2,340,675 | | $ | 1,212,178 | | $ | 611,150 | |
| | | | | | | | | | | | | | | | | | | | | | | |
Recently Acquired/Delivered/Renovated | | | | | | | | | | | | | | | | | | | | | | |
16th & I Street | | | 71.9 | % | $ | 1,391,539 | | $ | 501,107 | | $ | 37,260 | | $ | — | | $ | — | | $ | — | |
The Foundry | | | 9.9 | % | | 69,451 | | | — | | | — | | | — | | | — | | | — | |
| | | | | | | | | | | | | | | | | | | | | | | |
Total | | | | | $ | 1,460,990 | | $ | 501,107 | | $ | 37,260 | | $ | — | | $ | — | | $ | — | |
| | | | | | | | | | | | | | | | | | | | | | | |
Total | | | | | $ | 5,483,151 | | $ | 3,614,246 | | $ | 3,275,501 | | $ | 2,340,675 | | $ | 1,212,178 | | $ | 611,150 | |
| | | | | | | | | | | | | | | | | | | | | | | |
| | | | | | | | | | | | | | | | | | | | | | | |
| | | | | | | | | | | | | | | | | | | | | | | |
- (1)
- Represents contractual rent abatements for in place and signed but not commenced leases.
55
| | | | | | | | | | | | | | | | | | | | | | |
| |
| | At JBG Share(1) | |
|---|
| |
| | Quarter Ending:(2) | |
|---|
Office Asset | | Percent
Ownership | | June 30,
2016 | | September 30,
2016 | | December 31,
2016 | | March 31,
2017 | | June 30,
2017 | | September 30,
2017 | |
|---|
Stabilized | | | | | | | | | | | | | | | | | | | | | | |
Jefferson Court | | | 100.0 | % | $ | 1,186,835 | | $ | 768,577 | | $ | 482,708 | | $ | 453,329 | | $ | 151,110 | | $ | — | |
Summit I | | | 100.0 | % | | 1,101,069 | | | 1,101,069 | | | 1,101,069 | | | 367,023 | | | — | | | — | |
RTC—West | | | 100.0 | % | | 456,075 | | | 251,363 | | | 313,129 | | | 286,831 | | | 270,026 | | | 84,469 | |
L'Enfant Plaza Office—North | | | 49.0 | % | | 203,442 | | | 144,390 | | | 316,536 | | | 316,536 | | | 224,389 | | | 178,315 | |
1233 20th Street | | | 100.0 | % | | 248,387 | | | 102,724 | | | 102,724 | | | 198,989 | | | 154,481 | | | — | |
800 North Glebe Road | | | 100.0 | % | | 157,231 | | | 83,450 | | | 30,523 | | | — | | | — | | | — | |
Reston Arboretum | | | 100.0 | % | | 107,991 | | | 107,991 | | | 71,994 | | | — | | | — | | | — | |
Rosslyn Gateway—North | | | 18.0 | % | | 19,064 | | | 18,429 | | | 21,613 | | | 25,246 | | | 23,571 | | | 23,571 | |
Summit II | | | 100.0 | % | | 92,346 | | | 92,346 | | | 92,345 | | | 30,782 | | | — | | | — | |
Artery Plaza | | | 100.0 | % | | 58,002 | | | 12,131 | | | 29,705 | | | 19,803 | | | — | | | — | |
12725 Twinbrook Parkway | | | 10.0 | % | | 4,015 | | | — | | | — | | | — | | | — | | | — | |
6862 Elm Street | | | 100.0 | % | | 20,945 | | | 11,682 | | | 11,682 | | | 8,522 | | | — | | | — | |
11333 Woodglen Drive | | | 18.0 | % | | 3,280 | | | 3,280 | | | 2,187 | | | — | | | — | | | — | |
NCI—U.S. Government Tenant (GSA) | | | 100.0 | % | | 11,561 | | | 11,561 | | | 11,353 | | | 11,792 | | | 12,011 | | | 12,011 | |
NoBe II Office | | | 18.0 | % | | 398 | | | — | | | — | | | — | | | — | | | — | |
2121 Wisconsin Avenue | | | 100.0 | % | | — | | | 69,641 | | | 104,462 | | | 69,641 | | | — | | | — | |
Chase Tower | | | 10.0 | % | | — | | | 4,802 | | | 4,802 | | | 2,884 | | | 1,925 | | | 1,978 | |
Hungerford Plaza | | | 100.0 | % | | — | | | 14,290 | | | — | | | — | | | — | | | — | |
5635 Fishers Lane | | | 10.0 | % | | — | | | 1,428 | | | 4,283 | | | 1,428 | | | — | | | — | |
Wiehle Avenue Office Building | | | 100.0 | % | | — | | | 8,715 | | | 17,430 | | | 48,162 | | | — | | | — | |
Rosslyn Gateway—South | | | 18.0 | % | | — | | | — | | | — | | | 2,947 | | | 2,947 | | | — | |
| | | | | | | | | | | | | | | | | | | | | | | |
Total | | | | | $ | 3,670,641 | | $ | 2,807,869 | | $ | 2,718,545 | | $ | 1,843,915 | | $ | 840,460 | | $ | 300,344 | |
| | | | | | | | | | | | | | | | | | | | | | | |
Recently Acquired/Delivered/Renovated | | | | | | | | | | | | | | | | | | | | | | |
16th & I Street | | | 71.9 | % | $ | 1,000,236 | | $ | 360,195 | | $ | 26,783 | | $ | — | | $ | — | | $ | — | |
The Foundry | | | 9.9 | % | | 6,862 | | | — | | | — | | | — | | | — | | | — | |
| | | | | | | | | | | | | | | | | | | | | | | |
Total | | | | | $ | 1,007,098 | | $ | 360,195 | | $ | 26,783 | | $ | — | | $ | — | | $ | — | |
| | | | | | | | | | | | | | | | | | | | | | | |
Total | | | | | $ | 4,677,739 | | $ | 3,168,064 | | $ | 2,745,328 | | $ | 1,843,915 | | $ | 840,460 | | $ | 300,344 | |
| | | | | | | | | | | | | | | | | | | | | | | |
| | | | | | | | | | | | | | | | | | | | | | | |
| | | | | | | | | | | | | | | | | | | | | | | |
- (1)
- Reflects our pro rata share of joint venture assets.
- (2)
- Represents contractual rent abatements for in place and signed but not commenced leases.
Our operating office portfolio includes four build-to-suit assets leased by GSA, comprising more than 3.5 million RSF and 38.5 percent of our total operating office portfolio rentable square feet as of March 31, 2016. We are one of the largest landlords to GSA, having leased and developed over 5.2 million RSF of GSA office assets for federal government users, including the Department of Transportation, Social Security Administration and National Cancer Institute. One of our GSA assets is the headquarters building for the Department of Transportation, a federal Cabinet-level agency. Each of our GSA-leased assets is a mission critical, state-of-the-art facility accompanied by a long-term lease. Through our experience with GSA, we possess considerable in-house expertise in build-to-suit and lease-procurement opportunities for the federal government, which we believe positions us well for future opportunities to partner with GSA.
56
The complexity and time-consuming nature of the GSA large-scale build-to-suit procurement process results in leases that are typically renewed for a second term, enhancing the financial stability of these assets. We attribute this result to the difficulty and length of time associated with the planning, budgeting, authorization, procurement, design and construction cycle for large GSA leases. During the time period from 2000 to 2015, the vast majority (95.3 percent) of first-generation GSA leases larger than 100,000 RSF in the National Capital Region were renewed for a second term (at least three years of term upon lease expiration), according to JLL and GSA data. According to GSA's annual lease turnover analysis, the average length of time GSA tenants have occupied the same building is 23.3 years (weighted by rentable building area), and within the National Capital Region, the average length of GSA tenancy is 31.8 years, according to JLL data. GSA leases of space with annual rent payments exceeding $2.85 million fall into a category of lease under the GSA procurement regime that requires Congressional approval. Obtaining Congressional approval can take many years and is subject to political forces outside the control of GSA or the agencies it represents. The typical process can take three to four years from the date an agency notifies GSA of its need and award of the lease to a developer in addition to a second three to four years typically required to design and construct a facility. For example, the approval, design and construction process for the Department of Transportation headquarters lease took more than ten years from the date the agency notified GSA of its space need. Each of the GSA leases in our portfolio contains a ten year renewal option at 95 percent of market rent, with the exception of DOT which has an 11 year renewal option at 95 percent of market rent.
In March 2013, the U.S. Office of Management and Budget released a memo detailing a new "freeze the footprint" mandate. GSA subsequently consolidated its 52.8 million RSF portfolio of leased office space in the Metro DC region into more efficient modern office buildings. In total, GSA has reduced its leased inventory by approximately 4.0 million square feet to 48.8 million RSF, according to published GSA statistics. During this period, we have developed and own approximately 2.5 million RSF of the new prototype space. Our assets are designed to the new space standards for federal office space and will be the building blocks of the new federal inventory, further increasing the likelihood of renewal in recently developed, first generation buildings.
In addition to stability that we attribute to the nature of procurement process, agencies frequently make significant investments in above standard improvements and critical infrastructure that would be costly and disruptive to relocate, further enhancing this stability. Across our single-tenant, GSA build-to-suit portfolio, we believe GSA has invested significant capital above any landlord tenant improvement allowance for security enhancements, in-house data centers, and other tenant specific requirements, thereby enhancing GSA's commitment to the building.
While we believe the likelihood of renewal is high, we design the floor plans of our build-to-suit GSA buildings with a hedge against a change in plans of our government tenants that would result in a vacancy. We accomplish this hedge through floor plans with multiple wings and cores that are capable of accommodating multi-tenant occupancy. Additionally, the current uses are predominately office, rather than lab or specialty use, making the space suitable for other GSA or private sector tenants.
57
Our build-to-suit leases are directly with the tenant agency, rather than with GSA, which results in lease payments under our leases not falling subject to annual budget appropriations. Additionally, each of the GSA leases in our portfolio is structured net of certain utilities expenses, which makes net income more predictable. Our largest lease, the Department of Transportation headquarters, includes annual base rent escalations of 2.0 percent, while most GSA leases do not include escalation provisions.
| | | | | | | | | | | | | | | | | | | | |
Asset | | Year Built /
Renovated | | GSA
Lease
Square
Feet | | GSA
Annualized
Rent(1)
($000s) | | Annualized
Rent
Per
Square
Foot | | Estimated
Tenant
Direct
Expense
Per
Square
Foot(2) | | Estimated
Full
Service
Equivalent
Rent
Per
Square
Foot | | Lease
Expiration
Date |
|---|
DOT—U.S. Government Tenant (GSA)(3) | | | 2006 | | | 1,503,112 | | | 60,233 | | $ | 40.07 | | $ | 1.98 | | $ | 42.05 | | 10/19/2021 |
5600 Fishers Lane—U.S. Government Tenant (GSA)(4) | | | 2015 | | | 935,386 | | | 29,715 | | | 31.77 | | | 2.54 | | | 34.31 | | 7/31/2030 |
NCI—U.S. Government Tenant (GSA)(5) | | | 2013 | | | 574,614 | | | 20,014 | | | 34.83 | | | 2.66 | | | 37.49 | | 2/6/2023 |
5601 Fishers Lane—U.S. Government Tenant (GSA)(6) | | | 2014 | | | 490,998 | | | 14,362 | | | 29.25 | | | 1.27 | | | 30.52 | | 3/26/2029 |
| | | | | | | | | | | | | | | | | | | | | |
Total | | | | | | 3,504,110 | | | 124,324 | | $ | 35.48 | | $ | 2.14 | | $ | 37.62 | | |
| | | | | | | | | | | | | | | | | | | | | |
| | | | | | | | | | | | | | | | | | | | | |
| | | | | | | | | | | | | | | | | | | | | |
Note: Table shown at 100 percent share.
- (1)
- Represents in place base rent before rent abatements, plus tenant reimbursements for the month ended March 31, 2016, multiplied by 12. Triple net leases are converted to a gross basis by adding tenant reimbursements to base rent. See "—Our Office Assets—Contractual Rent Abatement in Our Office Portfolio" for detail on rent abatements.
- (2)
- Represents management's estimate of utility expenses paid directly by tenant.
- (3)
- DOT—U.S. Government Tenant (GSA) lease is net of real estate taxes, electric and water.
- (4)
- 5600 Fishers Lane—U.S. Government Tenant (GSA) lease is net of electric, water and fuel.
- (5)
- NCI—U.S. Government Tenant (GSA) lease is net of electric, water and fuel.
- (6)
- 5601 Fishers Lane—U.S. Government Tenant (GSA) lease is net of electric, water and fuel.
�� We own the approximately 1.5 million square feet Class A office building in the heart of the Capitol Riverfront neighborhood that serves as headquarters to the U.S. Department of Transportation. We refer to this property as DOT. DOT is the only property in our operating portfolio that accounted for more than 10 percent of our total assets, based on book value, or more than 10 percent of our gross revenues as of and for the 12 months ended March 31, 2016. In addition, please see "—Case Studies—U.S. Department of Transportation Headquarters" for more information about this asset.
DOT is the only privately-owned, cabinet-level headquarters building in the nation. We competed and were awarded the opportunity to develop the build-to-suit facility in 2001 and completed the project in 2006. The project was designed by award-winning architectural firm Michael Graves & Associates to meet GSA's exacting security standards and includes custom tenant finishes. The complex is comprised of two interconnected office buildings and a modern fitness center and offers on-site dining and conference facilities. Each building features a full-height atrium that provides abundant natural light to building workspaces. The flexible architectural design is conducive to multi-tenant arrangements, should we desire to change the building's layout in the future. DOT is the 12th largest LEED Gold office building in the United States as reported by the Green Building Information Gateway and includes a three acre "green roof."
Except for 1,945 square feet of retail storefront leased to Starbucks and 1,898 square feet of office space used as a management office, the entire building is leased through October 2021 to the U.S. Department of Transportation, net of utilities and taxes, with two percent escalating rents per year, and an 11-year extension option. As of March 31, 2016, the annualized rent under this lease was
58
$40.07 per rentable square foot with the tenant paying its electricity costs directly. The U.S. Department of Transportation has been the sole non-retail tenant, excluding the management office, since the building's completion. Over the past five years, the building has been 100 percent occupied and had an average annualized rent per square foot of $36.49 in 2011, $37.18 in 2012, $38.02 in 2013. $39.24 in 2014 and $39.29 in 2015.
The U.S. government tenant has invested significant capital in improvements and space customization. We believe that this tenant investment increases the likelihood that the tenant will exercise its extension option. The payment obligations on the building's lease are supported by the full faith and credit of the federal government and are not subject to the congressional approval process.
We believe that the property has significant additional revenue potential if DOT renews its lease for several reasons. First, the actual BOMA measurement for the building is approximately 150,000 square feet more than the square footage agreed to in the original lease so a significant increase in the lease square footage may be possible. Second, the existing lease renewal provisions contemplates an increase in the rent to the greater of (i) 95 percent of a market rental rate, or (ii) the base rent in effect during the last year of the initial lease term plus actual operating expenses for the first year of the renewal term. We estimate the minimum annualized base rent (not including operating expenses, taxes and electricity) for the first year of the renewal term would be no less than $29.48 per square foot based upon the current lease contractual rent increases (estimated to total no less than approximately $45.00 per square foot when including actual operating expenses and real estate taxes) as compared to a current annualized rent of $40.07 per square foot in 2015 (including actual operating expenses and real estate taxes). GSA also has a one-time option to purchase the building at 95 percent of market value and would need to notify us of its intention to purchase the building no later than 36 months prior to the primary term lease expiration. An appraisal process would be used to determine the market value.
We believe that it is unlikely that GSA would exercise this right, given that GSA has rarely exercised similar options in the past, but there can be no assurance that this will be the case.
The following table sets forth information on the mortgage that encumbers the property.
| | | | | | | | | | | | |
Loan | | Principal
Balance | | Current
Annual
Interest
Rate | | Maturity
Date | | Balance
Due at
Maturity | |
|---|
DOT Headquarters A-1 | | $ | 326.0 | | | 6.00 | % | 12/2/21 | | $ | 326.0 | |
DOT Headquarters A-2 | | $ | 98.8 | | | 5.27 | % | 12/2/21 | | | — | |
| | | | | | | | | | | | | |
Portfolio Total/Weighted Average | | $ | 424.8 | | | 5.82 | % | | | $ | 326.0 | |
| | | | | | | | | | | | | |
| | | | | | | | | | | | | |
| | | | | | | | | | | | | |
The A-1 note is interest only. The A-2 note amortizes over the life of the loan based on a 15 year schedule. The notes are open to prepayment, subject to defeasance.
The following table sets forth for the property and each component thereof upon which depreciation is taken the (i) federal tax basis, (ii) rate, (iii) method, and (iv) life claimed with respect to the property or component thereof for purposes of depreciation:
| | | | | | | | |
Federal Tax Basis
(unaudited in millions) | | Rate | | Method | | Life Claimed |
|---|
| $ | 482.0 | | | 2.5 | % | Straight Line | | 40 Years |
The 2015 tax rate for this property was $1.85 per $100 of assessed value, or $11,821,974 in property taxes for the 2015 tax year. In the opinion of our management, the property will be adequately covered by insurance.
59
Our Multifamily Assets
We have a high-quality portfolio of multifamily assets consisting of 19 multifamily assets, over 5.6 million RSF and 6,517 units as of March 31, 2016. Our multifamily assets comprise 34.5 percent of our total operating portfolio rentable square feet. Within our multifamily asset class, we operate both mid/high-rise and garden-style multifamily subcategory types and we own interests in 2,501 mid/high-rise units (approximately 2.1 million RSF) and 4,016 garden-style units (over 3.5 million RSF) as of March 31, 2016. Additionally, our mid/high-rise multifamily portfolio has four assets under construction and six assets in pre-development, representing over 1.8 million square feet.
Within the mid/high-rise subcategory type, our development team has designed and constructed over 6,100 units since 2000. Our strategy involves integrating retail amenities into our multifamily assets to help bolster leasing interest, velocity and rental rates. Our design and leasing teams focus considerable creative and analytic resources to identify highly-valued tenant amenities and use this information to design and develop innovative and valuable multifamily assets. Our mid/high-rise units consistently achieve a premium to market, and our stabilized assets were on average 93.7 percent leased as of March 31, 2016, based on units.
We also own interests in 4,016 garden-style multifamily units in urban infill markets that provide stable cash flows with significant growth opportunities through organic rental rate growth, renovation opportunities and potential redevelopment. The average monthly asking rent per unit in our garden-style assets was $1,465, which was $562, or approximately 27.7 percent, lower than the average monthly asking rent per unit for mid/high-rise units in the same submarkets in which our garden-style assets are located. We believe this discount to mid/high-rise units is a significant value proposition for tenants and leads to strong demand for this subcategory within the multifamily asset class. This dynamic, coupled with recent supply and demand imbalance, is expected to support organic rental rate growth in our garden-style multifamily portfolio. Additionally, these units and certain units in our mid/high-rise assets offer attractive rent growth opportunities to be realized through unit renovations. We have renovated 104 units and averaged a per unit rental increase of approximately $198 per month and averaged an unlevered yield on cost of 19.9 percent per unit. Moreover, several of our garden-style assets also present future redevelopment opportunities in the form of higher density uses in neighborhoods that we have targeted for Placemaking™ activity, and we have procured zoning approvals for potential density of approximately 4.4 million square feet across these assets.
Our multifamily lease terms generally range from three to twenty-four months for new leases, with the majority of new leases having terms of twelve months. Prior to the expiration of their lease, residents are provided lease renewal options ranging from three to fifteen months, with rental rates dependent on our assessment of prevailing market conditions. Residents can opt to vacate at the expiration of their current lease, continue their lease on a month-to-month basis or select a renewal option.
60
The following table presents information related to the recently completed renovations at four of our garden-style multifamily assets and one mid/high-rise multifamily asset.
| | | | | | | | | | | | | | | | | | | | | | | | | | | | |
| |
| |
| |
| | Per Unit | | Asset Totals | |
| |
|---|
Multifamily Asset | | Percent
Ownership | | Total
Units | | Completed
Renovations | | In-Place
Monthly
Rents as of
March 31,
2016 | | Monthly
Renovation
Premium | | Renovation
Cost | | Annualized
Rent
Premium(1) | | Total
Renovation
Cost | | Yield
on
Cost(1)(2) | |
|---|
Charter Oak | | | 100.0 | % | | 262 | | | 41 | | $ | 1,546 | | $ | 242 | | $ | 16,224 | | $ | 119,064 | | $ | 665,184 | | | 17.9 | % |
Falkland Chase—South & West | | | 100.0 | % | | 268 | | | 26 | | | 1,728 | | | 185 | | | 10,894 | | | 57,720 | | | 283,244 | | | 20.4 | % |
Bennington Crossings | | | 100.0 | % | | 308 | | | 21 | | | 1,397 | | | 170 | | | 7,552 | | | 42,720 | | | 158,582 | | | 26.9 | % |
The Gale | | | 5.0 | % | | 603 | | | 8 | | | 2,140 | | | 56 | | | 3,167 | | | 5,400 | | | 25,335 | | | 21.3 | % |
Hillwood | | | 100.0 | % | | 601 | | | 8 | | | 1,410 | | | 225 | | | 13,459 | | | 21,600 | | | 107,672 | | | 20.1 | % |
| | | | | | | | | | | | | | | | | | | | | | | | | | | | | |
Total/Weighted Average | | | | | | 2,042 | | | 104 | | $ | 1,596 | | $ | 198 | | $ | 11,923 | | $ | 246,504 | | $ | 1,240,017 | | | 19.9 | % |
| | | | | | | | | | | | | | | | | | | | | | | | | | | | | |
| | | | | | | | | | | | | | | | | | | | | | | | | | | | | |
| | | | | | | | | | | | | | | | | | | | | | | | | | | | | |
- (1)
- Figures assume assets are 100 percent leased and do not contemplate a vacancy factor.
- (2)
- Based on annualized rent premium as a percent of total renovation cost. We calculate a renovated and/or repositioned unit's annualized rent premium by multiplying the estimated monthly renovation premium by 12.
Our Retail Assets
Our operating retail portfolio is comprised of 15 assets and approximately 1.5 million RSF representing approximately 9.1 percent of our total operating portfolio square footage as of March 31, 2016. These 15 assets were 91.9 percent leased and 87.8 percent occupied as of March 31, 2016.
Additionally, our retail portfolio has three assets under construction and two assets in pre-development, representing approximately 233,000 RSF. Our three retail assets under construction were 8.1 percent pre-leased as of March 31, 2016. Our two retail assets in pre-development were 35.4 percent pre-leased as of March 31, 2016.
Our retail assets are generally located in premier retail corridors with attractive population densities and high disposable income, a diverse tenant base and high pedestrian traffic. We focus our retail investments on anchored centers in urban infill submarkets, with many of our retail assets anchored by a grocery store. We have relationships with major grocers in the DC Metro area, having executed leases with Whole Foods Market, Harris Teeter, Giant, Safeway, and Trader Joe's, among others. In addition to major grocers, our retail tenants include Walmart, Container Store, CVS, Walgreens and multiple other national and local retailers. In addition, we believe our office and multifamily rental rates reflect a significant premium attributable to the presence of thoughtfully-selected retail amenities, and we strive to incorporate, where possible, high-quality, value-creating retail space into our office and multifamily assets. As of March 31, 2016, we had over 303,000 RSF of retail space integrated into our operating office and multifamily assets.
As of March 31, 2016, no single tenant other than Walgreens and Wal-Mart, which accounted for 9.3 percent and 6.9 percent, respectively, of our share of total annualized rent for our retail portfolio accounted for more than 3.9 percent of our share of total annualized rent for our retail
61
portfolio as of March 31, 2016. The following table sets forth information regarding the 20 largest tenants in our retail portfolio based on annualized rent as of March 31, 2016:
| | | | | | | | | | | | | | | | | | | | | | | | | | | | | | |
| |
| |
| | At 100 Percent Share | | At JBG Share(1) | |
|---|
Tenant | | Number
of
Leases | | Rentable
Square
Feet | | Percent
of Total
Rentable
Square
Feet | | Annualized
Rent(2) | | Percent
of Total
Annualized
Rent | | Rentable
Square
Feet | | Percent
of Total
Rentable
Square
Feet | | Annualized
Rent(2) | | Percent
of Total
Annualized
Rent | |
|---|
1 | | Walgreen Co. | | | 3 | | | 48,476 | | | 3.6 | % | $ | 2,162,113 | | | 5.2 | % | | 47,991 | | | 6.5 | % | $ | 2,140,492 | | | 9.3 | % |
2 | | Wegman's Food Markets, Inc. | | | 1 | | | 138,500 | | | 10.4 | % | | 2,139,459 | | | 5.1 | % | | 13,850 | | | 1.9 | % | | 213,946 | | | 0.9 | % |
3 | | Giant of Maryland LLC | | | 1 | | | 66,805 | | | 5.0 | % | | 2,136,018 | | | 5.1 | % | | 9,820 | | | 1.3 | % | | 313,995 | | | 1.4 | % |
4 | | Safeway Inc. | | | 1 | | | 62,753 | | | 4.7 | % | | 1,754,574 | | | 4.2 | % | | 1,130 | | | 0.2 | % | | 31,582 | | | 0.1 | % |
5 | | Wal-Mart | | | 1 | | | 121,196 | | | 9.1 | % | | 1,600,256 | | | 3.8 | % | | 120,432 | | | 16.2 | % | | 1,590,164 | | | 6.9 | % |
6 | | Sport and Health Virginia Prop | | | 1 | | | 42,401 | | | 3.2 | % | | 1,145,099 | | | 2.7 | % | | 4,240 | | | 0.6 | % | | 114,510 | | | 0.5 | % |
7 | | H Mart Centerville LLC | | | 1 | | | 45,478 | | | 3.4 | % | | 903,228 | | | 2.2 | % | | 45,023 | | | 6.1 | % | | 894,196 | | | 3.9 | % |
8 | | RK Spa World LLC | | | 1 | | | 27,315 | | | 2.1 | % | | 802,563 | | | 1.9 | % | | 27,042 | | | 3.6 | % | | 794,537 | | | 3.5 | % |
9 | | Recreational Equipment Inc. | | | 1 | | | 25,218 | | | 1.9 | % | | 681,972 | | | 1.6 | % | | 2,522 | | | 0.3 | % | | 68,197 | | | 0.3 | % |
10 | | Global Food | | | 1 | | | 32,183 | | | 2.4 | % | | 669,775 | | | 1.6 | % | | 32,183 | | | 4.3 | % | | 669,775 | | | 2.9 | % |
11 | | Container Store | | | 1 | | | 19,120 | | | 1.4 | % | | 650,000 | | | 1.6 | % | | 18,929 | | | 2.5 | % | | 643,500 | | | 2.8 | % |
12 | | U.S. Government (GSA) | | | 2 | | | 16,013 | | | 1.2 | % | | 599,574 | | | 1.4 | % | | 7,846 | | | 1.1 | % | | 293,763 | | | 1.3 | % |
13 | | PNC Bank | | | 1 | | | 3,750 | | | 0.3 | % | | 563,494 | | | 1.3 | % | | 375 | | | 0.1 | % | | 56,349 | | | 0.2 | % |
14 | | Bank of America | | | 1 | | | 4,500 | | | 0.3 | % | | 534,213 | | | 1.3 | % | | 4,500 | | | 0.6 | % | | 534,213 | | | 2.3 | % |
15 | | Uncle Julio's Rio Grande Café | | | 1 | | | 10,820 | | | 0.8 | % | | 493,583 | | | 1.2 | % | | 1,082 | | | 0.1 | % | | 49,358 | | | 0.2 | % |
16 | | Golfsmith USA, LLC | | | 1 | | | 18,406 | | | 1.4 | % | | 438,113 | | | 1.0 | % | | 1,841 | | | 0.2 | % | | 43,811 | | | 0.2 | % |
17 | | World Gym | | | 1 | | | 27,035 | | | 2.0 | % | | 405,385 | | | 1.0 | % | | 26,765 | | | 3.6 | % | | 401,331 | | | 1.7 | % |
18 | | Coco Houseware, Inc. | | | 1 | | | 16,443 | | | 1.2 | % | | 395,017 | | | 0.9 | % | | 16,279 | | | 2.2 | % | | 391,067 | | | 1.7 | % |
19 | | DSW Shoe Warehouse, Inc. | | | 1 | | | 17,688 | | | 1.3 | % | | 393,765 | | | 0.9 | % | | 1,769 | | | 0.2 | % | | 39,377 | | | 0.2 | % |
20 | | Ulta Salon Cosmetics & Fragrance | | | 1 | | | 11,609 | | | 0.9 | % | | 385,643 | | | 0.9 | % | | 1,161 | | | 0.2 | % | | 38,564 | | | 0.2 | % |
| | Other | | | 220 | | | 574,515 | | | 43.2 | % | | 23,054,935 | | | 55.0 | % | | 358,622 | | | 48.2 | % | | 13,619,063 | | | 59.4 | % |
| | | | | | | | | | | | | | | | | | | | | | | | | | | | | | | |
| | Total In-Place Leases | | | 243 | | | 1,330,224 | | | 100.0 | % | $ | 41,908,779 | | | 100.0 | % | | 743,402 | | | 100.0 | % | $ | 22,941,790 | | | 100.0 | % |
| | | | | | | | | | | | | | | | | | | | | | | | | | | | | | | |
| | | | | | | | | | | | | | | | | | | | | | | | | | | | | | | |
| | | | | | | | | | | | | | | | | | | | | | | | | | | | | | | |
| | Available | | | — | | | 127,414 | | | | | | | | | | | | 55,219 | | | | | | | | | | |
| | Signed Leases Not Commenced | | | 25 | | | 67,946 | | | | | | | | | | | | 28,856 | | | | | | | | | | |
| | Building Management Use | | | 3 | | | 15,454 | | | | | | | | | | | | 7,572 | | | | | | | | | | |
| | | | | | | | | | | | | | | | | | | | | | | | | | | | | | | |
| | Total | | | 271 | | | 1,541,038 | | | | | | | | | | | | 835,049 | | | | | | | | | | |
| | | | | | | | | | | | | | | | | | | | | | | | | | | | | | | |
| | | | | | | | | | | | | | | | | | | | | | | | | | | | | | | |
| | | | | | | | | | | | | | | | | | | | | | | | | | | | | | | |
- (1)
- Reflects our pro rata share of joint venture assets.
- (2)
- Represents in place base rent and percentage rent before abatements, plus tenant reimbursements for the month ended March 31, 2016 multiplied by 12. Triple net leases are converted to a gross basis by adding tenant reimbursements to base rent. See "—Contractual Rent Abatement in Our Retail Portfolio" for detail on rent abatements.
62
As of March 31, 2016, our retail portfolio was leased to a variety of industries. Our largest categories of tenants (based on SIC codes) were Food and Beverage, Miscellaneous Retail (which includes drug stores, such as CVS and Walgreens), Food Stores and Personal Services which accounted for 23.2 percent, 16.8 percent, 13.6 percent and 9.5 percent, respectively, of our share of total annualized rent for our retail portfolio. No other industry accounted for more than 8.3 percent of our share of total annualized rent for our retail portfolio as of March 31, 2016. The following table sets forth information regarding the ten largest industries in our retail portfolio based on annualized rent as of March 31, 2016:
| | | | | | | | | | | | | | | | | | | | | | | | | | | | | | |
| |
| |
| | At 100 Percent Share | | At JBG Share(1) | |
|---|
Industry | | Number
of
Leases | | Rentable
Square
Feet | | Percent
of Total
Rentable
Square
Feet | | Annualized
Rent(2) | | Percent
of Total
Annualized
Rent | | Rentable
Square
Feet | | Percent
of Total
Rentable
Square
Feet | | Annualized
Rent(2) | | Percent
of Total
Annualized
Rent | |
|---|
1 | | Food and Beverage | | | 78 | | | 176,195 | | | 13.2 | % | $ | 9,123,351 | | | 21.8 | % | | 105,747 | | | 14.2 | % | $ | 5,316,217 | | | 23.2 | % |
2 | | Food Stores | | | 13 | | | 389,240 | | | 29.3 | % | | 8,605,130 | | | 20.5 | % | | 144,907 | | | 19.5 | % | | 3,111,077 | | | 13.6 | % |
3 | | Miscellaneous Retail | | | 34 | | | 187,008 | | | 14.1 | % | | 6,432,117 | | | 15.3 | % | | 101,517 | | | 13.7 | % | | 3,862,828 | | | 16.8 | % |
4 | | Apparel and Accessory Stores | | | 31 | | | 113,405 | | | 8.5 | % | | 3,665,371 | | | 8.7 | % | | 35,949 | | | 4.8 | % | | 1,238,715 | | | 5.4 | % |
5 | | Personal Services | | | 28 | | | 72,951 | | | 5.5 | % | | 2,949,528 | | | 7.0 | % | | 56,622 | | | 7.6 | % | | 2,187,071 | | | 9.5 | % |
6 | | Depository Institutions | | | 9 | | | 26,454 | | | 2.0 | % | | 2,147,428 | | | 5.1 | % | | 13,048 | | | 1.8 | % | | 1,054,260 | | | 4.6 | % |
7 | | Amusement & Recreation Service | | | 3 | | | 143,181 | | | 10.8 | % | | 1,923,989 | | | 4.6 | % | | 142,197 | | | 19.1 | % | | 1,910,660 | | | 8.3 | % |
8 | | General Merchandise Stores | | | 4 | | | 73,634 | | | 5.5 | % | | 1,721,352 | | | 4.1 | % | | 31,563 | | | 4.2 | % | | 537,422 | | | 2.3 | % |
9 | | Furniture & Homefurnish Stores | | | 3 | | | 37,863 | | | 2.8 | % | | 1,141,253 | | | 2.7 | % | | 37,484 | | | 5.0 | % | | 1,129,840 | | | 4.9 | % |
10 | | Health Services | | | 6 | | | 9,784 | | | 0.7 | % | | 601,651 | | | 1.4 | % | | 6,229 | | | 0.8 | % | | 307,530 | | | 1.3 | % |
| | Other | | | 34 | | | 100,509 | | | 7.6 | % | | 3,597,609 | | | 8.6 | % | | 68,139 | | | 9.2 | % | | 2,286,170 | | | 10.0 | % |
| | | | | | | | | | | | | | | | | | | | | | | | | | | | | | | |
| | Total In-Place Leases | | | 243 | | | 1,330,224 | | | 100.0 | % | $ | 41,908,779 | | | 100.0 | % | | 743,402 | | | 100.0 | % | $ | 22,941,790 | | | 100.0 | % |
| | | | | | | | | | | | | | | | | | | | | | | | | | | | | | | |
| | | | | | | | | | | | | | | | | | | | | | | | | | | | | | | |
| | | | | | | | | | | | | | | | | | | | | | | | | | | | | | | |
| | Available | | | — | | | 127,414 | | | | | | | | | | | | 55,219 | | | | | | | | | | |
| | Signed Leases Not Commenced | | | 25 | | | 67,946 | | | | | | | | | | | | 28,856 | | | | | | | | | | |
| | Building Management Use | | | 3 | | | 15,454 | | | | | | | | | | | | 7,572 | | | | | | | | | | |
| | | | | | | | | | | | | | | | | | | | | | | | | | | | | | | |
| | Total | | | 271 | | | 1,541,038 | | | | | | | | | | | | 835,049 | | | | | | | | | | |
| | | | | | | | | | | | | | | | | | | | | | | | | | | | | | | |
| | | | | | | | | | | | | | | | | | | | | | | | | | | | | | | |
| | | | | | | | | | | | | | | | | | | | | | | | | | | | | | | |
- (1)
- Reflects our pro rata share of joint venture assets.
- (2)
- Represents in place base rent and percentage rent before abatements, plus tenant reimbursements for the month ended March 31, 2016 multiplied by 12. Triple net leases are converted to a gross basis by adding tenant reimbursements to base rent. See "—Contractual Rent Abatement in Our Retail Portfolio" for detail on rent abatements.
63
The following table sets forth a summary schedule of the lease expirations for leases in place as of March 31, 2016 at the assets in our retail portfolio. The information set forth in the table assumes that tenants exercise no renewal options:
| | | | | | | | | | | | | | | | | | | | | | | | | |
| |
| | At 100
Percent
Share | | At JBG Share(1) | |
|---|
Year of Lease Expiration | | Number
of
Leases | | Rentable
Square
Feet | | Rentable
Square
Feet | | Percent
of Total
Rentable
Square
Feet | | Annualized
Rent(2) | | Percent of Total
Annualized Rent | | Annualized Rent
Per Square Foot | | Estimated
Annualized Rent
Per Square Foot
at Expiration(3) | |
|---|
Month to Month | | | 5 | | | 7,670 | | | 7,392 | | | 1.0 | % | $ | 476,123 | | | 2.1 | % | $ | 64.41 | | $ | 64.41 | |
2016 (April 1, 2016 to December 31, 2016) | | | 9 | | | 9,428 | | | 7,173 | | | 1.0 | % | | 257,991 | | | 1.1 | % | | 35.97 | | | 35.98 | |
2017 | | | 22 | | | 55,684 | | | 53,097 | | | 7.1 | % | | 1,838,261 | | | 8.0 | % | | 34.62 | | | 32.80 | |
2018 | | | 14 | | | 32,372 | | | 20,442 | | | 2.7 | % | | 890,660 | | | 3.9 | % | | 43.57 | | | 45.70 | |
2019 | | | 21 | | | 116,629 | | | 107,925 | | | 14.5 | % | | 3,061,661 | | | 13.3 | % | | 28.37 | | | 32.85 | |
2020 | | | 37 | | | 102,836 | | | 52,996 | | | 7.1 | % | | 1,993,830 | | | 8.7 | % | | 37.62 | | | 41.73 | |
2021 | | | 22 | | | 43,253 | | | 25,823 | | | 3.5 | % | | 1,315,268 | | | 5.7 | % | | 50.93 | | | 58.01 | |
2022 | | | 25 | | | 92,222 | | | 38,247 | | | 5.1 | % | | 1,340,903 | | | 5.8 | % | | 35.06 | | | 40.48 | |
2023 | | | 16 | | | 112,172 | | | 14,827 | | | 2.0 | % | | 468,944 | | | 2.0 | % | | 31.63 | | | 36.70 | |
2024 | | | 18 | | | 102,188 | | | 81,601 | | | 11.0 | % | | 1,895,951 | | | 8.3 | % | | 23.23 | | | 27.24 | |
Thereafter | | | 54 | | | 655,770 | | | 333,878 | | | 44.9 | % | | 9,402,199 | | | 41.0 | % | | 28.16 | | | 35.56 | |
| | | | | | | | | | | | | | | | | | | | | | | | | | |
Total In-Place Leases | | | 243 | | | 1,330,224 | | | 743,401 | | | 100.0 | % | $ | 22,941,791 | | | 100.0 | % | $ | 30.86 | | $ | 36.12 | |
| | | | | | | | | | | | | | | | | | | | | | | | | | |
| | | | | | | | | | | | | | | | | | | | | | | | | | |
| | | | | | | | | | | | | | | | | | | | | | | | | | |
Available | | | — | | | 127,414 | | | 55,219 | | | | | | | | | | | | | | | | |
Signed leases not commenced | | | 25 | | | 67,946 | | | 28,856 | | | | | | | | | | | | | | | | |
Building Management Use | | | 3 | | | 15,454 | | | 7,572 | | | | | | | | | | | | | | | | |
| | | | | | | | | | | | | | | | | | | | | | | | | | |
Total | | | 271 | | | 1,541,038 | | | 835,048 | | | | | | | | | | | | | | | | |
| | | | | | | | | | | | | | | | | | | | | | | | | | |
| | | | | | | | | | | | | | | | | | | | | | | | | | |
| | | | | | | | | | | | | | | | | | | | | | | | | | |
- (1)
- Reflects our pro rata share of joint venture assets.
- (2)
- Represents in place base rent and percentage rent before abatements, plus tenant reimbursements for the month ended March 31, 2016 multiplied by 12. Triple net leases are converted to a gross basis by adding tenant reimbursements to base rent. See "—Contractual Rent Abatement in Our Retail Portfolio" for detail on rent abatements.
- (3)
- Represents in place base rent before abatements, plus management's estimate of tenant reimbursements, as of lease expiration multiplied by 12 and divided by rentable square feet. Triple net leases are converted to a gross basis by adding tenant reimbursements to base rent. Tenant reimbursements at lease expiration are estimated by escalating tenant reimbursements as of March 31, 2016, or management's estimate thereof, by two and three-quarters percent annually through the lease expiration year.
64
The following table sets forth information relating to leases signed but not commenced in our retail portfolio as of March 31, 2016.
| | | | | | | | | | | | | | | | | | | | | | |
| |
| |
| |
| | At 100 Percent Share | | At JBG Share(1) | |
|---|
| |
| | Estimated
Lease
Commencement
Date | | Estimated
Lease
Expiration
Date | |
|---|
Retail Asset | | Percent
Ownership | | Rentable
Square
Feet | | Annualized
Rent(2) | | Rentable
Square
Feet | | Annualized
Rent(2) | |
|---|
Stabilized | | | | | | | | | | | | | | | | | | | | | | |
Galvan Retail | | | 1.8 | % | | May-16 | | | May-26 | | | 10,000 | | $ | 450,000 | | | 180 | | $ | 8,100 | |
Galvan Retail | | | 1.8 | % | | Dec-16 | | | Nov-26 | | | 2,523 | | | 186,954 | | | 45 | | | 3,365 | |
Galvan Retail | | | 1.8 | % | | Apr-16 | | | Mar-26 | | | 2,195 | | | 180,758 | | | 40 | | | 3,254 | |
Galvan Retail | | | 1.8 | % | | Sep-16 | | | Aug-26 | | | 2,000 | | | 156,200 | | | 36 | | | 2,812 | |
Galvan Retail | | | 1.8 | % | | Apr-16 | | | Mar-26 | | | 1,672 | | | 113,387 | | | 30 | | | 2,041 | |
Galvan Retail | | | 1.8 | % | | Apr-16 | | | Apr-26 | | | 1,560 | | | 109,356 | | | 28 | | | 1,968 | |
Galvan Retail | | | 1.8 | % | | Jun-16 | | | Jun-26 | | | 1,505 | | | 99,480 | | | 27 | | | 1,791 | |
Galvan Retail | | | 1.8 | % | | Oct-16 | | | Sep-21 | | | 1,560 | | | 72,972 | | | 28 | | | 1,313 | |
Stonebridge at Potomac Town Center—Phase I | | | 10.0 | % | | Aug-16 | | | Jul-26 | | | 4,040 | | | 200,877 | | | 404 | | | 20,088 | |
Stonebridge at Potomac Town Center—Phase I | | | 10.0 | % | | Jun-16 | | | May-26 | | | 2,269 | | | 120,983 | | | 227 | | | 12,098 | |
Takoma-Langley Crossroads Center | | | 99.0 | % | | Jun-16 | | | Sep-28 | | | 5,488 | | | 192,080 | | | 5,432 | | | 190,159 | |
Takoma-Langley Crossroads Center | | | 99.0 | % | | Nov-16 | | | Oct-34 | | | 2,111 | | | 128,800 | | | 2,090 | | | 127,512 | |
Fort Totten Square Retail | | | 99.4 | % | | Sep-16 | | | Jan-27 | | | 3,870 | | | 154,800 | | | 3,846 | | | 153,824 | |
Fort Totten Square Retail | | | 99.4 | % | | Oct-16 | | | Sep-26 | | | 2,257 | | | 125,399 | | | 2,243 | | | 124,608 | |
L'Enfant Plaza Retail—West | | | 49.0 | % | | Jul-16 | | | Jun-26 | | | 1,967 | | | 135,736 | | | 964 | | | 66,504 | |
L'Enfant Plaza Retail—West | | | 49.0 | % | | Oct-16 | | | Sep-26 | | | 2,002 | | | 70,070 | | | 981 | | | 34,331 | |
L'Enfant Plaza Retail—West | | | 49.0 | % | | Jan-17 | | | Dec-26 | | | 8,888 | | | 44,440 | | | 4,355 | | | 21,773 | |
North End Retail I | | | 100.0 | % | | Jul-16 | | | Jun-21 | | | 2,574 | | | 128,808 | | | 2,574 | | | 128,808 | |
Old Centreville Crossing | | | 99.0 | % | | May-16 | | | May-26 | | | 1,200 | | | 58,200 | | | 1,188 | | | 57,618 | |
The Terano | | | 1.8 | % | | Jul-16 | | | Nov-20 | | | 1,500 | | | 41,668 | | | 27 | | | 750 | |
The Gale | | | 5.0 | % | | Aug-16 | | | Jul-23 | | | 1,200 | | | 36,000 | | | 60 | | | 1,800 | |
| | | | | | | | | | | | | | | | | | | | | | | |
Total | | | | | | | | | | | | 62,381 | | $ | 2,806,968 | | | 24,805 | | $ | 964,517 | |
| | | | | | | | | | | | | | | | | | | | | | | |
Recently Acquired/Delivered/Renovated | | | | | | | | | | | | | | | | | | | | | | |
Atlantic Plumbing | | | 64.0 | % | | Jun-16 | | | Jun-26 | | | 2,188 | | $ | 142,264 | | | 1,400 | | $ | 91,049 | |
Atlantic Plumbing | | | 64.0 | % | | Jul-16 | | | Jun-26 | | | 1,977 | | | 98,850 | | | 1,265 | | | 63,264 | |
Pikesville Walgreens | | | 99.0 | % | | Jun-16 | | | Dec-25 | | | 1,400 | | | 32,824 | | | 1,386 | | | 32,496 | |
| | | | | | | | | | | | | | | | | | | | | | | |
Total | | | | | | | | | | | | 5,565 | | $ | 273,938 | | | 4,051 | | $ | 186,809 | |
| | | | | | | | | | | | | | | | | | | | | | | |
Total Operating | | | | | | | | | | | | 67,946 | | $ | 3,080,906 | | | 28,856 | | $ | 1,151,326 | |
| | | | | | | | | | | | | | | | | | | | | | ��� | |
| | | | | | | | | | | | | | | | | | | | | | | |
| | | | | | | | | | | | | | | | | | | | | | | |
Construction | | | | | | | | | | | | | | | | | | | | | | |
RTC—West Retail | | | 100.0 | % | | Oct-17 | | | Oct-27 | | | 9,673 | | $ | 580,380 | | | 9,673 | | $ | 580,380 | |
RTC—West Retail | | | 100.0 | % | | Jul-17 | | | Jul-27 | | | 2,124 | | | 168,858 | | | 2,124 | | | 168,858 | |
7770 Norfolk | | | 79.9 | % | | Apr-17 | | | Mar-27 | | | 3,020 | | | 222,081 | | | 2,414 | | | 177,506 | |
7770 Norfolk | | | 79.9 | % | | May-17 | | | Apr-27 | | | 2,622 | | | 179,992 | | | 2,096 | | | 143,865 | |
13th & U Street | | | 100.0 | % | | Feb-17 | | | Jan-42 | | | 8,438 | | | 147,759 | | | 8,438 | | | 147,759 | |
| | | | | | | | | | | | | | | | | | | | | | | |
Total | | | | | | | | | | | | 25,877 | | $ | 1,299,070 | | | 24,745 | | $ | 1,218,368 | |
| | | | | | | | | | | | | | | | | | | | | | | |
Pre-Development & Land | | | | | | | | | | | | | | | | | | | | | | |
Tysons West—Phase II | | | 86.8 | % | | Sep-20 | | | Sep-35 | | | 25,610 | | $ | 1,603,430 | | | 22,222 | | $ | 1,391,299 | |
51 N Street | | | 30.0 | % | | Nov-18 | | | Oct-33 | | | 33,000 | | | 1,287,000 | | | 9,900 | | | 386,100 | |
965 Florida Avenue | | | 70.0 | % | | Jan-20 | | | Jan-40 | | | 40,075 | | | 1,182,213 | | | 28,053 | | | 827,549 | |
Upper Rock Retail | | | 100.0 | % | | Jan-17 | | | Mar-42 | | | 14,600 | | | 546,000 | | | 14,600 | | | 546,000 | |
Upper Rock Retail | | | 100.0 | % | | Jun-17 | | | Jun-26 | | | 16,000 | | | 472,000 | | | 16,000 | | | 472,000 | |
| | | | | | | | | | | | | | | | | | | | | | | |
Total | | | | | | | | | | | | 129,285 | | $ | 5,090,643 | | | 90,775 | | $ | 3,622,948 | |
| | | | | | | | | | | | | | | | | | | | | | | |
Total | | | | | | | | | | | | 223,108 | | $ | 9,470,619 | | | 144,378 | | $ | 5,992,642 | |
| | | | | | | | | | | | | | | | | | | | | | | |
| | | | | | | | | | | | | | | | | | | | | | | |
| | | | | | | | | | | | | | | | | | | | | | | |
Note: Table only includes leases for space that was vacant as of March 31, 2016.
- (1)
- Reflects our pro rata share of joint venture assets.
- (2)
- Represents base rent before abatements, plus tenant reimbursements for the month in which the lease commences, multiplied by 12. Triple net leases are converted to a gross basis by adding tenant reimbursements to base rent. See "—Contractual Rent Abatement in Our Retail Portfolio" for detail on rent abatements.
65
The following tables set forth information relating to contractual rent abatements in our retail portfolio as of March 31, 2016, at 100 percent share and our share, respectively:
| | | | | | | | | | | | | | | | | | | | | | |
| |
| | At 100 Percent Share | |
|---|
| |
| | Quarter Ending:(1) | |
|---|
Retail Asset | | Percent
Ownership | | June 30,
2016 | | September 30,
2016 | | December 31,
2016 | | March 31,
2017 | | June 30,
2017 | | September 30,
2017 | |
|---|
Stabilized | | | | | | | | | | | | | | | | | | | | | | |
North End Retail I | | | 100.0 | % | $ | 55,037 | | $ | 45,305 | | $ | 18,959 | | $ | 5,234 | | $ | 5,234 | | $ | 5,234 | |
L'Enfant Plaza Retail—West | | | 49.0 | % | | 38,576 | | | — | | | — | | | 11,110 | | | 7,407 | | | — | |
The Alaire | | | 18.0 | % | | 13,563 | | | 11,613 | | | 11,613 | | | 11,613 | | | 11,613 | | | 11,613 | |
Galvan Retail | | | 1.8 | % | | 11,976 | | | 25,012 | | | — | | | — | | | — | | | — | |
Takoma-Langley Crossroads Center | | | 99.0 | % | | 6,631 | | | 6,631 | | | — | | | — | | | — | | | — | |
Old Centreville Crossing | | | 99.0 | % | | 3,000 | | | 6,000 | | | 1,000 | | | — | | | — | | | — | |
| | | | | | | | | | | | | | | | | | | | | | | |
Total | | | | | $ | 128,783 | | $ | 94,561 | | $ | 31,572 | | $ | 27,957 | | $ | 24,254 | | $ | 16,847 | |
| | | | | | | | | | | | | | | | | | | | | | | |
Recently Acquired/Delivered/Renovated | | | | | | | | | | | | | | | | | | | | | | |
Atlantic Plumbing | | | 64.0 | % | $ | 18,445 | | $ | 21,650 | | $ | 13,413 | | $ | — | | $ | — | | $ | — | |
The Terano | | | 1.8 | % | | — | | | 2,500 | | | — | | | — | | | — | | | — | |
| | | | | | | | | | | | | | | | | | | | | | | |
Total | | | | | $ | 18,445 | | $ | 24,150 | | $ | 13,413 | | $ | — | | $ | — | | $ | — | |
| | | | | | | | | | | | | | | | | | | | | | | |
Pre-Development | | | | | | | | | | | | | | | | | | | | | | |
Upper Rock Retail | | | 100.0 | % | $ | — | | $ | — | | $ | 100,000 | | $ | 100,000 | | $ | 64,000 | | $ | 96,000 | |
| | | | | | | | | | | | | | | | | | | | | | | |
Total | | | | | $ | — | | $ | — | | $ | 100,000 | | $ | 100,000 | | $ | 64,000 | | $ | 96,000 | |
| | | | | | | | | | | | | | | | | | | | | | | |
Total | | | | | $ | 147,228 | | $ | 118,711 | | $ | 144,984 | | $ | 127,957 | | $ | 88,254 | | $ | 112,847 | |
| | | | | | | | | | | | | | | | | | | | | | | |
| | | | | | | | | | | | | | | | | | | | | | | |
| | | | | | | | | | | | | | | | | | | | | | | |
- (1)
- Represents contractual rent abatements for in place and signed but not commenced leases.
| | | | | | | | | | | | | | | | | | | | | | |
| |
| | At JBG Share(1) | |
|---|
| |
| | Quarter Ending:(2) | |
|---|
Retail Asset | | Percent
Ownership | | June 30,
2016 | | September 30,
2016 | | December 31,
2016 | | March 31,
2017 | | June 30,
2017 | | September 30,
2017 | |
|---|
Stabilized | | | | | | | | | | | | | | | | | | | | | | |
North End Retail I | | | 100.0 | % | $ | 55,037 | | $ | 45,305 | | $ | 18,959 | | $ | 5,234 | | $ | 5,234 | | $ | 5,234 | |
L'Enfant Plaza Retail—West | | | 49.0 | % | | 18,900 | | | — | | | — | | | 5,443 | | | 3,629 | | | — | |
The Alaire | | | 18.0 | % | | 2,441 | | | 2,090 | | | 2,090 | | | 2,090 | | | 2,090 | | | 2,090 | |
Galvan Retail | | | 1.8 | % | | 216 | | | 450 | | | — | | | — | | | — | | | — | |
Takoma-Langley Crossroads Center | | | 99.0 | % | | 6,565 | | | 6,565 | | | — | | | — | | | — | | | — | |
Old Centreville Crossing | | | 99.0 | % | | 2,970 | | | 5,940 | | | 990 | | | — | | | — | | | — | |
| | | | | | | | | | | | | | | | | | | | | | | |
Total | | | | | $ | 86,129 | | $ | 60,350 | | $ | 22,039 | | $ | 12,767 | | $ | 10,953 | | $ | 7,324 | |
| | | | | | | | | | | | | | | | | | | | | | | |
Recently Acquired/Delivered/Renovated | | | | | | | | | | | | | | | | | | | | | | |
Atlantic Plumbing | | | 64.0 | % | $ | 11,805 | | $ | 13,856 | | $ | 8,584 | | $ | — | | $ | — | | $ | — | |
The Terano | | | 1.8 | % | | — | | | 45 | | | — | | | — | | | — | | | — | |
| | | | | | | | | | | | | | | | | | | | | | | |
Total | | | | | $ | 11,805 | | $ | 13,901 | | $ | 8,584 | | $ | — | | $ | — | | $ | — | |
| | | | | | | | | | | | | | | | | | | | | | | |
Pre-Development | | | | | | | | | | | | | | | | | | | | | | |
Upper Rock Retail | | | 100.0 | % | $ | — | | $ | — | | $ | 100,000 | | $ | 100,000 | | $ | 64,000 | | $ | 96,000 | |
| | | | | | | | | | | | | | | | | | | | | | | |
Total | | | | | $ | — | | $ | — | | $ | 100,000 | | $ | 100,000 | | $ | 64,000 | | $ | 96,000 | |
| | | | | | | | | | | | | | | | | | | | | | | |
Total | | | | | $ | 97,934 | | $ | 74,251 | | $ | 130,623 | | $ | 112,767 | | $ | 74,953 | | $ | 103,324 | |
| | | | | | | | | | | | | | | | | | | | | | | |
| | | | | | | | | | | | | | | | | | | | | | | |
| | | | | | | | | | | | | | | | | | | | | | | |
- (1)
- Reflects our pro rata share of joint venture assets.
- (2)
- Represents contractual rent abatements for in place and signed but not commenced leases.
66
Asset Revenue and Operating Expenses
The tables below present certain financial and operating information for each of the assets that are part of our operating portfolio (which excludes construction, pre-development and land assets held for development) based on historical results of operations for the three months ended March 31, 2016. Certain assets included in our operating portfolio were acquired, commenced lease-up or were placed into service upon completion of development activity in 2015 and 2014. We have included the three-month fiscal period ending March 31, 2016 because it reflects the most recent revenue and expense amounts for the operating portfolio. This information is derived in part from the combined statements of revenue and expenses from real estate operations of our assets included elsewhere in this document. We also present the Non-GAAP measures Adjusted Historical Asset-Level NOI and Adjusted Historical Asset-Level NOI, Before Rent Abatements. Please see the following paragraph for an explanation of why our management believes the presentation of these metrics provides useful information to investors. This asset-level information is not necessarily indicative of our future asset-level results and/or our results of operations. We believe, however, that this presentation of asset-level data will be useful to investors in understanding the historical performance of our assets on an asset-level basis.
Asset-Level Non-GAAP Financial Measures—Adjusted Historical Asset-Level NOI and Adjusted Historical Asset-Level NOI, Before Rent Abatements
In the following tables, we present a reconciliation of Adjusted Historical Asset-Level NOI and Adjusted Historical Asset-Level NOI, Before Rent Abatements to operating revenues in excess of expenses from the combined statements of revenue and expenses for our initial operating portfolio included herein starting on page F-46. Adjusted Historical Asset-Level NOI is a metric management uses to measure the operating performance of our assets and consists of property-related revenue (which includes base rent, tenant expense recoveries and other operating revenue) less operating expenses, before non-cash straight-line rents and related party management fees. Adjusted Historical Asset-Level NOI, Before Rent Abatements represents Adjusted Historical Asset-Level NOI before abatements. We also present our pro rata share of Adjusted Historical Asset-Level NOI and Adjusted Historical Asset-Level NOI, Before Rent Abatements, which represents our share of the Adjusted Historical Asset-Level NOI and Adjusted Historical Asset-Level NOI, Before Rent Abatements generated by our consolidated and unconsolidated operating assets based on our percentage ownership of such assets. Management uses Adjusted Historical and Adjusted Historical Asset-Level NOI, Before Rent Abatements as supplemental performance measures for our assets and believes they provide useful information to investors because they reflect only those revenue and expense items that are incurred at the asset level, excluding non-cash items. In addition, Adjusted Historical Asset-Level NOI and Adjusted Historical Asset-Level NOI, Before Rent Abatements are considered by many in the real estate industry to be a useful starting point for determining the value of a real estate asset or group of assets. However, because Adjusted Historical Asset-Level NOI and Adjusted Historical Asset-Level NOI, Before Rent Abatements exclude depreciation and amortization and capture neither the changes in the value of our assets that result from use or market conditions, nor the level of capital expenditures and capitalized leasing commissions necessary to maintain the operating performance of our assets, all of which have real economic effect and could materially impact the financial performance of our assets, the utility of Adjusted Historical Asset-Level NOI and Adjusted Historical Asset-Level NOI, Before Rent Abatements as measures of the operating performance of our assets is limited. Moreover, other real estate companies may calculate Adjusted Historical Asset-Level NOI and/or Adjusted Historical Asset-Level NOI, Before Rent Abatements differently than we do. Accordingly, our Adjusted Historical Asset-Level NOI and Adjusted Historical Asset-Level NOI, Before Rent Abatements may not be comparable to other real estate companies' Adjusted Historical Asset-Level NOI and Adjusted Historical Asset-Level NOI, Before Rent Abatements. Adjusted Historical Asset-Level NOI and Adjusted Historical Asset-Level NOI should be considered only as supplements to net operating income (loss) (computed in accordance with GAAP) as a measure of the operating performance of our assets.
67
Summary Asset-Level NOI Table
(Dollars at 100 Percent Share, except where otherwise indicated)
Three Months Ended March 31, 2016
| | | | | | | | | | | | | | | | |
| | Total | | Office—GSA | | Office—Non GSA | | Multifamily | | Retail | |
|---|
Number of operating assets | | | 72 | | | 4 | | | 34 | | | 19 | | | 15 | |
Base rent | | $ | 72,617 | | $ | 24,792 | | $ | 39,006 | | $ | — | | $ | 8,819 | |
Tenant expense recoveries | | | 12,213 | | | 5,256 | | | 5,060 | | | — | | | 1,897 | |
Other operating revenue | | | 5,959 | | | 2,258 | | | 3,201 | | | — | | | 500 | |
| | | | | | | | | | | | | | | | | |
Total office and retail revenue | | $ | 90,789 | | $ | 32,306 | | $ | 47,267 | | $ | — | | $ | 11,216 | |
| | | | | | | | | | | | | | | | | |
Multifamily and other revenue | | | 26,956 | | | — | | | — | | | 26,956 | | | — | |
| | | | | | | | | | | | | | | | | |
Total operating revenue | | $ | 117,745 | | $ | 32,306 | | $ | 47,267 | | $ | 26,956 | | $ | 11,216 | |
| | | | | | | | | | | | | | | | | |
Total operating expenses | | | (49,604 | ) | | (10,502 | ) | | (22,358 | ) | | (13,100 | ) | | (3,644 | ) |
| | | | | | | | | | | | | | | | | |
Operating revenues in excess of expenses | | $ | 68,141 | | $ | 21,804 | | $ | 24,909 | | $ | 13,856 | | $ | 7,572 | |
| | | | | | | | | | | | | | | | | |
Adjustments to arrive at adjusted historical asset-level NOI | | | | | | | | | | | | | | | | |
Straight-line rent adjustment | | $ | (1,529 | ) | $ | 1,243 | | $ | (1,705 | ) | $ | (87 | ) | $ | (980 | ) |
Related party management fees | | | 3,963 | | | 1,112 | | | 1,355 | | | 1,090 | | | 406 | |
| | | | | | | | | | | | | | | | | |
Total adjustments to arrive at adjusted historical asset-level NOI | | $ | 2,434 | | $ | 2,355 | | $ | (350 | ) | $ | 1,003 | | $ | (574 | ) |
| | | | | | | | | | | | | | | | | |
Adjusted Historical Asset-Level NOI | | $ | 70,575 | | $ | 24,159 | | $ | 24,559 | | $ | 14,859 | | $ | 6,998 | |
| | | | | | | | | | | | | | | | | |
| | | | | | | | | | | | | | | | | |
| | | | | | | | | | | | | | | | | |
Abatements | | $ | 4,634 | | $ | 11 | | $ | 3,033 | | $ | 1,185 | | $ | 405 | |
| | | | | | | | | | | | | | | | | |
Adjusted Historical Asset-Level NOI, Before Rent Abatements | | $ | 75,209 | | $ | 24,170 | | $ | 27,592 | | $ | 16,044 | | $ | 7,403 | |
| | | | | | | | | | | | | | | | | |
| | | | | | | | | | | | | | | | | |
| | | | | | | | | | | | | | | | | |
Annualized Adjusted Historical Asset-Level NOI, Before Rent Abatements(1) | | $ | 300,836 | | $ | 96,680 | | $ | 110,368 | | $ | 64,176 | | $ | 29,612 | |
| | | | | | | | | | | | | | | | | |
| | | | | | | | | | | | | | | | | |
| | | | | | | | | | | | | | | | | |
At JBG's Share(2) | | | | | | | | | | | | | | | | |
JBG share of Annualized Adjusted Historical Asset-Level NOI(3) | | $ | 199,596 | | $ | 83,940 | | $ | 59,488 | | $ | 41,184 | | $ | 14,984 | |
JBG share of Annualized Adjusted Historical Asset-Level NOI, Before Rent Abatements | | | 212,524 | | | 83,984 | | | 69,380 | | | 43,200 | | | 15,960 | |
Additional Information | | | | | | | | | | | | | | | | |
Base rent of signed leases, not commenced (at 100 percent share)(4) | | $ | 14,026 | | $ | — | | $ | 10,945 | | $ | 319 | | $ | 2,762 | |
JBG share of base rent of signed leases, not commenced(2)(4) | | | 8,896 | | | — | | | 7,745 | | | 157 | | | 994 | |
- (1)
- Represents Adjusted Historical Asset-Level NOI, Before Rent Abatements multiplied by four.
- (2)
- Represents JBG's pro rata share of asset level financial metrics based on JBG's ownership percentage as of March 31, 2016.
- (3)
- Represents JBG's share of Adjusted Historical Asset-Level NOI multiplied by four.
- (4)
- Represents base rent before abatements and straight line rent adjustments, plus estimated tenant reimbursements for the month in which the lease commences, multiplied by twelve. Triple net leases are converted to a gross basis by adding estimated tenant reimbursements to base rent. See "—Our Office Assets—Contractual Rent Abatement in Our Office Portfolio" and "—Our Retail Assets—Contractual Rent Abatement in Our Retail Portfolio" for detail on rent abatements.
68
Summary Office Asset-Level NOI Table
(Dollars at 100 Percent Share, except where otherwise indicated)
Three Months Ended March 31, 2016
| | | | | | | | | | | | | | | | | | | | | | |
| |
| | Non-GSA | | GSA | |
|---|
| | Total Office | | DC | | VA | | MD | | DC | | VA | | MD | |
|---|
Number of operating assets | | | 38 | | | 9 | | | 12 | | | 13 | | | 1 | | | — | | | 3 | |
Base rent | |
$ |
63,798 | |
$ |
15,392 | |
$ |
10,736 | |
$ |
12,878 | |
$ |
9,664 | |
$ |
— | |
$ |
15,128 | |
Tenant expense recoveries | �� | | 10,316 | | | 1,019 | | | 1,300 | | | 2,741 | | | 5,209 | | | — | | | 47 | |
Other operating revenue | | | 5,459 | | | 1,623 | | | 608 | | | 970 | | | 362 | | | — | | | 1,896 | |
| | | | | | | | | | | | | | | | | | | | | | | |
Total office and retail revenue | | $ | 79,573 | | $ | 18,034 | | $ | 12,644 | | $ | 16,589 | | $ | 15,235 | | $ | — | | $ | 17,071 | |
| | | | | | | | | | | | | | | | | | | | | | | |
Multifamily and other revenue | | | — | | | — | | | — | | | — | | | — | | | — | | | — | |
| | | | | | | | | | | | | | | | | | | | | | | |
Total operating revenue | | $ | 79,573 | | $ | 18,034 | | $ | 12,644 | | $ | 16,589 | | $ | 15,235 | | $ | — | | $ | 17,071 | |
| | | | | | | | | | | | | | | | | | | | | | | |
Total operating expenses | | |
(32,860 |
) | |
(9,102 |
) | |
(5,966 |
) | |
(7,290 |
) | |
(5,795 |
) | |
— | | |
(4,707 |
) |
| | | | | | | | | | | | | | | | | | | | | | | |
Operating revenues in excess of expenses | | $ | 46,713 | | $ | 8,932 | | $ | 6,678 | | $ | 9,299 | | $ | 9,440 | | $ | — | | $ | 12,364 | |
| | | | | | | | | | | | | | | | | | | | | | | |
Adjustments to arrive at adjusted historical asset-level NOI | | | | | | | | | | | | | | | | | | | | | | |
Straight-line rent adjustment | | $ | (462 | ) | $ | (1,388 | ) | $ | (551 | ) | $ | 234 | | $ | 472 | | $ | — | | $ | 771 | |
Related party management fees | | | 2,467 | | | 529 | | | 371 | | | 455 | | | 546 | | | — | | | 566 | |
| | | | | | | | | | | | | | | | | | | | | | | |
Total adjustments to arrive at adjusted historical asset-level NOI | | $ | 2,005 | | $ | (859 | ) | $ | (180 | ) | $ | 689 | | $ | 1,018 | | $ | — | | $ | 1,337 | |
| | | | | | | | | | | | | | | | | | | | | | | |
Adjusted Historical Asset-Level NOI | | $ | 48,718 | | $ | 8,073 | | $ | 6,498 | | $ | 9,988 | | $ | 10,458 | | $ | — | | $ | 13,701 | |
| | | | | | | | | | | | | | | | | | | | | | | |
| | | | | | | | | | | | | | | | | | | | | | | |
| | | | | | | | | | | | | | | | | | | | | | | |
Abatements | | $ | 3,044 | | $ | 2,016 | | $ | 764 | | $ | 253 | | $ | — | | $ | — | | $ | 11 | |
| | | | | | | | | | | | | | | | | | | | | | | |
Adjusted Historical Asset-Level NOI, Before Rent Abatements | | $ | 51,762 | | $ | 10,089 | | $ | 7,262 | | $ | 10,241 | | $ | 10,458 | | $ | — | | $ | 13,712 | |
| | | | | | | | | | | | | | | | | | | | | | | |
| | | | | | | | | | | | | | | | | | | | | | | |
| | | | | | | | | | | | | | | | | | | | | | | |
Annualized Adjusted Historical Asset-Level NOI, Before Rent Abatements(1) | | $ | 207,048 | | $ | 40,356 | | $ | 29,048 | | $ | 40,964 | | $ | 41,832 | | $ | — | | $ | 54,848 | |
| | | | | | | | | | | | | | | | | | | | | | | |
| | | | | | | | | | | | | | | | | | | | | | | |
| | | | | | | | | | | | | | | | | | | | | | | |
At JBG's Share(2) | | | | | | | | | | | | | | | | | | | | | | |
JBG share of Annualized Adjusted Historical Asset-Level NOI(3) | | $ | 143,428 | | $ | 22,064 | | $ | 19,992 | | $ | 17,432 | | $ | 41,832 | | $ | — | | $ | 42,108 | |
JBG share of Annualized Adjusted Historical Asset-Level NOI, Before Rent Abatements | | | 153,364 | | | 28,812 | | | 22,584 | | | 17,984 | | | 41,832 | | | — | | | 42,152 | |
Additional Information | | | | | | | | | | | | | | | | | | | | | | |
Base rent of signed leases, not commenced (at 100 percent share)(4) | | $ | 10,945 | | $ | 9,251 | | $ | 1,138 | | $ | 556 | | $ | — | | $ | — | | $ | — | |
JBG share of base rent of signed leases, not commenced(2)(4) | | | 7,745 | | | 6,312 | | | 1,111 | | | 322 | | | — | | | — | | | — | |
- (1)
- Represents Adjusted Historical Asset-Level NOI, Before Rent Abatements multiplied by four.
- (2)
- Represents JBG's pro rata share of asset level financial metrics based on JBG's ownership percentage as of March 31, 2016.
- (3)
- Represents JBG's share of Adjusted Historical Asset-Level NOI multiplied by four.
- (4)
- Represents base rent before abatements and straight line rent adjustments, plus estimated tenant reimbursements for the month in which the lease commences, multiplied by twelve. Triple net leases are converted to a gross basis by adding estimated tenant reimbursements to base rent. See "—Our Office Assets—Contractual Rent Abatement in Our Office Portfolio" and "—Our Retail Assets—Contractual Rent Abatement in Our Retail Portfolio" for detail on rent abatements.
69
Summary Multifamily Asset-Level NOI Table
(Dollars at 100 Percent Share, except where otherwise indicated)
Three Months Ended March 31, 2016
| | | | | | | | | | | | | | | | | | | | | | |
| |
| | Mid/High-Rise | | Garden-Style | |
|---|
| | Total
Multifamily | |
|---|
| | DC | | VA | | MD | | DC | | VA | | MD | |
|---|
Number of operating assets | | | 19 | | | 4 | | | 1 | | | 3 | | | — | | | 9 | | | 2 | |
Base rent | |
$ |
— | |
$ |
— | |
$ |
— | |
$ |
— | |
$ |
— | |
$ |
— | |
$ |
— | |
Tenant expense recoveries | | | — | | | — | | | — | | | — | | | — | | | — | | | — | |
Other operating revenue | | | — | | | — | | | — | | | — | | | — | | | — | | | — | |
| | | | | | | | | | | | | | | | | | | | | | | |
Total office and retail revenue | | $ | — | | $ | — | | $ | — | | $ | — | | $ | — | | $ | — | | $ | — | |
| | | | | | | | | | | | | | | | | | | | | | | |
Multifamily and other revenue | | | 26,956 | | | 5,545 | | | 574 | | | 2,878 | | | — | | | 15,866 | | | 2,093 | |
| | | | | | | | | | | | | | | | | | | | | | | |
Total operating revenue | | $ | 26,956 | | $ | 5,545 | | $ | 574 | | $ | 2,878 | | $ | — | | $ | 15,866 | | $ | 2,093 | |
| | | | | | | | | | | | | | | | | | | | | | | |
Total operating expenses | | | (13,100 | ) | | (2,263 | ) | | (559 | ) | | (1,684 | ) | | — | | | (7,854 | ) | | (740 | ) |
| | | | | | | | | | | | | | | | | | | | | | | |
Operating revenues in excess of expenses | | $ | 13,856 | | $ | 3,282 | | $ | 15 | | $ | 1,194 | | $ | — | | $ | 8,012 | | $ | 1,353 | |
| | | | | | | | | | | | | | | | | | | | | | | |
Adjustments to arrive at adjusted historical asset-level NOI | | | | | | | | | | | | | | | | | | | | | | |
Straight-line rent adjustment | | $ | (87 | ) | $ | (32 | ) | $ | — | | $ | (55 | ) | $ | — | | $ | — | | $ | — | |
Related party management fees | | | 1,090 | | | 231 | | | 20 | | | 134 | | | — | | | 626 | | | 79 | |
| | | | | | | | | | | | | | | | | | | | | | | |
Total adjustments to arrive at adjusted historical asset-level NOI | | $ | 1,003 | | $ | 199 | | $ | 20 | | $ | 79 | | $ | — | | $ | 626 | | $ | 79 | |
| | | | | | | | | | | | | | | | | | | | | | | |
Adjusted Historical Asset-Level NOI | | $ | 14,859 | | $ | 3,481 | | $ | 35 | | $ | 1,273 | | $ | — | | $ | 8,638 | | $ | 1,432 | |
| | | | | | | | | | | | | | | | | | | | | | | |
| | | | | | | | | | | | | | | | | | | | | | | |
| | | | | | | | | | | | | | | | | | | | | | | |
Abatements | | $ | 1,185 | | $ | 635 | | $ | 188 | | $ | 234 | | $ | — | | $ | 103 | | $ | 25 | |
| | | | | | | | | | | | | | | | | | | | | | | |
Adjusted Historical Asset-Level NOI, Before Rent Abatements | | $ | 16,044 | | $ | 4,116 | | $ | 223 | | $ | 1,507 | | $ | — | | $ | 8,741 | | $ | 1,457 | |
| | | | | | | | | | | | | | | | | | | | | | | |
| | | | | | | | | | | | | | | | | | | | | | | |
| | | | | | | | | | | | | | | | | | | | | | | |
Annualized Adjusted Historical Asset-Level NOI, Before Rent Abatements(1) | | $ | 64,176 | | $ | 16,464 | | $ | 892 | | $ | 6,028 | | $ | — | | $ | 34,964 | | $ | 5,828 | |
| | | | | | | | | | | | | | | | | | | | | | | |
| | | | | | | | | | | | | | | | | | | | | | | |
| | | | | | | | | | | | | | | | | | | | | | | |
At JBG's Share(2) | | | | | | | | | | | | | | | | | | | | | | |
JBG share of Annualized Adjusted Historical Asset-Level NOI(3) | | $ | 41,184 | | $ | 3,716 | | $ | 20 | | $ | 724 | | $ | — | | $ | 30,996 | | $ | 5,728 | |
JBG share of Annualized Adjusted Historical Asset-Level NOI, Before Rent Abatements | | | 43,200 | | | 5,084 | | | 132 | | | 772 | | | — | | | 31,384 | | | 5,828 | |
Additional Information | | |
| | |
| | |
| | |
| | |
| | |
| | |
| |
Base rent of signed leases, not commenced (at 100 percent share)(4) | | $ | 319 | | $ | 277 | | $ | — | | $ | 42 | | $ | — | | $ | — | | $ | — | |
JBG share of base rent of signed leases, not commenced(2)(4) | | | 157 | | | 156 | | | — | | | 1 | | | — | | | — | | | — | |
- (1)
- Represents Adjusted Historical Asset-Level NOI, Before Rent Abatements multiplied by four.
- (2)
- Represents JBG's pro rata share of asset level financial metrics based on JBG's ownership percentage as of March 31, 2016.
- (3)
- Represents JBG's share of Adjusted Historical Asset-Level NOI multiplied by four.
- (4)
- Represents base rent before abatements and straight line rent adjustments, plus estimated tenant reimbursements for the month in which the lease commences, multiplied by twelve for retail leases that have been signed but not commenced related to retail space at a multifamily asset. Triple net leases are converted to a gross basis by adding estimated tenant reimbursements to base rent. See "—Our Retail Assets—Contractual Rent Abatement in Our Retail Portfolio" for detail on rent abatements.
70
Summary Retail Asset-Level NOI Table
(Dollars at 100 Percent Share, except where otherwise indicated)
Three Months Ended March 31, 2016
| | | | | | | | | | | | | |
| | Total Retail | | DC | | VA | | MD | |
|---|
Number of operating assets | | | 15 | | | 4 | | | 6 | | | 5 | |
Base rent | |
$ |
8,819 | |
$ |
1,353 | |
$ |
5,222 | |
$ |
2,244 | |
Tenant expense recoveries | | | 1,897 | | | 490 | | | 1,131 | | | 276 | |
Other operating revenue | | | 500 | | | 232 | | | 206 | | | 62 | |
| | | | | | | | | | | | | | |
Total office and retail revenue | | $ | 11,216 | | $ | 2,075 | | $ | 6,559 | | $ | 2,582 | |
| | | | | | | | | | | | | | |
Multifamily and other revenue | | | — | | | — | | | — | | | — | |
| | | | | | | | | | | | | | |
Total operating revenue | | $ | 11,216 | | $ | 2,075 | | $ | 6,559 | | $ | 2,582 | |
| | | | | | | | | | | | | | |
Total operating expenses | | | (3,644 | ) | | (1,038 | ) | | (1,899 | ) | | (707 | ) |
| | | | | | | | | | | | | | |
Operating revenues in excess of expenses | | $ | 7,572 | | $ | 1,037 | | $ | 4,660 | | $ | 1,875 | |
| | | | | | | | | | | | | | |
Adjustments to arrive at adjusted historical asset-level NOI | | | | | | | | | | | | | |
Straight-line rent adjustment | | $ | (980 | ) | $ | (122 | ) | $ | (377 | ) | $ | (481 | ) |
Related party management fees | | | 406 | | | 64 | | | 241 | | | 101 | |
| | | | | | | | | | | | | | |
Total adjustments to arrive at adjusted historical asset-level NOI | | $ | (574 | ) | $ | (58 | ) | $ | (136 | ) | $ | (380 | ) |
| | | | | | | | | | | | | | |
Adjusted Historical Asset-Level NOI | | $ | 6,998 | | $ | 979 | | $ | 4,524 | | $ | 1,495 | |
| | | | | | | | | | | | | | |
| | | | | | | | | | | | | | |
| | | | | | | | | | | | | | |
Abatements | | $ | 405 | | $ | 232 | | $ | 60 | | $ | 113 | |
| | | | | | | | | | | | | | |
Adjusted Historical Asset-Level NOI, Before Rent Abatements | | $ | 7,403 | | $ | 1,211 | | $ | 4,584 | | $ | 1,608 | |
| | | | | | | | | | | | | | |
| | | | | | | | | | | | | | |
| | | | | | | | | | | | | | |
Annualized Adjusted Historical Asset-Level NOI, Before Rent Abatements(1) | | $ | 29,612 | | $ | 4,844 | | $ | 18,336 | | $ | 6,432 | |
| | | | | | | | | | | | | | |
| | | | | | | | | | | | | | |
| | | | | | | | | | | | | | |
At JBG's Share(2) | | | | | | | | | | | | | |
JBG share of Annualized Adjusted Historical Asset-Level NOI(3) | | $ | 14,984 | | $ | 2,444 | | $ | 8,084 | | $ | 4,456 | |
JBG share of Annualized Adjusted Historical Asset-Level NOI, Before Rent Abatements | | | 15,960 | | | 2,944 | | | 8,108 | | | 4,908 | |
Additional Information | | |
| | |
| | |
| | |
| |
Base rent of signed leases, not commenced (at 100 percent share)(4) | | $ | 2,762 | | $ | 659 | | $ | 380 | | $ | 1,723 | |
JBG share of base rent of signed leases, not commenced(2)(4) | | | 994 | | | 529 | | | 89 | | | 376 | |
- (1)
- Represents Adjusted Historical Asset-Level NOI, Before Rent Abatements multiplied by four.
- (2)
- Represents JBG's pro rata share of asset level financial metrics based on JBG's ownership percentage as of March 31, 2016.
- (3)
- Represents JBG's share of Adjusted Historical Asset-Level NOI multiplied by four.
- (4)
- Represents base rent before abatements and straight line rent adjustments, plus estimated tenant reimbursements for the month in which the lease commences, multiplied by twelve. Triple net leases are converted to a gross basis by adding estimated tenant reimbursements to base rent. See "—Our Retail Assets—Contractual Rent Abatement in Our Retail Portfolio" for detail on rent abatements.
71
Summary Asset-Level NOI Table
(Dollars at JBG Share, except where otherwise indicated)
Three Months Ended March 31, 2016
| | | | | | | | | | | | | | | | |
| | Total | | Office—GSA | | Office—Non GSA | | Multifamily | | Retail | |
|---|
Number of operating assets | | | 72 | | | 4 | | | 34 | | | 19 | | | 15 | |
Base rent | |
$ |
51,386 | |
$ |
21,263 | |
$ |
25,461 | |
$ |
— | |
$ |
4,662 | |
Tenant expense recoveries | | | 8,468 | | | 5,253 | | | 2,144 | | | — | | | 1,071 | |
Other operating revenue | | | 3,961 | | | 1,858 | | | 1,866 | | | — | | | 237 | |
| | | | | | | | | | | | | | | | | |
Total office and retail revenue | | $ | 63,815 | | $ | 28,374 | | $ | 29,471 | | $ | — | | $ | 5,970 | |
| | | | | | | | | | | | | | | | | |
Multifamily and other revenue | | | 18,767 | | | — | | | — | | | 18,767 | | | — | |
| | | | | | | | | | | | | | | | | |
Total operating revenue | | $ | 82,582 | | $ | 28,374 | | $ | 29,471 | | $ | 18,767 | | $ | 5,970 | |
| | | | | | | | | | | | | | | | | |
Total operating expenses | | | (34,751 | ) | | (9,517 | ) | | (13,932 | ) | | (9,194 | ) | | (2,108 | ) |
| | | | | | | | | | | | | | | | | |
Operating revenues in excess of expenses | | $ | 47,831 | | $ | 18,857 | | $ | 15,539 | | $ | 9,573 | | $ | 3,862 | |
| | | | | | | | | | | | | | | | | |
Adjustments to arrive at adjusted historical asset-level NOI | | | | | | | | | | | | | | | | |
Straight-line rent adjustment | | $ | (753 | ) | $ | 1,150 | | $ | (1,537 | ) | $ | (21 | ) | $ | (345 | ) |
Related party management fees | | | 2,821 | | | 978 | | | 870 | | | 744 | | | 229 | |
| | | | | | | | | | | | | | | | | |
Total adjustments to arrive at adjusted historical asset-level NOI | | $ | 2,068 | | $ | 2,128 | | $ | (667 | ) | $ | 723 | | $ | (116 | ) |
| | | | | | | | | | | | | | | | | |
Adjusted Historical Asset-Level NOI | | $ | 49,899 | | $ | 20,985 | | $ | 14,872 | | $ | 10,296 | | $ | 3,746 | |
| | | | | | | | | | | | | | | | | |
| | | | | | | | | | | | | | | | | |
| | | | | | | | | | | | | | | | | |
Abatements | | $ | 3,232 | | $ | 11 | | $ | 2,473 | | $ | 504 | | $ | 244 | |
| | | | | | | | | | | | | | | | | |
Adjusted Historical Asset-Level NOI, Before Rent Abatements | | $ | 53,131 | | $ | 20,996 | | $ | 17,345 | | $ | 10,800 | | $ | 3,990 | |
| | | | | | | | | | | | | | | | | |
| | | | | | | | | | | | | | | | | |
| | | | | | | | | | | | | | | | | |
Annualized Adjusted Historical Asset-Level NOI, Before Rent Abatements(1) | | $ | 212,524 | | $ | 83,984 | | $ | 69,380 | | $ | 43,200 | | $ | 15,960 | |
| | | | | | | | | | | | | | | | | |
| | | | | | | | | | | | | | | | | |
| | | | | | | | | | | | | | | | | |
Additional Information | | | | | | | | | | | | | | | | |
JBG share of base rent of signed leases, not commenced(2)(3) | | | 8,896 | | | — | | | 7,745 | | | 157 | | | 994 | |
- (1)
- Represents Adjusted Historical Asset-Level NOI, Before Rent Abatements multiplied by four.
- (2)
- Represents JBG's pro rata share of asset level financial metrics based on JBG's ownership percentage as of March 31, 2016.
- (3)
- Represents base rent before abatements and straight line rent adjustments, plus estimated tenant reimbursements for the month in which the lease commences, multiplied by twelve. Triple net leases are converted to a gross basis by adding estimated tenant reimbursements to base rent. See "—Our Office Assets—Contractual Rent Abatement in Our Office Portfolio" and "—Our Retail Assets—Contractual Rent Abatement in Our Retail Portfolio" for detail on rent abatements.
72
Summary Office Asset-Level NOI Table
(Dollars at JBG Share)
Three Months Ended March 31, 2016
| | | | | | | | | | | | | | | | | | | | | | |
| |
| | Non-GSA | | GSA | |
|---|
| | Total Office | | DC | | VA | | MD | | DC | | VA | | MD | |
|---|
Number of operating assets | | | 38 | | | 9 | | | 12 | | | 13 | | | 1 | | | — | | | 3 | |
Base rent | |
$ |
46,724 | |
$ |
11,018 | |
$ |
8,611 | |
$ |
5,832 | |
$ |
9,664 | |
$ |
— | |
$ |
11,599 | |
Tenant expense recoveries | | | 7,397 | | | 659 | | | 1,066 | | | 419 | | | 5,209 | | | — | | | 44 | |
Other operating revenue | | | 3,724 | | | 1,099 | | | 462 | | | 305 | | | 362 | | | — | | | 1,496 | |
| | | | | | | | | | | | | | | | | | | | | | | |
Total office and retail revenue | | $ | 57,845 | | $ | 12,776 | | $ | 10,139 | | $ | 6,556 | | $ | 15,235 | | $ | — | | $ | 13,139 | |
| | | | | | | | | | | | | | | | | | | | | | | |
Multifamily and other revenue | | | — | | | — | | | — | | | — | | | — | | | — | | | — | |
| | | | | | | | | | | | | | | | | | | | | | | |
Total operating revenue | | $ | 57,845 | | $ | 12,776 | | $ | 10,139 | | $ | 6,556 | | $ | 15,235 | | $ | — | | $ | 13,139 | |
| | | | | | | | | | | | | | | | | | | | | | | |
Total operating expenses | | | (23,449 | ) | | (6,501 | ) | | (4,950 | ) | | (2,481 | ) | | (5,795 | ) | | — | | | (3,722 | ) |
| | | | | | | | | | | | | | | | | | | | | | | |
Operating revenues in excess of expenses | | $ | 34,396 | | $ | 6,275 | | $ | 5,189 | | $ | 4,075 | | $ | 9,440 | | $ | — | | $ | 9,417 | |
| | | | | | | | | | | | | | | | | | | | | | | |
Adjustments to arrive at adjusted historical asset-level NOI | | | | | | | | | | | | | | | | | | | | | | |
Straight-line rent adjustment | | $ | (387 | ) | $ | (1,124 | ) | $ | (503 | ) | $ | 90 | | $ | 472 | | $ | — | | $ | 678 | |
Related party management fees | | | 1,848 | | | 365 | | | 312 | | | 193 | | | 546 | | | — | | | 432 | |
| | | | | | | | | | | | | | | | | | | | | | | |
Total adjustments to arrive at adjusted historical asset-level NOI | | $ | 1,461 | | $ | (759 | ) | $ | (191 | ) | $ | 283 | | $ | 1,018 | | $ | — | | $ | 1,110 | |
| | | | | | | | | | | | | | | | | | | | | | | |
Adjusted Historical Asset-Level NOI | | $ | 35,857 | | $ | 5,516 | | $ | 4,998 | | $ | 4,358 | | $ | 10,458 | | $ | — | | $ | 10,527 | |
| | | | | | | | | | | | | | | | | | | | | | | |
| | | | | | | | | | | | | | | | | | | | | | | |
| | | | | | | | | | | | | | | | | | | | | | | |
Abatements | | $ | 2,484 | | $ | 1,687 | | $ | 648 | | $ | 138 | | $ | — | | $ | — | | $ | 11 | |
| | | | | | | | | | | | | | | | | | | | | | | |
Adjusted Historical Asset-Level NOI, Before Rent Abatements | | $ | 38,341 | | $ | 7,203 | | $ | 5,646 | | $ | 4,496 | | $ | 10,458 | | $ | — | | $ | 10,538 | |
| | | | | | | | | | | | | | | | | | | | | | | |
| | | | | | | | | | | | | | | | | | | | | | | |
| | | | | | | | | | | | | | | | | | | | | | | |
Annualized Adjusted Historical Asset-Level NOI, Before Rent Abatements(1) | | $ | 153,364 | | $ | 28,812 | | $ | 22,584 | | $ | 17,984 | | $ | 41,832 | | $ | — | | $ | 42,152 | |
| | | | | | | | | | | | | | | | | | | | | | | |
| | | | | | | | | | | | | | | | | | | | | | | |
| | | | | | | | | | | | | | | | | | | | | | | |
Additional Information | | | | | | | | | | | | | | | | | | | | | | |
JBG share of base rent of signed leases, not commenced(2)(3) | | | 7,745 | | | 6,312 | | | 1,111 | | | 322 | | | — | | | — | | | — | |
- (1)
- Represents Adjusted Historical Asset-Level NOI, Before Rent Abatements multiplied by four.
- (2)
- Represents JBG's pro rata share of asset level financial metrics based on JBG's ownership percentage as of March 31, 2016.
- (3)
- Represents base rent before abatements and straight line rent adjustments, plus estimated tenant reimbursements for the month in which the lease commences, multiplied by twelve. Triple net leases are converted to a gross basis by adding estimated tenant reimbursements to base rent. See "—Our Office Assets—Contractual Rent Abatement in Our Office Portfolio" and "—Our Retail Assets—Contractual Rent Abatement in Our Retail Portfolio" for detail on rent abatements.
73
Summary Multifamily Asset-Level NOI Table
(Dollars at JBG Share)
Three Months Ended March 31, 2016
| | | | | | | | | | | | | | | | | | | | | | |
| |
| | Mid/High-Rise | | Garden-Style | |
|---|
| | Total
Multifamily | |
|---|
| | DC | | VA | | MD | | DC | | VA | | MD | |
|---|
Number of operating assets | | | 19 | | | 4 | | | 1 | | | 3 | | | — | | | 9 | | | 2 | |
Base rent | |
$ |
— | |
$ |
— | |
$ |
— | |
$ |
— | |
$ |
— | |
$ |
— | |
$ |
— | |
Tenant expense recoveries | | | — | | | — | | | — | | | — | | | — | | | — | | | — | |
Other operating revenue | | | — | | | — | | | — | | | — | | | — | | | — | | | — | |
| | | | | | | | | | | | | | | | | | | | | | | |
Total office and retail revenue | | $ | — | | $ | — | | $ | — | | $ | — | | $ | — | | $ | — | | $ | — | |
| | | | | | | | | | | | | | | | | | | | | | | |
Multifamily and other revenue | | | 18,767 | | | 1,984 | | | 84 | | | 298 | | | — | | | 14,308 | | | 2,093 | |
| | | | | | | | | | | | | | | | | | | | | | | |
Total operating revenue | | $ | 18,767 | | $ | 1,984 | | $ | 84 | | $ | 298 | | $ | — | | $ | 14,308 | | $ | 2,093 | |
| | | | | | | | | | | | | | | | | | | | | | | |
Total operating expenses | | | (9,194 | ) | | (1,121 | ) | | (82 | ) | | (128 | ) | | — | | | (7,123 | ) | | (740 | ) |
Operating revenues in excess of expenses | | $ | 9,573 | | $ | 863 | | $ | 2 | | $ | 170 | | $ | — | | $ | 7,185 | | $ | 1,353 | |
| | | | | | | | | | | | | | | | | | | | | | | |
Adjustments to arrive at adjusted historical asset-level NOI | | | | | | | | | | | | | | | | | | | | | | |
Straight-line rent adjustment | | $ | (21 | ) | $ | (20 | ) | $ | — | | $ | (1 | ) | $ | — | | $ | — | | $ | — | |
Related party management fees | | | 744 | | | 86 | | | 3 | | | 12 | | | — | | | 564 | | | 79 | |
| | | | | | | | | | | | | | | | | | | | | | | |
Total adjustments to arrive at adjusted historical asset-level NOI | | $ | 723 | | $ | 66 | | $ | 3 | | $ | 11 | | $ | — | | $ | 564 | | $ | 79 | |
Adjusted Historical Asset-Level NOI | | $ | 10,296 | | $ | 929 | | $ | 5 | | $ | 181 | | $ | — | | $ | 7,749 | | $ | 1,432 | |
| | | | | | | | | | | | | | | | | | | | | | | |
| | | | | | | | | | | | | | | | | | | | | | | |
| | | | | | | | | | | | | | | | | | | | | | | |
Abatements | | $ | 504 | | $ | 342 | | $ | 28 | | $ | 12 | | $ | — | | $ | 97 | | $ | 25 | |
| | | | | | | | | | | | | | | | | | | | | | | |
Adjusted Historical Asset-Level NOI, Before Rent Abatements | | $ | 10,800 | | $ | 1,271 | | $ | 33 | | $ | 193 | | $ | — | | $ | 7,846 | | $ | 1,457 | |
| | | | | | | | | | | | | | | | | | | | | | | |
| | | | | | | | | | | | | | | | | | | | | | | |
| | | | | | | | | | | | | | | | | | | | | | | |
Annualized Adjusted Historical Asset-Level NOI, Before Rent Abatements(1) | | $ | 43,200 | | $ | 5,084 | | $ | 132 | | $ | 772 | | $ | — | | $ | 31,384 | | $ | 5,828 | |
| | | | | | | | | | | | | | | | | | | | | | | |
| | | | | | | | | | | | | | | | | | | | | | | |
| | | | | | | | | | | | | | | | | | | | | | | |
Additional Information | | | | | | | | | | | | | | | | | | | | | | |
JBG share of base rent of signed leases, not commenced(2)(3) | | | 157 | | | 156 | | | — | | | 1 | | | — | | | — | | | — | |
- (1)
- Represents Adjusted Historical Asset-Level NOI, Before Rent Abatements multiplied by four.
- (2)
- Represents JBG's pro rata share of asset level financial metrics based on JBG's ownership percentage as of March 31, 2016.
- (3)
- Represents base rent before abatements and straight line rent adjustments, plus estimated tenant reimbursements for the month in which the lease commences, multiplied by twelve for retail leases that have been signed but not commenced related to retail space at a multifamily asset. Triple net leases are converted to a gross basis by adding estimated tenant reimbursements to base rent. See "—Our Retail Assets—Contractual Rent Abatement in Our Retail Portfolio" for detail on rent abatements.
74
Summary Retail Asset-Level NOI Table
(Dollars at JBG Share)
Three Months Ended March 31, 2016
| | | | | | | | | | | | | |
| | Total
Retail | | DC | | VA | | MD | |
|---|
Number of operating assets | | | 15 | | | 4 | | | 6 | | | 5 | |
Base rent | |
$ |
4,662 | |
$ |
910 | |
$ |
2,245 | |
$ |
1,507 | |
Tenant expense recoveries | | | 1,071 | | | 317 | | | 526 | | | 228 | |
Other operating revenue | | | 237 | | | 151 | | | 25 | | | 61 | |
| | | | | | | | | | | | | | |
Total office and retail revenue | | $ | 5,970 | | $ | 1,378 | | $ | 2,796 | | $ | 1,796 | |
| | | | | | | | | | | | | | |
Multifamily and other revenue | | | — | | | — | | | — | | | — | |
| | | | | | | | | | | | | | |
Total operating revenue | | $ | 5,970 | | $ | 1,378 | | $ | 2,796 | | $ | 1,796 | |
| | | | | | | | | | | | | | |
Total operating expenses | | | (2,108 | ) | | (715 | ) | | (781 | ) | | (612 | ) |
| | | | | | | | | | | | | | |
Operating revenues in excess of expenses | | $ | 3,862 | | $ | 663 | | $ | 2,015 | | $ | 1,184 | |
| | | | | | | | | | | | | | |
Adjustments to arrive at adjusted historical asset-level NOI | | | | | | | | | | | | | |
Straight-line rent adjustment | | $ | (345 | ) | $ | (97 | ) | $ | (106 | ) | $ | (142 | ) |
Related party management fees | | | 229 | | | 45 | | | 112 | | | 72 | |
| | | | | | | | | | | | | | |
Total adjustments to arrive at adjusted historical asset-level NOI | | $ | (116 | ) | $ | (52 | ) | $ | 6 | | $ | (70 | ) |
| | | | | | | | | | | | | | |
Adjusted Historical Asset-Level NOI | | $ | 3,746 | | $ | 611 | | $ | 2,021 | | $ | 1,114 | |
| | | | | | | | | | | | | | |
| | | | | | | | | | | | | | |
| | | | | | | | | | | | | | |
Abatements | | $ | 244 | | $ | 125 | | $ | 6 | | $ | 113 | |
| | | | | | | | | | | | | | |
Adjusted Historical Asset-Level NOI, Before Rent Abatements | | $ | 3,990 | | $ | 736 | | $ | 2,027 | | $ | 1,227 | |
| | | | | | | | | | | | | | |
| | | | | | | | | | | | | | |
| | | | | | | | | | | | | | |
Annualized Adjusted Historical Asset-Level NOI, Before Rent Abatements(1) | | $ | 15,960 | | $ | 2,944 | | $ | 8,108 | | $ | 4,908 | |
| | | | | | | | | | | | | | |
| | | | | | | | | | | | | | |
| | | | | | | | | | | | | | |
Additional Information | | | | | | | | | | | | | |
JBG share of base rent of signed leases, not commenced(2)(3) | | | 994 | | | 529 | | | 89 | | | 376 | |
- (1)
- Represents Adjusted Historical Asset-Level NOI, Before Rent Abatements multiplied by four.
- (2)
- Represents JBG's pro rata share of asset level financial metrics based on JBG's ownership percentage as of March 31, 2016.
- (3)
- Represents base rent before abatements and straight line rent adjustments, plus estimated tenant reimbursements for the month in which the lease commences, multiplied by twelve. Triple net leases are converted to a gross basis by adding estimated tenant reimbursements to base rent. See "—Our Retail Assets—Contractual Rent Abatement in Our Retail Portfolio" for detail on rent abatements.
75
Office Asset-Level NOI Table
Three Months Ended March 31, 2016
| | | | | | | | | | | | | | | | | | | | | | | | | | | | | | | | | | | | | | | | |
| |
| | 5600 Fishers
Lane—U.S.
Government
Tenant
(GSA) | |
| |
| | 5601 Fishers
Lane—U.S.
Government
Tenant
(GSA) | |
| |
| |
| |
| |
| |
| |
| |
| |
|---|
| | DOT—U.S.
Government
Tenant
(GSA) | | NCI—U.S.
Government
Tenant
(GSA) | |
| |
| |
| |
| |
| |
| |
| |
| |
| |
|---|
| |
| | Jefferson
Court | | 800 North
Glebe
Road | | Artery
Plaza | | One
Choke
Cherry | |
| |
| |
| |
| |
|---|
| |
| | 2115 Wisconsin
Avenue | | 1233 20th Street | |
| |
| |
|---|
| | Rockville
Pike
Corridor,
MD | | RTC—West | | Rockville
Pike
Corridor,
MD | | Summit I | | Summit II | |
|---|
| | Southeast,
DC | | Shady
Grove, MD | | Georgetown,
DC | | Ballston,
VA | | Bethesda
CBD,
MD | | North
Rockville,
MD | |
|---|
| | Reston, VA | | Uptown, DC | | CBD, DC | | Reston, VA | | Reston, VA | |
|---|
Base rent | | $ | 9,664 | | $ | 7,333 | | $ | 4,537 | | $ | 2,729 | | $ | 3,258 | | $ | 2,912 | | $ | 2,027 | | $ | 2,437 | | $ | 1,981 | | $ | 1,379 | | $ | 1,427 | | $ | — | | $ | 973 | |
Tenant expense recoveries | | | 5,209 | | | 12 | | | 35 | | | 55 | | | — | | | 113 | | | 797 | | | 118 | | | 6 | | | 57 | | | 28 | | | — | | | 20 | |
Other operating revenue | | | 362 | | | 751 | | | 695 | | | 54 | | | 450 | | | 318 | | | 331 | | | 208 | | | 19 | | | 109 | | | 42 | | | — | | | 13 | |
| | | | | | | | | | | | | | | | | | | | | | | | | | | | | | | | | | | | | | | | | |
Total office and retail revenue | | $ | 15,235 | | $ | 8,096 | | $ | 5,267 | | $ | 2,838 | | $ | 3,708 | | $ | 3,343 | | $ | 3,155 | | $ | 2,763 | | $ | 2,006 | | $ | 1,545 | | $ | 1,497 | | $ | — | | $ | 1,006 | |
| | | | | | | | | | | | | | | | | | | | | | | | | | | | | | | | | | | | | | | | | |
Multifamily and other revenue | | | — | | | — | | | — | | | — | | | — | | | — | | | — | | | — | | | — | | | — | | | — | | | — | | | — | |
| | | | | | | | | | | | | | | | | | | | | | | | | | | | | | | | | | | | | | | | | |
Total operating revenue | | $ | 15,235 | | $ | 8,096 | | $ | 5,267 | | $ | 2,838 | | $ | 3,708 | | $ | 3,343 | | $ | 3,155 | | $ | 2,763 | | $ | 2,006 | | $ | 1,545 | | $ | 1,497 | | $ | — | | $ | 1,006 | |
| | | | | | | | | | | | | | | | | | | | | | | | | | | | | | | | | | | | | | | | | |
Total operating expenses | | $ | (5,795 | ) | $ | (2,109 | ) | $ | (1,752 | ) | $ | (1,352 | ) | $ | (846 | ) | $ | (1,400 | ) | $ | (1,170 | ) | $ | (949 | ) | $ | (484 | ) | $ | (661 | ) | $ | (761 | ) | $ | (257 | ) | $ | (420 | ) |
| | | | | | | | | | | | | | | | | | | | | | | | | | | | | | | | | | | | | | | | | |
Operating revenues in excess of expenses | | $ | 9,440 | | $ | 5,987 | | $ | 3,515 | | $ | 1,486 | | $ | 2,862 | | $ | 1,943 | | $ | 1,985 | | $ | 1,814 | | $ | 1,522 | | $ | 884 | | $ | 736 | | $ | (257 | ) | $ | 586 | |
| | | | | | | | | | | | | | | | | | | | | | | | | | | | | | | | | | | | | | | | | |
Adjustments to arrive at adjusted historical asset-level NOI | | | | | | | | | | | | | | | | | | | | | | | | | | | | | | | | | | | | | | | | |
Straight-line Rent Adjustment | | $ | 472 | | $ | — | | $ | 493 | | $ | (163 | ) | $ | 278 | | $ | (941 | ) | $ | (21 | ) | $ | 108 | | $ | 3 | | $ | 46 | | $ | (242 | ) | $ | — | | $ | (14 | ) |
Related party management fees | | | 546 | | | 257 | | | 165 | | | 94 | | | 144 | | | 74 | | | 91 | | | 81 | | | 59 | | | 55 | | | 38 | | | — | | | 30 | |
| | | | | | | | | | | | | | | | | | | | | | | | | | | | | | | | | | | | | | | | | |
Total adjustments to arrive at adjusted historical asset-level NOI | | $ | 1,018 | | $ | 257 | | $ | 658 | | $ | (69 | ) | $ | 422 | | $ | (867 | ) | $ | 70 | | $ | 189 | | $ | 62 | | $ | 101 | | $ | (204 | ) | $ | — | | $ | 16 | |
| | | | | | | | | | | | | | | | | | | | | | | | | | | | | | | | | | | | | | | | | |
Adjusted Historical Asset-Level NOI (Loss) | | $ | 10,458 | | $ | 6,244 | | $ | 4,173 | | $ | 1,417 | | $ | 3,284 | | $ | 1,076 | | $ | 2,055 | | $ | 2,003 | | $ | 1,584 | | $ | 985 | | $ | 532 | | $ | (257 | ) | $ | 602 | |
| | | | | | | | | | | | | | | | | | | | | | | | | | | | | | | | | | | | | | | | | |
| | | | | | | | | | | | | | | | | | | | | | | | | | | | | | | | | | | | | | | | | |
| | | | | | | | | | | | | | | | | | | | | | | | | | | | | | | | | | | | | | | | | |
Abatements | | $ | — | | $ | — | | $ | 11 | | $ | 279 | | $ | — | | $ | 1,134 | | $ | 29 | | $ | 78 | | $ | — | | $ | — | | $ | 276 | | $ | — | | $ | — | |
| | | | | | | | | | | | | | | | | | | | | | | | | | | | | | | | | | | | | | | | | |
Adjusted Historical Asset-Level NOI, Before Rent Abatements | | $ | 10,458 | | $ | 6,244 | | $ | 4,184 | | $ | 1,696 | | $ | 3,284 | | $ | 2,210 | | $ | 2,084 | | $ | 2,081 | | $ | 1,584 | | $ | 985 | | $ | 808 | | $ | (257 | ) | $ | 602 | |
| | | | | | | | | | | | | | | | | | | | | | | | | | | | | | | | | | | | | | | | | |
| | | | | | | | | | | | | | | | | | | | | | | | | | | | | | | | | | | | | | | | | |
| | | | | | | | | | | | | | | | | | | | | | | | | | | | | | | | | | | | | | | | | |
Annualized Adjusted Historical Asset-Level NOI, Before Rent Abatements(1) | | $ | 41,832 | | $ | 24,976 | | $ | 16,736 | | $ | 6,784 | | $ | 13,136 | | $ | 8,840 | | $ | 8,336 | | $ | 8,324 | | $ | 6,336 | | $ | 3,940 | | $ | 3,232 | | $ | (1,028 | ) | $ | 2,408 | |
| | | | | | | | | | | | | | | | | | | | | | | | | | | | | | | | | | | | | | | | | |
| | | | | | | | | | | | | | | | | | | | | | | | | | | | | | | | | | | | | | | | | |
| | | | | | | | | | | | | | | | | | | | | | | | | | | | | | | | | | | | | | | | | |
At JBG's Share(2) | | | | | | | | | | | | | | | | | | | | | | | | | | | | | | | | | | | | | | | | |
JBG share of Annualized Adjusted Historical Asset-Level NOI(3) | | $ | 41,832 | | $ | 16,652 | | $ | 16,700 | | $ | 5,668 | | $ | 8,756 | | $ | 4,304 | | $ | 8,220 | | $ | 8,012 | | $ | 6,336 | | $ | 3,940 | | $ | 2,128 | | $ | (1,028 | ) | $ | 2,412 | |
JBG share of Annualized Adjusted Historical Asset-Level NOI, Before Rent Abatements | | | 41,832 | | | 16,652 | | | 16,744 | | | 6,784 | | | 8,756 | | | 8,840 | | | 8,336 | | | 8,324 | | | 6,336 | | | 3,940 | | | 3,232 | | | (1,028 | ) | | 2,412 | |
Additional Information | | | | | | | | | | | | | | | | | | | | | | | | | | | | | | | | | | | | | | | | |
Base rent of signed leases, not commenced (at 100 percent share)(4) | | $ | — | | $ | — | | $ | — | | $ | 1,010 | | $ | — | | $ | — | | $ | — | | $ | 284 | | $ | — | | $ | — | | $ | — | | $ | — | | $ | — | |
JBG share of base rent of signed leases, not commenced(2)(4) | | | — | | | — | | | — | | | 1,010 | | | — | | | — | | | — | | | 284 | | | — | | | — | | | — | | | — | | | — | |
Percent ownership | | | 100.0 | % | | 66.7 | % | | 100.0 | % | | 100.0 | % | | 66.7 | % | | 100.0 | % | | 100.0 | % | | 100.0 | % | | 100.0 | % | | 100.0 | % | | 100.0 | % | | 100.0 | % | | 100.0 | % |
Percent occupied | | | 100.0 | % | | 100.0 | % | | 100.0 | % | | 81.2 | % | | 100.0 | % | | 94.7 | % | | 79.1 | % | | 89.6 | % | | 100.0 | % | | 97.6 | % | | 88.8 | % | | 100.0 | % | | 94.4 | % |
Percent leased | | | 100.0 | % | | 100.0 | % | | 100.0 | % | | 83.0 | % | | 100.0 | % | | 96.0 | % | | 79.1 | % | | 92.6 | % | | 100.0 | % | | 97.6 | % | | 88.8 | % | | 100.0 | % | | 94.4 | % |
- (1)
- Represents Adjusted Historical Asset-Level NOI, Before Rent Abatements multiplied by four.
- (2)
- Represents JBG's pro rata share of asset-level financial metrics based on JBG's ownership percentage as of March 31, 2016.
- (3)
- Represents JBG's share of Adjusted Historical Asset-Level NOI multiplied by four.
- (4)
- Represents base rent before abatements and straight line rent adjustments, plus estimated tenant reimbursements for the month in which the lease commences, multiplied by twelve. Triple net leases are converted to a gross basis by adding estimated tenant reimbursements to base rent. See "—Our Office Assets—Contractual Rent Abatement in Our Office Portfolio" for detail on rent abatements.
76
Office Asset-Level NOI Table
Three Months Ended March 31, 2016
| | | | | | | | | | | | | | | | | | | | | | | | | | | | | | | | | | | | | | | | |
| |
| |
| |
| | Hungerford
Plaza | |
| | Wiehle
Avenue
Office
Building | |
| |
| | 5609 Fishers
Lane | | L'Enfant
Plaza
Office—
East | | L'Enfant
Plaza
Office—
North | |
| |
| |
|---|
| | 2121 Wisconsin
Avenue | | 6862 Elm
Street | | Reston
Arboretum | |
| | 1831 Wiehle
Avenue | | Old
Dominion | | Chase
Tower | | Pickett
Industrial
Park | |
|---|
| | 1600 K
Street | |
|---|
| | Rockville
Pike
Corridor,
MD | | Rockville
Pike
Corridor,
MD | |
|---|
| | Uptown,
DC | | McLean,
VA | | Reston,
VA | | Reston,
VA | | Reston,
VA | | McLean,
VA | | Southwest,
DC | | Southwest,
DC | | Chevy
Chase,
MD | | Eisenhower
Avenue,
VA | |
|---|
| | CBD, DC | |
|---|
Base rent | | $ | 536 | | $ | 713 | | $ | 658 | | $ | 439 | | $ | 920 | | $ | 341 | | $ | 473 | | $ | 303 | | $ | 176 | | $ | 3,973 | | $ | 1,379 | | $ | 2,663 | | $ | 753 | |
Tenant expense recoveries | | | 52 | | | 47 | | | 26 | | | 5 | | | 50 | | | 25 | | | 56 | | | 9 | | | 32 | | | 540 | | | 82 | | | 126 | | | 188 | |
Other operating revenue | | | 129 | | | 9 | | | — | | | 4 | | | 14 | | | 4 | | | 9 | | | 9 | | | — | | | 418 | | | 190 | | | 385 | | | — | |
| | | | | | | | | | | | | | | | | | | | | | | | | | | | | | | | | | | | | | | | | |
Total office and retail revenue | | $ | 717 | | $ | 769 | | $ | 684 | | $ | 448 | | $ | 984 | | $ | 370 | | $ | 538 | | $ | 321 | | $ | 208 | | $ | 4,931 | | $ | 1,651 | | $ | 3,174 | | $ | 941 | |
| | | | | | | | | | | | | | | | | | | | | | | | | | | | | | | | | | | | | | | | | |
Multifamily and other revenue | | | — | | | — | | | — | | | — | | | — | | | — | | | — | | | — | | | — | | | — | | | — | | | — | | | — | |
| | | | | | | | | | | | | | | | | | | | | | | | | | | | | | | | | | | | | | | | | |
Total operating revenue | | $ | 717 | | $ | 769 | | $ | 684 | | $ | 448 | | $ | 984 | | $ | 370 | | $ | 538 | | $ | 321 | | $ | 208 | | $ | 4,931 | | $ | 1,651 | | $ | 3,174 | | $ | 941 | |
| | | | | | | | | | | | | | | | | | | | | | | | | | | | | | | | | | | | | | | | | |
Total operating expenses | | $ | (391 | ) | $ | (319 | ) | $ | (600 | ) | $ | (363 | ) | $ | (484 | ) | $ | (221 | ) | $ | (222 | ) | $ | (206 | ) | $ | (109 | ) | $ | (1,866 | ) | $ | (1,320 | ) | $ | (1,023 | ) | $ | (394 | ) |
| | | | | | | | | | | | | | | | | | | | | | | | | | | | | | | | | | | | | | | | | |
Operating revenues in excess of expenses | | $ | 326 | | $ | 450 | | $ | 84 | | $ | 85 | | $ | 500 | | $ | 149 | | $ | 316 | | $ | 115 | | $ | 99 | | $ | 3,065 | | $ | 331 | | $ | 2,151 | | $ | 547 | |
| | | | | | | | | | | | | | | | | | | | | | | | | | | | | | | | | | | | | | | | | |
Adjustments to arrive at adjusted historical asset-level NOI | | | | | | | | | | | | | | | | | | | | | | | | | | | | | | | | | | | | | | | | |
Straight-line Rent Adjustment | | $ | 186 | | $ | (18 | ) | $ | (283 | ) | $ | (32 | ) | $ | (66 | ) | $ | 1 | | $ | — | | $ | 7 | | $ | 2 | | $ | (59 | ) | $ | (195 | ) | $ | 119 | | $ | 9 | |
Related party management fees | | | 26 | | | 24 | | | 15 | | | 12 | | | 26 | | | 15 | | | 16 | | | 15 | | | 15 | | | 128 | | | 44 | | | 90 | | | 16 | |
| | | | | | | | | | | | | | | | | | | | | | | | | | | | | | | | | | | | | | | | | |
Total adjustments to arrive at adjusted historical asset-level NOI | | $ | 212 | | $ | 6 | | $ | (268 | ) | $ | (20 | ) | $ | (40 | ) | $ | 16 | | $ | 16 | | $ | 22 | | $ | 17 | | $ | 69 | | $ | (151 | ) | $ | 209 | | $ | 25 | |
| | | | | | | | | | | | | | | | | | | | | | | | | | | | | | | | | | | | | | | | | |
Adjusted Historical Asset-Level NOI (Loss) | | $ | 538 | | $ | 456 | | $ | (184 | ) | $ | 65 | | $ | 460 | | $ | 165 | | $ | 332 | | $ | 137 | | $ | 116 | | $ | 3,134 | | $ | 180 | | $ | 2,360 | | $ | 572 | |
| | | | | | | | | | | | | | | | | | | | | | | | | | | | | | | | | | | | | | | | | |
| | | | | | | | | | | | | | | | | | | | | | | | | | | | | | | | | | | | | | | | | |
| | | | | | | | | | | | | | | | | | | | | | | | | | | | | | | | | | | | | | | | | |
Abatements | | $ | — | | $ | 48 | | $ | 266 | | $ | 39 | | $ | 66 | | $ | — | | $ | — | | $ | — | | $ | — | | $ | 63 | | $ | 240 | | $ | — | | $ | — | |
| | | | | | | | | | | | | | | | | | | | | | | | | | | | | | | | | | | | | | | | | |
Adjusted Historical Asset-Level NOI, Before Rent Abatements | | $ | 538 | | $ | 504 | | $ | 82 | | $ | 104 | | $ | 526 | | $ | 165 | | $ | 332 | | $ | 137 | | $ | 116 | | $ | 3,197 | | $ | 420 | | $ | 2,360 | | $ | 572 | |
| | | | | | | | | | | | | | | | | | | | | | | | | | | | | | | | | | | | | | | | | |
| | | | | | | | | | | | | | | | | | | | | | | | | | | | | | | | | | | | | | | | | |
| | | | | | | | | | | | | | | | | | | | | | | | | | | | | | | | | | | | | | | | | |
Annualized Adjusted Historical Asset-Level NOI, Before Rent Abatements(1) | | $ | 2,152 | | $ | 2,016 | | $ | 328 | | $ | 416 | | $ | 2,104 | | $ | 660 | | $ | 1,328 | | $ | 548 | | $ | 464 | | $ | 12,788 | | $ | 1,680 | | $ | 9,440 | | $ | 2,288 | |
| | | | | | | | | | | | | | | | | | | | | | | | | | | | | | | | | | | | | | | | | |
| | | | | | | | | | | | | | | | | | | | | | | | | | | | | | | | | | | | | | | | | |
| | | | | | | | | | | | | | | | | | | | | | | | | | | | | | | | | | | | | | | | | |
At JBG's Share(2) | | | | | | | | | | | | | | | | | | | | | | | | | | | | | | | | | | | | | | | | |
JBG share of Annualized Adjusted Historical Asset-Level NOI(3) | | $ | 2,152 | | $ | 1,824 | | $ | (740 | ) | $ | 260 | | $ | 1,840 | | $ | 660 | | $ | 1,324 | | $ | 548 | | $ | 304 | | $ | 6,140 | | $ | 348 | | $ | 944 | | $ | 232 | |
JBG share of Annualized Adjusted Historical Asset-Level NOI, Before Rent Abatements | | | 2,152 | | | 2,016 | | | 324 | | | 416 | | | 2,104 | | | 660 | | | 1,324 | | | 548 | | | 304 | | | 6,264 | | | 820 | | | 944 | | | 232 | |
Additional Information | | | | | | | | | | | | | | | | | | | | | | | | | | | | | | | | | | | | | | | | |
Base rent of signed leases, not commenced (at 100 percent share)(4) | | $ | — | | $ | 95 | | $ | — | | $ | 6 | | $ | — | | $ | — | | $ | — | | $ | — | | $ | — | | $ | — | | $ | 1,477 | | $ | 193 | | $ | — | |
JBG share of base rent of signed leases, not commenced(2)(4) | | | — | | | 95 | | | — | | | 6 | | | — | | | — | | | — | | | — | | | — | | | — | | | 724 | | | 19 | | | — | |
Percent ownership | | | 100.0 | % | | 100.0 | % | | 100.0 | % | | 100.0 | % | | 100.0 | % | | 100.0 | % | | 100.0 | % | | 100.0 | % | | 66.7 | % | | 49.0 | % | | 49.0 | % | | 10.0 | % | | 10.0 | % |
Percent occupied | | | 88.2 | % | | 77.0 | % | | 81.8 | % | | 86.7 | % | | 94.4 | % | | 89.8 | % | | 98.2 | % | | 55.8 | % | | 92.4 | % | | 88.1 | % | | 52.4 | % | | 94.3 | % | | 100.0 | % |
Percent leased | | | 88.2 | % | | 79.7 | % | | 81.8 | % | | 87.8 | % | | 94.7 | % | | 89.8 | % | | 98.2 | % | | 55.8 | % | | 92.4 | % | | 88.1 | % | | 63.4 | % | | 96.5 | % | | 100.0 | % |
- (1)
- Represents Adjusted Historical Asset-Level NOI, Before Rent Abatements multiplied by four.
- (2)
- Represents JBG's pro rata share of asset-level financial metrics based on JBG's ownership percentage as of March 31, 2016.
- (3)
- Represents JBG's share of Adjusted Historical Asset-Level NOI multiplied by four.
- (4)
- Represents base rent before abatements and straight line rent adjustments, plus estimated tenant reimbursements for the month in which the lease commences, multiplied by twelve. Triple net leases are converted to a gross basis by adding estimated tenant reimbursements to base rent. See "—Our Office Assets—Contractual Rent Abatement in Our Office Portfolio" for detail on rent abatements.
77
Office Asset-Level NOI Table
Three Months Ended March 31, 2016
| | | | | | | | | | | | | | | | | | | | | | | | | | | | | | | | | | | | | | | | | | | |
| | 5635 Fishers
Lane | | 5625 Fishers
Lane | |
| | NoBe II
Office | |
| | 12735 Twinbrook
Parkway | | 5640 Fishers
Lane | | 11333 Woodglen
Drive | | 12725 Twinbrook
Parkway | |
| |
| |
| |
| |
| |
|---|
| | Rosslyn
Gateway—
North | | Rosslyn
Gateway—
South | | 12440 Parklawn | | 16th &
I Street(5) | |
| | Incidental
Income | |
| |
|---|
| | The Foundry | |
| |
|---|
| | Rockville Pike
Corridor, MD | | Rockville Pike
Corridor, MD | | Rockville Pike
Corridor, MD | | Rockville Pike
Corridor, MD | | Rockville Pike
Corridor, MD | | Rockville Pike
Corridor, MD | | Rockville Pike
Corridor, MD | | Rockville Pike
Corridor, MD | | Total
Office | |
|---|
| | Rosslyn, VA | | Rosslyn, VA | | CBD, DC | | Georgetown, DC | | Various | |
|---|
Base rent | | $ | 1,619 | | $ | 1,349 | | $ | 1,133 | | $ | 209 | | $ | 633 | | $ | 538 | | $ | 442 | | $ | 506 | | $ | 341 | | $ | 178 | | $ | — | | $ | 1,824 | | $ | 1,042 | | $ | 63,798 | |
Tenant expense recoveries | | | 127 | | | 823 | | | 44 | | | 30 | | | 33 | | | 625 | | | 520 | | | 74 | | | 218 | | | 37 | | | — | | | 45 | | | 52 | | | 10,316 | |
Other operating revenue | | | 351 | | | — | | | 114 | | | — | | | 65 | | | — | | | — | | | — | | | 3 | | | — | | | — | | | 238 | | | 165 | | | 5,459 | |
| | | | | | | | | | | | | | | | | | | | | | | | | | | | | | | | | | | | | | | | | | | | |
Total office and retail revenue | | $ | 2,097 | | $ | 2,172 | | $ | 1,291 | | $ | 239 | | $ | 731 | | $ | 1,163 | | $ | 962 | | $ | 580 | | $ | 562 | | $ | 215 | | $ | — | | $ | 2,107 | | $ | 1,259 | | $ | 79,573 | |
| | | | | | | | | | | | | | | | | | | | | | | | | | | | | | | | | | | | | | | | | | | | |
Multifamily and other revenue | | | — | | | — | | | — | | | — | | | — | | | — | | | — | | | — | | | — | | | — | | | — | | | — | | | — | | | — | |
| | | | | | | | | | | | | | | | | | | | | ��� | | | | | | | | | | | | | | | | | | | | | | | |
Total operating revenue | | $ | 2,097 | | $ | 2,172 | | $ | 1,291 | | $ | 239 | | $ | 731 | | $ | 1,163 | | $ | 962 | | $ | 580 | | $ | 562 | | $ | 215 | | $ | — | | $ | 2,107 | | $ | 1,259 | | $ | 79,573 | |
| | | | | | | | | | | | | | | | | | | | | | | | | | | | | | | | | | | | | | | | | | | | |
Total operating expenses | | $ | (773 | ) | $ | (1,022 | ) | $ | (458 | ) | $ | (432 | ) | $ | (347 | ) | $ | (749 | ) | $ | (641 | ) | $ | (402 | ) | $ | (293 | ) | $ | (50 | ) | $ | — | | $ | (1,083 | ) | $ | (1,136 | ) | $ | (32,860 | ) |
| | | | | | | | | | | | | | | | | | | | | | | | | | | | | | | | | | | | | | | | | | | | |
Operating revenues in excess of expenses | | $ | 1,324 | | $ | 1,150 | | $ | 833 | | $ | (193 | ) | $ | 384 | | $ | 414 | | $ | 321 | | $ | 178 | | $ | 269 | | $ | 165 | | $ | — | | $ | 1,024 | | $ | 123 | | $ | 46,713 | |
| | | | | | | | | | | | | | | | | | | | | | | | | | | | | | | | | | | | | | | | | | | | |
Adjustments to arrive at adjusted historical asset-level NOI | | | | | | | | | | | | | | | | | | | | | | | | | | | | | | | | | | | | | | | | | | | |
Straight-line Rent Adjustment | | $ | 73 | | $ | 34 | | $ | (87 | ) | $ | 6 | | $ | 18 | | $ | 19 | | $ | 27 | | $ | (11 | ) | $ | (43 | ) | $ | (71 | ) | $ | — | | $ | (150 | ) | $ | 33 | | $ | (462 | ) |
Related party management fees | | | 66 | | | 49 | | | 33 | | | 7 | | | 22 | | | 20 | | | 14 | | | 18 | | | 16 | | | 8 | | | — | | | 85 | | | 53 | | | 2,467 | |
| | | | | | | | | | | | | | | | | | | | | | | | | | | | | | | | | | | | | | | | | | | | |
Total adjustments to arrive at adjusted historical asset-level NOI | | $ | 139 | | $ | 83 | | $ | (54 | ) | $ | 13 | | $ | 40 | | $ | 39 | | $ | 41 | | $ | 7 | | $ | (27 | ) | $ | (63 | ) | $ | — | | $ | (65 | ) | $ | 86 | | $ | 2,005 | |
| | | | | | | | | | | | | | | | | | | | | | | | | | | | | | | | | | | | | | | | | | | | |
Adjusted Historical Asset-Level NOI (Loss) | | $ | 1,463 | | $ | 1,233 | | $ | 779 | | $ | (180 | ) | $ | 424 | | $ | 453 | | $ | 362 | | $ | 185 | | $ | 242 | | $ | 102 | | $ | — | | $ | 959 | | $ | 209 | | $ | 48,718 | |
| | | | | | | | | | | | | | | | | | | | | | | | | | | | | | | | | | | | | | | | | | | | |
| | | | | | | | | | | | | | | | | | | | | | | | | | | | | | | | | | | | | | | | | | | | |
| | | | | | | | | | | | | | | | | | | | | | | | | | | | | | | | | | | | | | | | | | | | |
Abatements | | $ | — | | $ | — | | $ | 138 | | $ | 3 | | $ | 4 | | $ | — | | $ | — | | $ | 20 | | $ | 60 | | $ | 53 | | $ | — | | $ | 194 | | $ | 43 | | $ | 3,044 | |
| | | | | | | | | | | | | | | | | | | | | | | | | | | | | | | | | | | | | | | | | | | | |
Adjusted Historical Asset-Level NOI, Before Rent Abatements | | $ | 1,463 | | $ | 1,233 | | $ | 917 | | $ | (177 | ) | $ | 428 | | $ | 453 | | $ | 362 | | $ | 205 | | $ | 302 | | $ | 155 | | $ | — | | $ | 1,153 | | $ | 252 | | $ | 51,762 | |
| | | | | | | | | | | | | | | | | | | | | | | | | | | | | | | | | | | | | | | | | | | | |
| | | | | | | | | | | | | | | | | | | | | | | | | | | | | | | | | | | | | | | | | | | | |
| | | | | | | | | | | | | | | | | | | | | | | | | | | | | | | | | | | | | | | | | | | | |
Annualized Adjusted Historical Asset-Level NOI, Before Rent Abatements(1) | | $ | 5,852 | | $ | 4,932 | | $ | 3,668 | | $ | (708 | ) | $ | 1,712 | | $ | 1,812 | | $ | 1,448 | | $ | 820 | | $ | 1,208 | | $ | 620 | | $ | — | | $ | 4,612 | | $ | 1,008 | | $ | 207,048 | |
| | | | | | | | | | | | | | | | | | | | | | | | | | | | | | | | | | | | | | | | | | | | |
| | | | | | | | | | | | | | | | | | | | | | | | | | | | | | | | | | | | | | | | | | | | |
| | | | | | | | | | | | | | | | | | | | | | | | | | | | | | | | | | | | | | | | | | | | |
At JBG's Share(2) | | | | | | | | | | | | | | | | | | | | | | | | | | | | | | | | | | | | | | | | | | | |
JBG share of Annualized Adjusted Historical Asset-Level NOI(3) | | $ | 588 | | $ | 488 | | $ | 568 | | $ | (128 | ) | $ | 304 | | $ | 176 | | $ | 148 | | $ | 132 | | $ | 100 | | $ | 72 | | $ | — | | $ | 380 | | $ | 832 | | $ | 143,428 | |
JBG share of Annualized Adjusted Historical Asset-Level NOI, Before Rent Abatements | | | 588 | | | 488 | | | 668 | | | (124 | ) | | 308 | | | 176 | | | 148 | | | 148 | | | 124 | | | 112 | | | — | | | 456 | | | 1,004 | | | 153,364 | |
Additional Information | | | | | | | | | | | | | | | | | | | | | | | | | | | | | | | | | | | | | | | | | | | |
Base rent of signed leases, not commenced (at 100 percent share)(4) | | $ | — | | $ | — | | $ | 33 | | $ | — | | $ | — | | $ | — | | $ | — | | $ | 73 | | $ | — | | $ | — | | $ | 7,774 | | $ | — | | $ | — | | $ | 10,945 | |
JBG share of base rent of signed leases, not commenced(2)(4) | | | — | | | — | | | 6 | | | — | | | — | | | — | | | — | | | 13 | | | — | | | — | | | 5,588 | | | — | | | — | | | 7,745 | |
Percent ownership | | | 10.0 | % | | 10.0 | % | | 18.0 | % | | 18.0 | % | | 18.0 | % | | 10.0 | % | | 10.0 | % | | 18.0 | % | | 10.0 | % | | 18.0 | % | | 71.9 | % | | 9.9 | % | | 100.0 | % | | | |
Percent occupied | | | 100.0 | % | | 100.0 | % | | 87.0 | % | | 29.8 | % | | 87.9 | % | | 100.0 | % | | 100.0 | % | | 90.8 | % | | 100.0 | % | | 100.0 | % | | 0.0 | % | | 76.2 | % | | 0.0 | % | | | |
Percent leased | | | 100.0 | % | | 100.0 | % | | 87.6 | % | | 29.8 | % | | 87.9 | % | | 100.0 | % | | 100.0 | % | | 94.9 | % | | 100.0 | % | | 100.0 | % | | 72.5 | % | | 76.2 | % | | 0.0 | % | | | |
- (1)
- Represents Adjusted Historical Asset-Level NOI, Before Rent Abatements multiplied by four.
- (2)
- Represents JBG's pro rata share of asset-level financial metrics based on JBG's ownership percentage as of March 31, 2016.
- (3)
- Represents JBG's share of Adjusted Historical Asset-Level NOI multiplied by four.
- (4)
- Represents base rent before abatements and straight line rent adjustments, plus estimated tenant reimbursements for the month in which the lease commences, multiplied by twelve. Triple net leases are converted to a gross basis by adding estimated tenant reimbursements to base rent. See "—Our Office Assets—Contractual Rent Abatement in Our Office Portfolio" for detail on rent abatements.
- (5)
- Denotes assets that were acquired or delivered in the first quarter of 2016. Amounts shown represent a partial quarter.
78
Multifamily Asset-Level NOI Table
Three Months Ended March 31, 2016
| | | | | | | | | | | | | | | | | | | | | | | | | | | | | | | |
| | Kennedy
Row | | Hillwood | | Lynbrook | | Brookdale | | Meadowcreek | | Fairmont
Gardens | | Bennington
Crossings | | Falkland
Chase—South &
West | | Charter Oak | | Stoneridge | |
|---|
| | Capitol Hill,
DC | | I-395 Corridor,
VA | | I-395 Corridor,
VA | | I-395 Corridor,
VA | | I-395 Corridor,
VA | | Annandale,
VA | | I-395 Corridor,
VA | | Downtown Silver
Spring,
MD | | Reston,
VA | | I-395 Corridor,
VA | |
|---|
Base rent | | $ | — | | $ | — | | $ | — | | $ | — | | $ | — | | $ | — | | $ | — | | $ | — | | $ | — | | $ | — | |
Tenant expense recoveries | | | — | | | — | | | — | | | — | | | — | | | — | | | — | | | — | | | — | | | — | |
Other operating revenue | | | — | | | — | | | — | | | — | | | — | | | — | | | — | | | — | | | — | | | — | |
| | | | | | | | | | | | | | | | | | | | | | | | | | | | | | | | |
Total office and retail revenue | | $ | — | | $ | — | | $ | — | | $ | — | | $ | — | | $ | — | | $ | — | | $ | — | | $ | — | | $ | — | |
| | | | | | | | | | | | | | | | | | | | | | | | | | | | | | | | |
Multifamily and other revenue | | | 835 | | | 2,779 | | | 2,389 | | | 1,872 | | | 1,686 | | | 1,904 | | | 1,340 | | | 1,337 | | | 1,233 | | | 932 | |
| | | | | | | | | | | | | | | | | | | | | | | | | | | | | | | | |
Total operating revenue | | $ | 835 | | $ | 2,779 | | $ | 2,389 | | $ | 1,872 | | $ | 1,686 | | $ | 1,904 | | $ | 1,340 | | $ | 1,337 | | $ | 1,233 | | $ | 932 | |
| | | | | | | | | | | | | | | | | | | | | | | | | | | | | | | | |
Total operating expenses | | $ | (228 | ) | $ | (1,270 | ) | $ | (1,204 | ) | $ | (1,067 | ) | $ | (819 | ) | $ | (926 | ) | $ | (700 | ) | $ | (442 | ) | $ | (594 | ) | $ | (462 | ) |
| | | | | | | | | | | | | | | | | | | | | | | | | | | | | | | | |
Operating revenues in excess of expenses | | $ | 607 | | $ | 1,509 | | $ | 1,185 | | $ | 805 | | $ | 867 | | $ | 978 | | $ | 640 | | $ | 895 | | $ | 639 | | $ | 470 | |
| | | | | | | | | | | | | | | | | | | | | | | | | | | | | | | | |
Adjustments to arrive at adjusted historical asset-level NOI | | | | | | | | | | | | | | | | | | | | | | | | | | | | | | | |
Straight-line Rent Adjustment | | $ | — | | $ | — | | $ | — | | $ | — | | $ | — | | $ | — | | $ | — | | $ | — | | $ | — | | $ | — | |
Related party management fees | | | 34 | | | 106 | | | 95 | | | 74 | | | 67 | | | 75 | | | 53 | | | 49 | | | 50 | | | 37 | |
| | | | | | | | | | | | | | | | | | | | | | | | | | | | | | | | |
Total adjustments to arrive at adjusted historical asset-level NOI | | $ | 34 | | $ | 106 | | $ | 95 | | $ | 74 | | $ | 67 | | $ | 75 | | $ | 53 | | $ | 49 | | $ | 50 | | $ | 37 | |
| | | | | | | | | | | | | | | | | | | | | | | | | | | | | | | | |
Adjusted Historical Asset-Level NOI (Loss) | | $ | 641 | | $ | 1,615 | | $ | 1,280 | | $ | 879 | | $ | 934 | | $ | 1,053 | | $ | 693 | | $ | 944 | | $ | 689 | | $ | 507 | |
| | | | | | | | | | | | | | | | | | | | | | | | | | | | | | | | |
| | | | | | | | | | | | | | | | | | | | | | | | | | | | | | | | |
| | | | | | | | | | | | | | | | | | | | | | | | | | | | | | | | |
Abatements | | $ | 27 | | $ | 56 | | $ | 6 | | $ | 7 | | $ | 7 | | $ | 4 | | $ | 3 | | $ | 17 | | $ | 6 | | $ | 7 | |
| | | | | | | | | | | | | | | | | | | | | | | | | | | | | | | | |
Adjusted Historical Asset-Level NOI, Before Rent Abatements | | $ | 668 | | $ | 1,671 | | $ | 1,286 | | $ | 886 | | $ | 941 | | $ | 1,057 | | $ | 696 | | $ | 961 | | $ | 695 | | $ | 514 | |
| | | | | | | | | | | | | | | | | | | | | | | | | | | | | | | | |
| | | | | | | | | | | | | | | | | | | | | | | | | | | | | | | | |
| | | | | | | | | | | | | | | | | | | | | | | | | | | | | | | | |
Annualized Adjusted Historical Asset-Level NOI, Before Rent Abatements(1) | | $ | 2,672 | | $ | 6,684 | | $ | 5,144 | | $ | 3,544 | | $ | 3,764 | | $ | 4,228 | | $ | 2,784 | | $ | 3,844 | | $ | 2,780 | | $ | 2,056 | |
| | | | | | | | | | | | | | | | | | | | | | | | | | | | | | | | |
| | | | | | | | | | | | | | | | | | | | | | | | | | | | | | | | |
| | | | | | | | | | | | | | | | | | | | | | | | | | | | | | | | |
At JBG's Share(2) | | | | | | | | | | | | | | | | | | | | | | | | | | | | | | | |
JBG share of Annualized Adjusted Historical Asset-Level NOI(3) | | $ | 2,308 | | $ | 6,460 | | $ | 5,120 | | $ | 3,516 | | $ | 3,736 | | $ | 4,212 | | $ | 2,772 | | $ | 3,776 | | $ | 2,756 | | $ | 2,028 | |
JBG share of Annualized Adjusted Historical Asset-Level NOI, Before Rent Abatements | | | 2,404 | | | 6,684 | | | 5,144 | | | 3,544 | | | 3,764 | | | 4,228 | | | 2,784 | | | 3,844 | | | 2,780 | | | 2,056 | |
Additional Information | | | | | | | | | | | | | | | | | | | | | | | | | | | | | | | |
Base rent of signed leases, not commenced (at 100 percent share)(4) | | $ | — | | $ | — | | $ | — | | $ | — | | $ | — | | $ | — | | $ | — | | $ | — | | $ | — | | $ | — | |
JBG share of base rent of signed leases, not commenced(2)(4) | | | — | | | — | | | — | | | — | | | — | | | — | | | — | | | — | | | — | | | — | |
Percent ownership | | | 90.0 | % | | 100.0 | % | | 100.0 | % | | 100.0 | % | | 100.0 | % | | 100.0 | % | | 100.0 | % | | 100.0 | % | | 100.0 | % | | 100.0 | % |
Percent occupied | | | 92.9 | % | | 94.8 | % | | 95.8 | % | | 92.2 | % | | 94.2 | % | | 92.8 | % | | 89.0 | % | | 94.0 | % | | 91.6 | % | | 94.4 | % |
Percent leased | | | 96.5 | % | | 96.5 | % | | 97.0 | % | | 95.1 | % | | 95.4 | % | | 96.4 | % | | 91.6 | % | | 95.5 | % | | 94.3 | % | | 96.5 | % |
- (1)
- Represents Adjusted Historical Asset-Level NOI, Before Rent Abatements multiplied by four.
- (2)
- Represents JBG's pro rata share of asset-level financial metrics based on JBG's ownership percentage as of March 31, 2016.
- (3)
- Represents JBG's share of Adjusted Historical Asset-Level NOI multiplied by four.
- (4)
- Represents base rent before abatements and straight line rent adjustments, plus estimated tenant reimbursements for the month in which the lease commences, multiplied by twelve. Triple net leases are converted to a gross basis by adding estimated tenant reimbursements to base rent. See "—Our Retail Assets—Contractual Rent Abatement in Our Retail Portfolio" for detail on rent abatements.
79
Multifamily Asset-Level NOI Table
Three Months Ended March 31, 2016
| | | | | | | | | | | | | | | | | | | | | | | | | | | | | | | |
| | Falkland
Chase—
North | |
| | The
Alaire | |
| |
| |
| |
| |
| | The
Terano | |
| |
|---|
| | The
Gale | |
| | Fort
Totten
Square | | Atlantic
Plumbing | | Galvan | |
| |
| |
|---|
| | Fairway
Apartments | | Notch 8 | |
| |
|---|
| | Downtown
Silver
Spring,
MD | | Rockville
Pike
Corridor,
MD | | Rockville
Pike
Corridor,
MD | | Rockville
Pike
Corridor,
MD | |
| |
|---|
| | H Street/
NoMa,
DC | | Brookland/
Fort
Totten, DC | | U Street/
Shaw,
DC | | Potomac
Yard, VA | | Total
Multifamily | |
|---|
| | Reston, VA | |
|---|
Base rent | | $ | — | | $ | — | | $ | — | | $ | — | | $ | — | | $ | — | | $ | — | | $ | — | | $ | — | | $ | — | |
Tenant expense recoveries | | | — | | | — | | | — | | | — | | | — | | | — | | | — | | | — | | | — | | | — | |
Other operating revenue | | | — | | | — | | | — | | | — | | | — | | | — | | | — | | | — | | | — | | | — | |
| | | | | | | | | | | | | | | | | | | | | | | | | | | | | | | | |
Total office and retail revenue | | $ | — | | $ | — | | $ | — | | $ | — | | $ | — | | $ | — | | $ | — | | $ | — | | $ | — | | $ | — | |
| | | | | | | | | | | | | | | | | | | | | | | | | | | | | | | | |
Multifamily and other revenue | | | 756 | | | 3,529 | | | 1,514 | | | 1,731 | | | 848 | | | 333 | | | 219 | | | 574 | | | 1,145 | | | 26,956 | |
| | | | | | | | | | | | | | | | | | | | | | | | | | | | | | | | |
Total operating revenue | | $ | 756 | | $ | 3,529 | | $ | 1,514 | | $ | 1,731 | | $ | 848 | | $ | 333 | | $ | 219 | | $ | 574 | | $ | 1,145 | | $ | 26,956 | |
| | | | | | | | | | | | | | | | | | | | | | | | | | | | | | | | |
Total operating expenses | | $ | (298 | ) | $ | (964 | ) | $ | (613 | ) | $ | (812 | ) | $ | (510 | ) | $ | (561 | ) | $ | (431 | ) | $ | (559 | ) | $ | (640 | ) | $ | (13,100 | ) |
| | | | | | | | | | | | | | | | | | | | | | | | | | | | | | | | |
Operating revenues in excess of expenses | | $ | 458 | | $ | 2,565 | | $ | 901 | | $ | 919 | | $ | 338 | | $ | (228 | ) | $ | (212 | ) | $ | 15 | | $ | 505 | | $ | 13,856 | |
| | | | | | | | | | | | | | | | | | | | | | | | | | | | | | | | |
Adjustments to arrive at adjusted historical asset-level NOI | | | | | | | | | | | | | | | | | | | | | | | | | | | | | | | |
Straight-line Rent Adjustment | | $ | — | | $ | — | | $ | 1 | | $ | — | | $ | — | | $ | (32 | ) | $ | — | | $ | — | | $ | (56 | ) | $ | (87 | ) |
Related party management fees | | | 30 | | | 140 | | | 63 | | | 69 | | | 32 | | | 25 | | | 15 | | | 20 | | | 56 | | | 1,090 | |
| | | | | | | | | | | | | | | | | | | | | | | | | | | | | | | | |
Total adjustments to arrive at adjusted historical asset-level NOI | | $ | 30 | | $ | 140 | | $ | 64 | | $ | 69 | | $ | 32 | | $ | (7 | ) | $ | 15 | | $ | 20 | | $ | — | | $ | 1,003 | |
| | | | | | | | | | | | | | | | | | | | | | | | | | | | | | | | |
Adjusted Historical Asset-Level NOI (Loss) | | $ | 488 | | $ | 2,705 | | $ | 965 | | $ | 988 | | $ | 370 | | $ | (235 | ) | $ | (197 | ) | $ | 35 | | $ | 505 | | $ | 14,859 | |
| | | | | | | | | | | | | | | | | | | | | | | | | | | | | | | | |
| | | | | | | | | | | | | | | | | | | | | | | | | | | | | | | | |
| | | | | | | | | | | | | | | | | | | | | | | | | | | | | | | | |
Abatements | | $ | 8 | | $ | 232 | | $ | 48 | | $ | 7 | | $ | 184 | | $ | 192 | | $ | 105 | | $ | 188 | | $ | 81 | | $ | 1,185 | |
| | | | | | | | | | | | | | | | | | | | | | | | | | | | | | | | |
Adjusted Historical Asset-Level NOI, Before Rent Abatements | | $ | 496 | | $ | 2,937 | | $ | 1,013 | | $ | 995 | | $ | 554 | | $ | (43 | ) | $ | (92 | ) | $ | 223 | | $ | 586 | | $ | 16,044 | |
| | | | | | | | | | | | | | | | | | | | | | | | | | | | | | | | |
| | | | | | | | | | | | | | | | | | | | | | | | | | | | | | | | |
| | | | | | | | | | | | | | | | | | | | | | | | | | | | | | | | |
Annualized Adjusted Historical Asset-Level NOI, Before Rent Abatements(1) | | $ | 1,984 | | $ | 11,748 | | $ | 4,052 | | $ | 3,980 | | $ | 2,216 | | $ | (172 | ) | $ | (368 | ) | $ | 892 | | $ | 2,344 | | $ | 64,176 | |
| | | | | | | | | | | | | | | | | | | | | | | | | | | | | | | | |
| | | | | | | | | | | | | | | | | | | | | | | | | | | | | | | | |
| | | | | | | | | | | | | | | | | | | | | | | | | | | | | | | | |
At JBG's Share(2) | | | | | | | | | | | | | | | | | | | | | | | | | | | | | | | |
JBG share of Annualized Adjusted Historical Asset-Level NOI(3) | | $ | 1,952 | | $ | 540 | | $ | 696 | | $ | 396 | | $ | 1,472 | | $ | (604 | ) | $ | (12 | ) | $ | 20 | | $ | 40 | | $ | 41,184 | |
JBG share of Annualized Adjusted Historical Asset-Level NOI, Before Rent Abatements | | | 1,984 | | | 588 | | | 732 | | | 400 | | | 2,204 | | | (112 | ) | | (4 | ) | | 132 | | | 44 | | | 43,200 | |
Additional Information | | | | | | | | | | | | | | | | | | | | | | | | | | | | | | | |
Base rent of signed leases, not commenced (at 100 percent share)(4) | | $ | — | | $ | 36 | | $ | — | | $ | — | | $ | — | | $ | 241 | | $ | — | | $ | — | | $ | 42 | | $ | 319 | |
JBG share of base rent of signed leases, not commenced(2)(4) | | | — | | | 2 | | | — | | | — | | | — | | | 154 | | | — | | | — | | | 1 | | | 157 | |
Percent ownership | | | 100.0 | % | | 5.0 | % | | 18.0 | % | | 10.0 | % | | 99.4 | % | | 64.0 | % | | 1.8 | % | | 14.7 | % | | 1.8 | % | | | |
Percent occupied | | | 94.0 | % | | 89.1 | % | | 91.0 | % | | 95.4 | % | | 56.5 | % | | 26.1 | % | | 23.0 | % | | 54.5 | % | | 87.9 | % | | | |
Percent leased | | | 96.7 | % | | 91.9 | % | | 96.8 | % | | 96.2 | % | | 62.3 | % | | 37.4 | % | | 33.1 | % | | 64.4 | % | | 93.0 | % | | | |
- (1)
- Represents Adjusted Historical Asset-Level NOI, Before Rent Abatements multiplied by four.
- (2)
- Represents JBG's pro rata share of asset-level financial metrics based on JBG's ownership percentage as of March 31, 2016.
- (3)
- Represents JBG's share of Adjusted Historical Asset-Level NOI multiplied by four.
- (4)
- Represents base rent before abatements and straight line rent adjustments, plus estimated tenant reimbursements for the month in which the lease commences, multiplied by twelve. Triple net leases are converted to a gross basis by adding estimated tenant reimbursements to base rent. See "—Our Retail Assets—Contractual Rent Abatement in Our Retail Portfolio" for detail on rent abatements.
80
Retail Asset-Level NOI Table
Three Months Ended March 31, 2016
| | | | | | | | | | | | | | | | | | | | | | | | | |
| | Old Centreville
Crossing | | Fort Totten
Square Retail | |
| | La Plata
Shopping Center | |
| | North End
Retail I | |
| | Leesburg
Pike Retail | |
|---|
| | Takoma-Langley
Crossroads
Center | | The Shops At
Mark Center | | Vienna
Walgreens | |
|---|
| | Rt. 28 South/
Chantilly, VA | | Brookland/Fort
Totten, DC | | Suburban
Maryland, MD | | U Street/
Shaw, DC | | Tysons
Corner, VA | |
|---|
| | Takoma, MD | | I-395 Corridor, VA | | Vienna, VA | |
|---|
Base rent | | $ | 1,047 | | $ | 318 | | $ | 874 | | $ | 304 | | $ | 425 | | $ | 172 | | $ | 269 | | $ | 163 | |
Tenant expense recoveries | | | 340 | | | 105 | | | 102 | | | 77 | | | 121 | | | 46 | | | — | | | — | |
Other operating revenue | | | 3 | | | 45 | | | 62 | | | — | | | 2 | | | 28 | | | — | | | — | |
| | | | | | | | | | | | | | | | | | | | | | | | | | |
Total office and retail revenue | | $ | 1,390 | | $ | 468 | | $ | 1,038 | | $ | 381 | | $ | 548 | | $ | 246 | | $ | 269 | | $ | 163 | |
| | | | | | | | | | | | | | | | | | | | | | | | | | |
Multifamily and other revenue | | | — | | | — | | | — | | | — | | | — | | | — | | | — | | | — | |
| | | | | | | | | | | | | | | | | | | | | | | | | | |
Total operating revenue | | $ | 1,390 | | $ | 468 | | $ | 1,038 | | $ | 381 | | $ | 548 | | $ | 246 | | $ | 269 | | $ | 163 | |
| | | | | | | | | | | | | | | | | | | | | | | | | | |
Total operating expenses | | $ | (378 | ) | $ | (248 | ) | $ | (303 | ) | $ | (118 | ) | $ | (180 | ) | $ | (159 | ) | $ | (86 | ) | $ | (13 | ) |
| | | | | | | | | | | | | | | | | | | | | | | | | | |
Operating revenues in excess of expenses | | $ | 1,012 | | $ | 220 | | $ | 735 | | $ | 263 | | $ | 368 | | $ | 87 | | $ | 183 | | $ | 150 | |
| | | | | | | | | | | | | | | | | | | | | | | | | | |
Adjustments to arrive at adjusted historical asset-level NOI | | | | | | | | | | | | | | | | | | | | | | | | | |
Straight-line Rent Adjustment | | $ | (73 | ) | $ | 2 | | $ | (41 | ) | $ | (5 | ) | $ | 2 | | $ | (76 | ) | $ | (4 | ) | $ | — | |
Related party management fees | | | 53 | | | 16 | | | 41 | | | 15 | | | 22 | | | 11 | | | 16 | | | 7 | |
| | | | | | | | | | | | | | | | | | | | | | | | | | |
Total adjustments to arrive at adjusted historical asset-level NOI | | $ | (20 | ) | $ | 18 | | $ | — | | $ | 10 | | $ | 24 | | $ | (65 | ) | $ | 12 | | $ | 7 | |
| | | | | | | | | | | | | | | | | | | | | | | | | | |
Adjusted Historical Asset-Level NOI (Loss) | | $ | 992 | | $ | 238 | | $ | 735 | | $ | 273 | | $ | 392 | | $ | 22 | | $ | 195 | | $ | 157 | |
| | | | | | | | | | | | | | | | | | | | | | | | | | |
| | | | | | | | | | | | | | | | | | | | | | | | | | |
| | | | | | | | | | | | | | | | | | | | | | | | | | |
Abatements | | $ | — | | $ | — | | $ | — | | $ | — | | $ | — | | $ | 23 | | $ | — | | $ | — | |
| | | | | | | | | | | | | | | | | | | | | | | | | | |
Adjusted Historical Asset-Level NOI, Before Rent Abatements | | $ | 992 | | $ | 238 | | $ | 735 | | $ | 273 | | $ | 392 | | $ | 45 | | $ | 195 | | $ | 157 | |
| | | | | | | | | | | | | | | | | | | | | | | | | | |
| | | | | | | | | | | | | | | | | | | | | | | | | | |
| | | | | | | | | | | | | | | | | | | | | | | | | | |
Annualized Adjusted Historical Asset-Level NOI, Before Rent Abatements(1) | | $ | 3,968 | | $ | 952 | | $ | 2,940 | | $ | 1,092 | | $ | 1,568 | | $ | 180 | | $ | 780 | | $ | 628 | |
| | | | | | | | | | | | | | | | | | | | | | | | | | |
| | | | | | | | | | | | | | | | | | | | | | | | | | |
| | | | | | | | | | | | | | | | | | | | | | | | | | |
At JBG's Share(2) | | | | | | | | | | | | | | | | | | | | | | | | | |
JBG share of Annualized Adjusted Historical Asset-Level NOI(3) | | $ | 3,928 | | $ | 944 | | $ | 2,904 | | $ | 1,080 | | $ | 1,568 | | $ | 88 | | $ | 772 | | $ | 620 | |
JBG share of Annualized Adjusted Historical Asset-Level NOI, Before Rent Abatements | | | 3,928 | | | 944 | | | 2,904 | | | 1,080 | | | 1,568 | | | 180 | | | 772 | | | 620 | |
Additional Information | | | | | | | | | | | | | | | | | | | | | | | | | |
Base rent of signed leases, not commenced (at 100 percent share)(4) | | $ | 58 | | $ | 280 | | $ | 321 | | $ | — | | $ | — | | $ | 129 | | $ | — | | $ | — | |
JBG share of base rent of signed leases, not commenced(2)(4) | | | 57 | | | 278 | | | 318 | | | — | | | — | | | 129 | | | — | | | — | |
Percent ownership | | | 99.0 | % | | 99.4 | % | | 99.0 | % | | 99.0 | % | | 100.0 | % | | 100.0 | % | | 99.0 | % | | 99.0 | % |
Percent occupied | | | 97.5 | % | | 94.0 | % | | 89.0 | % | | 100.0 | % | | 99.0 | % | | 86.5 | % | | 100.0 | % | | 100.0 | % |
Percent leased | | | 98.2 | % | | 98.7 | % | | 95.0 | % | | 100.0 | % | | 99.0 | % | | 95.8 | % | | 100.0 | % | | 100.0 | % |
- (1)
- Represents Adjusted Historical Asset-Level NOI, Before Rent Abatements multiplied by four.
- (2)
- Represents JBG's pro rata share of asset-level financial metrics based on JBG's ownership percentage as of March 31, 2016.
- (3)
- Represents JBG's share of Adjusted Historical Asset-Level NOI multiplied by four.
- (4)
- Represents base rent before abatements and straight line rent adjustments, plus estimated tenant reimbursements for the month in which the lease commences, multiplied by twelve. Triple net leases are converted to a gross basis by adding estimated tenant reimbursements to base rent. See "—Our Retail Assets—Contractual Rent Abatement in Our Retail Portfolio" for detail on rent abatements.
81
Retail Asset-Level NOI Table
Three Months Ended March 31, 2016
| | | | | | | | | | | | | | | | | | | | | | | | | |
| |
| |
| | Galvan
Retail | |
| |
| |
| | 275 N.
Washington | |
| |
|---|
| | Stonebridge at
Potomac Town
Center—Phase I | |
| | Notch 8
Retail | |
| |
| |
| |
|---|
| | L'Enfant
Plaza
Retail—West | | L'Enfant
Plaza
Retail—East | | Pikesville
Walgreens | |
| |
|---|
| | Rockville
Pike
Corridor,
MD | | Rockville
Pike
Corridor,
MD | |
| |
|---|
| | Prince
William
County, VA | | Potomac
Yard, VA | | Total
Retail | |
|---|
| | Southwest, DC | | Southwest, DC | | Pikesville, MD | |
|---|
Base rent | | $ | 2,780 | | $ | 460 | | $ | 737 | | $ | 538 | | $ | 403 | | $ | 170 | | $ | 159 | | $ | 8,819 | |
Tenant expense recoveries | | |
637 | | |
180 | | |
46 | | |
33 | | |
159 | | |
11 | | |
40 | | |
1,897 | |
Other operating revenue | | |
201 | | |
159 | | |
— | | |
— | | |
— | | |
— | | |
— | | |
500 | |
| | | | | | | | | | | | | | | | | | | | | | | | | | |
Total office and retail revenue | | $ | 3,618 | | $ | 799 | | $ | 783 | | $ | 571 | | $ | 562 | | $ | 181 | | $ | 199 | | $ | 11,216 | |
| | | | | | | | | | | | | | | | | | | | | | | | | | |
Multifamily and other revenue | | | — | | | — | | | — | | | — | | | — | | | — | | | — | | | — | |
| | | | | | | | | | | | | | | | | | | | | | | | | | |
Total operating revenue | | $ | 3,618 | | $ | 799 | | $ | 783 | | $ | 571 | | $ | 562 | | $ | 181 | | $ | 199 | | $ | 11,216 | |
| | | | | | | | | | | | | | | | | | | | | | | | | | |
Total operating expenses | | $ | (1,122 | ) | $ | (370 | ) | $ | (95 | ) | $ | (120 | ) | $ | (261 | ) | $ | (58 | ) | $ | (133 | ) | $ | (3,644 | ) |
| | | | | | | | | | | | | | | | | | | | | | | | | | |
Operating revenues in excess of expenses | | $ | 2,496 | | $ | 429 | | $ | 688 | | $ | 451 | | $ | 301 | | $ | 123 | | $ | 66 | | $ | 7,572 | |
| | | | | | | | | | | | | | | | | | | | | | | | | | |
Adjustments to arrive at adjusted historical asset-level NOI | | | | | | | | | | | | | | | | | | | | | | | | | |
Straight-line Rent Adjustment | | $ | (265 | ) | $ | (37 | ) | $ | (345 | ) | $ | (37 | ) | $ | (11 | ) | $ | — | | $ | (90 | ) | $ | (980 | ) |
Related party management fees | | | 126 | | | 20 | | | 30 | | | 17 | | | 17 | | | 9 | | | 6 | | | 406 | |
| | | | | | | | | | | | | | | | | | | | | | | | | | |
Total adjustments to arrive at adjusted historical asset-level NOI | | $ | (139 | ) | $ | (17 | ) | $ | (315 | ) | $ | (20 | ) | $ | 6 | | $ | 9 | | $ | (84 | ) | $ | (574 | ) |
| | | | | | | | | | | | | | | | | | | | | | | | | | |
Adjusted Historical Asset-Level NOI (Loss) | | $ | 2,357 | | $ | 412 | | $ | 373 | | $ | 431 | | $ | 307 | | $ | 132 | | $ | (18 | ) | $ | 6,998 | |
| | | | | | | | | | | | | | | | | | | | | | | | | | |
| | | | | | | | | | | | | | | | | | | | | | | | | | |
| | | | | | | | | | | | | | | | | | | | | | | | | | |
Abatements | | $ | 60 | | $ | 203 | | $ | — | | $ | — | | $ | 6 | | $ | — | | $ | 113 | | $ | 405 | |
| | | | | | | | | | | | | | | | | | | | | | | | | | |
Adjusted Historical Asset-Level NOI, Before Rent Abatements | | $ | 2,417 | | $ | 615 | | $ | 373 | | $ | 431 | | $ | 313 | | $ | 132 | | $ | 95 | | $ | 7,403 | |
| | | | | | | | | | | | | | | | | | | | | | | | | | |
| | | | | | | | | | | | | | | | | | | | | | | | | | |
| | | | | | | | | | | | | | | | | | | | | | | | | | |
Annualized Adjusted Historical Asset-Level NOI, Before Rent Abatements(1) | | $ | 9,668 | | $ | 2,460 | | $ | 1,492 | | $ | 1,724 | | $ | 1,252 | | $ | 528 | | $ | 380 | | $ | 29,612 | |
| | | | | | | | | | | | | | | | | | | | | | | | | | |
| | | | | | | | | | | | | | | | | | | | | | | | | | |
| | | | | | | | | | | | | | | | | | | | | | | | | | |
At JBG's Share(2) | | | | | | | | | | | | | | | | | | | | | | | | | |
JBG share of Annualized Adjusted Historical Asset-Level NOI(3) | | $ | 940 | | $ | 812 | | $ | 24 | | $ | 256 | | $ | 600 | | $ | 520 | | $ | (72 | ) | $ | 14,984 | |
JBG share of Annualized Adjusted Historical Asset-Level NOI, Before Rent Abatements | | | 964 | | | 1,208 | | | 24 | | | 256 | | | 612 | | | 520 | | | 380 | | | 15,960 | |
Additional Information | | |
| | |
| | |
| | |
| | |
| | |
| | |
| | |
| |
Base rent of signed leases, not commenced (at 100 percent share)(4) | | $ | 322 | | $ | 250 | | $ | 1,369 | | $ | — | | $ | — | | $ | 33 | | $ | — | | $ | 2,762 | |
JBG share of base rent of signed leases, not commenced(2)(4) | | | 32 | | | 122 | | | 25 | | | — | | | — | | | 33 | | | — | | | 994 | |
Percent ownership | | | 10.0 | % | | 49.0 | % | | 1.8 | % | | 14.7 | % | | 49.0 | % | | 99.0 | % | | 100.0 | % | | | |
Percent occupied | | | 90.5 | % | | 55.6 | % | | 68.3 | % | | 100.0 | % | | 90.5 | % | | 72.5 | % | | 48.7 | % | | | |
Percent leased | | | 91.8 | % | | 66.5 | % | | 92.5 | % | | 100.0 | % | | 90.5 | % | | 78.0 | % | | 48.7 | % | | | |
- (1)
- Represents Adjusted Historical Asset-Level NOI, Before Rent Abatements multiplied by four.
- (2)
- Represents JBG's pro rata share of asset-level financial metrics based on JBG's ownership percentage as of March 31, 2016.
- (3)
- Represents JBG's share of Adjusted Historical Asset-Level NOI multiplied by four.
- (4)
- Represents base rent before abatements and straight line rent adjustments, plus estimated tenant reimbursements for the month in which the lease commences, multiplied by twelve. Triple net leases are converted to a gross basis by adding estimated tenant reimbursements to base rent. See "—Our Retail Assets—Contractual Rent Abatement in Our Retail Portfolio" for detail on rent abatements.
82
Recent Developments
We have one pending acquisition as of the date of this document. Set forth below is a summary of this pending acquisition. There can be no assurance that this pending transaction will occur on the terms described below, or at all.
In April 2016, we entered into an agreement to purchase the fee simple interest in a 1.6 acre parcel in the Eckington neighborhood of Washington, DC, posting a $500,000 refundable deposit toward a total purchase price of $9.85 million. The property is currently improved with a 33,600 RSF industrial building which is 100 percent leased to two tenants. We intend to operate the asset in its current form through the duration of the in-place tenant's lease options, which span through 2028, after which we plan to redevelop the site by constructing approximately 320,000 SF of multifamily product. The transaction is expected to close in the third quarter of 2016.
Our Strategic Capital Business
Our strategic capital business provides fee-based services to a variety of real estate owners, including the real estate investment funds for which we have served as general partner or managing member, and joint ventures in which these investment funds have an interest. We expect that the fees we continue to earn in connection with providing such services will enhance our overall returns, and that our existing investment relationships will continue to provide us with potential capital sources and new investment opportunities.
In January 2016, we acquired the 66.67 percent interest that we did not own in JBG/Rosenfeld Retail Properties LLC, or JBGR, a company that provides property management, asset management, leasing and other related services for retail properties, including our retail properties. This acquisition enables us to provide a full range of real estate services for properties in all of our core asset classes—office, multifamily and retail. Because we already owned a 33.33 percent interest in JBGR, and shared certain administrative functions, we believe that JBGR's operations can be smoothly integrated into our platform.
Our strategic capital business provides a wide range of real estate services, including investment, development, asset and property management, leasing, construction management and other services. This business derives its revenue primarily from fees earned for providing such services. The substantial majority of these fees will be generated by providing services with respect to assets in which we have less than a 100 percent ownership interest and assets that are being retained by the investment funds and not contributed in the Combination Transactions, which we refer to as non-core excluded assets. We expect from time to time to provide real estate services to assets in which we do not have an ownership interest, particularly in situations where we might sell an asset to an institutional investor and continue to provide property management and leasing services for the new owner.
The primary revenue streams for our strategic capital business include the following:
- •
- Asset management. We provide asset management services to each of the investment funds and substantially all of the joint ventures in which we have an interest. These services include all aspects of asset management, including analyses regarding appropriate capital allocation and decisions with respect to all aspects of operation of an asset, such as identifying renovation/repositioning opportunities and strategic opportunities for pursuing sale or financing transactions.
83
- •
- Development and construction management. We provide development and construction management services for new development and redevelopment projects, as well as construction management for tenant improvement construction. We are experienced in all facets of development projects, including obtaining appropriate regulatory and zoning approvals, entering into contracts with general contractors and managing the construction process.
- •
- Property management. We provide property management services to the owners of residential communities, office buildings and retail properties. Our property management function provides "on the ground" intense management of an asset, as we seek to provide quality services for our tenants while identifying opportunities for increasing revenue and optimizing expenses for the building owner.
- •
- Leasing. We provide leasing services to the owners of office buildings and retail properties. We leverage our extensive existing relationships with major corporations and retailers to identify attractive leasing opportunities for the building owner.
- •
- Other Services. We also provide other ancillary services to property owners, such as legal, marketing and administrative support, for which we receive fees or reimbursements of our expenses.
Including the revenue generated by the retail portion of our management services business (which was not acquired until January 2016), our strategic capital business generated approximately $23.9 million and $115.1 million of revenue for the three months ended March 31, 2016 and the year ended December 31, 2015, respectively. After elimination of the fee streams earned for management of assets that will be consolidated in the combined company's financial statements on a going forward basis, we would have earned approximately $9.8 million and $49.0 million in revenue from such fees for the three months ended March 31, 2016 and the year ended December 31, 2015, respectively. The table below summarizes such fees for the three months ended March 31, 2016 and the year ended December 31, 2015. We expect to earn fees in the future from the JBG funds and our joint venture arrangements currently in place, as well as any future joint ventures or funds that we establish.
84
| | | | | | | | | | | | | | | | | | | |
| | Three Months Ended March 31, 2016 | | Year Ended December 31, 2015 | |
|---|
| | JBG/Operating
Partners, LLC
Revenues | | Elimination(1) | | Adjusted
JBG/Operating
Partners, LLC
Revenues | | JBG/Operating
Partners, LLC
Revenues | | Elimination(1) | | Adjusted
JBG/Operating
Partners, LLC
Revenues | |
|---|
Asset management fees | | $ | 10,266 | | $ | (6,562 | ) | $ | 3,704 | | $ | 46,108 | | $ | (31,995 | ) | $ | 14,113 | |
Property management fees | | | 5,225 | | | (2,683 | ) | | 2,542 | | | 16,648 | | | (8,614 | ) | | 8,034 | |
Leasing fees | | | 1,109 | | | (219 | ) | | 890 | | | 2,312 | | | (1,376 | ) | | 936 | |
Development fees | | | 4,117 | | | (2,740 | ) | | 1,377 | | | 26,230 | | | (17,690 | ) | | 8,540 | |
Construction management fees | | | 2,098 | | | (1,341 | ) | | 757 | | | 7,565 | | | (3,720 | ) | | 3,845 | |
Other service revenues | | | 1,095 | | | (545 | ) | | 550 | | | 4,838 | | | (1,635 | ) | | 3,203 | |
| | | | | | | | | | | | | | | | | | | | |
Total JBG/Operating Partners, LLC Revenues | | $ | 23,910 | | $ | (14,090 | ) | $ | 9,820 | | $ | 103,701 | | $ | (65,030 | ) | $ | 38,671 | |
| | | | | | | | | | | | | | | | | | | | |
Property management fees | | | | | | | | | | | $ | 3,708 | | $ | 64 | | $ | 3,772 | |
Leasing fees | | | | | | | | | | | | 4,576 | | | (678 | ) | | 3,898 | |
Development fees | | | | | | | | | | | | 1,863 | | | (314 | ) | | 1,549 | |
Construction management fees | | | | | | | | | | | | 739 | | | (142 | ) | | 597 | |
Other service revenues | | | | | | | | | | | | 500 | | | — | | | 500 | |
| | | | | | | | | | | | | | | | | | | | |
Total JBG/Rosenfeld Retail Properties, LLC Revenues | | | | | | | | | | | $ | 11,386 | | $ | (1,070 | ) | $ | 10,316 | |
| | | | | | | | | | | | | | | | | | | | |
Total Development, Management and Other Service Revenues | | $ | 23,910 | | $ | (14,090 | ) | $ | 9,820 | | $ | 115,087 | | $ | (66,100 | ) | $ | 48,987 | |
| | | | | | | | | | | | | | | | | | | | |
| | | | | | | | | | | | | | | | | | | | |
| | | | | | | | | | | | | | | | | | | | |
- (1)
- Calculated based on our anticipated accounting treatment under U.S. GAAP upon completion of the Combination Transactions.
Tangible Assets and Liabilities
The following table summarizes our tangible assets and liabilities as of March 31, 2016 (dollar amounts in thousands).
| | | | | | | |
| | As of March 31, 2016 | |
|---|
| | At 100
Percent
Share | | At
JBG
Share(1) | |
|---|
Cash and cash equivalents | | $ | 70,881 | | $ | 50,609 | |
Restricted cash | | | 109,498 | | | 83,573 | |
Accounts and other receivables | | | 35,993 | | | 27,528 | |
Prepaid expenses and other assets | | | 12,461 | | | 9,483 | |
| | | | | | | | |
Total tangible assets | | $ | 228,833 | | $ | 171,193 | |
| | | | | | | | |
Accounts payable and accrued expenses | | $ | 97,800 | | $ | 72,176 | |
Security deposits | | | 9,735 | | | 7,151 | |
Prepaid rent | | | 2,737 | | | 2,076 | |
Other liabilities | | | 6,603 | | | 4,168 | |
| | | | | | | | |
Total tangible liabilities | | $ | 116,875 | | $ | 85,571 | |
| | | | | | | | |
Net tangible assets | | $ | 111,958 | | $ | 85,622 | |
| | | | | | | | |
| | | | | | | | |
| | | | | | | | |
- (1)
- Reflects our pro rata share of joint venture assets.
85
Outstanding Indebtedness
The following table summarizes our outstanding indebtedness as of March 31, 2016 (dollar amounts in thousands).
| | | | | | | | | | | | | | | | | |
Asset | | Additional
Debt
Description | | Principal
Balance | | Pro Rata
Share of
Principal
Balance | | Stated
Interest
Rate | | Interest
Rate
Hedge | | Current
Annual
Interest
Rate(1) | | Maturity
Date |
|---|
4747 Bethesda Avenue(2) | | | | $ | 12,500 | | $ | 12,500 | | L + 2.40% | | — | | | 2.83 | % | 4/29/16 |
Leesburg Pike Retail(3) | | | | | 9,990 | | | 9,890 | | 3.13% | | Fixed | | | 3.13 | % | 5/30/16 |
Upper Rock Retail(4) | | | | | 3,500 | | | 3,500 | | L + 3.75% | | — | | | 4.18 | % | 6/30/16 |
1600 K Street | | | | | 21,135 | | | 21,135 | | 4.93% | | Fixed | | | 4.93 | % | 7/1/16 |
One Choke Cherry | | | | | 23,978 | | | 23,978 | | L + 3.00% | | Swap | | | 3.70 | % | 8/26/16 |
Reston Arboretum | | | | | 13,012 | | | 13,012 | | L + 2.75% | | — | | | 3.18 | % | 9/1/16 |
2115 Wisconsin Avenue | | | | | 28,908 | | | 28,908 | | 5.30% | | Fixed | | | 5.30 | % | 10/1/16 |
2121 Wisconsin Avenue | | | | | 13,342 | | | 13,342 | | 5.30% | | Fixed | | | 5.30 | % | 10/1/16 |
Rosslyn Gateway—North, Rosslyn Gateway—South | | | | | 44,700 | | | 8,046 | | L+ 2.50% | | — | | | 2.93 | % | 11/8/16 |
5609 Fishers Lane | | | | | 5,024 | | | 3,349 | | 5.00% | | Fixed | | | 5.00 | % | 12/12/16 |
275 N. Washington | | | | | 9,565 | | | 9,565 | | 3.25% | | Fixed | | | 3.25 | % | 12/15/16 |
RTC—West | | | | | 95,035 | | | 95,035 | | L + 2.35% | | — | | | 2.78 | % | 3/15/17 |
Capitol Point—North | | | | | 10,996 | | | 1,856 | | L+ 3.50% | | Swap | | | 4.12 | % | 3/30/17 |
Lynbrook | | | | | 50,910 | | | 50,910 | | L + 2.50% | | — | | | 2.93 | % | 4/1/17 |
Meadowcreek | | | | | 34,470 | | | 34,470 | | L + 2.50% | | — | | | 2.93 | % | 4/1/17 |
Hillwood | | | | | 60,872 | | | 60,872 | | L + 2.50% | | — | | | 2.93 | % | 4/1/17 |
Brookdale | | | | | 36,669 | | | 36,669 | | L + 2.50% | | — | | | 2.93 | % | 4/1/17 |
Stoneridge | | | | | 21,401 | | | 21,401 | | L + 2.50% | | — | | | 2.93 | % | 4/1/17 |
The Shops At Mark Center | | | | | 9,498 | | | 9,498 | | L + 2.50% | | — | | | 2.93 | % | 4/1/17 |
5600 Fishers Lane—U.S. Government Tenant (GSA)(5) | | RANs | | | 30,900 | | | 20,600 | | 2.03% | | Fixed | | | 2.03 | % | 4/5/17 |
Fort Totten Square, Fort Totten Square Retail | | | | | 71,455 | | | 71,004 | | L + 2.15% | | Swap | | | 4.23 | % | 4/11/17 |
Hungerford Plaza | | | | | 7,375 | | | 7,375 | | L + 3.00% | | Swap | | | 4.12 | % | 5/31/17 |
800 North Glebe Road | | | | | 96,500 | | | 96,500 | | L + 2.25% | | — | | | 2.68 | % | 6/17/17 |
7770 Norfolk | | | | | 49,262 | | | 39,374 | | L+ 2.40% | | Swap | | | 4.85 | % | 7/16/17 |
North End Retail I | | | | | 4,339 | | | 4,339 | | L + 2.25% | | — | | | 2.68 | % | 7/31/17 |
Jefferson Court | | | | | 73,000 | | | 73,000 | | L + 2.25% | | — | | | 2.68 | % | 8/16/17 |
Atlantic Plumbing | | | | | 86,905 | | | 55,619 | | L+ 2.25% | | Swap | | | 3.67 | % | 9/9/17 |
5635 Fishers Lane | | | | | 24,574 | | | 2,457 | | L + 4.75% | | Cap | | | 5.18 | % | 9/14/17 |
16th & I Street | | | | | 60,673 | | | 43,612 | | L+ 2.25% | | Swap | | | 4.77 | % | 9/28/17 |
The Terano | | | | | 37,798 | | | 680 | | L+ 2.10% | | Cap | | | 2.53 | % | 11/8/17 |
Galvan | | | | | 72,895 | | | 1,312 | | L+ 2.70% | | Cap | | | 3.13 | % | 12/12/17 |
Notch 8, Notch 8 Retail | | | | | 68,433 | | | 10,060 | | L+ 1.95% | | Swap | | | 3.53 | % | 12/23/17 |
1900 N Street(6) | | | | | 1,510 | | | 1,510 | | 4.00% | | Fixed | | | 4.00 | % | 1/23/18 |
The Alaire | | | | | 38,269 | | | 6,888 | | L+ 2.10% | | Cap | | | 2.53 | % | 3/13/18 |
Charter Oak(7) | | | | | 11,000 | | | 11,000 | | L + 3.50% | | Cap | | | 4.00 | % | 6/1/18 |
L'Enfant Plaza Office—North, L'Enfant Plaza Office—East, L'Enfant Plaza Retail—East, L'Enfant Plaza Retail—West(8) | | | | | 205,273 | | | 100,574 | | L + 3.65% | | Cap | | | 4.28 | % | 10/1/18 |
CEB Tower at Central Place | | | | | 16,424 | | | 16,424 | | L+ 2.45% | | Swap | | | 3.18 | % | 11/7/18 |
Artery Plaza | | Senior | | | 83,130 | | | 83,130 | | L + 1.75% | | Cap | | | 2.18 | % | 12/23/18 |
Artery Plaza | | Mezzanine | | | 15,000 | | | 15,000 | | L + 7.54% | | Cap | | | 7.97 | % | 12/23/18 |
5640 Fishers Lane | | | | | 10,218 | | | 1,022 | | 5.83% | | Fixed | | | 5.83 | % | 1/15/19 |
13th & U Street | | | | | 3,267 | | | 3,267 | | L+ 2.10% | | Swap | | | 4.30 | % | 3/16/19 |
1900 N Street(9) | | | | | 28,270 | | | 28,270 | | L + 2.50% | | Swap | | | 4.07 | % | 5/8/19 |
1233 20th Street | | | | | 44,206 | | | 44,206 | | 4.38% | | Fixed | | | 4.38 | % | 11/1/19 |
The Foundry | | | | | 44,224 | | | 4,369 | | L+ 1.85% | | Cap | | | 2.28 | % | 12/12/19 |
11333 Woodglen Drive | | | | | 14,000 | | | 2,520 | | L+ 1.90% | | Swap | | | 2.63 | % | 1/1/20 |
6862 Elm Street | | | | | 22,546 | | | 22,546 | | L + 1.80% | | Swap | | | 3.33 | % | 4/30/20 |
Old Dominion | | | | | 12,091 | | | 12,091 | | L + 2.00% | | Swap | | | 3.72 | % | 6/19/20 |
Summit I, Summit II | | | | | 59,000 | | | 59,000 | | L + 1.90% | | Cap | | | 2.33 | % | 8/4/20 |
Chase Tower | | | | | 96,220 | | | 9,622 | | L+1.65% | | — | | | 2.08 | % | 9/30/20 |
Stonebridge at Potomac Town Center | | | | | 94,000 | | | 9,400 | | L + 1.70% | | Swap | | | 3.25 | % | 12/10/20 |
Takoma-Langley Crossroads Center, Vienna Walgreens, Pikesville Walgreens | | | | | 48,375 | | | 47,891 | | 5.04% | | Fixed | | | 5.04 | % | 1/6/21 |
DOT—U.S. Government Tenant (GSA) | | A-1 Note | | | 326,000 | | | 326,000 | | 6.00% | | Fixed | | | 6.00 | % | 12/2/21 |
DOT—U.S. Government Tenant (GSA) | | A-2 Note | | | 98,815 | | | 98,815 | | 5.27% | | Fixed | | | 5.27 | % | 12/2/21 |
Fairway Apartments | | | | | 38,500 | | | 3,850 | | L + 1.60% | | Swap | | | 3.70 | % | 7/1/22 |
Kennedy Row | | | | | 30,480 | | | 27,432 | | L + 1.65% | | Swap | | | 3.64 | % | 7/1/22 |
12735 Twinbrook Parkway | | | | | 18,265 | | | 1,827 | | 7.19% | | Fixed | | | 7.19 | % | 7/15/22 |
The Gale | | | | | 109,645 | | | 5,482 | | L + 1.60% | | Swap | | | 3.56 | % | 7/31/22 |
Falkland Chase—South & West | | | | | 43,580 | | | 43,580 | | 3.78% | | Fixed | | | 3.78 | % | 6/1/23 |
Falkland Chase—North | | | | | 23,299 | | | 23,299 | | L + 2.32% | | Cap | | | 2.75 | % | 6/1/23 |
Bennington Crossings | | | | | 43,009 | | | 43,009 | | 3.65% | | Fixed | | | 3.65 | % | 6/1/23 |
Charter Oak(10) | | | | | 30,040 | | | 30,040 | | 4.06% | | Fixed | | | 4.06 | % | 6/1/23 |
NCI—U.S. Government Tenant (GSA) | | A Note | | | 52,065 | | | 52,065 | | 3.90% | | Fixed | | | 3.90 | % | 7/15/23 |
5625 Fishers Lane | | | | | 43,159 | | | 4,316 | | 7.21% | | Fixed | | | 7.21 | % | 1/15/24 |
Fairmont Gardens | | | | | 45,440 | | | 45,440 | | 4.14% | | Fixed | | | 4.14 | % | 7/1/24 |
La Plata Shopping Center | | | | | 9,825 | | | 9,727 | | 4.12% | | Fixed | | | 4.12 | % | 2/1/25 |
Pickett Industrial Park | | | | | 23,600 | | | 2,360 | | L + 1.45% | | Swap | | | 3.56 | % | 9/4/25 |
5601 Fishers Lane—U.S. Government Tenant (GSA) | | A Note | | | 59,815 | | | 39,897 | | 4.46% | | Fixed | | | 4.46 | % | 4/15/29 |
5601 Fishers Lane—U.S. Government Tenant (GSA) | | B Note | | | 69,000 | | | 46,000 | | 5.68% | | Fixed | | | 5.68 | % | 4/15/29 |
5600 Fishers Lane—U.S. Government Tenant (GSA) | | A Note | | | 135,650 | | | 90,434 | | 3.67% | | Fixed | | | 3.67 | % | 8/5/30 |
NCI—U.S. Government Tenant (GSA) | | B Note | | | 112,240 | | | 112,240 | | 6.10% | | Fixed | | | 6.10 | % | 7/15/33 |
5600 Fishers Lane—U.S. Government Tenant (GSA) | | B Note | | | 172,660 | | | 115,107 | | 5.48% | | Fixed | | | 5.48 | % | 8/5/40 |
Reston Heights—Phase I(11) | | | | | — | | | — | | — | | — | | | — | | — |
| | | | | | | | | | | | | | | | | | |
Total: | | | | $ | 3,521,724 | | $ | 2,483,498 | | | | | | | | | |
- (1)
- LIBOR is assumed to be 0.43% for loans which are denoted as floating with cap or floating (no hedge)
86
- (2)
- In April 2016, we agree to terms with our lender to extend this loan for one year to 4/29/2017. All terms will remain unchanged with the exception of the interest rate which will be L + 3.00 percent.
- (3)
- In April 2016, we exercised an extension option to extend the loan to 5/31/2017. All other loan terms remain unchanged.
- (4)
- We have a signed term sheet with the existing lender to fund vertical construction of this project. The construction loan is expected to close in the June of 2016. The maximum loan amount will be $11.5 million, the interest rate will be LIBOR + 2.00 percent, the loan term will be two years.
- (5)
- RANs stands for Revenue Anticipation Notes.
- (6)
- This loan is collateralized by a portion of the 1900 N Street land assemblage referred to as 1253 20th Street. The remaining portion of the property is encumbered by a separate loan.
- (7)
- Charter Oak is comprised of two parcels. This loan is collateralized by one parcel, a separate loan is collateralized by the remainder of the site. This loan has an interest rate floor of 4.00 percent.
- (8)
- The base rate for the loan is 3 month LIBOR, which was 0.63 percent as of March 31, 2016.
- (9)
- This loan is collateralized by a portion of the 1900 N Street land assemblage referred to as 1920 N Street. The remaining portion of the property is encumbered by a separate loan.
- (10)
- Charter Oak is comprised of two parcels. This loan is collateralized by one parcel, a separate loan is collateralized by the remainder of the site.
- (11)
- In March 2016, we signed a term sheet with a lender to fund vertical construction of this project. The maximum loan amount will be $95.6 million, the interest rate will be LIBOR + 2.00 percent, the loan term will be four years.
Outstanding Lease Liabilities
The following table summarizes our outstanding lease liabilities for both in-place and signed but not commenced leases as of March 31, 2016 (dollar amounts in thousands).
| | | | | | | | | | | | | | | | | | | |
| | At 100 Percent Share | | At JBG Share(1) | |
|---|
Section(s): | | Outstanding
Tenant
Improvements | | Outstanding
Lease
Commissions | | Total
Outstanding
Lease
Liabilities | | Outstanding
Tenant
Improvements | | Outstanding
Lease
Commissions | | Total
Outstanding
Lease
Liabilities | |
|---|
Office | | | | | | | | | | | | | | | | | | | |
Stablized | | $ | 49,406 | | $ | 3,223 | | $ | 52,629 | | $ | 38,564 | | $ | 2,895 | | $ | 41,459 | |
Recently Acquired/Delivered/Renovated | | | 1,841 | | | 1,603 | | | 3,445 | | | 1,324 | | | 1,152 | | | 2,476 | |
Construction | | | 37,570 | | | 5,477 | | | 43,047 | | | 37,570 | | | 5,477 | | | 43,047 | |
| | | | | | | | | | | | | | | | | | | | |
Total | | $ | 88,817 | | $ | 10,303 | | $ | 99,121 | | $ | 77,458 | | $ | 9,524 | | $ | 86,982 | |
| | | | | | | | | | | | | | | | | | | | |
Multifamily | | | | | | | | | | | | | | | | | | | |
Stablized | | $ | 8 | | $ | 34 | | $ | 41 | | $ | 0 | | $ | 1 | | $ | 1 | |
Recently Acquired/Delivered/Renovated | | | 2,202 | | | 302 | | | 2,504 | | | 1,547 | | | 217 | | | 1,764 | |
Construction | | | 1,614 | | | 36 | | | 1,649 | | | 1,614 | | | 36 | | | 1,649 | |
Pre-Development | | | 5,115 | | | 721 | | | 5,836 | | | 1,535 | | | 216 | | | 1,751 | |
| | | | | | | | | | | | | | | | | | | | |
Total | | $ | 8,939 | | $ | 1,093 | | $ | 10,030 | | $ | 4,696 | | $ | 470 | | $ | 5,165 | |
| | | | | | | | | | | | | | | | | | | | |
Retail | | | | | | | | | | | | | | | | | | | |
Stablized | | $ | 2,410 | | $ | 1,636 | | $ | 4,046 | | $ | 687 | | $ | 205 | | $ | 892 | |
Recently Acquired/Delivered/Renovated | | | 52 | | | — | | | 52 | | | 52 | | | — | | | 52 | |
Construction | | | 1,255 | | | 253 | | | 1,508 | | | 1,255 | | | 253 | | | 1,508 | |
Pre-Development | | | 402 | | | 446 | | | 848 | | | 402 | | | 446 | | | 848 | |
| | | | | | | | | | | | | | | | | | | | |
Total | | $ | 4,119 | | $ | 2,335 | | $ | 6,454 | | $ | 2,396 | | $ | 904 | | $ | 3,300 | |
| | | | | | | | | | | | | | | | | | | | |
Land(2) | | $ | 1,665 | | $ | 1,176 | | $ | 2,841 | | $ | 1,444 | | $ | 866 | | $ | 2,310 | |
| | | | | | | | | | | | | | | | | | | | |
Total | | $ | 103,540 | | $ | 14,907 | | $ | 118,446 | | $ | 85,994 | | $ | 11,764 | | $ | 97,757 | |
| | | | | | | | | | | | | | | | | | | | |
| | | | | | | | | | | | | | | | | | | | |
| | | | | | | | | | | | | | | | | | | | |
- (1)
- Reflects our pro rata share of joint venture assets.
- (2)
- Contigent upon management's decision to move forward with development.
Ground Lease Obligations
The Following table summarizes our minimum ground rent liabilities as of March 31, 2016 (dollar amounts in thousands).
| | | | | | | | | | | | | | | | | | | |
| | Nine Months
Ended
December 31,
2016 | | Year Ended December 31, | |
| |
|---|
| | 2017 | | 2018 | | 2019 | | 2020 | | Thereafter | |
|---|
Ground Rent Expense(1) | | $ | 3,472 | | $ | 4,664 | | $ | 4,288 | | $ | 3,910 | | $ | 3,971 | | $ | 21,027 | |
- (1)
- Reflects our pro rata share of joint venture assets.
87
Our Joint Venture Arrangements
We own a significant number of our assets through joint ventures with third parties. The tables below identify our joint venture partners, or their affiliated sponsor, and the assets that we hold through such joint ventures as of March 31, 2016 separated by those assets we expect to consolidate in the combined company's financial statements after the Combination Transactions and those we do not expect to consolidate.
| | | | | | | | | | | | | |
| | Asset Type | | City | | Submarket | | Our Percent
Ownership | | Total Rentable
Square Feet(2) | |
|---|
Consolidated(1) | | | | | | | | | | | | | |
Cammeby's | | | | | | | | | | | | | |
5600 Fishers Lane—U.S. Government Tenant (GSA) | | Office | | Rockville, MD | | Rockville Pike Corridor | | | 66.7 | % | | 935,386 | |
5601 Fishers Lane—U.S. Government Tenant (GSA) | | Office | | Rockville, MD | | Rockville Pike Corridor | | | 66.7 | % | | 490,998 | |
5609 Fishers Lane | | Office | | Rockville, MD | | Rockville Pike Corridor | | | 66.7 | % | | 59,800 | |
Parklawn—South | | Land | | Rockville, MD | | Rockville Pike Corridor | | | 66.7 | % | | 396,000 | |
5600 Fishers Lane—Wing C | | Land | | Rockville, MD | | Rockville Pike Corridor | | | 66.7 | % | | 350,000 | |
| | | | | | | | | | | | | | |
Total Cammeby's | | | | | | | | | | | | 2,232,184 | |
| | | | | | | | | | | | | | |
MRP Realty | | | | | | | | | | | | | |
Potomac Yard Land Bay G | | Land | | Alexandria, VA | | Potomac Yard | | | 98.0 | % | | 823,000 | |
Potomac Yard Land Bay H | | Land | | Alexandria, VA | | Potomac Yard | | | 80.0 | % | | 550,000 | |
| | | | | | | | | | | | | | |
Total MRP Realty | | | | | | | | | | | | 1,373,000 | |
| | | | | | | | | | | | | | |
Calais | | | | | | | | | | | | | |
Tysons West—Phase II | | Land | | Vienna, VA | | Tysons Corner | | | 86.8 | % | | 440,000 | |
Tysons West—Phase III | | Land | | Vienna, VA | | Tysons Corner | | | 86.8 | % | | 730,000 | |
| | | | | | | | | | | | | | |
Total Calais | | | | | | | | | | | | 1,170,000 | |
| | | | | | | | | | | | | | |
1111 Property Associates | | | | | | | | | | | | | |
Fort Totten Square | | Multifamily | | Washington, DC | | Brookland/Fort Totten | | | 99.4 | % | | 254,292 | |
Old Centreville Crossing | | Retail | | Centreville, VA | | Rt. 28 South/Chantilly | | | 99.0 | % | | 171,631 | |
Fort Totten Square Retail | | Retail | | Washington, DC | | Brookland/Fort Totten | | | 99.4 | % | | 130,664 | |
Takoma-Langley Crossroads Center | | Retail | | Takoma Park, MD | | Takoma | | | 99.0 | % | | 125,245 | |
La Plata Shopping Center | | Retail | | La Plata, MD | | Suburban Maryland | | | 99.0 | % | | 76,470 | |
Vienna Walgreens | | Retail | | Vienna, VA | | Vienna | | | 99.0 | % | | 25,500 | |
Pikesville Walgreens | | Retail | | Pikesville, MD | | Pikesville | | | 99.0 | % | | 25,476 | |
Leesburg Pike Retail | | Retail | | Vienna, VA | | Tysons Corner | | | 99.0 | % | | 19,120 | |
Leesburg Pike Land | | Land | | Vienna, VA | | Tysons Corner | | | 99.0 | % | | 34,000 | |
| | | | | | | | | | | | | | |
Total 1111 Property Associates | | | | | | | | | | | | 862,398 | |
| | | | | | | | | | | | | | |
Akridge | | | | | | | | | | | | | |
West Half III | | Multifamily | | Washington, DC | | Southeast | | | 94.2 | % | | 208,783 | |
West Half II | | Multifamily | | Washington, DC | | Southeast | | | 94.2 | % | | 173,947 | |
| | | | | | | | | | | | | | |
Total Akridge | | | | | | | | | | | | 382,730 | |
| | | | | | | | | | | | | | |
Bennett Group | | | | | | | | | | | | | |
801 New Jersey Avenue | | Land | | Washington, DC | | Capitol Hill | | | 99.0 | % | | 350,000 | |
JBG Investment Fund VII | | | | | | | | |
| | |
| |
Atlantic Plumbing C—North | | Multifamily | | Washington, DC | | U Street/Shaw | | | 60.0 | % | | 144,876 | |
Atlantic Plumbing C—South | | Multifamily | | Washington, DC | | U Street/Shaw | | | 60.0 | % | | 79,676 | |
| | | | | | | | | | | | | | |
Total JBG Investment Fund VII | | | | | | | | | | | | 224,552 | |
| | | | | | | | | | | | | | |
CIM Group and Ross | | | | | | | | | | | | | |
7770 Norfolk | | Multifamily | | Bethesda, MD | | Bethesda CBD | | | 79.9 | % | | 208,678 | |
ICG Properties | | | | | | | | |
| | |
| |
16th & I Street | | Office | | Washington, DC | | CBD | | | 71.9 | % | | 120,282 | |
Tritec | | | | | | | | |
| | |
| |
Kennedy Row | | Multifamily | | Washington, DC | | Capitol Hill | | | 90.0 | % | | 106,553 | |
| | | | | | | | | | | | | | |
Total Consolidated | | | | | | | | | | | | 7,030,377 | |
| | | | | | | | | | | | | | |
| | | | | | | | | | | | | | |
| | | | | | | | | | | | | | |
- (1)
- On a pro forma basis we expect to consolidate these joint ventures in the Combination Transactions in accordance with GAAP.
- (2)
- Refers to either (i) for operating office and retail assets, actual rentable square footage determined consistent with the Building Owners and Managers Association, or BOMA, measurement guidelines when available and management's estimate of approximate rentable square feet when BOMA measurement is not available, (ii) for operating multifamily assets, management's estimate of actual rentable square footage, (iii) for construction and pre-development assets, management's estimate of actual rentable square footage based on current design plans as of March 31, 2016, or (iv) for land assets, management's estimate of developable square feet based on its current business plans as of March 31, 2016. Shown at 100 percent share.
88
Unconsolidated Joint Ventures(1)
| | | | | | | | | | | | | |
| | Asset Type | | City | | Submarket | | Our Percent
Ownership | | Total
Rentable
Square Feet(2) | |
|---|
Unconsolidated | | | | | | | | | | | | | |
MFP-JBGU | | | | | | | | | | | | | |
L'Enfant Plaza Office—East | | Office | | Washington, D.C. | | Southwest | | | 49.0 | % | | 437,954 | |
L'Enfant Plaza Office—North | | Office | | Washington, D.C. | | Southwest | | | 49.0 | % | | 304,132 | |
Rosslyn Gateway—North | | Office | | Arlington, VA | | Rosslyn | | | 18.0 | % | | 144,830 | |
NoBe II Office | | Office | | Rockville, MD | | Rockville Pike Corridor | | | 18.0 | % | | 139,550 | |
Rosslyn Gateway—South | | Office | | Arlington, VA | | Rosslyn | | | 18.0 | % | | 105,722 | |
11333 Woodglen Drive | | Office | | Rockville, MD | | Rockville Pike Corridor | | | 18.0 | % | | 63,650 | |
12440 Parklawn | | Office | | Rockville, MD | | Rockville Pike Corridor | | | 18.0 | % | | 29,700 | |
Galvan | | Multifamily | | Rockville, MD | | Rockville Pike Corridor | | | 1.8 | % | | 295,472 | |
The Alaire | | Multifamily | | Rockville, MD | | Rockville Pike Corridor | | | 18.0 | % | | 288,806 | |
The Terano | | Multifamily | | Rockville, MD | | Rockville Pike Corridor | | | 1.8 | % | | 201,353 | |
L'Enfant Plaza Retail—West | | Retail | | Washington, D.C. | | Southwest | | | 49.0 | % | | 117,610 | |
Galvan Retail | | Retail | | Rockville, MD | | Rockville Pike Corridor | | | 1.8 | % | | 95,147 | |
L'Enfant Plaza Retail—East | | Retail | | Washington, D.C. | | Southwest | | | 49.0 | % | | 33,736 | |
NoBe II Land | | Land | | Rockville, MD | | Rockville Pike Corridor | | | 18.0 | % | | 672,500 | |
Bethesda North Marriott Land | | Land | | Rockville, MD | | Rockville Pike Corridor | | | 18.0 | % | | 548,500 | |
Rosslyn Gatweway—South Land | | Land | | Rosslyn, VA | | Rosslyn | | | 18.0 | % | | 498,500 | |
Capitol Point—North Option | | Land | | Washington, D.C. | | NoMa | | | 59.0 | % | | 439,000 | |
Capitol Point—North | | Land | | Washington, D.C. | | NoMa | | | 16.9 | % | | 409,000 | |
L'Enfant Plaza Office—Center | | Land | | Washington, D.C. | | Southwest | | | 49.0 | % | | 350,000 | |
Rosslyn Gateway—North Land | | Land | | Rosslyn, VA | | Rosslyn | | | 18.0 | % | | 311,000 | |
Courthouse Metro Land | | Land | | Arlington, VA | | Clarendon/Courthouse | | | 18.0 | % | | 286,500 | |
L'Enfant Plaza Office—Southeast | | Land | | Washington, D.C. | | Southwest | | | 49.0 | % | | 223,000 | |
5615 Fishers Drive | | Land | | Rockville, MD | | Rockville Pike Corridor | | | 18.0 | % | | 106,500 | |
Courthouse Metro Land—Option | | Land | | Arlington, VA | | Clarendon/Courthouse | | | 18.0 | % | | 62,500 | |
12511 Parklawn Drive | | Land | | Rockville, MD | | Rockville Pike Corridor | | | 18.0 | % | | 6,500 | |
Twinbrook | | Land | | Rockville, MD | | Rockville Pike Corridor | | | 18.0 | % | | — | |
Woodglen | | Land | | Rockville, MD | | Rockville Pike Corridor | | | 18.0 | % | | — | |
| | | | | | | | | | | | | | |
Total MFP-JBGU | | | | | | | | | | | | 6,171,162 | |
| | | | | | | | | | | | | | |
CBREI Venture | | | | | | | | | | | | | |
Pickett Industrial Park | | Office | | Alexandria, VA | | Eisenhower Avenue | | | 10.0 | % | | 246,145 | |
The Foundry | | Office | | Washington, DC | | Georgetown | | | 9.9 | % | | 233,855 | |
The Gale | | Multifamily | | Washington, DC | | H Street/NoMa | | | 5.0 | % | | 466,852 | |
Fairway Apartments | | Multifamily | | Reston, VA | | Reston | | | 10.0 | % | | 371,204 | |
Atlantic Plumbing | | Multifamily | | Washington, DC | | U Street/Shaw | | | 64.0 | % | | 245,604 | |
Stonebridge at Potomac Town Center—Phase I | | Retail | | Woodbridge, VA | | Prince William County | | | 10.0 | % | | 482,619 | |
Stonebridge at Potomac Town Center—Phase II | | Retail | | Woodbridge, VA | | Prince William County | | | 10.0 | % | | 51,738 | |
Stonebridge Land | | Land | | Woodbridge, VA | | Prince William County | | | 10.0 | % | | 737,500 | |
Fairway Land | | Land | | Reston, VA | | Reston | | | 10.0 | % | | 521,500 | |
| | | | | | | | | | | | | | |
Total CBREI Venture | | | | | | | | | | | | 3,357,017 | |
| | | | | | | | | | | | | | |
Wealth Capital Management | | | | | | | | | | | | | |
Chase Tower | | Office | | Chevy Chase, MD | | Chevy Chase | | | 10.0 | % | | 247,755 | |
5635 Fishers Lane | | Office | | Rockville, MD | | Rockville Pike Corridor | | | 10.0 | % | | 185,511 | |
5625 Fishers Lane | | Office | | Rockville, MD | | Rockville Pike Corridor | | | 10.0 | % | | 153,385 | |
12735 Twinbrook Parkway | | Office | | Rockville, MD | | Rockville Pike Corridor | | | 10.0 | % | | 76,520 | |
5640 Fishers Lane | | Office | | Rockville, MD | | Rockville Pike Corridor | | | 10.0 | % | | 74,185 | |
12725 Twinbrook Parkway | | Office | | Rockville, MD | | Rockville Pike Corridor | | | 10.0 | % | | 58,880 | |
| | | | | | | | | | | | | | |
Total Wealth Capital Management | | | | | | | | | | | | 796,236 | |
| | | | | | | | | | | | | | |
Brandywine | | | | | | | | | | | | | |
1250 1st Street | | Office | | Washington, DC | | NoMa | | | 30.0 | % | | 251,491 | |
50 Patterson Street | | Office | | Washington, DC | | NoMa | | | 30.0 | % | | 167,350 | |
51 N Street | | Multifamily | | Washington, DC | | NoMa | | | 30.0 | % | | 119,981 | |
| | | | | | | | | | | | | | |
Total Brandywine | | | | | | | | | | | | 538,822 | |
| | | | | | | | | | | | | | |
NETTIPF | | | | | | | | | | | | | |
Reston Heights—Phase I | | Multifamily | | Reston, VA | | Reston | | | 10.0 | % | | 327,163 | |
Reston Heights—Phase I Retail | | Retail | | Reston, VA | | Reston | | | 10.0 | % | | 89,690 | |
Reston Heights—Phase II | | Land | | Reston, VA | | Reston | | | 10.0 | % | | 96,500 | |
| | | | | | | | | | | | | | |
Total NETTIPF | | | | | | | | | | | | 513,353 | |
| | | | | | | | | | | | | | |
89
| | | | | | | | | | | | | |
| | Asset Type | | City | | Submarket | | Our Percent
Ownership | | Total
Rentable
Square Feet(2) | |
|---|
MRP Realty | | | | | | | | | | | | | |
965 Florida Avenue | | Land | | Washington, DC | | U Street/Shaw | | | 70.0 | % | | 402,500 | |
CIGNA | | | | | | | | | | | | | |
Notch 8 | | Multifamily | | Alexandria, VA | | Potomac Yard | | | 14.7 | % | | 207,374 | |
Notch 8 Retail | | Retail | | Alexandria, VA | | Potomac Yard | | | 14.7 | % | | 66,805 | |
| | | | | | | | | | | | | | |
Total CIGNA | | | | | | | | | | | | 274,179 | |
| | | | | | | | | | | | | | |
Lionstone | | | | | | | | | | | | | |
Potomac Yard Land Bay F | | Land | | Alexandria, VA | | Potomac Yard | | | 0.0 | % | | — | |
| | | | | | | | | | | | | | |
Total Unconsolidated | | | | | | | | | | | | 12,053,269 | |
| | | | | | | | | | | | | | |
| | | | | | | | | | | | | | |
| | | | | | | | | | | | | | |
- (1)
- On a pro forma basis we do not expect to consolidate these joint ventures in our financial statements following the Combination Transactions.
- (2)
- Refers to either (i) for operating office and retail assets, actual rentable square footage determined consistent with the Building Owners and Managers Association, or BOMA, measurement guidelines when available and management's estimate of approximate rentable square feet when BOMA measurement is not available, (ii) for operating multifamily assets, management's estimate of actual rentable square footage, (iii) for construction and pre-development assets, management's estimate of actual rentable square footage based on current design plans as of March 31, 2016, or (iv) for land assets, management's estimate of developable square feet based on its current business plans as of March 31, 2016. Shown at 100 percent share.
Through joint ventures with affiliates of Cammeby's International Group, or Cammeby's, we own 66.7 percent interests in three office and two land assets. We act as managing member of each of the ventures and are entitled to a promoted interest if certain return thresholds are met with respect to certain assets, in addition to our equity ownership interest. As the managing member of each of these ventures, we exercise day-to-day management control over each asset, subject to certain customary major decision rights in favor of Cammeby's, which include approval over sales and financings of the properties. In the event of a deadlock with respect to any major decision, either partner may exercise certain buy-sell rights with respect to interests in the applicable venture.
Through joint ventures with MRP Realty, we own interests in two land assets within the Potomac Yard development ranging from 80.0 percent to 98.0 percent. We act as managing member of one of these ventures and are entitled to a promoted interest with respect to the venture if certain return thresholds are met with respect to each underlying asset, in addition to our equity ownership interest. For the venture in which we are the managing member, we exercise day-to-day management control over the venture's assets, subject to certain customary major decision rights in favor of MRP Realty, which include approval over sales and financing of the underlying asset. In the one venture in which we are not the managing member, we have an equity ownership interest and have rights to approve certain customary major decisions, including approval over sales and financing of the underlying asset. Notwithstanding such rights, a buy-sell right is available with respect to major decision deadlocks and in certain circumstances, we have the ability to override any major decision vote by MRP Realty, in which event MRP Realty may trigger certain buy-sell rights with respect to interests in the applicable ventures. Forced sale rights are also expected to be included in venture agreements which may be entered into in connection with the vertical developments to be constructed on these assets.
Additionally, we own a 70 percent interest in the 965 Florida Avenue land asset. MRP Realty acts as the managing member of the venture and is entitled to a promoted interest if certain return thresholds are met with respect to the asset. As the managing member of this venture, MRP Realty exercises day-to-day management control over the asset, subject to customary major decision rights in our favor, which include approval over sales and financing of the property.
90
Through a joint venture with The Calais Corporation, or Calais, we own an 86.8 percent interest in each of the Tysons West—Phase II land asset and the Tysons West—Phase III land asset. We act as managing member of the venture and receive cash available for distribution based on our equity ownership interest and in connection with the repayment of a loan to Calais. In addition, we are entitled to cash available for distribution from the venture until any priority capital contributions have been returned plus a return on such contribution. Thereafter, our joint venture partner is entitled to a promoted interest if certain return thresholds are met. Our 86.3 percent interest reflects the fact that we have assigned a small portion of our interest and a promote interest in these joint ventures to certain unrelated third-party partners. As the managing member of each of these ventures, we exercise management control over each asset with limited approval rights for Calais. With respect to the member loan to Calais, we have certain remedies if Calais fails to repay the loan, including the right to assume ownership of a portion of Calais' membership interest in proportion to any unpaid amounts.
Through joint ventures with entities affiliated with 1111 Property Associates, we own 99.0 percent interests in six retail assets and one land asset and 99.4 percent interests in one multifamily asset and one retail asset. We act as managing member of each of the ventures and are entitled to receive our pro-rata share of the available cash for distribution from these ventures, subject to a promoted interest that may be paid to 1111 Property Associates if certain return thresholds are met with respect to each asset. As the managing member of each of these ventures, we control all decisions with respect to each asset, including sale and financing decisions.
Through joint joint ventures with Akridge, we own 94.2 percent interests in two multifamily pre-development assets. As the managing member of each of these ventures, we control all decisions with respect to each asset, including sale and financing decisions.
Through a joint venture with the Bennett Group, we own an interest in the 801 New Jersey Avenue land asset pursuant to a ground lease with the District of Columbia. Bennett Group's ownership interest is based on its capital account, which is in part a function of built or to-be-built FAR, as well as the amount of equity invested, and is subject to change. As of March 31, 2016, we were entitled to receive 99.0 percent of cash flow. Our approximate 99.0 percent interest reflects our assignment of a small portion of our interest in this joint venture to certain unrelated third-party partners. As the managing member of the venture, we exercise day-to-day management control over the asset, subject to certain customary major decision rights in favor only of Bennett Group, which include approval over sales and financings of the property. In the event of a deadlock between us and Bennett Group with respect to any major decision, we and Bennett Group may exercise certain buy-sell rights with respect to interests in the venture. Additionally, we and Bennett Group may initiate a sale of the asset at any time.
Following the Combination Transactions, we will own a 60 percent tenant in common interest in two multifamily assets through a joint venture with JBG Investment Fund VII, which assets were wholly-owned by JBG Investment Fund VII prior to the Combination Transactions.
91
Through a joint venture with CIM Group and ROSS Development & Investment, we own a 79.9 percent interest in the 7770 Norfolk multifamily asset. We act as the managing member with respect to the venture and are entitled to a promoted interest if certain return thresholds are met and, upon the satisfaction of certain additional return thresholds, we are required to pay a promoted interest to our partners. As the managing member of the venture, we exercise day-to-day management control over the asset, subject to certain limited consent rights in favor of CIM Group. After the expiration of a lockout period, CIM Group may exercise certain buy-sell rights with respect to the venture and we may exercise such buy-sell rights in the event CIM Group fails to give consent for an action proposed by us that requires their consent. ROSS has tag-along rights with respect to any buy-sell action taken by CIM Group or us, pursuant to which ROSS may elect to participate in the buy-sell with respect to its interest in the venture or retain its membership interest in the venture.
Through a joint venture with ICG Properties, we own a 71.9 percent interest in the 16th and I Street office asset. We act as managing member of this venture and receive cash available for distribution based on our equity ownership interest. Our 71.9 percent interest reflects our assignment of a small portion of our interest in this joint venture to certain unrelated third-party partners. As the managing member of this venture, we exercise day-to-day management control over the asset, subject to certain customary major decision rights in favor only of ICG Properties that include approval over sales and financings of the property. Notwithstanding such rights, during the development phase of this asset, we have the ability to override any major decision vote by ICG Properties, in which event ICG Properties may trigger a buy-sell option with respect to the venture. In the event of a deadlock with respect to any major decision, either we or ICG Properties may exercise certain buy-sell rights with respect to interests in the venture. We and ICG also each have the right to force a sale of the asset at any time after stabilization of the asset.
Through a joint venture with Tritec Real Estate Company, or Tritec, we own a 90.0 percent interest in the Kennedy Row multifamily asset. Tritec acts as the managing member of the venture and is entitled to a promoted interest if certain return thresholds are met with respect to the asset. As the managing member of this venture, Tritec exercises day-to-day management control over the asset, subject to customary major decision rights in our favor, which include approval over sales and financing of the property. In addition to those major decision rights, we also have the right to propose to Tritec that the venture take an action that would constitute a major decision. In the event of a deadlock with respect to any major decision, whether proposed by Tritec or us, either partner may exercise certain buy-sell rights with respect to interests in the applicable venture.
Through a joint venture with MFP-JBGU, which we refer to as JBG Urban, we own an 18.0 percent interest in seven office, three multifamily, three retail and 14 land assets. We act as managing member of this venture and are entitled to a promoted interest if certain return thresholds are met, in addition to our equity ownership interest. As the managing member of this venture, we exercise day-to-day management control over the assets owned by the venture, subject to certain customary major decision rights in favor of MFP-JBGU, which include approval over sales and financings of the properties. The joint venture parties have certain rights to initiate the sale of the venture's assets.
92
In addition to the assets wholly owned by JBG Urban joint venture, JBG Urban owns a 10 percent interest in certain assets, with the result that we own an effective 1.8 percent interest in those assets. With respect to certain assets, JBG Urban's joint venture partner is one of our investment funds, resulting in ownership by us, both directly and indirectly through JBG Urban, of significantly more than 18 percent in these assets, as reflected in the table above.
Through a joint venture with CB Richard Ellis Investors, or CBREI, we own a 5.0 percent interest in The Gale multifamily asset, a 10.0 percent interest in the Fairway multifamily asset and corresponding land asset, a 9.9 percent interest in The Foundry office asset, a 10.0 percent in the Pickett Industrial Park office asset, a 10.0 percent interest in the Stonebridge at Potomac Town Center—Phase I and Stonebridge at Potomac Town Center—Phase II retail assets and the Stonebridge Land asset, and a 64.0 percent interest in the Atlantic Plumbing multifamily asset. Our 9.9 percent interest in The Foundry office asset reflects an assignment of a small portion of the venture's interest in this asset to an unrelated third-party partner. We act as managing member of the venture and are entitled to a promoted interest if certain return thresholds are met, in addition to our equity ownership interest. As the managing member of each of these ventures, we exercise day-to-day management control over each asset, subject to certain customary major decision rights in favor of CBREI, which include approval over sales and financings of the properties. In the event of a deadlock with respect to any major decision, either partner may exercise certain buy-sell rights with respect to the interests in the applicable venture. Additionally, after the expiration of lock-out periods relating to each of the venture's assets, either partner may initiate a sale with respect to such asset.
Through joint ventures with Wealth Capital Management, we own 10.0 percent interests in six office assets. Our right to receive distributions from these ventures is subordinate to our partner's right to receive a preferred return and the payment to us of a deferred asset management fee. As the managing member of each of these ventures, we exercise day-to-day management control over each asset, subject to certain customary major decision rights in favor of Wealth Capital Management. In the event of a deadlock with respect to any major decision, either partner may exercise certain buy-sell rights with respect to interests in the applicable venture, except no buy-sell right may be exercised with respect to any asset that is undergoing material construction. Additionally, we and Wealth Capital Management may initiate a sale of any asset at any time.
Through joint ventures with the Brandywine Realty Trust, or Brandywine, we own 30.0 percent interests in two office assets and one multifamily asset. We act as the managing member of each of these ventures and are entitled to a promoted interest if certain return thresholds are met with respect to each asset. As the managing member of each of these ventures, we exercise day-to-day management control over each asset, subject to certain customary major decision rights in favor of Brandywine, which include approval over financings of the properties. In the event of a deadlock with respect to any major decision, either partner may exercise certain buy-sell rights with respect to interests in the applicable venture, other than during the construction phase for the applicable asset. Upon the earlier to occur of the satisfaction of certain development milestones or May 2020, we and Brandywine have a right to initiate a sale of each venture's assets.
Through joint ventures with New England Teamsters and Trucking Industry Pension Fund, or NETTIPF, we own 10.0 percent interests in one multifamily asset, one retail asset and one land asset.
93
We act as managing member of each of the ventures and are entitled to a portion of a promoted interest if certain return thresholds are met with respect to each asset, in addition to our equity ownership interest. As the managing member of each of these ventures, we exercise day-to-day management control over each asset, subject to certain customary major decision rights in favor of NETTIPF, which include approval over sales and financings of the properties. In the event of a deadlock with respect to any major decision, either partner may exercise certain buy-sell rights with respect to the interests in the applicable venture, except that no buy-sell offer may be made during certain periods of construction until the completion of related development milestones. Additionally, at any time satisfying such development milestones, either partner may initiate a sale with respect to the ventures' assets.
Through a joint venture with CIGNA Affiliates Realty Investment Group, or CIGNA, we own 14.7 percent interests in the Notch 8 multifamily and retail assets. We act as the operating member with respect to the venture and are entitled to a portion of a promoted interest if certain return thresholds are met with respect to each asset, in addition to our equity ownership interest. Our 14.7 percent interest reflects our assignment of a small portion of our interest in this joint venture to certain unrelated third-party partners. As the operating member of the venture, we exercise day-to-day management control over each asset, subject to certain consent rights in favor of CIGNA, which include approval over sales and financings of the properties. In the event of a deadlock with respect to any major decision occurring after satisfying certain development milestones, we and CIGNA may exercise a reciprocal repurchase right with respect to interests in the venture.
Through a joint venture with Lionstone, we act as the master developer for the Potomac Yards Land Bay F land asset. We do not currently own equity in the joint venture, but in connection with our role as the master developer, we and certain members of our management team are entitled to a promoted interest if certain return thresholds are met with respect to the asset. The venture is managed by individuals elected by Lionstone. Upon termination of the pre-development management agreement or the related agreements for certain causes or the occurrence of certain buyout events, Lionstone is entitled to exercise an option to purchase our interests in the venture.
Non-Core Excluded Assets
The JBG funds will continue to own various assets and interests in assets that will not be contributed as part of the Combination Transactions. These assets and interests in assets, which we refer to collectively as the non-core excluded assets, are not being contributed because they are not consistent with our long-term business strategy going forward as a public company. As of December 31, 2015, the estimated gross asset value of these non-core excluded assets was approximately $1.8 billion. These non-core excluded assets can generally be categorized as follows:
- •
- Condominiums and Townhomes. The JBG funds own three condominium and five townhome assets, comprising 109 condo units and 782 townhomes, that we are not acquiring because we do not intend for for-sale housing to be a primary asset class of ours going forward, except to enhance a mixed use development.
- •
- Hotels. The JBG funds own 10 hotels, comprising 4,090 rooms, that we are not acquiring because we do not intend for hotels to be a primary asset class of ours going forward.
- •
- Assets Likely to be Sold in the Near-Term. The JBG funds own 14 assets, comprising approximately 400,000 RSF of office space, 470 multifamily units, approximately 44,000 RSF of retail space and approximately 1.9 million square feet of estimated land density, that we
94
The JBG funds will continue in existence, owning and operating its assets, until the JBG fund winds down in accordance with its governance documents. The JBG funds, except the most recent fund, which we refer to as JBG Fund IX, only have the right under their governance documents to make material capital calls or make future investments that relate to their existing investments. JBG Fund IX expects to terminate its commitment period upon the completion of the Combination Transactions, at which point it will only be able to make capital calls and make future investments that relate to its existing investments.
In connection with obtaining the necessary approvals from the constituent members of the JBG funds, it was determined that the general partner and managing member interests in the JBG funds that are held by current JBG executives would not be transferred in the Combination Transactions. Therefore, an entity comprised of JBG employees, including individuals who will be our executive officers, will continue to serve as the general partner or managing member of each fund, making decisions with respect to the assets that will continue to be owned by the applicable JBG fund. These individuals will continue to have an ownership interest in each fund, and will continue to own a promoted interest in such fund that will entitle such individuals to receive additional compensation if the fund achieves certain return thresholds. We expect that we will be a general partner or managing member of any future investment fund that we sponsor.
Upon completion of the Combination Transactions, we will provide various services with respect to each of the JBG funds, including asset management, property management, construction management, leasing and related services, and receive fees with respect to these services. See "—Our Strategic Capital Business" above. We will not be acquiring the general partner or managing member interests in each of the JBG funds as part of the Combination Transactions and therefore will not be entitled to receive any of the promoted interest that may be payable by such funds pursuant to their organizational documents.
95
INDUSTRY OVERVIEW AND MARKET OPPORTUNITY
DC Metro Area Market Opportunity
Unless otherwise indicated, all information in this DC Metro Area Market Opportunity section is derived from the market study prepared for us by JLL.
Washington, DC is one of the world's premier gateway cities, an international hub of economic activity, and the capital of the U.S. government. The DC metro area is home to an affluent and well-educated population, featuring the highest median household income and educational attainment of any major metropolitan market in the United States. Moreover, the region features several top-tier universities, 15 Fortune 500 company headquarters and hundreds of think tank and non-profit organizations. This diversified community of businesses and institutions, along with an established governmental presence, provides a stable and growing economic foundation for the region. These factors provide the underpinnings of demand within the local real estate market.
DC Metro Area Versus Major Metropolitan Areas
The DC metro area is one of the most stable and resilient economies and real estate markets in the United States. The DC metro area market cycle has historically trended independently of other markets, exhibiting a recession-resilient tendency compared to other metro regions. During periods of economic downturn, the federal government has provided a buffer to economic shock as well as stability and growth in the market.
Since 1990, the DC metro area has experienced positive job growth in 22 of 26 years, with average annual job growth of 1.4 percent. In comparison, during the same time period, the New York metro area experienced job growth in 20 of 26 years, with average annual job growth of 0.6 percent, and the San Francisco metro area has experienced job growth in 19 of 26 years, with average annual job growth of 0.9 percent.
The DC metro area office market has experienced positive net absorption in 22 of the past 26 years. Over those 26 years, the regional office market has posted a net absorption as a percent of inventory ratio of 2.5 percent, substantially higher than the U.S. ratio of 1.1 percent over the same time period. Rents have also consistently followed this upward trajectory. Since 1990, there have been just six years where rents have remained flat or declined, with the average annual growth of 2.8 percent.
From a multifamily perspective, demand levels have consistently increased at above-average rates across the DC metro area multifamily market. Since 2011, net absorption to inventory ratios averaged 2.2 percent, compared to the 1.9 percent experienced across the United States. While rents increased at slightly lower rates than the overall United States due to greater supply additions, asking rents across the region have increased each year over the past decade, averaging annual growth of 3.1 percent since the beginning of 2003 as of the end of the first quarter of 2016.
Population growth across the region has grown 91 percent faster than the broader United States and migration to urban areas has positioned the multifamily market extremely well over the past seven years, with many submarkets, such as NoMa, Southeast, the Rockville Pike Corridor and Potomac Yard, emerging over that timeframe.
Recent DC Metro Area Performance Has Bottomed and is Now Recovering
While the DC metro area was historically one of the most consistent economies and office real estate markets in the United States prior to 2007, several factors disrupted that performance over the past eight years. These factors have resulted in a delayed recovery relative to other major metro areas. From 2007 through 2010, a large speculative development cycle in the regional office market delivered 25.3 million square feet of space to the market. With a significant amount of speculative space
96
delivering, vacancy rates shifted from a low of 8.1 percent in 2006 to 12.7 percent in 2010. At the same time vacant supply was added to the market, the DC metro area went into a mild recession, primarily impacting private entities such as law firms, which gave back 4.6 million square feet of space in rightsizing efforts from 2008 through 2015. The stimulus spending during the recession was largely responsible for initially isolating the government and its contractors from the most acute impacts of the recession.
The DC metro area was the first market nationally to exit the recession in late 2009 and early 2010 with nearly 7.5 million square feet of occupancy growth in 2010 fueled by substantial increases in government budgets, and employment as a result of stimulus funding. In fact, in 2010 the DC metro area accounted for 70 percent of national office net absorption. However, that growth was limited as federal deficits soared above one trillion dollars annually and long-term debt levels reached new heights. As a result of those soaring spending levels, the federal government shifted from investing to saving and sequestration followed. Sequestration, which mainly impacted government contractors and federal government agencies, combined with BRAC (Base Realignment And Closure) implementation, which shifted Department of Defense real estate from leased space to owned bases, contributed to 5.2 million square feet of occupancy losses from 2012 through 2014, mainly in Northern Virginia.
All of these examples point to an unusual aberration in the DC metro area's otherwise strong historical performance. As of the first quarter of 2016, it is expected that both the local economy and real estate markets, particularly the office sector, which had been lagging, have reached bottom and as of the first quarter of 2016, are displaying signs of consistent growth. The metro area has seen positive job growth since March of 2014 and since April of 2015, the regional economy has added the most number of jobs since 2006 and that growth is translating into net absorption and rent growth, first in Washington, DC and spreading to metro-accessible locations in Northern Virginia and Suburban Maryland.
In recent years, this aberration left the DC metro area economy and real estate market in a slow-growth environment, placing the DC metro area in a lagging position behind other Major Metro Areas. However, over the past 18 months, consistent signs of a strong and diversified recovery have emerged across the DC metro area. Recent federal deficits registered a quarter of the peak levels six years ago, federal employment has experienced year-over-year job increases since January of 2015 and procurement spending levels have reached bottom with significant increases in high-growth areas such as cybersecurity. All of this has fueled the highest regional job growth (83,300 jobs added the past 12 months, equating to 2.7 percent annual growth) since 2006, surpassing the long-term regional average and the current United States average.
Economic demand has driven real estate demand and regional office absorption levels surpassed one million square feet in 2015 for the first time since 2010 and and are projected to surpass two million square feet in 2016. Rents within all Metro-served area submarkets are projected to surpass the prior peak levels of 2007 in 2016. The preceding years' slow growth environment has resulted in a limited office supply environment where annual supply completions are expected to average 1.3 million square feet from 2016 to 2018, compared to 9.0 million square feet from 2006 to 2009. The DC metro area is forecast to surpass national and major peer markets in terms of both economic and office real estate growth over the next 36 months. Peer markets are defined in this study as the "Major Metropolitan Areas" within the United States, which are the metro areas of Atlanta, Boston, Chicago, Dallas, Houston, Los Angeles, Miami, New York, Philadelphia, Phoenix, San Francisco and Seattle. While certain of these markets, such as Houston, have already peaked, and other peer markets, such as Seattle and San Francisco, move closer to record highs, the DC metro area office recovery is in its early stages.
Based on this renewed demand and a supply-constrained environment, the DC metro area is expected to have several years of growth ahead. With the regional economy and office market now at
97
bottom, the region's real estate industry is uniquely poised to experience a stronger recovery over the next 36 to 48 months compared to peer markets. The following chart illustrates the DC metro area's positioning in the cycle relative to other Major Metro Areas.
Q1 2016 U.S. Office Clock
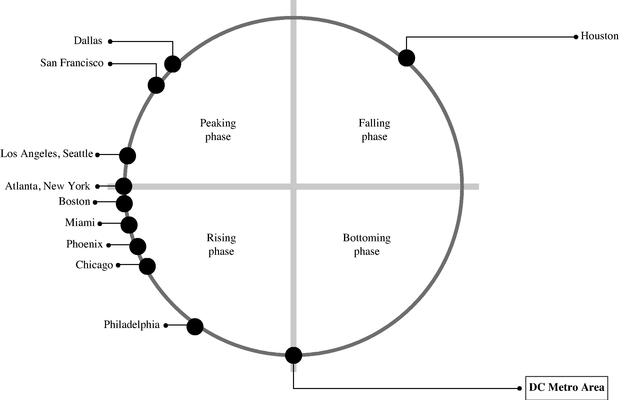
Source: JLL Research
The DC metro area encompasses Washington, DC, as well as Suburban Maryland and Northern Virginia. JBG's portfolio of assets is concentrated in strategic submarkets within the DC metro area that share several key attributes, including densely-populated urban infill Metro-served locations with high barriers to new development due to limited available land and/or entitlement constraints. The following sections present a summary of JBG's current submarkets, along with detail on their respective economic drivers, demographics, and office and multifamily real estate markets.
The map below illustrates the constituent counties of the Washington, DC Metropolitan Statistical Area, or MSA, as well as the counties covered by JLL's definition of "The Market," which includes Washington, DC; Northern Virginia, encompassing Arlington County, Fairfax County, Loudoun County, Prince William County and the cities of Alexandria, Falls Church, Fairfax, Manassas and
98
Manassas Park and Suburban Maryland, comprised of Montgomery, Frederick and Prince George's Counties.
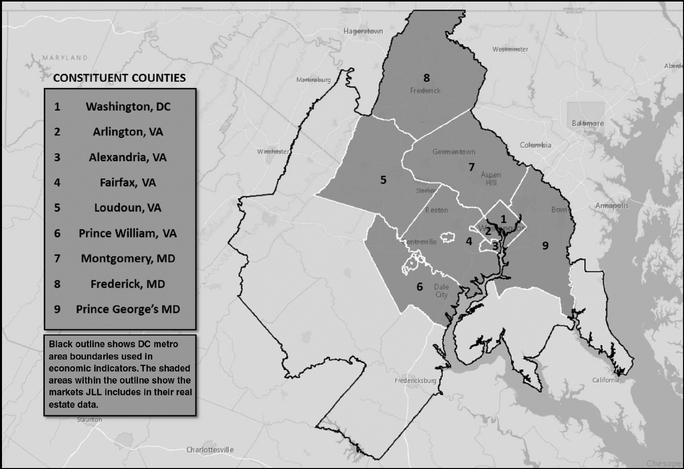
Washington DC Metro Area Overview
Economic Trends
The Washington DC metro area is the sixth-largest economy in the United States, with an annual gross metropolitan product, or GMP, of more than $410 billion and a population of more than six million local residents. The region has exhibited significant growth over the past 15 years, with economic output and total employment growing over 40 percent and 20 percent, respectively, since 2000. This exceeds the growth of both the broader United States and most other peer markets nationwide during the same time period. As of March 2016, the Washington, DC metro area,
99
unemployment rate was 4.1 percent, which is 50 basis points lower than the prior year and 90 basis points below the U.S. average.
| | |
Annual Employment Change
As of April 2016
12-month % change | | DC Metro Area Gross Metro Product vs.
U.S. Gross Domestic Product
12-month % change (real GDP) |
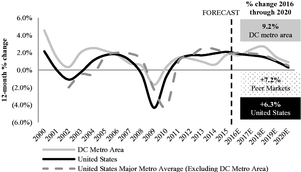 |
|
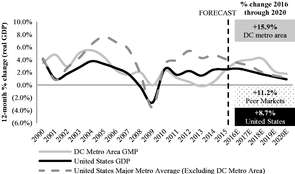 |
| |
|
| Source: JLL Research, Bureau of Labor Statistics | | Source: JLL Research, Bureau of Economic Analysis |
GMP Growth Across Major Metro Areas
2000 - 2015 As of April 2016
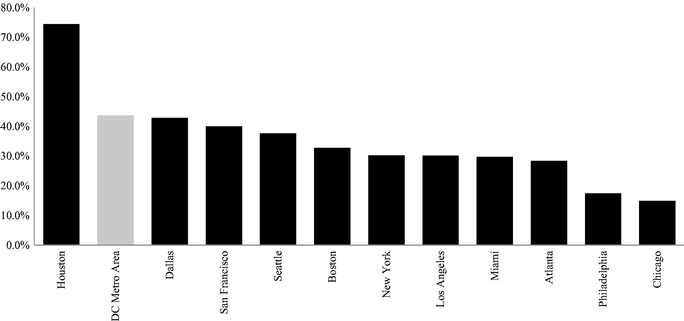
Source: JLL Research, Bureau of Economic Analysis
100
The regional economy has traditionally been driven by the core industries of government, federal contracting, professional services, defense and engineering. The federal government has historically acted as a stabilizing presence within the region, providing resiliency through economic cycles, as federal spending has generally been countercyclical and grown on average at more than twice the rate of annual U.S. Gross Domestic Product, or GDP, since the 1960s as shown in the chart below.
Annual U.S. Federal Outlays vs. Annual U.S. GDP
As of April 2016
% change
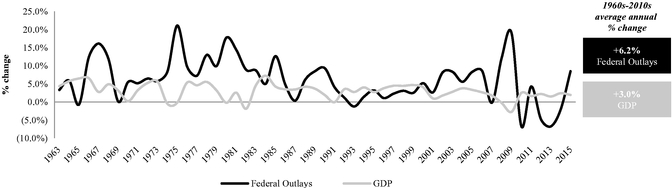
Source: JLL Research
It is expected that the economic contraction and stagnancy period is behind the region, and recovery and growth are pushing forward and diversifying from the region's traditional government base to more of a commercial base dominated by professional and business services and high-growth segments such as cybersecurity, intelligence, life sciences and technology.
GMP levels are forecast to grow by 15.9 percent from 2016 through 2020 with the highest growth coming in 2016 through 2018. In comparison, Major Metropolitan Area GMP growth is forecasted to grow by 11.2 percent during the same timeframe and overall GDP growth is forecast to grow by 8.7 percent. On the employment side, the DC metro area is expected to see combined job growth of 9.2 percent from 2016 through 2020, compared to employment growth of 7.2 percent and 6.3 percent, respectively, for Major Metropolitan Areas and the broader United States.
While the region has historically benefited from government spending, the DC metro area economy is diversifying away from reliance on government expenditures and expanding towards a broader base of private sector, non-governmental services. During the 2000 through 2015 time period, the federal government accounted for approximately 18 percent of the DC metro area total economic growth. From 2011 to 2015, however, that share declined to only 4 percent, illustrating the separation of the region's economy from government reliance. New emerging sectors have helped propel recent job creation, and now account for the largest share of jobs created in the DC metro area. Since 2000, economic gains have been led by non-governmental sectors, including professional and business services (5.7 percent annual growth), healthcare and social assistance (4.1 percent annual growth) and financial services (3.9 percent annual growth). According to the U.S. Bureau of Labor Statistics, the fastest growing industries in the Washington, DC MSA over the past 12 months have been education and
101
health services, professional and business services, and leisure and hospitality. The fastest growing industries in the commercial office market have been cybersecurity, life sciences and technology.
| | |
| |
|
|---|
DC Metro Area Economic Growth by Industry
From 2000 to Present as of October 2015 | | DC Metro Area Current Economic Breakdown by Industry
As of October 2015 |
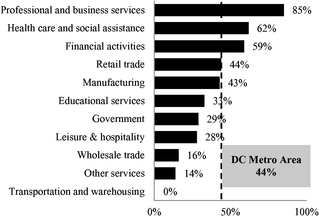 |
|
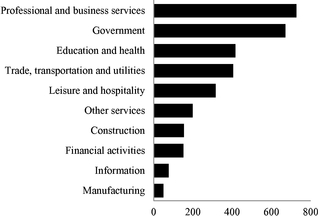 |
| |
|
| Source: JLL Research, Bureau of Economic Analysis | | Source: JLL Research, Bureau of Economic Analysis |
Demographic Attributes
The DC metro area is one of the most affluent, well-educated and fastest-growing regions in the nation. The region features the highest median household income and educational attainment of any Major Metropolitan Areas in the United States, and from 2000 through 2015 has exhibited the fourth highest population growth among Major Metropolitan Areas, behind only Houston, Dallas and Phoenix, increasing 8.2 percent during this time. Since 2000, the DC metro area population has grown by 27.1 percent compared to Major Metropolitan Area growth of 16.3 percent and overall U.S. growth of 14.2 percent.
Population Growth
From 2000 to 2015
Source: JLL, Census Bureau
102
| | |
| |
|
|---|
| Median Household Income | | Educational Attainment |
 |
|
 |
| |
|
| Source: JLL Research, U.S. Census Bureau | | Source: JLL Research, U.S. Census Bureau |
Regional employment gains in both traditional and "new" economies have contributed to positive net migration into the DC metro area since 2009. The region's strong growth attributes are supported by its younger-than-average residents, with the percentage of the population between the ages of 20 and 29, commonly known as "Millennials," higher than any other Major Metropolitan Area in the country. In addition, the DC metro area is served by the second-largest rapid transit system in the United States, commonly known as "Metro," and the region is routinely ranked as one of the most walkable metro areas in the country. The DC metro area's appeal to Millennials will continue to drive population increases over the next five years, fueling additional demand and development for the mainly Metro-served, destination-type locations that the Millennial demographic prefers.
Transportation and Amenities
Reliable and efficient public transportation services are provided throughout the DC metro area by the Washington Metropolitan Area Transit Authority (WMATA), which operates the second busiest rail transit system and sixth busiest bus network in the United States, commonly known as the Metro. Currently, Metro service is provided to more than 700,000 customers daily across 91 stations, and bus service is provided to 11,500 daily stops on 325 routes throughout the region.
The region's extensive public transportation system has fostered economic and population growth, with nearly all population growth over the past five years centered near Metro stations. For example, in Washington, DC, the highest levels of growth have centered around Metro stations (Woodley Park, U Street/Shaw, NoMa and Southeast). Similarly, in Suburban Maryland, recent population growth has primarily been located around Metro stations (Bethesda CBD, Chevy Chase, Downtown Silver Spring, and the Rockville Pike Corridor) and in Northern Virginia, growth has been fastest near current and planned Metro stations (Alexandria, the Rosslyn-Ballston Corridor, Falls Church, Tysons Corner and the Toll Road markets of Reston and Herndon).
This shifting population dynamic has generated competitive real estate market conditions in submarkets near current or planned Metro stations. These Metro-served areas typically feature heightened leasing activity, lower vacancy rates, and higher rental rates than non-Metro-served submarkets. For example, office locations in the DC metro area submarkets that have direct access to a Metro station exhibit an average current vacancy rate meaningfully lower than non-Metro-served submarkets. From January 1, 2015 through March 31, 2016, over 93 percent of office leasing activity in the DC metro area has been within 0.75 miles of a current or planned Metro station. Resulting rent premiums in Metro-served submarkets average in excess of 60 percent for both office and multifamily property types. Partly due to these superior economics, development activity has surged in these Metro-
103
served submarkets, accounting for over 90 percent of the active construction in the DC metro area as of the end of March 2016.
Over the past 15 years, the DC metro area has exhibited substantial growth in locations with greater density, transit access, walkability, a high level of retail amenities and diversification of real estate uses. The region's focus on mixed-use development and the widely-utilized public transportation system make the area an attractive destination for residents and office tenants seeking accessible places to live and work. Anchored by an urban core and suburban Metro-served core that have both seen population increases, steady densification and development, the DC metro area is expected to continue to be among the country's premier real estate markets.
DC Metro Area—Office Outlook
- •
- As of the first quarter of 2016, the DC metro area office market has bottomed with vacancy reaching peaks and rents hitting lows over the past 12 months and is uniquely poised to experience a stronger recovery over the next 36 to 48 months compared to other Major Metro Area markets.
- •
- Approximately 1.5 million square feet of space will deliver annually over the next three years, compared to an average of 3.3 million square feet annually from 2010 through 2014 and 9.0 million square feet annually from 2006 through 2010.
- •
- DC metro area office vacancy is forecast to decline from a rate of 16.4 percent at the end of the first quarter of 2016 to below 15 percent by the end of 2017 and to below 14 percent by the end of 2018, fueled by more than 10 million square feet of occupancy gains over the next 36 months.
- •
- With the exception of non-Metro accessible markets, rents will increase 13.1 percent over the next 36 months with 75 percent of submarkets experiencing rent growth as early as the first quarter of 2016.
- •
- Rent growth will average 14.1 percent over the next 36 months in Washington, DC
- •
- Rent growth will average 12.8 percent over the next 36 months in Northern Virginia
- •
- Rent growth will average 14.9 percent over the next 36 months in Suburban Maryland
DC Metro Area—Multifamily Outlook
- •
- As of the first quarter of 2016, the DC metro area multifamily market remains a high demand growth market, although the market will have to work through pockets of new supply over the next 24 months before stabilizing in the latter part of 2017 and into 2018.
- •
- Approximately 10,645 units are under construction across the DC metro area with an expected delivery in 2016, followed by another 13,085 units delivering in 2017, followed by a significant drop-off in new supply in 2018 projected at 6,700 units. In total, the market will see approximately 30,000 units deliver over the next three years through 2018. The condo market, however, is still far below historical delivery levels, helping to offset the large number of new rental deliveries.
- •
- While demand will remain strong due to increased vibrancy in the economy and continued population growth, supply will continue to outpace demand and DC metro area multifamily vacancy is projected to increase from a current rate of 6.2 percent to upward of 9.0 percent at the end of 2016 and 12.4 percent at the end of 2017 before returning to levels of 9.2 percent in 2018 as the supply pipeline diminishes.
104
- •
- Net effective rents are expected to flatten across the DC metro area as concessions increase due to increased supply, but asking rates will hold and increase over the next 36 months in the 7.0 percent range in aggregate as a result of new construction delivering to the market at 5.0 to 10.0 percent premiums.
- •
- Rent growth is projected to average 8.9 percent over the next 36 months in Washington, DC
- •
- Rent growth is projected to average 6.5 percent over the next 36 months in Northern Virginia
- •
- Rent growth is projected to average 7.7 percent over the next 36 months in Suburban Maryland
JBG Submarkets Versus Other DC Metro Area Submarkets
The tables below compare the submarkets JBG operates in against other DC metro area submarkets
105
Office Submarket Comparison—All Classes (as of March 31, 2016)
| | | | | | | | | | | | | |
Washington, DC Office Markets | | Rentable Square Feet | | Absorption(2) | | 15-Year
Inventory
Growth(3) | | 15-Year
Net Absorption(4) | |
|---|
JBG Submarkets(1) | | | 143,392,582 | | | 0.7 | % | | 33.0 | % | | 17.7 | % |
Non-JBG Submarkets | | | 186,431,852 | | | 0.0 | % | | 27.5 | % | | 8.9 | % |
| | | | | | | | | | | | | | |
Total/Wtd. Avg. | | | 329,824,434 | | | 0.3 | % | | 29.8 | % | | 12.3 | % |
| | | | | | | | | | | | | | |
| | | | | | | | | | | | | | |
| | | | | | | | | | | | | | |
| | | | | | | | | | | | | |
| | Vacancy Rate(5) | | 15-Year Historical
Vacancy Average(6) | | Rental Rates
Relative to
Market Average(7) | | 15-Year
Asking Rent
Growth(8) | |
|---|
JBG Submarkets(1) | | | 14.0 | % | | 9.9 | % | | 12.4 | % | | 34.7 | % |
Non-JBG Submarkets | | | 18.2 | % | | 12.7 | % | | (7.3 | )% | | 30.0 | % |
| | | | | | | | | | | | | | |
Wtd. Avg. | | | 16.4 | % | | 11.3 | % | | | | | 31.7 | % |
- (1)
- JBG submarkets are defined as: Ballston, Bethesda CBD, Chevy Chase, Clarendon/Courthouse, DC CBD, Eisenhower Avenue, Falls Church, Georgetown, McLean, NoMa, North Rockville, Reston, the Rockville Pike Corridor, Rossyln, Shady Grove, Southeast, Southwest, Uptown. Inventory includes leased office assets over 30,000 square feet, excluding medical office buildings and owner-occupied assets. Includes Class A, B and C assets.
- (2)
- Represents net change in occupied space from Q4 2014 through Q1 2016 as a percentage of overall inventory.
- (3)
- Represents growth in inventory over the noted period through Q1 2016.
- (4)
- Represents net change in occupied space over the noted period through Q1 2016 as a percentage of overall inventory.
- (5)
- Represents percentage of inventory that is direct vacant as of Q1 2016 as a share of overall inventory.
- (6)
- Long-term average vacancy rate change over the noted period through Q1 2016.
- (7)
- Represents weighted direct average rental rate, based on direct available square footage and per square foot, full service, quoted asking rental rates, on an annual basis through Q1 2016 for JBG and non-JBG submarkets compared to those for the overall blended market on a percent premium or discount basis.
- (8)
- Growth of average asking rental rates over the noted period through Q1 2016.
106
Multifamily Submarket Comparison—Mid/High-Rise (as of March 31, 2016)
| | | | | | | | | | | | | |
Washington, DC Multifamily Markets | | Units | | Absorption(2) | | 5 Year
Inventory
Growth(3)(9) | | 5 Year
Net Absorption(4)(9) | |
|---|
JBG Submarkets(1) | | | 28,092 | | | 25.1 | % | | 104.8 | % | | 94.1 | % |
Non-JBG Submarkets | | | 265,973 | | | 4.0 | % | | 15.5 | % | | 15.6 | % |
| | | | | | | | | | | | | | |
Total/Wtd. Avg. | | | 294,065 | | | 5.6 | % | | 20.5 | % | | 17.8 | % |
| | | | | | | | | | | | | | |
| | | | | | | | | | | | | | |
| | | | | | | | | | | | | | |
| | | | | | | | | | | | | |
| | Vacancy
Rate(5) | | 5 Year
Vacancy
Rate Change(6)(9) | | Rental Rates
Relative to
Market Average(7) | | 5 Year PSF
Asking Rent
Growth(8) | |
|---|
JBG Submarkets(1) | | | 2.7 | % | | (2.4 | )% | | 29.8 | % | | 8.4 | % |
Non-JBG Submarkets | | | 3.9 | % | | (0.1 | )% | | (8.1 | )% | | 2.8 | % |
| | | | | | | | | | | | | | |
Wtd. Avg. | | | 3.8 | % | | (0.3 | )% | | | | | 3.3 | % |
Multifamily Submarket Comparison—Garden-Style (as of March 31, 2016)
| | | | | | | | | | |
Washington, DC Multifamily Markets | | Units | | Absorption(2) | | 5 Year
Net Absorption(4)(9) | |
|---|
JBG Submarkets—Garden-Style(1) | | | 24,711 | | | 0.3 | % | | 1.2 | % |
Non-JBG Submarkets—Garden-Style | | | 198,296 | | | 0.6 | % | | 2.2 | % |
| | | | | | | | | | | |
Total/Wtd. Avg. | | | 223,007 | | | 0.6 | % | | 2.1 | % |
| | | | | | | | | | | |
| | | | | | | | | | | |
| | | | | | | | | | | |
| | | | | | | | | | | | | |
| | Vacancy
Rate(5) | | 5 Year Vacancy
Rate Change(6)(9) | | Rental Rates
Relative to
Market Average(7) | | 5 Year PSF
Asking Rent
Growth | |
|---|
JBG Submarkets—Garden-Style(1) | | | 3.3 | % | | (1.3 | )% | | 8.5 | % | | 5.7 | % |
Non-JBG Submarkets—Garden-Style | | | 3.2 | % | | (0.8 | )% | | (1.1 | )% | | 14.5 | % |
| | | | | | | | | | | | | | |
Wtd. Avg. | | | 3.3 | % | | (0.8 | )% | | | | | 13.0 | % |
- (1)
- JBG submarkets are defined as: Annandale (garden), Bethesda CBD (mid/high-rise), Brookland/Fort Totten (mid/high-rise), Capitol Hill (mid/high-rise), Downtown Silver Spring (garden), Georgetown/Glover (mid/high-rise), H Street (mid/high-rise), I-395 Corridor (garden), NoMa (mid/high-rise), Potomac Yard (mid/high-rise), Reston (mid/high-rise and garden), Rockville Pike Corridor (mid/high-rise), Southeast (mid/high-rise), Tysons Corner (mid/high-rise), and U Street/Shaw (mid/high-rise), . Inventory includes market rate apartment buildings (not including affordable) over 50 units.
- (2)
- Represents net change in occupied units from Q4 2014 through Q1 2016 as a percentage of overall inventory.
- (3)
- Represents growth in inventory over the noted period through Q1 2016.
- (4)
- Represents net change in occupied units over the noted period through Q1 2016.
- (5)
- Represents percentage of inventory that is direct vacant as of Q1 2016 as a share of overall inventory.
- (6)
- Long-term average vacancy rate change over the noted period through Q1 2016.
107
- (7)
- Represents weighted average rental rate, based on available units and per square foot, quoted asking rental rates, on a monthly basis for JBG and non-JBG submarkets compared to those for the overall blended market on a percent premium or discount basis.
- (8)
- Growth of average asking rental rates over the noted period through Q1 2016.
- (9)
- Five-year comparison selected due to lack of supply prior to five-year period in JBG submarkets.
Washington, DC
Overview
Washington, DC is the hub of the broader DC metro area and has experienced significant economic and population growth since 2000. Over the past 15 years, the city has fostered a business-friendly environment, encouraged new economic development initiatives, and spurred widespread residential, office and retail development. Since 2000, Washington, DC's residential population has grown at an annualized rate of 2.2 percent, compared to 0.9 percent growth across the United States. As the local population has grown, migration has spread to revitalized areas of the city such as U Street/Shaw, which is located closer to the established city center, and NoMa, Southeast, H Street and Fort Totten, which are located farther toward the east and north of the city. All of these areas were overlooked parts of the city's residential and retail landscape 15 to 20 years ago. They have now emerged in recent years as some of the trendiest and most attractive areas in the region driven by substantial Millennial migration, increased safety and significant enhancement of retail offerings. For example, along the 14th Street corridor in the U Street/Shaw submarket, there are now more than 60 restaurants within a 10-block stretch of 14th and P Street, NW, seven times the amount of restaurants that were present ten years ago.
Strong population growth, coupled with diversification of commercial tenant drivers, will position Washington, DC as a driving force in the region from an economic, development and investment growth standpoint over the coming years.
108
The map below illustrates the location of JBG submarkets and JBG assets within the Washington, DC market.
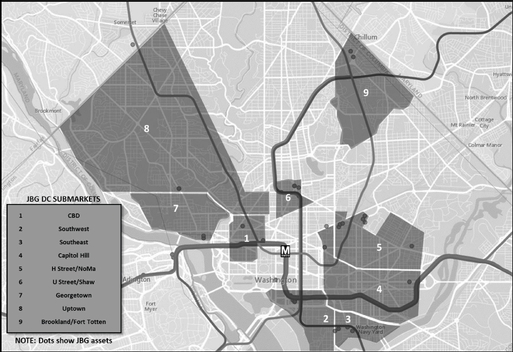
The submarkets in which JBG operates are typically metro-served, have a high degree of walkability and usually feature strong clusters of nearby amenities. As a result of these characteristics, and others described in the following sections, these submarkets have outperformed the DC metro area submarkets in which JBG does not operate, as measured by several common key measures of submarket strength.
Washington, DC Office Market
The Washington, DC office market is comprised of approximately 116 million square feet. The inner core of the market is comprised of the CBD, East End and Capitol Hill submarkets, encompasses approximately 79 million square feet of office inventory primarily leased to law firms, government affairs groups and lobbying firms. The outer core of the market, comprised of the Georgetown, Uptown and West End submarkets, spans approximately 11 million square feet of office inventory, and is occupied primarily by tenants in the professional and business services and creative industries. In the emerging submarkets of Southeast, Southwest,NoMa and Union Market, which comprise approximately 26 million square feet of office inventory, the majority of tenant demand stems from the federal government and federal contractors.
Washington, DC's office sector has also evolved greatly over the past 15 years. Law firms, lobbyists, government affairs group, and the "creative class" have overtaken the federal government as the largest industry concentration in the market over the same timeframe. As a result of this change, the federal government has migrated from the core of the market in the CBD and East End to more emerging commercial frontiers, such as NoMa, Southeast and Southwest, helping transform these submarkets into mixed-use environments, but also helping to substantially diversify the core of the market. Even in the past 24 to 36 months, the tenant composition of the city has evolved with increased migration of trade associations into the city from Northern Virginia and an emerging creative class that has taken shape around Georgetown, Dupont Circle, U Street/Shaw, H Street and Southeast.
109
As a result of steady federal and federally-related demand as well as a 130-foot height limit and other restrictive development regulations, the city of Washington, DC exhibited consistently low vacancy rates, ranging between 3.5 percent and 7.0 percent over the two decades ending in 2007. Despite market difficulties resulting from the 2008 economic downturn and subsequent market softening, as of the end of the first quarter of 2016, office market vacancy stood at a four-year low of 11.6 percent and asking rents have returned to near all-time highs, recently reaching an average of $54.77 per square foot.
Demand for high-end Trophy-class and Class A+ space has also been resurgent within the market, with pricing ranging from the high-$60s per square foot for Class A+ space to high-$80s per square foot for new Trophy-class buildings or second-generation Trophy-class buildings with views of the U.S. Capitol. Stable supply, coupled with increasing demand, is expected to yield consistent rent growth over the next 36 months.
Washington, DC—Office Outlook
- •
- 3.9 million square feet of supply (3.4 percent of existing inventory as of the first quarter of 2016) is projected to deliver to the market over the next 36 months.
- •
- Vacancy levels are projected to decline from 11.6 percent to 10.5 percent by the first quarter of 2017 as absorption levels will top one million square feet in both 2016 and 2017.
- •
- Overall city rents are expected to grow by 14.1 percent from 2016 through 2018
- •
- Rent growth is projected to be highest within Washington, DC core Trophy product and creative class product, averaging 15 percent over the next 24 months.
- •
- Rent growth in off-core Washington, DC locations and core Class A and B locations should average approximately 13 percent combined over the next 24 months.
| | |
| Washington, DC Office Direct Average Asking Rates | | Washington, DC Office New Supply vs. Net Absorption |
| (All Classes) ($PSF) | | (All Classes) (SF Thousands) |
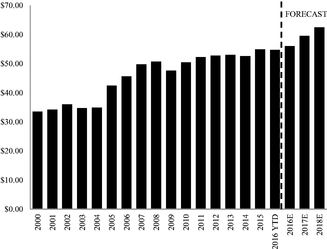 |
|
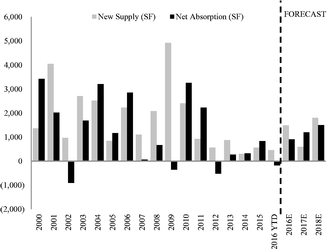 |
| |
|
| Source: JLL Research | | Source: JLL Research |
The following table provides information about JBG's office portfolio as of March 31, 2016 in the Washington, DC submarket
110
Washington, DC—JBG Office Assets
| | | | | | | | |
Asset | | Submarket | | Status | | Total Rentable Square
Feet | |
|---|
DOT | | Southeast | | Stabilized | | | 1,506,955 | |
L'Enfant Plaza Office—East | | Southwest | | Stabilized | | | 437,954 | |
L'Enfant Plaza Office—North | | Southwest | | Stabilized | | | 304,132 | |
1900 N Street | | CBD | | Pre-Development | | | 268,631 | |
1233 20th Street | | CBD | | Stabilized | | | 154,584 | |
16th & I Street | | CBD | | Recently Delivered | | | 120,282 | |
1600 K Street | | CBD | | Stabilized | | | 84,142 | |
Jefferson Court | | Georgetown | | Stabilized | | | 316,830 | |
The Foundry | | Georgetown | | Recently Renovated | | | 233,855 | |
1250 1st Street | | NoMa | | Pre-Development | | | 251,491 | |
50 Patterson Street | | NoMa | | Pre-Development | | | 167,350 | |
2115 Wisconsin Avenue | | Uptown | | Stabilized | | | 182,885 | |
2121 Wisconsin Avenue | | Uptown | | Stabilized | | | 110,241 | |
| | | | | | | | | |
Total Washington, DC Office | | | | | | | 4,139,332 | |
| | | | | | | | | |
| | | | | | | | | |
| | | | | | | | | |
Central Business District (CBD)
The CBD of Washington, DC is located in the heart of downtown Washington, DC within walking distance to the White House and the major residential areas of the city such as Georgetown and U Street/Shaw.
Totaling approximately 34 million square feet of office space, the CBD is a supply-constrained submarket, containing no vacant land parcels and little inventory under construction as of March 2016. The submarket is characterized by tenants with large space footprint requirements, with 82 private sector tenants occupying more than 50,000 square feet as of March 2016. As a result of supply constraints and the general health of larger tenants, CBD Trophy-class office vacancy levels have dropped below 9 percent for the first time since 2007, driving strong rent growth, particularly at the top end of the market.
From a tenancy competitive standpoint, the CBD most frequently competes with the East End for law firms. The key strength the CBD has over the East End is easier vehicular access to attorney workforce neighborhoods, such as Georgetown, Bethesda and McLean. The CBD generally has a lower quality stock of available buildings compared to the East End. 55 percent of the CBD inventory is comprised of Class B and C buildings, compared to just 37 percent of the East End inventory, meaning that the main high quality tenant base, law firms, have historically had more space opportunities in the East End rather than the CBD. That trend is expected to change over the next five to seven years as nearly 4,1 million square feet of Class B and C product within the CBD is being proposed for redevelopment or substantial repositioning in that timeframe.
With a substantial number of core properties along K Street and Pennsylvania Avenue repositioned in the past decade, tenants are expected to have the opportunity to find large blocks of quality space in the coming years in the northwestern section of the CBD near Dupont Circle, comprised today of mostly Class B and B- office buildings. Based on expected escalating law firm demand in the 2020 to 2022 timeframe, Class B and C buildings with central access that can be redeveloped to offer modern amenities and efficient designs will be best positioned to attract anchor tenants at top of the market rents well in excess of current rates.
Net absorption will outpace new supply over the next 36 months, further tightening the market and driving consistent rent growth that is expected to exceed that of the city and the broader region.
111
As of the beginning of April 2016, four buildings were under construction: the redevelopment of 2001 M Street, NW (254,500 square feet), which is 20 percent preleased to a prominent law firm, the redevelopment of 1800 K Street, NW (251,091 square feet), which is 33 percent leased, the redevelelopment of 900 19th Street, NW (115,338 square feet) and 2112 Pennsylvania Avenue, NW, (240,000 square feet), which is 53 percent preleased. The other buildings that will likely offer new space in the pipeline through 2018 are 2000 K Street, NW, 2001 K Street, NW, 2030 M Street, NW and 1700 M Street, NW.
Central Business District (CBD)—Office Outlook
- •
- Only 1.4 million square feet of supply (4 percent of existing inventory as of the first quarter of 2016) is projected to deliver to the market over the next 36 months.
- •
- Vacancy levels are projected to remain stable with the current levels of 9.1 percent to 11.0 percent through 2018 as redevelopment of activity picks up over the next 12 months.
- •
- Overall CBD rents should grow by 14.3 percent from 2016 through 2018.
| | |
| CBD Office Direct Average Asking Rates | | CBD Office New Supply vs. Net Absorption |
| (All Classes) ($PSF) | | (All Classes) (SF Thousands) |
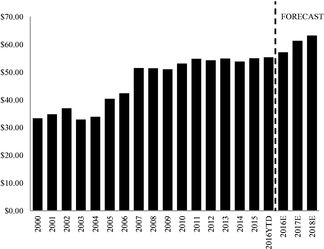 |
|
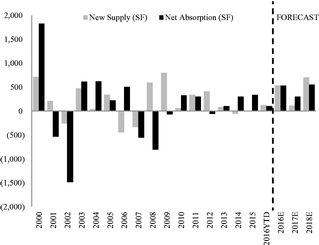 |
| |
|
| Source: JLL Research | | Source: JLL Research |
Georgetown
Georgetown is the smallest Washington, DC office submarket with only 2.2 million square feet of office space, located to the west of the inner core office market across from Rock Creek Park. As a result of the submarket's distinctive architectural character, Georgetown's tenant office composition is primarily comprised of more creative-based firms such as architectural, design, web, marketing, public relations and high-tech companies, along with a handful of national law firms with leased space in more traditional office space overlooking Washington Harbour.
There are currently no office buildings under construction or in the proposed development pipeline. With stable supply and demand continuing to escalate from the creative sector, rent growth is projected to reach 18 percent across the Georgetown office market in aggregate over the next 36 months as vacancy levels remain in the low single digits.
112
Georgetown—Office Outlook
- •
- As of the first quarter of 2016 no new supply is projected to deliver to the market over the next 36 months.
- •
- Vacancy levels are projected to decline from 5.1 percent to less than 3.0 percent by the middle of 2017 as large blocks of space are non-existent and small, creative users fill up the smaller blocks of space.
- •
- Overall Georgetown rents are projected to grow by 14.2 percent from 2016 through 2018.
| | |
| |
|
|---|
Georgetown Office Direct Average Asking Rates
(All Classes) ($PSF) | | Georgetown Office New Supply vs. Net Absorption
(All Classes) (SF Thousands) |
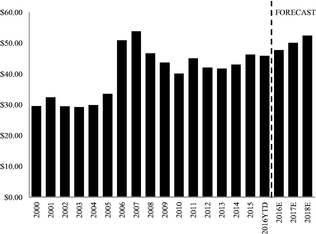 |
|
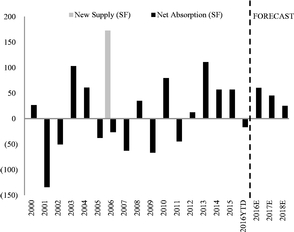 |
| |
|
| Source: JLL Research | | Source: JLL Research |
Southwest
The Southwest market consists of 12.7 million square feet of office space—made up of predominantly federal or federal-related tenants. Steady demand from the federal government and government contractors has historically kept market conditions tight in Southwest with long-term vacancy rates near 10 percent.
The Class B segment of the market has outperformed other segments over the past three years, attracting value-conscious federal government and contractor tenants looking to cut costs. Class B vacancy closed the first quarter of 2016 at 7.2 percent, 300 basis points below the level three years ago, and 61 percent lower than the current Class A vacancy. Further, based on the increased demand for discounted Class B space, the gap between Class A and Class B rents has declined to 12.1 percent as of the end of the first quarter of 2016, 220 basis points less than the historical discount for Class B space relative to Class A space, which averaged 15.5 percent from 2000 to 2014.
The only building in the Southwest office development pipeline is the Wharf at 800 Maine Street, SW. The first phase is a 241,000-square-foot office building that is 38 percent preleased to the American Psychiatric Association with healthy leasing velocity expected for the remainder of the building. Phase 2 of the project is estimated to break ground in the middle of 2016 and deliver an incremental 250,000 square feet in 2018. While Southwest rental dynamics are expected to lag the inner core markets, development activity is expected to be contained, enabling the Southwest market to stabilize and balance over the next 36 months.
113
Southwest—Office Outlook
- •
- 495,000 square feet of office supply at the mixed-use Wharf project (3.9 percent of existing inventory as of the first quarter of 2016) is projected to deliver to the market over the next 36 months.
- •
- Vacancy levels are projected to decline from 14.8 percent to less than 12 percent by the middle of 2017 as new tenants enter the market both at the Wharf and at existing large blocks of space such as 250 E Street, SW.
- •
- Overall Southwest rents should grow by 6.5 percent from 2016 through 2018.
| | |
| |
|
|---|
Southwest Office Direct Average Asking Rates
(All Classes) ($PSF) | | Southwest Office New Supply vs. Net Absorption
(All Classes) (SF Thousands) |
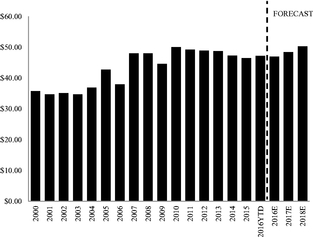 |
|
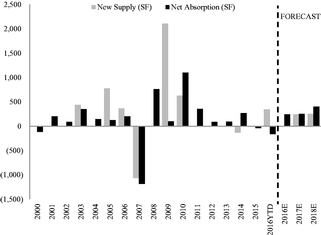 |
| |
|
| Source: JLL Research | | Source: JLL Research |
Washington, DC Multifamily Market
The following table provides information about JBG's multifamily portfolio as of March 31 2016 in the Washington, DC submarkets.
Washington, DC—JBG Multifamily Assets
| | | | | | | | | | | | | |
Asset | | Submarket | | Type | | Status | | Total
Rentable
Square
Feet | | Number of
Units | |
|---|
Atlantic Plumbing | | U Street/Shaw | | Mid/High-Rise | | Recently Delivered / Renovated | | | 245,604 | | | 310 | |
13th & U Street | | U Street/Shaw | | Mid/High-Rise | | Construction | | | 147,056 | | | 130 | |
Atlantic Plumbing C—North | | U Street/Shaw | | Mid/High-Rise | | Pre-Development | | | 144,876 | | | — | |
Atlantic Plumbing C—South | | U Street/Shaw | | Mid/High-Rise | | Pre-Development | | | 79,676 | | | — | |
1244 South Capitol Street | | Southeast | | Mid/High-Rise | | Construction | | | 226,283 | | | 291 | |
West Half II | | Southeast | | Mid/High-Rise | | Pre-Development | | | 173,947 | | | — | |
West Half III | | Southeast | | Mid/High-Rise | | Pre-Development | | | 208,783 | | | — | |
The Gale | | H Street/NoMa | | Mid/High-Rise | | Stabilized | | | 466,852 | | | 603 | |
Fort Totten Square | | Brookland/Fort Totten | | Mid/High-Rise | | Recently Delivered / Renovated | | | 254,292 | | | 345 | |
Georgetown Development Parcel | | Georgetown Multifamily | | Mid/High-Rise | | Pre-Development | | | 204,892 | | | — | |
51 N Street | | NoMa | | Mid/High-Rise | | Pre-Development | | | 119,981 | | | — | |
Kennedy Row | | Capitol Hill | | Mid/High-Rise | | Stabilized | | | 106,553 | | | 141 | |
| | | | | | | | | | | | | | |
Total Washington, DC Multifamily | | | | | | | | | 2,378,795 | | | 1,820 | |
| | | | | | | | | | | | | | |
| | | | | | | | | | | | | | |
| | | | | | | | | | | | | | |
114
U Street/Shaw
U Street/Shaw's central location, Metro access and proximity to downtown contribute to its status as one of Washington, DC's most attractive residential locations. U Street/Shaw is among sections of the city with the highest population density. Rent and home price growth have been strong due to sustained population increases, both of which are driving activity even farther east. Strong demand for residential and boutique office space coupled with low vacancy in both sectors are expected to lead to increased competition for the few remaining lots on 14th, 9th, 7th and U Streets—the main commercial thoroughfares of the submarket.
The U Street/Shaw Mid/High-Rise submarket has delivered 2,485 residential units since the beginning of 2013. Absorption levels largely kept pace during this growth period, with 2,001 of those units absorbed over the same timeframe. Stabilized vacancy levels have increased slightly from a cyclical low of 1.1 percent in 2011 to 1.2 percent in 2015 and rents have increased in 10 of the past 12 years back to 2004. The U Street/Shaw area currently exhibits the highest multifamily rents of any submarket within the DC metro area at $3.99 per square foot or $2,853 per unit, further illustrating the market's demand and resilience, despite the meaningful new supply additions. As a result of increasing rents at the epicenter of new development along 14th Street, development in the submarket has migrated east to Shaw where rents are also growing rapidly.
Over the next few years, new supply is expected to continue to deliver in the U Street/Shaw neighborhood. Projects such as Elysium Fourteen, JBG's project at 13th and U and The Griffith are some of the projects scheduled to deliver in 2016 through 2018. Despite this new supply, continued rent growth is expected due to high-quality product coming online and a strong migration of mature post-Millennial renters flocking to the submarket.
U Street/Shaw—Multifamily Outlook
- •
- 1,153 units of multifamily supply (33.2 percent of existing inventory as of the first quarter of 2016) are projected to be delivered to the market over the next 36 months.
- •
- Non-stabilized vacancy levels are projected to increase slightly from the current rate of 13.5 percent as new new supply slightly outpaces new demand. We do not expect demand to outpace new supply because a certain segment of renters will begin to be priced out of the U Street/Shaw submarket as the market matures and more luxury product delivers.
- •
- Overall U Street/Shaw rents should grow by 6.5 percent from 2016 through 2018 mainly as a result of newer product coming online at higher rents than existing product.
115
| | |
Logan-U Street-Shaw Mid-Rise and High-Rise Multifamily Average Asking Rates
(Mid/High-Rise) ($PSF) | | Logan-U Street-Shaw Mid-Rise and High-Rise
Multifamily New Supply vs. Net Absorption
(Mid/High-Rise) (Units) |
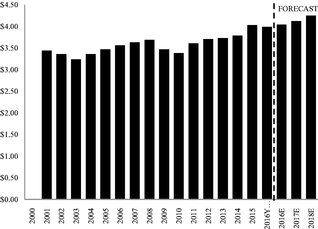 |
|
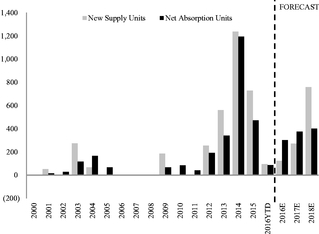 |
| |
|
| Source: JLL Research | | Source: JLL Research |
Southeast
Southeast's mid/high-rise multifamily market emerged with the arrival of the Washington Nationals baseball stadium in 2008. Prior to 2008, no multifamily product existed and just one mid-rise condo tower existed within the Southeast submarket. Over the past four years, population levels in Southeast have grown 29.1 percent—more than eight times the rate of western-situated submarkets such as the upper Northwest corridor and West End of Washington, DC.
The Southeast submarket's multifamily inventory includes 2,901 units, with an average addition of 484 units per year since 2008. While vacancy has increased with the delivery of additional buildings to 22 percent as of the end of March 2016, the overall vacancy level prior to these deliveries was 4.5 percent as of the end of December 2015. We believe buildings south of M Street will substantially outperform the market from both a demand and rent perspective, but buildings to the north of M Street will lag the market and contribute to higher vacancy in the submarket. As demand has escalated due to a growing retail and population base, rents have begun to increase at above-average rates, growing 8.8 percent since the beginning of 2013 to $3.10 per square foot, or $2,410 per unit.
The Southeast submarket is expected to experience meaningful supply growth in 2016 and 2017 with the delivery of nearly 1,498 units before the pipeline begins to moderate in 2018. While rents are expected to grow, increases will be limited due to the pipeline of new units delivering.
Southeast—Multifamily Outlook
- •
- 1,788 units of multifamily supply (66 percent of existing inventory as of the first quarter of 2016) are projected to deliver to the market over the next 36 months.
- •
- Vacancy levels are projected to remain heightened, but will lower slightly from the current 22 percent levels. Absorption will best historical averages, but new supply will likely outpace new demand, leaving an overhang of 400 to 500 units each in 2016 and 2017 before demand outpaces supply in 2018 by nearly 150 units.
116
- •
- Overall Southeast rents should grow by 4.5 percent from 2016 through 2018 mainly in late 2017 and early 2018 as supply and demand align further.
| | |
Southeast Mid-Rise and High-Rise Multifamily
Average Asking Rates
(Mid/High-Rise) ($PSF) | | Southeast Mid-Rise and High-Rise Multifamily
New Supply vs. Net Absorption
(Mid/High-Rise) (Units) |
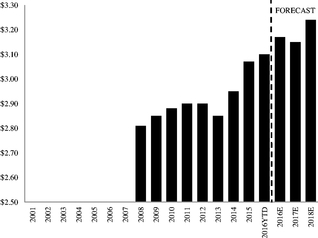 |
|
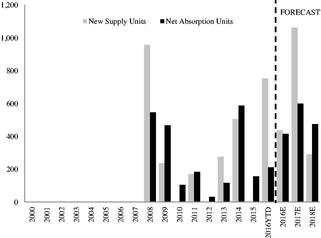 |
| |
|
| Source: JLL Research | | Source: JLL Research
|
NoMa
Along with Mount Vernon Triangle and Southeast, NoMa (North of Massachusetts Avenue) is one of the largest "emerging market" areas in the District and has been successful in attracting young professionals due to a rapidly-growing office sector with tenants such as National Public Radio Mathematica, the Department of Justice, Kaiser Permanente, the American Chemistry Council and NeighborWorks as well as its supply of new and well-located housing along Metro's red line.
As a result of these dynamics, NoMa's residential population has tripled since 2010. Prior to 2010, no mid/high-rise multifamily buildings existed in NoMa. Since 2010, an average of one building per year has been added to the market, yielding approximately 358 units delivered annually to the submarket over that timeframe.
Due to some of the highest population growth across the city and the region, NoMa's mid/high-rise vacancy has stabilized quickly as developments have delivered to the market. With new product added to the market, vacancy peaked at 27.4 percent in 2013, but has fallen sharply since to 6.8 percent at the end of the first quarter of 2016. Mid/High-Rise rent levels in NoMa have grown by 5.4 percent since the end of 2013 to $3.14 per square foot, or $2,568 per unit, and are highly competitive with other submarkets located in the eastern edge of the city, namely, Capitol Hill, H Street/Union Market and Southeast, all posting current per square foot rates of $2.90 to $3.10.
In early 2017, AvalonBay Communities, Inc. is expected to deliver 436 units at the AVA and Camden Property Trust is expected to deliver another 405 units along L Street, NE. No additional units are expected to be delivered in 2016, enabling occupancy levels to increase and rents to stabilize before new deliveries come online in 2017.
NoMa—Multifamily Outlook
- •
- 841 units of multifamily supply (39 percent of existing inventory as of the first quarter of 2016) are projected to deliver to the market over the next 36 months.
117
- •
- Vacancy levels are projected to decrease from 6.8 percent to 4.1 percent by the end of 2018 as demand outpaces new supply.
- •
- Overall NoMa rents should grow by 6.1 percent from 2016 through 2018 mainly in late 2017 and early 2018 as demand escalates due to the broadening appeal of NoMa, H Street and Union Market, all in close proximity to NoMa.
| | |
NoMa Mid-Rise and High-Rise Multifamily
Average Asking Rates
(Mid/High-Rise) ($PSF) | | NoMa Mid-Rise and High-Rise Multifamily New
Supply vs. Net Absorption
(Mid/High-Rise) (Units) |
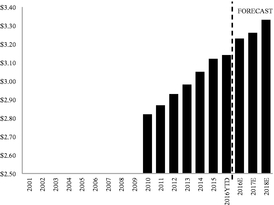 |
|
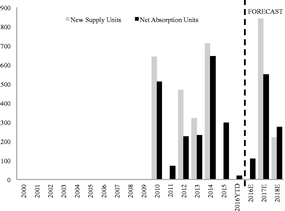 |
| |
|
| Source: JLL Research | | Source: JLL Research |
Northern Virginia
Overview
Northern Virginia has consistently led the DC metro area in both employment growth and overall tenant demand. The region has been among the most successful in the United States over the past decade in attracting headquarters relocations, with recent examples including Hilton Worldwide Holdings, Inc., Verisign, Inc., Computer Sciences Corporation, Northrop Grumman Corporation, Science Applications International Corporation and Volkswagen Group of America, Inc. Low tax rates and a highly-skilled workforce make the region highly attractive to companies, especially those in technology, professional services and those serving the federal government.
In Northern Virginia, like the rest of the DC metro area, the population has grown fastest in locations near Metro stations and planned Metro stations, driving growth in Alexandria, the Rosslyn-Ballston Corridor, Falls Church, Tysons Corner and the Toll Road markets of Reston and Herndon. In Northern Virginia, the Rosslyn-Ballston Corridor and Alexandria appeal to younger population segments in their 20s and 30s with the Rosslyn-Ballston Corridor having the highest composition of population 20 to 29 years old in the DC metro area. Residents with slightly older and established demographic characteristics, in their 30s and 40s, are fueling growth in new and planned Metro locations, such as Tysons Corner and Reston.
The key drivers of federal spending in Northern Virginia are defense contractors and other related civil programs, and much of the research and development functions that drive both government defense and contractor activity are situated in the region. After dipping deeply in 2013 and 2014 due to the effects of both BRAC move-outs and Sequestration, employment growth has regained momentum in Northern Virginia and is currently on par with both U.S. and broader DC metro area
118
levels. Professional and business services sector employment, driven by the defense contractor segment of the market, is stronger than both the nation and the region as of March 31, 2016
| | |
Northern Virginia Year-Over-Year Total Change
in Jobs
(Jobs created YoY) (Thousands) | | Federal Government Discretionary Spending Totals and Projections
(US$ Billions) |
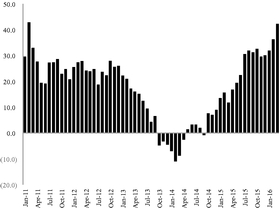 |
|
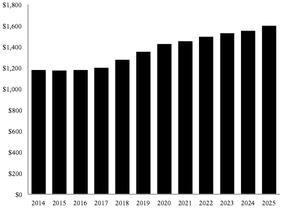 |
| |
|
| Source: JLL Research, BLS | | Source: JLL Research, CBO |
The map below illustrates the location of JBG submarkets and JBG assets within the Northern Virginia market.
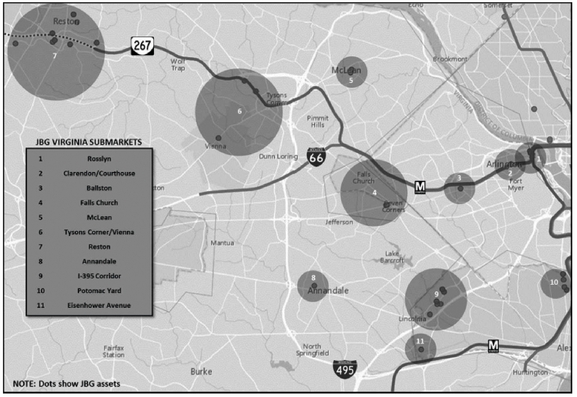
119
Northern Virginia Office Market
The Northern Virginia office market totals 150 million square feet, with regional demand for office space driven primarily by the federal government and related contractors, which provide aerospace, defense, intelligence and cybersecurity services.
As a result of the federal government's response to the terrorist attacks of September 11, 2001 and the start of the Iraq war in 2003, these government contractors benefitted from double-digit growth of federal procurement contract levels from 2003 through 2008.
With traditional defense funding evolving into intelligence-centric funding, however, more diversified leasing patterns have developed outside of the Beltway in Fairfax County, Northern Virginia's largest submarket. As the federal government and commercial enterprise increasingly focus on cybersecurity initiatives, Northern Virginia could be well positioned to become a national center for the cybersecurity industry, which will drive occupancy and rent growth in the market over the next few years. While vacancy is near the highest point in over 10 years, much of vacant space is viewed as non-competitive with the market due to newer tenant preferences for transit-proximate, amenity-rich locations.
Overall, the outside the Beltway market has reached bottom and is experiencing both occupancy and rent growth along the Toll Road and Tysons Corner. The inside the Beltway market has recently hit bottom, particularly within the small-segment Class B and C sectors; JLL expects the Class A sector to reach bottom by the end of the second quarter of 2016. Northern Virginia's inside the Beltway office market has historically closely followed the office market in Washington, DC. With the Washington, DC and the outside the Beltway market tightening (experiencing stronger leasing activity, increased absorption, declining concessions and increasing rental rates) and defense spending stabilzing, it is expected that inside the Beltway market conditions in Northern Virginia will continue to pick up momentum over the next 12 to 18 months
| | |
Northern Virginia Office Direct Average Asking
Rates | | Northern Virginia Office New Supply vs. Net
Absorption |
| (All Classes) ($PSF) | | (All Classes) (SF Thousands) |
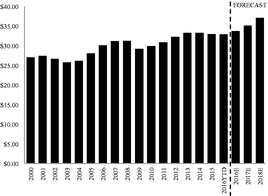 |
|
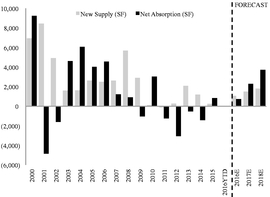 |
| |
|
| Source: JLL Research | | Source: JLL Research
|
120
The following table provides information about JBG's office portfolio as of March 31, 2016 in the Northern Virginia market.
Northern Virginia—JBG Office Assets
| | | | | | | | |
Asset | | Submarket | | Status | | Total
Rentable
Square Feet | |
|---|
RTC—West | | Reston | | Stabilized | | | 495,348 | |
Summit I | | Reston | | Stabilized | | | 145,768 | |
Summit II | | Reston | | Stabilized | | | 144,830 | |
Reston Arboretum | | Reston | | Stabilized | | | 95,666 | |
Wiehle Avenue Office Building | | Reston | | Stabilized | | | 77,528 | |
1831 Wiehle Avenue | | Reston | | Stabilized | | | 75,191 | |
CEB Tower at Central Place | | Rosslyn | | Construction | | | 536,710 | |
Rosslyn Gateway—North | | Rosslyn | | Stabilized | | | 144,830 | |
Rosslyn Gateway—South | | Rosslyn | | Stabilized | | | 105,722 | |
800 North Glebe Road | | Ballston | | Stabilized | | | 306,456 | |
Pickett Industrial Park | | Eisenhower Avenue | | Stabilized | | | 246,145 | |
6862 Elm Street | | McLean | | Stabilized | | | 103,556 | |
Old Dominion | | McLean | | Stabilized | | | 66,826 | |
| | | | | | | | | |
Total Northern Virginia Office | | | | | | | 2,544,576 | |
| | | | | | | | | |
| | | | | | | | | |
| | | | | | | | | |
Reston
Reston is positioned well from a demographic and population cluster standpoint, located in western Fairfax County outside of the Beltway along the Dulles Toll Road and in close proximity to nearby Loudoun County—two counties with some of the most educated and wealthiest populations in the country. Reston is a 15.5 million square foot office market and is home to a diverse tenant base of professional services firms, financial institutions, governmental and quasi-governmental agencies, high-tech and telecom companies and consulting firms. Tenants in this submarket include companies such as Google, Inc., Microsoft Corporation, Amazon.com, Inc., DLA Piper LLP, Rolls-Royce Limited, The College Board and Noblis, Inc., amongst others. Reston posted strong positive net absorption over the past four years through the end of 2015 with only a slight expected giveback of space in the first quarter of 2016, with cumulative growth largely based on growing demand from high-tech companies.
Reston became a Metro-served submarket in 2014 when the Wiehle Avenue-Reston East station opened, and a second Metro station is planned to open in the next few years at Reston Town Center as part of the Metro's ongoing silver line expansion. Following the opening of this new Metro station, numerous tenants from car-dependent submarkets, such as Merrifield and Fairfax Center, moved to the Reston submarket over the ensuing 24 months. This trend is expected to be further reinforced by the delivery of additional Trophy-class office projects in the coming years. When the second phase of silver line is complete, it will link Dulles Airport to downtown Washington, DC with stations along the way serving Reston, Tysons Corner and Rosslyn, among other submarkets.
Reston Town Center is the social and cultural nexus within the broader Reston market and features some of the highest rents and lowest vacancy rates amongst any submarket in the region. Reston Town Center also illustrates the power of a strong vision, dedicated planning and execution follow-through, which created a submarket that has excelled independently of the trends in the surrounding market. The strengths of this market include focused ownership and a diversified tenant base with one or two major drivers, as well as a walkable and accessible mixed-use plan. Over the past 13 years, Reston Town Center's rents have on average been 25.6 percent higher (+$7.11 per square
121
foot) than those in outer Reston. Similarly, total vacancy in Reston Town Center remains at a near-regional low of just 3.0 percent, whereas the broader Reston Class A vacancy is 790 basis points higher at 15.0 percent. No new product in the Town Center is expected to break ground over the short term meaning there is only a small probability of supply additions through the end of 2018.
Both Reston and Reston Town Center are expected to lead the Northern Virginia market from a recovery standpoint with rent growth having begun in earnest in the second half of 2015 with that rent growth picking up in 2016 before new high-end product along the Metro delivers in 2017.
Reston—Office Outlook
- •
- 568,413 square feet of office supply (3.8 percent of existing inventory as of the first quarter of 2016) is projected to deliver to the market over the next 36 months.
- •
- Vacancy levels are projected to decline from 15.0 percent to less than 11.0 percent by the end of 2018 as demand along silver line Metro locations for buildings and future developments picks up.
- •
- Overall Reston rents should grow by 15.9 percent from 2016 through 2018.
| | |
| Reston Office Direct Average Asking Rates | | Reston Office New Supply vs. Net Absorption |
| (All Classes) ($PSF) | | (All Classes) (SF Thousands) |
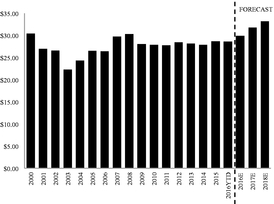 |
|
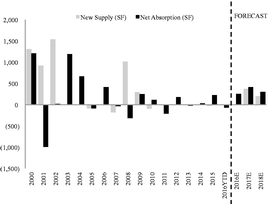 |
| |
|
| Source: JLL Research | | Source: JLL Research |
| | |
Reston Town Center Office Direct Average Asking
Rates | | Reston Town Center Office New Supply vs. Net
Absorption |
| (All Classes) ($PSF) | | (All Classes) (SF Thousands) |
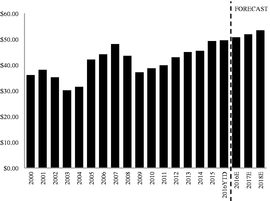 |
|
 |
| |
|
| Source: JLL Research | | Source: JLL Research |
122
Rosslyn-Ballston Corridor
The Rosslyn-Ballston Corridor refers to the three-mile stretch between Rosslyn and Ballston that contains five Metro stations, over 250 restaurants and bars and is home to approximately 50,000 residents that are among some of the most well-educated in the country. The Rosslyn-Ballston Corridor is one of the most attractive areas in the DC metro area for tenants because of its proximity to Washington, DC, commanding views, attractive workforce demographic, pro-business governance, good public safety and efficient transportation access. Rosslyn is the portion of the Rosslyn-Ballston Corridor that is closest to Washington, DC's city center and has the tallest office and residential buildings in the DC metro area. Rosslyn is the most closely-situated submarket to Washington, DC, followed by Courthouse, Clarendon, Virginia Square and Ballston.
Due to these appealing attributes, Rosslyn is able to attract the highest average rents in Northern Virginia, and Trophy-class rents sometimes reach levels comparable to rates for Class A product within Washington, DC. Due to permissive zoning and height restrictions, Rosslyn is one of the only submarkets within the city or in the immediate suburbs that offers unobstructed views of the Washington, DC skyline. While developers can build taller buildings than in Washington, DC, there is still a maximum height limit of 470 feet above sea level dictated by the U.S. Federal Aviation Administration so buildings will not interfere with air traffic flying in and out of Ronald Reagan National Airport a few miles away.
Clarendon/Courthouse is a 5.7 million square foot submarket located in the Rosslyn-Ballston Corridor in Arlington County. This swath of the Corridor is the high-amenity portion of Northern Virginia with Clarendon Boulevard serving as the main avenue featuring dozens of national and local retailers. Due to this dynamic offering of amenities, a sense of place and walkability, the Clarendon/Courthouse/Virginia Square area has one of the largest concentrations of Millennials in the DC metro area with residents in the submarket posting a median age of 31 years old, 85.4 percent of the population possessing a college degree and one of the highest concentrations of people earning more than $100,000 a year in the region. Rents in newer office buildings are some of the highest in Northern Virginia, reaching the mid-$50's per square foot to the upper-$50s per square foot for higher floors in new developments. Class B also far outpaces the region with B-quality buildings easily achieving rates in the low to mid-$40s per square foot.
Ballston is the westernmost part of the Rosslyn-Ballston Corridor. The 7.5 million-square-foot Ballston submarket is driven by government research agencies including DARPA, the Office of Naval Research and the National Science Foundation. There is also a large cluster of higher-education institutions present such as Virginia Tech, The George Washington University, George Mason University, and Marymount University. Ballston has a growing mix of retail and residential development and redevelopment around the Ballston Common Mall that will further reinvigorate the submarket and broaden its appeal to an already robust demographic with 90.6 percent of residents having a college degree. Market rents for new Trophy and Class A space in Ballston hover around +/– $50 per square foot varying by the position on the upper or lower floors of buildings. These rates are expected to rise as the Ballston Mall is reintroduced back into the market with modern amenities and refreshed appeal, fueling more developments including the final office building at Liberty Center, the redevelopment at Marymount University's campus and a new Whole Foods anchored apartment building, among numerous other redevelopments and developments farther from the epicenter of Ballston.
While the Rosslyn-Ballston corridor lags the rest of the region from an occupancy perspective, the corridor has finally reached bottom from a demand and pricing perspective as of the end of the first quarter of 2016 as the Class B market has solidified and several large new expansion deals are in negotiation that will help lower vacancy and stabilize both rents and concessions. Demand both from
123
organic growth and growth from Washington, DC is expected to pick up in 2016, yielding the first real rent increases to the market in eight years at the middle to latter part of 2016.
Rosslyn-Ballston Corridor—Office Outlook
- •
- 940,000 square feet of office supply (4.2 percent of existing inventory as of the first quarter of 2016) is projected to deliver to the market over the next 36 months.
- •
- Vacancy levels are projected to decline from 21.6 percent to less than 16.0 percent by the end of 2018 as demand from Washington, DC and new requirements begin to stimulate the market.
- •
- Overall Rosslyn-Ballston Corridor rents should grow by 11.7 percent from 2016 through 2018.
| | |
Rosslyn-Ballston Office Direct Average Asking
Rates | | Rosslyn-Ballston Office New Supply vs. Net
Absorption |
| (All Classes) ($PSF) | | (All Classes) (SF Thousands) |
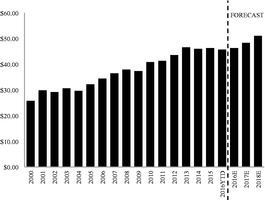 |
|
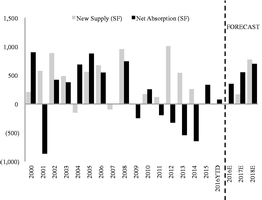 |
| |
|
| Source: JLL Research | | Source: JLL Research |
Northern Virginia Multifamily Market
The following table provides information about JBG's multifamily portfolio as of March 31, 2016 in the Northern Virginia submarket.
Northern Virginia—JBG Multifamily Assets
| | | | | | | | | | | | | |
Asset | | Submarket | | Type | | Status | | Total
Rentable
Square Feet | | Number
of Units | |
|---|
Hillwood(1) | | I-395 Corridor | | Garden-Style | | Stabilized | | | 520,828 | | | 601 | |
Lynbrook(1) | | I-395 Corridor | | Garden-Style | | Stabilized | | | 479,080 | | | 575 | |
Brookdale(1) | | I-395 Corridor | | Garden-Style | | Stabilized | | | 368,980 | | | 472 | |
Meadowcreek(1) | | I-395 Corridor | | Garden-Style | | Stabilized | | | 342,160 | | | 416 | |
Bennington Crossings | | I-395 Corridor | | Garden-Style | | Stabilized | | | 290,505 | | | 308 | |
Stoneridge(1) | | I-395 Corridor | | Garden-Style | | Stabilized | | | 181,251 | | | 198 | |
Fairway Apartments | | Reston | | Garden-Style | | Stabilized | | | 371,204 | | | 346 | |
Charter Oak | | Reston | | Garden-Style | | Stabilized | | | 287,520 | | | 262 | |
Reston Heights—Phase I | | Reston | | Mid/High-Rise | | Construction | | | 327,163 | | | 386 | |
Fairmont Gardens | | Annandale | | Garden-Style | | Stabilized | | | 358,500 | | | 388 | |
Notch 8 | | Potomac Yard | | Mid/High-Rise | | Recently Delivered | | | 207,374 | | | 253 | |
| | | | | | | | | | | | | | |
Total Northern Virginia Multifamily | | | | | | | | | 3,734,565 | | | 4,205 | |
| | | | | | | | | | | | | | |
| | | | | | | | | | | | | | |
| | | | | | | | | | | | | | |
- (1)
- Denotes assets that are part of Mark Center portfolio, which includes five multifamily assets and one retail asset.
124
I-395 Corridor
The I-395 Corridor is located in the western portion of Alexandria. The submarket is bifurcated by I-395 and is one of the largest regional markets in terms of total population and multifamily real estate inventory. As of March 31, 2016, the I-395 Corridor held nearly 115,000 residents and was comprised of 38,126 units across 107 rental buildings. Nearly 44 percent of the units throughout the I-395 Corridor are located in garden-style buildings with an average rental rate of $1.71 per square foot or $1,443 per unit. The garden-style segment of the market posts lower vacancy levels at 3.5 percent compared to 4.7 percent in the mid/high-rise segment of the market, with rents averaging an 8.6 percent discount to rents in high-rise and mid-rise buildings.
I-395 Corridor multifamily fundamentals will remain positive, but lag the more urban markets inside the Beltway. Nonetheless, rent growth is expected to remain positive, as the supply pipeline is limited over the next 24 to 36 months.
I-395 Corridor—Multifamily Outlook
- •
- 350 units of new supply (0.9 percent of existing inventory as of the first quarter of 2016) are projected to deliver to the market over the next 36 months.
- •
- Vacancy levels are projected to decline from 4.0 percent to less than 3.0 percent by the end of 2018 as supply remains relatively stable and demand continues at a steady pace.
- •
- Overall I-395 Corridor rents will grow by 6.7 percent from 2016 through 2018.
| | |
| |
|
|---|
I-395 Corridor Mid-Rise, High-Rise and Garden Style Multifamily Average Asking Rates
(Mid/High-Rise and Garden-Style) ($PSF) | | I-395 Corridor Mid-Rise, High-Rise and Garden Style Multifamily Occupancy Rate
(Mid/High-Rise and Garden-Style) (Occupancy %) |
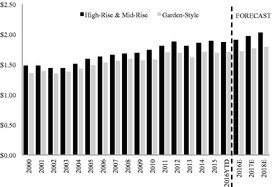 |
|
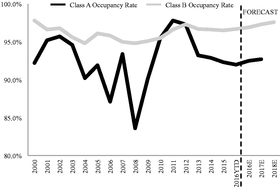 |
| |
|
| Source: JLL Research | | Source: JLL Research *NOTE: Occupancy is shown here as it is a more relevant metric than absorption for garden-style product given the lack of new deliveries in this product type. |
Reston
Reston is one of the DC metro area's most robust multifamily submarkets outside of the Beltway, supported by the most affluent and educated residents in the DC metro area and home to an employment cluster for contracting, software, engineering, aerospace and defense firms. Additionally, Reston features one of the nation's top-rated school districts, making the area attractive for families. Reston's overall multifamily inventory, including garden-style, mid-rise and high-rise, totaled 5,769 units across 22 buildings, as of March 31, 2016, and the vacancy rate stood at 7.3 percent.
125
As the Metro expansion continues to forge new amenity-rich and transit-oriented nodes aside from the traditional Town Center, Reston's multifamily market, along with Tysons Corner, is expected to be one of the highest-growth submarkets in the region from both an occupancy rate and rental rate perspective over the next 36 months. Average rents across the overall multifamily market have increased 12.1 percent since the end of 2013 to $1.81 per square foot or $1,714 per unit.
Reston—Multifamily Outlook
- •
- 1,144 units of new supply (22.1 percent of existing inventory as of the first quarter of 2016) are projected to deliver to the market over the next 36 months.
- •
- Vacancy levels are projected to decline slightly from 7.3 percent to below 6.0 percent through the end of 2018 as demand outpaces new supply delivering due to Metro expansion.
- •
- Overall Reston rents should grow by 10.3 percent from 2016 through 2018.
| | |
| |
|
|---|
Reston Mid-Rise, High-Rise and Garden-Style Multifamily Average Asking Rates
(Mid/High-Rise and Garden-Style) ($PSF) | | Reston Mid-Rise, High-Rise and Garden-Style Multifamily Occupancy Rate
(Mid/High-Rise and Garden-Style) (Occupancy %) |
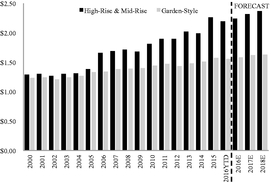 |
|
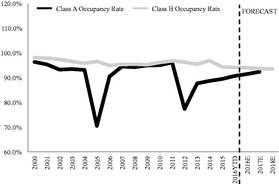 |
| |
|
| Source: JLL Research | | Source: JLL Research *NOTE: Occupancy is shown here as it is a more relevant metric than absorption for garden-style product given the lack of new deliveries in this product type. |
Tysons Corner
Tysons Corner is located in Fairfax County and is the main CBD of Northern Virginia (and the 17th largest CBD in the country). With an ideal location between Suburban Maryland, the District of Columbia and all parts of Northern Virginia, Tysons Corner has become a consensus destination for many local employers. The market functions as a geographic mid-point of various densely-populated residential enclaves. It has direct access to the Beltway, Dulles Toll Road, Route 7 and is less than five minutes from I-66. It is also located roughly 25 minutes from two major airports: Dulles International Airport and Reagan National Airport.
Tysons Corner is currently a submarket in transition. Fairfax County is aiming to transform the submarket from a largely suburban office park into a "24-hour urban center" with a targeted population of 100,000 and more than 200,000 jobs by 2050. Tysons Corner has already changed dramatically since the arrival of the Metro's silver line in 2014, which brought four Metro stations and spurred plans for significant new mixed-use development that is expected to dramatically change the ambiance of the submarket into a Metro-accessible, mixed-use, walkable, dense urban environment.
Tysons Corner's mid-rise and high-rise multifamily market consists of seven existing buildings, with six of those buildings delivered after 2008. The newest developments in the market are the most
126
luxurious and expensive in the market. The VITA at 7902 Tysons delivered 429 Trophy-class units to the market in 2015, and the Ascent at Spring Hill Station delivered 404 units to the market in 2014. Both of these developments are priced in the $3.00 to $3.20 per square foot range ($3,147 on average per unit), with rents for these two new developments averaging a 35 percent premium to the existing market. Although these two deliveries also increased vacancy rates substantially, the market is expected to stabilize in the near-term and has benefitted from them on the whole.
Out of all the submarkets in the region, Tysons Corner has the most development potential with nearly 15,000 residential units currently in varying stages of the development pipeline. With supply increasing at a steady rate, rent growth is expected to continue, but will likely register increases below those of the broader region.
Tysons Corner—Multifamily Outlook
- •
- 2,204 units of new supply (83.6 percent of existing inventory as of the first quarter of 2016) are projected to deliver to the market over the next 36 months.
- •
- Vacancy levels inclusive of buildings in lease-up (non-stablized) are projected to remain in the 11 to 15 percent range (13.8 percent as of the first quarter of 2016) by the end of 2018 as new supply delivers though we expect new demand to balance that new supply.
- •
- Overall Tysons Corner rents should grow by 9.6 percent from 2016 through 2018, mainly at the end of the 2018 timeframe.
| | |
| |
|
|---|
Tysons Mid-Rise and High-Rise Multifamily Average Asking Rates
(Mid/High-Rise) ($ PSF) | | Tysons Mid-Rise and High-Rise Multifamily New Supply vs. Net Absorption
(Mid/High-Rise) (Units) |
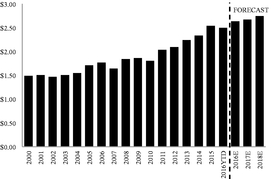 |
|
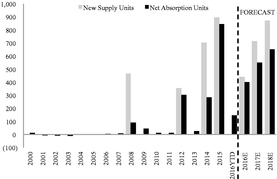 |
| |
|
| Source: JLL Research | | Source: JLL Research |
Suburban Maryland
Overview
Montgomery County holds the distinction of possessing the highest concentration of science, technology, engineering and mathematics (STEM) based employees of any county in the United States. Over 29 percent of Montgomery County residents over the age of 25 hold post-graduate degrees, providing a skilled labor force for the array of science-focused federal agencies in the submarket.
Montgomery County is home to more than 250 biotech companies, 19 federal facilities, including the National Institutes of Health (NIH), Food & Drug Administration (FDA), Nuclear Regulatory Commission (NRC) and Walter Reed National Military Medical Hospital, as well as numerous corporate headquarters, including Lockheed-Martin, Marriott Hotels, Choice Hotels and Sodexo.
127
Nearly all of the population growth in Montgomery County from 2010 to 2015 was located along the red line Metro corridor in submarkets such as Bethesda CBD, Chevy Chase, Downtown Silver Spring and the Rockville Pike Corridor. The Metro's red line serves 27 stations in Montgomery County, Maryland and Washington, DC. It is the primary line through downtown Washington, DC and the oldest and busiest line in the Metro system.
The map below illustrates the location of JBG submarkets and JBG assets within the Suburban Maryland market.
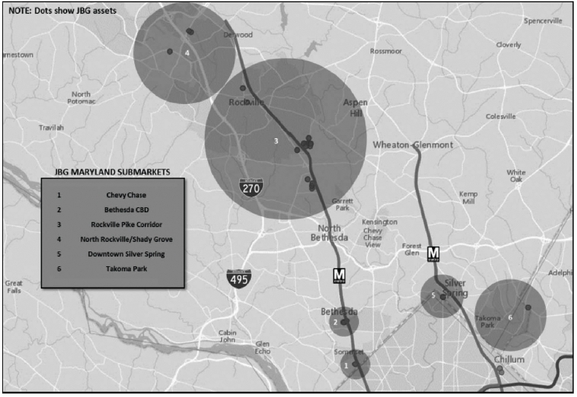
Suburban Maryland Office Market
Throughout most of the 1990s and early part of the 2000s, Suburban Maryland was the fastest-growing part of the region, driven by record-high funding levels to the NIH. As a result of heightened spending, NIH funding fueled substantial growth in an emerging home-grown life sciences industry. Vacancy levels ranged from less than 5.0 percent in the late 1990s to 9.1 percent before the recession of 2001.
From 2001 through 2006, nearly 8.5 million square feet of supply delivered to the market, mainly driven by additional funding to the NIH to counter chemical terrorism. From 2000 to 2006, net absorption averaged nearly 1.2 million square feet annually and from 2007 through 2015, the market posted negative net absorption annually averaging 178,000 square feet. Driving this decline were both the acquisitions of home-grown life science companies and a decline in NIH funding.
In the first quarter of 2016, Montgomery County vacancy declined by 10 basis points to end the quarter at 16.3 percent, driven by absorption gains of 264,307 square feet, almost exclusively attributable to the resurgent life sciences, business services and technology sectors. Additionally, as Washington, DC supply tightens, demand spills over into Suburban Maryland, disproportionately benefitting Metro-served and amenity rich submarkets, such as Bethesda CBD, Chevy Chase, the Rockville Pike Corridor and Downtown Silver Spring. For example, vacancy rates in the Bethesda CBD, Chevy Chase and Downtown Silver Spring are 10.8, 10.4 and 13.7 percent, respectively, which are
128
significantly less than the non-Metro served submarkets, which currently average 21.5 percent vacancy. These Metro-accessible markets to the south of Montgomery County and the life science-clustered markets to the northern edge of the county (Shady Grove) are expected to drive the vast majority of demand in the current recovery. No new development in either the life science clusters or the Metro-served nodes will leave landlords with the upper hand in negotiating favorable lease terms over the next 24 to 36 months, with the highest rent growth realized in the supply-constrained Metro-accessible submarkets of Chevy Chase and Bethesda.
Suburban Maryland—Office Outlook
- •
- 634,000 square feet of office supply (1.0 percent of existing inventory as of the first quarter of 2015) is projected to deliver to the market over the next 36 months.
- •
- Vacancy levels are projected to decline from 19.0 percent to less than 16.0 percent by the end of 2018 as demand in the northern part of the county is driven by a fast-growing life sciences sector and demand within close-in markets picks up both from Washington, DC tenants and organic growth from the professional and business service sector.
- •
- Overall Suburban Maryland rents should grow by 14.9 percent from 2016 through 2018.
| | |
| |
|
|---|
| Suburban Maryland Office Direct Average Asking Rates | | Suburban Maryland Office New Supply vs. Net Absorption |
| (All Classes) ($PSF) | | (All Classes) (SF Thousands) |
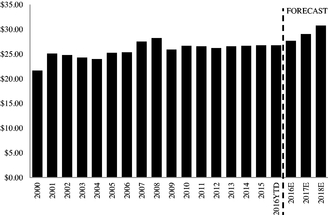 |
|
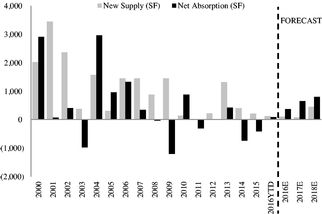 |
| |
|
| Source: JLL Research | | Source: JLL Research |
129
The following table provides information about JBG's office portfolio as of March 31, 2016 in the Suburban Maryland submarket.
Suburban Maryland—JBG Office Assets
| | | | | | | | |
Asset | | Submarket | | Status | | Total Rentable Square
Feet | |
|---|
5600 Fishers Lane—U.S. Government Tenant (GSA) | | Rockville Pike Corridor | | Stabilized | | | 935,386 | |
5601 Fishers Lane—U.S. Government Tenant (GSA) | | Rockville Pike Corridor | | Stabilized | | | 490,998 | |
5635 Fishers Lane | | Rockville Pike Corridor | | Stabilized | | | 185,511 | |
5625 Fishers Lane | | Rockville Pike Corridor | | Stabilized | | | 153,385 | |
NoBe II Office | | Rockville Pike Corridor | | Stabilized | | | 139,550 | |
Hungerford Plaza | | Rockville Pike Corridor | | Stabilized | | | 85,761 | |
12735 Twinbrook Parkway | | Rockville Pike Corridor | | Stabilized | | | 76,520 | |
5640 Fishers Lane | | Rockville Pike Corridor | | Stabilized | | | 74,185 | |
11333 Woodglen Drive | | Rockville Pike Corridor | | Stabilized | | | 63,650 | |
5609 Fishers Lane | | Rockville Pike Corridor | | Stabilized | | | 59,800 | |
12725 Twinbrook Parkway | | Rockville Pike Corridor | | Stabilized | | | 58,880 | |
12440 Parklawn | | Rockville Pike Corridor | | Stabilized | | | 29,700 | |
NCI | | Shady Grove | | Stabilized | | | 586,524 | |
Artery Plaza | | Bethesda CBD | | Stabilized | | | 272,874 | |
4747 Bethesda Avenue | | Bethesda CBD | | Pre-Development | | | 260,236 | |
Chase Tower | | Chevy Chase | | Stabilized | | | 247,755 | |
One Choke Cherry | | North Rockville | | Stabilized | | | 228,020 | |
| | | | | | | | | |
Total Suburban Maryland Office | | | | | | | 3,948,735 | |
| | | | | | | | | |
| | | | | | | | | |
| | | | | | | | | |
Bethesda CBD
The Bethesda CBD market is located on the red line of the Metro system and has historically been the core of the Suburban Maryland business community as well as home to many executive residences. Office demand for the Bethesda CBD stems from the professional services sector, namely regional Maryland law firms, consulting firms, accounting firms, financial services firms and high-tech/media companies. Several large federal government tenants are also present in the market.
Similar to the CBD and East End in Washington, DC and parts of the Rosslyn-Ballston corridor in Northern Virginia, the Bethesda CBD is a very supply-constrained market, limiting most of the development to redevelopment of underutilized real estate rather than development of vacant lots. Influenced by the office market's limited vacancy in 2010 (6.8 percent), as well as static supply and aging inventory (no new developments in more than a decade), developers began projects in 2011 to deliver new or renovated product to the Bethesda market. This resulted in the recent renovation of two projects and one ground-up development—the first new office building in the Bethesda market in more than 10 years. As a result of this new supply, vacancy has moved from historical levels of around five to six percent to slightly less than double that as of March 31, 2016. Despite that vacancy growth, the Bethesda CBD's vacancy rate of 10.8 percent is below the Suburban Maryland overall level (19.0 percent) and the DC metro area level (16.4 percent). The submarket's vacancy is predominantly comprised of small blocks of space. For example, as of the end of March 2016, only one block of available space larger than 25,000 square feet exists in the Bethesda CBD.
As a result of the limited blocks of large availability, rental pricing has significantly increased and new product is achieving a 20 percent premium to much of the existing office space. As a result of
130
new development pricing, rental rates across the board have increased from the mid-$30s per square foot in 2008 to the low-$40s per square foot in 2016 with Trophy-class rents exceeding $50 per square foot.
Currently, there are no developments in the under construction pipeline. The earliest a building will deliver to the market will likely be 2019, creating a landlord-friendly environment characterized by increasing rents, decreasing concessions on the horizon and the start of new speculative construction by the end of 2016.
Bethesda CBD—Office Outlook
- •
- As of the third quarter of 2015 no new supply is projected to deliver to the market over the next 36 months.
- •
- Vacancy levels are projected to decline from 10.8 percent to less than 6.0 percent by the end of 2018 as demand increases and supply remains constant. Several developers will likely deliver new supply in the late 2018 to early 2019 timeframe.
- •
- Overall Bethesda CBD rents should grow by 15.5 percent from 2016 through 2018.
| | |
Bethesda CBD Office Direct Average Asking
Rates | | Bethesda CBD Office New Supply vs. Net Absorption |
| (All Classes) ($PSF) | | (All Classes) (SF Thousands) |
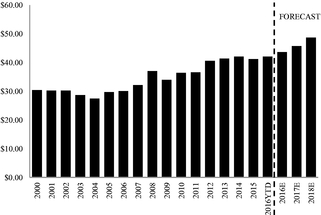 |
|
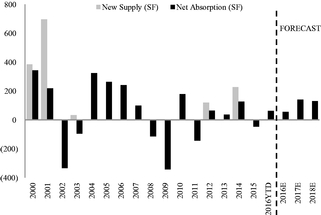 |
| |
|
| Source: JLL Research | | Source: JLL Research |
The Rockville Pike Corridor
Historical demand in the Rockville Pike Corridor has largely stemmed from the federal government, particularly the National Institutes of Health, U.S. Food and Drug Administration, U.S. Department of Health & Human Services and U.S. Nuclear Regulatory Commission. Recently there has been a shift to demand driven by professional services companies, including financial services firms, accounting and consulting firms, government contractors and high-tech companies.
The Rockville Pike Corridor's emerging amenity base is transforming the submarket from a suburban enclave to a walkable, high-amenity destination, attracting positive demographic shifts that have brought a younger population from more suburban locations to high-rise urban lifestyle.
Rent growth in the high-amenity new development pipeline is expected to continue at above-average rates, reaching the mid-$40s full-service in the next 18 months.
131
The Rockville Pike Corridor—Office Outlook
- •
- 103,500 square feet of office supply (1.1 percent of existing inventory as of the first quarter of 2016) is projected to deliver to the market over the next 36 months.
- •
- Vacancy levels are projected to decline from 15.2 percent to less than 11.5 percent by the end of 2018 as the market transitions from a more suburban-oriented market to a walkable, higher-amenity, mixed-use market.
- •
- Overall the Rockville Pike Corridor rents should grow by 12.9 percent from 2016 through 2018.
| | |
Rockville Pike Office Direct Average Asking
Rates | | Rockville Pike Office New Supply vs. Net Absorption |
| (All Classes) ($PSF) | | (All Classes) (SF Thousands) |
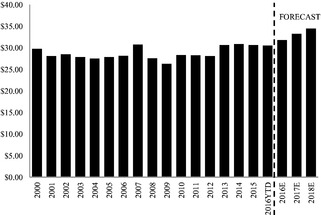 |
|
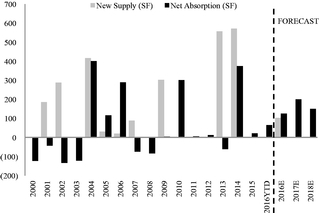 |
| |
|
| Source: JLL Research | | Source: JLL Research |
Suburban Maryland Multifamily Market
The following table provides information about JBG's multifamily portfolio as of March 31, 2016 in the Suburban Maryland submarket.
Suburban Maryland—JBG Multifamily Assets
| | | | | | | | | | | | | |
Asset | | Submarket | | Type | | Status | | Total
Rentable
Square
Feet | | Number
of Units | |
|---|
The Alaire | | Rockville Pike Corridor | | Mid/High-Rise | | Stabilized | | | 288,806 | | | 279 | |
The Terano | | Rockville Pike Corridor | | Mid/High-Rise | | Stabilized | | | 201,353 | | | 214 | |
Galvan | | Rockville Pike Corridor | | Mid/High-Rise | | Recently Delivered | | | 295,472 | | | 356 | |
Falkland Chase—South & West | | Downtown Silver Spring | | Garden-Style | | Stabilized | | | 222,949 | | | 268 | |
Falkland Chase—North | | Downtown Silver Spring | | Garden-Style | | Stabilized | | | 119,443 | | | 182 | |
7770 Norfolk | | Bethesda CBD | | Mid/High-Rise | | Construction | | | 208,678 | | | 200 | |
| | | | | | | | | | | | | | |
Total Suburban Maryland Multifamily | | | | | | | | | 1,336,701 | | | 1,499 | |
| | | | | | | | | | | | | | |
| | | | | | | | | | | | | | |
| | | | | | | | | | | | | | |
The Rockville Pike Corridor
The Rockville Pike Corridor stands as the geographic center point of Suburban Maryland and over the last five years this Metro-served submarket has evolved into one of the region's most dynamic areas. The Rockville Pike Corridor multifamily submarket totals 2,057 units across eight buildings with
132
the most recent development delivered in 2015. This new development added 214 units, of which more than half were leased within the first six months following delivery. Vacancy levels were at a stabilized rate of 5.3 percent at the end of 2014 with current vacancy sitting at 9.6 percent due to the 2015 delivery. Rates for new product can command a 15 percent premium to existing assets and proposed projects in the pipeline are being priced from a 15 percent to 25 percent premium.
The Rockville Pike Corridor—Multifamily Outlook
- •
- 627 units of multifamily supply (30.5 percent of existing inventory as of the first quarter of 2016) are projected to deliver to the market over the next 36 months.
- •
- Vacancy levels are projected to decline from 9.6 percent to less than 6.0 percent by the end of 2018 as the market sees demand from Millennials increase due to increased amenities and density delivering along Metro lines.
- •
- Overall the Rockville Pike Corridor rents should grow by 11.1 percent from 2016 through 2018.
| | |
Rockville Pike Mid-Rise and
High-Rise Multifamily
Average Asking Rates
(Mid/High-Rise) ($PSF) | | Rockville Pike Mid-Rise and
High-Rise Multifamily New
Supply vs. Net Absorption
(Mid/High-Rise) (Units) |
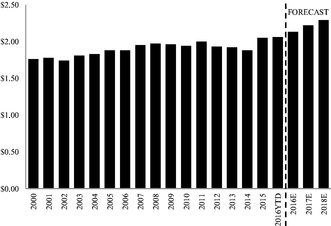 |
|
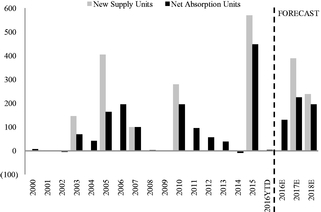 |
| |
|
| Source: JLL Research | | Source: JLL Research |
Downtown Silver Spring
Downtown Silver Spring is one of the region's densest suburban areas and is situated at one of Montgomery County's most important transportation interchanges. The submarket is anchored by commercial tenants such as Discovery Communications, the American Nurses Association, and United Therapeutics, among others. Downtown Silver Spring's retail base has grown in recent years with the arrival of a Whole Foods, as well as other retailers.
The Downtown Silver Spring multifamily submarket consists of 9,096 units across 32 buildings. Approximately 8.3 percent of the submarket's supply is garden-style and low-rise product, all of which was built before 1965, is well leased and posts rents that are similar to rates in the older mid-rise and high-rise buildings.
The Octave 1320 and the Pearl will deliver a combined 386 units to Downtown Silver Spring in 2016 and Central and Core will deliver 243 and 292 units, respectively, in 2017 and 2018. Rents are
133
expected to increase at above-average rates compared to the region based on Downtown Silver Spring positioning itself as a rent discount to Washington, DC.
Downtown Silver Spring—Multifamily Outlook
- •
- 921 units of multifamily supply (10.2 percent of existing inventory as of the first quarter of 2016) are projected to deliver to the market over the next 36 months.
- •
- Vacancy levels are projected to decline from 4.5 percent to less than 3.0 percent by the end of 2018 as the market sees little development and Millennial renters seeking Metro, amenities and rent discounts move to the market.
- •
- Overall Downtown Silver Spring rents should grow by 12.9 percent from 2016 through 2018.
| | |
Silver Spring Mid-Rise, High-Rise and
Garden Style Downtown Multifamily Average
Asking Rates
(Mid/High-Rise and Garden-Style) ($PSF) | | Silver Spring Downtown Mid-Rise, High-Rise
and Garden Style Multifamily new supply vs.
net absorption
(Mid/High-Rise and Garden-Style) (Units) |
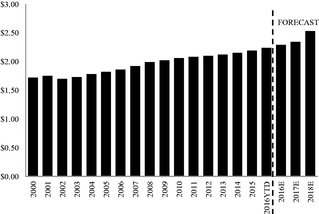 |
|
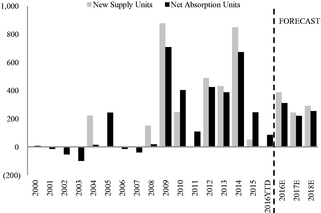 |
| |
|
| Source: JLL Research | | Source: JLL Research |
Federal/General Services Administration (GSA) Leasing
The following table provides information about JBG's GSA portfolio in the DC metro area as of March 31, 2016.
General Services Administration (GSA)—JBG Assets
| | | | | | | | |
Asset | | Submarket | | Status | | Total Rentable
Square Feet | |
|---|
DOT | | Southeast | | Stabilized | | | 1,506,955 | |
5600 Fishers Lane—U.S. Government Tenant (GSA) | | Rockville Pike Corridor | | Stabilized | | | 935,386 | |
NCI | | Shady Grove | | Stabilized | | | 586,524 | |
5601 Fishers Lane—U.S. Government Tenant (GSA) | | Rockville Pike Corridor | | Stabilized | | | 490,998 | |
| | | | | | | | | |
Total General Service Administration | | | | | | | 3,519,863 | |
| | | | | | | | | |
| | | | | | | | | |
| | | | | | | | | |
The General Services Administration (GSA) is an independent agency of the federal government, established to help manage and support the basic functioning of federal agencies,
134
including providing and procuring office and other space for the various agencies. The federal government represents a large and stable segment of the regional office market. Federal agencies under GSA leasing authority occupy over 48.8 million square feet in the DC metro area. Additionally, many federal agencies—particularly those in the intelligence and finance sectors—retain independent leasing authority, which provides another tranche of federally-leased space and enables those groups to pay higher rents and maintain more flexibility than agencies that operate under GSA control.
GSA Leased Office Space in DC Metro Area
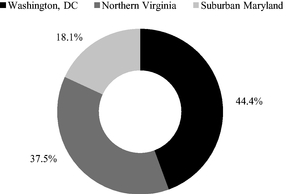
- Source:
- JLL Research
Comprising approximately 22.0 percent of the region's overall office market, the federal government exerts a widespread influence over general market conditions in the DC metro area. The tendency of government agencies to remain in their space for an average of over 30 years also functions as a stabilizing force for the overall office market and provides a safe and secure investment option for long-term investors.
Given recent GSA leasing tactics, which have emphasized short-term lease extensions, 55.8 percent of all regional GSA leases are set to expire within the next five years. The lease expiration pipeline presents both opportunities and challenges to building owners as they aim to recruit and retain tenants. The submarkets with the largest amount of lease rollover within the next five years include Southwest, Crystal City, Baileys Crossroads, NoMa, Springfield and the Rosslyn-Ballston Corridor.
Recent trends in federal leasing activity appear to indicate that pent-up demand is accumulating and suggest that more activity may occur in upcoming years. Although the volume of signed leases should experience a significant uptick, the rate of growth in the federal government's overall footprint is expected to remain flat or trend downward due to new executive orders stipulating increased space utilization rates. This trend of increased employee density stands to benefit office assets that have been constructed with contemporary design attributes, such as wide column spacing, high ceilings and floor-to-ceiling glass. Additionally, GSA's common stipulation that buildings be within 0.5 miles of a Metro station is likely to benefit more urbanized and transit-oriented developments at the expense of legacy assets in outlying submarkets.
As lawmakers work to establish clear and effective strategies in the years ahead around critical issues such as immigration, healthcare, cybersecurity, energy and finance, federal leasing demand is expected to evolve to accommodate these new priorities. Federal space requirements are significantly impacted by geopolitical events, thus GSA's office footprint tends to fluctuate reflecting changing political, social and economic cycles and responses to emerging opportunities or threats. For example, the post-9/11 build-up of the Department of Defense and creation of the Department of Homeland Security created robust growth throughout the DC metro area, in terms of both the federal footprint as well as the associated increases in government contractor leasing demand. Recently, increases in federal
135
funding for cybersecurity initiatives—as part of the federal government's Overseas Contingency Operations (OCO) budget—have helped spur a new 500,000-square-foot space requirement in the DC metro area and affiliated contractor demand. Additional space needs to help support administration of the Affordable Care Act, immigration initiatives and financial regulatory measures have materialized throughout the regional office market over the past 24 months.
Recent leasing patterns have affirmed GSA's tendency to remain in place and take action towards a relocation only when a building is nearing functional obsolescence. Over the past 15 years, GSA renewal probability has routinely held between 77 percent and 84 percent, underscoring the long-term nature of federal tenancies. However, renewal probabilities are more nuanced at the asset level, as properties known to be the subject of future consolidations are less likely to receive a lease extension and first-generation assets almost always obtain long-term commitments. In keeping with GSA's preference for newer, more efficient buildings, 98.7 percent of GSA leases in newly-constructed assets remained in place at the 10-year mark following the initial lease commencement. The inertia presented by large leases introduces another variable, and the federal government has averaged 31.8 years of occupancy at buildings in which GSA maintains 20,000 square feet of occupancy or greater, as weighted by square footage.
Only nine percent of GSA's current leased inventory (4.6 million square feet) falls within assets constructed since 2005. The significant number of near-term lease expirations and aging federal inventory presents opportunities for developers in transit-oriented submarkets to obtain commitments as part of agency consolidations or space upgrades. GSA occupies over 50.6 million square feet in the DC metro area and is anticipated to have lease requirements (including new expansions, relocations, renewals, extensions and consolidations) totaling approximately 28 million square feet over the next five years, which will present abundant opportunities for developers to seize upon this market potential.
136
JBG MANAGEMENT TEAM
Michael J. Glosserman, age 70, has worked at JBG since 1979, and he is a Managing Partner and Chair of the Executive Committee of The JBG Companies since 2008. He began his career as a staff attorney with the U.S. Department of Justice, before moving into commercial real estate investment and development in various senior positions with the Rouse Company between 1972 and 1979. He joined JBG in 1979. He currently serves on the board of directors of the CoStar Group (NASDAQ: CSGP), a provider of information, analytics and marketing services to the commercial real estate industry in the United States and United Kingdom. He received his Bachelor of Science in Economics from the Wharton School at the University of Pennsylvania and his Juris Doctor from the University of Texas Law School.
Rob Stewart, age 53, has been with The JBG Companies since 1988, serving as Managing Partner and Chair of the Investment Committee, and has focused during his tenure with JBG on the acquisition, financing and disposition of JBG investments, conceiving development plans for JBG properties and the asset management and fundraising processes. Mr. Stewart has served as a member of the JBG Executive Committee since 2008. Mr. Stewart received his Bachelor of Arts from Princeton University, and a Master of Business Administration from The Wharton School of the University of Pennsylvania.
W. Matthew Kelly, age 43, has worked at JBG since 2004, and has served as Managing Partner and a member of The JBG Companies' Executive Committee and Investment Committee since 2008. He has been responsible for the day-to-day oversight of JBG's investment strategy and the investment and acquisition activity of the JBG funds. Prior to joining JBG in 2004, he was co-founder of ODAC Inc., a media software company, which he joined in 2000, and worked in private equity and investment banking as an analyst with Thomas H. Lee Partners in Boston from 1998 to 2000 and Goldman Sachs, & Co (NYSE: GS) in New York as Analyst from 1996 to 1998. Mr. Kelly received his Bachelor of Arts with honors from Dartmouth College and a Master of Business Administration from Harvard Business School.
James Iker, age 43, has worked at JBG since 2002, and has served as a Managing Partner and a member of JBG's Executive Committee and Investment Committee since 2008. He has more than 20 years of experience in the real estate industry and is responsible for various aspects of investment strategy, acquisitions, dispositions, and financing activity for the JBG funds. Prior to joining JBG in 2002, he co-founded and managed Costa Mesa Realty Group, a real estate investment firm in Orange County, California, from 1994 until 2000. Mr. Iker received his Bachelor of Science from the University of Phoenix and a Master of Business Administration, with honors, from The Wharton School of the University of Pennsylvania.
David Paul, age 53, has worked at JBG since 2007, and has served as a Managing Partner and member of the Executive Committee since 2015, Management Committee since 2012 and Investment Committee since 2007. He began his career with the consulting firm Bain and Company in 1985, before moving into commercial and retail real estate development and investment with several firms, including Trammell Crow Company, Starwood Urban Investments, and Archon Group, a subsidiary of Goldman, Sachs & Co (NYSE: GS), and has been involved in both domestic and international real estate investment. He has over 25 years of experience in the commercial real estate industry and is responsible for overseeing the asset management function at JBG. He received his B.A. from Vanderbilt University and Master of Business Administration from The Tuck School of Business at Dartmouth.
Brian Coulter, age 56, originally joined JBG in 1986. He is a Managing Partner and has served as a member of the Executive Committee and Investment Committee since their formation.
137
Mr. Coulter has over 30 years of managerial experience in the real estate industry. During his tenure he has focused primarily on managing pre-development and development activities, as well as areas of value creation through more effective asset management. With the sale of a significant portion of JBG's commercial portfolio and two operating companies to a public real estate company in 1998, Mr. Coulter served as a Managing Director of the mid-Atlantic region of the acquiring company for 14 months. He returned to JBG in 1999. He is a past Board Member and President of Rosslyn Renaissance. He received his Bachelor of Arts, Summa Cum Laude, Phi Beta Kappa from Rutgers College and a Master of Business Administration from Harvard Business School.
138
GLOSSARY
Except where the context suggests otherwise, we define certain terms in this document as follows:
- •
- "annualized rent" when presented on an asset basis (i) for office and retail assets, or the retail component of a mixed-use asset, represents base rent and percentage rent before rent abatements, plus tenant reimbursements for the quarter ended March 31, 2016, multiplied by four, and (ii) for multifamily assets, or the multifamily component of a mixed-use asset, represents base rent before rent abatements for the quarter ended March 31, 2016, multiplied by four. "Annualized rent" when presented on a lease or tenant basis for office and retail leases and tenants represents in-place base rent and percentage rent before abatements, plus tenant reimbursements for the month ended March 31, 2016, multiplied by 12. Triple net leases are converted to a gross basis by adding estimated tenant reimbursements to base rent.
- •
- "annualized rent per square foot" represents annualized rent divided by occupied square feet.
- •
- "Beltway" refers to the I-495 highway loop that surrounds the Washington, DC region.
- •
- "construction" refers to assets that were under construction as of March 31, 2016.
- •
- "contractual free rent" represents contractual rent abatements for in-place and signed but not commenced leases.
- •
- "DC Metro area" refers to the metropolitan area of Washington, DC.
- •
- "embedded lease-up opportunity" refers to stabilized assets where we believe there is an opportunity to lease-up space.
- •
- "equity multiple" represents the sum of the total contributions and distributions from a realized investment or realized investments, as the case may be, received by the applicable fund, calculated on a quarterly basis, only including such contributions and distributions from the realized investment or realized investments, as the case may be, plus the equity invested divided by the equity invested.
- •
- "equity invested" represents the maximum equity invested by the applicable fund during its life, calculated on a quarterly basis, including only equity associated with a realized investment or realized investments, as the case may be.
- •
- "estimated potential density" reflects management's estimate of developable square feet based on its current business plans as of March 31, 2016.
- •
- "FAR" refers to floor-to-area ratio, which is generally the ratio of the total square feet of a building divided by the square feet of the lot on which the building is situated.
- •
- "first generation leases" refers to leases for space that was (i) vacant at the time of acquisition of an asset, (ii) substantially demolished and demised for its first time following a renovation or (iii) vacant for more than nine months.
- •
- "GAAP" refers to generally accepted accounting principles in the United States.
- •
- "garden-style" refers to multifamily assets that are garden-style apartment communities, consisting of multi-story buildings in landscaped settings.
- •
- "gross levered IRR" represents the levered internal rate of return based on (i) equity invested and (ii) the total distributions from a realized investment or realized investments, as the case may be (including the return of equity invested), received by the applicable fund,
139
less all sales costs, debt service and all other property level fees where applicable, but before deduction of carried interests and asset management fees where applicable. For realized investments that were subject to a joint venture, gross levered IRR reflects the impact of any promote that was either paid or earned.
- •
- "GSA" refers to the General Services Administration, which is the independent federal government agency that manages real estate procurement for the federal government and federal agencies.
- •
- "incremental lease-up opportunity" refers to Recently Acquired/Delivered/Renovated assets where we believe there are opportunities to lease-up space.
- •
- "Inside Beltway" refers to assets that are located inside the Beltway.
- •
- "JBG" refers to JBG/Operating Partners, L.P. and its affiliated entities that conduct business under The JBG Companies® trade name.
- •
- "JBG funds" refers to the nine real estate investment funds that we have sponsored.
- •
- "land bank" refers to assets that are development opportunities on which we do not expect to commence construction within 24 months of March 31, 2016 where we (i) have an option to purchase, or enter into a leasehold interest with respect to, land, (ii) are under a long-term conditional contract to purchase land, (iii) control the land through a ground lease, or (iv) own the land.
- •
- "Metro" refers to the public transportation network serving the DC Metro area operated by the Washington Metropolitan Area Transit Authority.
- •
- "Metro-served" refers to locations within walking distance of an existing or planned Metro station.
- •
- "mid/high-rise" refers to multifamily assets that are mid and high-rise apartment communities, typically in urban settings.
- •
- "non-core excluded assets" refers to the assets and interests in assets currently owned by the JBG funds that will not be contributed to us as part of the Combination Transactions. These assets primarily consist of assets that are not consistent with our long-term business strategy going forward as a public company, such as hotels, townhomes and condominiums, as well as office, multifamily and retail assets that are likely to be sold in the near term or are not in our target markets.
- •
- "non-recurring capital expenditures" include (i) expenditures completed in the year of acquisition, (ii) expenditures completed within the first two years from acquisition that were planned at the time of acquisition, (iii) expenditures completed within one year from delivery of newly-constructed assets and (iv) expenditures to substantially renovate and upgrade the competitive positioning or convert the use of an asset.
- •
- "Outside Beltway" refers to assets that are located outside the Beltway with no immediate Metro access.
- •
- "Outside Beltway—Metro" refers to assets that are located outside the Beltway but are within 0.75 miles of an existing or planned Metro station.
- •
- "percent leased" is based on leases signed as of March 31, 2016 and is calculated as (i) for office assets and retail assets, total rentable square feet less rentable square feet available for lease divided by total rentable square feet, and (ii) for multifamily assets, total units less units available for lease divided by total units, expressed as a percentage.
140
- •
- "percent pre-leased" is based on leases signed as of March 31, 2016 and is calculated as the estimated rentable square feet leased divided by estimated total rentable square feet expressed as a percentage.
- •
- "percent occupied" is based on occupied rentable square feet/units as of March 31, 2016 and is calculated as (i) for office and retail assets, total rentable square feet less unoccupied square feet divided by total rentable square feet, or (ii) for multifamily assets, total units less unoccupied units divided by total units, expressed as a percentage.
- •
- "pre-development" refers to assets on which we expect to be in a position to commence construction within 24 months of March 31, 2016.
- •
- "realized investments" refers to investments that were sold by the fund on or before March 31, 2016.
- •
- "Recently Acquired/Delivered/Renovated" refers to assets that have been acquired or delivered, or are undergoing or have completed significant renovation or redevelopment within the 12 months ended March 31, 2016 and are below 90 percent leased as of March 31, 2016, or assets that will undergo significant redevelopment or renovation within the 12 months from March 31, 2016.
- •
- "recurring capital expenditures" refers to expenditures to maintain an asset's competitive position within the market or extend the useful life of the asset.
- •
- "rentable square feet" or "RSF" (i) for office and retail assets refers to actual rentable square footage determined consistent with the Building Owners and Managers Association ("BOMA") measurement guidelines when available and management's estimate of approximate rentable square feet using BOMA measurement guidelines when a BOMA measurement is not available, (ii) for multifamily assets refers to management's estimate of approximate rentable square feet or (iii) for construction and pre-development assets, management's estimate of actual rentable square feet based on current design plans as of March 31, 2016.
- •
- "second generation leases" refers to leases for space that had previously been under lease and was vacant for nine months or less.
- •
- "stabilized" refers to office, multifamily or retail assets that are at or above 90 percent leased or have been operating assets collecting rent for longer than 12 months as of March 31, 2016.
- •
- "vintage" refers to the year in which the fund first made an investment.
141
INDEX TO FINANCIAL STATEMENTS
| | |
| | Page |
|---|
JBG/Operating Partners, L.P. and Subsidiaries | | |
Interim Consolidated Financial Statements (unaudited): | |
|
Consolidated Balance Sheet as of March 31, 2016 | |
F-3 |
Consolidated Statements of Operations and Comprehensive Income for the Three Months Ended March 31, 2016 and 2015 | | F-4 |
Consolidated Statements of Changes in Partners' Deficit for the Three Months Ended March 31, 2016 | | F-5 |
Consolidated Statements of Cash Flows for the Three Months Ended March 31, 2016 and 2015 | | F-6 |
Notes to the Interim Consolidated Financial Statements | | F-7 |
Consolidated Financial Statements: | |
|
Report of Independent Registered Public Accounting Firm | |
F-21 |
Consolidated Balance Sheets as of December 31, 2015, 2014 and 2013 | | F-22 |
Consolidated Statements of Operations and Comprehensive Loss for the Years Ended December 31, 2015, 2014 and 2013 | | F-23 |
Consolidated Statements of Changes in Partners' Deficit for the Years Ended December 31, 2015, 2014 and 2013 | | F-24 |
Consolidated Statements of Cash Flows for the Years Ended December 31, 2015, 2014 and 2013 | | F-25 |
Notes to the Consolidated Financial Statements | | F-26 |
JBG/Rosenfeld Retail Properties, LLC (JBGR) | |
|
Financial Statements: | |
|
Independent Auditors' Report | |
F-37 |
Balance Sheets as of December 31, 2015 and 2014 | | F-38 |
Statement of Operations and Comprehensive Loss for the Years Ended December 31, 2015 and 2014 | | F-39 |
Statement of Changes in Members' Equity (Deficit) for the Years Ended December 31, 2015 and 2014 | | F-40 |
Statements of Cash Flows for the Years Ended December 31, 2015 and 2014 | | F-41 |
Notes to the Financial Statements | | F-42 |
JBG Real Estate Operating Assets | |
|
Interim Financial Statements (unaudited): | |
|
Combined Statement of Revenue and Expenses from Real Estate Operations for the Three Months Ended March 31, 2016 | |
F-47 |
Notes to the Combined Statement of Revenue and Expenses from Real Estate Operations | | F-48 |
Consolidated Financial Statements: | |
|
Independent Auditors' Report | |
F-71 |
Combined Statement of Revenue and Expenses from Real Estate Operations for the Years Ended December 31, 2015, 2014 and 2013 | | F-73 |
Notes to Combined Statement of Revenue and Expenses from Real Estate Operations | | F-74 |
Stonebridge at Potomac Town Center—Phase I | |
|
Financial Statements: | | |
Independent Auditor's Report | |
F-125 |
Statement of Revenue and Expenses from Real Estate Operations for the Period January 1, 2015 to December 9, 2015 | | F-126 |
F-1
JBG/OPERATING PARTNERS, L.P. AND SUBSIDIARIES
Chevy Chase, Maryland
INTERIM CONSOLIDATED FINANCIAL STATEMENTS (UNAUDITED)
March 31, 2016
F-2
JBG/OPERATING PARTNERS, L.P. AND SUBSIDIARIES
Consolidated Balance Sheet (Unaudited)
As of March 31, 2016
(dollar amounts in thousands)
| | | | |
| |
| |
|---|
Assets | | | | |
Current assets | | | | |
Cash and cash equivalents | | $ | 2,454 | |
Accounts receivable | | | 8,412 | |
Prepaid expenses and other current assets | | | 800 | |
Due from affiliates | | | 2,759 | |
| | | | | |
Total current assets | | | 14,425 | |
Intangible assets and goodwill, net | | | 10,181 | |
Investment in affiliates | | | 290 | |
Property and equipment, net | | | 7,103 | |
| | | | | |
Total Assets | | $ | 31,999 | |
| | | | | |
| | | | | |
| | | | | |
Liabilities and Partners' Deficit | | | | |
Current liabilities | | |
| |
Line of credit | | $ | 8,000 | |
Accounts payable | | | 317 | |
Accrued expenses | | | 7,614 | |
Accrued limited partner profit-sharing expense, current | | | 7,522 | |
Deferred rent, current | | | 233 | |
Contingent purchase consideration payable | | | 2,000 | |
Due to affiliate | | | 175 | |
| | | | | |
Total current liabilities | | | 25,861 | |
Accrued limited partner profit-sharing expense, net of current portion | | | 120,985 | |
Deferred rent, net of current portion | | | 3,092 | |
| | | | | |
Total Liabilities | | | 149,938 | |
| | | | | |
Total Partners' Deficit | | | (117,939 | ) |
| | | | | |
Total Liabilities and Partners' Deficit | | $ | 31,999 | |
| | | | | |
| | | | | |
| | | | | |
See accompanying notes to the consolidated financial statements.
F-3
JBG/OPERATING PARTNERS, L.P. AND SUBSIDIARIES
Consolidated Statements of Operations and Comprehensive Income (Unaudited)
For the Three Months Ended March 31, 2016 and 2015
(dollar amounts in thousands)
| | | | | | | |
| | Three Months Ended
March 31, | |
|---|
| | 2016 | | 2015 | |
|---|
Revenues | | | | | | | |
Asset management fees | | $ | 7,716 | | $ | 9,586 | |
Asset management fee credits | | | 2,550 | | | 2,550 | |
Development and construction management fees | | | 6,215 | | | 7,853 | |
Property management fees | | | 5,225 | | | 3,814 | |
Leasing fees | | | 1,109 | | | 984 | |
Other revenue | | | 1,095 | | | 971 | |
| | | | | | | | |
Total revenues | | | 23,910 | | | 25,758 | |
Operating Expenses | | |
| | |
| |
Salary and benefits—reimbursement to general partner | | | 14,294 | | | 12,689 | |
Limited partner profit-sharing expense | | | 43 | | | 3,106 | |
Asset management fee credit expense | | | 2,550 | | | 2,550 | |
General and administrative | | | 3,847 | | | 2,163 | |
Depreciation and amortization | | | 513 | | | 393 | |
| | | | | | | | |
Total operating expenses | | | 21,247 | | | 20,901 | |
| | | | | | | | |
Operating Income | | | 2,663 | | | 4,857 | |
Income from Investments in Affiliates | | |
201 | | |
216 | |
Other Income (Expenses) | | |
| | |
| |
Gain on acquisition of affiliate, net | | | 3,086 | | | — | |
Interest expense | | | (39 | ) | | (8 | ) |
| | | | | | | | |
Total other income (expenses) | | | 3,047 | | | (8 | ) |
| | | | | | | | |
Income Before Income Taxes | | | 5,911 | | | 5,065 | |
Income Taxes | | |
(101 |
) | |
(83 |
) |
| | | | | | | | |
Net Income | | | 5,810 | | | 4,982 | |
Other comprehensive income | | |
— | | |
— | |
| | | | | | | | |
Comprehensive Income | | $ | 5,810 | | $ | 4,982 | |
| | | | | | | | |
| | | | | | | | |
| | | | | | | | |
See accompanying notes to the consolidated financial statements.
F-4
JBG/OPERATING PARTNERS, L.P. AND SUBSIDIARIES
Consolidated Statement of Changes in Partners' Deficit (Unaudited)
For the Three Months Ended March 31, 2016
(dollar amounts in thousands)
| | | | |
Balance, January 1, 2016 | | $ | (123,749 | ) |
Net income | | | 5,810 | |
| | | | | |
Balance, March 31, 2016 | | $ | (117,939 | ) |
| | | | | |
| | | | | |
| | | | | |
See accompanying notes to the consolidated financial statements.
F-5
JBG/OPERATING PARTNERS, L.P. AND SUBSIDIARIES
Consolidated Statements of Cash Flows (Unaudited)
For the Three Months Ended March 31, 2016 and 2015
(dollar amounts in thousands)
| | | | | | | |
| | Three Months Ended
March 31, | |
|---|
| | 2016 | | 2015 | |
|---|
Cash Flows from Operating Activities | | | | | | | |
Net income | | $ | 5,810 | | $ | 4,982 | |
Reconciliation adjustments | | | | | | | |
Gain on acquisition of affiliate, net | | | (3,086 | ) | | — | |
Depreciation and amortization | | | 513 | | | 393 | |
Other adjustments | | | 15 | | | 8 | |
Income from investment in affiliates | | | (201 | ) | | (216 | ) |
Distributions from affiliates | | | 329 | | | 193 | |
Changes in, net of acquired amounts: | | | | | | | |
Accounts receivable | | | (18 | ) | | (1,220 | ) |
Prepaid expenses and other current assets | | | 362 | | | 302 | |
Accounts payable | | | (8 | ) | | (40 | ) |
Accrued expenses | | | (11,071 | ) | | (7,561 | ) |
Accrued limited partner profit-sharing expense | | | 43 | | | 76 | |
Due from affiliate, net | | | (1,789 | ) | | (44 | ) |
Deferred rent | | | (47 | ) | | (22 | ) |
| | | | | | | | |
Net cash used in operating activities | | | (9,148 | ) | | (3,149 | ) |
Cash Flows from Investing Activities | | |
| | |
| |
Acquisition of affiliate | | | (4,870 | ) | | — | |
Acquisition of property and equipment | | | (151 | ) | | (19 | ) |
| | | | | | | | |
Net cash used in investing activities | | | (5,021 | ) | | (19 | ) |
Cash Flows from Financing Activities | | |
| | |
| |
Line of credit advances | | | 8,000 | | | — | |
| | | | | | | | |
Net cash provided by financing activities | | | 8,000 | | | — | |
| | | | | | | | |
Net Decrease in Cash and Cash Equivalents | | | (6,169 | ) | | (3,168 | ) |
Cash and Cash Equivalents, beginning of period | | |
8,623 | | |
7,240 | |
| | | | | | | | |
Cash and Cash Equivalents, end of period | | $ | 2,454 | | $ | 4,072 | |
| | | | | | | | |
| | | | | | | | |
| | | | | | | | |
Supplemental Disclosure of Cash Flow Information | | | | | | | |
Interest paid | | $ | 24 | | $ | — | |
| | | | | | | | |
| | | | | | | | |
| | | | | | | | |
Taxes paid | | $ | — | | $ | — | |
| | | | | | | | |
| | | | | | | | |
| | | | | | | | |
Supplemental Disclosure of Non-Cash Activity | | | | | | | |
Contingent consideration for acquisition of affiliate | | $ | 2,000 | | $ | — | |
| | | | | | | | |
| | | | | | | | |
| | | | | | | | |
See accompanying notes to the consolidated financial statements.
F-6
JBG/OPERATING PARTNERS, L.P. AND SUBSIDIARIES
Notes to Consolidated Financial Statements (Unaudited)
(dollar amounts in thousands)
NOTE 1—ORGANIZATION
JBG/Operating Partners, L.P. and subsidiaries (the "Partnership") is a limited partnership under the laws of the State of Delaware and will continue in perpetuity, unless earlier terminated or dissolved pursuant to the limited partnership agreement or by operation of law.
The Partnership is a fee-based real estate services company that is owned by a group of investors, including a general partner and twenty-one limited partners (the "Limited Partners"). The Limited Partners, and all other personnel providing services to and on behalf of the Partnership, are employees of the Partnership's general partner. The Partnership reimburses its general partner for all salary, benefits, and related costs under a cost reimbursement arrangement.
The Partnership operates in the Washington, DC, metropolitan area and earns fees in connection with investment, development, assets and property management, leasing, construction management, tenant improvement construction and finance services provided to commercial office properties, multifamily (both rental and for-sale), retail and hotels. Substantially all fee revenue earned by the Partnership is from services provided for the real estate assets owned by affiliated real estate investment funds (the "Funds") and other real estate investment vehicles (collectively, the "Contributing Entities"). The Contributing Entities own interests in real estate assets through separate limited liability companies ("Property LLCs"). The Partnership, Contributing Entities and Property LLCs are not under common control or ownership.
On May 25, 2016, the Partnership entered into a Master Combination Agreement (the "Combination Agreement") with New York REIT, Inc. ("NYRT") and to New York Recovery Operating Partnership, L.P., a Delaware limited partnership and NYRT's subsidiary operating partnership (the "Operating Partnership"), pursuant to which the Partnership and the Contributing Entities' interests in certain Property LLCs will be contributed through a series of formation transactions the Operating Partnership, in exchange for the right to receive units of limited partnership interest in the Operating Partnership or shares of common stock of NYRT or, in certain limited circumstances, cash (the "Transaction"). NYRT is the general partner of the Operating Partnership and is a publicly-traded Maryland corporation that operates as a real estate investment trust for U.S. federal tax purposes. The Operating Partnership will acquire ownership interests in certain of the Property LLCs owned by the Contributing Entities. The Contributing Entities are otherwise not parties to the formation transactions and the substantial majority of them will continue to exist independent of the Transaction. It is expected that the Partnership will merge with and into the Operating Partnership and continue providing management and other services to, and on behalf of, certain of the Contributing Entities and the Property LLCs owned by the Contributing Entities that were not contributed in the Transaction.
The Partnership has one reporting segment—real estate services.
NOTE 2—SUMMARY OF SIGNIFICANT ACCOUNTING POLICIES
Use of Estimates—The preparation of consolidated financial statements in conformity with accounting principles generally accepted in the United States of America ("U.S. GAAP") requires management to make estimates and assumptions that affect the reported amounts of assets, liabilities, revenues and expenses, and the disclosure of contingent assets and liabilities. Actual results may differ from these estimates.
F-7
JBG/OPERATING PARTNERS, L.P. AND SUBSIDIARIES
Notes to Consolidated Financial Statements (Unaudited) (Continued)
(dollar amounts in thousands)
NOTE 2—SUMMARY OF SIGNIFICANT ACCOUNTING POLICIES (Continued)
Principles of Consolidation—The consolidated financial statements include the accounts of the Partnership and its wholly-owned and majority-owned subsidiaries. All significant intercompany accounts and transactions have been eliminated. The Partnership has adopted the Financial Accounting Standards Board's ("FASB") Accounting Standards Updated ("ASU") No. 2015-02,Amendment to the Consolidation Analysis, which improves targeted areas of the consolidation guidance and reduces the number of consolidation models for all periods presented.
The Partnership does not have significant involvement and is not the primary beneficiary of any variable interest entities.
When the requirements for consolidation are not met, but the Partnership has significant influence over the operations of an investee, the Partnership accounts for its partially owned entities under the equity method. The Partnership's judgement with respect to its level of influence of an entity involves the consideration of various factors, including voting rights, forms of its ownership interest, representation in the entity's governance, the size of its investment (including loans), its ability to participate in policy making decisions and rights of the other investors to participate in the decision making process and to replace the Partnership as managing member and/or liquidate the venture, if applicable. The assessment of the Partnership's influence over an entity affects the presentation of these investments in the accompanying consolidated financial statements.
Equity method investments are initially recorded at cost and subsequently adjusted for the Partnership's share of net income or loss and cash contributions and distributions each period. See Note 5.
Unaudited Interim Consolidated Financial Statements—The interim consolidated financial statements are unaudited. In the opinion of management, these consolidated financial statements reflect all adjustments necessary for a fair presentation of the results of the interim period. All such adjustments are of a normal recurring nature.
Cash and Cash Equivalents—For purposes of the accompanying consolidated balance sheets and consolidated statements of cash flows, the Partnership considers short-term investments with remaining maturities of three months or less when purchased to be cash equivalents.
Accounts Receivable—Accounts receivable are stated at net realizable value. Management considers the following factors when determining the collectability of specific customer accounts: customer credit worthiness, past transaction history with the customer, current economic industry trends, and changes in customer payment terms. Past due balances over 90 days and other higher risk amounts are reviewed individually for collectability. Based on management's assessments, an allowance for doubtful accounts was not deemed necessary as of March 31, 2016.
Property and Equipment—Furniture, fixtures, and equipment are recorded at cost and are depreciated using the straight-line method over their estimated useful lives. Leasehold improvements are costs incurred to prepare the Partnership's corporate office space for occupancy and are depreciated on a straight-line basis over the shorter of the estimated useful lives of the improvements
F-8
JBG/OPERATING PARTNERS, L.P. AND SUBSIDIARIES
Notes to Consolidated Financial Statements (Unaudited) (Continued)
(dollar amounts in thousands)
NOTE 2—SUMMARY OF SIGNIFICANT ACCOUNTING POLICIES (Continued)
or the terms of the respective leases. The following are the estimated useful lives used for depreciation purposes:
| | |
Assets | | Depreciation Period |
|---|
Furniture, fixtures, and equipment | | 3 - 5 years |
Leasehold improvements | | 8 - 15 years |
Expenditures for ordinary maintenance and repairs are expensed to operations as incurred. Significant renovations and improvements that improve or extend the useful life of the asset are capitalized. Depreciation and amortization expense related to property and equipment for the three months ended March 31, 2016 was $404.
Business Combination—The Partnership accounts for business combinations using the acquisition method of accounting, under which the purchase price of the acquisition is allocated to the assets acquired and liabilities assuming using the fair values determined by management as of the acquisition date. Contingent consideration obligations that are elements of consideration transferred are recognized as of the acquisition date as part of the fair value transferred in exchange for the acquired business. Acquisition-related costs incurred in connection with the business combination are expensed.
Goodwill—Goodwill is the excess of cost of an acquired entity over the amounts specifically assigned to assets acquired and liabilities assumed in a business combination. The Partnership tests the carrying value of goodwill for impairment on an annual basis, or on an interim basis if an event occurs or circumstances change that would indicate the carrying amount may be impaired. Such interim circumstances may include, but are not limited to, significant adverse changes in the general business climate, unanticipated competition, and the loss of key personnel. The Partnership first assesses qualitative factors to determine whether it is more likely than not that the fair value of the reporting unit is less than its carrying amount. If assessing the totality of events or circumstances leads to a determination that it is more likely than not that the fair value of the reporting unit is less than its carrying amount, a quantitative assessment is performed to determine if the goodwill is impaired. The Partnership does not believe that impairment indicators are present as of March 31, 2016, and, accordingly, no such losses have been reflected in the accompanying consolidated financial statements.
Impairment of Long Lived Assets—Long-lived assets, such as property and equipment, and acquired intangible assets subject to amortization, are reviewed for impairment whenever events or changes in circumstances indicate that the carrying amount of an asset may not be recoverable. If circumstances require a long-lived asset or asset group be tested for possible impairment, the Partnership first compares undiscounted cash flows expected to be generated by that asset or asset group to its carrying amount. If the carrying amount of the long-lived asset or asset group is not recoverable on an undiscounted cash flow basis, an impairment is recognized to the extent that the carrying amount exceeds its fair value. Fair value is determined through various valuation techniques including discounted cash flow models, quoted market values and third-party independent appraisals, as considered necessary.
Fair Value Measurements—U.S. GAAP has established a framework for measuring fair value and requires certain disclosures for all financial and non-financial instruments required to be recorded
F-9
JBG/OPERATING PARTNERS, L.P. AND SUBSIDIARIES
Notes to Consolidated Financial Statements (Unaudited) (Continued)
(dollar amounts in thousands)
NOTE 2—SUMMARY OF SIGNIFICANT ACCOUNTING POLICIES (Continued)
in the consolidated balance sheet or disclosed in the footnotes to the consolidated financial statements. Broadly, U.S. GAAP requires fair value to be determined based on the exchange price that would be received for an asset or paid to transfer a liability (an exit price) in the principal or most advantageous market for the asset or liability in an orderly transaction between market participants. U.S. GAAP generally requires the use of one or more valuation techniques that include the market, income, or cost approaches. U.S. GAAP also establishes market or observable inputs as the preferred source of values when using such valuation techniques, followed by assumptions based on hypothetical transactions in the absence of market inputs.
The valuation techniques required by U.S. GAAP are based upon observable and unobservable inputs. Observable inputs reflect market data obtained from independent sources, while unobservable inputs reflect market assumptions. U.S. GAAP classifies inputs using the following hierarchy:
| |
| | Level 1—Quoted prices for identical instruments in active markets. |
| | Level 2—Quoted prices for similar instruments in active markets; quoted prices for identical or similar instruments in markets that are not active; and model-derived valuations whose inputs are observable or whose significant value drivers are observable. |
| | Level 3—Significant inputs to the valuation model are unobservable. |
Due to the uncertainty inherent in the valuation process, such estimates of fair value may differ significantly from the values that would have been used had a ready market for the asset or liability existed, and the differences could be material. Additionally, changes in the market environment and other events that may occur over the life of these assets and liabilities may cause the gains or losses, if any, ultimately realized, to be different than the valuations currently assigned.
The fair value of the intangible assets and goodwill and the measurement of the contingent consideration was based on unobservable inputs, including projected probability-weighted cash payments and a discount rate, which reflects a market rate. Changes in fair value may occur as a result of a change in the actual or projected cash payments, the probability weightings applied by the Partnership to projected payments, or a change in the discount rate. Significant increases or decreases in any of these inputs in isolation could result in a significant upward or downward change in the fair value measurement. Allocations of fair value to other assets and liabilities was equal to the respective carrying amounts. There were no other recurring or non-recurring fair value measurements during the three months ending March 31, 2016 and 2015.
Revenue Recognition—The Partnership's revenue streams are received for providing various real estate management and advisory services, including:
- •
- Asset management services provided to the Contributing Entities, as delegated by the managing member or equivalent of each of the Contributing Entities, for executing strategies to maximize real estate values, managing/supervising asset performance, and providing related reporting and other services to the Fund investors. Asset management fees are recognized as services are provided. See also Note 8.
- •
- Development and construction management fees are received for such services rendered at agreed upon hourly rates or charges. Revenue is recognized as services are provided.
F-10
JBG/OPERATING PARTNERS, L.P. AND SUBSIDIARIES
Notes to Consolidated Financial Statements (Unaudited) (Continued)
(dollar amounts in thousands)
NOTE 2—SUMMARY OF SIGNIFICANT ACCOUNTING POLICIES (Continued)
- •
- Property management services, include on-site oversight and maintenance, lease management, accounting, and other property related services. Property management fees are calculated as a percentage of rental revenue and are recognized as services are provided.
- •
- Leasing commissions include successful efforts commissions received when a lease is executed. Leasing commissions are recognized when earned.
Income Taxes—JBG/Operating Partners, L.P. is a limited partnership and certain subsidiaries of JBG/Operating Partners, L.P. are limited liability companies. Limited partnerships and limited liability companies are not subject to federal income taxes, although they may be subject to state income taxes in certain instances. The Partnership and the limited liabilities companies record no provision or benefit for federal income taxes because taxable income or loss passes through to and is reported by the partners and members on their respective income tax returns.
Deferred income taxes are provided for temporary differences in the reported costs of assets and liabilities and their tax bases, and are calculated due to the requirement of certain of the Partnership's subsidiaries to pay unincorporated business franchise tax in Washington, DC ("DC Franchise Tax"). DC Franchise Tax is an income-based tax and accounted for under the Financial Accounting Standards Board ("FASB") Accounting Standards Codification Topic 740,Income Taxes.
The tax effects from an uncertain tax position can be recognized in the financial statements only if the position is more likely than not to be sustained on audit, based on the technical merits of the position. The Partnership recognizes the financial statement benefit of a tax position only after determining that the relevant tax authority would more likely than not sustain the position following an audit. For tax positions meeting the more likely than not threshold, the amount recognized in the financial statements is the largest benefit that has a greater than 50 percent likelihood of being realized upon ultimate settlement with the relevant tax authority. The Partnership applied the accounting standard to all tax positions for which the statute of limitations remained open. As a result of this review, the Partnership did not identify any material uncertain tax positions.
The Partnership recognizes interest and penalties related to unrecognized tax benefits in income tax expense. For the three months ended March 31, 2016 and 2015, the Partnership has not recognized any interest or penalties in the consolidated statements of operations and comprehensive income. The Partnership is no longer subject to U.S. federal, state, or local income tax examinations by tax authorities for the years before 2012. The Partnership is not currently under examination by any taxing jurisdiction.
The Partnership's DC Franchise Tax for the three months ended March 31, 2016 and 2015 totaled $101, and $83, respectively, and is included in income tax expense on the consolidated statements of operations and comprehensive income.
Recently Issued Accounting Standards—On May 28, 2014, the FASB issued ASU No. 2014-09,Revenue from Contracts with Customers, which requires an entity to recognize the amount of revenue to which it expects to be entitled for the transfer of promised goods or services to customers. ASU 2014-09 will replace most existing revenue recognition guidance in U.S. GAAP when it becomes effective. The new standard is effective for annual and interim periods in fiscal years beginning after December 15, 2017, with early adoption permitted for annual and interim periods in fiscal years
F-11
JBG/OPERATING PARTNERS, L.P. AND SUBSIDIARIES
Notes to Consolidated Financial Statements (Unaudited) (Continued)
(dollar amounts in thousands)
NOTE 2—SUMMARY OF SIGNIFICANT ACCOUNTING POLICIES (Continued)
beginning after December 15, 2016. The new standard permits the use of either the retrospective or cumulative effect transition method. The Partnership has not yet selected a date of adoption or a transition method. Similarly, the Partnership is currently evaluating the effect the standard will have on its consolidated financial statements.
The Partnership has adopted FASB ASU No. 2015-03,Interest—Imputation of Interest, which simplifies the presentation of debt issuance costs and FASB ASU No. 2015-16,Simplifying the Accounting for Measurement-Period Adjustments, which eliminates the requirement to retrospectively account for adjustments made to provisional amounts recognized in a business combination.
In February 2016, the FASB issued ASU No. 2016-02,Leases. The new standard establishes a right-of-use ("ROU") model that requires a lessee to record a ROU asset and a lease liability on the balance sheet for all leases with terms longer than 12 months. Leases will be classified as either finance or operating, with classification affecting the pattern of expense recognition in the income statement. The new standard is effective for fiscal years beginning after December 15, 2018, including interim periods within those fiscal years. A modified retrospective transition approach is required for lessees for capital and operating leases existing at, or entered into after, the beginning of the earliest comparative period presented in the financial statements, with certain practical expedients available. The Partnership is currently evaluating the effect the standard will have on its consolidated financial statements.
NOTE 3—ACQUISITION OF AFFILIATE
Prior to January 8, 2016, the Partnership held a 33.3% interest in JBG/Rosenfeld Retail Properties, LLC ("JBGR") and accounted for its interest using the equity method of accounting. On January 8, 2016, the Partnership acquired the remaining 66.7% interest for cash consideration of $4,668 plus contingent consideration of up to $2,250. The amount of contingent consideration payable will be determined based on the fair value of the Partnership derived from the Transaction described in Note 1. The estimated fair value of the contingent consideration is $2,000 based on the terms of the Transaction. The Partnership estimates that the contingent consideration will be paid during 2016.
The carrying value of the Partnership's 33.3% interest was zero on the date of acquisition. Pursuant to US GAAP, the Partnership's existing equity interest is remeasured at fair value on the date of acquisition. The fair value adjustment is recognized as a gain in the statement of operations and comprehensive income and allocated to investee's assets and liabilities based on their relative fair values.
The fair value of JBGR totaled $10,220. Of this amount, $4,668 was paid to the sellers, $2,000 of contingent consideration is payable to the sellers, and $3,552 is allocable to the Partnership for its existing 33.3% interest. Also included in gain on acquisition of affiliate, net on the consolidated statement of operations and comprehensive income is the write-off of deferred rent receivable of $466 related to a preexisting sublease between the Company and JBGR.
F-12
JBG/OPERATING PARTNERS, L.P. AND SUBSIDIARIES
Notes to Consolidated Financial Statements (Unaudited) (Continued)
(dollar amounts in thousands)
NOTE 3—ACQUISITION OF AFFILIATE (Continued)
The following table summarizes the preliminary estimated fair values of the assets and liabilities at the acquisition date:
| | | | |
Accounts receivable | | $ | 465 | |
Other assets | | | 90 | |
Property and equipment | | | 187 | |
Accrued expenses | | | (812 | ) |
| | | | | |
Net identifiable liabilities assumed | | | (70 | ) |
Intangible assets and goodwill | | | 10,290 | |
| | | | | |
Net assets acquired | | $ | 10,220 | |
| | | | | |
| | | | | |
| | | | | |
Due to the recent timing of the acquisition, the purchase allocation described above is preliminary and subject to change. Specifically, the valuation of certain identifiable intangible assets (primarily related to acquired long-term contracts and the noncompete arrangements) have not yet been finalized.
The goodwill recognized is attributable primarily to expected synergies and assembled workforce of JBGR. The amounts of revenue and net loss of JBGR included in the Partnership's consolidated statement of operations for the three months ended March 31, 2016 are $1,997 and $(487), respectively.
As of the acquisition date, the fair value of the accounts receivable, other assets, and accrued expenses approximated the historical basis of the assets and liabilities due to the near term liquidity of the assets and liabilities. The value for property and equipment was determined based on a replacement cost approach, adjusted for estimated depreciation.
The following table sets forth the acquired intangible assets detail as of March 31, 2016:
| | | | | | | | | | |
| | Gross
Carrying
Amount | | Accumulated
Amortization | | Net
Carrying
Amount | |
|---|
Exclusive leasing agreements | | $ | 3,317 | | $ | (83 | ) | $ | 3,234 | |
Non-competition agreement | | | 321 | | | (26 | ) | | 295 | |
| | | | | | | | | | | |
| | $ | 3,638 | | $ | (109 | ) | $ | 3,529 | |
| | | | | | | | | | | |
| | | | | | | | | | | |
| | | | | | | | | | | |
Exclusive leasing agreements are amortized on a straight-line basis over their estimated useful lives of approximately 10 years. The non-competition agreement is amortized on a straight-line basis over the term of the non-competition agreement, which is 3 years. Amortization expense for intangible assets for the three months ended March 31, 2016 was $109.
F-13
JBG/OPERATING PARTNERS, L.P. AND SUBSIDIARIES
Notes to Consolidated Financial Statements (Unaudited) (Continued)
(dollar amounts in thousands)
NOTE 3—ACQUISITION OF AFFILIATE (Continued)
Estimated amortization of the acquired intangible assets as of March 31, 2016 is as follows:
| | | | |
Nine months ending December 31, 2016 | | $ | 329 | |
2017 | | | 439 | |
2018 | | | 439 | |
2019 | | | 332 | |
2020 | | | 332 | |
Thereafter | | | 1,658 | |
| | | | | |
| | $ | 3,529 | |
| | | | | |
| | | | | |
| | | | | |
Additionally, in January 2016, the Partnership entered into a Consulting Agreement with an entity owned by certain individual sellers of JBGR. The noncancelable term of the Consulting Agreement expires on January 1, 2018. Under the terms of the Consulting Agreements, monthly payments of $181 and $186 are payable in 2016 and 2017, respectively. The Partnership incurred consulting fees of $543 for the three months ended March 31, 2016 related to the Consulting Agreement, which is included in general and administrative expense on the accompanying consolidated statement of operations and comprehensive income.
NOTE 4—PROPERTY AND EQUIPMENT
The following table sets forth the details of property and equipment as of March 31, 2016:
| | | | |
Furniture, fixtures, and equipment | | $ | 8,886 | |
Leasehold improvements | | | 7,791 | |
| | | | | |
| | | 16,677 | |
Less accumulated depreciation and amortization | | | (9,574 | ) |
| | | | | |
Property and equipment, net | | $ | 7,103 | |
| | | | | |
| | | | | |
| | | | | |
NOTE 5—INVESTMENT IN AFFILIATE
The Partnership applies the equity method of accounting for investment in Hotco, LLC ("Hotco"). Under the Hotco limited liability agreement, the Partnership is not obligated to fund operating losses or other obligations of Hotco.
The Partnership periodically evaluates the carrying value of its equity method investment for impairment when the estimated fair value is less than the carrying value. The Partnership records a charge to reduce carrying value to estimated fair value when impairment is deemed other than temporary. No impairment was recorded for the three months ended March 31, 2016 and 2015.
F-14
JBG/OPERATING PARTNERS, L.P. AND SUBSIDIARIES
Notes to Consolidated Financial Statements (Unaudited) (Continued)
(dollar amounts in thousands)
NOTE 5—INVESTMENT IN AFFILIATE (Continued)
The following information summarizes the aggregate financial position and results Hotco as of and for the three months ended March 31, 2016:
| | | | |
Assets | | $ | 1,188 | |
| | | | | |
| | | | | |
| | | | | |
Liabilities | | $ | 125 | |
Equity | | | 1,063 | |
| | | | | |
Total Liabilities and Equity | | $ | 1,188 | |
| | | | | |
| | | | | |
| | | | | |
Partnership's Investment in Affiliate | | $ | 265 | |
| | | | | |
| | | | | |
| | | | | |
Net Income | | $ | 807 | |
| | | | | |
| | | | | |
| | | | | |
Partnership's Ownership Percentage | | | 24.9 | % |
| | | | | |
| | | | | |
| | | | | |
In addition to this equity method investment, the Partnership has several immaterial investments accounted for under the cost method.
Prior to the consummation of the Transaction, the Partnership intends on distributing its interest in Hotco to the Limited Partners and the Partnership's general partner. The general partner will, in turn, distribute the interest received to its owners.
NOTE 6—LINES OF CREDIT
The Partnership maintains a line of credit that had a maximum amount available of $8,000 as of March 31, 2016, which matures on September 30, 2016. The Partnership maintains a second line of credit with a maximum amount available of $8,000 as of March 31, 2016, which matures on June 30, 2016. Advances on the two lines of credit bear interest at a fluctuating rate equal to the Adjusted London Interbank Offered Rate ("LIBOR") plus 3.00 percent. As of March 31, 2016, borrowings on the lines of credit totaled $8,000 and the effective interest rate was 3.44 percent. The Partnership incurred interest expense of $39 and $8 for the three months ended March 31, 2016 and 2015, respectively, related to the lines of credit.
In connection with the Partnership obtaining the second line of credit, certain of the Limited Partners entered into a Repayment Guaranty Agreement (the "Guaranty"). Under the Guaranty, these Limited Partners agreed to guarantee timely payment due to the lender through the maturity date, including reasonable attorney fees and expenses. The terms of the Guaranty require partners to comply with certain financial covenants, including maintaining a collective minimum liquidity of $8,000 as of March 31, 2016. As of March 31, 2016, the partners were in compliance with the collective minimum liquidity requirement.
NOTE 7—LIMITED PARTNER PROFIT-SHARING EXPENSE
The Limited Partners serve in the capacity as employees in an employment arrangement, delivering real estate services for the benefit of the Partnership. The Limited Partners receive salary and other benefits in that capacity from the Partnership's general partner. The Partnership reimburses its general partner for these costs. In addition, and pursuant to the Limited Partnership Agreement, as amended (the "Partnership LPA"), the Limited Partners are entitled to receive a share of the
F-15
JBG/OPERATING PARTNERS, L.P. AND SUBSIDIARIES
Notes to Consolidated Financial Statements (Unaudited) (Continued)
(dollar amounts in thousands)
NOTE 7—LIMITED PARTNER PROFIT-SHARING EXPENSE (Continued)
Partnership's annual distributable cash, as defined in the Partnership LPA ("Distributable Cash"), subject to continued employment. The payment of this Distributable Cash is referred to as an "Annual Profit-Sharing Payment."
In addition to the Annual Profit-Sharing Payment, under the Partnership LPA, the Limited Partners are eligible to receive an annual profit-sharing payment equal to the Limited Partner's share of Distributable Cash for each year in the five-year period following conclusion of such Limited Partner's employment with the Partnership ("Redemption Payments"). Pursuant to the Partnership LPA, Redemption Payments vest ratably over a fifteen year period during the Limited Partner's continued employment. The Annual Profit-Sharing Payment and the Redemption Payments are collectively referred to as the "Profit-Sharing Arrangement."
The Limited Partners were not obligated to make an equity investment in the Partnership in exchange for the right to receive the benefit of the Annual Profit-Sharing Payment or Redemption Payments. Although the terms of the Partnership LPA require that Limited Partners contribute capital in the event of a capital call, no such capital call has occurred in the past, and none are expected in the future. In light of this history, the Partnership does not consider the Limited Partners to be substantively at risk for adverse changes in the net equity of the Partnership. The Partnership accounts for the Profit-Sharing Arrangement and recognizes corresponding compensation expense equal to (a) the Annual Profit-Sharing Payment; and (b) the vested portion of the Redemption Payments payable in accordance with the Partnership LPA when such future payments become probable and estimable. The compensation expense recorded related to these interests is recorded as limited partner profit-sharing expense on the consolidated statements of operations and comprehensive income, and the vested portion of Redemption Payments is accrued as accrued limited partner profit-sharing expense on the consolidated balance sheets. The partners' capital deficit is attributable to the expense recognition related to this Profit-Sharing Arrangement.
Judgment is required for purposes of estimating the Redemption Payments element of the Profit-Sharing Arrangement. For each Limited Partner, the Redemption Payment expense accrual for each fiscal year is calculated as the historical four year average of the Distributable Cash multiplied by the vesting ratio, which is calculated as the number of vested years divided by 15. The accrual amount is reduced by payments made to the participant. The current liability for Redemption Payments is equal to the amount payable over the next 12 months for Limited Partners that have previously retired or separated from the Partnership. Future actual payments may differ materially from current estimates. Future payment to the Limited Partners for the Annual Profit-Sharing Payments and future Redemption Payments is solely dependent upon the availability of Distributable Cash.
In connection with the contemplated Transaction, this Profit-Sharing Arrangement will be terminated. The Limited Partners will receive units of limited partnership in NYRT's Operating Partnership to settle any future amounts due for vested Redemption Payments.
NOTE 8—ASSET MANAGEMENT FEES AND FEE CREDITS
Each of the Funds pay a managing member fee ("Asset Management Fee") to the Fund's managing member ("Fund Managing Member Entity"). The Asset Management Fee is calculated quarterly on the basis of an annual rate ranging from 1.25 percent to 1.50 percent (0.104 percent to
F-16
JBG/OPERATING PARTNERS, L.P. AND SUBSIDIARIES
Notes to Consolidated Financial Statements (Unaudited) (Continued)
(dollar amounts in thousands)
NOTE 8—ASSET MANAGEMENT FEES AND FEE CREDITS (Continued)
0.125 percent per month) of the Fund's committed or invested member capital as defined in the Fund's organizational documents, determined and calculated as of the first day of each quarter, and payable monthly. At the election of the Fund Managing Member Entity, the Asset Management Fee is initially payable in the form of a credit amount representing a residual equity interest in the Fund up to certain defined monetary thresholds ("Asset Management Fee Credit"). Fee credits are presented as Asset Management Fee Credits in the consolidated statements of operations and comprehensive income. After achievement of the threshold, the remaining Asset Management Fee is payable in cash. The Fund Managing Member Entity may, at any time, make an irrevocable election to receive the Asset Management Fee in cash instead of in the form of an Asset Management Fee Credit. Fees paid in cash are presented as Asset Management Fees in the consolidated statements of operations and comprehensive income.
The Fund Managing Member Entity may delegate the provision of services, and may assign the corresponding fee, to an affiliate. The Fund Managing Member Entity has delegated responsibility for such services to the Partnership.
The Fund Managing Member Entity has granted the Asset Management Fee Credits to certain Partnership Limited Partners Partnership in exchange for services rendered to the Fund. The Partnership does not retain any portion of the Asset Management Fee Credits. These amounts are presented as asset management fee credit expense in the consolidated statements of operations and comprehensive income. Measurement of the revenue amount and corresponding expense is based on the fair value of the services rendered as this amount is more readily determinable than the fair value of the residual equity interest in the Fund. The fair value of the services rendered is equal to the amount of cash that would have been received had the Fund Managing Member Entities elected to receive a cash payment instead of the fee credit.
In connection with the Transaction, it is expected that the asset management agreements will be amended. The amendments are expected to include the removal of the ability to elect a Fee Credit in lieu of a cash payment for the asset management fee, among other changes.
The Partnership does not have a direct ownership interest or any other interests in the Fund Managing Member Entities.
NOTE 9—COMMITMENTS
The Partnership's general partner leases office space from a related party under a non-cancelable operating lease expiring in 2022. Because the general partner has no other operations or activities other than its interest in the Partnership, and the Partnership reimburses the general partner for all amounts due under the lease agreement, the rental obligation and related amounts are presented and disclosed in the Partnership's consolidated financial statements.
The lease contains a renewal option for two additional five-year periods. The Partnership recognizes lease expense on a straight-line basis over the non-cancelable term of the lease. The Partnership reports the liability associated with the lease as deferred rent liability on the accompanying consolidated balance sheet. As of March 31, 2016, the deferred rent liability related to this lease was $3,325.
F-17
JBG/OPERATING PARTNERS, L.P. AND SUBSIDIARIES
Notes to Consolidated Financial Statements (Unaudited) (Continued)
(dollar amounts in thousands)
NOTE 9—COMMITMENTS (Continued)
Future minimum rental payments due under the lease are as follows:
| | | | |
Nine months ending December 31, 2016 | | $ | 2,845 | |
2017 | | | 3,889 | |
2018 | | | 3,991 | |
2019 | | | 4,096 | |
2020 | | | 4,203 | |
Thereafter | | | 7,627 | |
| | | | | |
| | $ | 26,651 | |
| | | | | |
| | | | | |
| | | | | |
For the three months ended March 31, 2016 and 2015 lease expense totaled $897 and $897, respectively, and is included in general and administrative expense on the accompanying consolidated statements of operations and comprehensive income.
A portion of the leased space was subleased to JBGR; this sublease was terminated upon the acquisition of the remaining interest in JBGR in January 2016.
For the three months ended March 31, 2015, rental income under this sublease totaled $124 and is reported as other revenue on the accompanying consolidated statements of operations and comprehensive income.
NOTE 10—BUSINESS AND CREDIT CONCENTRATIONS
Substantially all revenues of the Partnership are derived from performing services for the affiliated Contributing Entities and Property LLCs.
The Partnership maintains cash and cash equivalents at insured financial institutions. The combined account balances at each institution periodically exceed FDIC insurance coverage, and, as a result, there is a concentration of credit risk related to amounts in excess of FDIC insurance coverage. The Partnership believes that the risk is not significant.
NOTE 11—EMPLOYEE RETIREMENT SAVINGS PLAN
The Partnership's general partner maintains a multiple employer retirement savings plan pursuant to Section 401(k) of the Internal Revenue Code whereby employees may contribute a portion of their compensation to their respective retirement accounts, in an amount not to exceed the maximum allowed under the Internal Revenue Code. The Partnership provides a discretionary matching contribution, which totaled $393 and $234, for the three months ended March 31, 2016 and 2015, respectively, and is included in salary and benefits—reimbursement to general partner on the accompanying consolidated statements of operations and comprehensive income. The Partnership may also provide a discretionary profit-sharing contribution under the plan. No discretionary profit-sharing contributions were made during the three months ended March 31, 2016 and 2015.
F-18
JBG/OPERATING PARTNERS, L.P. AND SUBSIDIARIES
Notes to Consolidated Financial Statements (Unaudited) (Continued)
(dollar amounts in thousands)
NOTE 12—RELATED PARTY TRANSACTIONS
The Partnership provides a wide range of services to affiliated entities, including asset management, property management, leasing, tenant improvement construction, acquisition, repositioning, development, redevelopment, accounting, and financing services. The rates for these services have been agreed upon in advance and are included in the related agreements. For the three months ended March 31, 2016 and 2015 revenues of $21,858 and $25,334, respectively, were earned from affiliated entities.
As of March 31, 2016, the Partnership had accounts receivable balances totaling $7,953 from affiliated entities.
During the three months ended March 31, 2016, the Partnership incurred certain professional fees associated with potential strategic options. The Partnership will be reimbursed for a portion of these fees by the Funds and other affiliates. The amount reimbursed by each affiliate is based on the relative value each entity will contribute to the Operating Partnership as a percentage of the total value contributed. During the three months ended March 31, 2016, the Partnership incurred $2,113 of professional fees, of which $323 was expensed by the Partnership based on its value allocation percentage and is included in general and administrative expense on the accompanying consolidated statements of operations and comprehensive income, and $1,789 is included in due from affiliates on the accompanying consolidated balance sheet. As of March 31, 2016, the total amount of professional fees expected to be reimbursed by affiliates was $2,759 and is included in due from affiliates on the accompanying consolidated balance sheet.
NOTE 13—SUBSEQUENT EVENTS
The Partnership evaluated subsequent events through May 25, 2016, the date the consolidated financial statements were available to be issued.
F-19
JBG/OPERATING PARTNERS, L.P. AND SUBSIDIARIES
Chevy Chase, Maryland
CONSOLIDATED FINANCIAL STATEMENTS
Including Report of Independent Auditors
December 31, 2015, 2014, and 2013
F-20
Independent Auditors' Report
The Members
JBG/Operating Partners, L.P.:
We have audited the accompanying consolidated balance sheets of JBG/Operating Partners, L.P. and subsidiaries as of December 31, 2015, 2014, and 2013, and the related consolidated statements of operations and comprehensive income (loss), changes in partners' deficit, and cash flows for each of the years in the three-year period ended December 31, 2015. These consolidated financial statements are the responsibility of the Company's management. Our responsibility is to express an opinion on these consolidated financial statements based on our audits.
Management's Responsibility for the Consolidated Financial Statements
Management is responsible for the preparation and fair presentation of these consolidated financial statements in accordance with U.S. generally accepted accounting principles; this includes the design, implementation, and maintenance of internal control relevant to the preparation and fair presentation of consolidated financial statements that are free from material misstatement, whether due to fraud or error.
Auditors' Responsibility
Our responsibility is to express an opinion on these consolidated financial statements based on our audits. We conducted our audits in accordance with auditing standards generally accepted in the United States of America. Those standards require that we plan and perform the audits to obtain reasonable assurance about whether the financial statements are free from material misstatement.
An audit involves performing procedures to obtain audit evidence about the amounts and disclosures in the financial statements. The procedures selected depend on the auditors' judgment, including the assessment of the risks of material misstatement of the financial statements, whether due to fraud or error. In making those risk assessments, the auditor considers internal control relevant to the entity's preparation and fair presentation of the financial statements in order to design audit procedures that are appropriate in the circumstances, but not for the purpose of expressing an opinion on the effectiveness of the entity's internal control. Accordingly, we express no such opinion. An audit also includes evaluating the appropriateness of accounting policies used and the reasonableness of significant accounting estimates made by management, as well as evaluating the overall presentation of the financial statements.
We believe that the audit evidence we have obtained is sufficient and appropriate to provide a basis for our audit opinion.
Opinion
In our opinion, the consolidated financial statements referred to above present fairly, in all material respects, the financial position of JBG/Operating Partners, L.P. and subsidiaries as of December 31, 2015, 2014, and 2013, and the results of their operations and their cash flows for each of the years in the three-year period ended December 31, 2015, in conformity with U.S. generally accepted accounting principles.
/s/ KPMG LLP
McLean, Virginia
May 25, 2016
F-21
JBG/OPERATING PARTNERS, L.P. AND SUBSIDIARIES
Consolidated Balance Sheets
As of December 31, 2015, 2014, and 2013
(dollar amounts in thousands)
| | | | | | | | | | |
| | December 31, | |
|---|
| | 2015 | | 2014 | | 2013 | |
|---|
Assets | | | | | | | | | | |
Current assets | | |
| | |
| | |
| |
Cash and cash equivalents | | $ | 8,623 | | $ | 7,240 | | $ | 5,366 | |
Accounts receivable | | | 8,394 | | | 6,771 | | | 7,153 | |
Prepaid expenses and other current assets | | | 1,098 | | | 971 | | | 881 | |
Due from affiliates | | | 969 | | | 18 | | | 3 | |
| | | | | | | | | | | |
Total current assets | | | 19,084 | | | 15,000 | | | 13,403 | |
Investment in affiliates | | | 216 | | | 223 | | | 545 | |
Property and equipment, net | | | 7,159 | | | 8,309 | | | 9,331 | |
| | | | | | | | | | | |
Total Assets | | $ | 26,459 | | $ | 23,532 | | $ | 23,279 | |
| | | | | | | | | | | |
| | | | | | | | | | | |
| | | | | | | | | | | |
Liabilities and Partners' Deficit | | | | | | | | | | |
Current liabilities | | | | | | | | | | |
Accounts payable | | $ | 325 | | $ | 429 | | $ | 51 | |
Accrued expenses | | | 17,873 | | | 15,588 | | | 15,121 | |
Accrued limited partner profit-sharing expense, current | | | 8,024 | | | 4,400 | | | 3,957 | |
Deferred rent, current | | | 200 | | | 113 | | | 61 | |
Due to affiliate | | | 174 | | | 192 | | | — | |
| | | | | | | | | | | |
Total current liabilities | | | 26,596 | | | 20,722 | | | 19,190 | |
Accrued limited partner profit-sharing expense, net of current portion | | | 120,440 | | | 123,762 | | | 121,645 | |
Deferred rent, net of current portion | | | 3,172 | | | 3,362 | | | 3,422 | |
| | | | | | | | | | | |
Total Liabilities | | | 150,208 | | | 147,846 | | | 144,257 | |
| | | | | | | | | | | |
Total Partners' Deficit | | | (123,749 | ) | | (124,314 | ) | | (120,978 | ) |
| | | | | | | | | | | |
Total Liabilities and Partners' Deficit | | $ | 26,459 | | $ | 23,532 | | $ | 23,279 | |
| | | | | | | | | | | |
| | | | | | | | | | | |
| | | | | | | | | | | |
See accompanying notes to the consolidated financial statements.
F-22
JBG/OPERATING PARTNERS, L.P. AND SUBSIDIARIES
Consolidated Statements of Operations and Comprehensive Income (Loss)
For the Years Ended December 31, 2015, 2014, and 2013
(dollar amounts in thousands)
| | | | | | | | | | |
| | For the year ended December 31, | |
|---|
| | 2015 | | 2014 | | 2013 | |
|---|
Revenues | | | | | | | | | | |
Asset management fees | | $ | 35,908 | | $ | 42,733 | | $ | 42,652 | |
Asset management fee credits | | | 10,200 | | | 7,043 | | | 5,374 | |
Development and construction management fees | | | 33,795 | | | 32,573 | | | 32,408 | |
Property management fees | | | 16,648 | | | 15,731 | | | 15,263 | |
Leasing fees | | | 2,312 | | | 5,678 | | | 2,554 | |
Other revenue | | | 4,838 | | | 3,487 | | | 2,124 | |
| | | | | | | | | | | |
Total revenues | | | 103,701 | | | 107,245 | | | 100,375 | |
Operating Expenses | | | | | | | | | | |
Salary and benefits—reimbursement to general partner | | | 48,759 | | | 47,546 | | | 45,368 | |
Limited partner profit-sharing expense | | | 30,333 | | | 43,250 | | | 52,118 | |
Asset management fee credit expense | | | 10,200 | | | 7,043 | | | 5,374 | |
General and administrative | | | 12,736 | | | 10,996 | | | 10,251 | |
Depreciation and amortization | | | 1,562 | | | 1,791 | | | 2,059 | |
| | | | | | | | | | | |
Total operating expenses | | | 103,590 | | | 110,626 | | | 115,170 | |
| | | | | | | | | | | |
Operating Income (Loss) | | | 111 | | | (3,381 | ) | | (14,795 | ) |
Income from Investments in Affiliates | | | 863 | | | 649 | | | 324 | |
Other Income (Expenses), Net | | | | | | | | | | |
Interest income | | | — | | | 6 | | | 2 | |
Interest expense | | | (78 | ) | | (49 | ) | | (65 | ) |
| | | | | | | | | | | |
Total other expenses, net | | | (78 | ) | | (43 | ) | | (63 | ) |
| | | | | | | | | | | |
Income (Loss) Before Income Taxes | | | 896 | | | (2,775 | ) | | (14,534 | ) |
Income Taxes | | | (331 | ) | | (561 | ) | | (842 | ) |
| | | | | | | | | | | |
Net Income (Loss) | | | 565 | | | (3,336 | ) | | (15,376 | ) |
Other comprehensive income (loss) | | | — | | | — | | | — | |
| | | | | | | | | | | |
Comprehensive Income (Loss) | | $ | 565 | | $ | (3,336 | ) | $ | (15,376 | ) |
| | | | | | | | | | | |
| | | | | | | | | | | |
| | | | | | | | | | | |
See accompanying notes to the consolidated financial statements.
F-23
JBG/OPERATING PARTNERS, L.P. AND SUBSIDIARIES
Consolidated Statement of Changes in Partners' Deficit
For the Years Ended December 31, 2015, 2014, and 2013
(dollar amounts in thousands)
| | | | |
Balance, January 1, 2013 | | $ | (106,352 | ) |
Net loss | | | (15,376 | ) |
Contributions from General Partner | | | 750 | |
| | | | | |
Balance, December 31, 2013 | | | (120,978 | ) |
Net loss | | | (3,336 | ) |
| | | | | |
Balance, December 31, 2014 | | | (124,314 | ) |
Net income | | | 565 | |
| | | | | |
Balance, December 31, 2015 | | $ | (123,749 | ) |
| | | | | |
| | | | | |
| | | | | |
See accompanying notes to the consolidated financial statements.
F-24
JBG/OPERATING PARTNERS, L.P. AND SUBSIDIARIES
Consolidated Statements of Cash Flows
For the Years Ended December 31, 2015, 2014, and 2013
(dollar amounts in thousands)
| | | | | | | | | | |
| | For the year ended December 31, | |
|---|
| | 2015 | | 2014 | | 2013 | |
|---|
Cash Flows from Operating Activities | | | | | | | | | | |
Net income (loss) | | $ | 565 | | $ | (3,336 | ) | $ | (15,376 | ) |
Reconciliation adjustments | | | | | | | | | | |
Depreciation and amortization | | | 1,562 | | | 1,791 | | | 2,059 | |
Other adjustments | | | (205 | ) | | 46 | | | 70 | |
Income from investment in affiliates | | | (863 | ) | | (649 | ) | | (324 | ) |
Distributions from affiliates | | | 870 | | | 973 | | | 474 | |
Changes in: | | | | | | | | | | |
Accounts receivable | | | (1,623 | ) | | 382 | | | 1,257 | |
Prepaid expenses and other current assets | | | 93 | | | (207 | ) | | (70 | ) |
Accounts payable | | | (104 | ) | | 378 | | | (21 | ) |
Accrued expenses | | | 2,285 | | | 522 | | | 1,257 | |
Accrued limited partner profit-sharing expense | | | 302 | | | 2,560 | | | 5,469 | |
Due from affiliate, net | | | (969 | ) | | 177 | | | 314 | |
Deferred rent | | | (103 | ) | | (8 | ) | | 97 | |
| | | | | | | | | | | |
Net cash provided by (used in) operating activities | | | 1,810 | | | 2,629 | | | (4,794 | ) |
Cash Flows from Investing Activities | | | | | | | | | | |
Contributions to affiliates | | | — | | | (2 | ) | | (3 | ) |
Payments received on notes receivable | | | — | | | — | | | 185 | |
Acquisition of property and equipment | | | (367 | ) | | (723 | ) | | (818 | ) |
| | | | | | | | | | | |
Net cash used in investing activities | | | (367 | ) | | (725 | ) | | (636 | ) |
Cash Flows from Financing Activities | | | | | | | | | | |
Line of credit advances | | | 4,000 | | | — | | | — | |
Line of credit repayments | | | (4,000 | ) | | — | | | — | |
Loan costs | | | (60 | ) | | (30 | ) | | (60 | ) |
| | | | | | | | | | | |
Net cash used in financing activities | | | (60 | ) | | (30 | ) | | (60 | ) |
| | | | | | | | | | | |
Net Increase (Decrease) in Cash and Cash Equivalents | | | 1,383 | | | 1,874 | | | (5,490 | ) |
Cash and Cash Equivalents, beginning of year | | | 7,240 | | | 5,366 | | | 10,856 | |
| | | | | | | | | | | |
Cash and Cash Equivalents, end of year | | $ | 8,623 | | $ | 7,240 | | $ | 5,366 | |
| | | | | | | | | | | |
| | | | | | | | | | | |
| | | | | | | | | | | |
Supplemental Disclosure of Cash Flow Information | | | | | | | | | | |
Interest paid | | $ | 33 | | $ | — | | $ | — | |
| | | | | | | | | | | |
| | | | | | | | | | | |
| | | | | | | | | | | |
Taxes paid | | $ | 570 | | $ | 866 | | $ | 973 | |
| | | | | | | | | | | |
| | | | | | | | | | | |
| | | | | | | | | | | |
Supplemental Disclosure of Non-Cash Activity | | | | | | | | | | |
Change in due from affiliate related to non-cash contributions from general partner | | $ | — | | $ | — | | $ | 750 | |
| | | | | | | | | | | |
| | | | | | | | | | | |
| | | | | | | | | | | |
See accompanying notes to the consolidated financial statements.
F-25
JBG/OPERATING PARTNERS, L.P. AND SUBSIDIARIES
Notes to Consolidated Financial Statements
(dollar amounts in thousands)
NOTE 1—ORGANIZATION
JBG/Operating Partners, L.P. and subsidiaries (the "Partnership") was converted from a limited liability company to a limited partnership on December 13, 2011, under the laws of the State of Delaware and will continue in perpetuity, unless earlier terminated or dissolved pursuant to the limited partnership agreement or by operation of law.
The Partnership is a fee-based real estate services company that is owned by a group of investors, including a general partner and twenty-one limited partners (the "Limited Partners"). The Limited Partners, and all other personnel providing services to and on behalf of the Partnership, are employees of the Partnership's general partner. The Partnership reimburses its general partner for all salary, benefits, and related costs under a cost reimbursement arrangement.
The Partnership operates in the Washington, DC, metropolitan area and earns fees in connection with investment, development, asset and property management, leasing, construction management, tenant improvement construction and finance services provided to commercial office properties, multifamily (both rental and for-sale), retail and hotels. Substantially all fee revenue earned by the Partnership is from services provided for the real estate assets owned by affiliated real estate investment funds (the "Funds") and other real estate investment vehicles (collectively, the "Contributing Entities"). The Contributing Entities own interests in real estate assets through separate limited liability companies ("Property LLCs"). The Partnership, Contributing Entities and Property LLCs are not under common control or ownership.
On May 25, 2016, the Partnership entered into a Master Combination Agreement (the "Combination Agreement") with New York REIT, Inc. ("NYRT") and New York Recovery Operating Partnership, L.P., a Delaware limited partnership and NYRT's subsidiary operating partnership (the "Operating Partnership"), pursuant to which the Partnership and the Contributing Entities' interests in certain Property LLCs will be contributed through a series of formation transactions to the Operating Partnership, in exchange for the right to receive units of limited partnership interest in the Operating Partnership or shares of common stock of NYRT or, in certain limited circumstances, cash (the "Transaction"). NYRT is the general partner of the Operating Partnership and is a publicly-traded Maryland corporation that operates as a real estate investment trust for U.S. federal tax purposes. The Operating Partnership will acquire ownership interests in certain of the Property LLCs owned by the Contributing Entities. The Contributing Entities are otherwise not parties to the formation transactions and the substantial majority of them will continue to exist independent of the Transaction. It is expected that the Partnership will merge with and into the Operating Partnership and continue providing management and other services to, and on behalf of, certain of the Contributing Entities and the Property LLCs owned by the Contributing Entities that were not contributed in the Transaction.
The Partnership has one reporting segment—real estate services.
NOTE 2—SUMMARY OF SIGNIFICANT ACCOUNTING POLICIES
Use of Estimates—The preparation of consolidated financial statements in conformity with accounting principles generally accepted in the United States of America ("U.S. GAAP") requires management to make estimates and assumptions that affect the reported amounts of assets, liabilities, revenues and expenses, and the disclosure of contingent assets and liabilities. Actual results may differ from these estimates.
F-26
JBG/OPERATING PARTNERS, L.P. AND SUBSIDIARIES
Notes to Consolidated Financial Statements (Continued)
(dollar amounts in thousands)
NOTE 2—SUMMARY OF SIGNIFICANT ACCOUNTING POLICIES (Continued)
Principles of Consolidation—The consolidated financial statements include the accounts of the Partnership and its wholly-owned and majority-owned subsidiaries. All significant intercompany accounts and transactions have been eliminated. The Partnership has adopted the Financial Accounting Standards Board's ("FASB") Accounting Standards Updated ("ASU") No. 2015-02,Amendment to the Consolidation Analysis, which improves targeted areas of the consolidation guidance and reduces the number of consolidation models for all periods presented.
The Partnership does not have significant involvement and is not the primary beneficiary of any variable interest entities.
When the requirements for consolidation are not met, but the Partnership has significant influence over the operations of an investee, the Partnership accounts for its partially owned entities under the equity method. The Partnership's judgement with respect to its level of influence of an entity involves the consideration of various factors, including voting rights, forms of its ownership interest, representation in the entity's governance, the size of its investment (including loans), its ability to participate in policy making decisions and rights of the other investors to participate in the decision making process and to replace the Partnership as managing member and/or liquidate the venture, if applicable. The assessment of the Partnership's influence over an entity affects the presentation of these investments in the accompanying consolidated financial statements.
Equity method investments are initially recorded at cost and subsequently adjusted for the Partnership's share of net income or loss and cash contributions and distributions each period. See Note 4.
Cash and Cash Equivalents—For purposes of the accompanying consolidated balance sheets and consolidated statements of cash flows, the Partnership considers short-term investments with remaining maturities of three months or less when purchased to be cash equivalents.
Accounts Receivable—Accounts receivable are stated at net realizable value. Management considers the following factors when determining the collectability of specific customer accounts: customer credit worthiness, past transaction history with the customer, current economic industry trends, and changes in customer payment terms. Past due balances over 90 days and other higher risk amounts are reviewed individually for collectability. Based on management's assessments, an allowance for doubtful accounts was not deemed necessary as of December 31, 2015, 2014, and 2013.
Property and Equipment—Furniture, fixtures, and equipment are recorded at cost and are depreciated using the straight-line method over their estimated useful lives. Leasehold improvements are costs incurred to prepare the Partnership's corporate office space for occupancy and are depreciated on a straight-line basis over the shorter of the estimated useful lives of the improvements or the terms of the respective leases. The following are the estimated useful lives used for depreciation purposes:
| | |
Assets | | Depreciation
Period |
|---|
Furniture, fixtures, and equipment | | 3 - 5 years |
Leasehold improvements | | 8 - 15 years |
F-27
JBG/OPERATING PARTNERS, L.P. AND SUBSIDIARIES
Notes to Consolidated Financial Statements (Continued)
(dollar amounts in thousands)
NOTE 2—SUMMARY OF SIGNIFICANT ACCOUNTING POLICIES (Continued)
Expenditures for ordinary maintenance and repairs are expensed to operations as incurred. Significant renovations and improvements that improve or extend the useful life of the asset are capitalized. Depreciation and amortization expense for the years ended December 31, 2015, 2014, and 2013 were $1,517, $1,745, and $2,013, respectively.
Revenue Recognition—The Partnership's revenue streams are received for providing various real estate management and advisory services, including:
- •
- Asset management services provided to the Contributing Entities, as delegated by the managing member or equivalent of each of the Contributing Entities, for executing strategies to maximize real estate values, managing/supervising asset performance, and providing related reporting and other services to the Fund investors. Asset management fees are recognized as services are provided. See also Note 7.
- •
- Development and construction management fees are received for such services rendered at agreed upon hourly rates or charges. Revenue is recognized as services are provided.
- •
- Property management services, include on-site oversight and maintenance, lease management, accounting, and other property related services. Property management fees are calculated as a percentage of rental revenue and are recognized as services are provided.
- •
- Leasing commissions include successful efforts commissions received when a lease is executed. Leasing commissions are recognized when earned.
Income Taxes—JBG/Operating Partners, L.P. is a limited partnership and certain subsidiaries of JBG/Operating Partners, L.P. are limited liability companies. Limited partnerships and limited liability companies are not subject to federal income taxes, although they may be subject to state income taxes in certain instances. The Partnership and the limited liabilities companies record no provision or benefit for federal income taxes because taxable income or loss passes through to and is reported by the partners and members on their respective income tax returns. Prior to June 15, 2013, one of the Partnership's subsidiaries had elected to be taxed as a C Corporation. On June 15, 2013, the subsidiary rescinded its election to be taxed as a C Corporation. The federal and state income tax expense, and any corresponding deferred tax amount, related to this subsidiary for the year ended December 31, 2013 was immaterial to the consolidated financial statements.
Deferred income taxes are provided for temporary differences in the reported costs of assets and liabilities and their tax bases, and are calculated due to the requirement of certain of the Partnership's subsidiaries to pay unincorporated business franchise tax in Washington, DC ("DC Franchise Tax"). DC Franchise Tax is an income-based tax and accounted for under the Financial Accounting Standards Board ("FASB") Accounting Standards Codification Topic 740,Income Taxes.
The tax effects from an uncertain tax position can be recognized in the financial statements only if the position is more likely than not to be sustained on audit, based on the technical merits of the position. The Partnership recognizes the financial statement benefit of a tax position only after determining that the relevant tax authority would more likely than not sustain the position following an audit. For tax positions meeting the more likely than not threshold, the amount recognized in the financial statements is the largest benefit that has a greater than 50 percent likelihood of being realized
F-28
JBG/OPERATING PARTNERS, L.P. AND SUBSIDIARIES
Notes to Consolidated Financial Statements (Continued)
(dollar amounts in thousands)
NOTE 2—SUMMARY OF SIGNIFICANT ACCOUNTING POLICIES (Continued)
upon ultimate settlement with the relevant tax authority. The Partnership applied the accounting standard to all tax positions for which the statute of limitations remained open. As a result of this review, the Partnership did not identify any material uncertain tax positions.
The Partnership recognizes interest and penalties related to unrecognized tax benefits in income tax expense. For the years ended December 31, 2015, 2014, and 2013, the Partnership has not recognized any interest or penalties in the consolidated statements of operations and comprehensive income (loss). The Partnership is no longer subject to U.S. federal, state, or local income tax examinations by tax authorities for the years before 2012. The Partnership is not currently under examination by any taxing jurisdiction.
The Partnership's DC Franchise Tax for the years ended December 31, 2015, 2014, and 2013, totaled $331, $561, and $842, respectively, and is included in income tax expense on the consolidated statements of operations and comprehensive income (loss).
Recently Issued Accounting Standards—On May 28, 2014, the FASB issued ASU No. 2014-09,Revenue from Contracts with Customers, which requires an entity to recognize the amount of revenue to which it expects to be entitled for the transfer of promised goods or services to customers. ASU 2014-09 will replace most existing revenue recognition guidance in U.S. GAAP when it becomes effective. The new standard is effective for annual and interim periods in fiscal years beginning after December 15, 2017, with early adoption permitted for annual and interim periods in fiscal years beginning after December 15, 2016. The new standard permits the use of either the retrospective or cumulative effect transition method. The Partnership has not yet selected a date of adoption or a transition method. Similarly, the Partnership is currently evaluating the effect the standard will have on its consolidated financial statements.
In April 2015, the FASB issued ASU No. 2015-03,Interest—Imputation of Interest, which simplifies the presentation of debt issuance costs. The amendments in the ASU are effective for annual and interim periods in fiscal years beginning after December 15, 2015, with early adoption permitted. The Partnership does not believe implementation of the amendments will have a material effect on its consolidated financial statements.
In September 2015, the FASB issued ASU No. 2015-16,Simplifying the Accounting for Measurement-Period Adjustments, which eliminates the requirement to retrospectively account for adjustments made to provisional amounts recognized in a business combination. The amendments in the ASU are effective for annual and interim period in fiscal years beginning after December 15, 2015. The Partnership does not believe implementation of the amendments will have a material effect on its consolidated financial statements.
In February 2016, the FASB issued ASU No. 2016-02,Leases. The new standard establishes a right-of-use ("ROU") model that requires a lessee to record a ROU asset and a lease liability on the balance sheet for all leases with terms longer than 12 months. Leases will be classified as either finance or operating, with classification affecting the pattern of expense recognition in the income statement. The new standard is effective for fiscal years beginning after December 15, 2018, including interim periods within those fiscal years. A modified retrospective transition approach is required for lessees for capital and operating leases existing at, or entered into after, the beginning of the earliest comparative period presented in the financial statements, with certain practical expedients available.
F-29
JBG/OPERATING PARTNERS, L.P. AND SUBSIDIARIES
Notes to Consolidated Financial Statements (Continued)
(dollar amounts in thousands)
NOTE 2—SUMMARY OF SIGNIFICANT ACCOUNTING POLICIES (Continued)
The Partnership is currently evaluating the effect the standard will have on its consolidated financial statements.
NOTE 3—PROPERTY AND EQUIPMENT
The following table sets forth the details of property and equipment:
| | | | | | | | | | |
| | For the year ended December 31, | |
|---|
| | 2015 | | 2014 | | 2013 | |
|---|
Furniture, fixtures, and equipment | | $ | 8,652 | | $ | 8,285 | | $ | 7,669 | |
Leasehold improvements | | | 7,689 | | | 7,689 | | | 7,582 | |
| | | | | | | | | | | |
| | | 16,341 | | | 15,974 | | | 15,251 | |
Less accumulated depreciation and amortization | | | (9,182 | ) | | (7,665 | ) | | (5,920 | ) |
| | | | | | | | | | | |
Property and equipment, net | | $ | 7,159 | | $ | 8,309 | | $ | 9,331 | |
| | | | | | | | | | | |
| | | | | | | | | | | |
| | | | | | | | | | | |
NOTE 4—INVESTMENT IN AFFILIATES
The Partnership applies the equity method of accounting for investments in JBG/Rosenfeld Retail Properties, LLC ("JBGR") and Hotco, LLC ("Hotco"). As of December 31, 2015, the Partnership owned a 33.3 percent interest in JBGR. In January 2016, the Partnership acquired the remaining the 66.7 percent interest in JBGR that it did not previously own for $4,668 in cash. Additional contingent consideration of up to $2,250 may be payable to the sellers under certain circumstances if the Transaction is completed. Under the limited liability agreements of these affiliates, the Partnership is not obligated to fund operating losses or other obligations of JBGR or Hotco.
The Partnership periodically evaluates the carrying value of its equity method investments for impairment when the estimated fair value is less than the carrying value. The Partnership records a charge to reduce carrying value to estimated fair value when impairment is deemed other than temporary. No impairment was recorded for the years ended December 31, 2015, 2014, and 2013.
The following information summarizes the aggregate financial position and results of these investments as of and for the year ended December 31, 2015:
| | | | | | | |
| | JBG/Rosenfeld
Retail Properties, LLC | | Hotco, LLC | |
|---|
Assets | | $ | 1,763 | | $ | 889 | |
| | | | | | | | |
| | | | | | | | |
| | | | | | | | |
Liabilities | | $ | 2,246 | | $ | 122 | |
(Deficit) Equity | | | (483 | ) | | 767 | |
| | | | | | | | |
Total Liabilities and Equity | | $ | 1,763 | | $ | 889 | |
| | | | | | | | |
| | | | | | | | |
| | | | | | | | |
Partnership's Investment in Affiliate | | $ | — | | $ | 191 | |
| | | | | | | | |
| | | | | | | | |
| | | | | | | | |
Net (Loss) Income | | $ | (195 | ) | $ | 3,465 | |
| | | | | | | | |
| | | | | | | | |
| | | | | | | | |
Partnership's Ownership Percentage | | | 33.3 | % | | 24.9 | % |
| | | | | | | | |
| | | | | | | | |
| | | | | | | | |
F-30
JBG/OPERATING PARTNERS, L.P. AND SUBSIDIARIES
Notes to Consolidated Financial Statements (Continued)
(dollar amounts in thousands)
NOTE 4—INVESTMENT IN AFFILIATES (Continued)
The following information summarizes the aggregate financial position and results of these investments as of and for the year ended December 31, 2014:
| | | | | | | |
| | JBG/Rosenfeld
Retail Properties, LLC | | Hotco, LLC | |
|---|
Assets | | $ | 1,017 | | $ | 968 | |
| | | | | | | | |
| | | | | | | | |
| | | | | | | | |
Liabilities | | $ | 1,305 | | $ | 175 | |
(Deficit) Equity | | | (288 | ) | | 793 | |
| | | | | | | | |
Total Liabilities and Equity | | $ | 1,017 | | $ | 968 | |
| | | | | | | | |
| | | | | | | | |
| | | | | | | | |
Partnership's Investment in Affiliate | | $ | — | | $ | 197 | |
| | | | | | | | |
| | | | | | | | |
| | | | | | | | |
Net (Loss) Income | | $ | (1,487 | ) | $ | 3,162 | |
| | | | | | | | |
| | | | | | | | |
| | | | | | | | |
Partnership's Ownership Percentage | | | 33.3 | % | | 24.9 | % |
| | | | | | | | |
| | | | | | | | |
| | | | | | | | |
The following information summarizes the aggregate financial position and results of these investments as of and for the year ended December 31, 2013:
| | | | | | | |
| | JBG/Rosenfeld
Retail Properties, LLC | | Hotco, LLC | |
|---|
Assets | | $ | 4,133 | | $ | 804 | |
| | | | | | | | |
| | | | | | | | |
| | | | | | | | |
Liabilities | | $ | 3,075 | | $ | 91 | |
Equity | | | 1,058 | | | 713 | |
| | | | | | | | |
Total Liabilities and Equity | | $ | 4,133 | | $ | 804 | |
| | | | | | | | |
| | | | | | | | |
| | | | | | | | |
Partnership's Investment in Affiliate | | $ | 330 | | $ | 178 | |
| | | | | | | | |
| | | | | | | | |
| | | | | | | | |
Net (Loss) Income | | $ | (665 | ) | $ | 2,098 | |
| | | | | | | | |
| | | | | | | | |
| | | | | | | | |
Partnership's Ownership Percentage | | | 33.3 | % | | 24.9 | % |
| | | | | | | | |
| | | | | | | | |
| | | | | | | | |
In addition to the equity method investments, the Partnership has several immaterial investments accounted for under the cost method.
Prior to the consummation of the Transaction, the Partnership intends on distributing its interest in Hotco to the Limited Partners and the Partnership's general partner. The general partner will, in turn, distribute the interest received to its owners.
NOTE 5—LINES OF CREDIT
The Partnership maintains a line of credit that had a maximum amount available of $8,000, $4,000, and $7,000 as of December 31, 2015, 2014, and 2013, respectively, which matures on September 30, 2016. The Partnership maintains a second line of credit with a maximum amount available of $8,000, $4,000, and $10,000 as of December 31, 2015, 2014, and 2013, respectively, which matures on June 30, 2016. Advances on the two lines of credit bear interest at a fluctuating rate equal to the Adjusted London Interbank Offered Rate ("LIBOR") plus 3.00 percent. As of December 31,
F-31
JBG/OPERATING PARTNERS, L.P. AND SUBSIDIARIES
Notes to Consolidated Financial Statements (Continued)
(dollar amounts in thousands)
NOTE 5—LINES OF CREDIT (Continued)
2015, 2014, and 2013, there were no amounts outstanding on the lines of credit and the effective interest rate was 3.36 percent, 3.16 percent, and 3.17 percent, respectively. The Partnership incurred interest expense of $33 for the year ended December 31, 2015, related to the lines of credit. No interest expense was incurred on the lines of credit for the years ended December 31, 2014 and 2013.
In connection with the Partnership obtaining the second line of credit, certain of the Limited Partners entered into a Repayment Guaranty Agreement (the "Guaranty"). Under the Guaranty, these Limited Partners agreed to guarantee timely payment due to the lender through the maturity date, including reasonable attorney fees and expenses. The terms of the Guaranty require partners to comply with certain financial covenants, including maintaining a collective minimum liquidity of $8,000, $4,000, and $7,000 as of December 31, 2015, 2014, and 2013, respectively. As of December 31, 2015, 2014, and 2013, the partners were in compliance with the collective minimum liquidity requirement.
NOTE 6—LIMITED PARTNER PROFIT-SHARING EXPENSE
The Limited Partners serve in the capacity as employees in an employment arrangement, delivering real estate services for the benefit of the Partnership. The Limited Partners receive salary and other benefits in that capacity from the Partnership's general partner. The Partnership reimburses its general partner for these costs. In addition, and pursuant to the Limited Partnership Agreement, as amended (the "Partnership LPA"), the Limited Partners are entitled to receive a share of the Partnership's annual distributable cash, as defined in the Partnership LPA ("Distributable Cash"), subject to continued employment. The payment of this Distributable Cash is referred to as an "Annual Profit-Sharing Payment."
In addition to the Annual Profit-Sharing Payment, under the Partnership LPA, the Limited Partners are eligible to receive an annual profit-sharing payment equal to the Limited Partner's share of Distributable Cash for each year in the five-year period following conclusion of such Limited Partner's employment with the Partnership ("Redemption Payments"). Pursuant to the Partnership LPA, Redemption Payments vest ratably over a fifteen year period during the Limited Partner's continued employment. The Annual Profit-Sharing Payment and the Redemption Payments are collectively referred to as the "Profit-Sharing Arrangement."
The Limited Partners were not obligated to make an equity investment in the Partnership in exchange for the right to receive the benefit of the Annual Profit-Sharing Payment or Redemption Payments. Although the terms of the Partnership LPA require that Limited Partners contribute capital in the event of a capital call, no such capital call has occurred in the past, and none are expected in the future. In light of this history, the Partnership does not consider the Limited Partners to be substantively at risk for adverse changes in the net equity of the Partnership. The Partnership accounts for the Profit-Sharing Arrangement and recognizes corresponding compensation expense equal to (a) the Annual Profit-Sharing Payment; and (b) the vested portion of the Redemption Payments payable in accordance with the Partnership LPA when such future payments become probable and estimable. The compensation expense recorded related to these interests is recorded as limited partner profit-sharing expense on the consolidated statements of operations and comprehensive income (loss), and the vested portion of Redemption Payments is accrued as accrued limited partner profit-sharing expense on the consolidated balance sheets. The partners' capital deficit is attributable to the expense recognition related to this Profit-Sharing Arrangement.
F-32
JBG/OPERATING PARTNERS, L.P. AND SUBSIDIARIES
Notes to Consolidated Financial Statements (Continued)
(dollar amounts in thousands)
NOTE 6—LIMITED PARTNER PROFIT-SHARING EXPENSE (Continued)
Judgment is required for purposes of estimating the Redemption Payments element of the Profit-Sharing Arrangement. For each Limited Partner, the Redemption Payment expense accrual for each fiscal year is calculated as the historical four year average of the Distributable Cash multiplied by the vesting ratio, which is calculated as the number of vested years divided by 15. The accrual amount is reduced by payments made to the participant. The current liability for Redemption Payments is equal to the amount payable over the next 12 months for Limited Partners that have previously retired or separated from the Partnership. Future actual payments may differ materially from current estimates. Future payment to the Limited Partners for the Annual Profit-Sharing Payments and future Redemption Payments is solely dependent upon the availability of Distributable Cash.
In connection with the Transaction, this Profit-Sharing Arrangement will be terminated. The Limited Partners will receive units of limited partnership in the Operating Partnership to settle any future amounts due for vested Redemption Payments.
NOTE 7—ASSET MANAGEMENT FEES AND FEE CREDITS
Each of the Funds pay a managing member fee ("Asset Management Fee") to the Fund's managing member ("Fund Managing Member Entity"). The Asset Management Fee is calculated quarterly on the basis of an annual rate ranging from 1.25 percent to 1.50 percent (0.104 percent to 0.125 percent per month) of the Fund's committed or invested member capital as defined in the Fund's organizational documents, determined and calculated as of the first day of each quarter, and payable monthly. At the election of the Fund Managing Member Entity, the Asset Management Fee is initially payable in the form of a credit amount representing a residual equity interest in the Fund up to certain defined monetary thresholds ("Asset Management Fee Credit"). Fee credits are presented as Asset Management Fee Credits in the consolidated statements of operations and comprehensive income (loss). After achievement of the threshold, the remaining Asset Management Fee is payable in cash. The Fund Managing Member Entity may, at any time, make an irrevocable election to receive the Asset Management Fee in cash instead of in the form of an Asset Management Fee Credit. Fees paid in cash are presented as Asset Management Fees in the consolidated statements of operations and comprehensive income (loss).
The Fund Managing Member Entity may delegate the provision of services, and may assign the corresponding fee, to an affiliate. The Fund Managing Member Entity has delegated responsibility for such services to the Partnership.
The Fund Managing Member Entity has granted the Asset Management Fee Credits to certain Partnership Limited Partners Partnership in exchange for services rendered to the Fund. The Partnership does not retain any portion of the Asset Management Fee Credits. These amounts are presented as asset management fee credit expense in the consolidated statements of operations and comprehensive income (loss). Measurement of the revenue amount and corresponding expense is based on the fair value of the services rendered as this amount is more readily determinable than the fair value of the residual equity interest in the Fund. The fair value of the services rendered is equal to the amount of cash that would have been received had the Fund Managing Member Entities elected to receive a cash payment instead of the fee credit.
F-33
JBG/OPERATING PARTNERS, L.P. AND SUBSIDIARIES
Notes to Consolidated Financial Statements (Continued)
(dollar amounts in thousands)
NOTE 7—ASSET MANAGEMENT FEES AND FEE CREDITS (Continued)
In connection with the contemplated Transaction, it is expected that the asset management agreements will be amended. The amendments are expected to include the removal of the ability to elect a Fee Credit in lieu of a cash payment for the asset management fee, among other changes.
The Partnership does not have a direct ownership interest or any other interests in the Fund Managing Member Entities.
NOTE 8—LEASE COMMITMENTS
The Partnership's general partner leases office space from a related party under a non-cancelable operating lease expiring in 2022. Because the general partner has no other operations or activities other than its interest in the Partnership, and the Partnership reimburses the general partner for all amounts due under the lease agreement, the rental obligation and related amounts are presented and disclosed in the Partnership's consolidated financial statements.
The lease contains a renewal option for two additional five-year periods. The Partnership recognizes lease expense on a straight-line basis over the non-cancelable term of the lease. The Partnership reports the liability associated with the lease as deferred rent liability on the accompanying consolidated balance sheets. As of December 31, 2015, 2014, and 2013, the deferred rent liability related to this lease was $3,372, $3,475, and $3,483, respectively.
Future minimum rental payments due under the lease are as follows:
| | | | |
Year ending December 31, 2016 | | $ | 3,789 | |
2017 | | | 3,889 | |
2018 | | | 3,991 | |
2019 | | | 4,096 | |
2020 | | | 4,203 | |
Thereafter | | | 7,627 | |
| | | | | |
| | $ | 27,595 | |
| | | | | |
| | | | | |
| | | | | |
For the years ended December 31, 2015, 2014, and 2013, lease expense totaled $3,588, $3,588, and $3,667, respectively, and is included in general and administrative expense on the accompanying consolidated statements of operations and comprehensive income (loss).
A portion of the leased space was subleased to JBGR under a non-cancelable lease. This sublease was terminated upon the acquisition of the remaining interest in JBGR in January 2016. For the years ended December 31, 2015, 2014, and 2013, rental income under the subleases totaled $494, $494, and $629, respectively, and is reported as other revenue on the accompanying consolidated statements of operations and comprehensive income (loss).
NOTE 9—BUSINESS AND CREDIT CONCENTRATIONS
Substantially all revenues of the Partnership are derived from performing services for the affiliated Contributing Entities and Property LLCs.
F-34
JBG/OPERATING PARTNERS, L.P. AND SUBSIDIARIES
Notes to Consolidated Financial Statements (Continued)
(dollar amounts in thousands)
NOTE 9—BUSINESS AND CREDIT CONCENTRATIONS (Continued)
The Partnership maintains cash and cash equivalents at insured financial institutions. The combined account balances at each institution periodically exceed FDIC insurance coverage, and, as a result, there is a concentration of credit risk related to amounts in excess of FDIC insurance coverage. The Partnership believes that the risk is not significant.
NOTE 10—EMPLOYEE RETIREMENT SAVINGS PLAN
The Partnership's general partner maintains a multiple employer retirement savings plan pursuant to Section 401(k) of the Internal Revenue Code whereby employees may contribute a portion of their compensation to their respective retirement accounts, in an amount not to exceed the maximum allowed under the Internal Revenue Code. The Partnership provides a discretionary matching contribution, which totaled $1,073, $713, and $555, for the years ended December 31, 2015, 2014, and 2013, respectively, and is included in salary and benefits—reimbursement to general partner on the accompanying consolidated statements of operations and comprehensive income (loss). The Partnership may also provide a discretionary profit-sharing contribution under the plan. No discretionary profit-sharing contributions were made in 2015, 2014, and 2013.
NOTE 11—RELATED PARTY TRANSACTIONS
The Partnership provides a wide range of services to affiliated entities, including asset management, property management, leasing, tenant improvement construction, acquisition, repositioning, development, redevelopment, accounting, and financing services. The rates for these services have been agreed upon in advance and are included in the related agreements. For the years ended December 31, 2015, 2014, and 2013, revenues of $101,682, $105,938, and $98,887, respectively, were earned from affiliated entities.
As of December 31, 2015, 2014, and 2013, the Partnership had accounts receivable balances totaling $8,219, $6,621, and $6,996, respectively, from affiliated entities.
During the year ended December 31, 2015, the Partnership incurred certain professional fees associated with potential strategic options, including an initial public offering. The Partnership will be reimbursed for a portion of these fees by the Funds and other affiliates. The amount reimbursed by each affiliate is based on the relative value each Fund or other affiliated entity will contribute to the Operating Partnership as a percentage of the total value contributed. During the year ended December 31, 2015, the Partnership incurred $9,510 of professional fees related to strategic options, of which $7,222 was reimbursed by the Funds and other affiliates; a total of $1,319 was expensed by the Partnership based on its value allocation percentage and is included in general and administrative expense on the accompanying consolidated statements of operations and comprehensive income (loss); and, $969 is included in due from affiliates on the accompanying consolidated balance sheets.
NOTE 12—SUBSEQUENT EVENTS
The Partnership evaluated subsequent events through May 25, 2016, the date the consolidated financial statements were available to be issued.
F-35
JBG/ROSENFELD RETAIL PROPERTIES, LLC
Chevy Chase, Maryland
FINANCIAL STATEMENTS
Including Independent Auditors' Report
December 31, 2015 and 2014
F-36
Independent Auditors' Report
The Members
JBG/Rosenfeld Retail Properties, LLC:
We have audited the accompanying financial statements of JBG/Rosenfeld Retail Properties, LLC, which comprise the balance sheets as of December 31, 2015 and 2014, and the related statements of operations and comprehensive loss, changes in members' equity (deficit), and cash flows for the years then ended, and the related notes to the financial statements.
Management's Responsibility for the Financial Statements
Management is responsible for the preparation and fair presentation of these financial statements in accordance with U.S. generally accepted accounting principles; this includes the design, implementation, and maintenance of internal control relevant to the preparation and fair presentation of financial statements that are free from material misstatement, whether due to fraud or error.
Auditors' Responsibility
Our responsibility is to express an opinion on these financial statements based on our audits. We conducted our audits in accordance with auditing standards generally accepted in the United States of America. Those standards require that we plan and perform the audits to obtain reasonable assurance about whether the financial statements are free from material misstatement.
An audit involves performing procedures to obtain audit evidence about the amounts and disclosures in the financial statements. The procedures selected depend on the auditors' judgment, including the assessment of the risks of material misstatement of the financial statements, whether due to fraud or error. In making those risk assessments, the auditor considers internal control relevant to the entity's preparation and fair presentation of the financial statements in order to design audit procedures that are appropriate in the circumstances, but not for the purpose of expressing an opinion on the effectiveness of the entity's internal control. Accordingly, we express no such opinion. An audit also includes evaluating the appropriateness of accounting policies used and the reasonableness of significant accounting estimates made by management, as well as evaluating the overall presentation of the financial statements.
We believe that the audit evidence we have obtained is sufficient and appropriate to provide a basis for our audit opinion.
Opinion
In our opinion, the financial statements referred to above present fairly, in all material respects, the financial position of JBG/Rosenfeld Retail Properties, LLC as of December 31, 2015 and 2014, and the results of its operations and its cash flows for the years then ended in accordance with U.S. generally accepted accounting principles.
/s/ KPMG LLP
McLean, Virginia
May 25, 2016
F-37
JBG/ROSENFELD RETAIL PROPERTIES, LLC
Balance Sheets
As of December 31, 2015 and 2014
(dollar amounts in thousands)
| | | | | | | |
| | December 31, | |
|---|
| | 2015 | | 2014 | |
|---|
Assets | | | | | | | |
Current assets | | | | | | | |
Cash and cash equivalents | | $ | 1,010 | | $ | 233 | |
Accounts receivable | | | 331 | | | 177 | |
Due from affiliates | | | — | | | 126 | |
Prepaid expenses | | | 96 | | | 54 | |
| | | | | | | | |
Total current assets | | | 1,437 | | | 590 | |
Property and equipment, net | | | 326 | | | 427 | |
| | | | | | | | |
Total Assets | | $ | 1,763 | | $ | 1,017 | |
| | | | | | | | |
| | | | | | | | |
| | | | | | | | |
Liabilities and Members' Deficit | | | | | | | |
Current liabilities | | | | | | | |
Accounts payable | | $ | 148 | | $ | 198 | |
Accrued expenses | | | 1,324 | | | 605 | |
Deferred rent, current | | | 30 | | | 17 | |
Deferred revenue | | | 309 | | | — | |
Due to affiliates | | | — | | | 20 | |
| | | | | | | | |
Total current liabilities | | | 1,811 | | | 840 | |
Deferred rent, net of current portion | | | 435 | | | 465 | |
| | | | | | | | |
Total Liabilities | | | 2,246 | | | 1,305 | |
| | | | | | | | |
Total Members' Deficit | | | (483 | ) | | (288 | ) |
| | | | | | | | |
Total Liabilities and Members' Deficit | | $ | 1,763 | | $ | 1,017 | |
| | | | | | | | |
| | | | | | | | |
| | | | | | | | |
See accompanying notes to the financial statements.
F-38
JBG/ROSENFELD RETAIL PROPERTIES, LLC
Statements of Operations and Comprehensive Loss
For the Years Ended December 31, 2015 and 2014
(dollar amounts in thousands)
| | | | | | | |
| | For the year ended
December 31, | |
|---|
| | 2015 | | 2014 | |
|---|
Revenues | | | | | | | |
Property management fees | | $ | 3,708 | | $ | 3,518 | |
Leasing fees | | | 4,576 | | | 4,936 | |
Development and construction management fees | | | 2,602 | | | 2,899 | |
Other revenue | | | 500 | | | 180 | |
| | | | | | | | |
Total revenues | | | 11,386 | | | 11,533 | |
Operating Expenses | | | | | | | |
Salary, wages, and benefits | | | 9,523 | | | 10,957 | |
General and administrative | | | 1,910 | | | 1,893 | |
Depreciation and amortization | | | 119 | | | 146 | |
| | | | | | | | |
Total operating expenses | | | 11,552 | | | 12,996 | |
| | | | | | | | |
Operating Loss | | | (166 | ) | | (1,463 | ) |
Other Expenses | | | | | | | |
Interest expense | | | 29 | | | 24 | |
| | | | | | | | |
Net Loss | | | (195 | ) | | (1,487 | ) |
Other comprehensive loss | | | — | | | — | |
| | | | | | | | |
Comprehensive Loss | | $ | (195 | ) | $ | (1,487 | ) |
| | | | | | | | |
| | | | | | | | |
| | | | | | | | |
See accompanying notes to the financial statements.
F-39
JBG/ROSENFELD RETAIL PROPERTIES, LLC
Statement of Changes in Members' Equity (Deficit)
For the Years Ended December 31, 2015 and 2014
(dollar amounts in thousands)
| | | | |
Balance, January 1, 2014 | | $ | 1,199 | |
Net loss | | | (1,487 | ) |
| | | | | |
Balance, December 31, 2014 | | | (288 | ) |
Net loss | | | (195 | ) |
| | | | | |
Balance, December 31, 2015 | | $ | (483 | ) |
| | | | | |
| | | | | |
| | | | | |
See accompanying notes to the financial statements.
F-40
JBG/ROSENFELD RETAIL PROPERTIES, LLC
Statements of Cash Flows
For the Years Ended December 31, 2015 and 2014
(dollar amounts in thousands)
| | | | | | | |
| | For the year ended December 31, | |
|---|
| | 2015 | | 2014 | |
|---|
Cash Flows from Operating Activities | | | | | | | |
Net loss | | $ | (195 | ) | $ | (1,487 | ) |
Reconciliation adjustments | | | | | | | |
Depreciation and amortization | | | 119 | | | 146 | |
Changes in: | | | | | | | |
Accounts receivable | | | (154 | ) | | 447 | |
Accounts payable | | | (50 | ) | | (187 | ) |
Accrued expenses | | | 719 | | | 287 | |
Deferred rent | | | (17 | ) | | (4 | ) |
Deferred revenue | | | 309 | | | — | |
Due to affiliates, net | | | 106 | | | (1,641 | ) |
Prepaid expenses | | | (42 | ) | | (14 | ) |
| | | | | | | | |
Net cash provided by (used in) operating activities | | | 795 | | | (2,453 | ) |
Cash Flows from Investing Activities | | | | | | | |
Acquisition of property and equipment | | | (18 | ) | | (93 | ) |
| | | | | | | | |
Net cash used in investing activities | | | (18 | ) | | (93 | ) |
Cash Flows from Financing Activities | | | | | | | |
Proceeds from borrowings on line of credit | | | 1,350 | | | 2,000 | |
Repayment of borrowings on line of credit | | | (1,350 | ) | | (2,675 | ) |
| | | | | | | | |
Net cash used in financing activities | | | — | | | (675 | ) |
| | | | | | | | |
Net Increase (Decrease) in Cash and Cash Equivalents | | | 777 | | | (3,221 | ) |
Cash and Cash Equivalents, beginning of year | | | 233 | | | 3,454 | |
| | | | | | | | |
Cash and Cash Equivalents, end of year | | $ | 1,010 | | $ | 233 | |
| | | | | | | | |
| | | | | | | | |
| | | | | | | | |
Supplemental Disclosure of Cash Flow Information | | | | | | | |
Interest paid | | $ | 29 | | $ | 24 | |
| | | | | | | | |
| | | | | | | | |
| | | | | | | | |
See accompanying notes to the financial statements.
F-41
JBG/ROSENFELD RETAIL PROPERTIES, LLC
Notes to Financial Statements
(dollar amounts in thousands)
NOTE 1—ORGANIZATION
JBG/Rosenfeld Retail Properties, LLC ("JBGR") was organized on November 29, 1994, effective as of January 1, 1995, pursuant to a written agreement under the laws of the State of Maryland. As of December 31, 2015, 700 Associates, L.L.C. ("Associates") owned a 66.67 percent interest in JBGR and a subsidiary of JBG/Operating Partners, L.P. owned the remaining 33.33 percent interest in JBGR. JBGR was organized to provide professional leasing, management, and related services for retail real estate and to identify and pursue retail related development and acquisition activities. In January 2016, JBG/Operating Partners, L.P. acquired Associate's 66.67 percent interest in JBGR for $4,668 in cash. Contingent consideration may be payable to Associates under certain circumstances if the Transaction is completed and has an estimated fair value of $2 million. JBGR is now a wholly-owned subsidiary of JBG/Operating Partners, L.P. On May 25, 2016, JBG/Operating Partners, L.P, entered into an agreement to be acquired by New York REIT, Inc.
NOTE 2—SUMMARY OF SIGNIFICANT ACCOUNTING POLICIES
Use of Estimates—The preparation of financial statements in conformity with U.S. generally accepted accounting principles ("U.S. GAAP") requires management to make estimates and assumptions that affect the reported amounts of assets, liabilities, revenues and expenses, and the disclosure of contingent assets and liabilities. Actual results may differ from these estimates.
Cash and Cash Equivalents—For purposes of the accompanying balance sheets and statements of cash flows, JBGR considers short-term investments with remaining maturities of three months or less when purchased to be cash equivalents.
Accounts Receivable—Accounts receivable are stated at net realizable value. Management considers the following factors when determining the collectability of specific customer accounts: customer credit worthiness, past transaction history with the customer, current economic industry trends, and changes in customer payment terms. Past due balances over 90 days and other higher risk amounts are reviewed individually for collectability. Based on management's assessments, an allowance for doubtful accounts was not deemed necessary as of December 31, 2015 and 2014.
Property and Equipment—Furniture, fixtures, and equipment are recorded at cost and are depreciated using the straight-line method over their estimated useful lives. Leasehold improvements are costs incurred to prepare JBGR's office space for occupancy and are depreciated on a straight-line basis over the shorter of the estimated useful lives of the improvements or the terms of the respective leases. The following are the estimated useful lives used for depreciation purposes:
| | |
Assets | | Depreciation Period |
|---|
Furniture, fixtures, and equipment | | 3 - 7 years |
Leasehold improvements | | 7 - 15 years |
Expenditures for ordinary maintenance and repairs are expensed to operations as incurred. Significant renovations and improvements that improve or extend the useful life of the asset are capitalized. Depreciation and amortization expense for the years ended December 31, 2015 and 2014 were $119 and $146, respectively.
F-42
JBG/ROSENFELD RETAIL PROPERTIES, LLC
Notes to Financial Statements (Continued)
(dollar amounts in thousands)
NOTE 2—SUMMARY OF SIGNIFICANT ACCOUNTING POLICIES (Continued)
Revenue Recognition—JBGR's revenue streams are received for providing various real estate management and advisory services, including:
- •
- Property management services including on-site oversight and maintenance, lease management, accounting, and other property related services. Property management fees are calculated as a percentage of rental revenue and are recognized as services are provided.
- •
- Leasing commissions include successful efforts commissions JBGR receives when a lease is executed. Leasing commissions are recognized when earned.
- •
- Development and construction management fees are received for such services rendered by employees of JBGR. Services agreements include agreed upon pricing for these services. Revenue is recognized as services are provided.
Deferred revenue includes cash payments received in accordance with the terms of the underlying agreements, but such amounts have not yet met the criteria for revenue recognition in accordance with generally accepted accounting principles. Such revenues are recognized when the appropriate criteria are met.
Income Taxes—JBGR is a limited liability company and therefore no provision or benefit for income taxes are recorded because taxable income or loss passes through to and is reported by the members on their respective income tax returns.
The tax effects from an uncertain tax position can be recognized in the financial statements only if the position is more likely than not to be sustained on audit, based on the technical merits of the position. JBGR recognizes the financial statement benefit of a tax position only after determining that the relevant tax authority would more likely than not sustain the position following an audit. For tax positions meeting the more likely than not threshold, the amount recognized in the financial statements is the largest benefit that has a greater than 50 percent likelihood of being realized, upon ultimate settlement with the relevant tax authority. JBGR applied the accounting standard to all tax positions for which the statute of limitations remained open. JBGR did not identify any material uncertain tax positions.
JBGR recognizes interest and penalties related to unrecognized tax benefits in income tax expense in the accompanying statements of operations and comprehensive loss. For the years ended December 31, 2015 and 2014, JBGR has not recognized any interest or penalties. JBGR is no longer subject to U.S. federal, state, or local income tax examinations by tax authorities for the years before 2012. JBGR is not currently under examination by any taxing jurisdiction.
F-43
JBG/ROSENFELD RETAIL PROPERTIES, LLC
Notes to Financial Statements (Continued)
(dollar amounts in thousands)
NOTE 3—PROPERTY AND EQUIPMENT
The following table sets forth the details of property and equipment:
| | | | | | | |
| | For the year ended
December 31, | |
|---|
| | 2015 | | 2014 | |
|---|
Furniture, fixtures, and equipment | | $ | 1,249 | | $ | 1,234 | |
Leasehold improvements | | | 354 | | | 354 | |
| | | | | | | | |
| | | 1,603 | | | 1,588 | |
Less accumulated depreciation and amortization | | | (1,277 | ) | | (1,161 | ) |
| | | | | | | | |
Property and equipment, net | | $ | 326 | | $ | 427 | |
| | | | | | | | |
| | | | | | | | |
| | | | | | | | |
NOTE 4—LINE OF CREDIT
JBGR maintains a line of credit with a maximum amount available of $1,750 as of December 31, 2015 and 2014, that matures on July 31, 2016. Advances on the line of credit bear interest at a fluctuating rate equal to 3.00 percent plus the Adjusted London Interbank Offered Rate ("LIBOR"). The line of credit is secured by JBGR's assets and guaranteed by affiliates who own a direct financial interest in JBGR's members. The terms of the guaranty require the affiliates to comply with certain financial covenants, including maintaining a collective minimum liquidity of $2,500. As of December 31, 2015 and 2014, JBGR was in compliance with all loan covenants. As of December 31, 2015 and 2014, there were no amounts outstanding on the line of credit and the effective interest rate was 3.2 percent. JBGR incurred interest expense of $29 and $24 for the years ended December 31, 2015 and 2014, respectively, related to this line of credit.
NOTE 5—MEMBERS' DEFICIT
Contributions, distributions, net income, and losses are allocated to the members in accordance with the provisions as defined in JBGR's Operating Agreement (the "Agreement") and may not be in proportion with capital or ownership interests. JBGR shall continue in perpetuity, unless earlier terminated or dissolved pursuant to the Agreement or by operation of law.
NOTE 6—LEASE COMMITMENTS
JBGR leased office space from JBG/Operating Partners, L.P. and its general partner. This lease was terminated upon the acquisition described in Note 1. JBGR recognizes lease expense on a straight-line basis over the non-cancelable term of the lease. JBGR reported the liability associated with the lease as deferred rent liability on the accompanying balance sheets. As of December 31, 2015 and 2014, the deferred rent liability related to this lease was $465 and $482, respectively. JBGR also leases office equipment under various operating leases.
For the years ended December 31, 2015 and 2014, rent expense related to the above leases totaled $511 and $498, respectively, and is included in general and administrative expense on the accompanying statements of operations and comprehensive loss.
F-44
JBG/ROSENFELD RETAIL PROPERTIES, LLC
Notes to Financial Statements (Continued)
(dollar amounts in thousands)
NOTE 7—BUSINESS AND CREDIT CONCENTRATIONS
For the years ended December 31, 2015 and 2014, approximately 48 percent and 58 percent, respectively, of JBGR's revenue was derived from performing services for related parties.
JBGR maintains cash and cash equivalents at insured financial institutions. The combined account balances at each institution periodically exceed FDIC insurance coverage, and, as a result, there is a concentration of credit risk related to amounts in excess of FDIC insurance coverage. JBGR believes that the risk is not significant.
NOTE 8—EMPLOYEE RETIREMENT SAVINGS PLAN
JBGR maintains a multiple employer retirement savings plan pursuant to Section 401(k) of the Internal Revenue Code whereby JBGR's employees may contribute a portion of their compensation to their respective retirement accounts, in an amount not to exceed the maximum allowed under the Internal Revenue Code. JBGR provides a discretionary matching contribution, which totaled $151 and $135 for the years ended December 31, 2015 and 2014, respectively, and is included in salaries, wages, and benefits on the accompanying statements of operations and comprehensive loss. JBGR may also provide a discretionary profit-sharing contribution under the plan. No discretionary profit-sharing contributions were made in 2015 and 2014.
NOTE 9—RELATED PARTY TRANSACTIONS
JBGR leases additional office space from a related party on a month-to-month basis. Lease expense related to this lease totaled $135 and $121 for the years ended December 31, 2015 and 2014, respectively, and is included in general and administrative expense on the accompanying statements of operations and comprehensive loss.
JBGR earns property management and leasing fees from partnerships affiliated with a member. These amounted to $3,255 and $5,028 for the years ended December 31, 2015 and 2014.
JBGR also earns development and construction management, and sales fees from partnerships affiliated with a member. These amounted to $2,247 and $1,634 for the years ended December 31, 2015 and 2014, respectively.
JBGR loaned funds to affiliates of the members. The advances are noninterest bearing and due on demand. The balances due from these affiliates totaled $0 and $126 at December 31, 2015 and 2014, respectively.
JBGR was advanced funds from affiliates of the members totaling $0 and $20 at December 31, 2015 and 2014, respectively. The advances are noninterest bearing and due on demand.
NOTE 10—SUBSEQUENT EVENTS
JBGR evaluated subsequent events through May 25, 2016, the date the financial statements were available to be issued.
F-45
JBG REAL ESTATE OPERATING ASSETS
INTERIM COMBINED STATEMENT OF REVENUE AND
EXPENSES FROM REAL ESTATE OPERATIONS
(UNAUDITED)
For the Three Months Ended
March 31, 2016
F-46
JBG REAL ESTATE OPERATING ASSETS
Combined Statement of Revenue and Expenses from Real Estate Operations (Unaudited)
(dollar amounts in thousands)
| | | | |
| | For the Three
Months Ended
March 31, 2016 | |
|---|
Operating Revenue | | | | |
Base rent | | $ | 72,617 | |
Tenant expense recoveries | | | 12,213 | |
Other operating revenue | | | 5,959 | |
| | | | | |
Total office and retail revenue | | | 90,789 | |
Multifamily and other revenue | | | 26,956 | |
| | | | | |
Total Operating Revenue | | | 117,745 | |
Expenses | | | | |
Payroll expenses | | | 7,309 | |
Other operating expenses | | | 22,842 | |
Real estate taxes | | | 14,604 | |
Insurance | | | 888 | |
Management fees | | | 3,961 | |
| | | | | |
Total Expenses | | | 49,604 | |
| | | | | |
Operating Revenues in Excess of Expenses | | $ | 68,141 | |
| | | | | |
| | | | | |
| | | | | |
See notes to combined statement of revenue and expenses from real estate operations.
F-47
JBG REAL ESTATE OPERATING ASSETS
Notes to the Combined Statement of
Revenue and Expenses from Real Estate Operations (Unaudited)
For the Three Months Ended March 31, 2016
(dollar amounts in thousands)
NOTE 1—BASIS OF PRESENTATION
JBG Real Estate Operating Assets is not a separate or single legal entity, but rather a combination of real estate operating assets and entities under the common management of JBG/Operating Partners, L.P. and its consolidated subsidiaries (the "Management Company"). The Management Company earns fees in connection with investment, development, asset and property management, leasing, construction management, tenant improvement construction and finance services provided to commercial office properties, multifamily (both rental and for-sale), retail, and hotels. Substantially all fee revenue earned by the Management Company is from services provided for the real estate assets owned by affiliated real estate investment funds and other affiliated real estate investment vehicles (collectively, the "Contributing Entities"). The Contributing Entities hold direct ownership in each real estate asset ("Property Asset") through a separate limited liability company ("Property LLC"). The Contributing Entities own direct or indirect equity interests in the Property LLCs. The Management Company, Contributing Entities, Property Assets and Property LLCs are collectively referred to as "JBG".
On May 25, 2016, certain JBG entities, New York REIT, Inc. and New York Recovery Operating Partnership, L.P., a Delaware limited partnership (the "Operating Partnership"), entered into a Master Combination Agreement (the "Combination Agreement"), pursuant to which the Management Company and the Contributing Entities' interests in certain Property LLCs will be contributed through a series of formation transactions to the Operating Partnership in exchange for the right to receive units of limited partnership interest in the Operating Partnership or shares of common stock of New York REIT, Inc. or, in certain circumstances, cash (the "Transaction"). New York REIT, Inc. is the general partner of the Operating Partnership and is a publicly-traded Maryland corporation that operates as a real estate investment trust for U.S. federal tax purposes. New York REIT, Inc. and the Operating Partnership are collectively referred to as "NYRT".
The following are the Contributing Entities: JBG Investment Fund I, L.P. ("Fund I"); JBG Investment Fund II, L.P. ("Fund II"); JBG Investment Fund III, L.P. ("Fund III"); JBG Investment Fund VI, L.L.C. ("Fund VI"); JBG Investment Fund VII, L.L.C. ("Fund VII"); JBG Investment Fund VIII, L.L.C. ("Fund VIII"); JBG Investment Fund IX, L.L.C. ("Fund IX"); JBG/Urban Direct Member, L.L.C. ("Urban Direct"); JBG/Recap Investors, L.L.C. ("JBG Recap"); and JBG/SEFC Fund Investors, L.L.C. and JBG/SEFC Partners, L.L.C. ("JBG SEFC").
The Management Company, Contributing Entities and Property LLCs are not entities under common control or subsidiaries of a common parent. The Property Assets presented in the combined statement of revenue and expenses from real estate operations and supplementary information presented in Schedule 1 (the "Statement") have been under common management of the Management Company since the date of acquisition by the applicable Contributing Entity. The date of acquisition is indicated on the Statement (for properties acquired prior to January 1, 2013, the acquisition date is indicated as "Prior to 2013").
Although NYRT is expected to acquire less than 100 percent equity interest in certain of the Property LLCs, the Statement presents 100 percent of the revenue and expenses from real estate operations for each Property Asset. The schedule included in the Supplemental Information identifies
F-48
JBG REAL ESTATE OPERATING ASSETS
Notes to the Combined Statement of
Revenue and Expenses from Real Estate Operations (Unaudited) (Continued)
For the Three Months Ended March 31, 2016
(dollar amounts in thousands)
NOTE 1—BASIS OF PRESENTATION (Continued)
the Contributing Entity, and the percentage ownership in each Property Asset that will be acquired by NYRT. Operating revenue includes contractual base and other rent pursuant to the lease agreements, tenant expense recoveries, and other revenue derived from the operation of the real estate asset. Expenses are the direct expenses associated with operating and maintaining the real estate asset and are expensed as incurred.
All ownership percentages ascribed to NYRT in this statement reflect the ownership held by the Operating Partnership.
NYRT is expected to acquire 100 percent of the ownership interests in the Property LLCs that hold the ownership interests in the following Property Assets:
| | | | |
| Property Asset—Office | | Property Asset—Retail | | Property Asset—Multifamily |
|---|
1233 20th Street | | 275 N. Washington | | Bennington Crossings |
1600 K Street | | North End Retail I | | Brookdale |
1831 Wiehle Avenue | | The Shops at Mark Center | | Charter Oak |
1900 N Street | | | | Fairmont Gardens |
2115 Wisconsin Avenue | | | | Falkland Chase—North |
2121 Wisconsin Avenue | | | | Falkland Chase—South & West |
4747 Bethesda Avenue | | | | Hillwood |
6862 Elm Street | | | | Lynbrook |
800 North Glebe Road | | | | Meadowcreek |
Artery Plaza | | | | Stoneridge |
DOT—U.S. Government Tenant (GSA) | | | | |
Hungerford Plaza | | | | |
Jefferson Court | | | | |
NCI—U.S. Government Tenant (GSA) | | | | |
Old Dominion | | | | |
One Choke Cherry | | | | |
Reston Arboretum | | | | |
RTC—West | | | | |
Summit I | | | | |
Summit II | | | | |
Wiehle Avenue Office Building | | | | |
F-49
JBG REAL ESTATE OPERATING ASSETS
Notes to the Combined Statement of
Revenue and Expenses from Real Estate Operations (Unaudited) (Continued)
For the Three Months Ended March 31, 2016
(dollar amounts in thousands)
NOTE 1—BASIS OF PRESENTATION (Continued)
NYRT is expected to acquire less than 100 percent of the ownership interests in the Property LLCs that hold the ownership interests in the following Property Assets.
| | | | | | |
Property Assets | | Type | | Anticipated NYRT
Ownership | |
|---|
11333 Woodglen Drive | | Office | | | 18.00 | % |
12440 Parklawn | | Office | | | 18.00 | % |
12725 Twinbrook Parkway | | Office | | | 10.00 | % |
12735 Twinbrook Parkway | | Office | | | 10.00 | % |
5600 Fishers Lane—U.S. Government Tenant (GSA) | | Office | | | 66.70 | % |
5601 Fishers Lane—U.S. Government Tenant (GSA) | | Office | | | 66.70 | % |
5609 Fishers Lane | | Office | | | 66.70 | % |
5625 Fishers Lane | | Office | | | 10.00 | % |
5635 Fishers Lane | | Office | | | 10.00 | % |
5640 Fishers Lane | | Office | | | 10.00 | % |
Capitol Point—North | | Office | | | 16.87 | % |
Chase Tower | | Office | | | 10.00 | % |
Courthouse Metro Office | | Office | | | 18.00 | % |
L'Enfant Plaza Office—East | | Office | | | 49.00 | % |
L'Enfant Plaza Office—North | | Office | | | 49.00 | % |
NoBe II Office | | Office | | | 18.00 | % |
Pickett Industrial Park | | Office | | | 10.00 | % |
Rosslyn Gateway—North | | Office | | | 18.00 | % |
Rosslyn Gateway—South | | Office | | | 18.00 | % |
The Foundry | | Office | | | 9.88 | % |
Woodglen | | Office | | | 18.00 | % |
Fort Totten Square Retail | | Retail | | | 99.30 | % |
Galvan Retail | | Retail | | | 1.80 | % |
L'Enfant Plaza Retail—East | | Retail | | | 49.00 | % |
L'Enfant Plaza Retail—West | | Retail | | | 49.00 | % |
La Plata Shopping Center | | Retail | | | 99.00 | % |
Leesburg Pike Retail | | Retail | | | 99.00 | % |
Notch 8 Retail | | Retail | | | 14.70 | % |
Old Centreville Crossing | | Retail | | | 99.00 | % |
Pikesville Walgreens | | Retail | | | 99.00 | % |
Stonebridge at Potomac Town Center—Phase I | | Retail | | | 10.00 | % |
Takoma—Langley Crossroads Center | | Retail | | | 99.00 | % |
Vienna Walgreens | | Retail | | | 99.00 | % |
Atlantic Plumbing | | Multifamily | | | 64.00 | % |
Fairway Apartments | | Multifamily | | | 10.00 | % |
Fort Totten Square | | Multifamily | | | 99.30 | % |
Galvan | | Multifamily | | | 1.80 | % |
F-50
JBG REAL ESTATE OPERATING ASSETS
Notes to the Combined Statement of
Revenue and Expenses from Real Estate Operations (Unaudited) (Continued)
For the Three Months Ended March 31, 2016
(dollar amounts in thousands)
NOTE 1—BASIS OF PRESENTATION (Continued)
| | | | | | |
Property Assets | | Type | | Anticipated NYRT
Ownership | |
|---|
Kennedy Row | | Multifamily | | | 90.00 | % |
Notch 8 | | Multifamily | | | 14.70 | % |
The Alaire | | Multifamily | | | 18.00 | % |
The Gale | | Multifamily | | | 5.00 | % |
The Terano | | Multifamily | | | 1.80 | % |
The Combined Statement of Revenue and Expenses from Real Estate Operations has been prepared for the purpose of complying with Rule 3-14 of Regulation S-X promulgated under the Securities Act of 1933, as amended. Accordingly, the Statement does not reflect the actual operations for the period presented as revenue and expenses from real estate operations exclude certain revenue and expenses expected to be incurred in the future operations of the Property Assets. Such items include depreciation, amortization, interest expense, interest income, ground rent expense, and amortization of above- and below-market leases. Further, the accompanying Statement does not include any amounts for non-operating real estate assets including land parcels and Property Assets in the pre-development, development, and construction phases. The accompanying combined Schedule 1 is presented for the purposes of additional analysis and is not a required part of the combined statement.
NOTE 2—SUMMARY OF SIGNIFICANT ACCOUNTING POLICIES
Principles of Combination—The combined statement of revenue and expenses from real estate operations include selected revenue and expense accounts of the Property Assets as described in Note 1. All significant intercompany accounts and transactions have been eliminated in the combined statement of revenue and expenses from real estate operations.
Unaudited Interim Combined Statement—The combined statement of revenue and expenses from real estate operations for the three months ended March 31, 2016 is unaudited. In the opinion of management, the statement reflects all adjustments necessary for a fair presentation of the results of the interim period. All such adjustments are of a normal recurring nature.
Revenue Recognition—Rental revenue is recognized on a straight-line basis over the non-cancellable lease term when collectability is reasonably assured and the tenant has taken possession or controls the physical use of the leased asset.
Tenant expense recoveries for real estate taxes, common area maintenance, and other recoverable costs are recognized in the period that the expenses are incurred. The recoveries are recognized and presented gross as the Property Assets are generally the primary obligor with respect to purchasing goods and services from third-party suppliers, have discretion in selecting the supplier, and bear the associated credit risk.
Other revenue is revenue derived from lease termination fees and the tenants' use of parking and other property facilities. Lease termination fees are recognized when the related leases are
F-51
JBG REAL ESTATE OPERATING ASSETS
Notes to the Combined Statement of
Revenue and Expenses from Real Estate Operations (Unaudited) (Continued)
For the Three Months Ended March 31, 2016
(dollar amounts in thousands)
NOTE 2—SUMMARY OF SIGNIFICANT ACCOUNTING POLICIES (Continued)
canceled and the landlord has no continuing obligation to provide services to such former tenants. Other revenue is recognized when the related services are utilized by the tenants.
Use of Estimates—Management has made a number of estimates and assumptions relating to the reporting and disclosure of revenue and expenses from real estate operations during the reporting period to present the statement of revenue and expenses from real estate operations in conformity with accounting principles generally accepted in the United States of America. Actual results could differ from those estimates.
NOTE 3—SUMMARY TABLES
The following table separately presents the aggregate operating revenue and expenses for the wholly-owned Property Assets, and the less than wholly-owned Property Assets. Presentation of amounts as "100% Owned" or "Less Than 100% Owned Consolidated" or "Less Than 100% Owned and Non-Consolidated" may change as the subject Transaction has not yet occurred and events, facts and circumstances may change from the date of this Statement through the date of the Transaction which may affect a consolidation assessment performed in accordance with U.S. generally accepted accounting principles.
Three Months Ended March 31, 2016
| | | | | | | | | | | | | |
| | 100% Owned | | Less Than 100%
Owned Consolidated | | Less Than 100% Owned
Non-Consolidated | | Subtotal | |
|---|
Operating Revenue | | | | | | | | | | | | | |
Base rent | | $ | 36,076 | | $ | 13,912 | | $ | 22,629 | | $ | 72,617 | |
Tenant expense recoveries | | | 6,931 | | | 679 | | | 4,603 | | | 12,213 | |
Other operating revenue | | | 2,451 | | | 1,311 | | | 2,197 | | | 5,959 | |
| | | | | | | | | | | | | | |
Total office and retail revenue | | | 45,458 | | | 15,902 | | | 29,429 | | | 90,789 | |
Multifamily and other revenue | | | 16,228 | | | 1,683 | | | 9,045 | | | 26,956 | |
| | | | | | | | | | | | | | |
Total Operating Revenue | | | 61,686 | | | 17,585 | | | 38,474 | | | 117,745 | |
Expenses | | | | | | | | | | | | | |
Payroll expenses | | | 3,981 | | | 736 | | | 2,592 | | | 7,309 | |
Other operating expenses | | | 11,526 | | | 2,234 | | | 9,082 | | | 22,842 | |
Real estate taxes | | | 8,757 | | | 1,261 | | | 4,586 | | | 14,604 | |
Insurance | | | 449 | | | 136 | | | 303 | | | 888 | |
Management fees | | | 2,085 | | | 639 | | | 1,237 | | | 3,961 | |
| | | | | | | | | | | | | | |
Total Expenses | | | 26,798 | | | 5,006 | | | 17,800 | | | 49,604 | |
| | | | | | | | | | | | | | |
Operating Revenues in Excess of Expenses | | $ | 34,888 | | $ | 12,579 | | $ | 20,674 | | $ | 68,141 | |
| | | | | | | | | | | | | | |
| | | | | | | | | | | | | | |
| | | | | | | | | | | | | | |
Number of Property Assets and Venture Assets | | | 34 | | | 12 | | | 30 | | | 76
| |
F-52
JBG REAL ESTATE OPERATING ASSETS
Notes to the Combined Statement of
Revenue and Expenses from Real Estate Operations (Unaudited) (Continued)
For the Three Months Ended March 31, 2016
(dollar amounts in thousands)
NOTE 4—LEASE COMMITMENTS
There are various lease agreements in place with tenants to lease space in the Property Assets. As of March 31, 2016, the minimum future cash rents receivable under non-cancelable operating leases are as follows:
| | | | |
2016 | | $ | 218,000 | |
2017 | | | 267,200 | |
2018 | | | 249,360 | |
2019 | | | 227,872 | |
2020 | | | 215,100 | |
Thereafter | | | 970,728 | |
| | | | | |
| | $ | 2,148,260 | |
| | | | | |
| | | | | |
| | | | | |
Leases generally require reimbursement of the tenant's proportional share of common area, real estate taxes, and other operating expenses, which are excluded from the amounts above. Future cash rents receivable on multifamily real estate operating assets are excluded from the table above as the lease terms are generally one year or less.
NOTE 5—TENANT CONCENTRATIONS
For the three months ended March 31, 2016, 35 percent of total combined rental revenue was recognized from one government agency tenant.
NOTE 6—RELATED PARTY TRANSACTIONS
The Management Company provides property management and other services for the Contributing Entities and Property Assets which are calculated as a percentage of rental revenue or gross receipts.
For the three months ended March 31, 2016, fees totaled $4,040, which are included in management fees on the accompanying combined statement of revenue and expenses from real estate operations.
NOTE 7—SUBSEQUENT EVENTS
Subsequent events were evaluated through May 25, 2016, the date the combined statement of revenue and expenses from real estate operations was available to be issued.
F-53
JBG REAL ESTATE OPERATING ASSETS
Supplemental Information—Schedule 1
Combining Statement of Revenue and Expenses from Real Estate Operations (Unaudited)
For the Three Months Ended March 31, 2016
(dollar amounts in thousands)
| | | | | | | | | | | | | | | | | | | |
| | 100% Owned Office | |
|---|
| | 1233 20th Street | | 1600 K Street | | 1831 Wiehle
Avenue | | 1900 N Street | | 2115 Wisconsin
Avenue | | 2121 Wisconsin
Avenue | |
|---|
Operating Revenue | | | | | | | | | | | | | | | | | | | |
Base rent | | $ | 1,427 | | $ | 920 | | $ | 473 | | $ | 841 | | $ | 1,379 | | $ | 536 | |
Tenant expense recoveries | | | 28 | | | 50 | | | 56 | | | 16 | | | 57 | | | 52 | |
Other operating revenue | | | 42 | | | 14 | | | 9 | | | 8 | | | 109 | | | 129 | |
| | | | | | | | | | | | | | | | | | | | |
Total office and retail revenue | | | 1,497 | | | 984 | | | 538 | | | 865 | | | 1,545 | | | 717 | |
Multifamily and other revenue | | | — | | | — | | | — | | | — | | | — | | | — | |
| | | | | | | | | | | | | | | | | | | | |
Total Operating Revenue | | | 1,497 | | | 984 | | | 538 | | | 865 | | | 1,545 | | | 717 | |
Expenses | | | | | | | | | | | | | | | | | | | |
Payroll expenses | | | 90 | | | 78 | | | 34 | | | 52 | | | 91 | | | 60 | |
Other operating expenses | | | 316 | | | 210 | | | 130 | | | 233 | | | 246 | | | 146 | |
Real estate taxes | | | 310 | | | 165 | | | 42 | | | 252 | | | 261 | | | 155 | |
Insurance | | | 7 | | | 5 | | | — | | | 5 | | | 8 | | | 4 | |
Management fees | | | 38 | | | 26 | | | 16 | | | 28 | | | 55 | | | 26 | |
| | | | | | | | | | | | | | | | | | | | |
Total Expenses | | | 761 | | | 484 | | | 222 | | | 570 | | | 661 | | | 391 | |
| | | | | | | | | | | | | | | | | | | | |
Revenues in Excess of Expenses (Expenses in Excess of Revenues) | | $ | 736 | | $ | 500 | | $ | 316 | | $ | 295 | | $ | 884 | | $ | 326 | |
| | | | | | | | | | | | | | | | | | | | |
| | | | | | | | | | | | | | | | | | | | |
| | | | | | | | | | | | | | | | | | | | |
Acquisition Date | | | Prior to 2013 | | | Prior to 2013 | | | Prior to 2013 | | | Prior to 2013 | | | Prior to 2013 | | | Prior to 2013 | |
Affiliated Seller in each table | | | Fund VIII | | | Fund VIII | | | Fund VIII/Urban Direct | | | Fund VI/Fund VIII | | | Fund VII | | | Fund VII | |
Anticipated NYRT Ownership | | | 100.0% | | | 100.0% | | | 100.0% | | | 100.0% | | | 100.0% | | | 100.0%
| |
See notes to combined statement of revenue and expenses from real estate operations.
F-54
JBG REAL ESTATE OPERATING ASSETS
Supplemental Information—Schedule 1 (Continued)
Combining Statement of Revenue and Expenses from Real Estate Operations (Unaudited)
For the Three Months Ended March 31, 2016
(dollar amounts in thousands)
| | | | | | | | | | | | | | | | | | | |
| | 100% Owned Office—Continued | |
|---|
| | 4747 Bethesda
Avenue | | 6862 Elm Street | | 800 North Glebe
Road | | Artery Plaza | | DOT—U.S.
Government
Tenant (GSA) | | Hungerford Plaza | |
|---|
Operating Revenue | | | | | | | | | | | | | | | | | | | |
Base rent | | $ | 30 | | $ | 713 | | $ | 2,027 | | $ | 2,437 | | $ | 9,664 | | $ | 439 | |
Tenant expense recoveries | | | — | | | 47 | | | 797 | | | 118 | | | 5,209 | | | 5 | |
Other operating revenue | | | 84 | | | 9 | | | 331 | | | 208 | | | 362 | | | 4 | |
| | | | | | | | | | | | | | | | | | | | |
Total office and retail revenue | | | 114 | | | 769 | | | 3,155 | | | 2,763 | | | 15,235 | | | 448 | |
Multifamily and other revenue | | | — | | | — | | | — | | | — | | | — | | | — | |
| | | | | | | | | | | | | | | | | | | | |
Total Operating Revenue | | | 114 | | | 769 | | | 3,155 | | | 2,763 | | | 15,235 | | | 448 | |
Expenses | | | | | | | | | | | | | | | | | | | |
Payroll expenses | | | 21 | | | 62 | | | 159 | | | 138 | | | 665 | | | 51 | |
Other operating expenses | | | 54 | | | 149 | | | 434 | | | 482 | | | 1,448 | | | 266 | |
Real estate taxes | | | 92 | | | 80 | | | 475 | | | 236 | | | 3,065 | | | 30 | |
Insurance | | | — | | | 4 | | | 11 | | | 12 | | | 71 | | | 4 | |
Management fees | | | — | | | 24 | | | 91 | | | 81 | | | 546 | | | 12 | |
| | | | | | | | | | | | | | | | | | | | |
Total Expenses | | | 167 | | | 319 | | | 1,170 | | | 949 | | | 5,795 | | | 363 | |
| | | | | | | | | | | | | | | | | | | | |
Revenues in Excess of Expenses (Expenses in Excess of Revenues) | | $ | (53 | ) | $ | 450 | | $ | 1,985 | | $ | 1,814 | | $ | 9,440 | | $ | 85 | |
| | | | | | | | | | | | | | | | | | | | |
| | | | | | | | | | | | | | | | | | | | |
| | | | | | | | | | | | | | | | | | | | |
Acquisition Date | | | Prior to 2013 | | | Prior to 2013 | | | Prior to 2013 | | | Prior to 2013 | | | Prior to 2013 | | | Prior to 2013 | |
Affiliated Seller in each table | | | Fund VIII/Urban Direct | | | Fund VI/Fund VII | | | Fund VII/Urban Direct | | | Fund VI | | | Fund III/Fund VI/Fund VII/JBG SEFC | | | Fund VI | |
Anticipated NYRT Ownership | | | 100.0% | | | 100.0% | | | 100.% | | | 100.0% | | | 100.0% | | | 100.0%
| |
See notes to combined statement of revenue and expenses from real estate operations.
F-55
JBG REAL ESTATE OPERATING ASSETS
Supplemental Information—Schedule 1 (Continued)
Combining Statement of Revenue and Expenses from Real Estate Operations (Unaudited)
For the Three Months Ended March 31, 2016
(dollar amounts in thousands)
| | | | | | | | | | | | | | | | |
| | 100% Owned Office—Continued | |
|---|
| | Jefferson Court | | NCI—U.S.
Government
Tenant (GSA) | | Old Dominion | | One Choke Cherry | | Reston
Arboretum | |
|---|
Operating Revenue | | | | | | | | | | | | | | | | |
Base rent | | $ | 2,912 | | $ | 4,537 | | $ | 303 | | $ | 1,981 | | $ | 658 | |
Tenant expense recoveries | | | 113 | | | 35 | | | 9 | | | 6 | | | 26 | |
Other operating revenue | | | 318 | | | 695 | | | 9 | | | 19 | | | — | |
| | | | | | | | | | | | | | | | | |
Total office and retail revenue | | | 3,343 | | | 5,267 | | | 321 | | | 2,006 | | | 684 | |
Multifamily and other revenue | | | — | | | — | | | — | | | — | | | — | |
| | | | | | | | | | | | | | | | | |
Total Operating Revenue | | | 3,343 | | | 5,267 | | | 321 | | | 2,006 | | | 684 | |
Expenses | | | | | | | | | | | | | | | | |
Payroll expenses | | | 187 | | | 270 | | | 41 | | | 59 | | | 45 | |
Other operating expenses | | | 554 | | | 662 | | | 104 | | | 271 | | | 477 | |
Real estate taxes | | | 570 | | | 619 | | | 44 | | | 84 | | | 59 | |
Insurance | | | 15 | | | 36 | | | 2 | | | 11 | | | 4 | |
Management fees | | | 74 | | | 165 | | | 15 | | | 59 | | | 15 | |
| | | | | | | | | | | | | | | | | |
Total Expenses | | | 1,400 | | | 1,752 | | | 206 | | | 484 | | | 600 | |
| | | | | | | | | | | | | | | | | |
Revenues in Excess of Expenses (Expenses in Excess of Revenues) | | $ | 1,943 | | $ | 3,515 | | $ | 115 | | $ | 1,522 | | $ | 84 | |
| | | | | | | | | | | | | | | | | |
| | | | | | | | | | | | | | | | | |
| | | | | | | | | | | | | | | | | |
Acquisition Date | | | Prior to 2013 | | | Prior to 2013 | | | Prior to 2013 | | | Prior to 2013 | | | Prior to 2013 | |
Affiliated Seller in each table | | | Fund VIII | | | Fund VI/Fund VII | | | Fund VI/Fund VII | | | Fund VI/Fund VII | | | Fund VII | |
Anticipated NYRT Ownership | | | 100.0% | | | 100.0% | | | 100.0% | | | 100.0% | | | 100.0%
| |
See notes to combined statement of revenue and expenses from real estate operations.
F-56
JBG REAL ESTATE OPERATING ASSETS
Supplemental Information—Schedule 1 (Continued)
Combining Statement of Revenue and Expenses from Real Estate Operations (Unaudited)
For the Three Months Ended March 31, 2016
(dollar amounts in thousands)
| | | | | | | | | | | | | | | | |
| | 100% Owned Office—Continued | |
|---|
| | RTC—West | | Summit I | | Summit II | | Wiehle Avenue
Office Building | | Subtotal 100%
Owned—Office | |
|---|
Operating Revenue | | | | | | | | | | | | | | | | |
Base rent | | $ | 2,729 | | $ | — | | $ | 973 | | $ | 341 | | $ | 35,320 | |
Tenant expense recoveries | | | 55 | | | — | | | 20 | | | 25 | | | 6,724 | |
Other operating revenue | | | 54 | | | — | | | 13 | | | 4 | | | 2,421 | |
| | | | | | | | | | | | | | | | | |
Total office and retail revenue | | | 2,838 | | | — | | | 1,006 | | | 370 | | | 44,465 | |
Multifamily and other revenue | | | — | | | — | | | — | | | — | | | — | |
| | | | | | | | | | | | | | | | | |
Total Operating Revenue | | | 2,838 | | | — | | | 1,006 | | | 370 | | | 44,465 | |
Expenses | | | | | | | | | | | | | | | | |
Payroll expenses | | | 271 | | | 49 | | | 53 | | | 33 | | | 2,509 | |
Other operating expenses | | | 596 | | | 151 | | | 239 | | | 131 | | | 7,299 | |
Real estate taxes | | | 371 | | | 53 | | | 94 | | | 39 | | | 7,096 | |
Insurance | | | 20 | | | 4 | | | 4 | | | 3 | | | 230 | |
Management fees | | | 94 | | | — | | | 30 | | | 15 | | | 1,410 | |
| | | | | | | | | | | | | | | | | |
Total Expenses | | | 1,352 | | | 257 | | | 420 | | | 221 | | | 18,544 | |
| | | | | | | | | | | | | | | | | |
Revenues in Excess of Expenses (Expenses in Excess of Revenues) | | $ | 1,486 | | $ | (257 | ) | $ | 586 | | $ | 149 | | $ | 25,921 | |
| | | | | | | | | | | | | | | | | |
| | | | | | | | | | | | | | | | | |
| | | | | | | | | | | | | | | | | |
Acquisition Date | | | Prior to 2013 | | | Prior to 2013 | | | Prior to 2013 | | | July 1, 2015 | | | | |
Affiliated Seller in each table | | | Fund VIII | | | Fund VIII | | | Fund VIII | | | Fund VIII | | | | |
Anticipated NYRT Ownership | | | 100.0% | | | 100.0% | | | 100.0% | | | 100.0% | | | | |
See notes to combined statement of revenue and expenses from real estate operations.
F-57
JBG REAL ESTATE OPERATING ASSETS
Supplemental Information—Schedule 1 (Continued)
Combining Statement of Revenue and Expenses from Real Estate Operations (Unaudited)
For the Three Months Ended March 31, 2016
(dollar amounts in thousands)
| | | | | | | | | | | | | |
| | 100% Owned Retail | |
|---|
| | 275 N. Washington | | North End
Retail I | | The Shops at
Mark Center | | Subtotal 100%
Owned—Retail | |
|---|
Operating Revenue | | | | | | | | | | | | | |
Base rent | | $ | 159 | | $ | 172 | | $ | 425 | | $ | 756 | |
Tenant expense recoveries | | | 40 | | | 46 | | | 121 | | | 207 | |
Other operating revenue | | | — | | | 28 | | | 2 | | | 30 | |
| | | | | | | | | | | | | | |
Total office and retail revenue | | | 199 | | | 246 | | | 548 | | | 993 | |
Multifamily and other revenue | | | — | | | — | | | — | | | — | |
| | | | | | | | | | | | | | |
Total Operating Revenue | | | 199 | | | 246 | | | 548 | | | 993 | |
Expenses | | | | | | | | | | | | | |
Payroll expenses | | | 11 | | | — | | | — | | | 11 | |
Other operating expenses | | | 82 | | | 83 | | | 101 | | | 266 | |
Real estate taxes | | | 33 | | | 60 | | | 54 | | | 147 | |
Insurance | | | 1 | | | 5 | | | 3 | | | 9 | |
Management fees | | | 6 | | | 11 | | | 22 | | | 39 | |
| | | | | | | | | | | | | | |
Total Expenses | | | 133 | | | 159 | | | 180 | | | 472 | |
| | | | | | | | | | | | | | |
Revenues in Excess of Expenses (Expenses in Excess of Revenues) | | $ | 66 | | $ | 87 | | $ | 368 | | $ | 521 | |
| | | | | | | | | | | | | | |
| | | | | | | | | | | | | | |
| | | | | | | | | | | | | | |
Acquisition Date | | | Prior to 2013 | | | Prior to 2013 | | | Prior to 2013 | | | | |
Affiliated Seller in each table | | | Fund VIII | | | Fund VII | | | Fund IX/Urban Direct | | | | |
Anticipated NYRT Ownership | | | 100.0% | | | 100.0% | | | 100.0% | | | | |
See notes to combined statement of revenue and expenses from real estate operations.
F-58
JBG REAL ESTATE OPERATING ASSETS
Supplemental Information—Schedule 1 (Continued)
Combining Statement of Revenue and Expenses from Real Estate Operations (Unaudited)
For the Three Months Ended March 31, 2016
(dollar amounts in thousands)
| | | | | | | | | | | | | | | | | | | |
| | 100% Owned Multifamily | |
|---|
| | Bennington
Crossings | | Brookdale | | Charter
Oak | | Fairmont
Gardens | | Falkland
Chase—North | | Falkland Chase—
South & West | |
|---|
Operating Revenue | | | | | | | | | | | | | | | | | | | |
Base rent | | $ | — | | $ | — | | $ | — | | $ | — | | $ | — | | $ | — | |
Tenant expense recoveries | | | — | | | — | | | — | | | — | | | — | | | — | |
Other operating revenue | | | — | | | — | | | — | | | — | | | — | | | — | |
| | | | | | | | | | | | | | | | | | | | |
Total office and retail revenue | | | — | | | — | | | — | | | — | | | — | | | — | |
Multifamily and other revenue | | | 1,340 | | | 1,872 | | | 1,233 | | | 1,904 | | | 756 | | | 1,337 | |
| | | | | | | | | | | | | | | | | | | | |
Total Operating Revenue | | | 1,340 | | | 1,872 | | | 1,233 | | | 1,904 | | | 756 | | | 1,337 | |
Expenses | | | | | | | | | | | | | | | | | | | |
Payroll expenses | | | 127 | | | 190 | | | 98 | | | 172 | | | 74 | | | 109 | |
Other operating expenses | | | 374 | | | 598 | | | 288 | | | 506 | | | 113 | | | 175 | |
Real estate taxes | | | 131 | | | 181 | | | 144 | | | 152 | | | 71 | | | 94 | |
Insurance | | | 15 | | | 24 | | | 14 | | | 21 | | | 10 | | | 15 | |
Management fees | | | 53 | | | 74 | | | 50 | | | 75 | | | 30 | | | 49 | |
| | | | | | | | | | | | | | | | | | | | |
Total Expenses | | | 700 | | | 1,067 | | | 594 | | | 926 | | | 298 | | | 442 | |
| | | | | | | | | | | | | | | | | | | | |
Revenues in Excess of Expenses (Expenses in Excess of Revenues) | | $ | 640 | | $ | 805 | | $ | 639 | | $ | 978 | | $ | 458 | | $ | 895 | |
| | | | | | | | | | | | | | | | | | | | |
| | | | | | | | | | | | | | | | | | | | |
| | | | | | | | | | | | | | | | | | | | |
Acquisition Date | | | May 9, 2013 | | | Prior to 2013 | | | Prior to 2013 | | | Prior to 2013 | | | March 29, 2013 | | | March 29, 2013 | |
Affiliated Seller in each table | | | Fund VIII | | | Fund IX/Urban Direct | | | Fund VIII | | | Fund IX/Urban Direct | | | Fund VIII | | | Fund VIII | |
Anticipated NYRT Ownership | | | 100.0% | | | 100.0% | | | 100.0% | | | 100.0% | | | 100.0% | | | 100.0%
| |
See notes to combined statement of revenue and expenses from real estate operations.
F-59
JBG REAL ESTATE OPERATING ASSETS
Supplemental Information—Schedule 1 (Continued)
Combining Statement of Revenue and Expenses from Real Estate Operations (Unaudited)
For the Three Months Ended March 31, 2016
(dollar amounts in thousands)
| | | | | | | | | | | | | | | | | | | |
| | 100% Owned Multifamily—Continued | |
| |
|---|
| | Hillwood | | Lynbrook | | Meadowcreek | | Stoneridge | | Subtotal 100%
Owned—
Multifamily | | Total 100%
Owned | |
|---|
Operating Revenue | | | | | | | | | | | | | | | | | | | |
Base rent | | $ | — | | $ | — | | $ | — | | $ | — | | $ | — | | $ | 36,076 | |
Tenant expense recoveries | | | — | | | — | | | — | | | — | | | — | | | 6,931 | |
Other operating revenue | | | — | | | — | | | — | | | — | | | — | | | 2,451 | |
| | | | | | | | | | | | | | | | | | | | |
Total office and retail revenue | | | — | | | — | | | — | | | — | | | — | | | 45,458 | |
Multifamily and other revenue | | | 2,779 | | | 2,389 | | | 1,686 | | | 932 | | | 16,228 | | | 16,228 | |
| | | | | | | | | | | | | | | | | | | | |
Total Operating Revenue | | | 2,779 | | | 2,389 | | | 1,686 | | | 932 | | | 16,228 | | | 61,686 | |
Expenses | | | | | | | | | | | | | | | | | | | |
Payroll expenses | | | 223 | | | 232 | | | 149 | | | 87 | | | 1,461 | | | 3,981 | |
Other operating expenses | | | 648 | | | 623 | | | 431 | | | 205 | | | 3,961 | | | 11,526 | |
Real estate taxes | | | 259 | | | 216 | | | 146 | | | 120 | | | 1,514 | | | 8,757 | |
Insurance | | | 34 | | | 38 | | | 26 | | | 13 | | | 210 | | | 449 | |
Management fees | | | 106 | | | 95 | | | 67 | | | 37 | | | 636 | | | 2,085 | |
| | | | | | | | | | | | | | | | | | | | |
Total Expenses | | | 1,270 | | | 1,204 | | | 819 | | | 462 | | | 7,782 | | | 26,798 | |
| | | | | | | | | | | | | | | | | | | | |
Revenues in Excess of Expenses (Expenses in Excess of Revenues) | | $ | 1,509 | | $ | 1,185 | | $ | 867 | | $ | 470 | | $ | 8,446 | | $ | 34,888 | |
| | | | | | | | | | | | | | | | | | | | |
| | | | | | | | | | | | | | | | | | | | |
| | | | | | | | | | | | | | | | | | | | |
Acquisition Date | | | Prior to 2013 | | | Prior to 2013 | | | Prior to 2013 | | | Prior to 2013 | | | | | | | |
Affiliated Seller in each table | | | Fund IX/Urban Direct | | | Fund IX/Urban Direct | | | Fund IX/Urban Direct | | | Fund IX/Urban Direct | | | | | | | |
Anticipated NYRT Ownership | | | 100.0% | | | 100.0% | | | 100.0% | | | 100.0% | | | | | | | |
See notes to combined statement of revenue and expenses from real estate operations.
F-60
JBG REAL ESTATE OPERATING ASSETS
Supplemental Information—Schedule 1 (Continued)
Combining Statement of Revenue and Expenses from Real Estate Operations (Unaudited)
For the Three Months Ended March 31, 2016
(dollar amounts in thousands)
| | | | | | | | | | | | | | | | | | | |
| | Less Than 100% Owned Office | |
|---|
| | 11333 Woodglen
Drive | | 12440 Parklawn | | 12725 Twinbrook
Parkway | | 12735 Twinbrook
Parkway | | 5600 Fishers
Lane—U.S.
Government
Tenant (GSA) | | 5601 Fishers
Lane—U.S.
Government
Tenant (GSA) | |
|---|
Operating Revenue | | | | | | | | | | | | | | | | | | | |
Base rent | | $ | 506 | | $ | 178 | | $ | 341 | | $ | 538 | | $ | 7,333 | | $ | 3,258 | |
Tenant expense recoveries | | | 74 | | | 37 | | | 218 | | | 625 | | | 12 | | | — | |
Other operating revenue | | | — | | | — | | | 3 | | | — | | | 751 | | | 450 | |
| | | | | | | | | | | | | | | | | | | | |
Total office and retail revenue | | | 580 | | | 215 | | | 562 | | | 1,163 | | | 8,096 | | | 3,708 | |
Multifamily and other revenue | | | — | | | — | | | — | | | — | | | — | | | — | |
| | | | | | | | | | | | | | | | | | | | |
Total Operating Revenue | | | 580 | | | 215 | | | 562 | | | 1,163 | | | 8,096 | | | 3,708 | |
Expenses | | | | | | | | | | | | | | | | | | | |
Payroll expenses | | | 34 | | | 16 | | | 31 | | | 15 | | | 304 | | | 185 | |
Other operating expenses | | | 276 | | | 16 | | | 213 | | | 645 | | | 1,019 | | | 321 | |
Real estate taxes | | | 71 | | | 9 | | | 29 | | | 64 | | | 475 | | | 168 | |
Insurance | | | 3 | | | 1 | | | 4 | | | 5 | | | 54 | | | 28 | |
Management fees | | | 18 | | | 8 | | | 16 | | | 20 | | | 257 | | | 144 | |
| | | | | | | | | | | | | | | | | | | | |
Total Expenses | | | 402 | | | 50 | | | 293 | | | 749 | | | 2,109 | | | 846 | |
| | | | | | | | | | | | | | | | | | | | |
Revenues in Excess of Expenses (Expenses in Excess of Revenues) | | $ | 178 | | $ | 165 | | $ | 269 | | $ | 414 | | $ | 5,987 | | $ | 2,862 | |
| | | | | | | | | | | | | | | | | | | | |
| | | | | | | | | | | | | | | | | | | | |
| | | | | | | | | | | | | | | | | | | | |
Acquisition Date | | | Prior to 2013 | | | Prior to 2013 | | | Prior to 2013 | | | Prior to 2013 | | | Prior to 2013 | | | Prior to 2013 | |
Affiliated Seller in each table | | | Urban Direct | | | Urban Direct | | | Fund I/Fund II/Fund III/JBG Recap | | | Fund I/Fund II/Fund III/JBG Recap | | | Fund VI/Fund VII | | | Fund VI/Fund VII | |
Anticipated NYRT Ownership | | | 18.0% | | | 18.0% | | | 10.0% | | | 10.0% | | | 66.7% | | | 66.7% | |
Anticipated financial statement presentation by combined entity (unaudited) | | | Unconsolidated | | | Unconsolidated | | | Unconsolidated | | | Unconsolidated | | | Consolidated | | | Consolidated
| |
See notes to combined statement of revenue and expenses from real estate operations.
F-61
JBG REAL ESTATE OPERATING ASSETS
Supplemental Information—Schedule 1 (Continued)
Combining Statement of Revenue and Expenses from Real Estate Operations (Unaudited)
For the Three Months Ended March 31, 2016
(dollar amounts in thousands)
| | | | | | | | | | | | | | | | | | | |
| | Less Than 100% Owned Office—Continued | |
|---|
| | 5609 Fishers Lane | | 5625 Fishers Lane | | 5635 Fishers Lane | | 5640 Fishers Lane | | Capitol Point—
North(1) | | Chase Tower | |
|---|
Operating Revenue | | | | | | | | | | | | | | | | | | | |
Base rent | | $ | 176 | | $ | 1,349 | | $ | 1,619 | | $ | 442 | | $ | — | | $ | 2,663 | |
Tenant expense recoveries | | | 32 | | | 823 | | | 127 | | | 520 | | | — | | | 126 | |
Other operating revenue | | | — | | | — | | | 351 | | | — | | | 28 | | | 385 | |
| | | | | | | | | | | | | | | | | | | | |
Total office and retail revenue | | | 208 | | | 2,172 | | | 2,097 | | | 962 | | | 28 | | | 3,174 | |
Multifamily and other revenue | | | — | | | — | | | — | | | — | | | — | | | — | |
| | | | | | | | | | | | | | | | | | | | |
Total Operating Revenue | | | 208 | | | 2,172 | | | 2,097 | | | 962 | | | 28 | | | 3,174 | |
Expenses | | | | | | | | | | | | | | | | | | | |
Payroll expenses | | | 15 | | | 16 | | | 98 | | | 14 | | | 6 | | | 137 | |
Other operating expenses | | | 60 | | | 779 | | | 460 | | | 554 | | | 83 | | | 483 | |
Real estate taxes | | | 18 | | | 166 | | | 135 | | | 54 | | | 161 | | | 297 | |
Insurance | | | 1 | | | 12 | | | 14 | | | 5 | | | 1 | | | 16 | |
Management fees | | | 15 | | | 49 | | | 66 | | | 14 | | | 8 | | | 90 | |
| | | | | | | | | | | | | | | | | | | | |
Total Expenses | | | 109 | | | 1,022 | | | 773 | | | 641 | | | 259 | | | 1,023 | |
| | | | | | | | | | | | | | | | | | | | |
Revenues in Excess of Expenses (Expenses in Excess of Revenues) | | $ | 99 | | $ | 1,150 | | $ | 1,324 | | $ | 321 | | $ | (231 | ) | $ | 2,151 | |
| | | | | | | | | | | | | | | | | | | | |
| | | | | | | | | | | | | | | | | | | | |
| | | | | | | | | | | | | | | | | | | | |
Acquisition Date | | | Prior to 2013 | | | Prior to 2013 | | | Prior to 2013 | | | Prior to 2013 | | | Prior to 2013 | | | Prior to 2013 | |
Affiliated Seller in each table | | | Fund VI/Fund VII | | | Fund I/Fund II/Fund III/JBG Recap | | | Fund I/Fund II/Fund III/JBG Recap | | | Fund I/Fund II/Fund III/JBG Recap | | | Fund VI/Urban Direct | | | Fund I/Fund II/ Fund III/JBG Recap | |
Anticipated NYRT Ownership | | | 66.7% | | | 10.0% | | | 10.0% | | | 10.0% | | | 16.9% | | | 10.0% | |
Anticipated financial statement presentation by combined entity (unaudited) | | | Consolidated | | | Unconsolidated | | | Unconsolidated | | | Unconsolidated | | | Unconsolidated | | | Unconsolidated
| |
(1)—Fund VI currently owns 14.3 percent and Urban currently owns 14.3 percent.
See notes to combined statement of revenue and expenses from real estate operations.
F-62
JBG REAL ESTATE OPERATING ASSETS
Supplemental Information—Schedule 1 (Continued)
Combining Statement of Revenue and Expenses from Real Estate Operations (Unaudited)
For the Three Months Ended March 31, 2016
(dollar amounts in thousands)
| | | | | | | | | | | | | | | | | | | |
| | Less Than 100% Owned Office—Continued | |
|---|
| | Courthouse
Metro
Office | | L'Enfant
Plaza Office—
East(2) | | L'Enfant
Plaza Office—
North(2) | | NoBe II Office | | Pickett
Industrial
Park | | Rosslyn
Gateway—North | |
|---|
Operating Revenue | | | | | | | | | | | | | | | | | | | |
Base rent | | $ | 171 | | $ | 3,973 | | $ | 1,379 | | $ | 209 | | $ | 753 | | $ | 1,133 | |
Tenant expense recoveries | | | 36 | | | 540 | | | 82 | | | 30 | | | 188 | | | 44 | |
Other operating revenue | | | 16 | | | 418 | | | 190 | | | — | | | — | | | 114 | |
| | | | | | | | | | | | | | | | | | | | |
Total office and retail revenue | | | 223 | | | 4,931 | | | 1,651 | | | 239 | | | 941 | | | 1,291 | |
Multifamily and other revenue | | | — | | | — | | | — | | | — | | | — | | | — | |
| | | | | | | | | | | | | | | | | | | | |
Total Operating Revenue | | | 223 | | | 4,931 | | | 1,651 | | | 239 | | | 941 | | | 1,291 | |
Expenses | | | | | | | | | | | | | | | | | | | |
Payroll expenses | | | 20 | | | 310 | | | 229 | | | 75 | | | 23 | | | 107 | |
Other operating expenses | | | 62 | | | 693 | | | 549 | | | 266 | | | 272 | | | 219 | |
Real estate taxes | | | 26 | | | 717 | | | 482 | | | 80 | | | 73 | | | 94 | |
Insurance | | | 1 | | | 18 | | | 16 | | | 4 | | | 10 | | | 5 | |
Management fees | | | 15 | | | 128 | | | 44 | | | 7 | | | 16 | | | 33 | |
| | | | | | | | | | | | | | | | | | | | |
Total Expenses | | | 124 | | | 1,866 | | | 1,320 | | | 432 | | | 394 | | | 458 | |
| | | | | | | | | | | | | | | | | | | | |
Revenues in Excess of Expenses (Expenses in Excess of Revenues) | | $ | 99 | | $ | 3,065 | | $ | 331 | | $ | (193 | ) | $ | 547 | | $ | 833 | |
| | | | | | | | | | | | | | | | | | | | |
| | | | | | | | | | | | | | | | | | | | |
| | | | | | | | | | | | | | | | | | | | |
Acquisition Date | | | Prior to 2013 | | | Prior to 2013 | | | Prior to 2013 | | | Prior to 2013 | | | June 1, 2015 | | | Prior to 2013 | |
Affiliated Seller in each table | | | Urban Direct | | | Fund VI/Urban Direct | | | Fund VI/Urban Direct | | | Urban Direct | | | Fund IX | | | Urban Direct | |
Anticipated NYRT Ownership | | | 18.0% | | | 49.0% | | | 49.0% | | | 18.0% | | | 10.0% | | | 18.0% | |
Anticipated financial statement presentation by combined entity (unaudited) | | | Unconsolidated | | | Unconsolidated | | | Unconsolidated | | | Unconsolidated | | | Unconsolidated | | | Unconsolidated
| |
(2)—Fund VI currently owns 37.8 percent and Urban currently owns 62.2 percent.
See notes to combined statement of revenue and expenses from real estate operations.
F-63
JBG REAL ESTATE OPERATING ASSETS
Supplemental Information—Schedule 1 (Continued)
Combining Statement of Revenue and Expenses from Real Estate Operations (Unaudited)
For the Three Months Ended March 31, 2016
(dollar amounts in thousands)
| | | | | | | | | | | | | |
| | Less Than 100% Owned Office—Continued | |
|---|
| | Rosslyn
Gateway—South | | The Foundry | | Woodglen | | Subtotal Less
Than 100%
Owned—Office | |
|---|
Operating Revenue | | | | | | | | | | | | | |
Base rent | | $ | 633 | | $ | 1,824 | | $ | — | | $ | 28,478 | |
Tenant expense recoveries | | | 33 | | | 45 | | | — | | | 3,592 | |
Other operating revenue | | | 65 | | | 238 | | | 29 | | | 3,038 | |
| | | | | | | | | | | | | | |
Total office and retail revenue | | | 731 | | | 2,107 | | | 29 | | | 35,108 | |
Multifamily and other revenue | | | — | | | — | | | — | | | — | |
| | | | | | | | | | | | | | |
Total Operating Revenue | | | 731 | | | 2,107 | | | 29 | | | 35,108 | |
Expenses | | | | | | | | | | | | | |
Payroll expenses | | | 79 | | | 142 | | | — | | | 1,856 | |
Other operating expenses | | | 158 | | | 430 | | | 1 | | | 7,559 | |
Real estate taxes | | | 85 | | | 402 | | | 15 | | | 3,621 | |
Insurance | | | 3 | | | 24 | | | — | | | 225 | |
Management fees | | | 22 | | | 85 | | | — | | | 1,055 | |
| | | | | | | | | | | | | | |
Total Expenses | | | 347 | | | 1,083 | | | 16 | | | 14,316 | |
| | | | | | | | | | | | | | |
Revenues in Excess of Expenses (Expenses in Excess of Revenues) | | $ | 384 | | $ | 1,024 | | $ | 13 | | $ | 20,792 | |
| | | | | | | | | | | | | | |
| | | | | | | | | | | | | | |
| | | | | | | | | | | | | | |
Acquisition Date | | | Prior to 2013 | | | December 12, 2014 | | | Prior to 2013 | | | | |
Affiliated Seller in each table | | | Urban Direct | | | Fund IX | | | Urban Direct | | | | |
Anticipated NYRT Ownership | | | 18.0% | | | 9.9% | | | 18.0% | | | | |
Anticipated financial statement presentation by combined entity (unaudited) | | | Unconsolidated | | | Unconsolidated | | | Unconsolidated | | | | |
See notes to combined statement of revenue and expenses from real estate operations.
F-64
JBG REAL ESTATE OPERATING ASSETS
Supplemental Information—Schedule 1 (Continued)
Combining Statement of Revenue and Expenses from Real Estate Operations (Unaudited)
For the Three Months Ended March 31, 2016
(dollar amounts in thousands)
| | | | | | | | | | | | | | | | |
| | Less Than 100% Owned Retail | |
|---|
| | Fort Totten
Square Retail | | Galvan Retail | | L'Enfant Plaza
Retail—East(2) | | L'Enfant Plaza
Retail—West(2) | | La Plata
Shopping Center | |
|---|
Operating Revenue | | | | | | | | | | | | | | | | |
Base rent | | $ | 318 | | $ | 737 | | $ | 403 | | $ | 460 | | $ | 304 | |
Tenant expense recoveries | | | 105 | | | 46 | | | 159 | | | 180 | | | 77 | |
Other operating revenue | | | 45 | | | — | | | — | | | 159 | | | — | |
| | | | | | | | | | | | | | | | | |
Total office and retail revenue | | | 468 | | | 783 | | | 562 | | | 799 | | | 381 | |
Multifamily and other revenue | | | — | | | — | | | — | | | — | | | — | |
| | | | | | | | | | | | | | | | | |
Total Operating Revenue | | | 468 | | | 783 | | | 562 | | | 799 | | | 381 | |
Expenses | | | | | | | | | | | | | | | | |
Payroll expenses | | | — | | | — | | | 31 | | | 80 | | | — | |
Other operating expenses | | | 46 | | | 35 | | | 140 | | | 165 | | | 68 | |
Real estate taxes | | | 182 | | | 30 | | | 71 | | | 94 | | | 31 | |
Insurance | | | 4 | | | — | | | 2 | | | 11 | | | 4 | |
Management fees | | | 16 | | | 30 | | | 17 | | | 20 | | | 15 | |
| | | | | | | | | | | | | | | | | |
Total Expenses | | | 248 | | | 95 | | | 261 | | | 370 | | | 118 | |
| | | | | | | | | | | | | | | | | |
Revenues in Excess of Expenses (Expenses in Excess of Revenues) | | $ | 220 | | $ | 688 | | $ | 301 | | $ | 429 | | $ | 263 | |
| | | | | | | | | | | | | | | | | |
| | | | | | | | | | | | | | | | | |
| | | | | | | | | | | | | | | | | |
Acquisition Date | | | Prior to 2013 | | | July 1, 2015 | | | Prior to 2013 | | | Prior to 2013 | | | January 13, 2015 | |
Affiliated Seller in each table | | | Fund VII | | | Urban Direct | | | Fund VI/Urban Direct | | | Fund VI/Urban Direct | | | Fund IX | |
Anticipated NYRT Ownership | | | 99.3% | | | 1.8% | | | 49.0% | | | 49.0% | | | 99.0% | |
Anticipated financial statement presentation by combined entity (unaudited) | | | Consolidated | | | Unconsolidated | | | Unconsolidated | | | Unconsolidated | | | Consolidated
| |
(2)—Fund VI currently owns 37.8 percent and Urban currently owns 62.2 percent.
See notes to combined statement of revenue and expenses from real estate operations.
F-65
JBG REAL ESTATE OPERATING ASSETS
Supplemental Information—Schedule 1 (Continued)
Combining Statement of Revenue and Expenses from Real Estate Operations (Unaudited)
For the Three Months Ended March 31, 2016
(dollar amounts in thousands)
| | | | | | | | | | | | | |
| | Less Than 100% Owned Retail—Continued | |
|---|
| | Leesburg Pike
Retail | | Notch 8 Retail | | Old Centreville
Crossing | | Pikesville
Walgreens | |
|---|
Operating Revenue | | | | | | | | | | | | | |
Base rent | | $ | 163 | | $ | 538 | | $ | 1,047 | | $ | 170 | |
Tenant expense recoveries | | | — | | | 33 | | | 340 | | | 11 | |
Other operating revenue | | | — | | | — | | | 3 | | | — | |
| | | | | | | | | | | | | | |
Total office and retail revenue | | | 163 | | | 571 | | | 1,390 | | | 181 | |
Multifamily and other revenue | | | — | | | — | | | — | | | — | |
| | | | | | | | | | | | | | |
Total Operating Revenue | | | 163 | | | 571 | | | 1,390 | | | 181 | |
Expenses | | | | | | | | | | | | | |
Payroll expenses | | | — | | | — | | | — | | | — | |
Other operating expenses | | | 6 | | | 14 | | | 157 | | | 36 | |
Real estate taxes | | | — | | | 87 | | | 163 | | | 12 | |
Insurance | | | — | | | 2 | | | 5 | | | 1 | |
Management fees | | | 7 | | | 17 | | | 53 | | | 9 | |
| | | | | | | | | | | | | | |
Total Expenses | | | 13 | | | 120 | | | 378 | | | 58 | |
| | | | | | | | | | | | | | |
Revenues in Excess of Expenses (Expenses in Excess of Revenues) | | $ | 150 | | $ | 451 | | $ | 1,012 | | $ | 123 | |
| | | | | | | | | | | | | | |
| | | | | | | | | | | | | | |
| | | | | | | | | | | | | | |
Acquisition Date | | | May 31, 2013 | | | December 23, 2013 | | | July 1, 2015 | | | June 24, 2015 | |
Affiliated Seller in each table | | | Fund VIII | | | Fund VII | | | Fund IX | | | Fund IX | |
Anticipated NYRT Ownership | | | 99.0% | | | 14.7% | | | 99.0% | | | 99.0% | |
Anticipated financial statement presentation by combined entity (unaudited) | | | Consolidated | | | Unconsolidated | | | Consolidated | | | Consolidated
| |
See notes to combined statement of revenue and expenses from real estate operations.
F-66
JBG REAL ESTATE OPERATING ASSETS
Supplemental Information—Schedule 1 (Continued)
Combining Statement of Revenue and Expenses from Real Estate Operations (Unaudited)
For the Three Months Ended March 31, 2016
(dollar amounts in thousands)
| | | | | | | | | | | | | |
| | Less Than 100% Owned Retail—Continued | |
|---|
| | Stonebridge at
Potomac Town
Center—Phase I | | Takoma-Langley
Crossroads
Center | | Vienna
Walgreens | | Subtotal Less
Than 100%
Owned—Retail | |
|---|
Operating Revenue | | | | | | | | | | | | | |
Base rent | | $ | 2,780 | | $ | 874 | | $ | 269 | | $ | 8,063 | |
Tenant expense recoveries | | | 637 | | | 102 | | | — | | | 1,690 | |
Other operating revenue | | | 201 | | | 62 | | | — | | | 470 | |
| | | | | | | | | | | | | | |
Total office and retail revenue | | | 3,618 | | | 1,038 | | | 269 | | | 10,223 | |
Multifamily and other revenue | | | — | | | — | | | — | | | — | |
| | | | | | | | | | | | | | |
Total Operating Revenue | | | 3,618 | | | 1,038 | | | 269 | | | 10,223 | |
Expenses | | | | | | | | | | | | | |
Payroll expenses | | | 42 | | | — | | | — | | | 153 | |
Other operating expenses | | | 466 | | | 150 | | | 6 | | | 1,289 | |
Real estate taxes | | | 467 | | | 109 | | | 63 | | | 1,309 | |
Insurance | | | 21 | | | 3 | | | 1 | | | 54 | |
Management fees | | | 126 | | | 41 | | | 16 | | | 367 | |
| | | | | | | | | | | | | | |
Total Expenses | | | 1,122 | | | 303 | | | 86 | | | 3,172 | |
| | | | | | | | | | | | | | |
Revenues in Excess of Expenses (Expenses in Excess of Revenues) | | $ | 2,496 | | $ | 735 | | $ | 183 | | $ | 7,051 | |
| | | | | | | | | | | | | | |
| | | | | | | | | | | | | | |
| | | | | | | | | | | | | | |
Acquisition Date | | | December 10, 2015 | | | June 24, 2015 | | | June 24, 2015 | | | | |
Affiliated Seller in each table | | | Fund IX | | | Fund IX | | | Fund IX | | | | |
Anticipated NYRT Ownership | | | 10.0% | | | 99.0% | | | 99.0% | | | | |
Anticipated financial statement presentation by combined entity (unaudited) | | | Unconsolidated | | | Consolidated | | | Consolidated | | | | |
See notes to combined statement of revenue and expenses from real estate operations.
F-67
JBG REAL ESTATE OPERATING ASSETS
Supplemental Information—Schedule 1 (Continued)
Combining Statement of Revenue and Expenses from Real Estate Operations (Unaudited)
For the Three Months Ended March 31, 2016
(dollar amounts in thousands)
| | | | | | | | | | | | | | | | | | | |
| | Less Than 100% Owned Multifamily | |
|---|
| | Atlantic
Plumbing | | Fairway
Apartments | | Fort
Totten
Square | | Galvan | | Kennedy
Row | | Notch 8 | |
|---|
Operating Revenue | | | | | | | | | | | | | | | | | | | |
Base rent | | $ | — | | $ | — | | $ | — | | $ | — | | $ | — | | $ | — | |
Tenant expense recoveries | | | — | | | — | | | — | | | — | | | — | | | — | |
Other operating revenue | | | — | | | — | | | — | | | — | | | — | | | — | |
| | | | | | | | | | | | | | | | | | | | |
Total office and retail revenue | | | — | | | — | | | — | | | — | | | — | | | — | |
Multifamily and other revenue | | | 333 | | | 1,731 | | | 848 | | | 219 | | | 835 | | | 574 | |
| | | | | | | | | | | | | | | | | | | | |
Total Operating Revenue | | | 333 | | | 1,731 | | | 848 | | | 219 | | | 835 | | | 574 | |
Expenses | | | | | | | | | | | | | | | | | | | |
Payroll expenses | | | 186 | | | 123 | | | 187 | | | 150 | | | 45 | | | 122 | |
Other operating expenses | | | 295 | | | 412 | | | 265 | | | 243 | | | 100 | | | 178 | |
Real estate taxes | | | 26 | | | 186 | | | — | | | 13 | | | 40 | | | 224 | |
Insurance | | | 29 | | | 22 | | | 26 | | | 10 | | | 9 | | | 15 | |
Management fees | | | 25 | | | 69 | | | 32 | | | 15 | | | 34 | | | 20 | |
| | | | | | | | | | | | | | | | | | | | |
Total Expenses | | | 561 | | | 812 | | | 510 | | | 431 | | | 228 | | | 559 | |
| | | | | | | | | | | | | | | | | | | | |
Revenues in Excess of Expenses (Expenses in Excess of Revenues) | | $ | (228 | ) | $ | 919 | | $ | 338 | | $ | (212 | ) | $ | 607 | | $ | 15 | |
| | | | | | | | | | | | | | | | | | | | |
| | | | | | | | | | | | | | | | | | | | |
| | | | | | | | | | | | | | | | | | | | |
Acquisition Date | | | Prior to 2013 | | | Prior to 2013 | | | Prior to 2013 | | | July 1, 2015 | | | Prior to 2013 | | | December 23, 2013 | |
Affiliated Seller in each table | | | Fund VII | | | Fund IX | | | Fund VII | | | Urban Direct | | | Fund VIII | | | Fund VII | |
Anticipated NYRT Ownership | | | 64.0% | | | 10.0% | | | 99.3% | | | 1.8% | | | 90.0% | | | 14.7% | |
Anticipated financial statement presentation by combined entity (unaudited) | | | Unconsolidated | | | Unconsolidated | | | Consolidated | | | Unconsolidated | | | Consolidated | | | Unconsolidated
| |
See notes to combined statement of revenue and expenses from real estate operations.
F-68
JBG REAL ESTATE OPERATING ASSETS
Supplemental Information—Schedule 1 (Continued)
Combining Statement of Revenue and Expenses from Real Estate Operations (Unaudited)
For the Three Months Ended March 31, 2016
(dollar amounts in thousands)
| | | | | | | | | | | | | | | | | | | |
| | Less Than 100% Owned Multifamily—Continued | |
| |
| |
|---|
| | The
Alaire | | The
Gale | | The
Terano | | Subtotal
Less
Than 100%
Owned—
Multifamily | | Total
Less
Than 100%
Owned | | Combined
Total | |
|---|
Operating Revenue | | | | | | | | | | | | | | | | | | | |
Base rent | | $ | — | | $ | — | | $ | — | | $ | — | | $ | 36,541 | | $ | 72,617 | |
Tenant expense recoveries | | | — | | | — | | | — | | | — | | | 5,282 | | | 12,213 | |
Other operating revenue | | | — | | | — | | | — | | | — | | | 3,508 | | | 5,959 | |
| | | | | | | | | | | | | | | | | | | | |
Total office and retail revenue | | | — | | | — | | | — | | | — | | | 45,331 | | | 90,789 | |
Multifamily and other revenue | | | 1,514 | | | 3,529 | | | 1,145 | | | 10,728 | | | 10,728 | | | 26,956 | |
| | | | | | | | | | | | | | | | | | | | |
Total Operating Revenue | | | 1,514 | | | 3,529 | | | 1,145 | | | 10,728 | | | 56,059 | | | 117,745 | |
Expenses | | | | | | | | | | | | | | | | | | | |
Payroll expenses | | | 130 | | | 286 | | | 90 | | | 1,319 | | | 3,328 | | | 7,309 | |
Other operating expenses | | | 238 | | | 493 | | | 244 | | | 2,468 | | | 11,316 | | | 22,842 | |
Real estate taxes | | | 170 | | | 19 | | | 239 | | | 917 | | | 5,847 | | | 14,604 | |
Insurance | | | 12 | | | 26 | | | 11 | | | 160 | | | 439 | | | 888 | |
Management fees | | | 63 | | | 140 | | | 56 | | | 454 | | | 1,876 | | | 3,961 | |
| | | | | | | | | | | | | | | | | | | | |
Total Expenses | | | 613 | | | 964 | | | 640 | | | 5,318 | | | 22,806 | | | 49,604 | |
| | | | | | | | | | | | | | | | | | | | |
Revenues in Excess of Expenses (Expenses in Excess of Revenues) | | $ | 901 | | $ | 2,565 | | $ | 505 | | $ | 5,410 | | $ | 33,253 | | $ | 68,141 | |
| | | | | | | | | | | | | | | | | | | | |
| | | | | | | | | | | | | | | | | | | | |
| | | | | | | | | | | | | | | | | | | | |
Acquisition Date | | | Prior to 2013 | | | July 31, 2015 | | | Prior to 2013 | | | | | | | | | | |
Affiliated Seller in each table | | | Urban Direct | | | Fund IX | | | Urban Direct | | | | | | | | | | |
Anticipated NYRT Ownership | | | 18.0% | | | 5.0% | | | 1.8% | | | | | | | | | | |
Anticipated financial statement presentation by combined entity (unaudited) | | | Unconsolidated | | | Unconsolidated | | | Unconsolidated | | | | | | | | | | |
See notes to combined statement of revenue and expenses from real estate operations.
F-69
JBG REAL ESTATE OPERATING ASSETS
COMBINED STATEMENT OF REVENUE AND EXPENSES
FROM REAL ESTATE OPERATIONS
Including Independent Auditors' Report
For the Years Ended
December 31, 2015, 2014, and 2013
F-70
Independent Auditors' Report
The Partners of
JBG/Operating Partners, L.P.:
We have audited the accompanying combined statement of revenue and expenses from real estate operations (as defined in Note 1) for each of the years in the three-year period ended December 31, 2015, and the related notes (the "financial statement").
Management's Responsibility for the Financial Statement
Management is responsible for the preparation and fair presentation of this financial statement in accordance with U.S. generally accepted accounting principles; this includes the design, implementation, and maintenance of internal control relevant to the preparation and fair presentation of financial statement that are free from material misstatement, whether due to fraud or error.
Auditors' Responsibility
Our responsibility is to express an opinion on the financial statement based on our audits. We conducted our audits in accordance with auditing standards generally accepted in the United States of America. Those standards require that we plan and perform the audits to obtain reasonable assurance about whether the financial statement is free from material misstatement.
An audit involves performing procedures to obtain audit evidence about the amounts and disclosures in the financial statement. The procedures selected depend on the auditors' judgment, including the assessment of the risks of material misstatement of the financial statement, whether due to fraud or error. In making those risk assessments, the auditor considers internal control relevant to the entity's preparation and fair presentation of the financial statement in order to design audit procedures that are appropriate in the circumstances, but not for the purpose of expressing an opinion on the effectiveness of the entity's internal control. Accordingly, we express no such opinion. An audit also includes evaluating the appropriateness of accounting policies used and the reasonableness of significant accounting estimates made by management, as well as evaluating the overall presentation of the financial statement.
We believe that the audit evidence we have obtained is sufficient and appropriate to provide a basis for our audit opinion.
Opinion
In our opinion, except for the information marked as unaudited, the combined statement of revenue and expenses from real estate operations referred to above presents fairly, in all material respects, the revenue and expenses from real estate operations described in Note 1 of this financial statement for each of the years in the three-year period ended December 31, 2015, in accordance with U.S. generally accepted accounting principles.
Emphasis of Matter
We draw attention to Note 1 to the financial statement, which describes that the accompanying financial statement was prepared for the purpose of complying with the Rule 3-14 of Regulation S-X promulgated under the Securities Act of 1933, as amended (for inclusion in the filing of Form 8-K of New York REIT, Inc.) and is not intended to be a complete presentation of revenues and expenses from real estate operations. Our opinion is not modified with respect to this matter.
F-71
Report on Supplementary Information
Our audits were conducted for the purpose of forming an opinion on the combined financial statement as a whole. The accompanying combining Schedule 1 (year ended December 31, 2015), Schedule 2 (year ended December 31, 2014), and Schedule 3 (year ended December 31, 2013) are presented for purposes of additional analysis and are not a required part of the combined financial statement. Such information is the responsibility of management and was derived from and relates directly to the underlying accounting and other records used to prepare the combined financial statement. The information has been subjected to the auditing procedures applied in the audit of the combined financial statement and certain additional procedures, including comparing and reconciling such information directly to the underlying accounting and other records used to prepare the combined financial statement or to the combined financial statement itself, and other additional procedures in accordance with auditing standards generally accepted in the United States of America. In our opinion, the information is fairly stated in all material respects in relation to the combined financial statement as a whole.
/s/ KPMG LLP
McLean, Virginia
May 25, 2016
F-72
JBG REAL ESTATE OPERATING ASSETS
Combined Statement of Revenue and Expenses from Real Estate Operations
(dollar amounts in thousands)
| | | | | | | | | | |
| | For the Year Ended December 31, | |
|---|
| | 2015 | | 2014 | | 2013 | |
|---|
Operating Revenue | | | | | | | | | | |
Base rent | | $ | 267,666 | | $ | 235,056 | | $ | 214,422 | |
Tenant expense recoveries | | | 42,337 | | | 40,931 | | | 36,233 | |
Other operating revenue | | | 23,359 | | | 19,654 | | | 16,763 | |
| | | | | | | | | | | |
Total office and retail revenue | | | 333,362 | | | 295,641 | | | 267,418 | |
Multifamily and other revenue | | | 89,242 | | | 80,510 | | | 73,670 | |
| | | | | | | | | | | |
Total Operating Revenue | | | 422,604 | | | 376,151 | | | 341,088 | |
Expenses | | | | | | | | | | |
Payroll expenses | | | 23,655 | | | 20,856 | | | 18,810 | |
Other operating expenses | | | 81,680 | | | 70,673 | | | 64,427 | |
Real estate taxes | | | 51,248 | | | 44,938 | | | 43,244 | |
Insurance | | | 3,275 | | | 2,650 | | | 2,416 | |
Management fees | | | 13,183 | | | 11,591 | | | 10,462 | |
| | | | | | | | | | | |
Total Expenses | | | 173,041 | | | 150,708 | | | 139,359 | |
| | | | | | | | | | | |
Operating Revenues in Excess of Expenses | | $ | 249,563 | | $ | 225,443 | | $ | 201,729 | |
| | | | | | | | | | | |
| | | | | | | | | | | |
| | | | | | | | | | | |
See accompanying notes to combined statement of revenue and expenses from real estate operations.
F-73
JBG REAL ESTATE OPERATING ASSETS
Notes to the Combined Statement of
Revenue and Expenses from Real Estate Operations
For the Years Ended December 31, 2015, 2014, and 2013
(dollar amounts in thousands)
NOTE 1—BASIS OF PRESENTATION
JBG Real Estate Operating Assets is not a separate or single legal entity, but rather a combination of real estate operating assets and entities under the common management of JBG/Operating Partners, L.P. and its consolidated subsidiaries (the "Management Company"). The Management Company earns fees in connection with investment, development, asset and property management, leasing, construction management, tenant improvement construction and finance services provided to commercial office properties, multifamily (both rental and for-sale), retail, and hotels. Substantially all fee revenue earned by the Management Company is from services provided to the real estate assets owned by affiliated real estate investment funds and other affiliated real estate investment vehicles (collectively, the "Contributing Entities"). The Contributing Entities hold direct ownership in each real estate asset ("Property Asset") through a separate limited liability company ("Property LLC"). The Management Company, Contributing Entities, Property Assets and Property LLCs are collectively referred to as "JBG".
On May , 2016, JBG and New York REIT, Inc. entered into a Master Combination Agreement (the "Combination Agreement"), pursuant to which the Management Company and the Contributing Entities' interests in certain Property LLCs will be contributed through a series of formation transactions to New York Recovery Operating Partnership, L.P., a Delaware limited partnership (the "Operating Partnership"), in exchange for the right to receive units of limited partnership interest in the Operating Partnership or shares of common stock of New York REIT, Inc. or, in certain circumstances, cash (the "Transaction"). New York REIT, Inc. is the general partner of the Operating Partnership and is a publicly-traded Maryland corporation that operates as a real estate investment trust for U.S. federal tax purposes. New York REIT, Inc. and the Operating Partnership are collectively referred to as "NYRT".
The following are the Contributing Entities: JBG Investment Fund I, L.P. ("Fund I"); JBG Investment Fund II, L.P. ("Fund II"); JBG Investment Fund III, L.P. ("Fund III"); JBG Investment Fund VI, L.L.C. ("Fund VI"); JBG Investment Fund VII, L.L.C. ("Fund VII"); JBG Investment Fund VIII, L.L.C. ("Fund VIII"); JBG Investment Fund IX, L.L.C. ("Fund IX"); JBG/Urban Direct Member, L.L.C. ("Urban Direct"); JBG/Recap Investors, L.L.C. ("JBG Recap"); and JBG/SEFC Fund Investors, L.L.C. and JBG/SEFC Partners L.L.C. ("JBG SEFC").
The Management Company, Contributing Entities and Property LLCs are not entities under common control or subsidiaries of a common parent. The Property Assets presented in the combined statement of revenue and expenses from real estate operations and supplementary information presented in Schedules 1-3 (together the "Statements") have been under common management of the Management Company since the date of acquisition by the applicable Contributing Entity. The date of acquisition is indicated on the Statements (for properties acquired prior to January 1, 2013, the acquisition date is indicated as "Prior to 2013"). If the Asset was acquired by the applicable Contributing Entity prior to January 1, 2013, the Statements present the revenues and expenses for all periods. If the property was acquired on or after January 1, 2013, the Statements present the revenues and expenses from the date of acquisition.
F-74
JBG REAL ESTATE OPERATING ASSETS
Notes to the Combined Statement of
Revenue and Expenses from Real Estate Operations (Continued)
For the Years Ended December 31, 2015, 2014, and 2013
(dollar amounts in thousands)
NOTE 1—BASIS OF PRESENTATION (Continued)
Although NYRT is expected to acquire less than 100 percent equity interest in certain of the Property LLCs, the Statements present 100 percent of the revenue and expenses from real estate operations for each Property Asset. The accompanying supplemental information schedules identify the Contributing Entity, and the percentage ownership in each Property Asset that will be acquired by NYRT. Operating revenue includes contractual base and other rent pursuant to the lease agreements, tenant expense recoveries, and other revenue derived from the operation of the real estate asset. Expenses are the direct expenses associated with operating and maintaining the real estate asset and are expensed as incurred.
All ownership percentages ascribed to NYRT in this statement reflect the ownership held by the Operating Partnership.
NYRT is expected to acquire 100 percent (unaudited) of the ownership interests in the Property LLCs that hold the ownership interests in the following Property Assets:
| | | | |
| Property Asset—Office | | Property Asset—Retail | | Property Asset—Multifamily |
|---|
1233 20th Street | | 275 N. Washington | | Bennington Crossings |
1600 K Street | | North End Retail I | | Brookdale |
1831 Wiehle Avenue | | The Shops at Mark Center | | Charter Oak |
1900 N Street | | | | Fairmont Gardens |
2115 Wisconsin Avenue | | | | Falkland Chase—North |
2121 Wisconsin Avenue | | | | Falkland Chase—South & West |
4747 Bethesda Avenue | | | | Hillwood |
6862 Elm Street | | | | Lynbrook |
800 North Glebe Road | | | | Meadowcreek |
Artery Plaza | | | | Stoneridge |
DOT—U.S. Government Tenant (GSA) | | | | |
Hungerford Plaza | | | | |
Jefferson Court | | | | |
NCI—U.S. Government Tenant (GSA) | | | | |
Old Dominion | | | | |
One Choke Cherry | | | | |
Reston Arboretum | | | | |
RTC—West | | | | |
Summit I | | | | |
Summit II | | | | |
Wiehle Avenue Office Building | | | | |
F-75
JBG REAL ESTATE OPERATING ASSETS
Notes to the Combined Statement of
Revenue and Expenses from Real Estate Operations (Continued)
For the Years Ended December 31, 2015, 2014, and 2013
(dollar amounts in thousands)
NOTE 1—BASIS OF PRESENTATION (Continued)
NYRT is expected to acquire less than 100 percent of the ownership interests in the Property LLCs that hold the ownership interests in the following Property Assets:
| | | | | | |
Property Assets | | Type | | Anticipated NYRT
Ownership
(unaudited) | |
|---|
11333 Woodglen Drive | | Office | | | 18.00 | % |
12440 Parklawn | | Office | | | 18.00 | % |
12725 Twinbrook Parkway | | Office | | | 10.00 | % |
12735 Twinbrook Parkway | | Office | | | 10.00 | % |
5600 Fishers Lane—U.S. Government Tenant (GSA) | | Office | | | 66.70 | % |
5601 Fishers Lane—U.S. Government Tenant (GSA) | | Office | | | 66.70 | % |
5609 Fishers Lane | | Office | | | 66.70 | % |
5625 Fishers Lane | | Office | | | 10.00 | % |
5635 Fishers Lane | | Office | | | 10.00 | % |
5640 Fishers Lane | | Office | | | 10.00 | % |
Capitol Point—North | | Office | | | 16.87 | % |
Chase Tower | | Office | | | 10.00 | % |
Courthouse Metro Office | | Office | | | 18.00 | % |
L'Enfant Plaza Office—East | | Office | | | 49.00 | % |
L'Enfant Plaza Office—North | | Office | | | 49.00 | % |
NoBe II Office | | Office | | | 18.00 | % |
Pickett Industrial Park | | Office | | | 10.00 | % |
Rosslyn Gateway—North | | Office | | | 18.00 | % |
Rosslyn Gateway���South | | Office | | | 18.00 | % |
The Foundry | | Office | | | 9.88 | % |
Woodglen | | Office | | | 18.00 | % |
Fort Totten Square Retail | | Retail | | | 99.30 | % |
Galvan Retail | | Retail | | | 1.80 | % |
L'Enfant Plaza Retail—East | | Retail | | | 49.00 | % |
L'Enfant Plaza Retail—West | | Retail | | | 49.00 | % |
La Plata Shopping Center | | Retail | | | 99.00 | % |
Leesburg Pike Retail | | Retail | | | 99.00 | % |
Notch 8 Retail | | Retail | | | 14.70 | % |
Old Centreville Crossing | | Retail | | | 99.00 | % |
Pikesville Walgreens | | Retail | | | 99.00 | % |
Stonebridge at Potomac Town Center—Phase I | | Retail | | | 10.00 | % |
Takoma—Langley Crossroads Center | | Retail | | | 99.00 | % |
Vienna Walgreens | | Retail | | | 99.00 | % |
Atlantic Plumbing | | Multifamily | | | 64.00 | % |
Fairway Apartments | | Multifamily | | | 10.00 | % |
Fort Totten Square | | Multifamily | | | 99.30 | % |
Galvan | | Multifamily | | | 1.80 | % |
Kennedy Row | | Multifamily | | | 90.00 | % |
Notch 8 | | Multifamily | | | 14.70 | % |
The Alaire | | Multifamily | | | 18.00 | % |
The Gale | | Multifamily | | | 5.00 | % |
The Terano | | Multifamily | | | 1.80 | % |
F-76
JBG REAL ESTATE OPERATING ASSETS
Notes to the Combined Statement of
Revenue and Expenses from Real Estate Operations (Continued)
For the Years Ended December 31, 2015, 2014, and 2013
(dollar amounts in thousands)
NOTE 1—BASIS OF PRESENTATION (Continued)
The accompanying Statements have been prepared for the purpose of complying with Rule 3-14 of Regulation S-X promulgated under the Securities Act of 1933, as amended. Accordingly, the Statements do not reflect the actual operations for the periods presented as revenue and expenses from real estate operations exclude certain revenue and expenses expected to be incurred in the future operations of the Property Assets. Such items include depreciation, amortization, interest expense, interest income, ground rent expense, and amortization of above- and below-market leases. Further, the accompanying Statements do not include any amounts for non-operating real estate assets including land parcels and Property Assets in the pre-development, development, and construction phases.
NOTE 2—SUMMARY OF SIGNIFICANT ACCOUNTING POLICIES
Principles of Combination—The combined statement of revenue and expenses from real estate operations include selected accounts of the Property Assets as described in Note 1. All significant intercompany accounts and transactions have been eliminated in the combined statements of revenue and expenses from real estate operations.
Revenue Recognition—Rental revenue is recognized on a straight-line basis over the non-cancellable lease term when collectability is reasonably assured and the tenant has taken possession or controls the physical use of the leased asset.
Tenant expense recoveries for real estate taxes, common area maintenance, and other recoverable costs are recognized in the period that the expenses are incurred. The recoveries are recognized and presented gross as the Property Assets are generally the primary obligor with respect to purchasing goods and services from third-party suppliers, have discretion in selecting the supplier, and bear the associated credit risk.
Other revenue is revenue derived from lease termination fees and the tenants' use of parking and other property facilities. Lease termination fees are recognized when the related leases are canceled and the landlord has no continuing obligation to provide services to such former tenants. Other revenue is recognized when the related services are utilized by the tenants.
Use of Estimates—Management has made a number of estimates and assumptions relating to the reporting and disclosure of revenue and expenses from real estate operations during the reporting periods to present the statements of revenue and expenses from real estate operations in conformity with accounting principles generally accepted in the United States of America. Actual results could differ from those estimates.
NOTE 3—SUMMARY TABLES (UNAUDITED)
The following tables separately present the aggregate operating revenue and expenses for the wholly-owned Property Assets, and the less than wholly-owned Property Assets. Presentation of amounts as "100% Owned" or "Less Than 100% Owned Consolidated" or "Less Than 100% Owned Non-Consolidated" are unaudited as the subject Transaction has not yet occurred and events, facts and circumstances may change from the date of these Statements through the date of the Transaction which
F-77
JBG REAL ESTATE OPERATING ASSETS
Notes to the Combined Statement of
Revenue and Expenses from Real Estate Operations (Continued)
For the Years Ended December 31, 2015, 2014, and 2013
(dollar amounts in thousands)
NOTE 3—SUMMARY TABLES (UNAUDITED) (Continued)
may affect a consolidation assessment performed in accordance with U.S. generally accepted accounting principles.
Year Ended December 31, 2015
| | | | | | | | | | | | | |
| | 100% Owned | | Less Than 100%
Owned
Consolidated | | Less Than 100%
Owned
Non-Consolidated | | Subtotal | |
|---|
Operating Revenue | | | | | | | | | | | | | |
Base rent | | $ | 142,843 | | $ | 45,557 | | $ | 79,266 | | $ | 267,666 | |
Tenant expense recoveries | | | 25,524 | | | 1,627 | | | 15,186 | | | 42,337 | |
Other operating revenue | | | 11,513 | | | 3,674 | | | 8,172 | | | 23,359 | |
| | | | | | | | | | | | | | |
Total office and retail revenue | | | 179,880 | | | 50,858 | | | 102,624 | | | 333,362 | |
Multifamily and other revenue | | | 64,703 | | | 3,980 | | | 20,559 | | | 89,242 | |
| | | | | | | | | | | | | | |
Total Operating Revenue | | | 244,583 | | | 54,838 | | | 123,183 | | | 422,604 | |
Expenses | | | | | | | | | | | | | |
Payroll expenses | | | 14,327 | | | 2,279 | | | 7,049 | | | 23,655 | |
Other operating expenses | | | 44,369 | | | 6,490 | | | 30,821 | | | 81,680 | |
Real estate taxes | | | 32,500 | | | 3,605 | | | 15,143 | | | 51,248 | |
Insurance | | | 1,813 | | | 573 | | | 889 | | | 3,275 | |
Management fees | | | 7,660 | | | 1,720 | | | 3,803 | | | 13,183 | |
| | | | | | | | | | | | | | |
Total Expenses | | | 100,669 | | | 14,667 | | | 57,705 | | | 173,041 | |
| | | | | | | | | | | | | | |
Operating Revenues in Excess of Expenses | | $ | 143,914 | | $ | 40,171 | | $ | 65,478 | | $ | 249,563 | |
| | | | | | | | | | | | | | |
| | | | | | | | | | | | | | |
| | | | | | | | | | | | | | |
Number of Property Assets | | | 34 | | | 12 | | | 30 | | | 76
| |
F-78
JBG REAL ESTATE OPERATING ASSETS
Notes to the Combined Statement of
Revenue and Expenses from Real Estate Operations (Continued)
For the Years Ended December 31, 2015, 2014, and 2013
(dollar amounts in thousands)
NOTE 3—SUMMARY TABLES (UNAUDITED) (Continued)
Year Ended December 31, 2014
| | | | | | | | | | | | | |
| | 100% Owned | | Less Than 100%
Owned
Consolidated | | Less Than 100%
Owned
Non-Consolidated | | Subtotal | |
|---|
Operating Revenue | | | | | | | | | | | | | |
Base rent | | $ | 132,489 | | $ | 33,054 | | $ | 69,513 | | $ | 235,056 | |
Tenant expense recoveries | | | 25,283 | | | 423 | | | 15,225 | | | 40,931 | |
Other operating revenue | | | 9,978 | | | 2,909 | | | 6,767 | | | 19,654 | |
| | | | | | | | | | | | | | |
Total office and retail revenue | | | 167,750 | | | 36,386 | | | 91,505 | | | 295,641 | |
Multifamily and other revenue | | | 64,059 | | | 3,213 | | | 13,238 | | | 80,510 | |
| | | | | | | | | | | | | | |
Total Operating Revenue | | | 231,809 | | | 39,599 | | | 104,743 | | | 376,151 | |
Expenses | | | | | | | | | | | | | |
Payroll expenses | | | 13,916 | | | 1,642 | | | 5,298 | | | 20,856 | |
Other operating expenses | | | 42,274 | | | 2,635 | | | 25,764 | | | 70,673 | |
Real estate taxes | | | 32,777 | | | 1,117 | | | 11,044 | | | 44,938 | |
Insurance | | | 1,738 | | | 294 | | | 618 | | | 2,650 | |
Management fees | | | 7,514 | | | 1,084 | | | 2,993 | | | 11,591 | |
| | | | | | | | | | | | | | |
Total Expenses | | | 98,219 | | | 6,772 | | | 45,717 | | | 150,708 | |
| | | | | | | | | | | | | | |
Operating Revenues in Excess of Expenses | | $ | 133,590 | | $ | 32,827 | | $ | 59,026 | | $ | 225,443 | |
| | | | | | | | | | | | | | |
| | | | | | | | | | | | | | |
| | | | | | | | | | | | | | |
Number of Property Assets | | | 31 | | | 5 | | | 21 | | | 57
| |
F-79
JBG REAL ESTATE OPERATING ASSETS
Notes to the Combined Statement of
Revenue and Expenses from Real Estate Operations (Continued)
For the Years Ended December 31, 2015, 2014, and 2013
(dollar amounts in thousands)
NOTE 3—SUMMARY TABLES (UNAUDITED) (Continued)
Year Ended December 31, 2013
| | | | | | | | | | | | | |
| | 100% Owned | | Less Than 100%
Owned
Consolidated | | Less Than 100%
Owned
Non-Consolidated | | Subtotal | |
|---|
Operating Revenue | | | | | | | | | | | | | |
Base rent | | $ | 123,060 | | $ | 22,841 | | $ | 68,521 | | $ | 214,422 | |
Tenant expense recoveries | | | 23,849 | | | 72 | | | 12,312 | | | 36,233 | |
Other operating revenue | | | 9,208 | | | 1,712 | | | 5,843 | | | 16,763 | |
| | | | | | | | | | | | | | |
Total office and retail revenue | | | 156,117 | | | 24,625 | | | 86,676 | | | 267,418 | |
Multifamily and other revenue | | | 59,451 | | | 1,213 | | | 13,006 | | | 73,670 | |
| | | | | | | | | | | | | | |
Total Operating Revenue | | | 215,568 | | | 25,838 | | | 99,682 | | | 341,088 | |
Expenses | | | | | | | | | | | | | |
Payroll expenses | | | 12,895 | | | 1,211 | | | 4,704 | | | 18,810 | |
Other operating expenses | | | 39,668 | | | 2,965 | | | 21,794 | | | 64,427 | |
Real estate taxes | | | 30,962 | | | 847 | | | 11,435 | | | 43,244 | |
Insurance | | | 1,583 | | | 225 | | | 608 | | | 2,416 | |
Management fees | | | 6,656 | | | 845 | | | 2,961 | | | 10,462 | |
| | | | | | | | | | | | | | |
Total Expenses | | | 91,764 | | | 6,093 | | | 41,502 | | | 139,359 | |
| | | | | | | | | | | | | | |
Operating Revenues in Excess of Expenses | | $ | 123,804 | | $ | 19,745 | | $ | 58,180 | | $ | 201,729 | |
| | | | | | | | | | | | | | |
| | | | | | | | | | | | | | |
| | | | | | | | | | | | | | |
Number of Property Assets | | | 31 | | | 5 | | | 20 | | | 56
| |
NOTE 4—LEASE COMMITMENTS
There are various lease agreements in place with tenants to lease space in the Property Assets. As of December 31, 2015, the minimum future cash rents receivable under non-cancelable operating leases in each of the next five years and thereafter are as follows:
| | | | |
2016 | | $ | 291,732 | |
2017 | | | 267,047 | |
2018 | | | 249,302 | |
2019 | | | 227,797 | |
2020 | | | 215,272 | |
Thereafter | | | 960,902 | |
| | | | | |
| | $ | 2,212,052 | |
| | | | | |
| | | | | |
| | | | | |
Leases generally require reimbursement of the tenant's proportional share of common area, real estate taxes, and other operating expenses, which are excluded from the amounts above. Future cash rents receivable on multifamily real estate operating assets are excluded from the table above as the lease terms are generally one year or less.
F-80
JBG REAL ESTATE OPERATING ASSETS
Notes to the Combined Statement of
Revenue and Expenses from Real Estate Operations (Continued)
For the Years Ended December 31, 2015, 2014, and 2013
(dollar amounts in thousands)
NOTE 5—TENANT CONCENTRATIONS
For the years ended December 31, 2015, 2014, and 2013, 40 percent, 44 percent, and 41 percent, respectively, of total combined rental revenue was recognized from one government agency tenant.
NOTE 6—RELATED PARTY TRANSACTIONS
The Management Company provides property management and other services for the Contributing Entities and Property Assets which are calculated as a percentage of rental revenue or gross receipts.
For the years ended December 31, 2015, 2014, and 2013, fees totaled $13,183, $11,591, and $10,462, respectively, which are included in management fees on the accompanying combined statement of revenue and expenses from real estate operations.
NOTE 7—SUBSEQUENT EVENTS
Subsequent events were evaluated through May 25, 2016, the date the combined statement of revenue and expenses from real estate operations were available to be issued.
F-81
JBG REAL ESTATE OPERATING ASSETS
Supplemental Information—Schedule 1
Combining Statement of Revenue and Expenses from Real Estate Operations
For the Year Ended December 31, 2015
(dollar amounts in thousands)
| | | | | | | | | | | | | | | | | | | |
| | 100% Owned Office | |
|---|
| | 1233 20th Street | | 1600 K Street | | 1831 Wiehle
Avenue | | 1900 N Street | | 2115 Wisconsin
Avenue | | 2121 Wisconsin
Avenue | |
|---|
Operating Revenue | | | | | | | | | | | | | | | | | | | |
Base rent | | $ | 5,605 | | $ | 3,493 | | $ | 1,898 | | $ | 2,728 | | $ | 5,518 | | $ | 2,963 | |
Tenant expense recoveries | | | 199 | | | 205 | | | 256 | | | 59 | | | 128 | | | 223 | |
Other operating revenue | | | 346 | | | 137 | | | 15 | | | 188 | | | 845 | | | 581 | |
| | | | | | | | | | | | | | | | | | | | |
Total office and retail revenue | | | 6,150 | | | 3,835 | | | 2,169 | | | 2,975 | | | 6,491 | | | 3,767 | |
Multifamily and other revenue | | | — | | | — | | | — | | | — | | | — | | | — | |
| | | | | | | | | | | | | | | | | | | | |
Total Operating Revenue | | | 6,150 | | | 3,835 | | | 2,169 | | | 2,975 | | | 6,491 | | | 3,767 | |
Expenses | | | | | | | | | | | | | | | | | | | |
Payroll expenses | | | 269 | | | 246 | | | 152 | | | 237 | | | 335 | | | 228 | |
Other operating expenses | | | 1,158 | | | 881 | | | 491 | | | 1,226 | | | 1,090 | | | 704 | |
Real estate taxes | | | 1,222 | | | 626 | | | 161 | | | 1,017 | | | 1,004 | | | 679 | |
Insurance | | | 28 | | | 21 | | | 10 | | | 22 | | | 28 | | | 14 | |
Management fees | | | 153 | | | 96 | | | 63 | | | 106 | | | 195 | | | 95 | |
| | | | | | | | | | | | | | | | | | | | |
Total Expenses | | | 2,830 | | | 1,870 | | | 877 | | | 2,608 | | | 2,652 | | | 1,720 | |
| | | | | | | | | | | | | | | | | | | | |
Revenues in Excess of Expenses (Expenses in Excess of Revenues) | | $ | 3,320 | | $ | 1,965 | | $ | 1,292 | | $ | 367 | | $ | 3,839 | | $ | 2,047 | |
| | | | | | | | | | | | | | | | | | | | |
| | | | | | | | | | | | | | | | | | | | |
| | | | | | | | | | | | | | | | | | | | |
Acquisition Date | | | Prior to 2013 | | | Prior to 2013 | | | Prior to 2013 | | | Prior to 2013 | | | Prior to 2013 | | | Prior to 2013 | |
Affiliated Seller in each table | | | Fund VIII | | | Fund VIII | | | Fund VIII/
Urban Direct | | | Fund VI/
Fund VIII | | | Fund VII | | | Fund VII | |
Anticipated NYRT Ownership (unaudited) | | | 100.0% | | | 100.0% | | | 100.0% | | | 100.0% | | | 100.0% | | | 100.0%
| |
See accompanying independent auditors' report.
F-82
JBG REAL ESTATE OPERATING ASSETS
Supplemental Information—Schedule 1 (Continued)
Combining Statement of Revenue and Expenses from Real Estate Operations
For the Year Ended December 31, 2015
(dollar amounts in thousands)
| | | | | | | | | | | | | | | | | | | |
| | 100% Owned Office—Continued | |
|---|
| | 4747 Bethesda
Avenue | | 6862 Elm Street | | 800 North
Glebe Road | | Artery Plaza | | DOT—U.S.
Government
Tenant (GSA) | | Hungerford
Plaza | |
|---|
Operating Revenue | | | | | | | | | | | | | | | | | | | |
Base rent | | $ | 160 | | $ | 3,154 | | $ | 7,826 | | $ | 10,361 | | $ | 38,655 | | $ | 1,705 | |
Tenant expense recoveries | | | 13 | | | 176 | | | 2,824 | | | 376 | | | 19,572 | | | 6 | |
Other operating revenue | | | 566 | | | 36 | | | 1,670 | | | 818 | | | 1,279 | | | 12 | |
| | | | | | | | | | | | | | | | | | | | |
Total office and retail revenue | | | 739 | | | 3,366 | | | 12,320 | | | 11,555 | | | 59,506 | | | 1,723 | |
Multifamily and other revenue | | | — | | | — | | | — | | | — | | | — | | | — | |
| | | | | | | | | | | | | | | | | | | | |
Total Operating Revenue | | | 739 | | | 3,366 | | | 12,320 | | | 11,555 | | | 59,506 | | | 1,723 | |
Expenses | | | | | | | | | | | | | | | | | | | |
Payroll expenses | | | 129 | | | 233 | | | 572 | | | 478 | | | 2,088 | | | 194 | |
Other operating expenses | | | 413 | | | 594 | | | 1,615 | | | 1,996 | | | 6,088 | | | 768 | |
Real estate taxes | | | 256 | | | 320 | | | 1,735 | | | 905 | | | 11,243 | | | 97 | |
Insurance | | | — | | | 16 | | | 50 | | | 47 | | | 280 | | | 13 | |
Management fees | | | — | | | 100 | | | 358 | | | 316 | | | 1,658 | | | 54 | |
| | | | | | | | | | | | | | | | | | | | |
Total Expenses | | | 798 | | | 1,263 | | | 4,330 | | | 3,742 | | | 21,357 | | | 1,126 | |
| | | | | | | | | | | | | | | | | | | | |
Revenues in Excess of Expenses (Expenses in Excess of Revenues) | | $ | (59 | ) | $ | 2,103 | | $ | 7,990 | | $ | 7,813 | | $ | 38,149 | | $ | 597 | |
| | | | | | | | | | | | | | | | | | | | |
| | | | | | | | | | | | | | | | | | | | |
| | | | | | | | | | | | | | | | | | | | |
Acquisition Date | | | Prior to 2013 | | | Prior to 2013 | | | Prior to 2013 | | | Prior to 2013 | | | Prior to 2013 | | | Prior to 2013 | |
Affiliated Seller in each table | | | Fund VIII/
Urban Direct | | | Fund VI/
Fund VII | | | Fund VII/
Urban Direct | | | Fund VI | | | Fund III/
Fund VI/
Fund VII | | | Fund VI | |
Anticipated NYRT Ownership (unaudited) | | | 100.0% | | | 100.0% | | | 100.0% | | | 100.0% | | | 100.0% | | | 100.0%
| |
See accompanying independent auditors' report.
F-83
JBG REAL ESTATE OPERATING ASSETS
Supplemental Information—Schedule 1 (Continued)
Combining Statement of Revenue and Expenses from Real Estate Operations
For the Year Ended December 31, 2015
(dollar amounts in thousands)
| | | | | | | | | | | | | | | | |
| | 100% Owned Office—Continued | |
|---|
| | Jefferson Court | | NCI—U.S.
Government
Tenant (GSA) | | Old Dominion | | One Choke Cherry | | Reston Arboretum | |
|---|
Operating Revenue | | | | | | | | | | | | | | | | |
Base rent | | $ | 11,923 | | $ | 17,825 | | $ | 1,506 | | $ | 7,924 | | $ | 1,972 | |
Tenant expense recoveries | | | 164 | | | 329 | | | 98 | | | 30 | | | 42 | |
Other operating revenue | | | 1,138 | | | 2,752 | | | 21 | | | 594 | | | 39 | |
| | | | | | | | | | | | | | | | | |
Total office and retail revenue | | | 13,225 | | | 20,906 | | | 1,625 | | | 8,548 | | | 2,053 | |
Multifamily and other revenue | | | — | | | — | | | — | | | — | | | — | |
| | | | | | | | | | | | | | | | | |
Total Operating Revenue | | | 13,225 | | | 20,906 | | | 1,625 | | | 8,548 | | | 2,053 | |
Expenses | | | | | | | | | | | | | | | | |
Payroll expenses | | | 561 | | | 846 | | | 151 | | | 305 | | | 199 | |
Other operating expenses | | | 2,408 | | | 2,008 | | | 397 | | | 1,604 | | | 656 | |
Real estate taxes | | | 1,786 | | | 2,432 | | | 178 | | | 480 | | | 204 | |
Insurance | | | 63 | | | 145 | | | 10 | | | 50 | | | 13 | |
Management fees | | | 295 | | | 692 | | | 61 | | | 254 | | | 63 | |
| | | | | | | | | | | | | | | | | |
Total Expenses | | | 5,113 | | | 6,123 | | | 797 | | | 2,693 | | | 1,135 | |
| | | | | | | | | | | | | | | | | |
Revenues in Excess of Expenses (Expenses in Excess of Revenues) | | $ | 8,112 | | $ | 14,783 | | $ | 828 | | $ | 5,855 | | $ | 918 | |
| | | | | | | | | | | | | | | | | |
| | | | | | | | | | | | | | | | | |
| | | | | | | | | | | | | | | | | |
Acquisition Date | | | Prior to 2013 | | | Prior to 2013 | | | Prior to 2013 | | | Prior to 2013 | | | Prior to 2013 | |
Affiliated Seller in each table | | | Fund VIII | | | Fund VI/
Fund VII | | | Fund VI/
Fund VII | | | Fund VI/
Fund VII | | | Fund VII | |
Anticipated NYRT Ownership (unaudited) | | | 100.0% | | | 100.0% | | | 100.0% | | | 100.0% | | | 100.0%
| |
See accompanying independent auditors' report.
F-84
JBG REAL ESTATE OPERATING ASSETS
Supplemental Information—Schedule 1 (Continued)
Combining Statement of Revenue and Expenses from Real Estate Operations
For the Year Ended December 31, 2015
(dollar amounts in thousands)
| | | | | | | | | | | | | | | | |
| | 100% Owned Office—Continued | |
|---|
| | RTC—West | | Summit I | | Summit II | | Wiehle Avenue
Office Building | | Subtotal 100%
Owned Office | |
|---|
Operating Revenue | | | | | | | | | | | | | | | | |
Base rent | | $ | 10,846 | | $ | — | | $ | 3,749 | | $ | 682 | | $ | 140,493 | |
Tenant expense recoveries | | | 109 | | | — | | | 60 | | | 52 | | | 24,921 | |
Other operating revenue | | | 438 | | | — | | | 20 | | | 8 | | | 11,503 | |
| | | | | | | | | | | | | | | | | |
Total office and retail revenue | | | 11,393 | | | — | | | 3,829 | | | 742 | | | 176,917 | |
Multifamily and other revenue | | | — | | | — | | | — | | | — | | | — | |
| | | | | | | | | | | | | | | | | |
Total Operating Revenue | | | 11,393 | | | — | | | 3,829 | | | 742 | | | 176,917 | |
Expenses | | | | | | | | | | | | | | | | |
Payroll expenses | | | 798 | | | 228 | | | 249 | | | 66 | | | 8,564 | |
Other operating expenses | | | 2,690 | | | 397 | | | 944 | | | 258 | | | 28,386 | |
Real estate taxes | | | 1,368 | | | 214 | | | 377 | | | 67 | | | 26,371 | |
Insurance | | | 82 | | | 19 | | | 18 | | | 16 | | | 945 | |
Management fees | | | 298 | | | — | | | 98 | | | 30 | | | 4,985 | |
| | | | | | | | | | | | | | | | | |
Total Expenses | | | 5,236 | | | 858 | | | 1,686 | | | 437 | | | 69,251 | |
| | | | | | | | | | | | | | | | | |
Revenues in Excess of Expenses (Expenses in Excess of Revenues) | | $ | 6,157 | | $ | (858 | ) | $ | 2,143 | | $ | 305 | | $ | 107,666 | |
| | | | | | | | | | | | | | | | | |
| | | | | | | | | | | | | | | | | |
| | | | | | | | | | | | | | | | | |
Acquisition Date | | | Prior to 2013 | | | Prior to 2013 | | | Prior to 2013 | | | July 1, 2015 | | | | |
Affiliated Seller in each table | | | Fund VIII | | | Fund VIII | | | Fund VIII | | | Fund VIII | | | | |
Anticipated NYRT Ownership (unaudited) | | | 100.0% | | | 100.0% | | | 100.0% | | | 100.0% | | | | |
See accompanying independent auditors' report.
F-85
JBG REAL ESTATE OPERATING ASSETS
Supplemental Information—Schedule 1 (Continued)
Combining Statement of Revenue and Expenses from Real Estate Operations
For the Year Ended December 31, 2015
(dollar amounts in thousands)
| | | | | | | | | | | | | |
| | 100% Owned Retail | |
|---|
| | 275 N. Washington | | North End
Retail I | | The Shops at
Mark Center | | Subtotal 100%
Owned Retail | |
|---|
Operating Revenue | | | | | | | | | | | | | |
Base rent | | $ | 523 | | $ | 132 | | $ | 1,695 | | $ | 2,350 | |
Tenant expense recoveries | | | 74 | | | 16 | | | 513 | | | 603 | |
Other operating revenue | | | — | | | 1 | | | 9 | | | 10 | |
| | | | | | | | | | | | | | |
Total office and retail revenue | | | 597 | | | 149 | | | 2,217 | | | 2,963 | |
Multifamily and other revenue | | | — | | | — | | | — | | | — | |
| | | | | | | | | | | | | | |
Total Operating Revenue | | | 597 | | | 149 | | | 2,217 | | | 2,963 | |
Expenses | | | | | | | | | | | | | |
Payroll expenses | | | 30 | | | — | | | 1 | | | 31 | |
Other operating expenses | | | 167 | | | 41 | | | 340 | | | 548 | |
Real estate taxes | | | 135 | | | 8 | | | 190 | | | 333 | |
Insurance | | | 3 | | | 2 | | | 12 | | | 17 | |
Management fees | | | 9 | | | 12 | | | 86 | | | 107 | |
| | | | | | | | | | | | | | |
Total Expenses | | | 344 | | | 63 | | | 629 | | | 1,036 | |
| | | | | | | | | | | | | | |
Revenues in Excess of Expenses (Expenses in Excess of Revenues) | | $ | 253 | | $ | 86 | | $ | 1,588 | | $ | 1,927 | |
| | | | | | | | | | | | | | |
| | | | | | | | | | | | | | |
| | | | | | | | | | | | | | |
Acquisition Date | | | Prior to 2013 | | | Prior to 2013 | | | Prior to 2013 | | | | |
Affiliated Seller in each table | | | Fund VIII | | | Fund VII | | | Fund IX/Urban Direct | | | | |
Anticipated NYRT Ownership (unaudited) | | | 100.0% | | | 100.0% | | | 100.0% | | | | |
See accompanying independent auditors' report.
F-86
JBG REAL ESTATE OPERATING ASSETS
Supplemental Information—Schedule 1 (Continued)
Combining Statement of Revenue and Expenses from Real Estate Operations
For the Year Ended December 31, 2015
(dollar amounts in thousands)
| | | | | | | | | | | | | | | | | | | |
| | 100% Owned Multifamily | |
|---|
| | Bennington
Crossings | | Brookdale | | Charter
Oak | | Fairmont
Gardens | | Falkland
Chase—North | | Falkland Chase—
South & West | |
|---|
Operating Revenue | | | | | | | | | | | | | | | | | | | |
Base rent | | $ | — | | $ | — | | $ | — | | $ | — | | $ | — | | $ | — | |
Tenant expense recoveries | | | — | | | — | | | — | | | — | | | — | | | — | |
Other operating revenue | | | — | | | — | | | — | | | — | | | — | | | — | |
| | | | | | | | | | | | | | | | | | | | |
Total office and retail revenue | | | — | | | — | | | — | | | — | | | — | | | — | |
Multifamily and other revenue | | | 5,466 | | | 7,661 | | | 5,010 | | | 7,628 | | | 3,065 | | | 5,454 | |
| | | | | | | | | | | | | | | | | | | | |
Total Operating Revenue | | | 5,466 | | | 7,661 | | | 5,010 | | | 7,628 | | | 3,065 | | | 5,454 | |
Expenses | | | | | | | | | | | | | | | | | | | |
Payroll expenses | | | 496 | | | 675 | | | 351 | | | 664 | | | 290 | | | 431 | |
Other operating expenses | | | 1,442 | | | 1,881 | | | 1,184 | | | 2,210 | | | 554 | | | 847 | |
Real estate taxes | | | 516 | | | 704 | | | 545 | | | 574 | | | 282 | | | 371 | |
Insurance | | | 65 | | | 108 | | | 58 | | | 92 | | | 39 | | | 57 | |
Management fees | | | 218 | | | 301 | | | 201 | | | 306 | | | 121 | | | 216 | |
| | | | | | | | | | | | | | | | | | | | |
Total Expenses | | | 2,737 | | | 3,669 | | | 2,339 | | | 3,846 | | | 1,286 | | | 1,922 | |
| | | | | | | | | | | | | | | | | | | | |
Revenues in Excess of Expenses (Expenses in Excess of Revenues) | | $ | 2,729 | | $ | 3,992 | | $ | 2,671 | | $ | 3,782 | | $ | 1,779 | | $ | 3,532 | |
| | | | | | | | | | | | | | | | | | | | |
| | | | | | | | | | | | | | | | | | | | |
| | | | | | | | | | | | | | | | | | | | |
Acquisition Date | | | May 9, 2013 | | | Prior to 2013 | | | Prior to 2013 | | | Prior to 2013 | | | March 29, 2013 | | | March 29, 2013 | |
Affiliated Seller in each table | | | Fund VIII | | | Fund IX/Urban Direct | | | Fund VIII | | | Fund IX/Urban Direct | | | Fund VIII | | | Fund VIII | |
Anticipated NYRT Ownership (unaudited) | | | 100.0% | | | 100.0% | | | 100.0% | | | 100.0% | | | 100.0% | | | 100.0%
| |
See accompanying independent auditors' report.
F-87
JBG REAL ESTATE OPERATING ASSETS
Supplemental Information—Schedule 1 (Continued)
Combining Statement of Revenue and Expenses from Real Estate Operations
For the Year Ended December 31, 2015
(dollar amounts in thousands)
| | | | | | | | | | | | | | | | | | | |
| | 100% Owned Multifamily—Continued | |
| |
|---|
| | Hillwood | | Lynbrook | | Meadowcreek | | Stoneridge | | Subtotal 100%
Owned
Multifamily | | Total 100%
Owned | |
|---|
Operating Revenue | | | | | | | | | | | | | | | | | | | |
Base rent | | $ | — | | $ | — | | $ | — | | $ | — | | $ | — | | $ | 142,843 | |
Tenant expense recoveries | | | — | | | — | | | — | | | — | | | — | | | 25,524 | |
Other operating revenue | | | — | | | — | | | — | | | — | | | — | | | 11,513 | |
| | | | | | | | | | | | | | | | | | | | |
Total office and retail revenue | | | — | | | — | | | — | | | — | | | — | | | 179,880 | |
Multifamily and other revenue | | | 10,674 | | | 9,297 | | | 6,701 | | | 3,747 | | | 64,703 | | | 64,703 | |
| | | | | | | | | | | | | | | | | | | | |
Total Operating Revenue | | | 10,674 | | | 9,297 | | | 6,701 | | | 3,747 | | | 64,703 | | | 244,583 | |
Expenses | | | | | | | | | | | | | | | | | | | |
Payroll expenses | | | 958 | | | 962 | | | 571 | | | 334 | | | 5,732 | | | 14,327 | |
Other operating expenses | | | 2,370 | | | 2,417 | | | 1,822 | | | 708 | | | 15,435 | | | 44,369 | |
Real estate taxes | | | 1,006 | | | 833 | | | 564 | | | 401 | | | 5,796 | | | 32,500 | |
Insurance | | | 135 | | | 149 | | | 100 | | | 48 | | | 851 | | | 1,813 | |
Management fees | | | 427 | | | 366 | | | 263 | | | 149 | | | 2,568 | | | 7,660 | |
| | | | | | | | | | | | | | | | | | | | |
Total Expenses | | | 4,896 | | | 4,727 | | | 3,320 | | | 1,640 | | | 30,382 | | | 100,669 | |
| | | | | | | | | | | | | | | | | | | | |
Revenues in Excess of Expenses (Expenses in Excess of Revenues) | | $ | 5,778 | | $ | 4,570 | | $ | 3,381 | | $ | 2,107 | | $ | 34,321 | | $ | 143,914 | |
| | | | | | | | | | | | | | | | | | | | |
| | | | | | | | | | | | | | | | | | | | |
| | | | | | | | | | | | | | | | | | | | |
Acquisition Date | | | Prior to 2013 | | | Prior to 2013 | | | Prior to 2013 | | | Prior to 2013 | | | | | | | |
Affiliated Seller in each table | | | Fund IX/Urban Direct | | | Fund IX/Urban Direct | | | Fund IX/Urban Direct | | | Fund IX/Urban Direct | | | | | | | |
Anticipated NYRT Ownership (unaudited) | | | 100.0% | | | 100.0% | | | 100.0% | | | 100.0% | | | | | | | |
See accompanying independent auditors' report.
F-88
JBG REAL ESTATE OPERATING ASSETS
Supplemental Information—Schedule 1 (Continued)
Combining Statement of Revenue and Expenses from Real Estate Operations
For the Year Ended December 31, 2015
(dollar amounts in thousands)
| | | | | | | | | | | | | | | | | | | |
| | Less Than 100% Owned Office | |
|---|
| | 11333 Woodglen
Drive | | 12440 Parklawn | | 12725 Twinbrook
Parkway | | 12735 Twinbrook
Parkway | | 5600 Fishers
Lane—U.S.
Government
Tenant (GSA) | | 5601 Fishers
Lane—U.S.
Government
Tenant (GSA) | |
|---|
Operating Revenue | | | | | | | | | | | | | | | | | | | |
Base rent | | $ | 1,819 | | $ | 711 | | $ | 1,342 | | $ | 2,154 | | $ | 24,908 | | $ | 13,032 | |
Tenant expense recoveries | | | 392 | | | 169 | | | 820 | | | 2,500 | | | 106 | | | 14 | |
Other operating revenue | | | 143 | | | 3 | | | — | | | 156 | | | 1,721 | | | 1,819 | |
| | | | | | | | | | | | | | | | | | | | |
Total office and retail revenue | | | 2,354 | | | 883 | | | 2,162 | | | 4,810 | | | 26,735 | | | 14,865 | |
Multifamily and other revenue | | | — | | | — | | | — | | | — | | | — | | | — | |
| | | | | | | | | | | | | | | | | | | | |
Total Operating Revenue | | | 2,354 | | | 883 | | | 2,162 | | | 4,810 | | | 26,735 | | | 14,865 | |
Expenses | | | | | | | | | | | | | | | | | | | |
Payroll expenses | | | 125 | | | 49 | | | 98 | | | 62 | | | 1,007 | | | 574 | |
Other operating expenses | | | 744 | | | 85 | | | 848 | | | 2,311 | | | 2,469 | | | 1,384 | |
Real estate taxes | | | 217 | | | 54 | | | 103 | | | 255 | | | 1,104 | | | 667 | |
Insurance | | | 12 | | | 8 | | | 15 | | | 20 | | | 287 | | | 125 | |
Management fees | | | 57 | | | 30 | | | 68 | | | 80 | | | 824 | | | 322 | |
| | | | | | | | | | | | | | | | | | | | |
Total Expenses | | | 1,155 | | | 226 | | | 1,132 | | | 2,728 | | | 5,691 | | | 3,072 | |
| | | | | | | | | | | | | | | | | | | | |
Revenues in Excess of Expenses (Expenses in Excess of Revenues) | | $ | 1,199 | | $ | 657 | | $ | 1,030 | | $ | 2,082 | | $ | 21,044 | | $ | 11,793 | |
| | | | | | | | | | | | | | | | | | | | |
| | | | | | | | | | | | | | | | | | | | |
| | | | | | | | | | | | | | | | | | | | |
Acquisition Date | | | Prior to 2013 | | | Prior to 2013 | | | Prior to 2013 | | | Prior to 2013 | | | Prior to 2013 | | | Prior to 2013 | |
Affiliated Seller in each table | | | Urban Direct | | | Urban Direct | | | Fund I/Fund II/
Fund III/JBG Recap | | | Fund I/Fund II/
Fund III/JBG Recap | | | Fund VI/Fund VII | | | Fund VI/Fund VII | |
Anticipated NYRT Ownership (unaudited) | | | 18.0% | | | 18.0% | | | 10.0% | | | 10.0% | | | 66.7% | | | 66.7% | |
Anticipated financial statement presentation by combined entity (unaudited) | | | Unconsolidated | | | Unconsolidated | | | Unconsolidated | | | Unconsolidated | | | Consolidated | | | Consolidated
| |
See accompanying independent auditors' report.
F-89
JBG REAL ESTATE OPERATING ASSETS
Supplemental Information—Schedule 1 (Continued)
Combining Statement of Revenue and Expenses from Real Estate Operations
For the Year Ended December 31, 2015
(dollar amounts in thousands)
| | | | | | | | | | | | | | | | | | | |
| | Less Than 100% Owned Office—Continued | |
|---|
| | 5609 Fishers
Lane | | 5625 Fishers
Lane | | 5635 Fishers
Lane | | 5640 Fishers
Lane | | Capitol Point—
North(1) | | Chase Tower | |
|---|
Operating Revenue | | | | | | | | | | | | | | | | | | | |
Base rent | | $ | 683 | | $ | 5,395 | | $ | 6,388 | | $ | 1,768 | | $ | 983 | | $ | 10,711 | |
Tenant expense recoveries | | | 125 | | | 3,262 | | | 827 | | | 2,295 | | | 11 | | | 954 | |
Other operating revenue | | | 4 | | | 105 | | | 1,755 | | | — | | | 227 | | | 889 | |
| | | | | | | | | | | | | | | | | | | | |
Total office and retail revenue | | | 812 | | | 8,762 | | | 8,970 | | | 4,063 | | | 1,221 | | | 12,554 | |
Multifamily and other revenue | | | — | | | — | | | — | | | — | | | — | | | — | |
| | | | | | | | | | | | | | | | | | | | |
Total Operating Revenue | | | 812 | | | 8,762 | | | 8,970 | | | 4,063 | | | 1,221 | | | 12,554 | |
Expenses | | | | | | | | | | | | | | | | | | | |
Payroll expenses | | | 55 | | | 56 | | | 321 | | | 39 | | | 65 | | | 416 | |
Other operating expenses | | | 104 | | | 2,680 | | | 1,711 | | | 2,194 | | | 348 | | | 1,891 | |
Real estate taxes | | | 71 | | | 648 | | | 614 | | | 223 | | | 499 | | | 1,157 | |
Insurance | | | 5 | | | 49 | | | 57 | | | 19 | | | 7 | | | 61 | |
Management fees | | | 60 | | | 188 | | | 251 | | | 65 | | | 60 | | | 378 | |
| | | | | | | | | | | | | | | | | | | | |
Total Expenses | | | 295 | | | 3,621 | | | 2,954 | | | 2,540 | | | 979 | | | 3,903 | |
| | | | | | | | | | | | | | | | | | | | |
Revenues in Excess of Expenses (Expenses in Excess of Revenues) | | $ | 517 | | $ | 5,141 | | $ | 6,016 | | $ | 1,523 | | $ | 242 | | $ | 8,651 | |
| | | | | | | | | | | | | | | | | | | | |
| | | | | | | | | | | | | | | | | | | | |
| | | | | | | | | | | | | | | | | | | | |
Acquisition Date | | | Prior to 2013 | | | Prior to 2013 | | | Prior to 2013 | | | Prior to 2013 | | | Prior to 2013 | | | Prior to 2013 | |
Affiliated Seller in each table | | | Fund VI/Fund VII | | | Fund I/Fund II/
Fund III/JBG Recap | | | Fund I/Fund II/
Fund III/JBG Recap | | | Fund I/Fund II/
Fund III/JBG Recap | | | Fund VI/Urban Direct | | | Fund I/Fund II/
Fund III/JBG Recap | |
Anticipated NYRT Ownership (unaudited) | | | 66.7% | | | 10.0% | | | 10.0% | | | 10.0% | | | 16.9% | | | 10.0% | |
Anticipated financial statement presentation by combined entity (unaudited) | | | Consolidated | | | Unconsolidated | | | Unconsolidated | | | Unconsolidated | | | Unconsolidated | | | Unconsolidated
| |
(1) Fund VI currently owns 14.3 percent and Urban currently owns 14.3 percent.
See accompanying independent auditors' report.
F-90
JBG REAL ESTATE OPERATING ASSETS
Supplemental Information—Schedule 1 (Continued)
Combining Statement of Revenue and Expenses from Real Estate Operations
For the Year Ended December 31, 2015
(dollar amounts in thousands)
| | | | | | | | | | | | | | | | | | | |
| | Less Than 100% Owned Office—Continued | |
|---|
| | Courthouse
Metro Office | | L'Enfant
Plaza Office—
East(2) | | L'Enfant
Plaza Office—
North(2) | | NoBe II Office | | Pickett
Industrial Park | | Rosslyn
Gateway—North | |
|---|
Operating Revenue | | | | | | | | | | | | | | | | | | | |
Base rent | | $ | 490 | | $ | 17,157 | | $ | 7,916 | | $ | 1,026 | | $ | 1,758 | | $ | 4,416 | |
Tenant expense recoveries | | | 112 | | | 1,441 | | | 232 | | | 90 | | | 439 | | | 239 | |
Other operating revenue | | | 101 | | | 1,155 | | | 957 | | | 20 | | | 123 | | | 476 | |
| | | | | | | | | | | | | | | | | | | | |
Total office and retail revenue | | | 703 | | | 19,753 | | | 9,105 | | | 1,136 | | | 2,320 | | | 5,131 | |
Multifamily and other revenue | | | — | | | — | | | — | | | — | | | — | | | — | |
| | | | | | | | | | | | | | | | | | | | |
Total Operating Revenue | | | 703 | | | 19,753 | | | 9,105 | | | 1,136 | | | 2,320 | | | 5,131 | |
Expenses | | | | | | | | | | | | | | | | | | | |
Payroll expenses | | | 65 | | | 948 | | | 741 | | | 255 | | | 46 | | | 361 | |
Other operating expenses | | | 330 | | | 2,929 | | | 2,439 | | | 734 | | | 520 | | | 1,035 | |
Real estate taxes | | | 115 | | | 2,993 | | | 1,903 | | | 290 | | | 171 | | | 365 | |
Insurance | | | 4 | | | 75 | | | 70 | | | 18 | | | 17 | | | 18 | |
Management fees | | | 60 | | | 592 | | | 273 | | | 33 | | | 67 | | | 147 | |
| | | | | | | | | | | | | | | | | | | | |
Total Expenses | | | 574 | | | 7,537 | | | 5,426 | | | 1,330 | | | 821 | | | 1,926 | |
| | | | | | | | | | | | | | | | | | | | |
Revenues in Excess of Expenses (Expenses in Excess of Revenues) | | $ | 129 | | $ | 12,216 | | $ | 3,679 | | $ | (194 | ) | $ | 1,499 | | $ | 3,205 | |
| | | | | | | | | | | | | | | | | | | | |
| | | | | | | | | | | | | | | | | | | | |
| | | | | | | | | | | | | | | | | | | | |
Acquisition Date | | | Prior to 2013 | | | Prior to 2013 | | | Prior to 2013 | | | Prior to 2013 | | | June 1, 2015 | | | Prior to 2013 | |
Affiliated Seller in each table | | | Urban Direct | | | Fund VI/
Urban Direct | | | Fund VI/
Urban Direct | | | Urban Direct | | | Fund IX | | | Urban Direct | |
Anticipated NYRT Ownership (unaudited) | | | 18.0% | | | 49.0% | | | 49.0% | | | 18.0% | | | 10.0% | | | 18.0% | |
Anticipated financial statement presentation by combined entity (unaudited) | | | Unconsolidated | | | Unconsolidated | | | Unconsolidated | | | Unconsolidated | | | Unconsolidated | | | Unconsolidated
| |
(2) Fund VI currently owns 37.8 percent and Urban currently owns 62.2 percent.
See accompanying independent auditors' report.
F-91
JBG REAL ESTATE OPERATING ASSETS
Supplemental Information—Schedule 1 (Continued)
Combining Statement of Revenue and Expenses from Real Estate Operations
For the Year Ended December 31, 2015
(dollar amounts in thousands)
| | | | | | | | | | | | | |
| | Less Than 100% Owned Office—Continued | |
|---|
| | Rosslyn
Gateway—South | | The Foundry | | Woodglen | | Subtotal Less
Than 100%
Owned Office | |
|---|
Operating Revenue | | | | | | | | | | | | | |
Base rent | | $ | 2,502 | | $ | 7,718 | | $ | — | | $ | 112,877 | |
Tenant expense recoveries | | | 55 | | | 227 | | | — | | | 14,310 | |
Other operating revenue | | | 456 | | | 1,052 | | | 84 | | | 11,246 | |
| | | | | | | | | | | | | | |
Total office and retail revenue | | | 3,013 | | | 8,997 | | | 84 | | | 138,433 | |
Multifamily and other revenue | | | — | | | — | | | — | | | — | |
| | | | | | | | | | | | | | |
Total Operating Revenue | | | 3,013 | | | 8,997 | | | 84 | | | 138,433 | |
Expenses | | | | | | | | | | | | | |
Payroll expenses | | | 273 | | | 439 | | | — | | | 5,995 | |
Other operating expenses | | | 680 | | | 1,846 | | | 39 | | | 27,321 | |
Real estate taxes | | | 487 | | | 1,810 | | | 39 | | | 13,785 | |
Insurance | | | 13 | | | 102 | | | 1 | | | 983 | |
Management fees | | | 92 | | | 230 | | | — | | | 3,877 | |
| | | | | | | | | | | | | | |
Total Expenses | | | 1,545 | | | 4,427 | | | 79 | | | 51,961 | |
| | | | | | | | | | | | | | |
Revenues in Excess of Expenses (Expenses in Excess of Revenues) | | $ | 1,468 | | $ | 4,570 | | $ | 5 | | $ | 86,472 | |
| | | | | | | | | | | | | | |
| | | | | | | | | | | | | | |
| | | | | | | | | | | | | | |
Acquisition Date | | | Prior to 2013 | | | December 12, 2014 | | | Prior to 2013 | | | | |
Affiliated Seller in each table | | | Urban Direct | | | Fund IX | | | Urban Direct | | | | |
Anticipated NYRT Ownership (unaudited) | | | 18.0% | | | 9.9% | | | 18.0% | | | | |
Anticipated financial statement presentation by combined entity (unaudited) | | | Unconsolidated | | | Unconsolidated | | | Unconsolidated | | | | |
See accompanying independent auditors' report.
F-92
JBG REAL ESTATE OPERATING ASSETS
Supplemental Information—Schedule 1 (Continued)
Combining Statement of Revenue and Expenses from Real Estate Operations
For the Year Ended December 31, 2015
(dollar amounts in thousands)
| | | | | | | | | | | | | | | | |
| | Less Than 100% Owned Retail | |
|---|
| | Fort Totten
Square Retail | | Galvan Retail | | L'Enfant
Plaza Retail—
East(2) | | L'Enfant
Plaza Retail—
West(2) | | La Plata
Shopping Center | |
|---|
Operating Revenue | | | | | | | | | | | | | | | | |
Base rent | | $ | 274 | | $ | 157 | | $ | 1,715 | | $ | 1,911 | | $ | 1,310 | |
Tenant expense recoveries | | | 61 | | | 12 | | | 534 | | | 399 | | | 267 | |
Other operating revenue | | | — | | | — | | | 124 | | | 340 | | | 7 | |
| | | | | | | | | | | | | | | | | |
Total office and retail revenue | | | 335 | | | 169 | | | 2,373 | | | 2,650 | | | 1,584 | |
Multifamily and other revenue | | | — | | | — | | | — | | | — | | | — | |
| | | | | | | | | | | | | | | | | |
Total Operating Revenue | | | 335 | | | 169 | | | 2,373 | | | 2,650 | | | 1,584 | |
Expenses | | | | | | | | | | | | | | | | |
Payroll expenses | | | — | | | — | | | 101 | | | 260 | | | — | |
Other operating expenses | | | 2 | | | — | | | 806 | | | 910 | | | 251 | |
Real estate taxes | | | 182 | | | — | | | 292 | | | 428 | | | 114 | |
Insurance | | | 11 | | | — | | | 7 | | | 45 | | | 14 | |
Management fees | | | 31 | | | 10 | | | 64 | | | 76 | | | 54 | |
| | | | | | | | | | | | | | | | | |
Total Expenses | | | 226 | | | 10 | | | 1,270 | | | 1,719 | | | 433 | |
| | | | | | | | | | | | | | | | | |
Revenues in Excess of Expenses (Expenses in Excess of Revenues) | | $ | 109 | | $ | 159 | | $ | 1,103 | | $ | 931 | | $ | 1,151 | |
| | | | | | | | | | | | | | | | | |
| | | | | | | | | | | | | | | | | |
| | | | | | | | | | | | | | | | | |
Acquisition Date | | | Prior to 2013 | | | July 1, 2015 | | | Prior to 2013 | | | Prior to 2013 | | | January 13, 2015 | |
Affiliated Seller in each table | | | Fund VII | | | Urban Direct | | | Fund VI/
Urban Direct | | | Fund VI/
Urban Direct | | | Fund IX | |
Anticipated NYRT Ownership (unaudited) | | | 99.3% | | | 1.8% | | | 49.0% | | | 49.0% | | | 99.0% | |
Anticipated financial statement presentation by combined entity (unaudited) | | | Consolidated | | | Unconsolidated | | | Unconsolidated | | | Unconsolidated | | | Consolidated
| |
(2) Fund VI currently owns 37.8 percent and Urban currently owns 62.2 percent.
See accompanying independent auditors' report.
F-93
JBG REAL ESTATE OPERATING ASSETS
Supplemental Information—Schedule 1 (Continued)
Combining Statement of Revenue and Expenses from Real Estate Operations
For the Year Ended December 31, 2015
(dollar amounts in thousands)
| | | | | | | | | | | | | |
| | Less Than 100% Owned Retail—Continued | |
|---|
| | Leesburg Pike
Retail | | Notch 8 Retail | | Old Centreville
Crossing | | Pikesville
Walgreens | |
|---|
Operating Revenue | | | | | | | | | | | | | |
Base rent | | $ | 650 | | $ | 676 | | $ | 2,112 | | $ | 354 | |
Tenant expense recoveries | | | — | | | 43 | | | 628 | | | 54 | |
Other operating revenue | | | — | | | — | | | 10 | | | — | |
| | | | | | | | | | | | | | |
Total office and retail revenue | | | 650 | | | 719 | | | 2,750 | | | 408 | |
Multifamily and other revenue | | | — | | | — | | | — | | | — | |
| | | | | | | | | | | | | | |
Total Operating Revenue | | | 650 | | | 719 | | | 2,750 | | | 408 | |
Expenses | | | | | | | | | | | | | |
Payroll expenses | | | — | | | — | | | — | | | — | |
Other operating expenses | | | 15 | | | 12 | | | 382 | | | 35 | |
Real estate taxes | | | — | | | 14 | | | 259 | | | 23 | |
Insurance | | | 1 | | | 2 | | | 20 | | | 2 | |
Management fees | | | 26 | | | 56 | | | 103 | | | 18 | |
| | | | | | | | | | | | | | |
Total Expenses | | | 42 | | | 84 | | | 764 | | | 78 | |
| | | | | | | | | | | | | | |
Revenues in Excess of Expenses (Expenses in Excess of Revenues) | | $ | 608 | | $ | 635 | | $ | 1,986 | | $ | 330 | |
| | | | | | | | | | | | | | |
| | | | | | | | | | | | | | |
| | | | | | | | | | | | | | |
Acquisition Date | | | May 31, 2013 | | | December 23, 2013 | | | July 1, 2015 | | | June 24, 2015 | |
Affiliated Seller in each table | | | Fund VIII | | | Fund VII | | | Fund IX | | | Fund IX | |
Anticipated NYRT Ownership (unaudited) | | | 99.0% | | | 14.7% | | | 99.0% | | | 99.0% | |
Anticipated financial statement presentation by combined entity (unaudited) | | | Consolidated | | | Unconsolidated | | | Consolidated | | | Consolidated
| |
See accompanying independent auditors' report.
F-94
JBG REAL ESTATE OPERATING ASSETS
Supplemental Information—Schedule 1 (Continued)
Combining Statement of Revenue and Expenses from Real Estate Operations
For the Year Ended December 31, 2015
(dollar amounts in thousands)
| | | | | | | | | | | | | |
| | Less Than 100% Owned Retail—Continued | |
|---|
| | Stonebridge at Potomac
Town Center—Phase I | | Takoma-Langley
Crossroads Center | | Vienna Walgreens | | Subtotal Less
Than 100%
Owned Retail | |
|---|
Operating Revenue | | | | | | | | | | | | | |
Base rent | | $ | 553 | | $ | 1,677 | | $ | 557 | | $ | 11,946 | |
Tenant expense recoveries | | | 133 | | | 261 | | | 111 | | | 2,503 | |
Other operating revenue | | | 6 | | | 4 | | | 109 | | | 600 | |
| | | | | | | | | | | | | | |
Total office and retail revenue | | | 692 | | | 1,942 | | | 777 | | | 15,049 | |
Multifamily and other revenue | | | — | | | — | | | — | | | — | |
| | | | | | | | | | | | | | |
Total Operating Revenue | | | 692 | | | 1,942 | | | 777 | | | 15,049 | |
Expenses | | | | | | | | | | | | | |
Payroll expenses | | | — | | | 2 | | | — | | | 363 | |
Other operating expenses | | | — | | | 213 | | | 25 | | | 2,651 | |
Real estate taxes | | | 91 | | | 225 | | | 220 | | | 1,848 | |
Insurance | | | 6 | | | 9 | | | 2 | | | 119 | |
Management fees | | | — | | | 71 | | | 26 | | | 535 | |
| | | | | | | | | | | | | | |
Total Expenses | | | 97 | | | 520 | | | 273 | | | 5,516 | |
| | | | | | | | | | | | | | |
Revenues in Excess of Expenses (Expenses in Excess of Revenues) | | $ | 595 | | $ | 1,422 | | $ | 504 | | $ | 9,533 | |
| | | | | | | | | | | | | | |
| | | | | | | | | | | | | | |
| | | | | | | | | | | | | | |
Acquisition Date | | | December 10, 2015 | | | June 24, 2015 | | | June 24, 2015 | | | | |
Affiliated Seller in each table | | | Fund IX | | | Fund IX | | | Fund IX | | | | |
Anticipated NYRT Ownership (unaudited) | | | 10.0% | | | 99.0% | | | 99.0% | | | | |
Anticipated financial statement presentation by combined entity (unaudited) | | | Unconsolidated | | | Consolidated | | | Consolidated | | | | |
See accompanying independent auditors' report.
F-95
JBG REAL ESTATE OPERATING ASSETS
Supplemental Information—Schedule 1 (Continued)
Combining Statement of Revenue and Expenses from Real Estate Operations
For the Year Ended December 31, 2015
(dollar amounts in thousands)
| | | | | | | | | | | | | | | | | | | |
| | Less Than 100% Owned Multifamily | |
|---|
| | Atlantic
Plumbing | | Fairway
Apartments | | Fort Totten
Square | | Galvan | | Kennedy Row | | Notch 8 | |
|---|
Operating Revenue | | | | | | | | | | | | | | | | | | | |
Base rent | | $ | — | | $ | — | | $ | — | | $ | — | | $ | — | | $ | — | |
Tenant expense recoveries | | | — | | | — | | | — | | | — | | | — | | | — | |
Other operating revenue | | | — | | | — | | | — | | | — | | | — | | | — | |
| | | | | | | | | | | | | | | | | | | | |
Total office and retail revenue | | | — | | | — | | | — | | | — | | | — | | | — | |
Multifamily and other revenue | | | 51 | | | 6,998 | | | 688 | | | 49 | | | 3,292 | | | 335 | |
| | | | | | | | | | | | | | | | | | | | |
Total Operating Revenue | | | 51 | | | 6,998 | | | 688 | | | 49 | | | 3,292 | | | 335 | |
Expenses | | | | | | | | | | | | | | | | | | | |
Payroll expenses | | | 209 | | | 497 | | | 388 | | | 95 | | | 253 | | | 227 | |
Other operating expenses | | | 388 | | | 1,582 | | | 967 | | | 83 | | | 643 | | | 630 | |
Real estate taxes | | | 220 | | | 667 | | | 540 | | | 5 | | | 200 | | | 57 | |
Insurance | | | 29 | | | 91 | | | 61 | | | — | | | 36 | | | 4 | |
Management fees | | | 46 | | | 275 | | | 58 | | | 20 | | | 127 | | | 47 | |
| | | | | | | | | | | | | | | | | | | | |
Total Expenses | | | 892 | | | 3,112 | | | 2,014 | | | 203 | | | 1,259 | | | 965 | |
| | | | | | | | | | | | | | | | | | | | |
Revenues in Excess of Expenses (Expenses in Excess of Revenues) | | $ | (841 | ) | $ | 3,886 | | $ | (1,326 | ) | $ | (154 | ) | $ | 2,033 | | $ | (630 | ) |
| | | | | | | | | | | | | | | | | | | | |
| | | | | | | | | | | | | | | | | | | | |
| | | | | | | | | | | | | | | | | | | | |
Acquisition Date | | | Prior to 2013 | | | Prior to 2013 | | | Prior to 2013 | | | July 1, 2015 | | | Prior to 2013 | | | December 23, 2013 | |
Affiliated Seller in each table | | | Fund VII | | | Fund IX | | | Fund VII | | | Urban Direct | | | Fund VIII | | | Fund VII | |
Anticipated NYRT Ownership (unaudited) | | | 64.0% | | | 10.0% | | | 99.3% | | | 1.8% | | | 90.0% | | | 14.7% | |
Anticipated financial statement presentation by combined entity (unaudited) | | | Unconsolidated | | | Unconsolidated | | | Consolidated | | | Unconsolidated | | | Consolidated | | | Unconsolidated
| |
See accompanying independent auditors' report.
F-96
JBG REAL ESTATE OPERATING ASSETS
Supplemental Information—Schedule 1 (Continued)
Combining Statement of Revenue and Expenses from Real Estate Operations
For the Year Ended December 31, 2015
(dollar amounts in thousands)
| | | | | | | | | | | | | | | | | | | |
| | Less Than 100% Owned Multifamily—Continued | |
| |
| |
|---|
| | The Alaire | | The Gale | | The Terano | | Subtotal
Less Than
100% Owned
Multifamily | | Total
Less Than
100% Owned | | Combined
Total | |
|---|
Operating Revenue | | | | | | | | | | | | | | | | | | | |
Base rent | | $ | — | | $ | — | | $ | — | | $ | — | | $ | 124,823 | | $ | 267,666 | |
Tenant expense recoveries | | | — | | | — | | | — | | | — | | | 16,813 | | | 42,337 | |
Other operating revenue | | | — | | | — | | | — | | | — | | | 11,846 | | | 23,359 | |
| | | | | | | | | | | | | | | | | | | | |
Total office and retail revenue | | | — | | | — | | | — | | | — | | | 153,482 | | | 333,362 | |
Multifamily and other revenue | | | 6,155 | | | 5,684 | | | 1,287 | | | 24,539 | | | 24,539 | | | 89,242 | |
| | | | | | | | | | | | | | | | | | | | |
Total Operating Revenue | | | 6,155 | | | 5,684 | | | 1,287 | | | 24,539 | | | 178,021 | | | 422,604 | |
Expenses | | | | | | | | | | | | | | | | | | | |
Payroll expenses | | | 622 | | | 390 | | | 289 | | | 2,970 | | | 9,328 | | | 23,655 | |
Other operating expenses | | | 1,000 | | | 1,364 | | | 682 | | | 7,339 | | | 37,311 | | | 81,680 | |
Real estate taxes | | | 898 | | | 32 | | | 496 | | | 3,115 | | | 18,748 | | | 51,248 | |
Insurance | | | 60 | | | 53 | | | 26 | | | 360 | | | 1,462 | | | 3,275 | |
Management fees | | | 257 | | | 210 | | | 71 | | | 1,111 | | | 5,523 | | | 13,183 | |
| | | | | | | | | | | | | | | | | | | | |
Total Expenses | | | 2,837 | | | 2,049 | | | 1,564 | | | 14,895 | | | 72,372 | | | 173,041 | |
| | | | | | | | | | | | | | | | | | | | |
Revenues in Excess of Expenses (Expenses in Excess of Revenues) | | $ | 3,318 | | $ | 3,635 | | $ | (277 | ) | $ | 9,644 | | $ | 105,649 | | $ | 249,563 | |
| | | | | | | | | | | | | | | | | | | | |
| | | | | | | | | | | | | | | | | | | | |
| | | | | | | | | | | | | | | | | | | | |
Acquisition Date | | | Prior to 2013 | | | July 31, 2015 | | | Prior to 2013 | | | | | | | | | | |
Affiliated Seller in each table | | | Urban Direct | | | Fund IX | | | Urban Direct | | | | | | | | | | |
Anticipated NYRT Ownership (unaudited) | | | 18.0% | | | 5.0% | | | 1.8% | | | | | | | | | | |
Anticipated financial statement presentation by combined entity (unaudited) | | | Unconsolidated | | | Unconsolidated | | | Unconsolidated | | | | | | | | | | |
See accompanying independent auditors' report.
F-97
JBG REAL ESTATE OPERATING ASSETS
Supplemental Information—Schedule 2
Combining Statement of Revenue and Expenses from Real Estate Operations
For the Year Ended December 31, 2014
(dollar amounts in thousands)
| | | | | | | | | | | | | | | | | | | |
| | 100% Owned Office | |
|---|
| | 1233 20th Street | | 1600 K Street | | 1831 Wiehle
Avenue | | 1900 N Street | | 2115 Wisconsin
Avenue | | 2121 Wisconsin
Avenue | |
|---|
Operating Revenue | | | | | | | | | | | | | | | | | | | |
Base rent | | $ | 5,638 | | $ | 3,256 | | $ | 1,903 | | $ | 3,211 | | $ | 5,518 | | $ | 2,466 | |
Tenant expense recoveries | | | 199 | | | 193 | | | 192 | | | 102 | | | 55 | | | 214 | |
Other operating revenue | | | 294 | | | 148 | | | 1 | | | 182 | | | 854 | | | 502 | |
| | | | | | | | | | | | | | | | | | | | |
Total office and retail revenue | | | 6,131 | | | 3,597 | | | 2,096 | | | 3,495 | | | 6,427 | | | 3,182 | |
Multifamily and other revenue | | | — | | | — | | | — | | | — | | | — | | | — | |
| | | | | | | | | | | | | | | | | | | | |
Total Operating Revenue | | | 6,131 | | | 3,597 | | | 2,096 | | | 3,495 | | | 6,427 | | | 3,182 | |
Expenses | | | | | | | | | | | | | | | | | | | |
Payroll expenses | | | 272 | | | 263 | | | 164 | | | 228 | | | 349 | | | 233 | |
Other operating expenses | | | 1,219 | | | 865 | | | 447 | | | 1,040 | | | 1,071 | | | 719 | |
Real estate taxes | | | 1,138 | | | 618 | | | 179 | | | 777 | | | 918 | | | 531 | |
Insurance | | | 27 | | | 20 | | | 11 | | | 19 | | | 26 | | | 12 | |
Management fees | | | 182 | | | 102 | | | 66 | | | 125 | | | 187 | | | 89 | |
| | | | | | | | | | | | | | | | | | | | |
Total Expenses | | | 2,838 | | | 1,868 | | | 867 | | | 2,189 | | | 2,551 | | | 1,584 | |
| | | | | | | | | | | | | | | | | | | | |
Revenues in Excess of Expenses (Expenses in Excess of Revenues) | | $ | 3,293 | | $ | 1,729 | | $ | 1,229 | | $ | 1,306 | | $ | 3,876 | | $ | 1,598 | |
| | | | | | | | | | | | | | | | | | | | |
| | | | | | | | | | | | | | | | | | | | |
| | | | | | | | | | | | | | | | | | | | |
Acquisition Date | | | Prior to 2013 | | | Prior to 2013 | | | Prior to 2013 | | | Prior to 2013 | | | Prior to 2013 | | | Prior to 2013 | |
Affiliated Seller in each table | | | Fund VIII | | | Fund VIII | | | Fund VIII/
Urban Direct | | | Fund VI/
Fund VIII | | | Fund VII | | | Fund VII | |
Anticipated NYRT Ownership (unaudited) | | | 100.0% | | | 100.0% | | | 100.0% | | | 100.0% | | | 100.0% | | | 100.0%
| |
See accompanying independent auditors' report.
F-98
JBG REAL ESTATE OPERATING ASSETS
Supplemental Information—Schedule 2 (Continued)
Combining Statement of Revenue and Expenses from Real Estate Operations
For the Year Ended December 31, 2014
(dollar amounts in thousands)
| | | | | | | | | | | | | | | | |
| | 100% Owned Office—Continued | |
|---|
| | 4747 Bethesda
Avenue | | 6862 Elm Street | | 800 North
Glebe Road | | Artery
Plaza | | DOT—U.S.
Government
Tenant (GSA) | |
|---|
Operating Revenue | | | | | | | | | | | | | | | | |
Base rent | | $ | 104 | | $ | 3,153 | | $ | 7,880 | | $ | 8,978 | | $ | 38,655 | |
Tenant expense recoveries | | | 6 | | | 154 | | | 2,138 | | | 390 | | | 20,279 | |
Other operating revenue | | | 274 | | | 50 | | | 943 | | | 811 | | | 1,462 | |
| | | | | | | | | | | | | | | | | |
Total office and retail revenue | | | 384 | | | 3,357 | | | 10,961 | | | 10,179 | | | 60,396 | |
Multifamily and other revenue | | | — | | | — | | | — | | | — | | | — | |
| | | | | | | | | | | | | | | | | |
Total Operating Revenue | | | 384 | | | 3,357 | | | 10,961 | | | 10,179 | | | 60,396 | |
Expenses | | | | | | | | | | | | | | | | |
Payroll expenses | | | 111 | | | 217 | | | 453 | | | 467 | | | 2,082 | |
Other operating expenses | | | 341 | | | 556 | | | 1,605 | | | 1,985 | | | 6,016 | |
Real estate taxes | | | 261 | | | 342 | | | 1,537 | | | 869 | | | 12,229 | |
Insurance | | | — | | | 15 | | | 39 | | | 43 | | | 266 | |
Management fees | | | — | | | 100 | | | 259 | | | 292 | | | 1,810 | |
| | | | | | | | | | | | | | | | | |
Total Expenses | | | 713 | | | 1,230 | | | 3,893 | | | 3,656 | | | 22,403 | |
| | | | | | | | | | | | | | | | | |
Revenues in Excess of Expenses (Expenses in Excess of Revenues) | | $ | (329 | ) | $ | 2,127 | | $ | 7,068 | | $ | 6,523 | | $ | 37,993 | |
| | | | | | | | | | | | | | | | | |
| | | | | | | | | | | | | | | | | |
| | | | | | | | | | | | | | | | | |
Acquisition Date | | | Prior to 2013 | | | Prior to 2013 | | | Prior to 2013 | | | Prior to 2013 | | | Prior to 2013 | |
Affiliated Seller in each table | | | Fund VIII/
Urban Direct | | | Fund VI/
Fund VII | | | Fund VII/
Urban Direct | | | Fund VI | | | Fund III/
Fund VI/
Fund VII/
JBG SEFC | |
Anticipated NYRT Ownership (unaudited) | | | 100.0% | | | 100.0% | | | 100.0% | | | 100.0% | | | 100.0%
| |
See accompanying independent auditors' report.
F-99
JBG REAL ESTATE OPERATING ASSETS
Supplemental Information—Schedule 2 (Continued)
Combining Statement of Revenue and Expenses from Real Estate Operations
For the Year Ended December 31, 2014
(dollar amounts in thousands)
| | | | | | | | | | | | | | | | |
| | 100% Owned Office—Continued | |
|---|
| | Hungerford
Plaza | | Jefferson
Court | | NCI—U.S.
Government
Tenant (GSA) | | Old
Dominion | | One Choke
Cherry | |
|---|
Operating Revenue | | | | | | | | | | | | | | | | |
Base rent | | $ | 1,700 | | $ | 10,231 | | $ | 16,063 | | $ | 1,791 | | $ | 6,009 | |
Tenant expense recoveries | | | 5 | | | 227 | | | 286 | | | 86 | | | 234 | |
Other operating revenue | | | 9 | | | 1,046 | | | 2,677 | | | 2 | | | 557 | |
| | | | | | | | | | | | | | | | | |
Total office and retail revenue | | | 1,714 | | | 11,504 | | | 19,026 | | | 1,879 | | | 6,800 | |
Multifamily and other revenue | | | — | | | — | | | — | | | — | | | — | |
| | | | | | | | | | | | | | | | | |
Total Operating Revenue | | | 1,714 | | | 11,504 | | | 19,026 | | | 1,879 | | | 6,800 | |
Expenses | | | | | | | | | | | | | | | | |
Payroll expenses | | | 205 | | | 540 | | | 781 | | | 144 | | | 311 | |
Other operating expenses | | | 649 | | | 2,374 | | | 1,861 | | | 411 | | | 1,544 | |
Real estate taxes | | | 101 | | | 1,716 | | | 2,286 | | | 183 | | | 509 | |
Insurance | | | 13 | | | 58 | | | 136 | | | 7 | | | 46 | |
Management fees | | | 60 | | | 349 | | | 538 | | | 62 | | | 197 | |
| | | | | | | | | | | | | | | | | |
Total Expenses | | | 1,028 | | | 5,037 | | | 5,602 | | | 807 | | | 2,607 | |
| | | | | | | | | | | | | | | | | |
Revenues in Excess of Expenses (Expenses in Excess of Revenues) | | $ | 686 | | $ | 6,467 | | $ | 13,424 | | $ | 1,072 | | $ | 4,193 | |
| | | | | | | | | | | | | | | | | |
| | | | | | | | | | | | | | | | | |
| | | | | | | | | | | | | | | | | |
Acquisition Date | | | Prior to 2013 | | | Prior to 2013 | | | Prior to 2013 | | | Prior to 2013 | | | Prior to 2013 | |
Affiliated Seller in each table | | | Fund VI | | | Fund VIII | | | Fund VI/
Fund VII | | | Fund VI/
Fund VII | | | Fund VI/
Fund VII | |
Anticipated NYRT Ownership (unaudited) | | | 100.0% | | | 100.0% | | | 100.0% | | | 100.0% | | | 100.0%
| |
See accompanying independent auditors' report.
F-100
JBG REAL ESTATE OPERATING ASSETS
Supplemental Information—Schedule 2 (Continued)
Combining Statement of Revenue and Expenses from Real Estate Operations
For the Year Ended December 31, 2014
(dollar amounts in thousands)
| | | | | | | | | | | | | | | | |
| | 100% Owned Office—Continued | |
|---|
| | Reston
Arboretum | | RTC—West | | Summit I | | Summit II | | Subtotal 100%
Owned Office | |
|---|
Operating Revenue | | | | | | | | | | | | | | | | |
Base rent | | $ | 1,619 | | $ | 9,707 | | $ | — | | $ | 3,341 | | $ | 131,223 | |
Tenant expense recoveries | | | 11 | | | 217 | | | — | | | 20 | | | 25,008 | |
Other operating revenue | | | 5 | | | 110 | | | — | | | 42 | | | 9,969 | |
| | | | | | | | | | | | | | | | | |
Total office and retail revenue | | | 1,635 | | | 10,034 | | | — | | | 3,403 | | | 166,200 | |
Multifamily and other revenue | | | — | | | — | | | — | | | — | | | — | |
| | | | | | | | | | | | | | | | | |
Total Operating Revenue | | | 1,635 | | | 10,034 | | | — | | | 3,403 | | | 166,200 | |
Expenses | | | | | | | | | | | | | | | | |
Payroll expenses | | | 199 | | | 777 | | | 200 | | | 196 | | | 8,192 | |
Other operating expenses | | | 539 | | | 2,629 | | | 334 | | | 778 | | | 26,983 | |
Real estate taxes | | | 214 | | | 1,595 | | | 247 | | | 378 | | | 26,628 | |
Insurance | | | 12 | | | 84 | | | 17 | | | 17 | | | 868 | |
Management fees | | | 61 | | | 304 | | | — | | | 78 | | | 4,861 | |
| | | | | | | | | | | | | | | | | |
Total Expenses | | | 1,025 | | | 5,389 | | | 798 | | | 1,447 | | | 67,532 | |
| | | | | | | | | | | | | | | | | |
Revenues in Excess of Expenses (Expenses in Excess of Revenues) | | $ | 610 | | $ | 4,645 | | $ | (798 | ) | $ | 1,956 | | $ | 98,668 | |
| | | | | | | | | | | | | | | | | |
| | | | | | | | | | | | | | | | | |
| | | | | | | | | | | | | | | | | |
Acquisition Date | | | Prior to 2013 | | | Prior to 2013 | | | Prior to 2013 | | | Prior to 2013 | | | | |
Affiliated Seller in each table | | | Fund VII | | | Fund VIII | | | Fund VIII | | | Fund VIII | | | | |
Anticipated NYRT Ownership (unaudited) | | | 100.0% | | | 100.0% | | | 100.0% | | | 100.0% | | | | |
See accompanying independent auditors' report.
F-101
JBG REAL ESTATE OPERATING ASSETS
Supplemental Information—Schedule 2 (Continued)
Combining Statement of Revenue and Expenses from Real Estate Operations
For the Year Ended December 31, 2014
(dollar amounts in thousands)
| | | | | | | |
| | 100% Owned Retail | |
|---|
| | The Shops at
Mark Center | | Subtotal 100%
Owned Retail | |
|---|
Operating Revenue | | | | | | | |
Base rent | | $ | 1,266 | | $ | 1,266 | |
Tenant expense recoveries | | | 275 | | | 275 | |
Other operating revenue | | | 9 | | | 9 | |
| | | | | | | | |
Total office and retail revenue | | | 1,550 | | | 1,550 | |
Multifamily and other revenue | | | — | | | — | |
| | | | | | | | |
Total Operating Revenue | | | 1,550 | | | 1,550 | |
Expenses | | | | | | | |
Payroll expenses | | | — | | | — | |
Other operating expenses | | | 314 | | | 314 | |
Real estate taxes | | | 152 | | | 152 | |
Insurance | | | 13 | | | 13 | |
Management fees | | | 63 | | | 63 | |
| | | | | | | | |
Total Expenses | | | 542 | | | 542 | |
| | | | | | | | |
Revenues in Excess of Expenses (Expenses in Excess of Revenues) | | $ | 1,008 | | $ | 1,008 | |
| | | | | | | | |
| | | | | | | | |
| | | | | | | | |
Acquisition Date | | | Prior to 2013 | | | | |
Affiliated Seller in each table | | | Fund IX/Urban Direct | | | | |
Anticipated NYRT Ownership (unaudited) | | | 100.0% | | | | |
See accompanying independent auditors' report.
F-102
JBG REAL ESTATE OPERATING ASSETS
Supplemental Information—Schedule 2 (Continued)
Combining Statement of Revenue and Expenses from Real Estate Operations
For the Year Ended December 31, 2014
(dollar amounts in thousands)
| | | | | | | | | | | | | | | | | | | |
| | 100% Owned Multifamily | |
|---|
| | Bennington
Crossings | | Brookdale | | Charter Oak | | Fairmont
Gardens | | Falkland
Chase—North | | Falkland
Chase—
South & West | |
|---|
Operating Revenue | | | | | | | | | | | | | | | | | | | |
Base rent | | $ | — | | $ | — | | $ | — | | $ | — | | $ | — | | $ | — | |
Tenant expense recoveries | | | — | | | — | | | — | | | — | | | — | | | — | |
Other operating revenue | | | — | | | — | | | — | | | — | | | — | | | — | |
| | | | | | | | | | | | | | | | | | | | |
Total office and retail revenue | | | — | | | — | | | — | | | — | | | — | | | — | |
Multifamily and other revenue | | | 5,369 | | | 7,597 | | | 4,950 | | | 7,571 | | | 2,954 | | | 5,126 | |
| | | | | | | | | | | | | | | | | | | | |
Total Operating Revenue | | | 5,369 | | | 7,597 | | | 4,950 | | | 7,571 | | | 2,954 | | | 5,126 | |
Expenses | | | | | | | | | | | | | | | | | | | |
Payroll expenses | | | 474 | | | 686 | | | 359 | | | 667 | | | 299 | | | 437 | |
Other operating expenses | | | 1,209 | | | 1,688 | | | 1,161 | | | 2,314 | | | 582 | | | 858 | |
Real estate taxes | | | 541 | | | 720 | | | 620 | | | 560 | | | 276 | | | 365 | |
Insurance | | | 65 | | | 102 | | | 59 | | | 78 | | | 41 | | | 61 | |
Management fees | | | 220 | | | 305 | | | 201 | | | 306 | | | 120 | | | 212 | |
| | | | | | | | | | | | | | | | | | | | |
Total Expenses | | | 2,509 | | | 3,501 | | | 2,400 | | | 3,925 | | | 1,318 | | | 1,933 | |
| | | | | | | | | | | | | | | | | | | | |
Revenues in Excess of Expenses (Expenses in Excess of Revenues) | | $ | 2,860 | | $ | 4,096 | | $ | 2,550 | | $ | 3,646 | | $ | 1,636 | | $ | 3,193 | |
| | | | | | | | | | | | | | | | | | | | |
| | | | | | | | | | | | | | | | | | | | |
| | | | | | | | | | | | | | | | | | | | |
Acquisition Date | | | May 9, 2013 | | | Prior to 2013 | | | Prior to 2013 | | | Prior to 2013 | | | March 29, 2013 | | | March 29, 2013 | |
Affiliated Seller in each table | | | Fund VIII | | | Fund IX/Urban Direct | | | Fund VIII | | | Fund IX/Urban Direct | | | Fund VIII | | | Fund VIII | |
Anticipated NYRT Ownership (unaudited) | | | 100.0% | | | 100.0% | | | 100.0% | | | 100.0% | | | 100.0% | | | 100.0%
| |
See accompanying independent auditors' report.
F-103
JBG REAL ESTATE OPERATING ASSETS
Supplemental Information—Schedule 2 (Continued)
Combining Statement of Revenue and Expenses from Real Estate Operations
For the Year Ended December 31, 2014
(dollar amounts in thousands)
| | | | | | | | | | | | | | | | | | | |
| | 100% Owned Multifamily—Continued | |
| |
|---|
| | Hillwood | | Lynbrook | | Meadowcreek | | Stoneridge | | Subtotal 100%
Owned
Multifamily | | Total 100%
Owned | |
|---|
Operating Revenue | | | | | | | | | | | | | | | | | | | |
Base rent | | $ | — | | $ | — | | $ | — | | $ | — | | $ | — | | $ | 132,489 | |
Tenant expense recoveries | | | — | | | — | | | — | | | — | | | — | | | 25,283 | |
Other operating revenue | | | — | | | — | | | — | | | — | | | — | | | 9,978 | |
| | | | | | | | | | | | | | | | | | | | |
Total office and retail revenue | | | — | | | — | | | — | | | — | | | — | | | 167,750 | |
Multifamily and other revenue | | | 10,823 | | | 9,253 | | | 6,662 | | | 3,754 | | | 64,059 | | | 64,059 | |
| | | | | | | | | | | | | | | | | | | | |
Total Operating Revenue | | | 10,823 | | | 9,253 | | | 6,662 | | | 3,754 | | | 64,059 | | | 231,809 | |
Expenses | | | | | | | | | | | | | | | | | | | |
Payroll expenses | | | 878 | | | 974 | | | 646 | | | 304 | | | 5,724 | | | 13,916 | |
Other operating expenses | | | 2,417 | | | 2,304 | | | 1,727 | | | 717 | | | 14,977 | | | 42,274 | |
Real estate taxes | | | 1,101 | | | 865 | | | 587 | | | 362 | | | 5,997 | | | 32,777 | |
Insurance | | | 142 | | | 154 | | | 104 | | | 51 | | | 857 | | | 1,738 | |
Management fees | | | 433 | | | 373 | | | 268 | | | 152 | | | 2,590 | | | 7,514 | |
| | | | | | | | | | | | | | | | | | | | |
Total Expenses | | | 4,971 | | | 4,670 | | | 3,332 | | | 1,586 | | | 30,145 | | | 98,219 | |
| | | | | | | | | | | | | | | | | | | | |
Revenues in Excess of Expenses (Expenses in Excess of Revenues) | | $ | 5,852 | | $ | 4,583 | | $ | 3,330 | | $ | 2,168 | | $ | 33,914 | | $ | 133,590 | |
| | | | | | | | | | | | | | | | | | | | |
| | | | | | | | | | | | | | | | | | | | |
| | | | | | | | | | | | | | | | | | | | |
Acquisition Date | | | Prior to 2013 | | | Prior to 2013 | | | Prior to 2013 | | | Prior to 2013 | | | | | | | |
Affiliated Seller in each table | | | Fund IX/Urban Direct | | | Fund IX/Urban Direct | | | Fund IX/Urban Direct | | | Fund IX/Urban Direct | | | | | | | |
Anticipated NYRT Ownership (unaudited) | | | 100.0% | | | 100.0% | | | 100.0% | | | 100.0% | | | | | | | |
See accompanying independent auditors' report.
F-104
JBG REAL ESTATE OPERATING ASSETS
Supplemental Information—Schedule 2 (Continued)
Combining Statement of Revenue and Expenses from Real Estate Operations
For the Year Ended December 31, 2014
(dollar amounts in thousands)
| | | | | | | | | | | | | | | | | | | |
| | Less Than 100% Owned Office | |
|---|
| | 11333 Woodglen
Drive | | 12440 Parklawn | | 12725 Twinbrook
Parkway | | 12735 Twinbrook
Parkway | | 5600 Fishers
Lane—U.S.
Government
Tenant (GSA) | | 5601 Fishers
Lane—U.S.
Government
Tenant (GSA) | |
|---|
Operating Revenue | | | | | | | | | | | | | | | | | | | |
Base rent | | $ | 1,908 | | $ | — | | $ | 1,398 | | $ | 2,154 | | $ | 21,743 | | $ | 9,949 | |
Tenant expense recoveries | | | 481 | | | — | | | 1,052 | | | 2,458 | | | 317 | | | — | |
Other operating revenue | | | 105 | | | 18 | | | — | | | 132 | | | 1,298 | | | 1,580 | |
| | | | | | | | | | | | | | | | | | | | |
Total office and retail revenue | | | 2,494 | | | 18 | | | 2,450 | | | 4,744 | | | 23,358 | | | 11,529 | |
Multifamily and other revenue | | | — | | | — | | | — | | | — | | | — | | | — | |
| | | | | | | | | | | | | | | | | | | | |
Total Operating Revenue | | | 2,494 | | | 18 | | | 2,450 | | | 4,744 | | | 23,358 | | | 11,529 | |
Expenses | | | | | | | | | | | | | | | | | | | |
Payroll expenses | | | 122 | | | 39 | | | 108 | | | 29 | | | 891 | | | 422 | |
Other operating expenses | | | 732 | | | 147 | | | 820 | | | 2,262 | | | 1,194 | | | 832 | |
Real estate taxes | | | 149 | | | 14 | | | 98 | | | 249 | | | 796 | | | 214 | |
Insurance | | | 9 | | | 5 | | | 15 | | | 22 | | | 226 | | | 26 | |
Management fees | | | 62 | | | — | | | 70 | | | 76 | | | 798 | | | 73 | |
| | | | | | | | | | | | | | | | | | | | |
Total Expenses | | | 1,074 | | | 205 | | | 1,111 | | | 2,638 | | | 3,905 | | | 1,567 | |
| | | | | | | | | | | | | | | | | | | | |
Revenues in Excess of Expenses (Expenses in Excess of Revenues) | | $ | 1,420 | | $ | (187 | ) | $ | 1,339 | | $ | 2,106 | | $ | 19,453 | | $ | 9,962 | |
| | | | | | | | | | | | | | | | | | | | |
| | | | | | | | | | | | | | | | | | | | |
| | | | | | | | | | | | | | | | | | | | |
Acquisition Date | | | Prior to 2013 | | | Prior to 2013 | | | Prior to 2013 | | | Prior to 2013 | | | Prior to 2013 | | | Prior to 2013 | |
Affiliated Seller in each table | | | Urban Direct | | | Urban Direct | | | Fund I/
Fund II/
Fund III | | | Fund I/
Fund II/
Fund III | | | Fund VI/Fund VII | | | Fund VI/Fund VII | |
Anticipated NYRT Ownership (unaudited) | | | 18.0% | | | 18.0% | | | 10.0% | | | 10.0% | | | 66.7% | | | 66.7% | |
Anticipated financial statement presentation by combined entity (unaudited) | | | Unconsolidated | | | Unconsolidated | | | Unconsolidated | | | Unconsolidated | | | Consolidated | | | Consolidated
| |
See accompanying independent auditors' report.
F-105
JBG REAL ESTATE OPERATING ASSETS
Supplemental Information—Schedule 2 (Continued)
Combining Statement of Revenue and Expenses from Real Estate Operations
For the Year Ended December 31, 2014
(dollar amounts in thousands)
| | | | | | | | | | | | | | | | |
| | Less Than 100% Owned Office—Continued | |
|---|
| | 5609 Fishers
Lane | | 5625 Fishers
Lane | | 5635 Fishers
Lane | | 5640 Fishers
Lane | | Capitol Point—
North(1) | |
|---|
Operating Revenue | | | | | | | | | | | | | | | | |
Base rent | | $ | 712 | | $ | 5,395 | | $ | 6,481 | | $ | 1,768 | | $ | 2,064 | |
Tenant expense recoveries | | | 106 | | | 3,913 | | | 877 | | | 2,681 | | | 81 | |
Other operating revenue | | | 26 | | | 105 | | | 1,217 | | | — | | | 119 | |
| | | | | | | | | | | | | | | | | |
Total office and retail revenue | | | 844 | | | 9,413 | | | 8,575 | | | 4,449 | | | 2,264 | |
Multifamily and other revenue | | | — | | | — | | | — | | | — | | | — | |
| | | | | | | | | | | | | | | | | |
Total Operating Revenue | | | 844 | | | 9,413 | | | 8,575 | | | 4,449 | | | 2,264 | |
Expenses | | | | | | | | | | | | | | | | |
Payroll expenses | | | 42 | | | 38 | | | 307 | | | 33 | | | 85 | |
Other operating expenses | | | 99 | | | 3,334 | | | 1,615 | | | 2,552 | | | 534 | |
Real estate taxes | | | 66 | | | 636 | | | 633 | | | 219 | | | 488 | |
Insurance | | | 5 | | | 50 | | | 57 | | | 23 | | | 6 | |
Management fees | | | 60 | | | 184 | | | 254 | | | 66 | | | 64 | |
| | | | | | | | | | | | | | | | | |
Total Expenses | | | 272 | | | 4,242 | | | 2,866 | | | 2,893 | | | 1,177 | |
| | | | | | | | | | | | | | | | | |
Revenues in Excess of Expenses (Expenses in Excess of Revenues) | | $ | 572 | | $ | 5,171 | | $ | 5,709 | | $ | 1,556 | | $ | 1,087 | |
| | | | | | | | | | | | | | | | | |
| | | | | | | | | | | | | | | | | |
| | | | | | | | | | | | | | | | | |
Acquisition Date | | | Prior to 2013 | | | Prior to 2013 | | | Prior to 2013 | | | Prior to 2013 | | | Prior to 2013 | |
Affiliated Seller in each table | | | Fund VI/
Fund VII | | | Fund I/Fund II/
Fund III | | | Fund I/
Fund II/
Fund III | | | Fund I/
Fund II/
Fund III | | | Fund VI/
Urban Direct | |
Anticipated NYRT Ownership (unaudited) | | | 66.7% | | | 10.0% | | | 10.0% | | | 10.0% | | | 16.9% | |
Anticipated financial statement presentation by combined entity (unaudited) | | | Consolidated | | | Unconsolidated | | | Unconsolidated | | | Unconsolidated | | | Unconsolidated
| |
(1) Fund VI currently owns 14.3 percent and Urban currently owns 14.3 percent.
See accompanying independent auditors' report.
F-106
JBG REAL ESTATE OPERATING ASSETS
Supplemental Information—Schedule 2 (Continued)
Combining Statement of Revenue and Expenses from Real Estate Operations
For the Year Ended December 31, 2014
(dollar amounts in thousands)
| | | | | | | | | | | | | | | | |
| | Less Than 100% Owned Office—Continued | |
|---|
| | Chase Tower | | Courthouse Metro
Office | | L'Enfant
Plaza Office—
East(2) | | L'Enfant
Plaza Office—
North(2) | | NoBe II Office | |
|---|
Operating Revenue | | | | | | | | | | | | | | | | |
Base rent | | $ | 10,772 | | $ | 803 | | $ | 17,077 | | $ | 8,330 | | $ | 1,216 | |
Tenant expense recoveries | | | 671 | | | 157 | | | 1,849 | | | 127 | | | 98 | |
Other operating revenue | | | 952 | | | 63 | | | 977 | | | 966 | | | 8 | |
| | | | | | | | | | | | | | | | | |
Total office and retail revenue | | | 12,395 | | | 1,023 | | | 19,903 | | | 9,423 | | | 1,322 | |
Multifamily and other revenue | | | — | | | — | | | — | | | — | | | — | |
| | | | | | | | | | | | | | | | | |
Total Operating Revenue | | | 12,395 | | | 1,023 | | | 19,903 | | | 9,423 | | | 1,322 | |
Expenses | | | | | | | | | | | | | | | | |
Payroll expenses | | | 371 | | | 58 | | | 995 | | | 733 | | | 254 | |
Other operating expenses | | | 1,689 | | | 525 | | | 3,135 | | | 2,412 | | | 711 | |
Real estate taxes | | | 1,098 | | | 92 | | | 2,531 | | | 1,688 | | | 259 | |
Insurance | | | 57 | | | 3 | | | 73 | | | 63 | | | 13 | |
Management fees | | | 372 | | | 60 | | | 554 | | | 270 | | | 39 | |
| | | | | | | | | | | | | | | | | |
Total Expenses | | | 3,587 | | | 738 | | | 7,288 | | | 5,166 | | | 1,276 | |
| | | | | | | | | | | | | | | | | |
Revenues in Excess of Expenses (Expenses in Excess of Revenues) | | $ | 8,808 | | $ | 285 | | $ | 12,615 | | $ | 4,257 | | $ | 46 | |
| | | | | | | | | | | | | | | | | |
| | | | | | | | | | | | | | | | | |
| | | | | | | | | | | | | | | | | |
Acquisition Date | | | Prior to 2013 | | | Prior to 2013 | | | Prior to 2013 | | | Prior to 2013 | | | Prior to 2013 | |
Affiliated Seller in each table | | | Fund I/
Fund II/
Fund III | | | Urban Direct | | | Fund VI/
Urban Direct | | | Fund VI/
Urban Direct | | | Urban Direct | |
Anticipated NYRT Ownership (unaudited) | | | 10.0% | | | 18.0% | | | 49.0% | | | 49.0% | | | 18.0% | |
Anticipated financial statement presentation by combined entity (unaudited) | | | Unconsolidated | | | Unconsolidated | | | Unconsolidated | | | Unconsolidated | | | Unconsolidated
| |
(2) Fund VI currently owns 37.8 percent and Urban currently owns 62.2 percent.
See accompanying independent auditors' report.
F-107
JBG REAL ESTATE OPERATING ASSETS
Supplemental Information—Schedule 2 (Continued)
Combining Statement of Revenue and Expenses from Real Estate Operations
For the Year Ended December 31, 2014
(dollar amounts in thousands)
| | | | | | | | | | | | | | | | |
| | Less Than 100% Owned Office—Continued | |
|---|
| | Rosslyn Gateway—
North | | Rosslyn Gateway—
South | | The Foundry | | Woodglen | | Subtotal Less Than
100% Owned Office | |
|---|
Operating Revenue | | | | | | | | | | | | | | | | |
Base rent | | $ | 4,232 | | $ | 2,637 | | $ | 384 | | $ | — | | $ | 99,023 | |
Tenant expense recoveries | | | 144 | | | 121 | | | 14 | | | — | | | 15,147 | |
Other operating revenue | | | 563 | | | 370 | | | 50 | | | 111 | | | 8,660 | |
| | | | | | | | | | | | | | | | | |
Total office and retail revenue | | | 4,939 | | | 3,128 | | | 448 | | | 111 | | | 122,830 | |
Multifamily and other revenue | | | — | | | — | | | — | | | — | | | — | |
| | | | | | | | | | | | | | | | | |
Total Operating Revenue | | | 4,939 | | | 3,128 | | | 448 | | | 111 | | | 122,830 | |
Expenses | | | | | | | | | | | | | | | | |
Payroll expenses | | | 381 | | | 276 | | | 18 | | | — | | | 5,202 | |
Other operating expenses | | | 906 | | | 630 | | | 42 | | | 11 | | | 24,182 | |
Real estate taxes | | | 353 | | | 319 | | | 99 | | | 17 | | | 10,018 | |
Insurance | | | 19 | | | 14 | | | — | | | 1 | | | 687 | |
Management fees | | | 149 | | | 91 | | | 24 | | | — | | | 3,266 | |
| | | | | | | | | | | | | | | | | |
Total Expenses | | | 1,808 | | | 1,330 | | | 183 | | | 29 | | | 43,355 | |
| | | | | | | | | | | | | | | | | |
Revenues in Excess of Expenses (Expenses in Excess of Revenues) | | $ | 3,131 | | $ | 1,798 | | $ | 265 | | $ | 82 | | $ | 79,475 | |
| | | | | | | | | | | | | | | | | |
| | | | | | | | | | | | | | | | | |
| | | | | | | | | | | | | | | | | |
Acquisition Date | | | Prior to 2013 | | | Prior to 2013 | | | December 12, 2014 | | | Prior to 2013 | | | | |
Affiliated Seller in each table | | | Urban Direct | | | Urban Direct | | | Fund IX | | | Urban Direct | | | | |
Anticipated NYRT Ownership (unaudited) | | | 18.0% | | | 18.0% | | | 9.9% | | | 18.0% | | | | |
Anticipated financial statement presentation by combined entity (unaudited) | | | Unconsolidated | | | Unconsolidated | | | Unconsolidated | | | Unconsolidated | | | | |
See accompanying independent auditors' report.
F-108
JBG REAL ESTATE OPERATING ASSETS
Supplemental Information—Schedule 2 (Continued)
Combining Statement of Revenue and Expenses from Real Estate Operations
For the Year Ended December 31, 2014
(dollar amounts in thousands)
| | | | | | | | | | | | | |
| | Less Than 100% Owned Retail | |
|---|
| | L'Enfant Plaza
Retail—East(2) | | L'Enfant Plaza
Retail—West(2) | | Leesburg Pike
Retail | | Subtotal Less Than
100% Owned Retail | |
|---|
Operating Revenue | | | | | | | | | | | | | |
Base rent | | $ | 1,356 | | $ | 1,538 | | $ | 650 | | $ | 3,544 | |
Tenant expense recoveries | | | 370 | | | 131 | | | — | | | 501 | |
Other operating revenue | | | 393 | | | 618 | | | 5 | | | 1,016 | |
| | | | | | | | | | | | | | |
Total office and retail revenue | | | 2,119 | | | 2,287 | | | 655 | | | 5,061 | |
Multifamily and other revenue | | | — | | | — | | | — | | | — | |
| | | | | | | | | | | | | | |
Total Operating Revenue | | | 2,119 | | | 2,287 | | | 655 | | | 5,061 | |
Expenses | | | | | | | | | | | | | |
Payroll expenses | | | 85 | | | 234 | | | — | | | 319 | |
Other operating expenses | | | 485 | | | 726 | | | — | | | 1,211 | |
Real estate taxes | | | 248 | | | 430 | | | — | | | 678 | |
Insurance | | | 7 | | | 38 | | | 1 | | | 46 | |
Management fees | | | 63 | | | 54 | | | 26 | | | 143 | |
| | | | | | | | | | | | | | |
Total Expenses | | | 888 | | | 1,482 | | | 27 | | | 2,397 | |
| | | | | | | | | | | | | | |
Revenues in Excess of Expenses (Expenses in Excess of Revenues) | | $ | 1,231 | | $ | 805 | | $ | 628 | | $ | 2,664 | |
| | | | | | | | | | | | | | |
| | | | | | | | | | | | | | |
| | | | | | | | | | | | | | |
Acquisition Date | | | Prior to 2013 | | | Prior to 2013 | | | May 31, 2013 | | | | |
Affiliated Seller in each table | | | Fund VI/
Urban Direct | | | Fund VI/
Urban Direct | | | Fund VIII | | | | |
Anticipated NYRT Ownership (unaudited) | | | 49.0% | | | 49.0% | | | 99.0% | | | | |
Anticipated financial statement presentation by combined entity (unaudited) | | | Unconsolidated | | | Unconsolidated | | | Consolidated | | | | |
(2) Fund VI currently owns 37.8 percent and Urban currently owns 62.2 percent.
See accompanying independent auditors' report.
F-109
JBG REAL ESTATE OPERATING ASSETS
Supplemental Information—Schedule 2 (Continued)
Combining Statement of Revenue and Expenses from Real Estate Operations
For the Year Ended December 31, 2014
(dollar amounts in thousands)
| | | | | | | | | | | | | | | | | | | |
| | Less Than 100% Owned Multifamily | |
| |
| |
|---|
| | Fairway
Apartments | | Kennedy Row | | The Alaire | | Subtotal Less Than
100% Owned
Multifamily | | Total Less Than
100% Owned | | Combined
Total | |
|---|
Operating Revenue | | | | | | | | | | | | | | | | | | | |
Base rent | | $ | — | | $ | — | | $ | — | | $ | — | | $ | 102,567 | | $ | 235,056 | |
Tenant expense recoveries | | | — | | | — | | | — | | | — | | | 15,648 | | | 40,931 | |
Other operating revenue | | | — | | | — | | | — | | | — | | | 9,676 | | | 19,654 | |
| | | | | | | | | | | | | | | | | | | | |
Total office and retail revenue | | | — | | | — | | | — | | | — | | | 127,891 | | | 295,641 | |
Multifamily and other revenue | | | 6,836 | | | 3,213 | | | 6,402 | | | 16,451 | | | 16,451 | | | 80,510 | |
| | | | | | | | | | | | | | | | | | | | |
Total Operating Revenue | | | 6,836 | | | 3,213 | | | 6,402 | | | 16,451 | | | 144,342 | | | 376,151 | |
Expenses | | | | | | | | | | | | | | | | | | | |
Payroll expenses | | | 487 | | | 287 | | | 645 | | | 1,419 | | | 6,940 | | | 20,856 | |
Other operating expenses | | | 1,503 | | | 510 | | | 993 | | | 3,006 | | | 28,399 | | | 70,673 | |
Real estate taxes | | | 668 | | | 41 | | | 756 | | | 1,465 | | | 12,161 | | | 44,938 | |
Insurance | | | 89 | | | 36 | | | 54 | | | 179 | | | 912 | | | 2,650 | |
Management fees | | | 275 | | | 127 | | | 266 | | | 668 | | | 4,077 | | | 11,591 | |
| | | | | | | | | | | | | | | | | | | | |
Total Expenses | | | 3,022 | | | 1,001 | | | 2,714 | | | 6,737 | | | 52,489 | | | 150,708 | |
| | | | | | | | | | | | | | | | | | | | |
Revenues in Excess of Expenses (Expenses in Excess of Revenues) | | $ | 3,814 | | $ | 2,212 | | $ | 3,688 | | $ | 9,714 | | $ | 91,853 | | $ | 225,443 | |
| | | | | | | | | | | | | | | | | | | | |
| | | | | | | | | | | | | | | | | | | | |
| | | | | | | | | | | | | | | | | | | | |
Acquisition Date | | | Prior to 2013 | | | Prior to 2013 | | | Prior to 2013 | | | | | | | | | | |
Affiliated Seller in each table | | | Fund IX | | | Fund VIII | | | Urban Direct | | | | | | | | | | |
Anticipated NYRT Ownership (unaudited) | | | 10.0% | | | 90.0% | | | 18.0% | | | | | | | | | | |
Anticipated financial statement presentation by combined entity (unaudited) | | | Unconsolidated | | | Consolidated | | | Unconsolidated | | | | | | | | | | |
See accompanying independent auditors' report.
F-110
JBG REAL ESTATE OPERATING ASSETS
Supplemental Information—Schedule 3
Combining Statement of Revenue and Expenses from Real Estate Operations
For the Year Ended December 31, 2013
(dollar amounts in thousands)
| | | | | | | | | | | | | | | | | | | |
| | 100% Owned Office | |
|---|
| | 1233 20th Street | | 1600 K Street | | 1831 Wiehle Avenue | | 1900 N Street | | 2115 Wisconsin
Avenue | | 2121 Wisconsin
Avenue | |
|---|
Operating Revenue | | | | | | | | | | | | | | | | | | | |
Base rent | | $ | 6,588 | | $ | 3,058 | | $ | 1,829 | | $ | 3,822 | | $ | 5,117 | | $ | 2,386 | |
Tenant expense recoveries | | | 104 | | | 257 | | | 129 | | | 243 | | | 42 | | | 135 | |
Other operating revenue | | | 305 | | | 50 | | | 1 | | | 182 | | | 658 | | | 479 | |
| | | | | | | | | | | | | | | | | | | | |
Total office and retail revenue | | | 6,997 | | | 3,365 | | | 1,959 | | | 4,247 | | | 5,817 | | | 3,000 | |
Multifamily and other revenue | | | — | | | — | | | — | | | — | | | — | | | — | |
| | | | | | | | | | | | | | | | | | | | |
Total Operating Revenue | | | 6,997 | | | 3,365 | | | 1,959 | | | 4,247 | | | 5,817 | | | 3,000 | |
Expenses | | | | | | | | | | | | | | | | | | | |
Payroll expenses | | | 249 | | | 195 | | | 149 | | | 233 | | | 305 | | | 212 | |
Other operating expenses | | | 1,074 | | | 807 | | | 448 | | | 928 | | | 1,060 | | | 659 | |
Real estate taxes | | | 1,216 | | | 519 | | | 183 | | | 892 | | | 877 | | | 523 | |
Insurance | | | 29 | | | 20 | | | 10 | | | 20 | | | 28 | | | 14 | |
Management fees | | | 202 | | | 87 | | | 63 | | | 131 | | | 180 | | | 88 | |
| | | | | | | | | | | | | | | | | | | | |
Total Expenses | | | 2,770 | | | 1,628 | | | 853 | | | 2,204 | | | 2,450 | | | 1,496 | |
| | | | | | | | | | | | | | | | | | | | |
Revenues in Excess of Expenses (Expenses in Excess of Revenues) | | $ | 4,227 | | $ | 1,737 | | $ | 1,106 | | $ | 2,043 | | $ | 3,367 | | $ | 1,504 | |
| | | | | | | | | | | | | | | | | | | | |
| | | | | | | | | | | | | | | | | | | | |
| | | | | | | | | | | | | | | | | | | | |
Acquisition Date | | | Prior to 2013 | | | Prior to 2013 | | | Prior to 2013 | | | Prior to 2013 | | | Prior to 2013 | | | Prior to 2013 | |
Affiliated Seller in each table | | | Fund VIII | | | Fund VIII | | | Fund VIII/Urban Direct | | | Fund VI/Fund VIII | | | Fund VII | | | Fund VII | |
Anticipated NYRT Ownership (unaudited) | | | 100.0% | | | 100.0% | | | 100.0% | | | 100.0% | | | 100.0% | | | 100.0%
| |
See accompanying independent auditors' report.
F-111
JBG REAL ESTATE OPERATING ASSETS
Supplemental Information—Schedule 3 (Continued)
Combining Statement of Revenue and Expenses from Real Estate Operations
For the Year Ended December 31, 2013
(dollar amounts in thousands)
| | | | | | | | | | | | | | | | |
| | 100% Owned Office—Continued | |
|---|
| | 4747 Bethesda
Avenue | | 6862 Elm Street | | 800 North
Glebe Road | | Artery Plaza | | DOT—U.S.
Government
Tenant (GSA) | |
|---|
Operating Revenue | | | | | | | | | | | | | | | | |
Base rent | | $ | 737 | | $ | 3,154 | | $ | 6,528 | | $ | 8,412 | | $ | 38,655 | |
Tenant expense recoveries | | | 23 | | | 82 | | | 1,981 | | | 298 | | | 19,161 | |
Other operating revenue | | | 322 | | | 28 | | | 762 | | | 843 | | | 1,545 | |
| | | | | | | | | | | | | | | | | |
Total office and retail revenue | | | 1,082 | | | 3,264 | | | 9,271 | | | 9,553 | | | 59,361 | |
Multifamily and other revenue | | | — | | | — | | | — | | | — | | | — | |
| | | | | | | | | | | | | | | | | |
Total Operating Revenue | | | 1,082 | | | 3,264 | | | 9,271 | | | 9,553 | | | 59,361 | |
Expenses | | | | | | | | | | | | | | | | |
Payroll expenses | | | 174 | | | 192 | | | 493 | | | 467 | | | 1,951 | |
Other operating expenses | | | 431 | | | 544 | | | 1,663 | | | 1,787 | | | 5,892 | |
Real estate taxes | | | 246 | | | 316 | | | 1,585 | | | 839 | | | 11,395 | |
Insurance | | | 11 | | | 14 | | | 40 | | | 44 | | | 264 | |
Management fees | | | 60 | | | 98 | | | 188 | | | 262 | | | 1,762 | |
| | | | | | | | | | | | | | | | | |
Total Expenses | | | 922 | | | 1,164 | | | 3,969 | | | 3,399 | | | 21,264 | |
| | | | | | | | | | | | | | | | | |
Revenues in Excess of Expenses (Expenses in Excess of Revenues) | | $ | 160 | | $ | 2,100 | | $ | 5,302 | | $ | 6,154 | | $ | 38,097 | |
| | | | | | | | | | | | | | | | | |
| | | | | | | | | | | | | | | | | |
| | | | | | | | | | | | | | | | | |
Acquisition Date | | | Prior to 2013 | | | Prior to 2013 | | | Prior to 2013 | | | Prior to 2013 | | | Prior to 2013 | |
Affiliated Seller in each table | | | Fund VIII/Urban Direct | | | Fund VI/Fund VII | | | Fund VII/Urban Direct | | | Fund VI | | | Fund III/Fund VI/Fund VII | |
Anticipated NYRT Ownership (unaudited) | | | 100.0% | | | 100.0% | | | 100.0% | | | 100.0% | | | 100.0%
| |
See accompanying independent auditors' report.
F-112
JBG REAL ESTATE OPERATING ASSETS
Supplemental Information—Schedule 3 (Continued)
Combining Statement of Revenue and Expenses from Real Estate Operations
For the Year Ended December 31, 2013
(dollar amounts in thousands)
| | | | | | | | | | | | | | | | |
| | 100% Owned Office—Continued | |
|---|
| | Hungerford Plaza | | Jefferson Court | | NCI—U.S.
Government
Tenant (GSA) | | Old Dominion | | One Choke Cherry | |
|---|
Operating Revenue | | | | | | | | | | | | | | | | |
Base rent | | $ | 1,785 | | $ | 9,684 | | $ | 7,897 | | $ | 1,840 | | $ | 4,993 | |
Tenant expense recoveries | | | 23 | | | — | | | 94 | | | 85 | | | 367 | |
Other operating revenue | | | — | | | 983 | | | 2,341 | | | 17 | | | 481 | |
| | | | | | | | | | | | | | | | | |
Total office and retail revenue | | | 1,808 | | | 10,667 | | | 10,332 | | | 1,942 | | | 5,841 | |
Multifamily and other revenue | | | — | | | — | | | — | | | — | | | — | |
| | | | | | | | | | | | | | | | | |
Total Operating Revenue | | | 1,808 | | | 10,667 | | | 10,332 | | | 1,942 | | | 5,841 | |
Expenses | | | | | | | | | | | | | | | | |
Payroll expenses | | | 155 | | | 472 | | | 772 | | | 127 | | | 315 | |
Other operating expenses | | | 650 | | | 2,582 | | | 1,462 | | | 402 | | | 1,608 | |
Real estate taxes | | | 99 | | | 1,875 | | | 1,656 | | | 184 | | | 402 | |
Insurance | | | 13 | | | 57 | | | 20 | | | 9 | | | 43 | |
Management fees | | | 61 | | | 296 | | | 87 | | | 63 | | | 175 | |
| | | | | | | | | | | | | | | | | |
Total Expenses | | | 978 | | | 5,282 | | | 3,997 | | | 785 | | | 2,543 | |
| | | | | | | | | | | | | | | | | |
Revenues in Excess of Expenses (Expenses in Excess of Revenues) | | $ | 830 | | $ | 5,385 | | $ | 6,335 | | $ | 1,157 | | $ | 3,298 | |
| | | | | | | | | | | | | | | | | |
| | | | | | | | | | | | | | | | | |
| | | | | | | | | | | | | | | | | |
Acquisition Date | | | Prior to 2013 | | | Prior to 2013 | | | Prior to 2013 | | | Prior to 2013 | | | Prior to 2013 | |
Affiliated Seller in each table | | | Fund VI | | | Fund VIII | | | Fund VI/Fund VIII | | | Fund VI/Fund VII | | | Fund VI/Fund VII | |
Anticipated NYRT Ownership (unaudited) | | | 100.0% | | | 100.0% | | | 100.0% | | | 100.0% | | | 100.0%
| |
See accompanying independent auditors' report.
F-113
JBG REAL ESTATE OPERATING ASSETS
Supplemental Information—Schedule 3 (Continued)
Combining Statement of Revenue and Expenses from Real Estate Operations
For the Year Ended December 31, 2013
(dollar amounts in thousands)
| | | | | | | | | | | | | | | | |
| | 100% Owned Office—Continued | |
|---|
| | Reston Arboretum | | RTC—West | | Summit I | | Summit II | | Subtotal 100%
Owned Office | |
|---|
Operating Revenue | | | | | | | | | | | | | | | | |
Base rent | | $ | 1,480 | | $ | 12,291 | | $ | — | | $ | 1,542 | | $ | 121,798 | |
Tenant expense recoveries | | | — | | | 463 | | | — | | | — | | | 23,487 | |
Other operating revenue | | | 4 | | | 160 | | | 12 | | | 10 | | | 9,183 | |
| | | | | | | | | | | | | | | | | |
Total office and retail revenue | | | 1,484 | | | 12,914 | | | 12 | | | 1,552 | | | 154,468 | |
Multifamily and other revenue | | | — | | | — | | | — | | | — | | | — | |
| | | | | | | | | | | | | | | | | |
Total Operating Revenue | | | 1,484 | | | 12,914 | | | 12 | | | 1,552 | | | 154,468 | |
Expenses | | | | | | | | | | | | | | | | |
Payroll expenses | | | 183 | | | 720 | | | 174 | | | 171 | | | 7,709 | |
Other operating expenses | | | 482 | | | 2,481 | | | 264 | | | 500 | | | 25,724 | |
Real estate taxes | | | 215 | | | 1,660 | | | 269 | | | 298 | | | 25,249 | |
Insurance | | | 13 | | | 82 | | | 26 | | | 21 | | | 778 | |
Management fees | | | 60 | | | 318 | | | 30 | | | 30 | | | 4,241 | |
| | | | | | | | | | | | | | | | | |
Total Expenses | | | 953 | | | 5,261 | | | 763 | | | 1,020 | | | 63,701 | |
| | | | | | | | | | | | | | | | | |
Revenues in Excess of Expenses (Expenses in Excess of Revenues) | | $ | 531 | | $ | 7,653 | | $ | (751 | ) | $ | 532 | | $ | 90,767 | |
| | | | | | | | | | | | | | | | | |
| | | | | | | | | | | | | | | | | |
| | | | | | | | | | | | | | | | | |
Acquisition Date | | | Prior to 2013 | | | Prior to 2013 | | | Prior to 2013 | | | Prior to 2013 | | | | |
Affiliated Seller in each table | | | Fund VII | | | Fund VIII | | | Fund VIII | | | Fund VIII | | | | |
Anticipated NYRT Ownership (unaudited) | | | 100.0% | | | 100.0% | | | 100.0% | | | 100.0% | | | | |
See accompanying independent auditors' report.
F-114
JBG REAL ESTATE OPERATING ASSETS
Supplemental Information—Schedule 3 (Continued)
Combining Statement of Revenue and Expenses from Real Estate Operations
For the Year Ended December 31, 2013
(dollar amounts in thousands)
| | | | | | | |
| | 100% Owned Retail | |
|---|
| | The Shops at Mark Center | | Subtotal 100% Owned Retail | |
|---|
Operating Revenue | | | | | | | |
Base rent | | $ | 1,262 | | $ | 1,262 | |
Tenant expense recoveries | | | 362 | | | 362 | |
Other operating revenue | | | 25 | | | 25 | |
| | | | | | | | |
Total office and retail revenue | | | 1,649 | | | 1,649 | |
Multifamily and other revenue | | | — | | | — | |
| | | | | | | | |
Total Operating Revenue | | | 1,649 | | | 1,649 | |
Expenses | | | | | | | |
Payroll expenses | | | — | | | — | |
Other operating expenses | | | 300 | | | 300 | |
Real estate taxes | | | 176 | | | 176 | |
Insurance | | | 13 | | | 13 | |
Management fees | | | 64 | | | 64 | |
| | | | | | | | |
Total Expenses | | | 553 | | | 553 | |
| | | | | | | | |
Revenues in Excess of Expenses (Expenses in Excess of Revenues) | | $ | 1,096 | | $ | 1,096 | |
| | | | | | | | |
| | | | | | | | |
| | | | | | | | |
Acquisition Date | | | Prior to 2013 | | | | |
Affiliated Seller in each table | | | Fund IX/Urban Direct | | | | |
Anticipated NYRT Ownership (unaudited) | | | 100.0% | | | | |
See accompanying independent auditors' report.
F-115
JBG REAL ESTATE OPERATING ASSETS
Supplemental Information—Schedule 3 (Continued)
Combining Statement of Revenue and Expenses from Real Estate Operations
For the Year Ended December 31, 2013
(dollar amounts in thousands)
| | | | | | | | | | | | | | | | | | | |
| | 100% Owned Multifamily | |
|---|
| | Bennington
Crossings | | Brookdale | | Charter
Oak | | Fairmont
Gardens | | Falkland
Chase—North | | Falkland Chase—
South & West | |
|---|
Operating Revenue | | | | | | | | | | | | | | | | | | | |
Base rent | | $ | — | | $ | — | | $ | — | | $ | — | | $ | — | | $ | — | |
Tenant expense recoveries | | | — | | | — | | | — | | | — | | | — | | | — | |
Other operating revenue | | | — | | | — | | | — | | | — | | | — | | | — | |
| | | | | | | | | | | | | | | | | | | | |
Total office and retail revenue | | | — | | | — | | | — | | | — | | | — | | | — | |
Multifamily and other revenue | | | 3,351 | | | 7,559 | | | 4,939 | | | 7,535 | | | 2,164 | | | 3,419 | |
| | | | | | | | | | | | | | | | | | | | |
Total Operating Revenue | | | 3,351 | | | 7,559 | | | 4,939 | | | 7,535 | | | 2,164 | | | 3,419 | |
Expenses | | | | | | | | | | | | | | | | | | | |
Payroll expenses | | | 277 | | | 686 | | | 375 | | | 682 | | | 219 | | | 338 | |
Other operating expenses | | | 841 | | | 1,680 | | | 1,036 | | | 2,264 | | | 385 | | | 608 | |
Real estate taxes | | | 310 | | | 716 | | | 528 | | | 529 | | | 202 | | | 270 | |
Insurance | | | 36 | | | 106 | | | 56 | | | 89 | | | 21 | | | 31 | |
Management fees | | | 122 | | | 299 | | | 197 | | | 302 | | | 85 | | | 134 | |
| | | | | | | | | | | | | | | | | | | | |
Total Expenses | | | 1,586 | | | 3,487 | | | 2,192 | | | 3,866 | | | 912 | | | 1,381 | |
| | | | | | | | | | | | | | | | | | | | |
Revenues in Excess of Expenses (Expenses in Excess of Revenues) | | $ | 1,765 | | $ | 4,072 | | $ | 2,747 | | $ | 3,669 | | $ | 1,252 | | $ | 2,038 | |
| | | | | | | | | | | | | | | | | | | | |
| | | | | | | | | | | | | | | | | | | | |
| | | | | | | | | | | | | | | | | | | | |
Acquisition Date | | | May 9, 2013 | | | Prior to 2013 | | | Prior to 2013 | | | Prior to 2013 | | | March 29, 2013 | | | March 29, 2013 | |
Affiliated Seller in each table | | | Fund VIII | | | Fund IX/Urban Direct | | | Fund VIII | | | Fund IX/Urban Direct | | | Fund VIII | | | Fund VIII | |
Anticipated NYRT Ownership (unaudited) | | | 100.0% | | | 100.0% | | | 100.0% | | | 100.0% | | | 100.0% | | | 100.0%
| |
See accompanying independent auditors' report.
F-116
JBG REAL ESTATE OPERATING ASSETS
Supplemental Information—Schedule 3 (Continued)
Combining Statement of Revenue and Expenses from Real Estate Operations
For the Year Ended December 31, 2013
(dollar amounts in thousands)
| | | | | | | | | | | | | | | | | | | |
| | 100% Owned Multifamily—Continued | |
| |
|---|
| | Hillwood | | Lynbrook | | Meadowcreek | | Stoneridge | | Subtotal 100%
Owned
Multifamily | | Total 100%
Owned | |
|---|
Operating Revenue | | | | | | | | | | | | | | | | | | | |
Base rent | | $ | — | | $ | — | | $ | — | | $ | — | | $ | — | | $ | 123,060 | |
Tenant expense recoveries | | | — | | | — | | | — | | | — | | | — | | | 23,849 | |
Other operating revenue | | | — | | | — | | | — | | | — | | | — | | | 9,208 | |
| | | | | | | | | | | | | | | | | | | | |
Total office and retail revenue | | | — | | | — | | | — | | | — | | | — | | | 156,117 | |
Multifamily and other revenue | | | 10,714 | | | 9,354 | | | 6,725 | | | 3,691 | | | 59,451 | | | 59,451 | |
| | | | | | | | | | | | | | | | | | | | |
Total Operating Revenue | | | 10,714 | | | 9,354 | | | 6,725 | | | 3,691 | | | 59,451 | | | 215,568 | |
Expenses | | | | | | | | | | | | | | | | | | | |
Payroll expenses | | | 814 | | | 962 | | | 528 | | | 305 | | | 5,186 | | | 12,895 | |
Other operating expenses | | | 2,410 | | | 2,076 | | | 1,599 | | | 745 | | | 13,644 | | | 39,668 | |
Real estate taxes | | | 1,087 | | | 902 | | | 613 | | | 380 | | | 5,537 | | | 30,962 | |
Insurance | | | 143 | | | 153 | | | 105 | | | 52 | | | 792 | | | 1,583 | |
Management fees | | | 426 | | | 372 | | | 267 | | | 147 | | | 2,351 | | | 6,656 | |
| | | | | | | | | | | | | | | | | | | | |
Total Expenses | | | 4,880 | | | 4,465 | | | 3,112 | | | 1,629 | | | 27,510 | | | 91,764 | |
| | | | | | | | | | | | | | | | | | | | |
Revenues in Excess of Expenses (Expenses in Excess of Revenues) | | $ | 5,834 | | $ | 4,889 | | $ | 3,613 | | $ | 2,062 | | $ | 31,941 | | $ | 123,804 | |
| | | | | | | | | | | | | | | | | | | | |
| | | | | | | | | | | | | | | | | | | | |
| | | | | | | | | | | | | | | | | | | | |
Acquisition Date | | | Prior to 2013 | | | Prior to 2013 | | | Prior to 2013 | | | Prior to 2013 | | | | | | | |
Affiliated Seller in each table | | | Fund IX/Urban Direct | | | Fund IX/Urban Direct | | | Fund IX/Urban Direct | | | Fund IX/Urban Direct | | | | | | | |
Anticipated NYRT Ownership (unaudited) | | | 100.0% | | | 100.0% | | | 100.0% | | | 100.0% | | | | | | | |
See accompanying independent auditors' report.
F-117
JBG REAL ESTATE OPERATING ASSETS
Supplemental Information—Schedule 3 (Continued)
Combining Statement of Revenue and Expenses from Real Estate Operations
For the Year Ended December 31, 2013
(dollar amounts in thousands)
| | | | | | | | | | | | | | | | |
| | Less Than 100% Owned Office | |
|---|
| | 11333 Woodglen
Drive | | 12440 Parklawn | | 12725 Twinbrook
Parkway | | 12735 Twinbrook
Parkway | | 5600 Fishers Lane—
U.S. Government
Tenant (GSA) | |
|---|
Operating Revenue | | | | | | | | | | | | | | | | |
Base rent | | $ | 1,918 | | $ | — | | $ | 1,018 | | $ | 2,154 | | $ | 21,759 | |
Tenant expense recoveries | | | 98 | | | — | | | 1,041 | | | 2,361 | | | — | |
Other operating revenue | | | — | | | 18 | | | — | | | 132 | | | 1,296 | |
| | | | | | | | | | | | | | | | | |
Total office and retail revenue | | | 2,016 | | | 18 | | | 2,059 | | | 4,647 | | | 23,055 | |
Multifamily and other revenue | | | — | | | — | | | — | | | — | | | — | |
| | | | | | | | | | | | | | | | | |
Total Operating Revenue | | | 2,016 | | | 18 | | | 2,059 | | | 4,647 | | | 23,055 | |
Expenses | | | | | | | | | | | | | | | | |
Payroll expenses | | | 128 | | | 18 | | | 78 | | | 25 | | | 826 | |
Other operating expenses | | | 367 | | | 98 | | | 749 | | | 2,143 | | | 2,459 | |
Real estate taxes | | | 149 | | | 10 | | | 80 | | | 248 | | | 710 | |
Insurance | | | 9 | | | 4 | | | 14 | | | 19 | | | 194 | |
Management fees | | | 51 | | | — | | | 63 | | | 72 | | | 695 | |
| | | | | | | | | | | | | | | | | |
Total Expenses | | | 704 | | | 130 | | | 984 | | | 2,507 | | | 4,884 | |
| | | | | | | | | | | | | | | | | |
Revenues in Excess of Expenses (Expenses in Excess of Revenues) | | $ | 1,312 | | $ | (112 | ) | $ | 1,075 | | $ | 2,140 | | $ | 18,171 | |
| | | | | | | | | | | | | | | | | |
| | | | | | | | | | | | | | | | | |
| | | | | | | | | | | | | | | | | |
Acquisition Date | | | Prior to 2013 | | | Prior to 2013 | | | Prior to 2013 | | | Prior to 2013 | | | Prior to 2013 | |
Affiliated Seller in each table | | | Urban Direct | | | Urban Direct | | | Fund I/Fund II/Fund III | | | Fund I/Fund II/Fund III | | | Fund VI/Fund VII | |
Anticipated NYRT Ownership (unaudited) | | | 18.0% | | | 18.0% | | | 10.0% | | | 10.0% | | | 66.7% | |
Anticipated financial statement presentation by combined entity (unaudited) | | | Unconsolidated | | | Unconsolidated | | | Unconsolidated | | | Unconsolidated | | | Consolidated
| |
See accompanying independent auditors' report.
F-118
JBG REAL ESTATE OPERATING ASSETS
Supplemental Information—Schedule 3 (Continued)
Combining Statement of Revenue and Expenses from Real Estate Operations
For the Year Ended December 31, 2013
(dollar amounts in thousands)
| | | | | | | | | | | | | | | | |
| | Less Than 100% Owned Office—Continued | |
|---|
| | 5601 Fishers Lane—
U.S. Government
Tenant (GSA) | | 5609 Fishers Lane | | 5625 Fishers Lane | | 5635 Fishers Lane | | 5640 Fishers Lane | |
|---|
Operating Revenue | | | | | | | | | | | | | | | | |
Base rent | | $ | — | | $ | 701 | | $ | 5,395 | | $ | 6,587 | | $ | 1,768 | |
Tenant expense recoveries | | | — | | | 72 | | | 3,195 | | | 549 | | | 2,356 | |
Other operating revenue | | | 404 | | | 12 | | | 105 | | | 1,203 | | | — | |
| | | | | | | | | | | | | | | | | |
Total office and retail revenue | | | 404 | | | 785 | | | 8,695 | | | 8,339 | | | 4,124 | |
Multifamily and other revenue | | | — | | | — | | | — | | | — | | | — | |
| | | | | | | | | | | | | | | | | |
Total Operating Revenue | | | 404 | | | 785 | | | 8,695 | | | 8,339 | | | 4,124 | |
Expenses | | | | | | | | | | | | | | | | |
Payroll expenses | | | 27 | | | 54 | | | 38 | | | 235 | | | 30 | |
Other operating expenses | | | 54 | | | 100 | | | 2,593 | | | 1,166 | | | 2,168 | |
Real estate taxes | | | 47 | | | 66 | | | 634 | | | 724 | | | 217 | |
Insurance | | | — | | | 5 | | | 47 | | | 55 | | | 20 | |
Management fees | | | — | | | 60 | | | 177 | | | 284 | | | 72 | |
| | | | | | | | | | | | | | | | | |
Total Expenses | | | 128 | | | 285 | | | 3,489 | | | 2,464 | | | 2,507 | |
| | | | | | | | | | | | | | | | | |
Revenues in Excess of Expenses (Expenses in Excess of Revenues) | | $ | 276 | | $ | 500 | | $ | 5,206 | | $ | 5,875 | | $ | 1,617 | |
| | | | | | | | | | | | | | | | | |
| | | | | | | | | | | | | | | | | |
| | | | | | | | | | | | | | | | | |
Acquisition Date | | | Prior to 2013 | | | Prior to 2013 | | | Prior to 2013 | | | Prior to 2013 | | | Prior to 2013 | |
Affiliated Seller in each table | | | Fund VI/Fund VII | | | Fund VI/Fund VII | | | Fund I/Fund II/Fund III | | | Fund I/Fund II/Fund III | | | Fund I/Fund II/Fund III | |
Anticipated NYRT Ownership (unaudited) | | | 66.7% | | | 66.7% | | | 10.0% | | | 10.0% | | | 10.0% | |
Anticipated financial statement presentation by combined entity (unaudited) | | | Consolidated | | | Consolidated | | | Unconsolidated | | | Unconsolidated | | | Unconsolidated
| |
See accompanying independent auditors' report.
F-119
JBG REAL ESTATE OPERATING ASSETS
Supplemental Information—Schedule 3 (Continued)
Combining Statement of Revenue and Expenses from Real Estate Operations
For the Year Ended December 31, 2013
(dollar amounts in thousands)
| | | | | | | | | | | | | | | | |
| | Less Than 100% Owned Office—Continued | |
|---|
| | Capitol
Point—
North(1) | | Chase Tower | | Courthouse
Metro
Office | | L'Enfant
Plaza Office—
East(2) | | L'Enfant
Plaza Office—
North(2) | |
|---|
Operating Revenue | | | | | | | | | | | | | | | | |
Base rent | | $ | 1,964 | | $ | 10,582 | | $ | 721 | | $ | 16,755 | | $ | 8,309 | |
Tenant expense recoveries | | | 68 | | | 834 | | | 154 | | | 605 | | | 308 | |
Other operating revenue | | | 100 | | | 619 | | | 42 | | | 1,085 | | | 822 | |
| | | | | | | | | | | | | | | | | |
Total office and retail revenue | | | 2,132 | | | 12,035 | | | 917 | | | 18,445 | | | 9,439 | |
Multifamily and other revenue | | | — | | | — | | | — | | | — | | | — | |
| | | | | | | | | | | | | | | | | |
Total Operating Revenue | | | 2,132 | | | 12,035 | | | 917 | | | 18,445 | | | 9,439 | |
Expenses | | | | | | | | | | | | | | | | |
Payroll expenses | | | 82 | | | 367 | | | 46 | | | 796 | | | 623 | |
Other operating expenses | | | 498 | | | 1,505 | | | 215 | | | 2,770 | | | 2,011 | |
Real estate taxes | | | 448 | | | 1,052 | | | 89 | | | 2,498 | | | 1,691 | |
Insurance | | | 5 | | | 53 | | | 4 | | | 77 | | | 64 | |
Management fees | | | 62 | | | 358 | | | 60 | | | 526 | | | 285 | |
| | | | | | | | | | | | | | | | | |
Total Expenses | | | 1,095 | | | 3,335 | | | 414 | | | 6,667 | | | 4,674 | |
| | | | | | | | | | | | | | | | | |
Revenues in Excess of Expenses (Expenses in Excess of Revenues) | | $ | 1,037 | | $ | 8,700 | | $ | 503 | | $ | 11,778 | | $ | 4,765 | |
| | | | | | | | | | | | | | | | | |
| | | | | | | | | | | | | | | | | |
| | | | | | | | | | | | | | | | | |
Acquisition Date | | | Prior to 2013 | | | Prior to 2013 | | | Prior to 2013 | | | Prior to 2013 | | | Prior to 2013 | |
Affiliated Seller in each table | | | Fund VI/Urban Direct | | | Fund I/Fund II/Fund III | | | Urban Direct | | | Fund VI/Urban Direct | | | Fund VI/Urban Direct | |
Anticipated NYRT Ownership (unaudited) | | | 16.9% | | | 10.0% | | | 18.0% | | | 49.0% | | | 49.0% | |
Anticipated financial statement presentation by combined entity (unaudited) | | | Unconsolidated | | | Unconsolidated | | | Unconsolidated | | | Unconsolidated | | | Unconsolidated
| |
(1)—Fund VI currently owns 14.3 percent and Urban currently owns 14.3 percent.
(2)—Fund VI currently owns 37.8 percent and Urban currently owns 62.2 percent.
See accompanying independent auditors' report.
F-120
JBG REAL ESTATE OPERATING ASSETS
Supplemental Information—Schedule 3 (Continued)
Combining Statement of Revenue and Expenses from Real Estate Operations
For the Year Ended December 31, 2013
(dollar amounts in thousands)
| | | | | | | | | | | | | | | | |
| | Less Than 100% Owned Office—Continued | |
|---|
| | NoBe II
Office | | Rosslyn
Gateway—
North | | Rosslyn
Gateway—
South | | Woodglen | | Subtotal
Less
Than 100%
Owned
Office | |
|---|
Operating Revenue | | | | | | | | | | | | | | | | |
Base rent | | $ | 1,948 | | $ | 4,366 | | $ | 2,665 | | $ | — | | $ | 88,610 | |
Tenant expense recoveries | | | 101 | | | 210 | | | 32 | | | — | | | 11,984 | |
Other operating revenue | | | 50 | | | 380 | | | 300 | | | 132 | | | 6,700 | |
| | | | | | | | | | | | | | | | | |
Total office and retail revenue | | | 2,099 | | | 4,956 | | | 2,997 | | | 132 | | | 107,294 | |
Multifamily and other revenue | | | — | | | — | | | — | | | — | | | — | |
| | | | | | | | | | | | | | | | | |
Total Operating Revenue | | | 2,099 | | | 4,956 | | | 2,997 | | | 132 | | | 107,294 | |
Expenses | | | | | | | | | | | | | | | | |
Payroll expenses | | | 269 | | | 357 | | | 262 | | | — | | | 4,261 | |
Other operating expenses | | | 569 | | | 956 | | | 621 | | | 8 | | | 21,050 | |
Real estate taxes | | | 270 | | | 399 | | | 314 | | | 18 | | | 9,664 | |
Insurance | | | 16 | | | 19 | | | 14 | | | 1 | | | 620 | |
Management fees | | | 62 | | | 151 | | | 91 | | | — | | | 3,069 | |
| | | | | | | | | | | | | | | | | |
Total Expenses | | | 1,186 | | | 1,882 | | | 1,302 | | | 27 | | | 38,664 | |
| | | | | | | | | | | | | | | | | |
Revenues in Excess of Expenses (Expenses in Excess of Revenues) | | $ | 913 | | $ | 3,074 | | $ | 1,695 | | $ | 105 | | $ | 68,630 | |
| | | | | | | | | | | | | | | | | |
| | | | | | | | | | | | | | | | | |
| | | | | | | | | | | | | | | | | |
Acquisition Date | | | Prior to 2013 | | | Prior to 2013 | | | Prior to 2013 | | | Prior to 2013 | | | | |
Affiliated Seller in each table | | | Urban Direct | | | Urban Direct | | | Urban Direct | | | Urban Direct | | | | |
Anticipated NYRT Ownership (unaudited) | | | 18.0% | | | 18.0% | | | 18.0% | | | 18.0% | | | | |
Anticipated financial statement presentation by combined entity (unaudited) | | | Unconsolidated | | | Unconsolidated | | | Unconsolidated | | | Unconsolidated | | | | |
See accompanying independent auditors' report.
F-121
JBG REAL ESTATE OPERATING ASSETS
Supplemental Information—Schedule 3 (Continued)
Combining Statement of Revenue and Expenses from Real Estate Operations
For the Year Ended December 31, 2013
(dollar amounts in thousands)
| | | | | | | | | | | | | |
| | Less Than 100% Owned Retail | |
|---|
| | L'Enfant
Plaza
Retail—East(2) | | L'Enfant
Plaza
Retail—West(2) | | Leesburg
Pike Retail | | Subtotal
Less
Than 100%
Owned
Retail | |
|---|
Operating Revenue | | | | | | | | | | | | | |
Base rent | | $ | 1,546 | | $ | 825 | | $ | 381 | | $ | 2,752 | |
Tenant expense recoveries | | | 388 | | | 12 | | | — | | | 400 | |
Other operating revenue | | | 306 | | | 549 | | | — | | | 855 | |
| | | | | | | | | | | | | | |
Total office and retail revenue | | | 2,240 | | | 1,386 | | | 381 | | | 4,007 | |
Multifamily and other revenue | | | — | | | — | | | — | | | | |
| | | | | | | | | | | | | | |
Total Operating Revenue | | | 2,240 | | | 1,386 | | | 381 | | | 4,007 | |
Expenses | | | | | | | | | | | | | |
Payroll expenses | | | 71 | | | 187 | | | — | | | 258 | |
Other operating expenses | | | 465 | | | 536 | | | 36 | | | 1,037 | |
Real estate taxes | | | 247 | | | 651 | | | — | | | 898 | |
Insurance | | | 8 | | | 35 | | | — | | | 43 | |
Management fees | | | 70 | | | 43 | | | 15 | | | 128 | |
| | | | | | | | | | | | | | |
Total Expenses | | | 861 | | | 1,452 | | | 51 | | | 2,364 | |
| | | | | | | | | | | | | | |
Revenues in Excess of Expenses (Expenses in Excess of Revenues) | | $ | 1,379 | | $ | (66 | ) | $ | 330 | | $ | 1,643 | |
| | | | | | | | | | | | | | |
| | | | | | | | | | | | | | |
| | | | | | | | | | | | | | |
Acquisition Date | | | Prior to 2013 | | | Prior to 2013 | | | May 31, 2013 | | | | |
Affiliated Seller in each table | | | Fund VI/Urban Direct | | | Fund VI/Urban Direct | | | Fund VIII | | | | |
Anticipated NYRT Ownership (unaudited) | | | 49.0% | | | 49.0% | | | 99.0% | | | | |
Anticipated financial statement presentation by combined entity (unaudited) | | | Unconsolidated | | | Unconsolidated | | | Consolidated | | | | |
(2)—Fund VI currently owns 37.8 percent and Urban currently owns 62.2 percent.
See accompanying independent auditors' report.
F-122
JBG REAL ESTATE OPERATING ASSETS
Supplemental Information—Schedule 3 (Continued)
Combining Statement of Revenue and Expenses from Real Estate Operations
For the Year Ended December 31, 2013
(dollar amounts in thousands)
| | | | | | | | | | | | | | | | | | | |
| | Less Than 100% Owned Multifamily—Continued | |
| |
| |
|---|
| | Fairway
Apartments | | Kennedy
Row | | The
Alaire | | Subtotal
Less
Than 100%
Owned
Multifamily | | Total
Less
Than 100%
Owned | | Combined
Total | |
|---|
Operating Revenue | | | | | | | | | | | | | | | | | | | |
Base rent | | $ | — | | $ | — | | $ | — | | $ | — | | $ | 91,362 | | $ | 214,422 | |
Tenant expense recoveries | | | — | | | — | | | — | | | — | | | 12,384 | | | 36,233 | |
Other operating revenue | | | — | | | — | | | — | | | — | | | 7,555 | | | 16,763 | |
| | | | | | | | | | | | | | | | | | | | |
Total office and retail revenue | | | — | | | — | | | — | | | — | | | 111,301 | | | 267,418 | |
Multifamily and other revenue | | | 6,730 | | | 1,213 | | | 6,276 | | | 14,219 | | | 14,219 | | | 73,670 | |
| | | | | | | | | | | | | | | | | | | | |
Total Operating Revenue | | | 6,730 | | | 1,213 | | | 6,276 | | | 14,219 | | | 125,520 | | | 341,088 | |
Expenses | | | | | | | | | | | | | | | | | | | |
Payroll expenses | | | 426 | | | 304 | | | 666 | | | 1,396 | | | 5,915 | | | 18,810 | |
Other operating expenses | | | 1,372 | | | 316 | | | 984 | | | 2,672 | | | 24,759 | | | 64,427 | |
Real estate taxes | | | 650 | | | 24 | | | 1,046 | | | 1,720 | | | 12,282 | | | 43,244 | |
Insurance | | | 91 | | | 26 | | | 53 | | | 170 | | | 833 | | | 2,416 | |
Management fees | | | 268 | | | 75 | | | 266 | | | 609 | | | 3,806 | | | 10,462 | |
| | | | | | | | | | | | | | | | | | | | |
Total Expenses | | | 2,807 | | | 745 | | | 3,015 | | | 6,567 | | | 47,595 | | | 139,359 | |
| | | | | | | | | | | | | | | | | | | | |
Revenues in Excess of Expenses (Expenses in Excess of Revenues) | | $ | 3,923 | | $ | 468 | | $ | 3,261 | | $ | 7,652 | | $ | 77,925 | | $ | 201,729 | |
| | | | | | | | | | | | | | | | | | | | |
| | | | | | | | | | | | | | | | | | | | |
| | | | | | | | | | | | | | | | | | | | |
Acquisition Date | | | Prior to 2013 | | | Prior to 2013 | | | Prior to 2013 | | | | | | | | | | |
Affiliated Seller in each table | | | Fund XI | | | Fund VIII | | | Urban Direct | | | | | | | | | | |
Anticipated NYRT Ownership (unaudited) | | | 10.0% | | | 90.0% | | | 18.0% | | | | | | | | | | |
Anticipated financial statement presentation by combined entity (unaudited) | | | Unconsolidated | | | Consolidated | | | Unconsolidated | | | | | | | | | | |
See accompanying independent auditors' report.
F-123
STONEBRIDGE AT POTOMAC TOWN CENTER—PHASE I
STATEMENT OF REVENUE AND
EXPENSES FROM REAL ESTATE OPERATIONS
Including Independent Auditors' Report
For the Period
January 1, 2015 to December 9, 2015
F-124
Independent Auditors' Report
The Partners of
JBG/Operating Partners, L.P.
We have audited the accompanying statement of revenue and expenses from real estate operations of Stonebridge at Potomac Town Center—Phase I (the "Property") for the period January 1, 2015 to December 9, 2015, and the related notes (the "Statement").
Management's Responsibility for the Statement
Management is responsible for the preparation and fair presentation of the Statement in accordance with U.S. generally accepted accounting principles; this includes the design, implementation, and maintenance of internal control relevant to the preparation and fair presentation of a Statement that is free from material misstatement, whether due to fraud or error.
Auditors' Responsibility
Our responsibility is to express an opinion on the Statement based on our audit. We conducted our audit in accordance with auditing standards generally accepted in the United States of America. Those standards require that we plan and perform the audit to obtain reasonable assurance about whether the Statement is free from material misstatement.
An audit involves performing procedures to obtain audit evidence about the amounts and disclosures in the Statement. The procedures selected depend on the auditors' judgment, including the assessment of the risks of material misstatement of the Statement, whether due to fraud or error. In making those risk assessments, the auditor considers internal control relevant to the entity's preparation and fair presentation of the Statement in order to design audit procedures that are appropriate in the circumstances, but not for the purpose of expressing an opinion on the effectiveness of the entity's internal control. Accordingly, we express no such opinion. An audit also includes evaluating the appropriateness of accounting policies used and the reasonableness of significant accounting estimates made by management, as well as evaluating the overall presentation of the Statement.
We believe that the audit evidence we have obtained is sufficient and appropriate to provide a basis for our audit opinion.
Opinion
In our opinion, the statement of revenue and expenses from real estate operations referred to above presents fairly, in all material respects, the revenue and expenses from real estate operations of the Property for the period January 1, 2015 to December 9, 2015, in accordance with U.S. generally accepted accounting principles.
Emphasis of Matter
We draw attention to Note 1 to the Statement, which describes that the accompanying financial statement was prepared for the purpose of complying with the Rule 3-14 of Regulation S-X promulgated under the Securities Act of 1933, as amended (for inclusion in the filing of Form 8-K of New York REIT, Inc.) and is not intended to be a complete presentation of revenues and expenses from real estate operations. Our opinion is not modified with respect to this matter.
McLean, Virginia
May 25, 2016
F-125
STONEBRIDGE AT POTOMAC TOWN CENTER—PHASE I
Statement of Revenue and Expenses from Real Estate Operations
(dollar amounts in thousands)
| | | | |
| | For the Period January 1, 2015 to December 9, 2015 | |
|---|
Operating Revenue | | | | |
Base rent | | $ | 9,765 | |
Tenant expense recoveries | | | 2,246 | |
Other operating revenue | | | 276 | |
| | | | | |
Total Operating Revenue | | | 12,287 | |
Expenses | | | | |
Payroll expenses | | | 317 | |
Other operating expenses | | | 2,465 | |
Real estate taxes | | | 1,508 | |
Insurance | | | 104 | |
Management fees | | | 405 | |
| | | | | |
Total Expenses | | | 4,799 | |
| | | | | |
Operating Revenues in Excess of Expenses | | $ | 7,488 | |
| | | | | |
| | | | | |
| | | | | |
See notes to statement of revenue and expenses from real estate operations.
F-126
STONEBRIDGE AT POTOMAC TOWN CENTER—PHASE I
Notes to the Statement of Revenue and
Expenses from Real Estate Operations
For the Period January 1, 2015 to December 9, 2015
(dollar amounts in thousands)
NOTE 1—BASIS OF PRESENTATION
On December 10, 2015, JBG Core Venture I, L.P. (the "Fund") acquired Stonebridge at Potomac Town Center—Phase I (the "Property"), a shopping center located in Woodbridge, Virginia. The Fund is owned 10 percent by JBG Investment Fund IX, LLC ("Fund IX") and 90 percent by multiple unrelated partners. Fund IX may contribute its 10 percent ownership interest in a combination transaction involving various JBG affiliates and New York REIT, Inc. JBG/Operating Partners, L.P. commenced providing property management and other services to the Property on December 10, 2015.
The accompanying statement of revenue and expenses from real estate operations (the "Statement") has been prepared for the purpose of complying with Rule 3-14 of Regulation S-X promulgated under the Securities Act of 1933, as amended. Accordingly, the Statement does not reflect the actual operations for the period presented as revenue and expenses from real estate operations exclude certain revenue and expenses expected to be incurred in the future operations of the Property. Such items include depreciation, amortization, interest expense, interest income, and amortization of above-and below-market leases.
NOTE 2—SUMMARY OF SIGNIFICANT ACCOUNTING POLICIES
Revenue Recognition—Rental revenue is recognized on a straight-line basis over the lease term when collectability is reasonably assured and the tenant has taken possession or controls the physical use of the leased asset.
Tenant expense recoveries for real estate taxes, common area maintenance, and other recoverable costs are recognized in the period that the expenses are incurred. The recoveries are recognized and presented gross as the Property is generally the primary obligor with respect to purchasing goods and services from third-party suppliers, has discretion in selecting the supplier, and bears the associated credit risk.
Other revenue is revenue derived from lease termination fees and the tenants' use of parking and other property facilities. Lease termination fees are recognized when the related leases are canceled and the landlord has no continuing obligation to provide services to such former tenants. Other revenue is recognized when the related services are utilized by the tenants.
Use of Estimates—Management has made a number of estimates and assumptions relating to the reporting and disclosure of revenue and expenses from real estate operations during the reporting period to present the statement of revenue and expenses from real estate operations in conformity with accounting principles generally accepted in the United States of America. Actual results could differ from those estimates.
F-127
STONEBRIDGE AT POTOMAC TOWN CENTER—PHASE I
Notes to the Statement of Revenue and
Expenses from Real Estate Operations (Continued)
For the Period January 1, 2015 to December 9, 2015
(dollar amounts in thousands)
NOTE 3—LEASE COMMITMENTS
There are various lease agreements in place with tenants to lease space at the Property. As of December 9, 2015, the minimum future cash rents receivable under non-cancelable operating leases in each of the next five years and thereafter were as follows:
| | | | |
Period December 10, 2015 to December 31, 2015 | | $ | 594 | |
2016 | | | 10,252 | |
2017 | | | 10,366 | |
2018 | | | 10,437 | |
2019 | | | 10,583 | |
Thereafter | | | 50,701 | |
| | | | | |
| | $ | 92,933 | |
| | | | | |
| | | | | |
| | | | | |
Leases generally require reimbursement of the tenant's proportional share of common area, real estate taxes, and other operating expenses, which are excluded from the amounts above.
NOTE 4—TENANT CONCENTRATIONS
For the period January 1, 2015 to December 9, 2015, 16 percent of total rental revenue was recognized from a single tenant.
NOTE 5—SUBSEQUENT EVENTS
Subsequent events were evaluated through May 25, 2016, the date the statement of revenue and expenses from real estate operations was available to be issued.
F-128
QuickLinks
The JBG CompaniesTable of ContentsBUSINESS AND PROPERTIESAll AssetsOperating AssetsConstruction AssetsPre-Development and Land Bank AssetsOffice Lease-up OpportunitiesMultifamily Lease-up OpportunitiesRetail Lease-up OpportunitiesOffice Assets Under ConstructionMultifamily Assets Under ConstructionRetail Assets Under ConstructionLand BankSummary Asset-Level NOI Table (Dollars at JBG Share, except where otherwise indicated) Three Months Ended March 31, 2016Summary Office Asset-Level NOI Table (Dollars at JBG Share) Three Months Ended March 31, 2016INDUSTRY OVERVIEW AND MARKET OPPORTUNITYJBG MANAGEMENT TEAMGLOSSARYINDEX TO FINANCIAL STATEMENTSJBG/OPERATING PARTNERS, L.P. AND SUBSIDIARIES Chevy Chase, Maryland INTERIM CONSOLIDATED FINANCIAL STATEMENTS (UNAUDITED) March 31, 2016JBG/OPERATING PARTNERS, L.P. AND SUBSIDIARIES Consolidated Balance Sheet (Unaudited) As of March 31, 2016 (dollar amounts in thousands)JBG/OPERATING PARTNERS, L.P. AND SUBSIDIARIES Consolidated Statements of Operations and Comprehensive Income (Unaudited) For the Three Months Ended March 31, 2016 and 2015 (dollar amounts in thousands)JBG/OPERATING PARTNERS, L.P. AND SUBSIDIARIES Consolidated Statement of Changes in Partners' Deficit (Unaudited) For the Three Months Ended March 31, 2016 (dollar amounts in thousands)JBG/OPERATING PARTNERS, L.P. AND SUBSIDIARIES Consolidated Statements of Cash Flows (Unaudited) For the Three Months Ended March 31, 2016 and 2015 (dollar amounts in thousands)JBG/OPERATING PARTNERS, L.P. AND SUBSIDIARIES Notes to Consolidated Financial Statements (Unaudited) (dollar amounts in thousands)JBG/OPERATING PARTNERS, L.P. AND SUBSIDIARIES Chevy Chase, Maryland CONSOLIDATED FINANCIAL STATEMENTS Including Report of Independent Auditors December 31, 2015, 2014, and 2013Independent Auditors' ReportJBG/OPERATING PARTNERS, L.P. AND SUBSIDIARIES Consolidated Balance Sheets As of December 31, 2015, 2014, and 2013 (dollar amounts in thousands)JBG/OPERATING PARTNERS, L.P. AND SUBSIDIARIES Consolidated Statements of Operations and Comprehensive Income (Loss) For the Years Ended December 31, 2015, 2014, and 2013 (dollar amounts in thousands)JBG/OPERATING PARTNERS, L.P. AND SUBSIDIARIES Consolidated Statement of Changes in Partners' Deficit For the Years Ended December 31, 2015, 2014, and 2013 (dollar amounts in thousands)JBG/OPERATING PARTNERS, L.P. AND SUBSIDIARIES Consolidated Statements of Cash Flows For the Years Ended December 31, 2015, 2014, and 2013 (dollar amounts in thousands)JBG/OPERATING PARTNERS, L.P. AND SUBSIDIARIES Notes to Consolidated Financial Statements (dollar amounts in thousands)JBG/ROSENFELD RETAIL PROPERTIES, LLC Chevy Chase, Maryland FINANCIAL STATEMENTS Including Independent Auditors' Report December 31, 2015 and 2014Independent Auditors' ReportJBG/ROSENFELD RETAIL PROPERTIES, LLC Balance Sheets As of December 31, 2015 and 2014 (dollar amounts in thousands)JBG/ROSENFELD RETAIL PROPERTIES, LLC Statements of Operations and Comprehensive Loss For the Years Ended December 31, 2015 and 2014 (dollar amounts in thousands)JBG/ROSENFELD RETAIL PROPERTIES, LLC Statement of Changes in Members' Equity (Deficit) For the Years Ended December 31, 2015 and 2014 (dollar amounts in thousands)JBG/ROSENFELD RETAIL PROPERTIES, LLC Statements of Cash Flows For the Years Ended December 31, 2015 and 2014 (dollar amounts in thousands)JBG/ROSENFELD RETAIL PROPERTIES, LLC Notes to Financial Statements (dollar amounts in thousands)JBG REAL ESTATE OPERATING ASSETS INTERIM COMBINED STATEMENT OF REVENUE AND EXPENSES FROM REAL ESTATE OPERATIONS (UNAUDITED) For the Three Months Ended March 31, 2016JBG REAL ESTATE OPERATING ASSETS Combined Statement of Revenue and Expenses from Real Estate Operations (Unaudited) (dollar amounts in thousands)JBG REAL ESTATE OPERATING ASSETS Notes to the Combined Statement of Revenue and Expenses from Real Estate Operations (Unaudited) For the Three Months Ended March 31, 2016 (dollar amounts in thousands)JBG REAL ESTATE OPERATING ASSETS COMBINED STATEMENT OF REVENUE AND EXPENSES FROM REAL ESTATE OPERATIONS Including Independent Auditors' Report For the Years Ended December 31, 2015, 2014, and 2013Independent Auditors' ReportJBG REAL ESTATE OPERATING ASSETS Combined Statement of Revenue and Expenses from Real Estate Operations (dollar amounts in thousands)JBG REAL ESTATE OPERATING ASSETS Notes to the Combined Statement of Revenue and Expenses from Real Estate Operations For the Years Ended December 31, 2015, 2014, and 2013 (dollar amounts in thousands)JBG REAL ESTATE OPERATING ASSETS Supplemental Information—Schedule 1 Combining Statement of Revenue and Expenses from Real Estate Operations For the Year Ended December 31, 2015 (dollar amounts in thousands)JBG REAL ESTATE OPERATING ASSETS Supplemental Information—Schedule 1 (Continued) Combining Statement of Revenue and Expenses from Real Estate Operations For the Year Ended December 31, 2015 (dollar amounts in thousands)JBG REAL ESTATE OPERATING ASSETS Supplemental Information—Schedule 1 (Continued) Combining Statement of Revenue and Expenses from Real Estate Operations For the Year Ended December 31, 2015 (dollar amounts in thousands)JBG REAL ESTATE OPERATING ASSETS Supplemental Information—Schedule 1 (Continued) Combining Statement of Revenue and Expenses from Real Estate Operations For the Year Ended December 31, 2015 (dollar amounts in thousands)JBG REAL ESTATE OPERATING ASSETS Supplemental Information—Schedule 1 (Continued) Combining Statement of Revenue and Expenses from Real Estate Operations For the Year Ended December 31, 2015 (dollar amounts in thousands)JBG REAL ESTATE OPERATING ASSETS Supplemental Information—Schedule 1 (Continued) Combining Statement of Revenue and Expenses from Real Estate Operations For the Year Ended December 31, 2015 (dollar amounts in thousands)JBG REAL ESTATE OPERATING ASSETS Supplemental Information—Schedule 1 (Continued) Combining Statement of Revenue and Expenses from Real Estate Operations For the Year Ended December 31, 2015 (dollar amounts in thousands)JBG REAL ESTATE OPERATING ASSETS Supplemental Information—Schedule 1 (Continued) Combining Statement of Revenue and Expenses from Real Estate Operations For the Year Ended December 31, 2015 (dollar amounts in thousands)JBG REAL ESTATE OPERATING ASSETS Supplemental Information—Schedule 1 (Continued) Combining Statement of Revenue and Expenses from Real Estate Operations For the Year Ended December 31, 2015 (dollar amounts in thousands)JBG REAL ESTATE OPERATING ASSETS Supplemental Information—Schedule 1 (Continued) Combining Statement of Revenue and Expenses from Real Estate Operations For the Year Ended December 31, 2015 (dollar amounts in thousands)JBG REAL ESTATE OPERATING ASSETS Supplemental Information—Schedule 1 (Continued) Combining Statement of Revenue and Expenses from Real Estate Operations For the Year Ended December 31, 2015 (dollar amounts in thousands)JBG REAL ESTATE OPERATING ASSETS Supplemental Information—Schedule 1 (Continued) Combining Statement of Revenue and Expenses from Real Estate Operations For the Year Ended December 31, 2015 (dollar amounts in thousands)JBG REAL ESTATE OPERATING ASSETS Supplemental Information—Schedule 1 (Continued) Combining Statement of Revenue and Expenses from Real Estate Operations For the Year Ended December 31, 2015 (dollar amounts in thousands)JBG REAL ESTATE OPERATING ASSETS Supplemental Information—Schedule 1 (Continued) Combining Statement of Revenue and Expenses from Real Estate Operations For the Year Ended December 31, 2015 (dollar amounts in thousands)JBG REAL ESTATE OPERATING ASSETS Supplemental Information—Schedule 1 (Continued) Combining Statement of Revenue and Expenses from Real Estate Operations For the Year Ended December 31, 2015 (dollar amounts in thousands)JBG REAL ESTATE OPERATING ASSETS Supplemental Information—Schedule 1 (Continued) Combining Statement of Revenue and Expenses from Real Estate Operations For the Year Ended December 31, 2015 (dollar amounts in thousands)JBG REAL ESTATE OPERATING ASSETS Supplemental Information—Schedule 2 Combining Statement of Revenue and Expenses from Real Estate Operations For the Year Ended December 31, 2014 (dollar amounts in thousands)JBG REAL ESTATE OPERATING ASSETS Supplemental Information—Schedule 2 (Continued) Combining Statement of Revenue and Expenses from Real Estate Operations For the Year Ended December 31, 2014 (dollar amounts in thousands)JBG REAL ESTATE OPERATING ASSETS Supplemental Information—Schedule 2 (Continued) Combining Statement of Revenue and Expenses from Real Estate Operations For the Year Ended December 31, 2014 (dollar amounts in thousands)JBG REAL ESTATE OPERATING ASSETS Supplemental Information—Schedule 2 (Continued) Combining Statement of Revenue and Expenses from Real Estate Operations For the Year Ended December 31, 2014 (dollar amounts in thousands)JBG REAL ESTATE OPERATING ASSETS Supplemental Information—Schedule 2 (Continued) Combining Statement of Revenue and Expenses from Real Estate Operations For the Year Ended December 31, 2014 (dollar amounts in thousands)JBG REAL ESTATE OPERATING ASSETS Supplemental Information—Schedule 2 (Continued) Combining Statement of Revenue and Expenses from Real Estate Operations For the Year Ended December 31, 2014 (dollar amounts in thousands)JBG REAL ESTATE OPERATING ASSETS Supplemental Information—Schedule 2 (Continued) Combining Statement of Revenue and Expenses from Real Estate Operations For the Year Ended December 31, 2014 (dollar amounts in thousands)JBG REAL ESTATE OPERATING ASSETS Supplemental Information—Schedule 2 (Continued) Combining Statement of Revenue and Expenses from Real Estate Operations For the Year Ended December 31, 2014 (dollar amounts in thousands)JBG REAL ESTATE OPERATING ASSETS Supplemental Information—Schedule 2 (Continued) Combining Statement of Revenue and Expenses from Real Estate Operations For the Year Ended December 31, 2014 (dollar amounts in thousands)JBG REAL ESTATE OPERATING ASSETS Supplemental Information—Schedule 2 (Continued) Combining Statement of Revenue and Expenses from Real Estate Operations For the Year Ended December 31, 2014 (dollar amounts in thousands)JBG REAL ESTATE OPERATING ASSETS Supplemental Information—Schedule 2 (Continued) Combining Statement of Revenue and Expenses from Real Estate Operations For the Year Ended December 31, 2014 (dollar amounts in thousands)JBG REAL ESTATE OPERATING ASSETS Supplemental Information—Schedule 2 (Continued) Combining Statement of Revenue and Expenses from Real Estate Operations For the Year Ended December 31, 2014 (dollar amounts in thousands)JBG REAL ESTATE OPERATING ASSETS Supplemental Information—Schedule 2 (Continued) Combining Statement of Revenue and Expenses from Real Estate Operations For the Year Ended December 31, 2014 (dollar amounts in thousands)STONEBRIDGE AT POTOMAC TOWN CENTER—PHASE I STATEMENT OF REVENUE AND EXPENSES FROM REAL ESTATE OPERATIONS Including Independent Auditors' Report For the Period January 1, 2015 to December 9, 2015Independent Auditors' ReportSTONEBRIDGE AT POTOMAC TOWN CENTER—PHASE I Statement of Revenue and Expenses from Real Estate Operations (dollar amounts in thousands)STONEBRIDGE AT POTOMAC TOWN CENTER—PHASE I Notes to the Statement of Revenue and Expenses from Real Estate Operations For the Period January 1, 2015 to December 9, 2015 (dollar amounts in thousands)