Exhibit 99.1
0 February 2014 Investor Presentation June 2015
1 Forward Looking Statements Certain statements included in this presentation are forward - looking statements . Those statements include statements regarding the intent, belief or current expectations of New York REIT, Inc . (the "Company," "we," "our" or "us") and members of our management team , as well as the assumptions on which such statements are based, and generally are identified by the use of words such as "may," " will", " seeks," "anticipates," "believes," "estimates," "expects," " plans," "intends," "should" or similar expressions . Actual results may differ materially from those contemplated by such forward - looking statements, including those set forth in the Risk Factors section of NYRT's Annual Report on Form 10 - K filed with the U . S . Securities and Exchange Commission . Further , forward - looking statements speak only as of the date they are made, and we undertake no obligation to update or revise forward - looking statements to reflect changed assumptions, the occurrence of unanticipated events or changes to future operating results over time, unless required by law .
2 The following are some of the risks and uncertainties, although not all risks and uncertainties, that could cause our actual results to differ materially from those presented in our forward - looking statements : • All of our executive officers are also officers, managers and/or holders of a direct or indirect interest in our Advisor and other American Realty Capital - affiliated entities ; as a result, our executive officers, our Advisor and its affiliates face conflicts of interest, including significant conflicts created by our Advisor’s compensation arrangements with us and other investor entities advised by American Realty Capital affiliates, and conflicts in allocating time among these entities and us, which could negatively impact our operating results ; • Because investment opportunities that are suitable for us may also be suitable for other American Realty Capital - advised programs or investors, our Advisor and its affiliates face conflicts of interest relating to the purchase of properties and other investments and such conflicts may not be resolved in our favor, meaning that we could invest in less attractive assets, which could reduce the investment return to our stockholders ; • We depend on tenants for our revenue, and, accordingly, our revenue is dependent upon the success and economic viability of our tenants ; • We may not be able to achieve our rental rate incentives and our expenses could be greater, which may impact our results of operations ; • Increases in interest rates could increase the amount of our debt payments and limit our ability to pay dividends ; • We have not generated cash flows sufficient to pay returns to stockholders, as such, we may be forced to borrow at higher rates or depend on our Advisor or our Property to waive reimbursement of certain expenses and fees to fund our operations ; • We may be unable to pay or maintain cash dividends or increase dividends over time . Amounts paid to our stockholder may be a return of capital and not a return on a stockholder's investment . • We are obligated to pay fees, which may be substantial, to our Advisor and its affiliates, including fees payable upon the sale of properties ; • We are subject to risks associated with the significant dislocations and liquidity disruptions that recently existed or occurred in the credit markets of the United States ; • We may fail to continue to qualify to be treated as a real estate investment trust for U . S . federal income tax purposes ; • Our properties may be adversely affected by economic cycles and risks inherent to the New York metropolitan statistical area, especially New York City ; and • We may be adversely affected by changes in general economic, business and political conditions, including the possibility of intensified international hostilities, acts of terrorism , and changes in conditions of United States or international lending, capital and financing markets . Forward - Looking Statements (cont’d)
3 Projections This presentation includes estimated projections of future operating results. These projections were not prepared in accordan ce with published guidelines of the SEC or the guidelines established by the American Institute of Certified Public Accountants for p rep aration and presentation of financial projections. This information is not fact and should not be relied upon as being necessarily in dic ative of future results; the projections were prepared in good faith by management and are based on numerous assumptions that may prov e t o be wrong. Important factors that may affect actual results and cause the projections to not be achieved include, but are not lim ite d to, risks and uncertainties relating to the company and other factors described under “Risk Factors” section of the Company’s Annual Re por t on Form 10 - K and any subsequent Quarterly Reports on Form 10 - Q or Current Reports on Form 8 - K and “Forward - Looking Statements.” The projections also reflect assumptions as to certain business decisions that are subject to change. As a result, actual res ult s may differ materially from those contained in the estimates. Accordingly, there can be no assurance that the estimates will be realized. This presentation also contains estimates and information concerning our industry, including market position, market size, an d g rowth rates of the markets in which we participate, that are based on industry publications and reports. This information involves a n umber of assumptions and limitations, and you are cautioned not to give undue weight to these estimates. We have not independently ver ifi ed the accuracy or completeness of the data contained in these industry publications and reports. The industry in which we operate i s s ubject to a high degree of uncertainty and risk due to variety of factors, including those described in the “Risk Factors” section of t he Company’s Annual Report on Form 10 - K and any subsequent Quarterly Reports on Form 10 - Q or Current Reports on Form 8 - K. These and other factors could cause results to differ materially from those expressed in these publications and reports.
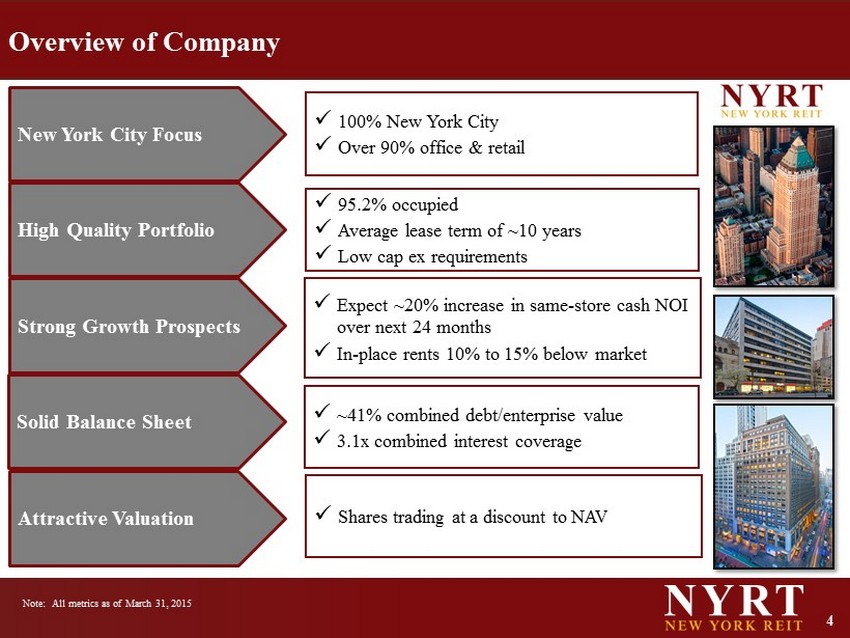
4 Overview of Company x Expect ~20% increase in same - store cash NOI over next 24 months x In - place rents 10% to 15 % below market x 100% New York City x Over 90% office & retail x 95.2% occupied x Average lease term of ~10 years x Low cap ex requirements x ~41% combined debt/enterprise value x 3.1x combined interest coverage x Shares trading at a discount to NAV New York City Focus High Quality Portfolio Solid Balance Sheet Strong Growth Prospects Attractive Valuation Note: All metrics as of March 31, 2015
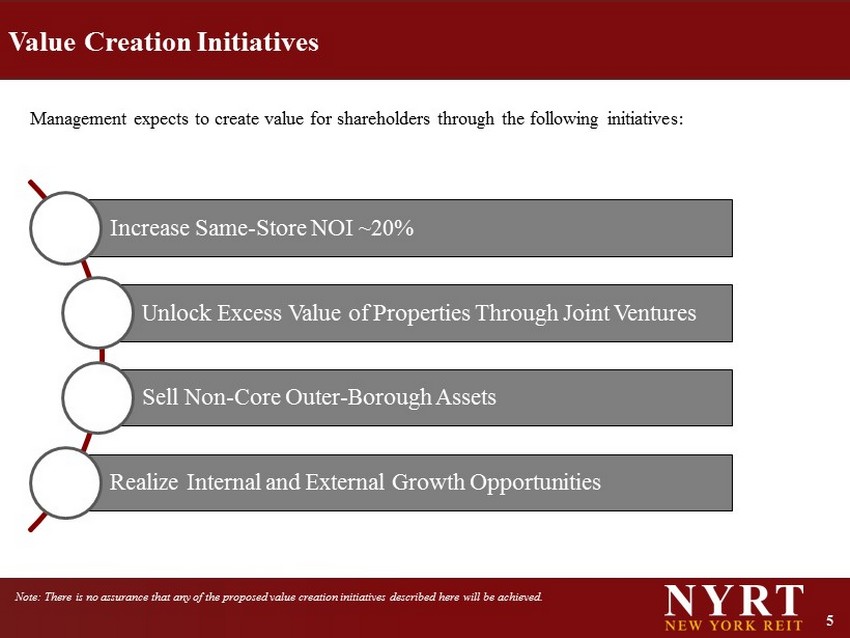
5 Value Creation Initiatives Increase Same - Store NOI ~20% Unlock Excess Value of Properties Through Joint Ventures Sell Non - Core Outer - Borough Assets Realize Internal and External Growth Opportunities Management expects to create value for shareholders through the following initiatives: Note : There is no assurance that any of the proposed value creation initiatives described here will be achieved.
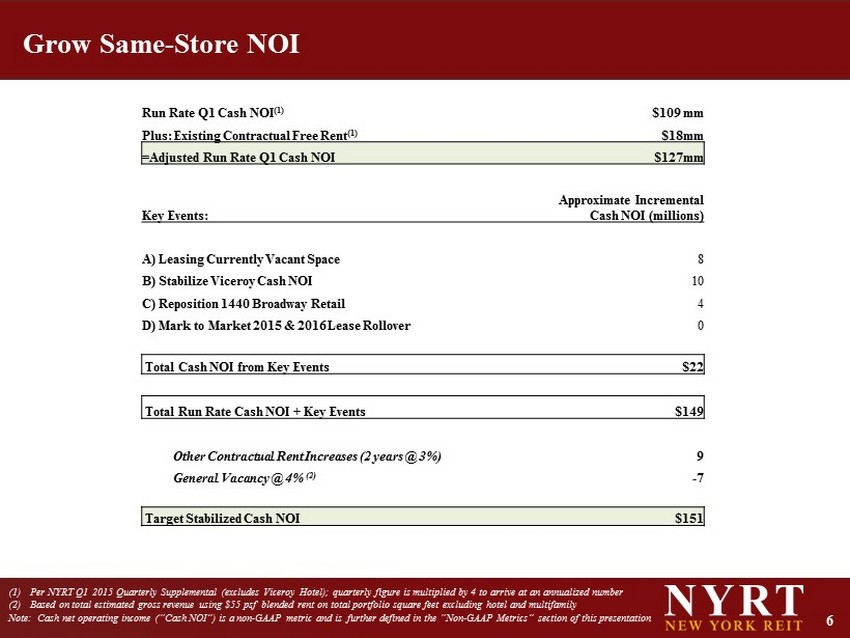
6 (1) Per NYRT Q1 2015 Quarterly Supplemental (excludes Viceroy Hotel); quarterly figure is multiplied by 4 to arrive at an annuali zed number (2) Based on total estimated gross revenue using $55 psf blended rent on total portfolio square feet excluding hotel and multifa mil y Note: Cash net operating income (“Cash NOI”) is a non - GAAP metric and is further defined in the “Non - GAAP Metrics” section of this presentation Grow Same - Store NOI Run Rate Q1 Cash NOI (1) $109 mm Plus: Existing Contractual Free Rent (1) $18mm =Adjusted Run Rate Q1 Cash NOI $127mm Key Events: Approximate Incremental Cash NOI (millions) A) Leasing Currently Vacant Space 8 B) Stabilize Viceroy Cash NOI 10 C) Reposition 1440 Broadway Retail 4 D) Mark to Market 2015 & 2016 Lease Rollover 0 Total Cash NOI from Key Events $22 Total Run Rate Cash NOI + Key Events $149 Other Contractual Rent Increases (2 years @ 3%) 9 General Vacancy @ 4% (2) - 7 Target Stabilized Cash NOI $151

7 Five Properties Account for 70% Portfolio Cash NOI Note: All metrics are as of 3/31/2015 (1) Square footage represents 48.9 % of building total which is NYRT’s pro rata share of its Joint Venture investment in Worldwide Plaza Top 5 properties account for more than 70% of portfolio Cash NOI Property Square Footage Occupancy (as of 3/31/15) Average Remaining Lease Term Borough Worldwide Plaza (1) 1,003,249 93% 12.4 Manhattan 1440 Broadway 748,502 92% 4.9 Manhattan Twitter Building 281,294 99% 12.7 Manhattan 333 West 34th Street 346,728 100% 9.2 Manhattan Red Bull Building 165,670 100% 8.5 Manhattan Total 5 Major Assets 2,545,443 95% 9.9
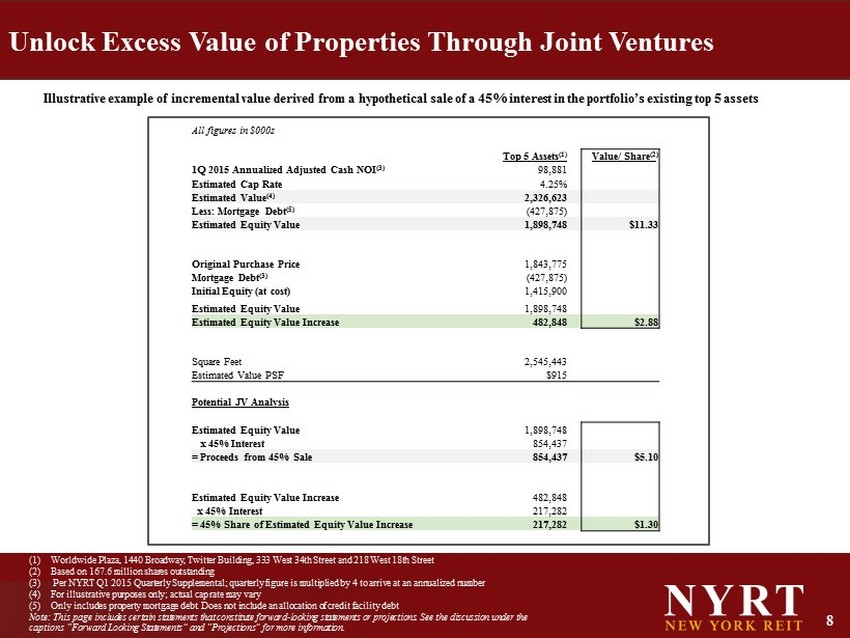
8 Unlock Excess Value of Properties Through Joint Ventures All figures in $000s Top 5 Assets (1) Value/ Share (2 ) 1Q 2015 Annualized Adjusted Cash NOI (3) 98,881 Estimated Cap Rate 4.25% Estimated Value (4) 2,326,623 Less: Mortgage Debt (5) (427,875) Estimated Equity Value 1,898,748 $11.33 Original Purchase Price 1,843,775 Mortgage Debt (3) (427,875) Initial Equity (at cost) 1,415,900 Estimated Equity Value 1,898,748 Estimated Equity Value Increase 482,848 $2.88 Square Feet 2,545,443 Estimated Value PSF $915 Potential JV Analysis Estimated Equity Value 1,898,748 x 45% Interest 854,437 = Proceeds from 45% Sale 854,437 $5.10 Estimated Equity Value Increase 482,848 x 45% Interest 217,282 = 45% Share of Estimated Equity Value Increase 217,282 $1.30 (1) Worldwide Plaza, 1440 Broadway, Twitter Building, 333 West 34th Street and 218 West 18th Street (2) Based on 167.6 million shares outstanding (3) Per NYRT Q1 2015 Quarterly Supplemental; quarterly figure is multiplied by 4 to arrive at an annualized number (4) For illustrative purposes only; actual cap rate may vary (5) Only includes property mortgage debt. Does not include an allocation of credit facility debt Note: This page includes certain statements that constitute forward - looking statements or projections. See the discussion under the captions “Forward Looking Statements” and “Projections” for more information. Illustrative example of incremental value derived from a hypothetical sale of a 45% interest in the portfolio’s existing top 5 a ssets
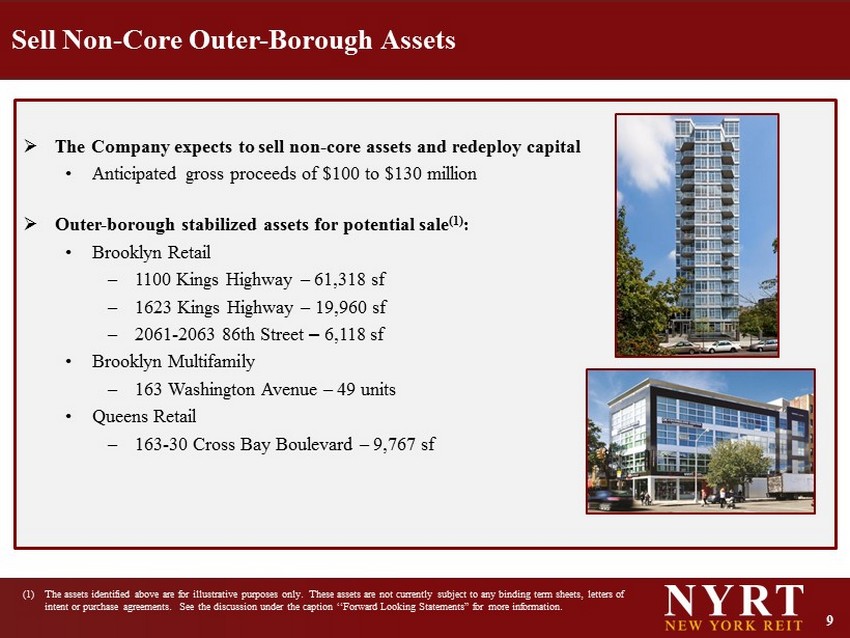
9 » The Company expects to sell non - core assets and redeploy capital • Anticipated gross proceeds of $100 to $130 million » Outer - borough stabilized assets for potential sale (1) : • Brooklyn Retail ‒ 1100 Kings Highway – 61,318 sf ‒ 1623 Kings Highway – 19,960 sf ‒ 2061 - 2063 86th Street – 6,118 sf • Brooklyn Multifamily ‒ 163 Washington Avenue – 49 units • Queens Retail ‒ 163 - 30 Cross Bay Boulevard – 9,767 sf Sell Non - Core Outer - Borough Assets (1) The assets identified above are for illustrative purposes only. These assets are not currently subject to any binding term sheets, letters of intent or purchase agreements. See the discussion under the caption “Forward Looking Statements” for more information.
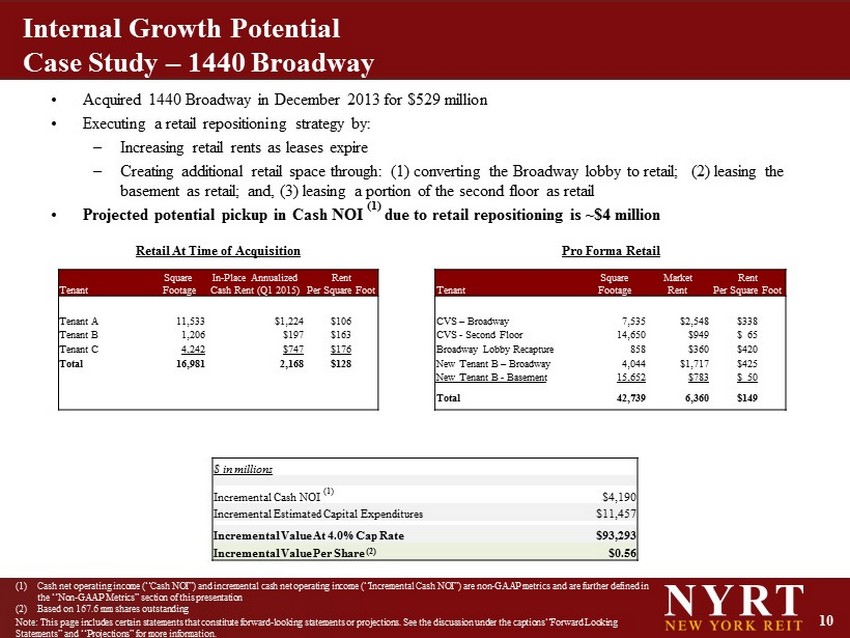
10 Internal Growth Potential Case Study – 1440 Broadway • Acquired 1440 Broadway in December 2013 for $529 million • Executing a retail repositioning strategy by: – Increasing retail rents as leases expire – Creating additional retail space through: (1) converting the Broadway lobby to retail; (2) leasing the basement as retail; and, (3) leasing a portion of the second floor as retail • Projected potential pickup in Cash NOI (1) due to retail repositioning is ~$4 million Retail At Time of Acquisition Pro Forma Retail Tenant Square Footage In - Place Annualized Cash Rent (Q1 2015) Rent Per Square Foot Tenant Square Footage Market Rent Rent Per Square Foot Tenant A 11,533 $ 1,224 $106 CVS – Broadway 7,535 $ 2,548 $ 338 Tenant B 1,206 $ 197 $163 CVS - Second Floor 14,650 $ 949 $ 65 Tenant C 4,242 $747 $176 Broadway Lobby Recapture 858 $ 360 $ 420 Total 16,981 2,168 $ 128 New Tenant B – Broadway 4,044 $ 1,717 $ 425 New Tenant B - Basement 15,652 $ 783 $ 50 Total 42,739 6,360 $ 149 (1) Cash net operating income (“Cash NOI ”) and incremental cash net operating income (“Incremental Cash NOI”) are non - GAAP metrics and are further defined in the “Non - GAAP Metrics” section of this presentation (2) Based on 167.6 mm shares outstanding $ in millions Incremental Cash NOI (1) $ 4,190 Incremental Estimated Capital Expenditures $ 11,457 Incremental Value At 4.0% Cap Rate $93,293 Incremental Value Per Share (2) $ 0.56 Note: This page includes certain statements that constitute forward - looking statements or projections. See the discussion under the captions “Forward Looking Statements” and “Projections” for more information.
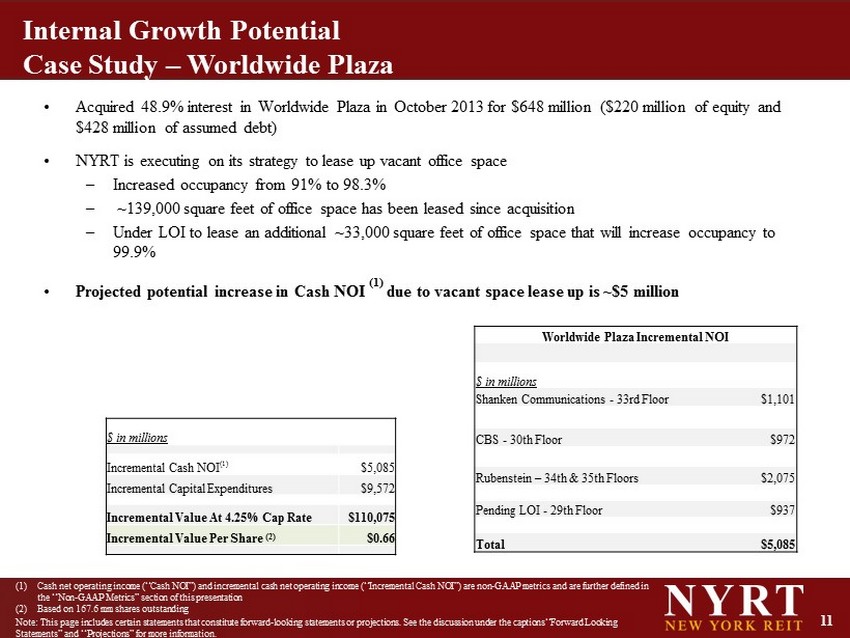
11 Internal Growth Potential Case Study – Worldwide Plaza • Acquired 48.9% interest in Worldwide Plaza in October 2013 for $648 million ($220 million of equity and $428 million of assumed debt) • NYRT is executing on its strategy to lease up vacant office space – Increased occupancy from 91% to 98.3% – ~139,000 square feet of office space has been leased since acquisition – Under LOI to lease an additional ~33,000 square feet of office space that will increase occupancy to 99.9% • Projected potential increase in Cash NOI (1) due to vacant space lease up is ~$5 million Worldwide Plaza Incremental NOI $ in millions Shanken Communications - 33rd Floor $ 1,101 CBS - 30th Floor $972 Rubenstein – 34th & 35th Floors $ 2,075 Pending LOI - 29th Floor $ 937 Total $5,085 $ in millions Incremental Cash NOI (1) $5,085 Incremental Capital Expenditures $9,572 Incremental Value At 4.25% Cap Rate $110,075 Incremental Value Per Share (2) $ 0.66 (1) Cash net operating income (“Cash NOI ”) and incremental cash net operating income (“Incremental Cash NOI”) are non - GAAP metrics and are further defined in the “Non - GAAP Metrics” section of this presentation (2) Based on 167.6 mm shares outstanding Note: This page includes certain statements that constitute forward - looking statements or projections. See the discussion under the captions “Forward Looking Statements” and “Projections” for more information.
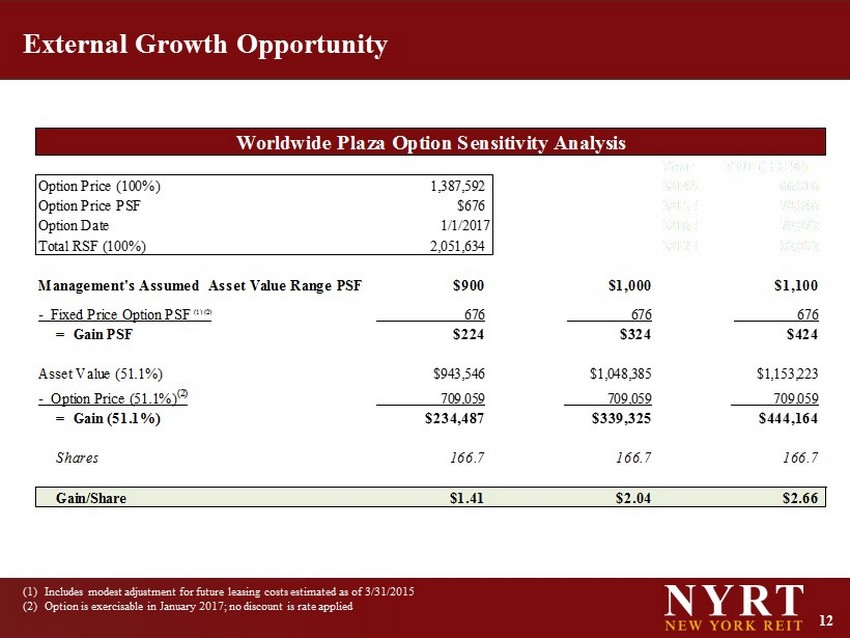
12 External Growth Opportunity Worldwide Plaza Option Sensitivity Analysis Year NOI (100%) Option Price (100%) 1,387,592 2014A 66,816 Option Price PSF $676 2015E 70,846 Option Date 1/1/2017 2016E 79,072 Total RSF (100%) 2,051,634 2017E 82,032 Management's Assumed Asset Value Range PSF $900 $1,000 $1,100 - Fixed Price Option PSF (1) (2) 676 676 676 = Gain PSF $224 $324 $424 Asset Value (51.1%) $943,546 $1,048,385 $1,153,223 - Option Price (51.1%) (2) 709,059 709,059 709,059 = Gain (51.1%) $234,487 $339,325 $444,164 Shares 166.7 166.7 166.7 Gain/Share $1.41 $2.04 $2.66 (1) Includes modest adjustment for future leasing costs estimated as of 3/31/2015 (2) Option is exercisable in January 2017; no discount is rate applied
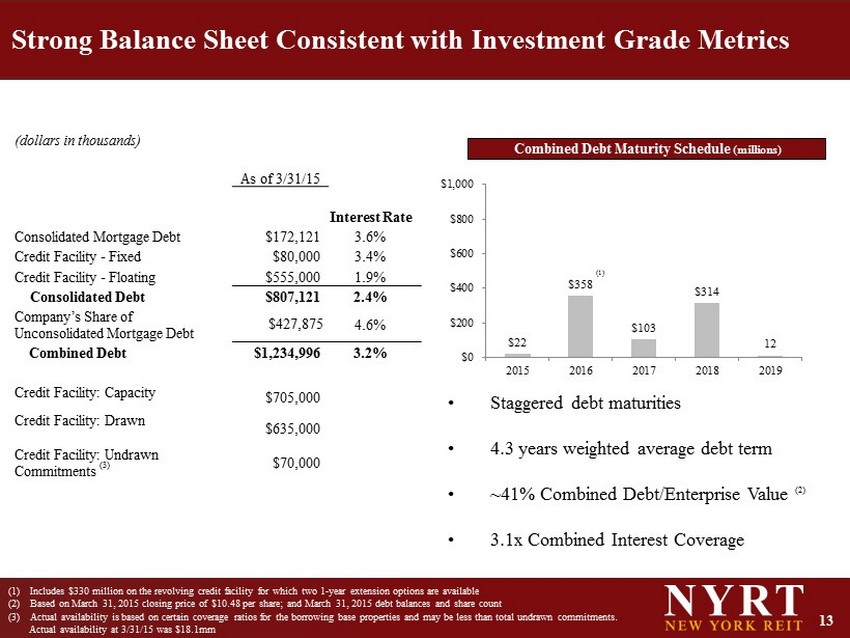
13 $22 $358 $103 $314 12 $0 $200 $400 $600 $800 $1,000 2015 2016 2017 2018 2019 Strong Balance Sheet Consistent with Investment Grade Metrics (1) Includes $330 million on the revolving credit facility for which two 1 - year extension options are available (2) Based on March 31, 2015 closing price of $ 10.48 per share; and March 31, 2015 debt balances and share count (3) Actual availability is based on certain coverage ratios for the borrowing base properties and may be less than total undrawn com mitments. Actual availability at 3/31/15 was $18.1mm (dollars in thousands ) As of 3/31/15 Interest Rate Consolidated Mortgage Debt $172,121 3.6% Credit Facility - Fixed $80,000 3.4% Credit Facility - Floating $555,000 1.9% Consolidated Debt $807,121 2.4% Company’s Share of Unconsolidated Mortgage Debt $427,875 4.6% Combined Debt $1,234,996 3.2% Credit Facility: Capacity $705,000 Credit Facility: Drawn $635,000 Credit Facility: Undrawn Commitments (3) $70,000 Combined Debt Maturity Schedule (millions) • Staggered debt maturities • 4.3 years weighted average debt term • ~41% Combined Debt/Enterprise Value (2) • 3.1x Combined Interest Coverage (1)
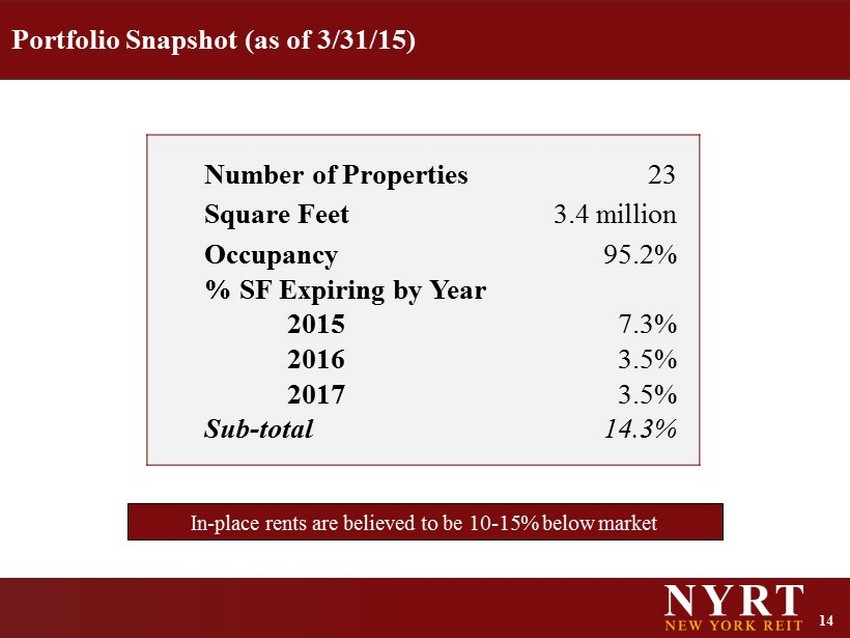
14 Portfolio Snapshot (as of 3/31/15) In - place rents are believed to be 10 - 15% below market Number of Properties 23 Square Feet 3.4 million Occupancy 95.2% % SF Expiring by Year 2015 7.3% 2016 3.5% 2017 3.5% Sub - total 14.3%
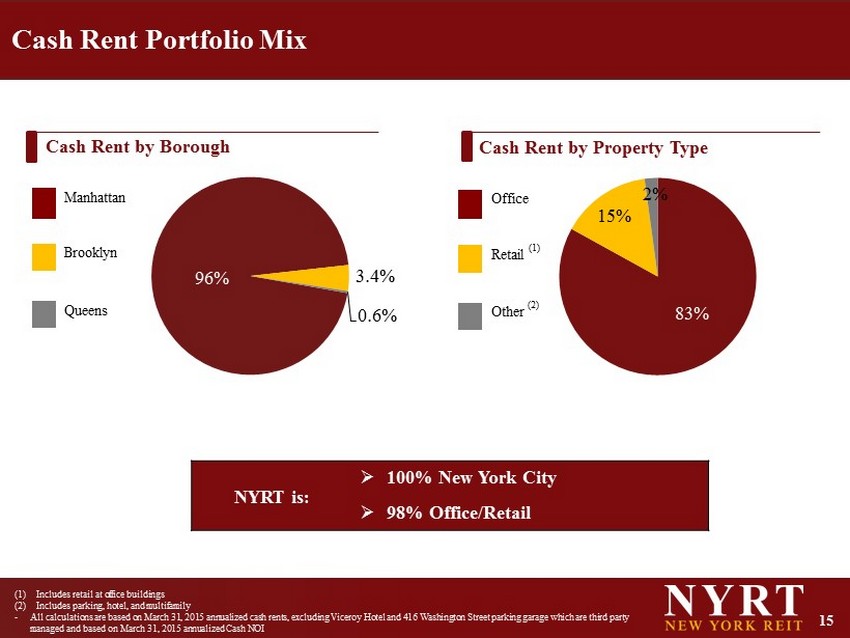
15 Cash Rent Portfolio Mix (1) Includes retail at office buildings (2) Includes parking, hotel, and multifamily - All calculations are based on March 31, 2015 annualized cash rents, excluding Viceroy Hotel and 416 Washington Street parking garage which are third party managed and based on March 31, 2015 annualized Cash NOI Cash Rent by Property Type 96% 3.4% 0.6% Manhattan Brooklyn Queens Cash Rent by Borough NYRT is: » 100% New York City » 98% Office/Retail Office Retail (1) Other (2) 83% 15% 2%
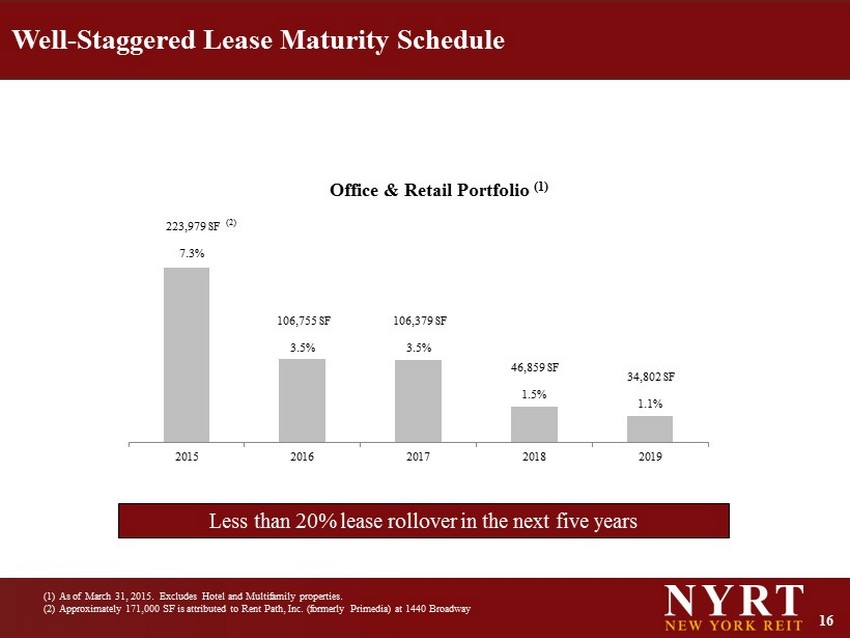
16 223,979 SF 7.3% 106,755 SF 3.5% 106,379 SF 3.5% 46,859 SF 1.5% 34,802 SF 1.1% 2015 2016 2017 2018 2019 (1) As of March 31, 2015. Excludes Hotel and Multifamily properties. (2) Approximately 171,000 SF is attributed to Rent Path, Inc. (formerly Primedia) at 1440 Broadway Well - Staggered Lease Maturity Schedule Office & Retail Portfolio (1) (2) Less than 20% lease rollover in the next five years
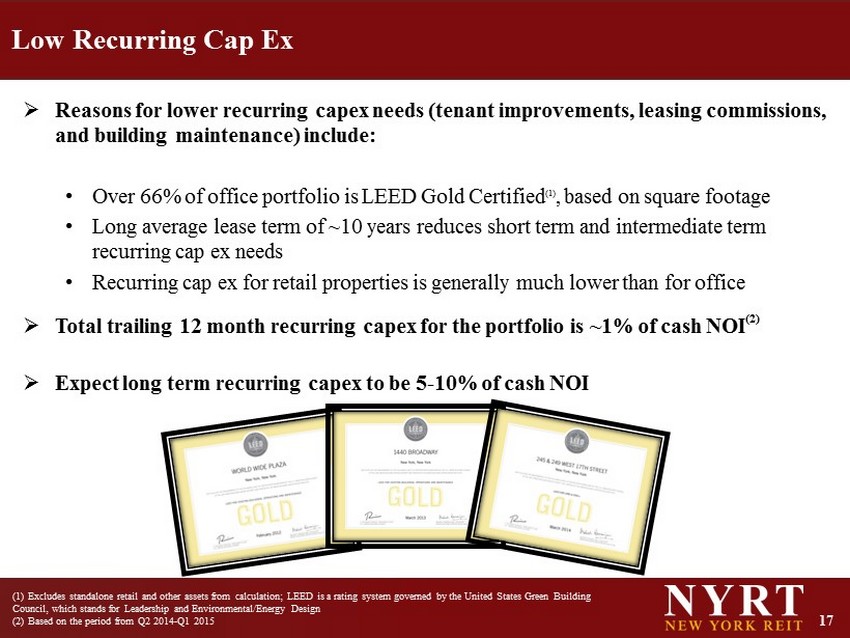
17 » Reasons for lower recurring capex needs (tenant improvements, leasing commissions, and building maintenance) include: • Over 66% of office portfolio is LEED Gold Certified (1) , based on square footage • Long average lease term of ~10 years reduces short term and intermediate term recurring cap ex needs • Recurring cap ex for retail properties is generally much lower than for office » Total trailing 12 month recurring capex for the portfolio is ~1% of cash NOI (2) » Expect long term recurring capex to be 5 - 10% of cash NOI Low Recurring Cap Ex ( 1 ) Excludes standalone retail and other assets from calculation; LEED is a rating system governed by the United States Green Building Council, which stands for Leadership and Environmental/Energy Design (2) Based on the period from Q2 2014 - Q1 2015
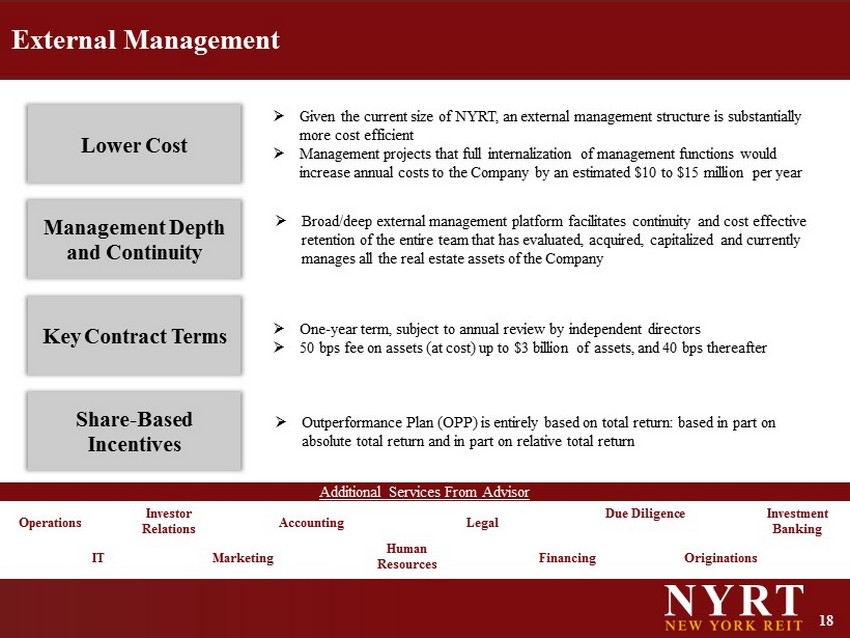
18 External Management Lower Cost Management Depth and Continuity Key Contract Terms Share - Based Incentives » Given the current size of NYRT, an external management structure is substantially more cost efficient » Management projects that full internalization of management functions would increase annual costs to the Company by an estimated $10 to $15 million per year » Broad/deep external management platform facilitates continuity and cost effective retention of the entire team that has evaluated, acquired, capitalized and currently manages all the real estate assets of the Company » One - year term, subject to annual review by independent directors » 50 bps fee on assets (at cost) up to $3 billion of assets, and 40 bps thereafter » Outperformance Plan (OPP) is entirely based on total return: based in part on absolute total return and in part on relative total return Additional Services From Advisor Operations IT Marketing Accounting Legal Human Resources Originations Due Diligence Investment Banking Investor Relations Financing
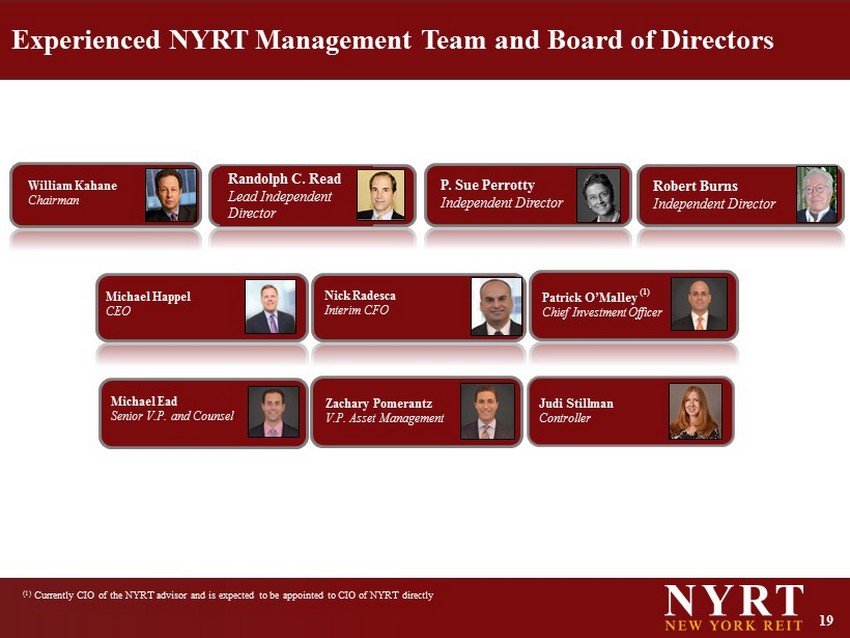
19 Experienced NYRT Management Team and Board of Directors Michael Ead Senior V.P. and Counsel Michael Happel CEO Judi Stillman Controller Nick Radesca Interim CFO Robert Burns Independent Director P. Sue Perrotty Independent Director Zachary Pomerantz V.P. Asset Management Patrick O’Malley (1) Chief Investment Officer William Kahane Chairman Randolph C. Read Lead Independent Director (1) Currently CIO of the NYRT advisor and is expected to be appointed to CIO of NYRT directly

20 Michael A. Happel, Chief Executive Officer Mr . Happel has over 25 years of experience investing in real estate including acquisitions of office, retail, multifamily, industrial and hotel properties as well as acquisitions of real estate companies and real estate debt . From 1988 - 2002 , he worked at Morgan Stanley & Co . , specializing in real estate and becoming co - head of acquisitions for the Morgan Stanley Real Estate Funds, or MSREF, in 1994 . While at MSREF, he was involved in acquiring over $ 10 billion of real estate and related assets in MSREF I and MSREF II . As stated in a report prepared by Wurts & Associates for the Fresno County Employees’ Retirement Association for the period ending September 30 , 2008 , MSREF I generated approximately a 48 % gross IRR for investors and MSREF II generated approximately a 27 % gross IRR for investors . In 2002 , Mr . Happel left Morgan Stanley & Co . to join Westbrook Partners, a large real estate private equity firm with over $ 5 billion of real estate assets under management at the time . In 2004 , he joined Atticus Capital, a multi - billion dollar hedge fund, as the head of real estate with responsibility for investing primarily in REITs and other publicly traded real estate securities . Nicholas Radesca, Interim Chief Financial Officer Mr . Radesca serves as the Interim Chief Financial Officer, Treasurer and Secretary for NYRT . Mr . Radesca also serves as the Chief Financial Officer of BDCA’s sponsor, AR Capital, and in the same capacity for a number of publicly registered, non - traded REITs sponsored by AR Capital . Prior to joining the Company in December 2012 , Mr . Radesca was CFO and corporate secretary for Solar Capital Ltd (SLRC) and Solar Senior Capital Ltd . (SUNS) from 2008 to 2012 , both of which are publicly traded business development companies . From 2006 to 2008 , Mr . Radesca served as the chief accounting officer at iStar Financial Inc . (SFI), a publicly traded commercial REIT, where his responsibilities included overseeing accounting, tax and SEC reporting . Prior to iStar, Mr . Radesca served in various senior accounting and financial reporting roles at Fannie Mae, Del Monte Foods Company, Providian Financial Corporation and Bank of America . Mr . Radesca is a licensed CPA in NY and VA, holds a BS in accounting from the New York Institute of Technology and an MBA from the California State University, East Bay . Senior Management Team
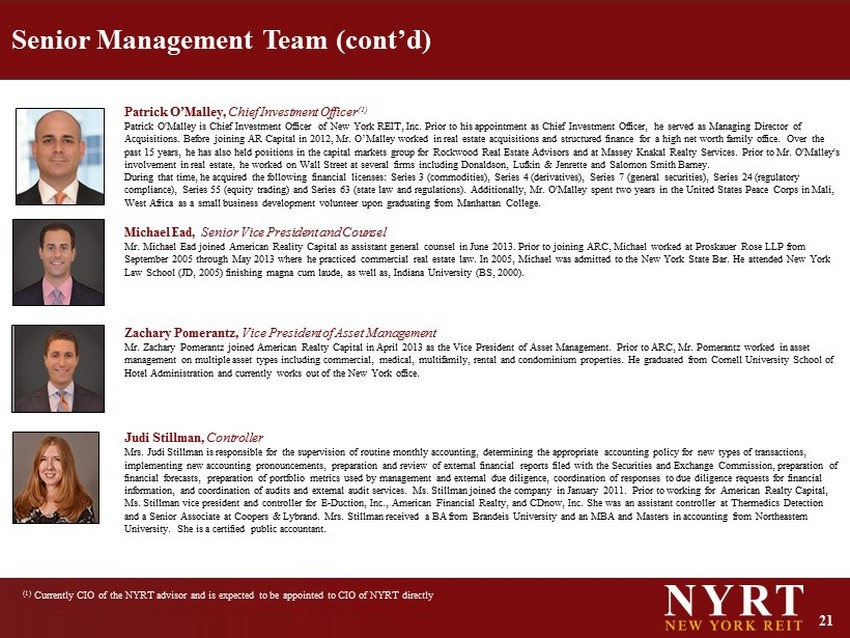
21 Patrick O’Malley, Chief Investment Officer (1) Patrick O'Malley is Chief Investment Officer of New York REIT, Inc. Prior to his appointment as Chief Investment Officer, he ser ved as Managing Director of Acquisitions. Before joining AR Capital in 2012, Mr. O’Malley worked in real estate acquisitions and structured finance for a hi gh net worth family office. Over the past 15 years, he has also held positions in the capital markets group for Rockwood Real Estate Advisors and at Massey Knakal Re alty Services. Prior to Mr. O'Malley's involvement in real estate, he worked on Wall Street at several firms including Donaldson, Lufkin & Jenrette and Salomon Smit h B arney. During that time, he acquired the following financial licenses: Series 3 (commodities), Series 4 (derivatives), Series 7 (gen era l securities), Series 24 (regulatory compliance), Series 55 (equity trading) and Series 63 (state law and regulations). Additionally, Mr. O'Malley spent two years in the United States Peace Corps in Mali, West Africa as a small business development volunteer upon graduating from Manhattan College . Michael Ead, Senior Vice President and Counsel Mr. Michael Ead joined American Reality Capital as assistant general counsel in June 2013. Prior to joining ARC, Michael work ed at Proskauer Rose LLP from September 2005 through May 2013 where he practiced commercial real estate law. In 2005, Michael was admitted to the New York Sta te Bar. He attended New York Law School (JD, 2005) finishing magna cum laude, as well as, Indiana University (BS, 2000). Zachary Pomerantz, Vice President of Asset Management Mr. Zachary Pomerantz joined American Realty Capital in April 2013 as the Vice President of Asset Management. Prior to ARC, M r. Pomerantz worked in asset management on multiple asset types including commercial, medical, multifamily, rental and condominium properties. He graduate d f rom Cornell University School of Hotel Administration and currently works out of the New York office . Judi Stillman, Controller Mrs. Judi Stillman is responsible for the supervision of routine monthly accounting, determining the appropriate accounting policy for new types of transactions, implementing new accounting pronouncements, preparation and review of external financial reports filed with the Securities an d E xchange Commission, preparation of financial forecasts, preparation of portfolio metrics used by management and external due diligence, coordination of response s t o due diligence requests for financial information, and coordination of audits and external audit services. Ms. Stillman joined the company in January 2011. Prior to working for American Realty Capital, Ms. Stillman vice president and controller for E - Duction, Inc., American Financial Realty, and CDnow, Inc. She was an assistant controller at Thermedics Detection and a Senior Associate at Coopers & Lybrand. Mrs. Stillman received a BA from Brandeis University and an MBA and Masters in a cco unting from Northeastern University. She is a certified public accountant. Senior Management Team (cont’d) (1) Currently CIO of the NYRT advisor and is expected to be appointed to CIO of NYRT directly
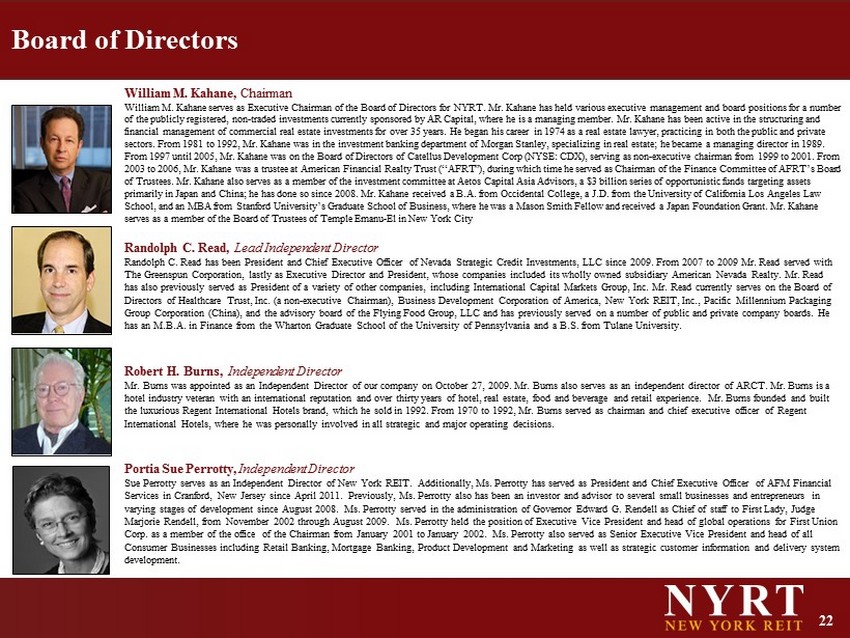
22 William M. Kahane, Chairman William M. Kahane serves as Executive Chairman of the Board of Directors for NYRT. Mr. Kahane has held various executive management and board positions for a number of the publicly registered, non - traded investments currently sponsored by AR Capital, where he is a managing member. Mr. Kahane has been active in the structuring and financial management of commercial real estate investments for over 35 years. He began his career in 1974 as a real estate la wye r, practicing in both the public and private sectors. From 1981 to 1992, Mr. Kahane was in the investment banking department of Morgan Stanley, specializing in real estat e; he became a managing director in 1989. From 1997 until 2005, Mr. Kahane was on the Board of Directors of Catellus Development Corp (NYSE: CDX), serving as non - executiv e chairman from 1999 to 2001. From 2003 to 2006, Mr. Kahane was a trustee at American Financial Realty Trust (“AFRT”), during which time he served as Chairman o f t he Finance Committee of AFRT’s Board of Trustees. Mr. Kahane also serves as a member of the investment committee at Aetos Capital Asia Advisors, a $3 billion seri es of opportunistic funds targeting assets primarily in Japan and China; he has done so since 2008. Mr. Kahane received a B.A. from Occidental College, a J.D. from the Uni versity of California Los Angeles Law School, and an MBA from Stanford University’s Graduate School of Business, where he was a Mason Smith Fellow and received a J apa n Foundation Grant. Mr. Kahane serves as a member of the Board of Trustees of Temple Emanu - El in New York City Randolph C. Read, Lead Independent Director Randolph C. Read has been President and Chief Executive Officer of Nevada Strategic Credit Investments, LLC since 2009. From 200 7 to 2009 Mr. Read served with The Greenspun Corporation, lastly as Executive Director and President, whose companies included its wholly owned subsidiary A mer ican Nevada Realty. Mr. Read has also previously served as President of a variety of other companies, including International Capital Markets Group, Inc. Mr. Read currently serves on the Board of Directors of Healthcare Trust, Inc. ( a non - executive Chairman), Business Development Corporation of America, New York REIT, Inc ., Pacific Millennium Packaging Group Corporation (China), and the advisory board of the Flying Food Group, LLC and has previously served on a number of publ ic and private company boards. He has an M.B.A. in Finance from the Wharton Graduate School of the University of Pennsylvania and a B.S. from Tulane University . Robert H. Burns, Independent Director Mr . Burns was appointed as an Independent Director of our company on October 27, 2009. Mr. Burns also serves as an independent dir ector of ARCT. Mr. Burns is a hotel industry veteran with an international reputation and over thirty years of hotel, real estate, food and beverage and re tai l experience. Mr. Burns founded and built the luxurious Regent International Hotels brand, which he sold in 1992. From 1970 to 1992, Mr. Burns served as chairman and c hie f executive officer of Regent International Hotels, where he was personally involved in all strategic and major operating decisions. Portia Sue Perrotty, Independent Director Sue Perrotty serves as an Independent Director of New York REIT. Additionally, Ms. Perrotty has served as President and Chie f E xecutive Officer of AFM Financial Services in Cranford, New Jersey since April 2011. Previously, Ms. Perrotty also has been an investor and advisor to several sm all businesses and entrepreneurs in varying stages of development since August 2008. Ms. Perrotty served in the administration of Governor Edward G. Rendell as Chi ef of staff to First Lady, Judge Marjorie Rendell, from November 2002 through August 2009. Ms. Perrotty held the position of Executive Vice President and hea d o f global operations for First Union Corp. as a member of the office of the Chairman from January 2001 to January 2002. Ms. Perrotty also served as Senior Execut ive Vice President and head of all Consumer Businesses including Retail Banking, Mortgage Banking, Product Development and Marketing as well as strategic custom er information and delivery system development. Board of Directors
23 Non - GAAP Metrics This presentation uses certain non - GAAP metrics, including Funds from Operations (“FFO”), Adjusted Funds from Operations (“AFFO” ), Core Funds From Operations (“ CFFO”), Net Operating Income (“NOI”), Cash Net Operating Income (“Cash NOI”) and Incremental Net Operating Income (“Incremental NOI”) . We believe that, since real estate values historically rise and fall with market conditions, including inflation, interest rates, the business cycle , u nemployment and consumer spending, presentations of operating results for a REIT using historical accounting may be something less informative than such non - GAAP financial metrics. However, these non - GAAP metrics should be read in conjunction with our reported GAAP financial statements. Note that our computation of these non - GAAP performance metrics may not be comparable to similarly - named performance metrics rep orted by other REITs or real estate companies, limiting their usefulness as a comparative measure. We compensate for these limitations by relying primarily on ou r G AAP results and using the non - GAAP measures only for supplemental purposes. Please see our consolidated financial statements and the related notes thereto. We use these non - GAAP metrics as an important part of our report and planning processes to, among other things,: • Monitor and evaluate the performance of our business operations; • Facilitate management’s internal comparisons of the historical operating performance of our business operations; • Facilitate management’s external comparisons of the results of our overall business to the historical operating performance ot her companies that may have different capital structures and debt levels; • Analyze and evaluate financial and strategic planning decisions regarding future operating investments; • Provide useful information to investors regarding financial and business trends related to our results of operations; and • Plan for and prepare future annual operating budgets and determine appropriate levels of operating investments. These non - GAAP measures have limitations as analytical tools, and you should not consider any of these measures in isolation or as a substitute for analyses of our income or cash flows as reported under GAAP. Some these limitations are: • They do not reflect our cash expenditures, or future requirements for capital expenditures, or contractual commitments; • They do not reflect changes in, or cash requirements for, our working capital needs; • They do not reflect the interest expense, or the cash requirements necessary to service interest or principal payments, on our debt; and depreciation, amortization and non - cash expense items that are reflected in our statements of cash flows.
24 Non - GAAP Metrics Funds from operations (FFO) Pursuant to the revised definition of funds from operations adopted by the Board of Governors of the National Association of Real Estate Investment Trusts (“NAREIT”), we calculate funds from operations (FFO) ; a non - GAAP financial measure ; by adjusting net income (loss) attributable stockholders (computed in accordance with GAAP, including non - recurring items) for gains (or losses) from sales of properties, impairment losses on depreciable real estate of consolidated real estate, impairment losses on investments in unconsolidated joint ventures driven by a measurable decrease in the fair value of depreciable real estate held by the unconsolidated joint ventures, real estate related depreciation and amortization, and after adjustment for unconsolidated partnerships and joint ventures . FFO is a non - GAAP financial measure . The use of FFO, combined with the required primary GAAP presentations, has been fundamentally beneficial in improving the understanding of operating results of REITs among the investing public and making comparisons of REIT operating results more meaningful . Management generally considers FFO to be a useful measure for reviewing our comparative operating and financial performance because, by excluding gains and losses related to asset sales (land and property), impairment losses and real estate asset depreciation and amortization (which can vary among owners of identical assets in similar condition based on historical cost accounting and useful life estimates), FFO can help one compare the operating performance of a company’s real estate between periods or as compared to different companies . Our computation of FFO may not be comparable to FFO reported by other REITs or real estate companies that do not define the term in accordance with the current NAREIT definition or that interpret the current NAREIT definition differently . FFO should not be considered as an alternative to net income attributable to stockholders (determined in accordance with GAAP) as an indication of our performance . FFO does not represent cash generated from operating activities determined in accordance with GAAP, and is not a measure of liquidity or an indicator of our ability to make cash distributions . We believe that to further understand our performance, FFO should be compared with our reported net income attributable to stockholders and considered in addition to cash flows determined in accordance with GAAP, as presented in our consolidated financial statements . Adjusted funds from operations (AFFO) AFFO ; a non - GAAP financial measure ; is core FFO excluding certain income or expense items that we consider more reflective of investing activities, other non - cash income and expense items and the income and expense effects of other activities that are not a fundamental attribute of our business plan . These items include unrealized gains and losses, which may not ultimately be realized, such as gains or losses on derivative instruments, gains or losses on contingent valuation rights, gains and losses on investments and early extinguishment of debt . In addition, by excluding non - cash income and expense items such as amortization of above and below market leases, amortization of deferred financing costs, straight - line rent and non - cash equity compensation from AFFO we believe we provide useful information regarding income and expense items which have no cash impact and do not provide liquidity to the company or require capital resources of the company . We exclude distributions related to Class B units and certain interest expenses related to securities that are convertible to common stock as the shares are assumed to have converted to common stock in our calculation of weighted average common shares - fully diluted . Furthermore we include certain cash inflow and outflows that are reflective of operating activities including preferred returns on joint ventures, second generation tenant improvement and leasing commissions (included in the period in which the lease commences) and recurring capital expenditures . Although our AFFO may not be comparable to that of other REITs and real estate companies, we believe it provides a meaningful indicator of our ability to fund cash needs and to make cash distributions to stockholders . In addition, we believe that to further understand our liquidity, AFFO should be compared with our cash flows determined in accordance with GAAP, as presented in our consolidated financial statements . AFFO does not represent cash generated from operating activities determined in accordance with GAAP, and AFFO should not be considered as an alternative to net income (determined in accordance with GAAP) as an indication of our performance, as an alternative to net cash flows from operating activities (determined in accordance with GAAP), or as a measure of our liquidity .
25 Non - GAAP Metrics Core funds from operations (Core FFO) Core funds from operations (Core FFO), is FFO excluding acquisition and transaction related costs, other costs that are considered to be non - recurring, such as charges relating to the Listing Note, non - recurring revenue, such as lease termination or modification fees, and other non - recurring expenses . The purchase of properties, and the corresponding expenses associated with that process, is a key operational feature of our business plan to generate operational income and cash flows in order to make dividend payments to investors . In evaluating investments in real estate, we differentiate the costs to acquire the investment from the operations derived from the investment . By excluding expensed acquisition and transaction related costs as well as non - recurring revenues and expenses, we believe Core FFO provides useful supplemental information that is comparable for each type of real estate investment and is consistent with management's analysis of the investing and operating performance of our properties . Net operating income (NOI) Net operating income (NOI) is a non - GAAP financial measure equal to net income attributable to stockholders, the most directly c omparable GAAP financial measure, less discontinued operations, plus corporate general and administrative expense, acquisition and transaction costs, depreciation and amortizati on and interest expense, income from unconsolidated joint ventures, interest and other income and gains from investments in securities. NOI is adjusted to include our pro - rata share of NOI from un consolidated joint ventures. We use NOI internally as a performance measure and believe NOI provides useful information to investors regarding our financial condition and results of op erations because it reflects only those income and expense items that are incurred at the property level. Therefore, we believe NOI is a useful measure for evaluating the operating per for mance of our real estate assets and to make decisions about resource allocations. Further, we believe NOI is useful to investors as a performance measure because, when compared across p eri ods, NOI reflects the impact on operations from trends in occupancy rates, rental rates, operating costs acquisition activity on an unleveraged basis, providing perspective not immedi ate ly apparent from net income. NOI excludes certain components from net income in order to provide results that are more closely related to a property's results of operations. For example, in terest expense is not necessarily linked to the operating performance of a real estate asset and is often incurred at the corporate level as opposed to the property level. In addition, depreciati on and amortization, because of historical cost accounting and useful life estimates, may distort operating performance at the property level. NOI presented by us may not be comparable to NOI reported by other REITs that define NOI differently. We believe that in order to facilitate a clear understanding of our operating results, NOI should be examined in conjunction with net income as pre sented in our consolidated financial statements. NOI should not be considered as an alternative to net income as an indication of our performance or to cash flows as a measure of our liquidity or ability to make distributions. Cash net operating income (Cash NOI) NOI, presented on a cash basis, which is equal to NOI after eliminating the effects of straight - lining of rent and fair value le ase revenue. Incremental cash net operating income (Incremental Cash NOI) Incremental NOI , presented on a cash basis, which is attributed to certain specific future anticipated events; incremental Cash NOI can include but is not limited to NOI generate d f rom future vacant lease up, future building reconfiguration, and future mark to market of expiring leases. Annualized Adjusted Cash NOI NOI, presented on a cash basis, which is equal to NOI after eliminating the effects of straight - line rent and fair value lease r evenue, plus contractual free rent. The quarterly number is multiplied by 4 to arrive at an annualized figure.