Exhibit 99.1

0 February 2014 Investor Presentation February 2016

1 1 Forward Looking Statements & Projections Certain statements included in this presentation are forward - looking statements . Those statements include statements regarding the intent, belief or current expectations of New York REIT, Inc . (the “Company,” “NYRT,” "we," "our" or "us ") and members of our management team, as well as the assumptions on which such statements are based, and generally are identified by the use of words such as "may," " will", " seeks," "anticipates," "believes," "estimates," "expects," " plans," "intends," "should" or similar expressions . Actual results may differ materially from those contemplated by such forward - looking statements, including those set forth in the Risk Factors section of NYRT's Annual Report on Form 10 - K filed with the U . S . Securities and Exchange Commission on February 26 , 2016 . Further , forward - looking statements speak only as of the date they are made, and we undertake no obligation to update or revise forward - looking statements to reflect changed assumptions, the occurrence of unanticipated events or changes to future operating results over time, unless required by law . The following are some of the risks and uncertainties, although not all risks and uncertainties, that could cause our actual results to differ materially from those presented in our forward - looking statements : • Our board continues to explore and evaluate strategic alternatives to enhance stockholder value and there can be no assurance reg ard ing the form or substance of any potential transaction or transactions that may be identified or consummated as a result of this process or how long the process may take; • All of our executive officers are also officers, managers or holders of a direct or indirect interest in New York Recovery Ad vis ors, LLC (our "Advisor") and other entities affiliated with AR Global Investments, LLC (the successor business to AR Capital, LLC, "AR Global"); as a result, our executive officers, our Advisor and its affiliates face co nflicts of interest, including significant conflicts created by our Advisor’s compensation arrangements with us and other investor entities advised by AR Global affiliates, and conflicts in allocating time among thes e e ntities and us, which could negatively impact our operating results; • We depend on tenants for revenue, and, accordingly, our revenue is dependent upon the success and economic viability of our t ena nts; • We may not be able to achieve our rental rate objectives on new and renewal leases and our expenses could be greater, which m ay impact our results of operations; • Our properties may be adversely affected by economic cycles and risks inherent to the New York metropolitan statistical area (“M SA”), especially New York City; • We may be unable to pay cash dividends or increase dividends over time. Amounts paid to our stockholders may be a return of capital and not a return on a sto ckholder's investment; • We are obligated to pay fees, which may be substantial, to our Advisor and its affiliates, including fees payable upon the sa le of properties ; • There can be no assurance that we will be able to realize our anticipated proceeds from the sale of our non - core assets; • We may fail to continue to qualify to be treated as a real estate investment trust for U.S. federal income tax purposes (“REI T”) ; • Because investment opportunities that are suitable for us may also be suitable for other AR Global - advised programs or investors , our Advisor and its affiliates may face conflicts of interest relating to the purchase of properties and other investments and such conflicts may not be resolved in our favor, meaning that we could invest in less attractive as set s, which could reduce the investment return to our stockholders; • We are party to an investment opportunity allocation agreement (the "Allocation Agreement") with another program that is spon sor ed by American Realty Capital III, LLC (our "Sponsor"), pursuant to which we may not have the first opportunity to acquire all properties identified by our Advisor and its affiliates; and • We may be adversely affected by changes in general economic, business and political conditions, including the possibility of int ensified international hostilities, acts of terrorism, and changes in conditions of United States or international lending, capital and financing markets. This presentation includes estimated projections of future operating results. These projections were not prepared in accordan ce with published guidelines of the SEC or the guidelines established by the American Institute of Certified Public Accountants for preparation and presentation of financial projections. This information is not fact and shou ld not be relied upon as being necessarily indicative of future results; the projections were prepared in good faith by management and are based on numerous assumptions that may prove to be wrong. Important factors that may affect act ual results and cause the projections to not be achieved include, but are not limited to, risks and uncertainties relating to the company and other factors described under “Risk Factors” sections of the Company’s Annual Report on Form 10 - K and any subsequent Quarterly Reports on Form 10 - Q or Current Reports on Form 8 - K and “Forward - Looking Statements.” The projections also reflect assumptions as to certain business decisions that are subject t o change. As a result, actual results may differ materially from those contained in the estimates. Accordingly, there can be no assurance that the estimates will be realized. This presentation also contains estimates and information concerning our industry, including market position, market size, an d g rowth rates of the markets in which we participate, that are based on industry publications and reports. This information involves a number of assumptions and limitations, and you are cautioned not to give undue weight to th ese estimates. We have not independently verified the accuracy or completeness of the data contained in these industry publications and reports. The industry in which we operate is subject to a high degree of uncerta int y and risk due to variety of factors, including those described in the “Risk Factors” section of the Company’s Annual Report on Form 10 - K and any subsequent Quarterly Reports on Form 10 - Q or Current Reports on Form 8 - K. These and other factors could cau se results to differ materially from those expressed in these publications and reports .
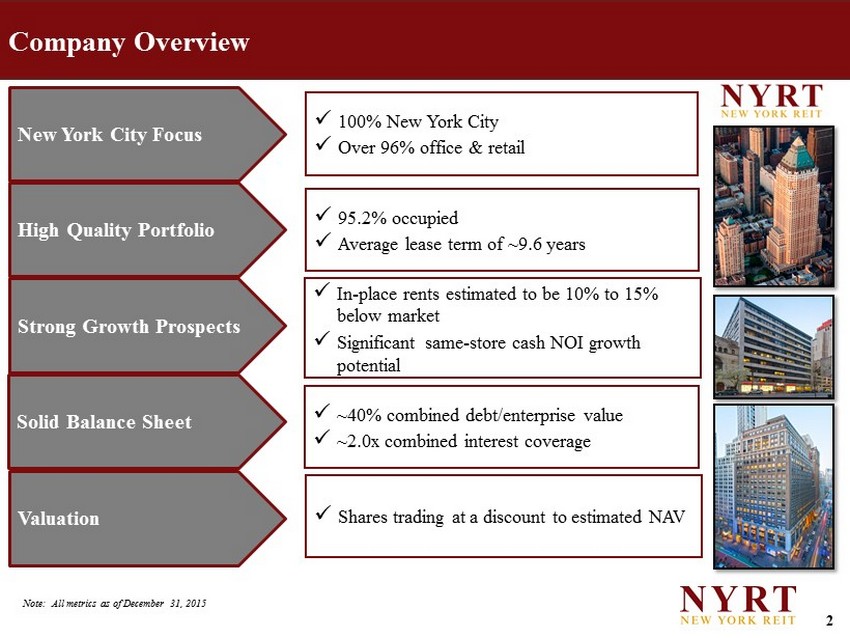
2 Company Overview x In - place rents estimated to be 10% to 15% below market x Significant same - store cash NOI growth potential x 100% New York City x Over 96% office & retail x 95.2% occupied x Average lease term of ~9.6 years x ~ 40% combined debt/enterprise value x ~2.0x combined interest coverage x Shares trading at a discount to estimated NAV New York City Focus High Quality Portfolio Solid Balance Sheet Strong Growth Prospects Valuation Note: All metrics as of December 31, 2015
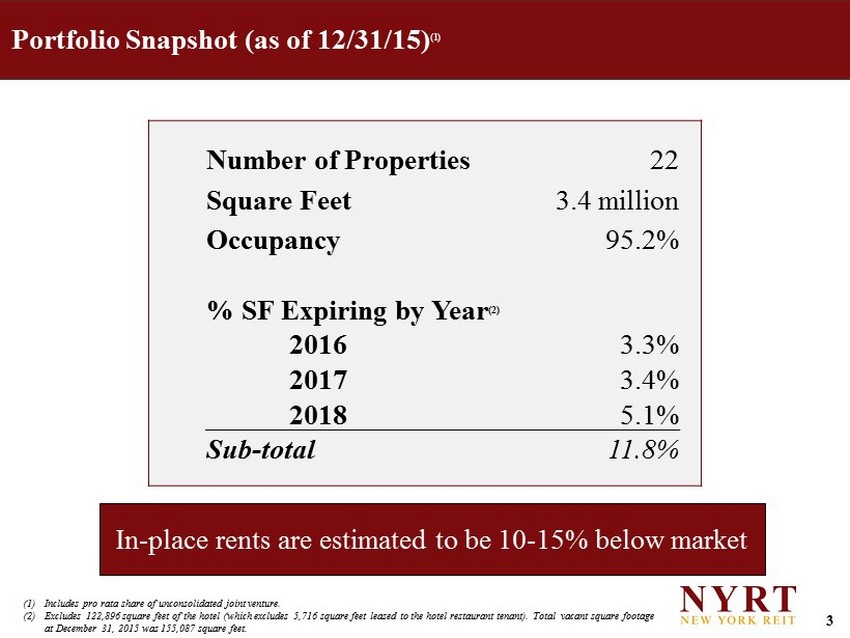
3 Portfolio Snapshot (as of 12/31/15) (1) In - place rents are estimated to be 10 - 15% below market Number of Properties 22 Square Feet 3.4 million Occupancy 95.2% % SF Expiring by Year (2) 2016 3.3% 2017 3.4% 2018 5.1% Sub - total 11.8% (1) Includes pro rata share of unconsolidated joint venture. (2) Excludes 122,896 square feet of the hotel (which excludes 5,716 square feet leased to the hotel restaurant tenant). Total va can t square footage at December 31, 2015 was 155,087 square feet.
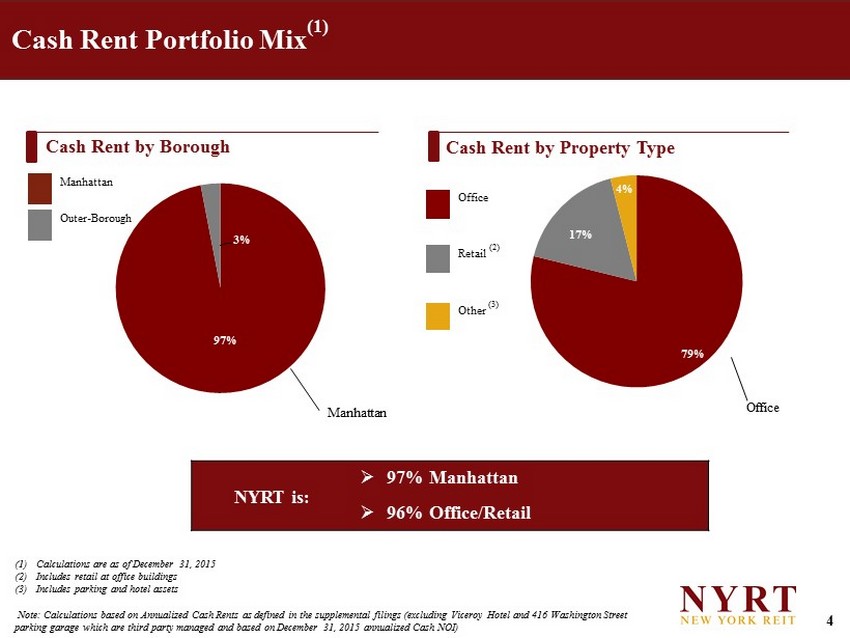
4 79% 17% 4% 97% 3% Cash Rent Portfolio Mix (1) (1) Calculations are as of December 31, 2015 (2) Includes retail at office buildings (3) Includes parking and hotel assets Note: Calculations based on Annualized Cash Rents as defined in the supplemental filings (excluding Viceroy Hotel and 416 Washington Street parking garage which are third party managed and based on December 31, 2015 annualized Cash NOI) Cash Rent by Property Type Manhattan Cash Rent by Borough NYRT is: » 97% Manhattan » 96% Office/Retail Office Retail (2) Other (3) Manhattan Office Outer - Borough

5 Five Properties Account for 70% Portfolio Cash NOI Note: All metrics are as of 12/31/2015 (1) Square footage represents 48.9 % of building total which is NYRT’s pro rata share of its joint venture investment in Worldwide Plaza (2) Weighted by Annualized Cash Rental Income Top 5 properties account for more than 70 % of portfolio Cash NOI Property Square Footage Occupancy (as of 12/31/15) Average Remaining Lease Term (2) Borough Worldwide Plaza (1) 1,001,827 100.0% 11.7 Manhattan 1440 Broadway 749,419 85.3% 6.6 Manhattan Twitter Building 281,294 100.0% 11.5 Manhattan 333 West 34th Street 346,728 100.0% 8.4 Manhattan Red Bull Building 165,670 100.0% 7.5 Manhattan Total 5 Major Assets 2,554,938 95.7% 9.7
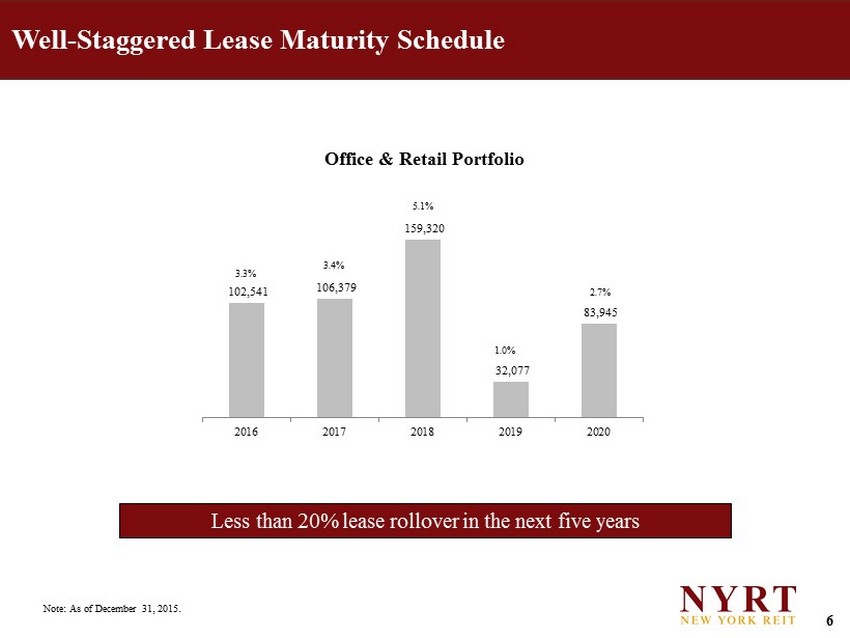
6 102,541 106,379 159,320 32,077 83,945 2016 2017 2018 2019 2020 (1) As of June 30, 2015. Excludes Hotel and Multifamily properties. Note: As of December 31, 2015. 171,000 SF is attributed to Rent Path, Inc. (formerly Primedia) at 1440 Broadway Well - Staggered Lease Maturity Schedule Office & Retail Portfolio Less than 20% lease rollover in the next five years 3.3% 3.4% 5.1% 1.0% 2.7%

7 $192 $56 $309 $314 $11 $420 $0 $200 $400 $600 $800 $1,000 2016 2017 2018 2019 2020 Thereafter Strong Balance Sheet (1) Includes $180 million on the revolving credit facility for which two 1 - year extension options are available (2) Based on December 31, 2015 closing price of $11.50 per share and December 31, 2015 debt balances and share count. (3) Availability is based on a pool of eligible unencumbered real estate assets and was $63.0 million as of December 31, 2015. Total maximum undrawn commitments as of December 31, 2015, was $220.0 million. All but two of our properties not otherwise subject to mortgage loans collateralize the borrowing base of ou r C redit Facility and have mortgages recorded for that purpose. (dollars in thousands ) As of 12/31/15 Interest Rate Consolidated Mortgage Debt $388,436 3.8% Credit Facility - Fixed 80,000 3.6% Credit Facility - Floating 405,000 2.1% Consolidated Debt $ 873,436 3.0% Company’s Share of Unconsolidated Mortgage Debt 427,875 4.6% Combined Debt $ 1,301,311 3.5% Credit Facility: Capacity $705,000 Credit Facility: Drawn 485,000 Credit Facility: Undrawn Commitments (3) 220,000 Credit Facility: Availability (3) 63,008 Combined Debt Maturity Schedule (millions) • Staggered debt maturities • 4.1 years weighted average debt term • ~40% Combined Debt/Enterprise Value (2) • ~2.0x Combined Interest Coverage (1)
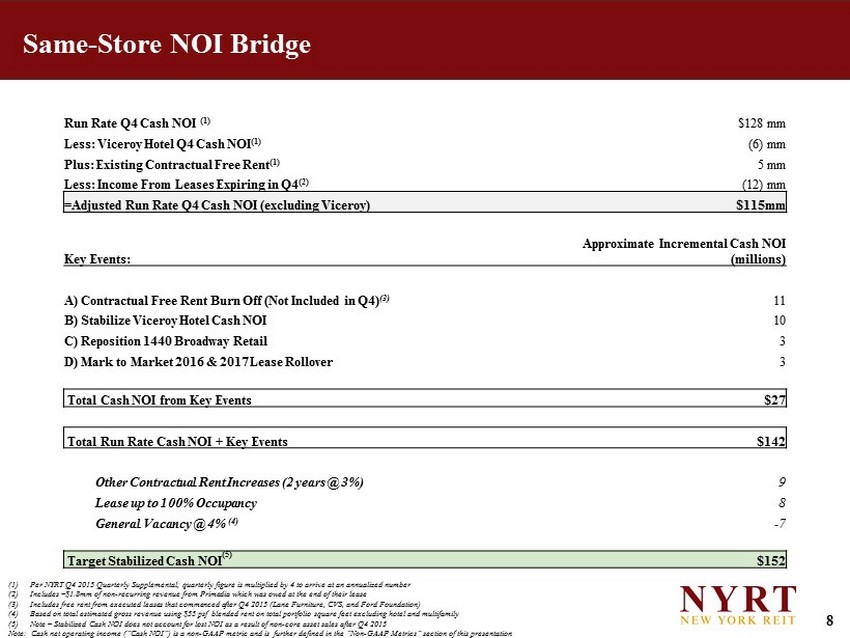
8 (1) Per NYRT Q4 2015 Quarterly Supplemental; quarterly figure is multiplied by 4 to arrive at an annualized number (2) Includes ~$1.8mm of non - recurring revenue from Primedia which was owed at the end of their lease (3) Includes free rent from executed leases that commenced after Q4 2015 (Lane Furniture, CVS, and Ford Foundation) (4) Based on total estimated gross revenue using $55 psf blended rent on total portfolio square feet excluding hotel and multifa mil y (5) Note – Stabilized Cash NOI does not account for lost NOI as a result of non - core asset sales after Q4 2015 Note: Cash net operating income (“Cash NOI”) is a non - GAAP metric and is further defined in the “Non - GAAP Metrics” section of this presentation Same - Store NOI Bridge Run Rate Q4 Cash NOI ( 1 ) $ 128 mm Less: Viceroy Hotel Q4 Cash NOI (1) (6) mm Plus: Existing Contractual Free Rent (1) 5 mm Less: Income From Leases Expiring in Q4 (2) (12) mm =Adjusted Run Rate Q4 Cash NOI (excluding Viceroy) $115mm Key Events: Approximate Incremental Cash NOI (millions) A) Contractual Free Rent Burn Off (Not Included in Q4) (3) 11 B) Stabilize Viceroy Hotel Cash NOI 10 C) Reposition 1440 Broadway Retail 3 D) Mark to Market 2016 & 2017 Lease Rollover 3 Total Cash NOI from Key Events $27 Total Run Rate Cash NOI + Key Events $ 142 Other Contractual Rent Increases (2 years @ 3%) 9 Lease up to 100% Occupancy 8 General Vacancy @ 4% (4) - 7 Target Stabilized Cash NOI (5) $ 152
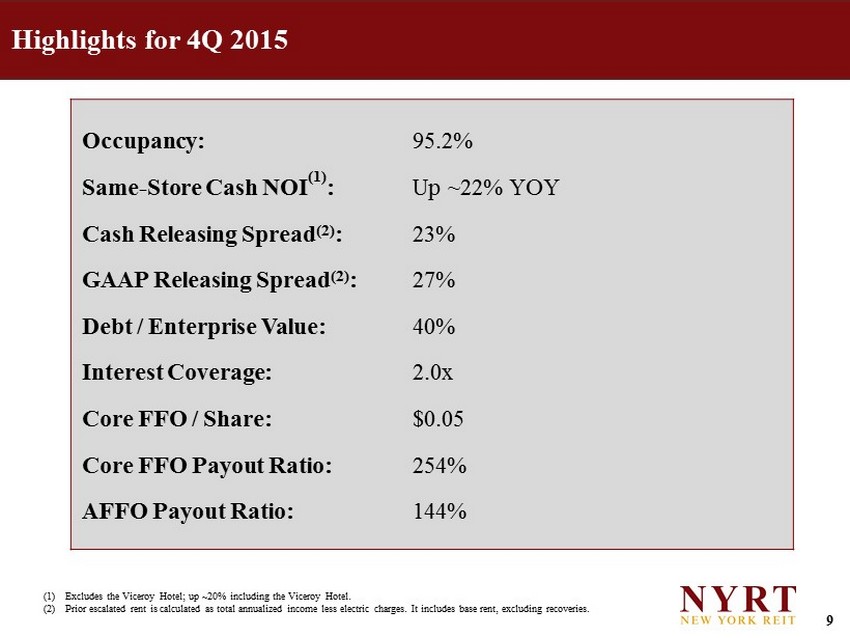
9 Highlights for 4Q 2015 Occupancy: 95.2% Same - Store Cash NOI (1) : Up ~22% YOY Cash Releasing Spread (2) : 23% GAAP Releasing Spread (2) : 27% Debt / Enterprise Value: 40% Interest Coverage: 2.0x Core FFO / Share: $0.05 Core FFO Payout Ratio: 254% AFFO Payout Ratio: 144% (1) Excludes the Viceroy Hotel; up ~20% including the Viceroy Hotel. (2) Prior escalated rent is calculated as total annualized income less electric charges. It includes base rent, excluding recover ies .

10 External Growth Opportunity (1) Includes modest adjustment for future leasing costs estimated as of 12/31/2015 (2) Option is exercisable December 31, 2016; no discount is rate applied Note: There can be no assurance that the actual value is within Management’s assumed range. Worldwide Plaza Option Sensitivity Analysis Year NOI (100%) Option Price (100%) 1,388,356 2014A 66,816 Option Price PSF $678 2015E 70,846 Option Date 12/31/2016 2016E 79,072 Total RSF (100%) 2,048,726 2017E 82,032 Management's Assumed Asset Value Range PSF $900 $1,000 $1,100 - Fixed Price Option PSF (1) (2) 678 678 678 = Gain PSF $222 $322 $422 Asset Value (51.1%) $942,209 $1,046,899 $1,151,589 - Option Price (51.1%) (2) 709,450 709,450 709,450 = Gain (51.1%) $232,759 $337,449 $442,139 Shares 167.9 167.9 167.9 Gain/Share $1.39 $2.01 $2.63

11 » The Company hopes to sell non - core assets and redeploy capital » In Q4 2015 the Company sold a property at 163 Washington for $37.7mm (1) • 49 unit multifamily asset in the Clinton Hill neighborhood of Brooklyn • Sale price represents ~3.9% cash cap rate (2) » Remaining outer - borough stabilized assets for potential sale: • Brooklyn Retail ‒ 1100 Kings Highway – 61,318 sf ‒ 1623 Kings Highway – 19,960 sf ‒ 2061 - 2063 86th Street – 6,118 sf • Queens Retail ‒ 163 - 30 Cross Bay Boulevard – 9,767 sf Non - Core Asset Sales (1) Based on 100% sale price; NYRT ownership was 97.3% which represents $36.6mm of gross proceeds to NYRT (2) Based on trailing 12 month Cash NOI at the time of sale
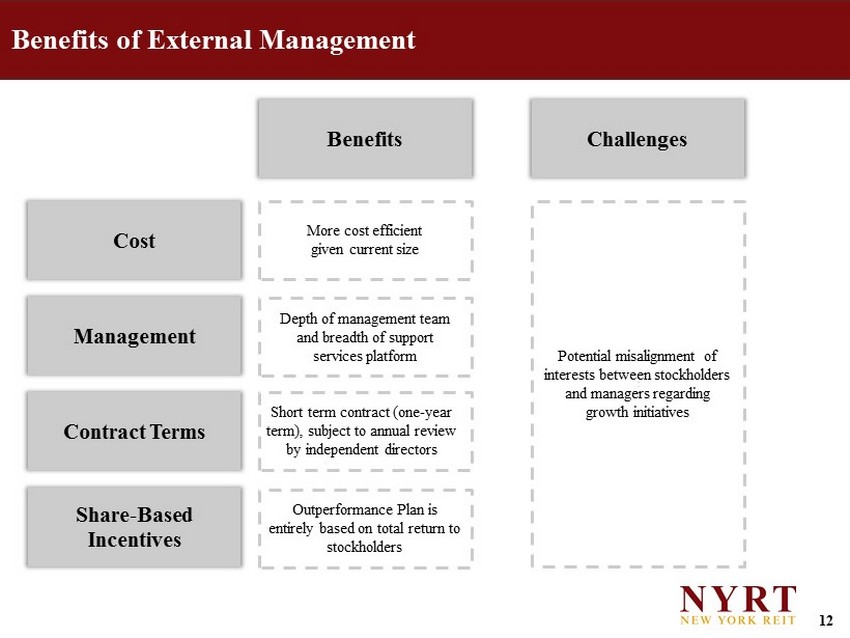
12 Benefits of External Management Cost Management Contract Terms Share - Based Incentives Potential misalignment of interests between stockholders and managers regarding growth initiatives Benefits Challenges More cost efficient given current size Depth of management team and breadth of support services platform Short term contract (one - year term), subject to annual review by independent directors Outperformance Plan is entirely based on total return to stockholders

13 Non - GAAP Metrics This presentation uses certain non - GAAP metrics, including Funds from Operations (“FFO”), Adjusted Funds from Operations (“AFFO” ), Core Funds From Operations (“ Core FFO”), Net Operating Income (“NOI”), Cash Net Operating Income (“Cash NOI”) and Incremental Net Operating Income (“Incremental NOI”). We believe that, since real estate values historically rise and fall with market conditions, including inflation, int ere st rates, the business cycle, unemployment and consumer spending, presentations of operating results for a REIT using histori cal accounting may be something less informative than such non - GAAP financial metrics. However, these non - GAAP metrics should be read in conjunction with our reported GAAP financial statement s. Note that our computation of these non - GAAP performance metrics may not be comparable to similarly - named performance metrics rep orted by other REITs or real estate companies, limiting their usefulness as a comparative measure. We compensate for these li mit ations by relying primarily on our GAAP results and using the non - GAAP measures only for supplemental purposes. Please see our consolidated financial statements and the related notes thereto. We use these non - GAAP metrics as an important part of our report and planning processes to, among other things,: • Monitor and evaluate the performance of our business operations; • Facilitate management’s internal comparisons of the historical operating performance of our business operations; • Facilitate management’s external comparisons of the results of our overall business to the historical operating performance ot her companies that may have different capital structures and debt levels; • Analyze and evaluate financial and strategic planning decisions regarding future operating investments; • Provide useful information to investors regarding financial and business trends related to our results of operations; and • Plan for and prepare future annual operating budgets and determine appropriate levels of operating investments. These non - GAAP measures have limitations as analytical tools, and you should not consider any of these measures in isolation or as a substitute for analyses of our income or cash flows as reported under GAAP. Some these limitations are: • They do not reflect our cash expenditures, or future requirements for capital expenditures, or contractual commitments; • They do not reflect changes in, or cash requirements for, our working capital needs; • They do not reflect the interest expense, or the cash requirements necessary to service interest or principal payments, on our debt; and depreciation, amortization and non - cash expense items that are reflected in our statements of cash flows . Funds from operations (FFO) Pursuant to the revised definition of funds from operations adopted by the Board of Governors of the National Association of Rea l Estate Investment Trusts (“NAREIT”), we calculate funds from operations (FFO), by adjusting net income (loss) (computed in accordance with GAAP, including non - recurring items) for gains (or losses) from sales of properties, impairment losses on depreciable real estate of consolidated real estate, impairment losses on investments in unconsolidated joint ventures dri ven by a measurable decrease in the fair value of depreciable real estate held by the unconsolidated joint ventures, real estate related depreciation and amortization, and after adjustment for unconsolidated partnerships and joint ventures. FFO is a non - GAAP financial measure. The use of FFO, combined with the required GAAP presentations, has been fundamentally beneficial in improv ing the understanding of operating results of REITs among the investing public and making comparisons of REIT operating results more meaningful. Management generally considers FFO to be a useful measure for reviewing our comparative operating and financial performance because, by excluding gains and losses related to asset sales (land and property), impairment losses and real estate asset depreciation and amortization (which can vary among owners of identical assets in similar condition based on historical cost accounting and useful life estimates) , F FO can help one compare the operating performance of a company’s real estate between periods or as compared to different companies. Our computation of FFO may not be comparable to FFO reported by other REITs or real estate companies tha t do not define the term in accordance with the current NAREIT definition or that interpret the current NAREIT definition differently. FF O should not be considered as an alternative to net income (determined in accordance with GAAP) as an indication of our performance. FFO does not represent cash generated from operating activities de termined in accordance with GAAP, and is not a measure of liquidity or an indicator of our ability to make cash dividends. We believe that to further understand our performance, FFO should be compared with our reported net income and considered in addition to cash flows determined in accordance with GAAP, as presented in our consolidated financial statements. Adjusted funds from operations (AFFO) AFFO is Core FFO, excluding certain income or expense items that we consider more reflective of investing activities, other n on - cash income and expense items and the income and expense effects of other activities that are not a fundamental attribute of our business plan. These items include unrealized gains a nd losses, which may not ultimately be realized, such as gains or losses on derivative instruments, gains or losses on contingent valuation rights and gains and losses on investments. In addi tio n, by excluding non - cash income and expense items such as amortization of above and below market leases, equity - based compensation expenses, amortization of deferred financing costs and straight - line rent from AFFO we believe we provide useful information regarding income and expense items which have no cash impact and do not provide liquidity to the Company or require capital r eso urces of the Company. We exclude certain interest expenses related to securities that are convertible to common stock as the shares are assumed to have converted to common sto ck in our calculation of weighted average common shares - fully diluted, if applicable. Furthermore we include certain cash inflows and outflows that are reflective of operating activities including preferred returns on joint ventures, second generation tenant improvements and leasing commissions (included in the period in which the lease commences) and recurring capital expen dit ures. We also include items such as free rent credits paid by sellers because these funds are paid to us during the free rent period and therefore improve our liquidity and ability to pay dividends. Although our AFFO may not be comparable to that of other REITs and real estate companies, we believe it provides a meaningful in dicator of our ability to fund cash needs and to make cash dividends to stockholders. In addition, we believe that to further understand our liquidity, AFFO should be compared with our cash flows determined in accordance with GAAP, as presented in our consolidated financial statements. AFFO does not represent cash generated from operating activities determined in acco rda nce with GAAP, and AFFO should not be considered as an alternative to net income (determined in accordance with GAAP) as an indication of our performance, as an alternative to net cash flows from operating activities ( determined in accordance with GAAP), or as a measure of our liquidity . Core funds from operations (Core FFO) Core FFO is FFO, excluding acquisition and transaction related costs and certain other costs that management deems to be non - cor e to our business. The purchase of properties, and the corresponding expenses associated with that process, is a key operational feature of our business plan to generate operational income and cash flows in order to make dividends to investors. In evaluating investments in real estate, management differentiates the costs to acquire the investment from the operations derived from th e i nvestment. By excluding expensed acquisition costs, management believes Core FFO provides useful supplemental information that is comparable for each type of real estate investment and is consistent with management’s analy sis of the investing and operating performance of our properties. Net operating income (NOI) Net operating income (NOI) is a non - GAAP financial measure equal to net income, the most directly comparable GAAP financial meas ure, less discontinued operations, plus corporate general and administrative expense, acquisition and transaction costs, depreciation and amortization and interest expense, income from unconsolidated joint ventures, interest, other non - cash items and other income and gains from investments in securities. NOI is adjusted to include our pro rata share of NOI from unconsol ida ted joint ventures. We use NOI internally as a performance measure and believe NOI provides useful information to investors regarding our financial condition and results of operations because it reflects only those income and expense items that are incurred at the property level. Therefore, we believe NOI is a useful measure for evaluating the operating performan ce of our real estate assets and to make decisions about resource allocations . Further, we believe NOI is useful to investors as a performance measure because, when compared across periods, NOI reflects th e impact on operations from trends in occupancy rates, rental rates, operating costs, acquisition activity on an unleveraged basis, providing perspective not immediately apparent from net income. NOI excludes certain components from net income in order to provide results that are more closely related to a property’s results of operations. For example, inte res t expense is not necessarily linked to the operating performance of a real estate asset and is often incurred at the corporate level as opposed to the property level. In addition, depreciation and amortization, because of historical cost accounting and useful life estimates, may distort operating performance at the property level. NOI presented by us may not be comparable to NOI reported by other REITs that define NOI differently. We believe that in order to facilitate a clear understanding of our operating results, NOI should be examined in conjunction with net in com e, as presented in our consolidated financial statements. NOI should not be considered as an alternative to net income as an indication of our performance or to cash flows as a measure of our liquidity or ability to make dividends. Cash net operating income (Cash NOI) NOI, presented on a cash basis, which is NOI after eliminating the effects of straight - lining of rent and fair value lease reven ue. Annualized Adjusted Cash NOI NOI, presented on a cash basis, which is equal to NOI after eliminating the effects of straight - line rent and fair value lease r evenue, plus contractual free rent. The quarterly number is multiplied by 4 to arrive at an annualized figure. Non - GAAP Reconciliation NYRT has filed supplemental information packages with the Securities and Exchange Commission ("SEC") to provide additional disclosure and financial information for the benefit of NYRT’s various stakeholders, including reconciliations of all non - GAAP measures contained in this Investor Presentation. The supplemental package can be found under "Investors — Quarterly Supplemental“ section of NYRT’s website at www.nyrt.com and on the SEC website at www.sec.gov . 13