TASMAN METALS LTD.
MANAGEMENT'S DISCUSSION AND ANALYSIS
FOR THE THREE MONTHS ENDED NOVEMBER 30, 2014
This discussion and analysis of financial position and results of operation is prepared as at January 12, 2015 and should be read in conjunction with the unaudited condensed consolidated interim financial statements for the three months ended November 30, 2014 of Tasman Metals Ltd. ("Tasman" or "the Company"). The following disclosure and associated financial statements are presented in accordance with International Financial Reporting Standards ("IFRS"). Except as otherwise disclosed, all dollar figures included therein and in the following management discussion and analysis ("MD&A") are quoted in Canadian dollars.
Forward Looking Statements
Certain information included in this discussion may constitute forward-looking statements. Forward-looking statements in this MD&A include, but are not limited to, statements with respect to: (i) the registration of the concessions comprising the various rare earth elements ("REE") projects; (ii) the market and future price of commodities; (iii) the timing, cost and success of future exploration activities, including, but not limited to, the Company's proposed work programs; (iv) currency fluctuations; (v) requirements for additional capital; and (vi) changes in mineral resource estimates. Forward-looking statements are based on current expectations and entail various risks and uncertainties. These risks and uncertainties could cause or contribute to actual results that are materially different than those expressed or implied. The Company disclaims any obligation or intention to update or revise any forward-looking statement, whether as a result of new information, future events, or otherwise.
Historical results of operations and trends that may be inferred from this MD&A may not necessarily indicate future results from operations. In particular, the current state of the global securities markets may cause significant reductions in the price of the Company's securities and render it difficult or impossible for the Company to raise the funds necessary to continue operations.
All of the Company's public disclosure filings, including its most recent management information circular, Form 20-F (in lieu of an Annual Information Form), material change reports, press releases and other information, may be accessed via www.sedar.com or the Company's website at www.tasmanmetals.com and readers are urged to review these materials, including the technical reports filed with respect to the Company's mineral properties.
Company Overview
The Company was incorporated under the laws of the Province of British Columbia on August 27, 2007. On October 22, 2009 the Company completed a statutory amalgamation with Lumex Capital Corp. and Ausex Capital Corp. and the surviving corporation continued under the name of Tasman Metals Ltd. On November 3, 2009 the Company commenced trading on the TSX Venture Exchange ("TSXV") under the symbol "TSM". On December 2, 2011 the Company commenced trading on the NYSE MKT (formerly the NYSE AMEX) under the symbol "TAS".
The Company is a junior resource company engaged in the acquisition and exploration of unproven REE properties and also holds interests in tungsten and iron ore properties in Scandinavia and is considered an exploration stage company. As at November 30, 2014 the Company has not earned any production revenue, nor found proved reserves on any of its mineral interests.
The Company's main focus continues to be the exploration and assessment of the Company's Norra Kärr property. In July 2013 the Company filed a revised preliminary economic assessment ("PEA") of Norra Kärr. See also "Exploration Projects - REE Projects, Sweden, Norra Kärr" in this MD&A.
In January 2015, the Company announced that it has been accepted as an observing member of the Critical Materials Institute ("CMI"). CMI is an initiative of the U.S. Department of Energy ("DOE") and is recognized as a leader in research to optimize the extraction and use of critical raw materials including REE's. The CMI team is coordinated and led by The Ames Laboratory in Iowa, with contribution from national laboratories, universities and various
- 1 -
industry partners. CMI's focus is to develop technologies and strategies that reduce the criticality of REE's and other elements which may hinder the current and future development and commercialization of clean energy technologies. The CMI aims to reduce the risks in Western REE supply chains, including the encouragement of diversification of supply sources.
Exploration Projects
As of the date of this MD&A the Company is the 100% owner of 10 exploration claims and one mining lease for rare earth elements in Sweden, and the owner of a 25% interest in four iron ore exploration claims in the Kiruna district of Sweden. Furthermore, Tasman holds a 100% interest in seven exploration claims for tungsten and one claim application in the Bergslagen district of Sweden, and 120 claims or claim applications for chromite in Finland
REE Projects
Sweden
In Sweden Tasman holds 10 exploration claims and one mining lease, considered prospective for REEs. Sweden is the home of REEs, many of which were first discovered in a quarry in the village of Ytterby, near Stockholm. REE consumption is growing, being essential in the production of hybrid/electric cars, solar panels, wind turbines, compact florescent lighting, high-energy magnets, mobile phones and computers. Tasman is well placed as the European Union is actively supporting policies to promote the domestic supply of REEs to secure high-tech industry.
Norra Kärr
Norra Kärr is located in southern Sweden, 300km SW of Stockholm and lies in farming and forestry land, well serviced by power, road, water and a local skilled community.
Norra Kärr is a zirconium and rare earth element enriched peralkaline (agpaitic) nepheline syenite intrusion which covers 350m x 1200m in area. The deepest extents of the mineralized intrusion have not been delineated, but exceed 320m. The rock units comprising the Norra Kärr intrusion are uncommon on a global scale, and include mineral phases that are comprised of or associated with REEs, Zr, Nb, Y and Hf. The most abundant intrusion present is Grännaite, a medium grained syenite consisting of alkali feldspar, nepheline, aegirine, natrolite, eudialyte and catapleite. Lesser units include Lakarpite (arfvedsonite-albite nepheline syenite), Pulaskite (microcline-arfvedsonite-
albite nepheline syenite) and Kaxtorpite (eckermannite-microcline-aegirine-pectolite- nepheline syenite). Intervals of irregular coarse grained pegmatite schlieren with equivalent mineralogy to the Grännaite are also commonly developed.
The first phase drill program by Tasman at Norra Kärr commenced in mid-December 2009 and comprised 26 holes. This first successful program was followed by two further phases for a total of 49 drill holes. A fourth phase of drilling was commenced in early 2012, which infilled drilling to 50m sections, and a total of 121 exploration holes have now been completed. A small number of holes for geotechnical purposes were completed during the current period.
In March 2012 Tasman announced the positive technical and financial results achieved from the Preliminary Economic Assessment (the "PEA") of Norra Kärr. Following a review by the British Columbia Securities Commission ("BCSC") a revised PEA (the "Norra Kärr PEA Report") was completed and submitted in July 2013. The conclusions reached in the Norra Kärr PEA Report have not varied from those disclosed in the previously filed PEA. The Norra Kärr PEA Report was completed by independent mining consultants Pincock, Allen & Holt ("PAH") of Denver, Colorado (subsequently renamed RungePincockMinarco). Metallurgical process design was completed by Mr. John Litz of JE Litz and Associates, Colorado, on the basis of data provided from process testing of Norra Kärr mineralization completed by SGS Canada Inc. ("SGS") in Lakefield, Canada, and the Geological Survey of Finland ("GTK") in Outokumpu, Finland.
Readers are encouraged to review the Norra Kärr PEA Report in its entirety, available on the SEDAR website at www.sedar.com or the Company's website at www.tasmanmetals.com. Tasman cautions that the Norra Kärr PEA Report is preliminary in nature and there is no certainty that the PEA will be realized.
- 2 -
The Norra Kärr project is proximal to road, rail, power and operating ports, plus skilled personnel, minimizing the need for offsite infrastructure to be built by the Company. Development of the project will occur as an open pit mine, with crushing, grinding, beneficiation and mineral dissolution occurring in the immediate vicinity of the pit.
In March 2013 Tasman announced that the Company engaged a consultant to support the next stage of Tasman's hydrometallurgical testing program on Norra Kärr. Tasman has completed comminution (crushing and grinding) studies to characterize Norra Kärr mineralized material. Work undertaken for Tasman showed milling conditions lay within a normal processing range. These comminution results will enable the design of the crushing and grinding circuits.
In May 2013 the Swedish Mining Inspectorate (Bergsstaten) granted a Mining Lease (the "ML") to Tasman covering Norra Kärr, valid for 25 years when it is available for renewal. The application documents for the ML were prepared by an independent consulting group and documented the extensive environmental, archeological and social impact data that was collected by consultants.
In April 2014 Tasman announced the commencement of a Pre-Feasibility Study (the "PFS") for the Norra Kärr deposit. Completion of this PFS has been the focus of the Company for much of the current reporting period.
Following an extensive review process, Tasman management has selected a highly qualified technical team with REE and European experience. The PFS is led and coordinated by GBM Minerals Engineering Consultants ("GBM") based in Twickenham, UK. GBM is a specialist metallurgy and engineering consulting group, who provide service from testing and design through to EPCM. Other members of the PFS team include Wardell Armstrong International ("WAI") for geology, mineral resources, mining and tailings management, Golders Associates AB for social impact, environment, permitting and water management, and Denco Strategic Research & Consulting Inc. for markets and pricing.
In July 2014 Tasman provided an update on metallurgical testing. Crushing and grinding characteristics of the Norra Kärr mineralized material are now well known. A grind size of 60 micron has been chosen which provides adequate liberation of the REE-bearing mineral (eudialyte) that can easily be achieved through standard commercial equipment.
Extensive testwork and optimization of single-stage magnetic separation has been completed. This optimization has increased REE recovery in beneficiation to in excess of 86% in less than 35% of the original mass, such that flotation is no longer deemed necessary as was envisaged under the Norra Kärr PEA Report published July 2013. Magnetic separation shall use standard commercial equipment and does not require process chemicals.
This improved magnetic separation has significantly reduced the amount of sulphuric acid-consuming gangue minerals within the eudialyte-rich mineral concentrate. As a result, sulphuric acid consumption per tonne of mineralized material has fallen to 85 kg/tonne from the 150 kg/tonne envisaged in the Norra Kärr PEA Report.
Extensive hydrometallurgical research has been completed which has tested/optimized a process of sulphuric acid leaching, leach solution purification, REE solvent extraction and precipitation of an REE-concentrate. Preparation of this concentrate is the final step in defining the Norra Kärr flowsheet.
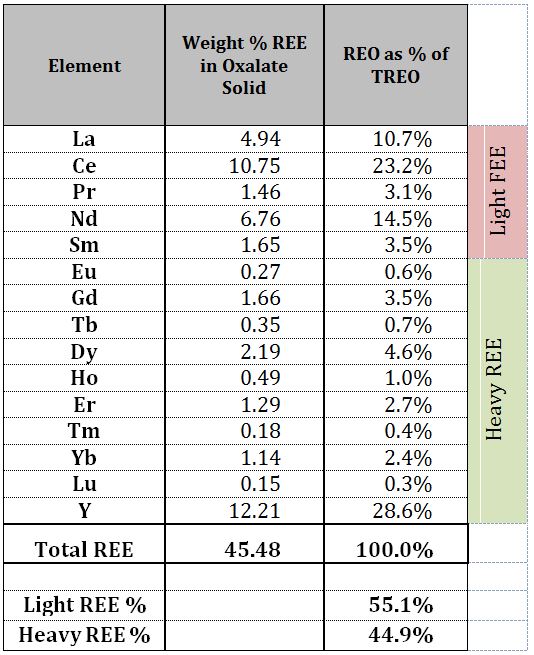
Sulphuric acid was chosen due to its relatively low cost, and its widespread availability in Sweden. A railway line which passes only 20km from Norra Kärr already transports bulk sulphuric acid. REE was precipitated as an oxalate with a grade of approximately 45% REE, as provided in Table 1. The high value heavy REE dysprosium (Dy) contributes 4.6% of the REE content. This oxalate can be easily calcined to a high grade REE-oxide (REO) subject to customer requirements. Under the hydrometallurgical process developed, leaching is undertaken at ambient temperature and pressure. High temperature roasting is not required to dissolve eudialyte.
- 3 -
Table 1: Composition of REE-oxalate precipitated from Norra Kärr project, with REO relative abundance (when converted to oxide)
In July 2014 Tasman also confirmed that despite Norra Kärr being a high-grade zirconium ("Zr") and hafnium ("Hf") deposit, under the metallurgical process being modeled for the PFS, the recovery of Zr is not being considered. Zr shall pass with Hf and niobium ("Nb") to a by-product that shall be stockpiled for potential future recovery.
In December 2014, Tasman announced the completion of a drill program to collect a representative metallurgical sample at Norra Kärr. The diamond drill program delivered approximately 8 tonnes of large diameter core that will be used for additional metallurgical test work during 2015. The cost of this drill program was borne by the EURARE project, of which Tasman is a research member. EURARE is a research project co-funded by the European Commission under the Seventh Framework Programme of the European Community for Research, Technological Development and Demonstration Activities (Grant Agreement NMP2-LA-2012-309373).
An array of shallow holes each 83.7mm in diameter and up to 12m in length was drilled across an area approximately 250m x 550m. The Norra Kärr REE deposit begins at surface with a width of 350m, a length of 800m lying typically beneath less than 1 metre of soil cover, making representative sample collection by such drilling both simple and cost effective.
The PFS is in the final stage of completion and delivery of the PFS is imminent. Once the PFS is finalized results will be announced.
Olserum
On October 13, 2011 Tasman announced the acquisition of a 100% interest in a new heavy rare earth element project in southern Sweden, located only 100km east of the Company's flagship Norra Kärr project. The Olserum project was purchased outright from a private UK registered company, Norrsken Energy Limited, for a total consideration of 37,746 common shares in Tasman.
Olserum is located approximately 10km from the Baltic coast, 30km north of the town of Västervik and 200km SSW of Stockholm. The project is secured by a granted exploration claim 1,100 Ha in size, and five surrounding exploration claim applications 5,160 Ha in size.
The REE potential of the Olserum region was first identified by the Swedish Geological Survey ("SGU") in the early 1990's, when a number of REE anomalous samples were collected and assayed from several locations. The presence
- 4 -
of yttrium ("Y") enriched outcrops associated with historic iron ore prospects was noted. In 2003 the Swedish exploration company IGE Resources AB ("IGE") claimed the area, concentrating on the iron ore workings at Olserum. During 2004 and 2005 a total of 27 diamond drill holes were drilled by IGE, 24 of which targeted the REE potential.
Drilling discovered a REE mineralized zone 600m in length and up to 100m wide. Drilling was performed on 40m spaced profiles with typically two holes on each profile.
In late 2012, Tasman completed a drill program at Olserum. Five holes, totalling 997.0m, were drilled to confirm previous drilling results and infill untested sections. All five holes intersected significant REE mineralization. Best results returned from holes OLR12001 through OLR12005 are provided in Table 2:
Table 2: Drilling Results from Tasman 2012 Program, Olserum
DRILL HOLE | FROM | TO | LENGTH (metres) | TREO (%) | HREO/TREO (%) | EASTING | NORTHING | AZIMUTH (deg) | DIP (deg) |
| OLR12001 | 59.7 | 157.9 | 98.2 | 0.60% | 36.3% | 580072 | 6423831 | 209 | - 46 |
| Including | 59.7 | 85.95 | 25.3 | 1.02% | 42.3% | ||||
| OLR12002 | 83.1 | 225.3 | 142.2 | 0.65% | 26.6% | 580127 | 6423833 | 195 | - 55 |
| Including | 132.4 | 169.5 | 37.1 | 1.00% | 22.9% | ||||
| OLR12003 | 117.0 | 250.6 | 133.6 | 0.52% | 42.1% | 580083 | 6423863 | 207 | - 61 |
| Including | 190.1 | 203.0 | 12.9 | 1.14% | 42.6% | ||||
| OLR12004 | 47.9 | 178.9 | 131.0 | 0.49% | 44.7% | 579995 | 6423857 | 205 | - 55 |
| Including | 118.7 | 135.7 | 17.0 | 1.01% | 47.3% | ||||
| OLR12005 | 52.8 | 121.6 | 68.8 | 0.39% | 24.7% | 580145 | 6423705 | 19 | - 43 |
| Including | 75.3 | 107.4 | 32.1 | 0.52% | 27.3% | ||||
TREO (total rare earth oxide) = sum of La2O3, Ce2O3, Pr2O3, Nd2O3, Sm2O3, Eu2O3, Gd2O3, Tb2O3, Dy2O3, Ho2O3, Er2O3, Tm2O3, Yb2O3, Lu2O3, Y2O3; HREO (heavy rare earth oxide) = sum of Eu2O3, Gd2O3, Tb2O3, Dy2O3, Ho2O3, Er2O3, Tm2O3, Yb2O3, Lu2O3, Y2O3; Most significant REO's by % are: Y2O3, La2O3, Ce2O3, Nd2O3, Dy2O3 EASTING, NORTHING provided in SWEREF99TM coordinate system | |||||||||
Petrological, MLA and microprobe research was undertaken to identify REE bearing minerals within 18 samples taken from Olserum drill core. Mineralogy was determined to be simple, with coarse to fine grained xenotime, monazite and rare apatite recognized as the host to all significant REE's.
Using all available drilling data, the independent resource estimate for Olserum was published in February 2013. The resource estimate was prepared by consulting geologists at ReedLeyton Consulting Pty Ltd following site visits, core sampling and geological modeling. Following a review by the BCSC, a revised resource estimate was completed and submitted in July 2013. The conclusions reached in the amended Olserum technical report have not varied from those disclosed in the previously filed report. Along with Norra Kärr, Olserum is the second of Tasman's resource-stage REE projects.
Readers are encouraged to review the entire Olserum technical report available on the SEDAR website at www.sedar.com or the Company's website at www.tasmanetals.com.
Mineral Resources were modelled applying six different TREO cut-off grades, with a base-case resource estimated using a TREO cut-off of 0.4% (Tables 3 and 4). At this cut-off, Olserum hosts an Indicated Mineral Resource of 4.5 million tonnes grading 0.60% TREO and an Inferred Mineral Resource of 3.3 million tonnes grading 0.63% TREO, both with 34% of the TREO being the higher value HREO. Table 5 and 6 provide the grade averages for rare earth oxides at the various cut-offs.
- 5 -
Table 3: Indicated Resource Estimate for the Olserum Deposit.
TREO % Cut-off | Million Tonnes | TREO % | % of HREO in TREO | Dy2O3 ppm | Y2O3 ppm | Nd2O3 ppm | Tonnes of Contained TREO | |
| 0.7 | 1.0 | 0.89 | 32.3 | 292 | 1800 | 1314 | 8,620 | |
| 0.6 | 1.7 | 0.78 | 32.9 | 262 | 1610 | 1146 | 13,360 | |
| 0.5 | 3.0 | 0.68 | 33.3 | 232 | 1420 | 996 | 20,650 | |
| 0.4 | 4.5 | 0.60 | 33.9 | 209 | 1283 | 878 | 27,260 | BASE CASE |
| 0.3 | 6.3 | 0.53 | 34.4 | 187 | 1146 | 769 | 33,530 | |
| 0.2 | 7.7 | 0.48 | 34.5 | 0.017 | 1042 | 700 | 37,030 |
Table 4: Inferred Resource Estimate for the Olserum Deposit.
TREO % Cut-off | Million Tonnes | TREO % | % of HREO in TREO | Dy2O3 ppm | Y2O3 ppm | Nd2O3 ppm | Tonnes of Contained TREO | |
| 0.7 | 0.9 | 0.85 | 31.8 | 288 | 1667 | 1294 | 7,947 | |
| 0.6 | 1.6 | 0.77 | 32.5 | 264 | 1547 | 1151 | 12,088 | |
| 0.5 | 2.5 | 0.69 | 33.6 | 242 | 1445 | 1018 | 16,960 | |
| 0.4 | 3.3 | 0.63 | 33.7 | 222 | 1320 | 925 | 20,770 | BASE CASE |
| 0.3 | 4.2 | 0.57 | 33.9 | 202 | 1205 | 841 | 23,820 | |
| 0.2 | 4.7 | 0.54 | 33.9 | 191 | 1134 | 790 | 25,050 |
Notes:
| 1. | Mineral Resources that are not Mineral Reserves do not have demonstrated economic viability. |
| 2. | TREO includes: La2O3, Ce2O3, Pr2O3, Nd2O3, Sm2O3, Eu2O3, Gd2O3, Tb2O3, Dy2O3, Ho2O3, Er2O3, Tm2O3, Yb2O3, Lu2O3, Y2O3 |
| 3. | HREO includes: Eu2O3, Gd2O3, Tb2O3, Dy2O3, Ho2O3, Er2O3, Tm2O3, Yb2O3, Lu2O3, Y2O3 |
| 4. | The calculated resource is sensitive to cut-off grade which will be influenced by metallurgical operating costs. Bench scale metallurgical tests were completed on an Olserum composite sample in 2005. Magnetic and gravity separation gave a mineral concentrate of 14% rare earth oxide in only 5% of the mass with a recovery of 59%. |
| 5. | The mineral resource estimate was completed by Mr Geoffrey Reed, Senior Consulting Geologist of ReedLeyton Consultants Pty Ltd, and is based on geological and geochemical data supplied by Tasman, as audited by Mr Reed. Mr Reed is an independent qualified person for the purposes of NI 43-101 standards of disclosure for mineral projects of the Canadian Securities Administrators. |
| 6. | The resource estimate has been classified as an Indicated and Inferred Resource based on the distance-space between sample data within the current deposit outline. Variograms were obtained from a variography study of TREO, with the continuity analysis showing a reasonable fit model in the major and semi major direction for the mineralised domains. |
| 7. | The resource estimate is based on: |
| § | A database of 31 "In Resource" drill holes totalling 5,297m of diamond drilling completed by Tasman and previous project owner IGE since 2004 where samples were composited on 1m lengths. All assays by both Tasman and IGE were completed at laboratories in Vancouver, British Columbia. |
| § | Specific gravity (SG) has an overall mean of 2.80 g/cc from 458 SG readings. The mean of the mineralisation of 2.82 g/cc was used in the estimate and a mean of the host rock of 2.67 g/cc was used in the estimate |
| § | Block model was estimated by ordinary kriging interpolation method on blocks 5m (x) x 20m (y) x 10m (z). |
| § | Metallurgical test work at Olserum is in progress and no information was available at the time of this resource calculation. |
In order to demonstrate that the mineralization as estimated in the block model has a reasonable expectation of being mined at some time in the foreseeable future, ReedLeyton completed a mining optimisation exercise. As the mining concept for the Olserum Deposit is currently surface mining, Whittle® software was used to generate a conceptual pit shell. Notwithstanding the pit optimisation exercise, it has not resulted in an engineered and operational open-pit mine design. Operating assumptions used for the Whittle® pit shell were based from the Norra Kärr PEA Report. Norra Kärr lies 100km northwest of Olserum with similar grade and surface aspect. The economic assumptions used to derive the optimised pit shell include:
| · | Stripping Cost $/tonne mined US $3.66 |
| · | Mining Cost $/tonne mined US $3.66 |
| · | Processing Cost $/tonne mineralized material US $41.48 |
- 6 -
| · | REO Recovery 80.0% |
| · | Discount to TREO Basket Price 38.0% (accounts for REO separation charge) |
| · | Discounted TREO Price US $31.0 kg |
| · | 5 percent mining loss, 5 percent for mining dilution |
Overall, ReedLeyton considered these assumptions are fair for the purpose of determining reasonable prospects for economic extraction of the Olserum deposit but do not demonstrate that the mineralization is economic, since the exercise is not at the level of a preliminary economic assessment and does not conform to the studies required for a preliminary economic assessment.
The drill-defined Mineral Resource at Olserum begins at surface and is open at depth and to the east. The resources comprise parallel bodies of mineralization, with lower grade intervening material, trending approximately east-west and dipping steeply to the north. Host rock to mineralization is a biotite and amphibole bearing foliated quartzite, with veins and patches of magnetite. It is interpreted that mineralization may represent heavy mineral sediments which have been subsequently metamorphosed and folded. Tables 5 and 6 provide the grade averages for rare earth oxides at the various cut offs.
Table 5: Indicated Resource Estimate Rare Earth Oxide Grade Averages for the Olserum Deposit.
TREO % Cut-off | La2O3 | Ce203 | Pr203 | Nd203 | Sm203 | Eu203 | Gd203 | Tb203 | Dy203 | Ho203 | Er203 | Tm203 | Yb203 | Lu203 | Y203 |
| 0.7 | 0.125 | 0.281 | 0.034 | 0.131 | 0.029 | 0.001 | 0.029 | 0.005 | 0.029 | 0.006 | 0.017 | 0.002 | 0.015 | 0.002 | 0.180 |
| 0.6 | 0.109 | 0.244 | 0.030 | 0.115 | 0.026 | 0.001 | 0.026 | 0.004 | 0.026 | 0.005 | 0.015 | 0.002 | 0.014 | 0.002 | 0.161 |
| 0.5 | 0.094 | 0.212 | 0.026 | 0.100 | 0.023 | 0.001 | 0.023 | 0.004 | 0.023 | 0.005 | 0.014 | 0.002 | 0.012 | 0.002 | 0.142 |
| 0.4 | 0.083 | 0.186 | 0.023 | 0.088 | 0.020 | 0.001 | 0.021 | 0.004 | 0.021 | 0.004 | 0.012 | 0.002 | 0.011 | 0.002 | 0.128 |
| 0.3 | 0.072 | 0.163 | 0.020 | 0.077 | 0.018 | 0.000 | 0.018 | 0.003 | 0.019 | 0.004 | 0.011 | 0.002 | 0.010 | 0.001 | 0.115 |
| 0.2 | 0.065 | 0.147 | 0.018 | 0.070 | 0.016 | 0.000 | 0.017 | 0.003 | 0.017 | 0.004 | 0.010 | 0.001 | 0.009 | 0.001 | 0.104 |
Table 6: Inferred Resource Estimate Rare Earth Oxide Grade Averages for the Olserum Deposit.
TREO % Cut-off | La2O3 | Ce203 | Pr203 | Nd203 | Sm203 | Eu203 | Gd203 | Tb203 | Dy203 | Ho203 | Er203 | Tm203 | Yb203 | Lu203 | Y203 |
| 0.7 | 0.118 | 0.270 | 0.033 | 0.129 | 0.030 | 0.001 | 0.029 | 0.005 | 0.029 | 0.006 | 0.016 | 0.002 | 0.014 | 0.002 | 0.167 |
| 0.6 | 0.105 | 0.241 | 0.030 | 0.115 | 0.027 | 0.001 | 0.026 | 0.005 | 0.026 | 0.005 | 0.015 | 0.002 | 0.013 | 0.002 | 0.155 |
| 0.5 | 0.093 | 0.213 | 0.026 | 0.102 | 0.024 | 0.001 | 0.024 | 0.004 | 0.024 | 0.005 | 0.014 | 0.002 | 0.012 | 0.002 | 0.145 |
| 0.4 | 0.084 | 0.194 | 0.024 | 0.093 | 0.022 | 0.001 | 0.022 | 0.004 | 0.022 | 0.005 | 0.013 | 0.002 | 0.011 | 0.002 | 0.132 |
| 0.3 | 0.077 | 0.176 | 0.022 | 0.084 | 0.020 | 0.000 | 0.020 | 0.003 | 0.020 | 0.004 | 0.012 | 0.002 | 0.010 | 0.001 | 0.121 |
| 0.2 | 0.072 | 0.166 | 0.020 | 0.079 | 0.018 | 0.000 | 0.019 | 0.003 | 0.019 | 0.004 | 0.011 | 0.002 | 0.010 | 0.001 | 0.113 |
In August 2013, the Company announced results of the first phase of metallurgical testing on representative mineralization samples from Olserum. Magnetic separation and flotation tests produced a mineral concentrate with REE recovery in excess of 90% within a concentrate mass between 6% and 7% of the original sample. This represents a very encouraging increase in REE grade of approximately 14 times. A very high grade magnetite concentrate was also produced as a by-product during testing. This metallurgical research, and the ongoing testing, was conducted and paid for under the European Commission's EURARE research project as was press released by Tasman on July 10, 2013.
As anticipated, the low intensity magnetic separator ("LIMS") was extremely efficient in the separation of magnetite from other minerals present. In test 8 the magnetic concentrate comprised 2.93% of the rock mass and showed a grade of Fe 65.5%, being very close to the iron content of pure magnetite. The best REE recovery results were obtained where highest REE recovery was achieved in the lowest concentrate mass (mass pull) as described below:
- 7 -
Table 7: REE recovery for various tests from Olserum
| Test | Concentrate Mass (Mass Pull) | Ce Recovery (%) | La Recovery (%) | Y Recovery (%) | ||
| 3A | 6.80% | 88.4 % | 88.8 % | 92.7 % | ||
| 3B | 8.42% | 89.6 % | 90.1 % | 93.8 % | ||
| 8 | 5.99% | 87.9 % | 85.3 % | 91.2 % |
Recovery data for all REEs is not available at this time, however heavy REE recovery is anticipated to follow Y recovery due to chemical and physical similarity. Additional testing is underway to improve the proposed flowsheet and better understand the processing behaviour of the Olserum mineralization.
Tungsten Projects
Sweden
As announced on October 10, 2013 Tasman purchased a portfolio of tungsten projects in the Bergslagen mining district of south-central Sweden. This portfolio includes several of the largest known tungsten occurrences in Scandinavia, including the former Yxsjöberg mine which accounts for more than 90% of the tungsten previously produced in Sweden. The projects were purchased outright for a total consideration of 50,000 common shares in Tasman and $45,000 cash. A further 50,000 common shares are issuable upon commencement of production from any of the tungsten projects. All projects have extensive historic information including drilling, production and metallurgical data, and are supported by excellent road, rail and power infrastructure. In addition, Tasman has made an application for an additional claim in the Bergslagen district.
Based on its economic importance and high risk of supply disruption, tungsten has been named a "critical" metal in recent British Geological Survey ("BGS") and European Commission ("EC") publications. Tungsten is an essential industrial element with hundreds of end-use applications. It has the highest melting point (3,410°C) and highest tensile strength (19.3 gms/cc) of all pure metals and is therefore highly sought after for drilling and cutting equipment (termed hardmetals), specialty steels and aerospace applications.
The acquired tungsten projects are approximately centered on the Yxsjöberg historical mine where a mill and tailings dam remains on site. Simple road access links all project areas. The data from the mines is historical in nature and was compiled prior to the implementation of NI 43-101 reporting standards. Tasman has not completed sufficient exploration to verify the estimates and is not treating them as NI 43-101 defined resources or reserves verified by a qualified person; the historical estimate should not be relied upon.
Yxsjöberg
The Yxsjöberg historical mine is the by far largest known tungsten mineralization in Sweden, from which more than 90% of all tungsten produced in the country emanates. The deposit is of a skarn-hosted tungsten-copper-beryllium- fluorite style consisting of three mineralized material bodies (Kvarnåsen, Nävergruvan, Finngruvan) which lie in the same folded, skarn altered limestone horizon. Earliest records of mining date back to 1728 and small scale mining for copper continued intermittently until the 19th century. The tungsten mineral scheelite (CaWO4) was first identified in 1862 and the earliest recorded production of tungsten in 1918. A new concentrator was built in 1937, and a roasting furnace and gravity separator added in 1951. A circuit for the production of fluorite concentrate was added in 1956. Fluorite remains a potential by-product to any future operation.
The price of tungsten fell in the early 1960s, and the mine was closed in 1963 and subsequently allowed to flood. By the end of the 1960s however, the tungsten price had recovered and interest was renewed. In 1969 the Swedish State-owned mining company, AB Statsgruvor, acquired the mine and constructed a new concentrator and head frame. This new plant began with gravity separation, but was converted to selective flotation in 1977. The mine and plant were closed again in 1989 due to low tungsten prices, when the deepest levels of the mine had reached approximately 600m. A total of more than 5 million tonnes of mineralized material averaging approximately 0.35% WO3 (with additional copper and fluorite) were extracted during the life of the Yxsjöberg mine. Significant mineralization remained in situ at the final closure in 1989.
- 8 -
Apart from remediation and environmental management, the plant has largely been left untouched since the closure of the mine, as have two large tailings dams estimated to contain a total of 4.6 million metric tonnes of material.
Other
The other tungsten projects comprise Wigström, Sandudden, Gensgruvan, Gussarvet, and Gustavsberg.
Tasman is compiling historic data for this tungsten portfolio and completing low intensity surface prospecting and sampling activity. Sampling and mapping will be increased during the fiscal year ending August 31, 2015 and may include geophysical exploration should results prove encouraging.
Chromite Projects
In December 2014 the Company announced that it had entered into a letter of agreement (the "Letter Agreement") with Kipu Metals Corp. ("Kipu") under which the Company will acquire (the "Acquisition") a 100% interest in a portfolio of stratiform chromite projects in north-eastern Finland totaling 11,400 ha in size (the "Chromite Portfolio") in exchange for the refund of costs incurred to date of $45,529 by Kipu. There is no additional consideration for the Acquisition. Closing of the Acquisition is subject to TSXV approval.
Mr. Michael Hudson, a director of the Company, and Mr. Mark Saxon, the Company's President, CEO and a director, are also directors and shareholders of Kipu. As a result, the Acquisition is a related party transaction as such term is defined under Multilateral Instrument 61-101 Protection of Minority Security Holders in Special Transactions ("MI 61-101"). The Acquisition is exempt from the valuation and minority shareholder approval requirements pursuant to exemptions available to the Company under MI 61-101 as the total consideration being received by Mr. Hudson and Mr. Saxon does not exceed 25% of Tasman's market capitalization.
On closing of the Acquisition, Tasman will acquire two chromite projects (Akanvaara and Koitelainen) that lie approximately 75 km apart in north-eastern Finland. The projects are secured by 120 exploration claims and claim applications totaling 11,400 hectares in size. North-eastern Finland has been a very active exploration district, following the discovery of the large Sakati Cu-Ni deposit by Anglo American, as announced in November 2011.
Based on its economic importance to European industry and a high risk of supply disruption, both chromium and PGEs are defined as "critical" raw materials within recent European Commission ("EC") publications (see:http://ec.europa.eu/enterprise/policies/raw-materials/critical/index_en.htm), in line with the balance of Tasman's existing project portfolio.
Chromium ("Cr") is an essential industrial element due in particular to its strengthening effect on steel alloys and its resistance to corrosion. Most (>90%) of the current global chromite production is destined for use in the metallurgical industry, in particular for stainless steel which requires a minimum of 10.5% Cr by mass to impart favorable strength and anti-corrosion properties. The remaining chromite is used in the aeronautics (for the protection of aluminium aircraft bodies), foundry, chemical and refractory sectors. Overall, demand growth for stainless steel and therefore chromium is forecast in the range 4% - 5% per year to 2020.
European stainless steel production is highly significant, second only to China in scale and accounting for some 20% of global output. Europe's share of world chromium metal demand is equally significant, estimated by the European Commission at 1,800,000 tonnes (approximately 18.5% of global consumption). At present, 80% of this demand is supplied from South Africa, whilst together Kazakhstan and South Africa hold greater than 85% of the currently known global resources ("USGS").
The Akanvaara and Koitelainen chromite projects are of a stratiform intrusion-hosted style, which together with similar deposits on the Kola Peninsula of Russia, constitute one of the largest known undeveloped resources of chromite in the world. The Akanvaara and Koitelainen intrusions are part of a group of Archean/early Proterozoic mafic layered intrusions within the Fennoscandian Shield, which show cumulate igneous layering similar to other large layered intrusions (Fiskenaesset, Burakovka, Bushveld), and host deposits of chromite, vanadium, titanium, PGEs and gold.
- 9 -
Akanvaara
The Akanvaara layered intrusion is located 140 km northeast of the town of Rovaniemi, with simple vehicle access through a network of gravel logging and drill roads. The closest rail access lies some 40km to the south, and a commercial airport in Kemijärvi being 62 km to the northeast. The Akanvaara project consists of 53 granted claims for 4,750 hectares.
The Akanvaara mafic intrusion has a known surface area of about 50 km2, with a strike length along magmatic layering of 10 km and a total stratigraphic thickness of approximately 3.1 km. The intrusion is characterised by a persistently layered sequence of mafic and ultramafic gabbro, pyroxenite, anorthosite and chromitite (chromium enriched) above a lower chilled margin.
GTK discovered and explored the Akanvaara intrusion from 1990 to 1999, at which point the project was offered for tender. Work completed by GTK included ground geophysical surveys (magnetic, electromagnetic, gravity); diamond drilling of 118 holes for a total of 18,136 m; and laboratory scale beneficiation testing on a number of mineralization styles. Twenty-three (23) chromitite layers were discovered within the Akanvaara intrusion, each with different thickness, strike extent and potential, across a total stratigraphic thickness of 1,100 m. Mineralized lenses vary from centimetre to tens of metres in thickness.
Following drilling, GTK completed an historic resource calculation on the three most persistent chromitite lenses and a vanadium enriched gabbro. Cumulate layers are noted to be very strike extensive with predictable grade and thickness. Historical resource estimates are provided in Table 8 and are based upon a report entitled "Akanvaaran intrusion kromi-, kromivanadiini, vanadiini- ja platinametalli- kultaesiintynay" by Mutatanen, T. 1998 on behalf of GTK.
Table 8: Historical Resource Estimate for the Akanvaara Chromite Project, Finland
| Name | Historical Resources (Million Tonnes) | Cr % | PGE ppm | V % | Comments |
| Akanvaara LC* | 27.0 | 15.7 | 0.60 | 0.00 | |
| Akanvaara UC* | 18.1 | 22.8 | 0.91 | 0.40 | Reef thickness is 1 m, extent 7.9 km along strike, tonnage is estimated down to 300 m vertical depth where the occurrence is open along dip. |
| Akanvaara ULC* | 10.0 | 15.3 | 0.00 | 0.00 | |
| Base of Magnetic Gabbro* | 20.0 | 0.0 | 0.00 | 0.34 | The 6 - 13 metres thick basal part of the magnetite gabbro unit, with V-rich magnetite. 20 million metric tons down to 100 metres (vertical) depth, with 0.34 % V, 0.10 % Cu, and 2.5 g/t Ag. |
| * | The data from these projects is historical in nature and was compiled prior to the implementation of NI 43-101 reporting standards. Tasman has not completed sufficient exploration to verify the estimates and we are not treating them as NI 43-101 defined resources or reserves verified by a qualified person; the historical estimate should not be relied upon. |
GTK commissioned the Technical Research Centre of Finland ("VTT") for preliminary mineral processing testing. Samples from the UC horizon were used for flotation tests, which yielded a chromite concentrate with 33.8% Cr2O3 (chromium oxide) and 0.55% V with recovery of 92% and 88% respectively. The chromite concentrate was shown to be relatively rich in iron, low in alumina and practically devoid of magnesium. This suggests Akanvaara chromite-vanadium concentrate may have potential as a metallurgical and chemical grade raw material for production of ferrochrome, chrome-vanadium alloys and chrome chemicals.
Flotation tests completed on the ULC material gave a higher-grade concentrate of 38.3% Cr203, with the promising recovery of 86%.
A series of magnetic concentrates (approximately 10 - 12 weight % of the feed) were produced from the Magnetic Gabbro Unit which contained 1.55 - 1.59 weight % V with up to 60% recovery of vanadium. A number of copper (Cu)-sulphide concentrates were also produced by flotation of this Magnetic Gabbro sample with a grade of 8 - 14% Cu, 1.4 g/t Au, 53 - 57 g/t Ag, 0.073 g/t Rh and 0.068 g/t Pt.
Subsequent to GTKs tender, the property was held by Finnish company Outokumpu, who evaluated Akanvaara for PGEs and recognised that magnetite-bearing gabbros in the uppermost section of the intrusion where little GTK drilling was complete were highly anomalous in PGEs (to 1.26 g/t). Outokumpu completed 5 drill holes and undertook extensive surface sampling.
- 10 -
Koitelainen
The Koitelainen layered intrusion is located 75 km northwest of Akanvaara. The nearest railroad is found in Salla, 100 km to the south, and the area is accessible by car through a network of gravel logging and drill roads. The Koitelainen project consists of 67 claim applications for 6650 hectares and is totally contained within a Natura 2000 area.
The Koitelainen intrusion is a flat, oval-shaped anticline, 26 km x 29 km in size with an estimated maximum thickness of around 3.2 km. The interior of the anticline is made up of Archean footwall rocks to the intrusion through which the intrusion was emplaced. The intrusion is divided into an ultramafic Lower Zone ("LZ"), a gabbroic Main Zone ("MZ") and a gabbroic Upper Zone ("UZ").
Chromite mineralization at Koitelainen was first discovered in 1977, and two principal levels of chromite mineralization are now known. The Lower Chromitite ("LC") layers are found within a pyroxene cumulate, and are continuous in drilling over a distance of about 20 km. Four to six layers each over 0.3 m thick, with Cr2O3 from 10.6% to 32.2% have been discovered, the thickest drill intersection being 2.9 metres. The basal contacts are generally sharp; the hanging wall contact is gradational from massive chromitite to chromite-disseminated pyroxenite. The Upper Chromitite ("UC") layer is a distinct interval up to 2.2 metres thick containing 21% Cr2O3, 0.4% V and 1.1 ppm PGE. The UC is strike continuous, and compositionally and mineralogically homogeneous.
From 1973 to 1999, 131 holes for a total of 16,440 m were drilled at a range of chromite, PGE and vanadium targets at Koitelainen. All drilling was completed on behalf of GTK, and the core remains in storage in Finland.
Using 42 drill holes, GTK undertook a resource estimate for a vanadium enriched ilmenomagnetite unit, discovered within the upper parts of the Koitelainen layered intrusion. Using 17 drill holes and 4 drill holes, GTK completed historic resource calculations on the Upper and Lower Chromitite horizons respectively. The Upper Chromitite layer is 1.3 m thick, and is noted to be very strike extensive with predictable grade and thickness. Historical resource estimates are provided in Table 9 and are based upon a report entitled "Koitelaisen malmitutkimukset vuosina 1979-1989" by Mutatanen, T. 1989 on behalf of the Geological Survey of Finland.
Table 9: Historical Resource Estimate for the Koitelainen Chromite Project, Finland
| Name | Historical Resources (Million tonnes) | Cr % | PGE ppm | V % | Comments |
Magnetite Gabbro* | 10.8 | 0.0 | 0.00 | 0.2 | 42 drill holes used in resource calculation. 4 strike extensive mineralized units, up to 40m thick. |
| Koitelainen UC* | 70.0 | 15.7 | 1.10 | 0.0 | The distinct UC layer averages 1.3 m thick. Resource to 500m vertical depth. 17 drill holes used in resource calculation. |
| Koitelainen LC* | 2.0 | 14.4 | 1.38 | 0.4 | The three to six LC layers extends for at least 20 km along strike. |
| * | The data from these projects is historical in nature and was compiled prior to the implementation of NI 43-101 reporting standards. Tasman has not completed sufficient exploration to verify the estimates and we are not treating them as NI 43-101 defined resources or reserves verified by a qualified person; the historical estimate should not be relied upon. |
Metallurgical testwork from Koitelainen has been poorly recorded and appears limited to the Magnetite Gabbro. In 1976, it is reported that drill core was used as feed materials for weak magnetic separation testwork. Recovery of the magnetic material was approximately 90%, with a concentrate grade of 50-50% Fe and 0.8-1.2% V.
Iron Projects
Tasman retains a 25% interest in four claims following the joint venture of iron ore projects to an Australian Stock Exchange listed company. In addition, Tasman retains a 2% net smelter royalty on two claims following the sale of iron ore projects to a London Stock Exchange listed company.
2015 Exploration Budget
The Company had prepared a budget of approximately $3,220,000 for the fiscal year ending August 31, 2015 to be used for completion of the PFS, exploration, metallurgy and permitting activities on the Norra Kärr and Yxsjöberg properties and for ongoing corporate and field general administration and overhead. Drilling of the Norra Kärr project
- 11 -
was completed in December 2014. The majority of the work on the PFS has now been completed and delivery of the PFS is imminent.
The Company is not incurring significant costs on the Olserum project and does not intend to incur significant costs until a further financing is completed and the mining lease, currently under application, is granted. The Company is, however, continuing with metallurgical research, of which the majority of the costs are being funded through the Company's participation in a European Union funding initiative for studying supply of critical materials.
The Company is planning to undertake only low cost data compilation and review of the new chromite projects at this time.
The exploration budget may change pending any future financings.
Qualified Person
The qualified person for Tasman's projects, Mr. Mark Saxon, the Company's President and Chief Executive Officer, a Fellow of the Australasian Institute of Mining and Metallurgy and a Member of the Australian Institute of Geoscientists, has reviewed and verified the contents of this document.
Selected Financial Data
The following selected financial information is derived from the unaudited condensed consolidated interim financial statements of the Company prepared in accordance with IFRS.
| Fiscal 2015 | Fiscal 2014 | Fiscal 2013 | ||||||
| Three Months Ended | Nov. 30, 2014 $ | Aug. 31, 2014 $ | May 31, 2014 $ | Feb. 28, 2014 $ | Nov. 30, 2013 $ | Aug. 31, 2013 $ | May 31, 2013 $ | Feb. 28, 2013 $ |
Operations: | ||||||||
| Revenues | Nil | Nil | Nil | Nil | Nil | Nil | Nil | Nil |
| Expenses | (457,724) | (449,118) | (578,083) | (638,057) | (766,824) | (679,723) | (576,014) | (635,742) |
| Other items | 15,996 | (2,287) | (33,713) | 15,157 | 10,917 | (462,602) | 22,139 | 35,566 |
Net loss before deferred income tax | (441,728) | (451,405) | (611,796) | (622,900) | (755,907) | (1,142,325) | (553,875) | (600,176) |
| Deferred income tax | Nil | Nil | Nil | Nil | Nil | Nil | Nil | Nil |
| Net loss | (441,728) | (451,405) | (611,796) | (622,900) | (755,907) | (1,142,325) | (553,875) | (600,176) |
| Other comprehensive gain(loss) | (1,668) | 16,744 | (10,141) | 3,014 | (12,007) | (27,800) | (3,129) | 846 |
| Comprehensive loss | (443,396) | (434,661) | (621,937) | (619,886) | (767,914) | (1,170,125) | (557,004) | (599,330) |
| Basic and diluted loss per share | (0.01) | (0.01) | (0.01) | (0.01) | (0.01) | (0.01) | (0.01) | (0.01) |
| Dividends per share | Nil | Nil | Nil | Nil | Nil | Nil | Nil | Nil |
Balance Sheet: | ||||||||
| Working capital | 4,347,099 | 5,403,122 | 7,160,151 | 7,056,411 | 4,091,866 | 5,094,986 | 6,241,592 | 7,242,130 |
| Total assets | 16,451,844 | 17,375,571 | 17,470,818 | 16,682,588 | 13,130,518 | 13,856,353 | 13,595,076 | 14,520,301 |
| Total long term liabilities | Nil | Nil | Nil | Nil | Nil | Nil | Nil | Nil |
Results of Operations
Three Months Ended November 30, 2014 Compared to the Three Months Ended August 31, 2014
During the three months ended November 30, 2014 (the "Q1") the Company reported a net loss of $441,728 ($0.01 per share), compared to a net loss of $451,405 ($0.01 per share) for the three months ended August 31, 2014 (the "Q4"), a decrease in loss of $9,677.
Three Months Ended November 30, 2014 Compared to the Three Months Ended November 30, 2013
As the Company is in the exploration stage of investigating and evaluating its unproven mineral interests, it has no revenue.
- 12 -
During the three months ended November 30, 2014 (the "2014 period"), the Company incurred a net loss of $441,728 ($0.01 per share) compared to a net loss of $755,907 ($0.01 per share) for the three months ended November 30, 2013 (the "2013 period"). The $314,179 decrease in loss during the 2014 period was due to a reduction of corporate and investor relations activities during the current economic period, reduction in legal costs, reallocation of human resources and reduced recognition of share-based compensation.
Excluding share-based compensation, general and administrative expenses decreased by $245,200, from $651,624 during the 2013 period to $406,424 during the 2014 period. Specific general and administrative expenses of note during the 2014 are as follows:
| · | incurred $35,006 (2013 - $34,472) for accounting and administration of which $22,150 (2013 - $14,900) was charged by Chase Management Ltd. ("Chase"), a private corporation controlled by Mr. Nick DeMare, the CFO and a director of the Company, and $12,856 (2013 - $19,572) was charged for accounting services provided in Sweden; |
| · | $19,775 (2013 - $39,680) for travel expenses, primarily for Company personnel to oversee the Company's ongoing property exploration programs and attend international investment conferences. Travel expenses were lower during the 2014 period compared to the 2013 period due to less corporate travel; |
| · | corporate development expenses were lower during the 2014 period compared to the 2013 period from $54,261 in the 2013 period to $5,503 in the 2014 period. During the 2013 period the Company attended several international investment conferences; |
| ● | incurred $114,641 (2013 - $106,919) for professional services, of which the Company incurred $63,000 (2013 - $63,000) by directors and officers of the Company, $4,923 (2013 - $8,036) by consultants in Sweden and $46,718 (2013 - $35,883) by consultants for general corporate services; |
| · | $45,000 (2013 - $40,500) for management fees charged through Sierra Peru Pty ("Sierra") for remuneration of Mr. Mark Saxon, the Company's President and CEO; |
| · | salaries and benefits decreased by $64,438, from $69,678 in the 2013 period to $5,240 in the 2014 period due to termination of employees during fiscal 2014; and |
| · | legal fees decreased by $98,933, from $144,423 in the 2013 period to $45,490 in the 2014 period. During the 2013 period, legal fees were higher due to the preparation and filing of the base shelf prospectus and Form 20-F. |
During the 2014 period the Company recorded $51,300 (2013 - $115,200) for share-based compensation for the immediate vesting of 135,000 (2013 - 220,000) share options granted.
Investments
The Company holds 2,647,059 common shares of Hannans Reward Limited ("Hannans") and 600,000 common shares of Thomson Resources Ltd. ("Thomson"), public companies listed on the Australian Stock Exchange, and have been designated as available-for-sale for accounting purposes. As at November 30, 2014 the quoted market value of the Hannans shares was $25,700 and the Thomson shares was $11,650.
Exploration and Evaluation Assets
During the 2014 period the Company incurred a total of $677,215 (2013 - $433,941) on the acquisition, exploration and evaluation of its unproven resources assets, of which $657,702 (2013 - $321,100) was incurred on the Norra Kärr property and $19,513 (2013 - $112,841) on other properties. Primary activities during the 2014 period were focused on completing metallurgical testing and preparation of the PFS on the Norra Kärr property. The majority of the work on the PFS has now been completed and delivery of the PFS is imminent. Details of the exploration activities conducted during the 2014 period are described in "Exploration Projects" in this MD&A.
- 13 -
The carrying costs of the Company's exploration and evaluation assets are as follows:
| As at November 30, 2014 | As at August 31, 2014 | |||||||||||||||||||||||
Acquisition Costs $ | Deferred Exploration Costs $ | Total $ | Acquisition Costs $ | Deferred Exploration Costs $ | Total $ | |||||||||||||||||||
| Rare Earth Properties | ||||||||||||||||||||||||
| Norra Kärr | 92,797 | 10,546,985 | 10,639,782 | 92,797 | 9,889,283 | 9,982,080 | ||||||||||||||||||
| Olserum | 143,357 | 569,469 | 712,826 | 143,357 | 568,594 | 711,951 | ||||||||||||||||||
| Other | 15,960 | 4,758 | 20,718 | 15,960 | 4,758 | 20,718 | ||||||||||||||||||
Other Properties | 122,752 | 47,790 | 170,542 | 112,853 | 39,051 | 151,904 | ||||||||||||||||||
374,866 | 11,169,002 | 11,543,868 | 364,967 | 10,501,686 | 10,866,653 | |||||||||||||||||||
Exploration and evaluation activities incurred during the year ended August 31, 2014 and the three months ended November 30, 2014 are as follows:
| Rare Earth Element Properties | Other | |||||||||||||||||||
Norra Kärr $ | Olserum $ | Other $ | Properties $ | Total $ | ||||||||||||||||
| Balance at August 31, 2013 | 7,202,949 | 613,182 | 64,948 | 2,860 | 7,883,939 | |||||||||||||||
Exploration costs | ||||||||||||||||||||
| Consulting | 532,787 | 72,570 | - | 33,436 | 638,793 | |||||||||||||||
| Database | 2,424 | - | - | 191 | 2,615 | |||||||||||||||
| Exploration site | 8,490 | 1,069 | - | 265 | 9,824 | |||||||||||||||
| Geochemical | 94,079 | 3,723 | - | 4,192 | 101,994 | |||||||||||||||
| Geological | 156,299 | - | - | - | 156,299 | |||||||||||||||
| Maps | 1,442 | - | - | 437 | 1,879 | |||||||||||||||
| Metallurgical testing | 429,895 | - | - | - | 429,895 | |||||||||||||||
| Technical report | 1,364,575 | - | - | - | 1,364,575 | |||||||||||||||
| Salaries | 29,188 | - | - | - | 29,188 | |||||||||||||||
| Surface rights | 76,364 | - | - | - | 76,364 | |||||||||||||||
| Travel | 13,836 | 2,896 | - | 76 | 16,808 | |||||||||||||||
2,709,379 | 80,258 | - | 38,597 | 2,828,234 | ||||||||||||||||
| Acquisition costs | ||||||||||||||||||||
| Mining rights | 16,832 | 18,511 | - | 16,353 | 51,696 | |||||||||||||||
| Issuance of common shares | 52,920 | - | - | 51,500 | 104,420 | |||||||||||||||
| Acquisition | - | - | - | 45,000 | 45,000 | |||||||||||||||
69,752 | 18,511 | - | 112,853 | 201,116 | ||||||||||||||||
Impairment | - | - | (44,230 | ) | (2,406 | ) | (46,636 | ) | ||||||||||||
Balance at August 31, 2014 | 9,982,080 | 711,951 | 20,718 | 151,904 | 10,866,653 | |||||||||||||||
Exploration costs | ||||||||||||||||||||
| Consulting | 115,500 | - | - | 3,142 | 118,642 | |||||||||||||||
| Drilling | 105,744 | - | - | - | 105,744 | |||||||||||||||
| Exploration site | 1,099 | - | - | - | 1,099 | |||||||||||||||
| Geochemical | 28,263 | - | - | 2,555 | 30,818 | |||||||||||||||
| Geological | 16,972 | - | - | - | 16,972 | |||||||||||||||
| Maps | - | - | - | 964 | 964 | |||||||||||||||
| Technical report | 351,900 | - | - | - | 351,900 | |||||||||||||||
| Salaries | 9,363 | 875 | - | 2,078 | 12,316 | |||||||||||||||
| Surface rights | 26,865 | - | - | - | 26,865 | |||||||||||||||
| Travel | 1,996 | - | - | - | 1,996 | |||||||||||||||
657,702 | 875 | - | 8,739 | 667,316 | ||||||||||||||||
Acquisition costs | - | |||||||||||||||||||
| Mining rights | - | - | - | 9,899 | 9,899 | |||||||||||||||
Balance at November 30, 2014 | 10,639,782 | 712,826 | 20,718 | 170,542 | 11,543,868 | |||||||||||||||
- 14 -
Cash Flows
During the 2014 period cash decreased by $1,565,172. Operations utilized $385,469 and investing activities, mainly for exploration activities on exploration and evaluation assets, utilized $1,179,703.
During the 2013 period cash decreased by $1,189,097. Operations utilized $842,180 and investing activities mainly for expenditures on exploration and evaluation assets utilized $346,917.
Financial Condition / Capital Resources
The Company manages its capital structure and makes adjustments to it, based on the funds available to the Company, in order to support the acquisition and exploration of mineral properties. The Board of Directors does not establish quantitative return on capital criteria for management, but rather relies on the expertise of the Company's management to sustain future development of the business. The Company defines capital that it manages as share capital, cash and cash equivalents and short-term investments. The Company will continue to assess new properties and seek to acquire an interest in additional properties if it feels there is sufficient geologic or economic potential and if it has adequate financial resources to do so. Management reviews its capital management approach on an ongoing basis and believes that this approach, given the relative size of the Company, is reasonable.
To date the Company has not conducted any borrowing outside of its accounts payable and accrued liabilities incurred for operations and exploration activities. The Company maintains its cash primarily in Canadian currency in a major Canadian financial institution. The funds are held in interest-bearing accounts. The Company is not exposed to significant credit or interest rate risk although cash is held in excess of federally insured levels.
The Company advances funds to its subsidiary as required to satisfy ongoing levels of operations. There are no legal or economic restrictions on the ability of the Company's subsidiary to transfer funds to the Company in the form of cash dividends, loans or advances.
As at November 30, 2014, the Company had working capital of $4,347,099. The Company believes that it currently has sufficient financial resources to conduct anticipated exploration programs and meet anticipated corporate administration costs for the upcoming twelve month period.
The Company filed a final short form base shelf prospectus with certain Canadian and US securities regulatory authorities in August 2013. The shelf prospectus was declared effective on October 1, 2013. The shelf prospectus allows the Company to offer, from time to time over a 25-month period, expiring November 1, 2015, up to $25,000,000 of common shares, units and warrants. In the event the aggregate market value worldwide of the Company's common shares held by non-affiliates of the Company is less than US $75 million, US securities law restricts the issuance of securities during the 12-month period prior to and including the relevant sale to no more than one-third of the aggregate market value worldwide of the Company's common shares held by non-affiliates of the Company. As of the date of this MD&A, the market value does not exceed the minimum requirements.
The Company is not required to offer or sell all or any portion of the securities pursuant to the shelf prospectus in the future and will only do so if it believes market conditions warrant it.
The Company has relied solely on equity financing to raise the requisite financial resources. While it has been successful in the past, there can be no assurance that the Company will be successful in raising future financing should the need arise.
Contractual Commitments
The Company has no contractual commitments.
Off-Balance Sheet Arrangements
The Company has no off-balance sheet arrangements.
- 15 -
Proposed Transactions
The Company has not entered into any proposed transactions.
Critical Accounting Estimates
Critical Judgments and Sources of Estimation Uncertainty
The preparation of the consolidated financial statements requires management to make certain estimates, judgments and assumptions that affect the reported amounts of assets and liabilities at the date of the consolidated financial statements and reported amounts of expenses during the reporting period. Actual outcomes could differ from these estimates. These consolidated financial statements include estimates which, by their nature, are uncertain. The impacts of such estimates are pervasive throughout the consolidated financial statements, and may require accounting adjustments based on future occurrences. Revisions to accounting estimates are recognized in the period in which the estimate is revised and future periods if the revision affects both current and future periods. These estimates are based on historical experience, current and future economic conditions and other factors, including expectations of future events that are believed to be reasonable under the circumstances.
Critical Judgments
The following are critical judgments that management has made in the process of applying accounting policies and that have the most significant effect on the amounts recognized in the consolidated financial statements:
| (i) | The determination of categories of financial assets and financial liabilities has been identified as an accounting policy which involves judgments or assessments made by management. |
| (ii) | Management is required to assess the functional currency of each entity of the Company. In concluding that the Canadian dollar is the functional currency of the parent and its subsidiary companies, management considered the currency that mainly influences the cost of providing goods and services in each jurisdiction in which the Company operates. As no single currency was clearly dominant the Company also considered secondary indicators including the currency in which funds from financing activities are denominated and the currency in which funds are retained. |
| (iii) | Management is required to assess impairment in respect of intangible exploration and evaluation assets. The triggering events are defined in IFRS 6. In making the assessment, management is required to make judgments on the status of each project and the future plans towards finding commercial reserves. The nature of exploration and evaluation activity is such that only a proportion of projects are ultimately successful and some assets are likely to become impaired in future periods. Management has determined impairment indicators were present in respect of certain other exploration and evaluation assets and as a result an impairment test was performed. Management has determined that there were no triggering events present as defined in IFRS 6 with the other properties as at November 30, 2014 and as such, no impairment test was performed. |
| (iv) | Although the Company takes steps to verify title to exploration and evaluation assets in which it has an interest, these procedures do not guarantee the Company's title. Such properties may be subject to prior agreements or transfers and title may be affected by undetected defects. |
Estimation Uncertainty
The following are key assumptions concerning the future and other key sources of estimation uncertainty that have a significant risk of resulting in a material adjustment to the carrying amount of assets and liabilities within the next financial year:
| (i) | Provisions for income taxes are made using the best estimate of the amount expected to be paid based on a qualitative assessment of all relevant factors. The Company reviews the adequacy of these provisions at the end of the reporting period. However, it is possible that at some future date an additional liability could result from audits by taxing authorities. Where the final outcome of these tax-related matters is different from the amounts that were originally recorded, such differences will affect the tax provisions in the period in which such determination is made. |
- 16 -
| (ii) | The assessment of any impairment of exploration and evaluation assets, and property, plant and equipment is dependent upon estimates of the recoverable amount that take into account factors such as reserves, economic and market conditions and the useful lives of assets. As a result of this assessment, management has carried out an impairment test on certain other exploration and evaluation assets and an impairment charge of $46,636 was made during fiscal 2014. |
Changes in Accounting Policies
There are no changes in accounting policies.
Transactions with Related Parties
A number of key management personnel hold positions in other entities that result in them having control or significant influence over the financial or operating policies of those entities. Certain of these entities transacted with the Company during the reporting period.
| (a) | Transactions with Key Management Personnel |
During the three months ended November 30, 2014 and 2013 the following amounts were incurred with respect to the Company's executive officers, comprising the President (Mark Saxon), Vice-President of Corporate Development (James Powell) and Chief Financial Officer (Nick DeMare):
2014 $ | 2013 $ | |||
| Management fees - Mr. Saxon | 45,000 | 40,500 | ||
| Professional fees - Mr. Powell | 22,500 | 24,000 | ||
| Professional fees - Mr. DeMare | 10,500 | 7,500 | ||
78,000 | 72,000 |
As at November 30, 2014, $18,500 (2013 - $19,500) of the above amounts remained unpaid.
The Company has a management agreement with the President, which provides that in the event the President's services are terminated without cause or upon a change of control of the Company, a termination payment of two years of compensation, at $15,000 per month, is payable. If the termination had occurred on November 30, 2014 the amount payable under the agreement would be $360,000.
(b) Transactions with Other Related Parties
| (i) | During the three months ended November 30, 2014 and 2013 the following amounts were incurred with respect to the Company's non-management directors of the Company (David Henstridge, Robert G. Atkinson, Gil Leathley and Michael Hudson): |
2014 $ | 2013 $ | |||
| Professional fees - Mr. Henstridge | 7,500 | 12,000 | ||
| Professional fees - Mr. Atkinson | 4,500 | 4,500 | ||
| Professional fees - Mr. Leathley | 10,500 | 7,500 | ||
| Professional fees - Mr. Hudson | 7,500 | 7,500 | ||
30,000 | 31,500 |
As at November 30, 2014, $9,500 (2013 - $42,500) of the above amounts remained unpaid.
| (ii) | During the three months ended November 30, 2014 the Company incurred a total of $22,150 (2013 - $14,900) to Chase for accounting and administration services provided by Chase personnel, excluding Mr. DeMare, and $1,005 (2013 - $1,005) for rent. As at November 30, 2014, $16,135 (2013 - $8,835) remained unpaid. |
- 17 -
| (c) | During the three months ended November 30, 2014 the Company incurred $4,490 (2013 - $6,190) for shared administration costs with Mawson Resources Limited ("Mawson") a public company with common officers and directors. As at November 30, 2014, $3,765 (2013 - $4,120) of the amount remained unpaid. |
| (d) | During the three months ended November 30, 2014 the Company recorded a recovery of $6,850 (2013 - $23,894) for shared office personnel and costs from Mawson, Tinka Resources Limited and Flinders Resources Ltd., public companies with common officers and directors. As at November 30, 2014, $4,403 (2013 - $20,004) of the amount remained outstanding. |
| (e) | On October 7, 2013 the Company entered into a letter agreement with Tumi Resources Limited ("Tumi") and acquired a 100% interest in seven exploration licenses (the "Tungsten Projects") located in south-central Sweden by paying $45,000 cash and issuing 50,000 common shares of the Company at a fair value of $51,500. A further 50,000 common shares are issuable upon commencement of production from any of the Tungsten Projects. Tumi has two common directors, Mr. DeMare and Mr. Henstridge. |
Risks and Uncertainties
The Company competes with other mining companies, some of which have greater financial resources and technical facilities, for the acquisition of mineral concessions, claims and other interests, as well as for the recruitment and retention of qualified employees.
The Company is in compliance in all material regulations applicable to its exploration activities. Existing and possible future environmental legislation, regulations and actions could cause additional expense, capital expenditures, restrictions and delays in the activities of the Company, the extent of which cannot be predicted. Before production can commence on any properties, the Company must obtain regulatory and environmental approvals. There is no assurance that such approvals can be obtained on a timely basis or at all. The cost of compliance with changes in governmental regulations has the potential to reduce the profitability of operations.
The Company's material mineral properties are located in Scandinavia and consequently the Company is subject to certain risks, including currency fluctuations which may result in the impairment or loss of mining title or other mineral rights, and mineral exploration and mining activities may be affected in varying degrees by governmental regulations relating to the mining industry.
For additional risks and uncertainties relating to the Company and its business, readers are encouraged to read Tasman's Annual Report on Form 20-F for the fiscal year ended August 31, 2014 available at www.sedar.com or the Company's website at www.tasmanmetals.com.
Investor Relations Activities
The Company maintains a website at www.tasmanmetals.com. All investor relations activities are conducted by in-house personnel.
Outstanding Share Data
The Company's authorized share capital is unlimited common shares without par value. As at January 12, 2015, there were 66,141,922 outstanding common shares, 4,935,435 warrants outstanding with an exercise price of $1.50 per common share, 295,907 compensation options outstanding with an exercise price of $1.10 per unit and 900,000 share options outstanding with exercise prices ranging from $0.60 to $1.87 per common share.
Disclosure Controls and Procedures
Disclosure controls and procedures are designed to provide reasonable assurance that material information is gathered and reported to senior management, including the Chief Executive Officer and Chief Financial Officer, as appropriate to permit timely decisions regarding public disclosure.
- 18 -
Management, including the Chief Executive Officer and Chief Financial Officer, has evaluated the effectiveness of the design and operation of the Company's disclosure controls and procedures. Based on this evaluation, the Chief Executive Officer and Chief Financial Officer have concluded that the Company's disclosure controls and procedures, as defined in National Instrument 52-109 - Certification of Disclosure in Issuer's Annual and Interim Filings ("52-109"), are effective to ensure that the information required to be disclosed in reports that are filed or submitted under Canadian Securities legislation are recorded, processed, summarized and reported within the time period specified in those rules. Management relies upon certain informal procedures and communication, and upon "hands-on" knowledge of senior management. Due to the small staff, however, the Company will continue to rely on an active Board and management with open lines of communication to maintain the effectiveness of the Company's disclosure controls and procedures.
Internal Control over Financial Reporting
The management of the Company is responsible for establishing and maintaining adequate internal control over financial reporting. Internal control over financial reporting is a process to provide reasonable assurance regarding the reliability of the Company's financial reporting for external purposes in accordance with IFRS. Internal control over financial reporting includes maintaining records that in reasonable detail accurately and fairly reflect the Company's transactions and dispositions of the assets of the Company; providing reasonable assurance that transactions are recorded as necessary for preparation of the Company's consolidated financial statements in accordance with IFRS; providing reasonable assurance that receipts and expenditures are made in accordance with authorizations of management and the directors of the Company; and providing reasonable assurance that unauthorized acquisition, use or disposition of Company's assets that could have a material effect on the Company's consolidated financial statements would be prevented or detected on a timely basis. Because of its inherent limitations, internal control over financial reporting is not intended to provide absolute assurance that a misstatement of the Company's consolidated financial statements would be prevented or detected.
Management conducted an evaluation of the effectiveness of the Company's internal control over financial reporting based on the framework and criteria established in Internal Control – Integrated Framework, issued by the Committee of Sponsoring Organizations of the Treadway Commission (1992). This evaluation included review of the documentation of controls, evaluation of the design effectiveness of controls, testing of the operating effectiveness of controls and a conclusion on this evaluation. Based on this evaluation, management concluded that the Company's internal control over financial reporting was effective as of November 30, 2014.
Changes in Internal Control over Financial Reporting
Internal control over financial reporting is a process designed to provide reasonable assurance regarding the reliability of financial reporting and the preparation of financial statements for external purposes in accordance with IFRS. The Chief Executive Officer and Chief Financial Officer have concluded that there has been no change in the Company's internal control over financial reporting during the three months ended November 30, 2014 that has materially affected, or is reasonably likely to materially affect, the Company's internal control over financial reporting.
- 19 -