
1 BG Staffing, Inc. Corporate Presentation May 2015
2 Forward-Looking Statements This presentation contains forward-looking statements regarding the business, operations and prospects of BG Staffing and industry factors affecting it. These statements are identified by words such as “may,” “will,” “begin,” “look forward,” “expect,” “believe,” “intend,” “anticipate,” “should,” “potential,” “estimate,” “continue,” “momentum,” and other words referring to events to occur in the future. These statements reflect BG Staffing’s current view of future events and are based on its assessment of, and are subject to, a variety of risks and uncertainties beyond its control, including: the availability of workers’ compensation insurance coverage at commercially reasonable terms; the availability of qualified temporary personnel; compliance with federal and state labor and employment laws and regulations and changes in such laws and regulations; the ability to compete with new competitors and competitors with superior marketing and financial resources; management team changes; the favorable resolution of current or future litigation; the ability to begin to generate sufficient revenue to produce net profits; the impact of outstanding indebtedness on the ability to fund operations or obtain additional financing; the ability to leverage the benefits of recent acquisitions and successfully integrate newly acquired operations; adverse changes in the economic conditions of the industries, countries or markets that BG Staffing serves; disturbances in world financial, credit, and stock markets; unanticipated changes in national and international regulations affecting the company’s business; a decline in consumer confidence and discretionary spending; the general performance of the U.S. and global economies; economic disruptions resulting from the European debt crisis; and continued or escalated conflict in the Middle East, each of which could cause actual results to differ materially from those projected in the forward-looking statements. BG Staffing is under no obligation to (and expressly disclaims any such obligation to) update or alter its forward-looking statements, whether as a result of new information, future events or otherwise. This presentation also contains information about BG Staffing’s Adjusted EBITDA and Contribution to Overhead (“COH”), which are not measures derived in accordance with GAAP and which exclude components that are important to understanding BG Staffing’s financial performance. The definition of Adjusted EBITDA is disclosed in BG Staffing’s Forms 10-K and 10-Q filed with the Securities and Exchange Commission. COH is a non-GAAP measure that is derived by subtracting selling expenses from gross profit. Selling expenses are a subcomponent of Selling, General and Administrative costs as disclosed in our financial statements filed on Forms 10-K and 10-Q with the Securities and Exchange Commission. Investors should recognize that these non-GAAP measures might not be comparable to similarly titled measures of other companies. These measures should be considered in addition to, and not as a substitute for or superior to, any measure of performance, cash flows or liquidity prepared in accordance with accounting principles generally accepted in the United States.
3 BG Staffing, Inc. Overview
4 National provider of temporary staffing services. Management has led steady expansion & diversification initiatives. Operates in diversified segments. BG Staffing, Inc. (NYSE: MKT: BGSF)
5 Listed on NYSE MKT in Oct 2014. Closed $9.4M PIPE in Dec 2014. In Jan 2015: Filed $60M S-3 shelf registration statement. Paid $0.15 dividend. Acquired D&W Talent assets in Feb 2015. May 2015 raised dividend to $0.25. Recent Events
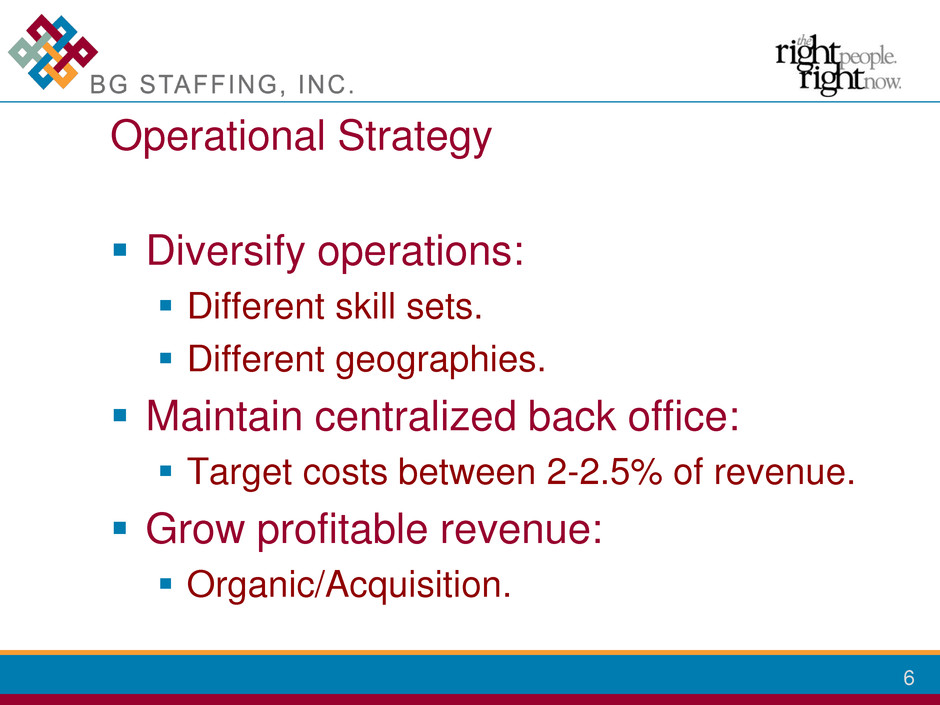
6 Diversify operations: Different skill sets. Different geographies. Maintain centralized back office: Target costs between 2-2.5% of revenue. Grow profitable revenue: Organic/Acquisition. Operational Strategy
7 L. ALLEN BAKER, Jr. - President and CEO since 2009. Baker joined the board of directors in 2008 while serving as the Executive Vice President/CFO of a confections manufacturing company. During his tenure at the confections manufacturing company, he led in the acquisition and integration of two other confection manufacturing companies and spearheaded the exit of the company to a private equity buyer. To date, Baker has successfully integrated nine staffing brands under the BGSF umbrella. His previous experience includes 17 years in the staffing industry with a national, privately held staffing company headquartered in the Dallas/Fort Worth area, with operations in 43 states. He has a BS degree in mathematics with a minor in computer information systems from West Texas State University and an MBA from the University of Dallas. MICHAEL A. RUTLEDGE – CFO since 2013. Rutledge has held executive management positions beginning in 2005, having served as the Chief Financial Officer/Vice President of Finance of one public company and three private companies. Rutledge began his career in public accounting at Ernst & Young LLP in Houston. He has a BBA in Accounting from Texas A&M. Biographies
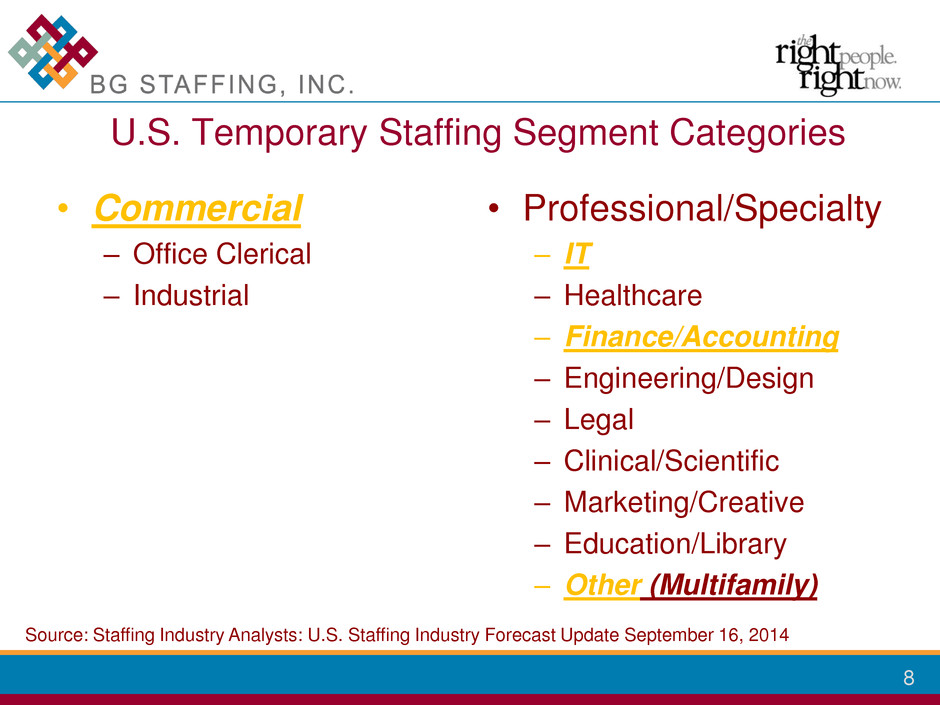
8 • Professional/Specialty – IT – Healthcare – Finance/Accounting – Engineering/Design – Legal – Clinical/Scientific – Marketing/Creative – Education/Library – Other (Multifamily) • Commercial – Office Clerical – Industrial U.S. Temporary Staffing Segment Categories Source: Staffing Industry Analysts: U.S. Staffing Industry Forecast Update September 16, 2014
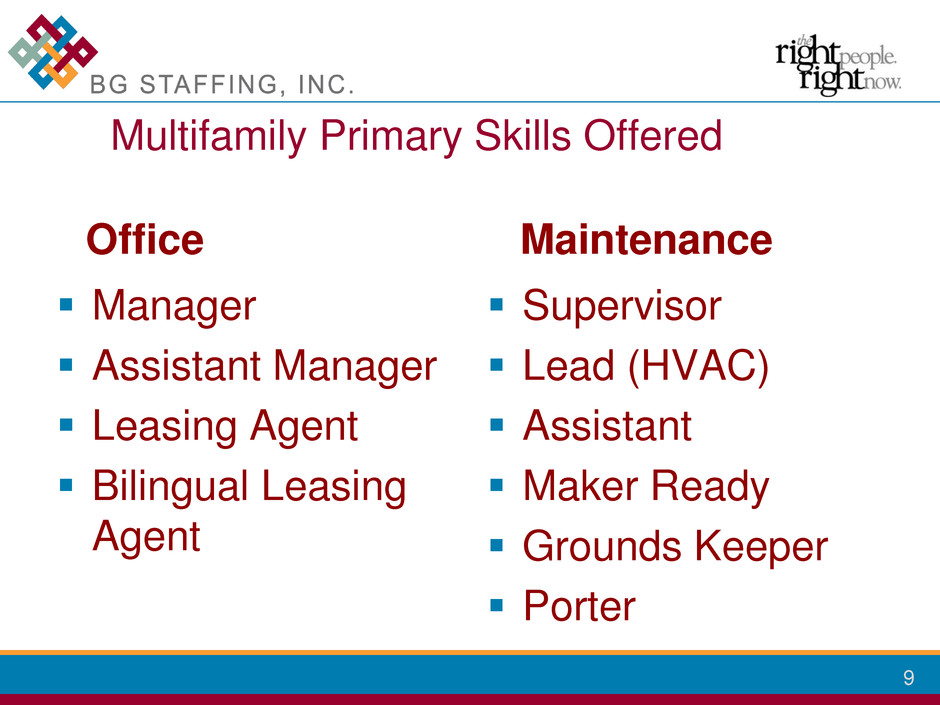
9 Manager Assistant Manager Leasing Agent Bilingual Leasing Agent Maintenance Supervisor Lead (HVAC) Assistant Maker Ready Grounds Keeper Porter Office Multifamily Primary Skills Offered
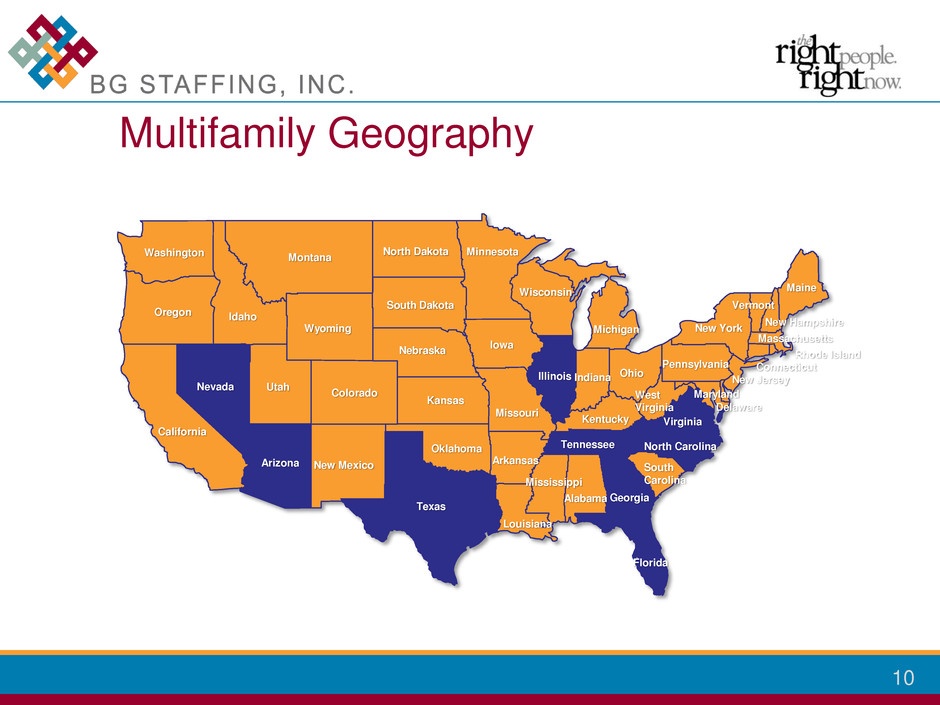
10 Multifamily Geography Colorado Kansas New Mexico Arizona California Oklahoma Texas Missouri Louisiana Mississippi Alabama Georgia Florida South Carolina North Carolina Tennessee Kentucky Virginia West Virginia Michigan Ohio Indiana Illinois Iowa Wisconsin Minnesota Arkansas Nebraska Wyoming South Dakota North Dakota Montana Utah Idaho Nevada Oregon Washington Pennsylvania New York Maine New Jersey Rhode Island Connecticut Massachusetts Vermont New Hampshire Delaware Maryland
11 Many modules such as Sales & Distribution Supply Chain Materials Management Production Planning Business Warehouse Finance & Cost Accounting Human Capital Management Add ons such as Vistex, Qlickview, Workday Oracle Gold Partner Hyperion Oracle Business Intelligence Peoplesoft ERP Oracle EBS SAP ERP IT Staffing Primary Skills Offered
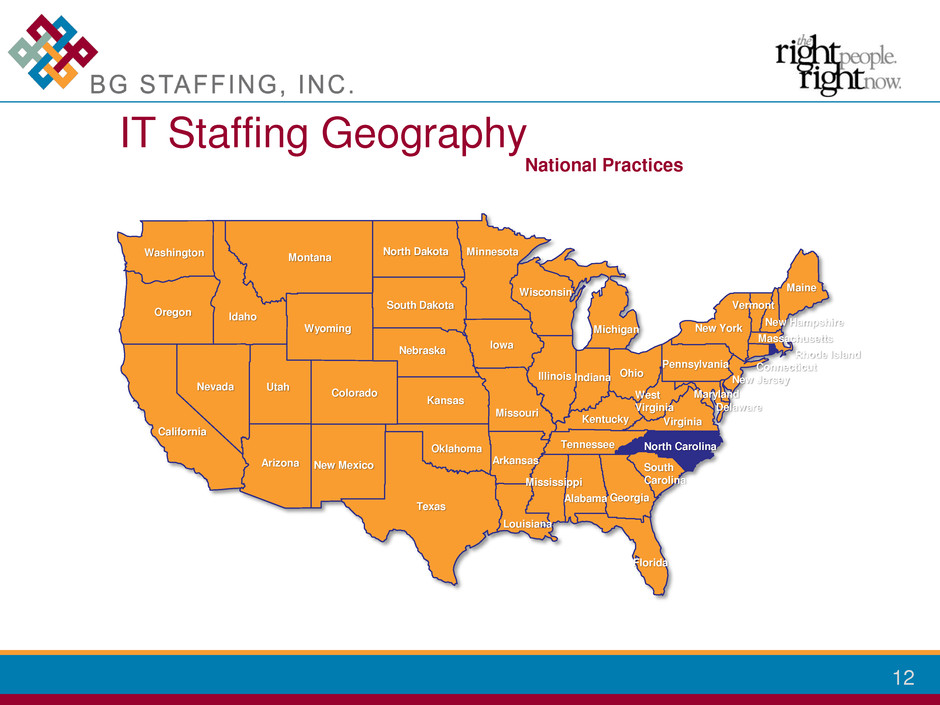
12 IT Staffing Geography Colorado Kansas New Mexico Arizona California Oklahoma Texas Missouri Louisiana Mississippi Alabama Georgia Florida South Carolina North Carolina Tennessee Kentucky Virginia West Virginia Michigan Ohio Indiana Illinois Iowa Wisconsin Minnesota Arkansas Nebraska Wyoming South Dakota North Dakota Montana Utah Idaho Nevada Oregon Washington Pennsylvania New York Maine New Jersey Rhode Island Connecticut Massachusetts Vermont New Hampshire Delaware Maryland National Practices
13 Finance & Accounting Primary Skills Offered • Purchasing Positions • Treasury Positions • HR Positions • Admin Positions • Controllers • Accountants – Tax, SEC, Analysts – Oil & Gas • Clerks to Managers – AP, AR, GL – Payroll, Inventory • Facilities Positions
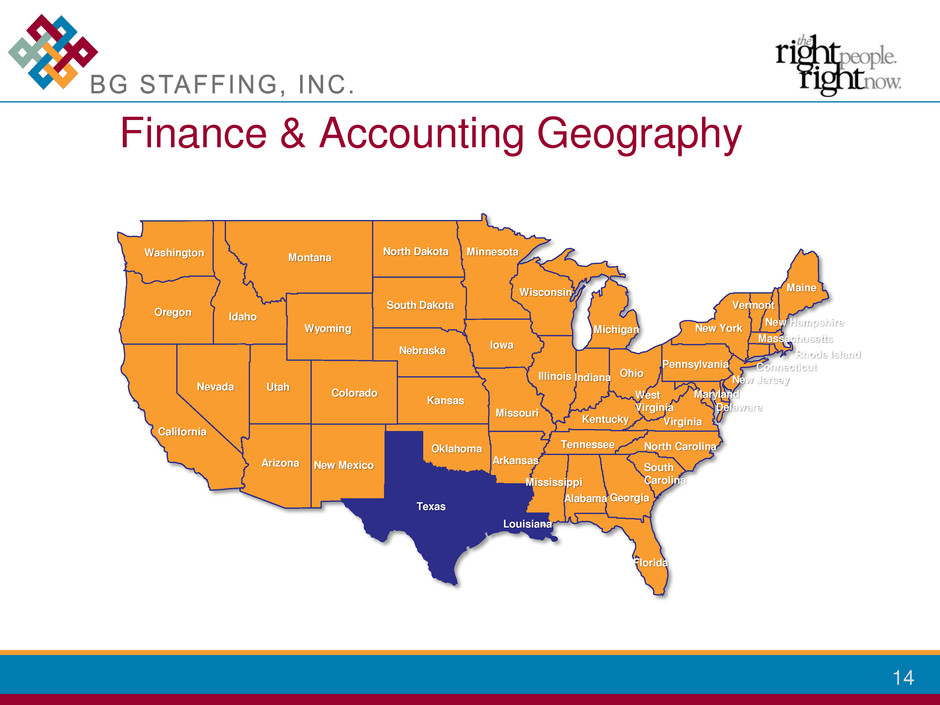
14 Finance & Accounting Geography Colorado Kansas New Mexico Arizona California Oklahoma Texas Missouri Louisiana Mississippi Alabama Georgia Florida South Carolina North Carolina Tennessee Kentucky Virginia West Virginia Michigan Ohio Indiana Illinois Iowa Wisconsin Minnesota Arkansas Nebraska Wyoming South Dakota North Dakota Montana Utah Idaho Nevada Oregon Washington Pennsylvania New York Maine New Jersey Rhode Island Connecticut Massachusetts Vermont New Hampshire Delaware Maryland
15 Forklift Drivers Pickers/Packers Production workers Light Assembly Light Manufacturing General Labor Commercial Primary Skills Offered
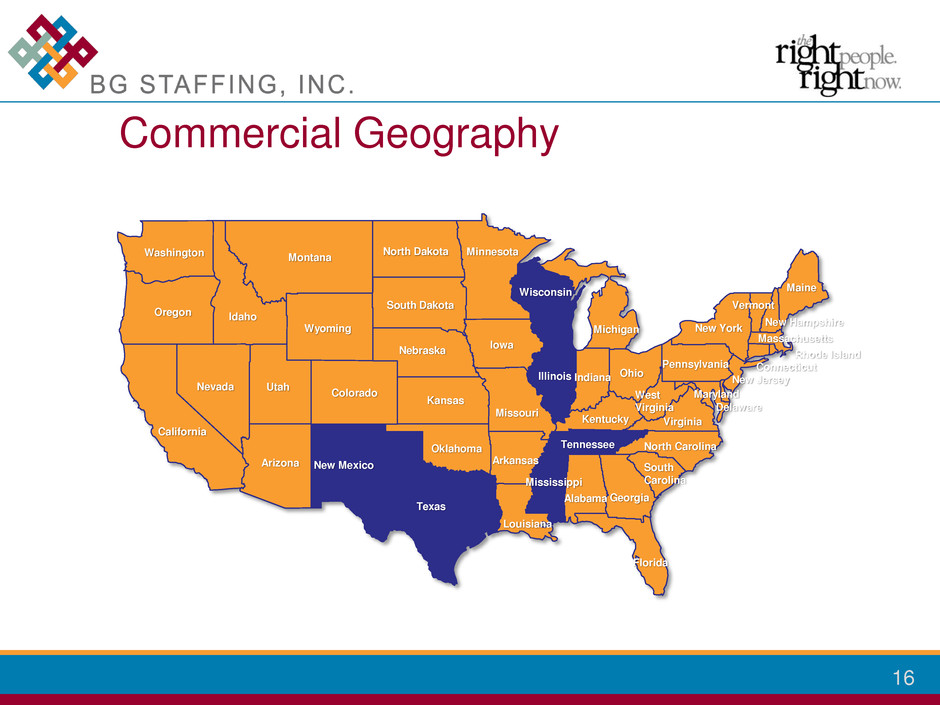
16 Commercial Geography Colorado Kansas New Mexico Arizona California Oklahoma Texas Missouri Louisiana Mississippi Alabama Georgia Florida South Carolina North Carolina Tennessee Kentucky Virginia West Virginia Michigan Ohio Indiana Illinois Iowa Wisconsin Minnesota Arkansas Nebraska Wyoming South Dakota North Dakota Montana Utah Idaho Nevada Oregon Washington Pennsylvania New York Maine New Jersey Rhode Island Connecticut Massachusetts Vermont New Hampshire Delaware Maryland
17 2010-BG Staffing (Price $3M; LTM COH $4.56M). Multifamily Staffing 2011-Extrinsic (Price $9.9M; LTM COH $1.52M). IT Staffing (Primarily SAP) 2012–American Partners(Price $13.23M; LTM COH $3.58M). IT Staffing (Primarily Oracle and Hyperion BI) 2013–InStaff (Price ($10.00M; LTM COH $3.33M). Commercial Staffing 2015-Donovan&Watkins (Price $12M; LTM Proforma $3.21M). Finance & Accounting Staffing Accretive Acquisitions Include:
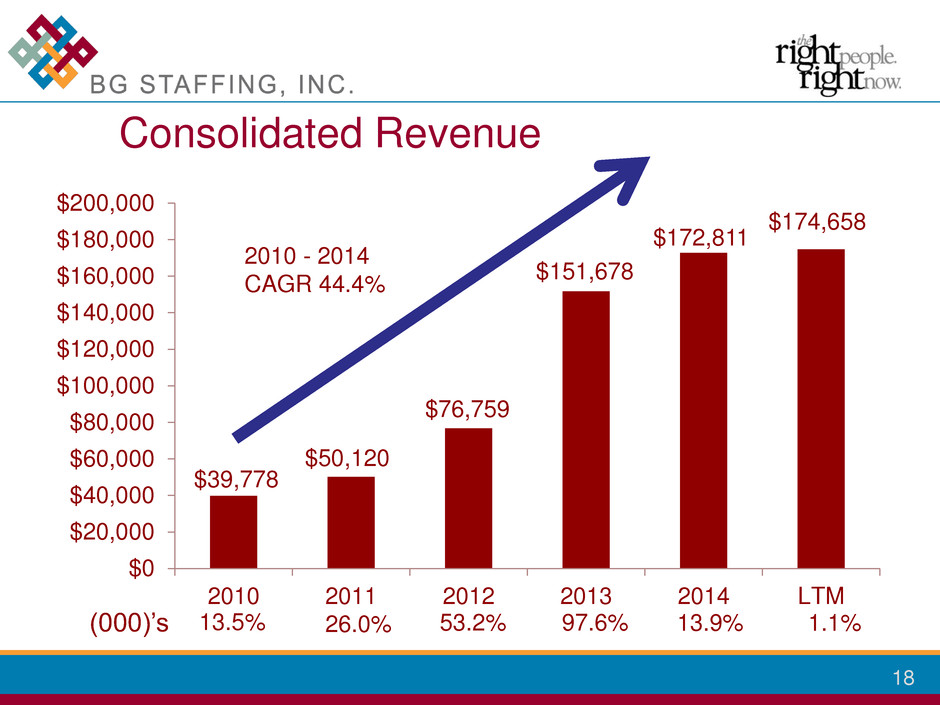
18 $39,778 $50,120 $76,759 $151,678 $172,811 $174,658 $0 $20,000 $40,000 $60,000 $80,000 $100,000 $120,000 $140,000 $160,000 $180,000 $200,000 2010 2011 2012 2013 2014 LTM Consolidated Revenue 13.5% 26.0% 53.2% 97.6% (000)’s 13.9% 2010 - 2014 CAGR 44.4% 1.1%
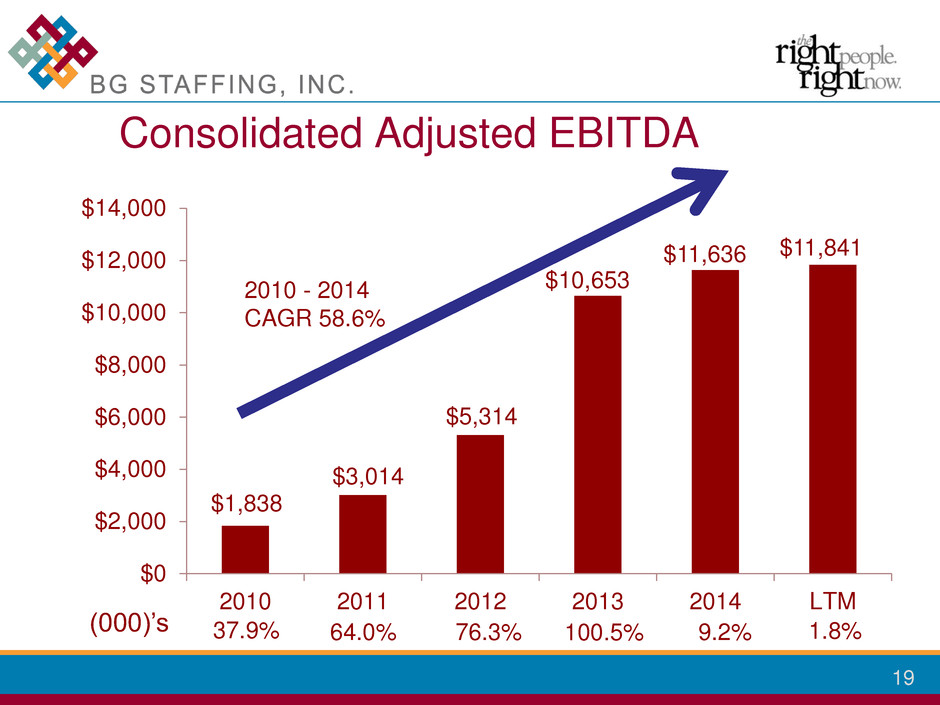
19 $1,838 $3,014 $5,314 $10,653 $11,636 $11,841 $0 $2,000 $4,000 $6,000 $8,000 $10,000 $12,000 $14,000 2010 2011 2012 2013 2014 LTM Consolidated Adjusted EBITDA 37.9% 64.0% 76.3% 100.5% 9.2% (000)’s 2010 - 2014 CAGR 58.6% 1.8%
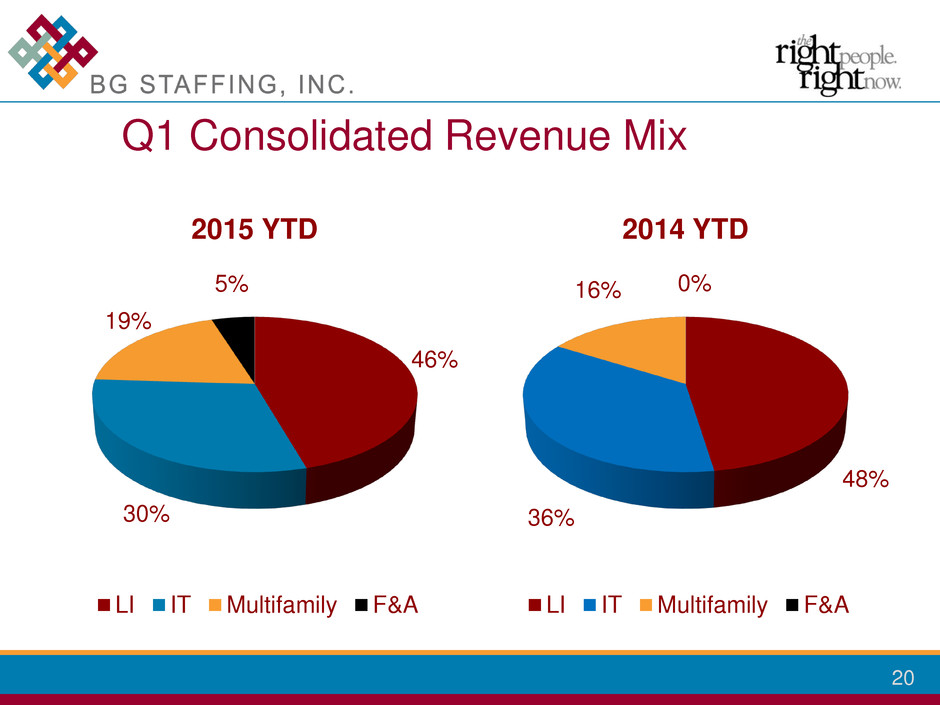
20 46% 30% 19% 5% 2015 YTD LI IT Multifamily F&A 48% 36% 16% 0% 2014 YTD LI IT Multifamily F&A Q1 Consolidated Revenue Mix
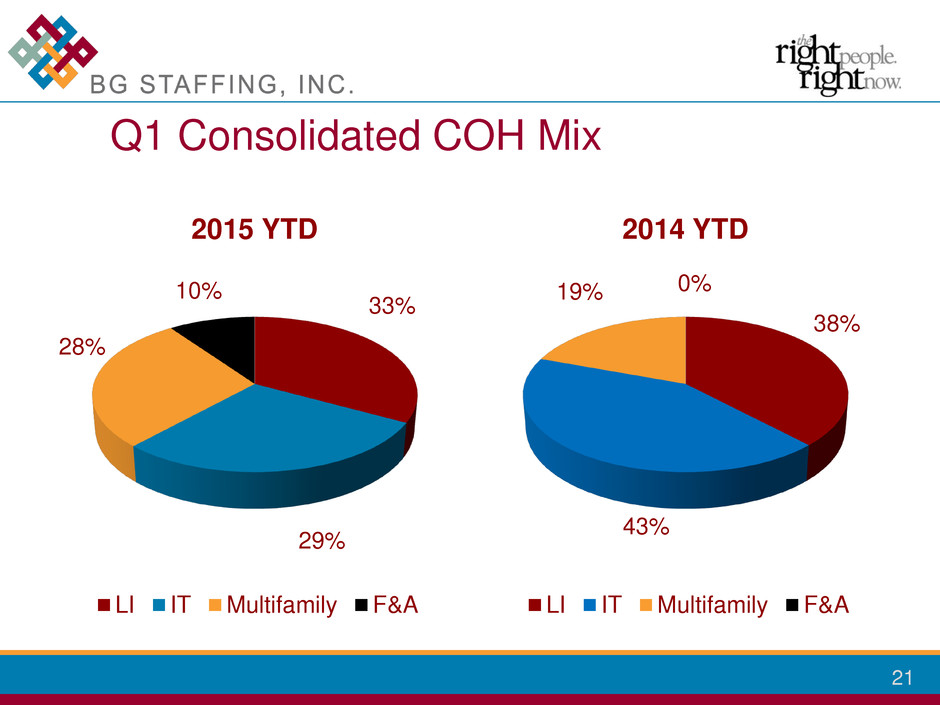
21 33% 29% 28% 10% 2015 YTD LI IT Multifamily F&A 38% 43% 19% 0% 2014 YTD LI IT Multifamily F&A Q1 Consolidated COH Mix
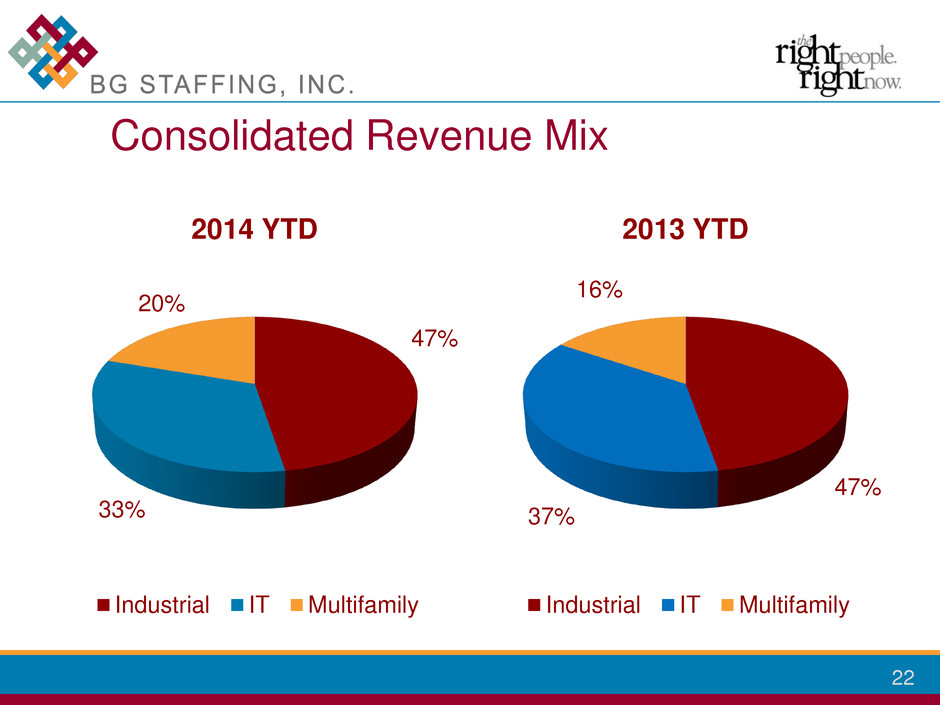
22 47% 33% 20% 2014 YTD Industrial IT Multifamily 47% 37% 16% 2013 YTD Industrial IT Multifamily Consolidated Revenue Mix
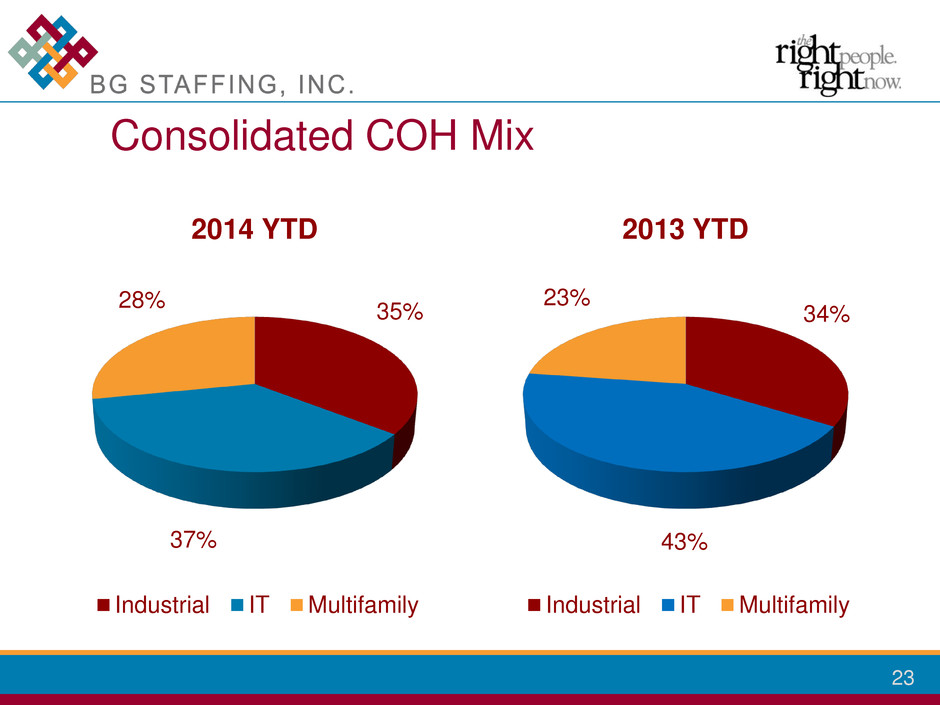
23 35% 37% 28% 2014 YTD Industrial IT Multifamily 34% 43% 23% 2013 YTD Industrial IT Multifamily Consolidated COH Mix
24 Staffing Industry Update
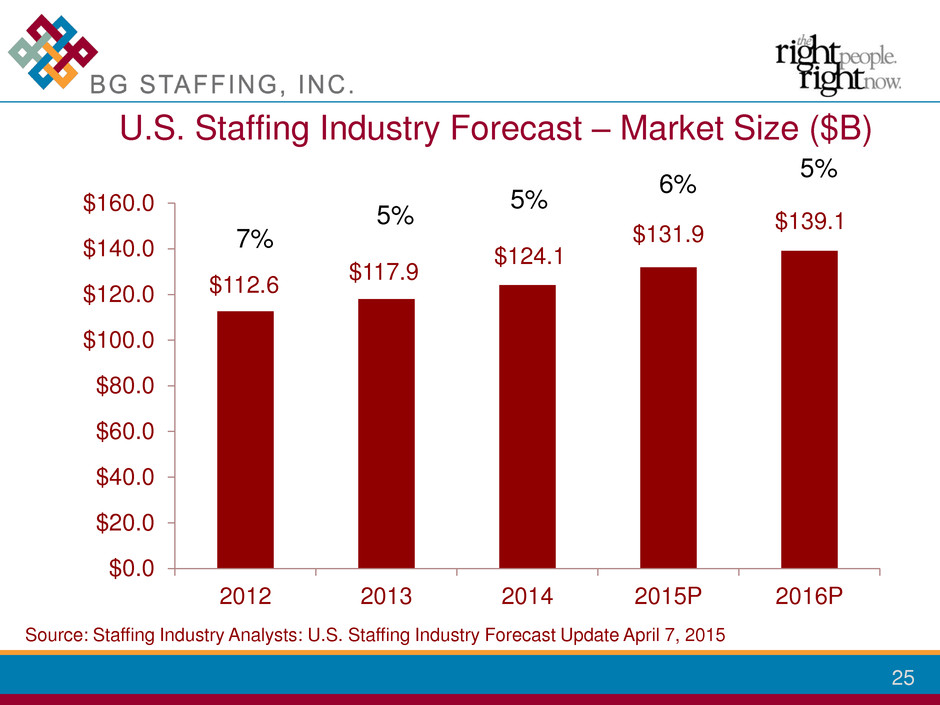
25 $112.6 $117.9 $124.1 $131.9 $139.1 $0.0 $20.0 $40.0 $60.0 $80.0 $100.0 $120.0 $140.0 $160.0 2012 2013 2014 2015P 2016P U.S. Staffing Industry Forecast – Market Size ($B) Source: Staffing Industry Analysts: U.S. Staffing Industry Forecast Update April 7, 2015 5% 6% 5% 5% 7%
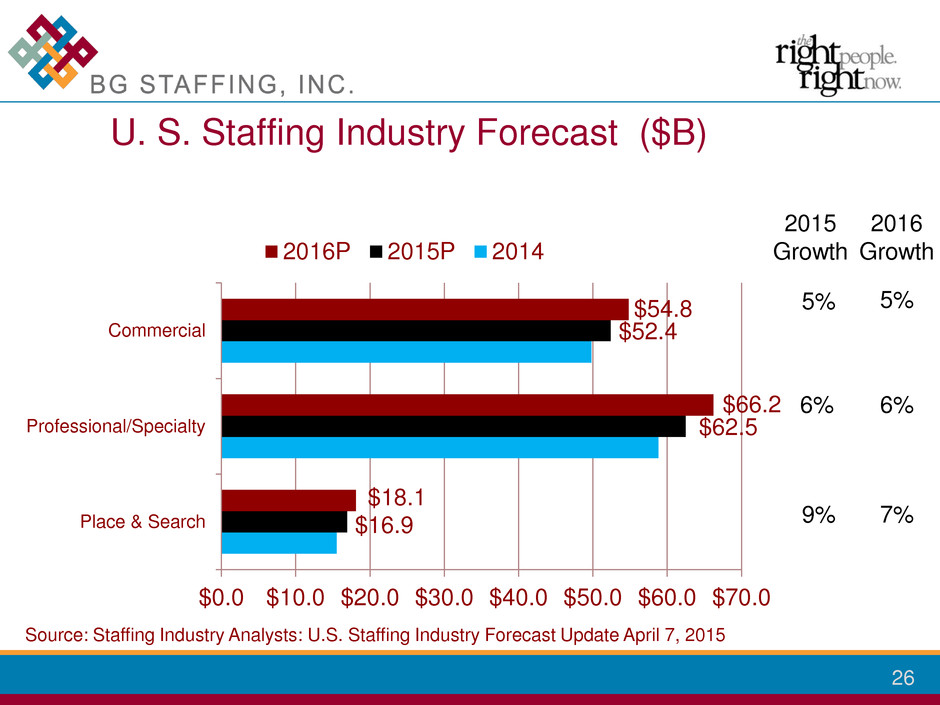
26 $16.9 $62.5 $52.4 $18.1 $66.2 $54.8 $0.0 $10.0 $20.0 $30.0 $40.0 $50.0 $60.0 $70.0 Place & Search Professional/Specialty Commercial 2016P 2015P 2014 U. S. Staffing Industry Forecast ($B) 5% 2015 Growth 2016 Growth 5% 6% 7% 6% 9% Source: Staffing Industry Analysts: U.S. Staffing Industry Forecast Update April 7, 2015
27 “Growth in the staffing industry is strongly correlated with GDP growth,” according to research from Staffing Industry Analysts (October 30, 2014). Correlation of Economy and Staffing
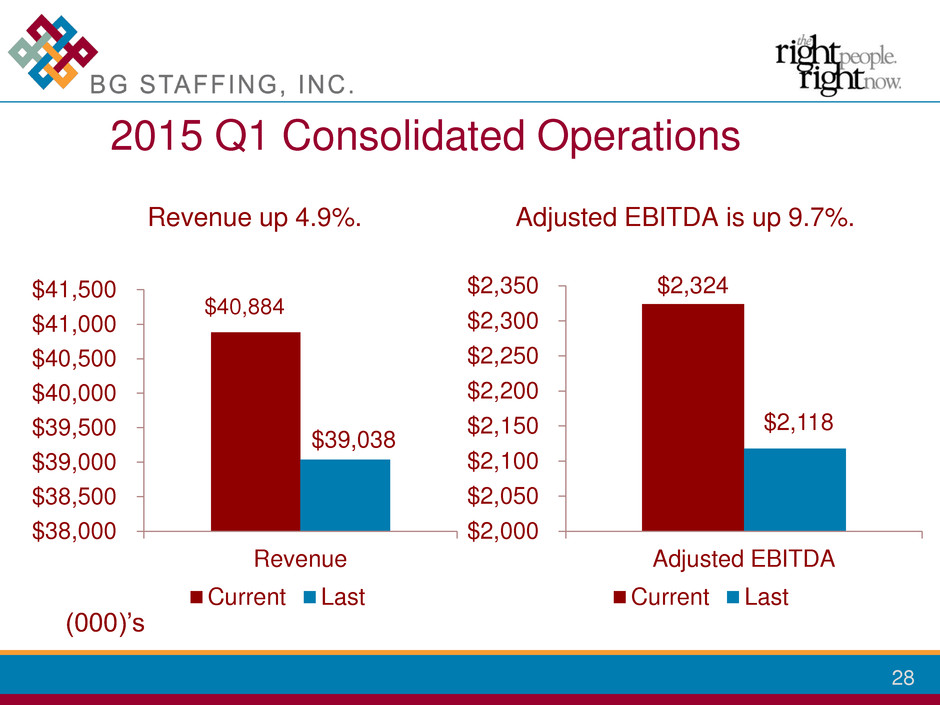
28 Revenue up 4.9%. $40,884 $39,038 $38,000 $38,500 $39,000 $39,500 $40,000 $40,500 $41,000 $41,500 Revenue Current Last Adjusted EBITDA is up 9.7%. $2,324 $2,118 $2,000 $2,050 $2,100 $2,150 $2,200 $2,250 $2,300 $2,350 Adjusted EBITDA Current Last 2015 Q1 Consolidated Operations (000)’s
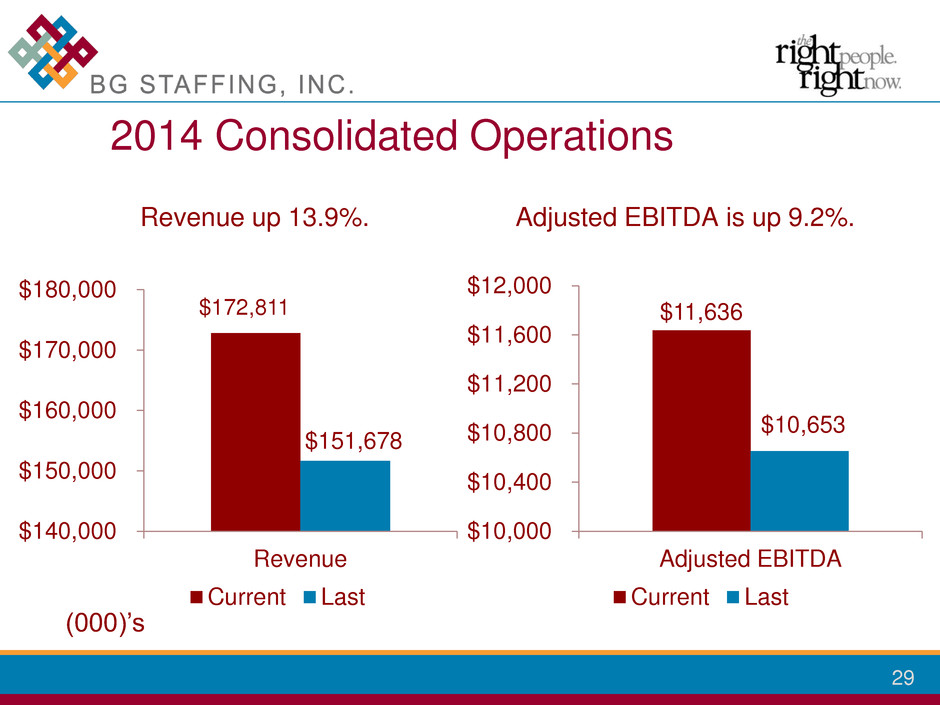
29 Revenue up 13.9%. $172,811 $151,678 $140,000 $150,000 $160,000 $170,000 $180,000 Revenue Current Last Adjusted EBITDA is up 9.2%. $11,636 $10,653 $10,000 $10,400 $10,800 $11,200 $11,600 $12,000 Adjusted EBITDA Current Last 2014 Consolidated Operations (000)’s
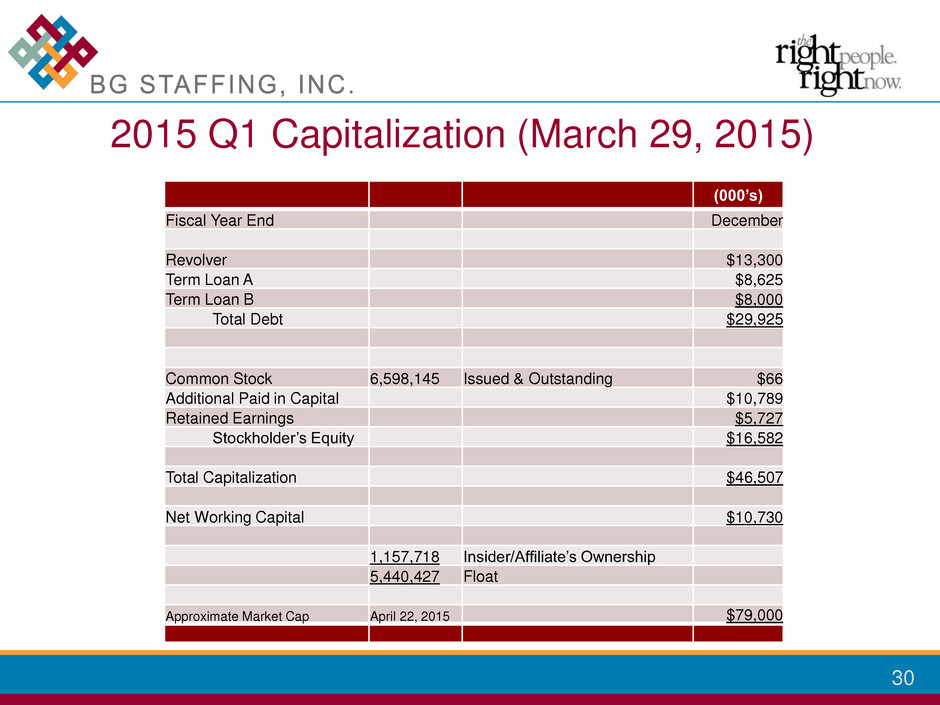
30 (000’s) Fiscal Year End December Revolver $13,300 Term Loan A $8,625 Term Loan B $8,000 Total Debt $29,925 Common Stock 6,598,145 Issued & Outstanding $66 Additional Paid in Capital $10,789 Retained Earnings $5,727 Stockholder’s Equity $16,582 Total Capitalization $46,507 Net Working Capital $10,730 1,157,718 Insider/Affiliate’s Ownership 5,440,427 Float Approximate Market Cap April 22, 2015 $79,000 2015 Q1 Capitalization (March 29, 2015)

31 Contacts Investor Relations: Terri MacInnis, VP of IR Bibicoff + MacInnis, Inc. 818-379-8500 terri@bibimac.com Company: Michael Rutledge, CFO BG Staffing, Inc. 972-692-2422 mrutledge@bgstaffing.com


