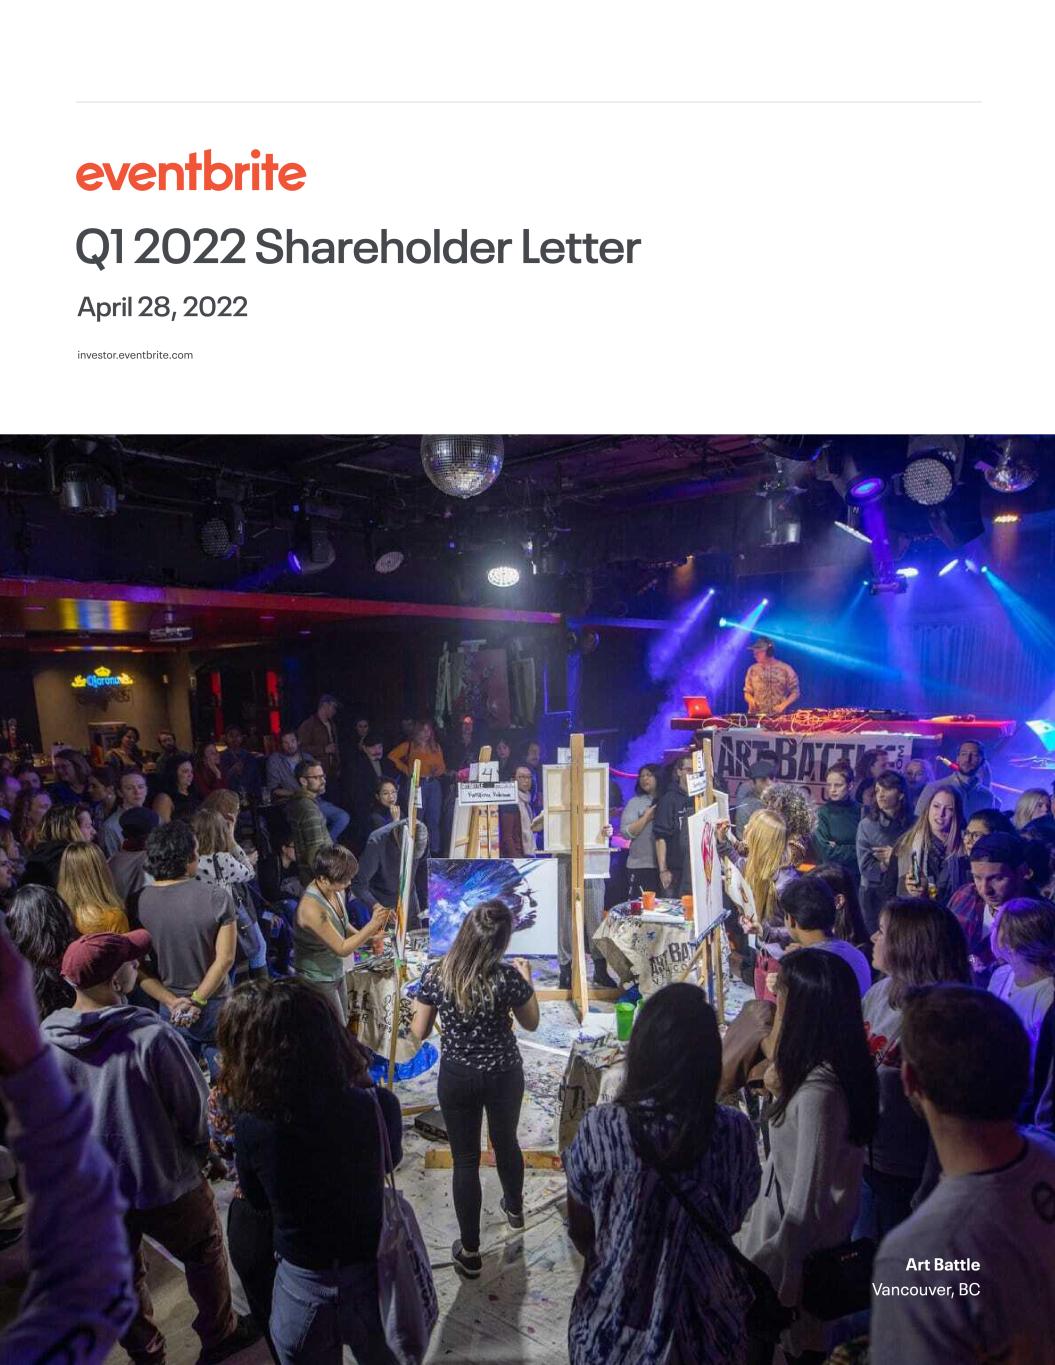
Q1 2022 Shareholder Letter April 28, 2022 investor.eventbrite.com Art Battle Vancouver, BC
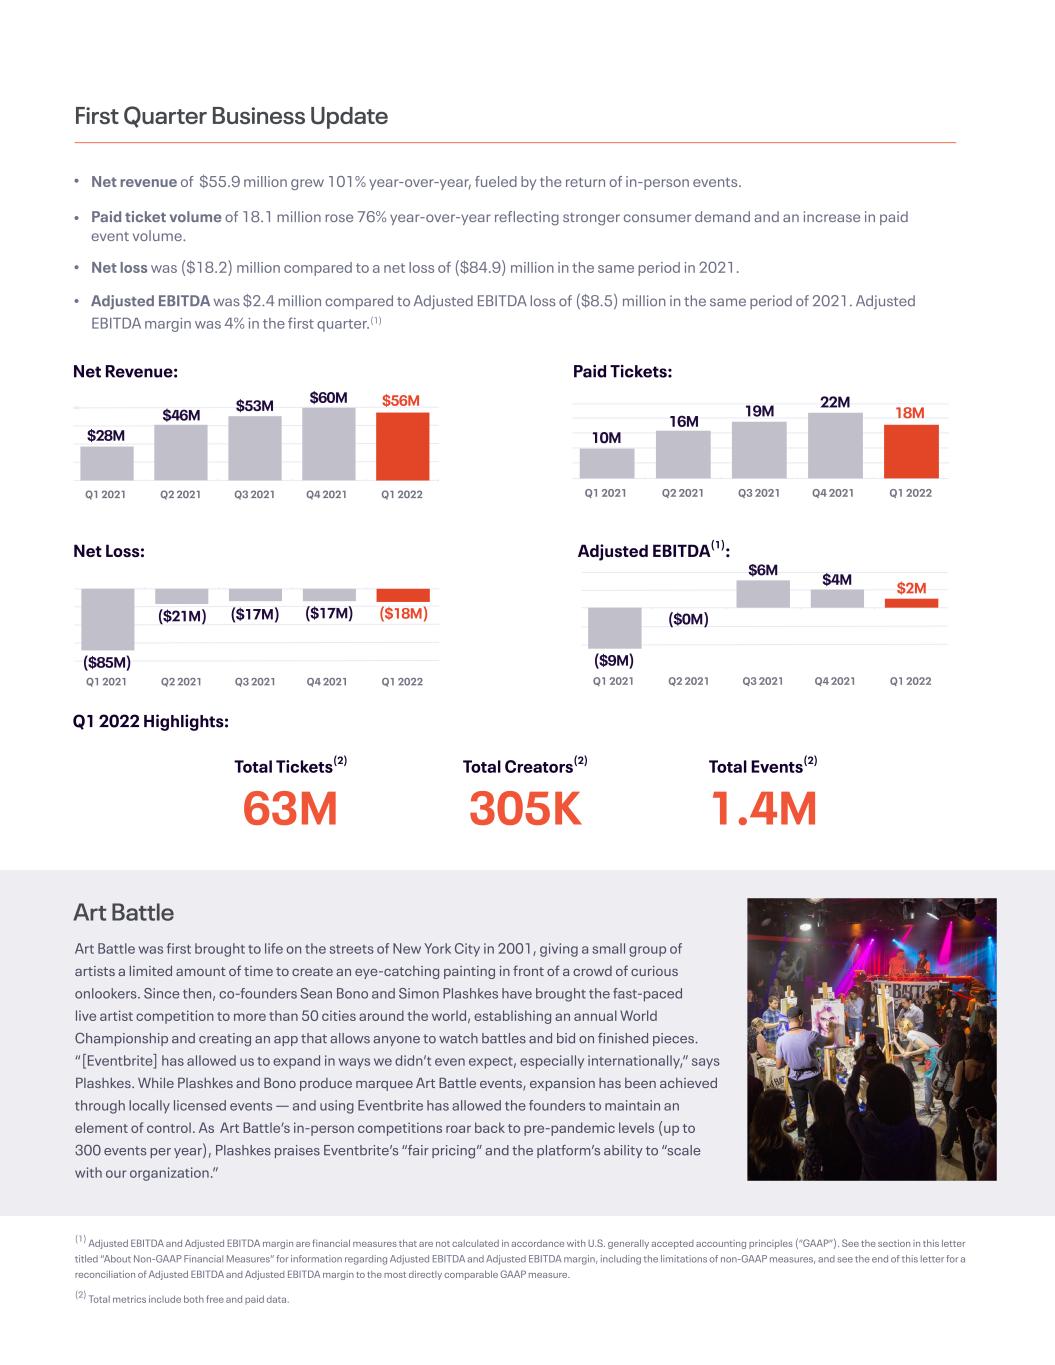
Adjusted EBITDA(1): First Quarter Business Update Net Revenue: Q1 2022 Highlights: Paid Tickets: Net revenue of $55.9 million grew 101% year-over-year, fueled by the return of in-person events. Paid ticket volume of 18.1 million rose 76% year-over-year reflecting stronger consumer demand and an increase in paid event volume. Net loss was ($18.2) million compared to a net loss of ($84.9) million in the same period in 2021. Adjusted EBITDA was $2.4 million compared to Adjusted EBITDA loss of ($8.5) million in the same period of 2021. Adjusted EBITDA margin was 4% in the first quarter.(1) Net Loss: Total Tickets(2) 63M Art Battle Art Battle was first brought to life on the streets of New York City in 2001, giving a small group of artists a limited amount of time to create an eye-catching painting in front of a crowd of curious onlookers. Since then, co-founders Sean Bono and Simon Plashkes have brought the fast-paced live artist competition to more than 50 cities around the world, establishing an annual World Championship and creating an app that allows anyone to watch battles and bid on finished pieces. “[Eventbrite] has allowed us to expand in ways we didn’t even expect, especially internationally,” says Plashkes. While Plashkes and Bono produce marquee Art Battle events, expansion has been achieved through locally licensed events — and using Eventbrite has allowed the founders to maintain an element of control. As Art Battle’s in-person competitions roar back to pre-pandemic levels (up to 300 events per year), Plashkes praises Eventbrite’s “fair pricing” and the platform’s ability to “scale with our organization.” (1) Adjusted EBITDA and Adjusted EBITDA margin are financial measures that are not calculated in accordance with U.S. generally accepted accounting principles (“GAAP”). See the section in this letter titled “About Non-GAAP Financial Measures” for information regarding Adjusted EBITDA and Adjusted EBITDA margin, including the limitations of non-GAAP measures, and see the end of this letter for a reconciliation of Adjusted EBITDA and Adjusted EBITDA margin to the most directly comparable GAAP measure. (2) Total metrics include both free and paid data. Q1 2022Q4 2021Q3 2021Q2 2021Q1 2021 $28M $46M $53M $60M $56M Q1 2022Q4 2021Q3 2021Q2 2021Q1 2021 ($85M) ($21M) ($17M) ($17M) ($18M) Q1 2022Q4 2021Q3 2021Q2 2021Q1 2021 10M 16M 19M 22M 18M Q1 2022Q4 2021Q3 2021Q2 2021Q1 2021 ($9M) ($0M) $6M $4M $2M Total Creators(2) 305K Total Events(2) 1.4M
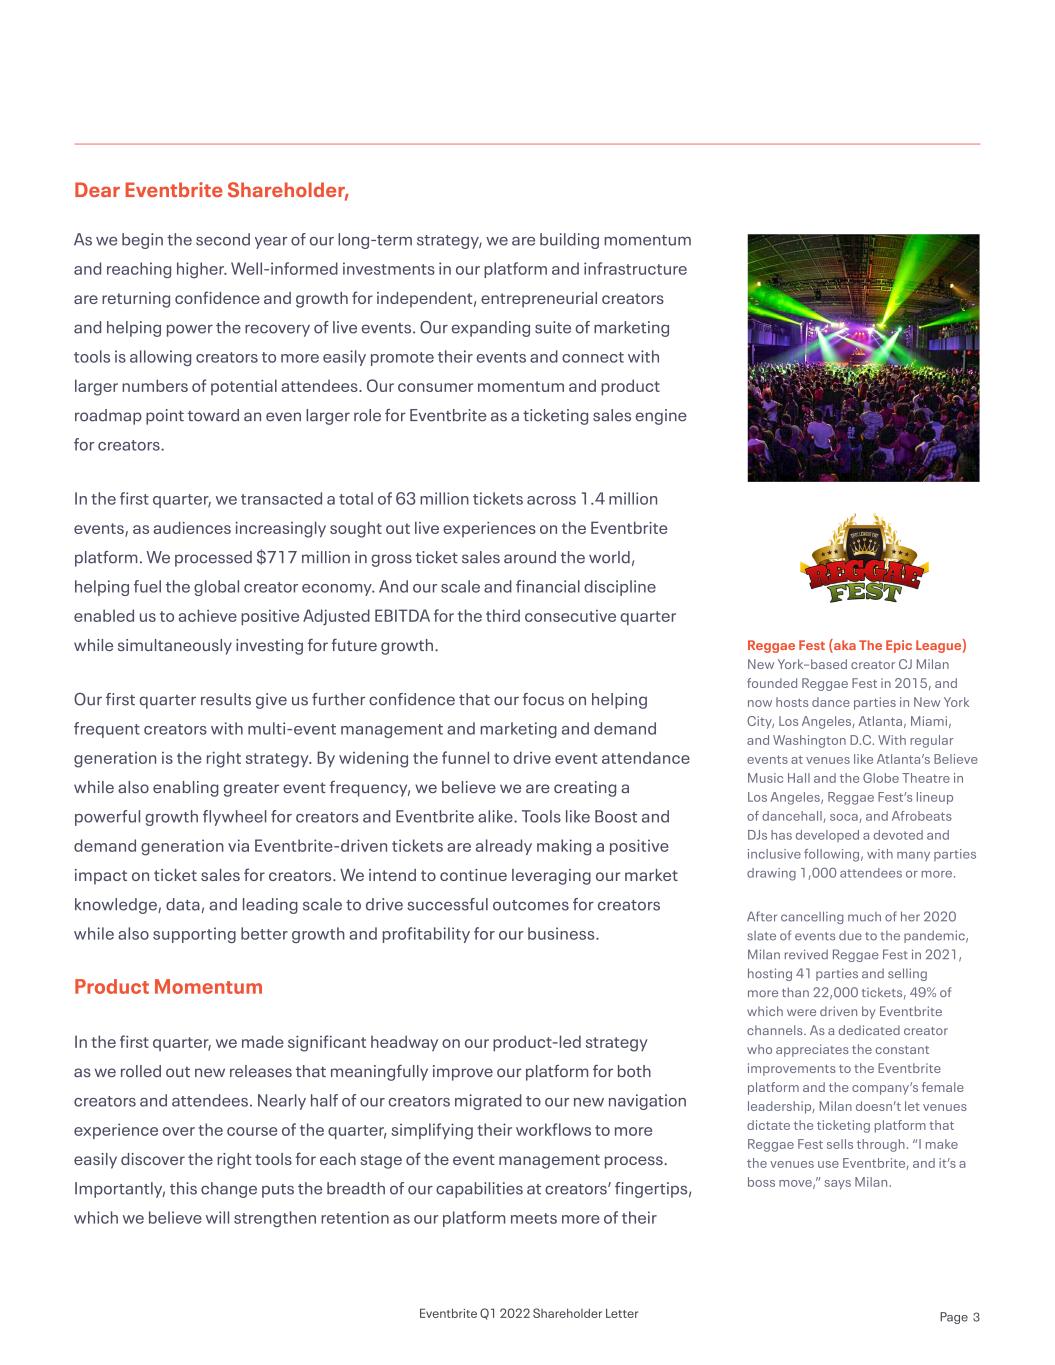
Dear Eventbrite Shareholder, As we begin the second year of our long-term strategy, we are building momentum and reaching higher. Well-informed investments in our platform and infrastructure are returning confidence and growth for independent, entrepreneurial creators and helping power the recovery of live events. Our expanding suite of marketing tools is allowing creators to more easily promote their events and connect with larger numbers of potential attendees. Our consumer momentum and product roadmap point toward an even larger role for Eventbrite as a ticketing sales engine for creators. In the first quarter, we transacted a total of 63 million tickets across 1.4 million events, as audiences increasingly sought out live experiences on the Eventbrite platform. We processed $717 million in gross ticket sales around the world, helping fuel the global creator economy. And our scale and financial discipline enabled us to achieve positive Adjusted EBITDA for the third consecutive quarter while simultaneously investing for future growth. Our first quarter results give us further confidence that our focus on helping frequent creators with multi-event management and marketing and demand generation is the right strategy. By widening the funnel to drive event attendance while also enabling greater event frequency, we believe we are creating a powerful growth flywheel for creators and Eventbrite alike. Tools like Boost and demand generation via Eventbrite-driven tickets are already making a positive impact on ticket sales for creators. We intend to continue leveraging our market knowledge, data, and leading scale to drive successful outcomes for creators while also supporting better growth and profitability for our business. Product Momentum In the first quarter, we made significant headway on our product-led strategy as we rolled out new releases that meaningfully improve our platform for both creators and attendees. Nearly half of our creators migrated to our new navigation experience over the course of the quarter, simplifying their workflows to more easily discover the right tools for each stage of the event management process. Importantly, this change puts the breadth of our capabilities at creators’ fingertips, which we believe will strengthen retention as our platform meets more of their Reggae Fest (aka The Epic League) New York–based creator CJ Milan founded Reggae Fest in 2015, and now hosts dance parties in New York City, Los Angeles, Atlanta, Miami, and Washington D.C. With regular events at venues like Atlanta’s Believe Music Hall and the Globe Theatre in Los Angeles, Reggae Fest’s lineup of dancehall, soca, and Afrobeats DJs has developed a devoted and inclusive following, with many parties drawing 1,000 attendees or more. After cancelling much of her 2020 slate of events due to the pandemic, Milan revived Reggae Fest in 2021, hosting 41 parties and selling more than 22,000 tickets, 49% of which were driven by Eventbrite channels. As a dedicated creator who appreciates the constant improvements to the Eventbrite platform and the company’s female leadership, Milan doesn’t let venues dictate the ticketing platform that Reggae Fest sells through. “I make the venues use Eventbrite, and it’s a boss move,” says Milan. Eventbrite Q1 2022 Shareholder Letter Page 3
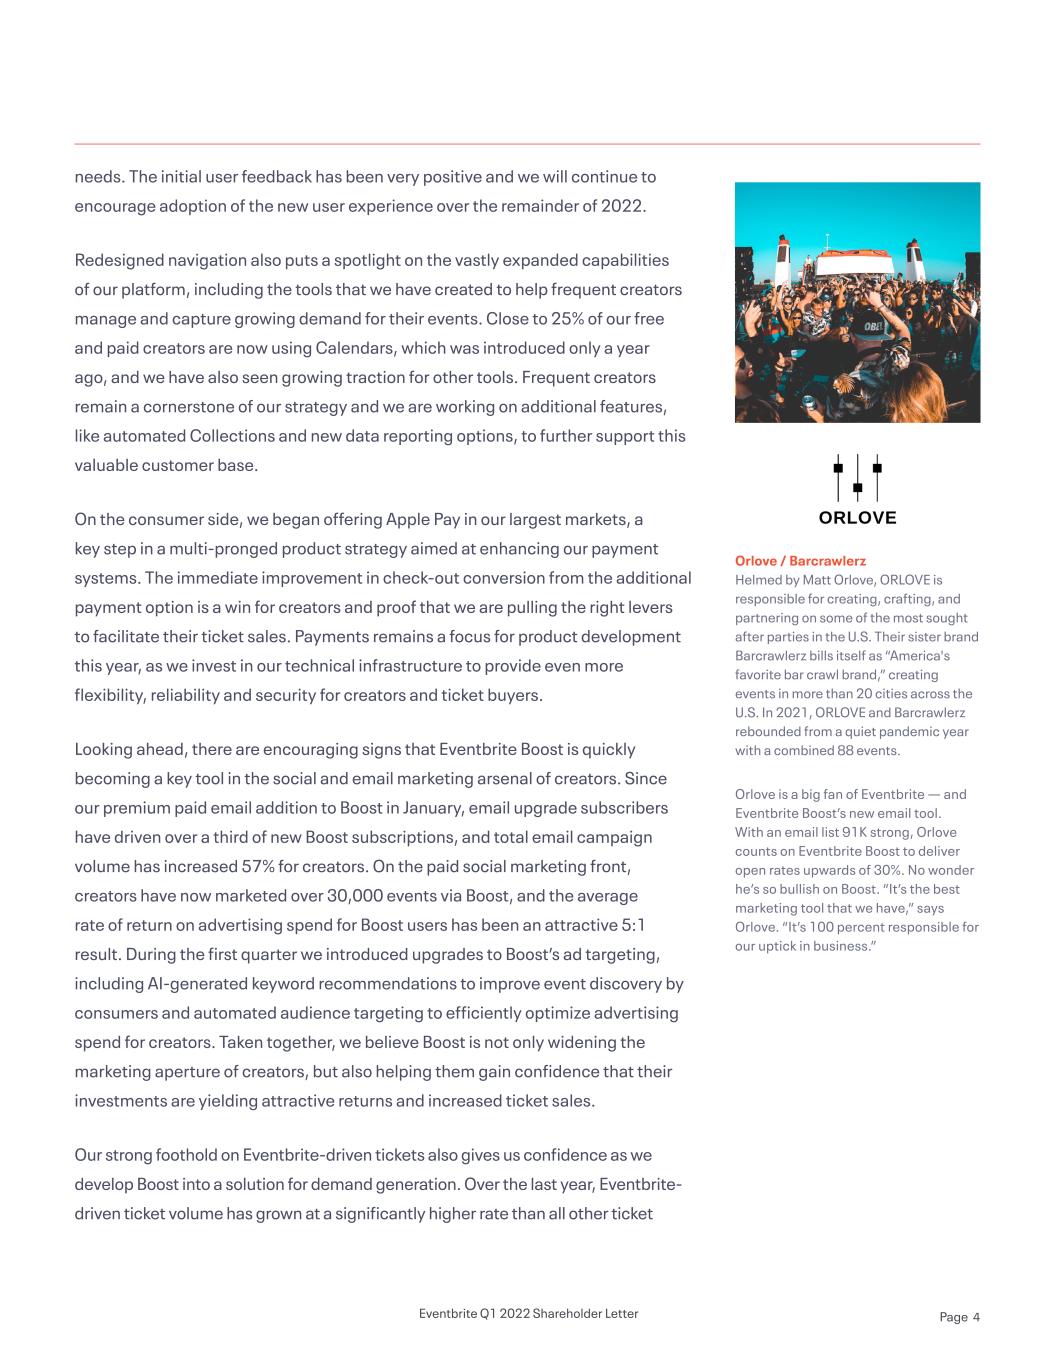
needs. The initial user feedback has been very positive and we will continue to encourage adoption of the new user experience over the remainder of 2022. Redesigned navigation also puts a spotlight on the vastly expanded capabilities of our platform, including the tools that we have created to help frequent creators manage and capture growing demand for their events. Close to 25% of our free and paid creators are now using Calendars, which was introduced only a year ago, and we have also seen growing traction for other tools. Frequent creators remain a cornerstone of our strategy and we are working on additional features, like automated Collections and new data reporting options, to further support this valuable customer base. On the consumer side, we began offering Apple Pay in our largest markets, a key step in a multi-pronged product strategy aimed at enhancing our payment systems. The immediate improvement in check-out conversion from the additional payment option is a win for creators and proof that we are pulling the right levers to facilitate their ticket sales. Payments remains a focus for product development this year, as we invest in our technical infrastructure to provide even more flexibility, reliability and security for creators and ticket buyers. Looking ahead, there are encouraging signs that Eventbrite Boost is quickly becoming a key tool in the social and email marketing arsenal of creators. Since our premium paid email addition to Boost in January, email upgrade subscribers have driven over a third of new Boost subscriptions, and total email campaign volume has increased 57% for creators. On the paid social marketing front, creators have now marketed over 30,000 events via Boost, and the average rate of return on advertising spend for Boost users has been an attractive 5:1 result. During the first quarter we introduced upgrades to Boost’s ad targeting, including AI-generated keyword recommendations to improve event discovery by consumers and automated audience targeting to efficiently optimize advertising spend for creators. Taken together, we believe Boost is not only widening the marketing aperture of creators, but also helping them gain confidence that their investments are yielding attractive returns and increased ticket sales. Our strong foothold on Eventbrite-driven tickets also gives us confidence as we develop Boost into a solution for demand generation. Over the last year, Eventbrite- driven ticket volume has grown at a significantly higher rate than all other ticket Orlove / Barcrawlerz Helmed by Matt Orlove, ORLOVE is responsible for creating, crafting, and partnering on some of the most sought after parties in the U.S. Their sister brand Barcrawlerz bills itself as “America's favorite bar crawl brand,” creating events in more than 20 cities across the U.S. In 2021, ORLOVE and Barcrawlerz rebounded from a quiet pandemic year with a combined 88 events. Orlove is a big fan of Eventbrite — and Eventbrite Boost’s new email tool. With an email list 91K strong, Orlove counts on Eventbrite Boost to deliver open rates upwards of 30%. No wonder he’s so bullish on Boost. “It’s the best marketing tool that we have,” says Orlove. “It’s 100 percent responsible for our uptick in business.” Eventbrite Q1 2022 Shareholder Letter Page 4
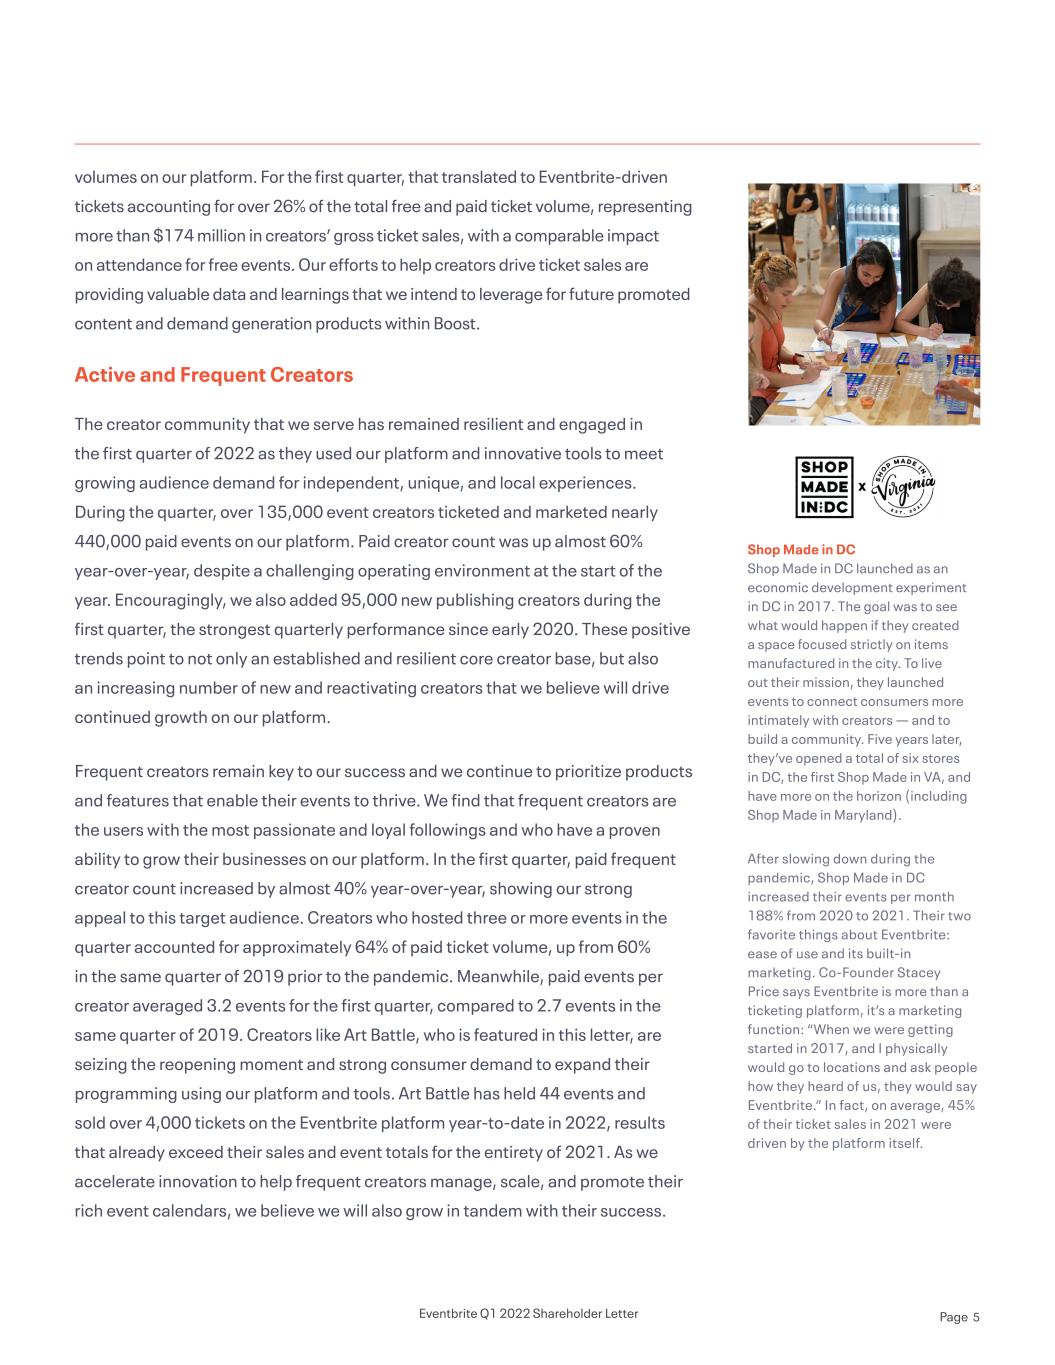
volumes on our platform. For the first quarter, that translated to Eventbrite-driven tickets accounting for over 26% of the total free and paid ticket volume, representing more than $174 million in creators’ gross ticket sales, with a comparable impact on attendance for free events. Our efforts to help creators drive ticket sales are providing valuable data and learnings that we intend to leverage for future promoted content and demand generation products within Boost. Active and Frequent Creators The creator community that we serve has remained resilient and engaged in the first quarter of 2022 as they used our platform and innovative tools to meet growing audience demand for independent, unique, and local experiences. During the quarter, over 135,000 event creators ticketed and marketed nearly 440,000 paid events on our platform. Paid creator count was up almost 60% year-over-year, despite a challenging operating environment at the start of the year. Encouragingly, we also added 95,000 new publishing creators during the first quarter, the strongest quarterly performance since early 2020. These positive trends point to not only an established and resilient core creator base, but also an increasing number of new and reactivating creators that we believe will drive continued growth on our platform. Frequent creators remain key to our success and we continue to prioritize products and features that enable their events to thrive. We find that frequent creators are the users with the most passionate and loyal followings and who have a proven ability to grow their businesses on our platform. In the first quarter, paid frequent creator count increased by almost 40% year-over-year, showing our strong appeal to this target audience. Creators who hosted three or more events in the quarter accounted for approximately 64% of paid ticket volume, up from 60% in the same quarter of 2019 prior to the pandemic. Meanwhile, paid events per creator averaged 3.2 events for the first quarter, compared to 2.7 events in the same quarter of 2019. Creators like Art Battle, who is featured in this letter, are seizing the reopening moment and strong consumer demand to expand their programming using our platform and tools. Art Battle has held 44 events and sold over 4,000 tickets on the Eventbrite platform year-to-date in 2022, results that already exceed their sales and event totals for the entirety of 2021. As we accelerate innovation to help frequent creators manage, scale, and promote their rich event calendars, we believe we will also grow in tandem with their success. Shop Made in DC Shop Made in DC launched as an economic development experiment in DC in 2017. The goal was to see what would happen if they created a space focused strictly on items manufactured in the city. To live out their mission, they launched events to connect consumers more intimately with creators — and to build a community. Five years later, they’ve opened a total of six stores in DC, the first Shop Made in VA, and have more on the horizon (including Shop Made in Maryland). After slowing down during the pandemic, Shop Made in DC increased their events per month 188% from 2020 to 2021. Their two favorite things about Eventbrite: ease of use and its built-in marketing. Co-Founder Stacey Price says Eventbrite is more than a ticketing platform, it’s a marketing function: “When we were getting started in 2017, and I physically would go to locations and ask people how they heard of us, they would say Eventbrite.” In fact, on average, 45% of their ticket sales in 2021 were driven by the platform itself. Eventbrite Q1 2022 Shareholder Letter Page 5
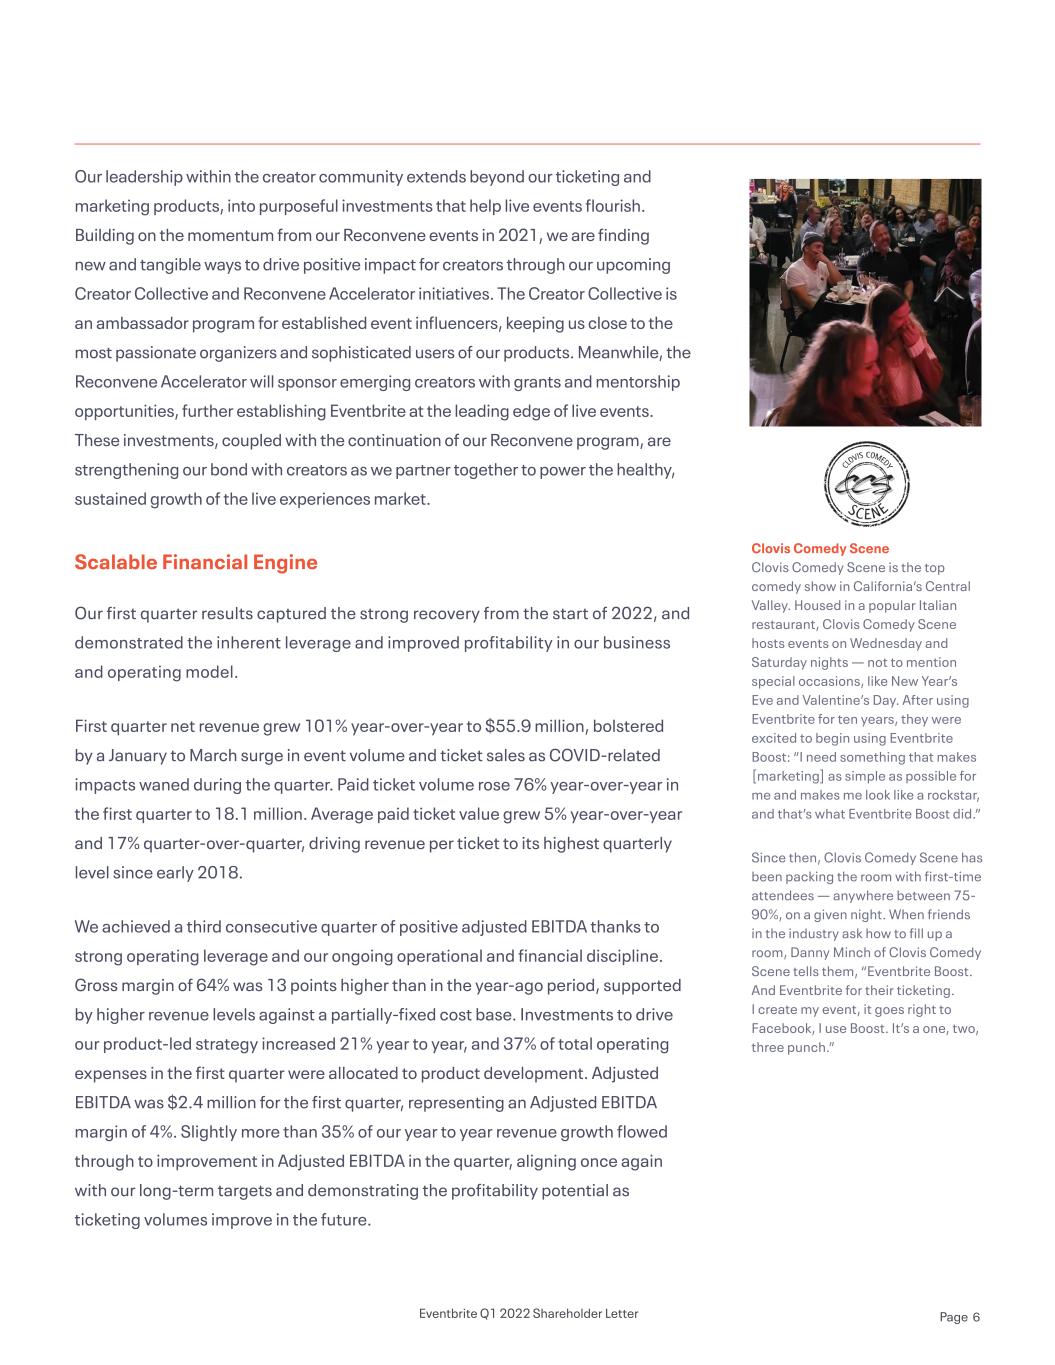
Our leadership within the creator community extends beyond our ticketing and marketing products, into purposeful investments that help live events flourish. Building on the momentum from our Reconvene events in 2021, we are finding new and tangible ways to drive positive impact for creators through our upcoming Creator Collective and Reconvene Accelerator initiatives. The Creator Collective is an ambassador program for established event influencers, keeping us close to the most passionate organizers and sophisticated users of our products. Meanwhile, the Reconvene Accelerator will sponsor emerging creators with grants and mentorship opportunities, further establishing Eventbrite at the leading edge of live events. These investments, coupled with the continuation of our Reconvene program, are strengthening our bond with creators as we partner together to power the healthy, sustained growth of the live experiences market. Scalable Financial Engine Our first quarter results captured the strong recovery from the start of 2022, and demonstrated the inherent leverage and improved profitability in our business and operating model. First quarter net revenue grew 101% year-over-year to $55.9 million, bolstered by a January to March surge in event volume and ticket sales as COVID-related impacts waned during the quarter. Paid ticket volume rose 76% year-over-year in the first quarter to 18.1 million. Average paid ticket value grew 5% year-over-year and 17% quarter-over-quarter, driving revenue per ticket to its highest quarterly level since early 2018. We achieved a third consecutive quarter of positive adjusted EBITDA thanks to strong operating leverage and our ongoing operational and financial discipline. Gross margin of 64% was 13 points higher than in the year-ago period, supported by higher revenue levels against a partially-fixed cost base. Investments to drive our product-led strategy increased 21% year to year, and 37% of total operating expenses in the first quarter were allocated to product development. Adjusted EBITDA was $2.4 million for the first quarter, representing an Adjusted EBITDA margin of 4%. Slightly more than 35% of our year to year revenue growth flowed through to improvement in Adjusted EBITDA in the quarter, aligning once again with our long-term targets and demonstrating the profitability potential as ticketing volumes improve in the future. Clovis Comedy Scene Clovis Comedy Scene is the top comedy show in California’s Central Valley. Housed in a popular Italian restaurant, Clovis Comedy Scene hosts events on Wednesday and Saturday nights — not to mention special occasions, like New Year’s Eve and Valentine’s Day. After using Eventbrite for ten years, they were excited to begin using Eventbrite Boost: “I need something that makes [marketing] as simple as possible for me and makes me look like a rockstar, and that’s what Eventbrite Boost did.” Since then, Clovis Comedy Scene has been packing the room with first-time attendees — anywhere between 75- 90%, on a given night. When friends in the industry ask how to fill up a room, Danny Minch of Clovis Comedy Scene tells them, “Eventbrite Boost. And Eventbrite for their ticketing. I create my event, it goes right to Facebook, I use Boost. It’s a one, two, three punch.” Eventbrite Q1 2022 Shareholder Letter Page 6
Summary The first quarter marked a period of strong and disciplined execution, as we successfully advanced our strategy while thriving during dynamic business conditions. On the product front, we made numerous enhancements that directly improved the product experiences for creators and attendees. Our core creator base was active despite disruptions, and we see signs that new and reactivating creators are increasingly seeking out our solutions as they gain confidence in the recovery of live events. Financially, our operating model continues to support differentiating investments in our product while simultaneously delivering improved profitability. As the basic human need for social and community connections becomes increasingly important, so does our mission to help bring the world together through live events. Creators who have long relied on our technology to confidently and reliably transact tickets are increasingly looking to us to help them engage and grow their audiences. With our product-led strategy and the encouraging momentum of early 2022, we believe we are well-positioned to capitalize on the opportunity to transform beyond the leading ticketing platform to become a ticket sales engine and growth partner for our creators. As we continue to elevate the experience we deliver for creators and meet more of their fundamental business needs, we have confidence that our employees, shareholders and communities stand to benefit as well. Thank you for your support on this journey and we look forward to updating you on our progress. Sincerely, Julia Hartz CEO Lanny Baker CFO Eventbrite Q1 2022 Shareholder Letter Page 7

First Quarter Results All financial comparisons are on a year-over-year basis unless otherwise noted. Financial statement tables can be found at the end of this letter. Net Revenue Net revenue of $55.9 million in the first quarter of 2022 increased 101% as paid ticket volumes improved from the prior period, particularly in the United States. Reported net revenue per paid ticket was $3.09 in the first quarter, compared to $2.72 in the same period in 2021. Revenue per ticket reached its highest quarterly level since early 2018, reflecting higher average ticket values and an improved take rate, as well as a decline in ticket refund activity. Paid Ticket Volume Paid ticket volume of 18.1 million increased 76% as paid creators and paid events both improved from the same quarter in 2021. Paid ticket volume was weakest in the first month of the quarter and improved month-over-month as disruptive effects from the latest variant wave moderated over time. Paid ticket volume for events outside of the U.S. represented 36% of total paid tickets in the first quarter, compared to 39% a year earlier. Paid ticket volume for events in the U.S. increased 85% year-over-year. Gross Profit Gross profit was $35.9 million in the first quarter of 2022 compared to gross profit of $14.1 million from the year-ago period. Gross margin was 64.3%, up 13 points over that comparable period. The improvement in gross margin reflects the improvement in ticket volume and revenue and better cost absorption against our fixed cost base. Financial Discussion Net Revenue: Paid Tickets: Gross Profit: Q1 2022 Q1 2021 $28M $56M Q1 2022 Q1 2021 10M 18M Q1 2022 Q1 2021 $14M $36M Eventbrite Q1 2022 Shareholder Letter Page 8
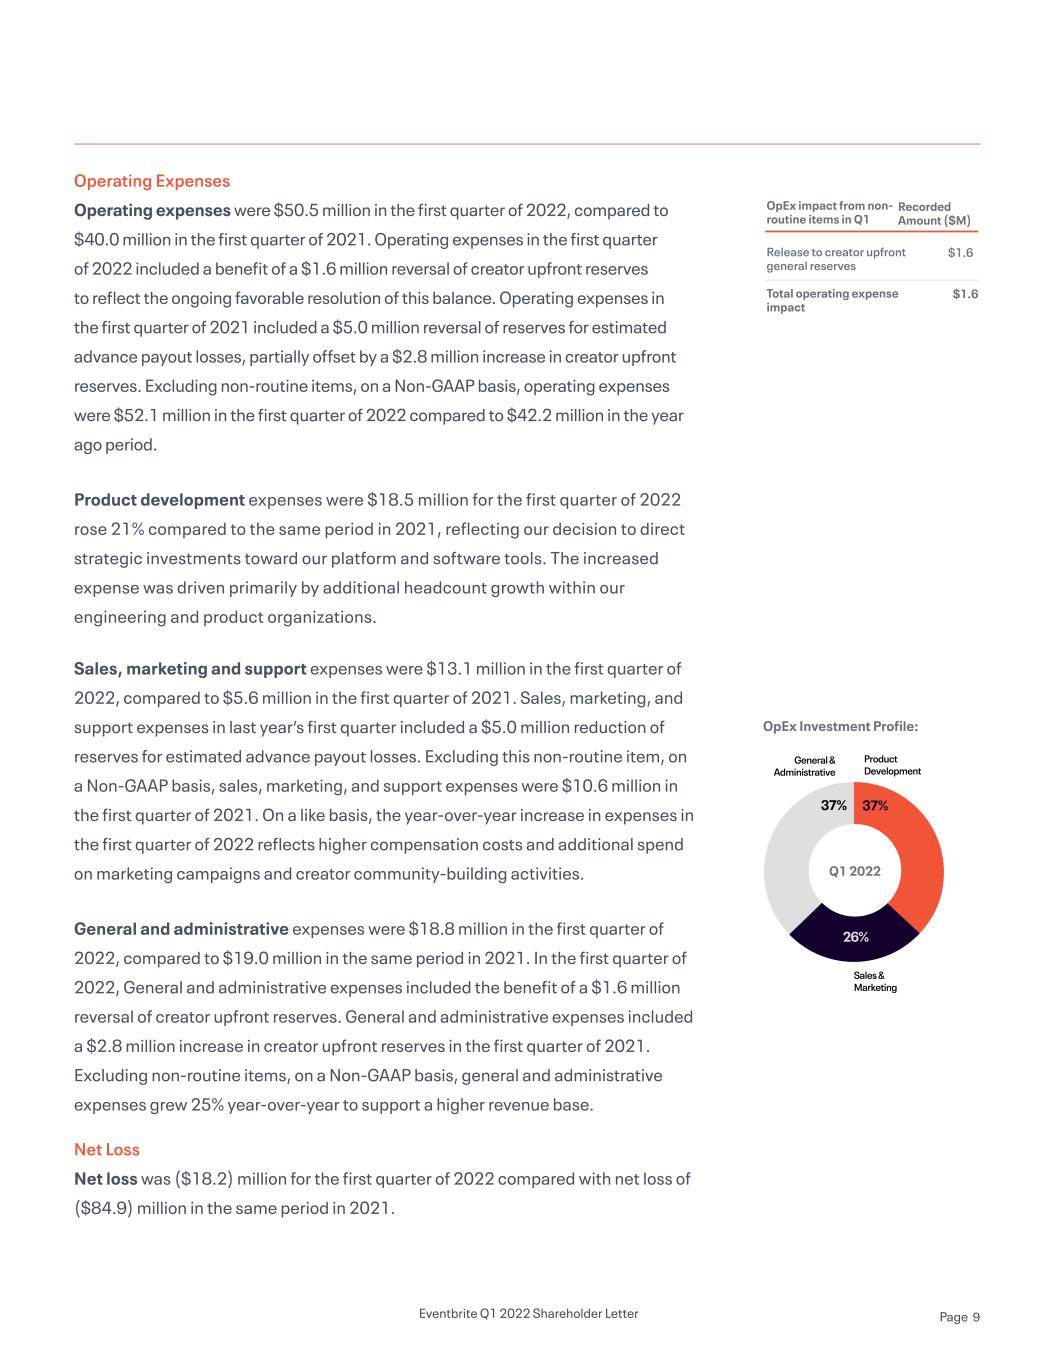
OpEx Investment Profile: Operating Expenses Operating expenses were $50.5 million in the first quarter of 2022, compared to $40.0 million in the first quarter of 2021. Operating expenses in the first quarter of 2022 included a benefit of a $1.6 million reversal of creator upfront reserves to reflect the ongoing favorable resolution of this balance. Operating expenses in the first quarter of 2021 included a $5.0 million reversal of reserves for estimated advance payout losses, partially offset by a $2.8 million increase in creator upfront reserves. Excluding non-routine items, on a Non-GAAP basis, operating expenses were $52.1 million in the first quarter of 2022 compared to $42.2 million in the year ago period. Product development expenses were $18.5 million for the first quarter of 2022 rose 21% compared to the same period in 2021, reflecting our decision to direct strategic investments toward our platform and software tools. The increased expense was driven primarily by additional headcount growth within our engineering and product organizations. Sales, marketing and support expenses were $13.1 million in the first quarter of 2022, compared to $5.6 million in the first quarter of 2021. Sales, marketing, and support expenses in last year’s first quarter included a $5.0 million reduction of reserves for estimated advance payout losses. Excluding this non-routine item, on a Non-GAAP basis, sales, marketing, and support expenses were $10.6 million in the first quarter of 2021. On a like basis, the year-over-year increase in expenses in the first quarter of 2022 reflects higher compensation costs and additional spend on marketing campaigns and creator community-building activities. General and administrative expenses were $18.8 million in the first quarter of 2022, compared to $19.0 million in the same period in 2021. In the first quarter of 2022, General and administrative expenses included the benefit of a $1.6 million reversal of creator upfront reserves. General and administrative expenses included a $2.8 million increase in creator upfront reserves in the first quarter of 2021. Excluding non-routine items, on a Non-GAAP basis, general and administrative expenses grew 25% year-over-year to support a higher revenue base. Net Loss Net loss was ($18.2) million for the first quarter of 2022 compared with net loss of ($84.9) million in the same period in 2021. Q1 2022 37% General & Administrative 26% Sales & Marketing 37% Product Development OpEx impact from non- routine items in Q1 Release to creator upfront general reserves Total operating expense impact Recorded Amount ($M) $1.60 $1.6 Eventbrite Q1 2022 Shareholder Letter Page 9
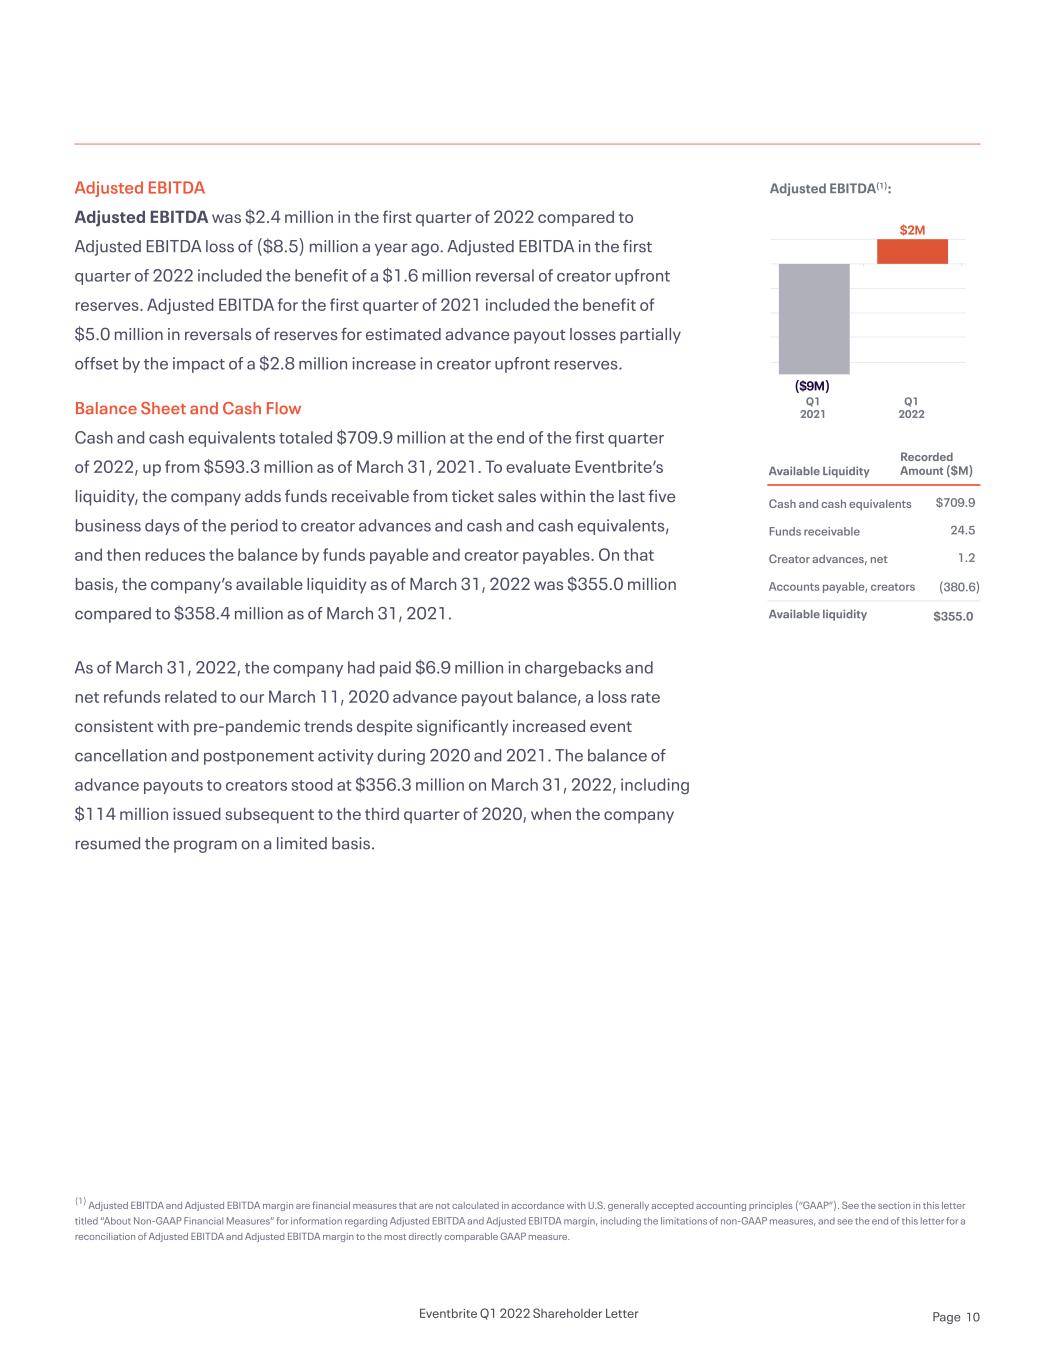
($7M) Adjusted EBITDA(1): Available Liquidity Cash and cash equivalents Funds receivable Creator advances, net Accounts payable, creators Available liquidity Recorded Amount ($M) $709.90 24.50 1.20 (380.6) l$355.00 Adjusted EBITDA Adjusted EBITDA was $2.4 million in the first quarter of 2022 compared to Adjusted EBITDA loss of ($8.5) million a year ago. Adjusted EBITDA in the first quarter of 2022 included the benefit of a $1.6 million reversal of creator upfront reserves. Adjusted EBITDA for the first quarter of 2021 included the benefit of $5.0 million in reversals of reserves for estimated advance payout losses partially offset by the impact of a $2.8 million increase in creator upfront reserves. Balance Sheet and Cash Flow Cash and cash equivalents totaled $709.9 million at the end of the first quarter of 2022, up from $593.3 million as of March 31, 2021. To evaluate Eventbrite’s liquidity, the company adds funds receivable from ticket sales within the last five business days of the period to creator advances and cash and cash equivalents, and then reduces the balance by funds payable and creator payables. On that basis, the company’s available liquidity as of March 31, 2022 was $355.0 million compared to $358.4 million as of March 31, 2021. As of March 31, 2022, the company had paid $6.9 million in chargebacks and net refunds related to our March 11, 2020 advance payout balance, a loss rate consistent with pre-pandemic trends despite significantly increased event cancellation and postponement activity during 2020 and 2021. The balance of advance payouts to creators stood at $356.3 million on March 31, 2022, including $114 million issued subsequent to the third quarter of 2020, when the company resumed the program on a limited basis. Q1 2022 Q1 2021 ($9M) $2M (1) Adjusted EBITDA and Adjusted EBITDA margin are financial measures that are not calculated in accordance with U.S. generally accepted accounting principles (“GAAP”). See the section in this letter titled “About Non-GAAP Financial Measures” for information regarding Adjusted EBITDA and Adjusted EBITDA margin, including the limitations of non-GAAP measures, and see the end of this letter for a reconciliation of Adjusted EBITDA and Adjusted EBITDA margin to the most directly comparable GAAP measure. Eventbrite Q1 2022 Shareholder Letter Page 10
Based upon current information, we anticipate second quarter 2022 revenue will be within a range of $60 million to $63 million. Business Outlook Eventbrite Q1 2022 Shareholder Letter Page 11
Eventbrite will hold a conference call and live webcast on April 28, 2022 at 2:00 p.m. PDT to discuss the first quarter 2022 financial results. To listen to a live audio webcast, please visit Eventbrite’s Investor Relations website at https://investor.eventbrite.com/overview/default.aspx. A replay of the webcast will be available at the same website. About Eventbrite Eventbrite is a global self-service ticketing and experience technology platform that serves a community of hundreds of thousands of event creators in nearly 180 countries. Since inception, Eventbrite has been at the center of the experience economy, transforming the way people organize and attend events. The company was founded by Julia Hartz, Kevin Hartz and Renaud Visage, with a vision to build a self-service platform that would make it possible for anyone to create and sell tickets to live experiences. The Eventbrite platform provides an intuitive, secure, and reliable service that enables creators to plan and execute their live and online events, whether it’s an annual culinary festival attracting thousands of foodies, a professional webinar, a weekly yoga workshop or a youth dance class. With over 290 million tickets distributed for over 5 million total events in 2021, Eventbrite is where people all over the world discover new things to do or new ways to do more of what they love. Learn more at www.eventbrite.com. Earnings Webcast The neon icons can be used to convey abstract concepts and work well in presentations. They should feel active and expressive. Feel free to expand on these as you build out the experience. Eventbrite Q1 2022 Shareholder Letter Page 12
Forward-Looking Statements This letter contains forward-looking statements within the meaning of Section 27A of the Securities Act of 1933, as amended, and Section 21E of the Securities Exchange Act of 1934, as amended, that involve substantial risks and uncertainties. All statements other than statements of historical fact could be deemed forward-looking, including, but not limited to, statements regarding the future performance of Eventbrite, Inc. and its consolidated subsidiaries (the “Company”); the Company’s business model, investments to support growth, product-led strategy, product momentum and operating leverage, including the impact on results; the impact of the Company’s focus on developing features for frequent creators, including multi-event management, marketing and demand generation tools; the impact of the Company’s creator community investments; growth strategies and opportunities in the Company’s businesses and products, including creative initiatives; the Company’s expectations regarding the development of its platform and products; the Company’s scalable financial entine and expectations regarding growth and further improvements in its margin profile, profitability and adjusted EBITDA; and the Company’s expectations described under “Business Outlook” above. In some cases, forward-looking statements can be identified by terms such as “may,” “will,” “appears,” “shall,” “should,” “expects,” “plans,” “anticipates,” “could,” “intends,” “target,” “projects,” “contemplates,” “believes,” “estimates,” “predicts,” “potential,” or “continue,” or the negative of these words or other similar terms or expressions that concern our expectations, strategy, plans, or intentions. Such statements are subject to a number of known and unknown risks, uncertainties, assumptions, and other factors that may cause the Company’s actual results, performance, or achievements to differ materially from results expressed or implied in this letter. Investors are cautioned not to place undue reliance on these statements. Actual results could differ materially from those expressed or implied, and reported results should not be considered as an indication of future performance. The forward-looking statements contained in this letter are also subject to additional risks, uncertainties and factors, including those more fully described in the Company’s filings with the Securities and Exchange Commission, including the Company’s Annual Report on Form 10-K and Quarterly Reports on Form 10-Q. Further information on potential risks that could affect actual results will be included in the subsequent periodic and current reports and other filings that the Company makes with the Securities and Exchange Commission from time to time. All forward-looking statements are based on information and estimates available to the Company at the time of this letter and are not guarantees of future performance. Except as required by law, the Company assumes no obligation to update any of the statements in this letter. About Non-GAAP Financial Measures We believe that the use of Adjusted EBITDA and Adjusted EBITDA margin is helpful to our investors as they are metrics used by management in assessing the health of our business and our operating performance. These measures are not prepared in accordance with GAAP and have limitations as an analytical tool, and you should not consider them in isolation or as a substitute for analysis of our results of operations as reported under GAAP. In addition, other companies may not calculate non-GAAP financial measures in the same manner as we calculate them, limiting their usefulness as comparative measures. You are encouraged to evaluate the adjustments and the reasons we consider them appropriate. Adjusted EBITDA We believe Adjusted EBITDA provides useful information to investors and others in understanding and evaluating our results of operations, as well as provides a useful measure for period-to-period comparisons of our business performance. Moreover, it is a key measurement used by our management internally to make operating decisions, evaluating performance, and performing strategic planning and annual budgeting. We calculate Adjusted EBITDA as net loss adjusted to exclude depreciation and amortization, stock-based compensation expense, interest expense, loss on debt extinguishment, direct and indirect acquisition related costs, employer taxes related to employee transactions and other income (expense), which consisted of interest income, foreign exchange rate gains and losses, and income tax provision (benefit). Adjusted EBITDA should not be considered as an alternative to net loss or any other measure of financial performance calculated and presented in accordance with GAAP. Some of the limitations of Adjusted EBITDA include (i) Adjusted EBITDA does not properly reflect capital spending that occurs off of the income statement or account for future contractual commitments, (ii) although depreciation and amortization are non-cash charges, the underlying assets may need to be replaced and Adjusted EBITDA does not reflect these capital expenditures and (iii) Adjusted EBITDA does not reflect the interest and principal required to service our indebtedness. In evaluating Adjusted EBITDA, you should be aware that in the future we expect to incur expenses similar to the adjustments in this letter. Our presentation of Adjusted EBITDA should not be construed as an inference that our future results will be unaffected by these expenses or any unusual or non-recurring items. When evaluating our performance, you should consider Adjusted EBITDA alongside other financial performance measures, including our net loss and other GAAP results. Adjusted EBITDA Margin Adjusted EBITDA Margin is defined as Adjusted EBITDA divided by revenue. Because of the limitations described above, you should consider Adjusted EBITDA and Adjusted EBITDA Margin alongside other financial performance measures, including net loss and our other GAAP results. Eventbrite Q1 2022 Shareholder Letter Page 13
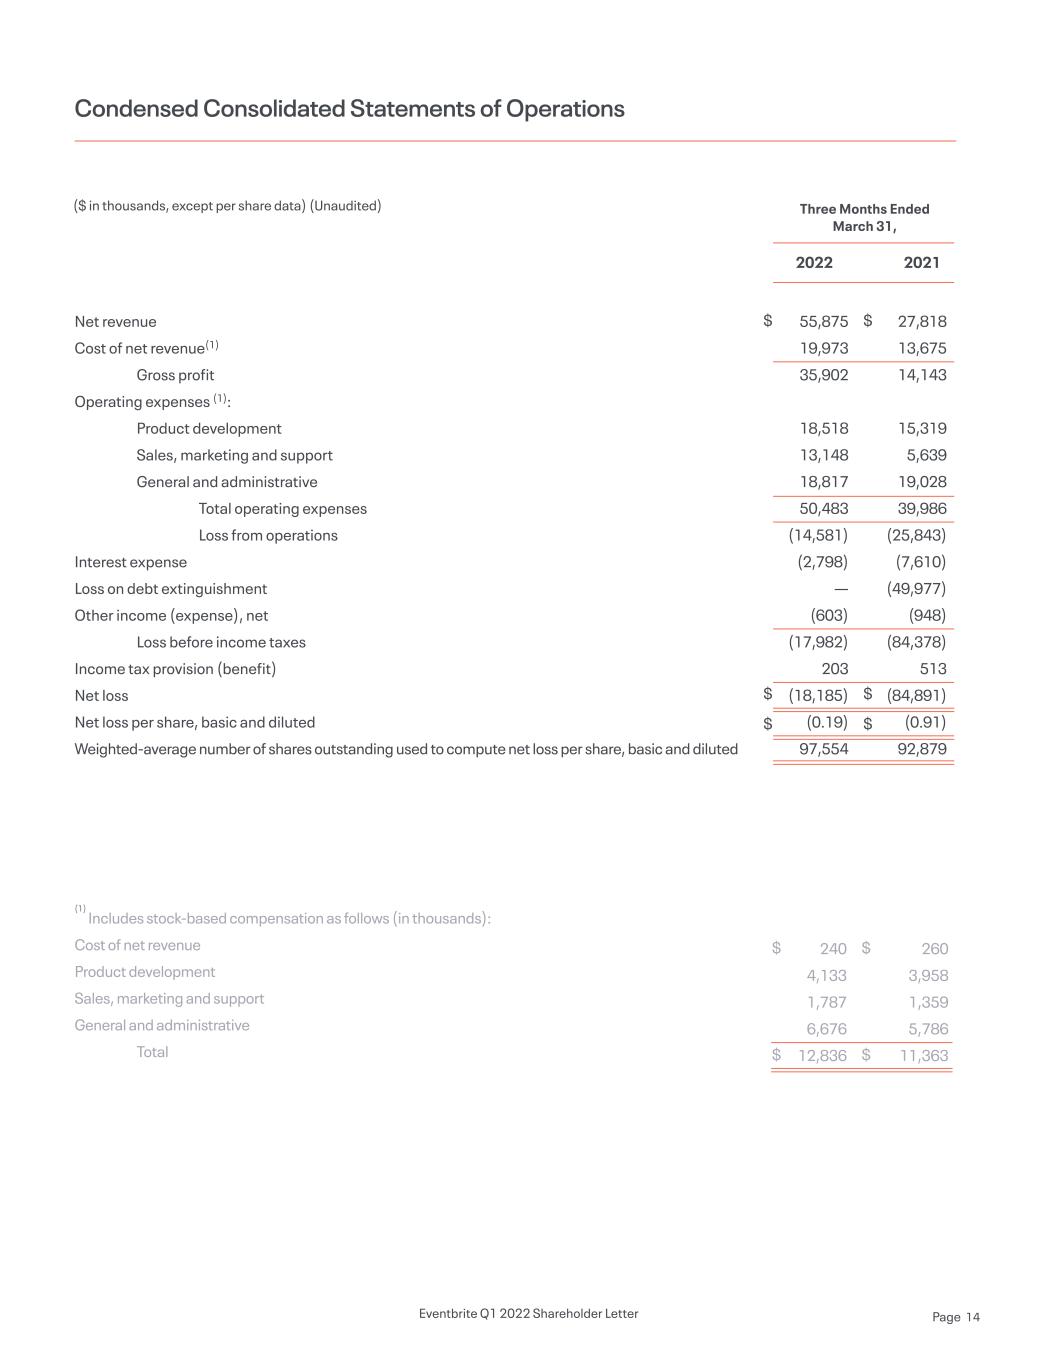
Net revenue Cost of net revenue(1) Gross profit Operating expenses (1): Product development Sales, marketing and support General and administrative Total operating expenses Loss from operations Interest expense Loss on debt extinguishment Other income (expense), net Loss before income taxes Income tax provision (benefit) Net loss Net loss per share, basic and diluted Weighted-average number of shares outstanding used to compute net loss per share, basic and diluted Condensed Consolidated Statements of Operations ($ in thousands, except per share data) (Unaudited) $ $ $ 27,818 13,675 14,143 15,319 5,639 19,028 39,986 (25,843) (7,610) (49,977) (948) (84,378) 513 (84,891) (0.91) 92,879 Three Months Ended March 31, 2022 2021 $ $ $ 55,875 19,973 35,902 18,518 13,148 18,817 50,483 (14,581) (2,798) — (603) (17,982) 203 (18,185) (0.19) 97,554 (1) Includes stock-based compensation as follows (in thousands): Cost of net revenue Product development Sales, marketing and support General and administrative Total $ $ $ $ $ $ 240 4,133 1,787 6,676 12,836 260 3,958 1,359 5,786 11,363 Eventbrite Q1 2022 Shareholder Letter Page 14
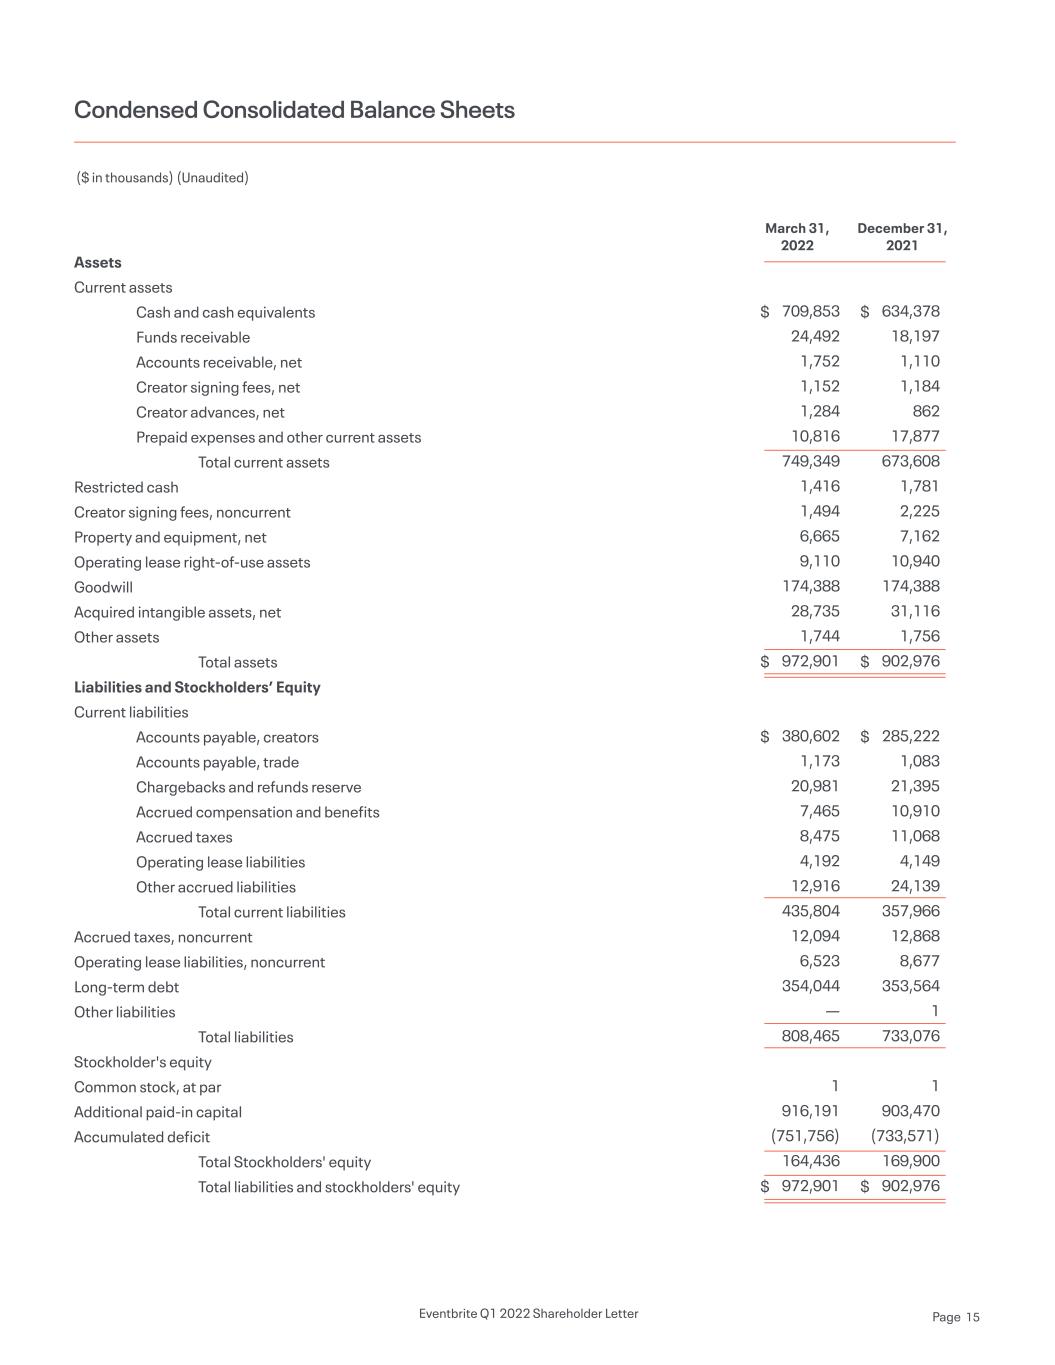
Assets Current assets Cash and cash equivalents Funds receivable Accounts receivable, net Creator signing fees, net Creator advances, net Prepaid expenses and other current assets Total current assets Restricted cash Creator signing fees, noncurrent Property and equipment, net Operating lease right-of-use assets Goodwill Acquired intangible assets, net Other assets Total assets Liabilities and Stockholders’ Equity Current liabilities Accounts payable, creators Accounts payable, trade Chargebacks and refunds reserve Accrued compensation and benefits Accrued taxes Operating lease liabilities Other accrued liabilities Total current liabilities Accrued taxes, noncurrent Operating lease liabilities, noncurrent Long-term debt Other liabilities Total liabilities Stockholder's equity Common stock, at par Additional paid-in capital Accumulated deficit Total Stockholders' equity Total liabilities and stockholders' equity Condensed Consolidated Balance Sheets ($ in thousands) (Unaudited) March 31, 2022 $ $ $ $ 709,853 24,492 1,752 1,152 1,284 10,816 749,349 1,416 1,494 6,665 9,110 174,388 28,735 1,744 972,901 380,602 1,173 20,981 7,465 8,475 4,192 12,916 435,804 12,094 6,523 354,044 — 808,465 1 916,191 (751,756) 164,436 972,901 December 31, 2021 $ $ $ $ 634,378 18,197 1,110 1,184 862 17,877 673,608 1,781 2,225 7,162 10,940 174,388 31,116 1,756 902,976 285,222 1,083 21,395 10,910 11,068 4,149 24,139 357,966 12,868 8,677 353,564 1 733,076 1 903,470 (733,571) 169,900 902,976 Eventbrite Q1 2022 Shareholder Letter Page 15
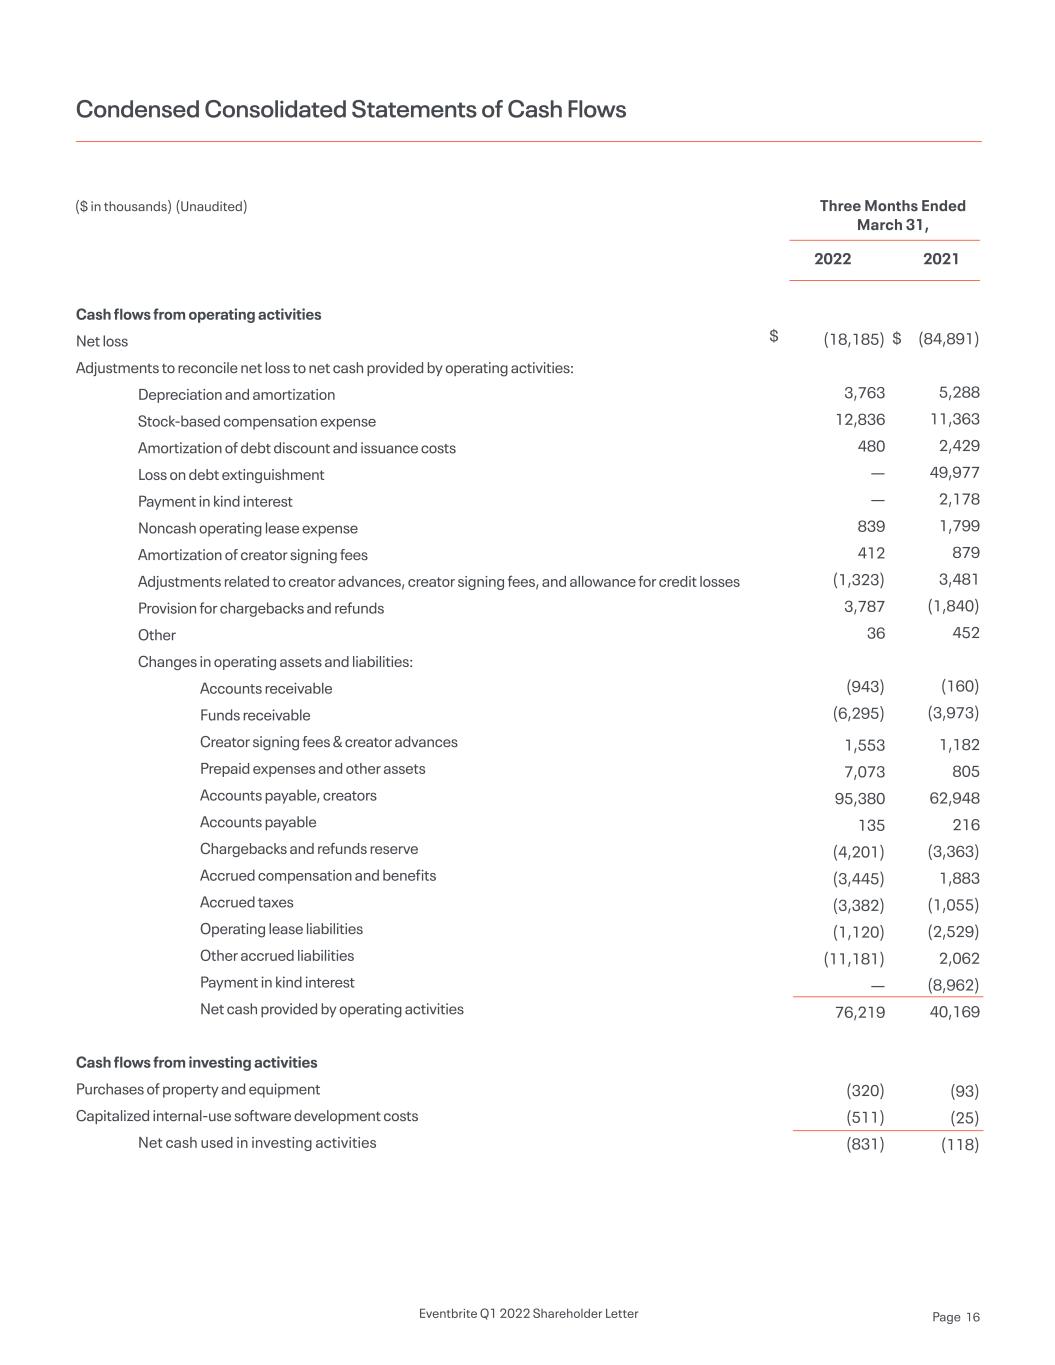
Cash flows from operating activities Net loss Adjustments to reconcile net loss to net cash provided by operating activities: Depreciation and amortization Stock-based compensation expense Amortization of debt discount and issuance costs Loss on debt extinguishment Payment in kind interest Noncash operating lease expense Amortization of creator signing fees Adjustments related to creator advances, creator signing fees, and allowance for credit losses Provision for chargebacks and refunds Other Changes in operating assets and liabilities: Accounts receivable Funds receivable Creator signing fees & creator advances Prepaid expenses and other assets Accounts payable, creators Accounts payable Chargebacks and refunds reserve Accrued compensation and benefits Accrued taxes Operating lease liabilities Other accrued liabilities Payment in kind interest Net cash provided by operating activities Cash flows from investing activities Purchases of property and equipment Capitalized internal-use software development costs Net cash used in investing activities (18,185) 3,763 12,836 480 — — 839 412 (1,323) 3,787 36 (943) (6,295) 1,553 7,073 95,380 135 (4,201) (3,445) (3,382) (1,120) (11,181) — 76,219 (320) (511) (831) (84,891) 5,288 11,363 2,429 49,977 2,178 1,799 879 3,481 (1,840) 452 (160) (3,973) 1,182 805 62,948 216 (3,363) 1,883 (1,055) (2,529) 2,062 (8,962) 40,169 (93) (25) (118) Condensed Consolidated Statements of Cash Flows ($ in thousands) (Unaudited) Three Months Ended March 31, 2022 2021 $ $ Eventbrite Q1 2022 Shareholder Letter Page 16
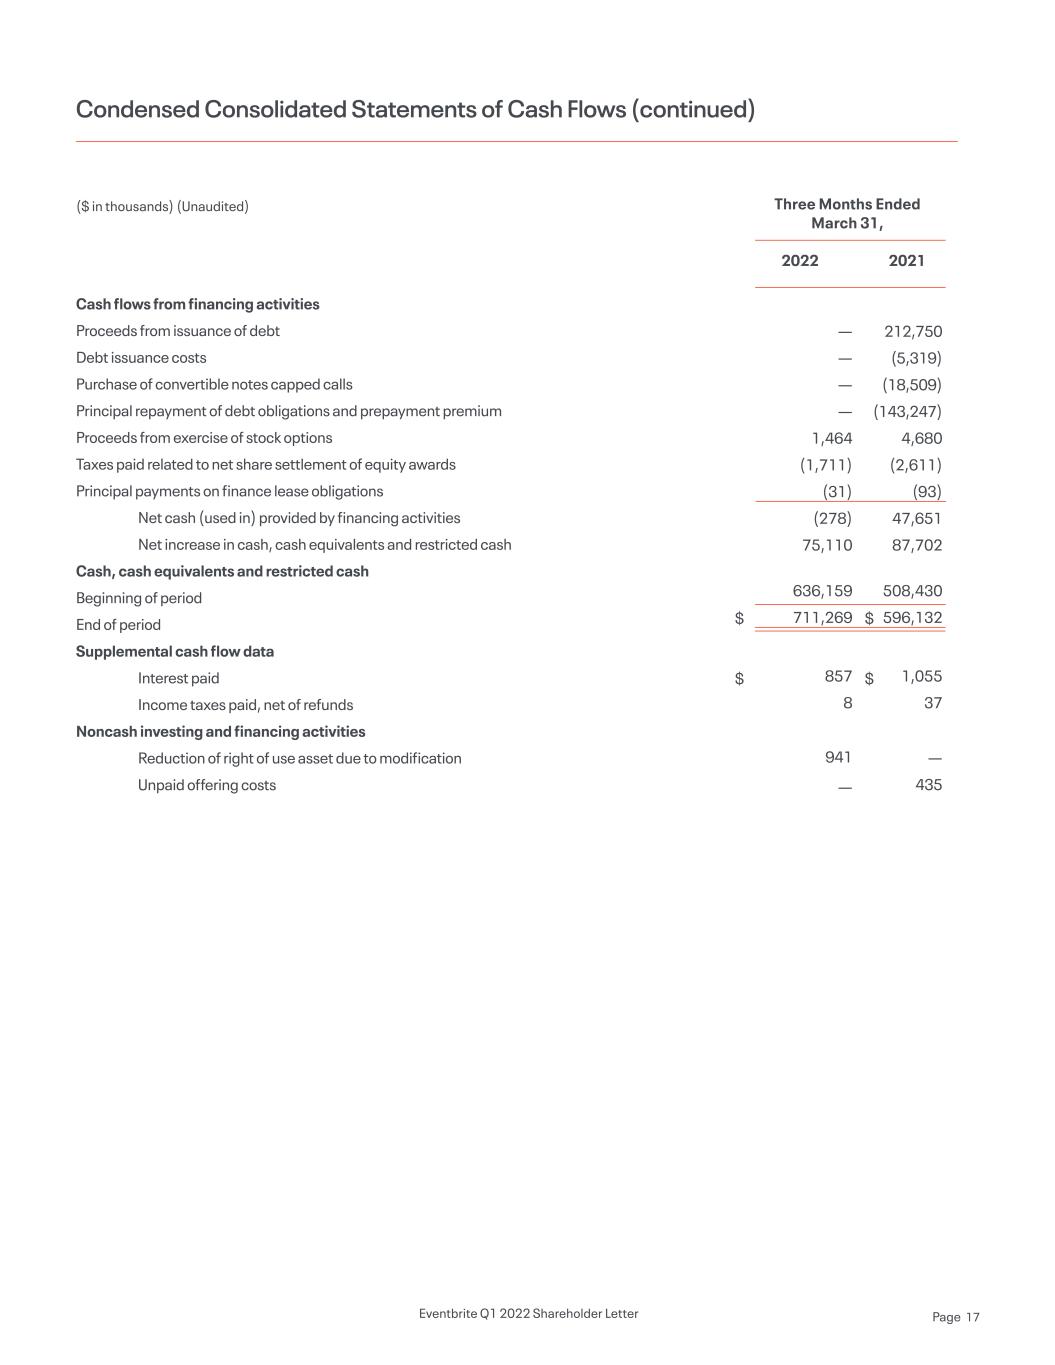
Cash flows from financing activities Proceeds from issuance of debt Debt issuance costs Purchase of convertible notes capped calls Principal repayment of debt obligations and prepayment premium Proceeds from exercise of stock options Taxes paid related to net share settlement of equity awards Principal payments on finance lease obligations Net cash (used in) provided by financing activities Net increase in cash, cash equivalents and restricted cash Cash, cash equivalents and restricted cash Beginning of period End of period Supplemental cash flow data Interest paid Income taxes paid, net of refunds Noncash investing and financing activities Reduction of right of use asset due to modification Unpaid offering costs — — — — 1,464 (1,711) (31) (278) 75,110 636,159 711,269 857 8 941 — 212,750 (5,319) (18,509) (143,247) 4,680 (2,611) (93) 47,651 87,702 508,430 596,132 1,055 37 — 435 Condensed Consolidated Statements of Cash Flows (continued) ($ in thousands) (Unaudited) Three Months Ended March 31, 2022 2021 $ $ $ $ Eventbrite Q1 2022 Shareholder Letter Page 17

Key Operating Metrics and Non-GAAP Financial Measures Net Revenue Paid Ticket Volume Net revenue per paid ticket Adjusted EBITDA Adjusted EBITDA Margin (In thousands, except per ticket data) (Unaudited) Three Months Ended March 31, Three Months Ended 2022 2021 55,875 18,054 3.09 2,375 4% 27,818 10,232 2.72 (8,510) (31) % $ $ $ $ $ $ Adjusted EBITDA Reconciliation (Unaudited) March 31, 2022 December 31, 2021 September 30, 2021 June 30, 2021 March 31, 2021 Net loss Add: Depreciation and amortization Stock-based compensation Interest expense Loss on debt extinguishment Employer taxes related to employee equity transactions Other (income) expense, net Income tax provision (benefit) Adjusted EBITDA Net Revenue Adjusted EBITDA Margin (18,185) 3,763 12,836 2,798 - 357 603 203 2,375 55,875 4 % (16,836) 4,228 11,537 3,067 - 669 748 543 3,956 59,638 7 % (16,813) 4,428 12,300 2,814 - 400 2,460 311 5,900 53,367 11 % (20,540) 4,772 12,323 2,776 - 793 (526) 61 (341) 46,311 (1) % (84,891) 5,288 11,363 7,610 49,977 682 948 513 (8,510) 27,818 (31) % $ $ $ $ $ $ $ $ $ $ $ $ $ $ $ Eventbrite Q1 2022 Shareholder Letter Page 18


