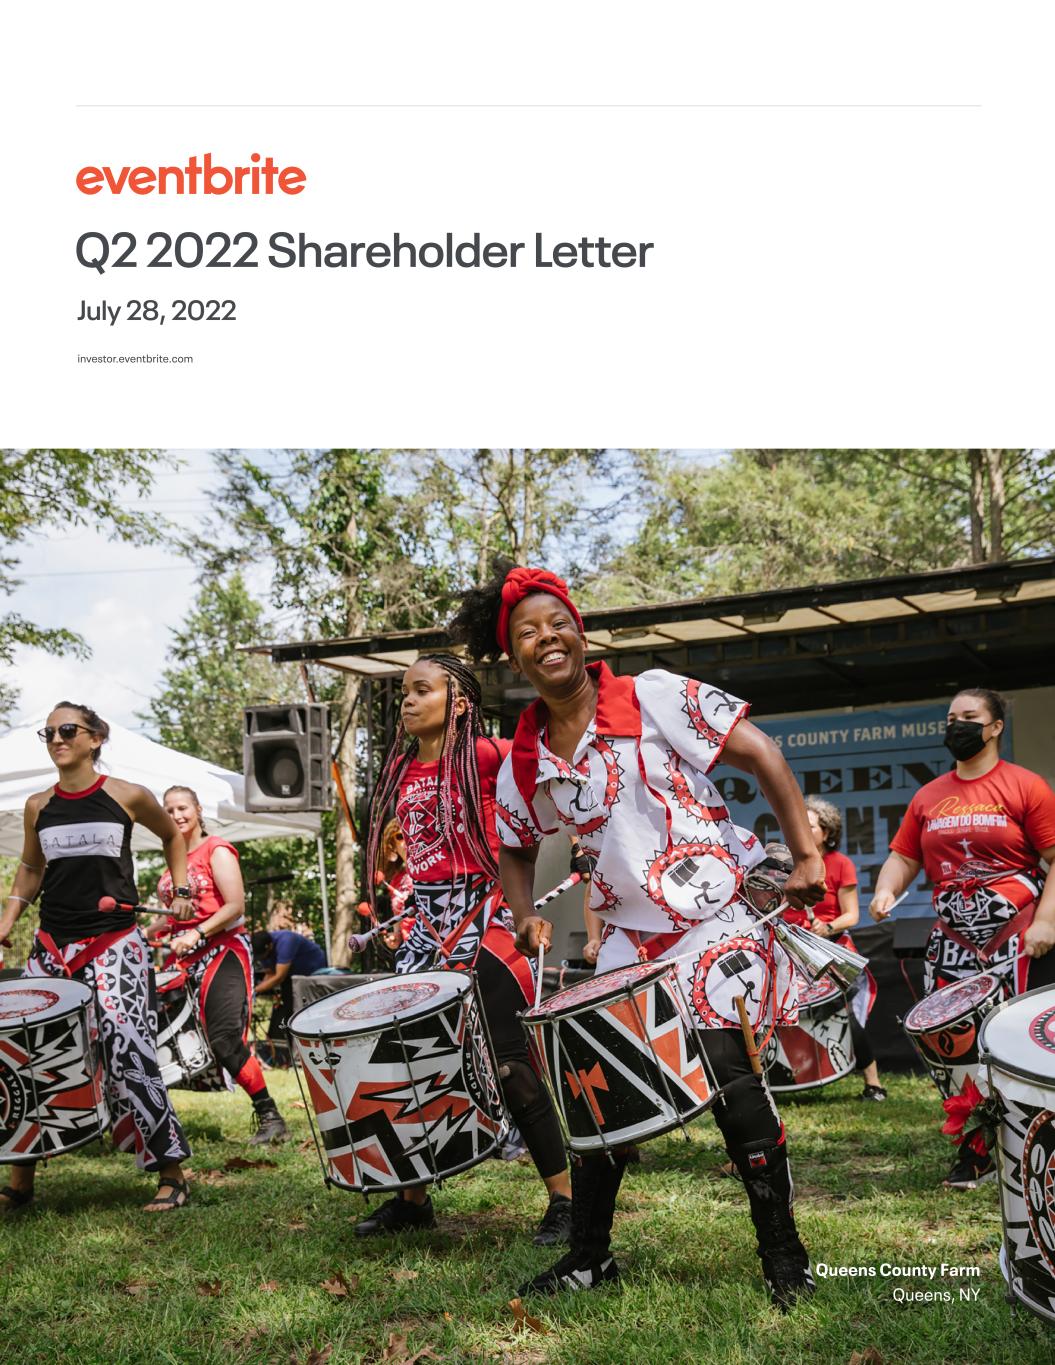
Q2 2022 Shareholder Letter July 28, 2022 investor.eventbrite.com Queens County Farm Queens, NY
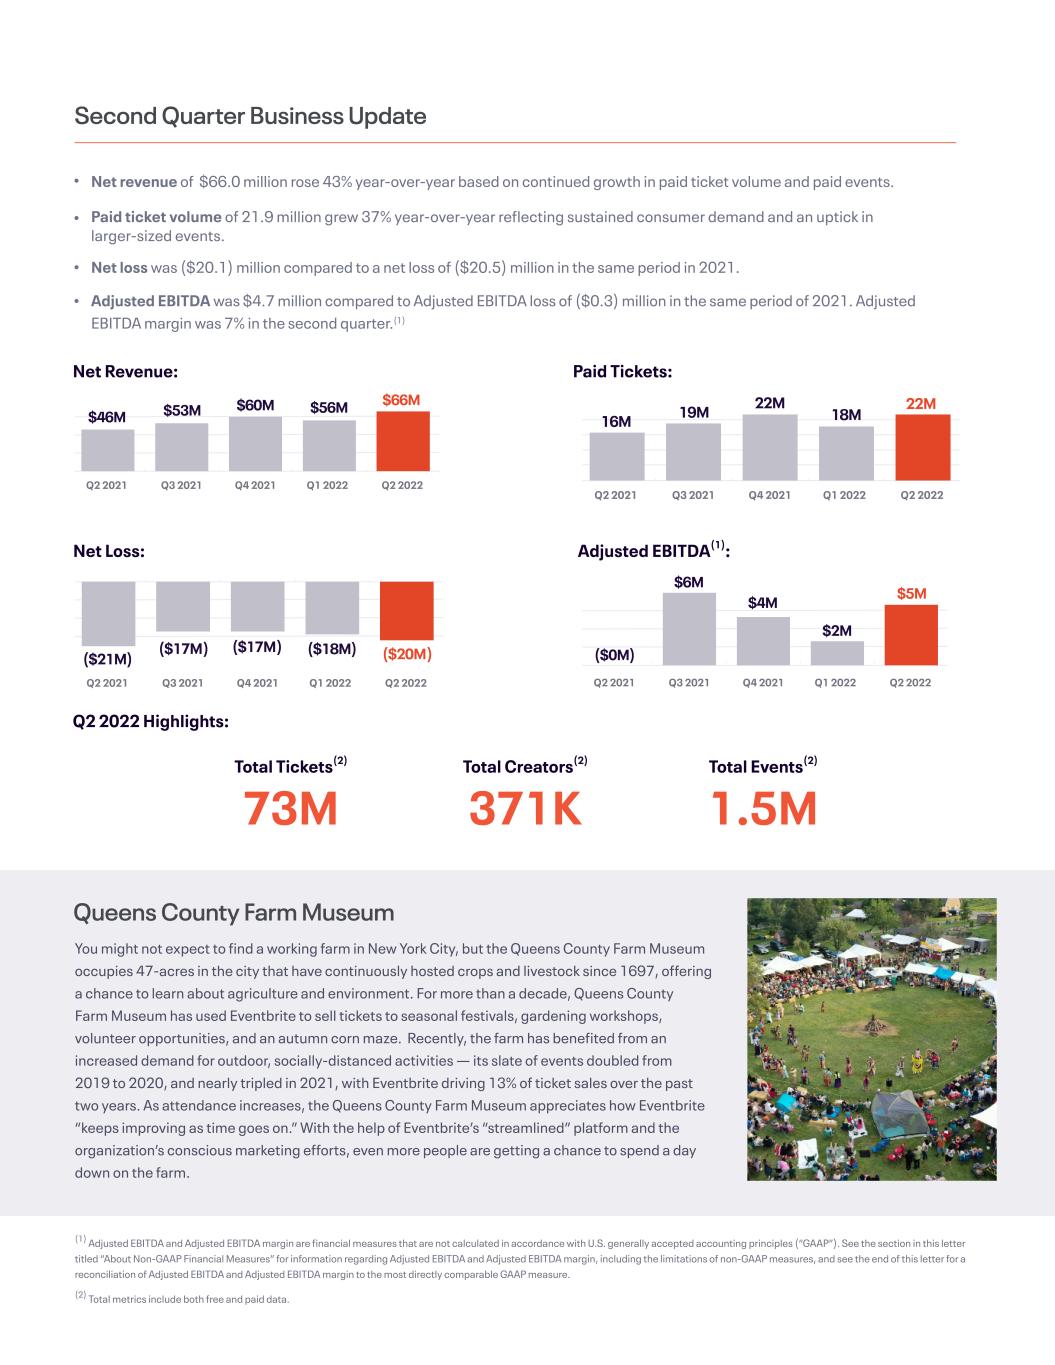
Adjusted EBITDA(1): Second Quarter Business Update Net Revenue: Q2 2022 Highlights: Paid Tickets: Net revenue of $66.0 million rose 43% year-over-year based on continued growth in paid ticket volume and paid events. Paid ticket volume of 21.9 million grew 37% year-over-year reflecting sustained consumer demand and an uptick in larger-sized events. Net loss was ($20.1) million compared to a net loss of ($20.5) million in the same period in 2021. Adjusted EBITDA was $4.7 million compared to Adjusted EBITDA loss of ($0.3) million in the same period of 2021. Adjusted EBITDA margin was 7% in the second quarter.(1) Net Loss: Total Tickets(2) 73M Queens County Farm Museum You might not expect to find a working farm in New York City, but the Queens County Farm Museum occupies 47-acres in the city that have continuously hosted crops and livestock since 1697, offering a chance to learn about agriculture and environment. For more than a decade, Queens County Farm Museum has used Eventbrite to sell tickets to seasonal festivals, gardening workshops, volunteer opportunities, and an autumn corn maze. Recently, the farm has benefited from an increased demand for outdoor, socially-distanced activities — its slate of events doubled from 2019 to 2020, and nearly tripled in 2021, with Eventbrite driving 13% of ticket sales over the past two years. As attendance increases, the Queens County Farm Museum appreciates how Eventbrite “keeps improving as time goes on.” With the help of Eventbrite’s “streamlined” platform and the organization’s conscious marketing efforts, even more people are getting a chance to spend a day down on the farm. (1) Adjusted EBITDA and Adjusted EBITDA margin are financial measures that are not calculated in accordance with U.S. generally accepted accounting principles (“GAAP”). See the section in this letter titled “About Non-GAAP Financial Measures” for information regarding Adjusted EBITDA and Adjusted EBITDA margin, including the limitations of non-GAAP measures, and see the end of this letter for a reconciliation of Adjusted EBITDA and Adjusted EBITDA margin to the most directly comparable GAAP measure. (2) Total metrics include both free and paid data. Total Creators(2) 371K Total Events(2) 1.5M Q2 2022Q1 2022Q4 2021Q3 2021Q2 2021 $46M $53M $60M $56M $66M Q2 2022Q1 2022Q4 2021Q3 2021Q2 2021 16M 19M 22M 18M 22M Q2 2022Q1 2022Q4 2021Q3 2021Q2 2021 ($21M) ($17M) ($17M) ($18M) ($20M) Q2 2022Q1 2022Q4 2021Q3 2021Q2 2021 ($0M) $6M $4M $2M $5M
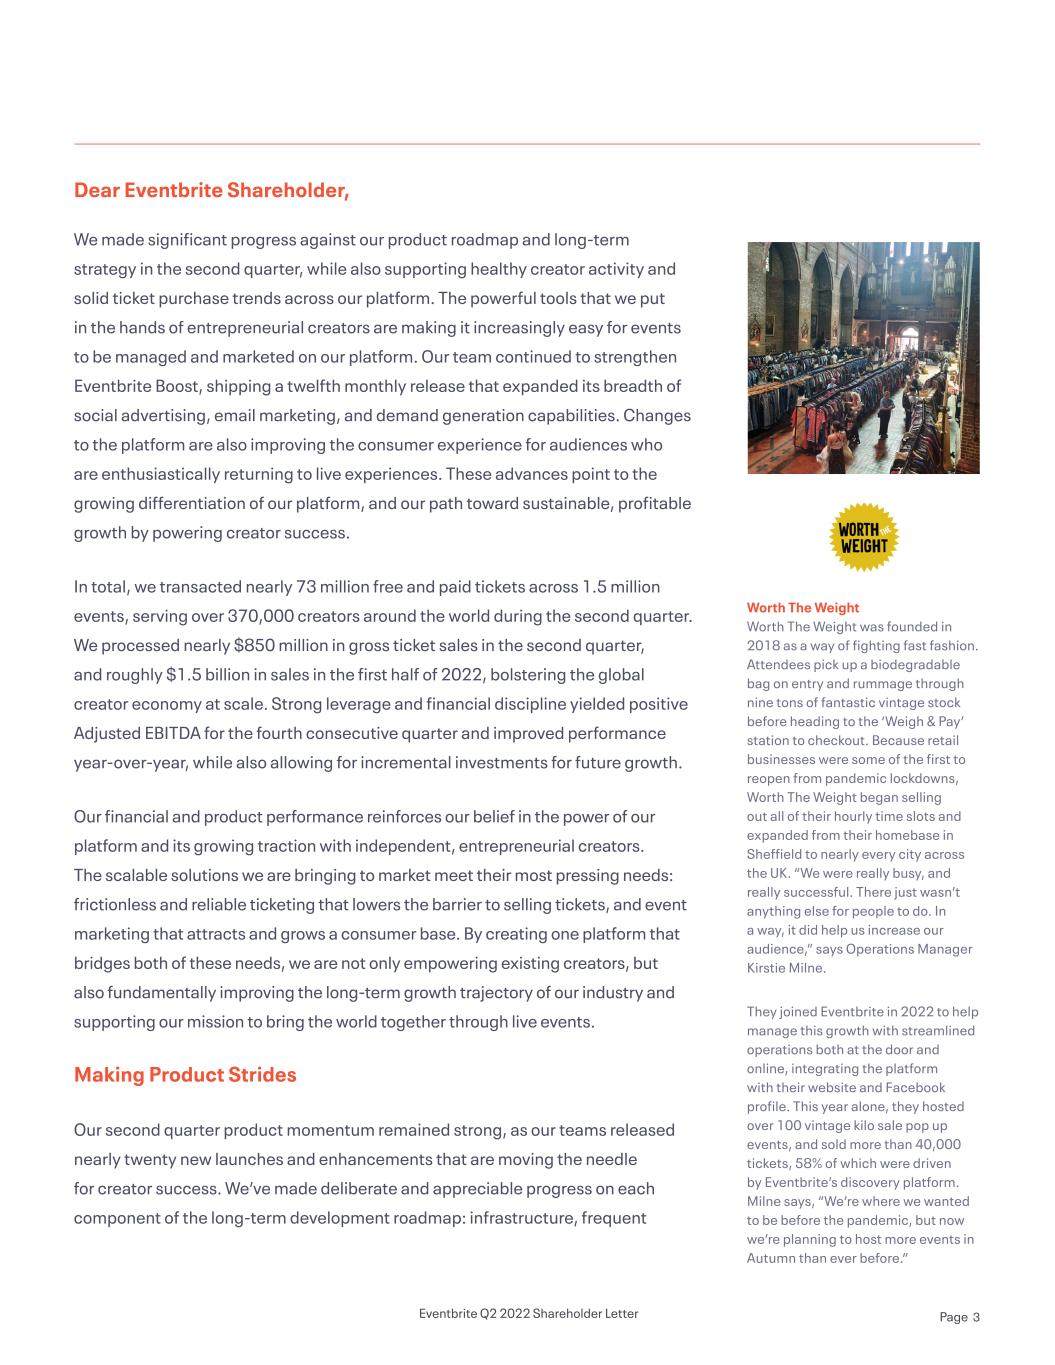
Dear Eventbrite Shareholder, We made significant progress against our product roadmap and long-term strategy in the second quarter, while also supporting healthy creator activity and solid ticket purchase trends across our platform. The powerful tools that we put in the hands of entrepreneurial creators are making it increasingly easy for events to be managed and marketed on our platform. Our team continued to strengthen Eventbrite Boost, shipping a twelfth monthly release that expanded its breadth of social advertising, email marketing, and demand generation capabilities. Changes to the platform are also improving the consumer experience for audiences who are enthusiastically returning to live experiences. These advances point to the growing differentiation of our platform, and our path toward sustainable, profitable growth by powering creator success. In total, we transacted nearly 73 million free and paid tickets across 1.5 million events, serving over 370,000 creators around the world during the second quarter. We processed nearly $850 million in gross ticket sales in the second quarter, and roughly $1.5 billion in sales in the first half of 2022, bolstering the global creator economy at scale. Strong leverage and financial discipline yielded positive Adjusted EBITDA for the fourth consecutive quarter and improved performance year-over-year, while also allowing for incremental investments for future growth. Our financial and product performance reinforces our belief in the power of our platform and its growing traction with independent, entrepreneurial creators. The scalable solutions we are bringing to market meet their most pressing needs: frictionless and reliable ticketing that lowers the barrier to selling tickets, and event marketing that attracts and grows a consumer base. By creating one platform that bridges both of these needs, we are not only empowering existing creators, but also fundamentally improving the long-term growth trajectory of our industry and supporting our mission to bring the world together through live events. Making Product Strides Our second quarter product momentum remained strong, as our teams released nearly twenty new launches and enhancements that are moving the needle for creator success. We’ve made deliberate and appreciable progress on each component of the long-term development roadmap: infrastructure, frequent Worth The Weight Worth The Weight was founded in 2018 as a way of fighting fast fashion. Attendees pick up a biodegradable bag on entry and rummage through nine tons of fantastic vintage stock before heading to the ‘Weigh & Pay’ station to checkout. Because retail businesses were some of the first to reopen from pandemic lockdowns, Worth The Weight began selling out all of their hourly time slots and expanded from their homebase in Sheffield to nearly every city across the UK. “We were really busy, and really successful. There just wasn’t anything else for people to do. In a way, it did help us increase our audience,” says Operations Manager Kirstie Milne. They joined Eventbrite in 2022 to help manage this growth with streamlined operations both at the door and online, integrating the platform with their website and Facebook profile. This year alone, they hosted over 100 vintage kilo sale pop up events, and sold more than 40,000 tickets, 58% of which were driven by Eventbrite’s discovery platform. Milne says, “We’re where we wanted to be before the pandemic, but now we’re planning to host more events in Autumn than ever before.” Eventbrite Q2 2022 Shareholder Letter Page 3
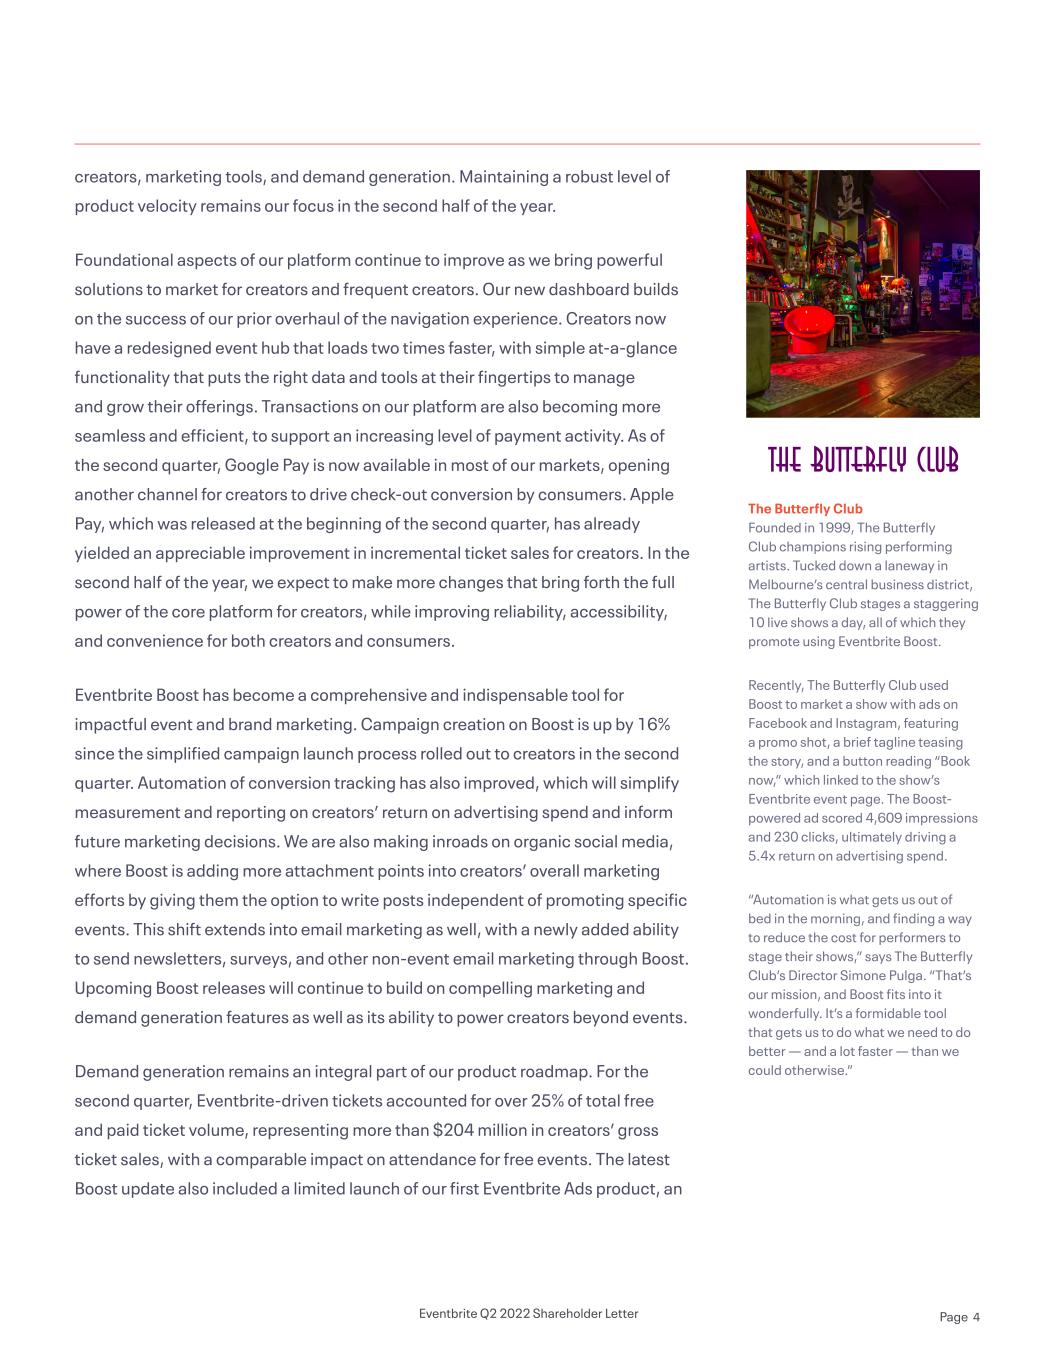
creators, marketing tools, and demand generation. Maintaining a robust level of product velocity remains our focus in the second half of the year. Foundational aspects of our platform continue to improve as we bring powerful solutions to market for creators and frequent creators. Our new dashboard builds on the success of our prior overhaul of the navigation experience. Creators now have a redesigned event hub that loads two times faster, with simple at-a-glance functionality that puts the right data and tools at their fingertips to manage and grow their offerings. Transactions on our platform are also becoming more seamless and efficient, to support an increasing level of payment activity. As of the second quarter, Google Pay is now available in most of our markets, opening another channel for creators to drive check-out conversion by consumers. Apple Pay, which was released at the beginning of the second quarter, has already yielded an appreciable improvement in incremental ticket sales for creators. In the second half of the year, we expect to make more changes that bring forth the full power of the core platform for creators, while improving reliability, accessibility, and convenience for both creators and consumers. Eventbrite Boost has become a comprehensive and indispensable tool for impactful event and brand marketing. Campaign creation on Boost is up by 16% since the simplified campaign launch process rolled out to creators in the second quarter. Automation of conversion tracking has also improved, which will simplify measurement and reporting on creators’ return on advertising spend and inform future marketing decisions. We are also making inroads on organic social media, where Boost is adding more attachment points into creators’ overall marketing efforts by giving them the option to write posts independent of promoting specific events. This shift extends into email marketing as well, with a newly added ability to send newsletters, surveys, and other non-event email marketing through Boost. Upcoming Boost releases will continue to build on compelling marketing and demand generation features as well as its ability to power creators beyond events. Demand generation remains an integral part of our product roadmap. For the second quarter, Eventbrite-driven tickets accounted for over 25% of total free and paid ticket volume, representing more than $204 million in creators’ gross ticket sales, with a comparable impact on attendance for free events. The latest Boost update also included a limited launch of our first Eventbrite Ads product, an The Butterfly Club Founded in 1999, The Butterfly Club champions rising performing artists. Tucked down a laneway in Melbourne’s central business district, The Butterfly Club stages a staggering 10 live shows a day, all of which they promote using Eventbrite Boost. Recently, The Butterfly Club used Boost to market a show with ads on Facebook and Instagram, featuring a promo shot, a brief tagline teasing the story, and a button reading “Book now,” which linked to the show’s Eventbrite event page. The Boost- powered ad scored 4,609 impressions and 230 clicks, ultimately driving a 5.4x return on advertising spend. “Automation is what gets us out of bed in the morning, and finding a way to reduce the cost for performers to stage their shows,” says The Butterfly Club’s Director Simone Pulga. “That’s our mission, and Boost fits into it wonderfully. It’s a formidable tool that gets us to do what we need to do better — and a lot faster — than we could otherwise.” Eventbrite Q2 2022 Shareholder Letter Page 4
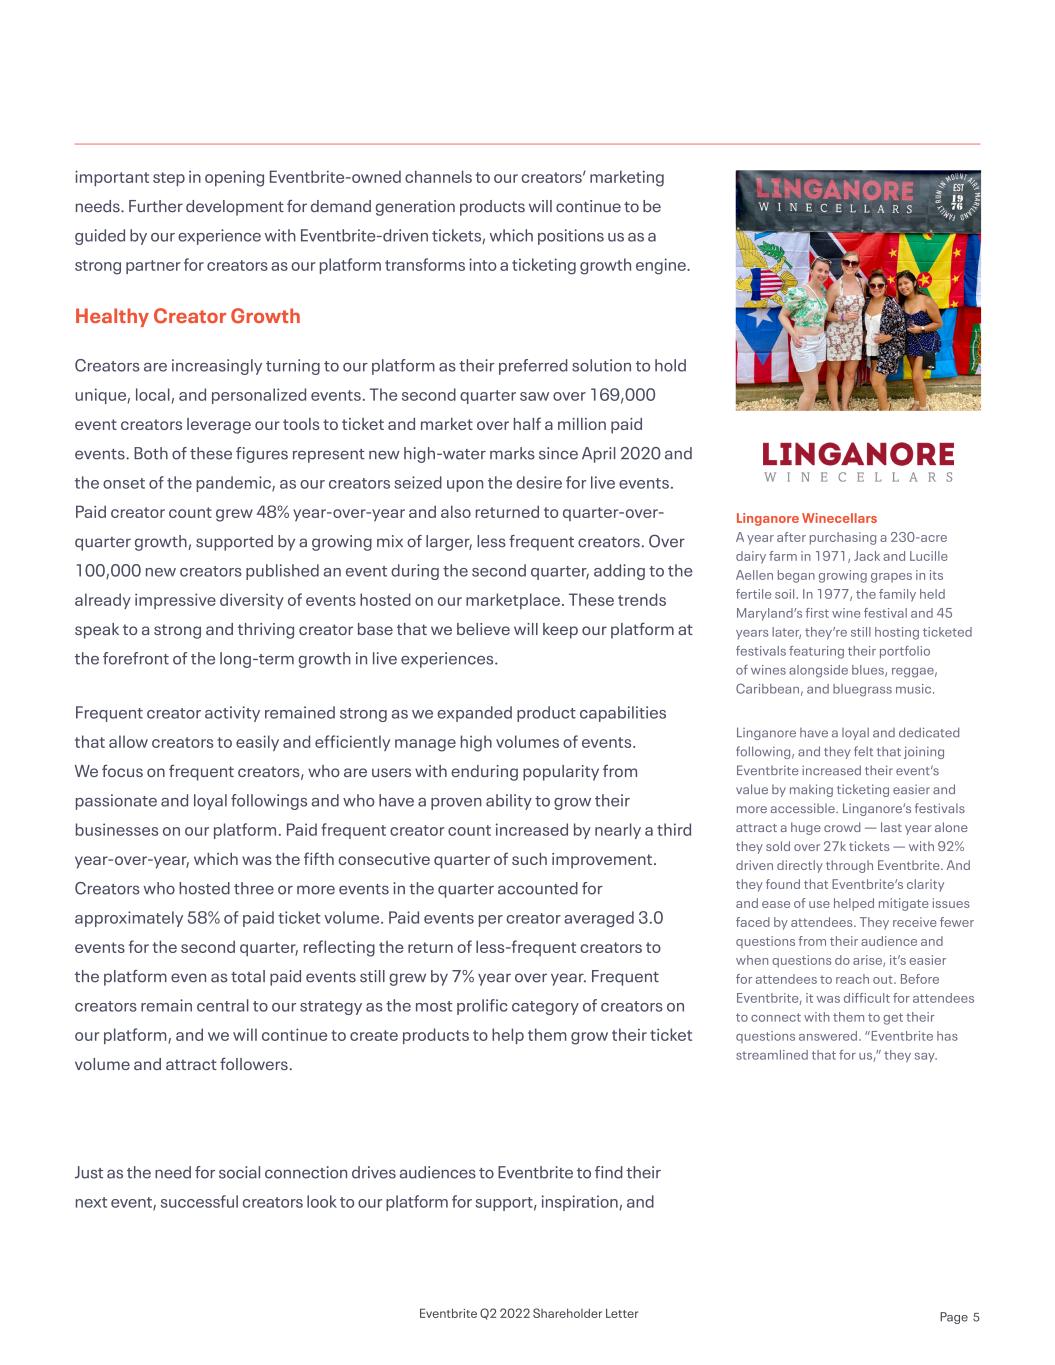
important step in opening Eventbrite-owned channels to our creators’ marketing needs. Further development for demand generation products will continue to be guided by our experience with Eventbrite-driven tickets, which positions us as a strong partner for creators as our platform transforms into a ticketing growth engine. Healthy Creator Growth Creators are increasingly turning to our platform as their preferred solution to hold unique, local, and personalized events. The second quarter saw over 169,000 event creators leverage our tools to ticket and market over half a million paid events. Both of these figures represent new high-water marks since April 2020 and the onset of the pandemic, as our creators seized upon the desire for live events. Paid creator count grew 48% year-over-year and also returned to quarter-over- quarter growth, supported by a growing mix of larger, less frequent creators. Over 100,000 new creators published an event during the second quarter, adding to the already impressive diversity of events hosted on our marketplace. These trends speak to a strong and thriving creator base that we believe will keep our platform at the forefront of the long-term growth in live experiences. Frequent creator activity remained strong as we expanded product capabilities that allow creators to easily and efficiently manage high volumes of events. We focus on frequent creators, who are users with enduring popularity from passionate and loyal followings and who have a proven ability to grow their businesses on our platform. Paid frequent creator count increased by nearly a third year-over-year, which was the fifth consecutive quarter of such improvement. Creators who hosted three or more events in the quarter accounted for approximately 58% of paid ticket volume. Paid events per creator averaged 3.0 events for the second quarter, reflecting the return of less-frequent creators to the platform even as total paid events still grew by 7% year over year. Frequent creators remain central to our strategy as the most prolific category of creators on our platform, and we will continue to create products to help them grow their ticket volume and attract followers. Just as the need for social connection drives audiences to Eventbrite to find their next event, successful creators look to our platform for support, inspiration, and Linganore Winecellars A year after purchasing a 230-acre dairy farm in 1971, Jack and Lucille Aellen began growing grapes in its fertile soil. In 1977, the family held Maryland’s first wine festival and 45 years later, they’re still hosting ticketed festivals featuring their portfolio of wines alongside blues, reggae, Caribbean, and bluegrass music. Linganore have a loyal and dedicated following, and they felt that joining Eventbrite increased their event’s value by making ticketing easier and more accessible. Linganore’s festivals attract a huge crowd — last year alone they sold over 27k tickets — with 92% driven directly through Eventbrite. And they found that Eventbrite’s clarity and ease of use helped mitigate issues faced by attendees. They receive fewer questions from their audience and when questions do arise, it’s easier for attendees to reach out. Before Eventbrite, it was difficult for attendees to connect with them to get their questions answered. “Eventbrite has streamlined that for us,” they say. Eventbrite Q2 2022 Shareholder Letter Page 5
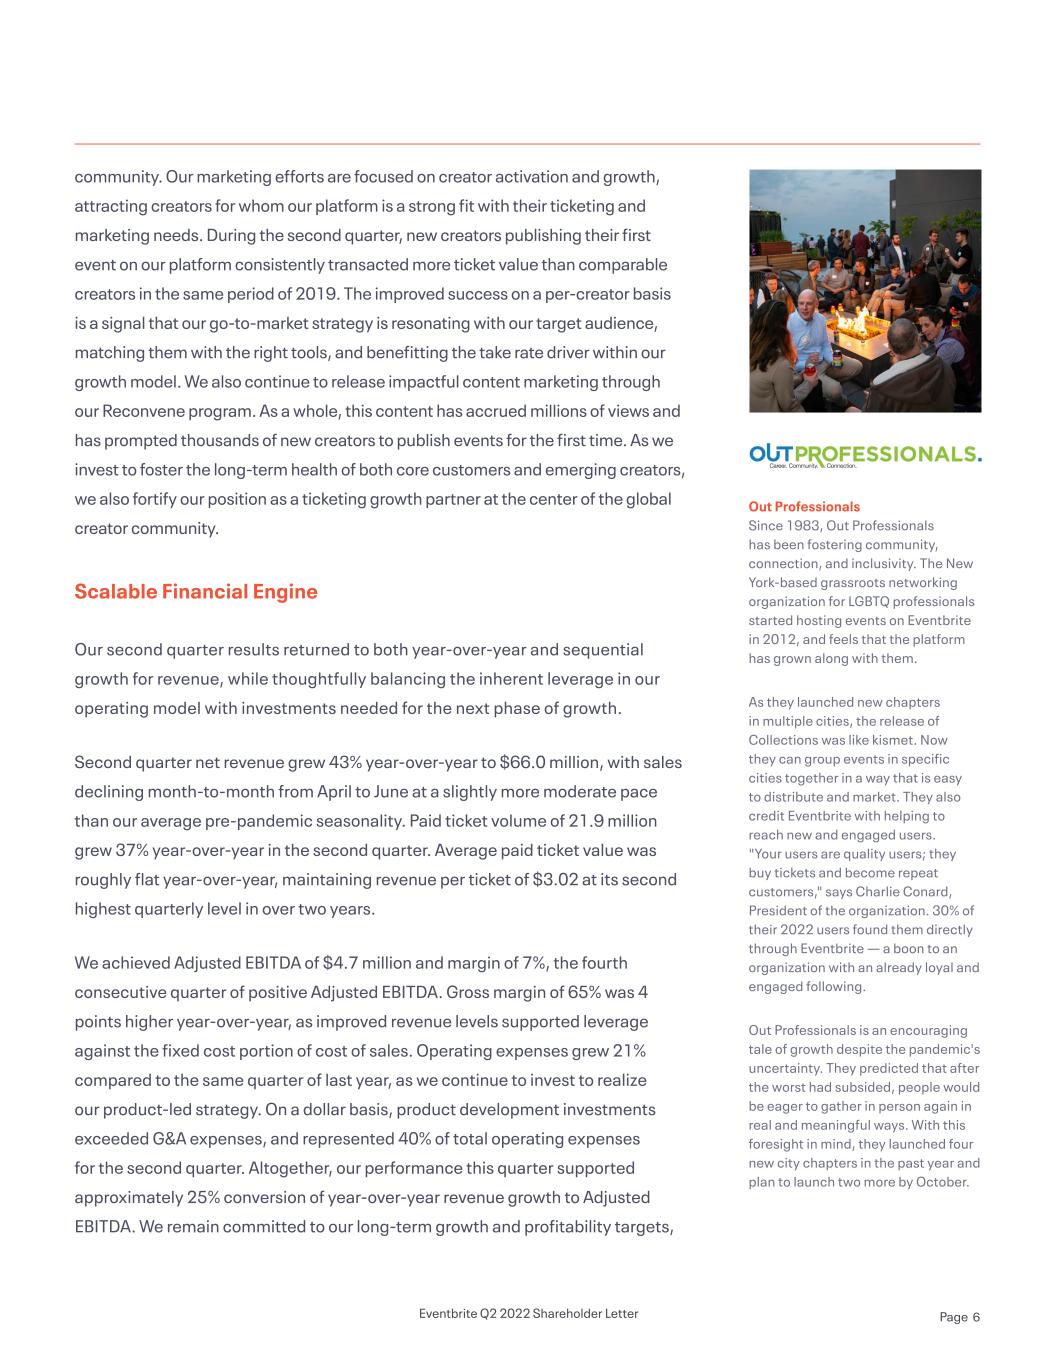
community. Our marketing efforts are focused on creator activation and growth, attracting creators for whom our platform is a strong fit with their ticketing and marketing needs. During the second quarter, new creators publishing their first event on our platform consistently transacted more ticket value than comparable creators in the same period of 2019. The improved success on a per-creator basis is a signal that our go-to-market strategy is resonating with our target audience, matching them with the right tools, and benefitting the take rate driver within our growth model. We also continue to release impactful content marketing through our Reconvene program. As a whole, this content has accrued millions of views and has prompted thousands of new creators to publish events for the first time. As we invest to foster the long-term health of both core customers and emerging creators, we also fortify our position as a ticketing growth partner at the center of the global creator community. Scalable Financial Engine Our second quarter results returned to both year-over-year and sequential growth for revenue, while thoughtfully balancing the inherent leverage in our operating model with investments needed for the next phase of growth. Second quarter net revenue grew 43% year-over-year to $66.0 million, with sales declining month-to-month from April to June at a slightly more moderate pace than our average pre-pandemic seasonality. Paid ticket volume of 21.9 million grew 37% year-over-year in the second quarter. Average paid ticket value was roughly flat year-over-year, maintaining revenue per ticket of $3.02 at its second highest quarterly level in over two years. We achieved Adjusted EBITDA of $4.7 million and margin of 7%, the fourth consecutive quarter of positive Adjusted EBITDA. Gross margin of 65% was 4 points higher year-over-year, as improved revenue levels supported leverage against the fixed cost portion of cost of sales. Operating expenses grew 21% compared to the same quarter of last year, as we continue to invest to realize our product-led strategy. On a dollar basis, product development investments exceeded G&A expenses, and represented 40% of total operating expenses for the second quarter. Altogether, our performance this quarter supported approximately 25% conversion of year-over-year revenue growth to Adjusted EBITDA. We remain committed to our long-term growth and profitability targets, Out Professionals Since 1983, Out Professionals has been fostering community, connection, and inclusivity. The New York-based grassroots networking organization for LGBTQ professionals started hosting events on Eventbrite in 2012, and feels that the platform has grown along with them. As they launched new chapters in multiple cities, the release of Collections was like kismet. Now they can group events in specific cities together in a way that is easy to distribute and market. They also credit Eventbrite with helping to reach new and engaged users. "Your users are quality users; they buy tickets and become repeat customers," says Charlie Conard, President of the organization. 30% of their 2022 users found them directly through Eventbrite — a boon to an organization with an already loyal and engaged following. Out Professionals is an encouraging tale of growth despite the pandemic's uncertainty. They predicted that after the worst had subsided, people would be eager to gather in person again in real and meaningful ways. With this foresight in mind, they launched four new city chapters in the past year and plan to launch two more by October. Eventbrite Q2 2022 Shareholder Letter Page 6
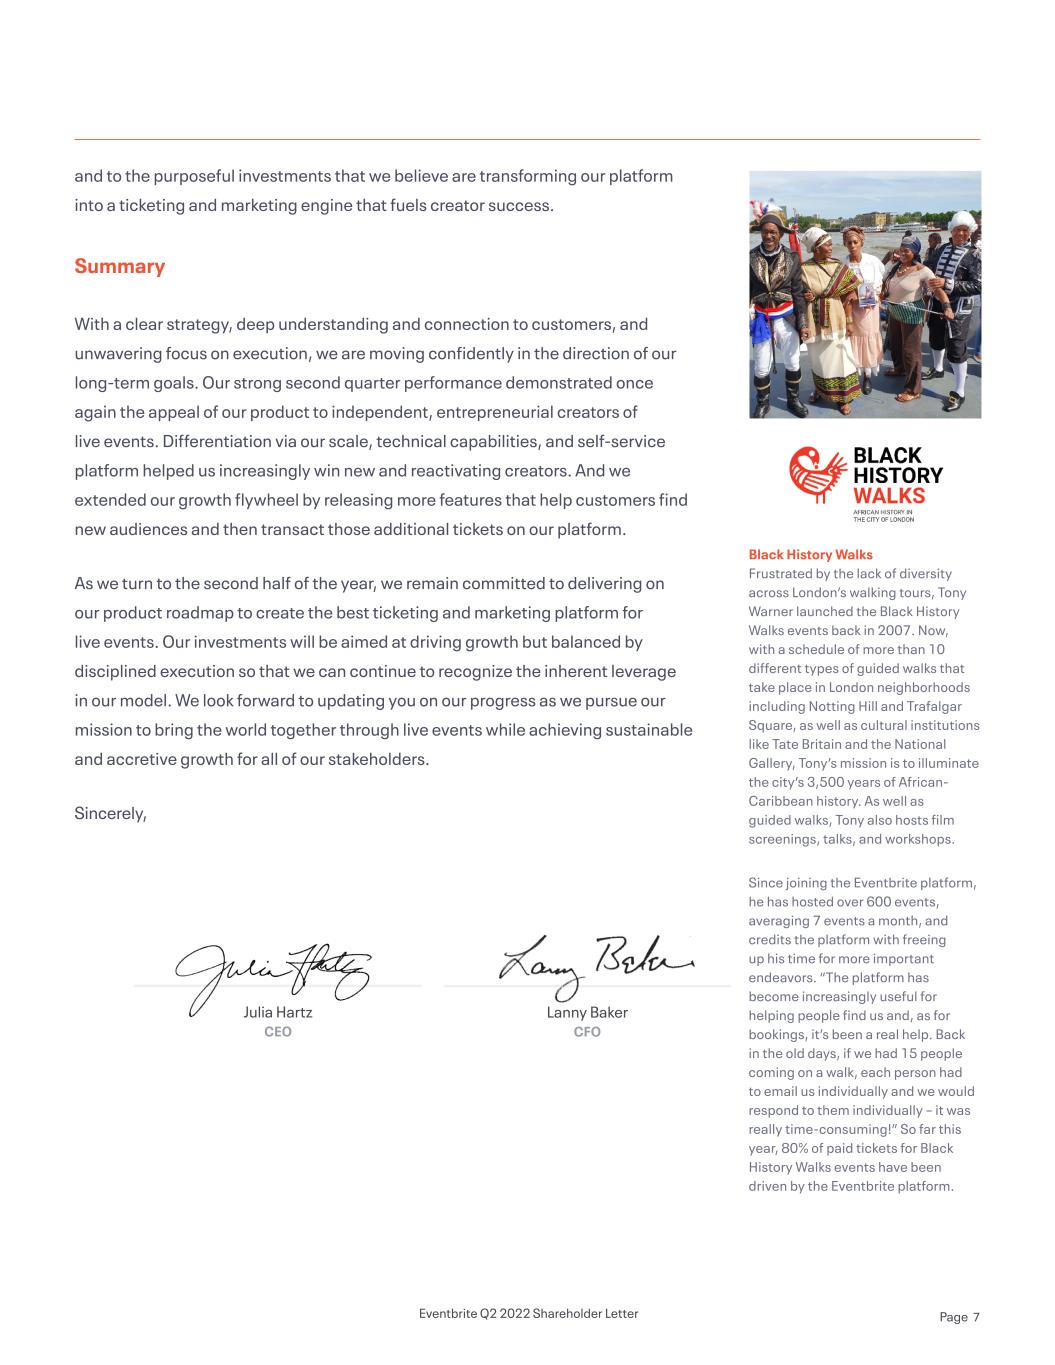
and to the purposeful investments that we believe are transforming our platform into a ticketing and marketing engine that fuels creator success. Summary With a clear strategy, deep understanding and connection to customers, and unwavering focus on execution, we are moving confidently in the direction of our long-term goals. Our strong second quarter performance demonstrated once again the appeal of our product to independent, entrepreneurial creators of live events. Differentiation via our scale, technical capabilities, and self-service platform helped us increasingly win new and reactivating creators. And we extended our growth flywheel by releasing more features that help customers find new audiences and then transact those additional tickets on our platform. As we turn to the second half of the year, we remain committed to delivering on our product roadmap to create the best ticketing and marketing platform for live events. Our investments will be aimed at driving growth but balanced by disciplined execution so that we can continue to recognize the inherent leverage in our model. We look forward to updating you on our progress as we pursue our mission to bring the world together through live events while achieving sustainable and accretive growth for all of our stakeholders. Sincerely, Julia Hartz CEO Lanny Baker CFO Black History Walks Frustrated by the lack of diversity across London’s walking tours, Tony Warner launched the Black History Walks events back in 2007. Now, with a schedule of more than 10 different types of guided walks that take place in London neighborhoods including Notting Hill and Trafalgar Square, as well as cultural institutions like Tate Britain and the National Gallery, Tony’s mission is to illuminate the city’s 3,500 years of African- Caribbean history. As well as guided walks, Tony also hosts film screenings, talks, and workshops. Since joining the Eventbrite platform, he has hosted over 600 events, averaging 7 events a month, and credits the platform with freeing up his time for more important endeavors. “The platform has become increasingly useful for helping people find us and, as for bookings, it’s been a real help. Back in the old days, if we had 15 people coming on a walk, each person had to email us individually and we would respond to them individually – it was really time-consuming!” So far this year, 80% of paid tickets for Black History Walks events have been driven by the Eventbrite platform. Eventbrite Q2 2022 Shareholder Letter Page 7
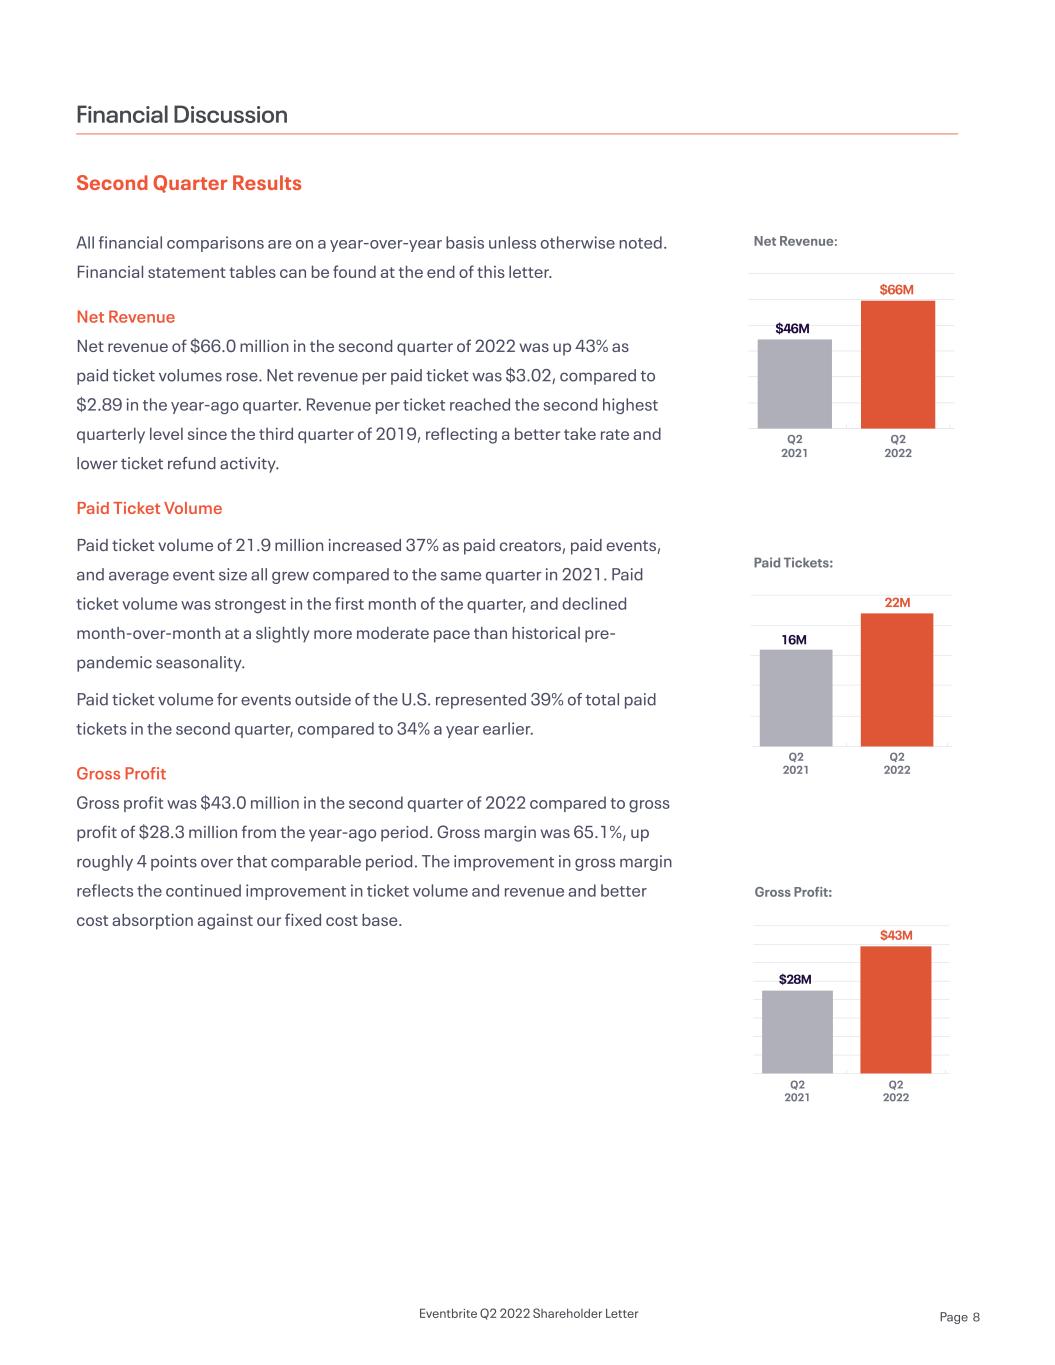
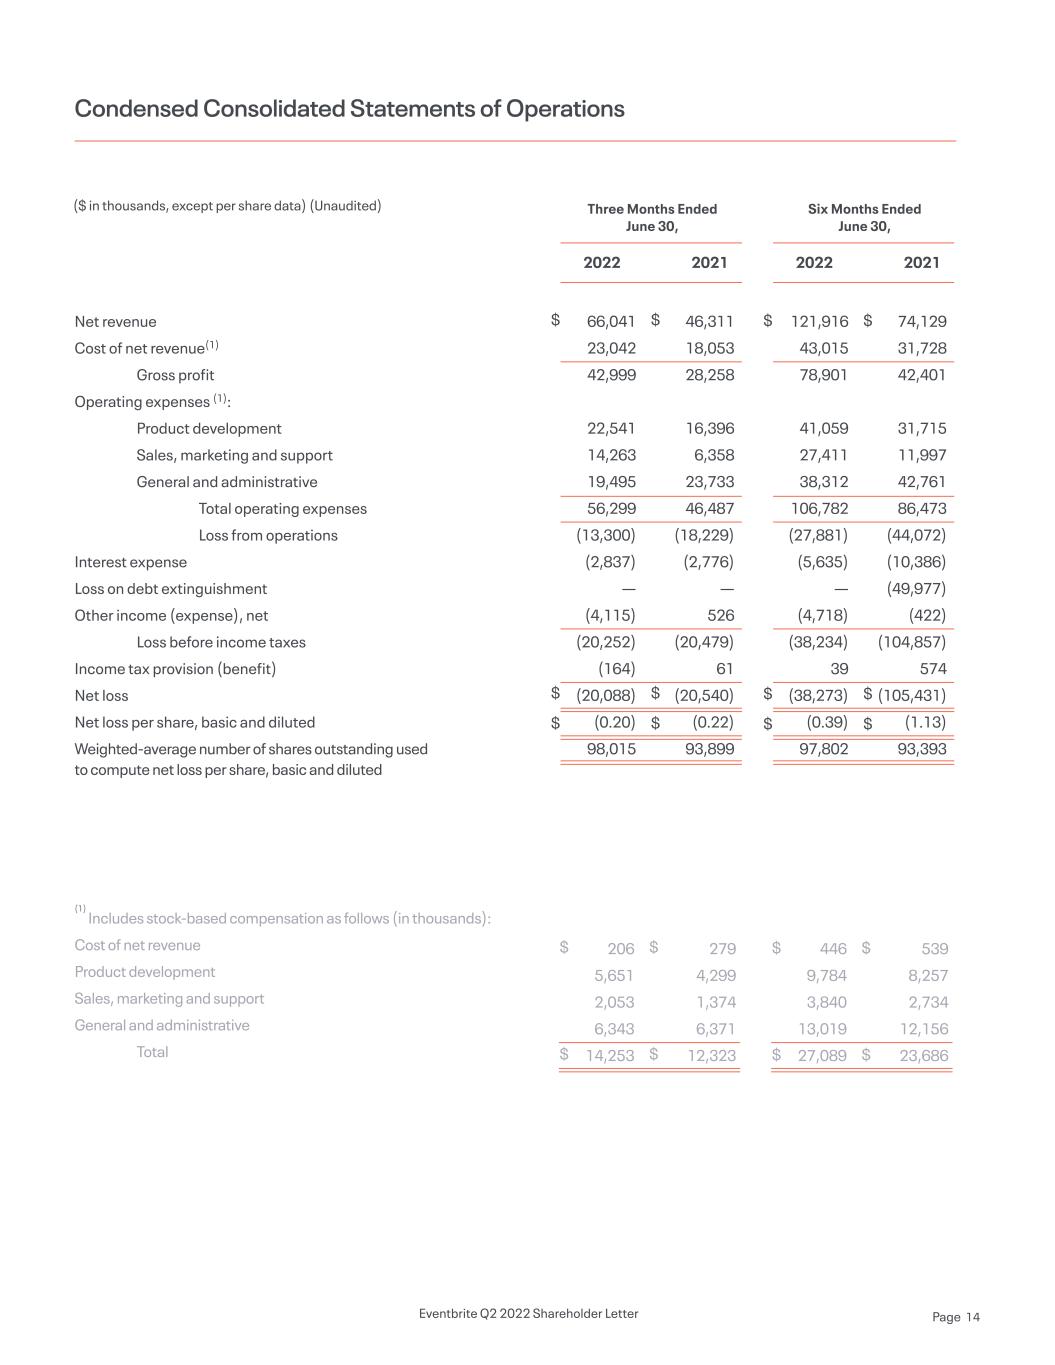
Second Quarter Results All financial comparisons are on a year-over-year basis unless otherwise noted. Financial statement tables can be found at the end of this letter. Net Revenue Net revenue of $66.0 million in the second quarter of 2022 was up 43% as paid ticket volumes rose. Net revenue per paid ticket was $3.02, compared to $2.89 in the year-ago quarter. Revenue per ticket reached the second highest quarterly level since the third quarter of 2019, reflecting a better take rate and lower ticket refund activity. Paid Ticket Volume Paid ticket volume of 21.9 million increased 37% as paid creators, paid events, and average event size all grew compared to the same quarter in 2021. Paid ticket volume was strongest in the first month of the quarter, and declined month-over-month at a slightly more moderate pace than historical pre- pandemic seasonality. Paid ticket volume for events outside of the U.S. represented 39% of total paid tickets in the second quarter, compared to 34% a year earlier. Gross Profit Gross profit was $43.0 million in the second quarter of 2022 compared to gross profit of $28.3 million from the year-ago period. Gross margin was 65.1%, up roughly 4 points over that comparable period. The improvement in gross margin reflects the continued improvement in ticket volume and revenue and better cost absorption against our fixed cost base. Financial Discussion Net Revenue: Paid Tickets: Gross Profit: Q2 2022 Q2 2021 $46M $66M Q2 2022 Q2 2021 16M 22M Q2 2022 Q2 2021 $28M $43M Eventbrite Q2 2022 Shareholder Letter Page 8
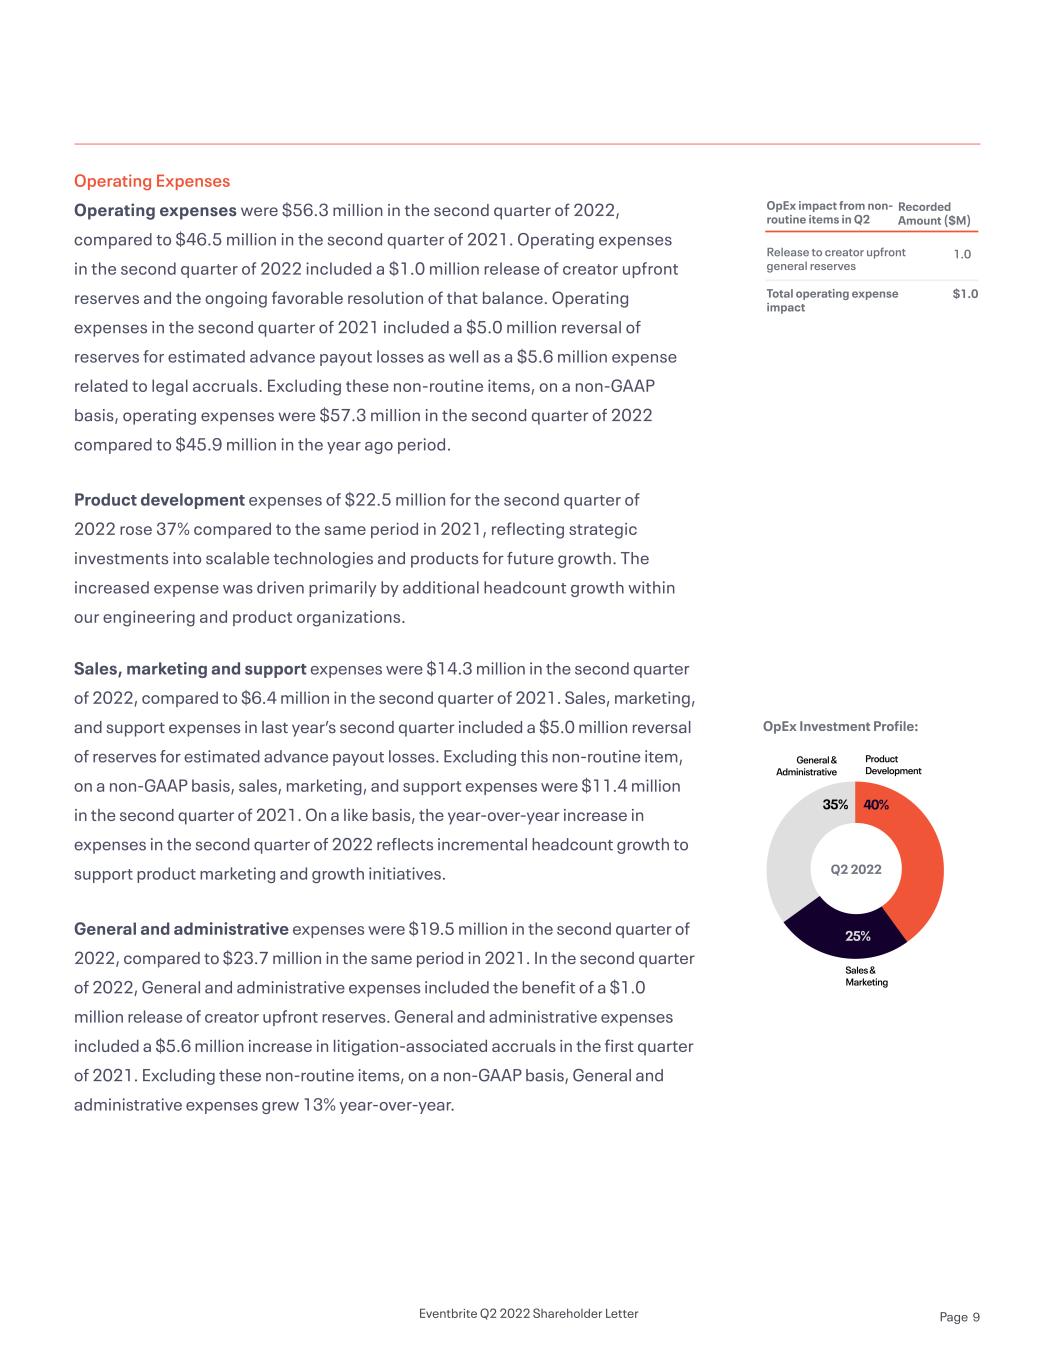
OpEx Investment Profile: Operating Expenses Operating expenses were $56.3 million in the second quarter of 2022, compared to $46.5 million in the second quarter of 2021. Operating expenses in the second quarter of 2022 included a $1.0 million release of creator upfront reserves and the ongoing favorable resolution of that balance. Operating expenses in the second quarter of 2021 included a $5.0 million reversal of reserves for estimated advance payout losses as well as a $5.6 million expense related to legal accruals. Excluding these non-routine items, on a non-GAAP basis, operating expenses were $57.3 million in the second quarter of 2022 compared to $45.9 million in the year ago period. Product development expenses of $22.5 million for the second quarter of 2022 rose 37% compared to the same period in 2021, reflecting strategic investments into scalable technologies and products for future growth. The increased expense was driven primarily by additional headcount growth within our engineering and product organizations. Sales, marketing and support expenses were $14.3 million in the second quarter of 2022, compared to $6.4 million in the second quarter of 2021. Sales, marketing, and support expenses in last year’s second quarter included a $5.0 million reversal of reserves for estimated advance payout losses. Excluding this non-routine item, on a non-GAAP basis, sales, marketing, and support expenses were $11.4 million in the second quarter of 2021. On a like basis, the year-over-year increase in expenses in the second quarter of 2022 reflects incremental headcount growth to support product marketing and growth initiatives. General and administrative expenses were $19.5 million in the second quarter of 2022, compared to $23.7 million in the same period in 2021. In the second quarter of 2022, General and administrative expenses included the benefit of a $1.0 million release of creator upfront reserves. General and administrative expenses included a $5.6 million increase in litigation-associated accruals in the first quarter of 2021. Excluding these non-routine items, on a non-GAAP basis, General and administrative expenses grew 13% year-over-year. Q2 2022 35% General & Administrative 25% Sales & Marketing 40% Product Development OpEx impact from non- routine items in Q2 Release to creator upfront general reserves Total operating expense impact Recorded Amount ($M) 1.0 $1.0 Eventbrite Q2 2022 Shareholder Letter Page 9
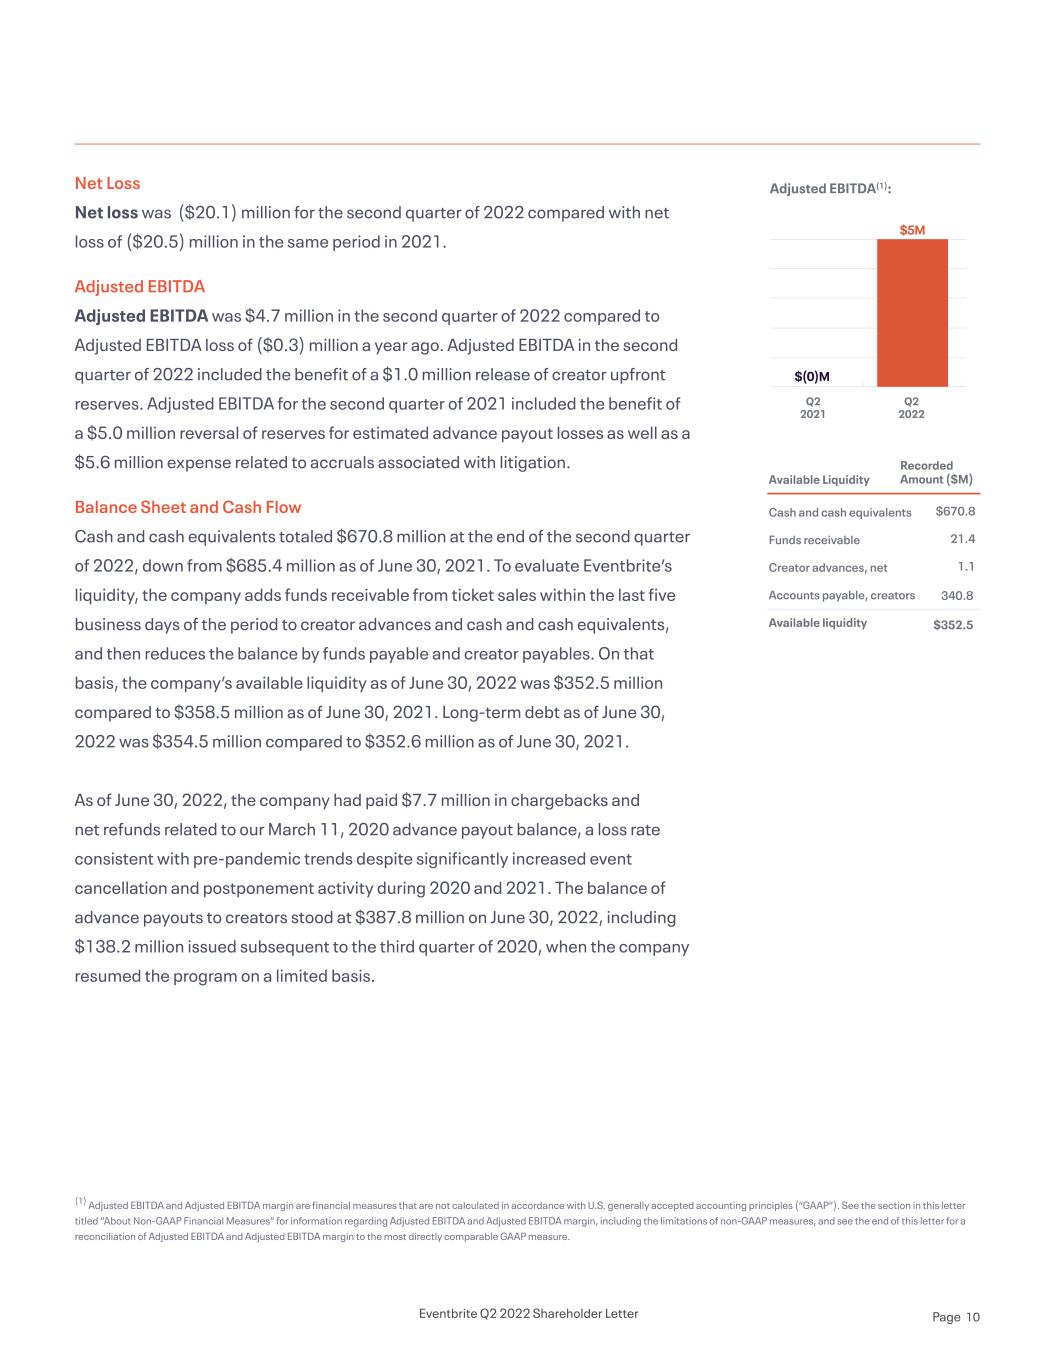
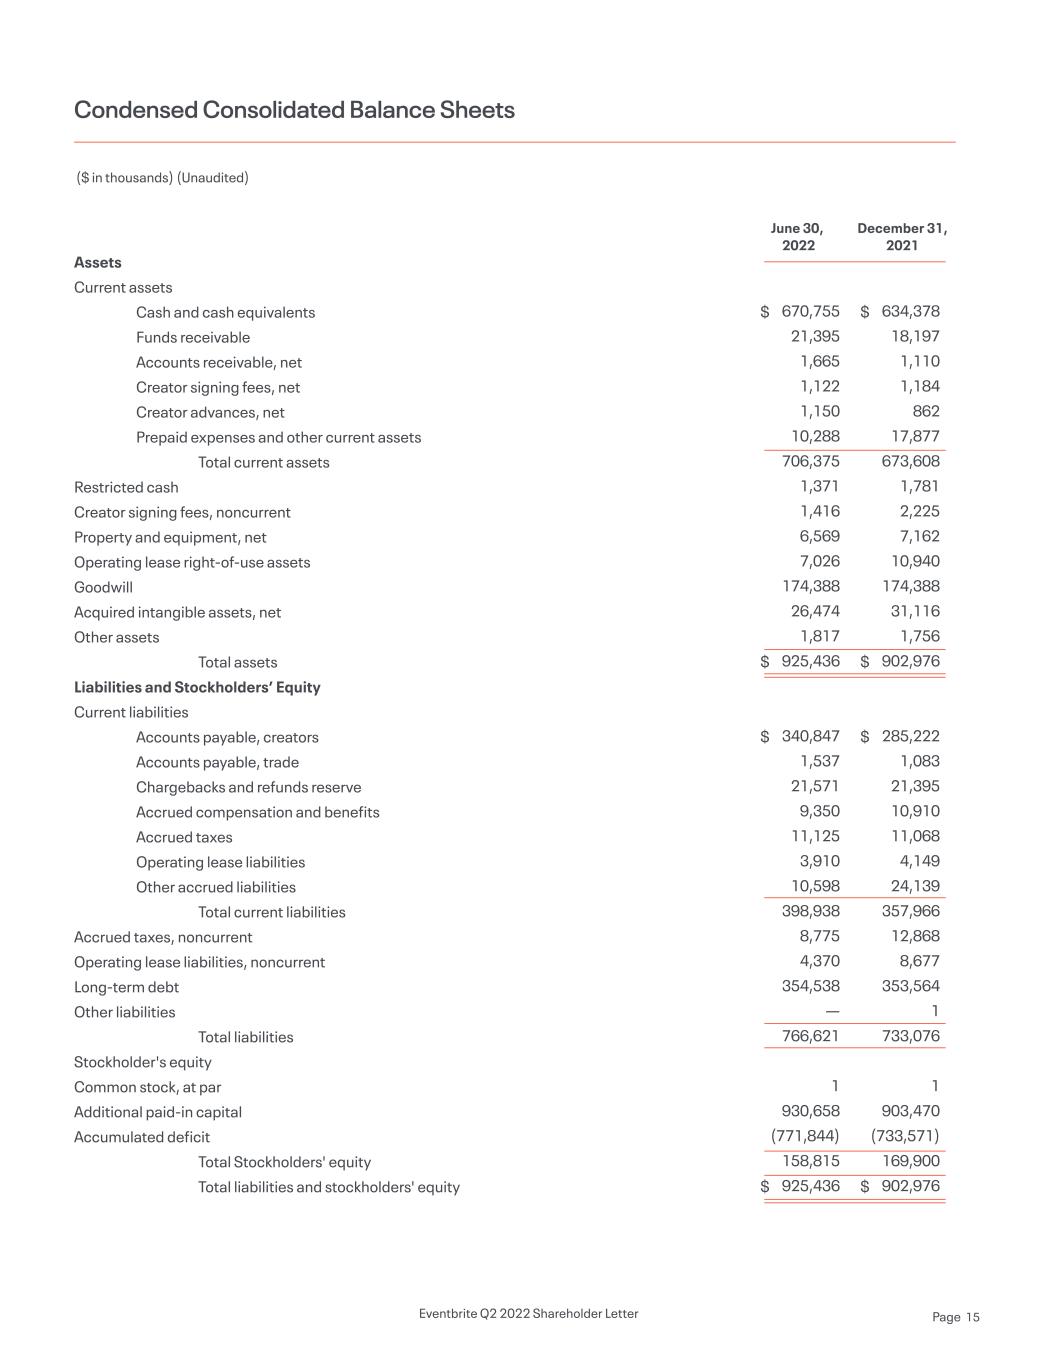
($7M) Adjusted EBITDA(1): Available Liquidity Cash and cash equivalents Funds receivable Creator advances, net Accounts payable, creators Available liquidity Recorded Amount ($M) $670.80 21.40 1.10 340.80 l $352.50 Net Loss Net loss was ($20.1) million for the second quarter of 2022 compared with net loss of ($20.5) million in the same period in 2021. Adjusted EBITDA Adjusted EBITDA was $4.7 million in the second quarter of 2022 compared to Adjusted EBITDA loss of ($0.3) million a year ago. Adjusted EBITDA in the second quarter of 2022 included the benefit of a $1.0 million release of creator upfront reserves. Adjusted EBITDA for the second quarter of 2021 included the benefit of a $5.0 million reversal of reserves for estimated advance payout losses as well as a $5.6 million expense related to accruals associated with litigation. Balance Sheet and Cash Flow Cash and cash equivalents totaled $670.8 million at the end of the second quarter of 2022, down from $685.4 million as of June 30, 2021. To evaluate Eventbrite’s liquidity, the company adds funds receivable from ticket sales within the last five business days of the period to creator advances and cash and cash equivalents, and then reduces the balance by funds payable and creator payables. On that basis, the company’s available liquidity as of June 30, 2022 was $352.5 million compared to $358.5 million as of June 30, 2021. Long-term debt as of June 30, 2022 was $354.5 million compared to $352.6 million as of June 30, 2021. As of June 30, 2022, the company had paid $7.7 million in chargebacks and net refunds related to our March 11, 2020 advance payout balance, a loss rate consistent with pre-pandemic trends despite significantly increased event cancellation and postponement activity during 2020 and 2021. The balance of advance payouts to creators stood at $387.8 million on June 30, 2022, including $138.2 million issued subsequent to the third quarter of 2020, when the company resumed the program on a limited basis. Q2 2022 Q2 2021 $(0)M $5M (1) Adjusted EBITDA and Adjusted EBITDA margin are financial measures that are not calculated in accordance with U.S. generally accepted accounting principles (“GAAP”). See the section in this letter titled “About Non-GAAP Financial Measures” for information regarding Adjusted EBITDA and Adjusted EBITDA margin, including the limitations of non-GAAP measures, and see the end of this letter for a reconciliation of Adjusted EBITDA and Adjusted EBITDA margin to the most directly comparable GAAP measure. Eventbrite Q2 2022 Shareholder Letter Page 10
Based upon current information, we anticipate third quarter 2022 revenue will be within a range of $65 million to $68 million. We expect sustained consumer demand for live events in the third quarter, influenced by the improving public health climate and consumer appetite for the events on our platform. We are also factoring in a cautious near-term view of creators’ confidence to host events in light of shifting macroeconomic conditions including potentially inflation, labor shortages, interest rates, economic recession, and other factors. Business Outlook Eventbrite Q2 2022 Shareholder Letter Page 11
Eventbrite will hold a conference call and live webcast on July 28, 2022 at 2:00 p.m. PDT to discuss the second quarter 2022 financial results. To listen to a live audio webcast, please visit Eventbrite’s Investor Relations website at https://investor.eventbrite.com/overview/default.aspx. A replay of the webcast will be available at the same website. About Eventbrite Eventbrite is a global self-service ticketing, marketing, and experience technology platform that serves a community of hundreds of thousands of event creators in nearly 180 countries. Since inception, Eventbrite has been at the center of the experience economy, transforming the way people organize and attend events. The company was founded by Julia Hartz, Kevin Hartz and Renaud Visage, with a vision to build a self-service platform that would make it possible for anyone to create and sell tickets to live experiences. In 2022, Eventbrite was recognized as a Great Place to Work® based on employees’ satisfaction with the company culture, flexibility and great benefits. The Eventbrite platform provides an intuitive, secure, and reliable service that enables creators to plan and execute their live and online events, whether it’s an annual culinary festival attracting thousands of foodies, a professional webinar, a weekly yoga workshop or a youth dance class. With over 290 million tickets distributed for over 5 million total events in 2021, Eventbrite is where people all over the world discover new things to do or new ways to do more of what they love. Learn more at www.eventbrite.com. Earnings Webcast The neon icons can be used to convey abstract concepts and work well in presentations. They should feel active and expressive. Feel free to expand on these as you build out the experience. Eventbrite Q2 2022 Shareholder Letter Page 12
Forward-Looking Statements This letter contains forward-looking statements within the meaning of Section 27A of the Securities Act of 1933, as amended, and Section 21E of the Securities Exchange Act of 1934, as amended, that involve substantial risks and uncertainties. All statements other than statements of historical fact could be deemed forward-looking, including, but not limited to, statements regarding the future performance of Eventbrite, Inc. and its consolidated subsidiaries (the “Company”); the Company’s business model and investments to support growth, including the impact on results; the Company’s expectations regarding the development of its platform and products; and creator growth the Company’s scalable financial engine and expectations regarding growth and further improvements in its margin profile, profitability and adjusted EBITDA; and the Company’s expectations described under “Business Outlook” above. In some cases, forward-looking statements can be identified by terms such as “may,” “will,” “appears,” “shall,” “should,” “expects,” “plans,” “anticipates,” “could,” “intends,” “target,” “projects,” “contemplates,” “believes,” “estimates,” “predicts,” “potential,” or “continue,” or the negative of these words or other similar terms or expressions that concern our expectations, strategy, plans, or intentions. Such statements are subject to a number of known and unknown risks, uncertainties, assumptions, and other factors that may cause the Company’s actual results, performance, or achievements to differ materially from results expressed or implied in this letter. Investors are cautioned not to place undue reliance on these statements. Actual results could differ materially from those expressed or implied, and reported results should not be considered as an indication of future performance. The forward-looking statements contained in this letter are also subject to additional risks, uncertainties and factors, including those more fully described in the Company’s filings with the Securities and Exchange Commission, including the Company’s Annual Report on Form 10-K and Quarterly Reports on Form 10-Q. Further information on potential risks that could affect actual results will be included in the subsequent periodic and current reports and other filings that the Company makes with the Securities and Exchange Commission from time to time. All forward-looking statements are based on information and estimates available to the Company at the time of this letter and are not guarantees of future performance. Except as required by law, the Company assumes no obligation to update any of the statements in this letter. Disclaimer Regarding Ticketing, Creator and Event Metrics This presentation includes certain measures related to our ticketing business, such as paid tickets, paid creators and paid events. We believe that the use of these metrics is helpful to our investors as these metrics are used by management in assessing the health of our business and our operating performance. These metrics are based on what we believe to be reasonable estimates for the applicable period of measurement. There are inherent challenges in measuring these metrics, and we regularly review and may adjust our processes for calculating our internal metrics to improve their accuracy. You should not consider these metrics in isolation or as substitutes for analysis of our results of operations as reported under GAAP. About Non-GAAP Financial Measures We believe that the use of Adjusted EBITDA, Adjusted EBITDA margin and Available Liquidity is helpful to our investors in understanding and evaluating our results of operations and useful measures for period-to-period comparisons of our business performance as they are metrics used by management in assessing the health of our business and our operating performance, making operating decisions, and performing strategic planning and annual budgeting. These measures are not prepared in accordance with GAAP and have limitations as an analytical tool, and you should not consider them in isolation or as a substitute for analysis of our results of operations as reported under GAAP. In addition, other companies may not calculate non-GAAP financial measures in the same manner as we calculate them, limiting their usefulness as comparative measures. You are encouraged to evaluate the adjustments and the reasons we consider them appropriate. Adjusted EBITDA We calculate Adjusted EBITDA as net loss adjusted to exclude depreciation and amortization, stock-based compensation expense, interest expense, loss on debt extinguishment, direct and indirect acquisition related costs, employer taxes related to employee transactions and other income (expense), which consisted of interest income, foreign exchange rate gains and losses, and income tax provision (benefit). Adjusted EBITDA should not be considered as an alternative to net loss or any other measure of financial performance calculated and presented in accordance with GAAP. Some of the limitations of Adjusted EBITDA include (i) Adjusted EBITDA does not properly reflect capital spending that occurs off of the income statement or account for future contractual commitments, (ii) although depreciation and amortization are non-cash charges, the underlying assets may need to be replaced and Adjusted EBITDA does not reflect these capital expenditures and (iii) Adjusted EBITDA does not reflect the interest and principal required to service our indebtedness. In evaluating Adjusted EBITDA, you should be aware that in the future we expect to incur expenses similar to the adjustments in this letter. Our presentation of Adjusted EBITDA should not be construed as an inference that our future results will be unaffected by these expenses or any unusual or non-recurring items. When evaluating our performance, you should consider Adjusted EBITDA alongside other financial performance measures, including our net loss and other GAAP results. Adjusted EBITDA Margin Adjusted EBITDA Margin is defined as Adjusted EBITDA divided by revenue. Because of the limitations described above, you should consider Adjusted EBITDA and Adjusted EBITDA Margin alongside other financial performance measures, including net loss and our other GAAP results. Available Liquidity To evaluate Eventbrite’s liquidity, the company adds funds receivable from ticket sales within the last five business days of the period to creator advances and cash and cash equivalents, and then reduces the balance by funds payable and creator payables. . Eventbrite Q2 2022 Shareholder Letter Page 13
Net revenue Cost of net revenue(1) Gross profit Operating expenses (1): Product development Sales, marketing and support General and administrative Total operating expenses Loss from operations Interest expense Loss on debt extinguishment Other income (expense), net Loss before income taxes Income tax provision (benefit) Net loss Net loss per share, basic and diluted Weighted-average number of shares outstanding used to compute net loss per share, basic and diluted Condensed Consolidated Statements of Operations ($ in thousands, except per share data) (Unaudited) $ $ $ $ $ $ 74,129 31,728 42,401 31,715 11,997 42,761 86,473 (44,072) (10,386) (49,977) (422) (104,857) 574 (105,431) (1.13) 93,393 46,311 18,053 28,258 16,396 6,358 23,733 46,487 (18,229) (2,776) — 526 (20,479) 61 (20,540) (0.22) 93,899 Six Months Ended June 30, Three Months Ended June 30, 20222022 20212021 $ $ $ $ $ $ 121,916 43,015 78,901 41,059 27,411 38,312 106,782 (27,881) (5,635) — (4,718) (38,234) 39 (38,273) (0.39) 97,802 66,041 23,042 42,999 22,541 14,263 19,495 56,299 (13,300) (2,837) — (4,115) (20,252) (164) (20,088) (0.20) 98,015 (1) Includes stock-based compensation as follows (in thousands): Cost of net revenue Product development Sales, marketing and support General and administrative Total $ $ $ $ $ $ $ $ $ $ $ $ 446 9,784 3,840 13,019 27,089 206 5,651 2,053 6,343 14,253 539 8,257 2,734 12,156 23,686 279 4,299 1,374 6,371 12,323 Eventbrite Q2 2022 Shareholder Letter Page 14
Assets Current assets Cash and cash equivalents Funds receivable Accounts receivable, net Creator signing fees, net Creator advances, net Prepaid expenses and other current assets Total current assets Restricted cash Creator signing fees, noncurrent Property and equipment, net Operating lease right-of-use assets Goodwill Acquired intangible assets, net Other assets Total assets Liabilities and Stockholders’ Equity Current liabilities Accounts payable, creators Accounts payable, trade Chargebacks and refunds reserve Accrued compensation and benefits Accrued taxes Operating lease liabilities Other accrued liabilities Total current liabilities Accrued taxes, noncurrent Operating lease liabilities, noncurrent Long-term debt Other liabilities Total liabilities Stockholder's equity Common stock, at par Additional paid-in capital Accumulated deficit Total Stockholders' equity Total liabilities and stockholders' equity Condensed Consolidated Balance Sheets ($ in thousands) (Unaudited) June 30, 2022 $ $ $ $ 670,755 21,395 1,665 1,122 1,150 10,288 706,375 1,371 1,416 6,569 7,026 174,388 26,474 1,817 925,436 340,847 1,537 21,571 9,350 11,125 3,910 10,598 398,938 8,775 4,370 354,538 — 766,621 1 930,658 (771,844) 158,815 925,436 December 31, 2021 $ $ $ $ 634,378 18,197 1,110 1,184 862 17,877 673,608 1,781 2,225 7,162 10,940 174,388 31,116 1,756 902,976 285,222 1,083 21,395 10,910 11,068 4,149 24,139 357,966 12,868 8,677 353,564 1 733,076 1 903,470 (733,571) 169,900 902,976 Eventbrite Q2 2022 Shareholder Letter Page 15
Cash flows from operating activities Net loss Adjustments to reconcile net loss to net cash provided by operating activities: Depreciation and amortization Stock-based compensation expense Amortization of debt discount and issuance costs Loss on debt extinguishment Payment in kind interest Noncash operating lease expense Amortization of creator signing fees Adjustments related to creator advances, creator signing fees, and allowance for credit losses Provision for chargebacks and refunds Other Changes in operating assets and liabilities: Accounts receivable Funds receivable Creator signing fees & creator advances Prepaid expenses and other assets Accounts payable, creators Accounts payable Chargebacks and refunds reserve Accrued compensation and benefits Accrued taxes Operating lease liabilities Other accrued liabilities Payment in kind interest Net cash provided by operating activities Cash flows from investing activities Purchases of property and equipment Capitalized internal-use software development costs Cash paid for acquisitions Net cash used in investing activities (38,273) 7,249 27,089 974 — — 1,563 674 (2,035) 8,235 647 (1,144) (3,198) 2,533 7,528 55,625 410 (8,059) (1,560) (4,649) (2,195) (12,372) — 39,042 (708) (1,060) (1,125) (2,893) (105,431) 10,064 23,686 2,905 49,977 2,178 3,184 1,600 2,646 (2,522) 530 (513) (5,758) 2,522 1,972 155,918 (531) (7,236) 3,246 (603) (3,520) 7,220 (8,962) 132,572 (328) (547) — (875) Condensed Consolidated Statements of Cash Flows ($ in thousands) (Unaudited) Six Months Ended June 30, 2022 2021 $ $ Eventbrite Q2 2022 Shareholder Letter Page 16
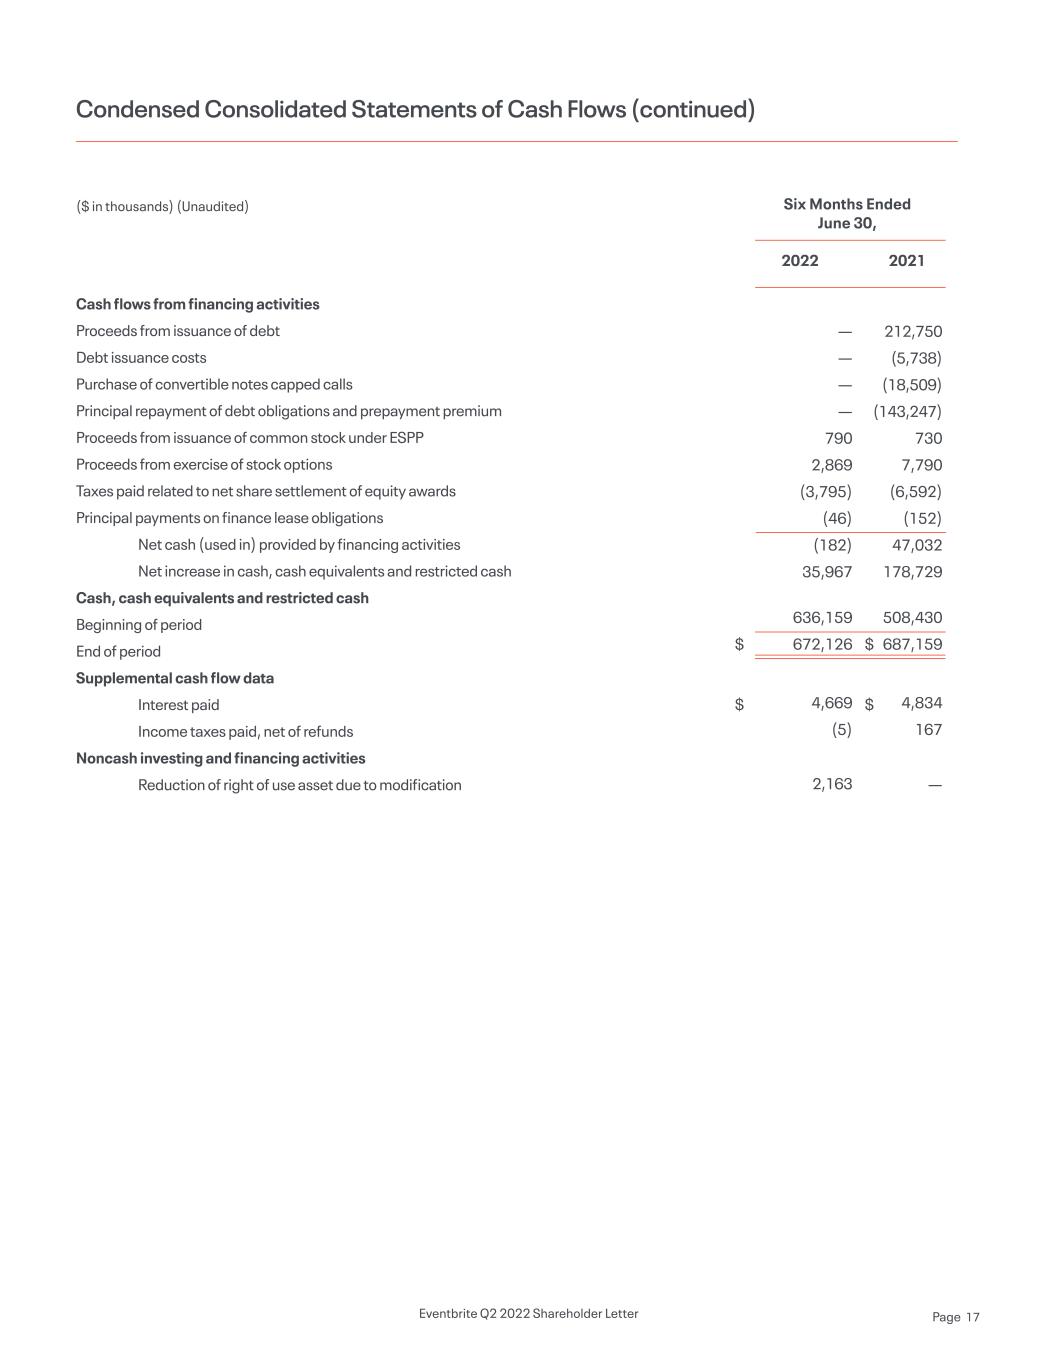
Cash flows from financing activities Proceeds from issuance of debt Debt issuance costs Purchase of convertible notes capped calls Principal repayment of debt obligations and prepayment premium Proceeds from issuance of common stock under ESPP Proceeds from exercise of stock options Taxes paid related to net share settlement of equity awards Principal payments on finance lease obligations Net cash (used in) provided by financing activities Net increase in cash, cash equivalents and restricted cash Cash, cash equivalents and restricted cash Beginning of period End of period Supplemental cash flow data Interest paid Income taxes paid, net of refunds Noncash investing and financing activities Reduction of right of use asset due to modification — — — — 790 2,869 (3,795) (46) (182) 35,967 636,159 672,126 4,669 (5) 2,163 212,750 (5,738) (18,509) (143,247) 730 7,790 (6,592) (152) 47,032 178,729 508,430 687,159 4,834 167 — Condensed Consolidated Statements of Cash Flows (continued) ($ in thousands) (Unaudited) Six Months Ended June 30, 2022 2021 $ $ $ $ Eventbrite Q2 2022 Shareholder Letter Page 17
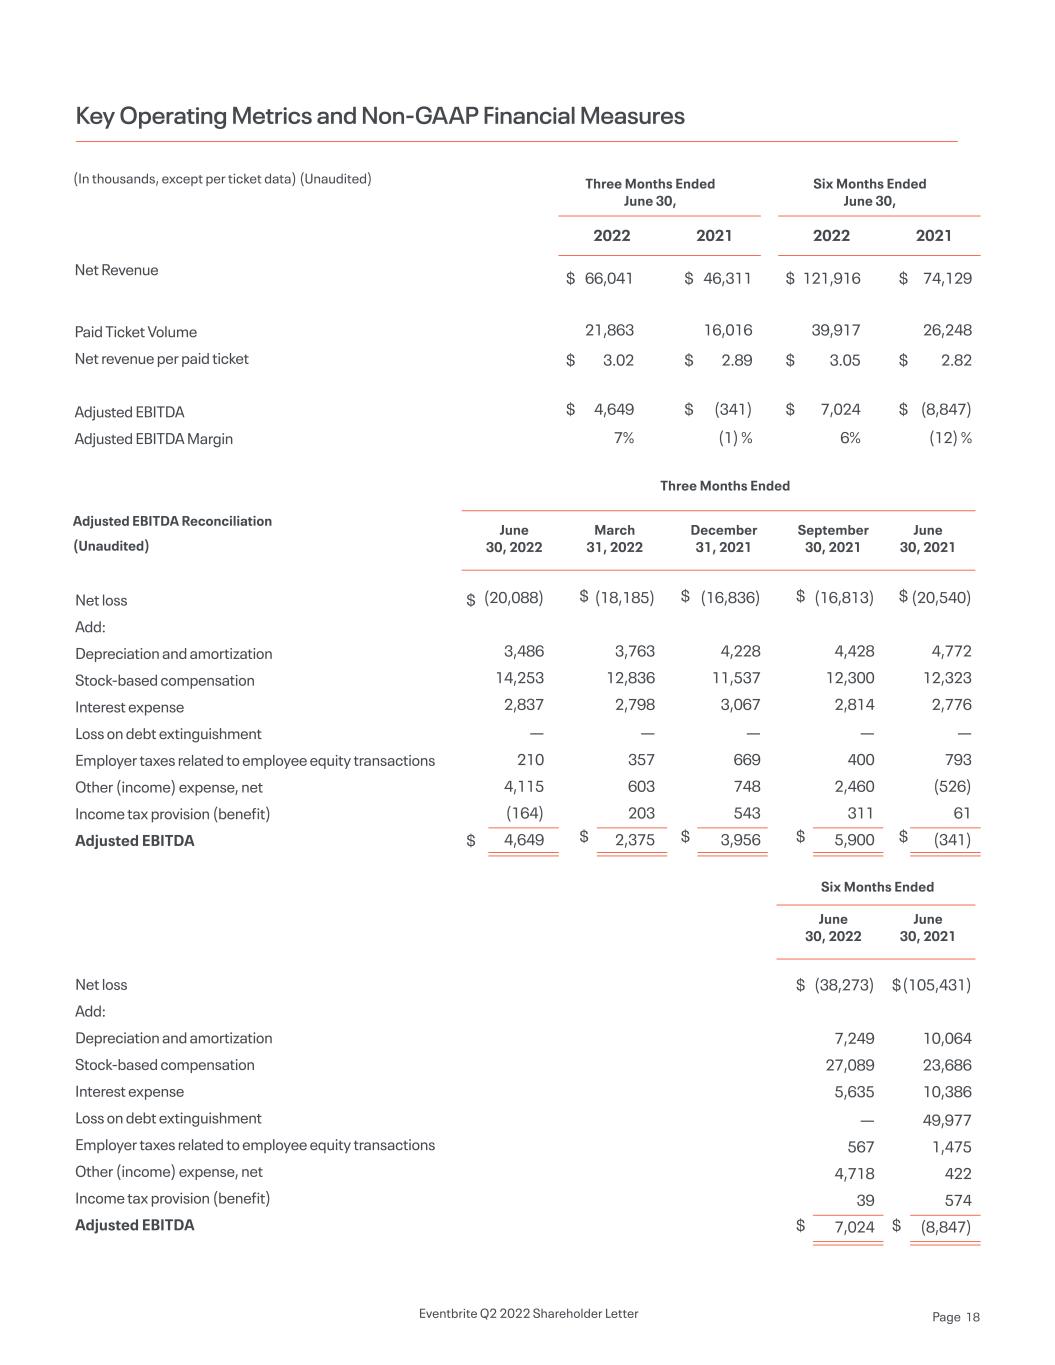
Key Operating Metrics and Non-GAAP Financial Measures Net Revenue Paid Ticket Volume Net revenue per paid ticket Adjusted EBITDA Adjusted EBITDA Margin (In thousands, except per ticket data) (Unaudited) Six Months Ended June 30, Three Months Ended June 30, Three Months Ended Six Months Ended 20222022 20212021 121,916 39,917 3.05 7,024 6% 66,041 21,863 3.02 4,649 7% 74,129 26,248 2.82 (8,847) (12) % 46,311 16,016 2.89 (341) (1) % $ $ $ $ $ $ $ $ $ $ $ $ Adjusted EBITDA Reconciliation (Unaudited) June 30, 2022 March 31, 2022 December 31, 2021 September 30, 2021 June 30, 2022 June 30, 2021 June 30, 2021 Net loss Add: Depreciation and amortization Stock-based compensation Interest expense Loss on debt extinguishment Employer taxes related to employee equity transactions Other (income) expense, net Income tax provision (benefit) Adjusted EBITDA Net loss Add: Depreciation and amortization Stock-based compensation Interest expense Loss on debt extinguishment Employer taxes related to employee equity transactions Other (income) expense, net Income tax provision (benefit) Adjusted EBITDA (20,088) 3,486 14,253 2,837 — 210 4,115 (164) 4,649 (18,185) 3,763 12,836 2,798 — 357 603 203 2,375 (16,836) 4,228 11,537 3,067 — 669 748 543 3,956 (16,813) 4,428 12,300 2,814 — 400 2,460 311 5,900 (38,273) 7,249 27,089 5,635 — 567 4,718 39 7,024 (20,540) 4,772 12,323 2,776 — 793 (526) 61 (341) (105,431) 10,064 23,686 10,386 49,977 1,475 422 574 (8,847) $ $ $ $ $ $ $ $ $ $ $ $ $ $ Eventbrite Q2 2022 Shareholder Letter Page 18
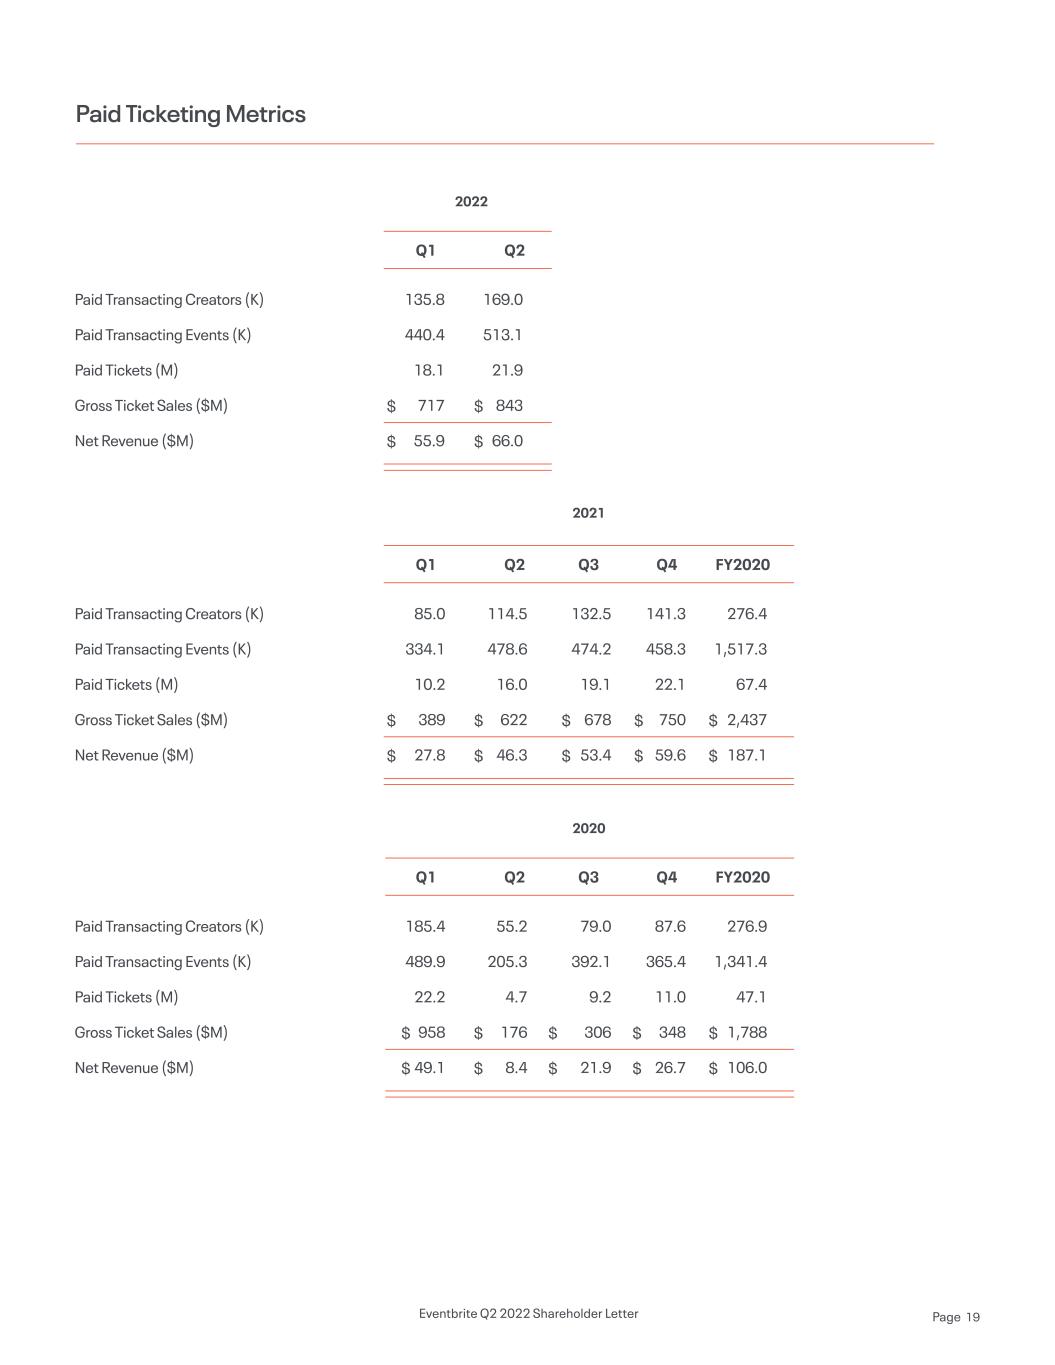
Paid Ticketing Metrics Paid Transacting Creators (K) Paid Transacting Events (K) Paid Tickets (M) Gross Ticket Sales ($M) Net Revenue ($M) Paid Transacting Creators (K) Paid Transacting Events (K) Paid Tickets (M) Gross Ticket Sales ($M) Net Revenue ($M) Paid Transacting Creators (K) Paid Transacting Events (K) Paid Tickets (M) Gross Ticket Sales ($M) Net Revenue ($M) 85.0 334.1 10.2 389 27.8 185.4 489.9 22.2 958 49.1 $ $ $ $ $ $ $ $ $ $ $ $ $ $ $ $ $ $ $ $ $ $ $ $ 114.5 478.6 16.0 622 46.3 55.2 205.3 4.7 176 8.4 132.5 474.2 19.1 678 53.4 79.0 392.1 9.2 306 21.9 141.3 458.3 22.1 750 59.6 87.6 365.4 11.0 348 26.7 276.4 1,517.3 67.4 2,437 187.1 276.9 1,341.4 47.1 1,788 106.0 135.8 440.4 18.1 717 55.9 169.0 513.1 21.9 843 66.0 2021 2022 2020 Q1 Q1 Q1 Q2 Q2 Q2 Q3 Q3 Q4 Q4 FY2020 FY2020 Eventbrite Q2 2022 Shareholder Letter Page 19


