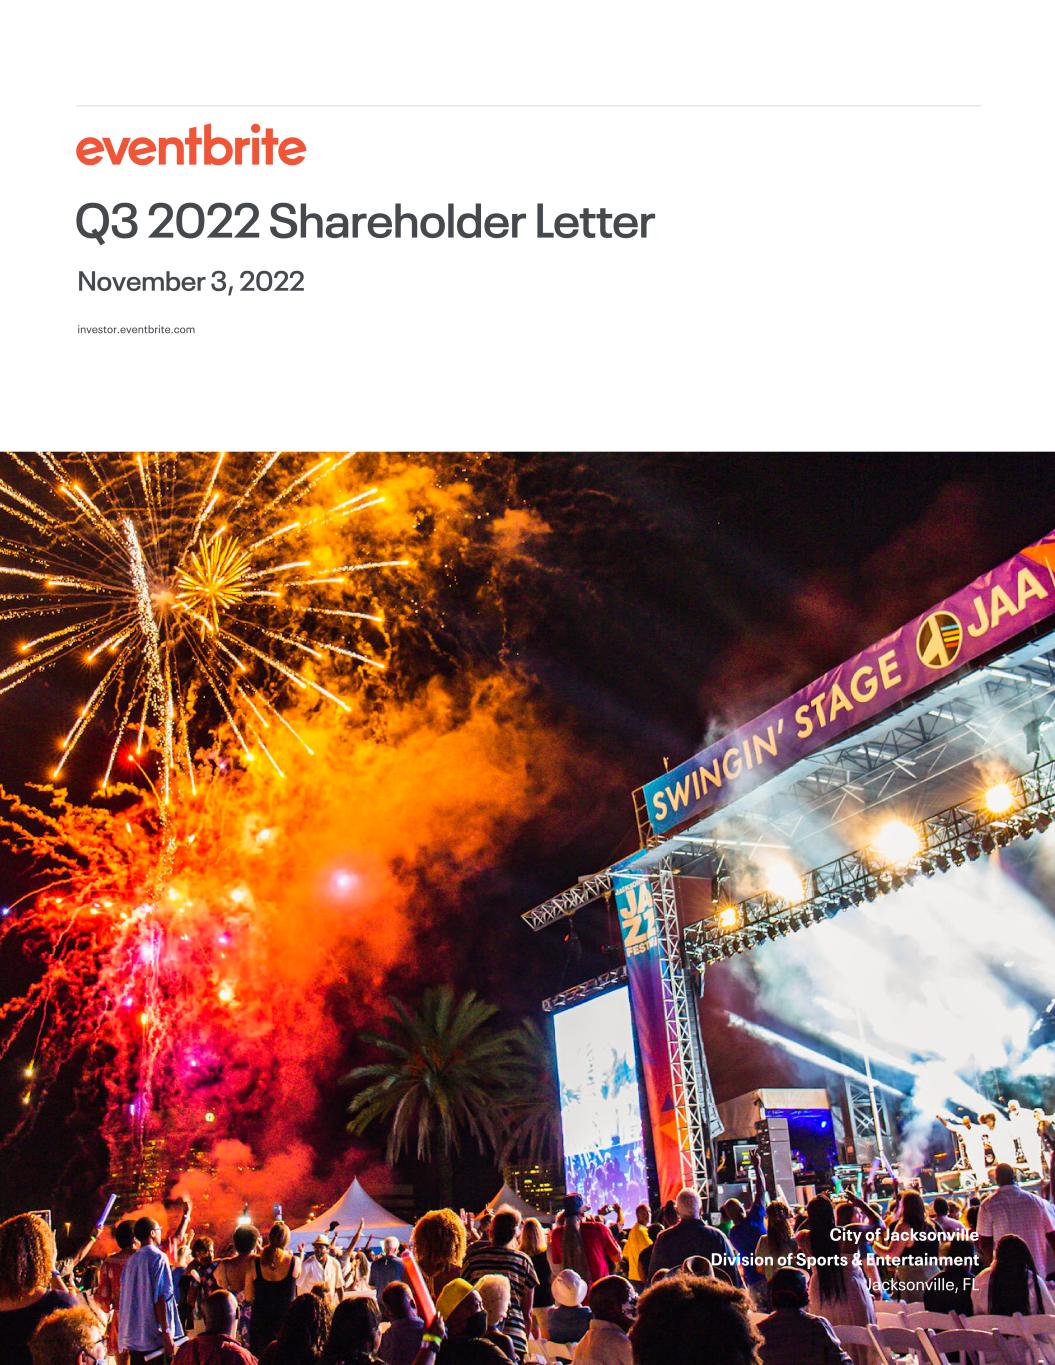
Q3 2022 Shareholder Letter November 3, 2022 investor.eventbrite.com City of Jacksonville Division of Sports & Entertainment Jacksonville, FL
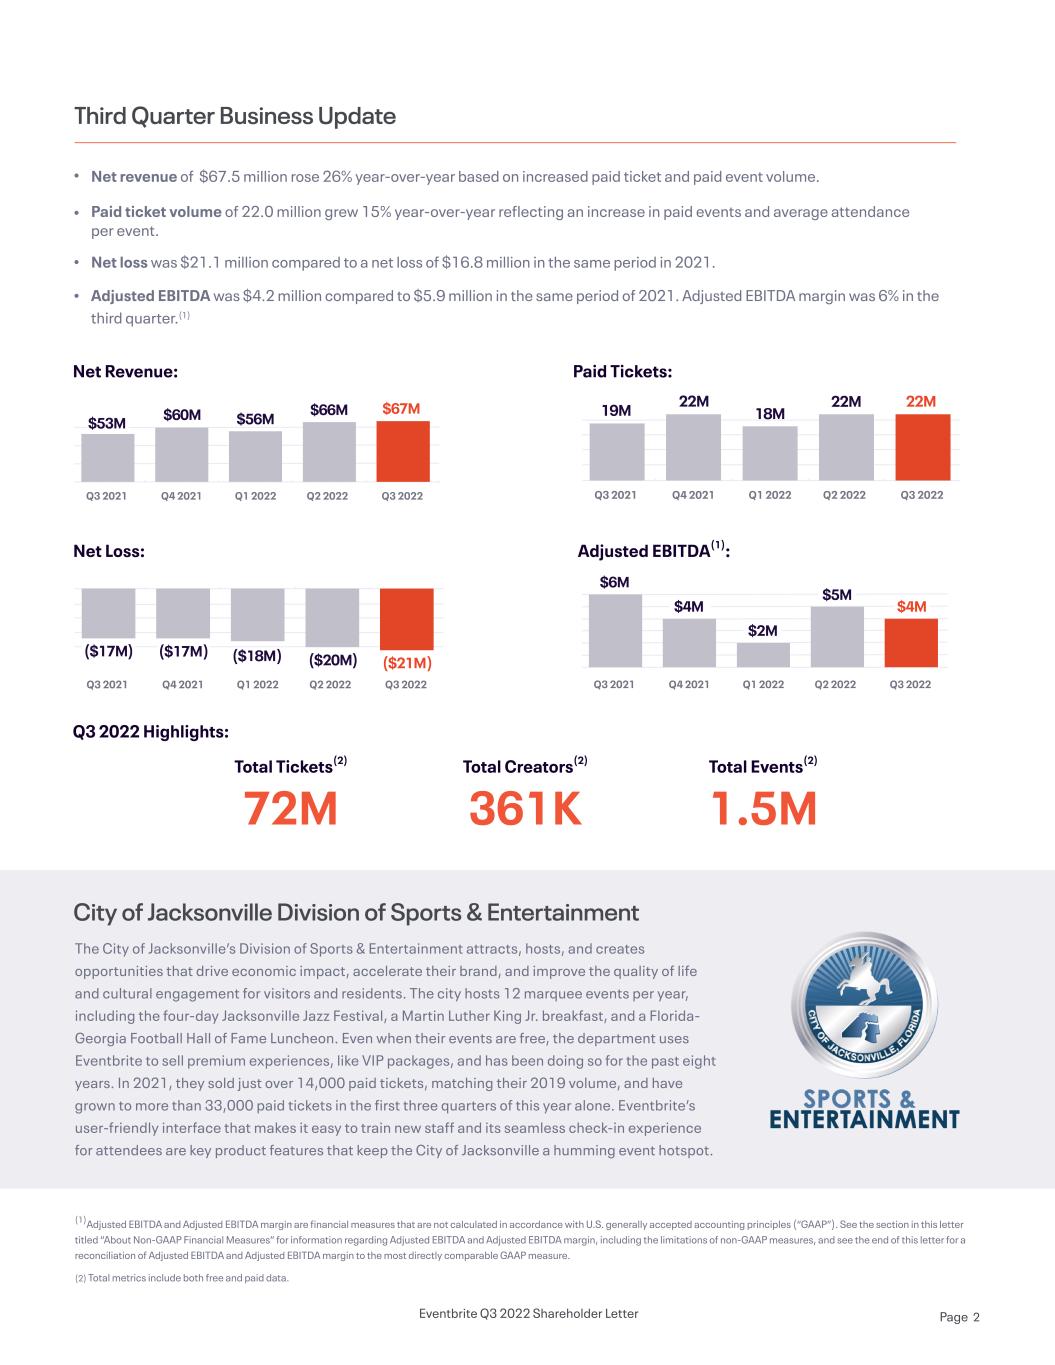
Adjusted EBITDA(1): Third Quarter Business Update Net Revenue: Q3 2022 Highlights: Paid Tickets: Net revenue of $67.5 million rose 26% year-over-year based on increased paid ticket and paid event volume. Paid ticket volume of 22.0 million grew 15% year-over-year reflecting an increase in paid events and average attendance per event. Net loss was $21.1 million compared to a net loss of $16.8 million in the same period in 2021. Adjusted EBITDA was $4.2 million compared to $5.9 million in the same period of 2021. Adjusted EBITDA margin was 6% in the third quarter.(1) Net Loss: Total Tickets(2) 72M City of Jacksonville Division of Sports & Entertainment The City of Jacksonville’s Division of Sports & Entertainment attracts, hosts, and creates opportunities that drive economic impact, accelerate their brand, and improve the quality of life and cultural engagement for visitors and residents. The city hosts 12 marquee events per year, including the four-day Jacksonville Jazz Festival, a Martin Luther King Jr. breakfast, and a Florida- Georgia Football Hall of Fame Luncheon. Even when their events are free, the department uses Eventbrite to sell premium experiences, like VIP packages, and has been doing so for the past eight years. In 2021, they sold just over 14,000 paid tickets, matching their 2019 volume, and have grown to more than 33,000 paid tickets in the first three quarters of this year alone. Eventbrite’s user-friendly interface that makes it easy to train new staff and its seamless check-in experience for attendees are key product features that keep the City of Jacksonville a humming event hotspot. (1)Adjusted EBITDA and Adjusted EBITDA margin are financial measures that are not calculated in accordance with U.S. generally accepted accounting principles (“GAAP”). See the section in this letter titled “About Non-GAAP Financial Measures” for information regarding Adjusted EBITDA and Adjusted EBITDA margin, including the limitations of non-GAAP measures, and see the end of this letter for a reconciliation of Adjusted EBITDA and Adjusted EBITDA margin to the most directly comparable GAAP measure. (2) Total metrics include both free and paid data. Total Creators(2) 361K Total Events(2) 1.5M Q3 2022Q2 2022Q1 2022Q4 2021Q3 2021 $53M $60M $56M $66M $67M Q3 2022Q2 2022Q1 2022Q4 2021Q3 2021 19M 22M 18M 22M 22M Q3 2022Q2 2022Q1 2022Q4 2021Q3 2021 ($17M) ($17M) ($18M) ($20M) ($21M) Q3 2022Q2 2022Q1 2022Q4 2021Q3 2021 $6M $4M $2M $5M $4M Eventbrite Q3 2022 Shareholder Letter Page 2

Dear Eventbrite Shareholder, Our third quarter was marked by steady revenue and ticketing growth coupled with increasing product momentum as creators connected with audiences around the world. We transacted nearly 72 million free and paid tickets across 1.5 million events, giving millions of new and returning attendees the opportunity to partake in a wide diversity of experiences. In total, we processed approximately $850 million of gross ticket sales in the quarter, bringing year-to-date gross ticket sales to $2.4 billion. Across the breadth of our platform, we see a healthy live events landscape and our scaled marketplace becoming more relevant than ever as we help creators launch and grow their businesses. Rollout of marketing and demand generation tools gained momentum in the third quarter as we empower creators to tap into consumer demand. Boost subscribers increased meaningfully, and an early iteration of Eventbrite Ads has drawn positive feedback and incremental spending from users. By targeting and anticipating the needs of creators who want to grow their audiences, we are expanding our addressable market and deepening our value proposition as we pursue sustainable and profitable long-term growth. Focused Growth and Investments Third quarter revenue was $67.5 million, up 26% year-over-year and the highest quarterly run rate since the end of 2019. This performance was anchored by an active creator base that sold 22 million paid tickets on our platform, a 15% year- over-year increase. Average paid ticket value of $38 grew 8% year-over-year and translated to average revenue per ticket of $3.06, which was up 10% versus a year ago. This continued improvement underscores what we believe are sustainable tailwinds for long-term ticketing growth as audiences increasingly seek out the distinctive local content that is unique to our platform. Our financial model powered both reinvestment into the business and leverage against sales, resulting in gross margin of 65% and Adjusted EBITDA margin of 6% in the third quarter. Total operating expense of $57 million supported sales growth of 26% year-over-year as well as focused product development that advances our strategic roadmap. Product development and engineering was nearly 40% of total spend in the third quarter and our biggest investment area. We’re committed to Freq Music Events New Zealand’s Freq Group comprises Freq Music, which produces dozens of concerts a year, as well as two biannual festivals: Freqs Out East and Freqs Out South. Freq events, according to Director Dan Hesson, let “people enjoy club vibes in their own backyard.” To promote Freq’s events, Hesson uses Eventbrite Boost. “It’s an awesome tool for our Facebook and Instagram marketing,” he says, especially “the ability to target Spotify listeners by genres and artists.” To ring in 2022, Freq Music hosted a pre-NYE bash at New Zealand’s Waihi Beach. Hesson ran a paid social ad campaign with Boost to advertise the event on Facebook. In just six days, the campaign generated over NZ$2,000, a whopping 24.1x return on their ad spend. Their ads reached nearly 10,000 people and resulted in hundreds of new leads for future Boost campaigns. Says Hesson: “I definitely recommend Boost to other people, especially in the music industry.” Eventbrite Q3 2022 Shareholder Letter Page 3

making our platform more performant for frequent creators who drive the majority of ticketing activity, and launching tools that help them grow their ticket sales and audience reach which we believe will propel long-term growth. We will stay nimble and flexible as we keep scaling our product strategy with efficiency and discipline. As anticipated, other investments to support improving ticketing volumes grew at a slower pace than our product and engineering investment. Sales & Marketing was roughly a quarter of total operating expense for the third quarter and has declined 50% compared to the same period in 2019. Where we made concentrated investments in the third quarter, like creator confidence advertising campaigns and product marketing for Boost, we believe the results are highly leverageable across our creator base. While we expect that certain customer support functions will grow in tandem with revenue, our strategic focus on self- service offerings will moderate overall expense growth within this category. General & Administrative expenses comprised the remainder of operating costs and were up 12% year-over-year. We expect additional operating leverage benefits from this category with revenue growth. Adjusted EBITDA was $4.2 million for the third quarter as we incurred expenses to support current and future growth. Year-to-date through the third quarter of 2022, revenue growth has supported a 23% conversion of sales to Adjusted EBITDA profitability, displaying the inherent leverage in our financial model. We will continue to use this leverage to make thoughtful investments into growth as we drive creator acquisition, bolster creator confidence, and improve the consumer experience. Cultivating the Creator Base Our year-over-year revenue growth was powered by a 27% increase in paid creators and speaks to the success that they are finding on our platform. New creators who joined in 2022 are growing more quickly than ever before and are achieving record sales compared to creators in historical cohorts. We believe this outperformance reflects both our ability to attract healthy creators who produce popular content, as well as secular trends that favor the creator economy. Within the existing creator base, our frequent creator count grew 20% versus a year ago and accounted for approximately 60% of paid ticket volume in the third quarter. We are encouraged by this frequent creator affinity, which is a cornerstone of our long-term strategy. BussPepper promotions Busspepper rings the heat of Caribbean partying to London, from massive club nights to bottomless brunches to Carnival on the streets of Notting Hill. The name “Busspepper” refers to the potent Scotch bonnet chili found in Trinidadian curries and stews. “When you have a ‘buss- pepper,’” says Director Mateen Hepburn, “that chili has exploded in your pot. All of a sudden, your food is really, really spicy. I wanted to describe the events as fiery and hot. The name does that.” BussPepper Promotions uses Eventbrite Boost to promote their events with paid social ads on Facebook and Instagram. Their “For the Love of Carnival” campaign ran 43 days and reached 26,791 people. Ultimately selling 699 tickets, the campaign generated nearly £700 in revenue — a 3.4x return on ad spend. “I instantly fell in love with Boost,” says Hepburn.“The reporting is fantastic, and I don’t need to become an advertising expert. I just need to grow and create great events. That’s what a simplified system like Boost helps us do.” . Eventbrite Q3 2022 Shareholder Letter Page 4
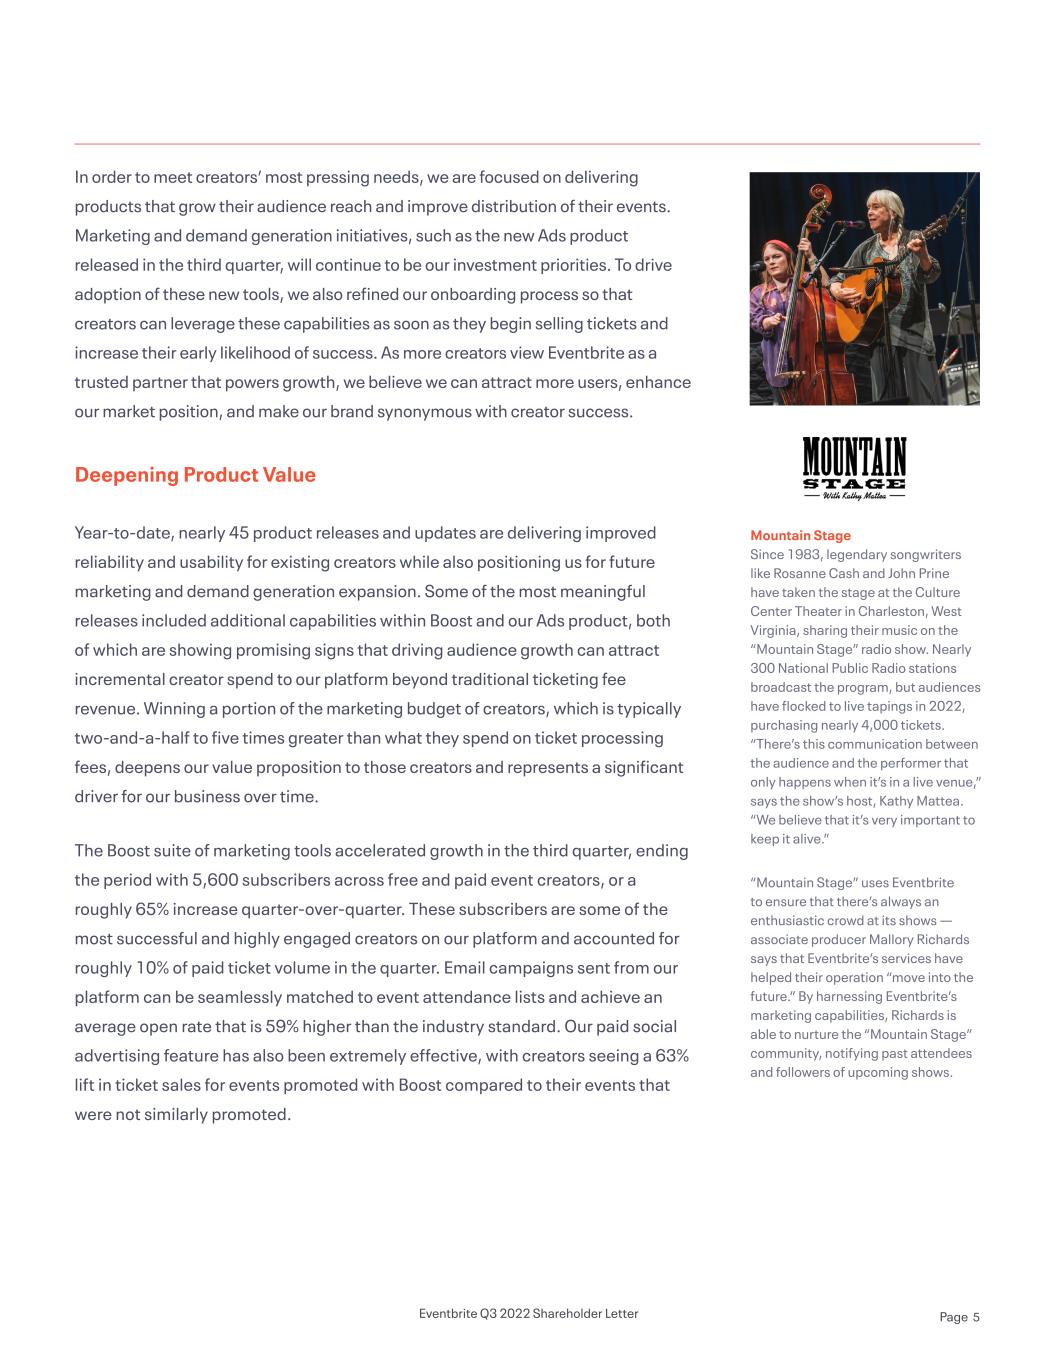
In order to meet creators’ most pressing needs, we are focused on delivering products that grow their audience reach and improve distribution of their events. Marketing and demand generation initiatives, such as the new Ads product released in the third quarter, will continue to be our investment priorities. To drive adoption of these new tools, we also refined our onboarding process so that creators can leverage these capabilities as soon as they begin selling tickets and increase their early likelihood of success. As more creators view Eventbrite as a trusted partner that powers growth, we believe we can attract more users, enhance our market position, and make our brand synonymous with creator success. Deepening Product Value Year-to-date, nearly 45 product releases and updates are delivering improved reliability and usability for existing creators while also positioning us for future marketing and demand generation expansion. Some of the most meaningful releases included additional capabilities within Boost and our Ads product, both of which are showing promising signs that driving audience growth can attract incremental creator spend to our platform beyond traditional ticketing fee revenue. Winning a portion of the marketing budget of creators, which is typically two-and-a-half to five times greater than what they spend on ticket processing fees, deepens our value proposition to those creators and represents a significant driver for our business over time. The Boost suite of marketing tools accelerated growth in the third quarter, ending the period with 5,600 subscribers across free and paid event creators, or a roughly 65% increase quarter-over-quarter. These subscribers are some of the most successful and highly engaged creators on our platform and accounted for roughly 10% of paid ticket volume in the quarter. Email campaigns sent from our platform can be seamlessly matched to event attendance lists and achieve an average open rate that is 59% higher than the industry standard. Our paid social advertising feature has also been extremely effective, with creators seeing a 63% lift in ticket sales for events promoted with Boost compared to their events that were not similarly promoted. Mountain Stage Since 1983, legendary songwriters like Rosanne Cash and John Prine have taken the stage at the Culture Center Theater in Charleston, West Virginia, sharing their music on the “Mountain Stage” radio show. Nearly 300 National Public Radio stations broadcast the program, but audiences have flocked to live tapings in 2022, purchasing nearly 4,000 tickets. “There’s this communication between the audience and the performer that only happens when it’s in a live venue,” says the show’s host, Kathy Mattea. “We believe that it’s very important to keep it alive.” “Mountain Stage” uses Eventbrite to ensure that there’s always an enthusiastic crowd at its shows — associate producer Mallory Richards says that Eventbrite’s services have helped their operation “move into the future.” By harnessing Eventbrite’s marketing capabilities, Richards is able to nurture the “Mountain Stage” community, notifying past attendees and followers of upcoming shows. Eventbrite Q3 2022 Shareholder Letter Page 5

With the release of Eventbrite Ads in ten US cities in the third quarter, promoted listings on our website have further expanded growth opportunities for creators. Eventbrite Ads harnesses our scale and consumer presence to improve creator and event discoverability and help audiences find events they love. Early adopters of Eventbrite Ads are heavily tilted to music and performing arts, currently our most popular categories, and creators in some geographies saw as much as a 14x uplift in event visibility. These positive signals fuel our confidence in demand generation as a valuable service to creators and a promising avenue for long-term growth. Powering additional ticket sales for creators via products like Boost and Ads strengthens the overall demand generation value proposition of our platform. In the third quarter, the Eventbrite platform supported consumer discovery and purchase conversion for $205 million in gross ticket sales. Approximately 80% of events on our platform benefitted from at least one Eventbrite-driven ticket, revealing the breadth of our impact for creators. Almost one in five events received more than 50% of ticket sales from Eventbrite-driven demand, meaning we are already the primary source of audience growth for many creators. As we continue to build features that drive ticket sales and help consumers find their preferred events, we believe demand generation will remain a key differentiator that draws both creators and ticket buyers to our platform. Summary With a healthy core creator base, strong product momentum, and disciplined execution in the third quarter, we remain confident in our ability to achieve our long-term goals. We are well on our way to becoming a ticketing growth engine for creators, and we will continue to make thoughtful investments into scalable, product-led growth that creates value for all of our stakeholders. Thank you for your support and we look forward to updating you on our future progress. Sincerely, Revenge Roughstock Company The Towery family have been raising livestock for over 25 years and hosting humane, professional rodeo performances for the last ten with their high-level animal athletes in Doswell, Virginia. The family-friendly rodeos welcome up to 2,000 diverse folks to each event to preserve the historic sport. The family-run business has been using Eventbrite for over 2 years to bring people together at their events, selling nearly 30,000 tickets, 45% of which are driven through the platform. Martin Towery stresses that the world needs rodeo. “When everyone’s laughing at a joke the clown said, when everyone is in awe at a bull ride — you can feel the community coming together in that moment,” he says. It’s more than entertainment; it’s a reminder that we’re all human beings no matter our background, political view, race, or religion — and we can all come together to have fun. “That’s what the world needs.” Julia Hartz CEO Lanny Baker CFO Eventbrite Q3 2022 Shareholder Letter Page 6
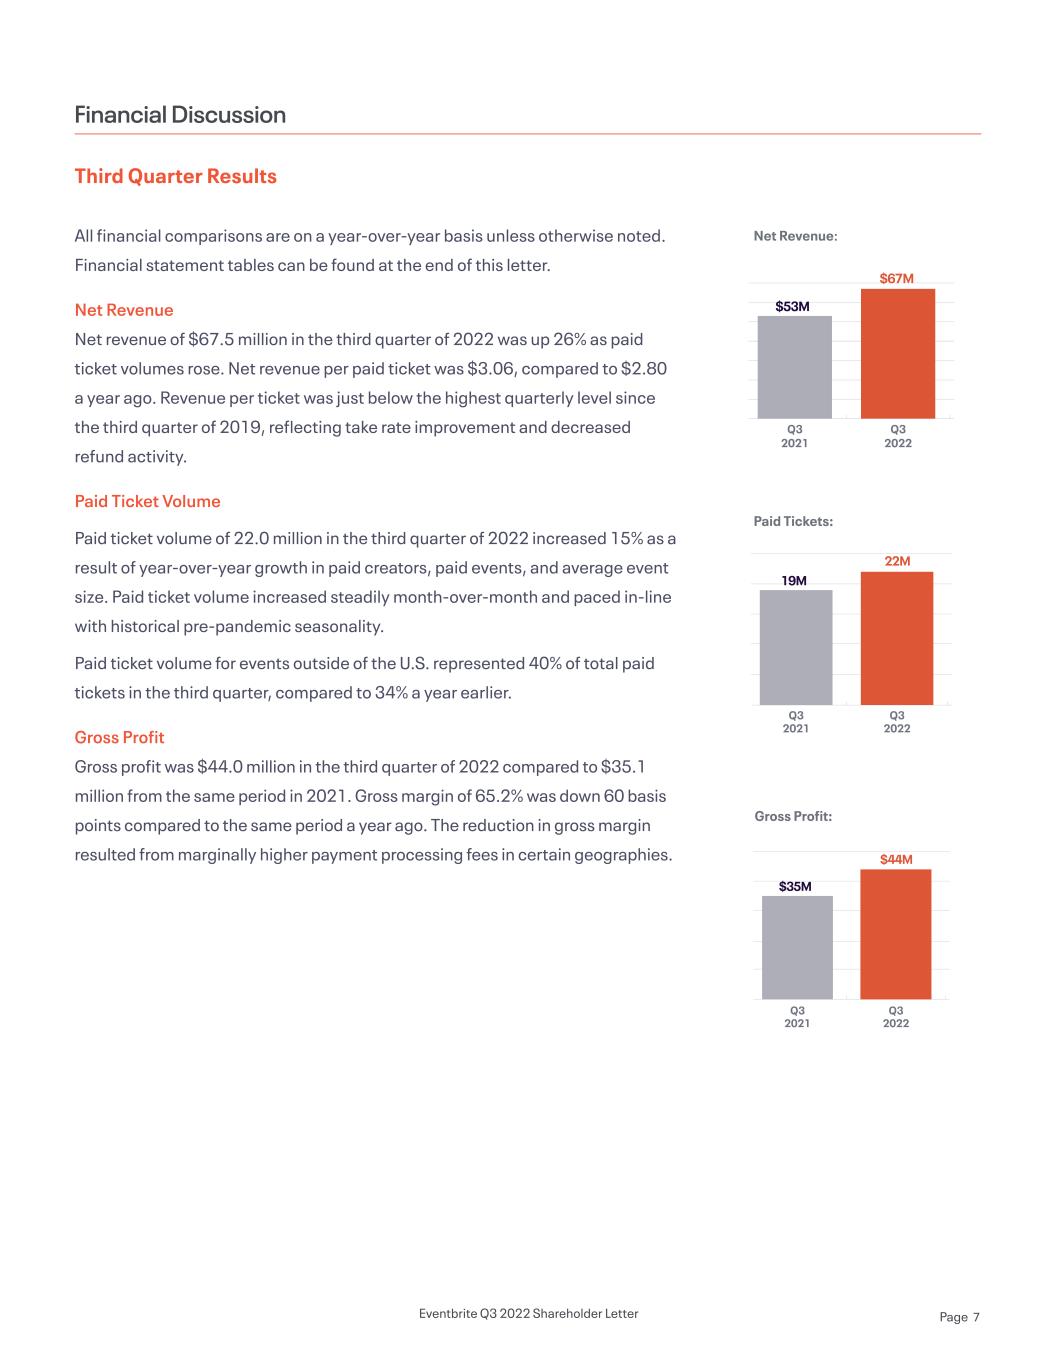
Third Quarter Results All financial comparisons are on a year-over-year basis unless otherwise noted. Financial statement tables can be found at the end of this letter. Net Revenue Net revenue of $67.5 million in the third quarter of 2022 was up 26% as paid ticket volumes rose. Net revenue per paid ticket was $3.06, compared to $2.80 a year ago. Revenue per ticket was just below the highest quarterly level since the third quarter of 2019, reflecting take rate improvement and decreased refund activity. Paid Ticket Volume Paid ticket volume of 22.0 million in the third quarter of 2022 increased 15% as a result of year-over-year growth in paid creators, paid events, and average event size. Paid ticket volume increased steadily month-over-month and paced in-line with historical pre-pandemic seasonality. Paid ticket volume for events outside of the U.S. represented 40% of total paid tickets in the third quarter, compared to 34% a year earlier. Gross Profit Gross profit was $44.0 million in the third quarter of 2022 compared to $35.1 million from the same period in 2021. Gross margin of 65.2% was down 60 basis points compared to the same period a year ago. The reduction in gross margin resulted from marginally higher payment processing fees in certain geographies. Financial Discussion Net Revenue: Paid Tickets: Gross Profit: Q3 2022 Q3 2021 $53M $67M Q3 2022 Q3 2021 19M 22M Q3 2022 Q3 2021 $35M $44M Eventbrite Q3 2022 Shareholder Letter Page 7
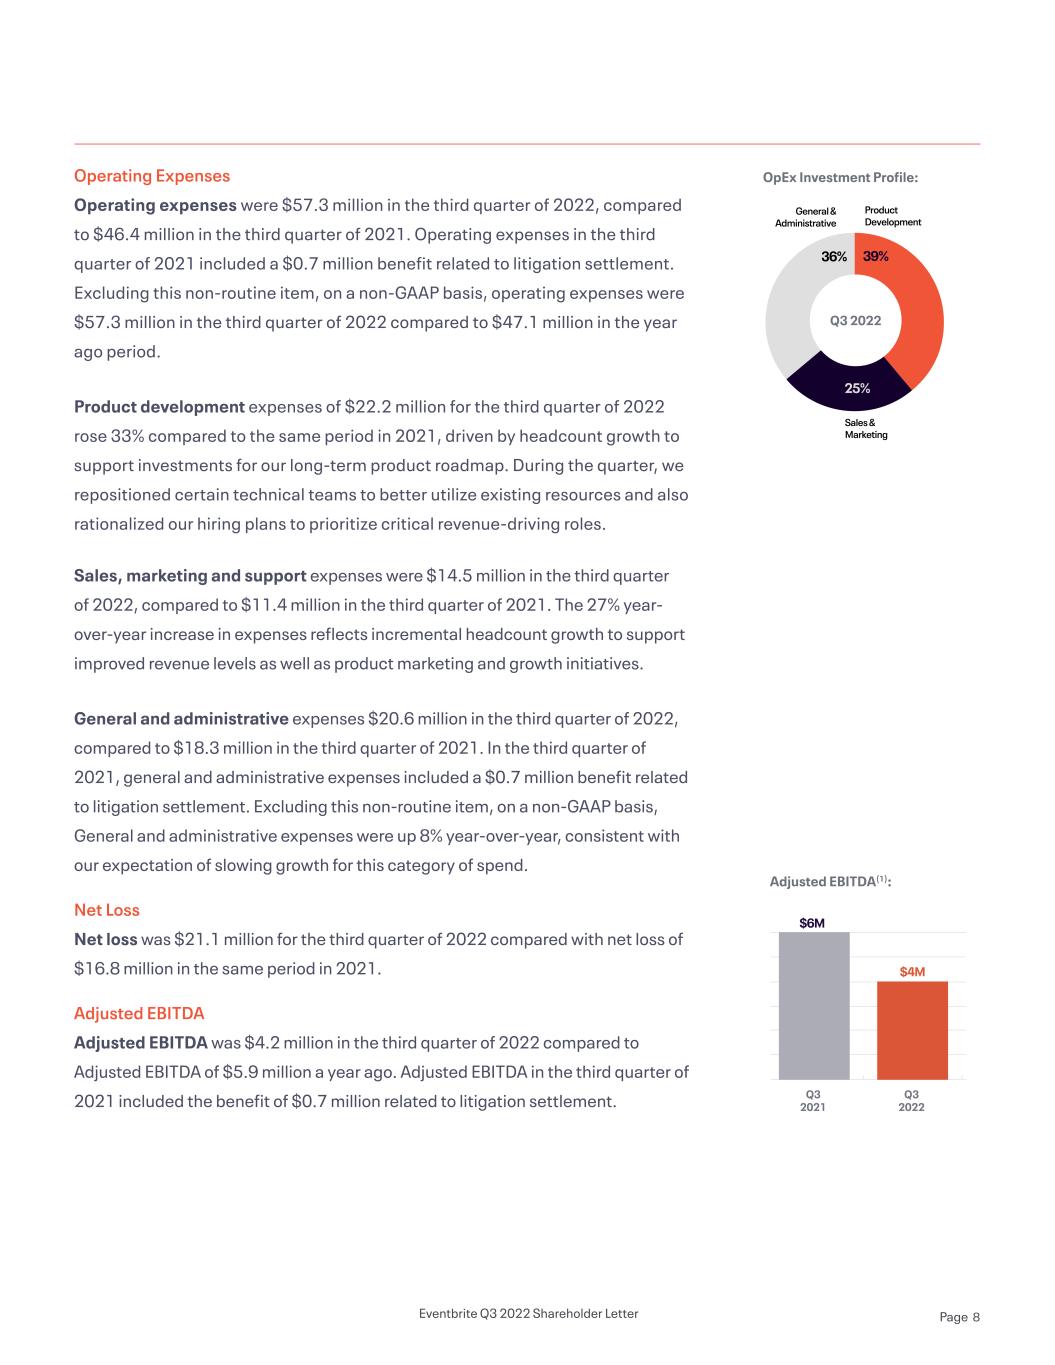
OpEx Investment Profile:Operating Expenses Operating expenses were $57.3 million in the third quarter of 2022, compared to $46.4 million in the third quarter of 2021. Operating expenses in the third quarter of 2021 included a $0.7 million benefit related to litigation settlement. Excluding this non-routine item, on a non-GAAP basis, operating expenses were $57.3 million in the third quarter of 2022 compared to $47.1 million in the year ago period. Product development expenses of $22.2 million for the third quarter of 2022 rose 33% compared to the same period in 2021, driven by headcount growth to support investments for our long-term product roadmap. During the quarter, we repositioned certain technical teams to better utilize existing resources and also rationalized our hiring plans to prioritize critical revenue-driving roles. Sales, marketing and support expenses were $14.5 million in the third quarter of 2022, compared to $11.4 million in the third quarter of 2021. The 27% year- over-year increase in expenses reflects incremental headcount growth to support improved revenue levels as well as product marketing and growth initiatives. General and administrative expenses $20.6 million in the third quarter of 2022, compared to $18.3 million in the third quarter of 2021. In the third quarter of 2021, general and administrative expenses included a $0.7 million benefit related to litigation settlement. Excluding this non-routine item, on a non-GAAP basis, General and administrative expenses were up 8% year-over-year, consistent with our expectation of slowing growth for this category of spend. Net Loss Net loss was $21.1 million for the third quarter of 2022 compared with net loss of $16.8 million in the same period in 2021. Adjusted EBITDA Adjusted EBITDA was $4.2 million in the third quarter of 2022 compared to Adjusted EBITDA of $5.9 million a year ago. Adjusted EBITDA in the third quarter of 2021 included the benefit of $0.7 million related to litigation settlement. Q3 2022 36% General & Administrative 25% Sales & Marketing 39% Product Development ($7M) Adjusted EBITDA(1): Q3 2022 Q3 2021 $6M $4M Eventbrite Q3 2022 Shareholder Letter Page 8

Available Liquidity Cash and cash equivalents Funds receivable Creator advances, net Accounts payable, creators Available liquidity Recorded Amount ($M) $675.8 0 26.5 0 0.8 0 (354.9)0 l $348.2 0 Balance Sheet and Cash Flow Cash and cash equivalents totaled $675.8 million at the end of the third quarter of 2022, up from $667.9 million as of September 30, 2021. To evaluate Eventbrite’s liquidity, the company adds funds receivable from ticket sales within the last five business days of the period to creator advances and cash and cash equivalents, and then reduces the balance by funds payable and creator payables. On that basis, the company’s available liquidity as of September 30, 2022 was $348.2 million compared to $361.7 million as of September 30, 2021. Long-term debt as of September 30, 2022 was $355.1 million compared to $353.1 million as of September 30, 2021. (1) Adjusted EBITDA and Adjusted EBITDA margin are financial measures that are not calculated in accordance with U.S. generally accepted accounting principles (“GAAP”). See the section in this letter titled “About Non-GAAP Financial Measures” for information regarding Adjusted EBITDA and Adjusted EBITDA margin, including the limitations of non-GAAP measures, and see the end of this letter for a reconciliation of Adjusted EBITDA and Adjusted EBITDA margin to the most directly comparable GAAP measure. Eventbrite Q3 2022 Shareholder Letter Page 9
Based upon current information, we anticipate fourth quarter 2022 revenue will be within a range of $69 million to $72 million. We expect sustained consumer demand for live events in the fourth quarter, influenced by strong appetite for the events on our platform and bellwether holiday events. Our outlook also considers macroeconomic conditions that may lead to greater friction around staging live events, such as inflation, labor shortages, interest rates, and other factors. Business Outlook Eventbrite Q3 2022 Shareholder Letter Page 10
Eventbrite will hold a conference call and live webcast on November 3, 2022 at 2:00 p.m. PDT to discuss the third quarter 2022 financial results. To listen to a live audio webcast, please visit Eventbrite’s Investor Relations website at https://investor.eventbrite.com/overview/default.aspx. A replay of the webcast will be available at the same website. About Eventbrite Eventbrite is a global self-service ticketing, marketing, and experience technology platform that serves a community of hundreds of thousands of event creators in nearly 180 countries. Since inception, Eventbrite has been at the center of the experience economy, transforming the way people organize and attend events. The company was founded by Julia Hartz, Kevin Hartz and Renaud Visage, with a vision to build a self-service platform that would make it possible for anyone to create and sell tickets to live experiences. The Eventbrite platform provides an intuitive, secure, and reliable service that enables creators to plan and execute their live and online events, whether it’s an annual culinary festival attracting thousands of foodies, a professional webinar, a weekly yoga workshop or a youth dance class. With over 290 million tickets distributed for over 5 million total events in 2021, Eventbrite is where people all over the world discover new things to do or new ways to do more of what they love. Eventbrite has also earned industry recognition as a top employer with special designations that include a coveted spot on Fast Company’s prestigious Brands That Matter List, the Great Place to Work® Award in the U.S., Best Employer in Argentina by Apertura, and Inc.’s Best-Led Companies honor. Learn more at www.eventbrite.com. Earnings Webcast The neon icons can be used to convey abstract concepts and work well in presentations. They should feel active and expressive. Feel free to expand on these as you build out the experience. Eventbrite Q3 2022 Shareholder Letter Page 11
Forward-Looking Statements This letter contains forward-looking statements within the meaning of Section 27A of the Securities Act of 1933, as amended, and Section 21E of the Securities Exchange Act of 1934, as amended, that involve substantial risks and uncertainties. All statements other than statements of historical fact could be deemed forward-looking, including, but not limited to, statements regarding the future performance of Eventbrite, Inc. and its consolidated subsidiaries (the “Company”); the Company’s business model and investments to support growth, including the impact on results; the Company’s expectations regarding the development of its platform and products; creator growth, pursuit of sustainable and profitable long-term growth, scalable, product-led growth and value creation; and the Company’s expectations described under “Business Outlook” above. In some cases, forward-looking statements can be identified by terms such as “may,” “will,” “appears,” “shall,” “should,” “expects,” “plans,” “anticipates,” “could,” “intends,” “target,” “projects,” “contemplates,” “believes,” “estimates,” “predicts,” “potential,” or “continue,” or the negative of these words or other similar terms or expressions that concern our expectations, strategy, plans, or intentions. Such statements are subject to a number of known and unknown risks, uncertainties, assumptions, and other factors that may cause the Company’s actual results, performance, or achievements to differ materially from results expressed or implied in this letter. Investors are cautioned not to place undue reliance on these statements. Actual results could differ materially from those expressed or implied, and reported results should not be considered as an indication of future performance. The forward-looking statements contained in this letter are also subject to additional risks, uncertainties and factors, including those more fully described in the Company’s filings with the Securities and Exchange Commission, including the Company’s Annual Report on Form 10-K and Quarterly Reports on Form 10-Q. Further information on potential risks that could affect actual results will be included in the subsequent periodic and current reports and other filings that the Company makes with the Securities and Exchange Commission from time to time. All forward-looking statements are based on information and estimates available to the Company at the time of this letter and are not guarantees of future performance. Except as required by law, the Company assumes no obligation to update any of the statements in this letter. Disclaimer Regarding Ticketing, Creator and Event Metrics This letter includes certain measures related to our ticketing business, such as paid tickets, paid creators and paid events. We believe that the use of these metrics is helpful to our investors as these metrics are used by management in assessing the health of our business and our operating performance. These metrics are based on what we believe to be reasonable estimates for the applicable period of measurement. There are inherent challenges in measuring these metrics, and we regularly review and may adjust our processes for calculating our internal metrics to improve their accuracy. You should not consider these metrics in isolation or as substitutes for analysis of our results of operations as reported under GAAP. About Non-GAAP Financial Measures We believe that the use of Adjusted EBITDA, Adjusted EBITDA margin and Available Liquidity is helpful to our investors in understanding and evaluating our results of operations and useful measures for period-to-period comparisons of our business performance as they are metrics used by management in assessing the health of our business and our operating performance, making operating decisions, and performing strategic planning and annual budgeting. These measures are not prepared in accordance with GAAP and have limitations as an analytical tool, and you should not consider them in isolation or as a substitute for analysis of our results of operations as reported under GAAP. In addition, other companies may not calculate non-GAAP financial measures in the same manner as we calculate them, limiting their usefulness as comparative measures. You are encouraged to evaluate the adjustments and the reasons we consider them appropriate. Adjusted EBITDA We calculate Adjusted EBITDA as net loss adjusted to exclude depreciation and amortization, stock-based compensation expense, interest expense, loss on debt extinguishment, direct and indirect acquisition related costs, employer taxes related to employee transactions and other income (expense), which consisted of interest income, foreign exchange rate gains and losses, and income tax provision (benefit). Adjusted EBITDA should not be considered as an alternative to net loss or any other measure of financial performance calculated and presented in accordance with GAAP. Some of the limitations of Adjusted EBITDA include (i) Adjusted EBITDA does not properly reflect capital spending that occurs off of the income statement or account for future contractual commitments, (ii) although depreciation and amortization are non-cash charges, the underlying assets may need to be replaced and Adjusted EBITDA does not reflect these capital expenditures and (iii) Adjusted EBITDA does not reflect the interest and principal required to service our indebtedness. In evaluating Adjusted EBITDA, you should be aware that in the future we expect to incur expenses similar to the adjustments in this letter. Our presentation of Adjusted EBITDA should not be construed as an inference that our future results will be unaffected by these expenses or any unusual or non-recurring items. When evaluating our performance, you should consider Adjusted EBITDA alongside other financial performance measures, including our net loss and other GAAP results. Adjusted EBITDA Margin Adjusted EBITDA Margin is defined as Adjusted EBITDA divided by revenue. Because of the limitations described above, you should consider Adjusted EBITDA and Adjusted EBITDA Margin alongside other financial performance measures, including net loss and our other GAAP results. Available Liquidity To evaluate Eventbrite’s liquidity, the Company adds funds receivable from ticket sales within the last five business days of the period to creator advances and cash and cash equivalents, and then reduces the balance by funds payable and creator payables. Eventbrite Q3 2022 Shareholder Letter Page 12
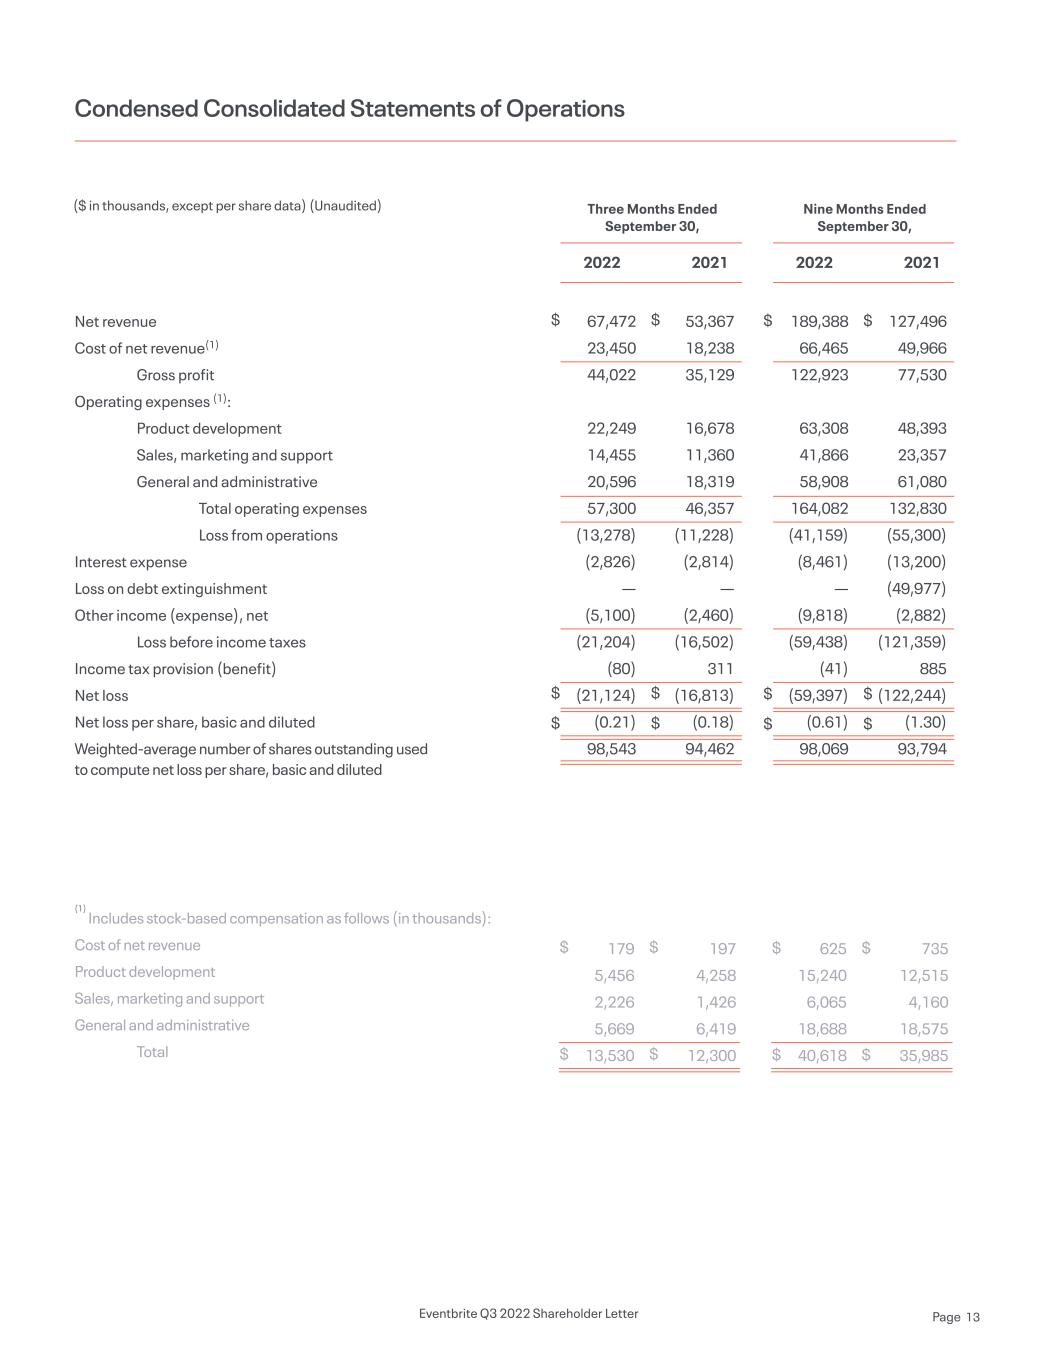
Net revenue Cost of net revenue(1) Gross profit Operating expenses (1): Product development Sales, marketing and support General and administrative Total operating expenses Loss from operations Interest expense Loss on debt extinguishment Other income (expense), net Loss before income taxes Income tax provision (benefit) Net loss Net loss per share, basic and diluted Weighted-average number of shares outstanding used to compute net loss per share, basic and diluted Condensed Consolidated Statements of Operations ($ in thousands, except per share data) (Unaudited) $ $ $ $ $ $ 127,496 49,966 77,530 48,393 23,357 61,080 132,830 (55,300) (13,200) (49,977) (2,882) (121,359) 885 (122,244) (1.30) 93,794 53,367 18,238 35,129 16,678 11,360 18,319 46,357 (11,228) (2,814) — (2,460) (16,502) 311 (16,813) (0.18) 94,462 Nine Months Ended September 30, Three Months Ended September 30, 20222022 20212021 $ $ $ $ $ $ 189,388 66,465 122,923 63,308 41,866 58,908 164,082 (41,159) (8,461) — (9,818) (59,438) (41) (59,397) (0.61) 98,069 67,472 23,450 44,022 22,249 14,455 20,596 57,300 (13,278) (2,826) — (5,100) (21,204) (80) (21,124) (0.21) 98,543 (1) Includes stock-based compensation as follows (in thousands): Cost of net revenue Product development Sales, marketing and support General and administrative Total $ $ $ $ $ $ $ $ $ $ $ $ 625 15,240 6,065 18,688 40,618 179 5,456 2,226 5,669 13,530 735 12,515 4,160 18,575 35,985 197 4,258 1,426 6,419 12,300 Eventbrite Q3 2022 Shareholder Letter Page 13

Assets Current assets Cash and cash equivalents Funds receivable Accounts receivable, net Creator signing fees, net Creator advances, net Prepaid expenses and other current assets Total current assets Restricted cash Creator signing fees, noncurrent Property and equipment, net Operating lease right-of-use assets Goodwill Acquired intangible assets, net Other assets Total assets Liabilities and Stockholders’ Equity Current liabilities Accounts payable, creators Accounts payable, trade Chargebacks and refunds reserve Accrued compensation and benefits Accrued taxes Operating lease liabilities Other accrued liabilities Total current liabilities Accrued taxes, noncurrent Operating lease liabilities, noncurrent Long-term debt Other liabilities Total liabilities Stockholder's equity Common stock, at par Additional paid-in capital Accumulated deficit Total Stockholders' equity Total liabilities and stockholders' equity Condensed Consolidated Balance Sheets ($ in thousands) (Unaudited) September 30, 2022 $ $ $ $ 675,817 26,525 2,009 929 825 9,425 715,530 1,344 1,253 6,975 6,175 174,388 24,189 1,784 931,638 354,941 723 20,397 11,297 9,697 3,473 13,549 414,077 8,689 3,689 355,067 — 781,522 1 943,083 (792,968) 150,116 931,638 December 31, 2021 $ $ $ $ 634,378 18,197 1,110 1,184 862 17,877 673,608 1,781 2,225 7,162 10,940 174,388 31,116 1,756 902,976 285,222 1,083 21,395 10,910 11,068 4,149 24,139 357,966 12,868 8,677 353,564 1 733,076 1 903,470 (733,571) 169,900 902,976 Eventbrite Q3 2022 Shareholder Letter Page 14
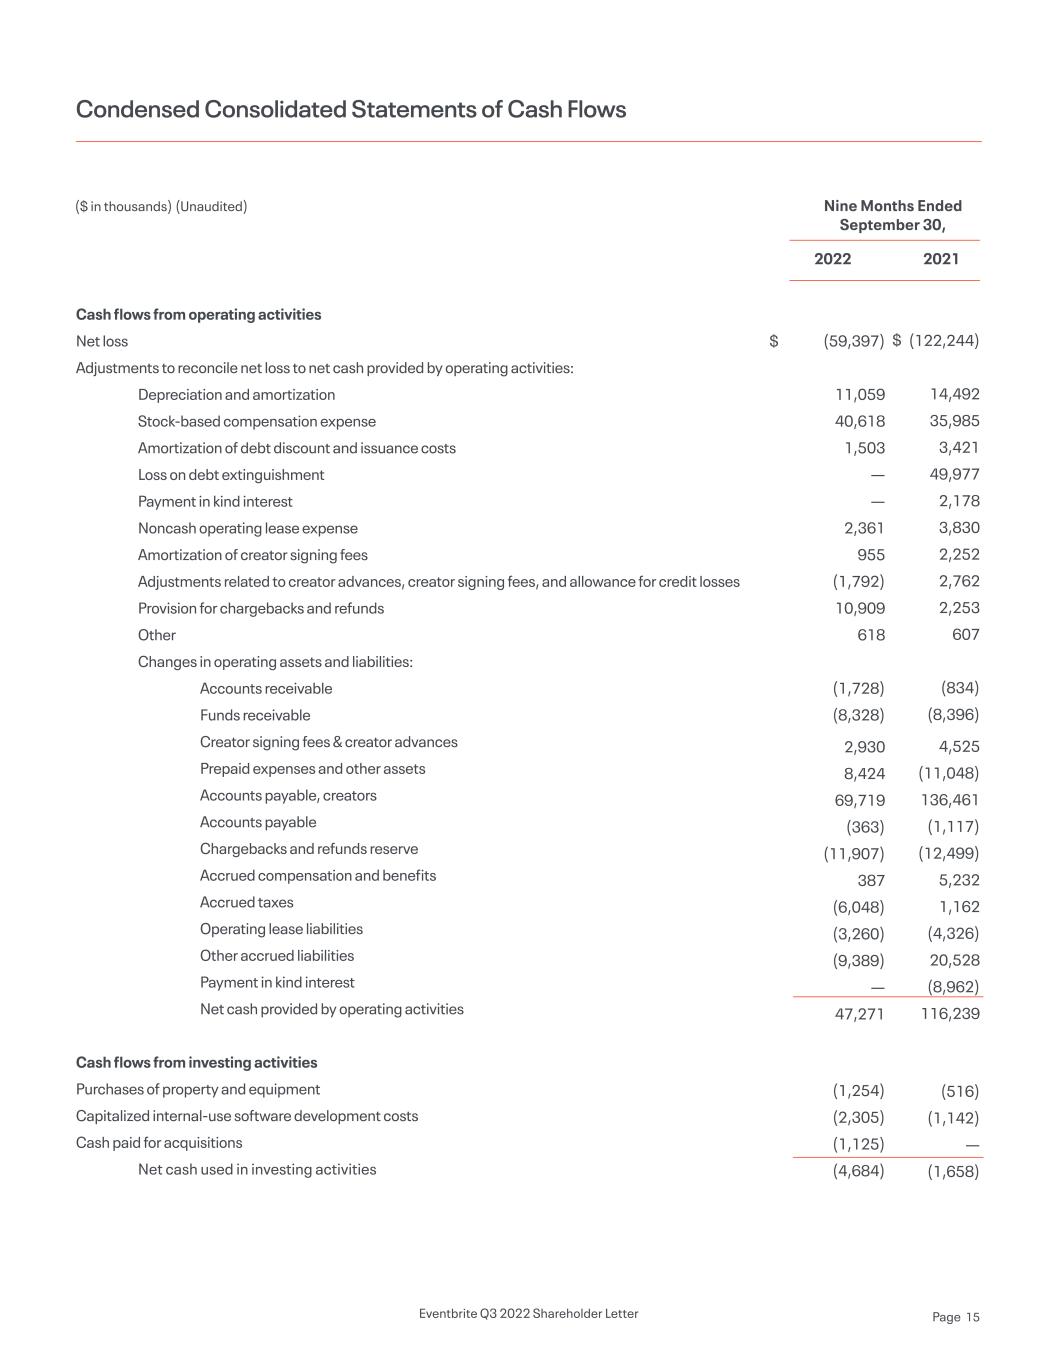
Cash flows from operating activities Net loss Adjustments to reconcile net loss to net cash provided by operating activities: Depreciation and amortization Stock-based compensation expense Amortization of debt discount and issuance costs Loss on debt extinguishment Payment in kind interest Noncash operating lease expense Amortization of creator signing fees Adjustments related to creator advances, creator signing fees, and allowance for credit losses Provision for chargebacks and refunds Other Changes in operating assets and liabilities: Accounts receivable Funds receivable Creator signing fees & creator advances Prepaid expenses and other assets Accounts payable, creators Accounts payable Chargebacks and refunds reserve Accrued compensation and benefits Accrued taxes Operating lease liabilities Other accrued liabilities Payment in kind interest Net cash provided by operating activities Cash flows from investing activities Purchases of property and equipment Capitalized internal-use software development costs Cash paid for acquisitions Net cash used in investing activities (59,397) 11,059 40,618 1,503 — — 2,361 955 (1,792) 10,909 618 (1,728) (8,328) 2,930 8,424 69,719 (363) (11,907) 387 (6,048) (3,260) (9,389) — 47,271 (1,254) (2,305) (1,125) (4,684) (122,244) 14,492 35,985 3,421 49,977 2,178 3,830 2,252 2,762 2,253 607 (834) (8,396) 4,525 (11,048) 136,461 (1,117) (12,499) 5,232 1,162 (4,326) 20,528 (8,962) 116,239 (516) (1,142) — (1,658) Condensed Consolidated Statements of Cash Flows ($ in thousands) (Unaudited) Nine Months Ended September 30, 2022 2021 $ $ Eventbrite Q3 2022 Shareholder Letter Page 15
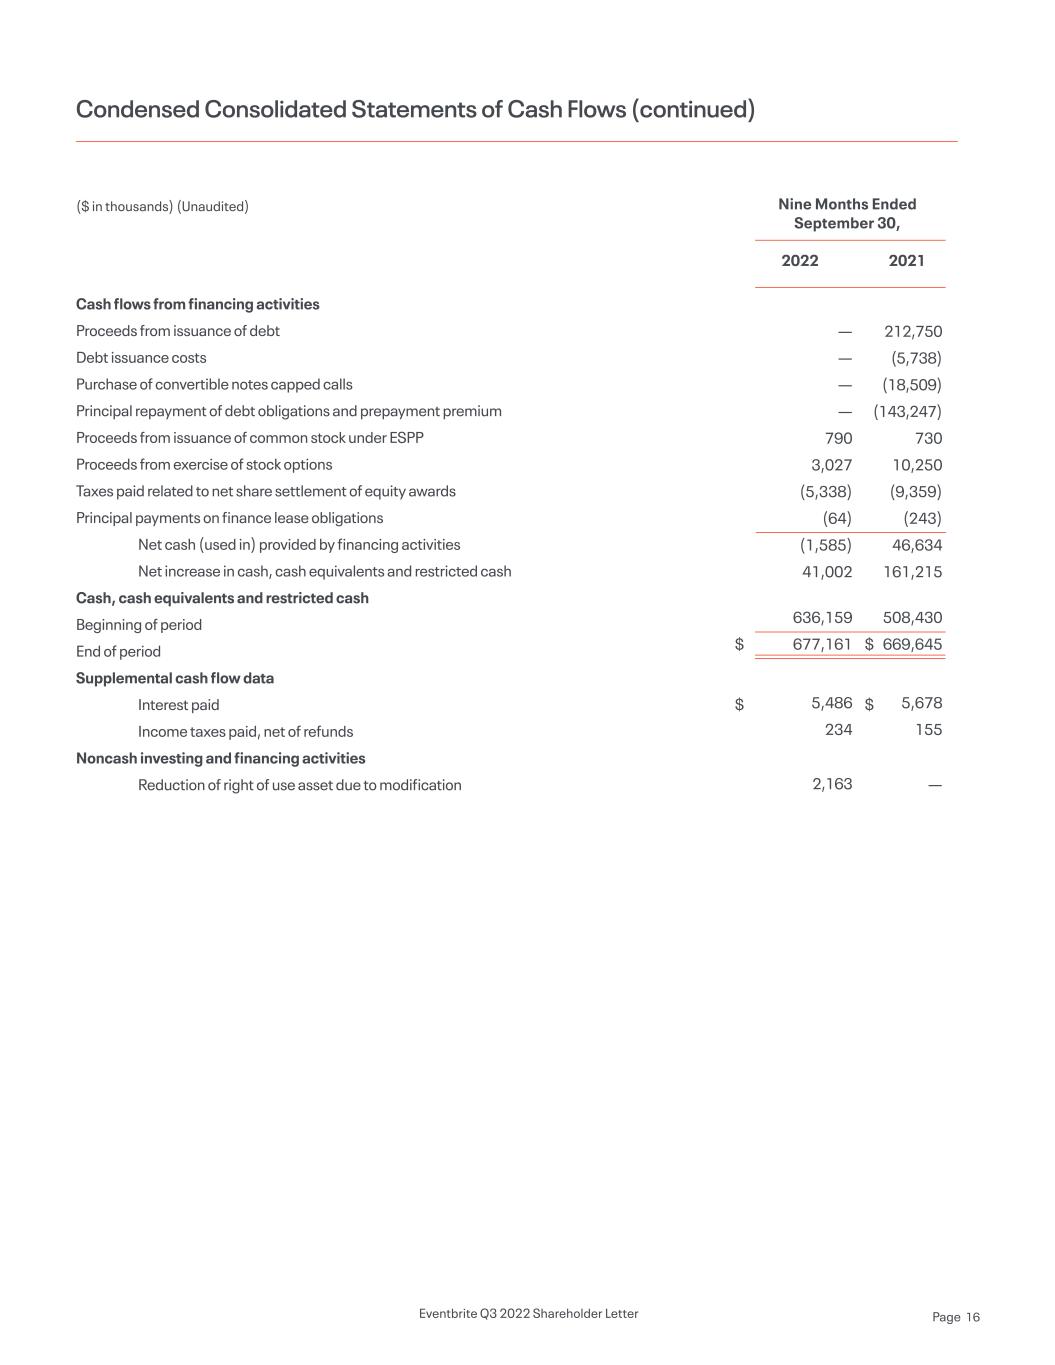
Cash flows from financing activities Proceeds from issuance of debt Debt issuance costs Purchase of convertible notes capped calls Principal repayment of debt obligations and prepayment premium Proceeds from issuance of common stock under ESPP Proceeds from exercise of stock options Taxes paid related to net share settlement of equity awards Principal payments on finance lease obligations Net cash (used in) provided by financing activities Net increase in cash, cash equivalents and restricted cash Cash, cash equivalents and restricted cash Beginning of period End of period Supplemental cash flow data Interest paid Income taxes paid, net of refunds Noncash investing and financing activities Reduction of right of use asset due to modification — — — — 790 3,027 (5,338) (64) (1,585) 41,002 636,159 677,161 5,486 234 2,163 212,750 (5,738) (18,509) (143,247) 730 10,250 (9,359) (243) 46,634 161,215 508,430 669,645 5,678 155 — Condensed Consolidated Statements of Cash Flows (continued) ($ in thousands) (Unaudited) Nine Months Ended September 30, 2022 2021 $ $ $ $ Eventbrite Q3 2022 Shareholder Letter Page 16
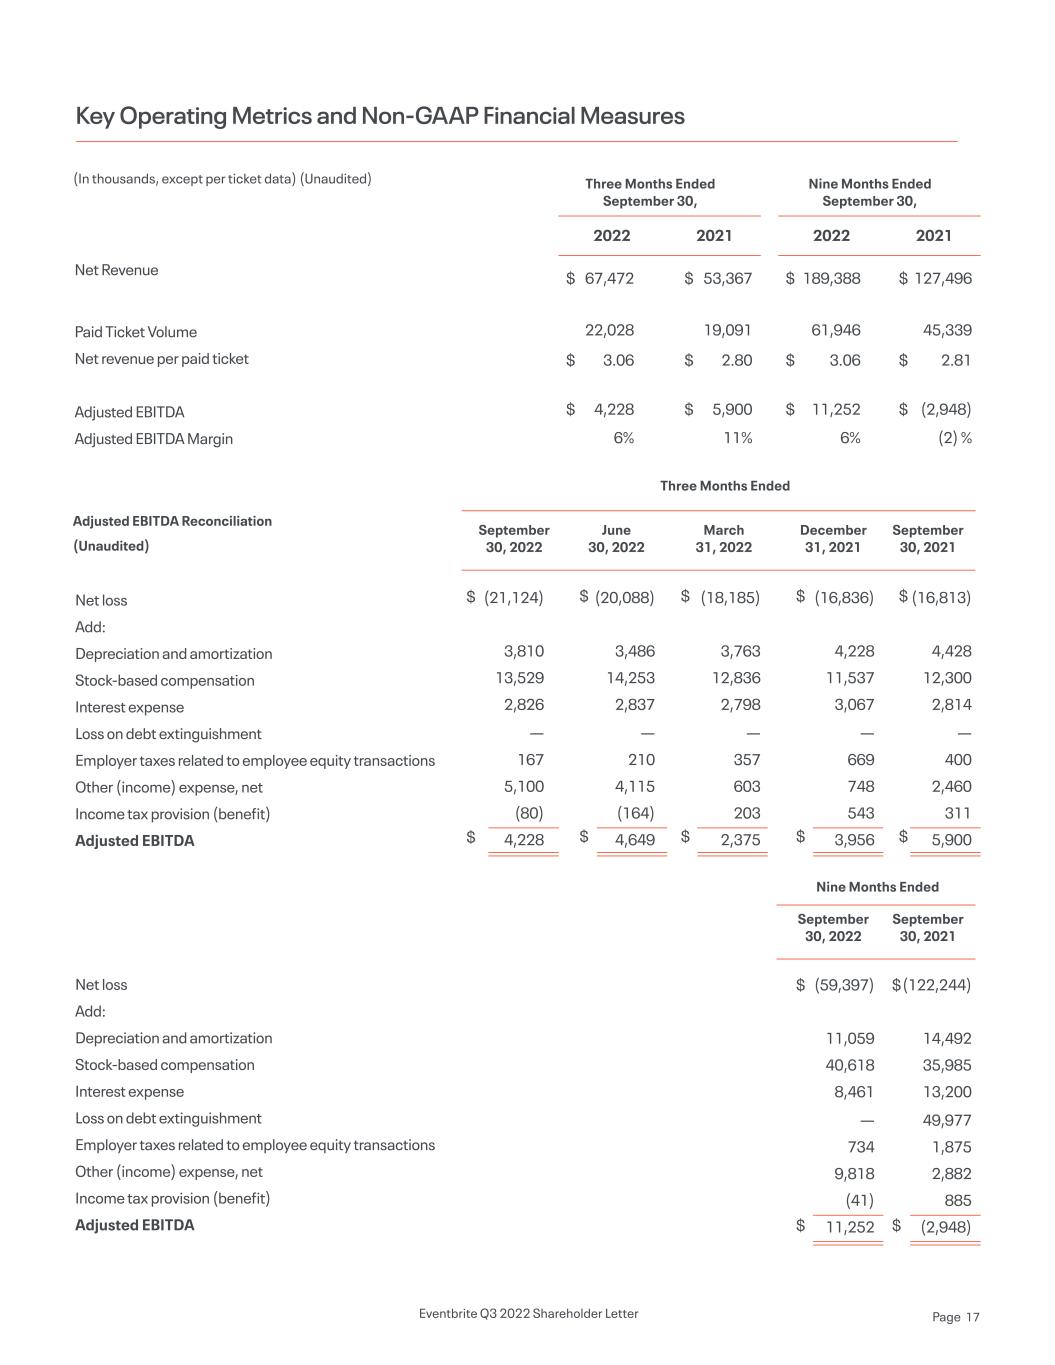
Key Operating Metrics and Non-GAAP Financial Measures Net Revenue Paid Ticket Volume Net revenue per paid ticket Adjusted EBITDA Adjusted EBITDA Margin (In thousands, except per ticket data) (Unaudited) Nine Months Ended September 30, Three Months Ended September 30, Three Months Ended Nine Months Ended 20222022 20212021 189,388 61,946 3.06 11,252 6% 67,472 22,028 3.06 4,228 6% 127,496 45,339 2.81 (2,948) (2) % 53,367 19,091 2.80 5,900 11% $ $ $ $ $ $ $ $ $ $ $ $ Adjusted EBITDA Reconciliation (Unaudited) September 30, 2022 June 30, 2022 March 31, 2022 December 31, 2021 September 30, 2022 September 30, 2021 September 30, 2021 Net loss Add: Depreciation and amortization Stock-based compensation Interest expense Loss on debt extinguishment Employer taxes related to employee equity transactions Other (income) expense, net Income tax provision (benefit) Adjusted EBITDA Net loss Add: Depreciation and amortization Stock-based compensation Interest expense Loss on debt extinguishment Employer taxes related to employee equity transactions Other (income) expense, net Income tax provision (benefit) Adjusted EBITDA (21,124) 3,810 13,529 2,826 — 167 5,100 (80) 4,228 (20,088) 3,486 14,253 2,837 — 210 4,115 (164) 4,649 (18,185) 3,763 12,836 2,798 — 357 603 203 2,375 (16,836) 4,228 11,537 3,067 — 669 748 543 3,956 (59,397) 11,059 40,618 8,461 — 734 9,818 (41) 11,252 (16,813) 4,428 12,300 2,814 — 400 2,460 311 5,900 (122,244) 14,492 35,985 13,200 49,977 1,875 2,882 885 (2,948) $ $ $ $ $ $ $ $ $ $ $ $ $ $ Eventbrite Q3 2022 Shareholder Letter Page 17
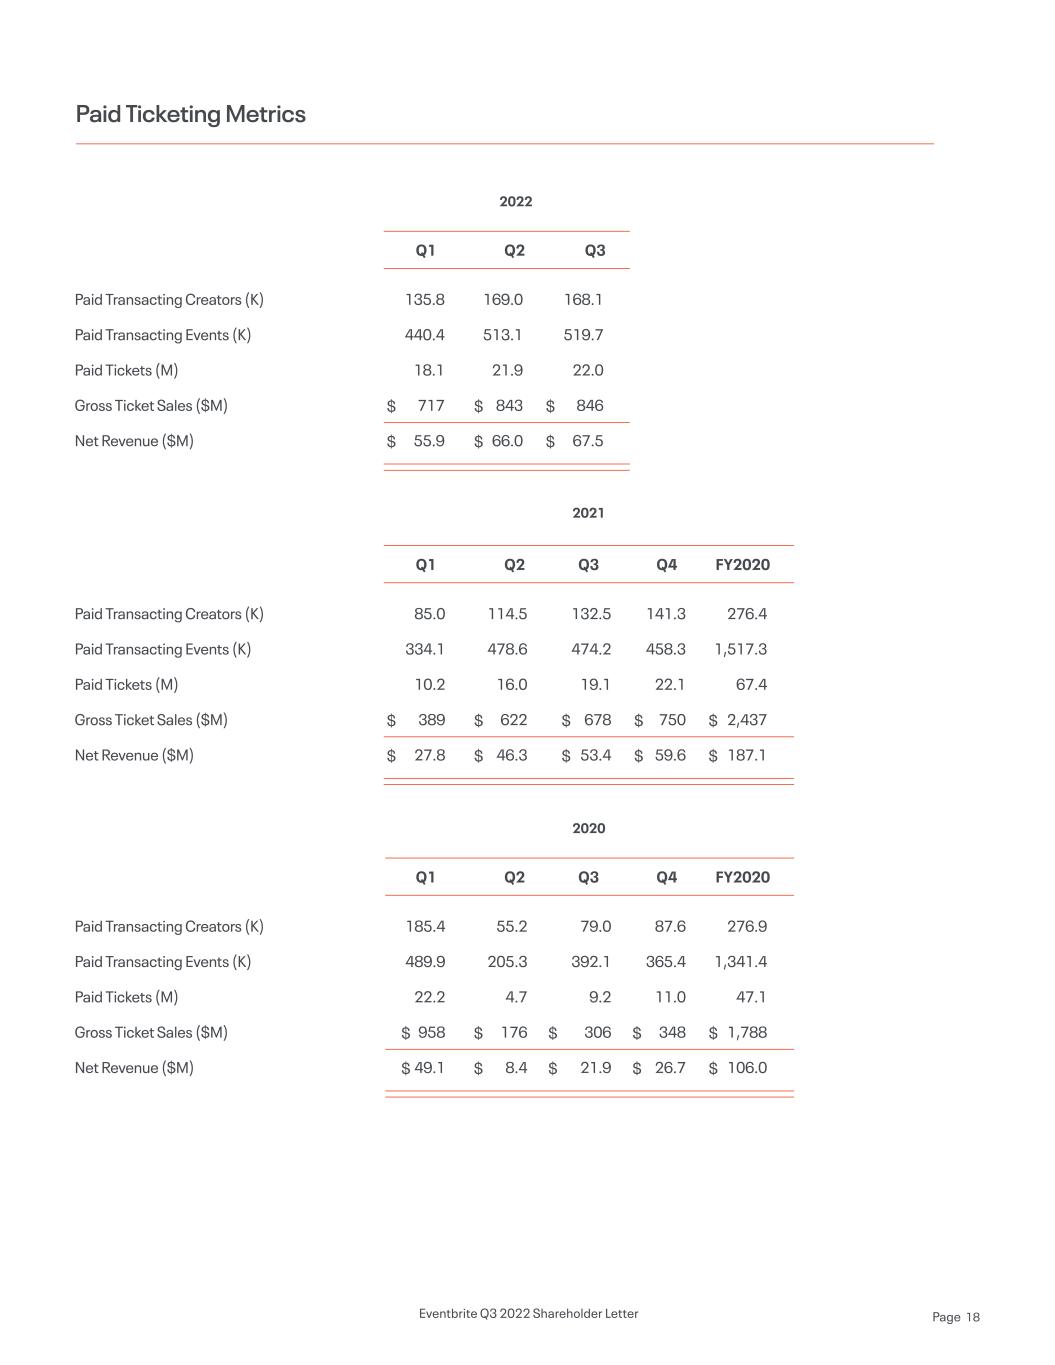
Paid Ticketing Metrics Paid Transacting Creators (K) Paid Transacting Events (K) Paid Tickets (M) Gross Ticket Sales ($M) Net Revenue ($M) Paid Transacting Creators (K) Paid Transacting Events (K) Paid Tickets (M) Gross Ticket Sales ($M) Net Revenue ($M) Paid Transacting Creators (K) Paid Transacting Events (K) Paid Tickets (M) Gross Ticket Sales ($M) Net Revenue ($M) 85.0 334.1 10.2 389 27.8 185.4 489.9 22.2 958 49.1 $ $ $ $ $ $ $ $ $ $ $ $ $ $ $ $ $ $ $ $ $ $ $ $ $ $ 114.5 478.6 16.0 622 46.3 55.2 205.3 4.7 176 8.4 132.5 474.2 19.1 678 53.4 79.0 392.1 9.2 306 21.9 141.3 458.3 22.1 750 59.6 87.6 365.4 11.0 348 26.7 276.4 1,517.3 67.4 2,437 187.1 276.9 1,341.4 47.1 1,788 106.0 135.8 440.4 18.1 717 55.9 169.0 513.1 21.9 843 66.0 168.1 519.7 22.0 846 67.5 2021 2022 2020 Q1 Q1 Q1 Q2 Q2 Q3 Q2 Q3 Q3 Q4 Q4 FY2020 FY2020 Eventbrite Q3 2022 Shareholder Letter Page 18


