
Shareholder Letter Fo od K ar m a Pr oj ec tsQ3 2024 Nov 7, 2024
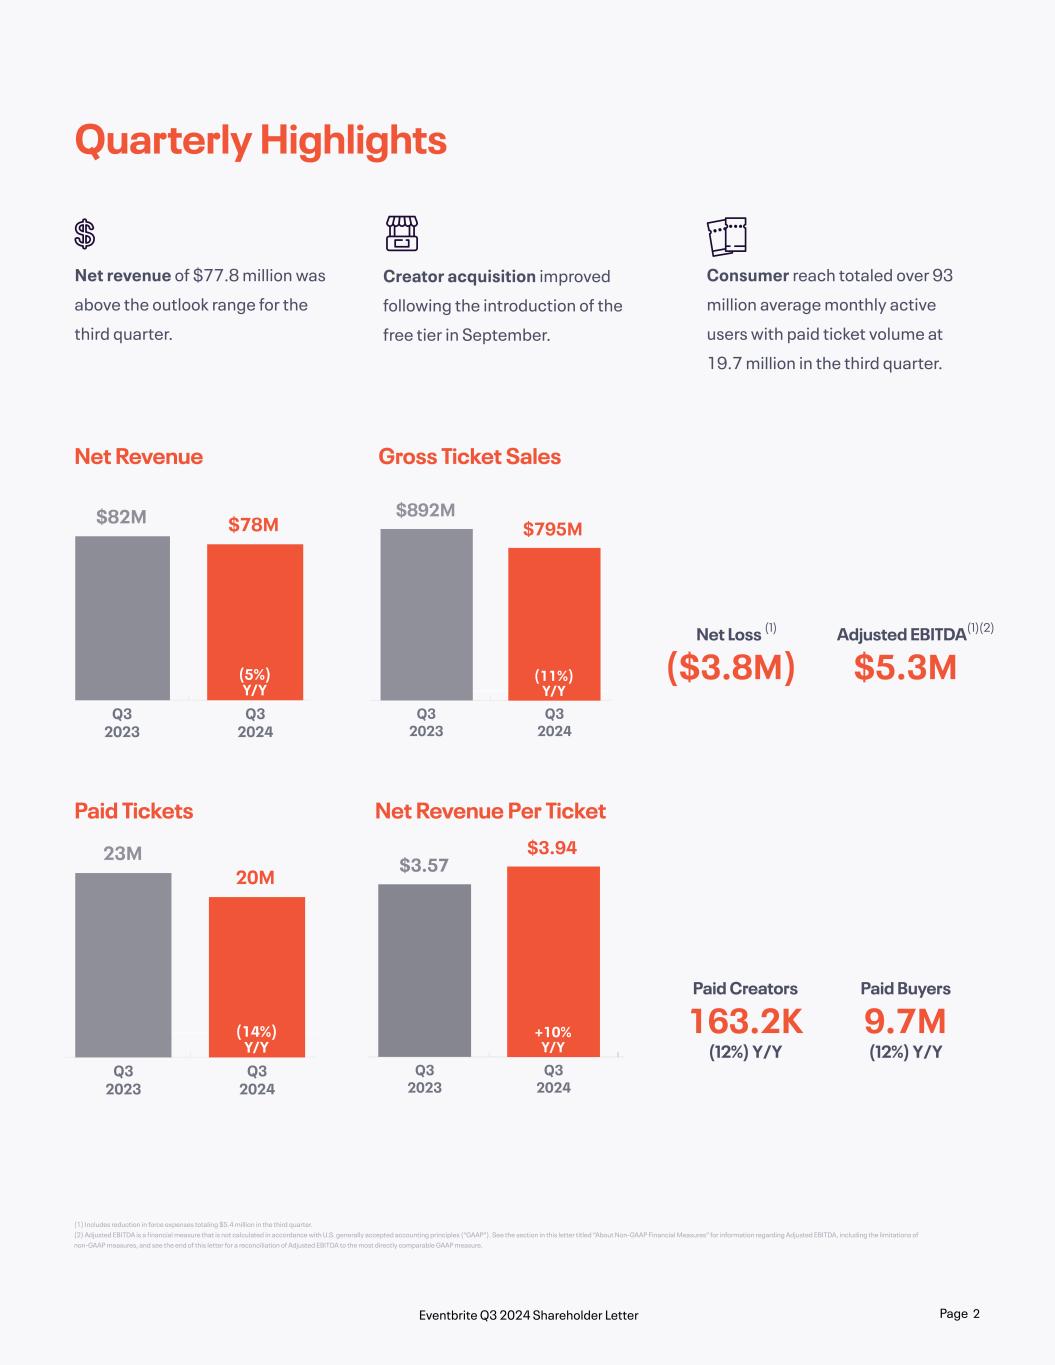
. Net Revenue Paid Tickets Gross Ticket Sales Net Revenue Per Ticket (1) Includes reduction in force expenses totaling $5.4 million in the third quarter. (2) Adjusted EBITDA is a financial measure that is not calculated in accordance with U.S. generally accepted accounting principles (“GAAP”). See the section in this letter titled “About Non-GAAP Financial Measures” for information regarding Adjusted EBITDA, including the limitations of non-GAAP measures, and see the end of this letter for a reconciliation of Adjusted EBITDA to the most directly comparable GAAP measure. Quarterly Highlights Net revenue of $77.8 million was above the outlook range for the third quarter. Consumer reach totaled over 93 million average monthly active users with paid ticket volume at 19.7 million in the third quarter. Paid Creators Net Loss (1) Paid Buyers Adjusted EBITDA(1)(2) (12%) Y/Y (12%) Y/Y 163.2K ($3.8M) 9.7M $5.3M Q3 2024 Q3 2023 $82M $78M (5%) Y/Y Q3 2024 Q3 2023 $892M $795M (11%) Y/Y Q3 2024 Q3 2023 23M 20M (14%) Y/Y Q3 2024 Q3 2023 $3.57 $3.94 +10% Y/Y Creator acquisition improved following the introduction of the free tier in September. Page 2Eventbrite Q3 2024 Shareholder Letter
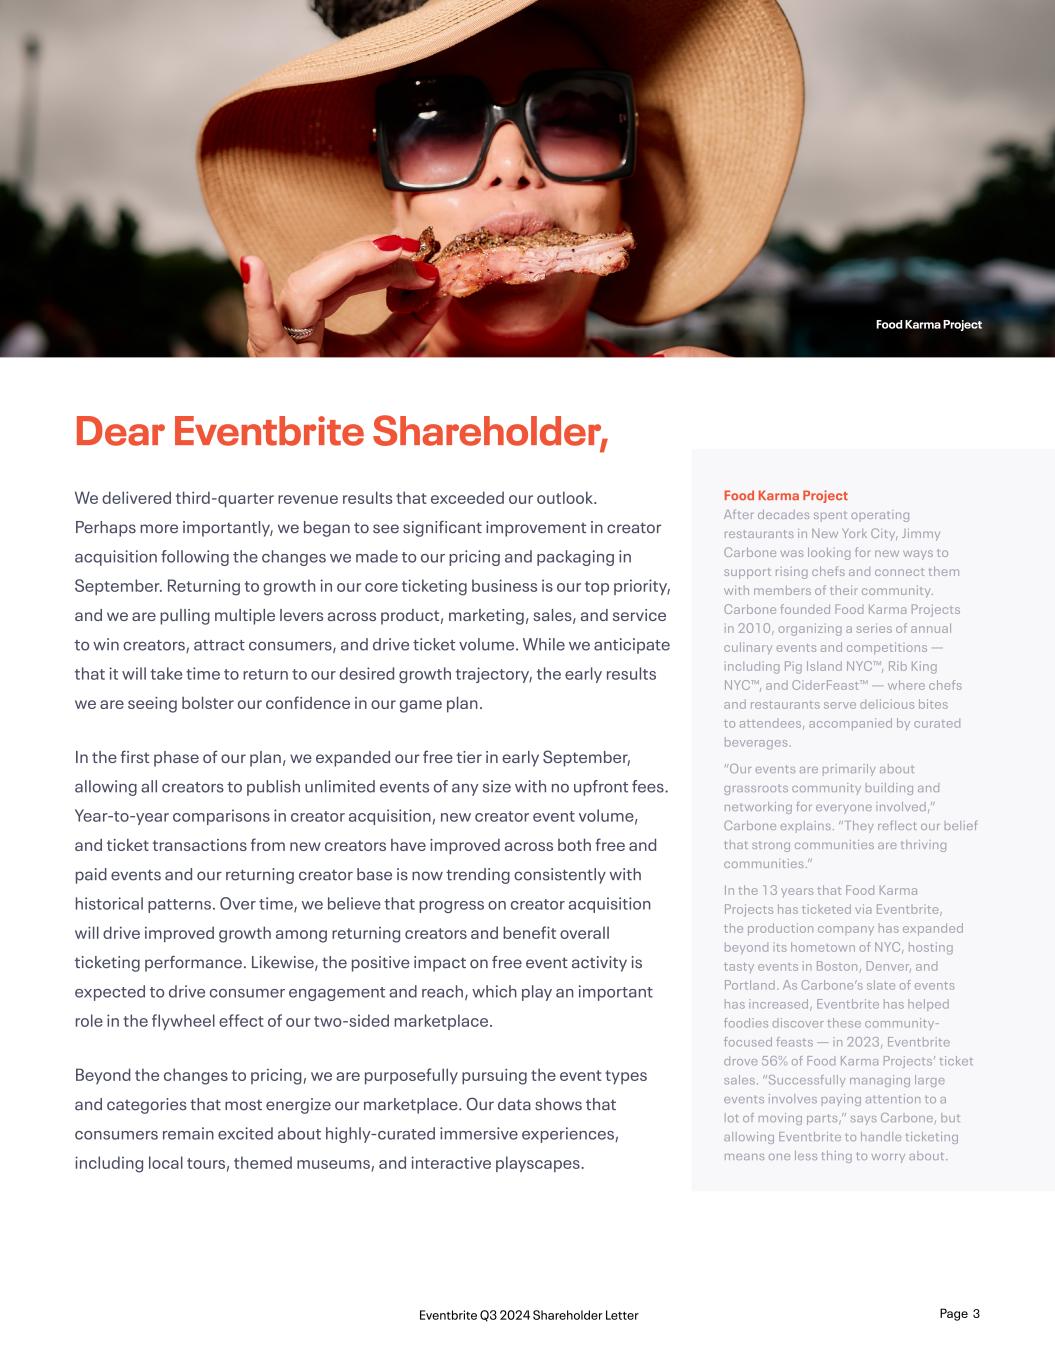
Dear Eventbrite Shareholder, We delivered third-quarter revenue results that exceeded our outlook. Perhaps more importantly, we began to see significant improvement in creator acquisition following the changes we made to our pricing and packaging in September. Returning to growth in our core ticketing business is our top priority, and we are pulling multiple levers across product, marketing, sales, and service to win creators, attract consumers, and drive ticket volume. While we anticipate that it will take time to return to our desired growth trajectory, the early results we are seeing bolster our confidence in our game plan. In the first phase of our plan, we expanded our free tier in early September, allowing all creators to publish unlimited events of any size with no upfront fees. Year-to-year comparisons in creator acquisition, new creator event volume, and ticket transactions from new creators have improved across both free and paid events and our returning creator base is now trending consistently with historical patterns. Over time, we believe that progress on creator acquisition will drive improved growth among returning creators and benefit overall ticketing performance. Likewise, the positive impact on free event activity is expected to drive consumer engagement and reach, which play an important role in the flywheel effect of our two-sided marketplace. Beyond the changes to pricing, we are purposefully pursuing the event types and categories that most energize our marketplace. Our data shows that consumers remain excited about highly-curated immersive experiences, including local tours, themed museums, and interactive playscapes. Food Karma Project Food Karma Project After decades spent operating restaurants in New York City, Jimmy Carbone was looking for new ways to support rising chefs and connect them with members of their community. Carbone founded Food Karma Projects in 2010, organizing a series of annual culinary events and competitions — including Pig Island NYC™, Rib King NYC™, and CiderFeast™ — where chefs and restaurants serve delicious bites to attendees, accompanied by curated beverages. “Our events are primarily about grassroots community building and networking for everyone involved,” Carbone explains. “They reflect our belief that strong communities are thriving communities.” In the 13 years that Food Karma Projects has ticketed via Eventbrite, the production company has expanded beyond its hometown of NYC, hosting tasty events in Boston, Denver, and Portland. As Carbone’s slate of events has increased, Eventbrite has helped foodies discover these community- focused feasts — in 2023, Eventbrite drove 56% of Food Karma Projects’ ticket sales. “Successfully managing large events involves paying attention to a lot of moving parts,” says Carbone, but allowing Eventbrite to handle ticketing means one less thing to worry about. Page 3Eventbrite Q3 2024 Shareholder Letter
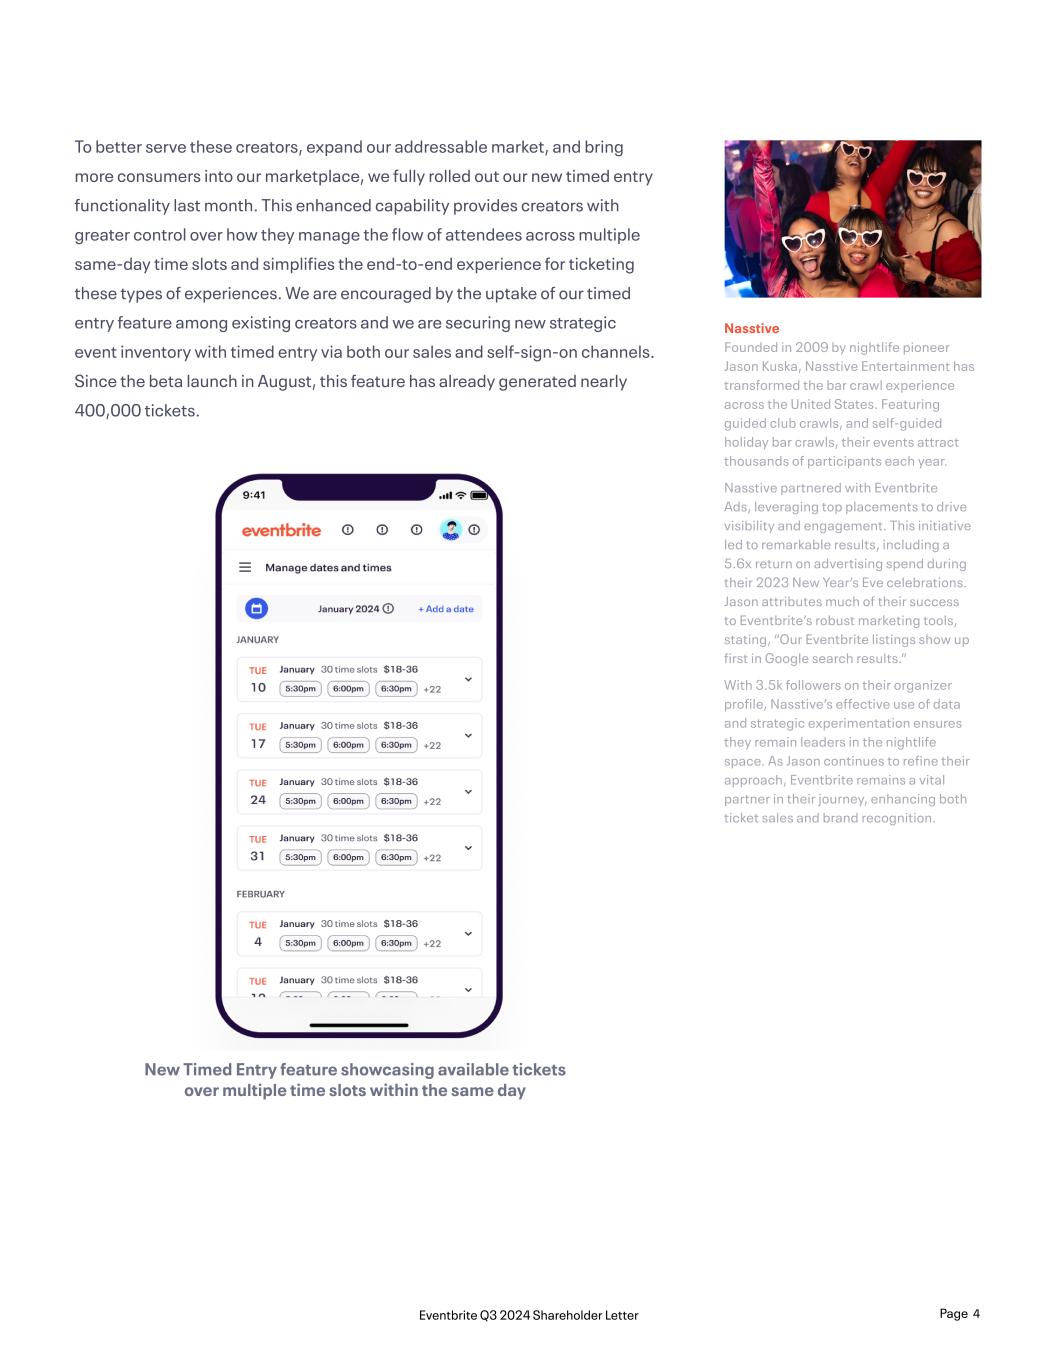
To better serve these creators, expand our addressable market, and bring more consumers into our marketplace, we fully rolled out our new timed entry functionality last month. This enhanced capability provides creators with greater control over how they manage the flow of attendees across multiple same-day time slots and simplifies the end-to-end experience for ticketing these types of experiences. We are encouraged by the uptake of our timed entry feature among existing creators and we are securing new strategic event inventory with timed entry via both our sales and self-sign-on channels. Since the beta launch in August, this feature has already generated nearly 400,000 tickets. Nasstive Founded in 2009 by nightlife pioneer Jason Kuska, Nasstive Entertainment has transformed the bar crawl experience across the United States. Featuring guided club crawls, and self-guided holiday bar crawls, their events attract thousands of participants each year. Nasstive partnered with Eventbrite Ads, leveraging top placements to drive visibility and engagement. This initiative led to remarkable results, including a 5.6x return on advertising spend during their 2023 New Year’s Eve celebrations. Jason attributes much of their success to Eventbrite’s robust marketing tools, stating, “Our Eventbrite listings show up first in Google search results.” With 3.5k followers on their organizer profile, Nasstive’s effective use of data and strategic experimentation ensures they remain leaders in the nightlife space. As Jason continues to refine their approach, Eventbrite remains a vital partner in their journey, enhancing both ticket sales and brand recognition. New Timed Entry feature showcasing available tickets over multiple time slots within the same day Page 4Eventbrite Q3 2024 Shareholder Letter
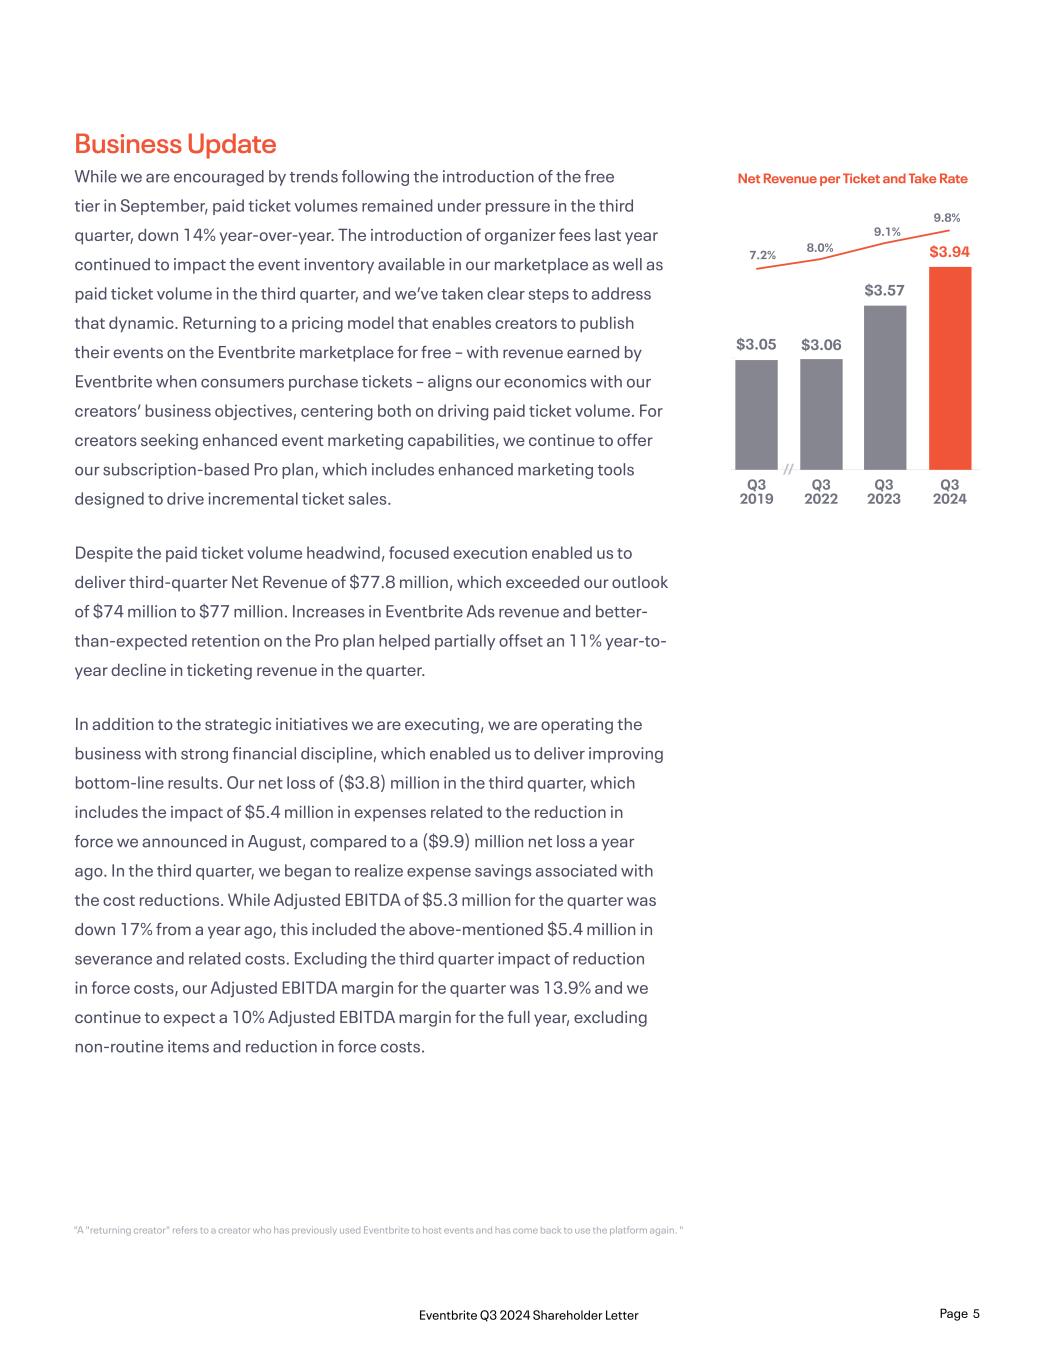
Business Update While we are encouraged by trends following the introduction of the free tier in September, paid ticket volumes remained under pressure in the third quarter, down 14% year-over-year. The introduction of organizer fees last year continued to impact the event inventory available in our marketplace as well as paid ticket volume in the third quarter, and we’ve taken clear steps to address that dynamic. Returning to a pricing model that enables creators to publish their events on the Eventbrite marketplace for free – with revenue earned by Eventbrite when consumers purchase tickets – aligns our economics with our creators’ business objectives, centering both on driving paid ticket volume. For creators seeking enhanced event marketing capabilities, we continue to offer our subscription-based Pro plan, which includes enhanced marketing tools designed to drive incremental ticket sales. Despite the paid ticket volume headwind, focused execution enabled us to deliver third-quarter Net Revenue of $77.8 million, which exceeded our outlook of $74 million to $77 million. Increases in Eventbrite Ads revenue and better- than-expected retention on the Pro plan helped partially offset an 11% year-to- year decline in ticketing revenue in the quarter. In addition to the strategic initiatives we are executing, we are operating the business with strong financial discipline, which enabled us to deliver improving bottom-line results. Our net loss of ($3.8) million in the third quarter, which includes the impact of $5.4 million in expenses related to the reduction in force we announced in August, compared to a ($9.9) million net loss a year ago. In the third quarter, we began to realize expense savings associated with the cost reductions. While Adjusted EBITDA of $5.3 million for the quarter was down 17% from a year ago, this included the above-mentioned $5.4 million in severance and related costs. Excluding the third quarter impact of reduction in force costs, our Adjusted EBITDA margin for the quarter was 13.9% and we continue to expect a 10% Adjusted EBITDA margin for the full year, excluding non-routine items and reduction in force costs. 2,000000 2,214286 2,428571 2,642857 2,857143 3,071429 3,285714 3,500000 Q3 2024 Q3 2023 Q3 2022 Q3 2019 $3.05 $3.06 $3.57 7.2% 8.0% 9.1% 9.8% $3.94 // Net Revenue per Ticket and Take Rate "A "returning creator" refers to a creator who has previously used Eventbrite to host events and has come back to use the platform again. " Page 5Eventbrite Q3 2024 Shareholder Letter
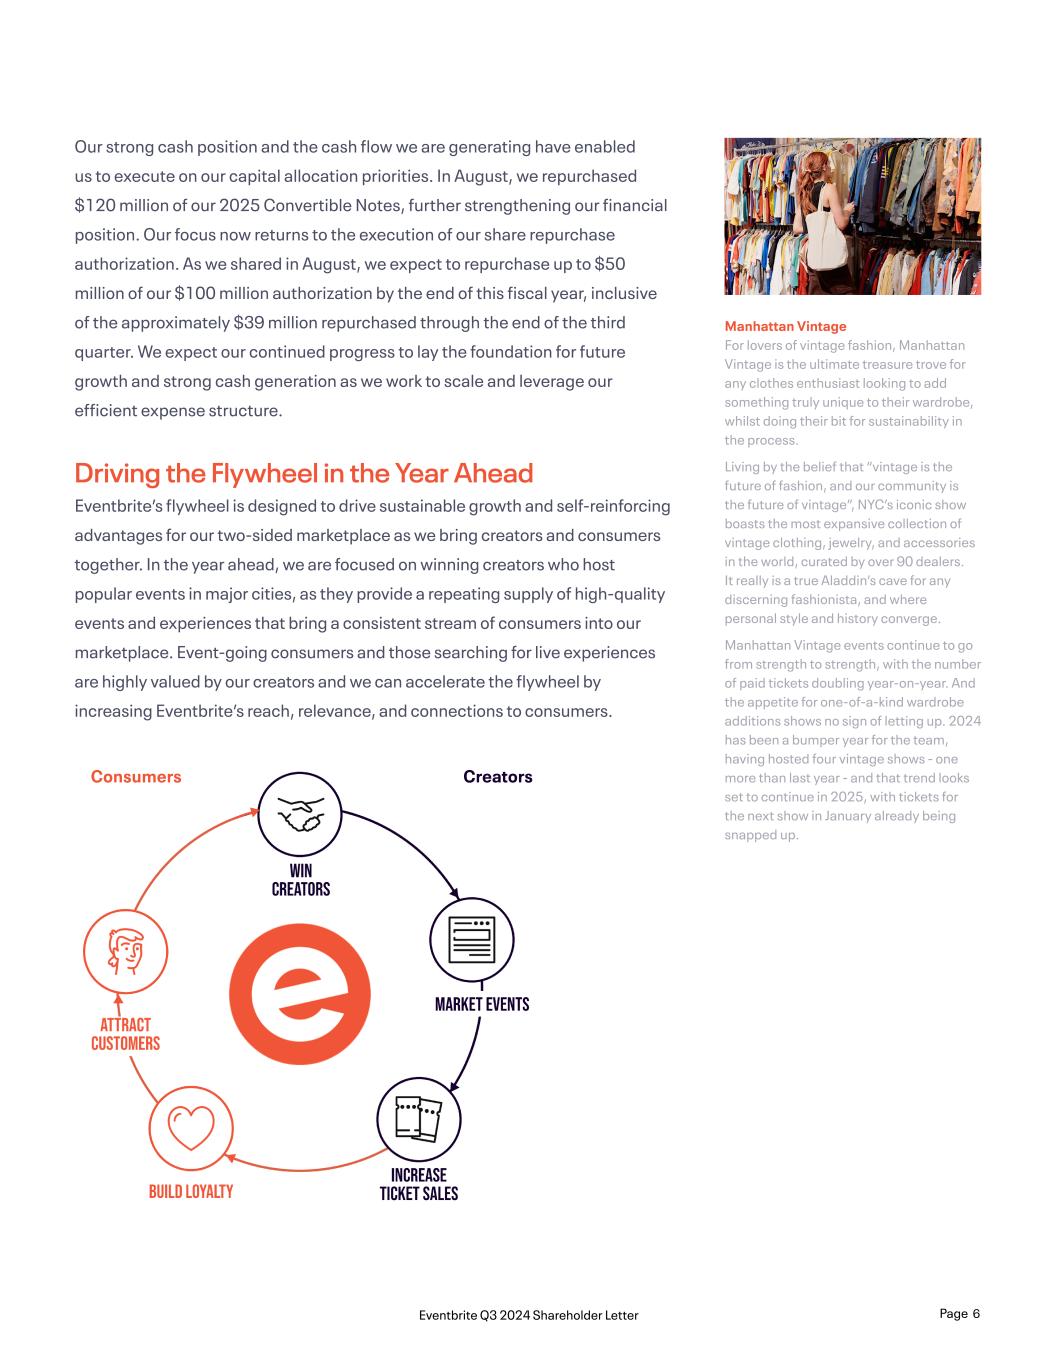
Our strong cash position and the cash flow we are generating have enabled us to execute on our capital allocation priorities. In August, we repurchased $120 million of our 2025 Convertible Notes, further strengthening our financial position. Our focus now returns to the execution of our share repurchase authorization. As we shared in August, we expect to repurchase up to $50 million of our $100 million authorization by the end of this fiscal year, inclusive of the approximately $39 million repurchased through the end of the third quarter. We expect our continued progress to lay the foundation for future growth and strong cash generation as we work to scale and leverage our efficient expense structure. Driving the Flywheel in the Year Ahead Eventbrite’s flywheel is designed to drive sustainable growth and self-reinforcing advantages for our two-sided marketplace as we bring creators and consumers together. In the year ahead, we are focused on winning creators who host popular events in major cities, as they provide a repeating supply of high-quality events and experiences that bring a consistent stream of consumers into our marketplace. Event-going consumers and those searching for live experiences are highly valued by our creators and we can accelerate the flywheel by increasing Eventbrite’s reach, relevance, and connections to consumers. Manhattan Vintage For lovers of vintage fashion, Manhattan Vintage is the ultimate treasure trove for any clothes enthusiast looking to add something truly unique to their wardrobe, whilst doing their bit for sustainability in the process. Living by the belief that “vintage is the future of fashion, and our community is the future of vintage”, NYC’s iconic show boasts the most expansive collection of vintage clothing, jewelry, and accessories in the world, curated by over 90 dealers. It really is a true Aladdin’s cave for any discerning fashionista, and where personal style and history converge. Manhattan Vintage events continue to go from strength to strength, with the number of paid tickets doubling year-on-year. And the appetite for one-of-a-kind wardrobe additions shows no sign of letting up. 2024 has been a bumper year for the team, having hosted four vintage shows - one more than last year - and that trend looks set to continue in 2025, with tickets for the next show in January already being snapped up. Consumers Creators Page 6Eventbrite Q3 2024 Shareholder Letter
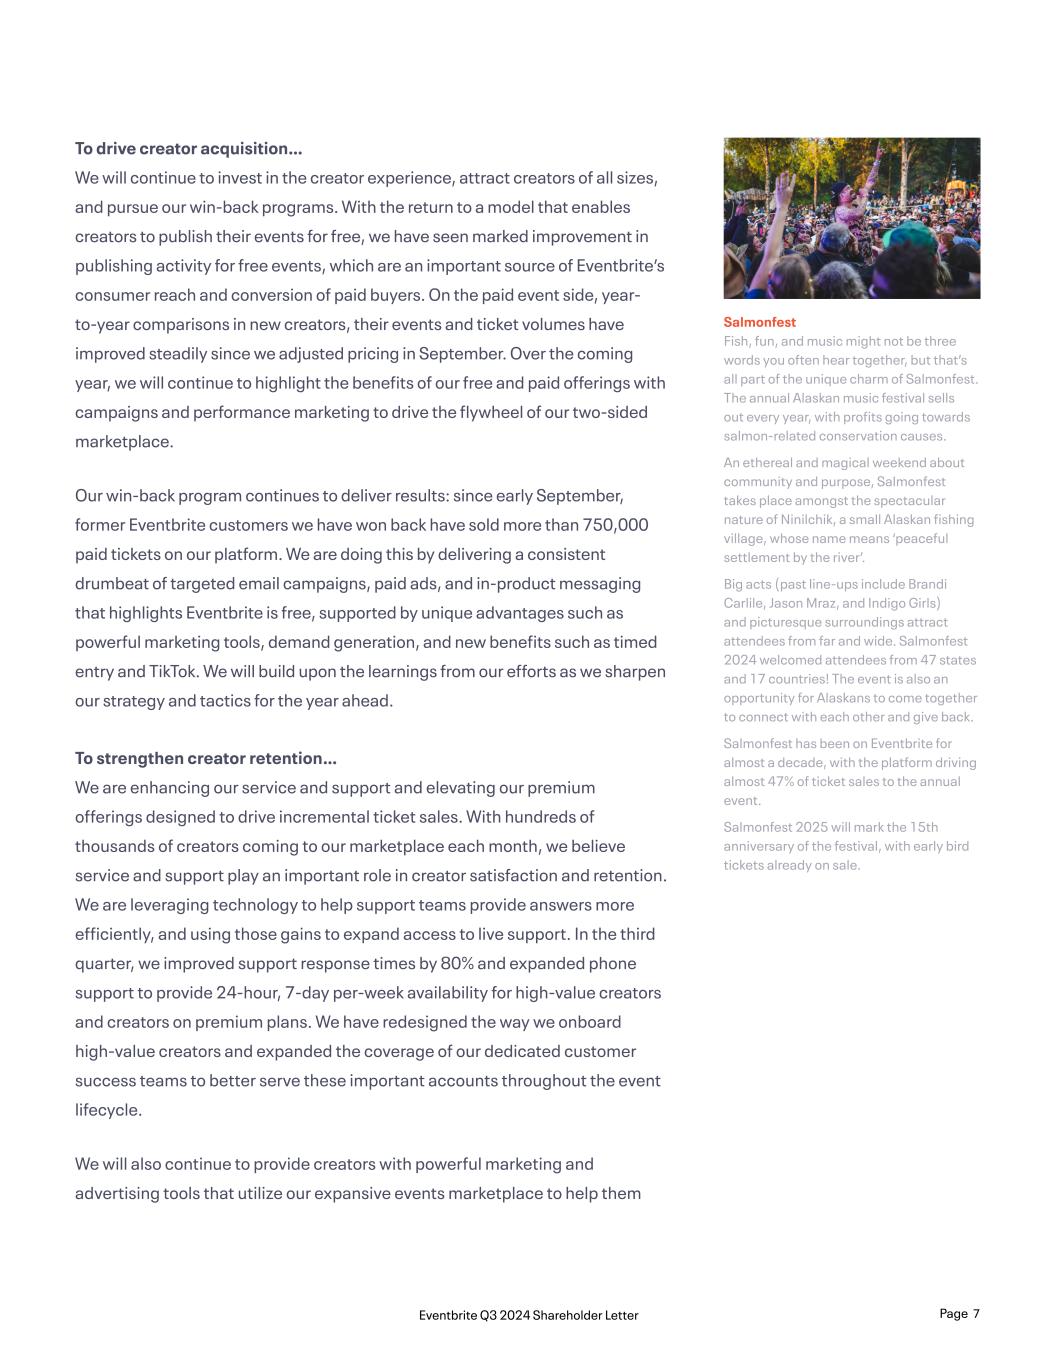
To drive creator acquisition… We will continue to invest in the creator experience, attract creators of all sizes, and pursue our win-back programs. With the return to a model that enables creators to publish their events for free, we have seen marked improvement in publishing activity for free events, which are an important source of Eventbrite’s consumer reach and conversion of paid buyers. On the paid event side, year- to-year comparisons in new creators, their events and ticket volumes have improved steadily since we adjusted pricing in September. Over the coming year, we will continue to highlight the benefits of our free and paid offerings with campaigns and performance marketing to drive the flywheel of our two-sided marketplace. Our win-back program continues to deliver results: since early September, former Eventbrite customers we have won back have sold more than 750,000 paid tickets on our platform. We are doing this by delivering a consistent drumbeat of targeted email campaigns, paid ads, and in-product messaging that highlights Eventbrite is free, supported by unique advantages such as powerful marketing tools, demand generation, and new benefits such as timed entry and TikTok. We will build upon the learnings from our efforts as we sharpen our strategy and tactics for the year ahead. To strengthen creator retention… We are enhancing our service and support and elevating our premium offerings designed to drive incremental ticket sales. With hundreds of thousands of creators coming to our marketplace each month, we believe service and support play an important role in creator satisfaction and retention. We are leveraging technology to help support teams provide answers more efficiently, and using those gains to expand access to live support. In the third quarter, we improved support response times by 80% and expanded phone support to provide 24-hour, 7-day per-week availability for high-value creators and creators on premium plans. We have redesigned the way we onboard high-value creators and expanded the coverage of our dedicated customer success teams to better serve these important accounts throughout the event lifecycle. We will also continue to provide creators with powerful marketing and advertising tools that utilize our expansive events marketplace to help them Salmonfest Fish, fun, and music might not be three words you often hear together, but that’s all part of the unique charm of Salmonfest. The annual Alaskan music festival sells out every year, with profits going towards salmon-related conservation causes. An ethereal and magical weekend about community and purpose, Salmonfest takes place amongst the spectacular nature of Ninilchik, a small Alaskan fishing village, whose name means ‘peaceful settlement by the river’. Big acts (past line-ups include Brandi Carlile, Jason Mraz, and Indigo Girls) and picturesque surroundings attract attendees from far and wide. Salmonfest 2024 welcomed attendees from 47 states and 17 countries! The event is also an opportunity for Alaskans to come together to connect with each other and give back. Salmonfest has been on Eventbrite for almost a decade, with the platform driving almost 47% of ticket sales to the annual event. Salmonfest 2025 will mark the 15th anniversary of the festival, with early bird tickets already on sale. Page 7Eventbrite Q3 2024 Shareholder Letter
build anticipation before events, drive ticket sales, and re-engage audiences for future events. Today, one in ten of our free and paid creators subscribes to the enhanced email marketing capabilities of our Pro product, and approximately 10,000 creators per month are using Eventbrite Ads to market their events. We see a significant opportunity to expand adoption of our event marketing programs via product improvements and targeted product marketing. We believe that by having creators experience the tangible benefits of our volume-driving marketing and ad offerings, they will achieve greater success on the platform and, in turn, become more successful and loyal Eventbrite customers. To drive consumer acquisition… We continue to increase our strategic inventory by investing in our Sales channel. Sales pipeline generation and efficiency improved significantly across all geographies, leading to more than $4.5 million in new bookings in the third quarter and strong momentum going into the holiday season. The events we have won span key categories our consumers are searching for, including music, food and drink, and comedy shows. Our new Sales leadership has brought new strategic inventory, holiday events, and timed-entry experiences into our marketplace, and in the coming year, we plan to invest in the team to drive acquisition of larger events and creators. We will also continue to connect consumers with creators on our platform at scale with compelling social media experiences. Thanks in part to our social partnerships, the number of consumers coming to Eventbrite to search for local events grew by nearly 20% in the third quarter compared to last year and we see an opportunity to expand these consumer-creator connections as partnerships like our TikTok integration mature and as we explore additional channels to drive engagement. To drive consumer conversion… We are investing in a more engaging Consumer App experience, greater personalization and discoverability. We seek to build consumer loyalty that generates repeat purchases, both free and paid, and make Eventbrite the desired spot to search for and find one-of-a-kind events. We see the greatest consumer engagement and purchase frequency within the mobile app, where logged-in usage is higher, localization and personalization can be stronger, Page 8Eventbrite Q3 2024 Shareholder Letter
and consumer purchase frequency is twice as great as on our web surfaces. Our revamped app is designed to improve the discoverability of events on our platform and strengthen the recommendations we provide our users. We are in live user testing today and are excited about our plans to bring the improved mobile app to the market in the coming year, with the twin goals of increasing consumer engagement and more effectively showcasing creators’ events. Strengthening Our Leadership As we look forward to the year ahead, we are putting in place the leadership to drive our marketplace transformation and propel Eventbrite to its next growth phase. Effective November 19, Anand Gandhi will join Eventbrite as our Chief Financial Officer. Anand comes to Eventbrite from Viator, the world's leading marketplace for travel experiences, where he was the CFO. During his tenure, he helped transform the financial performance of the business, driving to profitability while more than doubling revenue. Anand brings a valuable perspective to our Executive Leadership Team, with financial, operational, and strategic leadership experience across the consumer entertainment landscape, including at Disney, Fox, Viacom, and Time, as well as experience scaling a hyper-growth online marketplace as CFO of Skillshare. Anand’s appointment will sharpen our operational focus by allowing Lanny Baker to devote his attention to his new role as our Chief Operating Officer. Lanny has been a valuable partner to Eventbrite’s executive leadership team since he joined as CFO in 2019, and is already strengthening our ways of working, while ensuring we achieve operational progress as we execute our marketplace transformation. This transition will enable him to focus on revenue generation, business operations and leading our Sales and Customer Experience teams, which will be vital to our near- and long-term success. Page 9Eventbrite Q3 2024 Shareholder Letter
In Summary We are encouraged by the early momentum we are achieving as we begin to drive the strategic initiatives designed to deliver stronger results and position us to capture the large opportunity ahead. While the introduction of organizer fees slowed the progress of our marketplace transition, we have strong conviction in our long-term strategy, and the reintroduction of the expanded free tier has begun to attract more events and creators to Eventbrite to drive it forward. To continue the momentum of this important first step, we have outlined a series of strategic initiatives to build on the increased activity on the platform. As we look to the year ahead, we aim to execute with rigor and discipline to deliver value for our creators, consumers and shareholders, and appreciate your support through this year of transition. Sincerely, Julia Hartz CEO Lanny Baker COO & CFO Page 10Eventbrite Q3 2024 Shareholder Letter
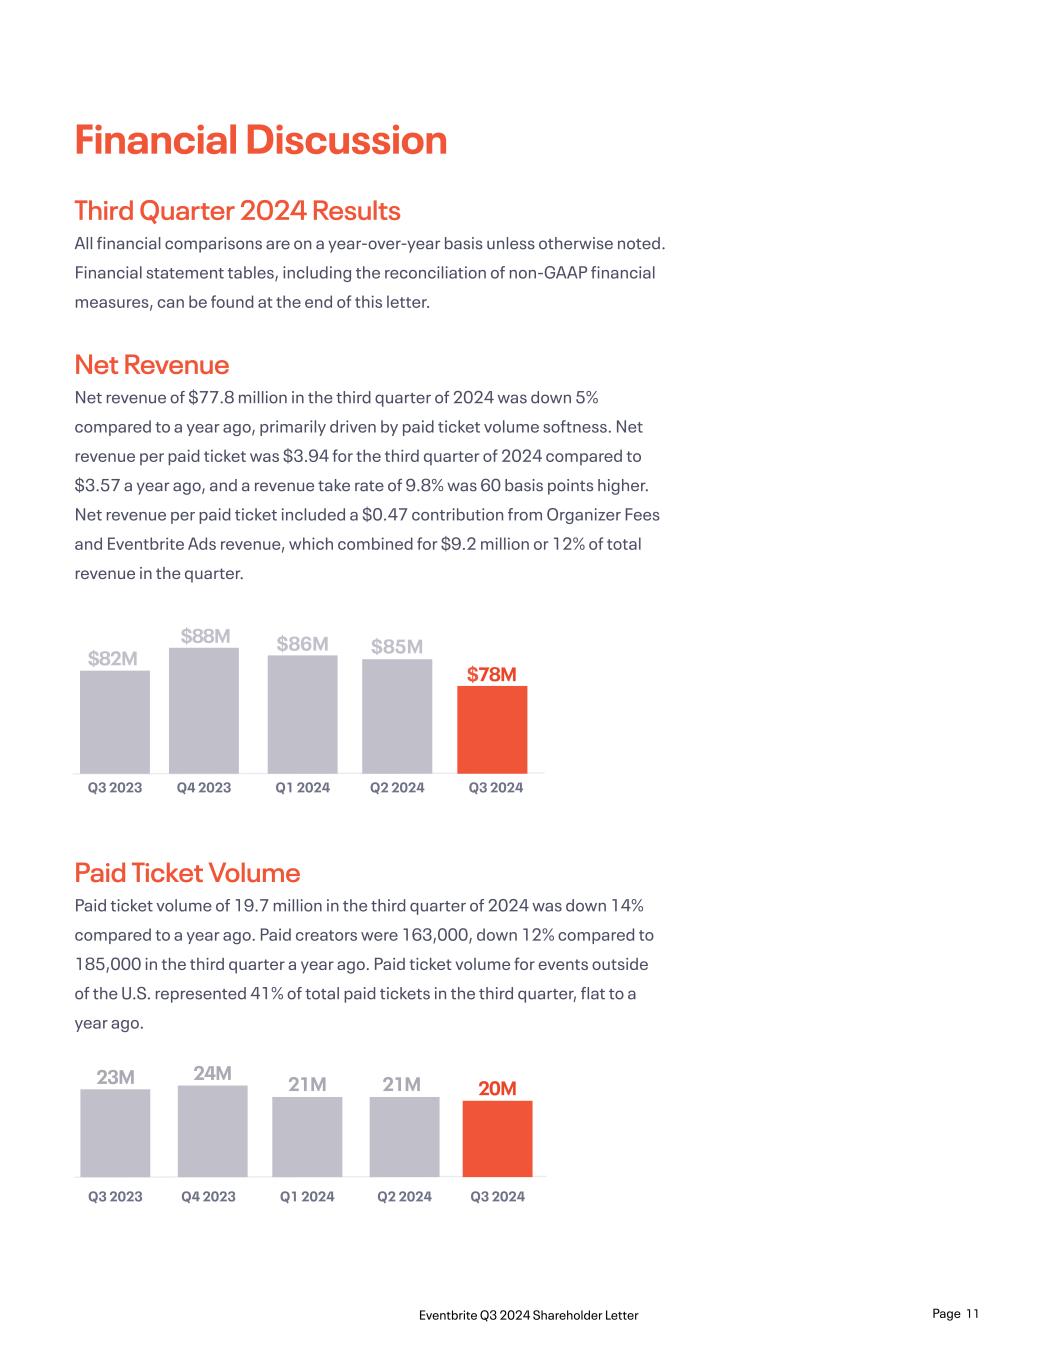
Q3 2024Q2 2024Q1 2024Q4 2023Q3 2023 $82M $88M $86M $85M $78M Q3 2024Q2 2024Q1 2024Q4 2023Q3 2023 23M 24M 21M 21M 20M Financial Discussion Third Quarter 2024 Results All financial comparisons are on a year-over-year basis unless otherwise noted. Financial statement tables, including the reconciliation of non-GAAP financial measures, can be found at the end of this letter. Net Revenue Net revenue of $77.8 million in the third quarter of 2024 was down 5% compared to a year ago, primarily driven by paid ticket volume softness. Net revenue per paid ticket was $3.94 for the third quarter of 2024 compared to $3.57 a year ago, and a revenue take rate of 9.8% was 60 basis points higher. Net revenue per paid ticket included a $0.47 contribution from Organizer Fees and Eventbrite Ads revenue, which combined for $9.2 million or 12% of total revenue in the quarter. Paid Ticket Volume Paid ticket volume of 19.7 million in the third quarter of 2024 was down 14% compared to a year ago. Paid creators were 163,000, down 12% compared to 185,000 in the third quarter a year ago. Paid ticket volume for events outside of the U.S. represented 41% of total paid tickets in the third quarter, flat to a year ago. Page 11Eventbrite Q3 2024 Shareholder Letter

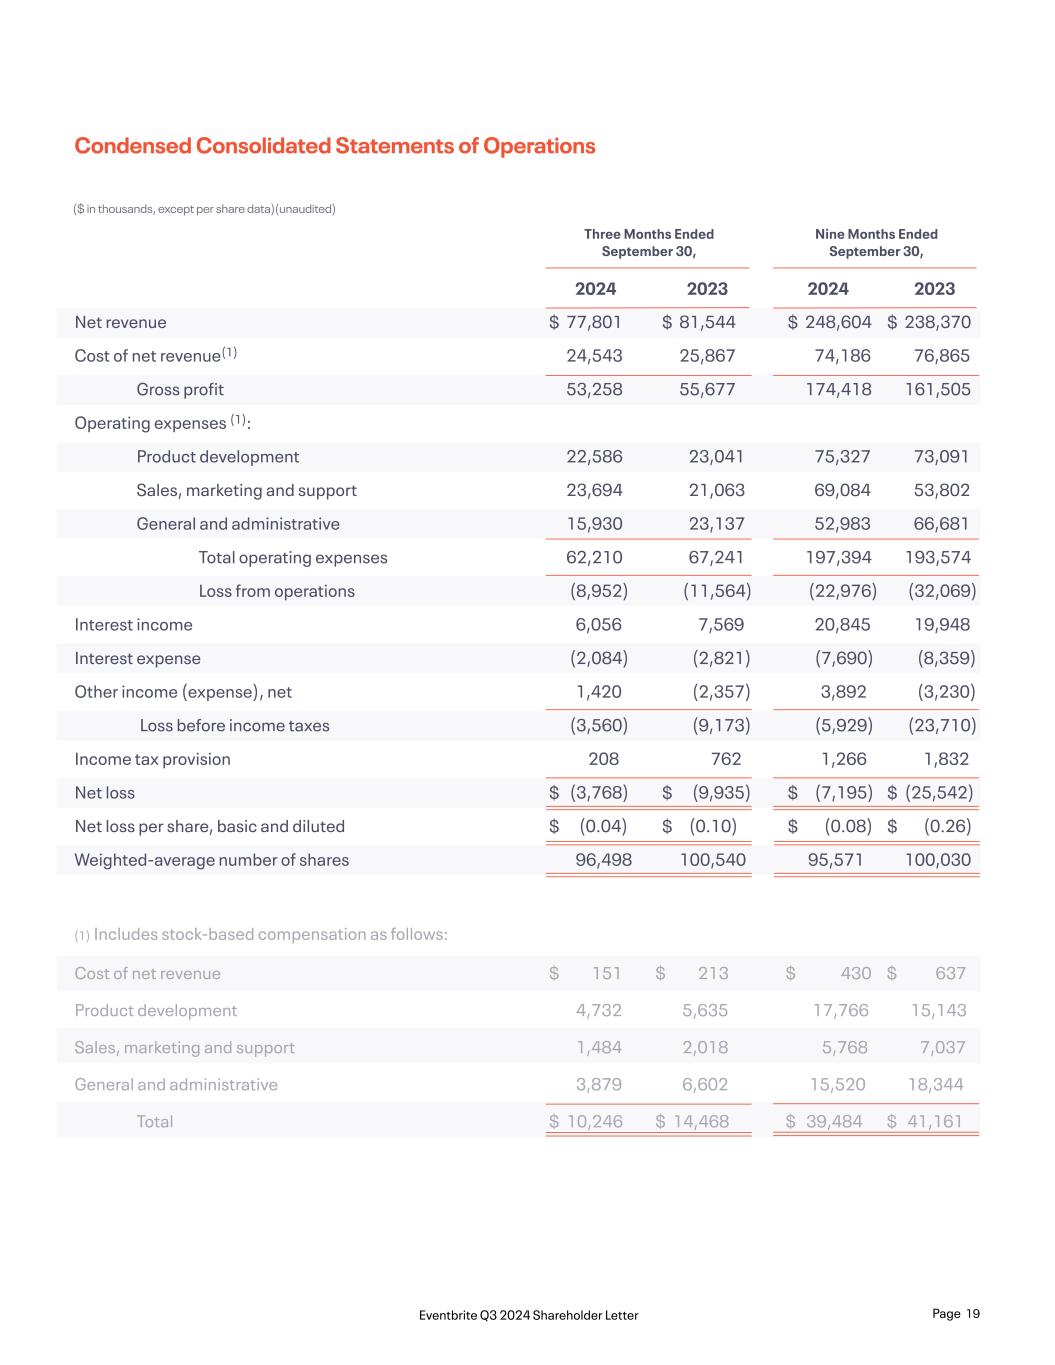
Q3 2024Q2 2024Q1 2024Q4 2023Q3 2023 $56M $61M $61M $60M $53M Product Development Sales, Marketing & Support General & Administrative Q3 2023 Q3 2024 $23M $21M $23M $67M $24M $23M $62M $16M As reported GAAP Total Operating Expense Gross Profit Gross profit was $53.3 million in the third quarter of 2024, down 4% year- over-year for a gross margin of 68.5% compared to 68.3% a year ago. The slight improvement in gross margin reflects the increased contribution of marketplace revenue year-over-year, and steps taken to reduce the cost of revenue. In the third quarter of 2023, cost of revenue included $0.2 million in restructuring costs. Operating Expenses Operating expenses were $62.2 million in the third quarter of 2024, compared to $67.2 million in the third quarter of 2023. Operating expenses, in the third quarter of 2024, included $5.4 million in headcount reduction costs, partially offset by $3.7 million in adjustments made to our full-year incentive compensation expense related to our adjusted expectations for the year. The third quarter of 2023 included $0.5 million in restructuring costs partially offset by a $0.4 million benefit from other costs. Product development expenses were $22.6 million for the third quarter, compared to $23.0 million a year ago. In the third quarter of 2024, product development expenses included $3.4 million related to the reduction in force costs, partially offset by $1.8 million in adjustments to our full-year incentive compensation expense. In the third quarter of 2023, we saw $0.1 million in restructuring costs. Sales, marketing, and support expenses were $23.7 million for the third quarter, compared to $21.1 million a year ago. Sales, marketing, and support expenses in the third quarter of 2024 saw a decrease in marketing expenses, offset by an increase in chargebacks and fraud remediation expenses, which totaled $6.8 million compared to $1.4 million a year ago in the same period. The third quarter of 2024 included a $0.8 million benefit as a result Page 12Eventbrite Q3 2024 Shareholder Letter
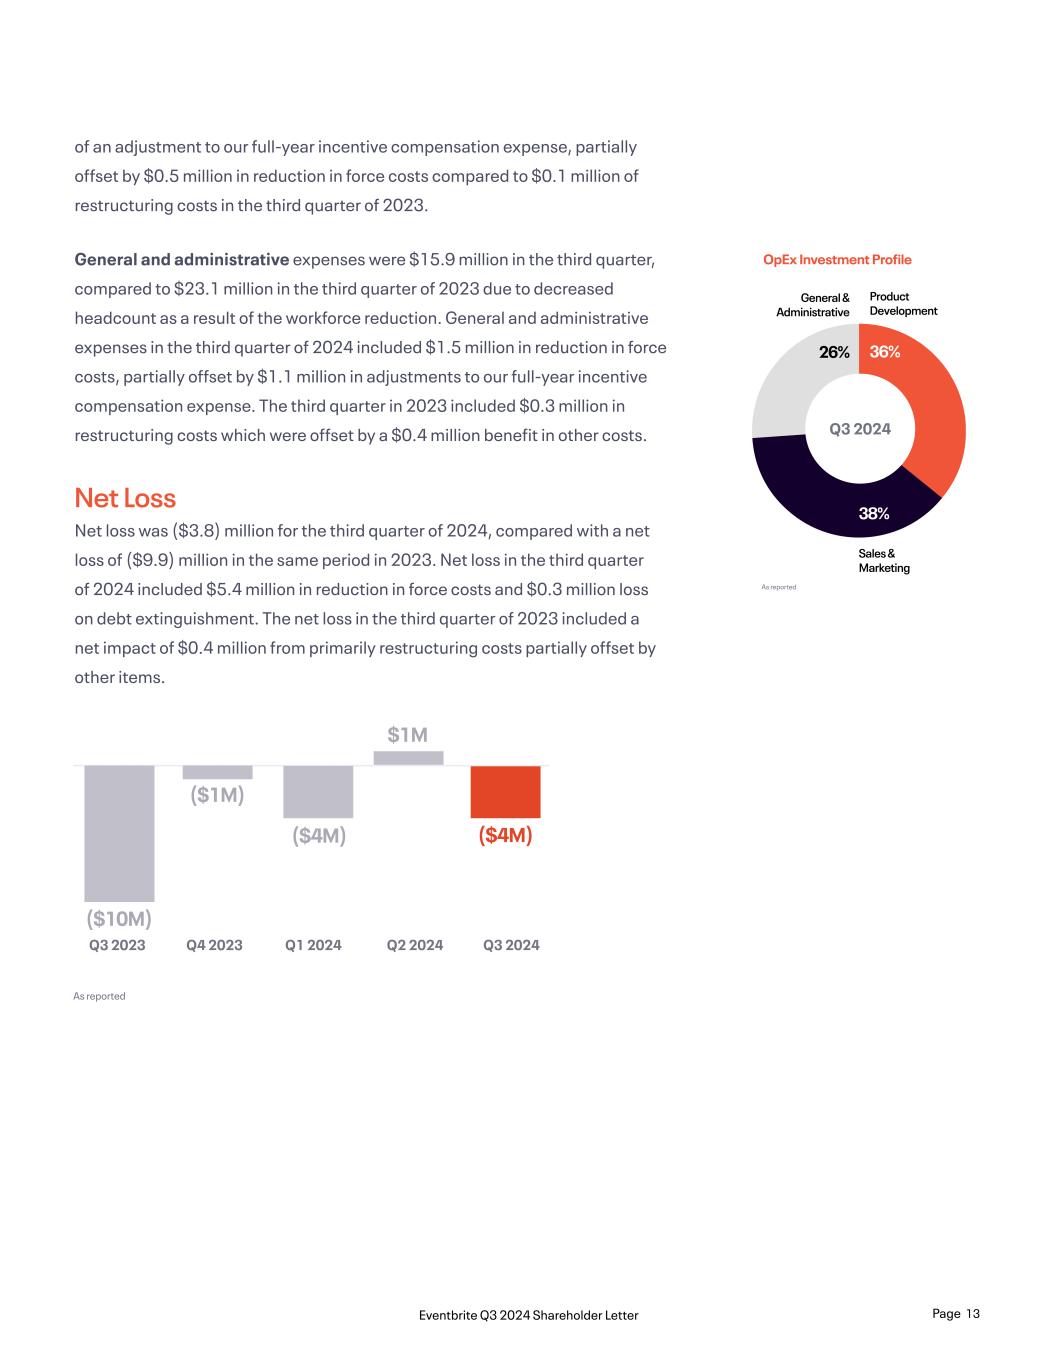
OpEx Investment Profile Q3 2024 26% General & Administrative 36% 38% Product Development Sales & Marketing As reported As reported $1M ($1M) Q3 2024Q2 2024Q1 2024Q4 2023Q3 2023 ($10M) ($4M) ($4M) of an adjustment to our full-year incentive compensation expense, partially offset by $0.5 million in reduction in force costs compared to $0.1 million of restructuring costs in the third quarter of 2023. General and administrative expenses were $15.9 million in the third quarter, compared to $23.1 million in the third quarter of 2023 due to decreased headcount as a result of the workforce reduction. General and administrative expenses in the third quarter of 2024 included $1.5 million in reduction in force costs, partially offset by $1.1 million in adjustments to our full-year incentive compensation expense. The third quarter in 2023 included $0.3 million in restructuring costs which were offset by a $0.4 million benefit in other costs. Net Loss Net loss was ($3.8) million for the third quarter of 2024, compared with a net loss of ($9.9) million in the same period in 2023. Net loss in the third quarter of 2024 included $5.4 million in reduction in force costs and $0.3 million loss on debt extinguishment. The net loss in the third quarter of 2023 included a net impact of $0.4 million from primarily restructuring costs partially offset by other items. Page 13Eventbrite Q3 2024 Shareholder Letter
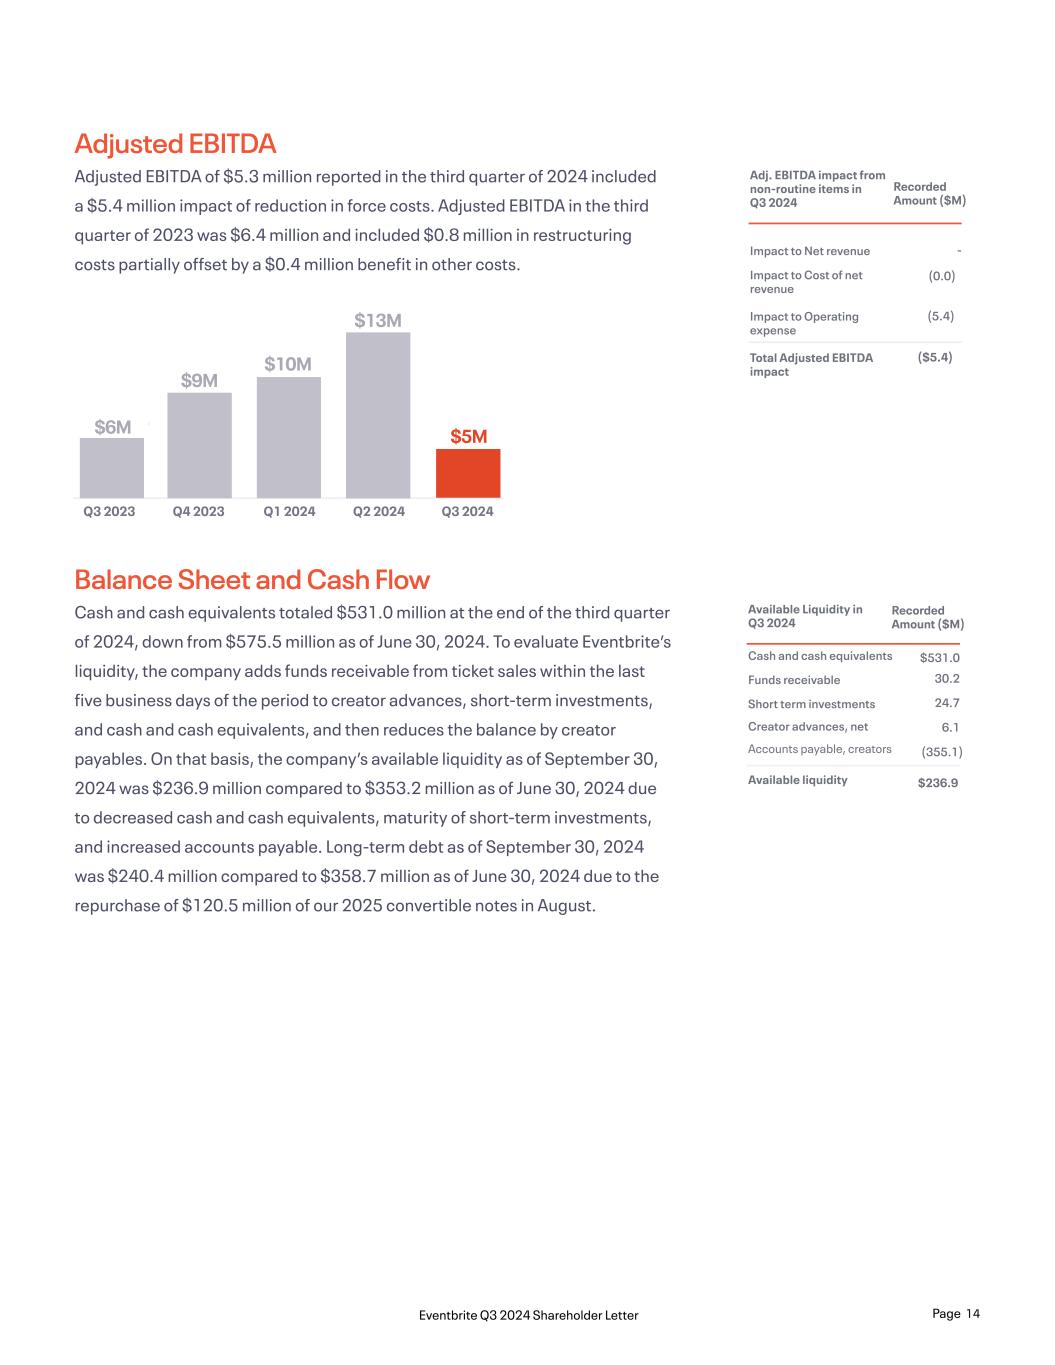
$6M $5M $13M $10M $9M Q3 2024Q2 2024Q1 2024Q4 2023Q3 2023 Adjusted EBITDA Adjusted EBITDA of $5.3 million reported in the third quarter of 2024 included a $5.4 million impact of reduction in force costs. Adjusted EBITDA in the third quarter of 2023 was $6.4 million and included $0.8 million in restructuring costs partially offset by a $0.4 million benefit in other costs. Adj. EBITDA impact from non-routine items in Q3 2024 Impact to Net revenue Impact to Cost of net revenue Impact to Operating expense Total Adjusted EBITDA impact Recorded Amount ($M) - (0.0) . (5.4) ($5.4) Balance Sheet and Cash Flow Cash and cash equivalents totaled $531.0 million at the end of the third quarter of 2024, down from $575.5 million as of June 30, 2024. To evaluate Eventbrite’s liquidity, the company adds funds receivable from ticket sales within the last five business days of the period to creator advances, short-term investments, and cash and cash equivalents, and then reduces the balance by creator payables. On that basis, the company’s available liquidity as of September 30, 2024 was $236.9 million compared to $353.2 million as of June 30, 2024 due to decreased cash and cash equivalents, maturity of short-term investments, and increased accounts payable. Long-term debt as of September 30, 2024 was $240.4 million compared to $358.7 million as of June 30, 2024 due to the repurchase of $120.5 million of our 2025 convertible notes in August. Available Liquidity in Q3 2024 Cash and cash equivalents Funds receivable Short term investments Creator advances, net Accounts payable, creators Available liquidity Recorded Amount ($M) $531.0 30.2 24.7 6.1 (355.1) $236.9 Page 14Eventbrite Q3 2024 Shareholder Letter

Business Outlook Based on current information, we anticipate fourth-quarter revenue will be within a range of $74 to $77 million, and full-year 2024 revenue will be within a range of $322 million to $326 million. At the midpoint of our revenue outlook range, we continue to expect Adjusted EBITDA margin, excluding the impact of non-routine items and severance costs, to be approximately 10% for the year. *We have not provided an outlook for GAAP net income (loss) or GAAP net income (loss) margin or reconciliations of expected Adjusted EBITDA to GAAP net income (loss) or expected Adjusted EBITDA margin to GAAP net income (loss) margin, because GAAP net income (loss) and GAAP net income (loss) margin on a forward-looking basis are not available without unreasonable efforts due to the potential variability and complexity of the items that are excluded from Adjusted EBITDA and Adjusted EBITDA margin, such as share-based compensation expense, foreign exchange rate gains and losses, and other non-recurring expenses. Page 15Eventbrite Q3 2024 Shareholder Letter
About Eventbrite Eventbrite is a global events marketplace that serves event creators and event-goers in nearly 180 countries. Since its inception, Eventbrite has been at the center of the experience economy, transforming how people organize and attend events. The company was founded by Julia Hartz, Kevin Hartz and Renaud Visage, with a vision to build a self-service platform that would make it possible for anyone to create and sell tickets to live experiences. With over 300 million tickets distributed for over 5 million events in 2023, Eventbrite is where people worldwide discover new things to do or new ways to do more of what they love. Eventbrite has also earned industry recognition as a top employer with special designations that include coveted spots on Fast Company’s prestigious The World’s 50 Most Innovative Companies and Fast Company’s Brands That Matter lists, the Great Place to Work® Award in the U.S., and Inc.'s Best-Led Companies honor. Learn more at www.eventbrite.com. Page 16Eventbrite Q3 2024 Shareholder Letter
Forward-Looking Statements This letter contains forward-looking statements within the meaning of Section 27A of the Securities Act of 1933, as amended, and Section 21E of the Securities Exchange Act of 1934, as amended, that involve substantial risks and uncertainties. All statements other than statements of historical fact could be deemed forward-looking, including, but not limited to, statements regarding the future performance of Eventbrite, Inc. and its consolidated subsidiaries (the “Company”); the Company’s business model and investments to support growth, including the Company’s marketplace strategy and impact on results; the Company’s expectations regarding the development of its marketplace and products; the Company’s long-term growth strategy, growth areas, pursuit of profitability, cash flows, operating expenses, and investment initiatives and focus areas; the Company’s expectations with respect to its operating model, financial results and trends; the Company’s plans with respect to its share repurchase program; and the Company’s expectations described under “Business Outlook” above. In some cases, forward-looking statements can be identified by terms such as “may,” “will,” “appears,” “shall,” “should,” “expects,” “plans,” “anticipates,” “could,” “intends,” “target,” “projects,” “contemplates,” “believes,” “estimates,” “predicts,” “potential,” or “continue,” or the negative of these words or other similar terms or expressions that concern the Company’s expectations, strategy, plans, or intentions. Such statements are subject to a number of known and unknown risks, uncertainties, assumptions, and other factors that may cause the Company’s actual results, performance, or achievements to differ materially from results expressed or implied in this letter, including those more fully described in the Company’s filings with the Securities and Exchange Commission, including the Company’s Annual Report on Form 10-K and Quarterly Reports on Form 10-Q. Further information on potential risks that could affect actual results will be included in the subsequent periodic and current reports and other filings that the Company makes with the Securities and Exchange Commission from time to time. Investors are cautioned not to place undue reliance on these statements. Actual results could differ materially from those expressed or implied. All forward-looking statements are based on information and estimates available to the Company at the time of this letter, and are not guarantees of future performance, and reported results should not be considered as an indication of future performance. Except as required by law, the Company assumes no obligation to update any of the statements in this letter. Disclaimer Regarding Ticketing and Creator Metrics This letter includes certain measures related to our ticketing business, such as free and paid tickets, paid creators, paid buyers, monthly active users (MAUs), and Eventbrite Ads. We believe that the use of these metrics is helpful to our investors as these metrics are used by management in assessing the health of our business and our operating performance. These metrics are based on what we believe to be reasonable estimates for the applicable period of measurement. There are inherent challenges in measuring these metrics, and we regularly review and may adjust our processes for calculating our internal metrics to improve their accuracy. You should not consider these metrics in isolation or as substitutes for analysis of our results of operations as reported under GAAP. About Non-GAAP Financial Measures We believe that the use of Adjusted EBITDA, Adjusted EBITDA margin and Available Liquidity is helpful to our investors in understanding and evaluating our results of operations and useful measures for period-to-period comparisons of our business performance as they are metrics used by management in assessing the health of our business and our operating performance, making operating decisions, and performing strategic planning and annual budgeting. These measures are not prepared in accordance with GAAP and have limitations as an analytical tool, and you should not consider them in isolation or as a substitute for analysis of our results of operations as reported under GAAP. In addition, other companies may not calculate non-GAAP financial measures in the same manner as we calculate them, limiting their usefulness as comparative measures. You are encouraged to evaluate the adjustments and the reasons we consider them appropriate. Some amounts in this shareholder letter may not sum due to rounding. Adjusted EBITDA We calculate Adjusted EBITDA as net income (loss) adjusted to exclude depreciation and amortization, stock-based compensation expense, interest expense, interest income, employer taxes related to employee transactions, other (income) expense net, which consists of foreign exchange rate gains and losses, and income tax provision (benefit). Adjusted EBITDA should not be considered as an alternative to net income (loss) or any other measure of financial performance calculated and presented in accordance with GAAP. Page 17Eventbrite Q3 2024 Shareholder Letter
Some of the limitations of Adjusted EBITDA include (i) Adjusted EBITDA does not properly reflect capital spending that occurs off of the income statement or account for future contractual commitments, (ii) although depreciation and amortization are non-cash charges, the underlying assets may need to be replaced and Adjusted EBITDA does not reflect these capital expenditures and (iii) Adjusted EBITDA does not reflect the interest and principal required to service our indebtedness. In evaluating Adjusted EBITDA, you should be aware that in the future we expect to incur expenses similar to the adjustments in this release. Our presentation of Adjusted EBITDA should not be construed as an inference that our future results will be unaffected by these expenses or any unusual or non-routine items. When evaluating our performance, you should consider Adjusted EBITDA alongside other financial performance measures, including our net income (loss) and other GAAP results. Adjusted EBITDA Margin Adjusted EBITDA Margin is defined as Adjusted EBITDA divided by net revenue. Because of the limitations described above, you should consider Adjusted EBITDA and Adjusted EBITDA Margin alongside other financial performance measures, including net income (loss), net income (loss) margin and our other GAAP results. Available Liquidity To evaluate Eventbrite’s liquidity, the Company adds funds receivable from ticket sales within the last five business days of the period to creator advances, short-term investments, and cash and cash equivalents, and then reduces the balance by creator payables. See page 14 for reconciliation table. Page 18Eventbrite Q3 2024 Shareholder Letter
Net revenue Cost of net revenue(1) Gross profit Operating expenses (1): Product development Sales, marketing and support General and administrative Total operating expenses Loss from operations Interest income Interest expense Other income (expense), net Loss before income taxes Income tax provision Net loss Net loss per share, basic and diluted Weighted-average number of shares 77,801 24,543 53,258 22,586 23,694 15,930 62,210 (8,952) 6,056 (2,084) 1,420 (3,560) 208 (3,768) (0.04) 96,498 81,544 25,867 55,677 23,041 21,063 23,137 67,241 (11,564) 7,569 (2,821) (2,357) (9,173) 762 (9,935) (0.10) 100,540 248,604 74,186 174,418 75,327 69,084 52,983 197,394 (22,976) 20,845 (7,690) 3,892 (5,929) 1,266 (7,195) (0.08) 95,571 238,370 76,865 161,505 73,091 53,802 66,681 193,574 (32,069) 19,948 (8,359) (3,230) (23,710) 1,832 (25,542) (0.26) 100,030 Cost of net revenue Product development Sales, marketing and support General and administrative Total 151 4,732 1,484 3,879 10,246 430 17,766 5,768 15,520 39,484 213 5,635 2,018 6,602 14,468 637 15,143 7,037 18,344 41,161 Condensed Consolidated Statements of Operations ($ in thousands, except per share data)(unaudited) $ $ $ $ $ $ $ $ $ $ $ $ $ $ $ $ $ $ $ $ Nine Months Ended September 30, Three Months Ended September 30, 20242024 20232023 (1) Includes stock-based compensation as follows: Page 19Eventbrite Q3 2024 Shareholder Letter
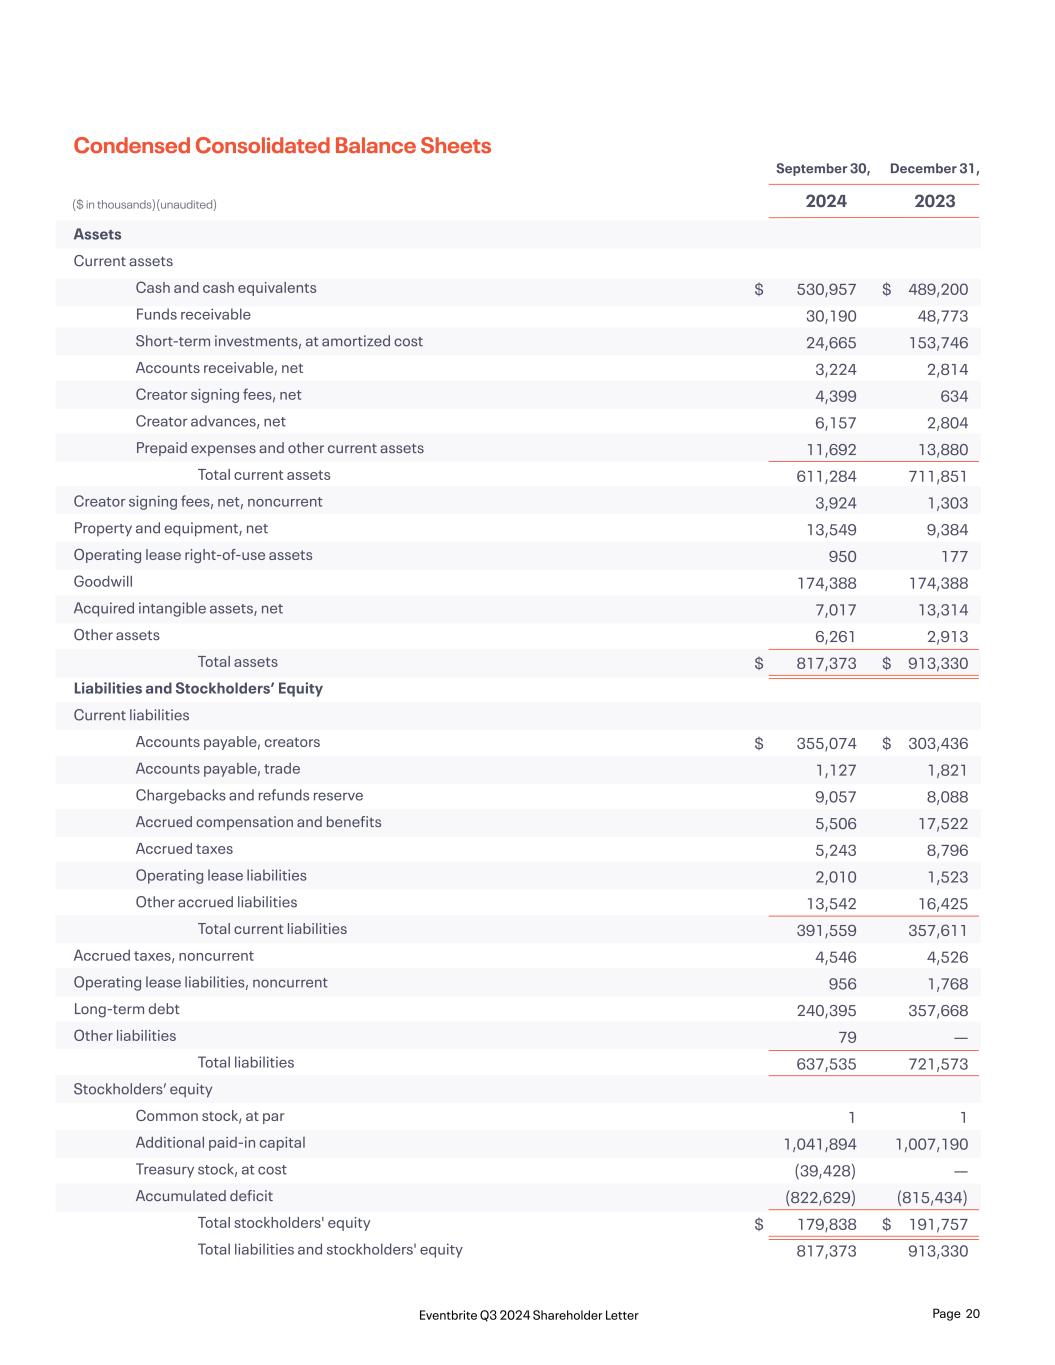
Assets Current assets Cash and cash equivalents Funds receivable Short-term investments, at amortized cost Accounts receivable, net Creator signing fees, net Creator advances, net Prepaid expenses and other current assets Total current assets Creator signing fees, net, noncurrent Property and equipment, net Operating lease right-of-use assets Goodwill Acquired intangible assets, net Other assets Total assets Liabilities and Stockholders’ Equity Current liabilities Accounts payable, creators Accounts payable, trade Chargebacks and refunds reserve Accrued compensation and benefits Accrued taxes Operating lease liabilities Other accrued liabilities Total current liabilities Accrued taxes, noncurrent Operating lease liabilities, noncurrent Long-term debt Other liabilities Total liabilities Stockholders’ equity Common stock, at par Additional paid-in capital Treasury stock, at cost Accumulated deficit Total stockholders' equity Total liabilities and stockholders' equity 530,957 30,190 24,665 3,224 4,399 6,157 11,692 611,284 3,924 13,549 950 174,388 7,017 6,261 817,373 355,074 1,127 9,057 5,506 5,243 2,010 13,542 391,559 4,546 956 240,395 79 637,535 1 1,041,894 (39,428) (822,629) 179,838 817,373 $ $ $ $ $ $ $ $ 489,200 48,773 153,746 2,814 634 2,804 13,880 711,851 1,303 9,384 177 174,388 13,314 2,913 913,330 303,436 1,821 8,088 17,522 8,796 1,523 16,425 357,611 4,526 1,768 357,668 — 721,573 1 1,007,190 — (815,434) 191,757 913,330 Condensed Consolidated Balance Sheets ($ in thousands)(unaudited) September 30, December 31, 2024 2023 Page 20Eventbrite Q3 2024 Shareholder Letter
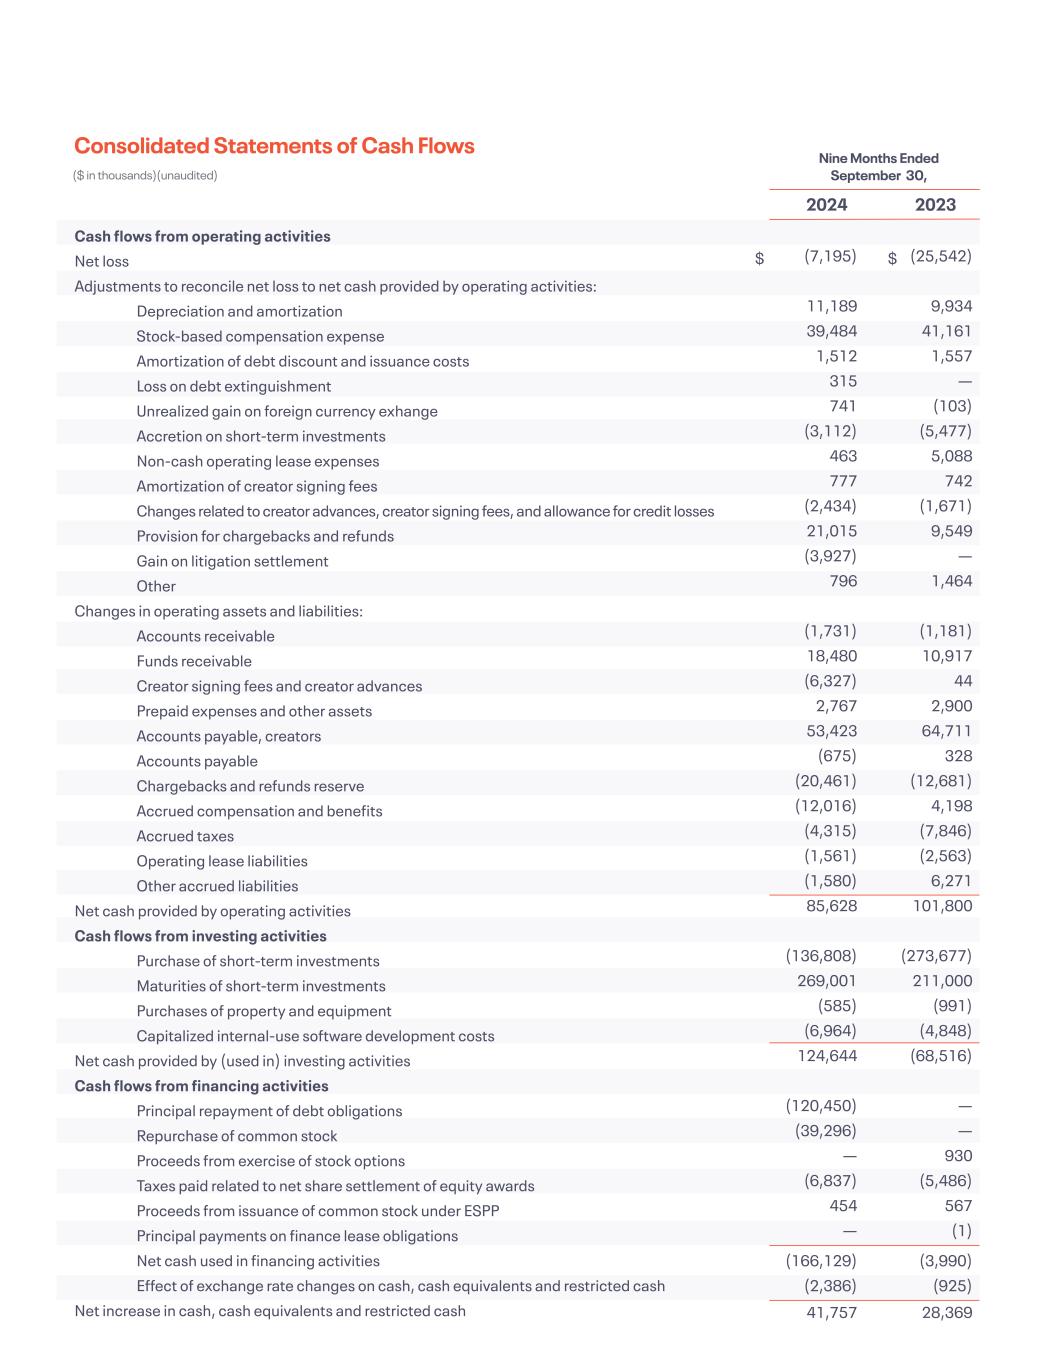
Cash flows from operating activities Net loss Adjustments to reconcile net loss to net cash provided by operating activities: Depreciation and amortization Stock-based compensation expense Amortization of debt discount and issuance costs Loss on debt extinguishment Unrealized gain on foreign currency exhange Accretion on short-term investments Non-cash operating lease expenses Amortization of creator signing fees Changes related to creator advances, creator signing fees, and allowance for credit losses Provision for chargebacks and refunds Gain on litigation settlement Other Changes in operating assets and liabilities: Accounts receivable Funds receivable Creator signing fees and creator advances Prepaid expenses and other assets Accounts payable, creators Accounts payable Chargebacks and refunds reserve Accrued compensation and benefits Accrued taxes Operating lease liabilities Other accrued liabilities Net cash provided by operating activities Cash flows from investing activities Purchase of short-term investments Maturities of short-term investments Purchases of property and equipment Capitalized internal-use software development costs Net cash provided by (used in) investing activities Cash flows from financing activities Principal repayment of debt obligations Repurchase of common stock Proceeds from exercise of stock options Taxes paid related to net share settlement of equity awards Proceeds from issuance of common stock under ESPP Principal payments on finance lease obligations Net cash used in financing activities Effect of exchange rate changes on cash, cash equivalents and restricted cash Net increase in cash, cash equivalents and restricted cash (7,195) 11,189 39,484 1,512 315 741 (3,112) 463 777 (2,434) 21,015 (3,927) 796 (1,731) 18,480 (6,327) 2,767 53,423 (675) (20,461) (12,016) (4,315) (1,561) (1,580) 85,628 (136,808) 269,001 (585) (6,964) 124,644 (120,450) (39,296) — (6,837) 454 — (166,129) (2,386) 41,757 (25,542) 9,934 41,161 1,557 — (103) (5,477) 5,088 742 (1,671) 9,549 — 1,464 (1,181) 10,917 44 2,900 64,711 328 (12,681) 4,198 (7,846) (2,563) 6,271 101,800 (273,677) 211,000 (991) (4,848) (68,516) — — 930 (5,486) 567 (1) (3,990) (925) 28,369 $ $ Consolidated Statements of Cash Flows ($ in thousands)(unaudited) Nine Months Ended September 30, 2024 2023
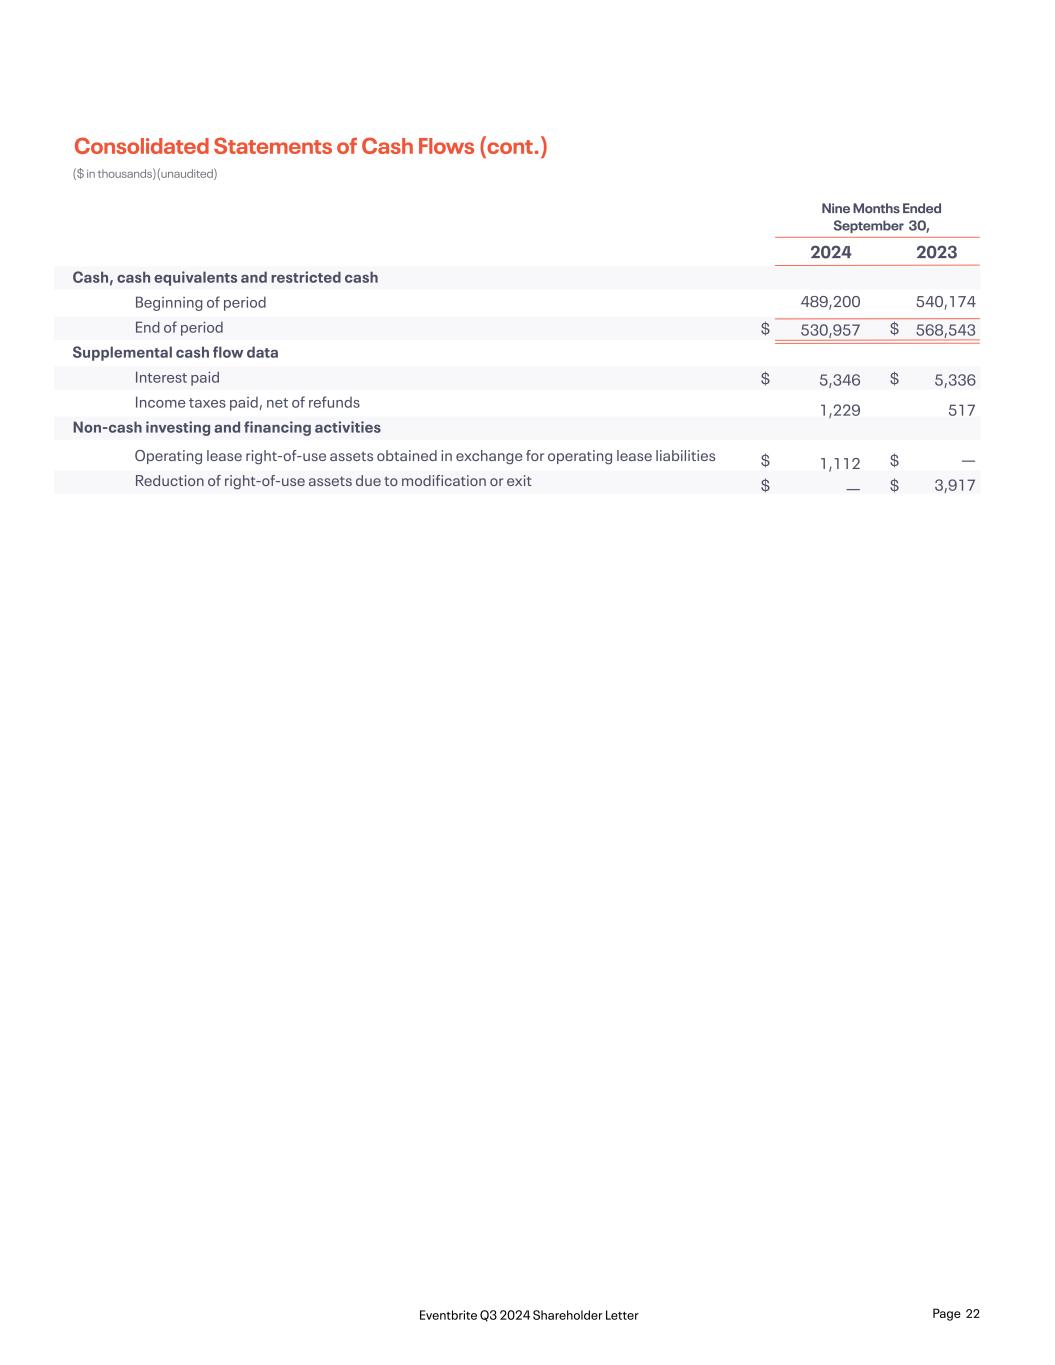
Cash, cash equivalents and restricted cash Beginning of period End of period Supplemental cash flow data Interest paid Income taxes paid, net of refunds Non-cash investing and financing activities Operating lease right-of-use assets obtained in exchange for operating lease liabilities Reduction of right-of-use assets due to modification or exit 489,200 530,957 5,346 1,229 1,112 — 540,174 568,543 5,336 517 — 3,917 Consolidated Statements of Cash Flows (cont.) ($ in thousands)(unaudited) Nine Months Ended September 30, 2024 2023 $ $ $ $ $ $ $ $ Page 22Eventbrite Q3 2024 Shareholder Letter
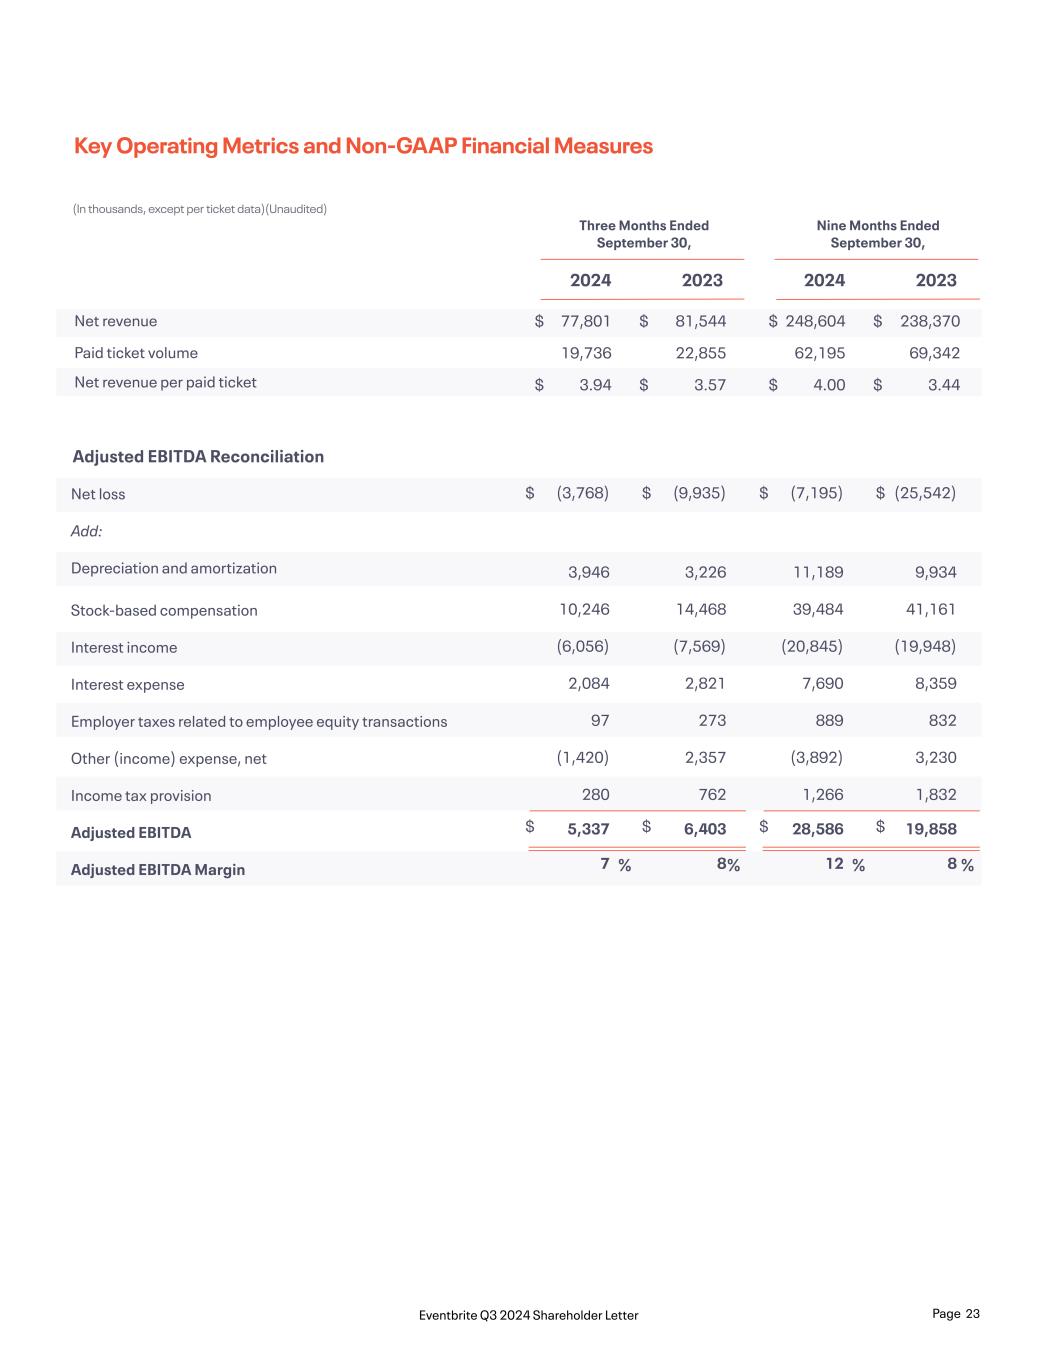
Net revenue Paid ticket volume Net revenue per paid ticket Net loss Add: Depreciation and amortization Stock-based compensation Interest income Interest expense Employer taxes related to employee equity transactions Other (income) expense, net Income tax provision Adjusted EBITDA Adjusted EBITDA Margin (7,195) 11,189 39,484 (20,845) 7,690 889 (3,892) 1,266 28,586 12 (25,542) 9,934 41,161 (19,948) 8,359 832 3,230 1,832 19,858 8 (3,768) 3,946 10,246 (6,056) 2,084 97 (1,420) 280 5,337 7 (9,935) 3,226 14,468 (7,569) 2,821 273 2,357 762 6,403 8 $ $ $ $ $ $ $ $ Key Operating Metrics and Non-GAAP Financial Measures (In thousands, except per ticket data)(Unaudited) 248,604 62,195 4.00 77,801 19,736 3.94 238,370 69,342 3.44 81,544 22,855 3.57 $ $ $ $ $ $ $ $ Nine Months Ended September 30, Three Months Ended September 30, 20242024 20232023 Adjusted EBITDA Reconciliation %% %% Page 23Eventbrite Q3 2024 Shareholder Letter


