Exhibit 99.1

Cenovus has strong third-quarter operational performance
Oil sands production increases; operating costs decline
Calgary, Alberta (October 27, 2016)– Cenovus Energy Inc. (TSX: CVE) (NYSE: CVE) continues to deliver safe and reliable operating performance. In 2016, the company has achieved consistent quarter-over-quarter increases in its oil sands production and steadily reduced total per-barrel oil operating costs. Compared with the same period in 2015, third-quarter oil sands volumes grew 5%, while total oil operating costs declined 14% per barrel (bbl).
“We continue to deliver on our commitments, including significantly lowering our costs, bringing on new oil sands production capacity and maintaining one of the best balance sheets in the business,” said Brian Ferguson, Cenovus President & Chief Executive Officer. “While I’m encouraged by the recent increase in oil prices, we remain firmly committed to pursuing additional cost reductions to position us to add shareholder value regardless of the commodity price environment.”
Key developments
| ● | | Achieved first oil at Foster Creek phase G, began start-up of Christina Lake phase F and completed the Wood River Refinery debottlenecking project |
| ● | | Reached oil sands production of almost 74,000 barrels per day (bbls/d) net at Foster Creek, 3% higher than in the third quarter of 2015 |
| ● | | Increased production at Christina Lake to almost 80,000 bbls/d net, 6% higher than in the third quarter of 2015 |
| ● | | Decreased total per-barrel oil operating costs by 14%, including a 9% reduction in oil sands per-barrel operating costs, compared with the third quarter of 2015 |
| ● | | Achieved target of reducing capital, operating and general and administrative (G&A) costs by $500 million for the year compared with original 2016 budget |
| ● | | Exited the quarter with nearly $8 billion in liquidity, including $4 billion in unused credit facilities and almost $3.9 billion in cash, with net debt to capitalization of 17% |
| | | | | | | | | | |
| | | Production & financial summary |
| | | (For the period ended September 30)
Production (before royalties) | | | | 2016 Q3 | | 2015 Q3 | | % change |
| | Oil sands (bbls/d) | | | | 153,591 | | 146,743 | | 5 |
| | Conventional oil1 (bbls/d) | | | | 54,481 | | 63,679 | | -14 |
| | Total oil(bbls/d) | | | | 208,072 | | 210,422 | | -1 |
| | Natural gas (MMcf/d) | | | | 392 | | 430 | | -9 |
| | Financial ($ millions, except per share amounts) | | | | |
| | Cash flow2 | | | | 422 | | 444 | | -5 |
| | Per share diluted | | | | 0.51 | | 0.53 | | |
| | Operating earnings/loss2 | | | | -236 | | -28 | | |
| | Per share diluted | | | | -0.28 | | -0.03 | | |
| | Net earnings/loss3 | | | | -251 | | 1,801 | | |
| | Per share diluted | | | | -0.30 | | 2.16 | | |
| | Capital investment | | | | 208 | | 400 | | -48 |
1Includes natural gas liquids (NGLs).
2Cash flow and operating earnings/loss are non-GAAP measures as defined in the Advisory.
3Net earnings in the third quarter of 2015 included a $1.9 billion after-tax gain related to an asset divestiture.
Overview
Cenovus remains focused on delivering safe and reliable operating performance. In the third quarter of 2016, the company achieved a 14% decrease in total per-barrel oil operating costs as well as a 5% increase in production at its oil sands business compared with the same quarter of 2015. While benchmark crude oil prices and Cenovus’s netbacks have somewhat recovered from the multi-year lows seen in the first quarter of 2016, Cenovus intends to remain disciplined in its approach to capital spending and will look for further opportunities to reduce its cost structures and provide growth.
Oil production
In 2016, Foster Creek has achieved steady production increases with oil sands volumes growing 21% from the first quarter through the third quarter. Production in the third quarter averaged approximately 74,000 bbls/d net, 3% higher than in the same period of 2015. The year-over-year increase was primarily due to incremental volumes from the start-up of processing facilities for the phase G expansion as well as additional sustaining wells being brought online. Phase G, which adds 30,000 bbls/d gross in incremental production capacity, is expected to continue ramping up over an 18-month period. Foster Creek remains on track to meet its full-year production guidance.
Christina Lake production has also increased consistently in 2016, growing 4% from the first quarter through the third quarter. Volumes averaged approximately 80,000 bbls/d net in the third quarter, a 6% increase from the same period in 2015. The increase was largely due to additional wells being brought online and the strong performance of Christina Lake’s facilities, which operated near design capacity through the third quarter. Commissioning and start-up of the phase F expansion continues, with first oil anticipated in November, followed by an expected ramp-up period of about 12 months. With the progression of phase F, Cenovus is on track to add 50,000 bbls/d gross in incremental production capacity at Christina Lake. As part of the expansion, the company continues to commission its new 100 megawatt Christina Lake cogeneration plant, which is anticipated to be online shortly.
“By continuing to invest in our top-tier oil sands assets during an extremely challenging period for our industry, we are now on track to increase combined oil sands production capacity to 390,000 barrels per day gross,” said Ferguson.
Cenovus is spending a small amount of capital to complete detailed engineering on the Christina Lake phase G expansion and has rebid work on the project. The company expects to provide more information about future oil sands investment at the time of its 2017 budget announcement in December.
Cost reductions
During the third quarter, Cenovus achieved its 2016 target of reducing planned capital, operating and G&A spending by $500 million this year compared with its original 2016 budget. The company continues to pursue additional cost reductions across its business to help position it to be competitive with oil producers across North America.
| | |
Cenovus Energy Inc. Third Quarter 2016 Report | | Page 2 News Release |
“With the significant improvements we’ve made in our cost structures, we forecast that we can cover all of our operating and capital costs as well as our dividend with a West Texas Intermediate price in the US$45 to $50 range,” said Ferguson. “As prices move beyond that range, we expect to generate free cash flow, giving us more capacity to further invest in growth.”
In 2016, Cenovus has achieved a steady reduction in its total per-barrel oil operating costs. Non-fuel oil operating costs averaged $8.02/bbl in the third quarter compared with $9.46/bbl in the first quarter of the year. Compared with the same period in 2015, third-quarter oil operating costs declined 14%, including a 9% reduction in oil sands operating costs. Oil sands non-fuel operating costs were $6.37/bbl in the third quarter compared with $6.99/bbl in the same period a year ago. Year to date in 2016, Cenovus’s non-fuel oil sands operating costs are almost 30% lower per barrel than they were for the full-year 2014.
Financial performance
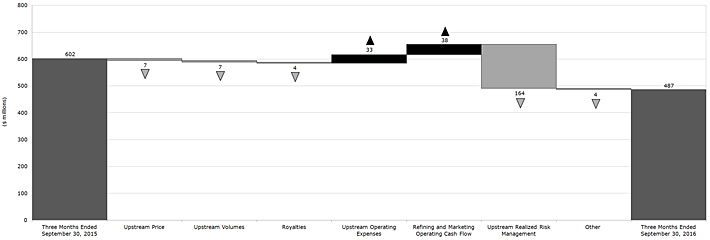
Crude oil sales prices and volumes remained relatively consistent in the third quarter of 2016 compared with the same period a year earlier. Third-quarter operating cash flow declined to $487 million, down 19% year over year, primarily due to smaller realized hedging gains at Cenovus’s oil and natural gas production assets compared with the same quarter in 2015. The company had realized hedging gains, excluding refining and marketing, of $42 million in the third quarter of 2016 compared with gains of $206 million a year earlier. The decline was partially offset by higher operating cash flow from refining and marketing as well as lower crude oil operating and transportation and blending expenses.
The company’s refineries had strong operating performance in the third quarter. Operating cash flow from refining and marketing was $68 million compared with $30 million in the same period of 2015. The increase was primarily due to wider heavy and medium oil price differentials, which contributed to a feedstock cost advantage, higher crude utilization rates and a decline in operating expenses compared with 2015. This was partially offset by lower average market crack spreads compared with the year-earlier period. The successful completion of the Wood River debottlenecking project has increased available heavy oil processing capability by 18,000 bbls/d gross.
Cenovus had a net loss of $251 million in the third quarter of 2016. This compares with net earnings of $1.8 billion in the same period of 2015 when the company recorded an after-tax gain of approximately $1.9 billion from the sale of its royalty interest and mineral fee title lands business. Cenovus’s third quarter 2016 results were negatively impacted by asset impairments of $292 million primarily due to the decline in long-term forward heavy oil and natural gas prices. This includes a $210 million impairment associated with the company’s northern Alberta conventional assets and a $65 million impairment related to its Suffield conventional oil and natural gas assets in southern Alberta.
Cenovus ended the third quarter of 2016 with cash and cash equivalents of approximately $3.9 billion. Including $4 billion in undrawn capacity under its committed credit facility, the company has nearly $8 billion in liquidity available, with no debt maturing until the fourth quarter of 2019. At the end of the third quarter, the company’s net debt to capitalization was 17% compared with 13% a year earlier. Cenovus’s net debt to adjusted earnings before
| | |
Cenovus Energy Inc. Third Quarter 2016 Report | | Page 3 News Release |
interest, taxes, depreciation and amortization (EBITDA) was 2.0 times on a trailing 12-month basis, compared with 0.8 times at the end of the third quarter of 2015.
Cenovus has an active hedging program to support financial resilience and stabilize cash flow. As of October 25, 2016, the company has hedges in place on approximately 64,000 bbls/d for 2017. About 37% of these barrels are hedged using costless collars, which set an average minimum price of US$44.78/bbl and average maximum price of US$56.24/bbl that the company will receive for its hedged oil. This limits downside risk on the hedged barrels while giving the company some ability to benefit in a rising price environment. Cenovus will continue to evaluate additional hedging opportunities.
Guidance update and outlook
Cenovus has updated its 2016 guidance to reflect actual results for the first nine months of the year and the company’s estimates for the full year. The revised guidance is available atcenovus.com under “Investors.” Cenovus will provide details of its plans for the coming year on December 8 when it releases its 2017 budget.
Third quarter details
Oil sands
Foster Creek
| | ● | | Production averaged 73,798 bbls/d net in the third quarter of 2016, a 3% increase from the same period of 2015. |
| | ● | | Operating costs declined 15% to $9.63/bbl in the quarter. Non-fuel operating costs were $7.19/bbl, a 17% decrease from a year earlier. |
| | ● | | The steam to oil ratio (SOR), the amount of steam needed to produce one barrel of oil, was 2.6 for the third quarter compared with 2.4 in the same period of 2015. |
Christina Lake
| | ● | | Production averaged 79,793 bbls/d net in the third quarter of 2016, a 6% increase from the same period a year earlier. |
| | ● | | Operating costs were $7.72/bbl in the quarter, a slight decline from a year earlier. Non-fuel operating costs were $5.58/bbl, comparable to the same period in 2015. |
| | ● | | The SOR was 1.9 during the third quarter compared with 1.7 a year earlier. |
Conventional oil
| | ● | | Total conventional oil production decreased 14% to 54,481 bbls/d in the third quarter of 2016 compared with the same quarter a year ago, primarily due to natural reservoir declines and the 2015 sale of Cenovus’s royalty interest and mineral fee title lands business. The divested assets contributed an average of 1,250 bbls/d of production in the third quarter of 2015. |
| | ● | | Operating costs were $12.89/bbl in the quarter, 17% lower than in the third quarter of 2015, primarily due to lower workforce, chemical, electricity and repairs and maintenance costs. |
| | |
Cenovus Energy Inc. Third Quarter 2016 Report | | Page 4 News Release |
Natural gas
| | ● | | Natural gas production averaged 392 million cubic feet per day (MMcf/d) in the third quarter of 2016, down 9% from the same period a year earlier, primarily due to expected natural declines and the company’s 2015 sale of its royalty interest and mineral fee title lands business. |
| | ● | | Operating costs fell 9% to $1.05 per thousand cubic feet (Mcf) in the quarter compared with the same period a year earlier. |
Downstream
| | ● | | Cenovus’s Wood River Refinery in Illinois and Borger Refinery in Texas, which are jointly owned with the operator, Phillips 66, continued to deliver strong operating performance in the third quarter of 2016, including: |
| | |
| o | | processing a combined average of 463,000 bbls/d gross of oil (101% utilization) compared with 394,000 bbls/d gross in the same period in 2015 (86% utilization) |
| o | | producing a combined average of 494,000 bbls/d gross of refined products compared with 414,000 bbls/d gross a year earlier. |
| | ● | | Cenovus had refining and marketing operating cash flow of $68 million in the quarter compared with $30 million in the third quarter of 2015. The company’s refining operating cash flow is calculated on a first-in, first-out (FIFO) inventory accounting basis. Using the last-in, first-out (LIFO) accounting method employed by most U.S. refiners, Cenovus’s operating cash flow from refining and marketing would have been $37 million higher in the third quarter of 2016. In the third quarter of 2015, operating cash flow would have been $130 million higher on a LIFO reporting basis. |
Financial
Corporate and financial information
| | ● | | Operating cash flow was $487 million in the third quarter, down 19% from the same period a year earlier, largely due to gains of $41 million from the company’s realized hedges compared with gains of $220 million the same period in 2015. |
| | ● | | Cash flow declined 5% in the third quarter to $422 million compared with the same period in 2015. This was due to lower operating cash flow, partially offset by a current income tax recovery compared with an expense in the same period a year earlier. |
| | ● | | After investing approximately $208 million during the third quarter, Cenovus had free cash flow of $214 million compared with free cash flow of $44 million in the same period a year earlier. |
| | ● | | Cenovus had a third-quarter operating loss of $236 million compared with an operating loss of $28 million in the same quarter of 2015. The 2016 third-quarter loss was largely the result of asset impairments of $292 million caused by a decline in long-term forward heavy oil and natural gas prices. |
| | ● | | Net loss was $251 million in the third quarter. This compares with net earnings of $1.8 billion in the same period of 2015 when the company recorded an after-tax gain of approximately $1.9 billion from the sale of its royalty interest and mineral fee title lands business. In the third quarter of 2016, Cenovus had unrealized risk management losses of $7 million compared with unrealized gains of $127 million a |
| | |
Cenovus Energy Inc. Third Quarter 2016 Report | | Page 5 News Release |
| | year earlier and a $111 million deferred income tax recovery in the third quarter of 2016 compared with a $228 million recovery a year earlier. The declines were partially offset by non-operating unrealized foreign exchange losses of $52 million compared with losses of $437 million in the same period a year earlier. |
| | ● | | G&A expenses were $71 million in the quarter, 9% lower than in the same period of 2015. The decrease was primarily due to lower workforce expenses as well as reduced information technology costs. |
| | ● | | The Board of Directors has declared a fourth-quarter dividend of $0.05 per share, payable on December 30, 2016 to common shareholders of record as of December 15, 2016. Based on the October 26, 2016 closing share price on the Toronto Stock Exchange of $20.16, this represents an annualized yield of about 1%. Declaration of dividends is at the sole discretion of the Board and will continue to be evaluated on a quarterly basis. |
Other developments
| | ● | | In the third quarter, Cenovus was included in the Dow Jones Sustainability North America Index for the seventh consecutive year. Cenovus is one of only three Canadian oil and gas producers to make the index this year. Areas where the company scored well include corporate governance, stakeholder engagement, social and environmental reporting, biodiversity, climate strategy, and risk and crisis management. |
| | |
Cenovus Energy Inc. Third Quarter 2016 Report | | Page 6 News Release |
MANAGEMENT’S DISCUSSION AND ANALYSIS
This Management’s Discussion and Analysis (“MD&A”) for Cenovus Energy Inc. (“we”, “our”, “us”, “its”, “Cenovus”, or the “Company”) dated October 26, 2016, should be read in conjunction with our September 30, 2016 unaudited interim Consolidated Financial Statements and accompanying notes (“interim Consolidated Financial Statements”), the December 31, 2015 audited Consolidated Financial Statements and accompanying notes (“Consolidated Financial Statements”) and the December 31, 2015 MD&A (“annual MD&A”). All of the information and statements contained in this MD&A are made as of October 26, 2016, unless otherwise indicated. This MD&A provides an update to our annual MD&A and contains forward-looking information about our current expectations, estimates, projections and assumptions. See the Advisory for information on the risk factors that could cause actual results to differ materially and the assumptions underlying our forward-looking information. Cenovus Management prepared the MD&A. The interim MD&As are approved by the Audit Committee of the Cenovus Board of Directors (the “Board”) and the annual MD&A is reviewed by the Audit Committee and recommended for its approval by the Board. Additional information about Cenovus, including our quarterly and annual reports, the Annual Information Form (“AIF”) and Form 40-F, is available on SEDAR at sedar.com, EDGAR at sec.gov and on our website at cenovus.com. Information on or connected to our website, even if referred to in this MD&A, does not constitute part of this MD&A.
Basis of Presentation
This MD&A and the interim Consolidated Financial Statements and comparative information have been prepared in Canadian dollars, except where another currency has been indicated, and in accordance with International Financial Reporting Standards (“IFRS” or “GAAP”) as issued by the International Accounting Standards Board (“IASB”). Production volumes are presented on a before royalties basis.
Non-GAAP Measures
Certain financial measures in this document do not have a standardized meaning as prescribed by IFRS, such as Operating Cash Flow, Cash Flow, Operating Earnings, Free Cash Flow, Debt, Net Debt, Capitalization and Adjusted Earnings before Interest, Taxes, Depreciation and Amortization (“Adjusted EBITDA”) and therefore are considered non-GAAP measures. These measures may not be comparable to similar measures presented by other issuers. These measures have been described and presented in order to provide shareholders and potential investors with additional measures for analyzing our ability to generate funds to finance our operations and information regarding our liquidity. This additional information should not be considered in isolation or as a substitute for measures prepared in accordance with IFRS.
The definition and reconciliation of each non-GAAP measure is presented in the Financial Results or Liquidity and Capital Resources sections of this MD&A.
OVERVIEW OF CENOVUS
We are a Canadian integrated oil company headquartered in Calgary, Alberta, with shares listed on the Toronto and New York stock exchanges. On September 30, 2016, we had a market capitalization of approximately $16 billion. We are in the business of developing, producing and marketing crude oil, natural gas liquids (“NGLs”) and natural gas in Canada with marketing activities and refining operations in the United States (“U.S.”). Our average crude oil and NGLs (collectively, “crude oil”) production for the nine months ended September 30, 2016 was approximately 201,300 barrels per day and our average natural gas production was 399 MMcf per day. Our refineries processed an average of 452,000 gross barrels per day of crude oil feedstock into an average of 479,000 gross barrels per day of refined products.
Our Operations
Oil Sands
Our operations include the following steam-assisted gravity drainage (“SAGD”) oil sands projects in northern Alberta:
| | | | | | | | | | | | | | | | |
| | | Nine Months Ended September 30, 2016 | |
| | | Ownership Interest | | | | | Net Production Volumes | | | | | Gross Production Volumes | |
| | | (percent) | | | | | (bbls/d) | | | | | (bbls/d) | |
| | | | | |
Existing Projects | | | | | | | | | | | | | | | | |
Foster Creek | | | 50 | | | | | | 66,435 | | | | | | 132,870 | |
Christina Lake | | | 50 | | | | | | 78,321 | | | | | | 156,642 | |
Narrows Lake | | | 50 | | | | | | - | | | | | | - | |
Emerging Projects | | | | | | | | | | | | | | | | |
Telephone Lake | | | 100 | | | | | | - | | | | | | - | |
Grand Rapids | | | 100 | | | | | | - | | | | | | - | |
Foster Creek, Christina Lake and Narrows Lake are operated by Cenovus and jointly owned with ConocoPhillips, an unrelated U.S. public company. Foster Creek and Christina Lake are producing and Narrows Lake is in the initial stages of development. These projects are located in the Athabasca region of northeastern Alberta. Two of our 100 percent-owned emerging projects are Telephone Lake and Grand Rapids, located within the Borealis and Greater Pelican Lake regions of northeastern Alberta, respectively.
| | | | | | | | | | |
| | | Nine Months Ended September 30, 2016 | |
| ($ millions) | | Crude Oil | | | | | Natural Gas | |
| | | |
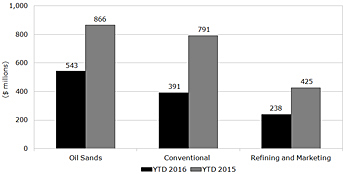
Operating Cash Flow | | | 542 | | | | | | 4 | |
Capital Investment | | | 472 | | | | | | 4 | |
Operating Cash Flow Net of Related Capital Investment | | | 70 | | | | | | - | |
| | |
| Cenovus Energy Inc. | | Page 7 |
| Third Quarter 2016 Report | | Management’s Discussion and Analysis |
Conventional
Crude oil production from our Conventional business segment continues to generate dependable near-term cash flow. This production provides diversification to our revenue stream and enables further development of our oil sands assets. Our natural gas production acts as an economic hedge for the natural gas required as a fuel source at both our oil sands and refining operations and provides cash flow to help fund our growth opportunities.
| | | | | | | | | | |
| | | Nine Months Ended September 30, 2016 | |
| ($ millions) | | Crude Oil (1) | | | | | Natural Gas | |
| | | |
Operating Cash Flow | | | 302 | | | | | | 87 | |
Capital Investment | | | 108 | | | | | | 6 | |
Operating Cash Flow Net of Related Capital Investment | | | 194 | | | | | | 81 | |
We have established crude oil and natural gas producing assets, including heavy oil assets at Pelican Lake, a carbon dioxide (“CO2”) enhanced oil recovery project in Weyburn, Saskatchewan and emerging tight oil assets in Alberta.
Refining and Marketing
Our operations include two refineries located in Illinois and Texas that are jointly owned with and operated by Phillips 66, an unrelated U.S. public company. The gross crude oil capacity at the Wood River and Borger refineries is approximately 314,000 barrels per day and 146,000 barrels per day, respectively. Our refining operations allow us to capture the value from crude oil production through to refined products, such as diesel, gasoline and jet fuel, to partially mitigate volatility associated with regional North American light/heavy crude oil price differential fluctuations. This segment also includes our crude-by-rail terminal operations, located in Bruderheim, Alberta, and the marketing of third-party purchases and sales of product undertaken to provide operational flexibility for transportation commitments, product quality, delivery points and customer diversification.
| | | | |
| ($ millions) | | Nine Months Ended
September 30, 2016 | |
Operating Cash Flow | | | 238 | |
Capital Investment | | | 156 | |
Operating Cash Flow Net of Related Capital Investment | | | 82 | |
QUARTERLY HIGHLIGHTS
Crude oil prices remained relatively flat in the third quarter compared with the second quarter of 2016 with the West Texas Intermediate (“WTI”) benchmark price averaging US$44.94 per barrel. Our average crude oil sales price was $34.64 per barrel in the quarter, a slight increase from $33.87 per barrel in the second quarter and more than double first quarter prices.
Our crude oil netback, before realized risk management activities, was $17.17 per barrel, a 12 percent increase from the third quarter of 2015. Year to date, our netback was $10.32 per barrel, which remains significantly lower than in 2015. We continue to focus on maintaining our financial resilience and safe and reliable operations. Our ongoing efforts to reduce costs have helped our balance sheet remain strong, with approximately $3.9 billion of cash on hand at September 30, 2016.
In the third quarter, we:
| ● | | Decreased our total crude oil operating costs by 14 percent or $1.54 per barrel, compared with 2015; |
| ● | | Achieved Cash Flow of $422 million, a decrease of five percent from the third quarter of 2015 primarily due to lower realized gains on risk management activities; |
| ● | | Incurred Operating Losses of $236 million or $9.28 per BOE sold compared with Operating Losses of $28 million or $1.08 per BOE sold in the third quarter of 2015; |
| ● | | Added incremental crude oil production volumes from Foster Creek phase G and began steam generation at Christina Lake phase F. These phases, which include cogeneration at Christina Lake phase F, are expected to add 80,000 gross barrels per day of production capacity; |
| ● | | Increased crude utilization as a result of strong performance at both refineries. In addition, the debottlenecking project at Wood River was successfully completed and is expected to increase our heavy crude oil processing capability by 18,000 gross barrels per day; and |
| ● | | Recorded asset impairments of $292 million due to a decline in long-term forward commodity prices. |
| | |
| Cenovus Energy Inc. | | Page 8 |
| Third Quarter 2016 Report | | Management’s Discussion and Analysis |
OPERATING RESULTS
Total crude oil production decreased slightly in the three and nine months ended September 30, 2016, as higher production from our Oil Sands segment was offset by lower production from our Conventional properties.
Crude Oil Production Volumes
| | | | | | | | | | | | | | | | | | | | | | | | | | | | | | | | | | | | | | | | |
| | | Three Months Ended September 30, | | | | | Nine Months Ended September 30, | |
| (barrels per day) | | 2016 | | | | | Percent Change | | | | | | 2015 | | | | | 2016 | | | | | | Percent Change | | | | | | 2015 | |
| | | | | | | | | | | |
Oil Sands | | | | | | | | | | | | | | | | | | | | | | | | | | | | | | | | | | | | | | | | |
Foster Creek | | | 73,798 | | | | | | 3% | | | | | | | | 71,414 | | | | | | 66,435 | | | | | | | | 1% | | | | | | | | 65,906 | |
Christina Lake | | | 79,793 | | | | | | 6% | | | | | | | | 75,329 | | | | | | 78,321 | | | | | | | | 5% | | | | | | | | 74,720 | |
| | | 153,591 | | | | | | 5% | | | | | | | | 146,743 | | | | | | 144,756 | | | | | | | | 3% | | | | | | | | 140,626 | |
| | | | | | | | | | | |
Conventional | | | | | | | | | | | | | | | | | | | | | | | | | | | | | | | | | | | | | | | | |
Heavy Oil | | | 28,096 | | | | | | (17)% | | | | | | | | 33,997 | | | | | | 29,276 | | | | | | | | (18)% | | | | | | | | 35,739 | |
Light and Medium Oil | | | 25,311 | | | | | | (11)% | | | | | | | | 28,491 | | | | | | 26,200 | | | | | | | | (18)% | | | | | | | | 31,787 | |
NGLs(1) | | | 1,074 | | | | | | (10)% | | | | | | | | 1,191 | | | | | | 1,027 | | | | | | | | (20)% | | | | | | | | 1,286 | |
| | | 54,481 | | | | | | (14)% | | | | | | | | 63,679 | | | | | | 56,503 | | | | | | | | (18)% | | | | | | | | 68,812 | |
Total Crude Oil Production | | | 208,072 | | | | | | (1)% | | | | | | | | 210,422 | | | | | | 201,259 | | | | | | | | (4)% | | | | | | | | 209,438 | |
| (1) | NGLs include condensate volumes. |
In the third quarter and on a year-to-date basis, production rose at Foster Creek primarily due to incremental production volumes from the phase G facility and additional wells being brought online. Ramp-up of phase G is on track and is expected to take 18 months. In the nine months ended September 30, 2015, production was decreased by approximately 3,500 barrels per day due to a nearby forest fire which resulted in the temporary shutdown of operations in the second quarter.
Production from Christina Lake increased in the three and nine months ended September 30, 2016 due to additional wells being brought online, incremental production from the optimization project completed in 2015 and reliable performance of our facilities.
Our Conventional crude oil production decreased in the third quarter and on a year-to-date basis due to expected natural declines and the sale of our royalty interest and mineral fee title lands business in July 2015. Divested assets contributed an average of 1,250 barrels per day and 3,415 barrels per day, respectively, in the three and nine months ended September 30, 2015.
Natural Gas Production Volumes
| | | | | | | | | | | | | | | | | | | | | | |
| | | Three Months Ended
September 30, | | Nine Months Ended September 30, | |
| (MMcf per day) | | 2016 | | | | | 2015 | | | | | 2016 | | | | | 2015 | |
| | | | | | | |
Conventional | | | 374 | | | | | | 411 | | | | | | 382 | | | | | | 427 | |
Oil Sands | | | 18 | | | | | | 19 | | | | | | 17 | | | | | | 20 | |
| | | 392 | | | | | | 430 | | | | | | 399 | | | | | | 447 | |
In the third quarter and on a year-to-date basis, our natural gas production decreased nine percent and 11 percent, respectively. Production was lower primarily due to expected natural declines and the sale of our royalty interest and mineral fee title lands business in 2015.
Operating Netbacks
| | | | | | | | | | | | | | | | | | | | | | | | | | | | | | | | | | | | | | |
| | | Three Months Ended September 30, | | Nine Months Ended September 30, | |
| | | Crude Oil(1) | | Natural Gas | | Crude Oil(1) | | Natural Gas | |
| | | ($/bbl) | | | | | ($/Mcf) | | | | | ($/bbl) | | | | | ($/Mcf) | |
| | | 2016 | | | 2015 | | | | | 2016 | | | 2015 | | | | | 2016 | | | 2015 | | | | | 2016 | | | 2015 | |
| | | | | | | | | | | |
Price(2) | | | 34.64 | | | | 34.03 | | | | | | 2.49 | | | | 3.00 | | | | | | 28.25 | | | | 37.90 | | | | | | 2.11 | | | | 2.96 | |
Royalties | | | 1.84 | | | | 1.60 | | | | | | 0.10 | | | | 0.11 | | | | | | 1.57 | | | | 1.85 | | | | | | 0.08 | | | | 0.06 | |
Transportation and Blending(2) | | | 5.71 | | | | 5.61 | | | | | | 0.10 | | | | 0.10 | | | | | | 6.02 | | | | 5.39 | | | | | | 0.11 | | | | 0.11 | |
Operating Expenses(3) | | | 9.74 | | | | 11.28 | | | | | | 1.05 | | | | 1.16 | | | | | | 10.19 | | | | 12.15 | | | | | | 1.11 | | | | 1.19 | |
Production and Mineral Taxes | | | 0.18 | | | | 0.23 | | | | | | 0.01 | | | | 0.01 | | | | | | 0.15 | | | | 0.25 | | | | | | - | | | | 0.01 | |
Netback Excluding Realized Risk Management | | | 17.17 | | | | 15.31 | | | | | | 1.23 | | | | 1.62 | | | | | | 10.32 | | | | 18.26 | | | | | | 0.81 | | | | 1.59 | |
Realized Risk Management Gain (Loss) | | | 2.14 | | | | 10.07 | | | | | | - | | | | 0.37 | | | | | | 4.06 | | | | 6.25 | | | | | | - | | | | 0.35 | |
Netback Including Realized Risk Management | | | 19.31 | | | | 25.38 | | | | | | 1.23 | | | | 1.99 | | | | | | 14.38 | | | | 24.51 | | | | | | 0.81 | | | | 1.94 | |
| (2) | The crude oil price and transportation and blending costs exclude the cost of purchased condensate which is blended with the heavy oil. On aper-barrel of unblended crude oil basis, the cost of condensate was $18.46 per barrel for the third quarter (2015 – $19.18 per barrel) and $19.40 per barrel for the nine months ended September 30, 2016 (2015 – $21.32 per barrel). |
| (3) | Employee long-term incentive costs in prior periods were reclassified from operating expenses to general and administrative costs to conform to the presentation adopted for the year ended December 31, 2015. |
| | |
| Cenovus Energy Inc. | | Page 9 |
| Third Quarter 2016 Report | | Management’s Discussion and Analysis |
Our average crude oil netback, excluding realized risk management gains and losses, increased 12 percent in the three months ended September 30, 2016 compared with 2015. The increase was primarily due to lower operating expenses and higher average sales prices, partially offset by higher royalties. Royalties increased primarily due to additional royalty burdens resulting from the sale of our royalty interest and mineral fee title lands business in 2015. Our average sales price increased primarily due to the decline in the cost of condensate used for blending in the third quarter of 2016 compared with 2015. As the cost of condensate decreases relative to the price of blended crude oil, our bitumen and heavy oil sales price increases. Refer to the Reportable Segments section for more details.
On a year-to-date basis, our average crude oil netback, excluding realized risk management gains and losses, declined 43 percent compared with 2015. The decline was primarily due to lower average sales prices and lower royalties, partially offset by a decline in operating expenses. The decrease in price is consistent with the decline in benchmark prices and a widening of the WTI-Western Canadian Select (“WCS”) differential, partially offset by the weakening of the Canadian dollar relative to the U.S. dollar, a decline in the cost of condensate used in blending and increased sales into the U.S. market, which generally secures a higher sales price. Our year-to-date netbacks were strongly impacted by crude oil sales prices in the first quarter which were approximately 50 percent lower than our crude oil sales prices in the second and third quarters.
In the third quarter, the value of the Canadian dollar relative to the U.S. dollar was consistent with the value in 2015. The weakening of the Canadian dollar relative to the U.S. dollar on a year-to-date basis, compared with 2015, had a positive impact on our crude oil price of approximately $1.32 per barrel.
In 2016, our average natural gas netback, excluding realized risk management gains and losses, decreased primarily due to lower sales prices, consistent with the decline in the AECO benchmark price.
Refining
In the third quarter, crude utilization increased due to consistent performance at both the Wood River and Borger refineries. In September, there was unplanned maintenance at the Borger refinery. As a result, a portion of the maintenance originally scheduled for October was started in the third quarter. In the third quarter of 2015, crude utilization was reduced by unplanned process unit outages at the Borger refinery for most of July and the start of a planned turnaround at the Wood River refinery.
On a year-to-date basis, crude utilization increased. Strong performance at both refineries was slightly offset by planned and unplanned maintenance at both refineries in the first quarter of 2016 and unplanned maintenance at the Borger refinery in September. In 2015, we experienced unplanned outages at the Borger refinery and planned turnarounds at both refineries.
| | | | | | | | | | | | | | | | | | | | | | | | | | | | | | | | | | |
| | | Three Months Ended September 30, | | Nine Months Ended September 30, | |
| | | 2016 | | | | | Percent Change | | | | | 2015 | | | | | 2016 | | | | | Percent Change | | | | | 2015 | |
| | | | | | | | | | | |
Crude Oil Runs(1)(Mbbls/d) | | | 463 | | | | | | 18% | | | | | | 394 | | | | | | 452 | | | | | | 7% | | | | | | 424 | |
Heavy Crude Oil(1) | | | 241 | | | | | | 30% | | | | | | 186 | | | | | | 237 | | | | | | 17% | | | | | | 202 | |
Refined Product(1)(Mbbls/d) | | | 494 | | | | | | 19% | | | | | | 414 | | | | | | 479 | | | | | | 7% | | | | | | 448 | |
Crude Utilization(1)(percent) | | | 101 | | | | | | 15% | | | | | | 86 | | | | | | 98 | | | | | | 6% | | | | | | 92 | |
| (1) | Represents 100 percent of the Wood River and Borger refinery operations. |
Further information on the changes in our production volumes, items included in our operating netbacks and refining results can be found in the Reportable Segments section of this MD&A. Further information on our risk management activities can be found in the Risk Management section of this MD&A and in the notes to the Consolidated Financial Statements.
COMMODITY PRICES UNDERLYING OUR FINANCIAL RESULTS
Key performance drivers for our financial results include commodity prices, price differentials, refining crack spreads as well as the U.S./Canadian dollar exchange rate.
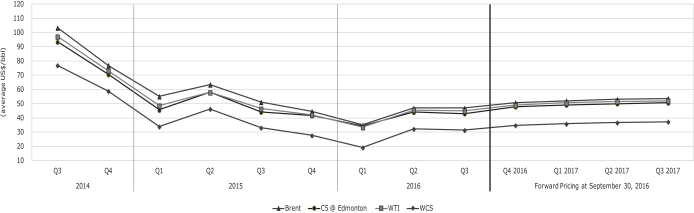
Crude Oil Benchmarks
Average crude oil benchmark prices in the third quarter were relatively consistent with the second quarter of 2016 and six percent lower than in the third quarter of 2015. Crude oil prices continued to be volatile, driven by stronger production from Saudi Arabia and Iran in combination with higher seasonal demand and lower gasoline prices for consumers. Additional volatility was introduced in late September when the Organization of Petroleum Exporting Countries (“OPEC”) announced a plan to limit its crude oil production.
| | |
| Cenovus Energy Inc. | | Page 10 |
| Third Quarter 2016 Report | | Management’s Discussion and Analysis |
WTI is an important benchmark for Canadian crude oil since it reflects inland North American crude oil prices and its Canadian dollar equivalent is the basis for determining royalties for a number of our crude oil properties. The average Brent-WTI differential narrowed in the third quarter of 2016 and on a year-to-date basis compared with 2015 as a result of lifting the U.S. export ban and a decrease in U.S. domestic light oil supply. The Brent-WTI differential continues to be primarily driven by transportation costs.
WCS is blended heavy oil which consists of both conventional heavy oil and unconventional diluted bitumen. Despite the decline in WTI, the average WTI-WCS differential was wider in the third quarter of 2016 and on a year-to-date basis compared with 2015. The differential widened as additional U.S. imports of medium crude competed for refining capacity and heavy oil prices were pressured by an oversupply of heavy oil products, such as fuel oil and bunker fuel.
Blending condensate with bitumen and heavy oil enables our production to be transported through pipelines. Our blending ratios range from approximately 10 percent to 33 percent. The WCS-Condensate differential is an important benchmark as a narrower differential generally results in an increase in the recovery of condensate costs when selling a barrel of blended crude oil. Since the supply of condensate in Alberta does not meet demand, Edmonton condensate prices may be driven by U.S. Gulf Coast condensate prices plus the cost attributed to transporting the condensate to Edmonton.
Average condensate prices were stronger relative to WTI in the third quarter of 2016 and on a year-to-date basis as declining U.S. light oil production reduced condensate supply from the U.S. Gulf Coast while higher heavy oil production in Alberta increased demand.
Selected Benchmark Prices and Exchange Rates(1)
| | | | | | | | | | | | | | | | | | | | | | | | | | | | | | |
| | | Nine Months Ended September 30, | | | | | | | | | | | | | | |
| | | 2016 | | | | | Percent Change | | | 2015 | | | | | Q3 2016 | | | Q2 2016 | | | | | Q3
2015 | |
| | | | | | | | | |
Crude Oil Prices(US$/bbl) | | | | | | | | | | | | | | | | | | | | | | | | | | | | | | |
Brent | | | | | | | | | | | | | | | | | | | | | | | | | | | | | | |
Average | | | 43.01 | | | | | | (24)% | | | | 56.61 | | | | | | 46.98 | | | | 46.97 | | | | | | 51.17 | |
End of Period | | | 49.06 | | | | | | 1% | | | | 48.37 | | | | | | 49.06 | | | | 49.68 | | | | | | 48.37 | |
WTI | | | | | | | | | | | | | | | | | | | | | | | | | | | | | | |
Average | | | 41.33 | | | | | | (19)% | | | | 51.00 | | | | | | 44.94 | | | | 45.59 | | | | | | 46.43 | |
End of Period | | | 48.24 | | | | | | 7% | | | | 45.09 | | | | | | 48.24 | | | | 48.33 | | | | | | 45.09 | |
Average Differential Brent-WTI | | | 1.68 | | | | | | (70)% | | | | 5.61 | | | | | | 2.04 | | | | 1.38 | | | | | | 4.74 | |
WCS(2) | | | | | | | | | | | | | | | | | | | | | | | | | | | | | | |
Average | | | 27.65 | | | | | | (27)% | | | | 37.80 | | | | | | 31.44 | | | | 32.29 | | | | | | 33.16 | |
End of Period | | | 34.97 | | | | | | 11% | | | | 31.62 | | | | | | 34.97 | | | | 35.79 | | | | | | 31.62 | |
Average Differential WTI-WCS | | | 13.68 | | | | | | 4% | | | | 13.20 | | | | | | 13.50 | | | | 13.30 | | | | | | 13.27 | |
Condensate (C5 @ Edmonton)(3) | | | | | | | | | | | | | | | | | | | | | | | | | | | | | | |
Average | | | 40.51 | | | | | | (18)% | | | | 49.25 | | | | | | 43.07 | | | | 44.07 | | | | | | 44.21 | |
Average Differential WTI-Condensate (Premium)/Discount | | | 0.82 | | | | | | (53)% | | | | 1.75 | | | | | | 1.87 | | | | 1.52 | | | | | | 2.22 | |
Average Differential WCS-Condensate (Premium)/Discount | | | (12.86) | | | | | | 12% | | | | (11.45) | | | | | | (11.63) | | | | (11.78) | | | | | | (11.05) | |
Average Refined Product Prices(US$/bbl) | | | | | | | | | | | | | | | | | | | | | | | | | | | | | | |
Chicago Regular Unleaded Gasoline (“RUL”) | | | 55.17 | | | | | | (23)% | | | | 71.82 | | | | | | 59.27 | | | | 64.25 | | | | | | 73.05 | |
Chicago Ultra-low Sulphur Diesel (“ULSD”) | | | 54.60 | | | | | | (23)% | | | | 71.09 | | | | | | 59.86 | | | | 59.40 | | | | | | 67.02 | |
Refining Margin: Average 3-2-1 Crack Spreads(US$/bbl) | | | | | | | | | | | | | | | | | | | | | | | | | | | | | | |
Chicago | | | 13.77 | | | | | | (33)% | | | | 20.66 | | | | | | 14.58 | | | | 17.15 | | | | | | 24.67 | |
Group 3 | | | 12.71 | | | | | | (35)% | | | | 19.61 | | | | | | 14.56 | | | | 13.03 | | | | | | 22.03 | |
Average Natural Gas Prices | | | | | | | | | | | | | | | | | | | | | | | | | | | | | | |
AECO(C$/Mcf) | | | 1.85 | | | | | | (34)% | | | | 2.81 | | | | | | 2.20 | | | | 1.25 | | | | | | 2.80 | |
NYMEX(US$/Mcf) | | | 2.29 | | | | | | (18)% | | | | 2.80 | | | | | | 2.81 | | | | 1.95 | | | | | | 2.77 | |
Basis Differential NYMEX-AECO(US$/Mcf) | | | 0.89 | | | | | | 59% | | | | 0.56 | | | | | | 1.13 | | | | 0.99 | | | | | | 0.61 | |
Foreign Exchange Rates(US$ per C$1) | | | | | | | | | | | | | | | | | | | | | | | | | | | | | | |
Average | | | 0.757 | | | | | | (5)% | | | | 0.794 | | | | | | 0.766 | | | | 0.776 | | | | | | 0.764 | |
| (1) | These benchmark prices do not reflect our sales prices. For our average sales prices and realized risk management results, refer to the operating netbacks table in the Operating Results section of this MD&A. |
| (2) | The average Canadian dollar WCS benchmark price for the third quarter of 2016 was $41.04 per barrel (2015 – $43.40 per barrel) and for the nine months ended September 30, 2016 was $36.53 per barrel (2015 – $47.61 per barrel). |
| (3) | The average Canadian dollar condensate benchmark price for the third quarter of 2016 was $56.23 per barrel (2015 – $57.87 per barrel) and for the nine months ended September 30, 2016 was $53.51 per barrel (2015 – $62.03 per barrel). |
| | |
| Cenovus Energy Inc. | | Page 11 |
| Third Quarter 2016 Report | | Management’s Discussion and Analysis |
Crude Oil Benchmarks
Crude Oil Benchmarks
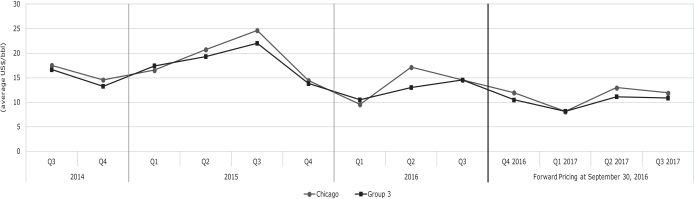
Refining Benchmarks
The Chicago Regular Unleaded Gasoline (“RUL”) and Chicago Ultra-low Sulphur Diesel (“ULSD”) benchmark prices are representative of inland refined product prices and are used to derive the Chicago 3-2-1 crack spread. The3-2-1 crack spread is an indicator of the refining margin generated by converting three barrels of crude oil into two barrels of regular unleaded gasoline and one barrel of ultra-low sulphur diesel using current month WTI-based crude oil feedstock prices and valued on a last in, first out accounting basis.
Average Chicago and Group 3 crack spreads decreased in the three and nine months ended September 30, 2016 compared with 2015 due to higher global refined product inventory and strengthening of the WTI benchmark price compared with Brent, as evidenced by narrowing of the Brent-WTI differential.
Our realized crack spreads are affected by many other factors such as the variety of feedstock crude oil, refinery configuration and product output, the time lag between the purchase and delivery of crude oil feedstock, and the cost of feedstock, which is valued on a first in, first out (“FIFO”) accounting basis.
Refining 3-2-1 Crack Spread Benchmarks
Natural Gas Benchmarks
Average natural gas prices decreased in the third quarter of 2016 and on a year-to-date basis compared with 2015 primarily due to high inventory levels in North America given a warmer than normal 2015/2016 winter and the resiliency of North American supply.
Foreign Exchange Benchmarks
Revenues are subject to foreign exchange exposure as the sales prices of our crude oil, natural gas and refined products are determined by reference to U.S. benchmark prices. A decrease in the value of the Canadian dollar compared with the U.S. dollar has a positive impact on our reported results. Likewise, as the Canadian dollar strengthens, our reported results are lower. In addition to our revenues being denominated in U.S. dollars, we chose to borrow U.S. dollar long-term debt. In periods of a weakening Canadian dollar, our U.S. dollar debt gives rise to unrealized foreign exchange losses when translated to Canadian dollars.
In the third quarter, compared with 2015, the Canadian dollar relative to the U.S. dollar was largely unchanged. On a year-to-date basis, the Canadian dollar weakened relative to the U.S. dollar due to lower commodity prices and the expectation of higher U.S. interest rates. The weakening of the Canadian dollar for the nine months ended September 30, 2016 compared with 2015, had a positive impact of approximately $397 million on our revenues. As at September 30, 2016, the Canadian dollar was stronger relative to the U.S. dollar on December 31, 2015, which resulted in $343 million of unrealized foreign exchange gains on the translation of our U.S. dollar debt for the nine months ended September 30, 2016.
| | |
| Cenovus Energy Inc. | | Page 12 |
| Third Quarter 2016 Report | | Management’s Discussion and Analysis |
FINANCIAL RESULTS
Selected Consolidated Financial Results
While crude oil prices in the third quarter improved from the first half of 2016, they were lower than in 2015 and had a significant impact on our year-to-date financial results. The following key performance measures are discussed in more detail within this MD&A.
| | | | | | | | | | | | | | | | | | | | | | | | | | | | | | | | | | | | | | | | |
| | | Nine Months
Ended
September 30, | | | 2016 | | | 2015 | | | 2014 | |
| ($ millions, except per share amounts) | | 2016 | | 2015 | | | Q3 | | Q2 | | | Q1 | | | Q4 | | | Q3 | | | Q2 | | | Q1 | | | Q4 | | | Q3 | |
| | | | | | | | | | | |
Revenues | | 8,492 | | | 10,140 | | | 3,240 | | | 3,007 | | | | 2,245 | | | | 2,924 | | | | 3,273 | | | | 3,726 | | | | 3,141 | | | | 4,238 | | | | 4,970 | |
Operating Cash Flow(1) (2) | | 1,172 | | | 2,082 | | | 487 | | | 541 | | | | 144 | | | | 357 | | | | 602 | | | | 932 | | | | 548 | | | | 537 | | | | 1,156 | |
Cash Flow(1) | | 888 | | | 1,416 | | | 422 | | | 440 | | | | 26 | | | | 275 | | | | 444 | | | | 477 | | | | 495 | | | | 401 | | | | 985 | |
Operating Earnings (Loss)(1) | | (698) | | | 35 | | | (236) | | | (39) | | | | (423) | | | | (438) | | | | (28) | | | | 151 | | | | (88) | | | | (590) | | | | 372 | |
Per Share – Diluted | | (0.84) | | | 0.04 | | | (0.28) | | | (0.05) | | | | (0.51) | | | | (0.53) | | | | (0.03) | | | | 0.18 | | | | (0.11) | | | | (0.78) | | | | 0.49 | |
Net Earnings (Loss) | | (636) | | | 1,259 | | | (251) | | | (267) | | | | (118) | | | | (641) | | | | 1,801 | | | | 126 | | | | (668) | | | | (472) | | | | 354 | |
Per Share – Basic and Diluted | | (0.76) | | | 1.55 | | | (0.30) | | | (0.32) | | | | (0.14) | | | | (0.77) | | | | 2.16 | | | | 0.15 | | | | (0.86) | | | | (0.62) | | | | 0.47 | |
Capital Investment(3) | | 767 | | | 1,286 | | | 208 | | | 236 | | | | 323 | | | | 428 | | | | 400 | | | | 357 | | | | 529 | | | | 786 | | | | 750 | |
Dividends | | | | | | | | | | | | | | | | | | | | | | | | | | | | | | | | | | | | | | | | |
Cash Dividends | | 124 | | | 396 | | | 41 | | | 42 | | | | 41 | | | | 132 | | | | 133 | | | | 125 | | | | 138 | | | | 201 | | | | 201 | |
In Shares from Treasury | | - | | | 182 | | | - | | | - | | | | - | | | | - | | | | - | | | | 98 | | | | 84 | | | | - | | | | - | |
Per Share | | 0.15 | | | 0.6924 | | | 0.05 | | | 0.05 | | | | 0.05 | | | | 0.16 | | | | 0.16 | | | | 0.2662 | | | | 0.2662 | | | | 0.2662 | | | | 0.2662 | |
| (1) | Non-GAAP measure defined in this MD&A. |
| (2) | Employee long-term incentive costs in prior periods were reclassified from operating expenses to general and administrative costs to conform to the presentation adopted for the year ended December 31, 2015. |
| (3) | Includes expenditures on Property, Plant and Equipment (“PP&E”) and Exploration and Evaluation (“E&E”) assets. |
Revenues
| | | | | | | | | | | | |
| | | Three Months | | | | | | Nine Months | |
| ($ millions) | | Ended | | | | | | Ended | |
| | | |
Revenues for the Periods Ended September 30, 2015 | | | 3,273 | | | | | | | | 10,140 | |
Increase (Decrease) due to: | | | | | | | | | | | | |
Oil Sands | | | 40 | | | | | | | | (388) | |
Conventional | | | (73) | | | | | | | | (462) | |
Refining and Marketing | | | 3 | | | | | | | | (813) | |
Corporate and Eliminations | | | (3) | | | | | | | | 15 | |
Revenues for the Periods Ended September 30, 2016 | | | 3,240 | | | | | | | | 8,492 | |
Combined Oil Sands and Conventional revenues declined three percent in the third quarter, compared with 2015, primarily due to lower natural gas sales prices and volumes, partially offset by an increase in crude oil sales prices. On a year-to-date basis, combined Oil Sands and Conventional revenues decreased 23 percent primarily due to lower crude oil and natural gas sales prices and a decline in sales volumes, partially offset by the weakening of the Canadian dollar relative to the U.S. dollar. The sale of our royalty interest and mineral fee title lands business in 2015 also reduced revenues.
Revenues from our Refining and Marketing segment in the third quarter of 2016 remained relatively flat as lower refined product pricing, consistent with lower Chicago RUL and Chicago ULSD benchmark prices, was offset by higher refined product output. On a year-to-date basis, refining revenues declined 12 percent due to lower refined product pricing, partially offset by higher refined product output and the weakening of the Canadian dollar relative to the U.S. dollar. Revenues fromthird-party sales undertaken by the marketing group increased from 2015 due to higher purchased crude oil and natural gas volumes, partially offset by lower natural gas sales prices. Crude oil sales prices increased in the third quarter compared with 2015 and declined on a year-to-date basis.
Corporate and Eliminations revenues relate to sales and operating revenues between segments and are recorded at transfer prices based on current market prices.
Further information regarding our revenues can be found in the Reportable Segments section of this MD&A.
Operating Cash Flow
Operating Cash Flow is a non-GAAP measure used to provide a consistent measure of the cash generating performance of our assets for comparability of our underlying financial performance between periods. Operating Cash Flow is defined as revenues less purchased product, transportation and blending, operating expenses and production and mineral taxes plus realized gains less realized losses on risk management activities. Items within the Corporate and Eliminations segment are excluded from the calculation of Operating Cash Flow.
| | |
| Cenovus Energy Inc. | | Page 13 |
| Third Quarter 2016 Report | | Management’s Discussion and Analysis |
| | | | | | | | | | | | | | | | | | | | | | | | | | | | |
| | | Three Months Ended September 30, | | | | | | Nine Months Ended September 30, | |
| ($ millions) | | 2016 | | | | | | 2015 | | | | | | 2016 | | | | | | 2015 | |
| | | | | | | |
Revenues | | | 3,329 | | | | | | | | 3,359 | | | | | | | | 8,737 | | | | | | | | 10,400 | |
(Add) Deduct: | | | | | | | | | | | | | | | | | | | | | | | | | | | | |
Purchased Product | | | 2,004 | | | | | | | | 2,012 | | | | | | | | 5,144 | | | | | | | | 5,826 | |
Transportation and Blending | | | 473 | | | | | | | | 483 | | | | | | | | 1,364 | | | | | | | | 1,509 | |
Operating Expenses(1) | | | 402 | | | | | | | | 477 | | | | | | | | 1,247 | | | | | | | | 1,384 | |
Production and Mineral Taxes | | | 4 | | | | | | | | 5 | | | | | | | | 9 | | | | | | | | 16 | |
Realized (Gain) Loss on Risk Management | | | (41) | | | | | | | | (220) | | | | | | | | (199) | | | | | | | | (417) | |
Operating Cash Flow | | | 487 | | | | | | | | 602 | | | | | | | | 1,172 | | | | | | | | 2,082 | |
| (1) | Employee long-term incentive costs in prior periods were reclassified from operating expenses to general and administrative costs to conform to the presentation adopted for the year ended December 31, 2015. |
Three Months Ended September 30, 2016 Compared With September 30, 2015
| | |
| Operating Cash Flow by Segment | | Upstream Operating Cash Flow by Product |
 | | 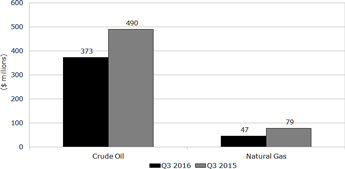 |
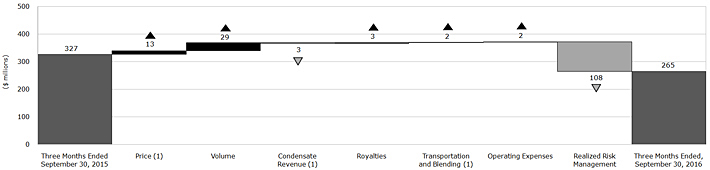
Crude oil prices and sales volumes remained relatively consistent in the third quarter of 2016 compared with 2015. Operating Cash Flow declined 19 percent in 2016 primarily due to upstream realized risk management gains of $42 million compared with gains of $206 million in 2015.
The decline in Operating Cash Flow was partially offset by:
| ● | | Higher Operating Cash Flow from Refining and Marketing as a result of widening heavy and medium crude oil differentials, increased utilization rates, and lower operating expenses, partially offset by lower average market crack spreads; |
| ● | | A $26 million decrease in crude oil operating expenses primarily due to lower repairs and maintenance, workforce, chemicals and electricity costs; and |
| ● | | An $11 million decrease in crude oil transportation and blending costs primarily due to lower condensate prices, partially offset by an increase in condensate volumes and transportation costs. |
Operating Cash Flow Variance
| | |
| Cenovus Energy Inc. | | Page 14 |
| Third Quarter 2016 Report | | Management’s Discussion and Analysis |
Nine Months Ended September 30, 2016 Compared With September 30, 2015
| | |
| Operating Cash Flow by Segment | | Upstream Operating Cash Flow by Product |
 | |  |
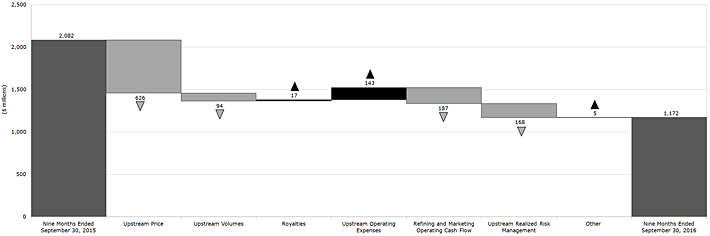
Operating Cash Flow declined 44 percent in the nine months ended September 30, 2016 compared with 2015 primarily due to:
| ● | | A 25 percent decrease in our average crude oil sales price and a 29 percent reduction in our average natural gas sales price. The steep declines in crude oil prices during the first quarter of 2016 significantly impacted our year-to-date average prices; |
| ● | | Lower Operating Cash Flow from Refining and Marketing as a result of a decrease in average market crack spreads, partially offset by widening heavy and medium crude oil differentials, increased utilization rates, weakening of the Canadian dollar relative to the U.S. dollar, and improved margins on the sale of secondary products; |
| ● | | Realized risk management gains of $222 million, excluding Refining and Marketing, compared with gains of $390 million in 2015; and |
| ● | | A three percent decrease in our crude oil sales volumes and an 11 percent decline in our natural gas sales volumes. |
These declines to Operating Cash Flow were partially offset by:
| ● | | A $144 million decrease in crude oil transportation and blending costs primarily due to lower condensate prices, partially offset by an increase in condensate volumes and higher transportation costs; |
| ● | | A $123 million decrease in crude oil operating expenses primarily due to workforce reductions, decreased repairs and maintenance, chemicals, fuel, and workover activities; and |
| ● | | A decline in royalties primarily due to reduced crude oil sales prices. |
Operating Cash Flow Variance
Additional details explaining the changes in Operating Cash Flow can be found in the Reportable Segments section of this MD&A.
Cash Flow
Cash Flow is a non-GAAP measure commonly used in the oil and gas industry to assist in measuring a company’s ability to finance its capital programs and meet its financial obligations. Cash Flow is defined as cash from operating activities excluding net change in other assets and liabilities and net change in non-cash working capital.
| | | | | | | | | | | | | | | | | | | | | | |
| | | Three Months Ended
September 30, | | | | | Nine Months Ended September 30, | |
| ($ millions) | | 2016 | | | | | 2015 | | | | | 2016 | | | | | 2015 | |
| | | | | | | |
Cash From Operating Activities | | | 310 | | | | | | 542 | | | | | | 697 | | | | | | 1,152 | |
(Add) Deduct: | | | | | | | | | | | | | | | | | | | | | | |
Net Change in Other Assets and Liabilities | | | (13) | | | | | | (13) | | | | | | (59) | | | | | | (81) | |
Net Change in Non-Cash Working Capital | | | (99) | | | | | | 111 | | | | | | (132) | | | | | | (183) | |
Cash Flow | | | 422 | | | | | | 444 | | | | | | 888 | | | | | | 1,416 | |
| | |
| Cenovus Energy Inc. | | Page 15 |
| Third Quarter 2016 Report | | Management’s Discussion and Analysis |
In the three and nine months ended September 30, 2016, Cash Flow decreased primarily due to lower Operating Cash Flow, as discussed above, partially offset by a current income tax recovery compared with an expense in 2015.
Operating Earnings (Loss)
Operating Earnings (Loss) is a non-GAAP measure used to provide a consistent measure of the comparability of our underlying financial performance between periods by removing non-operating items. Operating Earnings (Loss) is defined as Earnings (Loss) Before Income Tax excluding gain (loss) on discontinuance, gain on bargain purchase, unrealized risk management gains (losses) on derivative instruments, unrealized foreign exchange gains (losses) on translation of U.S. dollar denominated notes issued from Canada, foreign exchange gains (losses) on settlement of intercompany transactions, gains (losses) on divestiture of assets, less income taxes on Operating Earnings (Loss) before tax, excluding the effect of changes in statutory income tax rates and the recognition of an increase in U.S. tax basis.
| | | | | | | | | | | | | | | | | | | | | | |
| | | Three Months Ended
September 30, | | | | | Nine Months Ended September 30, | |
| ($ millions) | | 2016 | | | | | 2015 | | | | | 2016 | | | | | 2015 | |
| | | | | | | |
Earnings (Loss), Before Income Tax | | | (406) | | | | | | 2,020 | | | | | | (1,089) | | | | | | 1,419 | |
Add (Deduct): | | | | | | | | | | | | | | | | | | | | | | |
Unrealized Risk Management (Gain) Loss(1) | | | 7 | | | | | | (127) | | | | | | 440 | | | | | | 169 | |
Non-operating Unrealized Foreign Exchange (Gain) Loss(2) | | | 52 | | | | | | 437 | | | | | | (343) | | | | | | 852 | |
(Gain) Loss on Divestiture of Assets | | | 5 | | | | | | (2,379) | | | | | | 6 | | | | | | (2,395) | |
Operating Earnings (Loss), Before Income Tax | | | (342) | | | | | | (49) | | | | | | (986) | | | | | | 45 | |
Income Tax Expense (Recovery) | | | (106) | | | | | | (21) | | | | | | (288) | | | | | | 10 | |
Operating Earnings (Loss) | | | (236) | | | | | | (28) | | | | | | (698) | | | | | | 35 | |
| (1) | Includes the reversal of unrealized (gains) losses recorded in prior periods. |
| (2) | Includes unrealized foreign exchange (gains) losses on translation of U.S. dollar denominated notes issued from Canada and foreign exchange (gains) losses on settlement of intercompany transactions. |
Operating Earnings declined in the three and nine months ended September 30, 2016 compared with 2015 primarily due to lower Cash Flow, as discussed above, higher depreciation, depletion and amortization (“DD&A”) from asset impairments, and a $31 million non-cash expense on a year-to-date basis ($nil recorded in the third quarter) for office space in excess of Cenovus’s current and near-term requirements, partially offset by the change in income taxes. We recorded impairment losses of $292 million and $467 million in the three and nine months ended September 30, 2016, respectively, due to a decline in long-term forward heavy crude oil and natural gas prices. Refer to the Reportable Segments section for more details.
Net Earnings
| | | | | | | | | | |
| ($ millions) | | Three Months
Ended | | | | | Nine Months
Ended | |
| | | |
Net Earnings (Loss) for the Periods Ended September 30, 2015 | | | 1,801 | | | | | | 1,259 | |
Increase (Decrease) due to: | | | | | | | | | | |
Operating Cash Flow(1) (2) | | | (115) | | | | | | (910) | |
Corporate and Eliminations: | | | | | | | | | | |
Unrealized Risk Management Gain (Loss) | | | (134) | | | | | | (271) | |
Unrealized Foreign Exchange Gain (Loss) | | | 407 | | | | | | 1,219 | |
Gain (Loss) on Divestiture of Assets | | | (2,384) | | | | | | (2,401) | |
Expenses(2) (3) | | | (13) | | | | | | (50) | |
Depreciation, Depletion and Amortization | | | (186) | | | | | | (114) | |
Exploration Expense | | | (1) | | | | | | 19 | |
Income Tax Recovery | | | 374 | | | | | | 613 | |
Net Earnings (Loss) for the Periods Ended September 30, 2016 | | | (251) | | | | | | (636) | |
| (1) | Non-GAAP measure defined in this MD&A. |
| (2) | Employee long-term incentive costs in prior periods were reclassified from operating expenses to general and administrative costs to conform to the presentation adopted for the year ended December 31, 2015. |
| (3) | Includes general and administrative, finance costs, interest income, realized foreign exchange (gains) losses, research costs, other (income) loss, net and Corporate and Eliminations revenues, purchased product, transportation and blending, and operating expenses. |
Net Earnings for the three and nine months ended September 30, 2016 decreased primarily due to an after-tax gain in 2015 of approximately $1.9 billion from the divestiture of our royalty interest and mineral fee title lands business. In addition, the decrease was due to:
| ● | | A decline in Operating Earnings, as discussed above; |
| ● | | Unrealized risk management losses of $7 million in the quarter and $440 million on a year-to-date basis (2015 – gains of $127 million and losses of $169 million, respectively); and |
| ● | | A deferred income tax recovery of $111 million in the quarter and $353 million on a year-to-date basis (2015 – $228 million and $516 million, respectively). |
The declines were partially offset bynon-operating unrealized foreign exchange losses of $52 million in the quarter and gains of $343 million on a year-to-date basis (2015 – losses of $437 million and $852 million, respectively).
| | |
| Cenovus Energy Inc. | | Page 16 |
| Third Quarter 2016 Report | | Management’s Discussion and Analysis |
Net Capital Investment
| | | | | | | | | | | | | | | | | | | | | | |
| | | Three Months Ended
September 30, | | | | | Nine Months Ended September 30, | |
| ($ millions) | | 2016 | | | | | 2015 | | | | | 2016 | | | | | 2015 | |
| | | | | | | |
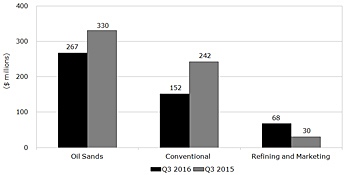
Oil Sands | | | 110 | | | | | | 272 | | | | | | 476 | | | | | | 946 | |
Conventional | | | 41 | | | | | | 55 | | | | | | 114 | | | | | | 157 | |
Refining and Marketing | | | 51 | | | | | | 67 | | | | | | 156 | | | | | | 159 | |
Corporate and Eliminations | | | 6 | | | | | | 6 | | | | | | 21 | | | | | | 24 | |
Capital Investment | | | 208 | | | | | | 400 | | | | | | 767 | | | | | | 1,286 | |
Acquisitions | | | - | | | | | | 84 | | | | | | 11 | | | | | | 84 | |
Divestitures | | | (8) | | | | | | (3,329) | | | | | | (8) | | | | | | (3,345) | |
Net Capital Investment (1) | | | 200 | | | | | | (2,845) | | | | | | 770 | | | | | | (1,975) | |
| (1) | Includes expenditures on PP&E and E&E. |
Capital investment in the three and nine months ended September 30, 2016 declined 48 percent and 40 percent, respectively, compared with 2015, as we reduced our spending in light of the low commodity price environment. Divestitures in the third quarter of 2016 related to non-core conventional crude oil and natural gas properties.
Oil Sands capital investment focused primarily on sustaining capital related to existing production, as well as work to complete Foster Creek phase G and Christina Lake phase F. Conventional capital investment focused on stratigraphic test well drilling for tight oil, maintenance capital and spending for our CO2 enhanced oil recovery project at Weyburn.
Capital investment in the Refining and Marketing segment focused on completion of the debottlenecking project at Wood River, in addition to capital maintenance, projects to improve our refinery reliability and safety, and environmental initiatives.
Further information regarding our capital investment can be found in the Reportable Segments section of this MD&A.
Capital Investment Decisions
Our disciplined approach to capital allocation includes prioritizing our uses of cash flow in the following manner:
| ● | | First, to capital for our existing business operations; |
| ● | | Second, to paying a dividend as part of providing strong total shareholder return; and |
| ● | | Third, for growth or discretionary capital. |
Our approach to capital allocation includes evaluating all opportunities using specific rigorous criteria within the context of achieving our objectives of maintaining a prudent and flexible capital structure and strong balance sheet metrics, which position us to be financially resilient in times of lower cash flow. In addition, we continue to evaluate other corporate and financial opportunities, including generating cash from our existing portfolio. Refer to the Liquidity and Capital Resources section of this MD&A for further information.
| | | | | | | | | | | | | | | | | | | | | | | | | | |
| | | Three Months Ended September 30, | | | | | | Nine Months Ended September 30, | |
| ($ millions) | | 2016 | | | | | 2015 | | | | | | 2016 | | | | | | 2015 | |
| | | | | | | |
Cash Flow (1) | | | 422 | | | | | | 444 | | | | | | | | 888 | | | | | | | | 1,416 | |
Capital Investment (Sustaining and Growth) | | | 208 | | | | | | 400 | | | | | | | | 767 | | | | | | | | 1,286 | |
Free Cash Flow(2) | | | 214 | | | | | | 44 | | | | | | | | 121 | | | | | | | | 130 | |
Cash Dividends | | | 41 | | | | | | 133 | | | | | | | | 124 | | | | | | | | 396 | |
| | | 173 | | | | | | (89) | | | | | | | | (3) | | | | | | | | (266) | |
| (1) | Non-GAAP measure defined in this MD&A. |
| (2) | Free Cash Flow is a non-GAAP measure defined as Cash Flow less capital investment. |
We expect our capital investment for 2016 to be funded from internally generated cash flow and our cash balance on hand.
| | |
| Cenovus Energy Inc. | | Page 17 |
| Third Quarter 2016 Report | | Management’s Discussion and Analysis |
REPORTABLE SEGMENTS
| | |
Our reportable segments are as follows: Oil Sands,which includes the development and production of bitumen and natural gas in northeast Alberta. Cenovus’s bitumen assets include Foster Creek, Christina Lake and Narrows Lake as well as projects in the early stages of development, such as Grand Rapids and Telephone Lake. Certain of Cenovus’s operated oil sands properties, notably Foster Creek, Christina Lake and Narrows Lake, are jointly owned with ConocoPhillips, an unrelated U.S. public company. Conventional,which includes the development and production of conventional crude oil, NGLs and natural gas in Alberta and Saskatchewan, including the heavy oil assets at Pelican Lake, the carbon dioxide enhanced oil recovery project at Weyburn and emerging tight oil opportunities. Refining and Marketing,which is responsible for transporting, selling and refining crude oil into petroleum and chemical products. Cenovus jointly owns two refineries in the U.S. with the operator Phillips 66, an unrelated U.S. public company. In addition, Cenovus owns and operates a crude-by-rail terminal in Alberta. This segment coordinates Cenovus’s marketing and transportation initiatives to optimize product mix, delivery points, transportation commitments and customer diversification. | | 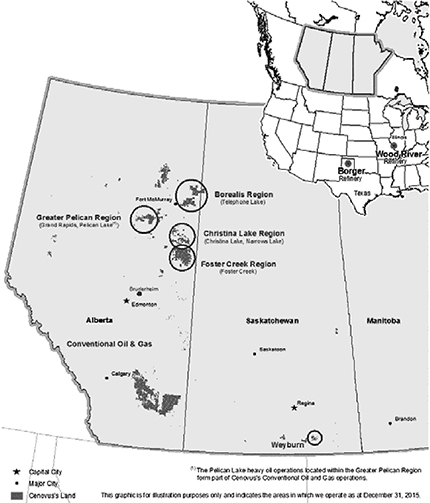 |
Corporate and Eliminations,which primarily includes unrealized gains and losses recorded on derivative financial instruments, gains and losses on divestiture of assets, as well as other Cenovus-wide costs for general and administrative, financing activities and research costs. As financial instruments are settled, the realized gains and losses are recorded in the operating segment to which the derivative instrument relates. Eliminations relate to sales and operating revenues, and purchased product between segments, recorded at transfer prices based on current market prices, and to unrealized intersegment profits in inventory.
Revenues by Reportable Segment
| | | | | | | | | | | | | | | | | | | | | | | | | | |
| | | Three Months Ended September 30, | | Nine Months Ended September 30, | |
| ($ millions) | | 2016 | | | | | | 2015 | | | | | 2016 | | | | | | 2015 | |
| | | | | | | |
Oil Sands | | | 789 | | | | | | | | 749 | | | | | | 1,965 | | | | | | | | 2,353 | |
Conventional | | | 295 | | | | | | | | 368 | | | | | | 810 | | | | | | | | 1,272 | |
Refining and Marketing | | | 2,245 | | | | | | | | 2,242 | | | | | | 5,962 | | | | | | | | 6,775 | |
Corporate and Eliminations | | | (89) | | | | | | | | (86) | | | | | | (245) | | | | | | | | (260) | |
| | | 3,240 | | | | | | | | 3,273 | | | | | | 8,492 | | | | | | | | 10,140 | |
OIL SANDS
In northeastern Alberta, we are a 50 percent partner in the Foster Creek, Christina Lake and Narrows Lake oil sands projects. We have several emerging projects, including our100 percent-owned projects at Telephone Lake and Grand Rapids. The Oil Sands segment also includes the Athabasca natural gas property, from which a portion of the natural gas production is used as fuel at the adjacent Foster Creek operations.
Significant developments in our Oil Sands segment in the third quarter of 2016 compared with 2015 includes:
| ● | | Decreasing our crude oil operating costs by $2 million or $0.81 per barrel to $8.65 per barrel; |
| ● | | Crude oil netbacks, excluding realized risk management activities, of $15.96 per barrel (2015 – $13.65 per barrel); |
| ● | | Generating Operating Cash Flow net of capital investment of $157 million, an increase of $99 million; |
| ● | | Adding incremental crude oil production volumes at Foster Creek phase G, our twelfth oil sands expansion phase, which is expected to ramp-up over the next 18 months; and |
| ● | | Began steam generation at Christina Lake phase F. |
| | |
| Cenovus Energy Inc. | | Page 18 |
| Third Quarter 2016 Report | | Management’s Discussion and Analysis |
Oil Sands – Crude Oil
Three Months Ended September 30, 2016 Compared With September 30, 2015
Financial Results
| | | | | | | | | | | | |
| | | Three Months Ended
September 30, | |
| ($ millions) | | 2016 | | | | | | 2015 | |
| | | |
Gross Sales | | | 788 | | | | | | | | 749 | |
Less: Royalties | | | 4 | | | | | | | | 7 | |
Revenues | | | 784 | | | | | | | | 742 | |
Expenses | | | | | | | | | | | | |
Transportation and Blending | | | 429 | | | | | | | | 431 | |
Operating(1) | | | 125 | | | | | | | | 127 | |
(Gain) Loss on Risk Management | | | (35) | | | | | | | | (143) | |
Operating Cash Flow | | | 265 | | | | | | | | 327 | |
Capital Investment | | | 107 | | | | | | | | 272 | |
Operating Cash Flow Net of Related Capital Investment | | | 158 | | | | | | | | 55 | |
| (1) | Employee long-term incentive costs in prior periods were reclassified from operating expenses to general and administrative costs to conform to the presentation adopted for the year ended December 31, 2015. |
When capital investment exceeds Operating Cash Flow from Oil Sands, it is funded through Operating Cash Flow generated by our Conventional segment as well as our cash balance on hand.
Operating Cash Flow Variance
Operating Cash Flow declined 19 percent in the third quarter of 2016 compared with 2015 primarily due to lower realized risk management gains, partially offset by higher crude oil prices and sales volumes.
| (1) | Revenues include the value of condensate sold as heavy oil blend. Condensate costs are recorded in transportation and blending expense. The crude oil price excludes the impact of condensate purchases. |
Revenues
Pricing
In the third quarter, our average crude oil sales price was $31.30 per barrel, a three percent increase from 2015. The increase in our crude oil price was due to the decline in the cost of condensate used for blending, the narrowing of the WCS-Christina Dilbit Blend (“CDB”) differential, and higher sales into the U.S. market, which generally secures a higher sales price, partially offset by a decrease in the WCS benchmark price.
Our bitumen sales price is influenced by the cost of condensate used in blending. Our blending ratios range from approximately 25 percent to 33 percent. As the cost of condensate decreases relative to the price of blended crude oil, our bitumen sales price increases. Due to high demand for condensate at Edmonton, we also purchase condensate from U.S. markets. As such, our cost of condensate is generally higher than the Edmonton benchmark price due to transportation between market hubs and to field locations. In addition, up to three months may elapse from when we purchase condensate to when we blend it with our production. In a rising price environment, we will see some benefit in our bitumen sales price as we are using condensate purchased at a lower price earlier in the year.
The WCS-CDB differential narrowed to a discount of US$2.05 per barrel (2015 – US$3.00 per barrel). In the third quarter, 88 percent of our Christina Lake production was sold as CDB (2015 – 84 percent), with the remainder sold into the WCS stream. Christina Lake production, whether sold as CDB or blended with WCS and subject to a quality equalization charge, is priced at a discount to WCS.
| | |
| Cenovus Energy Inc. | | Page 19 |
| Third Quarter 2016 Report | | Management’s Discussion and Analysis |
Production Volumes
| | | | | | | | | | | | | | | | | | |
| | | Three Months Ended September 30, | |
| (barrels per day) | | 2016 | | | | | Percent Change | | | | | | 2015 | |
| | | | | |
Foster Creek | | | 73,798 | | | | | | 3% | | | | | | | | 71,414 | |
Christina Lake | | | 79,793 | | | | | | 6% | | | | | | | | 75,329 | |
| | | 153,591 | | | | | | 5% | | | | | | | | 146,743 | |
Production at Foster Creek for the third quarter was higher than 2015 primarily due to incremental production volumes from the phase G oil processing facility and additional wells being brought online. Ramp-up of phase G is on track and expected to take 18 months. In 2015, Foster Creek experienced strong initial production after operations were temporarily shut down in the second quarter due to a nearby forest fire.
Production from Christina Lake increased compared with the third quarter of 2015 due to additional wells being brought online, incremental production from the optimization project completed in 2015, and consistent performance of our facilities.
Condensate
The bitumen currently produced by Cenovus must be blended with condensate to reduce its thickness in order to transport it to market. Revenues represent the total value of blended crude oil sold and include the value of condensate. Consistent with the widening of the WCS-Condensate differential during the third quarter, the proportion of the cost of condensate recovered decreased.
Royalties
Royalty calculations for our oil sands projects are based on government prescribed pre- and post-payout royalty rates which are determined on a sliding scale using the Canadian dollar equivalent WTI benchmark price. Royalty calculations differ between properties.
Royalties at Foster Creek, a post-payout project, are based on an annualized calculation which uses the greater of: (1) the gross revenues multiplied by the applicable royalty rate (one to nine percent, based on the Canadian dollar equivalent WTI benchmark price); or (2) the net profits of the project multiplied by the applicable royalty rate (25 to 40 percent, based on the Canadian dollar equivalent WTI benchmark price). Gross revenues are a function of sales volumes and sales prices. Net profits are a function of sales volumes, sales prices and allowed operating and capital costs. The royalty calculation was based on gross revenues in 2016 and 2015.
Royalties at Christina Lake, a pre-payout project, are based on a monthly calculation that applies a royalty rate (ranging from one to nine percent, based on the Canadian dollar equivalent WTI benchmark price) to the gross revenues from the project.
Effective Royalty Rates
| | | | | | | | |
| | | Three Months Ended
September 30, | |
| (percent) | | 2016 | | | 2015 | |
| | |
Foster Creek | | | 0.8 | | | | 0.8 | |
Christina Lake | | | 1.6 | | | | 3.7 | |
Royalties decreased $3 million in the third quarter relative to the same period in 2015 primarily due to the decline in the WTI benchmark price used in the royalty calculation, partially offset by higher crude oil sales prices and an increase in sales volumes.
Expenses
Transportation and Blending
Transportation and blending costs decreased slightly. Blending costs declined primarily as a result of lower condensate prices partially offset by higher condensate volumes required for increased bitumen production. Our condensate costs were higher than the average benchmark price in the third quarter due to the transportation costs associated with moving the condensate from purchase point to our oil sands projects.
Transportation costs increased primarily due to tariffs associated with additional sales to the U.S. market, which generally secure a higher sales price, and shipping higher volumes due to increased production. Future production growth is expected to reduce our per-barrel transportation costs.
Transportation costs related to rail decreased, despite moving higher volumes, as we transported volumes across shorter distances. We transported an average of 15,145 gross barrels per day of crude oil by rail, consisting of 22 unit train shipments, of which 19 were loaded at our crude-by-rail terminal located in Bruderheim, Alberta (2015 – 6,642 gross barrels per day, 10 unit train shipments).
| | |
| Cenovus Energy Inc. | | Page 20 |
| Third Quarter 2016 Report | | Management’s Discussion and Analysis |
Operating
Primary drivers of our operating expenses for the third quarter were workforce, fuel, chemical costs, repairs and maintenance, and workovers. Total operating expenses decreased $2 million primarily as a result of lower repairs and maintenance activities, a decrease in property taxes and lease costs and lower electrical costs, partially offset by increased workover costs.
Per-unit Operating Expenses
| | | | | | | | | | | | | | | | | | | | |
| | | Three Months Ended September 30, | |
| ($/bbl) | | 2016 | | | | | | Percent Change | | | | | | 2015 | |
| | | | | |
Foster Creek | | | | | | | | | | | | | | | | | | | | |
Fuel | | | 2.44 | | | | | | | | (8)% | | | | | | | | 2.65 | |
Non-fuel(1) | | | 7.19 | | | | | | | | (17)% | | | | | | | | 8.62 | |
Total | | | 9.63 | | | | | | | | (15)% | | | | | | | | 11.27 | |
Christina Lake | | | | | | | | | | | | | | | | | | | | |
Fuel | | | 2.14 | | | | | | | | (7)% | | | | | | | | 2.30 | |
Non-fuel(1) | | | 5.58 | | | | | | | | 1% | | | | | | | | 5.50 | |
Total | | | 7.72 | | | | | | | | (1)% | | | | | | | | 7.80 | |
Total | | | 8.65 | | | | | | | | (9)% | | | | | | | | 9.46 | |
| (1) | Employee long-term incentive costs in prior periods were reclassified from operating expenses to general and administrative costs to conform to the presentation adopted for the year ended December 31, 2015. |
At Foster Creek, fuel costs decreased primarily due to the decline in natural gas prices partially offset by an increase in fuel consumption on a per-barrel basis. Non-fuel operating expenses declined primarily due to:
| ● | | Lower repairs and maintenance costs from focusing on critical operational activities; |
At Christina Lake, fuel costs declined due to lower natural gas prices partially offset by an increase in fuel consumption on a per-barrel basis. Non-fuel operating expenses remained relatively consistent with 2015.
Operating Netbacks
| | | | | | | | | | | | | | | | | | | | | | | | | | | | |
| | | Foster Creek | | | | | | Christina Lake | |
| | | Three Months Ended September 30, | |
| ($/bbl) | | 2016 | | | | | | 2015 | | | | | | 2016 | | | | | | 2015 | |
| | | | | | | |
Price(1) | | | 33.61 | | | | | | | | 33.35 | | | | | | | | 29.11 | | | | | | | | 27.46 | |
Royalties | | | 0.19 | | | | | | | | 0.20 | | | | | | | | 0.41 | | | | | | | | 0.83 | |
Transportation and Blending(1) | | | 8.38 | | | | | | | | 8.50 | | | | | | | | 4.49 | | | | | | | | 5.00 | |
Operating Expenses(2) | | | 9.63 | | | | | | | | 11.27 | | | | | | | | 7.72 | | | | | | | | 7.80 | |
Netback Excluding Realized Risk Management | | | 15.41 | | | | | | | | 13.38 | | | | | | | | 16.49 | | | | | | | | 13.83 | |
Realized Risk Management | | | 2.37 | | | | | | | | 11.93 | | | | | | | | 2.38 | | | | | | | | 9.41 | |
Netback Including Realized Risk Management | | | 17.78 | | | | | | | | 25.31 | | | | | | | | 18.87 | | | | | | | | 23.24 | |
| (1) | The heavy oil price and transportation and blending costs exclude the cost of purchased condensate which is blended with the heavy oil. On aper-barrel of unblended crude oil basis, the cost of condensate in the third quarter was $22.82 per barrel (2015 – $24.20 per barrel) for Foster Creek, and $23.93 per barrel (2015 – $26.42 per barrel) for Christina Lake. |
| (2) | Employee long-term incentive costs in prior periods were reclassified from operating expenses to general and administrative costs to conform to the presentation adopted for the year ended December 31, 2015. |
Risk Management
Risk management activities in the third quarter resulted in realized gains of $35 million (2015 – $143 million), consistent with our contract prices exceeding average benchmark prices.
Nine Months Ended September 30, 2016 Compared With September 30, 2015
Financial Results
| | | | | | | | | | | | |
| | | Nine Months Ended September 30, | |
| ($ millions, unless otherwise noted) | | 2016 | | | | | | 2015 | |
| | | |
Gross Sales | | | 1,960 | | | | | | | | 2,356 | |
Less: Royalties | | | 7 | | | | | | | | 26 | |
Revenues | | | 1,953 | | | | | | | | 2,330 | |
Expenses | | | | | | | | | | | | |
Transportation and Blending | | | 1,228 | | | | | | | | 1,336 | |
Operating(1) | | | 348 | | | | | | | | 387 | |
(Gain) Loss on Risk Management | | | (165) | | | | | | | | (249) | |
Operating Cash Flow | | | 542 | | | | | | | | 856 | |
Capital Investment | | | 472 | | | | | | | | 945 | |
Operating Cash Flow Net of Related Capital Investment | | | 70 | | | | | | | | (89) | |
| (1) | Employee long-term incentive costs in prior periods were reclassified from operating expenses to general and administrative costs to conform to the presentation adopted for the year ended December 31, 2015. |
| | |
| Cenovus Energy Inc. | | Page 21 |
| Third Quarter 2016 Report | | Management’s Discussion and Analysis |
Capital investment in excess of Operating Cash Flow from Oil Sands was funded through Operating Cash Flow generated by our Conventional and Refining and Marketing segments.
Operating Cash Flow Variance
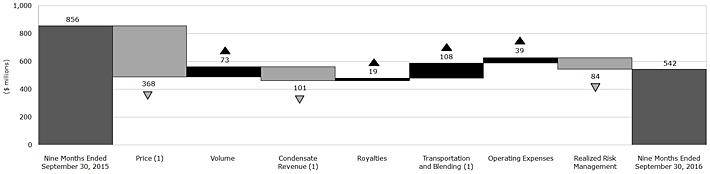
| (1) | Revenues include the value of condensate sold as heavy oil blend. Condensate costs are recorded in transportation and blending expense. The crude oil price excludes the impact of condensate purchases. |
Revenues
Pricing
First quarter crude oil sales prices, which were approximately 65 percent lower than prices in the second and third quarter, had a significant impact on our year-to-date average prices. For the nine months ended September 30, 2016, our average crude oil sales price was $24.28 per barrel, a decrease of 28 percent from 2015. The decline in our crude oil sales price was consistent with the decrease in the WCS and CDB benchmark prices, partially offset by a decline in the cost of condensate used in blending, the weakening of the Canadian dollar relative to the U.S. dollar, and increased sales into the U.S. market, which generally secure a higher sales price.
In the nine months ended September 30, 2016, 89 percent of our Christina Lake production was sold as CDB (2015 – 86 percent), with the remainder sold into the WCS stream.
Production Volumes
| | | | | | | | | | | | | | | | | | | | |
| | | Nine Months Ended September 30, | |
| (barrels per day) | | 2016 | | | | | | Percent Change | | | | | | 2015 | |
| | | | | |
Foster Creek | | | 66,435 | | | | | | | | 1% | | | | | | | | 65,906 | |
Christina Lake | | | 78,321 | | | | | | | | 5% | | | | | | | | 74,720 | |
| | | 144,756 | | | | | | | | 3% | | | | | | | | 140,626 | |
On a year-to-date basis, production rose at Foster Creek primarily due to incremental production volumes at the phase G facility and additional wells being brought online. In 2015, production decreased by approximately 3,500 barrels per day due to a nearby forest fire which resulted in the temporary shutdown of operations in the second quarter.
Production from Christina Lake increased in the nine months ended September 30, 2016 due to increased production from additional wells, incremental production from the optimization project completed in 2015, and consistent performance of our facilities.
Royalties
Effective Royalty Rates
| | | | | | | | |
| | | Nine Months Ended September 30, | |
| (percent) | | 2016 | | | 2015 | |
| | |
Foster Creek | | | 0.5 | | | | 2.1 | |
Christina Lake | | | 1.4 | | | | 3.0 | |
Royalties decreased $19 million compared with 2015. At Foster Creek, low crude oil sales prices and the true-up of the 2015 royalty calculation decreased the overall royalty rate in 2016. In 2015, we received regulatory approval to include certain capital costs incurred in previous years in our royalty calculation and recorded an associated credit, decreasing the overall royalty rate. Excluding the credit, the effective royalty rate in 2015 for Foster Creek would have been 3.6 percent. The royalty calculation was based on gross revenues in 2016 and 2015.
The Christina Lake royalty rate decreased in 2016 as a result of lower sales prices and the decline in the WTI benchmark price.
| | |
| Cenovus Energy Inc. | | Page 22 |
| Third Quarter 2016 Report | | Management’s Discussion and Analysis |
Expenses
Transportation and Blending
Transportation and blending costs decreased $108 million or eight percent. Blending costs declined primarily due to lower condensate prices, partially offset by higher condensate volumes required for increased bitumen production. Our condensate costs exceeded the average benchmark price in 2016 primarily due to the transportation costs associated with moving the condensate from purchase point to our oil sands projects.
Transportation costs increased primarily due to tariffs from additional sales to the U.S. market, which generally secure a higher sales price, and shipping higher volumes due to increased production. Future production growth is expected to reduce our per-barrel transportation costs.
Transportation costs related to rail decreased, despite moving higher volumes, as we transported volumes across shorter distances. We transported an average of 10,212 gross barrels per day of crude oil by rail, consisting of 45 unit train shipments, of which 42 unit trains were loaded at our crude-by-rail terminal, located in Bruderheim, Alberta (2015 – 7,889 gross barrels per day, 36 unit train shipments).
Operating
Primary drivers of our operating expenses for the nine months ended September 30, 2016 were workforce, fuel, workovers, chemicals, and repairs and maintenance. Total operating expenses decreased $39 million primarily as a result of a decline in repairs and maintenance activities, lower natural gas prices that reduced fuel costs, and workforce reductions.
Per-unit Operating Expenses
| | | | | | | | | | | | | | | | |
| | | Nine Months Ended September 30, | |
| ($/bbl) | | 2016 | | | | | Percent Change | | | | | 2015 | |
| | | | | |
Foster Creek | | | | | | | | | | | | | | | | |
Fuel | | | 2.20 | | | | | | (21)% | | | | | | 2.78 | |
Non-fuel(1) | | | 8.32 | | | | | | (18)% | | | | | | 10.14 | |
Total | | | 10.52 | | | | | | (19)% | | | | | | 12.92 | |
Christina Lake | | | | | | | | | | | | | | | | |
Fuel | | | 1.85 | | | | | | (17)% | | | | | | 2.22 | |
Non-fuel(1) | | | 5.39 | | | | | | (8)% | | | | | | 5.86 | |
Total | | | 7.24 | | | | | | (10)% | | | | | | 8.08 | |
Total | | | 8.74 | | | | | | (15)% | | | | | | 10.32 | |
| (1) | Employee long-term incentive costs in prior periods were reclassified from operating expenses to general and administrative costs to conform to the presentation adopted for the year ended December 31, 2015. |
At Foster Creek, fuel costs decreased primarily due to the decline in natural gas prices partially offset by an increase in fuel consumption on a per-barrel basis. Non-fuel operating expenses declined primarily due to:
| ● | | Lower repairs and maintenance costs from focusing on critical operational activities; |
| ● | | Workforce reductions; and |
| ● | | A decline in workover expenses due to reduced well maintenance activity. |
At Christina Lake, fuel costs declined due to lower natural gas prices partially offset by an increase in fuel consumption on a per-barrel basis. Non-fuel operating expenses decreased primarily due to:
| ● | | Lower chemical costs due to supply chain initiatives. |
These decreases were offset by higher workover costs due to more pump changes.
Operating Netbacks
| | | | | | | | | | | | | | | | | | | | | | |
| | | Foster Creek | | | | | Christina Lake | |
| | | Nine Months Ended September 30, | |
| ($/bbl) | | 2016 | | | | | 2015 | | | | | 2016 | | | | | 2015 | |
| | | | | | | |
Price(1) | | | 26.97 | | | | | | 36.58 | | | | | | 22.01 | | | | | | 30.92 | |
Royalties | | | 0.10 | | | | | | 0.59 | | | | | | 0.25 | | | | | | 0.80 | |
Transportation and Blending(1) | | | 9.43 | | | | | | 8.95 | | | | | | 4.89 | | | | | | 4.49 | |
Operating Expenses(2) | | | 10.52 | | | | | | 12.92 | | | | | | 7.24 | | | | | | 8.08 | |
Netback Excluding Realized Risk Management | | | 6.92 | | | | | | 14.12 | | | | | | 9.63 | | | | | | 17.55 | |
Realized Risk Management | | | 4.37 | | | | | | 7.36 | | | | | | 3.95 | | | | | | 6.01 | |
Netback Including Realized Risk Management | | | 11.29 | | | | | | 21.48 | | | | | | 13.58 | | | | | | 23.56 | |
| (1) | The heavy oil price and transportation and blending costs exclude the cost of purchased condensate which is blended with the heavy oil. On aper-barrel of unblended crude oil basis, the cost of condensate was $24.43 per barrel (2015 – $27.94 per barrel) for Foster Creek, and $25.52 per barrel (2015 – $30.23 per barrel) for Christina Lake. |
| (2) | Employee long-term incentive costs in prior periods were reclassified from operating expenses to general and administrative costs to conform to the presentation adopted for the year ended December 31, 2015. |
| | |
| Cenovus Energy Inc. | | Page 23 |
| Third Quarter 2016 Report | | Management’s Discussion and Analysis |
Risk Management
Risk management activities for the nine months ended September 30, 2016 resulted in realized gains of $165 million (2015 – $249 million), consistent with our contract prices exceeding average benchmark prices.
Oil Sands – Natural Gas
Oil Sands include our natural gas operations in northeastern Alberta. A portion of the natural gas produced from our Athabasca property is used as fuel at Foster Creek. Our natural gas production for the three and nine months ended September 30, 2016, net of internal usage, was 18 MMcf per day and 17 MMcf per day, respectively (2015 – 19 MMcf per day and 20 MMcf per day, respectively).
Operating Cash Flow from our Oil Sands natural gas production was $3 million in the third quarter (2015 – $3 million) and $4 million on a year-to-date basis (2015 – $7 million), declining primarily due to lower natural gas sales prices.
Oil Sands – Capital Investment
| | | | | | | | | | | | | | | | | | | | | | |
| | | Three Months Ended September 30, | | Nine Months Ended September 30, | |
| ($ millions) | | 2016 | | | | | 2015 | | | | | 2016 | | | | | 2015 | |
| | | | | | | |
Foster Creek | | | 54 | | | | | | 96 | | | | | | 211 | | | | | | 318 | |
Christina Lake | | | 47 | | | | | | 147 | | | | | | 222 | | | | | | 515 | |
| | | 101 | | | | | | 243 | | | | | | 433 | | | | | | 833 | |
Narrows Lake | | | 1 | | | | | | 12 | | | | | | 6 | | | | | | 41 | |
Telephone Lake | | | 3 | | | | | | 4 | | | | | | 13 | | | | | | 19 | |
Grand Rapids | | | - | | | | | | 6 | | | | | | 5 | | | | | | 32 | |
Other(1) | | | 5 | | | | | | 7 | | | | | | 19 | | | | | | 21 | |
Capital Investment(2) | | | 110 | | | | | | 272 | | | | | | 476 | | | | | | 946 | |
| (1) | Includes new resource plays and Athabasca natural gas. |
| (2) | Includes expenditures on PP&E and E&E assets. |
Existing Projects
Capital investment at Foster Creek and Christina Lake in 2016 focused on sustaining capital related to existing production and drilling stratigraphic test wells in the first quarter to help identify well pad locations for sustaining wells and near-term expansion phases. Capital was also invested in 2016 to complete Foster Creek phase G and progress Christina Lake phase F. Capital investment at Foster Creek and Christina Lake declined in the third quarter and on a year-to-date basis primarily due to spending reductions in response to the low commodity price environment. Lower capital investment at Christina Lake is also attributable to the completion of the optimization project in 2015.
Capital investment at Narrows Lake in 2016 focused on detailed engineering. Capital investment was lower in 2016 compared with 2015 due to the suspension of construction at Narrows Lake.
Emerging Projects
Telephone Lake capital investment declined in 2016 in response to the current low commodity price environment. In 2016, Telephone Lake capital investment focused on front-end engineering work for the central processing facility.
Capital investment at Grand Rapids decreased in 2016 as spending was limited to the wind down of the SAGD pilot. In 2015, a third pilot well pair was completed at Grand Rapids.
Drilling Activity(1)
| | | | | | | | | | | | | | | | | | | | | | |
| | | Gross Stratigraphic Test Wells(2) | | | | | Gross Production Wells(3) | |
| | | Nine Months Ended September 30, | |
| | | 2016 | | | | | 2015 | | | | | 2016 | | | | | 2015 | |
| | | | | | | |
Foster Creek | | | 95 | | | | | | 122 | | | | | | 18 | | | | | | 21 | |
Christina Lake | | | 97 | | | | | | 36 | | | | | | 24 | | | | | | 67 | |
| | | 192 | | | | | | 158 | | | | | | 42 | | | | | | 88 | |
Grand Rapids | | | - | | | | | | - | | | | | | - | | | | | | 1 | |
Other | | | 5 | | | | | | - | | | | | | - | | | | | | - | |
| | | 197 | | | | | | 158 | | | | | | 42 | | | | | | 89 | |
| (1) | We did not drill any gross service wells in the nine months ended September 30, 2016 (2015 – seven gross service wells). |
| (2) | Includes wells drilled using our SkyStratTM drilling rig, which uses a helicopter and a lightweight drilling rig to allow safe stratigraphic well drilling to occur year-round in remote drilling locations. In the nine months ended September 30 2016, no wells were drilled using our SkyStratTM drilling rig (2015 – seven gross wells). |
| (3) | SAGD well pairs are counted as a single producing well. |
| | |
| Cenovus Energy Inc. | | Page 24 |
| Third Quarter 2016 Report | | Management’s Discussion and Analysis |
Future Capital Investment
We have adopted a more moderate and staged approach to future oil sands expansions due to the low commodity price environment.
Existing Projects
Foster Creek is currently producing from phases A through G. Incremental production from phase G was added in the third quarter and ramp-up is expected to take approximately 18 months. We expect phase G to add initial design capacity of 30,000 gross barrels per day. Capital investment for 2016 is forecast to be between $250 million and $270 million, focused on sustaining capital related to existing production and expansion phase G. Spending related to construction work on phase H was deferred in response to the low commodity price environment, pushing the expected start-up to beyond 2017. Phase H has an initial design capacity of 30,000 gross barrels per day. In December 2014, we received regulatory approval for expansion phase J, a 50,000 gross barrels per day phase.
Christina Lake is producing from phases A through E. Commissioning of the phase F facility, including cogeneration, is underway. We began steam generation in the third quarter and expect production to be added in the fourth quarter of 2016. We anticipate adding gross production capacity of 50,000 barrels per day from phase F with ramp-up expected to take approximately twelve months. Capital investment for 2016 is forecast to be between $265 million and $285 million, focused on sustaining capital related to existing production and expansion phase F. Construction work on phase G was deferred in 2015 in response to the low commodity price environment, pushing the expected start-up to beyond 2017. Phase G has an initial design capacity of 50,000 gross barrels per day. We received regulatory approval in December 2015 for expansion phase H, a 50,000 gross barrels per day phase.
Capital investment at Narrows Lake in 2016 is forecast to be between $5 million and $10 million, focusing on phase A detailed engineering and equipment preservation related to the suspension of construction.
Emerging Projects
Capital investment for our new resource plays is forecast to be between $35 million and $45 million in 2016.
Depreciation, Depletion & Amortization
We deplete crude oil and natural gas properties on a unit-of-production basis over proved reserves. Theunit-of-production rate takes into account expenditures incurred to date, together with future development expenditures required to develop those proved reserves. This rate, calculated at an area level, is then applied to our sales volume to determine DD&A in a given period. We believe that this method of calculating DD&A charges each barrel of crude oil equivalent sold with its proportionate share of the cost of capital invested over the total estimated life of the related asset as represented by proved reserves.
The following calculation illustrates how the implied depletion rate for our upstream assets could be determined using the reported consolidated data:
| | |
| ($ millions, unless otherwise indicated) | | As at December 31, 2015 |
| |
Upstream Property, Plant and Equipment | | 12,627 |
Estimated Future Development Capital | | 19,671 |
Total Estimated Upstream Cost Base | | 32,298 |
Total Proved Reserves(MMBOE) | | 2,546 |
Implied Depletion Rate($/BOE) | | 12.69 |
While this illustrates the calculation of the implied depletion rate, our depletion rates are slightly higher and result in a total average rate ranging between $13.50 and $14.50 per BOE. Amounts related to assets under construction, which would be included in the total upstream cost base and would have proved reserves attributed to them, are not depleted. Property specific rates will exclude upstream assets that are depreciated on a straight-line basis. As such, our actual depletion will differ from depletion calculated by applying the above implied depletion rate. Further information on our accounting policy for DD&A is included in our notes to the Consolidated Financial Statements.
In the third quarter, DD&A remained relatively flat. On a year-to-date basis, DD&A declined $23 million primarily due to lower DD&A rates, partially offset by higher sales volumes and impairment losses. The impairment losses of $16 million related to preliminary project engineering costs associated with a project that was cancelled and equipment that was written down to its recoverable amount.
The average depletion rate was approximately $11.55 per barrel compared with $11.65 per barrel in 2015 as the impact of proved reserves additions offset higher PP&E and future development expenditures. Future development costs, which compose approximately 60 percent of the depletable base, increased due to expansion of the development area at Christina Lake.
| | |
| Cenovus Energy Inc. | | Page 25 |
| Third Quarter 2016 Report | | Management’s Discussion and Analysis |
CONVENTIONAL
Our Conventional operations include dependable cash flow producing crude oil and natural gas assets in Alberta and Saskatchewan, including a CO2 enhanced oil recovery project in Weyburn, our heavy oil asset at Pelican Lake that uses polymer flood and waterflood technology and emerging tight oil assets in Alberta. The established assets in this segment are strategically important for their long-life reserves, stable operations and diversity of crude oil produced. The cash flow generated in our Conventional operations helps to fund future growth opportunities in our Oil Sands segment while our natural gas production acts as an economic hedge for the natural gas required as a fuel source at both our oil sands and refining operations.
Significant developments that impacted our Conventional segment in the third quarter of 2016 compared with 2015 includes:
| ● | | Generating Operating Cash Flow net of capital investment of $111 million, a decrease of 41 percent; |
| ● | | Reducing our crude oil operating costs by $24 million or $2.56 per barrel; |
| ● | | Crude oil and natural gas netbacks, excluding realized risk management activities, of $20.63 per barrel (2015 – $19.06 per barrel) and $1.25 per Mcf (2015 – $1.66 per Mcf), respectively; |
| ● | | Crude oil production of 54,481 barrels per day, a decrease of 14 percent; and |
| ● | | Recording impairment losses of $210 million and $65 million, associated with our Northern Alberta and Suffield cash generating units (“CGU”), respectively, due to the decline in long-term forward heavy crude oil and natural gas prices. |
Conventional – Crude Oil
Three Months Ended September 30, 2016 Compared With September 30, 2015
Financial Results
| | | | | | | | | | |
| | | Three Months Ended
September 30, | |
| ($ millions) | | 2016 | | | | | 2015 | |
| | | |
Gross Sales | | | 242 | | | | | | 279 | |
Less: Royalties | | | 32 | | | | | | 23 | |
Revenues | | | 210 | | | | | | 256 | |
Expenses | | | | | | | | | | |
Transportation and Blending | | | 40 | | | | | | 49 | |
Operating(1) | | | 65 | | | | | | 89 | |
Production and Mineral Taxes | | | 4 | | | | | | 4 | |
(Gain) Loss on Risk Management | | | (7 | ) | | | | | (49 | ) |
Operating Cash Flow | | | 108 | | | | | | 163 | |
Capital Investment | | | 39 | | | | | | 52 | |
Operating Cash Flow Net of Related Capital Investment | | | 69 | | | | | | 111 | |
| (1) | Employee long-term incentive costs in prior periods were reclassified from operating expenses to general and administrative costs to conform to the presentation adopted for the year ended December 31, 2015. |
Operating Cash Flow Variance
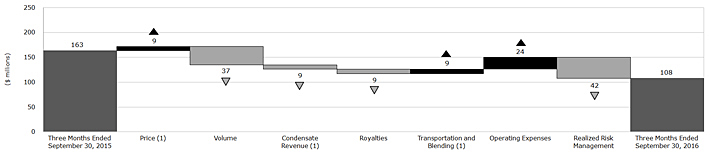
| (1) | Revenues include the value of condensate sold as heavy oil blend. Condensate costs are recorded in transportation and blending expense. The crude oil price excludes the impact of condensate purchases. |
Revenues
Pricing
Our Conventional crude oil assets produce a diverse spectrum of crude oils, ranging from heavy oil, which secures a price based on the WCS benchmark, to light oil, which secures a price closer to the WTI benchmark.
| | |
| Cenovus Energy Inc. | | Page 26 |
| Third Quarter 2016 Report | | Management’s Discussion and Analysis |
Our crude oil sales price averaged $44.24 per barrel in the third quarter, a four percent increase from 2015, due to the decline in the cost of condensate used for blending our heavy oil, partially offset by lower crude oil benchmark prices, adjusted for applicable differentials. As the cost of condensate decreases relative to the price of blended crude oil, our heavy oil sales price increases. Due to high demand for condensate at Edmonton, we also purchase condensate from U.S. markets. As such, our cost of condensate is generally higher than the Edmonton benchmark price due to transportation between market hubs and to field locations. In addition, up to three months may elapse from when we purchase condensate to when we blend it with our production. In a rising price environment, we will see some benefit in our heavy oil sales price as we are using condensate purchased at a lower price earlier in the year.
Production Volumes
| | | | | | | | | | | | | | | | |
| | | Three Months Ended September 30, | |
| (barrels per day) | | 2016 | | | | | Percent Change | | | | | 2015 | |
| | | | | |
Heavy Oil | | | 28,096 | | | | | | (17)% | | | | | | 33,997 | |
Light and Medium Oil | | | 25,311 | | | | | | (11)% | | | | | | 28,491 | |
NGLs | | | 1,074 | | | | | | (10)% | | | | | | 1,191 | |
| | | 54,481 | | | | | | (14)% | | | | | | 63,679 | |
Crude oil production decreased due to expected natural declines and the sale of our royalty interest and mineral fee title lands business. Divested assets contributed an average of 1,250 barrels per day in the third quarter of 2015.
Condensate
The heavy oil currently produced by Cenovus must be blended with condensate to reduce its thickness in order to transport it to market. Our blending ratios range from approximately 10 percent to 16 percent. Revenues represent the total value of blended crude oil sold and include the value of condensate. Consistent with the widening of the WCS-Condensate differential during the third quarter, the proportion of the cost of condensate recovered decreased.
Royalties
Royalties increased in the third quarter primarily due to lower allowable operating and capital costs at Pelican Lake and Weyburn, additional royalty burdens resulting from the sale of our royalty interest and mineral fee title lands business in 2015, and higher sales prices, partially offset by a decrease in sales volumes. In the third quarter, the effective crude oil royalty rate for our Conventional properties was 15.8 percent (2015 – 10.1 percent).
Crown royalties at Pelican Lake are determined under oil sands royalty calculations. Pelican Lake is a post-payout project, therefore royalties are based on an annualized calculation which uses the greater of: (1) the gross revenues multiplied by the applicable royalty rate (one to nine percent, based on the Canadian dollar equivalent WTI benchmark price); or (2) the net profits of the project multiplied by the applicable royalty rate (25 to 40 percent, based on the Canadian dollar equivalent WTI benchmark price). Gross revenues are a function of sales volumes and sales prices. Net profits are a function of sales volumes, sales prices and allowed operating and capital costs. The Pelican Lake crown royalty calculation is based on net profits.
In the third quarter of 2016, production and mineral taxes remained flat as the sale of our royalty interest and mineral fee title lands business in 2015 was offset by the increase in crude oil prices.
Expenses
Transportation and Blending
Transportation and blending costs decreased $9 million. Blending costs declined due to a decrease in condensate volumes, consistent with lower production, and a decline in condensate prices.
Transportation charges were flat due to a decline in sales volumes offset by higher costs associated with optimizing our sales and additional costs due to pipeline capacity commitments in excess of our current production.
Operating
Primary drivers of our operating expenses in the third quarter of 2016 were workforce, workovers, electricity, and property taxes and lease costs. Operating costs declined 17 percent to $12.89 per barrel primarily due to:
| ● | | Lower costs due to workforce reductions undertaken in late 2015 and early 2016; |
| ● | | Lower chemical costs associated with reduced polymer consumption; |
| ● | | A decrease in repairs and maintenance and workover costs as a result of focusing on critical activities and achieving operational efficiencies; and |
| ● | | Reduced electricity costs as a result of a decline in prices and a decrease in consumption. |
These decreases were partially offset by lower production.
| | |
| Cenovus Energy Inc. | | Page 27 |
| Third Quarter 2016 Report | | Management’s Discussion and Analysis |
Operating Netbacks
| | | | | | | | | | | | | | | | | | | | | | |
| | | Heavy Oil | | | | | Light and Medium | |
| | | Three Months Ended September 30, | |
| ($/bbl) | | 2016 | | | | | 2015 | | | | | 2016 | | | | | 2015 | |
| | | | | | | |
Price(1) | | | 40.50 | | | | | | 37.09 | | | | | | 48.97 | | | | | | 49.57 | |
Royalties | | | 3.97 | | | | | | 1.73 | | | | | | 8.91 | | | | | | 7.02 | |
Transportation and Blending(1) | | | 4.86 | | | | | | 3.36 | | | | | | 2.71 | | | | | | 2.88 | |
Operating Expenses(2) | | | 12.43 | | | | | | 15.59 | | | | | | 13.94 | | | | | | 15.92 | |
Production and Mineral Taxes | | | 0.01 | | | | | | 0.07 | | | | | | 1.48 | | | | | | 1.60 | |
Netback Excluding Realized Risk Management | | | 19.23 | | | | | | 16.34 | | | | | | 21.93 | | | | | | 22.15 | |
Realized Risk Management | | | 1.50 | | | | | | 9.03 | | | | | | 1.47 | | | | | | 8.80 | |
Netback Including Realized Risk Management | | | 20.73 | | | | | | 25.37 | | | | | | 23.40 | | | | | | 30.95 | |
| (1) | The heavy oil price and transportation and blending costs exclude the cost of purchased condensate which is blended with the heavy oil. On aper-barrel of unblended heavy oil basis, the cost of condensate for our heavy oil properties was $8.31 per barrel (2015 – $9.56 per barrel). |
| (2) | Employee long-term incentive costs in prior periods were reclassified from operating expenses to general and administrative costs to conform to the presentation adopted for the year ended December 31, 2015. |
Risk Management
Risk management activities for the third quarter resulted in realized gains of $7 million (2015 – $49 million), consistent with our contract prices exceeding average benchmark prices.
Nine Months Ended September 30, 2016 Compared With September 30, 2015
Financial Results
| | | | | | | | | | |
| | | Nine Months Ended September 30, | |
| ($ millions) | | 2016 | | | | | 2015 | |
| | | |
Gross Sales | | | 670 | | | | | | 1,000 | |
Less: Royalties | | | 80 | | | | | | 78 | |
Revenues | | | 590 | | | | | | 922 | |
Expenses | | | | | | | | | | |
Transportation and Blending | | | 124 | | | | | | 160 | |
Operating(1) | | | 213 | | | | | | 297 | |
Production and Mineral Taxes | | | 9 | | | | | | 14 | |
(Gain) Loss on Risk Management | | | (58 | ) | | | | | (100 | ) |
Operating Cash Flow | | | 302 | | | | | | 551 | |
Capital Investment | | | 108 | | | | | | 148 | |
Operating Cash Flow Net of Related Capital Investment | | | 194 | | | | | | 403 | |
| (1) | Employee long-term incentive costs in prior periods were reclassified from operating expenses to general and administrative costs to conform to the presentation adopted for the year ended December 31, 2015. |
Operating Cash Flow Variance
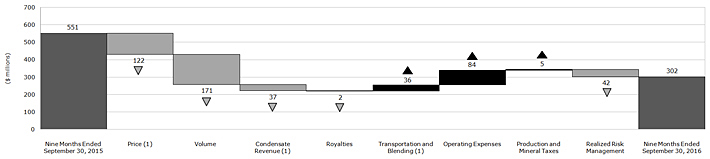
| (1) | Revenues include the value of condensate sold as heavy oil blend. Condensate costs are recorded in transportation and blending expense. The crude oil price excludes the impact of condensate purchases. |
Revenues
Pricing
Our average crude oil sales price decreased 17 percent to $38.49 per barrel consistent with the decline in crude oil benchmark prices, adjusted for applicable differentials.
| | |
| Cenovus Energy Inc. | | Page 28 |
| Third Quarter 2016 Report | | Management’s Discussion and Analysis |
Production Volumes
| | | | | | | | | | | | | | | | | | |
| | | Nine Months Ended September 30, | |
| (barrels per day) | | 2016 | | | | | Percent Change | | | | | | 2015 | |
| | | | | |
Heavy Oil | | | 29,276 | | | | | | (18)% | | | | | | | | 35,739 | |
Light and Medium Oil | | | 26,200 | | | | | | (18)% | | | | | | | | 31,787 | |
NGLs | | | 1,027 | | | | | | (20)% | | | | | | | | 1,286 | |
| | | 56,503 | | | | | | (18)% | | | | | | | | 68,812 | |
Production was lower primarily due to expected natural declines and the sale of our royalty interest and mineral fee title lands business in 2015. Divested assets contributed an average of 3,415 barrels per day for the nine months ended September 30, 2015.
Royalties
Royalties increased slightly due to lower allowable operating and capital costs at Pelican Lake and Weyburn, additional royalty burdens resulting from the sale of our royalty interest and mineral fee title lands business in 2015, partially offset by a reduction in sales volumes and lower sales prices. For the nine months ended September 30, 2016, the effective crude oil royalty rate for our Conventional properties was 14.9 percent (2015 – 9.3 percent). The Pelican Lake crown royalty calculation was based on net profits in both 2016 and 2015.
Production and mineral taxes declined on a year-to-date basis, consistent with lower crude oil prices in 2016, and due to the sale of our royalty interest and mineral fee title lands business in 2015.
Expenses
Transportation and Blending
Transportation and blending costs decreased $36 million. Blending costs declined primarily due to a reduction in condensate volumes, consistent with lower production, and a decrease in condensate prices.
Transportation charges were lower largely due to a decline in sales volumes, partially offset by higher transportation costs associated with optimizing our sales and additional costs due to pipeline capacity commitments in excess of our current production.
Operating
Primary drivers of our operating expenses for the nine months ended September 30, 2016 were workforce costs, workover activities, electricity, property taxes and lease costs, repairs and maintenance, and chemical consumption. Operating expenses declined $84 million or $1.85 per barrel. The per-unit decline was primarily due to:
| ● | | A decrease in repairs and maintenance and workover costs due to a focus on critical operational activities; |
| ● | | Lower chemical costs associated with reduced polymer consumption; |
| ● | | Workforce reductions; and |
| ● | | Lower electricity costs as a result of a decrease in consumption and a decline in prices. |
These decreases were partially offset by lower production.
Operating Netbacks
| | | | | | | | | | | | | | | | | | | | | | |
| | | Heavy Oil | | | | | Light and Medium | |
| | | Nine Months Ended September 30, | |
| ($/bbl) | | 2016 | | | | | 2015 | | | | | 2016 | | | | | 2015 | |
| | | | | | | |
Price(1) | | | 34.18 | | | | | | 42.01 | | | | | | 43.66 | | | | | | 52.13 | |
Royalties | | | 3.06 | | | | | | 3.18 | | | | | | 7.50 | | | | | | 5.30 | |
Transportation and Blending(1) | | | 4.50 | | | | | | 3.29 | | | | | | 2.74 | | | | | | 2.94 | |
Operating Expenses(2) | | | 12.94 | | | | | | 16.13 | | | | | | 15.52 | | | | | | 15.96 | |
Production and Mineral Taxes | | | - | | | | | | 0.06 | | | | | | 1.15 | | | | | | 1.60 | |
Netback Excluding Realized Risk Management | | | 13.68 | | | | | | 19.35 | | | | | | 16.75 | | | | | | 26.33 | |
Realized Risk Management | | | 3.98 | | | | | | 5.50 | | | | | | 3.88 | | | | | | 5.66 | |
Netback Including Realized Risk Management | | | 17.66 | | | | | | 24.85 | | | | | | 20.63 | | | | | | 31.99 | |
| (1) | The heavy oil price and transportation and blending costs exclude the cost of purchased condensate which is blended with the heavy oil. On aper-barrel of unblended heavy oil basis, the cost of condensate for our heavy oil properties was $9.58 per barrel (2015 – $11.21 per barrel). |
| (2) | Employee long-term incentive costs in prior periods were reclassified from operating expenses to general and administrative costs to conform to the presentation adopted for the year ended December 31, 2015. |
Risk Management
Risk management activities for the nine months ended September 30, 2016 resulted in realized gains of $58 million (2015 – $100 million), consistent with our contract prices exceeding average benchmark prices.
| | |
| Cenovus Energy Inc. | | Page 29 |
| Third Quarter 2016 Report | | Management’s Discussion and Analysis |
Conventional – Natural Gas
Financial Results
| | | | | | | | | | | | | | | | | | | | | | |
| | | Three Months Ended
September 30, | | | | | Nine Months Ended September 30, | |
| ($ millions) | | 2016 | | | | | 2015 | | | | | 2016 | | | | | 2015 | |
| | | | | | | |
Gross Sales | | | 86 | | | | | | 113 | | | | | | 221 | | | | | | 346 | |
Less: Royalties | | | 3 | | | | | | 5 | | | | | | 8 | | | | | | 8 | |
Revenues | | | 83 | | | | | | 108 | | | | | | 213 | | | | | | 338 | |
Expenses | | | | | | | | | | | | | | | | | | | | | | |
Transportation and Blending | | | 4 | | | | | | 3 | | | | | | 12 | | | | | | 12 | |
Operating | | | 35 | | | | | | 41 | | | | | | 113 | | | | | | 131 | |
Production and Mineral Taxes | | | - | | | | | | 1 | | | | | | - | | | | | | 2 | |
(Gain) Loss on Risk Management | | | - | | | | | | (13 | ) | | | | | 1 | | | | | | (38 | ) |
Operating Cash Flow | | | 44 | | | | | | 76 | | | | | | 87 | | | | | | 231 | |
Capital Investment | | | 2 | | | | | | 3 | | | | | | 6 | | | | | | 9 | |
Operating Cash Flow Net of Related Capital Investment | | | 42 | | | | | | 73 | | | | | | 81 | | | | | | 222 | |
Operating Cash Flow from natural gas continued to help fund our Oil Sands segment.
Three and Nine Months Ended September 30, 2016 Compared With September 30, 2015
Revenues
Pricing
In the three and nine months ended September 30, 2016, our average natural gas sales price decreased 17 percent to $2.49 per Mcf and 29 percent to $2.11 per Mcf, respectively. This is consistent with the decline in the AECO benchmark price.
Production
Production decreased by nine percent to 374 MMcf per day in the third quarter and by 11 percent to 382 MMcf per day on a year-to-date basis due to expected natural declines and from the sale of our royalty interest and mineral fee title lands business. Divested assets produced 6 MMcf and 13 MMcf per day, respectively, in the three and nine months ended September 30, 2015.
Royalties
Royalties remained relatively consistent as additional royalty burdens due to the sale of our royalty interest and mineral fee title lands business were offset by lower prices and production declines. The average royalty rate in the third quarter was 4.5 percent (2015 – 4.1 percent) and 4.4 percent (2015 – 2.3 percent) on a year-to-date basis.
Expenses
Transportation
In the three and nine months ended September 30, 2016, transportation costs were consistent with 2015. Cost reductions due to the decline in sales volumes were offset by additional charges from a true-up of 2015 transportation contracts.
Operating
Primary drivers of our operating expenses in the three and nine months ended September 30, 2016 were property taxes and lease costs, and workforce. Operating expenses in the three and nine months ended September 30, 2016 decreased by $6 million and $18 million, respectively, primarily due to lower workforce costs, a reduction in repairs and maintenance, and a decline in electricity costs due to lower pricing.
Risk Management
Risk management activities resulted in an impact of $nil in the third quarter and realized losses of $1 million on a year-to-date basis (2015 – realized gains of $13 million in the third quarter and $38 million on a year-to-date basis), consistent with average benchmark prices relative to our contract prices.
Conventional – Capital Investment
| | | | | | | | | | | | | | | | | | | | | | |
| | | Three Months Ended September 30, | | | | | Nine Months Ended September 30, | |
| ($ millions) | | 2016 | | | | | 2015 | | | | | 2016 | | | | | 2015 | |
| | | | | | | |
Heavy Oil | | | 11 | | | | | | 14 | | | | | | 34 | | | | | | 46 | |
Light and Medium Oil | | | 28 | | | | | | 38 | | | | | | 74 | | | | | | 102 | |
Natural Gas | | | 2 | | | | | | 3 | | | | | | 6 | | | | | | 9 | |
Capital Investment(1) | | | 41 | | | | | | 55 | | | | | | 114 | | | | | | 157 | |
| (1) | Includes expenditures on PP&E and E&E assets. |
| | |
| Cenovus Energy Inc. | | Page 30 |
| Third Quarter 2016 Report | | Management’s Discussion and Analysis |
Capital investment in 2016 was primarily related to stratigraphic test well drilling for tight oil, maintenance capital and spending for our CO2 enhanced oil recovery project at Weyburn. Capital investment declined in 2016 primarily due to spending reductions on crude oil activities in response to the low commodity price environment.
Drilling Activity
| | | | | | | | |
| | | Nine Months Ended September 30, | |
| (net wells, unless otherwise stated) | | 2016 | | | 2015 | |
| | |
Crude Oil | | | 1 | | | | 15 | |
Recompletions | | | 84 | | | | 498 | |
Gross Stratigraphic Test Wells | | | 27 | | | | - | |
Drilling activity in 2016 focused on stratigraphic test well drilling for tight oil and natural gas recompletions performed to optimize production.
Future Capital Investment
We are taking a more moderate approach to developing our conventional crude oil opportunities due to the low commodity price environment. We plan to focus on drilling projects that are considered to be relatively low risk, with short production cycle times and strong expected returns.
Our 2016 crude oil capital investment forecast is between $150 million and $175 million with spending plans mainly focused on maintaining and optimizing current production volumes.
DD&A
We deplete crude oil and natural gas properties on a unit-of-production basis over proved reserves. Theunit-of-production rate takes into account expenditures incurred to date, together with future development expenditures required to develop those proved reserves. This rate, calculated at an area level, is then applied to our sales volume to determine DD&A in a given period. We believe that this method of calculating DD&A charges each barrel of crude oil equivalent sold with its proportionate share of the cost of capital invested over the total estimated life of the related asset as represented by proved reserves.
Conventional DD&A increased $188 million in the third quarter and $132 million on a year-to-date basis, compared with 2015, primarily due to impairment losses, partially offset by a decline in sales volumes and lower DD&A rates.
In the third quarter of 2016, we determined that the carrying amounts of the Northern Alberta and Suffield CGUs exceeded their recoverable amounts due to a decline in long-term forward heavy crude oil and natural gas prices, resulting in impairment losses of $210 million and $65 million, respectively. We previously impaired the Northern Alberta CGU by $170 million, due to a decline in long-term forward crude oil prices at March 31, 2016. Year-to-date, impairment losses in 2016 were $445 million.
The average depletion rate decreased approximately 20 percent in 2016 as the impact of lower proved reserves due to the slowdown of our development plans was more than offset by lower PP&E. PP&E declined, in part, from an impairment loss of $184 million associated with our Northern Alberta CGU recorded at December 31, 2015 and a decrease in estimated decommissioning costs. Future development costs, which compose approximately 40 percent of the depletable base, declined from 2015 due to minimal capital investment planned at Pelican Lake in the near term.
REFINING AND MARKETING
We are a 50 percent partner in the Wood River and Borger refineries, which are located in the U.S. Our Refining and Marketing segment positions us to capture the value from crude oil production through to refined products such as diesel, gasoline and jet fuel. Our integrated approach provides a natural economic hedge against widening crude oil price differentials by providing lower feedstock prices to our refineries.
This segment captures our marketing and transportation initiatives as well as our crude-by-rail terminal operations located in Bruderheim, Alberta. In the three and nine months ended September 30, 2016, we loaded an average of 15,186 barrels per day and 12,487 barrels per day, consisting of 20 and 45 unit trains, respectively.
Refinery Operations(1)
| | | | | | | | | | | | | | | | | | | | | | | | | | | | |
| | | Three Months Ended
September 30, | | | Nine Months Ended September 30, | |
| | | 2016 | | | | | | 2015 | | | | | | 2016 | | | | | | 2015 | |
| | | | | | | |
Crude Oil Capacity(Mbbls/d) | | | 460 | | | | | | | | 460 | | | | | | | | 460 | | | | | | | | 460 | |
Crude Oil Runs(Mbbls/d) | | | 463 | | | | | | | | 394 | | | | | | | | 452 | | | | | | | | 424 | |
Heavy Crude Oil | | | 241 | | | | | | | | 186 | | | | | | | | 237 | | | | | | | | 202 | |
Light/Medium | | | 222 | | | | | | | | 208 | | | | | | | | 215 | | | | | | | | 222 | |
Refined Products(Mbbls/d) | | | 494 | | | | | | | | 414 | | | | | | | | 479 | | | | | | | | 448 | |
Gasoline | | | 235 | | | | | | | | 208 | | | | | | | | 235 | | | | | | | | 228 | |
Distillate | | | 152 | | | | | | | | 131 | | | | | | | | 148 | | | | | | | | 141 | |
Other | | | 107 | | | | | | | | 75 | | | | | | | | 96 | | | | | | | | 79 | |
Crude Utilization(percent) | | | 101 | | | | | | | | 86 | | | | | | | | 98 | | | | | | | | 92 | |
| (1) | Represents 100 percent of the Wood River and Borger refinery operations. |
| | |
| Cenovus Energy Inc. | | Page 31 |
| Third Quarter 2016 Report | | Management’s Discussion and Analysis |
On a 100-percent basis, our refineries have total processing capacity of approximately 460,000 gross barrels per day of crude oil, including processing capability of up to 255,000 gross barrels per day of blended heavy crude oil. We also have processing capacity of 45,000 gross barrels per day of NGLs. The ability to process a wide slate of crude oils allows us to economically integrate our heavy crude oil production. Processing less expensive crude oil creates a feedstock cost advantage, illustrated by the discount of WCS relative to WTI. The amount of heavy crude oil processed, such as WCS and CDB, is dependent on the quality and quantity of available crude oil with the total input slate being optimized at each refinery to maximize economic benefit. Our crude utilization represents the percentage of total crude oil processed in our refineries relative to the total capacity.
Crude oil runs and refined product output increased in the third quarter of 2016 compared with 2015 due to consistent performance at the Wood River and Borger refineries. In September, unplanned maintenance was performed at the Borger refinery. As a result, a portion of the maintenance originally scheduled for October was started in the third quarter. In the third quarter of 2015, crude utilization was lower due to unplanned process unit outages at the Borger refinery for most of July and the start of a planned turnaround at the Wood River refinery.
On a year-to-date basis, crude oil runs and refined product output increased. Strong performance at both of the refineries was slightly offset by planned and unplanned maintenance at the Wood River and Borger refineries in the first quarter of 2016, and unplanned maintenance at the Borger refinery in September. In 2015, we experienced unplanned outages at the Borger refinery and planned turnarounds at both refineries. Higher heavy crude oil volumes were processed in 2016 primarily due to the optimization of our total crude input slate.
Financial Results
| | | | | | | | | | | | | | | | | | | | | | | | | | | | |
| | | Three Months Ended
September 30, | | | Nine Months Ended September 30, | |
| ($ millions) | | 2016 | | | | | | 2015 | | | | | | 2016 | | | | | | 2015 | |
| | | | | | | |
Revenues | | | 2,245 | | | | | | | | 2,242 | | | | | | | | 5,962 | | | | | | | | 6,775 | |
Purchased Product | | | 2,004 | | | | | | | | 2,012 | | | | | | | | 5,144 | | | | | | | | 5,826 | |
Gross Margin | | | 241 | | | | | | | | 230 | | | | | | | | 818 | | | | | | | | 949 | |
Expenses | | | | | | | | | | | | | | | | | | | | | | | | | | | | |
Operating(1) | | | 172 | | | | | | | | 214 | | | | | | | | 557 | | | | | | | | 551 | |
(Gain) Loss on Risk Management | | | 1 | | | | | | | | (14) | | | | | | | | 23 | | | | | | | | (27) | |
Operating Cash Flow | | | 68 | | | | | | | | 30 | | | | | | | | 238 | | | | | | | | 425 | |
Capital Investment | | | 51 | | | | | | | | 67 | | | | | | | | 156 | | | | | | | | 159 | |
Operating Cash Flow Net of Related Capital Investment | | | 17 | | | | | | | | (37) | | | | | | | | 82 | | | | | | | | 266 | |
| (1) | Employee long-term incentive costs in prior periods were reclassified from operating expenses to general and administrative costs to conform to the presentation adopted for the year ended December 31, 2015. |
Gross Margin
Our realized crack spreads are affected by many factors, such as the variety of feedstock crude oil, refinery configuration and the proportion of gasoline, distillate and secondary product output; the time lag between the purchase of crude oil feedstock and the processing of that crude oil through our refineries; and the cost of feedstock. Our feedstock costs are valued on a FIFO accounting basis.
In the three months ended September 30, 2016, our refining gross margin increased, compared with 2015, primarily due to wider heavy and medium crude oil differentials creating a feedstock cost advantage, and higher crude utilization rates by 15 percent. This was partially offset by lower average market crack spreads as a result of higher global refined product inventory and a narrower Brent-WTI differential.
In the nine months ended September 30, 2016, our refining gross margin declined primarily due to lower average market crack spreads. This was partially offset by:
| ● | | Wider heavy and medium crude oil differentials; |
| ● | | Higher utilization rates; |
| ● | | A weaker Canadian dollar relative to the U.S. dollar which had a positive impact of approximately $36 million on our refining gross margin; and |
| ● | | Improved margins on the sale of secondary products, such as coke, asphalt and sulfur, due to lower overall feedstock costs. |
Our refineries do not blend renewable fuels into the motor fuel products we produce. Consequently, we are obligated to purchase Renewable Identification Numbers (“RINs”). In the three and nine months ended September 30, 2016, the cost of our RINs were $80 million and $209 million, respectively (2015 – $27 million and $120 million, respectively). The increase is consistent with the ethanol RINs benchmark price which increased 130 percent and 40 percent in the three and nine months ended September 30, 2016, respectively.
Revenues fromthird-party crude oil and natural gas sales undertaken by the marketing group in the third quarter increased 41 percent from 2015. Higher purchased crude oil and natural gas volumes, and an increase in our crude oil sales price was partially offset by lower natural gas sales prices. On a year-to-date basis, revenues from third-party sales increased seven percent compared with 2015 due to higher purchased crude oil and natural gas volumes, partially offset by lower sales prices.
| | |
| Cenovus Energy Inc. | | Page 32 |
| Third Quarter 2016 Report | | Management’s Discussion and Analysis |
Operating Expense
Primary drivers of operating expenses in the third quarter of 2016 and on a year-to-date basis were labour, maintenance and utilities. Reported operating expenses declined in the third quarter primarily due to a decline in maintenance activities associated with fewer unplanned outages and planned turnarounds. On a year-to-date basis, operating expenses increased primarily due to the weakening of the Canadian dollar relative to the U.S. dollar, partially offset by a reduction in maintenance activities as a result of the consistent performance at both of our refineries, and a decline in utility costs.
Refining and Marketing – Capital Investment
| | | | | | | | | | | | | | | | | | | | | | | | | | |
| | | Three Months Ended
September 30, | | | | | | Nine Months Ended September 30, | |
| ($ millions) | | 2016 | | | | | | 2015 | | | | | | 2016 | | | | | 2015 | |
| | | | | | | |
Wood River Refinery | | | 33 | | | | | | | | 47 | | | | | | | | 108 | | | | | | 108 | |
Borger Refinery | | | 16 | | | | | | | | 19 | | | | | | | | 42 | | | | | | 49 | |
Marketing | | | 2 | | | | | | | | 1 | | | | | | | | 6 | | | | | | 2 | |
| | | 51 | | | | | | | | 67 | | | | | | | | 156 | | | | | | 159 | |
Capital expenditures in 2016 focused on the debottlenecking project at Wood River, capital maintenance, projects to improve our refinery reliability and safety, and environmental initiatives. In the third quarter of 2016, the Wood River debottlenecking project was successfully completed. As a result, our blended heavy crude oil processing capability has increased by 18,000 gross barrels per day. The amount of heavy crude oil processed continues to be dependent on the optimization of our total input slate.
In 2016, we expect to invest between $230 million and $255 million mainly related to maintenance, reliability and environmental initiatives, as well as the debottlenecking project at Wood River.
DD&A
Refining and the crude-by-rail terminal assets are depreciated on a straight-line basis over the estimated service life of each component of the facilities, which range from three to 40 years. The service lives of these assets are reviewed on an annual basis. Refining and Marketing DD&A increased by $3 million in the third quarter of 2016 and $17 million on a year-to-date basis, primarily due to the change in the U.S./Canadian dollar exchange rate.
CORPORATE AND ELIMINATIONS
The Corporate and Eliminations segment includes intersegment eliminations relating to transactions that have been recorded at transfer prices based on current market prices, as well as unrealized intersegment profits in inventory. The gains and losses on risk management represent the unrealized mark-to-market gains and losses related to derivative financial instruments used to mitigate fluctuations in commodity prices, and the unrealizedmark-to-market gains and losses on the power purchase contract and interest rate swaps. In the third quarter of 2016, our risk management activities resulted in $7 million of unrealized losses (2015 – unrealized gains of $127 million). On a year-to-date basis, we had $440 million of unrealized losses (2015 – $169 million). The Corporate and Eliminations segment also includes Cenovus-wide costs for general and administrative, financing and research costs.
| | | | | | | | | | | | | | | | | | | | | | | | | | | | |
| | | Three Months Ended September 30, | | | Nine Months Ended September 30, | |
| ($ millions) | | 2016 | | | | | | 2015 | | | | | | 2016 | | | | | | 2015 | |
| | | | | | | |
General and Administrative(1) | | | 71 | | | | | | | | 78 | | | | | | | | 225 | | | | | | | | 226 | |
Finance Costs | | | 122 | | | | | | | | 122 | | | | | | | | 368 | | | | | | | | 359 | |
Interest Income | | | (27 | ) | | | | | | | (6 | ) | | | | | | | (45 | ) | | | | | | | (20 | ) |
Foreign Exchange (Gain) Loss, Net | | | 45 | | | | | | | | 417 | | | | | | | | (338 | ) | | | | | | | 832 | |
Research Costs | | | 5 | | | | | | | | 6 | | | | | | | | 30 | | | | | | | | 20 | |
(Gain) Loss on Divestiture of Assets | | | 5 | | | | | | | | (2,379 | ) | | | | | | | 6 | | | | | | | | (2,395 | ) |
Other (Income) Loss, Net | | | 5 | | | | | | | | (1 | ) | | | | | | | 7 | | | | | | | | 1 | |
| | | 226 | | | | | | | | (1,763 | ) | | | | | | | 253 | | | | | | | | (977 | ) |
| (1) | Employee long-term incentive costs in prior periods were reclassified from operating expenses to general and administrative costs to conform to the presentation adopted for the year ended December 31, 2015. |
Expenses
General and Administrative
Primary drivers of our general and administrative expenses in 2016 were workforce, office rent and information technology costs. General and administrative expenses decreased in the third quarter and on a year-to-date basis by $7 million and $1 million, respectively. Savings from workforce reductions, lower information technology costs and reduced discretionary spending were partially offset by severance costs recorded in the second quarter of 2016 related to the workforce reductions implemented in April 2016. Additionally, on a year-to-date basis a non-cash expense of $31 million was recorded in connection with certain Calgary office space in excess of Cenovus’s current and near-term requirements.
| | |
| Cenovus Energy Inc. | | Page 33 |
| Third Quarter 2016 Report | | Management’s Discussion and Analysis |
Finance Costs
Finance costs include interest expense on our long-term debt and short-term borrowings as well as the unwinding of the discount on decommissioning liabilities. Finance costs remained consistent in the third quarter and increased by $9 million on a year-to-date basis, compared with 2015. The Canadian dollar relative to the U.S. dollar remained relatively consistent in the third quarter of 2016 compared with 2015 and weakened on a year-to-date basis which increased reported interest expense on our U.S. dollar denominated debt.
The weighted average interest rate on outstanding debt for the three and nine months ended September 30, 2016 was 5.3 percent (2015 – 5.3 percent).
Foreign Exchange
| | | | | | | | | | | | | | | | | | | | | | | | | | | | |
| | | Three Months Ended
September 30, | | | Nine Months Ended September 30, | |
| ($ millions) | | 2016 | | | | | | 2015 | | | | | | 2016 | | | | | | 2015 | |
| | | | | | | |
Unrealized Foreign Exchange (Gain) Loss | | | 50 | | | | | | | | 457 | | | | | | | | (341 | ) | | | | | | | 878 | |
Realized Foreign Exchange (Gain) Loss | | | (5 | ) | | | | | | | (40 | ) | | | | | | | 3 | | | | | | | | (46 | ) |
| | | 45 | | | | | | | | 417 | | | | | | | | (338 | ) | | | | | | | 832 | |
The majority of unrealized foreign exchange gains on a year-to-date basis resulted from the translation of our U.S. dollar denominated debt. The Canadian dollar, relative to the U.S. dollar, at September 30, 2016 was slightly weaker compared with June 30, 2016, resulting in unrealized losses of $50 million in the third quarter. The Canadian dollar, relative to the U.S. dollar, strengthened by five percent from December 31, 2015 to September 30, 2016 resulting in year-to-date unrealized gains of $341 million.
DD&A
Corporate and Eliminations DD&A includes provisions in respect of corporate assets, such as computer equipment, leasehold improvements and office furniture. Costs associated with corporate assets are depreciated on astraight-line basis over the estimated service life of the assets, which range from three to 25 years. The service lives of these assets are reviewed on an annual basis. DD&A in the third quarter was $14 million (2015 – $20 million) and $50 million on a year-to-date basis (2015 – $62 million).
Income Tax
| | | | | | | | | | | | | | | | | | | | | | | | |
| | | Three Months Ended
September 30, | | | | | Nine Months Ended September 30, | |
| ($ millions) | | 2016 | | | | | 2015 | | | | | 2016 | | | | | | 2015 | |
| | | | | | | |
Current Tax | | | | | | | | | | | | | | | | | | | | | | | | |
Canada | | | (44 | ) | | | | | 451 | | | | | | (101 | ) | | | | | | | 686 | |
U.S. | | | - | | | | | | (4 | ) | | | | | 1 | | | | | | | | (10 | ) |
Total Current Tax Expense (Recovery) | | | (44 | ) | | | | | 447 | | | | | | (100 | ) | | | | | | | 676 | |
Deferred Tax Expense (Recovery) | | | (111 | ) | | | | | (228 | ) | | | | | (353 | ) | | | | | | | (516 | ) |
| | | (155 | ) | | | | | 219 | | | | | | (453 | ) | | | | | | | 160 | |
The following table reconciles income taxes calculated at the Canadian statutory rate with the recorded income taxes: | |
| | | | | | | | | | | | | Nine Months Ended September 30, | |
| ($ millions) | | | | | | | | | | | | 2016 | | | | | | 2015 | |
| | | | | | | |
Earnings (Loss) Before Income Tax | | | | | | | | | | | | | | | (1,089 | ) | | | | | | | 1,419 | |
Canadian Statutory Rate | | | | | | | | | | | | | | | 27.0% | | | | | | | | 26.1% | |
Expected Income Tax (Recovery) | | | | | | | | | | | | | | | (294 | ) | | | | | | | 370 | |
Effect of Taxes Resulting From: | | | | | | | | | | | | | | | | | | | | | | | | |
Foreign Tax Rate Differential | | | | | | | | | | | | | | | (38 | ) | | | | | | | (15 | ) |
Non-Deductible Stock-Based Compensation | | | | | | | | | | | | | | | 6 | | | | | | | | 7 | |
Non-Taxable Capital (Gains) Losses | | | | | | | | | | | | | | | (46 | ) | | | | | | | 113 | |
Unrecognized Capital (Gains) Losses Arising From Unrealized Foreign Exchange | | | | | | | | | | | | | | | (46 | ) | | | | | | | 113 | |
Adjustments Arising From Prior Year Tax Filings | | | | | | | | | | | | | | | (48 | ) | | | | | | | (13 | ) |
Recognition of Capital Losses | | | | | | | | | | | | | | | - | | | | | | | | (149 | ) |
Recognition of U.S. Tax Basis | | | | | | | | | | | | | | | - | | | | | | | | (385 | ) |
Change in Statutory Rate | | | | | | | | | | | | | | | - | | | | | | | | 158 | |
Other | | | | | | | | | | | | | | | 13 | | | | | | | | (39 | ) |
Total Tax (Recovery) | | | | | | | | | | | | | | | (453 | ) | | | | | | | 160 | |
Effective Tax Rate | | | | | | | | | | | | | | | 41.6% | | | | | | | | 11.3% | |
| | |
| Cenovus Energy Inc. | | Page 34 |
| Third Quarter 2016 Report | | Management’s Discussion and Analysis |
Tax interpretations, regulations and legislation in the various jurisdictions in which Cenovus and its subsidiaries operate are subject to change. We believe that our provision for income taxes is adequate. There are usually a number of tax matters under review and as a result, income taxes are subject to measurement uncertainty. The timing of the recognition of income and deductions for the purpose of current tax expense is determined by relevant tax legislation.
In the three and nine months ended September 30, 2016, we incurred losses for income tax purposes which will be carried back to recover income taxes previously paid in Canada or recognized as a deferred tax recovery. In the third quarter of 2016, a current income tax recovery was recognized related to prior year adjustments. In the third quarter of 2015, current income tax expense included $391 million attributable to the sale of our royalty interest and mineral fee title lands.
In the three and nine months ended September 30, 2016, a deferred tax recovery was recorded. The recovery was largely due to unrealized risk management losses and the recognition of current year operating losses that will be claimed in a future period. In the third quarter of 2015, we recorded a deferred tax recovery of $385 million arising from an adjustment to the tax basis of our refining assets. In addition, a one-time charge of approximately $158 million was recorded in 2015 from the revaluation of our deferred tax liability due to the increase in the Alberta corporate tax rate.
Our effective tax rate is a function of the relationship between total tax expense (recovery) and the amount of earnings (loss) before income taxes. The effective tax rate differs from the statutory tax rate as it reflects higher U.S. tax rates, non-taxable unrealized foreign exchange (gains) losses, permanent differences, adjustments for changes in tax rates and other tax legislation, variations in the estimate of reserves and differences between the provision and the actual amounts subsequently reported on the tax returns.
LIQUIDITY AND CAPITAL RESOURCES
| | | | | | | | | | | | | | | | | | | | | | | | | | | | | | |
| | | | | Three Months Ended September 30, | | | | | | Nine Months Ended September 30, | |
| ($ millions) | | | | 2016 | | | | | | 2015 | | | | | | 2016 | | | | | | 2015 | |
| | | | | | | | |
Net Cash From (Used In) | | | | | | | | | | | | | | | | | | | | | | | | | | | | | | |
Operating Activities | | | | | 310 | | | | | | | | 542 | | | | | | | | 697 | | | | | | | | 1,152 | |
Investing Activities | | | | | (196 | ) | | | | | | | 2,424 | | | | | | | | (835 | ) | | | | | | | 1,357 | |
Net Cash Provided (Used) Before Financing Activities | | | | | 114 | | | | | | | | 2,966 | | | | | | | | (138 | ) | | | | | | | 2,509 | |
Financing Activities | | | | | (41 | ) | | | | | | | (134 | ) | | | | | | | (125 | ) | | | | | | | 1,032 | |
Foreign Exchange Gain (Loss) on Cash and Cash Equivalents Held in Foreign Currency | | | | | (3 | ) | | | | | | | (21 | ) | | | | | | | 8 | | | | | | | | (23 | ) |
Increase (Decrease) in Cash and Cash Equivalents | | | | | 70 | | | | | | | | 2,811 | | | | | | | | (255 | ) | | | | | | | 3,518 | |
| | | | | |
| ($ millions) | | | | | | | September 30, 2016 | | | | | | December 31,
2015 | |
Cash and Cash Equivalents | | | | | | | | | | | | | | | | | | | | | 3,850 | | | | | | | | 4,105 | |
Committed and Undrawn Credit Facilities | | | | | | | | | | | | | | | | | | | | | 4,000 | | | | | | | | 4,000 | |
Operating Activities
Cash from operating activities decreased for the three and nine months ended September 30, 2016 mainly due to lower Cash Flow, as discussed in the Financial Results section of this MD&A. Excluding risk management assets and liabilities, working capital was $4,283 million at September 30, 2016 compared with $4,337 million at December 31, 2015.
We anticipate that we will continue to meet our payment obligations as they come due.
Investing Activities
Capital investment declined in the current quarter and on a year-to-date basis primarily due to spending reductions in response to the low commodity price environment. In 2015, cash from investing activities included proceeds of approximately $2.9 billion, net of tax, from the divestiture of our royalty interest and mineral fee title lands business.
Financing Activities
Cash used in financing activities decreased in the third quarter of 2016 as we paid dividends of $0.05 per share or $41 million (2015 – $0.16 per share or $133 million).
On a year-to-date basis, we paid dividends of $0.15 per share or $124 million (2015 – $0.6924 per share or $578 million, of which $396 million was paid in cash). In the nine months ended September 30, 2015, cash from financing activities included net proceeds of $1.4 billion from the issuance of common shares which was partially offset by a net repayment of short-term borrowings.
| | |
| Cenovus Energy Inc. | | Page 35 |
| Third Quarter 2016 Report | | Management’s Discussion and Analysis |
Our long-term debt at September 30, 2016 was $6,184 million (December 31, 2015 – $6,525 million) with no principal payments due until October 2019 (US$1.3 billion). The principal amount of long-term debt outstanding in U.S. dollars has remained unchanged since August 2012. The $341 million decrease in long-term debt is due to strengthening of the Canadian dollar relative to the U.S. dollar.
As at September 30, 2016, we were in compliance with all of the terms of our debt agreements.
Available Sources of Liquidity
We expect cash flow from our crude oil, natural gas and refining operations to fund a portion of our cash requirements. Any potential shortfalls may be required to be funded through prudent use of our balance sheet capacity, management of our asset portfolio and other corporate and financial opportunities that may be available to us.
The following sources of liquidity are available:
| | | | | | | | | | | | | | |
| ($ millions) | | | | | Amount | | | | | Term | |
| | | | |
Cash and Cash Equivalents | | | | | | | 3,850 | | | | | | N/A | |
Committed Credit Facility | | | | | | | 1,000 | | | | | | April 2019 | |
Committed Credit Facility | | | | | | | 3,000 | | | | | | November 2019 | |
U.S. Base Shelf Prospectus(1) | | | | | | US$ | 5,000 | | | | | | March 2018 | |
| (1) | Availability is subject to market conditions. |
Committed Credit Facility
We have a $4.0 billion committed credit facility, with $1.0 billion maturing on April 30, 2019 and $3.0 billion maturing on November 30, 2019. As at September 30, 2016, no amounts are drawn on our committed credit facilities.
Under the committed credit facility, Cenovus is required to maintain a debt to capitalization ratio not to exceed 65 percent; we are well below this limit.
Base Shelf Prospectus
Cenovus filed a base shelf prospectus in 2016. The base shelf prospectus allows us to offer, from time to time, up to US$5.0 billion, or the equivalent in other currencies, of debt securities, common shares, preferred shares, subscription receipts, warrants, share purchase contracts and units in Canada, the U.S. and elsewhere where permitted by law. The base shelf prospectus will expire in March 2018.
As at September 30, 2016, there were no issuances under the prospectus.
Financial Metrics
We monitor our capital structure and financing requirements using, among other things, non-GAAP financial metrics consisting of Debt to Capitalization and Debt to Adjusted EBITDA. We define our non-GAAP measure of Debt as short-term borrowings and the current and long-term portions of long-term debt. We define Capitalization as Debt plus Shareholders’ Equity. We define Adjusted EBITDA as earnings before finance costs, interest income, income tax expense, DD&A, goodwill and asset impairments, unrealized gains (losses) on risk management, foreign exchange gains (losses), gains (losses) on divestiture of assets and other income (loss), net, calculated on a trailing twelve-month basis. These metrics are used to steward our overall debt position and as measures of our overall financial strength. Refer to Note 17 of the interim Consolidated Financial Statements for more details on the calculation of our financial metrics.
| | | | | | | | | | | | |
| As at | | September 30,
2016 | | | | | | December 31,
2015 | |
| | | |
Net Debt to Capitalization(1) (2) | | | 17% | | | | | | | | 16% | |
Debt to Capitalization | | | 35% | | | | | | | | 34% | |
Net Debt to Adjusted EBITDA(1) | | | 2.0x | | | | | | | | 1.2x | |
Debt to Adjusted EBITDA | | | 5.3x | | | | | | | | 3.1x | |
| (1) | Net Debt is defined as Debt net of Cash and Cash Equivalents. |
| (2) | Net Debt to Capitalization is defined as Net Debt divided by Net Debt plus Shareholders’ Equity. |
Over the long-term, we target a Debt to Capitalization ratio of between 30 percent to 40 percent and a Debt to Adjusted EBITDA of between 1.0 time to 2.0 times. At different points within the economic cycle, we expect these ratios may periodically be outside of the target range.
Debt to Capitalization remained fairly consistent as the lower long-term debt balance, from the strengthening of the Canadian dollar relative to the U.S. dollar, was offset by the decrease in Shareholders’ Equity. Debt to Adjusted EBITDA increased as a result of a decrease in Adjusted EBITDA, primarily due to a decline in Cash Flow from a reduction in commodity prices, partially offset by the lower long-term debt balance.
| | |
| Cenovus Energy Inc. | | Page 36 |
| Third Quarter 2016 Report | | Management’s Discussion and Analysis |
Share Capital and Stock-Based Compensation Plans
As part of our long-term incentive program, Cenovus has an employee Stock Option Plan as well as Performance Share Unit (“PSU”) Plan, a Restricted Share Unit (“RSU”) Plan and two Deferred Share Unit (“DSU”) Plans. Refer to Note 16 of the interim Consolidated Financial Statements for more details on our Stock Option Plan and our PSU, RSU and DSU Plans.
| | | | | | | | | | |
| As at September 30, 2016 | | Units Outstanding (thousands) | | | | | Units Exercisable (thousands) | |
| | | |
Common Shares | | | 833,290 | | | | | | N/A | |
Stock Options | | | 45,327 | | | | | | 33,419 | |
Other Stock-Based Compensation Plans | | | 11,560 | | | | | | 1,588 | |
Contractual Obligations and Commitments
We have entered into various commitments in the normal course of operations primarily related to demand charges on firm transportation agreements and operating leases on buildings. In addition, we have commitments related to our risk management program and an obligation to fund our defined benefit pension and other post-employment benefit plans. For further information, see the notes to the Consolidated Financial Statements.
In 2016, net transportation commitments declined by approximately $1.5 billion primarily due to a net decrease in toll estimates. These agreements, some of which are subject to regulatory approval, are for terms up to 20 years subsequent to the date of commencement, and should help align our future transportation requirements with our anticipated production growth. As at September 30, 2016, total transportation commitments were $26 billion.
As at September 30, 2016, there were outstanding letters of credit aggregating $275 million issued as security for performance under certain contracts (December 31, 2015 – $64 million).
Legal Proceedings
We are involved in a limited number of legal claims associated with the normal course of operations and we believe we have made adequate provisions for such claims. There are no individually or collectively significant claims.
RISK MANAGEMENT
For a full understanding of the risks that impact Cenovus, the following discussion should be read in conjunction with the Risk Management sections of our 2015 annual MD&A and first and second quarters 2016 MD&A. A description of the risk factors and uncertainties affecting Cenovus can be found in the Advisory and a full discussion of the material risk factors affecting Cenovus can be found in our AIF for the year ended December 31, 2015, together with the updates provided in each of our first and second quarter 2016 MD&As.
Cenovus is exposed to a number of risks through the pursuit of our strategic objectives. Some of these risks impact the oil and gas industry as a whole and others are unique to our operations. Actively managing these risks improves our ability to effectively execute our business strategy. We continue to be exposed to the risks identified in our 2015 annual MD&A and AIF.
The following provides an update on our risks.
Federal Carbon Tax
In October 2016, the Canadian federal government announced a new national carbon pricing regime (the “Carbon Strategy”) in response to the Paris Agreement that was ratified by Canada and other nations in October 2016. Under the Carbon Strategy, the federal government is proposing a benchmark carbon pricing program that includes, at a minimum, a price on carbon emissions of $10 per tonne in 2018, rising by $10 per tonne each year to $50 per tonne in 2022. The Carbon Strategy also proposes a federal backstop in the event that jurisdictions fail to meet the benchmark. Alberta has already established a carbon pricing system that was referenced in the federal announcement; therefore, in the short-term, the national price on carbon will likely have little additional impact.
Additional details of the Carbon Strategy are expected to be finalized in the coming months, and further legislation and regulation is expected from the provinces. At this time, Cenovus is unable to predict the impact of the Paris Agreement and the Carbon Strategy on its operations. It is possible that mandatory emissions reduction requirements may have a material adverse effect on Cenovus’s financial condition, results of operations and cash flow. For more information on the risks to Cenovus related to the effects of climate change see our most recently filed AIF under “Risk Factors – Environment & Regulatory Risks – Climate Change”, available on SEDAR at sedar.com, EDGAR at sec.gov and on our website at cenovus.com.
Commodity Price Risk
Fluctuations in commodity prices and refined product prices impacts our financial condition, results of operations, cash flows, growth, access to capital and cost of borrowing.
| | |
| Cenovus Energy Inc. | | Page 37 |
| Third Quarter 2016 Report | | Management’s Discussion and Analysis |
We partially mitigate our exposure to commodity price risk through the integration of our business, financial instruments, physical contracts and market access commitments. Financial instruments undertaken within our refining business by the operator, Phillips 66, are primarily for purchased product. For details of our financial instruments, including classification, assumptions made in the calculation of fair value and additional discussion on exposure of risks and the management of those risks, see Notes 18 and 19 to the interim Consolidated Financial Statements.
Impact of Financial Risk Management Activities
| | | | | | | | | | | | | | | | | | | | | | | | | | | | |
| | | Three Months Ended September 30, | |
| | | 2016 | | | | | | 2015 | |
| ($ millions) | | Realized | | | Unrealized | | | Total | | | | | | Realized | | | Unrealized | | | Total | |
| | | | | | | |
Crude Oil | | | (42 | ) | | | (5 | ) | | | (47 | ) | | | | | | | (195 | ) | | | (141 | ) | | | (336 | ) |
Natural Gas | | | – | | | | – | | | | – | | | | | | | | (15 | ) | | | 15 | | | | – | |
Refining | | | 1 | | | | – | | | | 1 | | | | | | | | (14 | ) | | | (7 | ) | | | (21 | ) |
Power(1) | | | – | | | | – | | | | – | | | | | | | | 4 | | | | 6 | | | | 10 | |
Interest Rate | | | – | | | | 12 | | | | 12 | | | | | | | | – | | | | – | | | | – | |
(Gain) Loss on Risk Management | | | (41 | ) | | | 7 | | | | (34 | ) | | | | | | | (220 | ) | | | (127 | ) | | | (347 | ) |
Income Tax Expense (Recovery) | | | 11 | | | | (2 | ) | | | 9 | | | | | | | | 59 | | | | 34 | | | | 93 | |
(Gain) Loss on Risk Management, After Tax | | | (30 | ) | | | 5 | | | | (25 | ) | | | | | | | (161 | ) | | | (93 | ) | | | (254 | ) |
| | | Nine Months Ended September 30, | |
| | | 2016 | | | | | | 2015 | |
| ($ millions) | | Realized | | | Unrealized | | | Total | | | | | | Realized | | | Unrealized | | | Total | |
| | | | | | | |
Crude Oil | | | (198 | ) | | | 359 | | | | 161 | | | | | | | | (355 | ) | | | 120 | | | | (235 | ) |
Natural Gas | | | – | | | | – | | | | – | | | | | | | | (43 | ) | | | 41 | | | | (2 | ) |
Refining | | | (4 | ) | | | 4 | | | | – | | | | | | | | (26 | ) | | | 5 | | | | (21 | ) |
Power(1) | | | 3 | | | | (14 | ) | | | (11 | ) | | | | | | | 7 | | | | 3 | | | | 10 | |
Interest Rate | | | – | | | | 91 | | | | 91 | | | | | | | | – | | | | – | | | | – | |
(Gain) Loss on Risk Management | | | (199 | ) | | | 440 | | | | 241 | | | | | | | | (417 | ) | | | 169 | | | | (248 | ) |
Income Tax Expense (Recovery) | | | 52 | | | | (120 | ) | | | (68 | ) | | | | | | | 112 | | | | (48 | ) | | | 64 | |
(Gain) Loss on Risk Management, After Tax | | | (147 | ) | | | 320 | | | | 173 | | | | | | | | (305 | ) | | | 121 | | | | (184 | ) |
| (1) | The power contracts were effectively terminated on March 7, 2016. Recent litigation between third parties has caused some uncertainty regarding termination of the contracts. Any related liability or asset to Cenovus is not determinable at this time. |
In the third quarter of 2016 and on a year-to-date basis, we incurred realized gains on crude oil risk management activities, consistent with our contract prices exceeding the average benchmark price. Unrealized gains were recorded on our crude oil financial instruments in the three months ended September 30, 2016, as a result of changes to market prices. On a year-to-date basis, we recorded unrealized losses primarily due to changes in market prices and the realization of settled positions.
Unrealized losses were recorded on our interest rate hedge positions due to decreases in benchmark interest rates.
Risks Associated With Derivative Financial Instruments
Financial instruments expose Cenovus to the risk that a counterparty will default on its contractual obligations. This risk is partially mitigated through credit exposure limits, frequent assessment of counterparty credit ratings and netting arrangements, as outlined in our Credit Policy.
Financial instruments also expose Cenovus to the risk of a loss from adverse changes in the market value of financial instruments or if we are unable to fulfill our delivery obligations related to the underlying physical transaction. Financial instruments may limit the benefit to Cenovus of commodity price increases. These risks are minimized through hedging limits that are reviewed annually by the Board, as required by our Market Risk Mitigation Policy.
CRITICAL ACCOUNTING JUDGMENTS, ESTIMATES AND ACCOUNTING POLICIES
Management is required to make estimates and assumptions, and use judgment in the application of accounting policies that could have a significant impact on our financial results. Actual results may differ from estimates and those differences may be material. The estimates and assumptions used are subject to updates based on experience and the application of new information. Our critical accounting policies and estimates are reviewed annually by the Audit Committee of the Board. Further details on the basis of preparation and our significant accounting policies can be found in the notes to the Consolidated Financial Statements and annual MD&A for the year ended December 31, 2015.
| | |
| Cenovus Energy Inc. | | Page 38 |
| Third Quarter 2016 Report | | Management’s Discussion and Analysis |
Critical Judgments in Applying Accounting Policies
Critical judgments are those judgments made by Management in the process of applying accounting policies that have the most significant effect on the amounts recorded in our annual and interim Consolidated Financial Statements. There have been no changes to our critical judgments used in applying accounting policies during the nine months ended September 30, 2016. Further information can be found in the notes to the Consolidated Financial Statements and annual MD&A for the year ended December 31, 2015.
Key Sources of Estimation Uncertainty
Critical accounting estimates are those estimates that require Management to make particularly subjective or complex judgments about matters that are inherently uncertain. Estimates and underlying assumptions are reviewed on an ongoing basis and any revisions to accounting estimates are recorded in the period in which the estimates are revised.
Changes in Accounting Policies
There were no new or amended accounting standards or interpretations adopted during the nine months ended September 30, 2016.
Future Accounting Pronouncements
A description of additional accounting standards and interpretations that will be adopted in future periods can be found in the notes to the annual Consolidated Financial Statements for the year ended December 31, 2015.
CONTROL ENVIRONMENT
There have been no changes to internal control over financial reporting (“ICFR”) during the three months ended September 30, 2016 that have materially affected, or are reasonably likely to materially affect, ICFR.
Internal control systems, no matter how well designed, have inherent limitations. Therefore, even those systems determined to be effective can provide only reasonable assurance with respect to financial statement preparation and presentation. Also, projections of any evaluation of effectiveness to future periods are subject to the risk that controls may become inadequate because of changes in conditions, or that the degree of compliance with the policies or procedures may deteriorate.
OUTLOOK
We anticipate ongoing price volatility for the foreseeable future and accordingly we continue to be prudent in how we allocate capital and manage the pace at which we choose to invest. Additional confidence in commodity prices, our ability to sustain cost reductions as well as fiscal and regulatory certainty are required before we will consider further expansion of existing projects or developing emerging opportunities. We will commit to project reactivation only if we believe it does not undermine the strength of our balance sheet.
The following outlook commentary is focused on the next twelve months.
Commodity Prices Underlying our Financial Results
Our crude oil pricing outlook is influenced by the following:
| | |
● | | We expect the general outlook for crude oil prices will be tied primarily to the supply response to the current price environment, compliance of OPEC members with the plan to reduce production, the impact of supply disruptions and the pace of growth in global demand as influenced by macro-economic events. Overall, we expect crude oil price volatility and a modest price improvement in the next twelve months. |
● | | We anticipate the Brent-WTI differential to remain narrow now that the U.S. is exporting crude oil to overseas markets. Overall, the differential will likely be set by transportation costs; and |
● | | We expect that the WTI-WCS differential will widen due to increasing heavy oil production in Alberta. |
Crude Oil Benchmarks
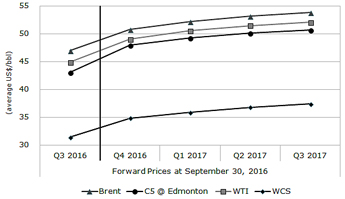
| | |
| Cenovus Energy Inc. | | Page 39 |
| Third Quarter 2016 Report | | Management’s Discussion and Analysis |
Refining 3-2-1 Crack Spread Benchmarks
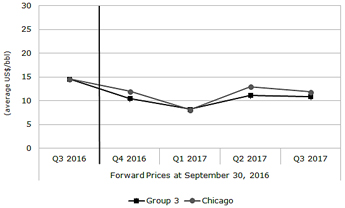
Foreign Exchange
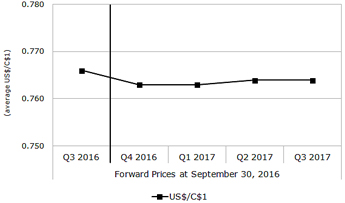
U.S. refining crack spreads are expected to follow historical seasonal patterns over the next twelve months and will be impacted by the rebalancing of crude product markets. Overall, we expect 3-2-1 crack spreads to be influenced by the pace of inventory draws, which will be influenced by product demand strength.
Natural gas prices are anticipated to improve in the next twelve months due to lower supply growth and stronger demand growth, although price escalation is constrained by coal-to-gas substitution in the power sector.
We expect the Canadian dollar to continue to be tied with crude oil prices, tempered by differing interest rate expectations between Canada and the U.S. Overall, ignoring the change in oil price, a weaker Canadian dollar is expected to have a positive impact on our revenues and Operating Cash Flow.
Our exposure to the light/heavy price differentials is composed of both a global light/heavy component as well as a transportation cost component. While we expect to see volatility in crude oil prices, we mitigate our exposure to light/heavy price differentials through the following:
| ● | | Integration – having heavy oil refining capacity capable of processing Canadian heavy oil. From a value perspective, our refining business positions us to capture value from both the WTI-WCS differential for Canadian crude oil and the Brent-WTI differential from the sale of refined products; |
| ● | | Financial hedge transactions – limiting the impact of fluctuations in upstream crude oil prices by entering into financial transactions that fix the WTI-WCS differential; |
| ● | | Marketing arrangements – limiting the impact of fluctuations in upstream crude oil prices by entering into physical supply transactions with fixed price components directly with refiners; and |
| ● | | Transportation commitments and arrangements – supporting transportation projects that move crude oil from our production areas to consuming markets and also to tidewater markets. |
Key Priorities for 2016
Maintain Financial Resilience
Maintaining our financial resilience, while maintaining safe operations, continues to be our top priority. At September 30, 2016, we had $3.9 billion of cash on hand and $4.0 billion of undrawn capacity under our committed credit facility. Our debt has a weighted average maturity of approximately 15 years, with no debt maturing until the fourth quarter of 2019. Although we have a strong balance sheet, we have undertaken additional measures in 2016 to remain financially resilient, including reductions in capital, operating and general and administrative costs.
Attack Cost Structures
We will continue to focus on reducing our cost structure. We have met our target of reducing our planned 2016 capital, operating, general and administrative spending by approximately $500 million, relative to our original 2016 budget released in December 2015. We will continue to ensure that, over the long term, we maintain an efficient and sustainable cost structure, and maximize the strengths of our functional business model.
Operational Excellence
We are focused on executing our work programs safely, responsibly and efficiently through standardized processes, procedures and controls. We use a manufacturing approach to optimize value, manage risk and improve performance. We are focused on reducing the environmental impact of our operations and engaging with people and communities who may be affected by our operations in a transparent, timely and respectful way.
| | |
| Cenovus Energy Inc. | | Page 40 |
| Third Quarter 2016 Report | | Management’s Discussion and Analysis |
CONSOLIDATED STATEMENTS OF EARNINGS (LOSS) (unaudited)
For the periods ended September 30,
($ millions, except per share amounts)
| | | | | | | | | | | | | | | | | | | | | | | | | | | | | | | | |
| | | | | | | | Three Months Ended | | | Nine Months Ended |
| | | Notes | | | | | 2016 | | | | | | 2015 | | | | | | 2016 | | | | | | 2015 |
| | | | | | | | | |
Revenues | | | 1 | | | | | | | | | | | | | | | | | | | | | | | | | | | | | |
Gross Sales | | | | | | | | | 3,279 | | | | | | | | 3,308 | | | | | | | | 8,587 | | | | | | | 10,252 |
Less: Royalties | | | | | | | | | 39 | | | | | | | | 35 | | | | | | | | 95 | | | | | | | 112 |
| | | | | | | | | 3,240 | | | | | | | | 3,273 | | | | | | | | 8,492 | | | | | | | 10,140 |
Expenses | | | 1 | | | | | | | | | | | | | | | | | | | | | | | | | | | | | |
Purchased Product | | | | | | | | | 1,917 | | | | | | | | 1,926 | | | | | | | | 4,903 | | | | | | | 5,566 |
Transportation and Blending | | | | | | | | | 472 | | | | | | | | 483 | | | | | | | | 1,360 | | | | | | | 1,509 |
Operating | | | | | | | | | 401 | | | | | | | | 476 | | | | | | | | 1,244 | | | | | | | 1,379 |
Production and Mineral Taxes | | | | | | | | | 4 | | | | | | | | 5 | | | | | | | | 9 | | | | | | | 16 |
(Gain) Loss on Risk Management | | | 18 | | | | | | (34) | | | | | | | | (347) | | | | | | | | 241 | | | | | | | (248) |
Depreciation, Depletion and Amortization | | | 6,10 | | | | | | 659 | | | | | | | | 473 | | | | | | | | 1,569 | | | | | | | 1,455 |
Exploration Expense | | | 6,9 | | | | | | 1 | | | | | | | | - | | | | | | | | 2 | | | | | | | 21 |
General and Administrative | | | | | | | | | 71 | | | | | | | | 78 | | | | | | | | 225 | | | | | | | 226 |
Finance Costs | | | 3 | | | | | | 122 | | | | | | | | 122 | | | | | | | | 368 | | | | | | | 359 |
Interest Income | | | | | | | | | (27) | | | | | | | | (6) | | | | | | | | (45) | | | | | | | (20) |
Foreign Exchange (Gain) Loss, Net | | | 4 | | | | | | 45 | | | | | | | | 417 | | | | | | | | (338) | | | | | | | 832 |
Research Costs | | | | | | | | | 5 | | | | | | | | 6 | | | | | | | | 30 | | | | | | | 20 |
(Gain) Loss on Divestiture of Assets | | | 5 | | | | | | 5 | | | | | | | | (2,379) | | | | | | | | 6 | | | | | | | (2,395) |
Other (Income) Loss, Net | | | | | | | | | 5 | | | | | | | | (1) | | | | | | | | 7 | | | | | | | 1 |
Earnings (Loss) Before Income Tax | | | | | | | | | (406) | | | | | | | | 2,020 | | | | | | | | (1,089) | | | | | | | 1,419 |
Income Tax Expense (Recovery) | | | 7 | | | | | | (155) | | | | | | | | 219 | | | | | | | | (453) | | | | | | | 160 |
Net Earnings (Loss) | | | | | | | | | (251) | | | | | | | | 1,801 | | | | | | | | (636) | | | | | | | 1,259 |
| | | | | | | | | |
Net Earnings (Loss) Per Share($) | | | 8 | | | | | | | | | | | | | | | | | | | | | | | | | | | | | |
Basic and Diluted | | | | | | | | | (0.30) | | | | | | | | 2.16 | | | | | | | | (0.76) | | | | | | | 1.55 |
| |
See accompanying Notes to Consolidated Financial Statements (unaudited). CONSOLIDATED STATEMENTS OF COMPREHENSIVE INCOME (LOSS)(unaudited) For the periods ended September 30, ($ millions) |
| | | | | | | | Three Months Ended | | | Nine Months Ended |
| | | | | | | | 2016 | | | | | | 2015 | | | | | | 2016 | | | | | | 2015 |
| | | | | | | | | |
Net Earnings (Loss) | | | | | | | | | (251) | | | | | | | | 1,801 | | | | | | | | (636) | | | | | | | 1,259 |
Other Comprehensive Income (Loss), Net of Tax | | | | | | | | | | | | | | | | | | | | | | | | | | | | | | | | |
Items That Will Not be Reclassified to Profit or Loss: | | | | | | | | | | | | | | | | | | | | | | | | | | | | | | | | |
Actuarial Gain (Loss) Relating to Pension and Other Post-Retirement Benefits | | | | | | | | | 3 | | | | | | | | (4) | | | | | | | | (9) | | | | | | | 5 |
Items That May be Reclassified to Profit or Loss: | | | | | | | | | | | | | | | | | | | | | | | | | | | | | | | | |
Available for Sale Financial Assets – Change in Fair Value | | | | | | | | | 2 | | | | | | | | - | | | | | | | | (2) | | | | | | | - |
Available for Sale Financial Assets – Reclassified to Profit or Loss | | | | | | | | | 1 | | | | | | | | - | | | | | | | | 1 | | | | | | | - |
Foreign Currency Translation Adjustment | | | | | | | | | 35 | | | | | | | | 245 | | | | | | | | (205) | | | | | | | 463 |
Total Other Comprehensive Income (Loss), Net of Tax | | | | | | | | | 41 | | | | | | | | 241 | | | | | | | | (215) | | | | | | | 468 |
Comprehensive Income (Loss) | | | | | | | | | (210) | | | | | | | | 2,042 | | | | | | | | (851) | | | | | | | 1,727 |
| |
See accompanying Notes to Consolidated Financial Statements (unaudited).
| | |
| Cenovus Energy Inc. | | Page 41 |
| Third Quarter 2016 Report | | Consolidated Financial Statements |
CONSOLIDATED BALANCE SHEETS(unaudited)
As at
($ millions)
| | | | | | | | | | | | | | | | | | |
| | | | | | | | September 30, | | | | | | December 31, | |
| | | Notes | | | | | 2016 | | | | | | 2015 | |
| | | | | |
Assets | | | | | | | | | | | | | | | | | | |
Current Assets | | | | | | | | | | | | | | | | | | |
Cash and Cash Equivalents | | | | | | | | | 3,850 | | | | | | | | 4,105 | |
Accounts Receivable and Accrued Revenues | | | | | | | | | 1,371 | | | | | | | | 1,251 | |
Income Tax Receivable | | | | | | | | | 6 | | | | | | | | 6 | |
Inventories | | | | | | | | | 972 | | | | | | | | 810 | |
Risk Management | | | 18,19 | | | | | | 13 | | | | | | | | 301 | |
Current Assets | | | | | | | | | 6,212 | | | | | | | | 6,473 | |
Exploration and Evaluation Assets | | | 1,9 | | | | | | 1,580 | | | | | | | | 1,575 | |
Property, Plant and Equipment, Net | | | 1,10 | | | | | | 16,313 | | | | | | | | 17,335 | |
Income Tax Receivable | | | | | | | | | 50 | | | | | | | | 90 | |
Other Assets | | | | | | | | | 78 | | | | | | | | 76 | |
Goodwill | | | 1 | | | | | | 242 | | | | | | | | 242 | |
Total Assets | | | | | | | | | 24,475 | | | | | | | | 25,791 | |
| | | | | |
Liabilities and Shareholders’ Equity | | | | | | | | | | | | | | | | | | |
Current Liabilities | | | | | | | | | | | | | | | | | | |
Accounts Payable and Accrued Liabilities | | | | | | | | | 1,809 | | | | | | | | 1,702 | |
Income Tax Payable | | | | | | | | | 107 | | | | | | | | 133 | |
Risk Management | | | 18,19 | | | | | | 87 | | | | | | | | 23 | |
Current Liabilities | | | | | | | | | 2,003 | | | | | | | | 1,858 | |
Long-Term Debt | | | 12 | | | | | | 6,184 | | | | | | | | 6,525 | |
Risk Management | | | 18,19 | | | | | | 107 | | | | | | | | 7 | |
Decommissioning Liabilities | | | 13 | | | | | | 2,135 | | | | | | | | 2,052 | |
Other Liabilities | | | | | | | | | 192 | | | | | | | | 142 | |
Deferred Income Taxes | | | | | | | | | 2,423 | | | | | | | | 2,816 | |
Total Liabilities | | | | | | | | | 13,044 | | | | | | | | 13,400 | |
Shareholders’ Equity | | | | | | | | | 11,431 | | | | | | | | 12,391 | |
Total Liabilities and Shareholders’ Equity | | | | | | | | | 24,475 | | | | | | | | 25,791 | |
See accompanying Notes to Consolidated Financial Statements (unaudited).
| | |
| Cenovus Energy Inc. | | Page 42 |
| Third Quarter 2016 Report | | Consolidated Financial Statements |
CONSOLIDATED STATEMENTS OF SHAREHOLDERS’ EQUITY
(unaudited)
($ millions)
| | | | | | | | | | | | | | | | | | | | | | | | | | | | |
| | | Share Capital | | | | | Paid in Surplus | | | | | Retained Earnings | | | | | AOCI(1) | | | | | Total | |
| | | (Note 14) | | | | | | | | | | | | | | | (Note 15) | | | | | | |
| | | | | | | | | |
As at December 31, 2014 | | | 3,889 | | | | | | 4,291 | | | | | | 1,599 | | | | | | 407 | | | | | | 10,186 | |
Net Earnings | | | - | | | | | | - | | | | | | 1,259 | | | | | | - | | | | | | 1,259 | |
Other Comprehensive Income (Loss) | | | - | | | | | | - | | | | | | - | | | | | | 468 | | | | | | 468 | |
Total Comprehensive Income (Loss) | | | - | | | | | | - | | | | | | 1,259 | | | | | | 468 | | | | | | 1,727 | |
Common Shares Issued for Cash | | | 1,463 | | | | | | - | | | | | | - | | | | | | - | | | | | | 1,463 | |
Common Shares Issued Pursuant to Dividend Reinvestment Plan | | | 182 | | | | | | - | | | | | | - | | | | | | - | | | | | | 182 | |
Stock-Based Compensation Expense | | | - | | | | | | 33 | | | | | | - | | | | | | - | | | | | | 33 | |
Dividends on Common Shares | | | - | | | | | | - | | | | | | (578) | | | | | | - | | | | | | (578) | |
As at September 30, 2015 | | | 5,534 | | | | | | 4,324 | | | | | | 2,280 | | | | | | 875 | | | | | | 13,013 | |
| | | | | | | | | | | | | | | | | | | | | | | | | | | | |
As at December 31, 2015 | | | 5,534 | | | | | | 4,330 | | | | | | 1,507 | | | | | | 1,020 | | | | | | 12,391 | |
Net Earnings (Loss) | | | - | | | | | | - | | | | | | (636) | | | | | | - | | | | | | (636) | |
Other Comprehensive Income (Loss) | | | - | | | | | | - | | | | | | - | | | | | | (215) | | | | | | (215) | |
Total Comprehensive Income (Loss) | | | - | | | | | | - | | | | | | (636) | | | | | | (215) | | | | | | (851) | |
Stock-Based Compensation Expense | | | - | | | | | | 15 | | | | | | - | | | | | | - | | | | | | 15 | |
Dividends on Common Shares | | | - | | | | | | - | | | | | | (124) | | | | | | - | | | | | | (124) | |
As at September 30, 2016 | | | 5,534 | | | | | | 4,345 | | | | | | 747 | | | | | | 805 | | | | | | 11,431 | |
| (1) | Accumulated Other Comprehensive Income (Loss). |
See accompanying Notes to Consolidated Financial Statements (unaudited).
| | |
| Cenovus Energy Inc. | | Page 43 |
| Third Quarter 2016 Report | | Consolidated Financial Statements |
CONSOLIDATED STATEMENTS OF CASH FLOWS(unaudited)
For the periods ended September 30,
($ millions)
| | | | | | | | | | | | | | | | | | | | | | | | | | | | |
| | | | | | | | Three Months Ended | | | | | Nine Months Ended | |
| | | Notes | | | | | 2016 | | | | | 2015 | | | | | 2016 | | | | | 2015 | |
| | | | | | | | | |
Operating Activities | | | | | | | | | | | | | | | | | | | | | | | | | | | | |
Net Earnings (Loss) | | | | | | | | | (251) | | | | | | 1,801 | | | | | | (636) | | | | | | 1,259 | |
Depreciation, Depletion and Amortization | | | 6,10 | | | | | | 659 | | | | | | 473 | | | | | | 1,569 | | | | | | 1,455 | |
Exploration Expense | | | 6,9 | | | | | | 1 | | | | | | - | | | | | | 2 | | | | | | 21 | |
Deferred Income Taxes | | | 7 | | | | | | (111) | | | | | | (228) | | | | | | (353) | | | | | | (516) | |
Unrealized (Gain) Loss on Risk Management | | | 18 | | | | | | 7 | | | | | | (127) | | | | | | 440 | | | | | | 169 | |
Unrealized Foreign Exchange (Gain) Loss | | | 4 | | | | | | 50 | | | | | | 457 | | | | | | (341) | | | | | | 878 | |
(Gain) Loss on Divestiture of Assets | | | 5 | | | | | | 5 | | | | | | (2,379) | | | | | | 6 | | | | | | (2,395) | |
Current Tax on Divestiture of Assets | | | 5 | | | | | | - | | | | | | 391 | | | | | | - | | | | | | 391 | |
Unwinding of Discount on Decommissioning Liabilities | | | 3,13 | | | | | | 33 | | | | | | 32 | | | | | | 97 | | | | | | 94 | |
Other | | | | | | | | | 29 | | | | | | 24 | | | | | | 104 | | | | | | 60 | |
Net Change in Other Assets and Liabilities | | | | | | | | | (13) | | | | | | (13) | | | | | | (59) | | | | | | (81) | |
Net Change in Non-Cash Working Capital | | | | | | | | | (99) | | | | | | 111 | | | | | | (132) | | | | | | (183) | |
Cash From Operating Activities | | | | | | | | | 310 | | | | | | 542 | | | | | | 697 | | | | | | 1,152 | |
| | | | | | | | | |
Investing Activities | | | | | | | | | | | | | | | | | | | | | | | | | | | | |
Capital Expenditures – Exploration and Evaluation Assets | | | 9 | | | | | | (3) | | | | | | (23) | | | | | | (56) | | | | | | (117) | |
Capital Expenditures – Property, Plant and Equipment | | | 10 | | | | | | (205) | | | | | | (378) | | | | | | (719) | | | | | | (1,170) | |
Acquisition | | | 11 | | | | | | - | | | | | | (80) | | | | | | - | | | | | | (80) | |
Proceeds From Divestiture of Assets | | | 5 | | | | | | 8 | | | | | | 3,329 | | | | | | 8 | | | | | | 3,345 | |
Current Tax on Divestiture of Assets | | | 5 | | | | | | - | | | | | | (391) | | | | | | - | | | | | | (391) | |
Net Change in Non-Cash Working Capital | | | | | | | | | 4 | | | | | | (33) | | | | | | (68) | | | | | | (230) | |
Cash From (Used in) Investing Activities | | | | | | | | | (196) | | | | | | 2,424 | | | | | | (835) | | | | | | 1,357 | |
| | | | | | | | | | | | | | | | | | | | | | | | | | | | |
Net Cash Provided (Used) Before Financing Activities | | | | | | | | | 114 | | | | | | 2,966 | | | | | | (138) | | | | | | 2,509 | |
| | | | | | | | | |
Financing Activities | | | | | | | | | | | | | | | | | | | | | | | | | | | | |
Net Issuance (Repayment) of Short-Term Borrowings | | | | | | | | | - | | | | | | - | | | | | | - | | | | | | (19) | |
Common Shares Issued, Net of Issuance Costs | | | | | | | | | - | | | | | | - | | | | | | - | | | | | | 1,449 | |
Dividends Paid on Common Shares | | | 8 | | | | | | (41) | | | | | | (133) | | | | | | (124) | | | | | | (396) | |
Other | | | | | | | | | - | | | | | | (1) | | | | | | (1) | | | | | | (2) | |
Cash From (Used in) Financing Activities | | | | | | | | | (41) | | | | | | (134) | | | | | | (125) | | | | | | 1,032 | |
| | | | | | | | | |
Foreign Exchange Gain (Loss) on Cash and Cash Equivalents Held in Foreign Currency | | | | | | | | | (3) | | | | | | (21) | | | | | | 8 | | | | | | (23) | |
Increase (Decrease) in Cash and Cash Equivalents | | | | | | | | | 70 | | | | | | 2,811 | | | | | | (255) | | | | | | 3,518 | |
Cash and Cash Equivalents, Beginning of Period | | | | | | | | | 3,780 | | | | | | 1,590 | | | | | | 4,105 | | | | | | 883 | |
Cash and Cash Equivalents, End of Period | | | | | | | | | 3,850 | | | | | | 4,401 | | | | | | 3,850 | | | | | | 4,401 | |
See accompanying Notes to Consolidated Financial Statements (unaudited).
| | |
| Cenovus Energy Inc. | | Page 44 |
| Third Quarter 2016 Report | | Consolidated Financial Statements |
NOTES TO CONSOLIDATED FINANCIAL STATEMENTS (unaudited)
All amounts in $ millions, unless otherwise indicated
For the period ended September 30, 2016
1. DESCRIPTION OF BUSINESS AND SEGMENTED DISCLOSURES
Cenovus Energy Inc. and its subsidiaries, (together “Cenovus” or the “Company”) are in the business of developing, producing and marketing crude oil, natural gas liquids (“NGLs”) and natural gas in Canada with marketing activities and refining operations in the United States (“U.S.”).
Cenovus is incorporated under theCanada Business Corporations Act and its shares are listed on the Toronto (“TSX”) and New York (“NYSE”) stock exchanges. The executive and registered office is located at 2600, 500 Centre Street S.E., Calgary, Alberta, Canada, T2G 1A6. Information on the Company’s basis of preparation for these interim Consolidated Financial Statements is found in Note 2.
Management has determined the operating segments based on information regularly reviewed for the purposes of decision making, allocating resources and assessing operational performance by Cenovus’s chief operating decision makers. The Company evaluates the financial performance of its operating segments primarily based on operating cash flow. The Company’s reportable segments are:
| | ● | | Oil Sands, which includes the development and production of bitumen and natural gas in northeast Alberta. Cenovus’s bitumen assets include Foster Creek, Christina Lake and Narrows Lake as well as projects in the early stages of development, such as Grand Rapids and Telephone Lake. Certain of the Company’s operated oil sands properties, notably Foster Creek, Christina Lake and Narrows Lake, are jointly owned with ConocoPhillips, an unrelated U.S. public company. |
| | ● | | Conventional, which includes the development and production of conventional crude oil, NGLs and natural gas in Alberta and Saskatchewan, including the heavy oil assets at Pelican Lake, the carbon dioxide enhanced oil recovery project at Weyburn and emerging tight oil opportunities. |
| | ● | | Refining and Marketing, which is responsible for transporting, selling and refining crude oil into petroleum and chemical products. Cenovus jointly owns two refineries in the U.S. with the operator Phillips 66, an unrelated U.S. public company. In addition, Cenovus owns and operates a crude-by-rail terminal in Alberta. This segment coordinates Cenovus’s marketing and transportation initiatives to optimize product mix, delivery points, transportation commitments and customer diversification. The marketing of crude oil and natural gas sourced from Canada, including physical product sales that settle in the U.S., is considered to be undertaken by a Canadian business. U.S. sourced crude oil and natural gas purchases and sales are attributed to the U.S. |
| | ● | | Corporate and Eliminations, which primarily includes unrealized gains and losses recorded on derivative financial instruments, gains and losses on divestiture of assets, as well as other Cenovus-wide costs for general and administrative, financing activities and research costs. As financial instruments are settled, the realized gains and losses are recorded in the operating segment to which the derivative instrument relates. Eliminations relate to sales and operating revenues, and purchased product between segments, recorded at transfer prices based on current market prices, and to unrealized intersegment profits in inventory. The Corporate and Eliminations segment is attributed to Canada, with the exception of unrealized risk management gains and losses, which have been attributed to the country in which the transacting entity resides. |
Employee stock-based compensation costs previously included in operating expense have been reclassified to general and administrative expense to conform to the presentation adopted for the year ended December 31, 2015. As a result, for the three and nine months ended September 30, 2015, an expense of $3 million and $6 million, respectively, were reclassified.
The following tabular financial information presents the segmented information first by segment, then by product and geographic location.
| | |
| Cenovus Energy Inc. | | Page 45 |
| Third Quarter 2016 Report | | Notes to Consolidated Financial Statements |
NOTES TO CONSOLIDATED FINANCIAL STATEMENTS (unaudited)
All amounts in $ millions, unless otherwise indicated
For the period ended September 30, 2016
A) Results of Operations – Segment and Operational Information
| | | | | | | | | | | | | | | | | | | | | | | | | | | | | | | | | | |
| | | Oil Sands | | | | | Conventional | | | | | Refining and Marketing | |
| For the three months ended September 30, | | 2016 | | | | | 2015 | | | | | 2016 | | | | | 2015 | | | | | 2016 | | | | | 2015 | |
| | | | | | | | | | | |
Revenues | | | | | | | | | | | | | | | | | | | | | | | | | | | | | | | | | | |
Gross Sales | | | 793 | | | | | | 756 | | | | | | 330 | | | | | | 396 | | | | | | 2,245 | | | | | | 2,242 | |
Less: Royalties | | | 4 | | | | | | 7 | | | | | | 35 | | | | | | 28 | | | | | | - | | | | | | - | |
| | | 789 | | | | | | 749 | | | | | | 295 | | | | | | 368 | | | | | | 2,245 | | | | | | 2,242 | |
| | | | | | | | | | | |
Expenses | | | | | | | | | | | | | | | | | | | | | | | | | | | | | | | | | | |
Purchased Product | | | - | | | | | | - | | | | | | - | | | | | | - | | | | | | 2,004 | | | | | | 2,012 | |
Transportation and Blending | | | 429 | | | | | | 431 | | | | | | 44 | | | | | | 52 | | | | | | - | | | | | | - | |
Operating | | | 128 | | | | | | 132 | | | | | | 102 | | | | | | 131 | | | | | | 172 | | | | | | 214 | |
Production and Mineral Taxes | | | - | | | | | | - | | | | | | 4 | | | | | | 5 | | | | | | - | | | | | | - | |
(Gain) Loss on Risk Management | | | (35) | | | | | | (144) | | | | | | (7) | | | | | | (62) | | | | | | 1 | | | | | | (14) | |
Operating Cash Flow | | | 267 | | | | | | 330 | | | | | | 152 | | | | | | 242 | | | | | | 68 | | | | | | 30 | |
Depreciation, Depletion and Amortization | | | 181 | | | | | | 180 | | | | | | 412 | | | | | | 224 | | | | | | 52 | | | | | | 49 | |
Exploration Expense | | | 1 | | | | | | - | | | | | | - | | | | | | - | | | | | | - | | | | | | - | |
Segment Income (Loss) | | | 85 | | | | | | 150 | | | | | | (260) | | | | | | 18 | | | | | | 16 | | | | | | (19) | |
| | | | | | | |
| | | | | | | | | | | | | Corporate and Eliminations | | | | | Consolidated | |
| For the three months ended September 30, | | | | | | | | | | | | 2016 | | | | | 2015 | | | | | 2016 | | | | | 2015 | |
| | | | | | | | | | | |
Revenues | | | | | | | | | | | | | | | | | | | | | | | | | | | | | | | | | | |
Gross Sales | | | | | | | | | | | | | | | (89) | | | | | | (86) | | | | | | 3,279 | | | | | | 3,308 | |
Less: Royalties | | | | | | | | | | | | | | | - | | | | | | - | | | | | | 39 | | | | | | 35 | |
| | | | | | | | | | | | | | | (89) | | | | | | (86) | | | | | | 3,240 | | | | | | 3,273 | |
| | | | | | | | | | | |
Expenses | | | | | | | | | | | | | | | | | | | | | | | | | | | | | | | | | | |
Purchased Product | | | | | | | | | | | | | | | (87) | | | | | | (86) | | | | | | 1,917 | | | | | | 1,926 | |
Transportation and Blending | | | | | | | | | | | | | | | (1) | | | | | | - | | | | | | 472 | | | | | | 483 | |
Operating | | | | | | | | | | | | | | | (1) | | | | | | (1) | | | | | | 401 | | | | | | 476 | |
Production and Mineral Taxes | | | | | | | | | | | | | | | - | | | | | | - | | | | | | 4 | | | | | | 5 | |
(Gain) Loss on Risk Management | | | | | | | | | | | | | | | 7 | | | | | | (127) | | | | | | (34) | | | | | | (347) | |
Depreciation, Depletion and Amortization | | | | | | | | | | | | | | | 14 | | | | | | 20 | | | | | | 659 | | | | | | 473 | |
Exploration Expense | | | | | | | | | | | | | | | - | | | | | | - | | | | | | 1 | | | | | | - | |
Segment Income (Loss) | | | | | | | | | | | | | | | (21) | | | | | | 108 | | | | | | (180) | | | | | | 257 | |
General and Administrative | | | | | | | | | | | | | | | 71 | | | | | | 78 | | | | | | 71 | | | | | | 78 | |
Finance Costs | | | | | | | | | | | | | | | 122 | | | | | | 122 | | | | | | 122 | | | | | | 122 | |
Interest Income | | | | | | | | | | | | | | | (27) | | | | | | (6) | | | | | | (27) | | | | | | (6) | |
Foreign Exchange (Gain) Loss, Net | | | | | | | | | | | | | | | 45 | | | | | | 417 | | | | | | 45 | | | | | | 417 | |
Research Costs | | | | | | | | | | | | | | | 5 | | | | | | 6 | | | | | | 5 | | | | | | 6 | |
(Gain) Loss on Divestiture of Assets | | | | | | | | | | | | | | | 5 | | | | | | (2,379) | | | | | | 5 | | | | | | (2,379) | |
Other (Income) Loss, Net | | | | | | | | | | | | | | | 5 | | | | | | (1) | | | | | | 5 | | | | | | (1) | |
| | | | | | | | | | | | | | | 226 | | | | | | (1,763) | | | | | | 226 | | | | | | (1,763) | |
Earnings (Loss) Before Income Tax | | | | | | | | | | | | | | | | | | | | | | | | | | | (406) | | | | | | 2,020 | |
Income Tax Expense (Recovery) | | | | | | | | | | | | | | | | | | | | | | | | | | | (155) | | | | | | 219 | |
Net Earnings (Loss) | | | | | | | | | | | | | | | | | | | | | | | | | | | (251) | | | | | | 1,801 | |
| | |
| Cenovus Energy Inc. | | Page 46 |
| Third Quarter 2016 Report | | Notes to Consolidated Financial Statements |
NOTES TO CONSOLIDATED FINANCIAL STATEMENTS (unaudited)
All amounts in $ millions, unless otherwise indicated
For the period ended September 30, 2016
B) Financial Results by Upstream Product
| | | | | | | | | | | | | | | | | | | | | | | | | | | | | | | | | | |
| | | Crude Oil(1) | |
| | | Oil Sands | | | | | Conventional | | | | | Total | |
| For the three months ended September 30, | | 2016 | | | | | 2015 | | | | | 2016 | | | | | 2015 | | | | | 2016 | | | | | 2015 | |
| | | | | | | | | | | |
Revenues | | | | | | | | | | | | | | | | | | | | | | | | | | | | | | | | | | |
Gross Sales | | | 788 | | | | | | 749 | | | | | | 242 | | | | | | 279 | | | | | | 1,030 | | | | | | 1,028 | |
Less: Royalties | | | 4 | | | | | | 7 | | | | | | 32 | | | | | | 23 | | | | | | 36 | | | | | | 30 | |
| | | 784 | | | | | | 742 | | | | | | 210 | | | | | | 256 | | | | | | 994 | | | | | | 998 | |
| | | | | | | | | | | |
Expenses | | | | | | | | | | | | | | | | | | | | | | | | | | | | | | | | | | |
Transportation and Blending | | | 429 | | | | | | 431 | | | | | | 40 | | | | | | 49 | | | | | | 469 | | | | | | 480 | |
Operating | | | 125 | | | | | | 127 | | | | | | 65 | | | | | | 89 | | | | | | 190 | | | | | | 216 | |
Production and Mineral Taxes | | | - | | | | | | - | | | | | | 4 | | | | | | 4 | | | | | | 4 | | | | | | 4 | |
(Gain) Loss on Risk Management | | | (35) | | | | | | (143) | | | | | | (7) | | | | | | (49) | | | | | | (42) | | | | | | (192) | |
Operating Cash Flow | | | 265 | | | | | | 327 | | | | | | 108 | | | | | | 163 | | | | | | 373 | | | | | | 490 | |
(1) Includes NGLs. | | | | | | | | | | | | | | | | | | | | | | | | | | | | | | | | | | |
| | | Natural Gas | |
| | | Oil Sands | | | | | Conventional | | | | | Total | |
| For the three months ended September 30, | | 2016 | | | | | 2015 | | | | | 2016 | | | | | 2015 | | | | | 2016 | | | | | 2015 | |
| | | | | | | | | | | |
Revenues | | | | | | | | | | | | | | | | | | | | | | | | | | | | | | | | | | |
Gross Sales | | | 5 | | | | | | 6 | | | | | | 86 | | | | | | 113 | | | | | | 91 | | | | | | 119 | |
Less: Royalties | | | - | | | | | | - | | | | | | 3 | | | | | | 5 | | | | | | 3 | | | | | | 5 | |
| | | 5 | | | | | | 6 | | | | | | 83 | | | | | | 108 | | | | | | 88 | | | | | | 114 | |
| | | | | | | | | | | |
Expenses | | | | | | | | | | | | | | | | | | | | | | | | | | | | | | | | | | |
Transportation and Blending | | | - | | | | | | - | | | | | | 4 | | | | | | 3 | | | | | | 4 | | | | | | 3 | |
Operating | | | 2 | | | | | | 4 | | | | | | 35 | | | | | | 41 | | | | | | 37 | | | | | | 45 | |
Production and Mineral Taxes | | | - | | | | | | - | | | | | | - | | | | | | 1 | | | | | | - | | | | | | 1 | |
(Gain) Loss on Risk Management | | | - | | | | | | (1) | | | | | | - | | | | | | (13) | | | | | | - | | | | | | (14) | |
Operating Cash Flow | | | 3 | | | | | | 3 | | | | | | 44 | | | | | | 76 | | | | | | 47 | | | | | | 79 | |
| |
| | | Other | |
| | | Oil Sands | | | | | Conventional | | | | | Total | |
| For the three months ended September 30, | | 2016 | | | | | 2015 | | | | | 2016 | | | | | 2015 | | | | | 2016 | | | | | 2015 | |
| | | | | | | | | | | |
Revenues | | | | | | | | | | | | | | | | | | | | | | | | | | | | | | | | | | |
Gross Sales | | | - | | | | | | 1 | | | | | | 2 | | | | | | 4 | | | | | | 2 | | | | | | 5 | |
Less: Royalties | | | - | | | | | | - | | | | | | - | | | | | | - | | | | | | - | | | | | | - | |
| | | - | | | | | | 1 | | | | | | 2 | | | | | | 4 | | | | | | 2 | | | | | | 5 | |
| | | | | | | | | | | |
Expenses | | | | | | | | | | | | | | | | | | | | | | | | | | | | | | | | | | |
Transportation and Blending | | | - | | | | | | - | | | | | | - | | | | | | - | | | | | | - | | | | | | - | |
Operating | | | 1 | | | | | | 1 | | | | | | 2 | | | | | | 1 | | | | | | 3 | | | | | | 2 | |
Production and Mineral Taxes | | | - | | | | | | - | | | | | | - | | | | | | - | | | | | | - | | | | | | - | |
(Gain) Loss on Risk Management | | | - | | | | | | - | | | | | | - | | | | | | - | | | | | | - | | | | | | - | |
Operating Cash Flow | | | (1) | | | | | | - | | | | | | - | | | | | | 3 | | | | | | (1) | | | | | | 3 | |
| |
| | | Total Upstream | |
| | | Oil Sands | | | | | Conventional | | | | | Total | |
| For the three months ended September 30, | | 2016 | | | | | 2015 | | | | | 2016 | | | | | 2015 | | | | | 2016 | | | | | 2015 | |
| | | | | | | | | | | |
Revenues | | | | | | | | | | | | | | | | | | | | | | | | | | | | | | | | | | |
Gross Sales | | | 793 | | | | | | 756 | | | | | | 330 | | | | | | 396 | | | | | | 1,123 | | | | | | 1,152 | |
Less: Royalties | | | 4 | | | | | | 7 | | | | | | 35 | | | | | | 28 | | | | | | 39 | | | | | | 35 | |
| | | 789 | | | | | | 749 | | | | | | 295 | | | | | | 368 | | | | | | 1,084 | | | | | | 1,117 | |
| | | | | | | | | | | |
Expenses | | | | | | | | | | | | | | | | | | | | | | | | | | | | | | | | | | |
Transportation and Blending | | | 429 | | | | | | 431 | | | | | | 44 | | | | | | 52 | | | | | | 473 | | | | | | 483 | |
Operating | | | 128 | | | | | | 132 | | | | | | 102 | | | | | | 131 | | | | | | 230 | | | | | | 263 | |
Production and Mineral Taxes | | | - | | | | | | - | | | | | | 4 | | | | | | 5 | | | | | | 4 | | | | | | 5 | |
(Gain) Loss on Risk Management | | | (35) | | | | | | (144) | | | | | | (7) | | | | | | (62) | | | | | | (42) | | | | | | (206) | |
Operating Cash Flow | | | 267 | | | | | | 330 | | | | | | 152 | | | | | | 242 | | | | | | 419 | | | | | | 572 | |
| | |
| Cenovus Energy Inc. | | Page 47 |
| Third Quarter 2016 Report | | Notes to Consolidated Financial Statements |
NOTES TO CONSOLIDATED FINANCIAL STATEMENTS (unaudited)
All amounts in $ millions, unless otherwise indicated
For the period ended September 30, 2016
C) Results of Operations – Segment and Operational Information
| | | | | | | | | | | | | | | | | | | | | | | | | | | | | | | | | | |
| | | Oil Sands | | | | | Conventional | | | | | Refining and Marketing | |
| For the nine months ended September 30, | | 2016 | | | | | 2015 | | | | | 2016 | | | | | 2015 | | | | | 2016 | | | | | 2015 | |
| | | | | | | | | | | |
Revenues | | | | | | | | | | | | | | | | | | | | | | | | | | | | | | | | | | |
Gross Sales | | | 1,972 | | | | | | 2,379 | | | | | | 898 | | | | | | 1,358 | | | | | | 5,962 | | | | | | 6,775 | |
Less: Royalties | | | 7 | | | | | | 26 | | | | | | 88 | | | | | | 86 | | | | | | - | | | | | | - | |
| | | 1,965 | | | | | | 2,353 | | | | | | 810 | | | | | | 1,272 | | | | | | 5,962 | | | | | | 6,775 | |
Expenses | | | | | | | | | | | | | | | | | | | | | | | | | | | | | | | | | | |
Purchased Product | | | - | | | | | | - | | | | | | - | | | | | | - | | | | | | 5,144 | | | | | | 5,826 | |
Transportation and Blending | | | 1,228 | | | | | | 1,337 | | | | | | 136 | | | | | | 172 | | | | | | - | | | | | | - | |
Operating | | | 359 | | | | | | 402 | | | | | | 331 | | | | | | 431 | | | | | | 557 | | | | | | 551 | |
Production and Mineral Taxes | | | - | | | | | | - | | | | | | 9 | | | | | | 16 | | | | | | - | | | | | | - | |
(Gain) Loss on Risk Management | | | (165) | | | | | | (252) | | | | | | (57) | | | | | | (138) | | | | | | 23 | | | | | | (27) | |
Operating Cash Flow | | | 543 | | | | | | 866 | | | | | | 391 | | | | | | 791 | | | | | | 238 | | | | | | 425 | |
Depreciation, Depletion and Amortization | | | 485 | | | | | | 508 | | | | | | 877 | | | | | | 745 | | | | | | 157 | | | | | | 140 | |
Exploration Expense | | | 2 | | | | | | - | | | | | | - | | | | | | 21 | | | | | | - | | | | | | - | |
Segment Income (Loss) | | | 56 | | | | | | 358 | | | | | | (486) | | | | | | 25 | | | | | | 81 | | | | | | 285 | |
| | | | | | | |
| | | | | | | | | | | | | Corporate and Eliminations | | | | | Consolidated | |
| For the nine months ended September 30, | | | | | | | | | | | | 2016 | | | | | 2015 | | | | | 2016 | | | | | 2015 | |
| | | | | | | | | | | |
Revenues | | | | | | | | | | | | | | | | | | | | | | | | | | | | | | | | | | |
Gross Sales | | | | | | | | | | | | | | | (245) | | | | | | (260) | | | | | | 8,587 | | | | | | 10,252 | |
Less: Royalties | | | | | | | | | | | | | | | - | | | | | | - | | | | | | 95 | | | | | | 112 | |
| | | | | | | | | | | | | | | (245) | | | | | | (260) | | | | | | 8,492 | | | | | | 10,140 | |
Expenses | | | | | | | | | | | | | | | | | | | | | | | | | | | | | | | | | | |
Purchased Product | | | | | | | | | | | | | | | (241) | | | | | | (260) | | | | | | 4,903 | | | | | | 5,566 | |
Transportation and Blending | | | | | | | | | | | | | | | (4) | | | | | | - | | | | | | 1,360 | | | | | | 1,509 | |
Operating | | | | | | | | | | | | | | | (3) | | | | | | (5) | | | | | | 1,244 | | | | | | 1,379 | |
Production and Mineral Taxes | | | | | | | | | | | | | | | - | | | | | | - | | | | | | 9 | | | | | | 16 | |
(Gain) Loss on Risk Management | | | | | | | | | | | | | | | 440 | | | | | | 169 | | | | | | 241 | | | | | | (248) | |
Depreciation, Depletion and Amortization | | | | | | | | | | | | | | | 50 | | | | | | 62 | | | | | | 1,569 | | | | | | 1,455 | |
Exploration Expense | | | | | | | | | | | | | | | - | | | | | | - | | | | | | 2 | | | | | | 21 | |
Segment Income (Loss) | | | | | | | | | | | | | | | (487) | | | | | | (226) | | | | | | (836) | | | | | | 442 | |
General and Administrative | | | | | | | | | | | | | | | 225 | | | | | | 226 | | | | | | 225 | | | | | | 226 | |
Finance Costs | | | | | | | | | | | | | | | 368 | | | | | | 359 | | | | | | 368 | | | | | | 359 | |
Interest Income | | | | | | | | | | | | | | | (45) | | | | | | (20) | | | | | | (45) | | | | | | (20) | |
Foreign Exchange (Gain) Loss, Net | | | | | | | | | | | | | | | (338) | | | | | | 832 | | | | | | (338) | | | | | | 832 | |
Research Costs | | | | | | | | | | | | | | | 30 | | | | | | 20 | | | | | | 30 | | | | | | 20 | |
(Gain) Loss on Divestiture of Assets | | | | | | | | | | | | | | | 6 | | | | | | (2,395) | | | | | | 6 | | | | | | (2,395) | |
Other (Income) Loss, Net | | | | | | | | | | | | | | | 7 | | | | | | 1 | | | | | | 7 | | | | | | 1 | |
| | | | | | | | | | | | | | | 253 | | | | | | (977) | | | | | | 253 | | | | | | (977) | |
Earnings (Loss) Before Income Tax | | | | | | | | | | | | | | | | | | | | | | | | | | | (1,089) | | | | | | 1,419 | |
Income Tax Expense (Recovery) | | | | | | | | | | | | | | | | | | | | | | | | | | | (453) | | | | | | 160 | |
Net Earnings (Loss) | | | | | | | | | | | | | | | | | | | | | | | | | | | (636) | | | | | | 1,259 | |
| | |
| Cenovus Energy Inc. | | Page 48 |
| Third Quarter 2016 Report | | Notes to Consolidated Financial Statements |
NOTES TO CONSOLIDATED FINANCIAL STATEMENTS (unaudited)
All amounts in $ millions, unless otherwise indicated
For the period ended September 30, 2016
D) Financial Results by Upstream Product
| | | | | | | | | | | | | | | | | | | | | | | | | | | | | | | | | | |
| | | Crude Oil(1) | |
| | | Oil Sands | | | | | Conventional | | | | | Total | |
| For the nine months ended September 30, | | 2016 | | | | | 2015 | | | | | 2016 | | | | | 2015 | | | | | 2016 | | | | | 2015 | |
| | | | | | | | | | | |
Revenues | | | | | | | | | | | | | | | | | | | | | | | | | | | | | | | | | | |
Gross Sales | | | 1,960 | | | | | | 2,356 | | | | | | 670 | | | | | | 1,000 | | | | | | 2,630 | | | | | | 3,356 | |
Less: Royalties | | | 7 | | | | | | 26 | | | | | | 80 | | | | | | 78 | | | | | | 87 | | | | | | 104 | |
| | | 1,953 | | | | | | 2,330 | | | | | | 590 | | | | | | 922 | | | | | | 2,543 | | | | | | 3,252 | |
| | | | | | | | | | | |
Expenses | | | | | | | | | | | | | | | | | | | | | | | | | | | | | | | | | | |
Transportation and Blending | | | 1,228 | | | | | | 1,336 | | | | | | 124 | | | | | | 160 | | | | | | 1,352 | | | | | | 1,496 | |
Operating | | | 348 | | | | | | 387 | | | | | | 213 | | | | | | 297 | | | | | | 561 | | | | | | 684 | |
Production and Mineral Taxes | | | - | | | | | | - | | | | | | 9 | | | | | | 14 | | | | | | 9 | | | | | | 14 | |
(Gain) Loss on Risk Management | | | (165) | | | | | | (249) | | | | | | (58) | | | | | | (100) | | | | | | (223) | | | | | | (349) | |
Operating Cash Flow | | | 542 | | | | | | 856 | | | | | | 302 | | | | | | 551 | | | | | | 844 | | | | | | 1,407 | |
(1) Includes NGLs. | | | | | | | | | | | | | | | | | | | | | | | | | | | | | | | | | | |
| | | Natural Gas | |
| | | Oil Sands | | | | | Conventional | | | | | Total | |
| For the nine months ended September 30, | | 2016 | | | | | 2015 | | | | | 2016 | | | | | 2015 | | | | | 2016 | | | | | 2015 | |
| | | | | | | | | | | |
Revenues | | | | | | | | | | | | | | | | | | | | | | | | | | | | | | | | | | |
Gross Sales | | | 11 | | | | | | 17 | | | | | | 221 | | | | | | 346 | | | | | | 232 | | | | | | 363 | |
Less: Royalties | | | - | | | | | | - | | | | | | 8 | | | | | | 8 | | | | | | 8 | | | | | | 8 | |
| | | 11 | | | | | | 17 | | | | | | 213 | | | | | | 338 | | | | | | 224 | | | | | | 355 | |
| | | | | | | | | | | |
Expenses | | | | | | | | | | | | | | | | | | | | | | | | | | | | | | | | | | |
Transportation and Blending | | | - | | | | | | 1 | | | | | | 12 | | | | | | 12 | | | | | | 12 | | | | | | 13 | |
Operating | | | 7 | | | | | | 12 | | | | | | 113 | | | | | | 131 | | | | | | 120 | | | | | | 143 | |
Production and Mineral Taxes | | | - | | | | | | - | | | | | | - | | | | | | 2 | | | | | | - | | | | | | 2 | |
(Gain) Loss on Risk Management | | | - | | | | | | (3) | | | | | | 1 | | | | | | (38) | | | | | | 1 | | | | | | (41) | |
Operating Cash Flow | | | 4 | | | | | | 7 | | | | | | 87 | | | | | | 231 | | | | | | 91 | | | | | | 238 | |
| |
| | | Other | |
| | | Oil Sands | | | | | Conventional | | | | | Total | |
| For the nine months ended September 30, | | 2016 | | | | | 2015 | | | | | 2016 | | | | | 2015 | | | | | 2016 | | | | | 2015 | |
| | | | | | | | | | | |
Revenues | | | | | | | | | | | | | | | | | | | | | | | | | | | | | | | | | | |
Gross Sales | | | 1 | | | | | | 6 | | | | | | 7 | | | | | | 12 | | | | | | 8 | | | | | | 18 | |
Less: Royalties | | | - | | | | | | - | | | | | | - | | | | | | - | | | | | | - | | | | | | - | |
| | | 1 | | | | | | 6 | | | | | | 7 | | | | | | 12 | | | | | | 8 | | | | | | 18 | |
| | | | | | | | | | | |
Expenses | | | | | | | | | | | | | | | | | | | | | | | | | | | | | | | | | | |
Transportation and Blending | | | - | | | | | | - | | | | | | - | | | | | | - | | | | | | - | | | | | | - | |
Operating | | | 4 | | | | | | 3 | | | | | | 5 | | | | | | 3 | | | | | | 9 | | | | | | 6 | |
Production and Mineral Taxes | | | - | | | | | | - | | | | | | - | | | | | | - | | | | | | - | | | | | | - | |
(Gain) Loss on Risk Management | | | - | | | | | | - | | | | | | - | | | | | | - | | | | | | - | | | | | | - | |
Operating Cash Flow | | | (3) | | | | | | 3 | | | | | | 2 | | | | | | 9 | | | | | | (1) | | | | | | 12 | |
| |
| | | Total Upstream | |
| | | Oil Sands | | | | | Conventional | | | | | Total | |
| For the nine months ended September 30, | | 2016 | | | | | 2015 | | | | | 2016 | | | | | 2015 | | | | | 2016 | | | | | 2015 | |
| | | | | | | | | | | |
Revenues | | | | | | | | | | | | | | | | | | | | | | | | | | | | | | | | | | |
Gross Sales | | | 1,972 | | | | | | 2,379 | | | | | | 898 | | | | | | 1,358 | | | | | | 2,870 | | | | | | 3,737 | |
Less: Royalties | | | 7 | | | | | | 26 | | | | | | 88 | | | | | | 86 | | | | | | 95 | | | | | | 112 | |
| | | 1,965 | | | | | | 2,353 | | | | | | 810 | | | | | | 1,272 | | | | | | 2,775 | | | | | | 3,625 | |
| | | | | | | | | | | |
Expenses | | | | | | | | | | | | | | | | | | | | | | | | | | | | | | | | | | |
Transportation and Blending | | | 1,228 | | | | | | 1,337 | | | | | | 136 | | | | | | 172 | | | | | | 1,364 | | | | | | 1,509 | |
Operating | | | 359 | | | | | | 402 | | | | | | 331 | | | | | | 431 | | | | | | 690 | | | | | | 833 | |
Production and Mineral Taxes | | | - | | | | | | - | | | | | | 9 | | | | | | 16 | | | | | | 9 | | | | | | 16 | |
(Gain) Loss on Risk Management | | | (165) | | | | | | (252) | | | | | | (57) | | | | | | (138) | | | | | | (222) | | | | | | (390) | |
Operating Cash Flow | | | 543 | | | | | | 866 | | | | | | 391 | | | | | | 791 | | | | | | 934 | | | | | | 1,657 | |
| | |
| Cenovus Energy Inc. | | Page 49 |
| Third Quarter 2016 Report | | Notes to Consolidated Financial Statements |
NOTES TO CONSOLIDATED FINANCIAL STATEMENTS (unaudited)
All amounts in $ millions, unless otherwise indicated
For the period ended September 30, 2016
E) Exploration and Evaluation Assets, Property, Plant and Equipment, Goodwill and Total Assets
| | | | | | | | | | | | | | | | | | | | | | |
| | | E&E(1) | | | | | PP&E(2) | |
| As at | | September 30, 2016 | | | | | December 31, 2015 | | | | | September 30, 2016 | | | | | December 31, 2015 | |
| | | | | | | |
Oil Sands | | | 1,563 | | | | | | 1,560 | | | | | | 8,903 | | | | | | 8,907 | |
Conventional | | | 17 | | | | | | 15 | | | | | | 2,966 | | | | | | 3,720 | |
Refining and Marketing | | | - | | | | | | - | | | | | | 4,164 | | | | | | 4,398 | |
Corporate and Eliminations | | | - | | �� | | | | - | | | | | | 280 | | | | | | 310 | |
Consolidated | | | 1,580 | | | | | | 1,575 | | | | | | 16,313 | | | | | | 17,335 | |
| | | |
| | | Goodwill | | | | | Total Assets | |
| As at | | September 30, 2016 | | | | | December 31, 2015 | | | | | September 30, 2016 | | | | | December 31, 2015 | |
| | | | | | | |
Oil Sands | | | 242 | | | | | | 242 | | | | | | 11,086 | | | | | | 11,069 | |
Conventional | | | - | | | | | | - | | | | | | 3,091 | | | | | | 3,830 | |
Refining and Marketing | | | - | | | | | | - | | | | | | 5,964 | | | | | | 5,844 | |
Corporate and Eliminations | | | - | | | | | | - | | | | | | 4,334 | | | | | | 5,048 | |
Consolidated | | | 242 | | | | | | 242 | | | | | | 24,475 | | | | | | 25,791 | |
(1) Exploration and Evaluation (“E&E”) assets. (2) Property, Plant and Equipment (“PP&E”). | | | | | | | | | | | | | | | | | | | | | | |
F) Geographical Information | | | | | | | | | | | | | | | | | | | | | | |
| |
| | | Revenues | |
| | | Three Months Ended | | | | | Nine Months Ended | |
| As at | | 2016 | | | | | 2015 | | | | | 2016 | | | | | 2015 | |
| | | | | | | |
Canada | | | 1,623 | | | | | | 1,482 | | | | | | 4,140 | | | | | | 4,897 | |
United States | | | 1,617 | | | | | | 1,791 | | | | | | 4,352 | | | | | | 5,243 | |
Consolidated | | | 3,240 | | | | | | 3,273 | | | | | | 8,492 | | | | | | 10,140 | |
| | | | | |
| | | | | | | | | | | | | Non-Current Assets(3) | |
| As at | | | | | | | | | | | | September 30, 2016 | | | | | December 31, 2015 | |
| | | | | | | |
Canada | | | | | | | | | | | | | | | 14,144 | | | | | | 14,921 | |
United States | | | | | | | | | | | | | | | 4,069 | | | | | | 4,307 | |
Consolidated | | | | | | | | | | | | | | | 18,213 | | | | | | 19,228 | |
(3) Includes E&E, PP&E, goodwill and other assets. | | | | | | | | | | | | | | | | | | | | | | |
G) Capital Expenditures(4) | | | | | | | | | | | | | | | | | | | | | | |
| | | Three Months Ended | | | | | Nine Months Ended | |
| For the periods ended September 30, | | 2016 | | | | | 2015 | | | | | 2016 | | | | | 2015 | |
| | | | | | | |
Capital | | | | | | | | | | | | | | | | | | | | | | |
Oil Sands | | | 110 | | | | | | 272 | | | | | | 476 | | | | | | 946 | |
Conventional | | | 41 | | | | | | 55 | | | | | | 114 | | | | | | 157 | |
Refining and Marketing | | | 51 | | | | | | 67 | | | | | | 156 | | | | | | 159 | |
Corporate | | | 6 | | | | | | 6 | | | | | | 21 | | | | | | 24 | |
| | | 208 | | | | | | 400 | | | | | | 767 | | | | | | 1,286 | |
Acquisition Capital | | | | | | | | | | | | | | | | | | | | | | |
Oil Sands | | | - | | | | | | - | | | | | | 11 | | | | | | - | |
Conventional | | | - | | | | | | 1 | | | | | | - | | | | | | 1 | |
Refining and Marketing | | | - | | | | | | 83 | | | | | | - | | | | | | 83 | |
| | | 208 | | | | | | 484 | | | | | | 778 | | | | | | 1,370 | |
(4) Includes expenditures on PP&E and E&E. | | | | | | | | | | | | | | | | | | | | | | |
| | |
| Cenovus Energy Inc. | | Page 50 |
| Third Quarter 2016 Report | | Notes to Consolidated Financial Statements |
NOTES TO CONSOLIDATED FINANCIAL STATEMENTS (unaudited)
All amounts in $ millions, unless otherwise indicated
For the period ended September 30, 2016
2. BASIS OF PREPARATION AND STATEMENT OF COMPLIANCE
In these interim Consolidated Financial Statements, unless otherwise indicated, all dollars are expressed in Canadian dollars. All references to C$ or $ are to Canadian dollars and references to US$ are to U.S. dollars.
These interim Consolidated Financial Statements have been prepared in accordance with International Financial Reporting Standards (“IFRS”) as issued by the International Accounting Standards Board (“IASB”) applicable to the preparation of interim financial statements, including International Accounting Standard 34, “Interim Financial Reporting” (“IAS 34”), and have been prepared following the same accounting policies and methods of computation as the annual Consolidated Financial Statements for the year ended December 31, 2015, except for income taxes. Income taxes on earnings or loss in the interim periods are accrued using the income tax rate that would be applicable to the expected total annual earnings or loss. Certain information and disclosures normally included in the notes to the annual Consolidated Financial Statements have been condensed or have been disclosed on an annual basis only. Accordingly, these interim Consolidated Financial Statements should be read in conjunction with the annual Consolidated Financial Statements for the year ended December 31, 2015, which have been prepared in accordance with IFRS as issued by the IASB.
These interim Consolidated Financial Statements of Cenovus were approved by the Audit Committee effective October 26, 2016.
3. FINANCE COSTS
| | | | | | | | | | | | | | | | | | | | | | | | |
| | | | | Three Months Ended | | | | | Nine Months Ended | |
| For the periods ended September 30, | | | | 2016 | | | | | 2015 | | | | | 2016 | | | | | 2015 | |
| | | | | | | | |
Interest Expense – Short-Term Borrowings and Long-Term Debt | | | | | 84 | | | | | | 84 | | | | | | 255 | | | | | | 243 | |
Unwinding of Discount on Decommissioning Liabilities (Note 13) | | | | | 33 | | | | | | 32 | | | | | | 97 | | | | | | 94 | |
Other | | | | | 5 | | | | | | 6 | | | | | | 16 | | | | | | 22 | |
| | | | | 122 | | | | | | 122 | | | | | | 368 | | | | | | 359 | |
4. FOREIGN EXCHANGE (GAIN) LOSS, NET
| | | | | | | | | | | | | | | | | | | | | | | | |
| | | | | Three Months Ended | | | | | Nine Months Ended | |
| For the periods ended September 30, | | | | 2016 | | | | | 2015 | | | | | 2016 | | | | | 2015 | |
| | | | | | | | |
Unrealized Foreign Exchange (Gain) Loss on Translation of: | | | | | | | | | | | | | | | | | | | | | | | | |
U.S. Dollar Debt Issued From Canada | | | | | 52 | | | | | | 437 | | | | | | (343 | ) | | | | | 852 | |
Other | | | | | (2 | ) | | | | | 20 | | | | | | 2 | | | | | | 26 | |
Unrealized Foreign Exchange (Gain) Loss | | | | | 50 | | | | | | 457 | | | | | | (341 | ) | | | | | 878 | |
Realized Foreign Exchange (Gain) Loss | | | | | (5 | ) | | | | | (40 | ) | | | | | 3 | | | | | | (46 | ) |
| | | | | 45 | | | | | | 417 | | | | | | (338 | ) | | | | | 832 | |
| | |
| Cenovus Energy Inc. | | Page 51 |
| Third Quarter 2016 Report | | Notes to Consolidated Financial Statements |
NOTES TO CONSOLIDATED FINANCIAL STATEMENTS (unaudited)
All amounts in $ millions, unless otherwise indicated
For the period ended September 30, 2016
5. DIVESTITURES
In the third quarter of 2016, the Company completed the sale of land to an unrelated third party for cash proceeds of $8 million, resulting in a loss of $5 million. In the second quarter of 2016, the Company sold equipment at a loss of $1 million. These assets, related liabilities and results of operations were reported in the Conventional segment.
In the third quarter of 2015, the Company completed the sale of Heritage Royalty Limited Partnership (“HRP”), a wholly-owned subsidiary, to a third party for gross cash proceeds of $3.3 billion, resulting in a gain of $2.4 billion. HRP was a royalty business consisting of royalty interest and mineral fee title lands in Alberta, Saskatchewan and Manitoba. These assets, related liabilities and results of operations were reported in the Conventional segment.
The divestiture gave rise to a taxable gain for which the Company recognized a current tax expense of $391 million. The majority of HRP’s assets had been acquired at a nominal cost and, as such, had minimal benefit from tax depreciation in prior years. For this reason, the current tax expense associated with the divestiture was specifically identifiable; therefore, it has been classified as an investing activity in the Consolidated Statements of Cash Flows.
In the first quarter of 2015, the Company divested an office building, recording a gain of $16 million.
6. IMPAIRMENTS
A) Cash-Generating Unit (“CGU”) Impairments
As at September 30, 2016, indicators of impairment were noted due to a further decline in long-term forward heavy crude oil and natural gas prices; therefore, the Company tested its upstream CGUs for impairment.
2016 Impairments
As at September 30, 2016, the Company determined that the carrying amounts of the Northern Alberta and Suffield CGUs exceeded their recoverable amounts, resulting in impairment losses of $210 million and $65 million, respectively. The impairment was recorded as additional depreciation, depletion and amortization (“DD&A”) in the Conventional segment.
The Northern Alberta CGU includes the Pelican Lake and Elk Point producing assets and other emerging assets in the exploration and evaluation stage. Future cash flows for the Northern Alberta CGU declined due to lowerlong-term forward crude oil prices. The Company had previously impaired the Northern Alberta CGU by $170 million at March 31, 2016 due to the decline in forward heavy crude oil prices, bringing the total 2016 impairment to $380 million.
The Suffield CGU includes both the production of natural gas and heavy crude oil in Alberta on the Canadian Forces Base. Future cash flows for the Suffield CGU declined due to lower long-term forward natural gas and heavy crude oil prices.
The recoverable amounts were determined using fair value less costs of disposal. The fair values for producing properties were calculated based on discounted after-tax cash flows of proved and probable reserves using forward prices and cost estimates, consistent with Cenovus’s independent qualified reserves evaluators (Level 3). Future cash flows were estimated using a two percent inflation rate and discounted using a rate of 10 percent. As at September 30, 2016, the recoverable amounts of the Northern Alberta and Suffield CGUs were estimated to be approximately $1.1 billion and $483 million, respectively.
For the purpose of impairment testing, goodwill is allocated to the CGU to which it relates. There were no impairments of goodwill for the nine months ended September 30, 2016.
Key Assumptions
The recoverable amounts of Cenovus’s upstream CGUs were determined based on fair value less costs of disposal or an evaluation of comparable asset transactions. Key assumptions in the determination of future cash flows from reserves include crude oil and natural gas prices, costs to develop and the discount rate. All reserves have been evaluated as at December 31, 2015 by independent qualified reserves evaluators.
| | |
| Cenovus Energy Inc. | | Page 52 |
| Third Quarter 2016 Report | | Notes to Consolidated Financial Statements |
NOTES TO CONSOLIDATED FINANCIAL STATEMENTS (unaudited)
All amounts in $ millions, unless otherwise indicated
For the period ended September 30, 2016
Crude Oil and Natural Gas Prices
The forward prices as at September 30, 2016, used to determine future cash flows from crude oil and natural gas reserves were:
| | | | | | | | | | | | | | | | | | | | | | | | | | | | | | | | | | | | | | | | | | | | |
| | | Remainder
of 2016 | | | | | | 2017 | | | | | | 2018 | | | | | | 2019 | | | | | | 2020 | | | | | | Average Annual % Change to 2026 | |
| | | | | | | | | | | |
WTI (US$/barrel)(1) | | | 50.00 | | | | | | | | 53.50 | | | | | | | | 59.70 | | | | | | | | 66.10 | | | | | | | | 70.00 | | | | | | | | 3.6% | |
WCS (C$/barrel)(2) | | | 45.50 | | | | | | | | 50.90 | | | | | | | | 57.00 | | | | | | | | 63.50 | | | | | | | | 65.20 | | | | | | | | 3.2% | |
AECO (C$/Mcf)(3) (4) | | | 2.95 | | | | | | | | 3.00 | | | | | | | | 3.15 | | | | | | | | 3.45 | | | | | | | | 3.60 | | | | | | | | 3.6% | |
| (1) | West Texas Intermediate (“WTI”) crude oil. |
| (2) | Western Canadian Select (“WCS”) crude oil blend. |
| (3) | Alberta Energy Company (“AECO”) natural gas. |
| (4) | Assumes gas heating value of one million British Thermal Units per thousand cubic feet. |
Discount and Inflation Rates
Evaluations of discounted future cash flows are initiated using the discount rate of 10 percent and inflation is estimated at two percent, which is common industry practice and used by Cenovus’s independent qualified reserves evaluators in preparing their reserves reports. Based on the individual characteristics of the asset, other economic and operating factors are also considered, which may increase or decrease the implied discount rate.
Sensitivities
As at September 30, 2016, changes to the assumed discount rate and forward price estimates over the life of the reserves independently would have had the following impact on the third quarter impairments:
| | | | | | | | | | | | | | | | | | | | |
| | | One Percent Increase in the Discount Rate | | | | | | One Percent
Decrease in the
Discount Rate | | | | | | Five Percent Decrease in the Forward Price Estimates | |
| | | | | |
PP&E – Change to Impairment of Northern Alberta CGU | | | 137 | | | | | | | | (145 | ) | | | | | | | 368 | |
PP&E – Change to Impairment of Suffield CGU | | | 26 | | | | | | | | (45 | ) | | | | | | | 56 | |
2015 Impairments
There were no CGU or goodwill impairments for the nine months ended September 30, 2015.
B) Asset Impairments
For the three months ended September 30, 2016, the Company recorded an impairment loss of $16 million related to preliminary engineering costs associated with a project that was cancelled and equipment that was written down to its recoverable amount. This impairment loss was recorded as additional DD&A in the Oil Sands segment. In the second quarter of 2016, $4 million of leasehold improvements were written off. This impairment loss was recorded as additional DD&A in the Corporate and Eliminations segment.
For the nine months ended September 30, 2015, $21 million of previously capitalized E&E costs related to exploration assets within the Saskatchewan CGU were deemed not to be technically feasible and commercially viable, and were recorded as exploration expense in the Conventional segment.
| | |
| Cenovus Energy Inc. | | Page 53 |
| Third Quarter 2016 Report | | Notes to Consolidated Financial Statements |
NOTES TO CONSOLIDATED FINANCIAL STATEMENTS (unaudited)
All amounts in $ millions, unless otherwise indicated
For the period ended September 30, 2016
7. INCOME TAXES
The provision for income taxes is:
| | | | | | | | | | | | | | | | | | | | | | | | | | | | |
| | | Three Months Ended | | | | | | Nine Months Ended | |
| For the periods ended September 30, | | 2016 | | | | | | 2015 | | | | | | 2016 | | | | | | 2015 | |
| | | | | | | |
Current Tax | | | | | | | | | | | | | | | | | | | | | | | | | | | | |
Canada | | | (44 | ) | | | | | | | 451 | | | | | | | | (101 | ) | | | | | | | 686 | |
United States | | | - | | | | | | | | (4 | ) | | | | | | | 1 | | | | | | | | (10 | ) |
Total Current Tax Expense (Recovery) | | | (44 | ) | | | | | | | 447 | | | | | | | | (100 | ) | | | | | | | 676 | |
Deferred Tax Expense (Recovery) | | | (111 | ) | | | | | | | (228 | ) | | | | | | | (353 | ) | | | | | | | (516 | ) |
| | | (155 | ) | | | | | | | 219 | | | | | | | | (453 | ) | | | | | | | 160 | |
In the third quarter of 2016, the Company recorded a current tax recovery of $50 million related to prior year adjustments.
In the third quarter of 2015, the Company recorded a deferred tax recovery of $385 million arising from an adjustment to the tax basis of the Company’s refining assets. The increase in tax basis was a result of the Company’s partner recognizing a taxable gain on its interest in WRB Refining LP (“WRB”) which, due to an election filed with the U.S. tax authorities, was added to the tax basis of WRB’s assets.
The following table reconciles income taxes calculated at the Canadian statutory rate with the recorded income taxes:
| | | | | | | | | | | | |
| | | Nine Months Ended | |
| For the periods ended September 30, | | 2016 | | | | | | 2015 | |
| | | |
Earnings (Loss) Before Income Tax | | | (1,089 | ) | | | | | | | 1,419 | |
Canadian Statutory Rate | | | 27.0% | | | | | | | | 26.1% | |
Expected Income Tax (Recovery) | | | (294 | ) | | | | | | | 370 | |
Effect of Taxes Resulting From: | | | | | | | | | | | | |
Foreign Tax Rate Differential | | | (38 | ) | | | | | | | (15 | ) |
Non-Deductible Stock-Based Compensation | | | 6 | | | | | | | | 7 | |
Non-Taxable Capital (Gains) Losses | | | (46 | ) | | | | | | | 113 | |
Unrecognized Capital (Gains) Losses Arising From Unrealized Foreign Exchange | | | (46 | ) | | | | | | | 113 | |
Adjustments Arising From Prior Year Tax Filings | | | (48 | ) | | | | | | | (13 | ) |
Recognition of Capital Losses | | | - | | | | | | | | (149 | ) |
Recognition of U.S. Tax Basis | | | - | | | | | | | | (385 | ) |
Change in Statutory Rate | | | - | | | | | | | | 158 | |
Other | | | 13 | | | | | | | | (39 | ) |
Total Tax (Recovery) | | | (453 | ) | | | | | | | 160 | |
Effective Tax Rate | | | 41.6% | | | | | | | | 11.3% | |
8. PER SHARE AMOUNTS
A) Net Earnings (Loss) Per Share
| | | | | | | | | | | | | | | | | | | | | | | | | | | | |
| | | Three Months Ended | | | Nine Months Ended | |
| For the periods ended September 30, | | 2016 | | | | | | 2015 | | | | | | 2016 | | | | | | 2015 | |
| | | | | | | |
Net Earnings (Loss) – Basic and Diluted($ millions) | | | (251 | ) | | | | | | | 1,801 | | | | | | | | (636 | ) | | | | | | | 1,259 | |
| | | | | | | |
Weighted Average Number of Shares – Basic and Diluted(millions) | | | 833.3 | | | | | | | | 833.3 | | | | | | | | 833.3 | | | | | | | | 813.8 | |
| | | | | | | |
Net Earnings (Loss) Per Share– Basic and Diluted($) | | | (0.30 | ) | | | | | | | 2.16 | | | | | | | | (0.76 | ) | | | | | | | 1.55 | |
B) Dividends Per Share
For the nine months ended September 30, 2016, the Company paid dividends of $124 million or $0.15 per share, all of which were paid in cash (nine months ended September 30, 2015 – $578 million or $0.6924 per share, including cash dividends of $396 million).
| | |
| Cenovus Energy Inc. | | Page 54 |
| Third Quarter 2016 Report | | Notes to Consolidated Financial Statements |
NOTES TO CONSOLIDATED FINANCIAL STATEMENTS (unaudited)
All amounts in $ millions, unless otherwise indicated
For the period ended September 30, 2016
9. EXPLORATION AND EVALUATION ASSETS
| | | | |
| | | Total | |
| |
As at December 31, 2015 | | | 1,575 | |
Additions | | | 56 | |
Transfers to PP&E (Note 10) | | | (49 | ) |
Exploration Expense | | | (2 | ) |
As at September 30, 2016 | | | 1,580 | |
10. PROPERTY, PLANT AND EQUIPMENT, NET
| | | | | | | | | | | | | | | | | | | | | | | | | | | | | | | | | | | | |
| | | Upstream Assets | | | | | | | | | | | | | | | | | | | |
| | | Development & Production | | | | | | Other Upstream | | | | | | Refining Equipment | | | | | | Other (1) | | | | | | Total | |
| | | | | | | | | |
COST | | | | | | | | | | | | | | | | | | | | | | | | | | | | | | | | | | | | |
As at December 31, 2015 | | | 31,481 | | | | | | | | 331 | | | | | | | | 5,206 | | | | | | | | 1,037 | | | | | | | | 38,055 | |
Additions | | | 544 | | | | | | | | 1 | | | | | | | | 149 | | | | | | | | 28 | | | | | | | | 722 | |
Transfers From E&E Assets (Note 9) | | | 49 | | | | | | | | - | | | | | | | | - | | | | | | | | - | | | | | | | | 49 | |
Change in Decommissioning Liabilities | | | 33 | | | | | | | | - | | | | | | | | (10 | ) | | | | | | | - | | | | | | | | 23 | |
Exchange Rate Movements and Other | | | (16 | ) | | | | | | | - | | | | | | | | (273 | ) | | | | | | | - | | | | | | | | (289 | ) |
Divestitures (Note 5) | | | (23 | ) | | | | | | | - | | | | | | | | - | | | | | | | | - | | | | | | | | (23 | ) |
As at September 30, 2016 | | | 32,068 | | | | | | | | 332 | | | | | | | | 5,072 | | | | | | | | 1,065 | | | | | | | | 38,537 | |
| | | | | | | | | |
ACCUMULATED DEPRECIATION, DEPLETION AND AMORTIZATION | | | | | | | | | | | | | | | | | | | | | | | | | | | | | | | | | | | | |
As at December 31, 2015 | | | 18,908 | | | | | | | | 277 | | | | | | | | 896 | | | | | | | | 639 | | | | | | | | 20,720 | |
Depreciation, Depletion and Amortization | | | 876 | | | | | | | | 25 | | | | | | | | 152 | | | | | | | | 51 | | | | | | | | 1,104 | |
Impairment Losses (Note 6) | | | 461 | | | | | | | | - | | | | | | | | - | | | | | | | | 4 | | | | | | | | 465 | |
Exchange Rate Movements and Other | | | (8 | ) | | | | | | | - | | | | | | | | (49 | ) | | | | | | | - | | | | | | | | (57 | ) |
Divestitures (Note 5) | | | (8 | ) | | | | | | | - | | | | | | | | - | | | | | | | | - | | | | | | | | (8 | ) |
As at September 30, 2016 | | | 20,229 | | | | | | | | 302 | | | | | | | | 999 | | | | | | | | 694 | | | | | | | | 22,224 | |
| | | | | | | | | |
CARRYING VALUE | | | | | | | | | | | | | | | | | | | | | | | | | | | | | | | | | | | | |
As at December 31, 2015 | | | 12,573 | | | | | | | | 54 | | | | | | | | 4,310 | | | | | | | | 398 | | | | | | | | 17,335 | |
As at September 30, 2016 | | | 11,839 | | | | | | | | 30 | | | | | | | | 4,073 | | | | | | | | 371 | | | | | | | | 16,313 | |
| (1) | Includes crude-by-rail terminal, office furniture, fixtures, leasehold improvements, information technology and aircraft. |
11. ACQUISITION
In the third quarter of 2015, the Company completed the acquisition of a crude-by-rail terminal for cash consideration of $75 million, plus adjustments. The transaction was accounted for using the acquisition method of accounting. In connection with the acquisition, the Company assumed an associated decommissioning liability of $4 million and working capital of $1 million. Transaction costs associated with the acquisition were expensed. These assets, related liabilities and results of operations are reported in the Refining and Marketing segment.
| | |
| Cenovus Energy Inc. | | Page 55 |
| Third Quarter 2016 Report | | Notes to Consolidated Financial Statements |
NOTES TO CONSOLIDATED FINANCIAL STATEMENTS (unaudited)
All amounts in $ millions, unless otherwise indicated
For the period ended September 30, 2016
12. LONG-TERM DEBT
| | | | | | | | | | | | | | | | |
| As at | | US$ Principal | | | | | September 30,
2016 | | | | | December 31,
2015 | |
| | | | | |
Revolving Term Debt(1) | | | - | | | | | | - | | | | | | - | |
U.S. Dollar Denominated Unsecured Notes | | | 4,750 | | | | | | 6,231 | | | | | | 6,574 | |
Total Debt Principal | | | | | | | | | 6,231 | | | | | | 6,574 | |
Debt Discounts and Transaction Costs | | | | | | | | | (47 | ) | | | | | (49 | ) |
| | | | | | | | | 6,184 | | | | | | 6,525 | |
| (1) | Revolving term debt may include bankers’ acceptances, LIBOR loans, prime rate loans and U.S. base rate loans. |
On February 24, 2016, Cenovus filed a base shelf prospectus. The base shelf prospectus allows the Company to offer, from time to time, up to US$5.0 billion, or the equivalent in other currencies, of debt securities, common shares, preferred shares, subscription receipts, warrants, share purchase contracts and units in Canada, the U.S. and elsewhere where permitted by law. The base shelf prospectus will expire in March 2018 and replaced the Company’s US$2.0 billion base debt shelf prospectus. In addition, the Company had a $1.5 billion Canadian base debt shelf prospectus that expired on July 25, 2016. As at September 30, 2016, no issuances have been made under the US$5.0 billion base shelf prospectus.
Effective April 22, 2016, the Company extended the maturity date of the $1.0 billion tranche of the committed credit facility from November 30, 2017 to April 30, 2019. As at September 30, 2016, Cenovus had $4.0 billion available on its committed credit facility.
As at September 30, 2016, the Company is in compliance with all of the terms of its debt agreements.
13. DECOMMISSIONING LIABILITIES
The decommissioning provision represents the present value of the expected future costs associated with the retirement of upstream crude oil and natural gas assets, refining facilities and the crude-by-rail terminal. The aggregate carrying amount of the obligation is:
| | | | |
| | | Total | |
| |
As at December 31, 2015 | | | 2,052 | |
Liabilities Incurred | | | 7 | |
Liabilities Settled | | | (34 | ) |
Liabilities Divested | | | (1 | ) |
Change in Estimated Future Cash Flows | | | (1 | ) |
Change in Discount Rate | | | 17 | |
Unwinding of Discount on Decommissioning Liabilities | | | 97 | |
Foreign Currency Translation | | | (2 | ) |
As at September 30, 2016 | | | 2,135 | |
The undiscounted amount of estimated future cash flows required to settle the obligation has been discounted using a credit-adjusted risk-free rate of 6.3 percent as at September 30, 2016 (December 31, 2015 – 6.4 percent).
| | |
| Cenovus Energy Inc. | | Page 56 |
| Third Quarter 2016 Report | | Notes to Consolidated Financial Statements |
NOTES TO CONSOLIDATED FINANCIAL STATEMENTS (unaudited)
All amounts in $ millions, unless otherwise indicated
For the period ended September 30, 2016
14. SHARE CAPITAL
A) Authorized
Cenovus is authorized to issue an unlimited number of common shares, and first and second preferred shares not exceeding, in aggregate, 20 percent of the number of issued and outstanding common shares. The first and second preferred shares may be issued in one or more series with rights and conditions to be determined by the Company’s Board of Directors prior to issuance and subject to the Company’s articles.
B) Issued and Outstanding
| | | | | | | | | | | | | | | | | | | | | | | | | | |
| | | | | | | | | | | | | | | September 30, 2016 | |
| As at | | | | | | | | | | | | | | Number of Common Shares (thousands) | | | | | Amount | |
| | | | | | | |
Outstanding, Beginning of Year and End of Period | | | | | | | | | | | | | | | | | | | 833,290 | | | | | | 5,534 | |
There were no preferred shares outstanding as at September 30, 2016 (December 31, 2015 – nil). As at September 30, 2016, there were 12 million (December 31, 2015 – 12 million) common shares available for future issuance under the stock option plan. 15. ACCUMULATED OTHER COMPREHENSIVE INCOME (LOSS) | |
| | | | | | | | | | | | | | | | | | | | | | | | | | | |
| | | Defined Benefit Plan | | | | | | Foreign Currency Translation | | | | | | Available for Sale Financial Assets | | | | | Total | |
| | | | | | | |
As at December 31, 2015 | | | (10 | ) | | | | | | | 1,014 | | | | | | | | 16 | | | | | | 1,020 | |
Other Comprehensive Income (Loss), Before Tax | | | (13 | ) | | | | | | | (205 | ) | | | | | | | (4 | ) | | | | | (222 | ) |
Income Tax | | | 4 | | | | | | | | - | | | | | | | | 3 | | | | | | 7 | |
As at September 30, 2016 | | | (19 | ) | | | | | | | 809 | | | | | | | | 15 | | | | | | 805 | |
| | | | | | | |
| | | Defined Benefit Plan | | | | | | Foreign Currency Translation | | | | | | Available for Sale Financial Assets | | | | | Total | |
| | | | | | | |
As at December 31, 2014 | | | (30 | ) | | | | | | | 427 | | | | | | | | 10 | | | | | | 407 | |
Other Comprehensive Income (Loss), Before Tax | | | 6 | | | | | | | | 463 | | | | | | | | - | | | | | | 469 | |
Income Tax | | | (1 | ) | | | | | | | - | | | | | | | | - | | | | | | (1 | ) |
As at September 30, 2015 | | | (25 | ) | | | | | | | 890 | | | | | | | | 10 | | | | | | 875 | |
| | |
| Cenovus Energy Inc. | | Page 57 |
| Third Quarter 2016 Report | | Notes to Consolidated Financial Statements |
NOTES TO CONSOLIDATED FINANCIAL STATEMENTS (unaudited)
All amounts in $ millions, unless otherwise indicated
For the period ended September 30, 2016
16. STOCK-BASED COMPENSATION PLANS
Cenovus has a number of stock-based compensation plans which include stock options with associated net settlement rights (“NSRs”), stock options with associated tandem stock appreciation rights (“TSARs”), performance share units (“PSUs”), restricted share units (“RSUs”) and deferred share units (“DSUs”). The following table summarizes information related to Cenovus’s stock-based compensation plans:
| | | | | | | | | | | | | | | | | | | | | | | | | | |
| | | | | | | | | | | | | | | Units Outstanding | | | | | Units Exercisable | |
| As at September 30, 2016 | | | | | | | | | | | | | | (thousands) | | | | | (thousands) | |
| | | | | | | |
NSRs | | | | | | | | | | | | | | | | | | | 41,946 | | | | | | 30,038 | |
TSARs | | | | | | | | | | | | | | | | | | | 3,381 | | | | | | 3,381 | |
PSUs | | | | | | | | | | | | | | | | | | | 6,175 | | | | | | - | |
RSUs | | | | | | | | | | | | | | | | | | | 3,797 | | | | | | - | |
DSUs | | | | | | | | | | | | | | | | | | | 1,588 | | | | | | 1,588 | |
| | | | | | | |
| | | | | | | | | | | | | | | Units Granted | | | | | Units Vested and
Paid Out | |
| For the nine months ended September 30, 2016 | | | | | | | | | | | | | | (thousands) | | | | | (thousands) | |
| | | | | | | |
NSRs | | | | | | | | | | | | | | | | | | | 3,646 | | | | | | - | |
PSUs | | | | | | | | | | | | | | | | | | | 2,336 | | | | | | 979 | |
RSUs | | | | | | | | | | | | | | | | | | | 1,708 | | | | | | 32 | |
DSUs | | | | | | | | | | | | | | | | | | | 92 | | | | | | 5 | |
The weighted average exercise price of NSRs and TSARs as at September 30, 2016 was $30.57 and $26.66, respectively. The following table summarizes the stock-based compensation expense (recovery) recorded for all plans: | |
| | | Three Months Ended | | | | | | Nine Months Ended | |
| For the periods ended September 30, | | 2016 | | | | | | 2015 | | | | | | 2016 | | | | | 2015 | |
| | | | | | | |
NSRs | | | 4 | | | | | | | | 6 | | | | | | | | 12 | | | | | | 20 | |
TSARs | | | - | | | | | | | | (1 | ) | | | | | | | - | | | | | | (4 | ) |
PSUs | | | 7 | | | | | | | | - | | | | | | | | 7 | | | | | | (7 | ) |
RSUs | | | 3 | | | | | | | | 2 | | | | | | | | 8 | | | | | | 5 | |
DSUs | | | 2 | | | | | | | | 2 | | | | | | | | 4 | | | | | | (1 | ) |
Stock-Based Compensation Expense | | | 16 | | | | | | | | 9 | | | | | | | | 31 | | | | | | 13 | |
Stock-Based Compensation Costs Capitalized | | | 4 | | | | | | | | 4 | | | | | | | | 8 | | | | | | 6 | |
Total Stock-Based Compensation | | | 20 | | | | | | | | 13 | | | | | | | | 39 | | | | | | 19 | |
| | |
| Cenovus Energy Inc. | | Page 58 |
| Third Quarter 2016 Report | | Notes to Consolidated Financial Statements |
NOTES TO CONSOLIDATED FINANCIAL STATEMENTS (unaudited)
All amounts in $ millions, unless otherwise indicated
For the period ended September 30, 2016
17. CAPITAL STRUCTURE
Cenovus’s capital structure objectives and targets have remained unchanged from previous periods. Cenovus’s capital structure consists of Shareholders’ Equity plus Debt. Debt is defined as short-term borrowings, and the current and long-term portions of long-term debt. Net debt includes the Company’s short-term borrowings, and the current and long-term portions of long-term debt, net of cash and cash equivalents. Cenovus’s objectives when managing its capital structure are to maintain financial flexibility, preserve access to capital markets, ensure its ability to finance internally generated growth and to fund potential acquisitions while maintaining the ability to meet the Company’s financial obligations as they come due.
Cenovus monitors its capital structure and financing requirements using, among other things, non-GAAP financial metrics consisting of Debt to Capitalization and Debt to Adjusted Earnings Before Interest, Taxes and DD&A (“Adjusted EBITDA”). These metrics are used to steward Cenovus’s overall debt position as measures of Cenovus’s overall financial strength.
Over the long term, Cenovus targets a Debt to Capitalization ratio of between 30 and 40 percent and a Debt to Adjusted EBITDA ratio of between 1.0 and 2.0 times. At different points within the economic cycle, Cenovus expects these ratios may periodically be outside of the target range.
A) Debt to Capitalization and Net Debt to Capitalization
| | | | | | | | | | | | |
| As at | | September 30, 2016 | | | | | | December 31, 2015 | |
Debt | | | 6,184 | | | | | | | | 6,525 | |
Add (Deduct): | | | | | | | | | | | | |
Cash and Cash Equivalents | | | (3,850) | | | | | | | | (4,105) | |
Net Debt | | | 2,334 | | | | | | | | 2,420 | |
| | | |
Debt | | | 6,184 | | | | | | | | 6,525 | |
Shareholders’ Equity | | | 11,431 | | | | | | | | 12,391 | |
| | | 17,615 | | | | | | | | 18,916 | |
Debt to Capitalization | | | 35% | | | | | | | | 34% | |
| | | |
Net Debt | | | 2,334 | | | | | | | | 2,420 | |
Shareholders’ Equity | | | 11,431 | | | | | | | | 12,391 | |
| | | 13,765 | | | | | | | | 14,811 | |
Net Debt to Capitalization | | | 17% | | | | | | | | 16% | |
B) Debt to Adjusted EBITDA and Net Debt to Adjusted EBITDA | |
| As at | | September 30, 2016 | | | | | | December 31, 2015 | |
Debt | | | 6,184 | | | | | | | | 6,525 | |
Net Debt | | | 2,334 | | | | | | | | 2,420 | |
| | | |
Net Earnings (Loss) | | | (1,277) | | | | | | | | 618 | |
Add (Deduct): | | | | | | | | | | | | |
Finance Costs | | | 491 | | | | | | | | 482 | |
Interest Income | | | (53) | | | | | | | | (28) | |
Income Tax Expense (Recovery) | | | (694) | | | | | | | | (81) | |
Depreciation, Depletion and Amortization | | | 2,228 | | | | | | | | 2,114 | |
E&E Impairment | | | 119 | | | | | | | | 138 | |
Unrealized (Gain) Loss on Risk Management | | | 466 | | | | | | | | 195 | |
Foreign Exchange (Gain) Loss, Net | | | (134) | | | | | | | | 1,036 | |
(Gain) Loss on Divestitures of Assets | | | 9 | | | | | | | | (2,392) | |
Other (Income) Loss, Net | | | 8 | | | | | | | | 2 | |
Adjusted EBITDA(1) | | | 1,163 | | | | | | | | 2,084 | |
| | | |
Debt to Adjusted EBITDA | | | 5.3x | | | | | | | | 3.1x | |
Net Debt to Adjusted EBITDA | | | 2.0x | | | | | | | | 1.2x | |
| (1) | Calculated on a trailing twelve-month basis. |
| | |
| Cenovus Energy Inc. | | Page 59 |
| Third Quarter 2016 Report | | Notes to Consolidated Financial Statements |
NOTES TO CONSOLIDATED FINANCIAL STATEMENTS (unaudited)
All amounts in $ millions, unless otherwise indicated
For the period ended September 30, 2016
Cenovus will maintain a high level of capital discipline and manage its capital structure to help ensure sufficient liquidity through all stages of the economic cycle. To manage its capital structure, Cenovus may, among other actions, adjust capital and operating spending, adjust dividends paid to shareholders, purchase shares for cancellation pursuant to normal course issuer bids, issue new shares, issue new debt, draw down on its credit facilities or repay existing debt.
Effective April 22, 2016, the Company extended the maturity date of the $1.0 billion tranche of the committed credit facility from November 30, 2017 to April 30, 2019. As at September 30, 2016, Cenovus had $4.0 billion available on its committed credit facility. In addition, Cenovus has in place a US$5.0 billion base shelf prospectus, the availability of which is dependent on market conditions.
Under the committed credit facility, the Company is required to maintain a debt to capitalization ratio not to exceed 65 percent. The Company is well below this limit.
As at September 30, 2016, Cenovus is in compliance with all of the terms of its debt agreements.
18. FINANCIAL INSTRUMENTS
Cenovus’s financial assets and financial liabilities consist of cash and cash equivalents, accounts receivable and accrued revenues, accounts payable and accrued liabilities, risk management assets and liabilities, available for sale financial assets, long-term receivables, short-term borrowings and long-term debt. Risk management assets and liabilities arise from the use of derivative financial instruments.
A) Fair Value of Non-Derivative Financial Instruments
The fair values of cash and cash equivalents, accounts receivable and accrued revenues, accounts payable and accrued liabilities, and short-term borrowings approximate their carrying amount due to the short-term maturity of these instruments.
The fair values of long-term receivables approximate their carrying amount due to the specific non-tradeable nature of these instruments.
Long-term debt is carried at amortized cost. The estimated fair values of long-term borrowings have been determined based on period-end trading prices of long-term borrowings on the secondary market (Level 2). As at September 30, 2016, the carrying value of Cenovus’s long-term debt was $6,184 million and the fair value was $6,271 million (December 31, 2015 carrying value – $6,525 million, fair value – $6,050 million).
Available for sale financial assets comprise private equity investments. These assets are carried at fair value on the Consolidated Balance Sheets in other assets. Fair value is determined based on recent private placement transactions (Level 3) when available. The following table provides a reconciliation of changes in the fair value of available for sale financial assets:
| | | | |
| | | Total | |
As at December 31, 2015 | | | 42 | |
Change in Fair Value(1) | | | (7) | |
As at September 30, 2016 | | | 35 | |
| (1) | Unrealized gains and losses on available for sale financial assets are recorded in other comprehensive income and impairment losses are reclassified to profit or loss. |
| | |
| Cenovus Energy Inc. | | Page 60 |
| Third Quarter 2016 Report | | Notes to Consolidated Financial Statements |
NOTES TO CONSOLIDATED FINANCIAL STATEMENTS (unaudited)
All amounts in $ millions, unless otherwise indicated
For the period ended September 30, 2016
B) Fair Value of Risk Management Assets and Liabilities
The Company’s risk management assets and liabilities consist of crude oil, condensate, power purchase contracts, and interest rate swaps. Crude oil, condensate and, if entered, natural gas contracts, are recorded at their estimated fair value based on the difference between the contracted price and the period-end forward price for the same commodity, using quoted market prices or the period-end forward price for the same commodity extrapolated to the end of the term of the contract (Level 2). The fair value of power purchase contracts are calculated internally based on observable and unobservable inputs such as forward power prices in less active markets (Level 3). The unobservable inputs are obtained from third parties whenever possible and reviewed by the Company for reasonableness. The fair value of interest rate swaps are calculated using external valuation models which incorporate observable market data, including quoted market prices and interest rate yield curves (Level 2).
Summary of Unrealized Risk Management Positions
| | | | | | | | | | | | | | | | | | | | | | | | | | | | | | | | | | | | | | | | | | | | |
| | | September 30, 2016 | | | | | | December 31, 2015 | |
| | | Risk Management | | | | | | Risk Management | |
| As at | | Asset | | | | | | Liability | | | | | | Net | | | | | | Asset | | | | | | Liability | | | | | | Net | |
Commodity Prices | | | | | | | | | | | | | | | | | | | | | | | | | | | | | | | | | | | | | | | | | | | | |
Crude Oil | | | 13 | | | | | | | | 101 | | | | | | | | (88 | ) | | | | | | | 301 | | | | | | | | 15 | | | | | | | | 286 | |
Power(1) | | | - | | | | | | | | - | | | | | | | | - | | | | | | | | - | | | | | | | | 13 | | | | | | | | (13) | |
| | | 13 | | | | | | | | 101 | | | | | | | | (88 | ) | | | | | | | 301 | | | | | | | | 28 | | | | | | | | 273 | |
Interest Rate | | | - | | | | | | | | 93 | | | | | | | | (93 | ) | | | | | | | - | | | | | | | | 2 | | | | | | | | (2) | |
Total Fair Value | | | 13 | | | | | | | | 194 | | | | | | | | (181 | ) | | | | | | | 301 | | | | | | | | 30 | | | | | | | | 271 | |
| (1) | The power contracts were effectively terminated on March 7, 2016. Recent litigation between third parties has caused some uncertainty regarding termination of the contracts. Any related liability or asset to Cenovus is not determinable at this time. |
The following table presents the Company’s fair value hierarchy for risk management assets and liabilities carried at fair value:
| | | | | | | | | | | | |
| As at | | September 30, 2016 | | | | | | December 31, 2015 | |
Prices Sourced From Observable Data or Market Corroboration (Level 2) | | | (181) | | | | | | | | 284 | |
Prices Determined From Unobservable Inputs (Level 3) | | | - | | | | | | | | (13) | |
| | | (181) | | | | | | | | 271 | |
Prices sourced from observable data or market corroboration refers to the fair value of contracts valued in part using active quotes and in part using observable, market-corroborated data. Prices determined from unobservable inputs refers to the fair value of contracts valued using data that is both unobservable and significant to the overall fair value measurement.
The following table provides a reconciliation of changes in the fair value of Cenovus’s risk management assets and liabilities from January 1 to September 30:
| | | | | | | | | | | | |
| | | 2016 | | | | | | 2015 | |
Fair Value of Contracts, Beginning of Year | | | 271 | | | | | | | | 462 | |
Fair Value of Contracts Realized During the Period(1) | | | (199 | ) | | | | | | | (417) | |
Change in Fair Value of Contracts in Place at Beginning of Year and Contracts Entered Into During the Period(2) | | | (241 | ) | | | | | | | 248 | |
Unrealized Foreign Exchange Gain (Loss) on U.S. Dollar Contracts | | | (12 | ) | | | | | | | 4 | |
Fair Value of Contracts, End of Period | | | (181 | ) | | | | | | | 297 | |
| (1) | Includes a realized loss of $3 million related to power contracts (2015 – $7 million loss). |
| (2) | Includes an increase of $10 million related to power contracts (2015 – $10 million decrease). |
C) Earnings Impact of (Gains) Losses From Risk Management Positions
| | | | | | | | | | | | | | | | | | | | | | | | | | | | |
| | | Three Months Ended | | | Nine Months Ended | |
| For the periods ended September 30, | | 2016 | | | | | | 2015 | | | | | | 2016 | | | | | | 2015 | |
| | | | | | | |
Realized (Gain) Loss(1) | | | (41 | ) | | | | | | | (220 | ) | | | | | | | (199 | ) | | | | | | | (417 | ) |
Unrealized (Gain) Loss(2) | | | 7 | | | | | | | | (127 | ) | | | | | | | 440 | | | | | | | | 169 | |
(Gain) Loss on Risk Management | | | (34 | ) | | | | | | | (347 | ) | | | | | | | 241 | | | | | | | | (248 | ) |
| (1) | Realized gains and losses on risk management are recorded in the operating segment to which the derivative instrument relates. |
| (2) | Unrealized gains and losses on risk management are recorded in the Corporate and Eliminations segment. |
| | |
| Cenovus Energy Inc. | | Page 61 |
| Third Quarter 2016 Report | | Notes to Consolidated Financial Statements |
NOTES TO CONSOLIDATED FINANCIAL STATEMENTS (unaudited)
All amounts in $ millions, unless otherwise indicated
For the period ended September 30, 2016
19. RISK MANAGEMENT
The Company is exposed to financial risks, including market risk related to commodity prices, foreign exchange rates, interest rates as well as credit risk and liquidity risk. A description of the nature and extent of risks arising from the Company’s financial assets and liabilities can be found in the notes to the annual Consolidated Financial Statements as at December 31, 2015. The Company’s exposure to these risks has not changed significantly since December 31, 2015. To manage the Company’s exposure to interest rate volatility, the Company has entered into interest rate swap contracts related to future debt issuances. As at September 30, 2016, the Company had a notional amount of US$400 million in interest rate swaps.
Net Fair Value of Risk Management Positions
| | | | | | | | | | | | | | | | | | | | | | | | | | | | |
| As at September 30, 2016 | | Notional Volumes | | | | | | Terms | | | | | | Average Price | | | | | | Fair Value | |
| | | | | | | |
Crude Oil Contracts | | | | | | | | | | | | | | | | | | | | | | | | | | | | |
Fixed Price Contracts | | | | | | | | | | | | | | | | | | | | | | | | | | | | |
Brent Fixed Price | | | 10,000 bbls/d | | | | | | | | January – December 2016 | | | | | | | | US$66.93/bbl | | | | | | | | 20 | |
Brent Fixed Price | | | 5,000 bbls/d | | | | | | | | July – December 2016 | | | | | | | | $75.46/bbl | | | | | | | | 4 | |
Brent Fixed Price | | | 10,000 bbls/d | | | | | | | | July – December 2017 | | | | | | | | US$53.09/bbl | | | | | | | | (2 | ) |
Brent Fixed Price | | | 10,000 bbls/d | | | | | | | | January – June 2018 | | | | | | | | US$54.06/bbl | | | | | | | | (3 | ) |
WTI Fixed Price | | | 10,000 bbls/d | | | | | | | | July – December 2016 | | | | | | | | US$39.02/bbl | | | | | | | | (12 | ) |
WTI Fixed Price | | | 70,000 bbls/d | | | | | | | | January – June 2017 | | | | | | | | US$46.35/bbl | | | | | | | | (77 | ) |
WCS Differential(1) | | | 31,600 bbls/d | | | | | | | | January – December 2016 | | | | | | | | US$(13.96)/bbl | | | | | | | | 1 | |
| | | | | | | |
Brent Collars | | | 10,000 bbls/d | | | | | | | | July – December 2016 | | | | | | |
| US$45.55 –
US$56.55/bbl |
| | | | | | | - | |
WTI Collars | | | 30,000 bbls/d | | | | | | | | July – December 2016 | | | | | | |
| US$45.39 –
US$55.36/bbl |
| | | | | | | 2 | |
WTI Collars | | | 30,000 bbls/d | | | | | | | | July – December 2017 | | | | | | |
| US$43.92 –
US$53.96/bbl |
| | | | | | | (20 | ) |
Other Financial Positions(2) | | | | | | | | | | | | | | | | | | | | | | | | | | | (3 | ) |
Crude Oil Fair Value Position | | | | | | | | | | | | | | | | | | | | | | | | | | | (90 | ) |
| | | | | | | |
Condensate Purchase Contracts | | | | | | | | | | | | | | | | | | | | | | | | | | | | |
Mont Belvieu Fixed Price | | | 3,000 bbls/d | | | | | | | | January – December 2016 | | | | | | | | US$39.20/bbl | | | | | | | | 2 | |
| | | | | | | |
Interest Rate Swaps | | | | | | | | | | | | | | | | | | | | | | | | | | | (93 | ) |
| (1) | Cenovus entered into fixed-price swaps and futures to protect against widening light/heavy price differentials for heavy crudes. |
| (2) | Other financial positions are part of ongoing operations to market the Company’s production. |
Sensitivities – Risk Management Positions
The following table summarizes the sensitivity of the fair value of Cenovus’s risk management positions to fluctuations in commodity prices or interest rates, with all other variables held constant. Management believes the price and interest rate fluctuations identified in the table below are a reasonable measure of volatility. The impact of fluctuating commodity prices and interest rates on the Company’s open risk management positions could have resulted in unrealized gains (losses) impacting earnings before income tax based on the risk management positions in place as follows:
Risk Management Positions in Place as at September 30, 2016
| | | | | | | | | | | | | | |
| | | Sensitivity Range | | Increase | | | | | | Decrease | |
| | | | |
| Crude Oil Commodity Price | | ± US$10 per bbl Applied to Brent and WTI Hedges | | | (394 | ) | | | | | | | 394 | |
| Crude Oil Differential Price | | ± US$5 per bbl Applied to Differential Hedges Tied to Production | | | 16 | | | | | | | | (16 | ) |
| Condensate Commodity Price | | ± US$10 per bbl Applied to Condensate Hedges | | | 27 | | | | | | | | (27 | ) |
| Interest Rate Swaps | | ± 50 Basis Points | | | 56 | | | | | | | | (65 | ) |
| | |
| Cenovus Energy Inc. | | Page 62 |
| Third Quarter 2016 Report | | Notes to Consolidated Financial Statements |
NOTES TO CONSOLIDATED FINANCIAL STATEMENTS (unaudited)
All amounts in $ millions, unless otherwise indicated
For the period ended September 30, 2016
20. COMMITMENTS AND CONTINGENCIES
A) Commitments
Cenovus has entered into various commitments in the normal course of operations primarily related to demand charges on firm transportation agreements. In addition, the Company has commitments related to its risk management program and an obligation to fund its defined benefit pension and other post-employment benefit plans. Additional information related to the Company’s commitments can be found in the notes to the annual Consolidated Financial Statements for the year ended December 31, 2015.
During the nine months ended September 30, 2016, the Company’s transportation commitments decreased approximately $1.5 billion primarily due to a net decrease in toll estimates. These agreements, some of which are subject to regulatory approval, are for terms up to 20 years subsequent to the date of commencement. As at September 30, 2016, total transportation commitments were $26 billion.
As at September 30, 2016, there were outstanding letters of credit aggregating $275 million issued as security for performance under certain contracts (December 31, 2015 – $64 million).
B) Legal Proceedings
Cenovus is involved in a limited number of legal claims associated with the normal course of operations. Cenovus believes it has made adequate provisions for such legal claims. There are no individually or collectively significant claims.
| | |
| Cenovus Energy Inc. | | Page 63 |
| Third Quarter 2016 Report | | Notes to Consolidated Financial Statements |
SUPPLEMENTAL INFORMATION(unaudited)
Financial Statistics
($ millions, except per share amounts)
| | | | | | | | | | | | | | | | | | | | | | | | | | | | | | | | | | | | | | | | | | | | |
| Revenues | | 2016 | | | | | | 2015 | |
| | | Year
to Date | | | Q3 | | | Q2 | | | Q1 | | | | | | Year | | | Q4 | | | Q3 Year
to Date | | | Q3 | | | Q2 | | | Q1 | |
| | | | | | | | | | | |
Gross Sales | | | | | | | | | | | | | | | | | | | | | | | | | | | | | | | | | | | | | | | | | | | | |
Upstream | | | 2,870 | | | | 1,123 | | | | 1,003 | | | | 744 | | | | | | | | 4,739 | | | | 1,002 | | | | 3,737 | | | | 1,152 | | | | 1,410 | | | | 1,175 | |
Refining and Marketing | | | 5,962 | | | | 2,245 | | | | 2,129 | | | | 1,588 | | | | | | | | 8,805 | | | | 2,030 | | | | 6,775 | | | | 2,242 | | | | 2,437 | | | | 2,096 | |
Corporate and Eliminations | | | (245 | ) | | | (89 | ) | | | (89 | ) | | | (67 | ) | | | | | | | (337 | ) | | | (77 | ) | | | (260 | ) | | | (86 | ) | | | (68 | ) | | | (106 | ) |
Less: Royalties | | | 95 | | | | 39 | | | | 36 | | | | 20 | | | | | | | | 143 | | | | 31 | | | | 112 | | | | 35 | | | | 53 | | | | 24 | |
Revenues | | | 8,492 | | | | 3,240 | | | | 3,007 | | | | 2,245 | | | | | | | | 13,064 | | | | 2,924 | | | | 10,140 | | | | 3,273 | | | | 3,726 | | | | 3,141 | |
| | | |
| Operating Cash Flow | | 2016 | | | | | | 2015 | |
| | | Year
to Date | | | Q3 | | | Q2 | | | Q1 | | | | | | Year | | | Q4 | | | Q3 Year
to Date | | | Q3 | | | Q2 | | | Q1 | |
Crude Oil and Natural Gas Liquids | | | | | | | | | | | | | | | | | | | | | | | | | | | | | | | | | | | | | | | | | | | | |
Foster Creek | | | 234 | | | | 125 | | | | 98 | | | | 11 | | | | | | | | 454 | | | | 72 | | | | 382 | | | | 168 | | | | 130 | | | | 84 | |
Christina Lake | | | 308 | | | | 140 | | | | 134 | | | | 34 | | | | | | | | 592 | | | | 118 | | | | 474 | | | | 159 | | | | 199 | | | | 116 | |
Conventional | | | 302 | | | | 108 | | | | 106 | | | | 88 | | | | | | | | 683 | | | | 132 | | | | 551 | | | | 163 | | | | 223 | | | | 165 | |
Natural Gas | | | 91 | | | | 47 | | | | 10 | | | | 34 | | | | | | | | 307 | | | | 69 | | | | 238 | | | | 79 | | | | 78 | | | | 81 | |
Other Upstream Operations | | | (1 | ) | | | (1 | ) | | | - | | | | - | | | | | | | | 18 | | | | 6 | | | | 12 | | | | 3 | | | | 2 | | | | 7 | |
| | | 934 | | | | 419 | | | | 348 | | | | 167 | | | | | | | | 2,054 | | | | 397 | | | | 1,657 | | | | 572 | | | | 632 | | | | 453 | |
Refining and Marketing | | | 238 | | | | 68 | | | | 193 | | | | (23 | ) | | | | | | | 385 | | | | (40 | ) | | | 425 | | | | 30 | | | | 300 | | | | 95 | |
Operating Cash Flow(1) | | | 1,172 | | | | 487 | | | | 541 | | | | 144 | | | | | | | | 2,439 | | | | 357 | | | | 2,082 | | | | 602 | | | | 932 | | | | 548 | |
| | | |
| Cash Flow | | 2016 | | | | | | 2015 | |
| | | Year
to Date | | | Q3 | | | Q2 | | | Q1 | | | | | | Year | | | Q4 | | | Q3 Year
to Date | | | Q3 | | | Q2 | | | Q1 | |
Cash from Operating Activities | | | 697 | | | | 310 | | | | 205 | | | | 182 | | | | | | | | 1,474 | | | | 322 | | | | 1,152 | | | | 542 | | | | 335 | | | | 275 | |
Deduct (Add Back): | | | | | | | | | | | | | | | | | | | | | | | | | | | | | | | | | | | | | | | | | | | | |
Net Change in Other Assets and Liabilities | | | (59 | ) | | | (13 | ) | | | (17 | ) | | | (29 | ) | | | | | | | (107 | ) | | | (26 | ) | | | (81 | ) | | | (13 | ) | | | (14 | ) | | | (54 | ) |
Net Change in Non-Cash Working Capital | | | (132 | ) | | | (99 | ) | | | (218 | ) | | | 185 | | | | | | | | (110 | ) | | | 73 | | | | (183 | ) | | | 111 | | | | (128 | ) | | | (166 | ) |
Cash Flow(2) | | | 888 | | | | 422 | | | | 440 | | | | 26 | | | | | | | | 1,691 | | | | 275 | | | | 1,416 | | | | 444 | | | | 477 | | | | 495 | |
Per Share - Basic | | | 1.07 | | | | 0.51 | | | | 0.53 | | | | 0.03 | | | | | | | | 2.07 | | | | 0.33 | | | | 1.74 | | | | 0.53 | | | | 0.58 | | | | 0.64 | |
- Diluted | | | 1.07 | | | | 0.51 | | | | 0.53 | | | | 0.03 | | | | | | | | 2.07 | | | | 0.33 | | | | 1.74 | | | | 0.53 | | | | 0.58 | | | | 0.64 | |
| | | |
| Earnings | | 2016 | | | | | | 2015 | |
| | | Year
to Date | | | Q3 | | | Q2 | | | Q1 | | | | | | Year | | | Q4 | | | Q3 Year
to Date | | | Q3 | | | Q2 | | | Q1 | |
Operating Earnings (Loss)(3) | | | (698 | ) | | | (236 | ) | | | (39 | ) | | | (423 | ) | | | | | | | (403 | ) | | | (438 | ) | | | 35 | | | | (28 | ) | | | 151 | | | | (88 | ) |
Per Share - Diluted | | | (0.84 | ) | | | (0.28 | ) | | | (0.05 | ) | | | (0.51 | ) | | | | | | | (0.49 | ) | | | (0.53 | ) | | | 0.04 | | | | (0.03 | ) | | | 0.18 | | | | (0.11 | ) |
| | | | | | | | | | | | | | | | | | | | | | | | | | | | | | | | | | | | | | | | | | | | |
Net Earnings (Loss) | | | (636 | ) | | | (251 | ) | | | (267 | ) | | | (118 | ) | | | | | | | 618 | | | | (641 | ) | | | 1,259 | | | | 1,801 | | | | 126 | | | | (668 | ) |
Per Share - Basic | | | (0.76 | ) | | | (0.30 | ) | | | (0.32 | ) | | | (0.14 | ) | | | | | | | 0.75 | | | | (0.77 | ) | | | 1.55 | | | | 2.16 | | | | 0.15 | | | | (0.86 | ) |
- Diluted | | | (0.76 | ) | | | (0.30 | ) | | | (0.32 | ) | | | (0.14 | ) | | | | | | | 0.75 | | | | (0.77 | ) | | | 1.55 | | | | 2.16 | | | | 0.15 | | | | (0.86 | ) |
| | | |
| Tax & Exchange Rates | | 2016 | | | | | | 2015 | |
| | | Year
to Date | | | Q3 | | | Q2 | | | Q1 | | | | | | Year | | | Q4 | | | Q3 Year
to Date | | | Q3 | | | Q2 | | | Q1 | |
Effective Tax Rates Using: | | | | | | | | | | | | | | | | | | | | | | | | | | | | | | | | | | | | | | | | | | | | |
Net Earnings(4) | | | 41.6% | | | | | | | | | | | | | | | | | | | | (15.1)% | | | | | | | | | | | | | | | | | | | | | |
Operating Earnings, Excluding Divestitures | | | 29.2% | | | | | | | | | | | | | | | | | | | | 32.4% | | | | | | | | | | | | | | | | | | | | | |
Canadian Statutory Rate(5) | | | 27.0% | | | | | | | | | | | | | | | | | | | | 26.1% | | | | | | | | | | | | | | | | | | | | | |
U.S. Statutory Rate | | | 38.0% | | | | | | | | | | | | | | | | | | | | 38.0% | | | | | | | | | | | | | | | | | | | | | |
| | | | | | | | | | | | | | | | | | | | | | | | | | | | | | | | | | | | | | | | | | | | |
Foreign Exchange Rates(US$ per C$1) | | | | | | | | | | | | | | | | | | | | | | | | | | | | | | | | | | | | | | | | | | | | |
Average | | | 0.757 | | | | 0.766 | | | | 0.776 | | | | 0.728 | | | | | | | | 0.782 | | | | 0.749 | | | | 0.794 | | | | 0.764 | | | | 0.813 | | | | 0.806 | |
Period End | | | 0.762 | | | | 0.762 | | | | 0.769 | | | | 0.771 | | | | | | | | 0.723 | | | | 0.723 | | | | 0.747 | | | | 0.747 | | | | 0.802 | | | | 0.789 | |
| (1) | Operating Cash Flow is a non-GAAP measure defined as revenues less purchased product, transportation and blending, operating expenses and production and mineral taxes plus realized gains less realized losses on risk management activities. Items within the Corporate and Eliminations segment are excluded from the calculation of Operating Cash Flow. |
| (2) | Cash Flow is a non-GAAP measure defined as cash from operating activities excluding net change in other assets and liabilities and net change in non-cash working capital, both of which are defined on the Consolidated Statement of Cash Flows. |
| (3) | Operating Earnings (Loss) is a non-GAAP measure that is used to provide a consistent measure of the comparability of our underlying financial performance between periods by removing non-operating items. Operating Earnings (Loss) is defined as Earnings (Loss) Before Income Tax excluding gain (loss) on discontinuance, gain on bargain purchase, unrealized risk management gains (losses) on derivative instruments, unrealized foreign exchange gains (losses) on translation of U.S. dollar denominated notes issued from Canada, foreign exchange gains (losses) on settlement of intercompany transactions, gains (losses) on divestiture of assets, less income taxes on Operating Earnings (Loss) before tax, excluding the effect of changes in statutory income tax rates and the recognition of an increase in U.S. tax basis. |
| (4) | The 2015 effective tax rate reflects an increase to the tax basis of Cenovus’s U.S. assets, the two percent increase in the Alberta corporate income tax rate and the benefit from recognition of previously unrecognized capital losses. |
| (5) | On June 29, 2015, the Alberta government enacted a two percent increase in the corporate income tax rate. The rate increase was effective July 1, 2015. |
| | | | | | | | | | | | | | | | | | | | | | | | | | | | | | | | | | | | | | | | | | | | |
| Financial Metrics (Non-GAAP measures) | | 2016 | | | | | | 2015 | |
| | | Year
to Date | | | Q3 | | | Q2 | | | Q1 | | | | | | Year | | | Q4 | | | Q3 Year
to Date | | | Q3 | | | Q2 | | | Q1 | |
| | | | | | | | | | | |
Net Debt to Capitalization(1) (2) | | | 17% | | | | 17% | | | | 17% | | | | 16% | | | | | | | | 16% | | | | 16% | | | | 13% | | | | 13% | | | | 28% | | | | 27% | |
Debt to Capitalization (3) (4) | | | 35% | | | | 35% | | | | 34% | | | | 34% | | | | | | | | 34% | | | | 34% | | | | 33% | | | | 33% | | | | 35% | | | | 35% | |
Net Debt to Adjusted EBITDA(1) (5) | | | 2.0x | | | | 2.0x | | | | 1.9x | | | | 1.3x | | | | | | | | 1.2x | | | | 1.2x | | | | 0.8x | | | | 0.8x | | | | 1.5x | | | | 1.3x | |
Debt to Adjusted EBITDA(3) (5) | | | 5.3x | | | | 5.3x | | | | 4.8x | | | | 3.6x | | | | | | | | 3.1x | | | | 3.1x | | | | 2.7x | | | | 2.7x | | | | 2.1x | | | | 1.9x | |
Return on Capital Employed (6) | | | (6)% | | | | (6)% | | | | 6% | | | | 8% | | | | | | | | 5% | | | | 5% | | | | 6% | | | | 6% | | | | (3)% | | | | 0% | |
Return on Common Equity(7) | | | (10)% | | | | (10)% | | | | 7% | | | | 10% | | | | | | | | 5% | | | | 5% | | | | 7% | | | | 7% | | | | (6)% | | | | (2)% | |
| (1) | Net debt includes the Company’s short-term borrowings, and the current and long-term portions of long-term debt, net of cash and cash equivalents. |
| (2) | Net debt to capitalization is defined as net debt divided by net debt plus shareholders’ equity. |
| (3) | Debt includes the Company’s short-term borrowings and the current and long-term portions of long-term debt. |
| (4) | Capitalization is a non-GAAP measure defined as debt plus shareholders’ equity. |
| (5) | Adjusted EBITDA is defined as earnings before finance costs, interest income, income tax expense, depreciation, depletion and amortization, asset impairments, unrealized gains (losses) on risk management, foreign exchange gains (losses), gains (losses) on divestiture of assets and other income (loss), net, calculated on a trailing twelve-month basis. |
| (6) | Return on capital employed is calculated, on a trailing twelve-month basis, as net earnings before after-tax interest divided by average shareholders’ equity plus average debt. |
| (7) | Return on common equity is calculated, on a trailing twelve-month basis, as net earnings divided by average shareholders’ equity. |
| | |
| Cenovus Energy Inc. | | Page 64 |
| Third Quarter 2016 Report | | Supplemental Information |
SUPPLEMENTAL INFORMATION(unaudited)
Financial Statistics (continued)
| | | | | | | | | | | | | | | | | | | | | | | | | | | | | | | | | | | | | | | | |
| Common Share Information | | 2016 | | | 2015 | |
| | | Year to Date | | | Q3 | | | Q2 | | | Q1 | | | Year | | | Q4 | | | Q3 Year to Date | | | Q3 | | | Q2 | | | Q1 | |
Common Shares Outstanding(millions) | | | | | | | | | | | | | | | | | | | | | | | | | | | | | | | | | | | | | | | | |
Period End | | | 833.3 | | | | 833.3 | | | | 833.3 | | | | 833.3 | | | | 833.3 | | | | 833.3 | | | | 833.3 | | | | 833.3 | | | | 833.3 | | | | 828.5 | |
Average - Basic | | | 833.3 | | | | 833.3 | | | | 833.3 | | | | 833.3 | | | | 818.7 | | | | 833.3 | | | | 813.8 | | | | 833.3 | | | | 828.6 | | | | 778.9 | |
Average - Diluted | | | 833.3 | | | | 833.3 | | | | 833.3 | | | | 833.3 | | | | 818.7 | | | | 833.3 | | | | 813.8 | | | | 833.3 | | | | 828.6 | | | | 778.9 | |
| | | | | | | | | | |
Price Range($ per share) | | | | | | | | | | | | | | | | | | | | | | | | | | | | | | | | | | | | | | | | |
TSX - C$ | | | | | | | | | | | | | | | | | | | | | | | | | | | | | | | | | | | | | | | | |
High | | | 21.00 | | | | 20.06 | | | | 21.00 | | | | 18.15 | | | | 26.42 | | | | 22.35 | | | | 26.42 | | | | 20.91 | | | | 24.28 | | | | 26.42 | |
Low | | | 12.70 | | | | 17.15 | | | | 16.12 | | | | 12.70 | | | | 15.75 | | | | 16.85 | | | | 15.75 | | | | 15.75 | | | | 19.53 | | | | 20.45 | |
Close | | | 18.83 | | | | 18.83 | | | | 17.87 | | | | 16.90 | | | | 17.50 | | | | 17.50 | | | | 20.24 | | | | 20.24 | | | | 19.98 | | | | 21.35 | |
| | | | | | | | | | |
NYSE - US$ | | | | | | | | | | | | | | | | | | | | | | | | | | | | | | | | | | | | | | | | |
High | | | 16.56 | | | | 15.72 | | | | 16.56 | | | | 13.97 | | | | 21.12 | | | | 17.23 | | | | 21.12 | | | | 15.97 | | | | 19.72 | | | | 21.12 | |
Low | | | 9.10 | | | | 12.93 | | | | 12.25 | | | | 9.10 | | | | 11.85 | | | | 12.10 | | | | 11.85 | | | | 11.85 | | | | 15.69 | | | | 16.29 | |
Close | | | 14.37 | | | | 14.37 | | | | 13.82 | | | | 13.00 | | | | 12.62 | | | | 12.62 | | | | 15.16 | | | | 15.16 | | | | 16.01 | | | | 16.88 | |
| | | | | | | | | | |
Dividends($ per share) | | | 0.1500 | | | | 0.0500 | | | | 0.0500 | | | | 0.0500 | | | | 0.8524 | | | | 0.1600 | | | | 0.6924 | | | | 0.1600 | | | | 0.2662 | | | | 0.2662 | |
| | | | | | | | | | |
Share Volume Traded(millions) | | | 1,169.1 | | | | 313.0 | | | | 373.3 | | | | 482.8 | | | | 1,691.2 | | | | 377.1 | | | | 1,314.1 | | | | 483.3 | | | | 388.7 | | | | 442.1 | |
| | |
| Net Capital Investment | | 2016 | | | 2015 | |
| | | Year
to Date | | | Q3 | | | Q2 | | | Q1 | | | Year | | | Q4 | | | Q3 Year
to Date | | | Q3 | | | Q2 | | | Q1 | |
Capital Investment($ millions) | | | | | | | | | | | | | | | | | | | | | | | | | | | | | | | | | | | | | | | | |
Oil Sands | | | | | | | | | | | | | | | | | | | | | | | | | | | | | | | | | | | | | | | | |
Foster Creek | | | 211 | | | | 54 | | | | 68 | | | | 89 | | | | 403 | | | | 85 | | | | 318 | | | | 96 | | | | 73 | | | | 149 | |
Christina Lake | | | 222 | | | | 47 | | | | 61 | | | | 114 | | | | 647 | | | | 132 | | | | 515 | | | | 147 | | | | 161 | | | | 207 | |
Total | | | 433 | | | | 101 | | | | 129 | | | | 203 | | | | 1,050 | | | | 217 | | | | 833 | | | | 243 | | | | 234 | | | | 356 | |
Other Oil Sands | | | 43 | | | | 9 | | | | 10 | | | | 24 | | | | 135 | | | | 22 | | | | 113 | | | | 29 | | | | 26 | | | | 58 | |
| | | 476 | | | | 110 | | | | 139 | | | | 227 | | | | 1,185 | | | | 239 | | | | 946 | | | | 272 | | | | 260 | | | | 414 | |
| | | | | | | | | | |
Conventional | | | 114 | | | | 41 | | | | 34 | | | | 39 | | | | 244 | | | | 87 | | | | 157 | | | | 55 | | | | 36 | | | | 66 | |
Refining and Marketing | | | 156 | | | | 51 | | | | 53 | | | | 52 | | | | 248 | | | | 89 | | | | 159 | | | | 67 | | | | 48 | | | | 44 | |
Corporate | | | 21 | | | | 6 | | | | 10 | | | | 5 | | | | 37 | | | | 13 | | | | 24 | | | | 6 | | | | 13 | | | | 5 | |
Capital Investment | | | 767 | | | | 208 | | | | 236 | | | | 323 | | | | 1,714 | | | | 428 | | | | 1,286 | | | | 400 | | | | 357 | | | | 529 | |
Acquisitions | | | 11 | | | | - | | | | 11 | | | | - | | | | 87 | | | | 3 | | | | 84 | | | | 84 | | | | - | | | | - | |
Divestitures | | | (8 | ) | | | (8 | ) | | | - | | | | - | | | | (3,344 | ) | | | 1 | | | | (3,345 | ) | | | (3,329 | ) | | | - | | | | (16 | ) |
Net Acquisition and Divestiture Activity | | | 3 | | | | (8 | ) | | | 11 | | | | - | | | | (3,257 | ) | | | 4 | | | | (3,261 | ) | | | (3,245 | ) | | | - | | | | (16 | ) |
Net Capital Investment | | | 770 | | | | 200 | | | | 247 | | | | 323 | | | | (1,543 | ) | | | 432 | | | | (1,975 | ) | | | (2,845 | ) | | | 357 | | | | 513 | |
| | | | | | | | |
| Operating Statistics - Before Royalties | | | | | | | | | | | | | | | | | | | | | | | | | | | | | | | | | |
| | |
| Upstream Production Volumes | | 2016 | | | 2015 | |
| | | Year
to Date | | | Q3 | | | Q2 | | | Q1 | | | Year | | | Q4 | | | Q3 Year
to Date | | | Q3 | | | Q2 | | | Q1 | |
Crude Oil and Natural Gas Liquids(bbls/d) | | | | | | | | | | | | | | | | | | | | | | | | | | | | | | | | | | | | | | | | |
Oil Sands | | | | | | | | | | | | | | | | | | | | | | | | | | | | | | | | | | | | | | | | |
Foster Creek | | | 66,435 | | | | 73,798 | | | | 64,544 | | | | 60,882 | | | | 65,345 | | | | 63,680 | | | | 65,906 | | | | 71,414 | | | | 58,363 | | | | 67,901 | |
Christina Lake | | | 78,321 | | | | 79,793 | | | | 78,060 | | | | 77,093 | | | | 74,975 | | | | 75,733 | | | | 74,720 | | | | 75,329 | | | | 72,371 | | | | 76,471 | |
| | | 144,756 | | | | 153,591 | | | | 142,604 | | | | 137,975 | | | | 140,320 | | | | 139,413 | | | | 140,626 | | | | 146,743 | | | | 130,734 | | | | 144,372 | |
Conventional | | | | | | | | | | | | | | | | | | | | | | | | | | | | | | | | | | | | | | | | |
Heavy Oil | | | 29,276 | | | | 28,096 | | | | 28,500 | | | | 31,247 | | | | 34,888 | | | | 32,363 | | | | 35,739 | | | | 33,997 | | | | 36,099 | | | | 37,155 | |
Light and Medium Oil | | | 26,200 | | | | 25,311 | | | | 26,177 | | | | 27,121 | | | | 30,486 | | | | 26,625 | | | | 31,787 | | | | 28,491 | | | | 31,809 | | | | 35,135 | |
Natural Gas Liquids(1) | | | 1,027 | | | | 1,074 | | | | 799 | | | | 1,208 | | | | 1,253 | | | | 1,155 | | | | 1,286 | | | | 1,191 | | | | 1,312 | | | | 1,358 | |
| | | | 56,503 | | | | 54,481 | | | | 55,476 | | | | 59,576 | | | | 66,627 | | | | 60,143 | | | | 68,812 | | | | 63,679 | | | | 69,220 | | | | 73,648 | |
Total Crude Oil and Natural Gas Liquids | | | 201,259 | | | | 208,072 | | | | 198,080 | | | | 197,551 | | | | 206,947 | | | | 199,556 | | | | 209,438 | | | | 210,422 | | | | 199,954 | | | | 218,020 | |
Natural Gas(MMcf/d) | | | | | | | | | | | | | | | | | | | | | | | | | | | | | | | | | | | | | | | | |
Oil Sands | | | 17 | | | | 18 | | | | 18 | | | | 17 | | | | 19 | | | | 19 | | | | 20 | | | | 19 | | | | 21 | | | | 20 | |
Conventional | | | 382 | | | | 374 | | | | 381 | | | | 391 | | | | 422 | | | | 405 | | | | 427 | | | | 411 | | | | 429 | | | | 442 | |
Total Natural Gas | | | 399 | | | | 392 | | | | 399 | | | | 408 | | | | 441 | | | | 424 | | | | 447 | | | | 430 | | | | 450 | | | | 462 | |
Total Production(BOE/d) | | | 267,759 | | | | 273,405 | | | | 264,580 | | | | 265,551 | | | | 280,447 | | | | 270,223 | | | | 283,938 | | | | 282,089 | | | | 274,954 | | | | 295,020 | |
(1) Natural gas liquids include condensate volumes. | |
| | | | | | | | | | |
| Average Royalty Rates | | | | | | | | | | | | | | | | | | | | | | | | | | | | | | | | | | | | | | | | |
(Excluding Impact of Realized Gain (Loss) on Risk Management) | | | 2016 | | | | 2015 | |
| | |
| Year
to Date |
| | | Q3 | | | | Q2 | | | | Q1 | | | | Year | | | | Q4 | | |
| Q3 Year
to Date |
| | | Q3 | | | | Q2 | | | | Q1 | |
Oil Sands | | | | | | | | | | | | | | | | | | | | | | | | | | | | | | | | | | | | | | | | |
Foster Creek (1) | | | 0.5% | | | | 0.8% | | | | 1.0% | | | | (4.9)% | | | | 1.9% | | | | 0.7% | | | | 2.1% | | | | 0.8% | | | | 5.0% | | | | (1.2)% | |
Christina Lake | | | 1.4% | | | | 1.6% | | | | 1.2% | | | | 1.2% | | | | 2.8% | | | | 1.9% | | | | 3.0% | | | | 3.7% | | | | 2.5% | | | | 3.1% | |
Conventional | | | | | | | | | | | | | | | | | | | | | | | | | | | | | | | | | | | | | | | | |
Pelican Lake | | | 12.8% | | | | 14.1% | | | | 14.3% | | | | 8.3% | | | | 9.0% | | | | 8.1% | | | | 9.2% | | | | 4.7% | | | | 14.3% | | | | 6.0% | |
Weyburn | | | 21.6% | | | | 23.0% | | | | 23.9% | | | | 16.6% | | | | 17.7% | | | | 17.0% | | | | 17.9% | | | | 18.7% | | | | 18.4% | | | | 16.5% | |
Other | | | 10.1% | | | | 10.4% | | | | 8.6% | | | | 12.0% | | | | 5.2% | | | | 12.2% | | | | 3.8% | | | | 8.2% | | | | 1.2% | | | | 3.5% | |
Natural Gas Liquids | | | 14.3% | | | | 12.0% | | | | 15.0% | | | | 16.1% | | | | 5.6% | | | | 12.8% | | | | 3.4% | | | | 7.1% | | | | 2.2% | | | | 2.3% | |
Natural Gas | | | 4.2% | | | | 4.5% | | | | 3.7% | | | | 4.3% | | | | 2.5% | | | | 3.8% | | | | 2.2% | | | | 3.7% | | | | 1.2% | | | | 1.6% | |
(1) In Q1 2015, regulatory approval was received to include certain capital costs incurred in previous years in the royalty calculation which has resulted in a negative rate. Excluding the credit, the Q1 2015 and year-to-date royalty rate would have been 5.9 percent and 3.6 percent, respectively. | |
| | |
| Cenovus Energy Inc. | | Page 65 |
| Third Quarter 2016 Report | | Supplemental Information |
SUPPLEMENTAL INFORMATION(unaudited)
Operating Statistics - Before Royalties (continued)
| | | | | | | | | | | | | | | | | | | | | | | | | | | | | | | | | | | | | | | | | | | | | | | | | | | | | | | | | | | | | | | | | | | | | | | | | | | | |
| Refining | | 2016 | | | 2015 |
| | | Year to Date | | | | | | Q3 | | | | | | Q2 | | | | | | Q1 | | | | | | | | Year | | | | | | Q4 | | | | | | Q3 Year to Date | | | | | | Q3 | | | | | | Q2 | | | | | | Q1 |
Refinery Operations(1) | | | | | | | | | | | | | | | | | | | | | | | | | | | | | | | | | | | | | | | | | | | | | | | | | | | | | | | | | | | | | | | | | | | | | | | | | | | | |
Crude Oil Capacity(Mbbls/d) | | | 460 | | | | | | | | 460 | | | | | | | | 460 | | | | | | | | 460 | | | | | | | | | | 460 | | | | | | | | 460 | | | | | | | | 460 | | | | | | | | 460 | | | | | | | | 460 | | | | | | | 460 |
Crude Oil Runs(Mbbls/d) | | | 452 | | | | | | | | 463 | | | | | | | | 458 | | | | | | | | 435 | | | | | | | | | | 419 | | | | | | | | 405 | | | | | | | | 424 | | | | | | | | 394 | | | | | | | | 441 | | | | | | | 439 |
Heavy Oil | | | 237 | | | | | | | | 241 | | | | | | | | 228 | | | | | | | | 241 | | | | | | | | | | 200 | | | | | | | | 196 | | | | | | | | 202 | | | | | | | | 186 | | | | | | | | 200 | | | | | | | 220 |
Light/Medium | | | 215 | | | | | | | | 222 | | | | | | | | 230 | | | | | | | | 194 | | | | | | | | | | 219 | | | | | | | | 209 | | | | | | | | 222 | | | | | | | | 208 | | | | | | | | 241 | | | | | | | 219 |
Crude Utilization | | | 98% | | | | | | | | 101% | | | | | | | | 100% | | | | | | | | 95% | | | | | | | | | | 91% | | | | | | | | 88% | | | | | | | | 92% | | | | | | | | 86% | | | | | | | | 96% | | | | | | | 95% |
Refined Products(Mbbls/d) | | | 479 | | | | | | | | 494 | | | | | | | | 483 | | | | | | | | 460 | | | | | | | | | | 444 | | | | | | | | 430 | | | | | | | | 448 | | | | | | | | 414 | | | | | | | | 462 | | | | | | | 469 |
(1) Represents 100% of the Wood River and Borger refinery operations. | | | | | | | | | | | | | | | | | | | | | | | | | | | | | | | | | | | | | | | | | | | | | | | | | | | | | | | | | | | | | | | | | | | | | | | | | | | | |
Selected Average Benchmark Prices | | 2016 | | | 2015 |
| | | Year to Date | | | | | | Q3 | | | | | | Q2 | | | | | | Q1 | | | | | | | | Year | | | | | | Q4 | | | | | | Q3 Year to Date | | | | | | Q3 | | | | | | Q2 | | | | | | Q1 |
Crude Oil Prices(US$/bbl) | | | | | | | | | | | | | | | | | | | | | | | | | | | | | | | | | | | | | | | | | | | | | | | | | | | | | | | | | | | | | | | | | | | | | | | | | | | | |
Brent | | | 43.01 | | | | | | | | 46.98 | | | | | | | | 46.97 | | | | | | | | 35.08 | | | | | | | | | | 53.64 | | | | | | | | 44.71 | | | | | | | | 56.61 | | | | | | | | 51.17 | | | | | | | | 63.50 | | | | | | | 55.17 |
West Texas Intermediate (“WTI”) | | | 41.33 | | | | | | | | 44.94 | | | | | | | | 45.59 | | | | | | | | 33.45 | | | | | | | | | | 48.80 | | | | | | | | 42.18 | | | | | | | | 51.00 | | | | | | | | 46.43 | | | | | | | | 57.94 | | | | | | | 48.63 |
Differential Brent - WTI | | | 1.68 | | | | | | | | 2.04 | | | | | | | | 1.38 | | | | | | | | 1.63 | | | | | | | | | | 4.84 | | | | | | | | 2.53 | | | | | | | | 5.61 | | | | | | | | 4.74 | | | | | | | | 5.56 | | | | | | | 6.54 |
Western Canadian Select (“WCS”) | | | 27.65 | | | | | | | | 31.44 | | | | | | | | 32.29 | | | | | | | | 19.21 | | | | | | | | | | 35.28 | | | | | | | | 27.69 | | | | | | | | 37.80 | | | | | | | | 33.16 | | | | | | | | 46.35 | | | | | | | 33.90 |
Differential WTI - WCS | | | 13.68 | | | | | | | | 13.50 | | | | | | | | 13.30 | | | | | | | | 14.24 | | | | | | | | | | 13.52 | | | | | | | | 14.49 | | | | | | | | 13.20 | | | | | | | | 13.27 | | | | | | | | 11.59 | | | | | | | 14.73 |
Condensate (C5 @ Edmonton) | | | 40.51 | | | | | | | | 43.07 | | | | | | | | 44.07 | | | | | | | | 34.39 | | | | | | | | | | 47.36 | | | | | | | | 41.67 | | | | | | | | 49.25 | | | | | | | | 44.21 | | | | | | | | 57.94 | | | | | | | 45.62 |
Differential WTI - Condensate (Premium)/Discount | | | 0.82 | | | | | | | | 1.87 | | | | | | | | 1.52 | | | | | | | | (0.94 | ) | | | | | | | | | 1.44 | | | | | | | | 0.51 | | | | | | | | 1.75 | | | | | | | | 2.22 | | | | | | | | - | | | | | | | 3.01 |
Refining Margins 3-2-1 Crack Spreads(1)(US$/bbl) | | | | | | | | | | | | | | | | | | | | | | | | | | | | | | | | | | | | | | | | | | | | | | | | | | | | | | | | | | | | | | | | | | | | | | | | | | | | |
Chicago | | | 13.77 | | | | | | | | 14.58 | | | | | | | | 17.15 | | | | | | | | 9.58 | | | | | | | | | | 19.11 | | | | | | | | 14.47 | | | | | | | | 20.66 | | | | | | | | 24.67 | | | | | | | | 20.77 | | | | | | | 16.53 |
Group 3 | | | 12.71 | | | | | | | | 14.56 | | | | | | | | 13.03 | | | | | | | | 10.52 | | | | | | | | | | 18.16 | | | | | | | | 13.82 | | | | | | | | 19.61 | | | | | | | | 22.03 | | | | | | | | 19.34 | | | | | | | 17.46 |
Natural Gas Prices | | | | | | | | | | | | | | | | | | | | | | | | | | | | | | | | | | | | | | | | | | | | | | | | | | | | | | | | | | | | | | | | | | | | | | | | | | | | |
AECO(C$/Mcf) | | | 1.85 | | | | | | | | 2.20 | | | | | | | | 1.25 | | | | | | | | 2.11 | | | | | | | | | | 2.77 | | | | | | | | 2.65 | | | | | | | | 2.81 | | | | | | | | 2.80 | | | | | | | | 2.67 | | | | | | | 2.95 |
NYMEX(US$/Mcf) | | | 2.29 | | | | | | | | 2.81 | | | | | | | | 1.95 | | | | | | | | 2.09 | | | | | | | | | | 2.66 | | | | | | | | 2.27 | | | | | | | | 2.80 | | | | | | | | 2.77 | | | | | | | | 2.64 | | | | | | | 2.98 |
Differential NYMEX - AECO(US$/Mcf) | | | 0.89 | | | | | | | | 1.13 | | | | | | | | 0.99 | | | | | | | | 0.56 | | | | | | | | | | 0.49 | | | | | | | | 0.27 | | | | | | | | 0.56 | | | | | | | | 0.61 | | | | | | | | 0.50 | | | | | | | 0.57 |
(1) The 3-2-1 crack spread is an indicator of the refining margin generated by converting three barrels of crude oil into two barrels of regular unleaded gasoline and one barrel of ultra-low sulphur diesel using current month WTI based crude oil feedstock prices and on a last in, first out accounting basis (“LIFO”). |
Per-unit Results (Excluding Impact of Realized Gain (Loss) on Risk Management) | | | | | | 2016 | | | | | | | | | | | 2015 |
| | | Year to Date | | | | | | Q3 | | | | | | Q2 | | | | | | Q1 | | | | | | | | Year | | | | | | Q4 | | | | | | Q3 Year to Date | | | | | | Q3 | | | | | | Q2 | | | | | | Q1 |
Heavy Oil - Foster Creek(1) (2)($/bbl) | | | | | | | | | | | | | | | | | | | | | | | | | | | | | | | | | | | | | | | | | | | | | | | | | | | | | | | | | | | | | | | | | | | | | | | | | | | | |
Price | | | 26.97 | | | | | | | | 33.61 | | | | | | | | 33.40 | | | | | | | | 11.82 | | | | | | | | | | 33.65 | | | | | | | | 25.09 | | | | | | | | 36.58 | | | | | | | | 33.35 | | | | | | | | 48.25 | | | | | | | 29.42 |
Royalties | | | 0.10 | | | | | | | | 0.19 | | | | | | | | 0.23 | | | | | | | | (0.16 | ) | | | | | | | | | 0.47 | | | | | | | | 0.12 | | | | | | | | 0.59 | | | | | | | | 0.20 | | | | | | | | 1.97 | | | | | | | (0.25) |
Transportation and Blending | | | 9.43 | | | | | | | | 8.38 | | | | | | | | 11.44 | | | | | | | | 8.70 | | | | | | | | | | 8.84 | | | | | | | | 8.53 | | | | | | | | 8.95 | | | | | | | | 8.50 | | | | | | | | 9.04 | | | | | | | 9.39 |
Operating | | | 10.52 | | | | | | | | 9.63 | | | | | | | | 10.15 | | | | | | | | 12.05 | | | | | | | | | | 12.60 | | | | | | | | 11.66 | | | | | | | | 12.92 | | | | | | | | 11.27 | | | | | | | | 13.29 | | | | | | | 14.50 |
Netback | | | 6.92 | | | | | | | | 15.41 | | | | | | | | 11.58 | | | | | | | | (8.77 | ) | | | | | | | | | 11.74 | | | | | | | | 4.78 | | | | | | | | 14.12 | | | | | | | | 13.38 | | | | | | | | 23.95 | | | | | | | 5.78 |
Heavy Oil - Christina Lake(1) (2)($/bbl) | | | | | | | | | | | | | | | | | | | | | | | | | | | | | | | | | | | | | | | | | | | | | | | | | | | | | | | | | | | | | | | | | | | | | | | | | | | | |
Price | | | 22.01 | | | | | | | | 29.11 | | | | | | | | 28.31 | | | | | | | | 8.85 | | | | | | | | | | 28.45 | | | | | | | | 21.34 | | | | | | | | 30.92 | | | | | | | | 27.46 | | | | | | | | 43.36 | | | | | | | 23.30 |
Royalties | | | 0.25 | | | | | | | | 0.41 | | | | | | | | 0.28 | | | | | | | | 0.05 | | | | | | | | | | 0.67 | | | | | | | | 0.30 | | | | | | | | 0.80 | | | | | | | | 0.83 | | | | | | | | 0.99 | | | | | | | 0.61 |
Transportation and Blending | | | 4.89 | | | | | | | | 4.49 | | | | | | | | 4.90 | | | | | | | | 5.28 | | | | | | | | | | 4.72 | | | | | | | | 5.40 | | | | | | | | 4.49 | | | | | | | | 5.00 | | | | | | | | 4.29 | | | | | | | 4.17 |
Operating | | | 7.24 | | | | | | | | 7.72 | | | | | | | | 6.35 | | | | | | | | 7.61 | | | | | | | | | | 8.01 | | | | | | | | 7.80 | | | | | | | | 8.08 | | | | | | | | 7.80 | | | | | | | | 8.20 | | | | | | | 8.24 |
Netback | | | 9.63 | | | | | | | | 16.49 | | | | | | | | 16.78 | | | | | | | | (4.09 | ) | | | | | | | | | 15.05 | | | | | | | | 7.84 | | | | | | | | 17.55 | | | | | | | | 13.83 | | | | | | | | 29.88 | | | | | | | 10.28 |
Total Heavy Oil - Oil Sands(1) (2)($/bbl) | | | | | | | | | | | | | | | | | | | | | | | | | | | | | | | | | | | | | | | | | | | | | | | | | | | | | | | | | | | | | | | | | | | | | | | | | | | | |
Price | | | 24.28 | | | | | | | | 31.30 | | | | | | | | 30.59 | | | | | | | | 10.13 | | | | | | | | | | 30.88 | | | | | | | | 23.08 | | | | | | | | 33.56 | | | | | | | | 30.35 | | | | | | | | 45.61 | | | | | | | 26.04 |
Royalties | | | 0.18 | | | | | | | | 0.30 | | | | | | | | 0.26 | | | | | | | | (0.04 | ) | | | | | | | | | 0.58 | | | | | | | | 0.22 | | | | | | | | 0.70 | | | | | | | | 0.52 | | | | | | | | 1.44 | | | | | | | 0.22 |
Transportation and Blending | | | 6.96 | | | | | | | | 6.39 | | | | | | | | 7.84 | | | | | | | | 6.75 | | | | | | | | | | 6.64 | | | | | | | | 6.85 | | | | | | | | 6.57 | | | | | | | | 6.72 | | | | | | | | 6.48 | | | | | | | 6.50 |
Operating | | | 8.74 | | | | | | | | 8.65 | | | | | | | | 8.06 | | | | | | | | 9.52 | | | | | | | | | | 10.13 | | | | | | | | 9.59 | | | | | | | | 10.32 | | | | | | | | 9.46 | | | | �� | | | | 10.57 | | | | | | | 10.99 |
Netback | | | 8.40 | | | | | | | | 15.96 | | | | | | | | 14.43 | | | | | | | | (6.10 | ) | | | | | | | | | 13.53 | | | | | | | | 6.42 | | | | | | | | 15.97 | | | | | | | | 13.65 | | | | | | | | 27.12 | | | | | | | 8.33 |
Heavy Oil - Conventional(1) (2)($/bbl) | | | | | | | | | | | | | | | | | | | | | | | | | | | | | | | | | | | | | | | | | | | | | | | | | | | | | | | | | | | | | | | | | | | | | | | | | | | | |
Price | | | 34.18 | | | | | | | | 40.50 | | | | | | | | 36.77 | | | | | | | | 25.99 | | | | | | | | | | 39.95 | | | | | | | | 32.84 | | | | | | | | 42.01 | | | | | | | | 37.09 | | | | | | | | 52.63 | | | | | | | 35.85 |
Royalties | | | 3.06 | | | | | | | | 3.97 | | | | | | | | 3.95 | | | | | | | | 1.40 | | | | | | | | | | 2.97 | | | | | | | | 2.24 | | | | | | | | 3.18 | | | | | | | | 1.73 | | | | | | | | 5.34 | | | | | | | 2.34 |
Transportation and Blending | | | 4.50 | | | | | | | | 4.86 | | | | | | | | 3.85 | | | | | | | | 4.77 | | | | | | | | | | 3.36 | | | | | | | | 3.63 | | | | | | | | 3.29 | | | | | | | | 3.36 | | | | | | | | 3.09 | | | | | | | 3.42 |
Operating | | | 12.94 | | | | | | | | 12.43 | | | | | | | | 12.34 | | | | | | | | 13.98 | | | | | | | | | | 15.92 | | | | | | | | 15.20 | | | | | | | | 16.13 | | | | | | | | 15.59 | | | | | | | | 15.45 | | | | | | | 17.30 |
Production and Mineral Taxes | | | - | | | | | | | | 0.01 | | | | | | | | 0.01 | | | | | | | | - | | | | | | | | | | 0.04 | | | | | | | | (0.03 | ) | | | | | | | 0.06 | | | | | | | | 0.07 | | | | | | | | 0.08 | | | | | | | 0.02 |
Netback | | | 13.68 | | | | | | | | 19.23 | | | | | | | | 16.62 | | | | | | | | 5.84 | | | | | | | | | | 17.66 | | | | | | | | 11.80 | | | | | | | | 19.35 | | | | | | | | 16.34 | | | | | | | | 28.67 | | | | | | | 12.77 |
Total Heavy Oil(1) (2)($/bbl) | | | | | | | | | | | | | | | | | | | | | | | | | | | | | | | | | | | | | | | | | | | | | | | | | | | | | | | | | | | | | | | | | | | | | | | | | | | | |
Price | | | 25.93 | | | | | | | | 32.69 | | | | | | | | 31.64 | | | | | | | | 12.98 | | | | | | | | | | 32.73 | | | | | | | | 24.87 | | | | | | | | 35.35 | | | | | | | | 31.63 | | | | | | | | 47.24 | | | | | | | 28.15 |
Royalties | | | 0.66 | | | | | | | | 0.86 | | | | | | | | 0.89 | | | | | | | | 0.22 | | | | | | | | | | 1.07 | | | | | | | | 0.59 | | | | | | | | 1.23 | | | | | | | | 0.75 | | | | | | | | 2.35 | | | | | | | 0.68 |
Transportation and Blending | | | 6.55 | | | | | | | | 6.16 | | | | | | | | 7.16 | | | | | | | | 6.39 | | | | | | | | | | 5.97 | | | | | | | | 6.26 | | | | | | | | 5.88 | | | | | | | | 6.08 | | | | | | | | 5.69 | | | | | | | 5.83 |
Operating | | | 9.44 | | | | | | | | 9.22 | | | | | | | | 8.79 | | | | | | | | 10.32 | | | | | | | | | | 11.31 | | | | | | | | 10.62 | | | | | | | | 11.55 | | | | | | | | 10.62 | | | | | | | | 11.70 | | | | | | | 12.35 |
Production and Mineral Taxes | | | - | | | | | | | | - | | | | | | | | - | | | | | | | | - | | | | | | | | | | 0.01 | | | | | | | | (0.01 | ) | | | | | | | 0.01 | | | | | | | | 0.01 | | | | | | | | 0.02 | | | | | | | - |
Netback | | | 9.28 | | | | | | | | 16.45 | | | | | | | | 14.80 | | | | | | | | (3.95 | ) | | | | | | | | | 14.37 | | | | | | | | 7.41 | | | | | | | | 16.68 | | | | | | | | 14.17 | | | | | | | | 27.48 | | | | | | | 9.29 |
(1) The netbacks do not reflect non-cash write-downs of product inventory. (2) Heavy oil price, and transportation and blending costs exclude the costs of purchased condensate, which is blended with the heavy oil. On a per-barrel of unblended crude oil basis, the cost of condensate is as follows: |
Cost of Condensate per Barrel of Unblended Crude Oil($/bbl) | | | |
Foster Creek | | | 24.43 | | | | | | | | 22.82 | | | | | | | | 24.76 | | | | | | | | 26.13 | | | | | | | | | | 27.44 | | | | | | | | 25.96 | | | | | | | | 27.94 | | | | | | | | 24.20 | | | | | | | | 29.82 | | | | | | | 30.57 |
Christina Lake | | | 25.52 | | | | | | | | 23.93 | | | | | | | | 26.24 | | | | | | | | 26.45 | | | | | | | | | | 29.50 | | | | | | | | 27.39 | | | | | | | | 30.23 | | | | | | | | 26.42 | | | | | | | | 32.90 | | | | | | | 31.60 |
Heavy Oil - Oil Sands | | | 25.02 | | | | | | | | 23.39 | | | | | | | | 25.58 | | | | | | | | 26.31 | | | | | | | | | | 28.54 | | | | | | | | 26.72 | | | | | | | | 29.17 | | | | | | | | 25.33 | | | | | | | | 31.48 | | | | | | | 31.14 |
Heavy Oil - Conventional | | | 9.58 | | | | | | | | 8.31 | | | | | | | | 10.34 | | | | | | | | 10.04 | | | | | | | | | | 10.94 | | | | | | | | 9.99 | | | | | | | | 11.21 | | | | | | | | 9.56 | | | | | | | | 12.42 | | | | | | | 11.50 |
Total Heavy Oil | | | 22.45 | | | | | | | | 21.11 | | | | | | | | 22.99 | | | | | | | | 23.39 | | | | | | | | | | 24.94 | | | | | | | | 23.64 | | | | | | | | 25.37 | | | | | | | | 22.34 | | | | | | | | 27.06 | | | | | | | 26.91 |
| | |
| Cenovus Energy Inc. | | Page 66 |
| Third Quarter 2016 Report | | Supplemental Information |
SUPPLEMENTAL INFORMATION(unaudited)
Operating Statistics - Before Royalties (continued)
| | | | | | | | | | | | | | | | | | | | | | | | | | | | | | | | | | | | | | | | | | | | |
| Per-unit Results | | | | | | | | | | | | | | | | | | | | | | | | | | | | | | | | | |
| (Excluding Impact of Realized Gain (Loss) on Risk Management) | | | 2016 | | | | | | | | | 2015 | |
| | | Year
to Date | | | Q3 | | | Q2 | | | Q1 | | | | | | Year | | | Q4 | | | Q3 Year
to Date | | | Q3 | | | Q2 | | | Q1 | |
Light and Medium Oil($/bbl) | | | | | | | | | | | | | | | | | | | | | | | | | | | | | | | | | | | | | | | | | | | | |
Price | | | 43.66 | | | | 48.97 | | | | 48.09 | | | | 34.36 | | | | | | | | 50.64 | | | | 45.35 | | | | 52.13 | | | | 49.57 | | | | 61.66 | | | | 45.81 | |
Royalties | | | 7.50 | | | | 8.91 | | | | 8.52 | | | | 5.18 | | | | | | | | 5.66 | | | | 6.97 | | | | 5.30 | | | | 7.02 | | | | 5.67 | | | | 3.56 | |
Transportation and Blending | | | 2.74 | | | | 2.71 | | | | 2.77 | | | | 2.73 | | | | | | | | 2.91 | | | | 2.80 | | | | 2.94 | | | | 2.88 | | | | 3.06 | | | | 2.88 | |
Operating | | | 15.52 | | | | 13.94 | | | | 16.21 | | | | 16.34 | | | | | | | | 16.27 | | | | 17.37 | | | | 15.96 | | | | 15.92 | | | | 15.90 | | | | 16.04 | |
Production and Mineral Taxes | | | 1.15 | | | | 1.48 | | | | 1.18 | | | | 0.82 | | | | | | | | 1.41 | | | | 0.76 | | | | 1.60 | | | | 1.60 | | | | 1.95 | | | | 1.28 | |
Netback | | | 16.75 | | | | 21.93 | | | | 19.41 | | | | 9.29 | | | | | | | | 24.39 | | | | 17.45 | | | | 26.33 | | | | 22.15 | | | | 35.08 | | | | 22.05 | |
Total Crude Oil(1)($/bbl) | | | | | | | | | | | | | | | | | | | | | | | | | | | | | | | | | | | | | | | | | | | | |
Price | | | 28.26 | | | | 34.66 | | | | 33.89 | | | | 15.91 | | | | | | | | 35.41 | | | | 27.62 | | | | 37.94 | | | | 34.08 | | | | 49.55 | | | | 31.09 | |
Royalties | | | 1.56 | | | | 1.83 | | | | 1.93 | | | | 0.90 | | | | | | | | 1.75 | | | | 1.44 | | | | 1.85 | | | | 1.60 | | | | 2.88 | | | | 1.16 | |
Transportation and Blending | | | 6.05 | | | | 5.74 | | | | 6.56 | | | | 5.89 | | | | | | | | 5.51 | | | | 5.79 | | | | 5.42 | | | | 5.64 | | | | 5.27 | | | | 5.34 | |
Operating | | | 10.24 | | | | 9.79 | | | | 9.80 | | | | 11.14 | | | | | | | | 12.05 | | | | 11.52 | | | | 12.23 | | | | 11.35 | | | | 12.37 | | | | 12.97 | |
Production and Mineral Taxes | | | 0.15 | | | | 0.18 | | | | 0.16 | | | | 0.11 | | | | | | | | 0.22 | | | | 0.10 | | | | 0.26 | | | | 0.23 | | | | 0.33 | | | | 0.22 | |
Netback | | | 10.26 | | | | 17.12 | | | | 15.44 | | | | (2.13 | ) | | | | | | | 15.88 | | | | 8.77 | | | | 18.18 | | | | 15.26 | | | | 28.70 | | | | 11.40 | |
Natural Gas Liquids($/bbl) | | | | | | | | | | | | | | | | | | | | | | | | | | | | | | | | | | | | | | | | | | | | |
Price | | | 27.45 | | | | 29.71 | | | | 28.11 | | | | 24.99 | | | | | | | | 30.98 | | | | 30.70 | | | | 31.07 | | | | 24.57 | | | | 39.64 | | | | 28.51 | |
Royalties | | | 3.92 | | | | 3.58 | | | | 4.20 | | | | 4.03 | | | | | | | | 1.74 | | | | 3.94 | | | | 1.07 | | | | 1.75 | | | | 0.87 | | | | 0.66 | |
Netback | | | 23.53 | | | | 26.13 | | | | 23.91 | | | | 20.96 | | | | | | | | 29.24 | | | | 26.76 | | | | 30.00 | | | | 22.82 | | | | 38.77 | | | | 27.85 | |
Total Liquids(1)($/bbl) | | | | | | | | | | | | | | | | | | | | | | | | | | | | | | | | | | | | | | | | | | | | |
Price | | | 28.25 | | | | 34.64 | | | | 33.87 | | | | 15.97 | | | | | | | | 35.38 | | | | 27.63 | | | | 37.90 | | | | 34.03 | | | | 49.48 | | | | 31.08 | |
Royalties | | | 1.57 | | | | 1.84 | | | | 1.94 | | | | 0.92 | | | | | | | | 1.75 | | | | 1.46 | | | | 1.85 | | | | 1.60 | | | | 2.86 | | | | 1.16 | |
Transportation and Blending | | | 6.02 | | | | 5.71 | | | | 6.53 | | | | 5.85 | | | | | | | | 5.48 | | | | 5.76 | | | | 5.39 | | | | 5.61 | | | | 5.24 | | | | 5.31 | |
Operating | | | 10.19 | | | | 9.74 | | | | 9.76 | | | | 11.08 | | | | | | | | 11.98 | | | | 11.46 | | | | 12.15 | | | | 11.28 | | | | 12.29 | | | | 12.89 | |
Production and Mineral Taxes | | | 0.15 | | | | 0.18 | | | | 0.16 | | | | 0.11 | | | | | | | | 0.22 | | | | 0.10 | | | | 0.25 | | | | 0.23 | | | | 0.33 | | | | 0.22 | |
Netback | | | 10.32 | | | | 17.17 | | | | 15.48 | | | | (1.99 | ) | | | | | | | 15.95 | | | | 8.85 | | | | 18.26 | | | | 15.31 | | | | 28.76 | | | | 11.50 | |
Total Natural Gas($/Mcf) | | | | | | | | | | | | | | | | | | | | | | | | | | | | | | | | | | | | | | | | | | | | |
Price | | | 2.11 | | | | 2.49 | | | | 1.53 | | | | 2.31 | | | | | | | | 2.92 | | | | 2.78 | | | | 2.96 | | | | 3.00 | | | | 2.82 | | | | 3.05 | |
Royalties | | | 0.08 | | | | 0.10 | | | | 0.04 | | | | 0.09 | | | | | | | | 0.07 | | | | 0.10 | | | | 0.06 | | | | 0.11 | | | | 0.03 | | | | 0.05 | |
Transportation and Blending | | | 0.11 | | | | 0.10 | | | | 0.13 | | | | 0.10 | | | | | | | | 0.11 | | | | 0.11 | | | | 0.11 | | | | 0.10 | | | | 0.10 | | | | 0.12 | |
Operating | | | 1.11 | | | | 1.05 | | | | 1.06 | | | | 1.23 | | | | | | | | 1.20 | | | | 1.25 | | | | 1.19 | | | | 1.16 | | | | 1.14 | | | | 1.26 | |
Production and Mineral Taxes | | | - | | | | 0.01 | | | | - | | | | - | | | | | | | | 0.01 | | | | 0.02 | | | | 0.01 | | | | 0.01 | | | | 0.02 | | | | 0.01 | |
Netback | | | 0.81 | | | | 1.23 | | | | 0.30 | | | | 0.89 | | | | | | | | 1.53 | | | | 1.30 | | | | 1.59 | | | | 1.62 | | | | 1.53 | | | | 1.61 | |
Total(1) (2)($/BOE) | | | | | | | | | | | | | | | | | | | | | | | | | | | | | | | | | | | | | | | | | | | | |
Price | | | 24.37 | | | | 29.98 | | | | 27.56 | | | | 15.43 | | | | | | | | 30.67 | | | | 24.78 | | | | 32.58 | | | | 29.95 | | | | 40.50 | | | | 27.73 | |
Royalties | | | 1.29 | | | | 1.55 | | | | 1.51 | | | | 0.82 | | | | | | | | 1.40 | | | | 1.23 | | | | 1.46 | | | | 1.36 | | | | 2.13 | | | | 0.93 | |
Transportation and Blending | | | 4.69 | | | | 4.51 | | | | 5.07 | | | | 4.51 | | | | | | | | 4.21 | | | | 4.43 | | | | 4.14 | | | | 4.35 | | | | 3.95 | | | | 4.11 | |
Operating | | | 9.32 | | | | 8.92 | | | | 8.89 | | | | 10.14 | | | | | | | | 10.72 | | | | 10.43 | | | | 10.82 | | | | 10.18 | | | | 10.78 | | | | 11.49 | |
Production and Mineral Taxes | | | 0.12 | | | | 0.15 | | | | 0.12 | | | | 0.08 | | | | | | | | 0.18 | | | | 0.10 | | | | 0.21 | | | | 0.19 | | | | 0.27 | | | | 0.17 | |
Netback | | | 8.95 | | | | 14.85 | | | | 11.97 | | | | (0.12 | ) | | | | | | | 14.16 | | | | 8.59 | | | | 15.95 | | | | 13.87 | | | | 23.37 | | | | 11.03 | |
| | | | | | | | | | | | | | | | | | | | | | | | | | | | | | | | | | | | | | | | | | | | | |
Realized Gain (Loss) on Risk Management | | | | | | | | | | | | | | | | | | | | | | | | | | | | | | | | | | | | | | | | | | | | |
Liquids($/bbl) | | | 4.06 | | | | 2.14 | | | | 1.97 | | | | 8.16 | | | | | | | | 7.51 | | | | 11.39 | | | | 6.25 | | | | 10.07 | | | | 1.75 | | | | 6.58 | |
Natural Gas($/Mcf) | | | - | | | | - | | | | - | | | | - | | | | | | | | 0.37 | | | | 0.42 | | | | 0.35 | | | | 0.37 | | | | 0.39 | | | | 0.29 | |
Total (2)($/BOE) | | | 3.05 | | | | 1.63 | | | | 1.46 | | | | 6.08 | | | | | | | | 6.11 | | | | 9.08 | | | | 5.15 | | | | 8.07 | | | | 1.92 | | | | 5.31 | |
| (1) | The netbacks do not reflect non-cash write-downs of product inventory. |
| (2) | Natural gas volumes have been converted to barrels of oil equivalent (BOE) on the basis of six thousand cubic feet (Mcf) to one barrel (bbl). BOE may be misleading, particularly if used in isolation. A conversion ratio of one bbl to six Mcf is based on an energy equivalency conversion method primarily applicable at the burner tip and does not represent value equivalency at the wellhead. Given that the value ratio based on the current price of crude oil compared to natural gas is significantly different from the energy equivalency conversion ratio of 6:1, utilizing a conversion on a 6:1 basis is not an accurate reflection of value. |
| | |
| Cenovus Energy Inc. | | Page 67 |
| Third Quarter 2016 Report | | Supplemental Information |
ADVISORY
FINANCIAL INFORMATION
Basis of PresentationCenovus reports financial results in Canadian dollars and presents production volumes on a net to Cenovus before royalties basis, unless otherwise stated. Cenovus prepares its financial statements in accordance with International Financial Reporting Standards (IFRS).
Non-GAAP Measures
This quarterly report contains references to non-GAAP measures as follows:
| | • | | Operating cash flow is defined as revenues, less purchased product, transportation and blending, operating expenses, production and mineral taxes plus realized gains, less realized losses on risk management activities and is used to provide a consistent measure of the cash generating performance of the company’s assets for comparability of Cenovus’s underlying financial performance between periods. Items within the Corporate and Eliminations segment are excluded from the calculation of operating cash flow. |
| | • | | Cash flow is defined as cash from operating activities excluding net change in other assets and liabilities and net change in non-cash working capital, both of which are defined on the Consolidated Statement of Cash Flows in Cenovus’s interim and annual Consolidated Financial Statements. Cash flow is a measure commonly used in the oil and gas industry to assist in measuring a company’s ability to finance its capital programs and meet its financial obligations. |
| | • | | Free cash flow is defined as cash flow less capital investment. |
| | • | | Operating earnings is used to provide a consistent measure of the comparability of the company’s underlying financial performance between periods by removing non-operating items. Operating earnings is defined as earnings before income tax excluding gain (loss) on discontinuance, gain on bargain purchase, unrealized risk management gains (losses) on derivative instruments, unrealized foreign exchange gains (losses) on translation of U.S. dollar denominated notes issued from Canada, foreign exchange gains (losses) on settlement of intercompany transactions, gains (losses) on divestiture of assets, less income taxes on operating earnings (loss) before tax, excluding the effect of changes in statutory income tax rates and the recognition of an increase in U.S. tax basis. |
| | • | | Debt to capitalization, net debt to capitalization, debt to adjusted EBITDA and net debt to adjusted EBITDA are ratios that management uses to steward the company’s overall debt position as measures of the company’s overall financial strength. Debt is defined as short-term borrowings and long-term debt, including the current portion. Net debt is defined as debt net of cash and cash equivalents. Capitalization is defined as debt plus shareholders’ equity. Net debt to capitalization is defined as net debt divided by net debt plus shareholders’ equity. Adjusted EBITDA is defined as earnings before finance costs, interest income, income tax expense, depreciation, depletion and amortization, goodwill and asset impairments, unrealized gains or losses on risk management, foreign exchange gains or losses, gains or losses on divestiture of assets and other income and loss, calculated on a trailing 12-month basis. |
These measures do not have a standardized meaning as prescribed by IFRS and therefore are considered non-GAAP measures. These measures may not be comparable to similar measures presented by other issuers. These measures have been described and presented in this quarterly report in order to provide shareholders and potential investors with additional information regarding Cenovus’s liquidity and its ability to generate funds to finance its operations. This information should not be considered in isolation or as a substitute for measures prepared in accordance with IFRS. For further information, refer to Cenovus’s most recent Management’s Discussion and Analysis (MD&A) available atcenovus.com.
| | |
Cenovus Energy Inc. | | Page 68 |
Third Quarter 2016 Report | | Advisory |
OIL AND GAS INFORMATION
Certain natural gas volumes have been converted to barrels of oil equivalent (BOE) on the basis of six Mcf to one barrel (bbl). BOE may be misleading, particularly if used in isolation. A conversion ratio of one bbl to six Mcf is based on an energy equivalency conversion method primarily applicable at the burner tip and does not represent value equivalency at the wellhead. Given that the value ratio based on the current price of crude oil compared to natural gas is significantly different from the energy equivalency conversion ratio of 6:1, utilizing a conversion on a 6:1 basis is not an accurate reflection of value.
FORWARD-LOOKING INFORMATION
This document contains certain forward-looking statements and other information (collectively “forward-looking information”) about Cenovus’s current expectations, estimates and projections, made in light of the company’s experience and perception of historical trends. Forward-looking information in this document is identified by words such as “anticipate”, “expect”, “estimate”, “plan”, “target”, “position”, “project”, “committed”, “can be”, “pursue”, “capacity”, “potential”, “may”, “on track”, “confidence” or similar expressions and includes suggestions of future outcomes, including statements about: milestones and schedules, including expected timing for oil sands expansion phases and associated expected production capacities; expected impacts of completion of the Wood River debottlenecking project; projections for 2016 and future years; forecast operating and financial results, including our ability to generate free cash flow; targets for our debt to capitalization and debt to EBITDA ratios; planned capital expenditures; expected future production, including the timing, stability or growth thereof; our ability to preserve our financial resilience and plans and strategies with respect thereto; achieved and forecast cost reductions, including sustainability and expected impacts thereof; our competitive position; our commitment to pursuit of additional cost reductions and expected impact on our position to add shareholder value, including in the commodity price environment; our forecasts regarding our ability to cover operating and capital costs as well as our dividend within a certain commodity price range; dividend strategy; the potential for generation of free cash flow and capacity to invest in growth at certain commodity price levels; and expected impacts of our hedging program. Readers are cautioned not to place undue reliance on forward-looking information as our actual results may differ materially from those expressed or implied.
Developing forward-looking information involves reliance on a number of assumptions and consideration of certain risks and uncertainties, some of which are specific to Cenovus and others that apply to the industry generally. The factors or assumptions on which the forward-looking information is based include: forecast oil and natural gas prices and other assumptions inherent in Cenovus’s 2016 guidance (as updated on October 27, 2016), available atcenovus.com; projected capital investment levels, flexibility of capital spending plans and associated source of funding; future cost reductions; sustainability of cost reductions; expected condensate prices; estimates of quantities of oil, bitumen, natural gas and liquids from properties and other sources not currently classified as proved; future use and development of technology; ability to obtain necessary regulatory and partner approvals; successful and timely implementation of capital projects or stages thereof; the company’s ability to generate sufficient cash flow to meet its current and future obligations; estimated abandonment and reclamation costs, including associated levies and regulations; and other risks and uncertainties described from time to time in the company’s filings with securities regulatory authorities.
The risk factors and uncertainties that could cause the company’s actual results to differ materially, include: volatility of and assumptions regarding oil and natural gas prices; the effectiveness of the company’s risk management program, including the impact of derivative financial instruments, the success of hedging strategies and the sufficiency of liquidity position; accuracy of cost estimates; commodity prices, currency and interest rates; product supply and demand; market competition, including from alternative energy sources; risks inherent in Cenovus’s marketing operations, including credit risks; exposure to counterparties and partners, including ability and willingness of such parties to satisfy contractual obligations in a timely manner; risks inherent in operation of
| | |
Cenovus Energy Inc. | | Page 69 |
Third Quarter 2016 Report | | Advisory |
the company’s crude-by-rail terminal, including health, safety and environmental risks; maintaining desirable ratios of debt to adjusted EBITDA and net debt to adjusted EBITDA as well as debt to capitalization and net debt to capitalization; ability to access various sources of debt and equity capital, generally, and on terms acceptable to Cenovus; ability to finance growth and sustaining capital expenditures; changes in credit ratings applicable to Cenovus or any of its securities; changes to dividend plans or strategy, including the dividend reinvestment plan; accuracy of reserves, resources and future production estimates; ability to replace and expand oil and gas reserves; ability to maintain relationships with partners and to successfully manage and operate the company’s integrated business; reliability of assets, including in order to meet production targets; potential disruption or unexpected technical difficulties in developing new products and manufacturing processes; occurrence of unexpected events such as fires, severe weather conditions, explosions, blow-outs, equipment failures, transportation incidents and other accidents or similar events; refining and marketing margins; inflationary pressures on operating costs, including labour, natural gas and other energy sources used in oil sands processes; potential failure of products to achieve acceptance in the market; risks associated with fossil fuel industry reputation; unexpected cost increases or technical difficulties in constructing or modifying manufacturing or refining facilities; unexpected difficulties in producing, transporting or refining of crude oil into petroleum and chemical products; risks associated with technology and its application to Cenovus’s business; risks associated with climate change; the timing and costs of well and pipeline construction; ability to secure adequate product transportation, including sufficient pipeline, crude-by-rail, marine or other alternate transportation, including to address any gaps caused by constraints in the pipeline system; availability of, and ability to attract and retain, critical talent; changes in labour relationships; changes in the regulatory framework in any of the locations in which Cenovus operates, including changes to the regulatory approval process and land-use designations, royalty, tax, environmental (including in relation to abandonment, reclamation and remediation costs, levies or liability recovery with respect thereto), greenhouse gas, carbon and other laws or regulations, or changes to the interpretation of such laws and regulations, as adopted or proposed, the impact thereof and the costs associated with compliance; the expected impact and timing of various accounting pronouncements, rule changes and standards on Cenovus’s business, financial results and consolidated financial statements; changes in the general economic, market and business conditions; the political and economic conditions in the countries of operation; occurrence of unexpected events such as war, terrorist threats and the instability resulting therefrom; and risks associated with existing and potential future lawsuits and regulatory actions.
Readers are cautioned that the foregoing lists are not exhaustive and are made as at the date hereof. For a discussion of Cenovus’s material risk factors, see “Risk Factors” in the company’s Annual Information Form (AIF) or Form 40-F for the period ended December 31, 2015, together with the updates under “Risk Management” in each of the company’s first, second and third quarter 2016 MD&As, available on SEDAR atsedar.com, EDGAR atsec.gov and on the company’s website atcenovus.com.
ABBREVIATIONS
The following is a summary of the abbreviations that have been used in this document:
| | | | | | |
Crude Oil | | Natural Gas |
| | | |
bbl | | barrel | | Mcf | | thousand cubic feet |
bbls/d | | barrels per day | | MMcf | | million cubic feet |
Mbbls/d | | thousand barrels per day | | Bcf | | billion cubic feet |
MMbbls | | million barrels | | MMBtu | | million British thermal units |
BOE | | barrel of oil equivalent | | GJ | | gigajoule |
BOE/d | | Barrel of oil equivalent per day | | AECO | | Alberta Energy Company |
MBOE | | thousand barrel of oil equivalent | | NYMEX | | New York Mercantile Exchange |
MMBOE | | million barrel of oil equivalent | | | | |
WTI | | West Texas Intermediate | | | | |
WCS | | Western Canadian Select | | | | |
CDB | | Christina Dilbit Blent | | TM | | Trademark of Cenovus Energy Inc. |
| | |
Cenovus Energy Inc. | | Page 70 |
Third Quarter 2016 Report | | Advisory |

Cenovus Energy Inc.
500 Centre Street SE
PO Box 766
Calgary, AB T2P 0M5
Phone: 403-766-2000
Fax: 403-766-7600
| | |
| CENOVUS CONTACTS | | |
Investor Relations: | | Media: |
| |
| Kam Sandhar | | General media line |
Vice-President, Investor Relations & Corporate Development | | 403-766-7751 |
| 403-766-5883 | | media.relations@cenovus.com |
| kam.sandhar@cenovus.com | | |
| |
| Graham Ingram | | |
| Manager, Investor Relations | | |
| 403-766-2849 | | |
| graham.ingram@cenovus.com | | |
| |
| Steven Murray | | |
| Senior Analyst, Investor Relations | | |
| 403-766-3382 | | |
| steven.murray@cenovus.com | | |
| |
Michelle Cheyne Analyst, Investor Relations 403-766-2584 michelle.cheyne@cenovus.com | | |
cenovus.com