Exhibit 99.1

Cenovus reports solid 2017 results
Company remains focused on deleveraging and reducing costs
Calgary, Alberta (February 15, 2018)– Cenovus Energy Inc. (TSX: CVE) (NYSE: CVE) delivered strong cash from operating activities and adjusted funds flow in 2017. Through its continued focus on capital discipline and reliable operational performance, the company generated almost $1.3 billion in free funds flow last year. Cenovus also completed the divestitures of its legacy conventional oil and natural gas assets within its expected timeframe. Divestiture proceeds and cash on hand were used to repay and retire the company’s bridge credit facility prior toyear-end.
Key 2017 highlights
| ● | Increased free funds flow by 216% compared with 2016 |
| ● | Increased cash from operating activities and adjusted funds flow by 255% and 105%, respectively, compared with 2016 |
| ● | Recorded net earnings of $3.4 billion versus a net loss of $545 million in 2016 |
| ● | Repaid and retired the company’s $3.6 billion bridge credit facility |
| ● | Doubled proved bitumen reserves to approximately 4.8 billion barrels |
| ● | Reduced general and administrative (G&A) costs by 44% per barrel of oil equivalent (BOE) and oil sands operating costs by 6% per barrel from 2016 |
2017 production & financial summary
| ||||||||||||
(for the period ended December 31)
|
2017 Q4
|
2016 Q4
| % change | 2017 Full year
| 2016
Full year | % change | ||||||
Financial1 ($ millions, except per share amounts)
| ||||||||||||
Cash from operating activities
| 900 | 164 | 449 | 3,059 | 861 | 255 | ||||||
Adjusted funds flow2 | 866 | 535 | 62 | 2,914 | 1,423 | 105 | ||||||
Per share diluted
| 0.70 | 0.64 | 2.64 | 1.71 | ||||||||
Free funds flow2
| 283 | 276 | 3 | 1,253 | 397 | 216 | ||||||
Operating earnings2 | -514 | 321 | 126 | -377 | ||||||||
Per share diluted
| -0.42 | 0.39 | 0.11 | -0.45 | ||||||||
Net earnings3 | 620 | 91 | 581 | 3,366 | -545 | |||||||
Per share diluted
| 0.50 | 0.11 | 3.05 | -0.65 | ||||||||
Capital investment
| 583 | 259 | 125 | 1,661 | 1,026 | 62 | ||||||
Production (before royalties)
| ||||||||||||
Oil sands (bbls/d)
| 361,363 | 164,396 | 120 | 292,479 | 149,693 | 95 | ||||||
Deep Basin liquids4 (bbls/d)
| 33,147 | n/a | 20,850 | n/a | ||||||||
Conventional liquids4,5 (bbls/d)
| 27,647 | 55,155 | -50 | 47,375 | 56,165 | -16 | ||||||
Total oil and liquids(bbls/d)
| 422,157 | 219,551 | 92 | 360,704 | 205,858 | 75 | ||||||
Deep Basin natural gas (MMcf/d)
| 509 | n/a | 316 | n/a | ||||||||
Conventional natural gas5 (MMcf/d)
| 286 | 379 | -25 | 343 | 394 | -13 | ||||||
Total natural gas (MMcf/d)
| 795 | 379 | 110 | 659 | 394 | 67 | ||||||
Total production (BOE/d)
| 554,606 | 282,718 | 96 | 470,490 | 271,525 | 73 | ||||||
| 1 | Financial information includes results from discontinued operations. |
| 2 | Adjusted funds flow, free funds flow and operating earnings/loss arenon-GAAP measures. See Advisory. |
| 3 | For a description of items included in net earnings, see page 3 of this news release. |
| 4 | Includes oil and natural gas liquids (NGLs). |
| 5 | All conventional assets other than Athabasca natural gas were sold as of January 5, 2018 and are presented as discontinued operations. |
 | Page 1 Q4 2017 | |
2017 Overview
In 2017, cash from operating activities and adjusted funds flow increased by 255% and 105%, respectively, while free funds flow and production were 216% and 73% higher compared with the previous year. The company benefited from higher average full-year benchmark commodity prices and stronger refining operating margin. Production increased last year largely due to Cenovus’s May 2017 acquisition of the remaining 50% working interest in the company’sbest-in-class oil sands projects in northern Alberta, and assets in the Deep Basin in Alberta and British Columbia.
Deleveraging and cost reduction
Paying down debt and reducing costs remain priorities for Cenovus, and the company made significant progress on both in 2017. As part of its strategy to refocus its portfolio and deleverage its balance sheet, Cenovus successfully completed the sale of its four legacy conventional oil and natural gas assets for combined gross cash proceeds of $3.7 billion. The company used the net proceeds from the three asset sales that closed in 2017, plus cash on hand, to repay and retire its $3.6 billion bridge facility prior to the end of the year. The Suffield asset sale, which was announced in the fourth quarter of 2017, closed on January 5, 2018 for gross cash proceeds of $512 million. At the end of 2017, Cenovus’s net debt was $8.9 billion, or 2.8 times adjusted earnings before interest, taxes, depreciation and amortization (adjusted EBITDA) on a trailing12-month basis. Between the end of the second quarter and the end of 2017, the company reduced net debt by approximately $4 billion, or 31%, largely through asset sales and free funds flow generation. Cenovus continues to target a long-term net debt to adjusted EBITDA ratio of less than two times.
In 2017, Cenovus had oil sands sustaining capital costs of $6.34 per barrel (bbl), down 12% from $7.24/bbl the previous year. In 2018, the company expects to further reduce itsper-barrel oil sands sustaining capital costs by 13%. Oil sands operating costs were $8.40/bbl in 2017, 6% lower than the previous year, and are expected to decline by another 6% per barrel in 2018.
Cenovus is also on track to meet its accelerated goal of achieving at least $1 billion in cumulative capital, operating and G&A cost reductions over two years versus an earlier targeted timeline of three years. This includes the company’s previously-announced plan to further reduce its workforce by approximately 15% this year, which was largely completed in January and February. In 2017, G&A costs per BOE decreased 44% to $1.83 from $3.29 the previous year, primarily as a result of increased production related to the acquisition. G&A costs per BOE were also reduced due to lower long-term employee incentive costs related to a decline in Cenovus’s share price, lowernon-cash charges related to the company’s excess office space compared with 2016 and lower information technology costs.
“I’m extremely pleased with the progress we’ve made to date in strengthening our balance sheet and lowering our cost structure,” said Alex Pourbaix, Cenovus President & Chief Executive Officer. “In the short to medium term, we’ll remain focused on driving additional efficiencies across our business while further reducing debt. This will give us greater flexibility to balance returning cash to shareholders with making disciplined investments in projects that have the potential for high-return growth.”
| Page 2 Q4 2017 | |
Financial performance
In 2017, Cenovus increased cash from operating activities to $3.1 billion from $861 million the previous year and adjusted funds flow to $2.9 billion from $1.4 billion in 2016. Free funds flow rose to nearly $1.3 billion from $397 million in 2016. The company benefited from higher average benchmark crude oil prices, including Western Canadian Select (WCS) which increased 32% compared with 2016. In 2017, the average differential between WCS and West Texas Intermediate (WTI) narrowed from the previous year but widened significantly towards the end of last year and into 2018. Cenovus is actively mitigating wider differentials through its downstream integration, pipeline commitments to the U.S. Gulf Coast and Canadian West Coast, rail optionality including the company’s Bruderheimcrude-by-rail terminal, as well as through financial contracts. Cenovus’s refining and marketing segment benefited from higher average market crack spreads and rising commodity prices. Refining and marketing operating margin rose 73% to $598 million in 2017 from the previous year.
Cenovus recorded full-year operating earnings of $126 million compared with an operating loss of $377 million in 2016. Operating earnings includednon-cash items such as $2 billion in depreciation, depletion and amortization (DD&A) expense, and $890 million in exploration expense related primarily to Cenovus’s emerging oil sands assets in the Greater Borealis region of northern Alberta. Net earnings of $3.4 billion in 2017 included abefore-tax revaluation gain of $2.6 billion related to the deemed disposition of Cenovus’spre-existing 50% ownership interest in the Foster Creek and Christina Lake oil sands partnership, abefore-tax gain on discontinuance of $1.3 billion related to asset sales, unrealized foreign exchange gains of $651 million and unrealized risk management losses of $729 million.
Reserves
Cenovus’s proved and probable reserves are evaluated each year by independent qualified reserves evaluators (IQREs).
At the end of 2017, Cenovus had total proved reserves of approximately 5.2 billion BOE, an increase of 96% compared with 2016, largely due to the acquisition. Proved bitumen reserves increased 103% to approximately 4.8 billion barrels. Total proved plus probable reserves increased 88% to approximately 7.1 billion BOE. Based on the evaluation of Cenovus’s bitumen reserves by IQREs, estimated future capital costs to develop the company’s remaining proved undeveloped bitumen reserves declined to approximately $7.00/bbl in 2017 compared with approximately $8.00/bbl the previous year.
More details about Cenovus’s reserves are available under Financial Information in the Advisory, the company’s Annual Information Form (AIF) and Annual Report on Form40-F for the year ended December 31, 2017, which are available on SEDAR atsedar.com, EDGAR atsec.gov and Cenovus’s website atcenovus.com.
Hedging
To support the company’s financial resilience as it continued to deleverage its balance sheet in 2017, Cenovus hedged a greater percentage of 2018 forecast liquids production than it typically does, establishing a floor on crude oil prices. Approximately 80% of the company’s forecast oil production is hedged for the first half of the year. Approximately 37% of forecast oil production is hedged for the second half of 2018. There were no natural gas hedges in place as of December 31, 2017. As of the end of 2017, no hedge positions were in place for 2019.
| Page 3 Q4 2017 | |
Operating highlights
Cenovus had another strong operating year in 2017, with improvements in capital efficiencies, execution, operating costs, reliability of production delivery and facility uptime.
Oil sands
Combined production at Cenovus’s Christina Lake and Foster Creek oil sands operations was 292,479 net barrels per day (bbls/d) in 2017, 95% higher than the previous year. The increase was mainly due to the company’s May 17, 2017 acquisition, which resulted in full ownership of the Foster Creek and Christina Lake assets, as well as incremental volumes from Foster Creek phase G and Christina Lake phase F, both of which began producing in the second half of 2016. Fourth-quarter oil sands production was 361,363 bbls/d, an increase of 120% from the same period in 2016. Sales volumes for the quarter were approximately 7% lower than production due to unplanned third-party pipeline bottlenecks late in the quarter. At Foster Creek, the steam to oil ratio (SOR), the amount of steam needed to produce one barrel of oil, was 2.5 in 2017, compared with 2.7 in 2016. At Christina Lake, the SOR was 1.8 in 2017, down from 1.9 a year earlier.
Construction at the Christina Lake phase G expansion resumed in the first quarter of 2017, with activity increasing through the end of the year and into 2018. Cenovus expects the expansion will havego-forward capital costs, from the time the project was restarted last year through to completion, of between $13,000 and $14,000 per flowing barrel, well below the company’s original estimate. Phase G has approved capacity of 50,000 bbls/d and is anticipated to begin production in the second half of 2019.
Deep Basin
Production between May 17, 2017 and the end of the year averaged 117,138 BOE/d, with average operating costs of $8.56/BOE. In December, production averaged 120,243 BOE/d. Cenovus continues to take a disciplined approach to development in the Deep Basin. The company drilled 24 net horizontal wells and participated in drilling fournon-operated net horizontal wells targeting liquids-rich natural gas in 2017. Twenty net wells were completed and 14 net wells started production. To date, Cenovus has achieved very strong drilling efficiencies with its Deep Basin program, and initial well results have met or exceeded the company’s expectations. As previously announced, Cenovus plans to drill 15 net wells in the Deep Basin in 2018.
Downstream
In 2017, Cenovus’s refining assets continued to deliver strong and reliable operating performance. The company achieved refining and marketing operating margin of $598 million compared with $346 million a year earlier. The increase was largely the result of higher average market crack spreads and stronger margins on the sale of secondary products such asnatural-gas liquids. The increase was partially offset by narrower heavy crude oil differentials and the strengthening of the Canadian dollar relative to the U.S. dollar in 2017 compared with 2016.
Cenovus’s refining operating margin is calculated on afirst-in,first-out (FIFO) inventory accounting basis. Using thelast-in,first-out (LIFO) accounting method employed by most U.S. refiners, operating margin from refining and marketing would have been $93 million lower in 2017. In 2016, operating margin would have been $108 million lower on a LIFO reporting basis.
| Page 4 Q4 2017 | |
Dividend
For the first quarter of 2018, the Board of Directors has declared a dividend of $0.05 per share, payable on March 29, 2018 to common shareholders of record as of March 15, 2018. Based on the February 14, 2018 closing share price on the Toronto Stock Exchange of $9.88, this represents an annualized yield of about 2%. Declaration of dividends is at the sole discretion of the Board and will continue to be evaluated on a quarterly basis.
Year-end disclosure documents
Today, Cenovus Energy Inc. is filing its audited Consolidated Financial Statements for the year ended December 31, 2017 as well as related Management’s Discussion and Analysis (MD&A) with Canadian securities regulatory authorities. Cenovus is also filing today its AIF for the year ended December 31, 2017, which includes disclosure relating to reserves data and other oil and gas information, and its Annual Report on Form40-F for the year ended December 31, 2017 with the U.S. Securities and Exchange Commission. Copies of these documents will be available today on SEDAR atsedar.com, EDGAR atsec.gov (for the Form40-F), and the company’s website atcenovus.com under Investors. They can also be requested by email at investor.relations@cenovus.com.
Conference Call Today 9 a.m. Mountain Time (11 a.m. Eastern Time) Cenovus will host a conference call today, February 15, 2018, starting at 9 a.m. MT (11 a.m. ET). To participate, please dial888-231-8191 (toll-free in North America) or647-427-7450 approximately 10 minutes prior to the conference call. A live audio webcast of the conference call will also be available viacenovus.com. The webcast will be archived for approximately 90 days.
|
ADVISORY
Basis of Presentation– Cenovus reports financial results in Canadian dollars and presents production volumes on a net to Cenovus before royalties basis, unless otherwise stated. Cenovus prepares its financial statements in accordance with International Financial Reporting Standards (IFRS).
Barrels of Oil Equivalent – Natural gas volumes have been converted to barrels of oil equivalent (BOE) on the basis of six thousand cubic feet (Mcf) to one barrel (bbl). BOE may be misleading, particularly if used in isolation. A conversion ratio of one bbl to six Mcf is based on an energy equivalency conversion method primarily applicable at the burner tip and does not represent value equivalency at the wellhead. Given that the value ratio based on the current price of crude oil compared with natural gas is significantly different from the energy equivalency conversion ratio of 6:1, utilizing a conversion on a 6:1 basis is not an accurate reflection of value.
Oil and Gas Information– Estimates of reserves referenced in this release were prepared effective December 31, 2017 by independent qualified reserves evaluators, based on the Canadian Oil and Gas Evaluation Handbook and in compliance with the requirements ofNational Instrument51-101 Standards of Disclosure for Oil and Gas Activities. Estimates are presented using an average of the January 1, 2018 price forecasts from three IQREs. For additional information about our reserves and other oil and gas information, see “Reserves
| Page 5 Q4 2017 | |
Data and Other Oil and Gas Information” in Cenovus’s Annual Information Form (AIF) and Annual Report for Form40-F for the year ended December 31, 2017 (available on SEDAR atsedar.com, on EDGAR atsec.gov and Cenovus’s website atcenovus.com).
Non-GAAP Measures and Additional Subtotal
This news release contains references to adjusted funds flow, free funds flow, operating earnings/loss, net debt, and net debt to adjusted EBITDA, which arenon-GAAP measures, and operating margin, which is an additional subtotal found in Note 1 of Cenovus’s Consolidated Financial Statements for the year ended December 31, 2017. These measures do not have a standardized meaning as prescribed by IFRS. Readers should not consider these measures in isolation or as a substitute for analysis of the company’s results as reported under IFRS. These measures are defined differently by different companies and therefore are not comparable to similar measures presented by other issuers. For definitions, as well as reconciliations to GAAP measures, and more information on these and othernon-GAAP measures and additional subtotals, refer to“Non-GAAP Measures and Additional Subtotals” and the Advisory section of Cenovus’s Management’s Discussion & Analysis (MD&A) for the year ended December 31, 2017 (available on SEDAR atsedar.com, on EDGAR atsec.gov and Cenovus’s website atcenovus.com).
Forward-looking Information
This news release contains certain forward-looking statements and forward-looking information (collectively referred to as “forward-looking information”) within the meaning of applicable securities legislation, including the United States Private Securities Litigation Reform Act of 1995, about Cenovus’s current expectations, estimates and projections about the future, based on certain assumptions made in light of Cenovus’s experience and perception of historical trends. Although Cenovus believes that the expectations represented by such forward-looking information are reasonable, there can be no assurance that such expectations will prove to be correct.
Forward-looking information in this document is identified by words such as “anticipate”, “expect”, “estimate”, “on track”, “goal”, “mitigating”, “capacity”, “plan”, “forecast”, “future”, “target”, “position”, “project”, “will”, “focus”, “potential”, “strategy”, “forward” or similar expressions and includes suggestions of future outcomes, including statements about: the company’s targeted net debt to adjusted EBITDA ratio; the company’s expectations with respect to further cost reductions, including expected reduction inper-barrel oil sands sustaining capital costs by 13% in 2018; that the company is on track to meet its goal of achieving at least $1 billion in cumulative capital, operating and G&A cost reductions over two years; expected workforce reductions; Cenovus’s focus in the short to medium term on driving additional efficiencies across its business while further reducing debt, and anticipated outcome of greater flexibility to balance returning cash to shareholders with making disciplined investments in projects that have the potential for high-return growth; anticipated mitigating effect of the company’s downstream integration, pipeline commitments, rail optionality and financial contracts on wider differentials; all statements and information related to “reserves”; estimated future capital costs to develop the company’s remaining proved undeveloped bitumen reserves; expected impacts of Cenovus’s hedging program; Cenovus’s hedge position as a percentage of its forecast production; expectedgo-forward capital costs for the Christina Lake expansion phase G and expectation that production from phase G will begin in the second half of 2019; and Cenovus’s drilling plans in the Deep Basin in 2018. Readers are cautioned not to place undue reliance on
| Page 6 Q4 2017 | |
forward-looking information as actual results may differ materially from those expressed or implied.
Developing forward-looking information involves reliance on a number of assumptions and consideration of certain risks and uncertainties, some of which are specific to Cenovus and others that apply to the industry generally. Material factors or assumptions on which the forward-looking information in this news release is based include: forecast oil and natural gas, natural gas liquids, condensate and refined products prices and other assumptions and sensitivities inherent in Cenovus’s 2018 guidance, available atcenovus.com; projected capital investment levels, the flexibility of Cenovus’s capital spending plans and the associated sources of funding; accuracy of reserves estimates; future use and development of technology; ability to obtain necessary regulatory and partner approvals; successful and timely implementation of capital projects or stages thereof; ability to generate sufficient cash flow to meet current and future obligations; estimated abandonment and reclamation costs, including associated levies and regulations applicable thereto; Cenovus’s ability to access sufficient capital to pursue its development plans; sustainability of achieved cost reductions, achievement of further cost reductions and sustainability thereof; and other risks and uncertainties described from time to time in the filings we make with securities regulatory authorities. 2018 Guidance (as updated December 13, 2017) assumes: Brent prices of US$55.00/bbl, WTI prices of US$52.00/bbl; WCS of US$37.00/bbl; NYMEX natural gas prices of US$3.00/MMBtu; AECO natural gas prices of $2.20/GJ; Chicago3-2-1 crack spread of US$15.00/bbl; and an exchange rate of $0.78 US$/C$.
Readers are cautioned that the foregoing lists are not exhaustive and are made as at the date hereof. Events or circumstances could cause Cenovus’s actual results to differ materially from those estimated or projected and expressed in, or implied by, the forward-looking information. Additional information about the material risk factors that could cause Cenovus’s actual results to differ materially from those expressed or implied by its forward-looking statements is contained under “Risk Management and Risk Factors” in Cenovus’s MD&A for the year ended December 31, 2017 (available on SEDAR atsedar.com, on EDGAR atsec.gov and Cenovus’s website atcenovus.com).
Cenovus Energy Inc.
Cenovus Energy Inc. is a Canadian integrated oil company. It is committed to applying fresh, progressive thinking to safely and responsibly unlock energy resources the world needs. Operations include oil sands projects in northern Alberta, which use specialized methods to drill and pump the oil to the surface, and established natural gas and oil production in Alberta and British Columbia. The company also has 50% ownership in two U.S. refineries. Cenovus shares trade under the symbol CVE, and are listed on the Toronto and New York stock exchanges. For more information, visitcenovus.com.
Find Cenovus onFacebook,Twitter,LinkedIn,YouTube andInstagram.
| Page 7 Q4 2017 | |
CENOVUS CONTACTS:
Investor Relations Kam Sandhar Senior Vice-President, Strategy & Corporate Development 403-766-5883
Steven Murray Manager, Investor Relations 403-766-3382 | Media Sonja Franklin Senior Media Advisor 403-766-7264
Media Relations general line 403-766-7751 |
| Page 8 Q4 2017 | |
CONSOLIDATED STATEMENTS OF EARNINGS (LOSS)
(unaudited)
For the periods ended December 31,
($ millions, except per share amounts)
| Three Months Ended | Twelve Months Ended | |||||||||||||||||||||
| Notes | 2017 | 2016 | 2017 | 2016 | ||||||||||||||||||
| (Restated) (1) | (Restated) (1) | |||||||||||||||||||||
Revenues | 1 | |||||||||||||||||||||
Gross Sales | 5,212 | 3,326 | 17,314 | 11,015 | ||||||||||||||||||
Less: Royalties | 133 | 2 | 271 | 9 | ||||||||||||||||||
| 5,079 | 3,324 | 17,043 | 11,006 | |||||||||||||||||||
Expenses | 1 | |||||||||||||||||||||
Purchased Product | 2,052 | 2,075 | 8,033 | 6,978 | ||||||||||||||||||
Transportation and Blending | 1,214 | 491 | 3,748 | 1,715 | ||||||||||||||||||
Operating | 557 | 326 | 1,949 | 1,239 | ||||||||||||||||||
Production and Mineral Taxes | 1 | - | 1 | - | ||||||||||||||||||
(Gain) Loss on Risk Management | 23 | 887 | 103 | 896 | 401 | |||||||||||||||||
Depreciation, Depletion and Amortization | 13 | 618 | 239 | 1,838 | 931 | |||||||||||||||||
Exploration Expense | 12 | 887 | - | 888 | 2 | |||||||||||||||||
General and Administrative | 91 | 101 | 308 | 326 | ||||||||||||||||||
Finance Costs | 5 | 187 | 98 | 645 | 390 | |||||||||||||||||
Interest Income | (3) | (7) | (62) | (52) | ||||||||||||||||||
Foreign Exchange (Gain) Loss, Net | 6 | 24 | 140 | (812) | (198) | |||||||||||||||||
Revaluation (Gain) | 4 | - | - | (2,555) | - | |||||||||||||||||
Transaction Costs | 4 | - | - | 56 | - | |||||||||||||||||
Re-measurement of Contingent Payment | 4,15 | (29) | - | (138) | - | |||||||||||||||||
Research Costs | 21 | 6 | 36 | 36 | ||||||||||||||||||
(Gain) Loss on Divestiture of Assets | 1 | - | 1 | 6 | ||||||||||||||||||
Other (Income) Loss, Net | 7 | (1) | 27 | (5) | 34 | |||||||||||||||||
Earnings (Loss) From Continuing Operations Before Income Tax | (1,428) | (275) | 2,216 | (802) | ||||||||||||||||||
Income Tax Expense (Recovery) | 10 | (652) | (66) | (52) | (343) | |||||||||||||||||
Net Earnings (Loss) From Continuing Operations | (776) | (209) | 2,268 | (459) | ||||||||||||||||||
Net Earnings (Loss) From Discontinued Operations | 9 | 1,396 | 300 | 1,098 | (86) | |||||||||||||||||
Net Earnings (Loss) | 620 | 91 | 3,366 | (545) | ||||||||||||||||||
Basic and Diluted Earnings (Loss) Per Share($) | 11 | |||||||||||||||||||||
Continuing Operations | (0.63) | (0.25) | 2.06 | (0.55) | ||||||||||||||||||
Discontinued Operations | 1.13 | 0.36 | 0.99 | (0.10) | ||||||||||||||||||
Net Earnings (Loss) Per Share | 0.50 | 0.11 | 3.05 | (0.65) | ||||||||||||||||||
| (1) | The comparative periods have been restated to reflect discontinued operations as discussed in Notes 1 and 9. |
See accompanying Notes to Consolidated Financial Statements (unaudited).
| Cenovus Energy Inc. | 3 | For the period ended December 31, 2017 |
CONSOLIDATED STATEMENTS OF COMPREHENSIVE INCOME (LOSS) (unaudited)
For the periods ended December 31,
($ millions)
| Three Months Ended | Twelve Months Ended | |||||||||||||||||||||||||||||
| Notes | 2017 | 2016 | 2017 | 2016 | ||||||||||||||||||||||||||
Net Earnings (Loss) | 620 | 91 | 3,366 | (545 | ) | |||||||||||||||||||||||||
Other Comprehensive Income (Loss), Net of Tax | 20 | |||||||||||||||||||||||||||||
Items That Will Not be Reclassified to Profit or Loss: | ||||||||||||||||||||||||||||||
Actuarial Gain (Loss) Relating to Pension and Other Post-Retirement Benefits | 8 | 6 | 9 | (3 | ) | |||||||||||||||||||||||||
Items That May be Reclassified to Profit or Loss: | ||||||||||||||||||||||||||||||
Available for Sale Financial Assets – Change in Fair Value | - | - | (1 | ) | (2 | ) | ||||||||||||||||||||||||
Available for Sale Financial Assets – Reclassified to Profit or Loss | - | - | - | 1 | ||||||||||||||||||||||||||
Foreign Currency Translation Adjustment | 15 | 99 | (275 | ) | (106 | ) | ||||||||||||||||||||||||
Total Other Comprehensive Income (Loss), Net of Tax | 23 | 105 | (267 | ) | (110 | ) | ||||||||||||||||||||||||
Comprehensive Income (Loss) | 643 | 196 | 3,099 | (655 | ) | |||||||||||||||||||||||||
See accompanying Notes to Consolidated Financial Statements (unaudited).
| Cenovus Energy Inc. | 4 | For the period ended December 31, 2017 |
CONSOLIDATED BALANCE SHEETS (unaudited)
As at December 31,
($ millions)
| Notes | 2017 | 2016 | ||||||||||||
Assets | ||||||||||||||
Current Assets | ||||||||||||||
Cash and Cash Equivalents | 610 | 3,720 | ||||||||||||
Accounts Receivable and Accrued Revenues | 1,830 | 1,838 | ||||||||||||
Income Tax Receivable | 68 | 6 | ||||||||||||
Inventories | 1,389 | 1,237 | ||||||||||||
Risk Management | 23,24 | 63 | 21 | |||||||||||
Assets Held for Sale | 9 | 1,048 | - | |||||||||||
Total Current Assets | 5,008 | 6,822 | ||||||||||||
Exploration and Evaluation Assets | 1,12 | 3,673 | 1,585 | |||||||||||
Property, Plant and Equipment, Net | 1,13 | 29,596 | 16,426 | |||||||||||
Income Tax Receivable | 311 | 124 | ||||||||||||
Risk Management | 23,24 | 2 | 3 | |||||||||||
Other Assets | 71 | 56 | ||||||||||||
Goodwill | 14 | 2,272 | 242 | |||||||||||
Total Assets | 40,933 | 25,258 | ||||||||||||
Liabilities and Shareholders’ Equity | ||||||||||||||
Current Liabilities | ||||||||||||||
Accounts Payable and Accrued Liabilities | 2,635 | 2,266 | ||||||||||||
Contingent Payment | 15 | 38 | - | |||||||||||
Income Tax Payable | 129 | 112 | ||||||||||||
Risk Management | 23,24 | 1,031 | 293 | |||||||||||
Liabilities Related to Assets Held for Sale | 9 | 603 | - | |||||||||||
Total Current Liabilities | 4,436 | 2,671 | ||||||||||||
Long-Term Debt | 16 | 9,513 | 6,332 | |||||||||||
Contingent Payment | 15 | 168 | - | |||||||||||
Risk Management | 23,24 | 20 | 22 | |||||||||||
Decommissioning Liabilities | 17 | 1,029 | 1,847 | |||||||||||
Other Liabilities | 18 | 173 | 211 | |||||||||||
Deferred Income Taxes | 5,613 | 2,585 | ||||||||||||
Total Liabilities | 20,952 | 13,668 | ||||||||||||
Shareholders’ Equity | 19,981 | 11,590 | ||||||||||||
Total Liabilities and Shareholders’ Equity | 40,933 | 25,258 | ||||||||||||
See accompanying Notes to Consolidated Financial Statements (unaudited).
| Cenovus Energy Inc. | 5 | For the period ended December 31, 2017 |
CONSOLIDATED STATEMENTS OF SHAREHOLDERS’ EQUITY
(unaudited)
($ millions)
Share Capital | Paid in Surplus | Retained Earnings | AOCI (1) | Total | ||||||||||||||||||||||||
| (Note 19 | ) | (Note 20 | ) | |||||||||||||||||||||||||
As at December 31, 2015 | 5,534 | 4,330 | 1,507 | 1,020 | 12,391 | |||||||||||||||||||||||
Net Earnings (Loss) | - | - | (545 | ) | - | (545 | ) | |||||||||||||||||||||
Other Comprehensive Income (Loss) | - | - | - | (110 | ) | (110 | ) | |||||||||||||||||||||
Total Comprehensive Income (Loss) | - | - | (545 | ) | (110 | ) | (655 | ) | ||||||||||||||||||||
Stock-Based Compensation Expense | - | 20 | - | - | 20 | |||||||||||||||||||||||
Dividends on Common Shares | - | - | (166 | ) | - | (166 | ) | |||||||||||||||||||||
As at December 31, 2016 | 5,534 | 4,350 | 796 | 910 | 11,590 | |||||||||||||||||||||||
Net Earnings (Loss) | - | - | 3,366 | - | 3,366 | |||||||||||||||||||||||
Other Comprehensive Income (Loss) | - | - | - | (267 | ) | (267 | ) | |||||||||||||||||||||
Total Comprehensive Income (Loss) | - | - | 3,366 | (267 | ) | 3,099 | ||||||||||||||||||||||
Common Shares Issued | 5,506 | - | - | - | 5,506 | |||||||||||||||||||||||
Stock-Based Compensation Expense | - | 11 | - | - | 11 | |||||||||||||||||||||||
Dividends on Common Shares | - | - | (225 | ) | - | (225 | ) | |||||||||||||||||||||
As at December 31, 2017 | 11,040 | 4,361 | 3,937 | 643 | 19,981 | |||||||||||||||||||||||
| (1) | Accumulated Other Comprehensive Income (Loss). |
See accompanying Notes to Consolidated Financial Statements (unaudited).
| Cenovus Energy Inc. | 6 | For the period ended December 31, 2017 |
CONSOLIDATED STATEMENTS OF CASH FLOWS (unaudited)
For the periods ended December 31,
($ millions)
| Three Months Ended | Twelve Months Ended | |||||||||||||||||||||||||
| Notes | 2017 | 2016 | 2017 | 2016 | ||||||||||||||||||||||
Operating Activities | ||||||||||||||||||||||||||
Net Earnings (Loss) | 620 | 91 | 3,366 | (545 | ) | |||||||||||||||||||||
Depreciation, Depletion and Amortization | 13 | 620 | (71 | ) | 2,030 | 1,498 | ||||||||||||||||||||
Exploration Expense | 12 | 887 | - | 890 | 2 | |||||||||||||||||||||
Deferred Income Taxes | 10 | (153 | ) | 144 | 583 | (209 | ) | |||||||||||||||||||
Unrealized (Gain) Loss on Risk Management | 23 | 654 | 114 | 729 | 554 | |||||||||||||||||||||
Unrealized Foreign Exchange (Gain) Loss | 6 | 51 | 152 | (857 | ) | (189 | ) | |||||||||||||||||||
Revaluation (Gain) | 4 | - | - | (2,555 | ) | - | ||||||||||||||||||||
Re-measurement of Contingent Payment | 15 | (29 | ) | - | (138 | ) | - | |||||||||||||||||||
(Gain) Loss on Discontinuance | 9 | (1,888 | ) | - | (1,285 | ) | - | |||||||||||||||||||
(Gain) Loss on Divestiture of Assets | 1 | - | 1 | 6 | ||||||||||||||||||||||
Unwinding of Discount on Decommissioning Liabilities | 17 | 60 | 33 | 128 | 130 | |||||||||||||||||||||
Onerous Contract Provisions, Net of Cash Paid | (1 | ) | 27 | (8 | ) | 53 | ||||||||||||||||||||
Other Asset Impairments | 7 | - | 23 | - | 30 | |||||||||||||||||||||
Other | 44 | 22 | 30 | 93 | ||||||||||||||||||||||
Net Change in Other Assets and Liabilities | (32 | ) | (32 | ) | (107 | ) | (91 | ) | ||||||||||||||||||
Net Change inNon-Cash Working Capital | 66 | (339 | ) | 252 | (471 | ) | ||||||||||||||||||||
Cash From Operating Activities | 900 | 164 | 3,059 | 861 | ||||||||||||||||||||||
Investing Activities | ||||||||||||||||||||||||||
Acquisition, Net of Cash Acquired | 4 | (3 | ) | - | (14,565 | ) | - | |||||||||||||||||||
Capital Expenditures – Exploration and Evaluation Assets | 12 | (19 | ) | (11 | ) | (147 | ) | (67 | ) | |||||||||||||||||
Capital Expenditures – Property, Plant and Equipment | 13 | (568 | ) | (248 | ) | (1,523 | ) | (967 | ) | |||||||||||||||||
Proceeds From Divestiture of Assets | 2,271 | - | 3,210 | 8 | ||||||||||||||||||||||
Net Change in Investments and Other | - | (1 | ) | - | (1 | ) | ||||||||||||||||||||
Net Change inNon-Cash Working Capital | 106 | 16 | 159 | (52 | ) | |||||||||||||||||||||
Cash From (Used in) Investing Activities | 1,787 | (244 | ) | (12,866 | ) | (1,079 | ) | |||||||||||||||||||
Net Cash Provided (Used) Before Financing Activities | 2,687 | (80 | ) | (9,807 | ) | (218 | ) | |||||||||||||||||||
Financing Activities | 25 | |||||||||||||||||||||||||
Issuance of Long-Term Debt | 16 | - | - | 3,842 | - | |||||||||||||||||||||
Net Issuance (Repayment) of Revolving Long-Term Debt | 16 | (1 | ) | - | 32 | - | ||||||||||||||||||||
Net Issuance of Debt Under Asset Sale Bridge Facility | 16 | - | - | 3,569 | - | |||||||||||||||||||||
Repayment of Debt Under Asset Sale Bridge Facility | 16 | (2,650 | ) | - | (3,600 | ) | - | |||||||||||||||||||
Common Shares Issued, Net of Issuance Costs | 19 | - | - | 2,899 | - | |||||||||||||||||||||
Dividends Paid on Common Shares | 11 | (61 | ) | (42 | ) | (225 | ) | (166 | ) | |||||||||||||||||
Other | - | (1 | ) | (2 | ) | (2 | ) | |||||||||||||||||||
Cash From (Used in) Financing Activities | (2,712 | ) | (43 | ) | 6,515 | (168 | ) | |||||||||||||||||||
Foreign Exchange Gain (Loss) on Cash and Cash Equivalents Held in Foreign Currency | 3 | (7 | ) | 182 | 1 | |||||||||||||||||||||
Increase (Decrease) in Cash and Cash Equivalents | (22 | ) | (130 | ) | (3,110 | ) | (385 | ) | ||||||||||||||||||
Cash and Cash Equivalents, Beginning of Period | 632 | 3,850 | 3,720 | 4,105 | ||||||||||||||||||||||
Cash and Cash Equivalents, End of Period | 610 | 3,720 | 610 | 3,720 | ||||||||||||||||||||||
See accompanying Notes to Consolidated Financial Statements (unaudited).
| Cenovus Energy Inc. | 7 | For the period ended December 31, 2017 |
NOTES TO CONSOLIDATED FINANCIAL STATEMENTS (unaudited)
All amounts in $ millions, unless otherwise indicated
For the period ended December 31, 2017
1. DESCRIPTION OF BUSINESS AND SEGMENTED DISCLOSURES
Cenovus Energy Inc. and its subsidiaries, (together “Cenovus” or the “Company”) are in the business of developing, producing and marketing crude oil, natural gas liquids (“NGLs”) and natural gas in Canada with marketing activities and refining operations in the United States (“U.S.”).
Cenovus is incorporated under the Canada Business Corporations Act and its shares are listed on the Toronto (“TSX”) and New York (“NYSE”) stock exchanges. The executive and registered office is located at 2600, 500 Centre Street S.E., Calgary, Alberta, Canada, T2G 1A6. Information on the Company’s basis of preparation for these interim Consolidated Financial Statements is found in Note 2.
On May 17, 2017, Cenovus acquired from ConocoPhillips Company and certain of its subsidiaries (collectively, “ConocoPhillips”) a 50 percent interest in FCCL Partnership (“FCCL”) and the majority of ConocoPhillips’ western Canadian conventional crude oil and natural gas assets (the “Deep Basin Assets”). This acquisition (the “Acquisition”) increased Cenovus’s interest in FCCL to 100 percent and expanded Cenovus’s operating areas to include more than three million net acres of land, exploration and production assets and related infrastructure and agreements in Alberta and British Columbia. The Acquisition had an effective date of January 1, 2017 (see Note 4).
Management has determined the operating segments based on information regularly reviewed for the purposes of decision making, allocating resources and assessing operational performance by Cenovus’s chief operating decision makers. The Company evaluates the financial performance of its operating segments primarily based on operating margin. The Company’s reportable segments are:
| ● | Oil Sands, which includes the development and production of bitumen and natural gas in northeast Alberta. Cenovus’s bitumen assets include Foster Creek, Christina Lake and Narrows Lake as well as other projects in the early stages of development. The Company’s interest in certain of its operated oil sands properties, notably Foster Creek, Christina Lake and Narrows Lake, increased from 50 percent to 100 percent on May 17, 2017. |
| ● | Deep Basin, which includes approximately three million net acres of land primarily in the Elmworth-Wapiti, Kaybob-Edson, and Clearwater operating areas, rich in natural gas and NGLs. The assets reside in Alberta and British Columbia and include interests in numerous natural gas processing facilities. The Deep Basin Assets were acquired on May 17, 2017. |
| ● | Refining and Marketing, which is responsible for transporting, selling and refining crude oil into petroleum and chemical products. Cenovus jointly owns two refineries in the U.S. with the operator Phillips 66, an unrelated U.S. public company. In addition, Cenovus owns and operates acrude-by-rail terminal in Alberta. This segment coordinates Cenovus’s marketing and transportation initiatives to optimize product mix, delivery points, transportation commitments and customer diversification. The marketing of crude oil and natural gas sourced from Canada, including physical product sales that settle in the U.S., is considered to be undertaken by a Canadian business. U.S. sourced crude oil and natural gas purchases and sales are attributed to the U.S. |
| ● | Corporate and Eliminations, which primarily includes unrealized gains and losses recorded on derivative financial instruments, gains and losses on divestiture of assets, as well as other Cenovus-wide costs for general and administrative, financing activities and research costs. As financial instruments are settled, the realized gains and losses are recorded in the reportable segment to which the derivative instrument relates. Eliminations relate to sales and operating revenues, and purchased product between segments, recorded at transfer prices based on current market prices, and to unrealized intersegment profits in inventory. The Corporate and Eliminations segment is attributed to Canada, with the exception of unrealized risk management gains and losses, which have been attributed to the country in which the transacting entity resides. |
In 2017, Cenovus disposed of the majority of the crude oil and natural gas assets in the Company’s Conventional segment. As such, the results of operations have been classified as a discontinued operation (see Note 9). This segment included the production of conventional crude oil, NGLs and natural gas in Alberta and Saskatchewan, including the heavy oil assets at Pelican Lake, the CO2 enhanced oil recovery project at Weyburn and emerging tight oil opportunities. As at December 31, 2017, all Conventional assets were sold, except for the Company’s Suffield operations. The sale of the Suffield assets closed on January 5, 2018.
| Cenovus Energy Inc. | 8 | For the period ended December 31, 2017 |
NOTES TO CONSOLIDATED FINANCIAL STATEMENTS (unaudited)
All amounts in $ millions, unless otherwise indicated
For the period ended December 31, 2017
The following tabular financial information presents the segmented information first by segment, then by product and geographic location.
A) Results of Operations — Segment and Operational Information
| Oil Sands | Deep Basin | Refining and Marketing | ||||||||||||||||||||||||||||||||
| For the three months ended December 31, | 2017 | 2016 | 2017 | 2016 | 2017 | 2016 | ||||||||||||||||||||||||||||
Revenues | ||||||||||||||||||||||||||||||||||
Gross Sales | 2,424 | 957 | 231 | - | 2,690 | 2,477 | ||||||||||||||||||||||||||||
Less: Royalties | 113 | 2 | 20 | - | - | - | ||||||||||||||||||||||||||||
| 2,311 | 955 | 211 | - | 2,690 | 2,477 | |||||||||||||||||||||||||||||
Expenses | ||||||||||||||||||||||||||||||||||
Purchased Product | - | - | - | - | 2,181 | 2,181 | ||||||||||||||||||||||||||||
Transportation and Blending | 1,193 | 493 | 24 | - | - | - | ||||||||||||||||||||||||||||
Operating | 271 | 142 | 94 | - | 193 | 185 | ||||||||||||||||||||||||||||
Production and Mineral Taxes | - | - | 1 | - | - | - | ||||||||||||||||||||||||||||
(Gain) Loss on Risk Management | 235 | (14 | ) | - | - | 2 | 3 | |||||||||||||||||||||||||||
Operating Margin | 612 | 334 | 92 | - | 314 | 108 | ||||||||||||||||||||||||||||
Depreciation, Depletion and Amortization | 383 | 170 | 167 | - | 53 | 54 | ||||||||||||||||||||||||||||
Exploration Expense | 887 | - | - | - | - | - | ||||||||||||||||||||||||||||
Segment Income (Loss) | (658 | ) | 164 | (75 | ) | - | 261 | 54 | ||||||||||||||||||||||||||
| Corporate and Eliminations | Consolidated | |||||||||||||||||||||||||||||||||
| For the three months ended December 31, | 2017 | 2016 | 2017 | 2016 | ||||||||||||||||||||||||||||||
Revenues | ||||||||||||||||||||||||||||||||||
Gross Sales | (133 | ) | (108 | ) | 5,212 | 3,326 | ||||||||||||||||||||||||||||
Less: Royalties | - | - | 133 | 2 | ||||||||||||||||||||||||||||||
|
(133 |
) | (108 | ) | 5,079 | 3,324 | ||||||||||||||||||||||||||||
Expenses | ||||||||||||||||||||||||||||||||||
Purchased Product | (129 | ) | (106 | ) | 2,052 | 2,075 | ||||||||||||||||||||||||||||
Transportation and Blending | (3 | ) | (2 | ) | 1,214 | 491 | ||||||||||||||||||||||||||||
Operating | (1 | ) | (1 | ) | 557 | 326 | ||||||||||||||||||||||||||||
Production and Mineral Taxes | - | - | 1 | - | ||||||||||||||||||||||||||||||
(Gain) Loss on Risk Management | 650 | 114 | 887 | 103 | ||||||||||||||||||||||||||||||
Depreciation, Depletion and Amortization | 15 | 15 | 618 | 239 | ||||||||||||||||||||||||||||||
Exploration Expense | - | - | 887 | - | ||||||||||||||||||||||||||||||
Segment Income (Loss) | (665 | ) | (128 | ) | (1,137 | ) | 90 | |||||||||||||||||||||||||||
General and Administrative | 91 | 101 | 91 | 101 | ||||||||||||||||||||||||||||||
Finance Costs | 187 | 98 | 187 | 98 | ||||||||||||||||||||||||||||||
Interest Income | (3 | ) | (7 | ) | (3 | ) | (7 | ) | ||||||||||||||||||||||||||
Foreign Exchange (Gain) Loss, Net | 24 | 140 | 24 | 140 | ||||||||||||||||||||||||||||||
Revaluation (Gain) | - | - | - | - | ||||||||||||||||||||||||||||||
Transaction Costs | - | - | - | - | ||||||||||||||||||||||||||||||
Re-measurement of Contingent Payment | (29 | ) | - | (29 | ) | - | ||||||||||||||||||||||||||||
Research Costs | 21 | 6 | 21 | 6 | ||||||||||||||||||||||||||||||
(Gain) Loss on Divestiture of Assets | 1 | - | 1 | - | ||||||||||||||||||||||||||||||
Other (Income) Loss, Net | (1 | ) | 27 | (1 | ) | 27 | ||||||||||||||||||||||||||||
|
291 |
| 365 | 291 | 365 | |||||||||||||||||||||||||||||
Earnings (Loss) From Continuing Operations Before Income Tax |
|
(1,428 |
) | (275 | ) | |||||||||||||||||||||||||||||
Income Tax Expense (Recovery) | (652 | ) | (66 | ) | ||||||||||||||||||||||||||||||
Net Earnings (Loss) From Continuing Operations |
|
(776 |
) | (209 | ) | |||||||||||||||||||||||||||||
| Cenovus Energy Inc. | 9 | For the period ended December 31, 2017 |
NOTES TO CONSOLIDATED FINANCIAL STATEMENTS (unaudited)
All amounts in $ millions, unless otherwise indicated
For the period ended December 31, 2017
| Oil Sands | Deep Basin | Refining and Marketing | ||||||||||||||||||||||||||||||||
| For the twelve months ended December 31, | 2017 | 2016 | 2017 | 2016 | 2017 | 2016 | ||||||||||||||||||||||||||||
Revenues | ||||||||||||||||||||||||||||||||||
Gross Sales | 7,362 | 2,929 | 555 | - | 9,852 | 8,439 | ||||||||||||||||||||||||||||
Less: Royalties | 230 | 9 | 41 | - | - | - | ||||||||||||||||||||||||||||
|
7,132 |
| 2,920 | 514 | - | 9,852 | 8,439 | |||||||||||||||||||||||||||
Expenses | ||||||||||||||||||||||||||||||||||
Purchased Product | - | - | - | - | 8,476 | 7,325 | ||||||||||||||||||||||||||||
Transportation and Blending | 3,704 | 1,721 | 56 | - | - | - | ||||||||||||||||||||||||||||
Operating | 934 | 501 | 250 | - | 772 | 742 | ||||||||||||||||||||||||||||
Production and Mineral Taxes | - | - | 1 | - | - | - | ||||||||||||||||||||||||||||
(Gain) Loss on Risk Management | 307 | (179) | - | - | 6 | 26 | ||||||||||||||||||||||||||||
Operating Margin |
|
2,187 |
| 877 | 207 | - | 598 | 346 | ||||||||||||||||||||||||||
Depreciation, Depletion and Amortization | 1,230 | 655 | 331 | - | 215 | 211 | ||||||||||||||||||||||||||||
Exploration Expense | 888 | 2 | - | - | - | - | ||||||||||||||||||||||||||||
Segment Income (Loss) | 69 | 220 | (124 | ) | - | 383 | 135 | |||||||||||||||||||||||||||
| Corporate and Eliminations | Consolidated | |||||||||||||||||||||||||||||||||
| For the twelve months ended December 31, | 2017 | 2016 | 2017 | 2016 | ||||||||||||||||||||||||||||||
Revenues | ||||||||||||||||||||||||||||||||||
Gross Sales | (455 | ) | (353 | ) | 17,314 | 11,015 | ||||||||||||||||||||||||||||
Less: Royalties | - | - | 271 | 9 | ||||||||||||||||||||||||||||||
|
(455 |
) | (353 | ) | 17,043 | 11,006 | ||||||||||||||||||||||||||||
Expenses | ||||||||||||||||||||||||||||||||||
Purchased Product | (443 | ) | (347 | ) | 8,033 | 6,978 | ||||||||||||||||||||||||||||
Transportation and Blending | (12 | ) | (6 | ) | 3,748 | 1,715 | ||||||||||||||||||||||||||||
Operating | (7 | ) | (4 | ) | 1,949 | 1,239 | ||||||||||||||||||||||||||||
Production and Mineral Taxes | - | - | 1 | - | ||||||||||||||||||||||||||||||
(Gain) Loss on Risk Management | 583 | 554 | 896 | 401 | ||||||||||||||||||||||||||||||
Depreciation, Depletion and Amortization | 62 | 65 | 1,838 | 931 | ||||||||||||||||||||||||||||||
Exploration Expense | - | - | 888 | 2 | ||||||||||||||||||||||||||||||
Segment Income (Loss) |
|
(638 |
) | (615 | ) | (310 | ) | (260 | ) | |||||||||||||||||||||||||
General and Administrative | 308 | 326 | 308 | 326 | ||||||||||||||||||||||||||||||
Finance Costs | 645 | 390 | 645 | 390 | ||||||||||||||||||||||||||||||
Interest Income | (62 | ) | (52 | ) | (62 | ) | (52 | ) | ||||||||||||||||||||||||||
Foreign Exchange (Gain) Loss, Net | (812 | ) | (198 | ) | (812 | ) | (198 | ) | ||||||||||||||||||||||||||
Revaluation (Gain) | (2,555 | ) | - | (2,555 | ) | - | ||||||||||||||||||||||||||||
Transaction Costs | 56 | - | 56 | - | ||||||||||||||||||||||||||||||
Re-measurement of Contingent Payment | (138 | ) | - | (138 | ) | - | ||||||||||||||||||||||||||||
Research Costs | 36 | 36 | 36 | 36 | ||||||||||||||||||||||||||||||
(Gain) Loss on Divestiture of Assets | 1 | 6 | 1 | 6 | ||||||||||||||||||||||||||||||
Other (Income) Loss, Net | (5 | ) | 34 | (5 | ) | 34 | ||||||||||||||||||||||||||||
|
(2,526 |
) | 542 | (2,526 | ) | 542 | ||||||||||||||||||||||||||||
Earnings (Loss) From Continuing Operations Before Income Tax | 2,216 | (802 | ) | |||||||||||||||||||||||||||||||
Income Tax Expense (Recovery) | (52 | ) | (343 | ) | ||||||||||||||||||||||||||||||
Net Earnings (Loss) From Continuing Operations | 2,268 | (459 | ) | |||||||||||||||||||||||||||||||
| Cenovus Energy Inc. | 10 | For the period ended December 31, 2017 |
NOTES TO CONSOLIDATED FINANCIAL STATEMENTS (unaudited)
All amounts in $ millions, unless otherwise indicated
For the period ended December 31, 2017
B) Revenues by Product
| Three Months Ended | Twelve Months Ended | |||||||||||||||||||||
| For the periods ended December 31, | 2017 | 2016 | 2017 | 2016 | ||||||||||||||||||
Upstream | ||||||||||||||||||||||
Crude Oil | 2,339 | 949 | 7,184 | 2,902 | ||||||||||||||||||
Natural Gas(1) | 84 | 5 | 235 | 16 | ||||||||||||||||||
NGLs | 84 | - | 184 | - | ||||||||||||||||||
Other | 15 | 1 | 43 | 2 | ||||||||||||||||||
Refining and Marketing | 2,690 | 2,477 | 9,852 | 8,439 | ||||||||||||||||||
Corporate and Eliminations | (133 | ) | (108 | ) | (455 | ) | (353 | ) | ||||||||||||||
Revenues From Continuing Operations | 5,079 | 3,324 | 17,043 | 11,006 | ||||||||||||||||||
(1) In the three and twelve months ending December 31, 2017, approximately 11 percent and 14 percent, respectively, of the natural gas produced by Cenovus’s Deep Basin Assets was sold to ConocoPhillips resulting in gross sales of $10 million and $32 million, respectively. |
| |||||||||||||||||||||
| C) Geographical Information | ||||||||||||||||||||||
| Revenues | ||||||||||||||||||||||
| Three Months Ended | Twelve Months Ended | |||||||||||||||||||||
For the periods ended December 31, | 2017 | 2016 | 2017 | 2016 | ||||||||||||||||||
Canada | 2,970 | 1,648 | 9,723 | 4,978 | ||||||||||||||||||
United States | 2,109 | 1,676 | 7,320 | 6,028 | ||||||||||||||||||
Revenues From Continuing Operations | 5,079 | 3,324 | 17,043 | 11,006 | ||||||||||||||||||
| Non-Current Assets (1) | ||||||||||||||||||||||
| As at December 31, | 2017 | 2016 | ||||||||||||||||||||
Canada(2) | 31,756 | 14,130 | ||||||||||||||||||||
United States | 3,856 | 4,179 | ||||||||||||||||||||
Consolidated | 35,612 | 18,309 | ||||||||||||||||||||
(1) Includes exploration and evaluation (“E&E”) assets, property, plant and equipment (“PP&E”), goodwill and other assets. |
| |||||||||||||||||||||
(2) Certain crude oil and natural gas properties of the Conventional and Deep Basin segments, which reside in Canada, have been reclassified as held for sale in 2017 in current assets. 2016 includes $3.1 billion related to the Conventional segment. |
| |||||||||||||||||||||
| D) Exploration and Evaluation Assets, Property, Plant and Equipment, Goodwill and Total Assets | ||||||||||||||||||||||
| E&E | PP&E | |||||||||||||||||||||
| As at December 31, | 2017 | 2016 | 2017 | 2016 | ||||||||||||||||||
Oil Sands | 617 | 1,564 | 22,320 | 8,798 | ||||||||||||||||||
Deep Basin | 3,056 | - | 3,019 | - | ||||||||||||||||||
Conventional | - | 21 | - | 3,080 | ||||||||||||||||||
Refining and Marketing | - | - | 3,967 | 4,273 | ||||||||||||||||||
Corporate and Eliminations | - | - | 290 | 275 | ||||||||||||||||||
Consolidated | 3,673 | 1,585 | 29,596 | 16,426 | ||||||||||||||||||
| Goodwill | Total Assets | |||||||||||||||||||||
| As at December 31, | 2017 | 2016 | 2017 | 2016 | ||||||||||||||||||
Oil Sands | 2,272 | 242 | 26,799 | 11,112 | ||||||||||||||||||
Deep Basin | - | - | 6,694 | - | ||||||||||||||||||
Conventional | - | - | 644 | 3,196 | ||||||||||||||||||
Refining and Marketing | - | - | 5,432 | 6,613 | ||||||||||||||||||
Corporate and Eliminations | - | - | 1,364 | 4,337 | ||||||||||||||||||
Consolidated | 2,272 | 242 | 40,933 | 25,258 | ||||||||||||||||||
| Cenovus Energy Inc. | 11 | For the period ended December 31, 2017 |
NOTES TO CONSOLIDATED FINANCIAL STATEMENTS (unaudited)
All amounts in $ millions, unless otherwise indicated
For the period ended December 31, 2017
E) Capital Expenditures(1)
| Three Months Ended | Twelve Months Ended | |||||||||||||||||||||||
| For the periods ended December 31, | 2017 | 2016 | 2017 | 2016 | ||||||||||||||||||||
Capital | ||||||||||||||||||||||||
Oil Sands | 313 | 128 | 973 | 604 | ||||||||||||||||||||
Deep Basin | 148 | - | 225 | - | ||||||||||||||||||||
Conventional | 26 | 57 | 206 | 171 | ||||||||||||||||||||
Refining and Marketing | 56 | 65 | 180 | 220 | ||||||||||||||||||||
Corporate | 40 | 9 | 77 | 31 | ||||||||||||||||||||
Capital Investment | 583 | 259 | 1,661 | 1,026 | ||||||||||||||||||||
Acquisition Capital | ||||||||||||||||||||||||
Oil Sands(2) | 7 | - | 11,614 | 11 | ||||||||||||||||||||
Deep Basin | 80 | - | 6,774 | - | ||||||||||||||||||||
Total Capital Expenditures | 670 | 259 | 20,049 | 1,037 | ||||||||||||||||||||
| (1) | Includes expenditures on PP&E, E&E assets and assets held for sale. |
| (2) | In connection with the Acquisition discussed in Note 4, Cenovus was deemed to have disposed of itspre-existing interest in FCCL andre-acquired it at fair value as required by International Financial Reporting Standard 3, “Business Combinations” (“IFRS 3”), which is not reflected in the table above. The carrying value of thepre-existing interest was $9,081 million and the estimated fair value was $11,605 million as at May 17, 2017. |
2. BASIS OF PREPARATION AND STATEMENT OF COMPLIANCE
In these interim Consolidated Financial Statements, unless otherwise indicated, all dollars are expressed in Canadian dollars. All references to C$ or $ are to Canadian dollars and references to US$ are to U.S. dollars.
These interim Consolidated Financial Statements have been prepared in accordance with International Financial Reporting Standards (“IFRS”) as issued by the International Accounting Standards Board (“IASB”) applicable to the preparation of interim financial statements, including International Accounting Standard 34, “Interim Financial Reporting” (“IAS 34”).
Certain information provided for the prior year has been reclassified to conform to the presentation adopted for the period ended December 31, 2017.
These interim Consolidated Financial Statements were approved by the Audit Committee effective February 14, 2018.
3. SIGNIFICANT ACCOUNTING POLICIES
A) Accounting Policies
Certain information and disclosures normally included in the notes to the annual Consolidated Financial Statements have been condensed or have been disclosed on an annual basis only. Accordingly, these interim Consolidated Financial Statements should be read in conjunction with the annual Consolidated Financial Statements for the year ended December 31, 2016, which have been prepared in accordance with IFRS as issued by the IASB. These interim Consolidated Financial Statements have been prepared following the same accounting policies and methods of computation as the annual Consolidated Financial Statements for the year ended December 31, 2016, except for income taxes. Clarification on the Company’s business combinations and goodwill accounting policy has been added below.
Income Taxes
Income taxes on earnings or loss in interim periods are accrued using the income tax rate that would be applicable to the expected total annual earnings or loss.
Business Combinations and Goodwill
Business combinations are accounted for using the acquisition method of accounting in which the identifiable assets acquired, liabilities assumed andnon-controlling interest, if any, are recognized and measured at their fair value at the date of acquisition. Any excess of the purchase price plus anynon-controlling interest over the fair value of the net assets acquired is recognized as goodwill. Any deficiency of the purchase price over the fair value of the net assets acquired is credited to net earnings.
At acquisition, goodwill is allocated to each of the cash-generating units (“CGUs”) to which it relates. Subsequent measurement of goodwill is at cost less any accumulated impairment losses.
| Cenovus Energy Inc. | 12 | For the period ended December 31, 2017 |
NOTES TO CONSOLIDATED FINANCIAL STATEMENTS (unaudited)
All amounts in $ millions, unless otherwise indicated
For the period ended December 31, 2017
Contingent consideration transferred in a business combination is measured at fair value on the date of acquisition and classified as a financial liability or equity. Contingent consideration classified as a liability isre-measured at fair value at each reporting date, with changes in fair value recognized in net earnings. Payments are classified as cash used in investing activities until the cumulative payments exceed the acquisition date fair value of the liability. Cumulative payments in excess of the acquisition date fair value are classified as cash used in operating activities. Contingent consideration classified as equity are notre-measured and settlements are accounted for within equity.
When a business combination is achieved in stages, the Companyre-measures itspre-existing interest at the acquisition date fair value and recognizes the resulting gain or loss, if any, in net earnings.
B) Recent Accounting Pronouncements
New Accounting Standards and Interpretations not yet Adopted
A number of new accounting standards, amendments to accounting standards and interpretations are effective for annual periods beginning on or after January 1, 2018 and have not been applied in preparing the Consolidated Financial Statements for the year ended December 31, 2017. The standards applicable to Cenovus are as follows and will be adopted on their respective effective dates:
Financial Instruments
On July 24, 2014, the IASB issued the final version of IFRS 9, “Financial Instruments” (“IFRS 9”) to replace IAS 39, “Financial Instruments: Recognition and Measurement” (“IAS 39”).
IFRS 9 introduces a single approach to determine whether a financial asset is measured at amortized cost or fair value and replaces the multiple rules in IAS 39. The approach is based on how an entity manages its financial instruments in the context of its business model and the contractual cash flow characteristics of the financial assets. The IAS 39 measurement categories for financial assets will be replaced by fair value through profit or loss, fair value through other comprehensive income (“FVOCI”) and amortized cost. The standard eliminates the existing IAS 39 categories of held to maturity, loans and receivables and available for sale. Based on Management’s assessment, the change in categories will not have a material impact on the Consolidated Financial Statements. As at December 31, 2017, the Company has private equity investments classified as available for sale with a fair value of $37 million. Under IFRS 9, the Company has elected to measure these investments as FVOCI. As such, all fair value gains or losses will be recorded in other comprehensive income (“OCI”), impairments will not be recognized in net earnings and fair value gains or losses will not be recycled to net earnings on disposition.
IFRS 9 retains most of the IAS 39 requirements for financial liabilities. However, where the fair value option is applied to financial liabilities, the change in fair value resulting from an entity’s own credit risk is recorded in OCI rather than net earnings, unless this creates an accounting mismatch. Cenovus currently does not designate any financial liabilities as fair value through profit or loss; therefore, there will be no impact on the accounting for financial liabilities.
A new expected credit loss model for calculating impairment on financial assets replaces the incurred loss impairment model used in IAS 39. The new model will result in more timely recognition of expected credit losses. Management does not expect a material change to its impairment provision as at January 1, 2018.
In addition, IFRS 9 includes a simplified hedge accounting model, aligning hedge accounting more closely with risk management. Cenovus does not currently apply hedge accounting.
IFRS 9 must be adopted for years beginning on or after January 1, 2018. The Company will apply the new standard retrospectively and elect to use the practical expedients permitted under the standard. Comparative periods will not be restated.
Revenue Recognition
On May 28, 2014, the IASB issued IFRS 15, “Revenue From Contracts With Customers” (“IFRS 15”) replacing IAS 11, “Construction Contracts”, IAS 18, “Revenue” and several revenue-related interpretations. IFRS 15 establishes a single revenue recognition framework that applies to contracts with customers. The standard requires an entity to recognize revenue to reflect the transfer of goods and services for the amount it expects to receive, when control is transferred to the purchaser. Disclosure requirements have also been expanded.
Management has assessed the impact of applying the new standard on the Consolidated Financial Statements and has not identified any material differences from its current revenue recognition practice.
The adoption of IFRS 15 is mandatory for years beginning on or after January 1, 2018. The standard may be applied either retrospectively or using a modified retrospective approach. Cenovus intends to adopt the standard using the modified retrospective approach recognizing the cumulative impact of adoption in retained earnings as of January 1, 2018. Comparative periods will not be restated. The Company will apply IFRS 15 using the practical expedient in paragraph C5(a) of IFRS 15, under which the Company will not restate contracts that are completed contracts as at the date of adoption.
| Cenovus Energy Inc. | 13 | For the period ended December 31, 2017 |
NOTES TO CONSOLIDATED FINANCIAL STATEMENTS (unaudited)
All amounts in $ millions, unless otherwise indicated
For the period ended December 31, 2017
Leases
On January 13, 2016, the IASB issued IFRS 16, “Leases” (“IFRS 16”), which requires entities to recognize lease assets and lease obligations on the balance sheet. For lessees, IFRS 16 removes the classification of leases as either operating leases or finance leases, effectively treating all leases as finance leases. Certain short-term leases (less than 12 months) and leases oflow-value assets are exempt from the requirements, and may continue to be treated as operating leases.
Lessors will continue with a dual lease classification model. Classification will determine how and when a lessor will recognize lease revenue, and what assets would be recorded.
IFRS 16 is effective for years beginning on or after January 1, 2019, with early adoption permitted if IFRS 15 has been adopted. The standard may be applied retrospectively or using a modified retrospective approach. The modified retrospective approach does not require restatement of prior period financial information as it recognizes the cumulative effect of applying the standard to prior periods as an adjustment to opening retained earnings. It is anticipated that the adoption of IFRS 16 will have a material impact on the Company’s Consolidated Balance Sheets due to material operating lease commitments. Cenovus will adopt IFRS 16 effective January 1, 2019. The Company intends to adopt the standard using the retrospective with cumulative effect approach and apply several of the practical expedients available.
Uncertain Tax Positions
In June 2017, the IASB issued International Financial Reporting Interpretation Committee 23,“Uncertainty Over Income Tax Treatments” (“IFRIC 23”). The interpretation provides clarity on how to account for a tax position when there is uncertainty over income tax treatments. In determining the likely resolution of the uncertain tax positions, a position may be considered separately or as a group. In addition, an assessment is required to determine the probability that the tax authority will accept the tax position taken in income tax filings. If the uncertain income tax treatment is unlikely to be accepted, the accounting tax position must reflect an appropriate level of uncertainty. An uncertain tax position may be reassessed if new information changes the original assessment. IFRIC 23 is effective for annual periods beginning on or after January 1, 2019 using either a modified or full retrospective approach. IFRIC 23 is not expected to have a significant impact on the Consolidated Financial Statements.
C) Key Sources of Estimation Uncertainty
Critical accounting estimates are those estimates that require Management to make particularly subjective or complex judgments about matters that are inherently uncertain. Estimates and underlying assumptions are reviewed on an ongoing basis and any revisions to accounting estimates are recorded in the period in which the estimates are revised. Further to those areas discussed in the annual Consolidated Financial Statements for the year ended December 31, 2016, the estimation of fair values of the assets acquired and liabilities assumed in a business combination, including contingent payment and goodwill, is a key area involving significant estimates or judgments.
4. ACQUISITION
FCCL and Deep Basin Acquisition
A) Summary of the Acquisition
On May 17, 2017, Cenovus acquired ConocoPhillips’ 50 percent interest in FCCL and the majority of ConocoPhillips’ Deep Basin Assets in Alberta and British Columbia (the “Acquisition”). The Acquisition provides Cenovus with control over the Company’s oil sands operations, doubles the Company’s oil sands production, and almost doubles the Company’s proved bitumen reserves. The Deep Basin Assets provide a second core operating area with more than three million net acres of land, exploration and production assets, and related infrastructure in Alberta and British Columbia.
The Acquisition has been accounted for using the acquisition method pursuant to IFRS 3. Under the acquisition method, assets and liabilities are recorded at their fair values on the date of acquisition and the total consideration is allocated to the tangible and intangible assets acquired and liabilities assumed. The excess of consideration given over the fair value of the net assets acquired has been recorded as goodwill.
B) Identifiable Assets Acquired and Liabilities Assumed
The final purchase price allocation is based on Management’s best estimate of fair value and has been retrospectively adjusted to reflect new information obtained between May 17, 2017 and December 31, 2017 about conditions that existed at the acquisition date. As a result of these adjustments, the final purchase price allocation includes an increase of $912 million to PP&E, $56 million to inventory and $16 million to accounts receivable and accrued revenues, as well as an $822 million decrease to E&E assets. Goodwill from the Acquisition was reduced to $2,030 million and the revaluation gain increased to $2,555 million. These adjustments also resulted in a $9 million increase to the deferred income tax liability. Depreciation, depletion and amortization (“DD&A”), operating
| Cenovus Energy Inc. | 14 | For the period ended December 31, 2017 |
NOTES TO CONSOLIDATED FINANCIAL STATEMENTS (unaudited)
All amounts in $ millions, unless otherwise indicated
For the period ended December 31, 2017
expenses and deferred income tax expense of prior quarters have been restated to reflect the impact of these measurement period adjustments.
The following table summarizes the recognized amounts of assets acquired and liabilities assumed at the date of the Acquisition.
| Notes | ||||||||||
100 Percent of the Identifiable Assets Acquired and Liabilities Assumed for FCCL | ||||||||||
Cash | 880 | |||||||||
Accounts Receivable and Accrued Revenues | 964 | |||||||||
Inventories | 345 | |||||||||
E&E Assets | 12 | 491 | ||||||||
PP&E | 13 | 22,717 | ||||||||
Other Assets | 27 | |||||||||
Accounts Payable and Accrued Liabilities | (445 | ) | ||||||||
Decommissioning Liabilities | 17 | (277 | ) | |||||||
Other Liabilities | (8 | ) | ||||||||
Deferred Income Taxes | (2,506 | ) | ||||||||
|
22,188 |
| ||||||||
Recognized Amounts of Identifiable Assets Acquired and Liabilities Assumed for Deep Basin | ||||||||||
Accounts Receivable and Accrued Revenues | 16 | |||||||||
Inventories | 14 | |||||||||
E&E Assets | 12 | 3,117 | ||||||||
PP&E | 13 | 3,600 | ||||||||
Accounts Payable and Accrued Liabilities | (6 | ) | ||||||||
Decommissioning Liabilities | 17 | (667 | ) | |||||||
|
6,074 |
| ||||||||
Total Identifiable Net Assets | 28,262 | |||||||||
The fair value of acquired accounts receivables and accrued revenues was $980 million. As at December 31, 2017, $964 million has been received and the remainder is expected to be collected.
C) Total Consideration
Total consideration for the Acquisition consisted of US$10.6 billion in cash and 208 million Cenovus common shares plus closing adjustments. At the same time, Cenovus agreed to make certain quarterly contingent payments to ConocoPhillips during the five years subsequent to May 17, 2017 if crude oil prices exceed a specific threshold. The following table summarizes the fair value of the consideration:
Common Shares | 2,579 | |||
Cash | 15,005 | |||
| 17,584 | ||||
Estimated Contingent Payment (Note 15) | 361 | |||
Total Consideration |
|
17,945 |
|
At the date of closing, the Company issued 208 million common shares to ConocoPhillips that were accounted for at $12.40 per share, the estimated fair value for accounting purposes.
Consideration paid in cash was US$10.6 billion, before closing adjustments, and was financed through a bought-deal common share offering (see Note 19) and an offering in the United States for senior unsecured notes (see Note 16). In addition, Cenovus borrowed $3.6 billion under a committed asset sale bridge credit facility (see Note 16). The remainder of the cash purchase price was funded with cash on hand and a draw on Cenovus’s existing committed credit facility.
The estimated contingent payment related to oil sands production reflects that Cenovus agreed to make quarterly payments to ConocoPhillips during the five years subsequent to the closing date for quarters in which the average Western Canadian Select (“WCS”) crude oil price exceeds $52.00 per barrel during the quarter. The quarterly payment will be $6 million for each dollar that the WCS price exceeds $52.00 per barrel. There are no maximum payment terms.
The calculation of any contingent payment includes an adjustment mechanism related to certain significant production outages at Foster Creek and Christina Lake, which may reduce the amount of a contingent payment. The terms of the contingent payment agreement allow Cenovus to retain 80 percent to 85 percent of the WCS prices above $52.00 per barrel, based on gross production capacity at Foster Creek and Christina Lake at the time
| Cenovus Energy Inc. | 15 | For the period ended December 31, 2017 |
NOTES TO CONSOLIDATED FINANCIAL STATEMENTS (unaudited)
All amounts in $ millions, unless otherwise indicated
For the period ended December 31, 2017
of the Acquisition. As production capacity increases with future expansions, the percentage of upside available to Cenovus will increase further.
The contingent payment is accounted for as a financial option. The fair value of $361 million on May 17, 2017 was estimated by calculating the present value of the future expected cash flows using an option pricing model, which assumes the probability distribution for WCS is based on the volatility of West Texas Intermediate (“WTI”) options, volatility ofCanadian-U.S. foreign exchange rate options and WCS futures pricing, and discounted at a credit-adjusted risk-free rate of 2.9 percent. The contingent payment will bere-measured at fair value at each reporting date with changes in fair value recognized in net earnings (see Note 15).
D) Goodwill
Goodwill arising from the Acquisition has been recognized as follows:
| Notes | ||||||||||||
Total Purchase Consideration | 4C | 17,945 | ||||||||||
Fair Value ofPre-Existing 50 Percent Ownership Interest in FCCL | 12,347 | |||||||||||
Fair Value of Identifiable Net Assets | 4B | (28,262) | ||||||||||
Goodwill | 2,030 | |||||||||||
Fair Value ofPre-Existing 50 Percent Ownership Interest in FCCL
Prior to the Acquisition, Cenovus’s 50 percent interest in FCCL was jointly controlled with ConocoPhillips and met the definition of a joint operation under IFRS 11,“Joint Arrangements” and as such Cenovus recognized its share of the assets, liabilities, revenues and expenses in its consolidated results. Subsequent to the Acquisition, Cenovus controls FCCL, as defined under IFRS 10,“Consolidated Financial Statements”and, accordingly, FCCL has been consolidated from the date of acquisition. As required by IFRS 3, when an acquirer achieves control in stages, the previously held interest isre-measured to fair value at the acquisition date with any gain or loss recognized in net earnings. The acquisition-date fair value of the previously held interest was $12.3 billion and has been included in the measurement of the total consideration transferred. The carrying value of the FCCL assets was $9.7 billion. As a result, Cenovus recognized anon-cash revaluation gain of $2.6 billion ($1.9 billion,after-tax) on there-measurement to fair value of its existing interest in FCCL.
Goodwill was recorded in connection with deferred tax liabilities arising from the difference between the purchase price allocated to the FCCL assets and liabilities based on fair value and the tax basis of these assets and liabilities. In addition, the consideration paid for FCCL included a control premium, which resulted in a higher value compared to the fair value of the net assets acquired.
E) Acquisition-Related Costs
The Company incurred $56 million of Acquisition-related costs, excluding common share and debt issuance costs. These costs have been included in transaction costs in the Consolidated Statements of Earnings.
Debt issuance costs related to the Acquisition financing were $72 million. These costs are netted against the carrying amount of the debt and amortized using the effective interest method.
F) Transitional Services
Under the purchase and sales agreement, Cenovus and ConocoPhillips agreed to certain transitional services where ConocoPhillips provided certainday-to-day services required by Cenovus for a period of approximately nine months. These transactions were in the normal course of operations and have been measured at the exchange amounts.
Costs related to the transitional services of approximately $40 million were recorded in general and administrative expenses.
G) Revenue and Profit Contribution
The acquired business contributed revenues of $3.3 billion and net earnings of $172 million for the period from May 17, 2017 to December 31, 2017.
| Cenovus Energy Inc. | 16 | For the period ended December 31, 2017 |
NOTES TO CONSOLIDATED FINANCIAL STATEMENTS (unaudited)
All amounts in $ millions, unless otherwise indicated
For the period ended December 31, 2017
If the closing of the Acquisition had occurred on January 1, 2017, Cenovus’s consolidated pro forma revenue and net earnings for the twelve months ended December 31, 2017 would have been $19.0 billion and $3.5 billion, respectively. These amounts have been calculated using results from the acquired business and adjusting them for:
| ● | Differences in accounting policies; |
| ● | Additional finance costs that would have been incurred if the amounts drawn on the Company’s committed asset sale bridge credit facility and the senior unsecured notes issued to fund the Acquisition had occurred on January 1, 2017; |
| ● | Additional DD&A that would have been charged assuming the fair value adjustments to PP&E and E&E assets had applied from January 1, 2017; |
| ● | Accretion on the decommissioning liability if it had been assumed on January 1, 2017; and |
| ● | The consequential tax effects. |
This pro forma information is not necessarily indicative of the results that would have been obtained if the Acquisition had actually occurred on January 1, 2017.
5. FINANCE COSTS
| Three Months Ended | Twelve Months Ended | |||||||||||||||||||||||||||
| For the periods ended December 31, | 2017 | 2016 | 2017 | 2016 | ||||||||||||||||||||||||
Interest Expense - Short-Term Borrowings and Long-Term Debt | 166 | 86 | 571 | 341 | ||||||||||||||||||||||||
Unwinding of Discount on Decommissioning Liabilities (Note 17) | 16 | 7 | 48 | 28 | ||||||||||||||||||||||||
Other | 5 | 5 | 26 | 21 | ||||||||||||||||||||||||
| 187 | 98 | 645 | 390 | |||||||||||||||||||||||||
6. FOREIGN EXCHANGE (GAIN) LOSS, NET
|
| |||||||||||||||||||||||||||
| Three Months Ended | Twelve Months Ended | |||||||||||||||||||||||||||
| For the periods ended December 31, | 2017 | 2016 | 2017 | 2016 | ||||||||||||||||||||||||
Unrealized Foreign Exchange (Gain) Loss on Translation of: | ||||||||||||||||||||||||||||
U.S. Dollar Debt Issued From Canada | 50 | 147 | (665 | ) | (196 | ) | ||||||||||||||||||||||
Other | 1 | 5 | (192 | ) | 7 | |||||||||||||||||||||||
Unrealized Foreign Exchange (Gain) Loss |
|
51 |
| 152 | (857 | ) | (189 | ) | ||||||||||||||||||||
Realized Foreign Exchange (Gain) Loss | (27 | ) | (12 | ) | 45 | (9 | ) | |||||||||||||||||||||
|
24 |
| 140 | (812 | ) | (198 | ) | |||||||||||||||||||||
7. OTHER (INCOME) LOSS, NET
As at December 31, 2016, due to the Government of Canada’s decision to reject the Northern Gateway Pipeline project, the Company wrote off $23 million of capitalized costs associated with its funding support unit in Northern Gateway Pipeline. In addition, $7 million of costs associated with termination were recorded and $7 million of certain investments in private equity companies were written off.
8. IMPAIRMENT CHARGES AND REVERSALS
A) Cash-Generating Unit Net Impairments
On a quarterly basis, the Company assesses its CGUs for indicators of impairment or when facts and circumstances suggest the carrying amount may exceed its recoverable amount. Goodwill is tested for impairment at least annually.
2017 Upstream Impairments
As indicators of impairment were noted for the Company’s upstream assets due to a decline in forward commodity prices since the Acquisition, the Company tested its upstream CGUs for impairment. As at December 31, 2017, the Company determined that the carrying amount of the Clearwater CGU exceeded its recoverable amount, resulting in an impairment loss of $56 million. The impairment was recorded as additional DD&A in the Deep Basin segment. Future cash flows for the CGU declined due to lower forward crude oil prices and revisions to the development plan. As at December 31, 2017, the recoverable amount of the Clearwater CGU was estimated to be approximately $295 million.
| Cenovus Energy Inc. | 17 | For the period ended December 31, 2017 |
NOTES TO CONSOLIDATED FINANCIAL STATEMENTS (unaudited)
All amounts in $ millions, unless otherwise indicated
For the period ended December 31, 2017
Key Assumptions
The recoverable amounts of Cenovus’s upstream CGUs were determined based on fair value less costs of disposal or an evaluation of comparable asset transactions. The fair values for producing properties were calculated based on discountedafter-tax cash flows of proved and probable reserves using forward prices and cost estimates, prepared by Cenovus’s independent qualified reserves evaluators (“IQREs”) (Level 3). Key assumptions in the determination of future cash flows from reserves include crude oil and natural gas prices, costs to develop and the discount rate. All reserves have been evaluated as at December 31, 2017 by the IQREs.
Crude Oil, NGLs and Natural Gas Prices
The forward prices as at December 31, 2017, used to determine future cash flows from crude oil, NGLs and natural gas reserves were:
| 2018 | 2019 | 2020 | 2021 | 2022 | Average Annual Increase Thereafter | |||||||||||||||||||
| ||||||||||||||||||||||||
WTI (US$/barrel) | 57.50 | 60.90 | 64.13 | 68.33 | 71.19 | 2.1% | ||||||||||||||||||
WCS (C$/barrel) | 50.61 | 56.59 | 60.86 | 64.56 | 66.63 | 2.1% | ||||||||||||||||||
Edmonton C5+ (C$/barrel) | 72.41 | 74.90 | 77.07 | 81.07 | 83.32 | 2.1% | ||||||||||||||||||
AECO (C$/Mcf)(1) (2) | 2.43 | 2.77 | 3.19 | 3.48 | 3.67 | 2.0% | ||||||||||||||||||
|
|
|
|
|
|
|
|
|
|
|
| |||||||||||||
| (1) | Alberta Energy Company (“AECO”) natural gas. |
| (2) | Assumes gas heating value of one million British Thermal Units per thousand cubic feet. |
Discount and Inflation Rates
Discounted future cash flows are determined by applying a discount rate between 10 percent and 15 percent based on the individual characteristics of the CGU, and other economic and operating factors. Inflation is estimated at two percent.
For the purpose of impairment testing, goodwill is allocated to the CGU to which it relates. There were no goodwill impairments for the twelve months ended December 31, 2017.
Sensitivities
The sensitivity analysis below shows the impact that a change in the discount rate or forward commodity prices would have on impairment testing for the following CGUs:
| Increase (Decrease) to Impairment | ||||||||||||||||||||||||
One Percent Increase in the Discount | One Percent the Discount | Five Percent Increase in the Forward | Five Percent the Forward | |||||||||||||||||||||
Clearwater | 27 | (30 | ) | (56 | ) | 65 | ||||||||||||||||||
Primrose | - | - | - | - | ||||||||||||||||||||
Christina Lake | - | - | - | - | ||||||||||||||||||||
Narrows Lake | 312 | - | - | 333 | ||||||||||||||||||||
| (1) | The $56 million represents the impairment loss as at December 31, 2017 that could be reversed in future periods. |
2016 Net Upstream Impairments
As at December 31, 2016, the recoverable value of the Northern Alberta CGU was estimated to be $1.1 billion. Earlier in 2016 and 2015, impairment losses of $380 million and $184 million, respectively, were recorded primarily due to a decline in long-term heavy crude oil prices and a slowing of the development plan. In the fourth quarter of 2016, the Company reversed $400 million of impairment losses, net of the DD&A that would have been recorded had no impairments been recorded. The reversal arose due to the increase in the CGU’s estimated recoverable amount caused by an average reduction in expected future operating costs of five percent and lower future development costs, partially offset by a decline in estimated reserves. The impairment losses and subsequent reversal were recorded as DD&A in the Conventional segment, which has been classified as a discontinued operation (see Note 9). The Northern Alberta CGU included the Pelican Lake and Elk Point producing assets and other emerging assets in the exploration and evaluation stage.
As at December 31, 2016, the recoverable amount of the Suffield CGU PP&E was estimated to be $548 million. Earlier in 2016, an impairment loss of $65 million was recognized due to lower long-term forward natural gas and heavy crude oil prices. In the fourth quarter of 2016, the Company reversed the full amount of the impairment losses, net of the DD&A that would have been recorded had no impairment been recorded ($62 million). The reversal arose due to a decline in expected future royalties increasing the estimated recoverable amount of the CGU. The impairment loss and the subsequent reversal were recorded as DD&A in the Conventional segment,
| Cenovus Energy Inc. | 18 | For the period ended December 31, 2017 |
NOTES TO CONSOLIDATED FINANCIAL STATEMENTS (unaudited)
All amounts in $ millions, unless otherwise indicated
For the period ended December 31, 2017
which has been classified as a discontinued operation (see Note 9). The Suffield CGU included production of natural gas and heavy crude oil in Alberta on the Canadian Forces Base.
Key Assumptions
The fair values for producing properties were calculated based on discountedafter-tax cash flows of proved and probable reserves using forward prices and cost estimates, prepared by Cenovus’s IQREs (Level 3). Future cash flows were estimated using a two percent inflation rate and discounted using a rate of 10 percent. Forward prices as at December 31, 2016 used to determine future cash flows from crude oil and natural gas reserves were:
| 2017 | 2018 | 2019 | 2020 | 2021 | Average Annual Increase Thereafter | |||||||||||||||||||
| ||||||||||||||||||||||||
WTI (US$/barrel) | 55.00 | 58.70 | 62.40 | 69.00 | 75.80 | 2.0% | ||||||||||||||||||
WCS (C$/barrel) | 53.70 | 58.20 | 61.90 | 66.50 | 71.00 | 2.0% | ||||||||||||||||||
AECO (C$/Mcf)(1) | 3.40 | 3.15 | 3.30 | 3.60 | 3.90 | 2.2% | ||||||||||||||||||
|
|
|
|
|
|
|
|
|
|
|
| |||||||||||||
| (1) | Assumes gas heating value of one million British Thermal Units per thousand cubic feet. |
There were no goodwill impairments for the twelve months ended December 31, 2016.
B) Asset Impairments and Writedowns
Exploration and Evaluation Assets
For the year ended December 31, 2017, Management wrotedown certain E&E assets, as their carrying values were not considered to be recoverable. As a result, $888 million of previously capitalized costs were recorded as exploration expense. These assets reside primarily in the Borealis CGU within the Oil Sands segment.
Management’s decision was based on a comprehensive review of spending to date, decisions to limit spending on these assets in recent years and the current business plan spending on the assets going forward. At this point, Management is not committing further material funding beyond that required to retain ownership of this significant resource. In addition, regulatory changes to the Oil Sands Royalty application process impact the economic viability of these projects.
In 2016, $2 million of previously capitalized E&E costs were written off and recorded as exploration expense in the Oil Sands segment.
Property, Plant and Equipment, Net
In 2017, the Company recorded an impairment loss of $21 million related to equipment that was written down to its recoverable amount. The impairment loss relates to the Oil Sands segment.
In the fourth quarter of 2016, the Company recorded an impairment loss of $20 million primarily related to equipment that was written down to its recoverable amount. This impairment was recorded as additional DD&A in the Conventional segment, which has been classified as a discontinued operation.
Earlier in 2016, the Company also recorded an impairment loss of $16 million related to preliminary engineering costs associated with a project that was cancelled and equipment that was written down to its recoverable amount. This impairment loss was recorded as additional DD&A in the Oil Sands segment. Leasehold improvements of $4 million were also written off and recorded as additional DD&A in the Corporate and Eliminations segment.
9. ASSETS HELD FOR SALE AND DISCONTINUED OPERATIONS
In the second quarter of 2017, the Company announced its intention to divest of its Conventional segment which included its heavy oil assets at Pelican Lake, the carbon dioxide enhanced oil recovery project at Weyburn and conventional crude oil, natural gas and NGLs assets in the Suffield and Palliser areas in southern Alberta. The associated assets and liabilities were consequently presented as held for sale and the results of operations reported as a discontinued operation.
A) Results of Discontinued Operations
In 2017, the Company sold the majority of its Conventional segment assets for total gross cash proceeds of $3.2 billion before closing adjustments. Details of the asset sales are as follows:
Pelican Lake
On September 29, 2017, the Company completed the sale of its Pelican Lake heavy oil operations, as well as other miscellaneous assets in northern Alberta, for cash proceeds of $975 million before closing adjustments. A before tax loss on discontinuance of $623 million was recorded on the sale.
| Cenovus Energy Inc. | 19 | For the period ended December 31, 2017 |
NOTES TO CONSOLIDATED FINANCIAL STATEMENTS (unaudited)
All amounts in $ millions, unless otherwise indicated
For the period ended December 31, 2017
Palliser
On December 7, 2017, Cenovus completed the sale of its Palliser crude oil and natural gas operations in southern Alberta for cash proceeds of $1.3 billion before closing adjustments. A before tax gain on discontinuance of $1.6 billion was recorded on the sale.
Weyburn
On December 14, 2017, the Company completed the sale of its Weyburn assets in southern Saskatchewan for cash proceeds of $940 million before closing adjustments. A before tax gain on discontinuance of $276 million was recorded on the sale.
Suffield
On September 25, 2017, Cenovus entered into an agreement to sell its Suffield crude oil and natural gas operations in southern Alberta for cash proceeds of $512 million, before closing adjustments. The sale closed on January 5, 2018. The Company anticipates abefore-tax gain of approximately $350 million to be recorded in 2018. The agreement includes a deferred purchase price adjustment (“DPPA”) that could provide Cenovus with purchase price adjustments of up to $36 million if the average crude oil and natural gas prices meet certain thresholds over the next two years.
The DPPA is a two year agreement that commences on close. Under the purchase and sale agreement, Cenovus is entitled to receive cash for each month in which the average daily price of WTI is above US$55 per barrel or the price of Henry Hub natural gas is above US$3.50 per million British thermal units. Monthly cash payments are capped at $375 thousand and $1.125 million for crude oil and natural gas, respectively. The DPPA will be accounted for as a financial option and fair valued at each reporting date. The fair value of the DPPA on the date of close was $7 million.
The following table presents the results of discontinued operations, including asset sales:
| Three Months Ended | Twelve Months Ended | |||||||||||||||||||||||
| For the periods ended December 31, | 2017 | 2016 | 2017 | 2016 | ||||||||||||||||||||
Revenues | ||||||||||||||||||||||||
Gross Sales | 218 | 369 | 1,309 | 1,267 | ||||||||||||||||||||
Less: Royalties | 29 | 51 | 174 | 139 | ||||||||||||||||||||
|
189 |
| 318 | 1,135 | 1,128 | |||||||||||||||||||
Expenses | ||||||||||||||||||||||||
Transportation and Blending | 18 | 50 | 167 | 186 | ||||||||||||||||||||
Operating | 83 | 113 | 426 | 444 | ||||||||||||||||||||
Production and Mineral Taxes | 4 | 3 | 18 | 12 | ||||||||||||||||||||
(Gain) Loss on Risk Management | 14 | (1 | ) | 33 | (58 | ) | ||||||||||||||||||
Operating Margin | 70 | 153 | 491 | 544 | ||||||||||||||||||||
Depreciation, Depletion and Amortization | 2 | (310 | ) | 192 | 567 | |||||||||||||||||||
Exploration Expense | - | - | 2 | - | ||||||||||||||||||||
Finance Costs | 44 | 26 | 80 | 102 | ||||||||||||||||||||
Earnings (Loss) From Discontinued Operations Before Income Tax | 24 | 437 | 217 | (125 | ) | |||||||||||||||||||
Current Tax Expense (Recovery) | - | - | 24 | 86 | ||||||||||||||||||||
Deferred Tax Expense (Recovery) | 6 | 137 | 33 | (125 | ) | |||||||||||||||||||
After-tax Earnings (Loss) From Discontinued Operations | 18 | 300 | 160 | (86 | ) | |||||||||||||||||||
After-tax Gain (Loss) on Discontinuance(1) | 1,378 | - | 938 | - | ||||||||||||||||||||
Net Earnings (Loss) From Discontinued Operations | 1,396 | 300 | 1,098 | (86 | ) | |||||||||||||||||||
| (1) | Net of deferred tax expense of $510 million and $347 million, respectively, in the three and twelve months ended December 31, 2017. |
B) Cash Flows From Discontinued Operations
Cash flows from discontinued operations reported in the Consolidated Statement of Cash Flows are:
| Three Months Ended | Twelve Months Ended | |||||||||||||||||||||||
| For the periods ended December 31, | 2017 | 2016 | 2017 | 2016 | ||||||||||||||||||||
Cash From Operating Activities | 67 | 142 | 448 | 435 | ||||||||||||||||||||
Cash From (Used in) Investing Activities | 2,234 | (57 | ) | 2,993 | (168 | ) | ||||||||||||||||||
Net Cash Flow |
|
2,301 |
| 85 | 3,441 | 267 | ||||||||||||||||||
| Cenovus Energy Inc. | 20 | For the period ended December 31, 2017 |
NOTES TO CONSOLIDATED FINANCIAL STATEMENTS (unaudited)
All amounts in $ millions, unless otherwise indicated
For the period ended December 31, 2017
C) Assets and Liabilities Held for Sale
In the fourth quarter of 2017, the Company announced its intention to market for sale a package ofnon-core Deep Basin assets in the East Clearwater area and a portion of the West Clearwater assets. The assets have been classified as held for sale and recorded at the lesser of their carrying amount and their fair value less cost to sell. Assets and liabilities held for sale also include the Suffield operations, which were sold on January 5, 2018. No impairments were recorded on the assets held for sale as at December 31, 2017.
| E&E Assets | PP&E | Decommissioning Liabilities | ||||||||||||||||
| As at December 31, 2017 | (Note 12) | (Note 13) | (Note 17) | |||||||||||||||
Conventional | - | 568 | 454 | |||||||||||||||
Deep Basin | 46 | 434 | 149 | |||||||||||||||
|
46 |
| 1,002 | 603 | ||||||||||||||
10. INCOME TAXES
The provision for income taxes is:
| Three Months Ended | Twelve Months Ended | |||||||||||||||||||||
| For the periods ended December 31, | 2017 | 2016 | 2017 | 2016 | ||||||||||||||||||
Current Tax | ||||||||||||||||||||||
Canada | 15 | (73 | ) | (217 | ) | (260 | ) | |||||||||||||||
United States | 2 | - | (38 | ) | 1 | |||||||||||||||||
Current Tax Expense (Recovery) | 17 | (73 | ) | (255 | ) | (259 | ) | |||||||||||||||
Deferred Tax Expense (Recovery) | (669 | ) | 7 | 203 | (84 | ) | ||||||||||||||||
Tax Expense (Recovery) From Continuing Operations | (652 | ) | (66 | ) | (52 | ) | (343 | ) | ||||||||||||||
In 2017 and 2016, the Company recorded a current tax recovery due to the carryback of losses for income tax purposes and prior year adjustments. A deferred tax expense was recorded in 2017 due to the revaluation gain of ourpre-existing interest in connection with the Acquisition, partially offset by a $275 million recovery from the reduction of the U.S. federal corporate income tax rate from 35 percent to 21 percent reducing the Company’s deferred income tax liability and the impact of E&E asset writedowns.
The following table reconciles income taxes calculated at the Canadian statutory rate with recorded income taxes:
| Twelve Months Ended | ||||||||||||
| For the periods ended December 31, | 2017 | 2016 | ||||||||||
Earnings (Loss) From Continuing Operations Before Income Tax | 2,216 | (802 | ) | |||||||||
Canadian Statutory Rate | 27.0% | 27.0 | % | |||||||||
Expected Income Tax (Recovery) | 598 | (217 | ) | |||||||||
Effect of Taxes Resulting From: | ||||||||||||
Foreign Tax Rate Differential | (17 | ) | (46 | ) | ||||||||
Non-Taxable Capital (Gains) Losses | (148 | ) | (26 | ) | ||||||||
Non-Recognition of Capital (Gains) Losses | (118 | ) | (26 | ) | ||||||||
Adjustments Arising From Prior Year Tax Filings | (41 | ) | (46 | ) | ||||||||
(Recognition) of Previously Unrecognized Capital Losses | (68 | ) | - | |||||||||
Change in U.S. Statutory Rate | (275 | ) | - | |||||||||
Non-Deductible Expenses | (5 | ) | 5 | |||||||||
Other | 22 | 13 | ||||||||||
Tax Expense (Recovery) From Continuing Operations |
|
(52 |
) | (343 | ) | |||||||
Effective Tax Rate |
|
(2.3 |
)% | 42.8 | % | |||||||
| Cenovus Energy Inc. | 21 | For the period ended December 31, 2017 |
NOTES TO CONSOLIDATED FINANCIAL STATEMENTS (unaudited)
All amounts in $ millions, unless otherwise indicated
For the period ended December 31, 2017
11. PER SHARE AMOUNTS
A) Net Earnings (Loss) Per Share – Basic and Diluted
| Three Months Ended | Twelve Months Ended | |||||||||||||||||||||
For the periods ended December 31, | 2017 | 2016 | 2017 | 2016 | ||||||||||||||||||
Earnings (Loss) From: | ||||||||||||||||||||||
Continuing Operations | (776 | ) | (209 | ) | 2,268 | (459 | ) | |||||||||||||||
Discontinued Operations | 1,396 | 300 | 1,098 | (86 | ) | |||||||||||||||||
Net Earnings (Loss) | 620 | 91 | 3,366 | (545 | ) | |||||||||||||||||
Weighted Average Number of Shares(millions) | 1,228.8 | 833.3 | 1,102.5 | 833.3 | ||||||||||||||||||
Basic and Diluted Earnings (Loss) Per Share From:($) | ||||||||||||||||||||||
Continuing Operations | (0.63 | ) | (0.25 | ) | 2.06 | (0.55 | ) | |||||||||||||||
Discontinued Operations | 1.13 | 0.36 | 0.99 | (0.10 | ) | |||||||||||||||||
Net Earnings (Loss) Per Share
| 0.50 | 0.11 | 3.05 | (0.65 | ) | |||||||||||||||||
B) Dividends Per Share
For the twelve months ended December 31, 2017, the Company paid dividends of $225 million or $0.20 per share (twelve months ended December 31, 2016 – $166 million or $0.20 per share).
12. EXPLORATION AND EVALUATION ASSETS
| Total | ||||
As at December 31, 2016 | 1,585 | |||
Additions | 147 | |||
Acquisition (Note 4) (1) | 3,608 | |||
Transfers to Assets Held for Sale (Note 9) | (316 | ) | ||
Transfers to PP&E (Note 13) | (6 | ) | ||
Exploration Expense (Notes 8 and 9) | (890 | ) | ||
Change in Decommissioning Liabilities | 5 | |||
Exchange Rate Movements and Other | 19 | |||
Divestitures(1) | (479 | ) | ||
As at December 31, 2017 | 3,673 | |||
| (1) | In connection with the Acquisition, Cenovus was deemed to have disposed of itspre-existing interest in FCCL andre-acquired it at fair value as required by IFRS 3. |
| Cenovus Energy Inc. | 22 | For the period ended December 31, 2017 |
NOTES TO CONSOLIDATED FINANCIAL STATEMENTS (unaudited)
All amounts in $ millions, unless otherwise indicated
For the period ended December 31, 2017
13. PROPERTY, PLANT AND EQUIPMENT, NET
| Upstream Assets | ||||||||||||||||||||||||||||
Development & Production | Other Upstream | Refining Equipment | Other (1) | Total | ||||||||||||||||||||||||
COST | ||||||||||||||||||||||||||||
As at December 31, 2016 | 31,941 | 333 | 5,259 | 1,074 | 38,607 | |||||||||||||||||||||||
Additions | 1,324 | - | 168 | 89 | 1,581 | |||||||||||||||||||||||
Acquisition (Note 4)(2) | 26,317 | - | - | - | 26,317 | |||||||||||||||||||||||
Transfers From E&E Assets (Note 12) | 6 | - | - | - | 6 | |||||||||||||||||||||||
Transfers to Assets Held for Sale (Note 9) | (19,719 | ) | - | - | - | (19,719 | ) | |||||||||||||||||||||
Change in Decommissioning Liabilities | (67 | ) | - | - | 3 | (64 | ) | |||||||||||||||||||||
Exchange Rate Movements and Other | (28 | ) | - | (364 | ) | 1 | (391 | ) | ||||||||||||||||||||
Divestitures(2) | (12,333 | ) | - | (2 | ) | - | (12,335 | ) | ||||||||||||||||||||
As at December 31, 2017 | 27,441 | 333 | 5,061 | 1,167 | 34,002 | |||||||||||||||||||||||
ACCUMULATED DEPRECIATION, DEPLETION AND AMORTIZATION |
| |||||||||||||||||||||||||||
As at December 31, 2016 | 20,088 | 308 | 1,076 | 709 | 22,181 | |||||||||||||||||||||||
DD&A | 1,653 | 23 | 209 | 68 | 1,953 | |||||||||||||||||||||||
Impairment Losses (Note 8) | 77 | - | - | - | 77 | |||||||||||||||||||||||
Transfers to Assets Held for Sale (Note 9) | (16,120 | ) | - | - | - | (16,120 | ) | |||||||||||||||||||||
Exchange Rate Movements and Other | 17 | - | (91 | ) | 1 | (73 | ) | |||||||||||||||||||||
Divestitures(2) | (3,611 | ) | - | (1 | ) | - | (3,612 | ) | ||||||||||||||||||||
As at December 31, 2017 | 2,104 | 331 | 1,193 | 778 | 4,406 | |||||||||||||||||||||||
CARRYING VALUE | ||||||||||||||||||||||||||||
As at December 31, 2016 | 11,853 | 25 | 4,183 | 365 | 16,426 | |||||||||||||||||||||||
As at December 31, 2017 | 25,337 | 2 | 3,868 | 389 | 29,596 | |||||||||||||||||||||||
| (1) | Includescrude-by-rail terminal, office furniture, fixtures, leasehold improvements, information technology and aircraft. |
| (2) | In connection with the Acquisition, Cenovus was deemed to have disposed of itspre-existing interest in FCCL andre-acquired it at fair value as required by IFRS 3. The carrying value of thepre-existing interest in FCCL was $8,602 million. |
14. GOODWILL
| As at December 31, | 2017 | 2016 | ||||||||
Carrying Value, Beginning of Year | 242 | 242 | ||||||||
Goodwill Recognized on Acquisition (Note 4) | 2,030 | - | ||||||||
Carrying Value, End of Year | 2,272 | 242 | ||||||||
The carrying amount of goodwill allocated to the Company’s exploration and production CGUs is:
| As at December 31, | 2017 | 2016 | ||||||||
Primrose (Foster Creek)(1) | 1,101 | 242 | ||||||||
Christina Lake(1) | 1,171 | - | ||||||||
| 2,272 | 242 | |||||||||
| (1) | Goodwill recognized on the Acquisition reflects measurement period adjustments. |
15. CONTINGENT PAYMENT
| Total | ||||
As at January 1, 2017 | - | |||
Initial Recognition on May 17, 2017 (Note 4) | 361 | |||
Re-measurement(1) | (138 | ) | ||
Liabilities Settled or Payable | (17 | ) | ||
As at December 31, 2017 | 206 | |||
Less: Current Portion | 38 | |||
Long-Term Portion | 168 | |||
| (1) | Contingent payment is carried at fair value. Changes in fair value are recorded in net earnings. |
| Cenovus Energy Inc. | 23 | For the period ended December 31, 2017 |
NOTES TO CONSOLIDATED FINANCIAL STATEMENTS (unaudited)
All amounts in $ millions, unless otherwise indicated
For the period ended December 31, 2017
In connection with the Acquisition (see Note 4), Cenovus agreed to make quarterly payments to ConocoPhillips during the five years subsequent to May 17, 2017 for quarters in which the average WCS crude oil price exceeds $52.00 per barrel during the quarter. The quarterly payment will be $6 million for each dollar that the WCS price exceeds $52.00 per barrel. The calculation includes an adjustment mechanism related to certain significant production outages at Foster Creek and Christina Lake which may reduce the amount of a contingent payment. For the three months ended December 31, 2017, $17 million is payable under this agreement.
16. LONG-TERM DEBT
| As at December 31, | Notes | US$ Principal Amount | 2017 | 2016 | ||||||||||||||||
Revolving Term Debt(1) | A | - | - | - | ||||||||||||||||
Asset Sale Bridge Credit Facility | B | - | - | - | ||||||||||||||||
U.S. Dollar Denominated Unsecured Notes | C | 7,650 | 9,597 | 6,378 | ||||||||||||||||
Total Debt Principal | 9,597 | 6,378 | ||||||||||||||||||
Debt Discounts and Transaction Costs | (84 | ) | (46 | ) | ||||||||||||||||
Long-Term Debt | 9,513 | 6,332 | ||||||||||||||||||
| (1) | Revolving term debt may include Bankers’ Acceptances, London Interbank Offered Rate based loans, prime rate loans and U.S. base rate loans. |
A) Revolving Term Debt
On April 28, 2017, Cenovus amended its existing committed credit facility to increase the capacity of the facility by $0.5 billion to $4.5 billion and to extend the maturity dates. The committed credit facility consists of a $1.2 billion tranche maturing on November 30, 2020 and a $3.3 billion tranche maturing on November 30, 2021. Borrowings are available by way of Bankers’ Acceptances, LIBOR based loans, prime rate loans or U.S. base rate loans. As at December 31, 2017, there were no amounts drawn on Cenovus’s committed credit facility (2016 – $nil).
B) Asset Sale Bridge Credit Facility
In connection with the Acquisition, Cenovus borrowed $3.6 billion under a committed asset sale bridge credit facility. Net proceeds from the sale of the Company’s Conventional segment assets (see Note 9) and cash on hand were used to repay and retire the committed asset bridge credit facility prior to December 31, 2017.
C) Unsecured Notes
On April 7, 2017, Cenovus completed an offering in the United States for US$2.9 billion in senior unsecured notes in three series (collectively, the “2017 Notes”), as follows:
| As at December 31, | US$ Principal Amount | 2017 | ||||||||
4.25% due 2027 | 1,200 | 1,505 | ||||||||
5.25% due 2037 | 700 | 878 | ||||||||
5.40% due 2047 | 1,000 | 1,255 | ||||||||
| 2,900 | 3,638 | |||||||||
In the fourth quarter of 2017, the Company completed an exchange offer (“Exchange Offering”) whereby substantially all of the 2017 Notes were exchanged for notes registered under the Securities Act of 1933 with essentially the same terms and provisions as the 2017 Notes. The Exchange Offering has been treated as a modification for accounting purposes and not an extinguishment.
On October 10, 2017, Cenovus filed a base shelf prospectus that allows the Company to offer, from time to time, up to US$7.5 billion, or the equivalent in other currencies, of debt securities, common shares, preferred shares, subscription receipts, warrants, share purchase contracts and units in Canada, the U.S. and elsewhere where permitted by law. The base shelf prospectus is available to ConocoPhillips to offer, should they so choose from time to time, the common shares they acquired in connection with the Acquisition. The base shelf prospectus will expire in November 2019. Following the completion of the Exchange Offering and as at December 31, 2017, US$4.6 billion was available under the base shelf prospectus. Offerings under the base shelf prospectus are subject to market conditions.
As at December 31, 2017, the Company is in compliance with all of the terms of its debt agreements.
| Cenovus Energy Inc. | 24 | For the period ended December 31, 2017 |
NOTES TO CONSOLIDATED FINANCIAL STATEMENTS (unaudited)
All amounts in $ millions, unless otherwise indicated
For the period ended December 31, 2017
17. DECOMMISSIONING LIABILITIES
The decommissioning provision represents the present value of the expected future costs associated with the retirement of upstream crude oil and natural gas assets, refining facilities and thecrude-by-rail terminal. The aggregate carrying amount of the obligation is:
| Total | ||||
As at December 31, 2016 | 1,847 | |||
Liabilities Incurred | 20 | |||
Liabilities Acquired (Note 4)(1) | 944 | |||
Liabilities Settled | (70 | ) | ||
Liabilities Divested(1) | (139 | ) | ||
Transfers to Liabilities Related to Assets Held for Sale (Note 9) | (1,621 | ) | ||
Change in Estimated Future Cash Flows | (155 | ) | ||
Change in Discount Rate | 76 | |||
Unwinding of Discount on Decommissioning Liabilities | 128 | |||
Foreign Currency Translation | (1 | ) | ||
As at December 31, 2017 | 1,029 | |||
| (1) | In connection with the Acquisition, Cenovus was deemed to have disposed of itspre-existing interest in FCCL and reacquired it at fair value as required by IFRS. |
The undiscounted amount of estimated future cash flows required to settle the obligation has been discounted using a credit-adjusted risk-free rate of 5.3 percent as at December 31, 2017 (December 31, 2016 – 5.9 percent).
18. OTHER LIABILITIES
| As at December 31, | 2017 | 2016 | ||||||||||
Employee Long-Term Incentives | 43 | 72 | ||||||||||
Pension and Other Post-Employment Benefit Plan | 62 | 71 | ||||||||||
Onerous Contract Provisions | 37 | 35 | ||||||||||
Other | 31 | 33 | ||||||||||
| 173 | 211 | |||||||||||
19. SHARE CAPITAL
A) Authorized
Cenovus is authorized to issue an unlimited number of common shares, and first and second preferred shares not exceeding, in aggregate, 20 percent of the number of issued and outstanding common shares. The first and second preferred shares may be issued in one or more series with rights and conditions to be determined by the Company’s Board of Directors prior to issuance and subject to the Company’s articles.
B) Issued and Outstanding
| 2017 | 2016 | |||||||||||||||||||||||||||
| As at December 31, | Number of Common Shares (thousands) | Amount | Number of Common Shares (thousands) | Amount | ||||||||||||||||||||||||
Outstanding, Beginning of Year | 833,290 | 5,534 | 833,290 | 5,534 | ||||||||||||||||||||||||
Common Shares Issued, Net of Issuance Costs and Tax | 187,500 | 2,927 | - | - | ||||||||||||||||||||||||
Common Shares Issued to ConocoPhillips (Note 4) | 208,000 | 2,579 | - | - | ||||||||||||||||||||||||
Outstanding, End of Year | 1,228,790 | 11,040 | 833,290 | 5,534 | ||||||||||||||||||||||||
In connection with the Acquisition (see Note 4), Cenovus closed a bought-deal common share financing on April 6, 2017 for 187.5 million common shares, raising gross proceeds of $3.0 billion ($2.9 billion net of $101 million of share issuance costs).
In addition, the Company issued 208 million common shares to ConocoPhillips on May 17, 2017 as partial consideration for the Acquisition. In relation to the share consideration, Cenovus and ConocoPhillips entered into an investor agreement, and a registration rights agreement which, among other things, restricted ConocoPhillips from
| Cenovus Energy Inc. | 25 | For the period ended December 31, 2017 |
NOTES TO CONSOLIDATED FINANCIAL STATEMENTS (unaudited)
All amounts in $ millions, unless otherwise indicated
For the period ended December 31, 2017
selling or hedging its Cenovus common shares until after November 17, 2017. ConocoPhillips is also restricted from nominating new members to Cenovus’s Board of Directors and must vote its Cenovus common shares in accordance with Management’s recommendations or abstain from voting until such time ConocoPhillips owns 3.5 percent or less of the then outstanding common shares of Cenovus. As at December 31, 2017, ConocoPhillips continued to hold these common shares.
There were no preferred shares outstanding as at December 31, 2017 (December 31, 2016 – $nil).
As at December 31, 2017, there were 15 million (December 31, 2016 – 12 million) common shares available for future issuance under the stock option plan.
20. ACCUMULATED OTHER COMPREHENSIVE INCOME (LOSS)
Defined Benefit Pension | Foreign Currency Translation Adjustment | Available for Sale Financial Assets | Total | |||||||||||||||||||
As at December 31, 2015 | (10 | ) | 1,014 | 16 | 1,020 | |||||||||||||||||
Other Comprehensive Income (Loss), Before Tax | (4 | ) | (106 | ) | (4 | ) | (114 | ) | ||||||||||||||
Income Tax | 1 | - | 3 | 4 | ||||||||||||||||||
As at December 31, 2016 | (13 | ) | 908 | 15 | 910 | |||||||||||||||||
Other Comprehensive Income (Loss), Before Tax | 12 | (275 | ) | (1 | ) | (264 | ) | |||||||||||||||
Income Tax | (3 | ) | - | - | (3 | ) | ||||||||||||||||
As at December 31, 2017 | (4 | ) | 633 | 14 | 643 | |||||||||||||||||
21. STOCK-BASED COMPENSATION PLANS
Cenovus has a number of stock-based compensation plans which include stock options with associated net settlement rights (“NSRs”), stock options with associated tandem stock appreciation rights (“TSARs”), performance share units (“PSUs”), restricted share units (“RSUs”) and deferred share units (“DSUs”). The following tables summarize information related to Cenovus’s stock-based compensation plans:
| As at December 31, 2017 | Units Outstanding (thousands) | Units Exercisable (thousands) | ||||||||
NSRs | 42,727 | 35,612 | ||||||||
TSARs | 81 | 81 | ||||||||
PSUs | 7,018 | - | ||||||||
RSUs | 6,785 | - | ||||||||
DSUs | 1,440 | 1,440 | ||||||||
| For the twelve months ended December 31, 2017 | Units Granted (thousands) | Units Vested and (thousands) | ||||||||
NSRs | 3,537 | - | ||||||||
PSUs | 2,392 | 451 | ||||||||
RSUs | 3,278 | 101 | ||||||||
DSUs | 229 | 414 | ||||||||
Certain directors, officers or employees chose prior to December 31, 2016 to convert a portion of their remuneration, paid in the first quarter of 2017, into DSUs. The election for any particular year is irrevocable. DSUs may not be redeemed until departure from the Company. Directors also received an annual grant of DSUs.
The weighted average exercise price of NSRs and TSARs as at December 31, 2017 was $29.40 and $33.52, respectively.
| Cenovus Energy Inc. | 26 | For the period ended December 31, 2017 |
NOTES TO CONSOLIDATED FINANCIAL STATEMENTS (unaudited)
All amounts in $ millions, unless otherwise indicated
For the period ended December 31, 2017
The following table summarizes the stock-based compensation expense (recovery) recorded for all plans:
| Three Months Ended | Twelve Months Ended | |||||||||||||||||||||
For the periods ended December 31, | 2017 | 2016 | 2017 | 2016 | ||||||||||||||||||
NSRs | 2 | 3 | 9 | 15 | ||||||||||||||||||
TSARs | - | (1 | ) | - | (1 | ) | ||||||||||||||||
PSUs | (7 | ) | 6 | (7 | ) | 13 | ||||||||||||||||
RSUs | - | 5 | 3 | 13 | ||||||||||||||||||
DSUs | - | 3 | (11 | ) | 7 | |||||||||||||||||
Stock-Based Compensation Expense (Recovery) | (5 | ) | 16 | (6 | ) | 47 | ||||||||||||||||
Stock-Based Compensation Costs Capitalized | (2 | ) | 4 | 3 | 12 | |||||||||||||||||
Total Stock-Based Compensation | (7 | ) | 20 | (3 | ) | 59 | ||||||||||||||||
22. CAPITAL STRUCTURE
Cenovus’s capital structure objectives remain unchanged from previous periods. Cenovus’s capital structure consists of shareholders’ equity plus Net Debt. Net Debt includes the Company’s short-term borrowings, and the current and long-term portions of long-term debt, net of cash and cash equivalents. Cenovus conducts its business and makes decisions consistent with that of an investment grade company. The Company’s objectives when managing its capital structure are to maintain financial flexibility, preserve access to capital markets, ensure its ability to finance internally generated growth and to fund potential acquisitions while maintaining the ability to meet the Company’s financial obligations as they come due.
Cenovus monitors its capital structure and financing requirements using, among other things,non-GAAP financial metrics consisting of Net Debt to Adjusted Earnings Before Interest, Taxes and DD&A (“Adjusted EBITDA”) and Net Debt to Capitalization. These metrics are used to steward Cenovus’s overall debt position as measures of Cenovus’s overall financial strength.
Over the long term, Cenovus targets a Net Debt to Adjusted EBITDA ratio of less than 2.0 times. At different points within the economic cycle, Cenovus expects this ratio may periodically be above the target. Cenovus also manages its Net Debt to Capitalization ratio to ensure compliance with the associated covenant as defined in its committed credit facility agreement.
A) Net Debt to Adjusted EBITDA
| As at December 31, | 2017 | 2016 | ||||||||
Long-Term Debt | 9,513 | 6,332 | ||||||||
Less: Cash and Cash Equivalents | (610 | ) | (3,720 | ) | ||||||
Net Debt | 8,903 | 2,612 | ||||||||
Net Earnings (Loss) | 3,366 | (545 | ) | |||||||
Add (Deduct): | ||||||||||
Finance Costs | 725 | 492 | ||||||||
Interest Income | (62 | ) | (52 | ) | ||||||
Income Tax Expense (Recovery) | 352 | (382 | ) | |||||||
DD&A | 2,030 | 1,498 | ||||||||
E&E Impairment | 890 | 2 | ||||||||
Unrealized (Gain) Loss on Risk Management | 729 | 554 | ||||||||
Foreign Exchange (Gain) Loss, Net | (812 | ) | (198 | ) | ||||||
Revaluation (Gain) | (2,555 | ) | - | |||||||
Re-measurement of Contingent Payment | (138 | ) | - | |||||||
(Gain) Loss on Discontinuance | (1,285 | ) | - | |||||||
(Gain) Loss on Divestitures of Assets | 1 | 6 | ||||||||
Other (Income) Loss, Net | (5 | ) | 34 | |||||||
Adjusted EBITDA(1) | 3,236 | 1,409 | ||||||||
Net Debt to Adjusted EBITDA | 2.8x | 1.9x | ||||||||
| (1) | Calculated on a trailing twelve-month basis. Includes discontinued operations. |
| Cenovus Energy Inc. | 27 | For the period ended December 31, 2017 |
NOTES TO CONSOLIDATED FINANCIAL STATEMENTS (unaudited)
All amounts in $ millions, unless otherwise indicated
For the period ended December 31, 2017
B) Net Debt to Capitalization
| As at December 31, | 2017 | 2016 | ||||||||
Net Debt | 8,903 | 2,612 | ||||||||
Shareholders’ Equity | 19,981 | 11,590 | ||||||||
| 28,884 | 14,202 | |||||||||
Net Debt to Capitalization | 31% | 18% | ||||||||
As at December 31, 2017, Cenovus’s Net Debt to Adjusted EBITDA is 2.8 times, which is above the Company’s target. However, it is important to note that Adjusted EBITDA is calculated on a rolling twelve month basis and as such, only includes the financial results from the Deep Basin Assets and the additional 50 percent of FCCL for the period May 17, 2017 to December 31, 2017. Net Debt is presented as at December 31, 2017; therefore, the ratio is burdened by the debt issued to finance the Acquisition. If Adjusted EBITDA reflected a full twelve months of earnings from the acquired assets, Cenovus’s Net Debt to Adjusted EBITDA ratio would be lower.
Cenovus’s objective is to maintain a high level of capital discipline and manage its capital structure to help ensure sufficient liquidity through all stages of the economic cycle. To ensure financial resilience, Cenovus may, among other actions, adjust capital and operating spending, draw down on its credit facility or repay existing debt, adjust dividends paid to shareholders, purchase shares for cancellation pursuant to normal course issuer bids, issue new debt, or issue new shares.
Cenovus has in place a committed credit facility that consists of a $1.2 billion tranche maturing on November 30, 2020 and a $3.3 billion tranche maturing on November 30, 2021. As at December 31, 2017, no amounts were drawn on its committed credit facility. Under the committed credit facility, the Company is required to maintain a debt to capitalization ratio, as defined in the agreement, not to exceed 65 percent. The Company is well below this limit.
In addition, the Company has in place a base shelf prospectus which expires in November 2019. As at December 31, 2017, US$4.6 billion remains available under the base shelf prospectus. Offerings under the base shelf prospectus are subject to market conditions.
As at December 31, 2017, Cenovus is in compliance with all of the terms of its debt agreements.
23. FINANCIAL INSTRUMENTS
Cenovus’s financial assets and financial liabilities consist of cash and cash equivalents, accounts receivable and accrued revenues, accounts payable and accrued liabilities, risk management assets and liabilities, available for sale financial assets, long-term receivables, contingent payment, short-term borrowings and long-term debt. Risk management assets and liabilities arise from the use of derivative financial instruments.
A) Fair Value ofNon-Derivative Financial Instruments
The fair values of cash and cash equivalents, accounts receivable and accrued revenues, accounts payable and accrued liabilities, and short-term borrowings approximate their carrying amount due to the short-term maturity of these instruments.
The fair values of long-term receivables approximate their carrying amount due to the specificnon-tradeable nature of these instruments.
Long-term debt is carried at amortized cost. The estimated fair values of long-term borrowings have been determined based onperiod-end trading prices of long-term borrowings on the secondary market (Level 2). As at December 31, 2017, the carrying value of Cenovus’s debt was $9,513 million and the fair value was $10,061 million (December 31, 2016 carrying value – $6,332 million, fair value – $6,539 million).
Available for sale financial assets comprise private equity investments. These assets are carried at fair value on the Consolidated Balance Sheets in other assets. Fair value is determined based on recent private placement transactions (Level 3) when available. The following table provides a reconciliation of changes in the fair value of available for sale financial assets:
| Total | ||||
| As at December 31, 2016 | 35 | |||
Net Acquisition of Investments | 3 | |||
Change in Fair Value(1) | (1 | ) | ||
As at December 31, 2017 | 37 | |||
| (1) | Changes in fair value on available for sale financial assets are recorded in OCI. |
| Cenovus Energy Inc. | 28 | For the period ended December 31, 2017 |
NOTES TO CONSOLIDATED FINANCIAL STATEMENTS (unaudited)
All amounts in $ millions, unless otherwise indicated
For the period ended December 31, 2017
B) Fair Value of Risk Management Assets and Liabilities
The Company’s risk management assets and liabilities consist of crude oil swaps and options, as well as condensate and interest rate swaps. Crude oil, condensate and, if entered, natural gas contracts are recorded at their estimated fair value based on the difference between the contracted price and theperiod-end forward price for the same commodity, using quoted market prices or theperiod-end forward price for the same commodity extrapolated to the end of the term of the contract (Level 2). The fair value of interest rate swaps are calculated using external valuation models which incorporate observable market data, including interest rate yield curves (Level 2).
Summary of Unrealized Risk Management Positions
| 2017 | 2016 | |||||||||||||||||||||||||||||||||
| Risk Management | Risk Management | |||||||||||||||||||||||||||||||||
| As at December 31, | Asset | Liability | Net | Asset | Liability | Net | ||||||||||||||||||||||||||||
Crude Oil | 63 | 1,031 | (968) | 21 | 307 | (286) | ||||||||||||||||||||||||||||
Interest Rate | 2 | 20 | (18) | 3 | 8 | (5) | ||||||||||||||||||||||||||||
Total Fair Value | 65 | 1,051 | (986) | 24 | 315 | (291) | ||||||||||||||||||||||||||||
The following table presents the Company’s fair value hierarchy for risk management assets and liabilities carried at fair value:
| As at December 31, | 2017 | 2016 | ||||||||
Level 2 – Prices Sourced From Observable Data or Market Corroboration | (986) | (291) | ||||||||
Prices sourced from observable data or market corroboration refers to the fair value of contracts valued in part using active quotes and in part using observable, market-corroborated data.
The following table provides a reconciliation of changes in the fair value of Cenovus’s risk management assets and liabilities from January 1 to December 31:
| 2017 | 2016 | |||||||||
Fair Value of Contracts, Beginning of Year | (291) | 271 | ||||||||
Fair Value of Contracts Realized During the Year(1) | 200 | (211) | ||||||||
Change in Fair Value of Contracts in Place at Beginning of Year and Contracts Entered Into During the Year | (929) | (343) | ||||||||
Unamortized Premium on Put Options | 16 | - | ||||||||
Unrealized Foreign Exchange Gain (Loss) on U.S. Dollar Contracts | 18 | (8) | ||||||||
Fair Value of Contracts, End of Year | (986) | (291) | ||||||||
| (1) | Includes a realized loss of $33 million (2016 – $58 million gain) related to the Conventional segment which is included in discontinued operations. |
C) Fair Value of Contingent Payment
The contingent payment is carried at fair value on the Consolidated Balance Sheets. Fair value is estimated by calculating the present value of the future expected cash flows using an option pricing model (Level 3), which assumes the probability distribution for WCS is based on the volatility of WTI options, volatility ofCanadian-U.S. foreign exchange rate options and WCS futures pricing, and discounted at a credit-adjusted risk-free rate of 3.3 percent. Fair value of the contingent payment has been calculated by Cenovus’s internal valuation team which consists of individuals who are knowledgeable and have experience in fair value techniques. As at December 31, 2017, the fair value of the contingent payment was estimated to be $206 million.
As at December 31, 2017, average WCS forward pricing for the remaining term of the contingent payment is US$35.51 per barrel or C$44.55 per barrel. The average volatility of WTI options and theCanadian-U.S. foreign exchange rates used to value the contingent payment was 20 percent and seven percent, respectively. Changes in the following inputs to the option pricing model, with fluctuations in all other variables held constant, could have resulted in unrealized gains (losses) impacting earnings before income tax as follows:
| Sensitivity Range | Increase | Decrease | ||||||||||
WCS Forward Prices | ± $5.00 per bbl | (167) | 111 | |||||||||
WTI Option Volatility | ± five percent | (95) | 85 | |||||||||
U.S. to Canadian Dollar Foreign Exchange Rate Volatility | ± five percent | 2 | (27) | |||||||||
| Cenovus Energy Inc. | 29 | For the period ended December 31, 2017 |
NOTES TO CONSOLIDATED FINANCIAL STATEMENTS (unaudited)
All amounts in $ millions, unless otherwise indicated
For the period ended December 31, 2017
D) Earnings Impact of (Gains) Losses From Risk Management Positions
| Three Months Ended | Twelve Months Ended | |||||||||||||||||||||
| For the periods ended December 31, | 2017 | 2016 | 2017 | 2016 | ||||||||||||||||||
Realized (Gain) Loss(1) | 233 | (11) | 167 | (153) | ||||||||||||||||||
Unrealized (Gain) Loss(2) | 654 | 114 | 729 | 554 | ||||||||||||||||||
(Gain) Loss on Risk Management From Continuing Operations | 887 | 103 | 896 | 401 | ||||||||||||||||||
| (1) | Realized gains and losses on risk management are recorded in the reportable segment to which the derivative instrument relates. Excludes realized risk management losses of $33 million in the twelve months ended December 31, 2017 (twelve months ended December 31, 2016 – $58 million gain) that were classified as discontinued operations. |
| (2) | Unrealized gains and losses on risk management are recorded in the Corporate and Eliminations segment. |
24. RISK MANAGEMENT
Cenovus is exposed to financial risks, including market risk related to commodity prices, foreign exchange rates, interest rates as well as credit risk and liquidity risk. To manage exposure to interest rate volatility, the Company entered into interest rate swap contracts related to expected future debt issuances. As at December 31, 2017, Cenovus had a notional amount of US$400 million in interest rate swaps. To mitigate the Company’s exposure to foreign exchange rate fluctuations, the Company periodically enters into foreign exchange contracts. No foreign exchange contracts were outstanding at December 31, 2017.
Net Fair Value of Risk Management Positions
| As at December 31, 2017 | Notional Volumes | Terms | Average Price | Fair Value Asset (Liability) | ||||||||||||||||||
Crude Oil Contracts | ||||||||||||||||||||||
Fixed Price Contracts | ||||||||||||||||||||||
Brent Fixed Price | 60,000 bbls/d | January – June 2018 | US$53.34/bbl | (172) | ||||||||||||||||||
WTI Fixed Price | 150,000 bbls/d | January – June 2018 | US$48.91/bbl | (384) | ||||||||||||||||||
WTI Fixed Price | 75,000 bbls/d | July – December 2018 | US$49.32/bbl | (158) | ||||||||||||||||||
Brent Put Options | 25,000 bbls/d | January – June 2018 | US$53.00/bbl | 1 | ||||||||||||||||||
Brent Collars | 80,000 bbls/d | January – June 2018 | | US$49.54 – US$59.86/bbl | | (124) | ||||||||||||||||
Brent Collars | 75,000 bbls/d | July – December 2018 | | US$49.00 – US$59.69/bbl | | (110) | ||||||||||||||||
WTI Collars | 10,000 bbls/d | January – June 2018 | | US$45.30 – US$62.77/bbl | | (2) | ||||||||||||||||
WCS Differential | 16,300 bbls/d | January – March 2018 | US$(13.11)/bbl | 14 | ||||||||||||||||||
WCS Differential | 14,800 bbls/d | April – June 2018 | US$(14.05)/bbl | 7 | ||||||||||||||||||
WCS Differential | 10,500 bbls/d | January – December 2018 | US$(14.52)/bbl | 25 | ||||||||||||||||||
Other Financial Positions(1) | (65) | |||||||||||||||||||||
Crude Oil Fair Value Position | (968) | |||||||||||||||||||||
Interest Rate Swaps | (18) | |||||||||||||||||||||
Total Fair Value | (986) | |||||||||||||||||||||
| (1) | Other financial positions are part of ongoing operations to market the Company’s production. |
| Cenovus Energy Inc. | 30 | For the period ended December 31, 2017 |
NOTES TO CONSOLIDATED FINANCIAL STATEMENTS (unaudited)
All amounts in $ millions, unless otherwise indicated
For the period ended December 31, 2017
Sensitivities – Risk Management Positions
The following table summarizes the sensitivity of the fair value of Cenovus’s risk management positions to fluctuations in commodity prices and interest rates, with all other variables held constant. Management believes the fluctuations identified in the table below are a reasonable measure of volatility. The impact of fluctuating commodity prices and interest rates on the Company’s open risk management positions could have resulted in unrealized gains (losses) impacting earnings before income tax as follows:
Risk Management Positions in Place as at December 31, 2017
| Sensitivity Range | Increase | Decrease | ||||||||||
Crude Oil Commodity Price | ± US$5.00 per bbl Applied to Brent, WTI and Condensate Hedges | (529) | 507 | |||||||||
Crude Oil Differential Price | ± US$2.50 per bbl Applied to Differential Hedges Tied to Production | 11 | (11) | |||||||||
Interest Rate Swaps | ± 50 Basis Points | 44 | (50) | |||||||||
25. SUPPLEMENTARY CASH FLOW INFORMATION
The following table provides a reconciliation of cash flows arising from financing activities:
| Dividends Payable | Current Portion of Long-Term Debt | Long-Term Debt | Share Capital | |||||||||||||||||||
As at December 31, 2015 | - | - | 6,525 | 5,534 | ||||||||||||||||||
Changes From Financing Cash Flows: | ||||||||||||||||||||||
Dividends Paid | (166 | ) | - | - | - | |||||||||||||||||
Non-Cash Changes: | ||||||||||||||||||||||
Dividends Declared | 166 | - | - | - | ||||||||||||||||||
Unrealized Foreign Exchange (Gain) Loss (Note 6) | - | - | (196 | ) | - | |||||||||||||||||
Amortization of Debt Discounts | - | - | 3 | - | ||||||||||||||||||
As at December 31, 2016 | - | - | 6,332 | 5,534 | ||||||||||||||||||
Changes From Financing Cash Flows: | ||||||||||||||||||||||
Issuance of Long-Term Debt | - | - | 3,842 | - | ||||||||||||||||||
Net Issuance (Repayment) of Revolving Long-Term Debt | - | - | 32 | - | ||||||||||||||||||
Issuance of Debt Under Asset Sale Bridge Facility | - | 892 | 2,677 | - | ||||||||||||||||||
(Repayment) of Debt Under Asset Sale Bridge Facility | - | (900 | ) | (2,700 | ) | - | ||||||||||||||||
Common Shares Issued, Net of Issuance Costs | - | - | - | 2,899 | ||||||||||||||||||
Dividends Paid | (225 | ) | - | - | - | |||||||||||||||||
Non-Cash Changes: | ||||||||||||||||||||||
Common Shares Issued to ConocoPhillips | - | - | - | 2,579 | ||||||||||||||||||
Deferred Taxes on Share Issuance Costs | - | - | - | 28 | ||||||||||||||||||
Dividends Declared | 225 | - | - | - | ||||||||||||||||||
Unrealized Foreign Exchange (Gain) Loss | - | - | (697 | ) | - | |||||||||||||||||
Finance Costs | - | 8 | 28 | - | ||||||||||||||||||
Other | - | - | (1 | ) | - | |||||||||||||||||
As at December 31, 2017 | - | - | 9,513 | 11,040 | ||||||||||||||||||
| Cenovus Energy Inc. | 31 | For the period ended December 31, 2017 |
NOTES TO CONSOLIDATED FINANCIAL STATEMENTS (unaudited)
All amounts in $ millions, unless otherwise indicated
For the period ended December 31, 2017
26. COMMITMENTS AND CONTINGENCIES
A) Commitments
Cenovus has entered into various commitments in the normal course of operations primarily related to demand charges on firm transportation agreements. In addition, the Company has commitments related to its risk management program and an obligation to fund its defined benefit pension and other post-employment benefit plans. Additional information related to the Company’s commitments can be found in the notes to the annual Consolidated Financial Statements for the year ended December 31, 2016.
As at December 31, 2017, total commitments were $21.7 billion, of which $18.3 billion were for various transportation commitments. During the twelve months ended December 31, 2017, the Company’s transportation commitments decreased approximately $8.0 billion primarily due to pipeline project cancellations, partially offset by incremental commitments included with the Acquisition and newly executed transportation agreements.
Transportation commitments include $8.8 billion that are subject to regulatory approval or have been approved but are not yet in service (December 31, 2016 – $19.2 billion). Terms are up to 20 years subsequent to the date of commencement and should help align the Company’s future transportation requirements with its anticipated production growth.
As at December 31, 2017, there were outstanding letters of credit aggregating $376 million issued as security for performance under certain contracts (December 31, 2016 – $258 million).
B) Contingencies
Legal Proceedings
Cenovus is involved in a limited number of legal claims associated with the normal course of operations. Cenovus believes that any liabilities that might arise from such matters, to the extent not provided for, are not likely to have a material effect on its Consolidated Financial Statements.
Contingent Payment
In connection with the Acquisition, Cenovus agreed to make quarterly payments to ConocoPhillips during the five years subsequent to May 17, 2017 for quarters in which the average WCS crude oil price exceeds $52.00 per barrel during the quarter. As at December 31, 2017, the estimated fair value of the contingent payment was $206 million (see Note 15).
| Cenovus Energy Inc. | 32 | For the period ended December 31, 2017 |
SUPPLEMENTAL INFORMATION(unaudited)
Financial Statistics
($ millions, except per share amounts)
| Revenues | 2017 | 2016 | ||||||||||||||||||||||
| Year | Q4 | Q3 | Q2 | Q1 | Year | |||||||||||||||||||
Gross Sales | ||||||||||||||||||||||||
Oil Sands | 7,362 | 2,424 | 2,210 | 1,666 | 1,062 | 2,929 | ||||||||||||||||||
Deep Basin | 555 | 231 | 200 | 124 | - | - | ||||||||||||||||||
Refining and Marketing | 9,852 | 2,690 | 2,161 | 2,397 | 2,604 | 8,439 | ||||||||||||||||||
Corporate and Eliminations | (455 | ) | (133 | ) | (118 | ) | (106 | ) | (98 | ) | (353 | ) | ||||||||||||
Less: Royalties | 271 | 133 | 67 | 44 | 27 | 9 | ||||||||||||||||||
Revenues from Continuing Operations | 17,043 | 5,079 | 4,386 | 4,037 | 3,541 | 11,006 | ||||||||||||||||||
Conventional (Net of Royalties) - Discontinued Operations | 1,135 | 189 | 286 | 336 | 324 | 1,128 | ||||||||||||||||||
Total Revenues | 18,178 | 5,268 | 4,672 | 4,373 | 3,865 | 12,134 | ||||||||||||||||||
| 2017 | 2016 | |||||||||||||||||||||||
| Operating Margin(1) | Year | Q4 | Q3 | Q2 | Q1 | Year | ||||||||||||||||||
Oil Sands | 2,187 | 612 | 822 | 501 | 252 | 877 | ||||||||||||||||||
Deep Basin | 207 | 92 | 64 | 51 | - | - | ||||||||||||||||||
| 2,394 | 704 | 886 | 552 | 252 | 877 | |||||||||||||||||||
Refining and Marketing | 598 | 314 | 211 | 20 | 53 | 346 | ||||||||||||||||||
Operating Margin from Continuing Operations | 2,992 | 1,018 | 1,097 | 572 | 305 | 1,223 | ||||||||||||||||||
Conventional - Discontinued Operations | 491 | 70 | 117 | 159 | 145 | 544 | ||||||||||||||||||
Total Operating Margin | 3,483 | 1,088 | 1,214 | 731 | 450 | 1,767 | ||||||||||||||||||
| 2017 | 2016 | |||||||||||||||||||||||
| Adjusted Funds Flow(2) | Year | Q4 | Q3 | Q2 | Q1 | Year | ||||||||||||||||||
Total Cash From Operating Activities | 3,059 | 900 | 592 | 1,239 | 328 | 861 | ||||||||||||||||||
Deduct (Add Back): | ||||||||||||||||||||||||
Net Change in Other Assets and Liabilities | (107 | ) | (32 | ) | (19 | ) | (25 | ) | (31 | ) | (91 | ) | ||||||||||||
Net Change inNon-Cash Working Capital | 252 | 66 | (369 | ) | 519 | 36 | (471 | ) | ||||||||||||||||
Total Adjusted Funds Flow | 2,914 | 866 | 980 | 745 | 323 | 1,423 | ||||||||||||||||||
Total Per Share - Basic and Diluted | 2.64 | 0.70 | 0.80 | 0.67 | 0.39 | 1.71 | ||||||||||||||||||
| 2017 | 2016 | |||||||||||||||||||||||
| Earnings | Year | Q4 | Q3 | Q2 | Q1 | Year | ||||||||||||||||||
Operating Earnings (Loss) from Continuing Operations(3) | (34 | ) | (533 | ) | 240 | 298 | (39 | ) | (291 | ) | ||||||||||||||
Per Share from Continuing Operations - Diluted | (0.03 | ) | (0.43 | ) | 0.20 | 0.27 | (0.05 | ) | (0.35 | ) | ||||||||||||||
Total Operating Earnings (Loss)(3) | 126 | (514 | ) | 327 | 352 | (39 | ) | (377 | ) | |||||||||||||||
Total Per Share - Diluted | 0.11 | (0.42 | ) | 0.27 | 0.32 | (0.05 | ) | (0.45 | ) | |||||||||||||||
Net Earnings (Loss) from Continuing Operations | 2,268 | (776 | ) | 275 | 2,558 | 211 | (459 | ) | ||||||||||||||||
Per Share from Continuing Operations - Basic and Diluted | 2.06 | (0.63 | ) | 0.22 | 2.30 | 0.25 | (0.55 | ) | ||||||||||||||||
Total Net Earnings (Loss) | 3,366 | 620 | (82 | ) | 2,617 | 211 | (545 | ) | ||||||||||||||||
Total Per Share - Basic and Diluted | 3.05 | 0.50 | (0.07 | ) | 2.35 | 0.25 | (0.65 | ) | ||||||||||||||||
| 2017 | 2016 | |||||||||||||||||||||||
| Net Capital Investment | Year | Q4 | Q3 | Q2 | Q1 | Year | ||||||||||||||||||
Oil Sands | ||||||||||||||||||||||||
Foster Creek | 455 | 143 | 122 | 120 | 70 | 263 | ||||||||||||||||||
Christina Lake | 426 | 154 | 132 | 77 | 63 | 282 | ||||||||||||||||||
Other Oil Sands | 92 | 16 | 19 | 18 | 39 | 59 | ||||||||||||||||||
Total Oil Sands | 973 | 313 | 273 | 215 | 172 | 604 | ||||||||||||||||||
Deep Basin | 225 | 148 | 64 | 13 | - | - | ||||||||||||||||||
Refining and Marketing | 180 | 56 | 38 | 40 | 46 | 220 | ||||||||||||||||||
Corporate | 77 | 40 | 21 | 9 | 7 | 31 | ||||||||||||||||||
Capital Investment from Continuing Operations | 1,455 | 557 | 396 | 277 | 225 | 855 | ||||||||||||||||||
Conventional (Discontinued Operations) | 206 | 26 | 42 | 50 | 88 | 171 | ||||||||||||||||||
Total Capital Investment | 1,661 | 583 | 438 | 327 | 313 | 1,026 | ||||||||||||||||||
Acquisitions(4) | 18,388 | 87 | 70 | 18,231 | - | 11 | ||||||||||||||||||
Divestitures | (3,210 | ) | (2,271 | ) | (939 | ) | - | - | (8 | ) | ||||||||||||||
Net Acquisition and Divestiture Activity | 15,178 | (2,184 | ) | (869 | ) | 18,231 | - | 3 | ||||||||||||||||
Net Capital Investment | 16,839 | (1,601 | ) | (431 | ) | 18,558 | 313 | 1,029 | ||||||||||||||||
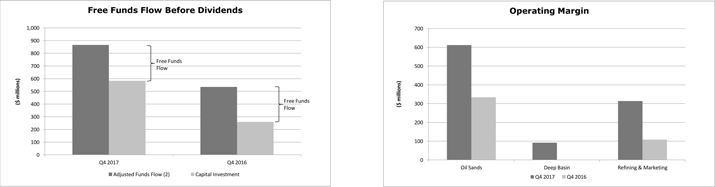
| (1) | Operating Margin is an additional subtotal found in Note 1 of the Consolidated Financial Statements and is used to provide a consistent measure of the cash generating performance of our assets for comparability of our underlying financial performance between periods. Operating Margin is defined as revenues less purchased product, transportation and blending, operating expenses, production and mineral taxes plus realized gains less realized losses on risk management activities. Items within the Corporate and Eliminations segment are excluded from the calculation of Operating Margin. |
| (2) | Adjusted Funds Flow is anon-GAAP measure commonly used in the oil and gas industry to assist in measuring a company’s ability to finance its capital programs and meet its financial obligations. Adjusted Funds Flow is defined as Cash From Operating Activities excluding net change in other assets and liabilities and net change innon-cash working capital. Net change in other assets and liabilities is composed of site restoration costs and pension funding.Non-cash working capital is composed of current assets and current liabilities, excluding cash and cash equivalents, risk management, the contingent payment, assets held for sale and liabilities related to assets held for sale. |
| (3) | Operating Earnings (Loss) is anon-GAAP measure used to provide a consistent measure of the comparability of our underlying financial performance between periods by removingnon-operating items. Operating Earnings (Loss) is defined as Earnings (Loss) Before Income Tax excluding gain (loss) on discontinuance, revaluation gain, gain on bargain purchase, unrealized risk management gains (losses) on derivative instruments, unrealized foreign exchange gains (losses) on translation of U.S. dollar denominated notes issued from Canada, foreign exchange gains (losses) on settlement of intercompany transactions, gains (losses) on divestiture of assets, less income taxes on Operating Earnings (Loss) before tax, excluding the effect of changes in statutory income tax rates and the recognition of an increase in U.S. tax basis. |
| (4) | In connection with the Acquisition that was completed in the second quarter of 2017, Cenovus was deemed to have disposed of itspre-existing interest in FCCL andre-acquired it at fair value as required by IFRS 3, which is not reflected in the table above. The carrying value of thepre-existing interest was $9,081 million and the fair value was $11,605 million as at May 17, 2017. |
. Supplemental Information
| Cenovus Energy Inc | 1 | for the period ended December 31, 2017 |
SUPPLEMENTAL INFORMATION(unaudited)
Financial Statistics (continued)
| Financial Metrics(Non-GAAP Measures) | 2017 | 2016 | ||||||||||||||||||||||
| Year | Q4 | Q3 | Q2 | Q1 | Year | |||||||||||||||||||
Net Debt to Adjusted EBITDA(1) (2) | 2.8x | 2.8x | 4.2x | 6.3x | 1.6x | 1.9x | ||||||||||||||||||
Return on Capital Employed (3) | 16% | 16% | 13% | 12% | 0% | (2)% | ||||||||||||||||||
Return on Common Equity(4) | 21% | 21% | 18% | 17% | (2)% | (5)% | ||||||||||||||||||
| 2017 | 2016 | |||||||||||||||||||||||
| Income Tax & Exchange Rates | Year | Q4 | Q3 | Q2 | Q1 | Year | ||||||||||||||||||
Effective Tax Rates Using: | ||||||||||||||||||||||||
Net Earnings From Continuing Operations | (2.3)% | 42.8% | ||||||||||||||||||||||
Operating Earnings From Continuing Operations, Excluding Divestitures | 86.9% | 33.6% | ||||||||||||||||||||||
Foreign Exchange Rates(US$ per C$1) | ||||||||||||||||||||||||
Average | 0.771 | 0.787 | 0.798 | 0.744 | 0.756 | 0.755 | ||||||||||||||||||
Period End | 0.797 | 0.797 | 0.801 | 0.771 | 0.751 | 0.745 | ||||||||||||||||||
| 2017 | 2016 | |||||||||||||||||||||||
| Common Share Information | Year | Q4 | Q3 | Q2 | Q1 | Year | ||||||||||||||||||
Common Shares Outstanding(millions) | ||||||||||||||||||||||||
Period End | 1,228.8 | 1,228.8 | 1,228.8 | 1,228.8 | 833.3 | 833.3 | ||||||||||||||||||
Average - Basic and Diluted | 1,102.5 | 1,228.8 | 1,228.8 | 1,113.3 | 833.3 | 833.3 | ||||||||||||||||||
Dividends($ per share) | 0.20 | 0.05 | 0.05 | 0.05 | 0.05 | 0.20 | ||||||||||||||||||
Closing Price - TSX(C$ per share) | 11.48 | 11.48 | 12.51 | 9.56 | 15.05 | 20.30 | ||||||||||||||||||
- NYSE(US$ per share) | 9.13 | 9.13 | 10.02 | 7.37 | 11.30 | 15.13 | ||||||||||||||||||
Share Volume Traded(millions) | 2,908.3 | 703.3 | 804.1 | 907.7 | 493.2 | 1,491.7 | ||||||||||||||||||
| Operating Statistics - Before Royalties | ||||||||||||||||||||||||
| 2017 | 2016 | |||||||||||||||||||||||
| Upstream Production Volumes | Year | Q4 | Q3 | Q2 | Q1 | Year | ||||||||||||||||||
Crude Oil and Natural Gas Liquids(bbls/d) | ||||||||||||||||||||||||
Oil Sands | ||||||||||||||||||||||||
Foster Creek | 124,752 | 154,784 | 154,363 | 107,859 | 80,866 | 70,244 | ||||||||||||||||||
Christina Lake | 167,727 | 206,579 | 208,131 | 153,953 | 100,635 | 79,449 | ||||||||||||||||||
| 292,479 | 361,363 | 362,494 | 261,812 | 181,501 | 149,693 | |||||||||||||||||||
Deep Basin | ||||||||||||||||||||||||
Light and Medium Oil | 3,922 | 6,042 | 6,494 | 3,059 | - | - | ||||||||||||||||||
Natural Gas Liquids(5) | 16,928 | 27,105 | 26,370 | 13,835 | - | - | ||||||||||||||||||
| 20,850 | 33,147 | 32,864 | 16,894 | - | - | |||||||||||||||||||
Total Liquids Production from Continuing Operations | 313,329 | 394,510 | 395,358 | 278,706 | 181,501 | 149,693 | ||||||||||||||||||
Natural Gas(MMcf/d) | ||||||||||||||||||||||||
Oil Sands | 10 | 7 | 6 | 12 | 15 | 17 | ||||||||||||||||||
Deep Basin | 316 | 509 | 495 | 253 | - | - | ||||||||||||||||||
Total Natural Gas Production from Continuing Operations | 326 | 516 | 501 | 265 | 15 | 17 | ||||||||||||||||||
Total Production from Continuing Operations(6) (BOE per day) | 367,635 | 480,497 | 478,817 | 322,792 | 184,001 | 152,527 | ||||||||||||||||||
Conventional | ||||||||||||||||||||||||
Heavy Oil | 21,478 | 6,675 | 25,549 | 26,593 | 27,277 | 29,185 | ||||||||||||||||||
Light and Medium Oil | 24,824 | 20,059 | 26,947 | 27,233 | 25,089 | 25,915 | ||||||||||||||||||
Natural Gas Liquids(5) | 1,073 | 913 | 1,201 | 1,132 | 1,047 | 1,065 | ||||||||||||||||||
| 47,375 | 27,647 | 53,697 | 54,958 | 53,413 | 56,165 | |||||||||||||||||||
Natural Gas | 333 | 279 | 350 | 355 | 348 | 377 | ||||||||||||||||||
Total Production from Discontinued Operations(6) (BOE per day) | 102,855 | 74,109 | 112,034 | 114,137 | 111,413 | 118,998 | ||||||||||||||||||
Total Production(6)(BOE/d) | 470,490 | 554,606 | 590,851 | 436,929 | 295,414 | 271,525 | ||||||||||||||||||
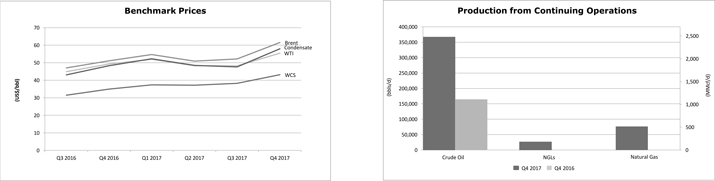
| (1) | Net debt includes the Company’s short-term borrowings and the current and long-term portions of long-term debt, net of cash and cash equivalents. |
| (2) | Adjusted EBITDA is defined as earnings before finance costs, interest income, income tax expense, depreciation, depletion and amortization, revaluation gain, remeasurement gains (losses) on contingent consideration, goodwill impairments, asset impairments and reversals, unrealized gains (losses) on risk management, foreign exchange gains (losses), gains (losses) on divestiture of assets and other income (loss), net, calculated on a trailing twelve-month basis. |
| (3) | Return on capital employed is calculated, on a trailing twelve-month basis, as net earnings beforeafter-tax interest divided by average shareholders’ equity plus average debt. |
| (4) | Return on common equity is calculated, on a trailing twelve-month basis, as net earnings divided by average shareholders’ equity. |
| (5) | Natural gas liquids include condensate volumes. |
| (6) | Natural gas volumes have been converted to barrels of oil equivalent (“BOE”) on the basis of six thousand cubic feet (“Mcf”) to one barrel (“bbl”). BOE may be misleading, particularly if used in isolation. A conversion ratio of one bbl to six Mcf is based on an energy equivalency conversion method primarily applicable at the burner tip and does not represent value equivalency at the wellhead. Given that the value ratio based on the current price of crude oil compared to natural gas is significantly different from the energy equivalency conversion ratio of 6:1, utilizing a conversion on a 6:1 basis is not an accurate reflection of value. |
| Cenovus Energy Inc. | 2 | Supplemental Information for the period ended December 31, 2017 |
SUPPLEMENTAL INFORMATION(unaudited)
Operating Statistics - Before Royalties (continued)
| 2017 | 2016 | |||||||||||||||||||||||
| Selected Average Benchmark Prices | Year | Q4 | Q3 | Q2 | Q1 | Year | ||||||||||||||||||
Crude Oil Prices(US$/bbl) | ||||||||||||||||||||||||
Brent | 54.82 | 61.54 | 52.18 | 50.92 | 54.66 | 45.04 | ||||||||||||||||||
West Texas Intermediate (“WTI”) | 50.95 | 55.40 | 48.21 | 48.29 | 51.91 | 43.32 | ||||||||||||||||||
Differential Brent - WTI | 3.87 | 6.14 | 3.97 | 2.63 | 2.75 | 1.72 | ||||||||||||||||||
Western Canadian Select (“WCS”) | 38.97 | 43.14 | 38.27 | 37.16 | 37.33 | 29.48 | ||||||||||||||||||
WCS (C$) | 50.56 | 54.84 | 47.96 | 49.95 | 49.38 | 39.05 | ||||||||||||||||||
Mixed Sweet Blend (US$) | 48.49 | 54.26 | 45.32 | 46.03 | 48.37 | 40.11 | ||||||||||||||||||
Differential WTI - WCS | 11.98 | 12.26 | 9.94 | 11.13 | 14.58 | 13.84 | ||||||||||||||||||
Condensate (C5 @ Edmonton) | 51.57 | 57.97 | 47.61 | 48.44 | 52.26 | 42.47 | ||||||||||||||||||
Differential WTI - Condensate (Premium)/Discount | (0.62) | (2.57) | 0.60 | (0.15) | (0.35) | 0.85 | ||||||||||||||||||
Refining Margins 3-2-1 Crack Spreads(1)(US$/bbl) | ||||||||||||||||||||||||
Chicago | 16.77 | 21.09 | 19.66 | 14.78 | 11.54 | 13.07 | ||||||||||||||||||
Group 3 | 16.61 | 18.77 | 20.20 | 14.27 | 13.18 | 12.27 | ||||||||||||||||||
Natural Gas Prices | ||||||||||||||||||||||||
AECO(C$/Mcf) | 2.43 | 1.96 | 2.04 | 2.77 | 2.94 | 2.09 | ||||||||||||||||||
NYMEX(US$/Mcf) | 3.11 | 2.93 | 3.00 | 3.18 | 3.32 | 2.46 | ||||||||||||||||||
Differential NYMEX - AECO(US$/Mcf) | 1.26 | 1.40 | 1.39 | 1.13 | 1.10 | 0.89 | ||||||||||||||||||
| 2017 | 2016 | |||||||||||||||||||||||
| Average Royalty Rates(Excluding Realized Gain (Loss) on Risk Management) | Year | Q4 | Q3 | Q2 | Q1 | Year | ||||||||||||||||||
Oil Sands | ||||||||||||||||||||||||
Foster Creek | 11.4% | 17.5% | 9.1% | 7.3% | 8.5% | 0.0% | ||||||||||||||||||
Christina Lake | 2.5% | 3.1% | 1.6% | 2.6% | 2.7% | 1.6% | ||||||||||||||||||
Deep Basin | ||||||||||||||||||||||||
Crude Oil | 15.0% | 14.8% | 14.5% | 17.4% | - | - | ||||||||||||||||||
Natural Gas Liquids | 10.8% | 12.2% | 10.0% | 9.2% | - | - | ||||||||||||||||||
Natural Gas | 4.4% | 5.6% | 3.5% | 4.1% | - | - | ||||||||||||||||||
Conventional Oil | ||||||||||||||||||||||||
Pelican Lake | 19.2% | - | 19.6% | 17.4% | 19.8% | 12.5% | ||||||||||||||||||
Weyburn | 26.9% | 28.8% | 24.8% | 25.8% | 28.3% | 23.6% | ||||||||||||||||||
Other | 12.3% | 9.7% | 13.8% | 12.7% | 12.4% | 12.8% | ||||||||||||||||||
Natural Gas Liquids | 12.9% | 13.0% | 12.2% | 13.0% | 13.3% | 13.5% | ||||||||||||||||||
Natural Gas | 4.8% | 3.6% | 5.1% | 5.2% | 4.8% | 4.6% | ||||||||||||||||||
| 2017 | 2016 | |||||||||||||||||||||||
| Oil Sands Netbacks(2)(Excluding Realized Gain (Loss) on Risk Management) | Year | Q4 | Q3 | Q2 | Q1 | Year | ||||||||||||||||||
Heavy Oil - Foster Creek($/bbl) | ||||||||||||||||||||||||
Sales Price | 43.75 | 47.37 | 41.57 | 44.38 | 40.62 | 30.32 | ||||||||||||||||||
Royalties | 4.00 | 6.86 | 2.98 | 2.49 | 2.83 | (0.01) | ||||||||||||||||||
Transportation and Blending | 8.73 | 8.07 | 8.68 | 10.44 | 7.72 | 8.84 | ||||||||||||||||||
Operating | 10.46 | 10.37 | 9.53 | 12.31 | 9.99 | 10.55 | ||||||||||||||||||
Netback | 20.56 | 22.07 | 20.38 | 19.14 | 20.08 | 10.94 | ||||||||||||||||||
Heavy Oil - Christina Lake($/bbl) | ||||||||||||||||||||||||
Sales Price | 39.78 | 45.13 | 38.84 | 36.54 | 35.86 | 25.30 | ||||||||||||||||||
Royalties | 0.87 | 1.23 | 0.55 | 0.85 | 0.86 | 0.33 | ||||||||||||||||||
Transportation and Blending | 4.52 | 5.42 | 4.14 | 4.10 | 4.13 | 4.68 | ||||||||||||||||||
Operating | 6.84 | 6.93 | 6.08 | 7.04 | 8.08 | 7.48 | ||||||||||||||||||
Netback | 27.55 | 31.55 | 28.07 | 24.55 | 22.79 | 12.81 | ||||||||||||||||||
Total Heavy Oil - Oil Sands($/bbl) | ||||||||||||||||||||||||
Sales Price | 41.49 | 46.08 | 40.02 | 39.73 | 38.08 | 27.64 | ||||||||||||||||||
Royalties | 2.22 | 3.63 | 1.60 | 1.52 | 1.78 | 0.17 | ||||||||||||||||||
Transportation and Blending | 6.33 | 6.55 | 6.11 | 6.68 | 5.81 | 6.62 | ||||||||||||||||||
Operating | 8.40 | 8.39 | 7.58 | 9.19 | 8.97 | 8.91 | ||||||||||||||||||
Netback | 24.54 | 27.51 | 24.73 | 22.34 | 21.52 | 11.94 | ||||||||||||||||||
| 2017 | 2016 | |||||||||||||||||||||||
| Deep Basin Netbacks(2)(Excluding Realized Gain (Loss) on Risk Management) | Year | Q4 | Q3 | Q2 | Q1 | Year | ||||||||||||||||||
Total Deep Basin(3)($/BOE) | ||||||||||||||||||||||||
Sales Price | 19.52 | 20.19 | 17.61 | 21.94 | - | - | ||||||||||||||||||
Royalties | 1.54 | 1.84 | 1.28 | 1.45 | - | - | ||||||||||||||||||
Transportation and Blending | 2.08 | 2.26 | 1.96 | 1.96 | - | - | ||||||||||||||||||
Operating | 8.56 | 7.99 | 9.00 | 8.84 | - | - | ||||||||||||||||||
Production and Mineral Taxes | 0.02 | 0.02 | 0.03 | 0.03 | - | - | ||||||||||||||||||
Netback | 7.32 | 8.08 | 5.34 | 9.66 | - | - | ||||||||||||||||||
2017 | 2016 | |||||||||||||||||||||||
| Continuing Operations Netbacks (2) (Excluding Realized Gain (Loss) on Risk Management) | Year | Q4 | Q3 | Q2 | Q1 | Year | ||||||||||||||||||
Total Continuing Operations(3)($/BOE) | ||||||||||||||||||||||||
Sales Price | 36.86 | 39.29 | 34.58 | 36.31 | 37.77 | 27.37 | ||||||||||||||||||
Royalties | 2.07 | 3.16 | 1.52 | 1.50 | 1.76 | 0.17 | ||||||||||||||||||
Transportation and Blending | 5.43 | 5.42 | 5.10 | 5.78 | 5.73 | 6.51 | ||||||||||||||||||
Operating | 8.46 | 8.32 | 7.94 | 9.13 | 9.03 | 8.94 | ||||||||||||||||||
Production and Mineral Taxes | 0.01 | 0.01 | 0.01 | - | - | - | ||||||||||||||||||
Netback | 20.89 | 22.38 | 20.01 | 19.90 | 21.25 | 11.75 | ||||||||||||||||||
| (1) | The 3-2-1 crack spread is an indicator of the refining margin generated by converting three barrels of crude oil into two barrels of regular unleaded gasoline and one barrel of ultra-low sulphur diesel using current month WTI based crude oil feedstock prices and on a last in, first out accounting basis (“LIFO”). |
| (2) | Netback is a non-GAAP measure commonly used in the oil and gas industry to assist in measuring operating performance on a per-unit basis. Netbacks reflect our margin on a per-barrel basis of unblended crude oil. Netback is defined as gross sales less royalties, transportation and blending, operating expenses and production and mineral taxes divided by sales volumes. Netbacks do not reflect the non-cash write-downs of product inventory until the product is sold. The crude oil sales price, transportation and blending costs, and sales volumes exclude the impact of purchased condensate. Condensate is blended with the heavy oil to reduce its thickness in order to transport it to market. Our Netback calculation is aligned with the definition found in the Canadian Oil and Gas Evaluation Handbook. The reconciliation of the financial components of each Netback to Operating Margin can be found in our quarterly and annual Management’s Discussion and Analysis. |
| (3) | Natural gas volumes have been converted to BOE on the basis of six Mcf to one bbl. BOE may be misleading, particularly if used in isolation. A conversion ratio of one bbl to six Mcf is based on an energy equivalency conversion method primarily applicable at the burner tip and does not represent value equivalency at the wellhead. Given that the value ratio based on the current price of crude oil compared to natural gas is significantly different from the energy equivalency conversion ratio of 6:1, utilizing a conversion on a 6:1 basis is not an accurate reflection of value. |
| Supplemental Information | ||||
| Cenovus Energy Inc. | 3 | for the period ended December 31, 2017 |
SUPPLEMENTAL INFORMATION(unaudited)
Operating Statistics - Before Royalties (continued)
| 2017 | 2016 | |||||||||||||||||||||||
Conventional (Discontinued Operations) Netbacks(1)(Excluding Realized Gain (Loss) on Risk Management) | Year | Q4 | Q3 | Q2 | Q1 | Year | ||||||||||||||||||
Heavy Oil - Conventional($/bbl) | ||||||||||||||||||||||||
Sales Price | 48.46 | 58.93 | 48.01 | 46.67 | 47.77 | 35.82 | ||||||||||||||||||
Royalties | 6.41 | 3.10 | 7.04 | 6.15 | 7.03 | 3.31 | ||||||||||||||||||
Transportation and Blending | 4.44 | 4.49 | 5.45 | 4.48 | 3.40 | 4.60 | ||||||||||||||||||
Operating | 14.85 | 20.64 | 15.50 | 14.56 | 12.86 | 13.38 | ||||||||||||||||||
Production and Mineral Taxes | 0.02 | 0.05 | 0.01 | 0.01 | 0.02 | 0.01 | ||||||||||||||||||
Netback | 22.74 | 30.65 | 20.01 | 21.47 | 24.46 | 14.52 | ||||||||||||||||||
Light and Medium Oil($/bbl) | ||||||||||||||||||||||||
Sales Price | 56.19 | 61.24 | 51.91 | 56.40 | 56.84 | 46.48 | ||||||||||||||||||
Royalties | 11.96 | 13.99 | 10.22 | 11.58 | 12.75 | 9.28 | ||||||||||||||||||
Transportation and Blending | 2.76 | 2.64 | 2.85 | 2.82 | 2.70 | 2.73 | ||||||||||||||||||
Operating | 17.03 | 18.47 | 17.19 | 16.08 | 16.77 | 15.65 | ||||||||||||||||||
Production and Mineral Taxes | 1.87 | 2.29 | 1.54 | 1.85 | 1.95 | 1.24 | ||||||||||||||||||
Netback | 22.57 | 23.85 | 20.11 | 24.07 | 22.67 | 17.58 | ||||||||||||||||||
Natural Gas Liquids($/bbl) | ||||||||||||||||||||||||
Sales Price | 44.36 | 52.16 | 38.12 | 41.06 | 48.35 | 31.16 | ||||||||||||||||||
Royalties | 5.71 | 6.77 | 4.66 | 5.32 | 6.42 | 4.21 | ||||||||||||||||||
Netback | 38.65 | 45.39 | 33.46 | 35.74 | 41.93 | 26.95 | ||||||||||||||||||
Natural Gas($/Mcf) | ||||||||||||||||||||||||
Sales Price | 2.47 | 2.05 | 1.94 | 2.80 | 3.00 | 2.33 | ||||||||||||||||||
Royalties | 0.12 | 0.08 | 0.10 | 0.14 | 0.14 | 0.10 | ||||||||||||||||||
Transportation and Blending | 0.10 | 0.09 | 0.11 | 0.08 | 0.13 | 0.11 | ||||||||||||||||||
Operating | 1.25 | 1.37 | 1.19 | 1.15 | 1.31 | 1.12 | ||||||||||||||||||
Production and Mineral Taxes | 0.01 | - | 0.01 | 0.01 | 0.02 | - | ||||||||||||||||||
Netback | 0.99 | 0.51 | 0.53 | 1.42 | 1.40 | 1.00 | ||||||||||||||||||
Total Conventional(2)($/BOE) | ||||||||||||||||||||||||
Sales Price | 32.10 | 30.08 | 29.94 | 33.53 | 34.19 | 26.54 | ||||||||||||||||||
Royalties | 4.65 | 4.27 | 4.45 | 4.69 | 5.07 | 3.18 | ||||||||||||||||||
Transportation and Blending | 1.93 | 1.48 | 2.26 | 2.00 | 1.82 | 2.08 | ||||||||||||||||||
Operating | 11.25 | 12.02 | 11.38 | 10.85 | 10.99 | 10.23 | ||||||||||||||||||
Production and Mineral Taxes | 0.49 | 0.60 | 0.42 | 0.47 | 0.51 | 0.27 | ||||||||||||||||||
Netback | 13.78 | 11.71 | 11.43 | 15.52 | 15.80 | 10.78 | ||||||||||||||||||
| 2017 | 2016 | |||||||||||||||||||||||
| Consolidated Netbacks(1)(Excluding Realized Gain (Loss) on Risk Management) | Year | Q4 | Q3 | Q2 | Q1 | Year | ||||||||||||||||||
Total Consolidated(2)($/BOE) | ||||||||||||||||||||||||
Sales Price | 35.80 | 38.01 | 33.71 | 35.58 | 36.37 | 27.01 | ||||||||||||||||||
Royalties | 2.64 | 3.31 | 2.08 | 2.34 | 3.06 | 1.49 | ||||||||||||||||||
Transportation and Blending | 4.65 | 4.87 | 4.56 | 4.78 | 4.20 | 4.56 | ||||||||||||||||||
Operating | 9.08 | 8.84 | 8.59 | 9.59 | 9.80 | 9.51 | ||||||||||||||||||
Production and Mineral Taxes | 0.11 | 0.09 | 0.08 | 0.13 | 0.20 | 0.12 | ||||||||||||||||||
Netback | 19.32 | 20.90 | 18.40 | 18.74 | 19.11 | 11.33 | ||||||||||||||||||
| 2017 | 2016 | |||||||||||||||||||||||
| Realized Gain (Loss) on Risk Management | Year | Q4 | Q3 | Q2 | Q1 | Year | ||||||||||||||||||
Total Crude Oil($/bbl) | (2.83) | (7.38) | (0.37) | 0.39 | (4.55) | 3.24 | ||||||||||||||||||
Total Production(2)($/BOE) | (2.02) | (5.09) | (0.24) | 0.28 | (3.56) | 2.44 | ||||||||||||||||||
| 2017 | 2016 | |||||||||||||||||||||||
| Refinery Operations(3) | Year | Q4 | Q3 | Q2 | Q1 | Year | ||||||||||||||||||
Crude Oil Capacity(Mbbls/d) | 460 | 460 | 460 | 460 | 460 | 460 | ||||||||||||||||||
Crude Oil Runs(Mbbls/d) | 442 | 450 | 462 | 449 | 406 | 444 | ||||||||||||||||||
Heavy Oil | 202 | 195 | 213 | 201 | 200 | 233 | ||||||||||||||||||
Light/Medium | 240 | 255 | 249 | 248 | 206 | 211 | ||||||||||||||||||
Crude Utilization | 96% | 98% | 100% | 98% | 88% | 97% | ||||||||||||||||||
Refined Products(Mbbls/d) | 470 | 480 | 490 | 476 | 433 | 471 | ||||||||||||||||||
| (1) | Netback is anon-GAAP measure commonly used in the oil and gas industry to assist in measuring operating performance on aper-unit basis. Netbacks reflect our margin on aper-barrel basis of unblended crude oil. Netback is defined as gross sales less royalties, transportation and blending, operating expenses and production and mineral taxes divided by sales volumes. Netbacks do not reflect thenon-cash write-downs of product inventory until the product is sold. The crude oil sales price, transportation and blending costs, and sales volumes exclude the impact of purchased condensate. Condensate is blended with the heavy oil to reduce its thickness in order to transport it to market. Our Netback calculation is aligned with the definition found in the Canadian Oil and Gas Evaluation Handbook. The reconciliation of the financial components of each Netback to Operating Margin can be found in our quarterly and annual Management’s Discussion and Analysis. |
| (2) | Natural gas volumes have been converted to BOE on the basis of six Mcf to one bbl. BOE may be misleading, particularly if used in isolation. A conversion ratio of one bbl to six Mcf is based on an energy equivalency conversion method primarily applicable at the burner tip and does not represent value equivalency at the wellhead. Given that the value ratio based on the current price of crude oil compared to natural gas is significantly different from the energy equivalency conversion ratio of 6:1, utilizing a conversion on a 6:1 basis is not an accurate reflection of value. |
| (3) | Represents 100% of the Wood River and Borger refinery operations. |
| Supplemental Information | ||||
| Cenovus Energy Inc. | 4 | for the period ended December 31, 2017 |