Exhibit 99.2

Management’s Discussion and Analysis
For the PERIOD ended June 30, 2019
This Management’s Discussion and Analysis (“MD&A”) for Cenovus Energy Inc. (which includes references to “we”, “our”, “us”, “its”, the “Company”, or “Cenovus”, and means Cenovus Energy Inc., the subsidiaries of, and partnership interests held by, Cenovus Energy Inc. and its subsidiaries) dated July 24, 2019, should be read in conjunction with our June 30, 2019 unaudited interim Consolidated Financial Statements and accompanying notes (“interim Consolidated Financial Statements”), the December 31, 2018 audited Consolidated Financial Statements and accompanying notes (“Consolidated Financial Statements”) and the December 31, 2018 MD&A (“annual MD&A”). All of the information and statements contained in this MD&A are made as of July 24, 2019, unless otherwise indicated. This MD&A provides an update to our annual MD&A and contains forward-looking information about our current expectations, estimates, projections and assumptions. See the Advisory for information on the risk factors that could cause actual results to differ materially and the assumptions underlying our forward-looking information. Cenovus management (“Management”) prepared the MD&A. The interim MD&As are approved by the Audit Committee of the Cenovus Board of Directors (the “Board”) and the annual MD&A is reviewed by the Audit Committee and recommended for approval by the Board. Additional information about Cenovus, including our quarterly and annual reports, the Annual Information Form (“AIF”) and Form 40-F, is available on SEDAR at sedar.com, on EDGAR at sec.gov, and on our website at cenovus.com. Information on or connected to our website, even if referred to in this MD&A, does not constitute part of this MD&A.
Basis of Presentation
This MD&A and the interim Consolidated Financial Statements and comparative information have been prepared in Canadian dollars, (which includes references to “dollar” or “$”), except where another currency has been indicated, and in accordance with International Financial Reporting Standards (“IFRS” or “GAAP”) as issued by the International Accounting Standards Board (“IASB”). Production volumes are presented on a before royalties basis. We adopted IFRS 16, “Leases” (“IFRS 16”), effective January 1, 2019 using the modified retrospective approach; therefore, comparative information has not been restated. Refer to the Critical Accounting Judgments, Estimation Uncertainties and Accounting Policies section of this MD&A for further information.
Non-GAAP Measures and Additional Subtotals
Certain financial measures in this document do not have a standardized meaning as prescribed by IFRS, such as Netbacks, Adjusted Funds Flow, Operating Earnings, Free Funds Flow, Debt, Net Debt, Capitalization and Adjusted Earnings Before Interest, Taxes, Depreciation and Amortization (“Adjusted EBITDA”) and therefore are considered non-GAAP measures. In addition, Operating Margin is considered an additional subtotal found in Notes 1 and 7 of our interim Consolidated Financial Statements. These measures may not be comparable to similar measures presented by other issuers. These measures have been described and presented in order to provide shareholders and potential investors with additional measures for analyzing our ability to generate funds to finance our operations and information regarding our liquidity. This additional information should not be considered in isolation or as a substitute for measures prepared in accordance with IFRS.
The definition and reconciliation, if applicable, of each non-GAAP measure or additional subtotal is presented in the Operating Results, Financial Results, Liquidity and Capital Resources, or Advisory sections of this MD&A.
Cenovus Energy Inc. – Q2 2019 Management’s Discussion and Analysis | | 1 |
| | |
OVERVIEW OF CENOVUS
We are a Canadian integrated oil company headquartered in Calgary, Alberta, with our shares listed on the Toronto and New York stock exchanges. On June 30, 2019, we had an enterprise value of approximately $22 billion. Operations include oil sands projects in northeast Alberta and established crude oil, natural gas liquids (“NGLs”) and natural gas production in Alberta and British Columbia. Total production from our upstream assets averaged approximately 443,000 BOE per day for the three months ended June 30, 2019. We also conduct marketing activities and have ownership interest in refining operations in the United States (“U.S.”). The refineries processed an average of 474,000 gross barrels per day of crude oil feedstock into an average of 501,000 gross barrels per day of refined products in the three months ended June 30, 2019.
Our strategy is focused on maximizing shareholder value through cost leadership and realizing the best margins for our products. We believe that maintaining a strong balance sheet will help Cenovus navigate through commodity price volatility and give us the flexibility to proceed with opportunities at all points in the price cycle. We aim to evaluate disciplined investment in our portfolio against dividend increases, share repurchases and maintaining the optimal debt level while retaining investment grade status. Our investment focus will be on areas where we believe we have the greatest competitive advantage. We plan to achieve our strategy by leveraging our strategic focus areas including oil sands, conventional oil and natural gas assets, marketing, transportation and refining portfolio, and our people.
For a description of our operations, refer to the Reportable Segments section of this MD&A.
QUARTERLY HIGHLIGHTS
Cenovus delivered solid operating and financial results in the second quarter of 2019 and made significant progress on further deleveraging the balance sheet. We repurchased US$814 million of our unsecured notes during the quarter and US$1.3 billion since the beginning of the year.
Our upstream operational performance was solid during the quarter with production averaging 443,318 BOE per day, restricted by the Government of Alberta’s mandatory production curtailment program and the planned turnaround completed at Christina Lake.
Refining and Marketing operations were solid with improved crude oil runs in second quarter of 2019 compared with 2018, despite unplanned outages at both the Wood River and Borger refineries (“the Refineries”). Our Refining and Marketing segment generated operating margin of $198 million down from the second quarter of 2018, due to lower crude advantage and higher operating costs, partially offset by higher crack spreads.
With market access constraints for Canadian crude oil production continuing to be a challenge, we have made good progress on our strategy to maintain firm transportation through a combination of pipelines, rail and marine access. In the second quarter of 2019, we received approximately one-third of the railcars under the agreements signed in late 2018. Delivery will continue through 2019, in line with our expected ramp up to 100,000 barrels per day shipped by rail. We have also secured additional storage capacity in the U.S. Gulf Coast to support the ramp up of our crude-by-rail activity.
Average Brent and West Texas Intermediate (“WTI”) benchmark prices were lower than the second quarter of 2018. At the same time, the differential between WTI and Western Canadian Select ("WCS") benchmark prices narrowed 45 percent, supported by the Government of Alberta’s mandatory production curtailment program. As a result, WCS benchmark crude oil prices remained relatively flat, averaging US$49.18 per barrel in the second quarter of 2019 compared with US$48.61 per barrel in the same period of 2018. Our realized crude oil sales price rose to $62.75 per barrel as a result of the higher WCS price along with lower cost of condensate due to lower condensate benchmark prices compared with the second quarter of 2018.
In the second quarter of 2019, we:
• | Achieved Cash from Operating Activities of $1,275 million and Adjusted Funds Flow of $1,082 million, a significant increase from the second quarter of 2018; |
• | Repurchased US$814 million of our unsecured notes, reducing total debt to US$5.5 billion ($7.2 billion), driven by Free Funds Flow of $834 million; |
• | Achieved Net Debt of $7.1 billion; |
• | Recorded Net Earnings from continuing operations of $1,784 million (2018 – Net Loss of $410 million) including one-time deferred tax recoveries related to the Alberta corporate tax rate change and a tax basis increase related to our refining assets and realized risk management losses of $52 million compared with $697 million in 2018; |
• | Used our fleet of leased railcars to transport an average of 34,519 barrels per day by rail to sales locations outside of Alberta, allowing us to capture higher market prices; |
• | Earned an average companywide Netback from continuing operations of $32.14 per BOE, before realized hedging; |
Cenovus Energy Inc. – Q2 2019 Management’s Discussion and Analysis | | 2 |
| | |
• | Increased rail loading activity at our Bruderheim crude-by-rail terminal averaging 53,539 barrels per day, which partially cleared pipeline constrained barrels in Alberta; and |
• | Invested $248 million on sustaining capital, yield enhancement, rail initiatives and infrastructure, office space and information technology. |
OPERATING RESULTS
Upstream Production Volumes
| Three Months Ended June 30, | | | Six Months Ended June 30, | |
| 2019 | | | Percent Change | | | 2018 | | | 2019 | | | Percent Change | | | 2018 | |
Continuing Operations | | | | | | | | | | | | | | | | | | | | | | | |
Liquids (barrels per day) | | | | | | | | | | | | | | | | | | | | | | | |
Oil Sands | | | | | | | | | | | | | | | | | | | | | | | |
Foster Creek | | 165,953 | | | | (3 | ) | | | 171,079 | | | | 160,087 | | | | (3 | ) | | | 164,273 | |
Christina Lake | | 179,020 | | | | (18 | ) | | | 218,299 | | | | 183,895 | | | | (13 | ) | | | 210,332 | |
| | 344,973 | | | | (11 | ) | | | 389,378 | | | | 343,982 | | | | (8 | ) | | | 374,605 | |
Deep Basin | | | | | | | | | | | | | | | | | | | | | | | |
Crude Oil | | 4,904 | | | | (22 | ) | | | 6,263 | | | | 4,862 | | | | (24 | ) | | | 6,389 | |
NGLs | | 21,513 | | | | (23 | ) | | | 27,778 | | | | 22,344 | | | | (21 | ) | | | 28,367 | |
| | 26,417 | | | | (22 | ) | | | 34,041 | | | | 27,206 | | | | (22 | ) | | | 34,756 | |
| | | | | | | | | | | | | | | | | | | | | | | |
Liquids Production (barrels per day) | | 371,390 | | | | (12 | ) | | | 423,419 | | | | 371,188 | | | | (9 | ) | | | 409,361 | |
| | | | | | | | | | | | | | | | | | | | | | | |
Natural Gas (MMcf per day) | | | | | | | | | | | | | | | | | | | | | | | |
Oil Sands | | - | | | | (100 | ) | | | 1 | | | | - | | | | (100 | ) | | | 2 | |
Deep Basin (1) | | 432 | | | | (24 | ) | | | 570 | | | | 445 | | | | (21 | ) | | | 560 | |
| | 432 | | | | (24 | ) | | | 571 | | | | 445 | | | | (21 | ) | | | 562 | |
| | | | | | | | | | | | | | | | | | | | | | | |
Production From Continuing Operations (BOE per day) | | 443,318 | | | | (15 | ) | | | 518,530 | | | | 445,283 | | | | (11 | ) | | | 503,083 | |
| | | | | | | | | | | | | | | | | | | | | | | |
Production From Discontinued Operations (Conventional) (BOE per day) | | - | | | | (100 | ) | | | 79 | | | | - | | | | (100 | ) | | | 585 | |
| | | | | | | | | | | | | | | | | | | | | | | |
Total Production (BOE per day) | | 443,318 | | | | (15 | ) | | | 518,609 | | | | 445,283 | | | | (12 | ) | | | 503,668 | |
(1) | Includes production used for internal consumption by the Oil Sands segment of 319 MMcf per day, for both the three and six months ended June 30, 2019 (2018 – 300 MMcf per day and 311 MMcf per day, respectively). |
Overall, production for the three and six months ended June 30, 2019 was in line with production limits set by the Government of Alberta. Oil Sands production for the three and six months ended June 30, 2019 was limited due to mandatory production curtailments and a planned turnaround at Christina Lake. During the quarter, production decreased by 7,665 barrels per day due to the turnaround, minimized by additional plant capacity from the Christina Lake phase G facility and production capability from Foster Creek. In 2018, Oil Sands production was impacted by our decision to reduce producing well rates in the first quarter due to pipeline capacity constraints and discounted heavy oil prices and the subsequent ramp up of production in the second quarter as differentials narrowed.
Deep Basin production for the three months ended June 30, 2019 averaged 98,345 BOE per day compared with 129,066 BOE per day in the second quarter of 2018 due to lower sustaining capital investment, the divestiture of Cenovus Pipestone Partnership (“CPP”) on September 6, 2018, natural declines and a temporary shut-in to manage low gas prices. This was partially offset by less downtime in the second quarter of 2019 compared with 2018. Deep Basin production for the six months ended June 30, 2019 decreased by 21 percent to 101,301 BOE per day compared with 2018 due to lower sustaining capital investment, the divestiture of CPP and natural declines, partially offset by less downtime.
Cenovus Energy Inc. – Q2 2019 Management’s Discussion and Analysis | | 3 |
| | |
Netbacks From Continuing Operations
Netback is a non-GAAP measure commonly used in the oil and gas industry to assist in measuring operating performance on a per-unit basis, and is defined in the Canadian Oil and Gas Evaluation Handbook. Netbacks reflect our margin on a per-barrel of oil equivalent basis. Netback is defined as gross sales less royalties, transportation and blending, operating expenses and production and mineral taxes divided by sales volumes. Netbacks do not reflect the non-cash writedowns of product inventory until the product is sold. The sales price, transportation and blending costs, and sales volumes exclude the impact of purchased condensate. Condensate is blended with the heavy oil to reduce its thickness in order to transport it to market. Our Netback calculation is aligned with the definition found in the Canadian Oil and Gas Evaluation Handbook. For a reconciliation of our Netbacks see the Advisory section of this MD&A.
| Three Months Ended June 30, | | | Six Months Ended June 30, | |
($/BOE) | 2019 | | | 2018 (2) | | | 2019 | | | 2018 (2) | |
Sales Price | | 58.22 | | | | 46.87 | | | | 52.50 | | | | 40.30 | |
Royalties | | 9.24 | | | | 4.55 | | | | 7.42 | | | | 3.49 | |
Transportation and Blending | | 7.76 | | | | 5.59 | | | | 7.10 | | | | 5.86 | |
Operating Expenses | | 9.07 | | | | 7.66 | | | | 8.55 | | | | 7.77 | |
Production and Mineral Taxes | | 0.01 | | | | 0.01 | | | | 0.01 | | | | 0.01 | |
Netback Excluding Realized Risk Management (1) | | 32.14 | | | | 29.06 | | | | 29.42 | | | | 23.17 | |
Realized Risk Management Gain (Loss) | | (1.62 | ) | | | (16.27 | ) | | | (0.65 | ) | | | (14.07 | ) |
Netback Including Realized Risk Management (1) | | 30.52 | | | | 12.79 | | | | 28.77 | | | | 9.10 | |
(1) | Excludes results from our Conventional segment, which has been classified as a discontinued operation. Excludes intersegment sales. |
(2) | IFRS 16 was adopted January 1, 2019 using the modified retrospective approach; therefore, comparative information has not been restated. Refer to the Critical Accounting Judgments, Estimation Uncertainties and Accounting Policies section in this MD&A. |
Our average Netback, excluding realized risk management gains and losses, increased in the second quarter of 2019 and on a year-to-date basis, compared with 2018, primarily due to higher realized sales prices and lower transportation and blending costs, partially offset by higher royalties, higher per-unit operating costs and lower sales volumes. Higher royalties were driven by higher prices and our Christina Lake property achieving payout in the third quarter of 2018. On a quarterly and year-to-date basis, the weakening of the Canadian dollar relative to the U.S. dollar compared with 2018 had a positive impact on our reported sales price of approximately $2.03 per BOE and $2.21 per BOE, respectively.
Refining and Marketing
In the second quarter of 2019, both refineries demonstrated good operational performance with crude utilization rates averaging 98 percent. Wood River was impacted by pipeline outages and flooding on the Mississippi River, which resulted in the reduction of throughput to manage finished product inventories. On a year-to-date basis, crude oil runs and refined product output increased as planned and unplanned maintenance in 2019, including a fire in a crude unit at Wood River in the first quarter of 2019, had less of an impact than major planned turnarounds completed at both Refineries in the first quarter of 2018.
| Three Months Ended June 30, | | | Six Months Ended June 30, | |
| 2019 | | | Percent Change | | | 2018 | | | 2019 | | | Percent Change | | | 2018 | |
Crude Oil Capacity (Mbbls/d) | | 482 | | | | 5 | | | | 460 | | | | 482 | | | | 5 | | | | 460 | |
Crude Oil Runs (1) (Mbbls/d) | | 474 | | | | 2 | | | | 464 | | | | 425 | | | | 4 | | | | 407 | |
Heavy Crude Oil (1) | | 194 | | | | (4 | ) | | | 203 | | | | 168 | | | | (8 | ) | | | 183 | |
Refined Product (1) (Mbbls/d) | | 501 | | | | 2 | | | | 490 | | | | 451 | | | | 5 | | | | 430 | |
Crude Utilization (1) (percent) | | 98 | | | | (3 | ) | | | 101 | | | | 88 | | | | - | | | | 88 | |
Operating Margin (2) ($ millions) | | 198 | | | | (45 | ) | | | 357 | | | | 502 | | | | 62 | | | | 309 | |
(1) | Represents 100 percent of the Wood River and Borger refinery operations. Cenovus’s interest is 50 percent. |
(2) | IFRS 16 was adopted January 1, 2019 using the modified retrospective approach; therefore, comparative information has not been restated. Refer to the Critical Accounting Judgments, Estimation Uncertainties and Accounting Policies section of this MD&A. |
We continue to increase total rail volumes loaded at our Bruderheim crude-by-rail terminal. In the three months ended June 30, 2019, we loaded an average of 53,539 barrels per day at our Bruderheim crude-by-rail terminal compared with an average of 21,756 barrels per day in the second quarter of 2018.
Operating Margin from the Refining and Marketing segment in the three and six months ended June 30, 2019 was $198 million and $502 million, respectively (2018 – $357 million and $309 million, respectively). Our Operating Margin in the second quarter of 2019 decreased compared with 2018 due to lower crude advantage from narrowing heavy and medium sour crude oil differentials, and higher operating costs related to labour and unplanned maintenance at both Refineries. Operating margin improved significantly year-over-year, primarily due to lower operating expenses as a result of major planned turnarounds at both Refineries in the first quarter of 2018, higher
Cenovus Energy Inc. – Q2 2019 Management’s Discussion and Analysis | | 4 |
| | |
market crack spreads, higher margins on fixed priced products due to a lower benchmark WTI, and a reduction in the cost of Renewable Identification Numbers (“RINs”), partially offset by a reduced crude advantage from narrowing heavy and medium sour crude oil differentials.
Further information on the changes in our production volumes and other items included in our Netbacks, and refining results can be found in the Reportable Segments section of this MD&A. Further information on our risk management activities can be found in the Risk Management and Risk Factors section of this MD&A and in the notes to the interim Consolidated Financial Statements.
COMMODITY PRICES UNDERLYING OUR FINANCIAL RESULTS
Key performance drivers for our financial results include commodity prices, price differentials, refining crack spreads as well as the U.S./Canadian dollar exchange rate. The following table shows selected market benchmark prices and the U.S./Canadian dollar average exchange rates to assist in understanding our financial results.
Selected Benchmark Prices and Exchange Rates (1)
| Six Months Ended June 30, | | | | | | | | | | | | | |
(US$/bbl, unless otherwise indicated) | 2019 | | | Percent Change | | | 2018 | | | Q2 2019 | | | Q1 2019 | | | Q2 2018 | |
Brent | | | | | | | | | | | | | | | | | | | | | | | |
Average | | 66.13 | | | | (7 | ) | | | 71.04 | | | | 68.34 | | | | 63.88 | | | | 74.91 | |
End of Period | | 66.55 | | | | (16 | ) | | | 79.44 | | | | 66.55 | | | | 68.39 | | | | 79.44 | |
WTI | | | | | | | | | | | | | | | | | | | | | | | |
Average | | 57.38 | | | | (12 | ) | | | 65.37 | | | | 59.83 | | | | 54.90 | | | | 67.88 | |
End of Period | | 58.47 | | | | (21 | ) | | | 74.15 | | | | 58.47 | | | | 60.14 | | | | 74.15 | |
Average Differential Brent-WTI | | 8.75 | | | | 54 | | | | 5.67 | | | | 8.51 | | | | 8.98 | | | | 7.03 | |
WCS | | | | | | | | | | | | | | | | | | | | | | | |
Average | | 45.87 | | | | 5 | | | | 43.60 | | | | 49.18 | | | | 42.53 | | | | 48.61 | |
Average (C$/bbl) | | 61.22 | | | | 10 | | | | 55.70 | | | | 65.80 | | | | 56.58 | | | | 62.75 | |
End of Period | | 45.48 | | | | (11 | ) | | | 51.32 | | | | 45.48 | | | | 50.97 | | | | 51.32 | |
Average Differential WTI-WCS | | 11.51 | | | | (47 | ) | | | 21.77 | | | | 10.65 | | | | 12.37 | | | | 19.27 | |
West Texas Sour (“WTS”) | | | | | | | | | | | | | | | | | | | | | | | |
Average | | 55.96 | | | | (8 | ) | | | 60.55 | | | | 58.18 | | | | 53.71 | | | | 59.64 | |
End of Period | | 58.37 | | | | (6 | ) | | | 62.05 | | | | 58.37 | | | | 61.09 | | | | 62.05 | |
Average Differential WTI-WTS | | 1.42 | | | | (71 | ) | | | 4.82 | | | | 1.65 | | | | 1.19 | | | | 8.24 | |
Condensate (C5 @ Edmonton) | | | | | | | | | | | | | | | | | | | | | | | |
Average | | 53.20 | | | | (19 | ) | | | 65.93 | | | | 55.87 | | | | 50.50 | | | | 68.83 | |
Average (C$/bbl) | | 70.96 | | | | (16 | ) | | | 84.20 | | | | 74.74 | | | | 67.15 | | | | 88.81 | |
Average Differential WTI-Condensate (Premium)/Discount | | 4.18 | | | | (846 | ) | | | (0.56 | ) | | | 3.96 | | | | 4.40 | | | | (0.95 | ) |
Average Differential WCS-Condensate (Premium)/Discount | | (7.33 | ) | | | (67 | ) | | | (22.33 | ) | | | (6.69 | ) | | | (7.97 | ) | | | (20.22 | ) |
Mixed Sweet Blend (“MSW” @ Edmonton) | | | | | | | | | | | | | | | | | | | | | | | |
Average | | 52.61 | | | | (12 | ) | | | 59.70 | | | | 55.21 | | | | 49.99 | | | | 62.42 | |
Average (C$/bbl) | | 70.19 | | | | (8 | ) | | | 76.25 | | | | 73.87 | | | | 66.48 | | | | 80.54 | |
End of Period | | 52.48 | | | | (18 | ) | | | 64.32 | | | | 52.48 | | | | 55.52 | | | | 64.32 | |
Average Refined Product Prices | | | | | | | | | | | | | | | | | | | | | | | |
Chicago Regular Unleaded Gasoline (“RUL”) | | 72.72 | | | | (8 | ) | | | 79.04 | | | | 81.23 | | | | 64.15 | | | | 85.00 | |
Chicago Ultra-low Sulphur Diesel (“ULSD”) | | 79.19 | | | | (7 | ) | | | 85.21 | | | | 81.29 | | | | 77.10 | | | | 89.07 | |
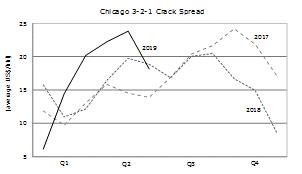
Refining Margin: Average 3-2-1 Crack Spreads (2) | | | | | | | | | | | | | | | | | | | | | | | |
Chicago | | 17.52 | | | | 12 | | | | 15.66 | | | | 21.44 | | | | 13.57 | | | | 18.36 | |
Group 3 | | 17.41 | | | | 3 | | | | 16.85 | | | | 19.99 | | | | 14.80 | | | | 18.04 | |
Average Natural Gas Prices | | | | | | | | | | | | | | | | | | | | | | | |
AECO (3) (C$/Mcf) | | 1.55 | | | | 8 | | | | 1.44 | | | | 1.17 | | | | 1.94 | | | | 1.03 | |
NYMEX (US$/Mcf) | | 2.89 | | | | - | | | | 2.90 | | | | 2.64 | | | | 3.15 | | | | 2.80 | |
Basis Differential NYMEX-AECO (US$/Mcf) | | 1.73 | | | | (2 | ) | | | 1.76 | | | | 1.76 | | | | 1.69 | | | | 2.00 | |
Foreign Exchange Rate (US$ per C$1) | | | | | | | | | | | | | | | | | | | | | | | |
Average | | 0.750 | | | | (4 | ) | | | 0.783 | | | | 0.748 | | | | 0.752 | | | | 0.775 | |
End of Period | | 0.764 | | | | 1 | | | | 0.759 | | | | 0.764 | | | | 0.748 | | | | 0.759 | |
(1) | These benchmark prices are not our realized sales prices. For our average realized sales prices and realized risk management results, refer to the Netbacks tables in the Operating Results and Reportable Segments sections of this MD&A. |
(2) | The average 3-2-1 Crack Spread is an indicator of the refining margin and is valued on a last in, first out accounting basis. |
(3) | Alberta Energy Company (“AECO”) natural gas monthly index. |
Cenovus Energy Inc. – Q2 2019 Management’s Discussion and Analysis | | 5 |
| | |
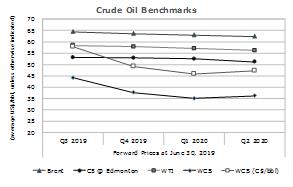
Crude Oil Benchmarks
The average Brent and WTI crude oil benchmark prices were lower compared with the second quarter of 2018. Continued uncertainty from oversupply and decreased demand for crude oil due to U.S.-China trade tensions lowered crude oil benchmark pricing. Global prices continued to be supported by the Organization of the Petroleum Exporting Countries (“OPEC”) led production cuts over the first six months of 2019 compared with the same period of 2018. Crude oil prices were further supported by turmoil in Venezuela that reduced the country’s crude oil supply. The decrease of crude oil supply from Venezuela coupled with OPEC cuts, which are predominately medium and heavy weighted crudes, reduced heavy crude supply globally causing WCS prices in the U.S. Gulf Coast to strengthen from the first quarter of 2019.
WTI is an important benchmark for Canadian crude oil since it reflects inland North American crude oil prices and the Canadian dollar equivalent is the basis for determining royalty rates for a number of our crude oil properties. In the second quarter of 2019, the Brent-WTI differential increased compared with 2018 as a result of increasing U.S. supply and inventory builds exceeding pipeline takeaway capacity at Cushing, Oklahoma.
WCS is blended heavy oil which consists of both conventional heavy oil and unconventional diluted bitumen. The average WTI-WCS differential narrowed in the second quarter of 2019 and on a year-to-date basis compared with 2018. Heavy oil differentials have narrowed in 2019 in response to production curtailments mandated by the Government of Alberta to address record high differentials in the fourth quarter of 2018 and high levels of crude oil in storage. Decreased production due to mandatory curtailments continues to support Alberta benchmark prices.
WTS is an important North American crude oil benchmark, representing the heavier, more sour counterpart to WTI crude oil, and is a primary component of the input feedstock at the Borger refinery. The differential between WTI and WTS benchmark prices narrowed in 2019 compared with 2018, due to additional pipeline capacity coming online, helping to debottleneck the Permian Basin.
Blending condensate with bitumen enables our production to be transported through pipelines. Our blending ratios, diluent volumes as a percentage of total blended volumes, range from approximately 25 percent to 33 percent. The WCS-Condensate differential is an important benchmark as a narrower differential generally results in an increase in the recovery of condensate costs when selling a barrel of blended crude oil. When the supply of condensate in Alberta does not meet the demand, Edmonton condensate prices may be driven by U.S. Gulf Coast condensate prices plus the cost to transport the condensate to Edmonton.
Average condensate benchmark prices were discounted relative to WTI in the second quarter of 2019 and on a year-to-date basis compared with a premium in the same periods of 2018 due to increasing domestic supply and lower demand as production curtailments were implemented.
MSW is an Alberta based light sweet crude oil benchmark that is representative of Canadian conventional production, comparable to the crude oil produced by our Deep Basin assets. The average MSW benchmark price declined in the second quarter of 2019 compared with 2018, consistent with the general decrease in average crude oil prices.
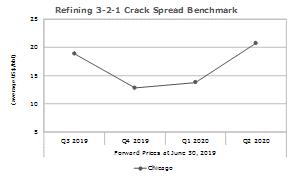
Refining Benchmarks
The Chicago Regular Unleaded Gasoline (“RUL”) and Chicago Ultra-low Sulphur Diesel (“ULSD”) benchmark prices are representative of inland refined product prices and are used to derive the Chicago 3-2-1 market crack spread. The 3‑2‑1 market crack spread is an indicator of the refining margin generated by converting three barrels of crude oil into two barrels of regular unleaded gasoline and one barrel of ultra-low sulphur diesel using current month WTI‑based crude oil feedstock prices and valued on a last in, first out accounting basis.
Average Chicago refined product prices decreased on a year-to-date basis in 2019 compared with the same period of 2018 primarily due to lower global crude oil prices. As North American refining crack spreads are expressed on a WTI basis, while refined products are set by international prices, the strength of refining crack spreads in the U.S. Midwest and Midcontinent will reflect the differential between Brent and WTI benchmark prices. The widening of the
Cenovus Energy Inc. – Q2 2019 Management’s Discussion and Analysis | | 6 |
| | |
Chicago 3-2-1 and Group 3 crack spreads in 2019 can be primarily attributed to the widening of the Brent-WTI differential, as discussed above.
Our realized crack spreads are affected by many other factors such as the variety of crude oil feedstock, refinery configuration and product output, the time lag between the purchase and delivery of crude oil feedstock, and the cost of feedstock which is valued on a first in, first out (“FIFO”) accounting basis.
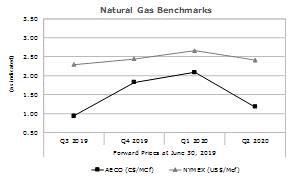
Natural Gas Benchmarks
Average AECO prices strengthened during the three and six months ended June 30, 2019 compared with 2018 due to strong weather induced demand and flat natural gas supply in Alberta. Average NYMEX prices were comparable with 2018 due to supply continuing to be high from the development of U.S. shale gas and natural gas associated with crude oil plays.
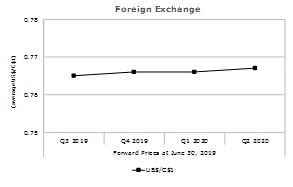
Foreign Exchange Benchmark
Our revenues are subject to foreign exchange exposure as the sales prices of our crude oil, NGLs, natural gas and refined products are determined by reference to U.S. benchmark prices. An increase in the value of the Canadian dollar compared with the U.S. dollar has a negative impact on our reported results. Likewise, as the Canadian dollar weakens, there is a positive impact on our reported results. In addition to our revenues being denominated in U.S. dollars, our long‑term debt is also U.S. dollar denominated. In periods of a strengthening Canadian dollar, our U.S. dollar debt gives rise to unrealized foreign exchange gains when translated to Canadian dollars.
The average Canadian dollar weakened relative to the U.S. dollar in 2019, compared with 2018, resulting in a positive impact of approximately $445 million on our revenues in the first half of the year. The strengthening of the Canadian dollar relative to the U.S. dollar as at June 30, 2019 compared with December 31, 2018, and the derecognition of unrealized foreign exchange losses, which were realized due to the repurchase of our unsecured notes, resulted in $628 million of unrealized foreign exchange gains on the translation of our U.S. dollar debt.
Cenovus Energy Inc. – Q2 2019 Management’s Discussion and Analysis | | 7 |
| | |
FINANCIAL RESULTS
Selected Consolidated Financial Results
In 2019, the impact of mandatory production curtailments, rising crude oil prices, higher refining throughput, and lower blending costs were the primary drivers of our financial results. The following key performance measures are discussed in more detail within this MD&A.
($ millions, except per share | Six Months Ended June 30, | | 2019 | | 2018 (5) | | 2017 (5) | |
amounts) | 2019 | | 2018 (5) | | Q2 | | Q1 | | Q4 | | Q3 | | Q2 | | Q1 | | Q4 | | Q3 | | Q2 | |
| | | | | | | | | | | | | | | | | | | | | | | | | | | | | | | | | |
Revenues | | 10,607 | | | 10,442 | | | 5,603 | | | 5,004 | | | 4,545 | | | 5,857 | | | 5,832 | | | 4,610 | | | 5,079 | | | 4,386 | | | 4,037 | |
Operating Margin (1) | | | | | | | | | | | | | | | | | | | | | | | | | | | | | | | | | |
From Continuing Operations | | 2,516 | | | 1,068 | | | 1,277 | | | 1,239 | | | 135 | | | 1,191 | | | 911 | | | 157 | | | 1,018 | | | 1,097 | | | 572 | |
| | | | | | | | | | | | | | | | | | | | | | | | | | | | | | | | | |
Total Operating Margin | | 2,516 | | | 1,107 | | | 1,277 | | | 1,239 | | | 132 | | | 1,192 | | | 938 | | | 169 | | | 1,088 | | | 1,214 | | | 731 | |
| | | | | | | | | | | | | | | | | | | | | | | | | | | | | | | | | |
Cash From Operating Activities | | | | | | | | | | | | | | | | | | | | | | | | | | | | | | | | | |
From Continuing Operations | | 1,711 | | | 372 | | | 1,275 | | | 436 | | | 488 | | | 1,258 | | | 506 | | | (134 | ) | | 833 | | | 481 | | | 1,102 | |
| | | | | | | | | | | | | | | | | | | | | | | | | | | | | | | | | |
Total Cash From Operating Activities | | 1,711 | | | 410 | | | 1,275 | | | 436 | | | 485 | | | 1,259 | | | 533 | | | (123 | ) | | 900 | | | 592 | | | 1,239 | |
| | | | | | | | | | | | | | | | | | | | | | | | | | | | | | | | | |
Adjusted Funds Flow (2) | | | | | | | | | | | | | | | | | | | | | | | | | | | | | | | | | |
From Continuing Operations | | 2,130 | | | 694 | | | 1,082 | | | 1,048 | | | (33 | ) | | 976 | | | 747 | | | (53 | ) | | 796 | | | 865 | | | 603 | |
| | | | | | | | | | | | | | | | | | | | | | | | | | | | | | | | | |
Total Adjusted Funds Flow | | 2,130 | | | 733 | | | 1,082 | | | 1,048 | | | (36 | ) | | 977 | | | 774 | | | (41 | ) | | 866 | | | 980 | | | 745 | |
| | | | | | | | | | | | | | | | | | | | | | | | | | | | | | | | | |
Operating Earnings (Loss) (2) | | | | | | | | | | | | | | | | | | | | | | | | | | | | | | | | | |
From Continuing Operations | | 336 | | | (1,044 | ) | | 267 | | | 69 | | | (1,670 | ) | | (41 | ) | | (292 | ) | | (752 | ) | | (533 | ) | | 240 | | | 298 | |
Per Share ($) (3) | | 0.27 | | | (0.85 | ) | | 0.22 | | | 0.06 | | | (1.36 | ) | | (0.03 | ) | | (0.24 | ) | | (0.61 | ) | | (0.43 | ) | | 0.20 | | | 0.27 | |
| | | | | | | | | | | | | | | | | | | | | | | | | | | | | | | | | |
Total Operating Earnings (Loss) | | 336 | | | (1,015 | ) | | 267 | | | 69 | | | (1,672 | ) | | (42 | ) | | (272 | ) | | (743 | ) | | (514 | ) | | 327 | | | 352 | |
Per Share ($) (3) | | 0.27 | | | (0.83 | ) | | 0.22 | | | 0.06 | | | (1.36 | ) | | (0.03 | ) | | (0.22 | ) | | (0.60 | ) | | (0.42 | ) | | 0.27 | | | 0.32 | |
| | | | | | | | | | | | | | | | | | | | | | | | | | | | | | | | | |
Net Earnings (Loss) | | | | | | | | | | | | | | | | | | | | | | | | | | | | | | | | | |
From Continuing Operations | | 1,894 | | | (1,324 | ) | | 1,784 | | | 110 | | | (1,350 | ) | | (242 | ) | | (410 | ) | | (914 | ) | | (776 | ) | | 275 | | | 2,558 | |
Per Share ($) (3) | | 1.54 | | | (1.08 | ) | | 1.45 | | | 0.09 | | | (1.10 | ) | | (0.20 | ) | | (0.33 | ) | | (0.74 | ) | | (0.63 | ) | | 0.22 | | | 2.30 | |
| | | | | | | | | | | | | | | | | | | | | | | | | | | | | | | | | |
Total Net Earnings (Loss) | | 1,894 | | | (1,072 | ) | | 1,784 | | | 110 | | | (1,356 | ) | | (241 | ) | | (418 | ) | | (654 | ) | | 620 | | | (82 | ) | | 2,617 | |
Per Share ($) (3) | | 1.54 | | | (0.87 | ) | | 1.45 | | | 0.09 | | | (1.10 | ) | | (0.20 | ) | | (0.34 | ) | | (0.53 | ) | | 0.50 | | | (0.07 | ) | | 2.35 | |
| | | | | | | | | | | | | | | | | | | | | | | | | | | | | | | | | |
Capital Investment (4) | | | | | | | | | | | | | | | | | | | | | | | | | | | | | | | | | |
From Continuing Operations | | 565 | | | 816 | | | 248 | | | 317 | | | 276 | | | 271 | | | 294 | | | 522 | | | 557 | | | 396 | | | 277 | |
| | | | | | | | | | | | | | | | | | | | | | | | | | | | | | | | | |
Total Capital Investment | | 565 | | | 816 | | | 248 | | | 317 | | | 276 | | | 271 | | | 292 | | | 524 | | | 583 | | | 438 | | | 327 | |
| | | | | | | | | | | | | | | | | | | | | | | | | | | | | | | | | |
Dividends | | 123 | | | 122 | | | 62 | | | 61 | | | 62 | | | 61 | | | 62 | | | 60 | | | 61 | | | 62 | | | 61 | |
Per Share ($) | | 0.10 | | | 0.10 | | | 0.05 | | | 0.05 | | | 0.05 | | | 0.05 | | | 0.05 | | | 0.05 | | | 0.05 | | | 0.05 | | | 0.05 | |
(1) | Additional subtotal found in Notes 1 and 7 of the interim Consolidated Financial Statements and defined in this MD&A. |
(2) | Non-GAAP measure defined in this MD&A. |
(3) | Represented on a basic and diluted per share basis. |
(4) | Includes expenditures on property, plant and equipment (“PP&E”), Exploration and Evaluation (“E&E”) assets and assets held for sale. |
(5) | IFRS 16 was adopted January 1, 2019 using the modified retrospective approach; therefore, comparative information has not been restated. Refer to the Critical Accounting Judgments, Estimation Uncertainties and Accounting Policies section in this MD&A. |
Revenues
($ millions) | Three Months Ended | | | Six Months Ended | |
Revenues for the Periods Ended June 30, 2018 | | 5,832 | | | | 10,442 | |
Increase (Decrease) due to: | | | | | | | |
Oil Sands | | (353 | ) | | | (451 | ) |
Deep Basin | | (85 | ) | | | (103 | ) |
Refining and Marketing | | 72 | | | | 529 | |
Corporate and Eliminations | | 137 | | | | 190 | |
Revenues for the Periods Ended June 30, 2019 | | 5,603 | | | | 10,607 | |
Upstream revenues decreased in 2019 compared with 2018 due to lower sales volumes and higher royalties, partially offset by higher realized pricing.
Refining and Marketing revenues rose three percent in the second quarter of 2019 compared with 2018 and increased 11 percent on a year-to-date basis. Refining revenues increased due to higher refined product output partially offset by lower refined product pricing. Revenues from third-party crude oil and natural gas sales
Cenovus Energy Inc. – Q2 2019 Management’s Discussion and Analysis | | 8 |
| | |
undertaken by our marketing group increased on a quarterly and year-to-date basis in 2019 compared with 2018 due to an increase in crude oil and natural gas volumes partially offset by lower prices.
Corporate and Eliminations revenues relate to sales of natural gas or crude oil and operating revenue between segments and are recorded at transfer prices based on current market prices.
Further information regarding our revenues can be found in the Reportable Segments section of this MD&A.
Operating Margin
Operating Margin is an additional subtotal found in Notes 1 and 7 of the interim Consolidated Financial Statements and is used to provide a consistent measure of the cash generating performance of our assets for comparability of our underlying financial performance between periods. Operating Margin is defined as revenues less purchased product, transportation and blending, operating expenses, production and mineral taxes, plus realized gains less realized losses on risk management activities. Items within the Corporate and Eliminations segment are excluded from the calculation of Operating Margin.
| Three Months Ended June 30, | | | Six Months Ended June 30, | |
($ millions) | 2019 | | | 2018 (1) | | | 2019 | | | 2018 (1) | |
Revenues | | 5,705 | | | | 6,071 | | | | 10,850 | | | | 10,875 | |
(Add) Deduct: | | | | | | | | | | | | | | | |
Purchased Product | | 2,441 | | | | 2,224 | | | | 4,604 | | | | 4,181 | |
Transportation and Blending | | 1,363 | | | | 1,669 | | | | 2,529 | | | | 3,186 | |
Operating Expenses | | 571 | | | | 569 | | | | 1,167 | | | | 1,274 | |
Production and Mineral Taxes | | - | | | | 1 | | | | - | | | | 1 | |
Realized (Gain) Loss on Risk Management Activities | | 53 | | | | 697 | | | | 34 | | | | 1,165 | |
Operating Margin From Continuing Operations | | 1,277 | | | | 911 | | | | 2,516 | | | | 1,068 | |
Conventional (Discontinued Operations) | | - | | | | 27 | | | | - | | | | 39 | |
Total Operating Margin | | 1,277 | | | | 938 | | | | 2,516 | | | | 1,107 | |
(1) | IFRS 16 was adopted January 1, 2019 using the modified retrospective approach; therefore, comparative information has not been restated. Refer to the Critical Accounting Judgments, Estimation Uncertainties and Accounting Policies section in this MD&A. |
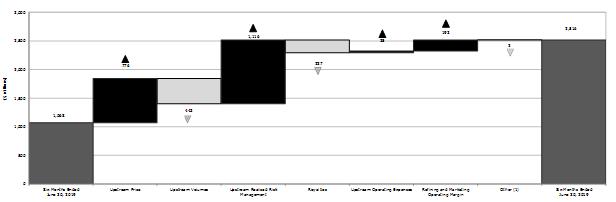
Three Months Ended June 30, 2019 Compared With June 30, 2018
Operating Margin from continuing operations increased primarily due to: | 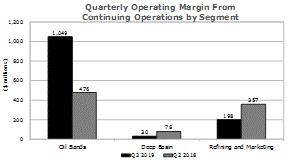
|
• | An increase in our average liquids sales prices; |
• | A decrease in our transportation and blending costs due to a decrease in condensate volumes required for blending and lower condensate prices, partially offset by an increase in rail transportation costs and pipeline tariffs due to higher volumes shipped to the U.S.; |
• | A decrease in upstream operating expenses; and |
• | Realized risk management losses of $53 million (2018 – losses of $697 million). |
These increases in Operating Margin were partially |
offset by: |
• | Lower sales volumes; |
• | Higher royalties; and |
• | Lower Operating Margin from our Refining and Marketing segment due to lower crude advantage and higher operating expenses partially offset by higher market crack spreads. |
Cenovus Energy Inc. – Q2 2019 Management’s Discussion and Analysis | | 9 |
| | |
Operating Margin From Continuing Operations Variance
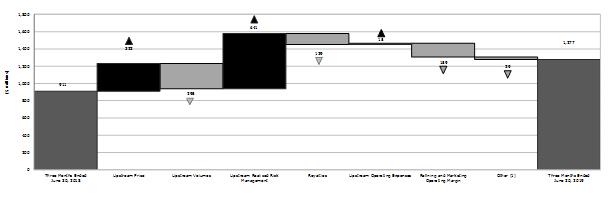
| (1) | Other includes the value of condensate sold as heavy oil blend recorded in revenues and condensate costs recorded in transportation and blending expense. The crude oil price excludes the impact of condensate purchases. |
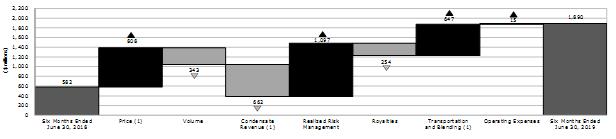
Six Months Ended June 30, 2019 Compared With June 30, 2018
Operating Margin from continuing operations increased in 2019 compared with 2018 primarily due to: | 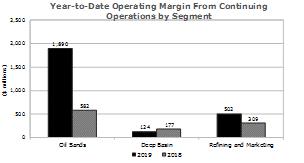
|
• | An increase in our average liquids and natural gas sales prices; |
• | A decrease in transportation and blending expenses due to a reduction in condensate volumes required for blending and lower condensate prices, partially offset by increased rail transportation costs and pipeline tariffs due to higher volumes shipped to the U.S.; |
• | Higher Operating Margin from our Refining and Marketing segment due to lower operating |
| expenses, higher market crack spreads, and higher margins on fixed priced products, partially offset by lower crude advantage; |
• | Lower upstream operating expenses; and |
• | Realized risk management losses of $34 million (2018 – losses of $1,165 million). |
These increases in Operating Margin were partially offset by lower volumes, and higher royalties primarily due to Christina Lake achieving payout in August 2018. |
Operating Margin From Continuing Operations Variance
| (1) | Other includes the value of condensate sold as heavy oil blend recorded in revenues and condensate costs recorded in transportation and blending expense. The crude oil price excludes the impact of condensate purchases. |
Additional details explaining the changes in Operating Margin from continuing operations can be found in the Reportable Segments section of this MD&A.
Cenovus Energy Inc. – Q2 2019 Management’s Discussion and Analysis | | 10 |
| | |
Cash From Operating Activities and Adjusted Funds Flow
Adjusted Funds Flow is a non-GAAP measure commonly used in the oil and gas industry to assist in measuring a company’s ability to finance its capital programs and meet its financial obligations. Adjusted Funds Flow is defined as cash from operating activities excluding net change in other assets and liabilities and net change in non-cash working capital. Non-cash working capital is composed of accounts receivable, inventories, income tax receivable, accounts payable and income tax payable. Net change in other assets and liabilities is composed of site restoration costs and pension funding.
Total Cash From Operating Activities and Adjusted Funds Flow
| Three Months Ended June 30, | | | Six Months Ended June 30, | |
($ millions) | 2019 | | | 2018 (2) | | | 2019 | | | 2018 (2) | |
Cash From Operating Activities (1) | | 1,275 | | | | 533 | | | | 1,711 | | | | 410 | |
(Add) Deduct: | | | | | | | | | | | | | | | |
Net Change in Other Assets and Liabilities | | (13 | ) | | | (17 | ) | | | (34 | ) | | | (35 | ) |
Net Change in Non-Cash Working Capital | | 206 | | | | (224 | ) | | | (385 | ) | | | (288 | ) |
Adjusted Funds Flow (1) | | 1,082 | | | | 774 | | | | 2,130 | | | | 733 | |
(1) | Includes results from our Conventional segment, which has been classified as a discontinued operation. |
(2) | IFRS 16 was adopted January 1, 2019 using the modified retrospective approach; therefore, comparative information has not been restated. Refer to the Critical Accounting Judgments, Estimation Uncertainties and Accounting Policies section in this MD&A. |
Cash From Operating Activities and Adjusted Funds Flow were higher in the second quarter of 2019 compared with 2018 due to higher Operating Margin, as discussed above, lower general and administrative costs, and lower finance costs, partially offset by an increase in current income tax expense. The change in non-cash working capital in the second quarter of 2019 was due to a decrease in accounts receivable and lower income tax receivable, partially offset by a decrease in accounts payable and an increase in inventories. For the three months ended June 30, 2018, the change in non-cash working capital was primarily due to an increase in accounts receivable, partially offset by a rise in accounts payable.
Cash From Operating Activities and Adjusted Funds Flow were higher on a year-to-date basis compared with 2018 due to higher Operating Margin, lower general and administrative costs due to $47 million severance costs in 2018 and lower finance costs, partially offset by an increase in current income tax expense. The change in non-cash working capital for the six months ended June 30, 2019 was primarily due to an increase in accounts receivable and increase in inventories, partially offset by a decrease in income tax receivable and an increase in accounts payable. For the first six months of 2018, the change in non-cash working capital was primarily due to an increase in accounts receivable and a decline in income tax payable, partially offset by an increase in accounts payable.
Operating Earnings (Loss)
| Three Months Ended June 30, | | | Six Months Ended June 30, | |
($ millions) | 2019 | | | 2018 (3) | | | 2019 | | | 2018 | |
Earnings (Loss) From Continuing Operations, Before Income Tax | | 918 | | | | (390 | ) | | | 1,075 | | | | (1,462 | ) |
Add (Deduct): | | | | | | | | | | | | | | | |
Unrealized Risk Management (Gain) Loss (1) | | (88 | ) | | | (122 | ) | | | 148 | | | | (261 | ) |
Non-Operating Unrealized Foreign Exchange (Gain) Loss (2) | | (407 | ) | | | 205 | | | | (616 | ) | | | 469 | |
(Gain) Loss on Divestiture of Assets | | (1 | ) | | | (1 | ) | | | 4 | | | | (1 | ) |
Other | | - | | | | 1 | | | | - | | | | - | |
Operating Earnings (Loss) From Continuing Operations, Before Income Tax | | 422 | | | | (307 | ) | | | 611 | | | | (1,255 | ) |
Income Tax Expense (Recovery) | | 155 | | | | (15 | ) | | | 275 | | | | (211 | ) |
Operating Earnings (Loss) From Continuing Operations | | 267 | | | | (292 | ) | | | 336 | | | | (1,044 | ) |
Operating Earnings (Loss) From Discontinued Operations | | - | | | | 20 | | | | - | | | | 29 | |
Total Operating Earnings (Loss) | | 267 | | | | (272 | ) | | | 336 | | | | (1,015 | ) |
(1) | Includes the reversal of unrealized (gains) losses recorded in prior periods. |
(2) | Includes unrealized foreign exchange (gains) losses on translation of U.S. dollar denominated notes issued from Canada and foreign exchange (gains) losses on settlement of intercompany transactions. |
(3) | IFRS 16 was adopted January 1, 2019 using the modified retrospective approach; therefore, comparative information has not been restated. Refer to the Critical Accounting Judgments, Estimation Uncertainties and Accounting Policies section in this MD&A. |
Operating Earnings (Loss) is a non-GAAP measure used to provide a consistent measure of the comparability of our underlying financial performance between periods by removing non-operating items. Operating Earnings (Loss) is defined as Earnings (Loss) Before Income Tax excluding gain (loss) on discontinuance, unrealized risk management gains (losses) on derivative instruments, unrealized foreign exchange gains (losses) on translation of U.S. dollar denominated notes issued from Canada, foreign exchange gains (losses) on settlement of intercompany
Cenovus Energy Inc. – Q2 2019 Management’s Discussion and Analysis | | 11 |
| | |
transactions, gains (losses) on divestiture of assets, less income taxes on Operating Earnings (Loss) before tax, excluding the effect of changes in statutory income tax rates and the recognition of an increase in U.S. tax basis.
Operating Earnings from continuing operations increased in the second quarter of 2019 compared with 2018 primarily due to a re-measurement gain of $109 million on the contingent payment compared with a loss of $377 million in 2018 and higher Cash From Operating Activities and Adjusted Funds Flow, as discussed above, partially offset by realized foreign exchange losses of $256 million on the repurchase of our unsecured notes compared with losses of $14 million in 2018.
For the six months ended June 30, 2019, Operating Earnings from continuing operations increased relative to 2018 primarily due to higher Cash From Operating Activities and Adjusted Funds Flow, as discussed above, a re‑measurement loss of $154 million on the contingent payment compared with a loss of $494 million in 2018, lower depreciation, depletion and amortization (“DD&A”), and a lower provision for onerous contracts. The increase in our Operating Earnings for the six months ended June 30, 2019 was partially offset by realized foreign exchange losses of $279 million on the repurchase of our unsecured notes, compared with losses of $14 million in 2018.
Net Earnings (Loss)
($ millions) | Three Months Ended | | | Six Months Ended | |
Net Earnings (Loss) From Continuing Operations, for the Periods Ended June 30, 2018 (1) | | (410 | ) | | | (1,324 | ) |
Increase (Decrease) due to: | | | | | | | |
Operating Margin From Continuing Operations | | 366 | | | | 1,448 | |
Corporate and Eliminations: | | | | | | | |
Unrealized Risk Management Gain (Loss) | | (34 | ) | | | (409 | ) |
Unrealized Foreign Exchange Gain (Loss) | | 632 | | | | 1,143 | |
Re-measurement of Contingent Payment | | 486 | | | | 340 | |
Gain (Loss) on Divestiture of Assets | | - | | | | (5 | ) |
Expenses (2) | | (157 | ) | | | (61 | ) |
DD&A | | 15 | | | | 84 | |
Exploration Expense | | - | | | | (3 | ) |
Income Tax Recovery (Expense) | | 886 | | | | 681 | |
Net Earnings (Loss) From Continuing Operations, for the Periods Ended June 30, 2019 | | 1,784 | | | | 1,894 | |
(1) | IFRS 16 was adopted January 1, 2019 using the modified retrospective approach; therefore, comparative information has not been restated. Refer to the Critical Accounting Judgments, Estimation Uncertainties and Accounting Policies section in this MD&A. |
(2) | Includes Corporate and Eliminations realized risk management (gains) losses, general and administrative, onerous contract provisions, finance costs, interest income, realized foreign exchange (gains) losses, transaction costs, research costs, other (income) loss, net and Corporate and Eliminations revenues, purchased product, transportation and blending, and operating expenses. |
Net Earnings of $1,784 million from continuing operations in the second quarter of 2019 increased compared with 2018 primarily due to:
• | A deferred income tax recovery of $877 million compared with a deferred tax expense of $55 million in 2018 primarily due to a four percent reduction in the Alberta corporate tax rate over the next four years and a step‑up in the tax basis of our refining assets; |
• | Non-operating unrealized foreign exchange gains of $407 million compared with losses of $205 million in 2018; and |
• | Higher Operating Earnings, as discussed above. |
These increases to our Net Earnings from continuing operations in 2019 were partially offset by unrealized risk management gains of $88 million compared with unrealized gains of $122 million in 2018.
On a year-to-date basis, Net Earnings of $1,894 million from continuing operations increased from the first half of 2018 due to higher Operating Earnings, as discussed above, non-operating unrealized foreign exchange gains of $616 million compared with losses of $469 million in 2018, and a deferred income tax recovery of $836 million compared with $49 million in 2018. These increases to our Net Earnings were partially offset by unrealized risk management losses of $148 million compared with gains of $261 million in 2018.
For the three months ended June 30, 2018, we incurred a Net Loss from discontinued operations of $8 million. Net Earnings from discontinued operations for the six months ended June 30, 2018 was $252 million and includes an after-tax gain of $223 million on the divestiture of the Suffield assets in the first quarter of 2018.
Cenovus Energy Inc. – Q2 2019 Management’s Discussion and Analysis | | 12 |
| | |
Total Capital Investment
| Three Months Ended June 30, | | | Six Months Ended June 30, | |
($ millions) | 2019 | | | 2018 (2) | | | 2019 | | | 2018 (2) | |
Oil Sands | | 136 | | | | 224 | | | | 350 | | | | 542 | |
Deep Basin | | 8 | | | | 26 | | | | 22 | | | | 171 | |
Refining and Marketing | | 72 | | | | 35 | | | | 127 | | | | 88 | |
Corporate and Eliminations | | 32 | | | | 9 | | | | 66 | | | | 15 | |
Capital Investment - Continuing Operations | | 248 | | | | 294 | | | | 565 | | | | 816 | |
Conventional (Discontinued Operations) | | - | | | | (2 | ) | | | - | | | | - | |
Total Capital Investment (1) | | 248 | | | | 292 | | | | 565 | | | | 816 | |
(1) | Includes expenditures on PP&E, E&E assets and assets held for sale. |
(2) | IFRS 16 was adopted January 1, 2019 using the modified retrospective approach; therefore, comparative information has not been restated. Refer to the Critical Accounting Judgments, Estimation Uncertainties and Accounting Policies section of this MD&A. |
Capital investment in 2019 decreased compared with 2018, reflecting our reduced capital investment program, lower Christina Lake phase G spend as the project was completed in March 2019, and a smaller sustaining well program. Oil Sands focused capital spending on sustaining capital related to existing production and stratigraphic test wells to determine pad placement for sustaining wells. Capital investment in the Deep Basin focused spending on pad and well equipping and tie-ins, as well as capital maintenance activities.
Refining and Marketing capital investment increased on a year-to-date basis due to higher spending on yield enhancements and capital maintenance projects at Borger, as well as higher spending on strategic rail initiatives and infrastructure.
Further information regarding our capital investment can be found in the Reportable Segments section of this MD&A.
Capital Investment Decisions
Our interim Net Debt target of $7.0 billion has largely been achieved. Ensuring balance sheet strength will continue to be a priority and we plan to direct the vast majority of our Free Funds Flow towards debt reduction until we reach our longer-term Net Debt target of $5.0 billion. This level of Net Debt aligns with a Net Debt to EBITDA ratio of two times at bottom of the cycle commodity prices. As we progress towards $5.0 billion, we will also consider opportunities for shareholder returns in the form of dividends and share repurchases.
Once we have achieved our long-term Net Debt target, our capital allocation priorities are:
• | First, to sustaining and maintenance capital for our existing business operations; |
• | Second, to paying our dividend and providing a stable and predictable shareholder return; and |
• | Third, consider incremental returns to shareholders, further deleveraging, and disciplined investment in growth. |
Our approach to capital allocation includes evaluating all opportunities using specific rigorous criteria with the objective of maintaining a prudent and flexible capital structure and strong balance sheet metrics, which positions us to be financially resilient in times of lower cash flows. In addition, we continue to evaluate other corporate and financial opportunities, including generating cash from our existing portfolio. Refer to the Liquidity and Capital Resources section of this MD&A for further information.
| Three Months Ended June 30, | | | Six Months Ended June 30, | |
($ millions) | 2019 | | | 2018 (3) | | | 2019 | | | 2018 (3) | |
Adjusted Funds Flow (1) | | 1,082 | | | | 774 | | | | 2,130 | | | | 733 | |
Total Capital Investment (1) | | 248 | | | | 292 | | | | 565 | | | | 816 | |
Free Funds Flow (1) (2) | | 834 | | | | 482 | | | | 1,565 | | | | (83 | ) |
Cash Dividends | | 62 | | | | 62 | | | | 123 | | | | 122 | |
| | 772 | | | | 420 | | | | 1,442 | | | | (205 | ) |
(1) | Includes our Conventional segment, which has been classified as a discontinued operation. |
(2) | Free Funds Flow is a non-GAAP measure defined as Adjusted Funds Flow less capital investment. |
(3) | IFRS 16 was adopted January 1, 2019 using the modified retrospective approach; therefore, comparative information has not been restated. Refer to the Critical Accounting Judgments, Estimation Uncertainties and Accounting Policies section in this MD&A. |
We expect our capital investment and cash dividends for 2019 to be funded from our internally generated cash flows and our cash balance on hand.
Cenovus Energy Inc. – Q2 2019 Management’s Discussion and Analysis | | 13 |
| | |
REPORTABLE SEGMENTS
Our reportable segments are as follows:
Oil Sands, which includes the development and production of bitumen in northeast Alberta. Cenovus’s bitumen assets include Foster Creek, Christina Lake and Narrows Lake as well as other projects in the early stages of development.
Deep Basin, which includes approximately 2.8 million net acres of land primarily in the Elmworth-Wapiti, Kaybob‑Edson, and Clearwater operating areas, rich in natural gas and NGLs. The assets reside in Alberta and British Columbia and include interests in numerous natural gas processing facilities.
Refining and Marketing, which is responsible for transporting, selling and refining crude oil into petroleum and chemical products. Cenovus jointly owns two refineries in the U.S. with the operator Phillips 66, an unrelated U.S. public company. In addition, Cenovus owns and operates a crude‑by‑rail terminal in Alberta. This segment coordinates Cenovus’s marketing and transportation initiatives to optimize product mix, delivery points, transportation commitments and customer diversification. The marketing of crude oil and natural gas sourced from Canada, including physical product sales that settle in the U.S., is considered to be undertaken by a Canadian business. U.S. sourced crude oil and natural gas purchases and sales are attributed to the U.S.
Corporate and Eliminations, which primarily includes unrealized gains and losses recorded on derivative financial instruments, gains and losses on divestiture of assets, as well as other Cenovus-wide costs for general and administrative, financing activities and research costs. As financial instruments are settled, the realized gains and losses are recorded in the reportable segment to which the derivative instrument relates. Eliminations include adjustments for internal usage of natural gas production between segments, transloading services provided to the Oil Sands segment by the Company’s rail terminal, crude oil production used as feedstock by the Refining and Marketing segment, and unrealized intersegment profits in inventory. Eliminations are recorded at transfer prices based on current market prices.
As at January 5, 2018, all of the Conventional segment assets were sold. Refer to the Discontinued Operations section of this MD&A for more information.
Revenues by Reportable Segment
| Three Months Ended June 30, | | | Six Months Ended June 30, | |
($ millions) | 2019 | | | 2018 | | | 2019 | | | 2018 | |
Oil Sands | | 2,716 | | | | 3,069 | | | | 4,966 | | | | 5,417 | |
Deep Basin | | 140 | | | | 225 | | | | 346 | | | | 449 | |
Refining and Marketing | | 2,849 | | | | 2,777 | | | | 5,538 | | | | 5,009 | |
Corporate and Eliminations | | (102 | ) | | | (239 | ) | | | (243 | ) | | | (433 | ) |
| | 5,603 | | | | 5,832 | | | | 10,607 | | | | 10,442 | |
OIL SANDS
In the second quarter of 2019 we:
• | Successfully completed a planned turnaround at Christina Lake; |
• | Managed total production to mandated curtailment requirements; |
• | Generated Operating Margin of $1,049 million, an increase of $573 million due to higher average realized sales prices, decreased transportation and blending costs, and realized risk management losses of $57 million compared with losses of $688 million in 2018, partially offset by lower sales volumes and higher royalties; |
• | Earned crude oil Netbacks of $35.78 per barrel, excluding realized risk management activities, a 10 percent increase compared with 2018; |
• | Received delivery of approximately one-third of our railcars under the agreements signed in late 2018. Delivery will continue through 2019, in line with our expected ramp up to 100,000 barrels per day shipped by rail; |
• | Used our fleet of leased railcars to transport 34,519 barrels per day by rail to sales locations outside of Alberta, allowing us to capture higher market prices; and |
• | On July 10, 2019, we reached one billion barrels of cumulative production from our Foster Creek and Christina Lake oil sands facilities in northern Alberta. |
Cenovus Energy Inc. – Q2 2019 Management’s Discussion and Analysis | | 14 |
| | |
Three Months Ended June 30, 2019 Compared With June 30, 2018
Financial Results
| Three Months Ended June 30, | |
($ millions) | 2019 | | | 2018 (1) | |
Gross Sales | | 3,030 | | | | 3,248 | |
Less: Royalties | | 314 | | | | 179 | |
Revenues | | 2,716 | | | | 3,069 | |
Expenses | | | | | | | |
Transportation and Blending | | 1,340 | | | | 1,642 | |
Operating | | 270 | | | | 263 | |
(Gain) Loss on Risk Management | | 57 | | | | 688 | |
Operating Margin | | 1,049 | | | | 476 | |
Capital Investment | | 136 | | | | 224 | |
Operating Margin Net of Related Capital Investment | | 913 | | | | 252 | |
(1) | IFRS 16 was adopted January 1, 2019 using the modified retrospective approach; therefore, comparative information has not been restated. Refer to the Critical Accounting Judgments, Estimation Uncertainties and Accounting Policies section in this MD&A. |
Operating Margin Variance

(1) | Revenues include the value of condensate sold as heavy oil blend. Condensate costs are recorded in transportation and blending expense. The crude oil price excludes the impact of condensate purchases. |
Revenues
Price
In the second quarter of 2019, our average realized crude oil sales price increased to $62.68 per barrel (2018 – $51.07 per barrel). While WTI decreased, the narrowing of the heavy oil differentials increased our realized crude oil sales price. The WTI-WCS differential narrowed to a discount of US$10.65 per barrel (2018 – US$19.27 per barrel) and the WCS-Christina Dilbit Blend (“CDB”) differential narrowed to a discount of US$1.25 per barrel (2018 – US$2.95 per barrel).
Our realized crude oil sales price is influenced by the cost of condensate used in blending. Our blending ratios range between 25 percent and 33 percent. As the cost of condensate decreases relative to the price of blended crude oil, our bitumen sales price increases. Due to high demand for condensate at Edmonton, we also purchase condensate from U.S. markets and deliver it to the Edmonton hub. As such, our average cost of condensate is generally higher than the Edmonton benchmark price due to transportation between market hubs and transportation to field locations. In addition, up to three months may elapse from when we purchase condensate to when we sell our blended production. In a rising crude oil price environment, we expect to see a positive impact on our bitumen sales price as we are using condensate purchased at a lower price earlier in the year.
Production Volumes
| Three Months Ended June 30, | |
(barrels per day) | 2019 | | | Percent Change | | | 2018 | |
Foster Creek | | 165,953 | | | | (3 | ) | | | 171,079 | |
Christina Lake | | 179,020 | | | | (18 | ) | | | 218,299 | |
| | 344,973 | | | | (11 | ) | | | 389,378 | |
Production levels in the second quarter of 2019 were limited by the government curtailment program and a planned turnaround at Christina Lake. In the three months ended June 30, 2019, the impact of the planned turnaround was approximately 7,665 barrels per day, minimized by the use of the Christina Lake phase G facility and production capability from Foster Creek. In the second quarter of 2018, we benefited from ramping up production and producing the majority of barrels that were stored in our oil sands reservoirs due to the decision to reduce producing well rates in the first quarter of 2018.
Cenovus Energy Inc. – Q2 2019 Management’s Discussion and Analysis | | 15 |
| | |
Condensate
The bitumen currently produced by Cenovus must be blended with condensate to reduce its thickness in order to transport it to market through pipelines or by rail. Revenues represent the total value of blended crude oil sold and include the value of condensate. Consistent with the narrowing of the WCS-Condensate differential in the second quarter of 2019, the proportion of the cost of condensate recovered increased. The total amount of condensate used decreased as a result of lower sales volumes.
Royalties
Royalty calculations for our oil sands projects are based on government prescribed pre- and post-payout royalty rates which are determined on a sliding scale using the Canadian dollar equivalent WTI benchmark price.
Royalties for a pre-payout project are based on a monthly calculation that applies a royalty rate (ranging from one to nine percent, based on the Canadian dollar equivalent WTI benchmark price) to the gross revenues from the project.
Project payout is achieved when the cumulative project revenue exceeds the cumulative project allowable costs. Royalties for a post-payout project are based on an annualized calculation which uses the greater of: (1) the gross revenues multiplied by the applicable royalty rate (one to nine percent, based on the Canadian dollar equivalent WTI benchmark price); or (2) the net profits of the project multiplied by the applicable royalty rate (25 to 40 percent, based on the Canadian dollar equivalent WTI benchmark price). Gross revenues are a function of sales revenues less diluent costs and transportation costs. Net profits are a function of sales revenues less diluent costs, transportation costs, and allowed operating and capital costs.
Foster Creek and Christina Lake are post-payout projects with our Christina Lake property achieving payout in the third quarter of 2018.
Effective Royalty Rates
| Three Months Ended June 30, | |
(percent) | 2019 | | | 2018 | |
Foster Creek | | 18.2 | | | | 19.6 | |
Christina Lake | | 19.7 | | | | 4.2 | |
Royalties increased $135 million in the second quarter of 2019 compared with 2018. Royalties increased primarily due to Christina Lake achieving project payout in August 2018 and higher realized sales prices, partially offset by lower annual average WTI benchmark pricing (which determines the royalty rate).
Expenses
Transportation and Blending
Transportation and blending costs decreased $302 million from the second quarter of 2018. Blending costs decreased primarily from reduced condensate volumes required for our decreased production and lower priced condensate in the second quarter of 2019 compared with 2018. Transportation costs increased primarily due to higher rail costs from additional volumes shipped by rail. In the three months ended June 30, 2019, we shipped 34,519 barrels per day by rail to locations outside of Alberta (2018 – nil).
Per-unit Transportation Expenses
At Foster Creek, transportation costs increased $2.06 per barrel due to higher rail transportation costs as a result of more railcars shipping our volumes and higher pipeline tariffs from increased U.S. sales, and decreased sales volumes. Christina Lake transportation costs of $6.69 per barrel were 35 percent higher relative to 2018 due to a higher volume of product shipped by rail and higher pipeline tariff rates due to increased U.S. sales, and decreased sales volumes. Transporting our volumes to U.S. destinations, either by pipeline or rail, allows us to achieve better market prices.
Operating
Primary drivers of our operating expenses in the second quarter of 2019 were workforce, fuel, repairs and maintenance, and chemical costs. Total operating expenses increased $7 million primarily due to higher repairs and maintenance costs, and waste handling and trucking costs due to the planned turnaround at Christina Lake, partially offset by lower chemical costs due to lower emulsion and less sulphur treating.
Cenovus Energy Inc. – Q2 2019 Management’s Discussion and Analysis | | 16 |
| | |
Per-unit Operating Expenses
| Three Months Ended June 30, | |
($/bbl) | 2019 | | | Percent Change | | | 2018 (1) | |
Foster Creek | | | | | | | | | | | |
Fuel | | 2.17 | | | | 14 | | | | 1.91 | |
Non-fuel | | 6.72 | | | | (2 | ) | | | 6.84 | |
Total | | 8.89 | | | | 2 | | | | 8.75 | |
Christina Lake | | | | | | | | | | | |
Fuel | | 1.79 | | | | 1 | | | | 1.77 | |
Non-fuel | | 6.75 | | | | 52 | | | | 4.45 | |
Total | | 8.54 | | | | 37 | | | | 6.22 | |
Total | | 8.70 | | | | 19 | | | | 7.32 | |
| (1) | IFRS 16 was adopted January 1, 2019 using the modified retrospective approach; therefore, comparative information has not been restated. Refer to the Critical Accounting Judgments, Estimation Uncertainties and Accounting Policies section in this MD&A. |
At Foster Creek, per barrel fuel costs increased in the second quarter of 2019 primarily due to lower sales volumes and higher consumption. At Christina Lake, per barrel fuel costs were relatively flat due to lower sales volumes offset by less consumption. Foster Creek per-barrel non-fuel operating expenses decreased compared with 2018, due to lower greenhouse gas costs and lower chemical costs, partially offset by lower sales volumes. At Christina Lake, per-barrel non-fuel operating expenses increased 52 percent compared with 2018, due to lower sales volumes, higher repairs and maintenance costs, and fluid, waste handling and trucking costs due to a planned turnaround, partially offset by lower chemical costs.
Netbacks (1)
| Foster Creek | | | Christina Lake | |
| Three Months Ended June 30, | |
($/bbl) | 2019 | | | 2018 (2) | | | 2019 | | | 2018 (2) | |
Sales Price | | 65.90 | | | | 54.08 | | | | 59.78 | | | | 48.74 | |
Royalties | | 10.02 | | | | 9.14 | | | | 10.24 | | | | 1.84 | |
Transportation and Blending | | 9.60 | | | | 7.54 | | | | 6.69 | | | | 4.95 | |
Operating Expenses | | 8.89 | | | | 8.75 | | | | 8.54 | | | | 6.22 | |
Netback Excluding Realized Risk Management | | 37.39 | | | | 28.65 | | | | 34.31 | | | | 35.73 | |
Realized Risk Management Gain (Loss) | | (1.55 | ) | | | (19.54 | ) | | | (2.08 | ) | | | (19.08 | ) |
Netback Including Realized Risk Management | | 35.84 | | | | 9.11 | | | | 32.23 | | | | 16.65 | |
(1) | Netbacks reflect our operating margin on a per-barrel basis of unblended crude oil. |
(2) | IFRS 16 was adopted January 1, 2019 using the modified retrospective approach; therefore, comparative information has not been restated. Refer to the Critical Accounting Judgments, Estimation Uncertainties and Accounting Policies section in this MD&A. |
Risk Management
Risk management positions in the second quarter of 2019 resulted in realized losses of $57 million (2018 – realized losses of $688 million), consistent with average benchmark prices exceeding our contract prices.
Six Months Ended June 30, 2019 Compared With June 30, 2018
Financial Results
| Six Months Ended June 30, | |
($ millions) | 2019 | | | 2018 (1) | |
Gross Sales | | 5,457 | | | | 5,654 | |
Less: Royalties | | 491 | | | | 237 | |
Revenues | | 4,966 | | | | 5,417 | |
Expenses | | | | | | | |
Transportation and Blending | | 2,487 | | | | 3,134 | |
Operating | | 544 | | | | 559 | |
(Gain) Loss on Risk Management | | 45 | | | | 1,142 | |
Operating Margin | | 1,890 | | | | 582 | |
Capital Investment | | 350 | | | | 542 | |
Operating Margin Net of Related Capital Investment | | 1,540 | | | | 40 | |
(1) | IFRS 16 was adopted January 1, 2019 using the modified retrospective approach; therefore, comparative information has not been restated. Refer to the Critical Accounting Judgments, Estimation Uncertainties and Accounting Policies section in this MD&A. |
Cenovus Energy Inc. – Q2 2019 Management’s Discussion and Analysis | | 17 |
| | |
Operating Margin Variance
(1) | Revenues include the value of condensate sold as heavy oil blend. Condensate costs are recorded in transportation and blending expense. The crude oil price excludes the impact of condensate purchases. |
Revenues
Price
In the six months ended June 30, 2019, our realized crude oil sales price increased to $56.30 per barrel compared with $43.00 per barrel in the first half of 2018. In the first half of 2018, WCS prices were more volatile ranging from $34.93 per barrel to $51.32 per barrel. The increase in our crude oil price reflects the rise in WCS prices, narrower WCS-Condensate and WCS-CDB differentials. While WTI benchmark prices decreased, the narrowing of the differential increased our realized sales price. The WTI-WCS differential narrowed to a discount of US$11.51 per barrel (2018 – discount of US$21.77 per barrel) and the WCS-CDB differential narrowed to a discount of US$1.51 per barrel (2018 – US$2.81 per barrel).
Production Volumes
| Six Months Ended June 30, | |
(barrels per day) | 2019 | | | Percent Change | | | 2018 | |
Foster Creek | | 160,087 | | | | (3 | ) | | | 164,273 | |
Christina Lake | | 183,895 | | | | (13 | ) | | | 210,332 | |
| | 343,982 | | | | (8 | ) | | | 374,605 | |
Production at both Foster Creek and Christina Lake was lower compared with 2018 primarily due to the mandated production curtailments. The planned turnaround at Christina Lake reduced production by approximately 3,854 barrels per day in 2019, which was minimized by using the Christina Lake phase G facility and production capabilities from Foster Creek.
Royalties
Effective Royalty Rates
| Six Months Ended June 30, | |
(percent) | 2019 | | | 2018 | |
Foster Creek | | 15.2 | | | | 16.1 | |
Christina Lake | | 18.7 | | | | 3.5 | |
On a year-to-date basis, royalties increased $254 million compared with 2018. Royalties increased primarily due to Christina Lake achieving project payout in August 2018 and higher realized sales prices, partially offset by lower annual average WTI benchmark pricing (which determines the royalty rate).
Expenses
Transportation and Blending
Transportation and blending costs decreased $647 million. Blending costs decreased due to a decline in condensate volumes required for our lower production and lower condensate prices. Our condensate costs were higher than the average Edmonton benchmark price primarily due to the transportation expense associated with moving the condensate between market hubs and to our oil sands projects.
Transportation costs increased primarily due to an increase in volumes shipped by rail. In the first half of 2019, using our railcars we shipped 23,712 barrels per day to locations outside of Alberta (2018 – nil). Transporting our volumes to U.S. destinations, either by pipeline or rail, allows us to achieve better market prices.
Cenovus Energy Inc. – Q2 2019 Management’s Discussion and Analysis | | 18 |
| | |
Per-unit Transportation Expenses
Foster Creek per-barrel transportation costs increased $1.28 per barrel due to higher rail transportation costs, from an increase in our volumes shipped by rail, and increased pipeline tariff costs due to higher volumes shipped to the U.S., and decreased sales volumes. Christina Lake transportation costs increased $0.72 per barrel as a result of a higher volume of product shipped by rail and decreased sales volumes relative to 2018.
Operating
Primary drivers of our operating expenses in the first half of 2019 were workforce, fuel, repairs and maintenance, and chemical costs. While total operating costs decreased $15 million, per-barrel operating expenses increased 11 percent primarily due to the lower sales volumes.
Per-unit Operating Expenses
| Six Months Ended June 30, | |
($/bbl) | 2019 | | | Percent Change | | | 2018 | |
Foster Creek | | | | | | | | | | | |
Fuel | | 2.64 | | | | 14 | | | | 2.32 | |
Non-fuel | | 7.00 | | | | (4 | ) | | | 7.29 | |
Total | | 9.64 | | | | - | | | | 9.61 | |
Christina Lake | | | | | | | | | | | |
Fuel | | 2.29 | | | | 12 | | | | 2.04 | |
Non-fuel | | 5.91 | | | | 25 | | | | 4.73 | |
Total | | 8.20 | | | | 21 | | | | 6.77 | |
Total | | 8.88 | | | | 11 | | | | 8.02 | |
At both Foster Creek and Christina Lake, per-barrel fuel costs increased due to lower sales volumes and higher natural gas prices. We continue to maintain steam levels at pre-curtailment levels. Per-barrel non-fuel operating expenses at Foster Creek decreased in the first half of 2019 primarily due to fewer workovers, lower workforce costs and decreased chemical costs due to less sulphur treating, partially offset by lower sales volumes. Per-barrel non-fuel operating expenses at Christina Lake increased in the first half of 2019 primarily due to lower sales volumes, increased repairs and maintenance, waste, fluid handling and trucking costs due to the planned turnaround, partially offset by lower chemical costs due to lower emulsion and sulphur treating.
Netbacks (1)
| Foster Creek | | | Christina Lake | |
| Six Months Ended June 30, | |
($/bbl) | 2019 | | | 2018 | | | 2019 | | | 2018 | |
Sales Price | | 59.12 | | | | 46.89 | | | | 53.79 | | | | 39.93 | |
Royalties | | 7.30 | | | | 6.23 | | | | 8.79 | | | | 1.25 | |
Transportation and Blending | | 9.50 | | | | 8.22 | | | | 5.59 | | | | 4.87 | |
Operating Expenses | | 9.64 | | | | 9.61 | | | | 8.20 | | | | 6.77 | |
Netback Excluding Realized Risk Management | | 32.68 | | | | 22.83 | | | | 31.21 | | | | 27.04 | |
Realized Risk Management Gain (Loss) | | (0.61 | ) | | | (16.62 | ) | | | (0.85 | ) | | | (16.66 | ) |
Netback Including Realized Risk Management | | 32.07 | | | | 6.21 | | | | 30.36 | | | | 10.38 | |
(1) | Netbacks reflect our margin on a per-barrel basis of unblended crude oil. |
Risk Management
Risk management positions in the first six months of 2019 resulted in realized losses of $45 million (2018 – realized losses of $1,142 million), consistent with average benchmark prices exceeding our contract prices on hedging contracts.
Cenovus Energy Inc. – Q2 2019 Management’s Discussion and Analysis | | 19 |
| | |
Oil Sands – Capital Investment
| Three Months Ended June 30, | | | Six Months Ended June 30, | |
($ millions) | 2019 | | | 2018 (3) | | | 2019 | | | 2018 (3) | |
Foster Creek | | 52 | | | | 108 | | | | 123 | | | | 247 | |
Christina Lake | | 74 | | | | 111 | | | | 195 | | | | 275 | |
| | 126 | | | | 219 | | | | 318 | | | | 522 | |
Other (1) | | 10 | | | | 5 | | | | 32 | | | | 20 | |
Capital Investment (2) | | 136 | | | | 224 | | | | 350 | | | | 542 | |
(1) | Includes new resource plays, Narrows Lake, Telephone Lake and Athabasca natural gas. |
(2) | Includes expenditures on PP&E and E&E assets. |
(3) | IFRS 16 was adopted January 1, 2019 using the modified retrospective approach; therefore, comparative information has not been restated. Refer to the Critical Accounting Judgments, Estimation Uncertainties and Accounting Policies section of this MD&A for further information. |
In the first half of 2019, Oil Sands capital investment of $350 million focused on a smaller sustaining well program, stratigraphic test wells and the completion of Christina Lake phase G construction. At Foster Creek, capital investment focused on sustaining capital related to existing production and stratigraphic test wells. Christina Lake capital investment focused on the completion of the phase G construction in March, sustaining capital related to existing production and stratigraphic test wells.
Drilling Activity
| Gross Stratigraphic Test Wells | | | Gross Production Wells (1) | |
Six Months Ended June 30, | 2019 | | | 2018 | | | 2019 | | | 2018 | |
Foster Creek | | 14 | | | | 43 | | | | - | | | | 14 | |
Christina Lake | | 18 | | | | 63 | | | | 11 | | | | 18 | |
| | 32 | | | | 106 | | | | 11 | | | | 32 | |
Other | | 14 | | | | 20 | | | | - | | | | - | |
| | 46 | | | | 126 | | | | 11 | | | | 32 | |
(1) | Steam-assisted gravity drainage well pairs are counted as a single producing well. |
Stratigraphic test wells were drilled to help identify well pad locations for sustaining wells and near-term expansion phases, and to further progress the evaluation of emerging assets.
Future Capital Investment
Foster Creek capital investment for 2019 is forecast to be between $250 million and $300 million. We plan to continue focusing on sustaining capital related to existing production.
Christina Lake capital investment for 2019 is forecast to be between $425 million and $475 million, focused on sustaining capital. Field construction of phase G, which has an initial design capacity of 50,000 barrels per day, was completed at the end of the first quarter of 2019. We have flexibility on when we ramp up production from Christina Lake phase G. We will take into consideration whether mandated production curtailments have been lifted and if there is sustained improvement in market access and heavy oil benchmark prices before we ramp up phase G.
In 2019, we plan to spend a minimal amount of capital on Foster Creek phase H, Christina Lake phase H and Narrows Lake to continue to advance each one to sanction-ready status.
In 2019, our Technology and other capital investment, forecast to be between $55 million and $65 million, relates to advancing key strategic initiatives that are expected to provide both cost and environmental benefits. This includes ongoing work on solvents, partial upgrading and advancing our new oil sands facility design. Guidance dated April 23, 2019 is available on our website at cenovus.com.
DD&A
We deplete crude oil and natural gas properties on a unit-of-production basis over total proved reserves. The unit‑of‑production rate takes into account expenditures incurred to date, together with estimated future development expenditures required to develop those proved reserves. This rate, calculated at an area level, is then applied to our sales volume to determine DD&A in a given period. We believe that this method of calculating DD&A charges each barrel of crude oil equivalent sold with its proportionate share of the cost of capital invested over the total estimated life of the related asset as represented by proved reserves.
We depreciate our right-of-use (“ROU”) assets on a straight-line basis over the shorter of the estimated useful life or the lease term.
Amounts related to assets under construction and assets held for sale are not depleted. Further information on our accounting policy for DD&A is included in our notes to the December 31, 2018 Consolidated Financial Statements and the interim Consolidated Financial Statements.
Cenovus Energy Inc. – Q2 2019 Management’s Discussion and Analysis | | 20 |
| | |
In the three and six months ended June 30, 2019, Oil Sands DD&A decreased $16 million and $9 million, respectively, compared with 2018 due to lower sales volumes, partially offset by an increase in our average depletion rate and depreciation expense on our ROU assets. Our depletion rate increased as a result of increased future development costs due to additional capital required to improve recovery performance and develop thin pay volumes at Christina Lake and Foster Creek, as well as an increase in maintenance capital at Foster Creek. The average depletion rate in the first six months of 2019 was approximately $11.17 per BOE (2018 – $10.61 per BOE).
Exploration expense of $4 million and $9 million was recorded in the three and six months ended June 30, 2019, respectively (2018 – $4 million and $6 million, respectively).
DEEP BASIN
In the second quarter of 2019 we:
• | Produced a total of 98,345 BOE per day; |
• | Generated Operating Margin of $30 million; and |
• | Earned a Netback of $2.28 per BOE, excluding realized risk management activities. |
Financial Results
| Three Months Ended June 30, | | | Six Months Ended June 30, | |
($ millions) | 2019 | | | 2018 | | | 2019 | | | 2018 | |
Gross Sales | | 150 | | | | 241 | | | | 370 | | | | 500 | |
Less: Royalties | | 10 | | | | 16 | | | | 24 | | | | 51 | |
Revenues | | 140 | | | | 225 | | | | 346 | | | | 449 | |
Expenses | | | | | | | | | | | | | | | |
Transportation and Blending | | 23 | | | | 27 | | | | 42 | | | | 52 | |
Operating | | 87 | | | | 109 | | | | 180 | | | | 200 | |
Production and Mineral Taxes | | - | | | | 1 | | | | - | | | | 1 | |
(Gain) Loss on Risk Management | | - | | | | 10 | | | | - | | | | 19 | |
Operating Margin | | 30 | | | | 78 | | | | 124 | | | | 177 | |
Capital Investment | | 8 | | | | 26 | | | | 22 | | | | 171 | |
Operating Margin Net of Related Capital Investment | | 22 | | | | 52 | | | | 102 | | | | 6 | |
Operating Margin Variance
Three Months Ended June 30, 2019 Compared With June 30, 2018
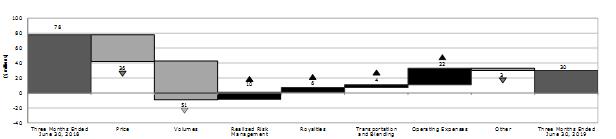
Six Months Ended June 30, 2019 Compared With June 30, 2018
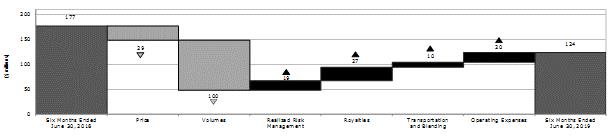
Cenovus Energy Inc. – Q2 2019 Management’s Discussion and Analysis | | 21 |
| | |
Revenues
Price
| Three Months Ended June 30, | | | Six Months Ended June 30, | |
| 2019 | | | 2018 | | | 2018 | | | | | |
Light and Medium Oil ($/bbl) | | 69.71 | | | | 79.96 | | | | 64.82 | | | | 73.54 | |
NGLs ($/bbl) | | 27.36 | | | | 42.30 | | | | 27.96 | | | | 39.98 | |
Natural Gas ($/mcf) | | 1.29 | | | | 1.34 | | | | 2.11 | | | | 1.77 | |
Total Oil Equivalent ($/BOE) | | 15.04 | | | | 18.92 | | | | 18.53 | | | | 20.28 | |
For the three and six months ended June 30, 2019, revenues included $15 million and $30 million, respectively, of processing fee revenue related to our interests in natural gas processing facilities (2018 – $18 million and $30 million, respectively). We do not include processing fee revenue in our per-unit pricing metrics or our Netbacks. Revenues decreased for the three months ended June 30, 2019 compared with 2018 due to lower volumes and lower prices. For the six months ended June 30, 2019, revenues declined due to decreased volumes and crude oil and NGL prices, partially offset by higher natural gas prices.
Production Volumes
| Three Months Ended June 30, | | | Six Months Ended June 30, | |
| 2019 | | | 2018 | | | 2018 | | | 2017 | |
Liquids | | | | | | | | | | | | | | | |
Crude Oil (barrels per day) | | 4,904 | | | | 6,263 | | | | 4,862 | | | | 6,389 | |
NGLs (barrels per day) | | 21,513 | | | | 27,778 | | | | 22,344 | | | | 28,367 | |
| | 26,417 | | | | 34,041 | | | | 27,206 | | | | 34,756 | |
Natural Gas (MMcf per day) | | 432 | | | | 570 | | | | 445 | | | | 560 | |
Total Production (BOE/d) | | 98,345 | | | | 129,066 | | | | 101,301 | | | | 128,067 | |
| | | | | | | | | | | | | | | |
Natural Gas Production (percentage of total) | | 73 | | | | 74 | | | | 73 | | | | 73 | |
Liquids Production (percentage of total) | | 27 | | | | 26 | | | | 27 | | | | 27 | |
Production for the three and six months ended June 30, 2019 declined 24 percent and 21 percent, respectively, from 2018 due to lower capital investment, the divestiture of CPP, natural declines, and a temporary shut-in to manage low natural gas prices, partially offset by less downtime. In 2019, downtime was due to shut-in production to manage low natural gas prices, and cold weather compared with downtime due to pipeline outages in 2018. CPP produced 9,600 BOE per day for both the three and six-month periods ended June 30, 2018.
Royalties
For the three and six months ended June 30, 2019, our effective liquids royalty rate was 15.9 percent and 13.7 percent, respectively (2018 – 10.6 percent and 16.5 percent, respectively). The effective natural gas royalty rate was negative 2.7 percent for the second quarter due to the gas cost allowance royalty credit being higher than the royalty expenses as a result of low gas prices and volumes (2018 – 1.0 percent). On a year-to-date basis, the effective natural gas royalty rate was 1.7 percent (2018 – 4.1 percent) due to price and production decreases.
Expenses
Transportation
Transportation costs averaged $2.53 per BOE and $2.29 per BOE for the three and six months ended June 30, 2019 compared with $1.92 per BOE and $2.06 per BOE, respectively, in 2018, due to increased pipeline tariffs. Our transportation costs reflect charges for the movement of crude oil, NGLs and natural gas from the point of production to where the product is sold. The majority of Deep Basin production is sold into the Alberta market.
Operating
Primary drivers of our operating expenses were related to workforce, repairs and maintenance, property tax, processing fees, electrical and chemical costs. Operating costs averaged $9.01 per BOE and $9.13 per BOE in the three and six months ended June 30, 2019, respectively (2018 – $8.68 per BOE and $8.03 per BOE, respectively). The increase in per-unit operating costs for the second quarter was driven by lower sales volumes, partially offset by lower repairs and maintenance activity, lower processing fees due to less throughput, and lower chemical, electrical, and workforce costs. The increase in per-unit operating costs on a year-to-date basis were driven by lower sales volumes, partially offset by lower repairs and maintenance activity, and lower chemical costs and processing fees due to less throughput.
Cenovus Energy Inc. – Q2 2019 Management’s Discussion and Analysis | | 22 |
| | |
Netbacks
| Three Months Ended June 30, | | | Six Months Ended June 30, | |
($/BOE) | 2019 | | | 2018 | | | 2018 | | | | | |
Sales Price | | 15.04 | | | | 18.92 | | | | 18.53 | | | | 20.28 | |
Royalties | | 1.19 | | | | 1.34 | | | | 1.31 | | | | 2.20 | |
Transportation and Blending | | 2.53 | | | | 1.92 | | | | 2.29 | | | | 2.06 | |
Operating Expenses | | 9.01 | | | | 8.68 | | | | 9.13 | | | | 8.03 | |
Production and Mineral Taxes | | 0.03 | | | | 0.04 | | | | 0.03 | | | | 0.03 | |
Netback Excluding Realized Risk Management | | 2.28 | | | | 6.94 | | | | 5.77 | | | | 7.96 | |
Realized Risk Management Gain (Loss) | | (0.02 | ) | | | (0.85 | ) | | | (0.01 | ) | | | (0.82 | ) |
Netback Including Realized Risk Management | | 2.26 | | | | 6.09 | | | | 5.76 | | | | 7.14 | |
Risk Management
Risk management activities in the three and six months ended June 30, 2019 were minimal (2018 – realized losses of $10 million and $19 million, respectively).
Deep Basin – Capital Investment
We invested $8 million and $22 million, in the three and six months ended June 30, 2019, respectively, compared with $26 million and $171 million in the same periods of 2018. For the three and six months ended June 30, 2019, we focused on investing capital in pad and well equipping and tie-ins, as well as capital maintenance activities. In 2018, we focused on facilities and infrastructure to support production in our core development areas.
| Three Months Ended June 30, | | | Six Months Ended June 30, | |
($ millions) | 2019 | | | 2018 | | | 2018 | | | | | |
Drilling and Completions | | - | | | | 10 | | | | 1 | | | | 104 | |
Facilities | | 2 | | | | 10 | | | | 7 | | | | 45 | |
Other | | 6 | | | | 6 | | | | 14 | | | | 22 | |
Capital Investment (1) | | 8 | | | | 26 | | | | 22 | | | | 171 | |
(1) | Includes expenditures on PP&E and E&E assets. |
Drilling Activity
In the second quarter of 2019 and on a year-to-date basis, there was one well tied-in. In the three months ended June 30, 2018, there was one non-operated net horizontal well drilled and completed and three tied-in. In the six months ended June 30, 2018 there were 13 operated net horizontal wells and two non-operated net horizontal wells drilled, 17 completed, and 20 tied-in.
Future Capital Investment
In 2019, Deep Basin capital investment is forecast to be between $50 million and $75 million.
We continue to take a disciplined approach to the development of our Deep Basin assets considering factors such as well inventory, pace of development, infrastructure constraints, economic thresholds and limited capital spending on the assets going forward. Management is committed to developing this significant resource; however, at a much slower pace of development. Guidance dated April 23, 2019 is available on our website at cenovus.com.
DD&A
We deplete crude oil and natural gas properties on a unit-of-production basis over proved reserves. The unit‑of‑production rate takes into account expenditures incurred to date, together with future development expenditures required to develop those proved reserves. This rate, calculated at an area level, is then applied to our sales volume to determine DD&A in a given period. We believe that this method of calculating DD&A charges each barrel of crude oil equivalent sold with its proportionate share of the cost of capital invested over the total estimated life of the related asset as represented by proved reserves. The average depletion rate was approximately $9.20 per BOE for the three and six months ended June 30, 2019 (2018 – $10.35 per BOE).
For the three and six months ended June 30, 2019 total Deep Basin DD&A was $83 million and $169 million, respectively (2018 – $107 million and $311 million). The decrease was due to the divestiture of CPP and a lower depletion rate. On a year-to-date basis in 2018, DD&A included an impairment loss of $100 million on the Clearwater cash-generating unit which was reversed at December 31, 2018.
Cenovus Energy Inc. – Q2 2019 Management’s Discussion and Analysis | | 23 |
| | |
REFINING AND MARKETING
In the second quarter of 2019 we:
• | Increased rail volumes loaded at the Bruderheim crude-by-rail terminal, averaging 53,539 barrels per day compared with 21,756 barrels per day in the second quarter of 2018; |
• | Achieved crude oil runs averaging 474,000 barrels per day, a slight increase compared with the second quarter of 2018; and |
• | Generated Operating Margin of $198 million, a decrease of $159 million compared with 2018 due to a lower crude advantage and higher operating costs. |
Refinery Operations (1)
| Three Months Ended June 30, | | | Six Months Ended June 30, | |
| 2019 | | | 2018 | | | 2019 | | | 2018 | |
Crude Oil Capacity (Mbbls/d) | | 482 | | | | 460 | | | | 482 | | | | 460 | |
Crude Oil Runs (Mbbls/d) | | 474 | | | | 464 | | | | 425 | | | | 407 | |
Heavy Crude Oil | | 194 | | | | 203 | | | | 168 | | | | 183 | |
Light/Medium | | 280 | | | | 261 | | | | 257 | | | | 224 | |
Refined Products (Mbbls/d) | | 501 | | | | 490 | | | | 451 | | | | 430 | |
Gasoline | | 227 | | | | 233 | | | | 220 | | | | 211 | |
Distillate | | 183 | | | | 158 | | | | 159 | | | | 139 | |
Other | | 91 | | | | 99 | | | | 72 | | | | 80 | |
Crude Utilization (percent) | | 98 | | | | 101 | | | | 88 | | | | 88 | |
(1) | Represents 100 percent of the Wood River and Borger refinery operations. Cenovus’s interest is 50 percent. |
On a 100 percent basis, the Refineries had their total processing capacity re-rated on January 1, 2019 to 482,000 gross barrels per day of crude oil, including processing capability of up to 255,000 gross barrels per day of blended heavy crude oil and 45,000 gross barrels per day of NGLs. The ability to process a wide slate of crude oils allows the Refineries to economically integrate heavy crude oil production. Processing less expensive crude oil relative to WTI creates a feedstock cost advantage, illustrated by the discount of both WCS and WTS relative to WTI. The amount of heavy crude oil processed, such as WCS and CDB, is dependent on the quality and quantity of available crude oil with the total input slate optimized at each refinery to maximize economic benefit. Crude utilization represents the percentage of total crude oil processed in the Refineries relative to the total capacity.
For the three months ended June 30, 2019, total crude oil runs and refined product output increased compared with the second quarter of 2018, partially offset by unplanned outages at both refineries and impacts at Wood River due to pipeline outages and flooding on the Mississippi River. On a year-to-date basis, crude oil runs and refined product output increased compared with the prior year, as planned and unplanned outages at the Refineries in 2019, including a fire in a crude unit at Wood River in the first quarter of 2019, had less of an impact than major planned turnarounds at the Refineries in 2018.
Crude-By-Rail Terminal
We continue to increase total rail volumes loaded at our Bruderheim crude-by-rail terminal. In the three months ended June 30, 2019, we loaded an average of 53,539 barrels per day at our Bruderheim crude-by-rail facility (29,839 barrels per day of our volumes) compared with an average of 21,756 barrels per day (16,979 barrels per day of our volumes) in the second quarter of 2018. On a year-to-date basis, we loaded an average of 53,188 barrels per day (32,001 barrels per day of our volumes) from our Bruderheim crude-by-rail terminal compared with an average of 18,997 barrels per day (14,437 barrels per day of our volumes) in the first six months of 2018.
Financial Results
| Three Months Ended June 30, | | | Six Months Ended June 30, | |
($ millions) | 2019 | | | 2018 (1) | | | 2019 | | | 2018 (1) | |
Revenues | | 2,849 | | | | 2,777 | | | | 5,538 | | | | 5,009 | |
Purchased Product | | 2,441 | | | | 2,224 | | | | 4,604 | | | | 4,181 | |
Gross Margin | | 408 | | | | 553 | | | | 934 | | | | 828 | |
Expenses | | | | | | | | | | | | | | | |
Operating | | 214 | | | | 197 | | | | 443 | | | | 515 | |
(Gain) Loss on Risk Management | | (4 | ) | | | (1 | ) | | | (11 | ) | | | 4 | |
Operating Margin | | 198 | | | | 357 | | | | 502 | | | | 309 | |
Capital Investment | | 72 | | | | 35 | | | | 127 | | | | 88 | |
Operating Margin Net of Related Capital Investment | | 126 | | | | 322 | | | | 375 | | | | 221 | |
(1) | IFRS 16 was adopted January 1, 2019 using the modified retrospective approach; therefore, comparative information has not been restated. Refer to the Critical Accounting Judgments, Estimation Uncertainties and Accounting Policies section in this MD&A. |
Cenovus Energy Inc. – Q2 2019 Management’s Discussion and Analysis | | 24 |
| | |
Gross Margin
The refining realized crack spread, which is the gross margin on a per barrel basis, is affected by many factors, such as the variety of feedstock crude oil processed; refinery configuration and the proportion of gasoline, distillate and secondary product output; the time lag between the purchase of crude oil feedstock and the processing of that crude oil through the Refineries; and the cost of feedstock. Feedstock costs are valued on a FIFO accounting basis.
In the three months ended June 30, 2019, Refining and Marketing gross margin decreased 26 percent compared with the same period in 2018 due to lower crude advantage from narrowing heavy and medium sour crude oil differentials, partially offset by higher market crack spreads. In the six months ended June 30, 2019, Refining and Marketing gross margin increased $106 million. The increase resulted from higher market crack spreads, higher crude oil runs, higher margins on fixed priced products due to a lower benchmark WTI, and a reduction in the cost of RINs, partially offset by lower crude advantage from narrowing heavy and medium sour crude oil differentials. Our gross margin was positively impacted by approximately $14 million and $38 million for the three and six months ended June 30, 2019, respectively, due to the weakening of the Canadian dollar relative to the U.S. dollar.
In the three and six months ended June 30, 2019, the cost of RINs was $23 million and $49 million, respectively (2018 – $34 million and $81 million, respectively). RIN costs declined, despite higher volume obligations in 2019, due primarily to the decrease in RINs benchmark prices as a result of small refiners being granted exemptions from volume obligations.
Operating Expense
Primary drivers of operating expenses in the second quarter of 2019 were labour, maintenance and utilities. Operating expenses increased in the second quarter of 2019 primarily due to higher labour cost and an increase in costs associated with maintenance.
For the six months ended June 30, 2019, the primary drivers of operating expenses were labour, maintenance and utilities. Operating expenses decreased on a year-to-date basis primarily due to higher planned turnaround costs in 2018.
Refining and Marketing – Capital Investment
| Three Months Ended June 30, | | | Six Months Ended June 30, | |
($ millions) | 2019 | | | 2018 (1) | | | 2019 | | | 2018 (1) | |
Wood River Refinery | | 32 | | | | 23 | | | | 55 | | | | 58 | |
Borger Refinery | | 31 | | | | 11 | | | | 57 | | | | 28 | |
Marketing | | 9 | | | | 1 | | | | 15 | | | | 2 | |
Capital Investment | | 72 | | | | 35 | | | | 127 | | | | 88 | |
(1) | IFRS 16 was adopted January 1, 2019 using the modified retrospective approach; therefore, comparative information has not been restated. Refer to the Critical Accounting Judgments, Estimation Uncertainties and Accounting Policies section of this MD&A for further information. |
Capital expenditures in the first half of 2019 and during the second quarter focused primarily on yield enhancements and capital maintenance projects as well as strategic rail initiatives and infrastructure.
In 2019, we expect to invest between $240 million and $275 million and will continue to focus on capital maintenance, reliability work and yield improvement projects. Our guidance dated April 23, 2019 is available on our website at cenovus.com.
DD&A
Refining and the crude-by-rail terminal assets are depreciated on a straight-line basis over the estimated service life of each component of the facilities, which range from three to 60 years. The service lives of these assets are reviewed on an annual basis. ROU assets are depreciated on a straight-line basis over the shorter of the estimated useful life of the asset or the lease term. For the three and six months ended June 30, 2019, Refining and Marketing DD&A was $68 million and $148 million, respectively, compared with $55 million and $109 million for the same periods in 2018. The increase is primarily attributable to depreciation of our ROU assets which commenced January 1, 2019 on the adoption of IFRS 16.
CORPORATE AND ELIMINATIONS
In the three and six months ended June 30, 2019, our risk management activities resulted in unrealized risk management gains of $88 million (2018 – gains of $122 million) and losses of $148 million (2018 – gains of $261 million), respectively. We had realized risk management gains of $1 million on foreign exchange and interest rate swap contracts in the first half of 2019 (2018 – loss of $1 million).
Cenovus Energy Inc. – Q2 2019 Management’s Discussion and Analysis | | 25 |
| | |
| Three Months Ended June 30, | | | Six Months Ended June 30, | |
($ millions) | 2019 | | | 2018 (1) | | | 2019 | | | 2018 (1) | |
General and Administrative | | 65 | | | | 106 | | | | 137 | | | | 226 | |
Onerous Contract Provisions | | (6 | ) | | | 3 | | | | (7 | ) | | | 62 | |
Finance Costs | | 114 | | | | 156 | | | | 238 | | | | 306 | |
Interest Income | | (4 | ) | | | (3 | ) | | | (6 | ) | | | (6 | ) |
Foreign Exchange (Gain) Loss, Net | | (155 | ) | | | 212 | | | | (353 | ) | | | 489 | |
Re-measurement of Contingent Payment | | (109 | ) | | | 377 | | | | 154 | | | | 494 | |
Research Costs | | 6 | | | | 7 | | | | 10 | | | | 19 | |
(Gain) Loss on Divestiture of Assets | | (1 | ) | | | (1 | ) | | | 4 | | | | (1 | ) |
Other (Income) Loss, Net | | (2 | ) | | | 2 | | | | 7 | | | | - | |
| | (92 | ) | | | 859 | | | | 184 | | | | 1,589 | |
(1) | IFRS 16 was adopted January 1, 2019 using the modified retrospective approach; therefore, comparative information has not been restated. Refer to the Critical Accounting Judgments, Estimation Uncertainties and Accounting Policies section in this MD&A. |
Expenses
General and Administrative
Primary drivers of our general and administrative expenses were workforce costs and office rent. General and administrative costs decreased by $41 million in the second quarter of 2019, primarily driven by lower rent expense due to the adoption of IFRS 16 and lower long-term employee incentive costs compared with the second quarter of 2018. On a year-to-date basis, general and administrative expenses decreased $89 million primarily due to lower headcount, minimal severance costs in 2019 compared with $47 million in 2018, and lower rent expense due to the adoption of IFRS 16.
Onerous Contract Provisions
In 2019, onerous contract provisions are composed of non-lease components of real estate contracts which consist of operating costs and unreserved parking. In 2018, onerous contract provisions included the lease components of base rent and reserved parking as well as the non-lease components.
In the three and six months ended June 30, 2019, we recorded a non-cash recovery for onerous contracts of $6 million and $7 million, respectively, due to an update in the underlying assumptions associated with Calgary office space in excess of current and near-term requirements (2018 – expense of $3 million and $62 million, respectively).
Finance Costs
Finance costs include interest expense on our short-term borrowings, long-term debt, and lease liability (as at January 1, 2019), as well as the discount on redemption of long-term debt and unwinding of the discount on decommissioning liabilities. Finance costs decreased by $42 million in the three months ended June 30, 2019 compared with 2018 due to the significant reduction of total debt and a discount of $32 million on the repurchase of certain unsecured notes, partially offset by an increase in interest of $20 million related to lease liabilities from the adoption of IFRS 16. On a year-to-date basis, finance costs decreased by $68 million compared with 2018 due to the significant reduction of total debt which resulted in decreased interest and a discount of $64 million on the repurchase of unsecured notes in 2019, partially offset by an increase in interest of $39 million related to lease liabilities from the adoption of IFRS 16.
The weighted average interest rate on outstanding debt for the three and six months ended June 30, 2019 was 5.1 percent (2018 – 5.1 percent).
Foreign Exchange
| Three Months Ended June 30, | | | Six Months Ended June 30, | |
($ millions) | 2019 | | | 2018 | | | 2019 | | | 2018 | |
Unrealized Foreign Exchange (Gain) Loss | | (419 | ) | | | 213 | | | | (648 | ) | | | 495 | |
Realized Foreign Exchange (Gain) Loss | | 264 | | | | (1 | ) | | | 295 | | | | (6 | ) |
| | (155 | ) | | | 212 | | | | (353 | ) | | | 489 | |
In the three and six months ended June 30, 2019, unrealized foreign exchange gains of $419 million and $648 million, respectively, were recorded primarily as a result of the translation of our U.S. dollar denominated debt. The Canadian dollar relative to the U.S. dollar as at June 30, 2019 was slightly stronger compared with March 31, 2019 and four percent stronger compared with December 31, 2018. For the three and six months ended June 30, 2019, realized foreign exchange losses of $264 million and $295 million, respectively, were recorded primarily as a result of the recognition of foreign exchange losses from the repurchase of debt.
Cenovus Energy Inc. – Q2 2019 Management’s Discussion and Analysis | | 26 |
| | |
Re-measurement of Contingent Payment
Related to oil sands production, Cenovus has agreed to make quarterly payments to ConocoPhillips Company and certain of its subsidiaries (“ConocoPhillips”) during the five years subsequent to the closing date of the acquisition of Deep Basin assets from ConocoPhillips in conjunction with their 50 percent interest in the FCCL Partnership on May 17, 2017 (the “Acquisition”) for quarters in which the average WCS crude oil price exceeds $52 per barrel during the quarter. The quarterly payment is $6 million for each dollar that the WCS price exceeds $52 per barrel. There are no maximum payment terms. The calculation includes an adjustment mechanism related to certain significant production outages at Foster Creek and Christina Lake, which may reduce the amount of a contingent payment.
The contingent payment is accounted for as a financial option. The fair value of $187 million as at June 30, 2019 was estimated by calculating the present value of the future expected cash flows using an option pricing model. The contingent payment is re-measured at fair value at each reporting date with changes in fair value recognized in net earnings. For the three months ended June 30, 2019, a non-cash re‑measurement gain of $109 million was recorded and for the six months ended June 30, 2019, we recorded a re-measurement loss of $154 million. In April 2019, $25 million was paid to ConocoPhillips and as at June 30, 2019, an additional $74 million is payable under this agreement.
Average WCS forward pricing for the remaining term of the contingent payment is C$45.17 per barrel. Estimated quarterly WCS forward prices for the remaining term of the agreement range between approximately C$42.40 per barrel and C$52.80 per barrel.
Corporate – Capital Investment
Capital expenditures of $66 million in the first half of 2019 focused primarily on the build-out of office space at Brookfield Place and information technology capital.
In 2019, we expect to invest between $150 million and $175 million, the majority of which is for the build-out of office space at Brookfield Place. Guidance dated April 23, 2019 is available on our website at cenovus.com.
DD&A
Corporate and Eliminations DD&A includes provisions in respect of corporate assets, such as computer equipment, leasehold improvements and office furniture. Costs associated with corporate assets are depreciated on a straight‑line basis over the estimated service life of the assets, which range from three to 25 years. The service lives of these assets are reviewed on an annual basis. ROU assets (real estate assets) are depreciated on a straight-line basis over the shorter of the estimated useful life of the asset or the lease term. DD&A in the second quarter of 2019 was $26 million (2018 – $14 million) and $57 million on a year-to-date basis (2018 – $29 million).
Income Tax
| Three Months Ended June 30, | | | Six Months Ended June 30, | |
($ millions) | 2019 | | | 2018 | | | 2019 | | | 2018 | |
Current Tax | | | | | | | | | | | | | | | |
Canada | | 8 | | | | (35 | ) | | | 12 | | | | (93 | ) |
United States | | 3 | | | | - | | | | 5 | | | | 4 | |
Current Tax Expense (Recovery) | | 11 | | | | (35 | ) | | | 17 | | | | (89 | ) |
Deferred Tax Expense (Recovery) | | (877 | ) | | | 55 | | | | (836 | ) | | | (49 | ) |
Total Tax Expense (Recovery) From Continuing Operations | | (866 | ) | | | 20 | | | | (819 | ) | | | (138 | ) |
The following table reconciles income taxes calculated at the Canadian statutory rate with the recorded income taxes:
($ millions) | 2019 | | | 2018 | |
Earnings (Loss) From Continuing Operations Before Income Tax | | 1,075 | | | | (1,462 | ) |
Canadian Statutory Rate (percent) | | 26.5 | | | | 27.0 | |
Expected Income Tax Expense (Recovery) From Continuing Operations | | 285 | | | | (395 | ) |
Effect of Taxes Resulting From: | | | | | | | |
Foreign Tax Rate Differential | | (30 | ) | | | (23 | ) |
Non-Taxable Capital (Gains) Losses | | (52 | ) | | | 131 | |
Non-Recognition of Capital (Gains) Losses | | (52 | ) | | | 131 | |
Reduction of Alberta corporate tax rate | | (658 | ) | | | - | |
Recognition of U.S. Tax Basis | | (387 | ) | | | (1 | ) |
Other | | 75 | | | | 19 | |
Total Tax Expense (Recovery) From Continuing Operations | | (819 | ) | | | (138 | ) |
Effective Tax Rate (percent) | | (76.2 | ) | | | 9.4 | |
Cenovus Energy Inc. – Q2 2019 Management’s Discussion and Analysis | | 27 |
| | |
Tax interpretations, regulations and legislation in the various jurisdictions in which Cenovus and its subsidiaries operate are subject to change. We believe that our provision for income taxes is adequate. There are usually a number of tax matters under review and as a result, income taxes are subject to measurement uncertainty. The timing of the recognition of income and deductions for the purpose of current tax expense is determined by relevant tax legislation.
A current tax expense was recorded for the six months ended June 30, 2019 compared with a recovery in 2018 due to the carry back of losses in 2018 to recover tax paid in previous years.
On May 28, 2019, the Government of Alberta substantively enacted a reduction in the provincial corporate tax rate from 12 percent to eight percent over four years. As a result, our deferred income tax liability decreased by $658 million as at June 30, 2019. In addition, we have recorded a deferred income tax recovery of $387 million due to an internal restructuring of our U.S. operations resulting in a step-up in the tax basis of our refining assets.
Our effective tax rate is a function of the relationship between total tax expense (recovery) and the amount of earnings (loss) before income taxes. The effective tax rate differs from the statutory tax rate as it reflects different tax rates in other jurisdictions, non-taxable foreign exchange (gains) losses, adjustments for changes in tax rates and other tax legislation, adjustments to the tax basis of the refining assets, variations in the estimate of reserves, differences between the provision and the actual amounts subsequently reported on the tax returns, and other permanent differences.
DISCONTINUED OPERATIONS
On January 5, 2018, we completed the sale of the Suffield crude oil and natural gas operations in southern Alberta for cash proceeds of $512 million, before closing adjustments. After-tax earnings from discontinued operations for the six months ended June 30, 2018 were $29 million. An after-tax gain on discontinuance of $223 million was recorded on the sale.
LIQUIDITY AND CAPITAL RESOURCES
| Three Months Ended June 30, | | | Six Months Ended June 30, | |
($ millions) | 2019 | | | 2018 | | | 2019 | | | 2018 | |
Cash From (Used In) | | | | | | | | | | | | | | | |
Operating Activities – Continuing Operations | | 1,275 | | | | 506 | | | | 1,711 | | | | 372 | |
Operating Activities – Discontinued Operations | | - | | | | 27 | | | | - | | | | 38 | |
Total Operating Activities | | 1,275 | | | | 533 | | | | 1,711 | | | | 410 | |
Investing Activities – Continuing Operations | | (309 | ) | | | (464 | ) | | | (623 | ) | | | (954 | ) |
Investing Activities – Discontinued Operations | | - | | | | (37 | ) | | | - | | | | 414 | |
Total Investing Activities | | (309 | ) | | | (501 | ) | | | (623 | ) | | | (540 | ) |
Net Cash Provided (Used) Before Financing Activities | | 966 | | | | 32 | | | | 1,088 | | | | (130 | ) |
Financing Activities | | (1,136 | ) | | | (77 | ) | | | (1,788 | ) | | | (136 | ) |
Foreign Exchange Gain (Loss) on Cash and Cash Equivalents Held in Foreign Currency | | (10 | ) | | | 16 | | | | (17 | ) | | | 32 | |
Increase (Decrease) in Cash and Cash Equivalents | | (180 | ) | | | (29 | ) | | | (717 | ) | | | (234 | ) |
| | | | | | | | | | | | | | | |
| | | | | | | | | June 30, 2019 | | | December 31, 2018 | |
Cash and Cash Equivalents | | | | | | | | | | 64 | | | | 781 | |
Committed and Undrawn Credit Facility | | | | | | | | | | 4,500 | | | | 4,500 | |
Cash From (Used In) Operating Activities
In the three months ended June 30, 2019, cash generated by operating activities increased mainly due to:
• | Higher Operating Margin, as discussed in the Financial Results section of this MD&A; |
• | A decrease in general and administrative costs; |
• | A decrease in finance costs, as discussed in the Corporate and Eliminations section of this MD&A; and |
• | Changes in non‑cash working capital, as discussed in the Financial Results section of this MD&A. |
The increases in cash from operating activities were partially offset by an increase in current income tax expense.
In the six months ended June 30, 2019, cash from operating activities increased mainly as a result of:
• | Higher Operating Margin, as discussed in the Financial Results section of this MD&A; |
• | A decrease in general and administrative costs, primarily due to $47 million of severance costs recognized in 2018; and |
• | A decrease in finance costs, as discussed in the Corporate and Eliminations section of this MD&A. |
Cenovus Energy Inc. – Q2 2019 Management’s Discussion and Analysis | | 28 |
| | |
The increases in cash from operating activities for the six months ended June 30, 2018 were partially offset by an increase in current income tax expense and changes in non‑cash working capital, as discussed in the Financial Results section of this MD&A.
Excluding risk management assets and liabilities and the current portion of the contingent payment, our working capital was $109 million at June 30, 2019 compared with $450 million at December 31, 2018.
We anticipate that we will continue to meet our payment obligations as they come due.
Cash From (Used In) Investing Activities
Cash used in investing activities in the three and six months ended June 30, 2019 was lower compared with 2018 due to decreased capital investment.
Cash From (Used In) Financing Activities
On June 4, 2019, we announced cash tender offers (“Tender Offers”) to purchase up to US$500 million aggregate principal amount of our outstanding 4.45 percent notes due 2042, 5.20 percent notes due 2043, 3.00 percent notes due 2022, 4.25 percent notes due 2027, 5.25 percent notes due 2037, 5.40 percent notes due 2047 and 3.80 percent notes due 2023. The Tender Offers were fully subscribed, and we increased the overall principal amount of the repurchase to US$748 million. On June 19, 2019, we completed the repurchase of US$748 million in principal of notes due 2042 and 2043, and a gain on the repurchase of C$27 million was recorded in finance costs.
In addition, during the three months ended June 30, 2019, we paid US$63 million to repurchase a portion of our unsecured notes with a principal amount of US$66 million and a gain on the repurchase of C$5 million was recorded in finance costs.
During the six months ended June 30, 2019, we repaid US$1.3 billion of unsecured notes for cash consideration of US$1.2 billion ($1.6 billion). Total debt as at June 30, 2019 was $7,152 million (December 31, 2018 – $9,164 million), with principal payments of US$500 million due on October 15, 2019.
As at June 30, 2019, we were in compliance with all of the terms of our debt agreements.
Dividends
In the three and six months ended June 30, 2019, we paid dividends of $0.05 per common share or $62 million and $0.10 per common share or $123 million, respectively (2018 – $0.05 per common share or $62 million and $0.10 per common share or $122 million). The declaration of dividends is at the sole discretion of the Board and is considered quarterly.
Available Sources of Liquidity
We expect cash flows from our upstream and refining operations to fund all of our cash requirements in 2019. Any potential shortfalls may be funded through prudent use of our balance sheet capacity including draws on our credit facility, management of our asset portfolio and other corporate and financial opportunities that may be available to us. We remain committed to maintaining our investment grade credit ratings at S&P Global Ratings, DBRS Limited and Fitch Ratings.
The following sources of liquidity are available at June 30, 2019:
($ millions) | Term | | | Amount | |
Cash and Cash Equivalents | Not applicable | | | | 64 | |
Committed Credit Facility – Tranche A | November 2022 | | | | 3,300 | |
Committed Credit Facility – Tranche B | November 2021 | | | | 1,200 | |
Committed Credit Facility
We have a committed credit facility in place that consists of a $1.2 billion tranche maturing on November 30, 2021 and $3.3 billion tranche maturing on November 30, 2022. As of June 30, 2019, no amounts were drawn on our committed credit facility.
Base Shelf Prospectus
Cenovus has in place a base shelf prospectus which expires in November 2019. As at June 30, 2019, US$4.6 billion remains available under the base shelf prospectus. Offerings under the base shelf prospectus are subject to market conditions.
Financial Metrics
We monitor our capital structure and financing requirements using, among other things, non-GAAP financial metrics consisting of Net Debt to Adjusted EBITDA and Net Debt to Capitalization. We define our non-GAAP measure of Net Debt as short-term borrowings, and the current and long-term portions of long-term debt, net of cash and cash equivalents. We define Capitalization as Net Debt plus Shareholders’ Equity. We define Adjusted EBITDA as net earnings before finance costs, interest income, income tax expense, DD&A, E&E Write-down, goodwill impairments, asset impairments and reversals, unrealized gains (losses) on risk management, foreign
Cenovus Energy Inc. – Q2 2019 Management’s Discussion and Analysis | | 29 |
| | |
exchange gains (losses), revaluation gain, re-measurement of contingent payment, gains (losses) on divestiture of assets, and other income (loss), net, calculated on a trailing twelve-month basis. These measures are used to steward our overall debt position and as measures of our overall financial strength.
As at | June 30, 2019 | | | December 31, 2018 | |
Net Debt to Capitalization (percent) | | 27 | | | | 32 | |
Net Debt to Adjusted EBITDA (1) | 2.4x | | | 5.9x | |
(1) | IFRS 16 was adopted January 1, 2019 using the modified retrospective approach; therefore, comparative information has not been restated. Refer to the Critical Accounting Judgments, Estimation Uncertainties and Accounting Policies section in this MD&A. |
Over the long-term, Cenovus targets a Net Debt to Adjusted EBITDA ratio of less than 2.0 times. At different points within the economic cycle, we expect this ratio may periodically be above the target. Our objective is to maintain a high level of capital discipline and manage our capital structure to help ensure sufficient liquidity through all stages of the economic cycle. To ensure financial resilience, Cenovus may, among other actions, adjust capital and operating spending, draw down on our credit facility or repay existing debt, adjust dividends paid to shareholders, purchase shares for cancellation pursuant to normal course issuer bids, issue new debt, or issue new shares. We also manage our Net Debt to Capitalization ratio to ensure compliance with the associated covenants as defined in our committed credit facility agreement.
Under the committed credit facility, Cenovus is required to maintain a debt to capitalization ratio not to exceed 65 percent; we are well below this limit.
Additional information regarding our financial measures and capital structure can be found in the notes to the interim Consolidated Financial Statements.
Share Capital and Stock-Based Compensation Plans
As at June 30, 2019, there were approximately 1,229 million common shares outstanding (2018 – 1,229 million common shares).
Refer to Note 21 of the interim Consolidated Financial Statements for more details on our Stock Option Plan and our Performance Share Unit, Restricted Share Unit and Deferred Share Unit Plans.
As at June 30, 2019 | Units Outstanding (thousands) | | | Units Exercisable (thousands) | |
Common Shares (1) | | 1,228,803 | | | N/A | |
Stock Options | | 32,214 | | | | 24,546 | |
Other Stock-Based Compensation Plans | | 17,071 | | | | 1,541 | |
(1) | ConocoPhillips continued to hold 208 million common shares issued as partial consideration related to the Acquisition. |
Contractual Obligations and Commitments
Cenovus has obligations for goods and services entered into in the normal course of business. Obligations are primarily related to transportation agreements, our risk management program and an obligation to fund our defined benefit pension and other post-employment benefit plans. Obligations that have original maturities of less than one year are excluded. For further information, see the notes to the interim Consolidated Financial Statements and December 31, 2018 Consolidated Financial Statements.
On January 1, 2019, the Company adopted IFRS 16, which resulted in the recognition of lease liabilities related to operating leases on the balance sheet. These liabilities were previously reported as commitments. For a reconciliation of our commitments as at December 31, 2018 to our lease liabilities as at January 1, 2019, see Note 3 to the interim Consolidated Financial Statements.
As at June 30, 2019, total commitments were $23.6 billion, of which $22.3 billion are for various transportation and storage commitments. Transportation commitments include $13.3 billion that are subject to regulatory approval or have been approved but are not yet in service (December 31, 2018 – $14 billion). Terms are up to 20 years subsequent to the date of commencement and should help align the Company’s future transportation requirements with anticipated production growth. Transportation and storage commitments include future commitments relating to railcar and storage tank leases of $233 million and $154 million, respectively, that have not yet commenced. The railcar leases are expected to commence in 2019 with lease terms between five and ten years and the storage tank leases are expected to commence in 2019 with lease terms of three and ten years.
We continue to focus on near and mid-term strategies to broaden market access for our crude oil production. We continue to support proposed new pipeline projects that would connect us to new markets in the U.S. and globally, moving our crude oil production to market by rail, and assessing options to maximize the value of our crude oil.
As at June 30, 2019, there were outstanding letters of credit aggregating $357 million issued as security for performance under certain contracts (December 31, 2018 – $336 million).
Cenovus Energy Inc. – Q2 2019 Management’s Discussion and Analysis | | 30 |
| | |
Legal Proceedings
We are involved in a limited number of legal claims associated with the normal course of operations. We believe that any liabilities that might arise from such matters, to the extent not provided for, are not likely to have a material effect on our interim Consolidated Financial Statements.
Contingent Payment
In connection with the Acquisition and related to oil sands production, we agreed to make quarterly payments to ConocoPhillips during the five years subsequent to May 17, 2017 for quarters in which the average WCS crude oil price exceeds $52 per barrel during the quarter. As at June 30, 2019, the estimated fair value of the contingent payment was $187 million. See the Corporate and Eliminations section of this MD&A for more details.
RISK MANAGEMENT AND RISK FACTORS
For a full understanding of the risks that impact Cenovus, the following discussion should be read in conjunction with the Risk Management and Risk Factors section of our 2018 annual MD&A.
Cenovus is exposed to a number of risks through the pursuit of our strategic objectives. Some of these risks impact the oil and gas industry as a whole and others are unique to our operations. The impact of any risk or a combination of risks may adversely affect, among other things, Cenovus’s business, reputation, financial condition, results of operations and cash flows, which may reduce or restrict our ability to pay a dividend to our shareholders and may materially affect the market price of our securities.
The following provides an update on our risks related to commodity prices.
Commodity Prices
Fluctuations in commodity prices and refined product prices impact our financial condition, results of operations, cash flows, growth, access to capital and cost of borrowing.
We partially mitigate our exposure to commodity price risk through the integration of our business, financial instruments, physical contracts and market access commitments. Financial instruments undertaken within our refining business by the operator, Phillips 66, are primarily for purchased product. For details of our financial instruments, including classification, assumptions made in the calculation of fair value and additional discussion on exposure of risks and the management of those risks, see Notes 22 and 23 to the interim Consolidated Financial Statements.
Risks Associated with Derivative Financial Instruments
Financial instruments expose Cenovus to the risk that a counterparty will default on its contractual obligations. This risk is partially mitigated through credit exposure limits, frequent assessment of counterparty credit ratings and netting arrangements, as outlined in our Credit Policy.
Financial instruments also expose Cenovus to the risk of a loss from adverse changes in the market value of financial instruments or if we are unable to fulfill our delivery obligations related to the underlying physical transaction. Financial instruments may limit the benefit to Cenovus if commodity prices increase. These risks are managed through hedging limits that are reviewed annually by the Board, as required by our Market Risk Mitigation Policy.
Impact of Financial Risk Management Activities
| Three Months Ended June 30, | |
| 2019 | | | 2018 | |
($ millions) | Realized | | Unrealized | | Total | | | Realized | | Unrealized | | Total | |
Crude Oil | | 57 | | | (88 | ) | | (31 | ) | | | 698 | | | (109 | ) | | 589 | |
Refining | | (4 | ) | | - | | | (4 | ) | | | (1 | ) | | (3 | ) | | (4 | ) |
Interest Rate | | - | | | - | | | - | | | | - | | | (10 | ) | | (10 | ) |
Foreign Exchange | | (1 | ) | | - | | | (1 | ) | | | - | | | - | | | - | |
(Gain) Loss on Risk Management | | 52 | | | (88 | ) | | (36 | ) | | | 697 | | | (122 | ) | | 575 | |
Income Tax Expense (Recovery) | | (14 | ) | | 25 | | | 11 | | | | (191 | ) | | 33 | | | (158 | ) |
(Gain) Loss on Risk Management, After Tax | | 38 | | | (63 | ) | | (25 | ) | | | 506 | | | (89 | ) | | 417 | |
Cenovus Energy Inc. – Q2 2019 Management’s Discussion and Analysis | | 31 |
| | |
| Six Months Ended June 30, | |
| 2019 | | | 2018 | |
($ millions) | Realized | | Unrealized | | Total | | | Realized | | Unrealized | | Total | |
Crude Oil | | 45 | | | 142 | | | 187 | | | | 1,161 | | | (220 | ) | | 941 | |
Refining | | (11 | ) | | 1 | | | (10 | ) | | | 4 | | | (6 | ) | | (2 | ) |
Interest Rate | | 1 | | | 7 | | | 8 | | | | - | | | (35 | ) | | (35 | ) |
Foreign Exchange | | (2 | ) | | (2 | ) | | (4 | ) | | | 1 | | | - | | | 1 | |
(Gain) Loss on Risk Management | | 33 | | | 148 | | | 181 | | | | 1,166 | | | (261 | ) | | 905 | |
Income Tax Expense (Recovery) | | (9 | ) | | (37 | ) | | (46 | ) | | | (317 | ) | | 70 | | | (247 | ) |
(Gain) Loss on Risk Management, After Tax | | 24 | | | 111 | | | 135 | | | | 849 | | | (191 | ) | | 658 | |
In the second quarter of 2019 and on a year-to-date basis, we incurred realized losses on crude oil risk management activities as settlement prices exceeded our contract prices. Unrealized gains of $88 million and unrealized losses of $142 million were recorded on our crude oil financial instruments in the three and six months ended June 30, 2019, respectively, primarily due to the realization of settled positions and changes in market prices.
CRITICAL ACCOUNTING JUDGMENTS, ESTIMATion Uncertainties AND ACCOUNTING POLICIES
Management is required to make estimates and assumptions, and use judgment in the application of accounting policies that could have a significant impact on our financial results. Actual results may differ from estimates and those differences may be material. The estimates and assumptions used are subject to updates based on experience and the application of new information. Our critical accounting policies and estimates are reviewed annually by the Audit Committee of the Board. Further details on the basis of preparation and our significant accounting policies can be found in the notes to the Consolidated Financial Statements.
Critical Judgments in Applying Accounting Policies
Critical judgments are those judgments made by Management in the process of applying accounting policies that have the most significant effect on the amounts recorded in our annual and interim Consolidated Financial Statements. Further to those areas discussed in the annual Consolidated Financial Statement for the year ended December 31, 2018 and the annual MD&A, determining the lease term under IFRS 16, requires critical judgments.
Management considers all facts and circumstances that create an economic incentive to exercise an extension option, or not exercise a termination option on a lease. The assessment is reviewed if a significant event or a significant change in circumstances occurs which affects this assessment.
Key Sources of Estimation Uncertainty
Critical accounting estimates are those estimates that require Management to make particularly subjective or complex judgments about matters that are inherently uncertain. Estimates and underlying assumptions are reviewed on an ongoing basis and any revisions to accounting estimates are recorded in the period in which the estimates are revised. There have been no changes to our key sources of estimation uncertainty during the six months ended June 30, 2019.
Further information can be found in the notes to the Consolidated Financial Statements and annual MD&A for the year ended December 31, 2018.
Changes in Accounting Policies
Leases
Effective January 1, 2019, we adopted IFRS 16. We applied the new standard using the modified retrospective approach. The modified retrospective approach does not require restatement of prior period financial information as it recognizes the cumulative effect as an adjustment to opening retained earnings and applies the standard prospectively. Therefore, the comparative information in the consolidated balance sheet, consolidated statements of earnings, other comprehensive income, shareholders’ equity and cash flows have not been restated.
On adoption, Management elected to use the following practical expedients permitted under the new standard:
• | Apply a single discount rate to a portfolio of leases with similar characteristics; |
• | Account for leases with a remaining term of less than twelve months as at January 1, 2019 as short-term leases; |
• | Account for lease payments as an expense and not recognize a ROU asset if the underlying asset is of a low dollar value; |
• | The use of hindsight in determining the lease term where the contract contains terms to extend or terminate the lease; |
Cenovus Energy Inc. – Q2 2019 Management’s Discussion and Analysis | | 32 |
| | |
• | Account for lease and non-lease components as a single lease component for lease liabilities related to storage tanks; and |
• | Use the Company’s previous assessment under IAS 37, “Provisions, Contingent Liabilities and Contingent Assets” (“IAS 37”) for onerous contracts instead of reassessing the ROU asset for impairment on January 1, 2019. |
IFRS 16 requires entities to recognize lease liabilities in relation to leases which had previously been classified as operating leases under the principles of IAS 17, “Leases” (“IAS 17”). Under the principles of the new standard these leases have been measured at the present value of the remaining lease payments, discounted using our incremental borrowing rates at January 1, 2019. Incremental borrowing rates as at January 1, 2019 range from 4.0 percent to 5.7 percent. Leases with a remaining term of less than twelve months and low-value leases were excluded. The associated ROU assets were measured at the amount equal to the lease liability on January 1, 2019 less any amount previously recognized under IAS 37 for onerous contracts with no impact on retained earnings.
The impact of the adoption of IFRS 16 as at January 1, 2019 is as follows:
• | Recorded lease liabilities of $1.5 billion, of which $128 million was the current portion; |
• | Recorded ROU assets of $893 million, equal to the lease liabilities less the previously recognized onerous contract provisions and a $16 million net investment in finance leases; |
• | Decreased the onerous contract provisions by $585 million, offsetting the ROU asset; and |
• | Recognized certain subleases as a net investment in finance leases ($16 million) that were classified as operating leases under IAS 17. |
The adoption of the new standard had the following impact to our year-to-date 2019 financial results compared with what would have occurred had we not adopted the new accounting policy:
• | Decrease in purchased product of $18 million; |
• | Decrease to transportation and blending costs of $32 million; |
• | Decrease to operating costs of $2 million; |
• | Decrease to general and administrative expenses of $35 million; |
• | Increase to DD&A expense of $73 million; and |
• | Increase in finance expenses of $39 million. |
Further information about changes to our accounting policies resulting from the adoption of IFRS 16 can be found in Note 3 to the interim Consolidated Financial Statements.
Uncertain Tax Positions
Effective January 1, 2019, we adopted International Financial Reporting Interpretation Committee (“IFRIC”) 23, “Uncertainty over Income Tax Treatments” using the modified approach. The interpretation provides clarity on how to account for a tax position when there is uncertainty over income tax treatments. In determining the likely resolution of the uncertain tax positions, a position may be considered separately or as a group. In addition, an assessment is required to determine the probability that the tax authority will accept the tax position taken in income tax filings. If the uncertain income tax treatment is unlikely to be accepted, the accounting tax position must reflect an appropriate level of uncertainty. An uncertain tax position may be reassessed if new information changes the original assessment. The adoption of IFRIC 23 did not have a material impact on the interim Consolidated Financial Statements.
New Accounting Standards and Interpretations not yet Adopted
There were no new or amended standards issued during the six months ended June 30, 2019 that are applicable to Cenovus in future periods.
CONTROL ENVIRONMENT
There have been no changes to internal control over financial reporting (“ICFR”) during the three months ended June 30, 2019 that have materially affected, or are reasonably likely to materially affect ICFR.
Internal control systems, no matter how well designed, have inherent limitations. Therefore, even those systems determined to be effective can provide only reasonable assurance with respect to financial statement preparation and presentation. Also, projections of any evaluation of effectiveness to future periods are subject to the risk that controls may become inadequate because of changes in conditions, or that the degree of compliance with the policies or procedures may deteriorate.
OUTLOOK
We expect the remainder of 2019 will see continued commodity price volatility and market access constraints for heavy oil exiting Alberta. Transportation challenges will continue to negatively impact heavy oil prices, demonstrating the need for increased rail export capabilities and approved pipeline projects, such as the Trans Mountain Pipeline Expansion (“TMX”) Project, to proceed as soon as possible. While our production levels have
Cenovus Energy Inc. – Q2 2019 Management’s Discussion and Analysis | | 33 |
| | |
been impacted by the government mandated production curtailments, the resulting narrowing price differentials are anticipated to continue to have a positive impact on our cash flows. Curtailment restrictions are expected to remain in place over the remainder of 2019 and into 2020. Increased crude‑by-rail volumes should help ease takeaway capacity constraints. Ramp up of Christina Lake phase G production will depend on production curtailments, crude-by-rail takeaway capacity ramping up and the reduction of pipeline congestion.
We continue to look for ways to increase our margins through strong operating performance and cost leadership, while focusing on safe and reliable operations. Proactively managing our market access commitments and opportunities assists with our goal of reaching a broader customer base to secure a higher sales price for our liquids production. We continue to take delivery of railcars to support our plan to increase crude-by-rail shipments to approximately 100,000 barrels per day by the end of 2019, as pipeline project approvals and construction continue to be stalled.
We have reduced the amount of capital needed to sustain our base business and expand our projects, through a continued focus on capital discipline and cost reduction, which we believe will further help support our financial resilience.
The following outlook commentary is focused on the next twelve months.
Commodity Prices Underlying our Financial Results
Our crude oil pricing outlook is influenced by the following:
• | We expect the general outlook for light crude oil prices will be tied primarily to the supply response to the current price environment, the impact of potential supply disruptions, and global demand impacts amid the escalation of trade conflicts; |
• | Overall, crude oil price volatility is expected to decrease as global inventories return to historical levels; |
• | Continuing OPEC supply cuts until March 2020, enforcement of Iranian sanctions, and Venezuelan production declines will be supportive of the narrowing of global light-heavy crude oil price differentials; |
• | We expect that the WTI-WCS differential will remain largely tied to the extent to which production curtailments in Alberta remain in place, the completion of the TMX Project, the potential start-up of Enbridge Inc.’s Line 3 Replacement Program, the extent to which the political turmoil in Venezuela continues and increasing crude-by-rail activity will reduce storage levels and support narrower differentials; |
• | We anticipate that the pending International Maritime Organization regulations will cause light-heavy crude oil price differentials to widen, although the magnitude of the widening remains uncertain; and |
• | We expect refining crack spreads will likely continue to fluctuate, adjusting for seasonal trends, and will narrow and widen in tandem with the Brent-WTI differentials. |
Natural gas prices are anticipated to remain challenged with North American supply continuing to grow as a result of U.S. shale gas drilling and associated natural gas from oil plays. The AECO basis differential is expected to remain wide as increasing supply is anticipated to exceed the limits of existing pipeline capacity.
We expect the Canadian dollar to continue to be tied to crude oil prices, the pace at which the U.S. Federal Reserve Board and the Bank of Canada raise or lower benchmark lending rates relative to each other, and emerging macro‑economic factors. The Bank of Canada raised its benchmark lending rate in October 2018, but the rate has remained unchanged since, marking a notable shift for Canada towards easing future rate hikes.
Cenovus Energy Inc. – Q2 2019 Management’s Discussion and Analysis | | 34 |
| | |
Our exposure to the light-heavy crude oil price differentials is composed of both a global light-heavy component as well as Canadian transportation constraints. While we expect to see volatility in crude oil prices, we have the ability to partially mitigate the impact of light-heavy crude oil price differentials through the following:
• | Integration – having heavy oil refining capacity capable of processing Canadian heavy oil. From a value perspective, our refining business positions us to capture value from both the WTI-WCS differential for Canadian crude oil and the Brent-WTI differential from the sale of refined products; |
• | Transportation commitments and arrangements – supporting transportation projects that move crude oil from our production areas to consuming markets, including tidewater markets, as well as utilizing our crude-by-rail terminal and entering into agreements with third parties to move additional rail volumes to alleviate a portion of near-term takeaway capacity constraints; |
• | Marketing agreements – limiting the impact of fluctuations in upstream crude oil prices by entering into physical supply transactions with fixed price components directly with refiners; |
• | Dynamic storage – our ability to use the significant storage capacity in our oil sands reservoirs provides us flexibility on timing of production and sales of our inventory. We will continue to manage our production well rates in response to pipeline capacity constraints, crude-by-rail export capacity, mandated production curtailments and crude oil price differentials; and |
• | Financial hedge transactions – limiting the impact of fluctuations in upstream crude oil prices by entering into financial transactions that fix the WTI-WCS differential. |
Key Priorities For 2019
Deleveraging and Disciplined Capital Investment
In 2019, our commitment to balance sheet strength and capital discipline has allowed us to largely achieve our interim Net Debt target of $7.0 billion. Going forward, balance sheet strength, further deleveraging, and capital discipline will remain a focus for us. Our strong balance sheet has put us in a position to start to consider increasing shareholder returns as we continue to progress toward our longer-term Net Debt target of $5.0 billion. Improving our financial resilience and flexibility while continuing to deliver safe and reliable operations will continue to be a top priority.
In 2019, we anticipate capital investment to be between $1.2 billion and $1.4 billion. Our oil sands production is expected to range between 350,000 and 370,000 barrels per day for the remainder of 2019, depending on how long the mandated production curtailments remain in place, as well as the ramp up of our crude-by-rail program. We continue to plan to direct the majority of our 2019 capital budget towards sustaining oil sands production. We have flexibility on when we ramp up production from Christina Lake phase G, and will consider whether mandated production curtailments have been lifted and if there is sustained improvement in market access and heavy oil benchmark prices. In response to the current commodity price environment and our continued focus on near-term debt reduction, we are taking a very disciplined approach in the Deep Basin, with the goal of reducing costs, improving efficiencies and maximizing value. With integration remaining an important part of our overall strategy, capital investment is also allocated for reliability work at the Refineries.
As at June 30, 2019, our Net Debt position was $7.1 billion. Through a combination of cash on hand and available capacity on our committed credit facility, we have approximately $4.6 billion of liquidity as at June 30, 2019.
Over the long-term, we continue to target a Net Debt to Adjusted EBITDA ratio of less than 2.0 times. Our objective is to maintain a high level of capital discipline and manage our capital structure to help ensure sufficient liquidity through all stages of the economic cycle.
We remain committed to increasing shareholder value through cost leadership, capital discipline and safe and reliable operations. These commitments, in combination with our high-quality upstream assets and joint ownership in strong refining assets, are expected to strengthen our ability to generate free funds flow and continue to deleverage our balance sheet.
Cenovus Energy Inc. – Q2 2019 Management’s Discussion and Analysis | | 35 |
| | |
Market Access
Market access constraints for Canadian crude oil production continue to be a challenge. Our strategy is to maintain firm transportation commitments through a combination of pipelines, rail and marine access to support our growth plans, but leave capacity for optimization. We expect to supplement firm capacity with active blending, storage, sourcing and destination optimization to ensure we are maximizing the margin on every barrel we produce. We continue to take delivery of railcars under the agreements signed in late 2018. Delivery will continue through 2019, in line with our expected ramp up to 100,000 barrels per day shipped by rail.
Cost Leadership
Over the past four years, we have achieved significant improvements in our operating and sustaining capital costs. In 2019, we continue to look for ways to improve efficiencies across Cenovus to drive incremental capital, operating and general and administrative cost reductions. We expect to realize additional savings through improvements in areas such as drilling performance, development planning and optimized scheduling of oil sands well start-ups. Our ability to drive structural and sustainable cost and margin improvements will further support our business plan, financial resilience and our ability to generate shareholder value.
We believe growth in cash flows and further cost reductions will help us reach our Net Debt to Adjusted EBITDA target of less than 2.0 times.
Advance Focused Technology and Innovation to Achieve Margin Improvement
We have always believed that technology and innovation are differentiating factors in our industry. We focus our innovation efforts on accelerating the adoption of technology solutions and methods of operating to enhance safety, reduce costs, improve margins and lower emissions. We expect innovation at Cenovus to mean significant improvements and game-changing developments that are implemented to generate value. We aim to complement our internal technology development efforts with external collaboration in an effort to leverage our technology spend.
ADVISORY
Oil and Gas Information
The estimates of reserves were prepared effective December 31, 2018 by independent qualified reserves evaluators, based on the Canadian Oil and Gas Evaluation Handbook and in compliance with the requirements of National Instrument 51-101, Standards of Disclosure for Oil and Gas Activities. Estimates are presented using an average of three independent qualified reserves evaluators January 1, 2019 price forecasts. For additional information about our reserves and other oil and gas information, see “Reserves Data and Other Oil and Gas Information” in our AIF for the year ended December 31, 2018.
Barrels of Oil Equivalent – natural gas volumes have been converted to barrels of oil equivalent (BOE) on the basis of six Mcf to one barrel (bbl). BOE may be misleading, particularly if used in isolation. A conversion ratio of one bbl to six Mcf is based on an energy equivalency conversion method primarily applicable at the burner tip and does not represent value equivalency at the wellhead. Given that the value ratio based on the current price of crude oil compared with natural gas is significantly different from the energy equivalency conversion ratio of 6:1, utilizing a conversion on a 6:1 basis is not an accurate reflection of value.
Forward-looking Information
This document contains certain forward-looking statements and forward-looking information (collectively referred to as “forward-looking information”) within the meaning of applicable securities legislation, including the U.S. Private Securities Litigation Reform Act of 1995, about our current expectations, estimates and projections about the future, based on certain assumptions made by us in light of our experience and perception of historical trends. Although we believe that the expectations represented by such forward looking information are reasonable, there can be no assurance that such expectations will prove to be correct.
Forward-looking information in this document is identified by words such as “aim”, “anticipate”, “believe”, “capacity”, “committed”, “commitment”, “could”, “expect”, “estimate”, “focus”, “forecast”, “forward”, “future”, “guidance”, “may”, “on track”, “outlook”, “plan”, “position”, “potential”, “priority”, “pursue”, “strategy”, “should”, “target”, “will”, or similar expressions and includes suggestions of future outcomes, including statements about: strategy and related milestones; schedules and plans; focus on maximizing shareholder value through cost leadership; desire to realize the best margins for our products; plans to maintain and demonstrate financial discipline while balancing growth and shareholder return; continuing to advance our operational performance and upholding our trusted reputation; expected timing for oil sands expansion phases and associated expected production capacities; projections for 2019 and future years and our plans and strategies to realize such projections; forecast exchange rates and trends; future opportunities for oil and natural gas development; forecast operating and financial results, including forecast sales prices, costs and cash flows; our commitment to continue reducing debt, including our long-term target Net Debt to Adjusted EBITDA ratio; our ability to satisfy payment obligations as they become due; priorities for and approach to capital investment decisions or capital allocation;
Cenovus Energy Inc. – Q2 2019 Management’s Discussion and Analysis | | 36 |
| | |
planned capital expenditures, including the amount, timing and funding sources thereof; all statements with respect to our 2019 guidance estimates; expected future production, including the timing, stability or growth thereof; the impact of the Government of Alberta’s mandatory production curtailment; our ability to take steps to partially mitigate against wider WTI and WCS price differentials; our expectation that our capital investment and any cash dividends for 2019 will be funded from internally generated cash flows and cash balance on hand; expected reserves; capacities, including for projects, transportation and refining; all statements related to government royalty regimes applicable to Cenovus, which regimes are subject to change; our ability to preserve our financial resilience and various plans and strategies with respect thereto; forecast cost reductions and sustainability thereof; our priorities, including for 2019; future impact of regulatory measures; forecast commodity prices, differentials and trends and expected impact; potential impacts of various risks, including those related to commodity prices and climate change; the potential effectiveness of our risk management strategies; new accounting standards, the timing for the adoption thereof, and anticipated impact on the Consolidated Financial Statements; the availability and repayment of our credit facilities; potential asset sales; expected impacts of the contingent payment; future use and development of technology and associated future outcomes; our ability to access and implement all technology necessary to efficiently and effectively operate our assets and achieve expected future cost reductions; and projected growth and projected shareholder return. Readers are cautioned not to place undue reliance on forward-looking information as our actual results may differ materially from those expressed or implied.
Developing forward-looking information involves reliance on a number of assumptions and consideration of certain risks and uncertainties, some of which are specific to Cenovus and others that apply to the industry generally. The factors or assumptions on which our forward-looking information is based include: forecast oil and natural gas, natural gas liquids, condensate and refined products prices, light-heavy crude oil price differentials and other assumptions identified in Cenovus’s 2019 guidance, available at cenovus.com; bottom of the cycle commodity prices of US$45/bbl WTI and C$44/bbl WCS; projected capital investment levels, the flexibility of capital spending plans and associated sources of funding; achievement of further cost reductions and sustainability thereof; applicable royalty regimes, including expected royalty rates; future improvements in availability of product transportation capacity; increase to our share price and market capitalization over the long‑term; future narrowing of crude oil differentials; realization of expected capacity to store within our oil sands reservoirs barrels not yet produced, including that we will be able to time production and sales of our inventory at later dates when pipeline capacity has improved and crude oil differentials have narrowed; the Government of Alberta’s mandatory production curtailment will narrow the differential between WTI and WCS crude oil prices thereby positively impacting cash flows for Cenovus; the ability of our refining capacity, dynamic storage, existing pipeline commitments, financial hedge transactions and plans to ramp up crude-by-rail loading capacity to partially mitigate a portion of our WCS crude oil volumes against wider differentials; estimates of quantities of oil, bitumen, natural gas and liquids from properties and other sources not currently classified as proved; accounting estimates and judgments; future use and development of technology and associated expected future results; our ability to obtain necessary regulatory and partner approvals; the successful and timely implementation of capital projects or stages thereof; our ability to generate sufficient cash flow to meet our current and future obligations; estimated abandonment and reclamation costs, including associated levies and regulations applicable thereto; achievement of expected impacts of the Acquisition; successful completion of the integration of the Deep Basin Assets; our ability to obtain and retain qualified staff and equipment in a timely and cost-efficient manner; our ability to access sufficient capital to pursue our development plans; our ability to complete asset sales, including with desired transaction metrics and within the timelines we expect; forecast inflation and other assumptions inherent in our current guidance set out below; expected impacts of the contingent payment to ConocoPhillips; alignment of realized WCS and WCS prices used to calculate the contingent payment to ConocoPhillips; our ability to access and implement all technology necessary to achieve expected future results; our ability to implement capital projects or stages thereof in a successful and timely manner; and other risks and uncertainties described from time to time in the filings we make with securities regulatory authorities.
2019 guidance, as updated April 23, 2019, assumes: Brent prices of US$66.00/bbl, WTI prices of US$59.00/bbl; WCS of US$44.50/bbl; AECO natural gas prices of $1.55/Mcf; Chicago 3-2-1 crack spread of US$15.00/bbl; and an exchange rate of $0.75 US$/C$.
The risk factors and uncertainties that could cause our actual results to differ materially, include: our ability to realize the anticipated benefits of and synergies from the Acquisition; our ability to access or implement some or all of the technology necessary to efficiently and effectively operate our assets and achieve expected future results; volatility of and other assumptions regarding commodity prices; our ability to realize the expected impacts of our capacity to store within our oil sands reservoirs barrels not yet produced, including possible inability to time production and sales at later dates when pipeline capacity and crude oil differentials have improved; failure of the Government of Alberta’s mandatory production curtailment to cause the differential between the WTI and the WCS crude oil prices to narrow or to narrow sufficiently to positively impact our cash flows; the Government of Alberta may extend mandatory production curtailment beyond when takeaway capacity constraints have been sufficiently relieved; the effectiveness of our risk management program, including the impact of derivative financial instruments, the success of our hedging strategies and the sufficiency of our liquidity position; the accuracy of cost estimates regarding commodity prices, currency and interest rates; lack of alignment of realized WCS prices and WCS prices used to calculate the contingent payment to ConocoPhillips; product supply and demand; accuracy of
Cenovus Energy Inc. – Q2 2019 Management’s Discussion and Analysis | | 37 |
| | |
our share price and market capitalization assumptions; market competition, including from alternative energy sources; risks inherent in our marketing operations, including credit risks, exposure to counterparties and partners, including ability and willingness of such parties to satisfy contractual obligations in a timely manner; risks inherent in the operation of our crude-by-rail terminal, including health, safety and environmental risks; our ability to maintain desirable ratios of Net Debt to Adjusted EBITDA as well as Net Debt to Capitalization; our ability to access various sources of debt and equity capital, generally, and on terms acceptable to us; our ability to finance growth and sustaining capital expenditures; changes in credit ratings applicable to us or any of our securities; changes to our dividend plans or strategy, including the dividend reinvestment plan; accuracy of our reserves, future production and future net revenue estimates; accuracy of our accounting estimates and judgments; our ability to replace and expand oil and gas reserves; potential requirements under applicable accounting standards for impairment or reversal of estimated recoverable amounts of some or all of our assets or goodwill from time to time; our ability to maintain our relationship with our partners and to successfully manage and operate our integrated business; reliability of our assets including in order to meet production targets; potential disruption or unexpected technical difficulties in developing new products and manufacturing processes; the occurrence of unexpected events such as fires, severe weather conditions, explosions, blow-outs, equipment failures, transportation incidents and other accidents or similar events; refining and marketing margins; inflationary pressures on operating costs, including labour, materials, natural gas and other energy sources used in oil sands processes; potential failure of products to achieve or maintain acceptance in the market; risks associated with fossil fuel industry reputation; unexpected cost increases or technical difficulties in constructing or modifying manufacturing or refining facilities; unexpected difficulties in producing, transporting or refining of bitumen and/or crude oil into petroleum and chemical products; risks associated with technology and its application to our business; risks associated with climate change and our assumptions relating thereto; the timing and the costs of well and pipeline construction; our ability to secure adequate and cost effective product transportation including sufficient pipeline, crude-by-rail, marine or alternate transportation, including to address any gaps caused by constraints in the pipeline system; availability of, and our ability to attract and retain, critical talent; possible failure to obtain and retain qualified staff and equipment in a timely and cost efficient manner; changes in labour relationships; changes in the regulatory framework in any of the locations in which we operate, including changes to the regulatory approval process and land-use designations, royalty, tax, environmental, greenhouse gas, carbon, climate change and other laws or regulations, or changes to the interpretation of such laws and regulations, as adopted or proposed, the impact thereof and the costs associated with compliance; the expected impact and timing of various accounting pronouncements, rule changes and standards on our business, our financial results and our Consolidated Financial Statements; changes in general economic, market and business conditions; the political and economic conditions in the countries in which we operate or supply; the occurrence of unexpected events such as war, terrorist threats and the instability resulting therefrom; and risks associated with existing and potential future lawsuits, shareholder proposals and regulatory actions against us.
Statements relating to “reserves” are deemed to be forward looking information, as they involve the implied assessment, based on certain estimates and assumptions, that the reserves described exist in the quantities predicted or estimated, and can be profitably produced in the future.
Readers are cautioned that the foregoing lists are not exhaustive and are made as at the date hereof. Events or circumstances could cause our actual results to differ materially from those estimated or projected and expressed in, or implied by, the forward-looking information. For a full discussion of our material risk factors, see “Risk Management and Risk Factors” in our MD&A for the period ended December 31, 2018, available on SEDAR at sedar.com, on EDGAR at sec.gov, and on our website at cenovus.com.
ABBREVIATIONS
The following abbreviations have been used in this document:
| | | |
Crude Oil | Natural Gas |
| | | |
bbl | barrel | Mcf | thousand cubic feet |
Mbbls/d | thousand barrels per day | MMcf | million cubic feet |
MMbbls | million barrels | Bcf | billion cubic feet |
BOE | barrel of oil equivalent | MMBtu | million British thermal units |
MMBOE | million barrel of oil equivalent | GJ | gigajoule |
WTI | West Texas Intermediate | AECO | Alberta Energy Company |
WCS | Western Canadian Select | NYMEX | New York Mercantile Exchange |
CDB | Christina Dilbit Blend | | |
MSW | Mixed Sweet Blend | | |
WTS | West Texas Sour | | |
Cenovus Energy Inc. – Q2 2019 Management’s Discussion and Analysis | | 38 |
| | |
NETBACK RECONCILIATIONS
The following tables provide a reconciliation of the items comprising Netbacks to Operating Margin found in our interim Consolidated Financial Statements.
Total Production From Continuing Operations
Continuing Upstream Financial Results
| Per Interim Consolidated Financial Statements | | | Adjustments | | | Basis of Netback Calculation | |
Three Months Ended June 30, 2019 ($ millions) | Oil Sands(1) | | | Deep Basin(1) | | | Continuing Operations | | | Condensate | | | Inventory | | | Internal Usage(2) | | | Other | | | Continuing Operations | |
Gross Sales | | 3,030 | | | | 150 | | | | 3,180 | | | | (1,091 | ) | | | - | | | | (33 | ) | | | (18 | ) | | | 2,038 | |
Royalties | | 314 | | | | 10 | | | | 324 | | | | - | | | | - | | | | - | | | | - | | | | 324 | |
Transportation and Blending | | 1,340 | | | | 23 | | | | 1,363 | | | | (1,091 | ) | | | - | | | | - | | | | - | | | | 272 | |
Operating | | 270 | | | | 87 | | | | 357 | | | | - | | | | - | | | | (33 | ) | | | (9 | ) | | | 315 | |
Production and Mineral Taxes | | - | | | | - | | | | - | | | | - | | | | - | | | | - | | | | - | | | | - | |
Netback | | 1,106 | | | | 30 | | | | 1,136 | | | | - | | | | - | | | | - | | | | (9 | ) | | | 1,127 | |
(Gain) Loss on Risk Management | | 57 | | | | - | | | | 57 | | | | - | | | | - | | | | - | | | | - | | | | 57 | |
Operating Margin | | 1,049 | | | | 30 | | | | 1,079 | | | | - | | | | - | | | | - | | | | (9 | ) | | | 1,070 | |
| Per Interim Consolidated Financial Statements | | | Adjustments | | | Basis of Netback Calculation | |
Three Months Ended June 30, 2018 ($ millions) (3) | Oil Sands(1) | | | Deep Basin(1) | | | Continuing Operations | | | Condensate | | | Inventory | | | Internal Usage(2) | | | Other | | | Continuing Operations | |
Gross Sales | | 3,248 | | | | 241 | | | | 3,489 | | | | (1,425 | ) | | | - | | | | (34 | ) | | | (20 | ) | | | 2,010 | |
Royalties | | 179 | | | | 16 | | | | 195 | | | | - | | | | - | | | | - | | | | - | | | | 195 | |
Transportation and Blending | | 1,642 | | | | 27 | | | | 1,669 | | | | (1,425 | ) | | | - | | | | - | | | | (4 | ) | | | 240 | |
Operating | | 263 | | | | 109 | | | | 372 | | | | - | | | | - | | | | (34 | ) | | | (9 | ) | | | 329 | |
Production and Mineral Taxes | | - | | | | 1 | | | | 1 | | | | - | | | | - | | | | - | | | | - | | | | 1 | |
Netback | | 1,164 | | | | 88 | | | | 1,252 | | | | - | | | | - | | | | - | | | | (7 | ) | | | 1,245 | |
(Gain) Loss on Risk Management | | 688 | | | | 10 | | | | 698 | | | | - | | | | - | | | | - | | | | - | | | | 698 | |
Operating Margin | | 476 | | | | 78 | | | | 554 | | | | - | | | | - | | | | - | | | | (7 | ) | | | 547 | |
| Per Interim Consolidated Financial Statements | | | Adjustments | | | Basis of Netback Calculation | |
Six Months Ended June 30, 2019 ($ millions) | Oil Sands(1) | | | Deep Basin(1) | | | Continuing Operations | | | Condensate | | | Inventory | | | Internal Usage(2) | | | Other | | | Continuing Operations | |
Gross Sales | | 5,457 | | | | 370 | | | | 5,827 | | | | (2,037 | ) | | | - | | | | (113 | ) | | | (37 | ) | | | 3,640 | |
Royalties | | 491 | | | | 24 | | | | 515 | | | | - | | | | - | | | | - | | | | - | | | | 515 | |
Transportation and Blending | | 2,487 | | | | 42 | | | | 2,529 | | | | (2,037 | ) | | | - | | | | - | | | | - | | | | 492 | |
Operating | | 544 | | | | 180 | | | | 724 | | | | - | | | | - | | | | (113 | ) | | | (19 | ) | | | 592 | |
Production and Mineral Taxes | | - | | | | - | | | | - | | | | - | | | | - | | | | - | | | | - | | | | - | |
Netback | | 1,935 | | | | 124 | | | | 2,059 | | | | - | | | | - | | | | - | | | | (18 | ) | | | 2,041 | |
(Gain) Loss on Risk Management | | 45 | | | | - | | | | 45 | | | | - | | | | - | | | | - | | | | - | | | | 45 | |
Operating Margin | | 1,890 | | | | 124 | | | | 2,014 | | | | - | | | | - | | | | - | | | | (18 | ) | | | 1,996 | |
| Per Interim Consolidated Financial Statements | | | Adjustments | | | Basis of Netback Calculation | |
Six Months Ended June 30, 2018 ($ millions) (3) | Oil Sands(1) | | | Deep Basin(1) | | | Continuing Operations | | | Condensate | | | Inventory | | | Internal Usage(2) | | | Other | | | Continuing Operations | |
Gross Sales | | 5,654 | | | | 500 | | | | 6,154 | | | | (2,699 | ) | | | - | | | | (97 | ) | | | (34 | ) | | | 3,324 | |
Royalties | | 237 | | | | 51 | | | | 288 | | | | - | | | | - | | | | - | | | | - | | | | 288 | |
Transportation and Blending | | 3,134 | | | | 52 | | | | 3,186 | | | | (2,699 | ) | | | - | | | | - | | | | (4 | ) | | | 483 | |
Operating | | 559 | | | | 200 | | | | 759 | | | | - | | | | - | | | | (97 | ) | | | (21 | ) | | | 641 | |
Production and Mineral Taxes | | - | | | | 1 | | | | 1 | | | | - | | | | - | | | | - | | | | - | | | | 1 | |
Netback | | 1,724 | | | | 196 | | | | 1,920 | | | | - | | | | - | | | | - | | | | (9 | ) | | | 1,911 | |
(Gain) Loss on Risk Management | | 1,142 | | | | 19 | | | | 1,161 | | | | - | | | | - | | | | - | | | | - | | | | 1,161 | |
Operating Margin | | 582 | | | | 177 | | | | 759 | | | | - | | | | - | | | | - | | | | (9 | ) | | | 750 | |
(1) | Found in Note 1 of the interim Consolidated Financial Statements. |
(2) | Represents natural gas volumes produced by the Deep Basin segment used for internal consumption by the Oil Sands segment. |
(3) | IFRS 16 was adopted January 1, 2019 using the modified retrospective approach; therefore, comparative information has not been restated. Refer to the Critical Accounting Judgments, Estimation Uncertainties and Accounting Polices section in this MD&A. |
Cenovus Energy Inc. – Q2 2019 Management’s Discussion and Analysis | | 39 |
| | |
Oil Sands
| Basis of Netback Calculation | | | Adjustments | | | Per Interim Consolidated Financial Statements(1) | |
Three Months Ended June 30, 2019 ($ millions) | Foster Creek | | | Christina Lake | | | Total Crude Oil | | | Natural Gas | | | Condensate | | | Inventory | | | Other | | | Total Oil Sands | |
Gross Sales | | 963 | | | | 973 | | | | 1,936 | | | | - | | | | 1,091 | | | | - | | | | 3 | | | | 3,030 | |
Royalties | | 148 | | | | 166 | | | | 314 | | | | - | | | | - | | | | - | | | | - | | | | 314 | |
Transportation and Blending | | 141 | | | | 108 | | | | 249 | | | | - | | | | 1,091 | | | | - | | | | - | | | | 1,340 | |
Operating | | 129 | | | | 139 | | | | 268 | | | | - | | | | - | | | | - | | | | 2 | | | | 270 | |
Netback | | 545 | | | | 560 | | | | 1,105 | | | | - | | | | - | | | | - | | | | 1 | | | | 1,106 | |
(Gain) Loss on Risk Management | | 23 | | | | 34 | | | | 57 | | | | - | | | | - | | | | - | | | | - | | | | 57 | |
Operating Margin | | 522 | | | | 526 | | | | 1,048 | | | | - | | | | - | | | | - | | | | 1 | | | | 1,049 | |
| Basis of Netback Calculation | | | Adjustments | | | Per Interim Consolidated Financial Statements(1) | |
Three Months Ended June 30, 2018 ($ millions) (2) | Foster Creek | | | Christina Lake | | | Total Crude Oil | | | Natural Gas | | | Condensate | | | Inventory | | | Other | | | Total Oil Sands | |
Gross Sales | | 842 | | | | 979 | | | | 1,821 | | | | - | | | | 1,425 | | | | - | | | | 2 | | | | 3,248 | |
Royalties | | 142 | | | | 37 | | | | 179 | | | | - | | | | - | | | | - | | | | - | | | | 179 | |
Transportation and Blending | | 117 | | | | 100 | | | | 217 | | | | - | | | | 1,425 | | | | - | | | | - | | | | 1,642 | |
Operating | | 136 | | | | 125 | | | | 261 | | | | - | | | | - | | | | - | | | | 2 | | | | 263 | |
Netback | | 447 | | | | 717 | | | | 1,164 | | | | - | | | | - | | | | - | | | | - | | | | 1,164 | |
(Gain) Loss on Risk Management | | 304 | | | | 384 | | | | 688 | | | | - | | | | - | | | | - | | | | - | | | | 688 | |
Operating Margin | | 143 | | | | 333 | | | | 476 | | | | - | | | | - | | | | - | | | | - | | | | 476 | |
| Basis of Netback Calculation | | | Adjustments | | | Per Interim Consolidated Financial Statements(1) | |
Six Months Ended June 30, 2019 ($ millions) | Foster Creek | | | Christina Lake | | | Total Crude Oil | | | Natural Gas | | | Condensate | | | Inventory | | | Other | | | Total Oil Sands | |
Gross Sales | | 1,685 | | | | 1,728 | | | | 3,413 | | | | - | | | | 2,037 | | | | - | | | | 7 | | | | 5,457 | |
Royalties | | 209 | | | | 282 | | | | 491 | | | | - | | | | - | | | | - | | | | - | | | | 491 | |
Transportation and Blending | | 271 | | | | 179 | | | | 450 | | | | - | | | | 2,037 | | | | - | | | | - | | | | 2,487 | |
Operating | | 275 | | | | 263 | | | | 538 | | | | - | | | | - | | | | - | | | | 6 | | | | 544 | |
Netback | | 930 | | | | 1,004 | | | | 1,934 | | | | - | | | | - | | | | - | | | | 1 | | | | 1,935 | |
(Gain) Loss on Risk Management | | 18 | | | | 27 | | | | 45 | | | | - | | | | - | | | | - | | | | - | | | | 45 | |
Operating Margin | | 912 | | | | 977 | | | | 1,889 | | | | - | | | | - | | | | - | | | | 1 | | | | 1,890 | |
| Basis of Netback Calculation | | | Adjustments | | | Per Interim Consolidated Financial Statements(1) | |
Six Months Ended June 30, 2018 ($ millions) (2) | Foster Creek | | | Christina Lake | | | Total Crude Oil | | | Natural Gas | | | Condensate | | | Inventory | | | Other | | | Total Oil Sands | |
Gross Sales | | 1,421 | | | | 1,529 | | | | 2,950 | | | | 1 | | | | 2,699 | | | | - | | | | 4 | | | | 5,654 | |
Royalties | | 189 | | | | 48 | | | | 237 | | | | - | | | | - | | | | - | | | | - | | | | 237 | |
Transportation and Blending | | 248 | | | | 187 | | | | 435 | | | | - | | | | 2,699 | | | | - | | | | - | | | | 3,134 | |
Operating | | 291 | | | | 259 | | | | 550 | | | | 2 | | | | - | | | | - | | | | 7 | | | | 559 | |
Netback | | 693 | | | | 1,035 | | | | 1,728 | | | | (1 | ) | | | - | | | | - | | | | (3 | ) | | | 1,724 | |
(Gain) Loss on Risk Management | | 504 | | | | 638 | | | | 1,142 | | | | - | | | | - | | | | - | | | | - | | | | 1,142 | |
Operating Margin | | 189 | | | | 397 | | | | 586 | | | | (1 | ) | | | - | | | | - | | | | (3 | ) | | | 582 | |
(1) | Found in Note 1 of the interim Consolidated Financial Statements. |
(2) | IFRS 16 was adopted January 1, 2019 using the modified retrospective approach; therefore, comparative information has not been restated. Refer to the Critical Accounting Judgments, Estimation Uncertainties and Accounting Polices section in this MD&A |
Cenovus Energy Inc. – Q2 2019 Management’s Discussion and Analysis | | 40 |
| | |
Deep Basin
| Basis of Netback Calculation | | | Adjustments | | | Per Interim Consolidated Financial Statements(1) | |
Three Months Ended June 30, 2019 ($ millions) | Total | | | Other(2) | | | Total Deep Basin | |
Gross Sales | | 135 | | | | 15 | | | | 150 | |
Royalties | | 10 | | | | - | | | | 10 | |
Transportation and Blending | | 23 | | | | - | | | | 23 | |
Operating | | 80 | | | | 7 | | | | 87 | |
Production and Mineral Taxes | | - | | | | - | | | | - | |
Netback | | 22 | | | | 8 | | | | 30 | |
(Gain) Loss on Risk Management | | - | | | | - | | | | - | |
Operating Margin | | 22 | | | | 8 | | | | 30 | |
| Basis of Netback Calculation | | | Adjustments | | | Per Interim Consolidated Financial Statements(1) | |
Three Months Ended June 30, 2018 ($ millions) (3) | Total | | | Other(2) | | | Total Deep Basin | |
Gross Sales | | 223 | | | | 18 | | | | 241 | |
Royalties | | 16 | | | | - | | | | 16 | |
Transportation and Blending | | 23 | | | | 4 | | | | 27 | |
Operating | | 102 | | | | 7 | | | | 109 | |
Production and Mineral Taxes | | 1 | | | | - | | | | 1 | |
Netback | | 81 | | | | 7 | | | | 88 | |
(Gain) Loss on Risk Management | | 10 | | | | - | | | | 10 | |
Operating Margin | | 71 | | | | 7 | | | | 78 | |
| Basis of Netback Calculation | | | Adjustments | | | Per Interim Consolidated Financial Statements(1) | |
Six Months Ended June 30, 2019 ($ millions) | Total | | | Other(2) | | | Total Deep Basin | |
Gross Sales | | 340 | | | | 30 | | | | 370 | |
Royalties | | 24 | | | | - | | | | 24 | |
Transportation and Blending | | 42 | | | | - | | | | 42 | |
Operating | | 167 | | | | 13 | | | | 180 | |
Production and Mineral Taxes | | - | | | | - | | | | - | |
Netback | | 107 | | | | 17 | | | | 124 | |
(Gain) Loss on Risk Management | | - | | | | - | | | | - | |
Operating Margin | | 107 | | | | 17 | | | | 124 | |
| Basis of Netback Calculation | | | Adjustments | | | Per Interim Consolidated Financial Statements(1) | |
Six Months Ended June 30, 2018 ($ millions) (3) | Total | | | Other(2) | | | Total Deep Basin | |
Gross Sales | | 470 | | | | 30 | | | | 500 | |
Royalties | | 51 | | | | - | | | | 51 | |
Transportation and Blending | | 48 | | | | 4 | | | | 52 | |
Operating | | 186 | | | | 14 | | | | 200 | |
Production and Mineral Taxes | | 1 | | | | - | | | | 1 | |
Netback | | 184 | | | | 12 | | | | 196 | |
(Gain) Loss on Risk Management | | 19 | | | | - | | | | 19 | |
Operating Margin | | 165 | | | | 12 | | | | 177 | |
(1) | Found in Note 1 of the interim Consolidated Financial Statements. |
(2) | Reflects operating margin from processing facility. |
(3) | IFRS 16 was adopted January 1, 2019 using the modified retrospective approach; therefore, comparative information has not been restated. Refer to the Critical Accounting Judgments, Estimation Uncertainties and Accounting Polices section in this MD&A. |
Cenovus Energy Inc. – Q2 2019 Management’s Discussion and Analysis | | 41 |
| | |
The following table provides the sales volumes used to calculate Netback.
Sales Volumes
| Three Months Ended June 30, | | | Six Months Ended June 30, | |
(barrels per day, unless otherwise stated) | 2019 | | | 2018 | | | 2019 | | | 2018 | |
Oil Sands | | | | | | | | | | | | | | | |
Foster Creek | | 160,673 | | | | 171,083 | | | | 157,538 | | | | 167,517 | |
Christina Lake | | 178,845 | | | | 220,779 | | | | 177,470 | | | | 211,546 | |
Total Oil Sands Crude Oil | | 339,518 | | | | 391,862 | | | | 335,008 | | | | 379,063 | |
| | | | | | | | | | | | | | | |
Natural Gas (MMcf per day) | | - | | | | 1 | | | | - | | | | 2 | |
| | | | | | | | | | | | | | | |
Total Oil Sands (BOE per day) | | 339,518 | | | | 391,948 | | | | 335,008 | | | | 379,474 | |
| | | | | | | | | | | | | | | |
Deep Basin | | | | | | | | | | | | | | | |
Total Liquids | | 26,417 | | | | 34,041 | | | | 27,206 | | | | 34,756 | |
| | | | | | | | | | | | | | | |
Natural Gas (MMcf per day) | | 432 | | | | 570 | | | | 445 | | | | 560 | |
| | | | | | | | | | | | | | | |
Total Deep Basin (BOE per day) | | 98,345 | | | | 129,066 | | | | 101,301 | | | | 128,067 | |
| | | | | | | | | | | | | | | |
Less: Internal Consumption (1) (MMcf per day) | | (319 | ) | | | (300 | ) | | | (319 | ) | | | (311 | ) |
| | | | | | | | | | | | | | | |
Sales From Continuing Operations (1) (BOE per day) | | 384,696 | | | | 471,013 | | | | 383,142 | | | | 455,709 | |
(1) | Less natural gas volumes used for internal consumption by the Oil Sands segment. |