Investor Presentation
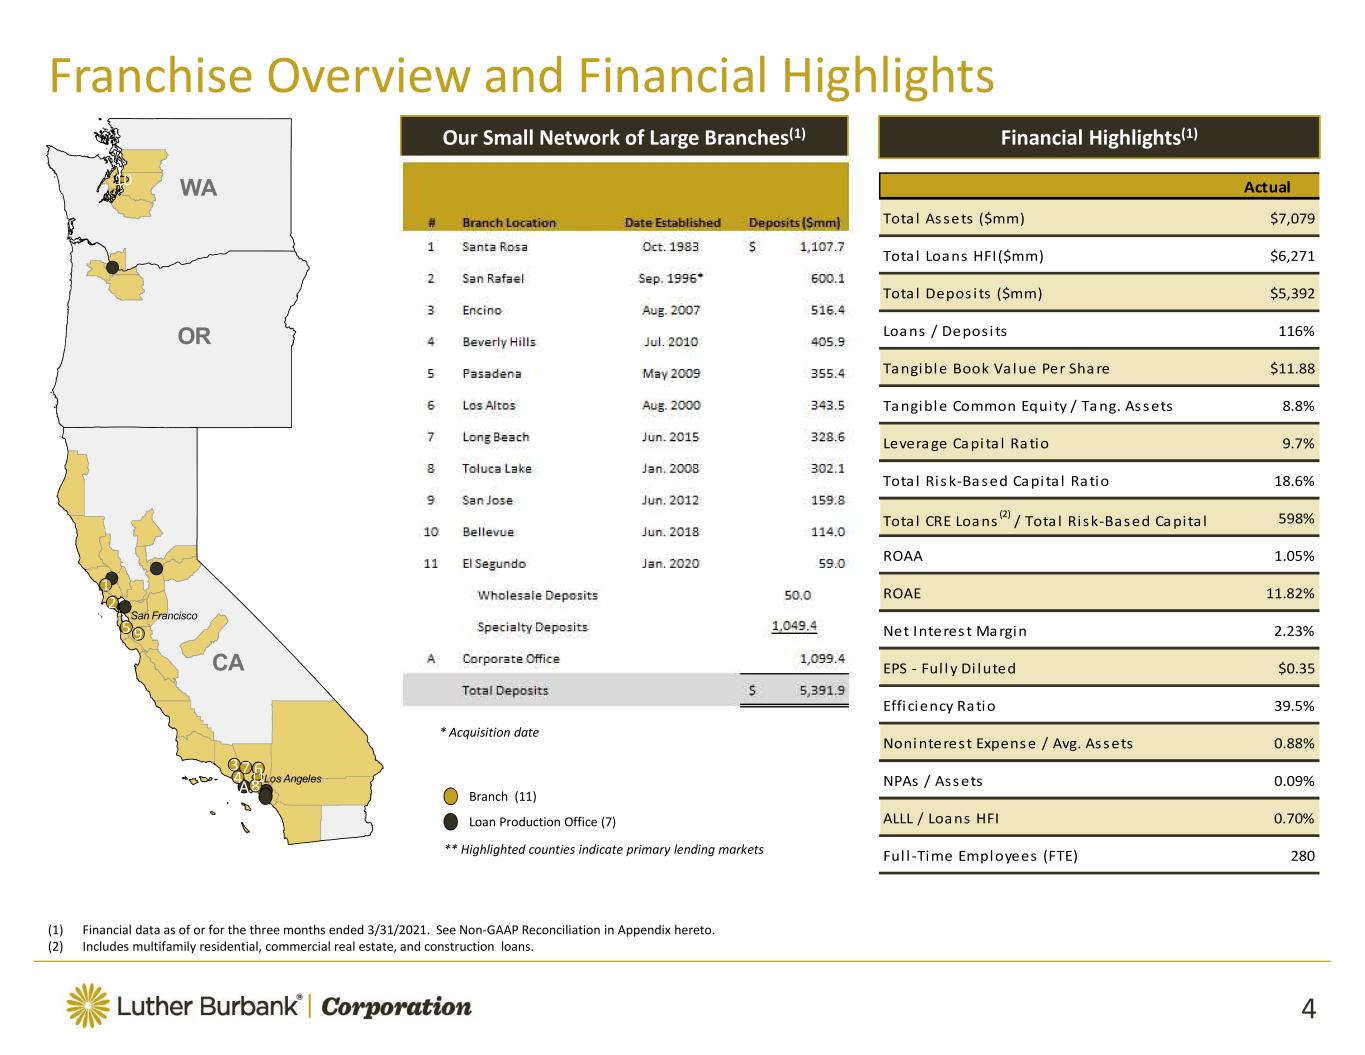
Financial Highlights(1) ** Highlighted counties indicate primary lending markets Our Small Network of Large Branches(1) OR CA WA San Francisco Los Angeles 1 2 59 3 6 7 8 4 * Acquisition date Actual
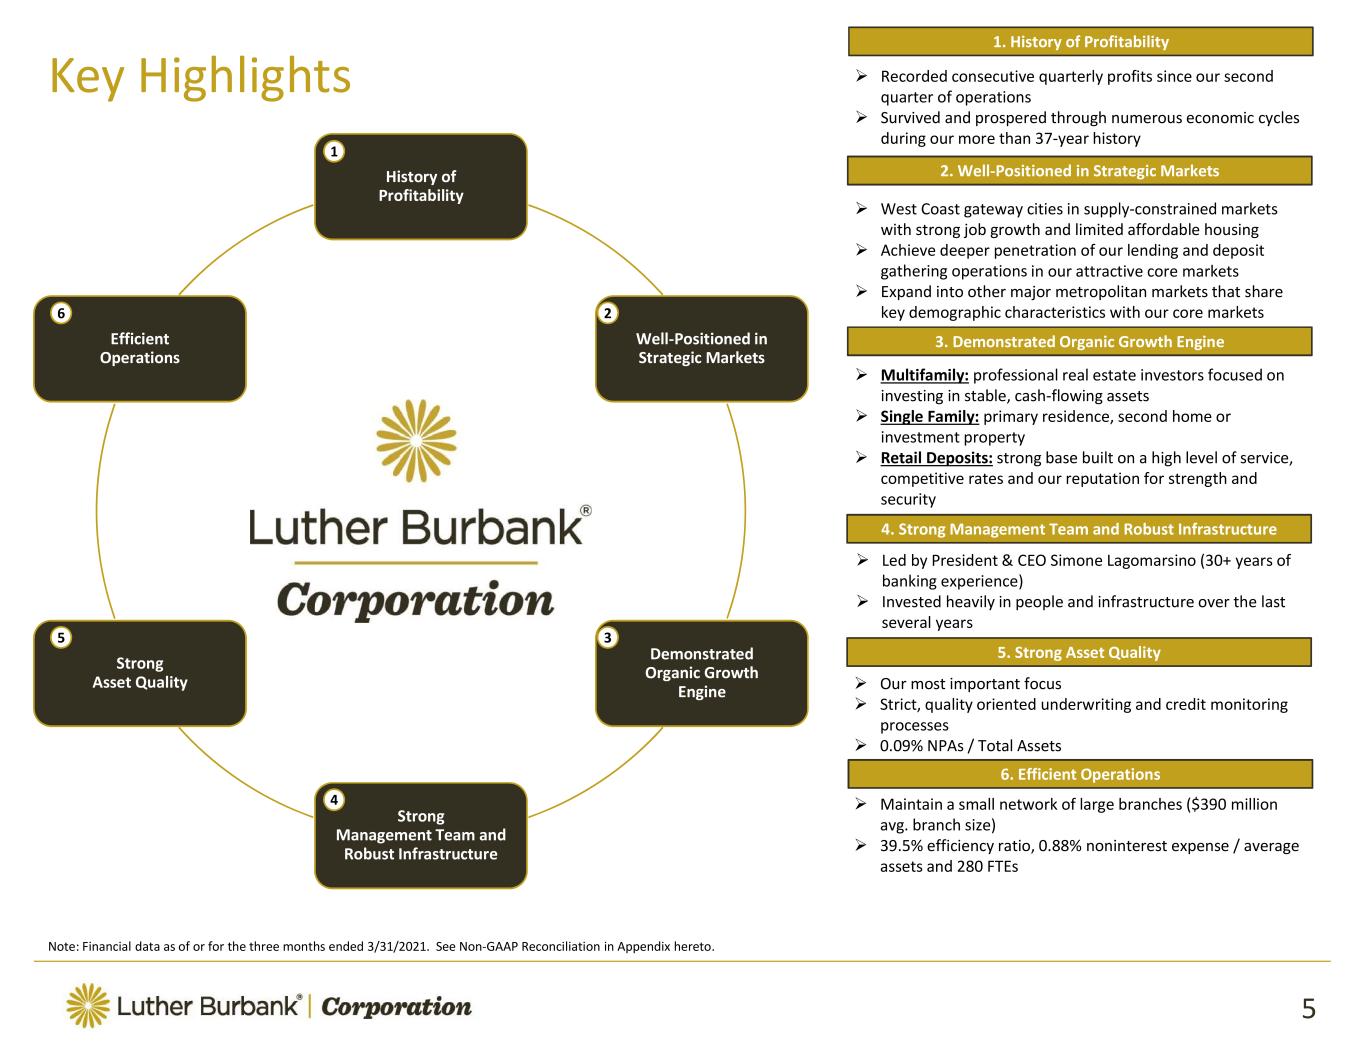
History of Profitability Well Positioned in Strategic Markets Demonstrated Organic Growth Engine Strong Management Team and Robust Infrastructure Strong Asset Quality Efficient Operations 4 3 2 1 6 5 Multifamily: Single Family: Retail Deposits: 1. History of Profitability 2. Well Positioned in Strategic Markets 3. Demonstrated Organic Growth Engine 4. Strong Management Team and Robust Infrastructure 5. Strong Asset Quality 6. Efficient Operations
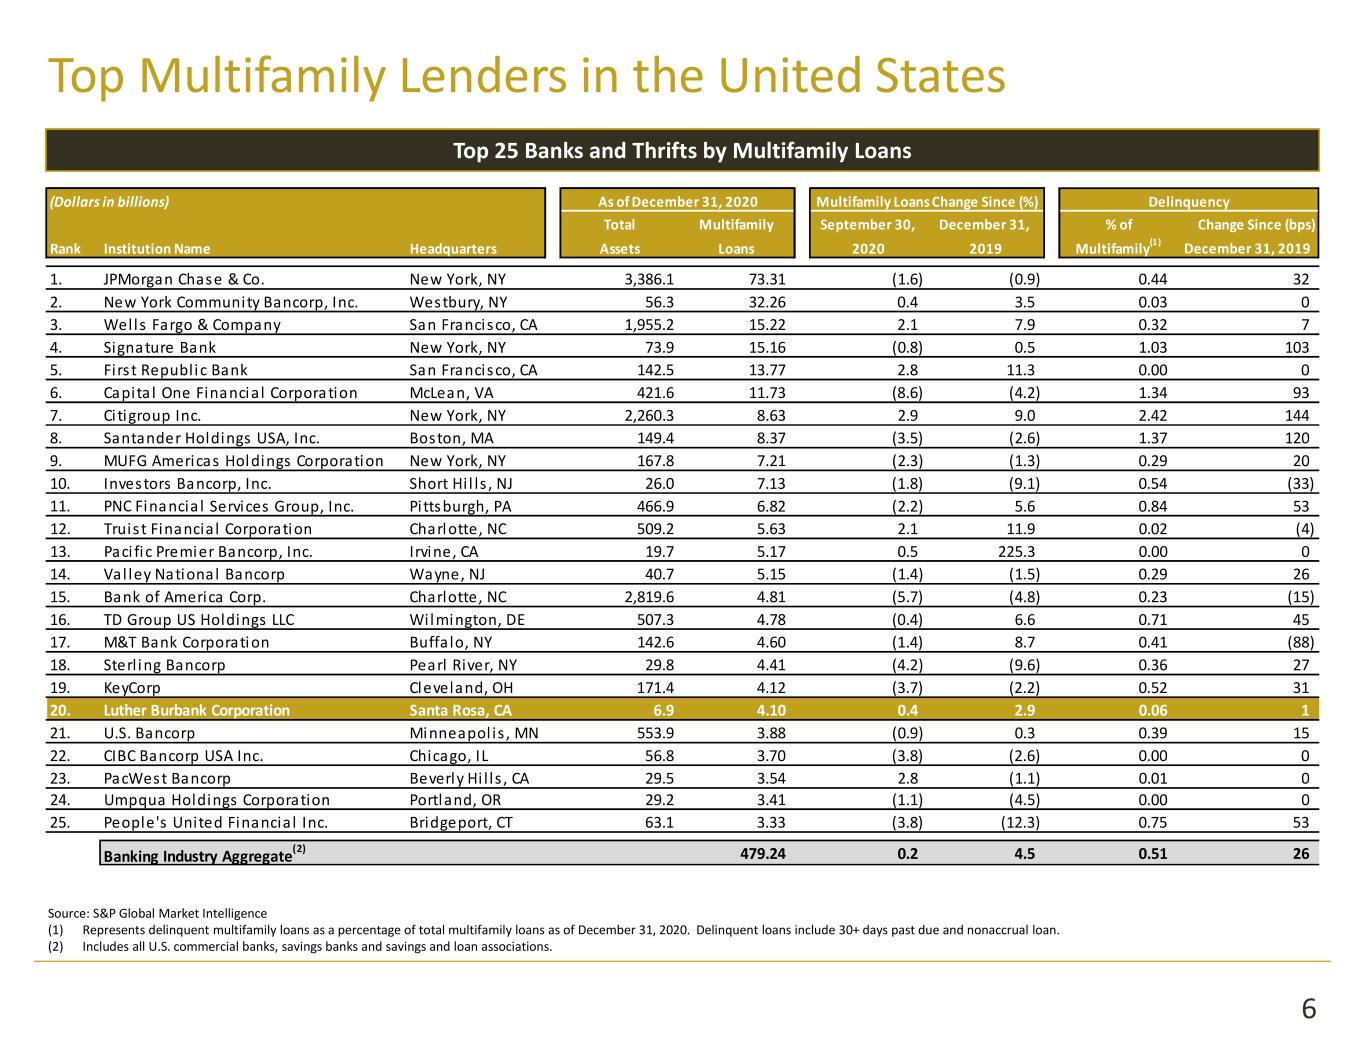
Top 25 Banks and Thrifts by Multifamily Loans (Dollars in billions) As ofDecember 31, 2020 Multifamily LoansChange Since (%) Delinquency Total Multifamily September 30, December 31, % of Change Since (bps) Rank Institution Name Headquarters Assets Loans 2020 2019 Multifamily(1) December 31, 2019 20. Luther Burbank Corporation Santa Rosa, CA 6.9 4.10 0.4 2.9 0.06 1 Banking Industry Aggregate (2) 479.24 0.2 4.5 0.51 26

Multifamily Loan Growth Multifamily Loan Delinquencies
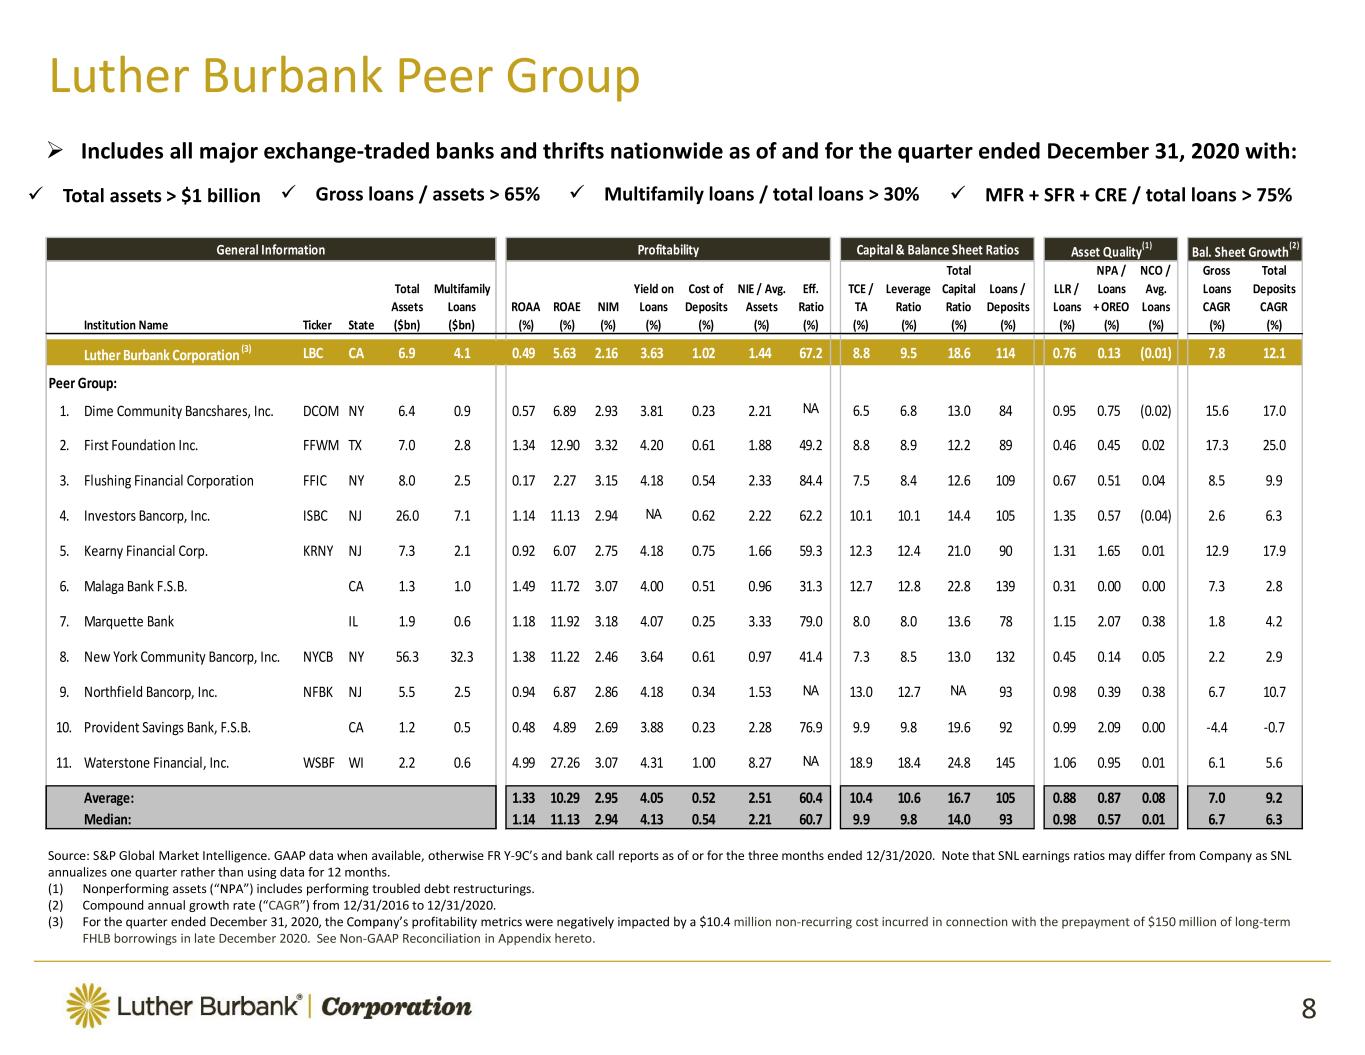
Includes all major exchange traded banks and thrifts nationwide as of and for the quarter ended December 31, 2020 with: Total assets > $1 billion Gross loans / assets > 65% Multifamily loans / total loans > 30% MFR + SFR + CRE / total loans > 75% General Information Profitability Capital & Balance Sheet Ratios Asset Quality (1) Bal. Sheet Growth (2) Total NPA / NCO / Gross Total Total Multifamily Yield on Cost of NIE / Avg. Eff. TCE / Leverage Capital Loans / LLR / Loans Avg. Loans Deposits Assets Loans ROAA ROAE NIM Loans Deposits Assets Ratio TA Ratio Ratio Deposits Loans +OREO Loans CAGR CAGR Institution Name Ticker State ($bn) ($bn) (%) (%) (%) (%) (%) (%) (%) (%) (%) (%) (%) (%) (%) (%) (%) (%) Luther Burbank Corporation (3) LBC CA 6.9 4.1 0.49 5.63 2.16 3.63 1.02 1.44 67.2 8.8 9.5 18.6 114 0.76 0.13 (0.01) 7.8 12.1 Peer Group: NA NA NA NA NA Average: 1.33 10.29 2.95 4.05 0.52 2.51 60.4 10.4 10.6 16.7 105 0.88 0.87 0.08 7.0 9.2 Median: 1.14 11.13 2.94 4.13 0.54 2.21 60.7 9.9 9.8 14.0 93 0.98 0.57 0.01 6.7 6.3
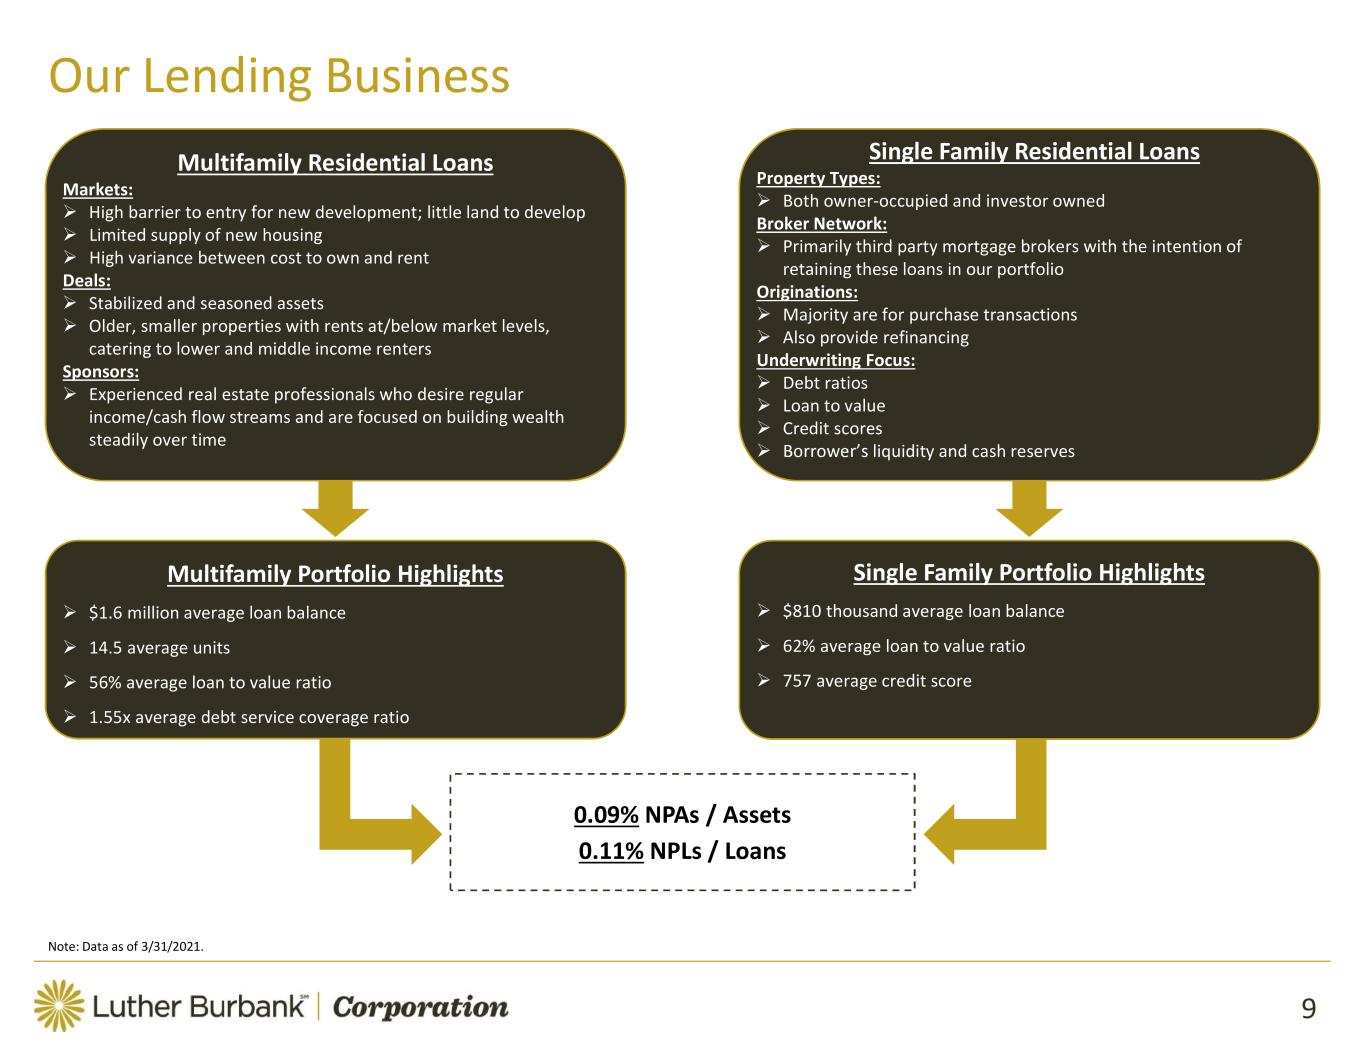
Multifamily Residential Loans Markets: Deals: Sponsors: Single Family Residential Loans Property Types: Broker Network: Originations: Underwriting Focus: 0.09% NPAs / Assets 0.11% NPLs / Loans Multifamily Portfolio Highlights Single Family Portfolio Highlights
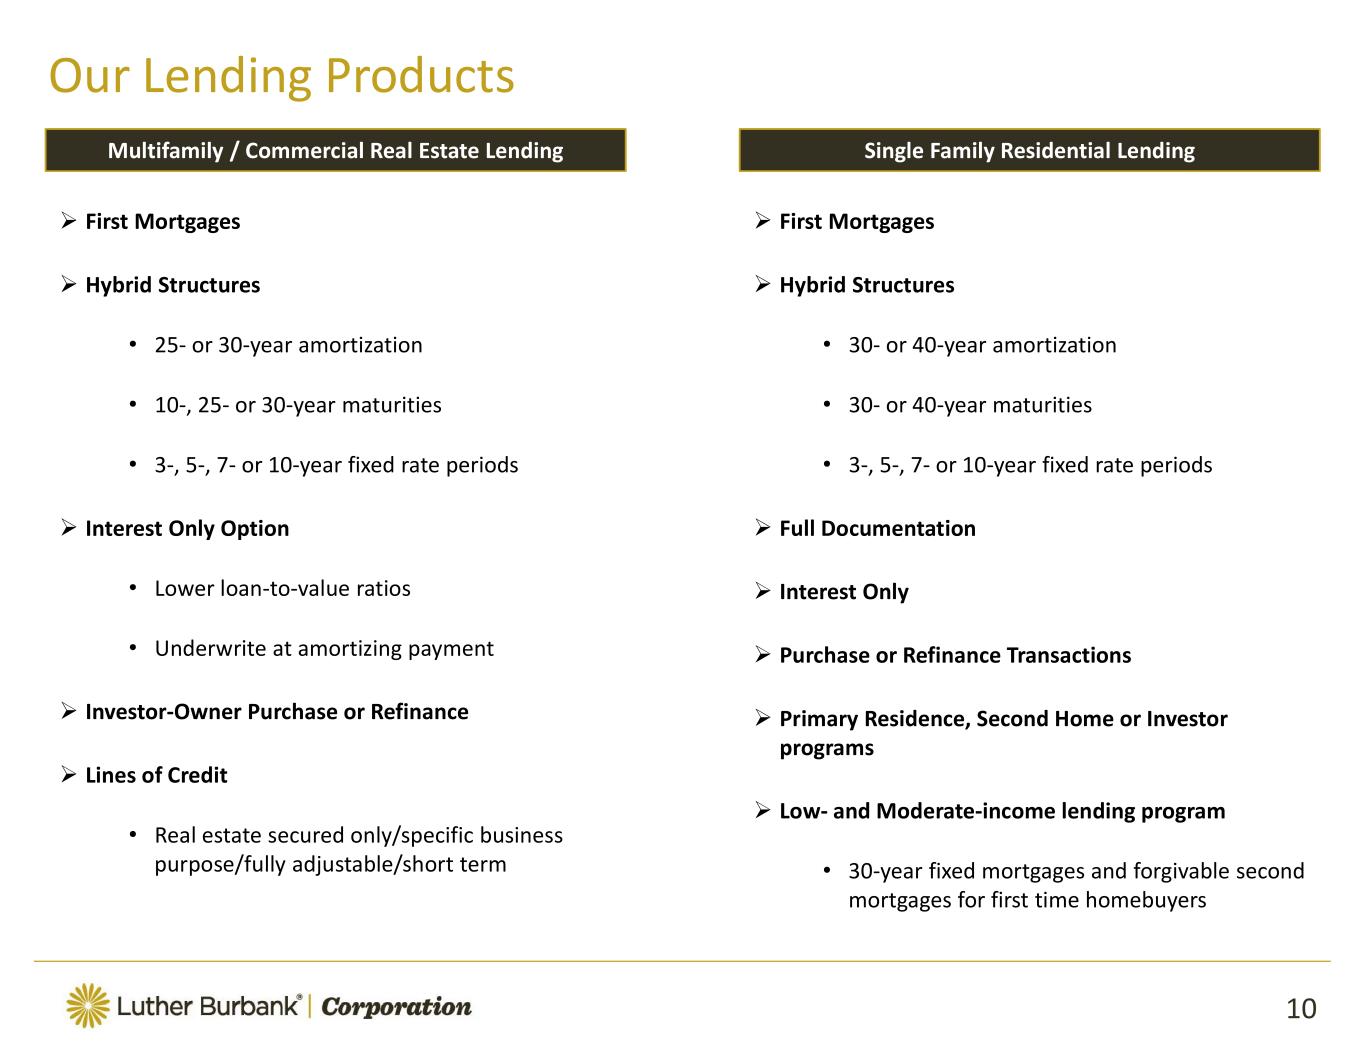
First Mortgages Hybrid Structures Interest Only Option Investor Owner Purchase or Refinance Lines of Credit Multifamily / Commercial Real Estate Lending Single Family Residential Lending First Mortgages Hybrid Structures Full Documentation Interest Only Purchase or Refinance Transactions Primary Residence, Second Home or Investor programs Low and Moderate income lending program

Historical Loan Growth 3.50% yield on loans; 3.86% weighted average coupon Loan Portfolio Composition (1) Multifamily Loans by Lending Area (1) Single Family Loans by Lending Area (1)

Loan Portfolio Composition (1)
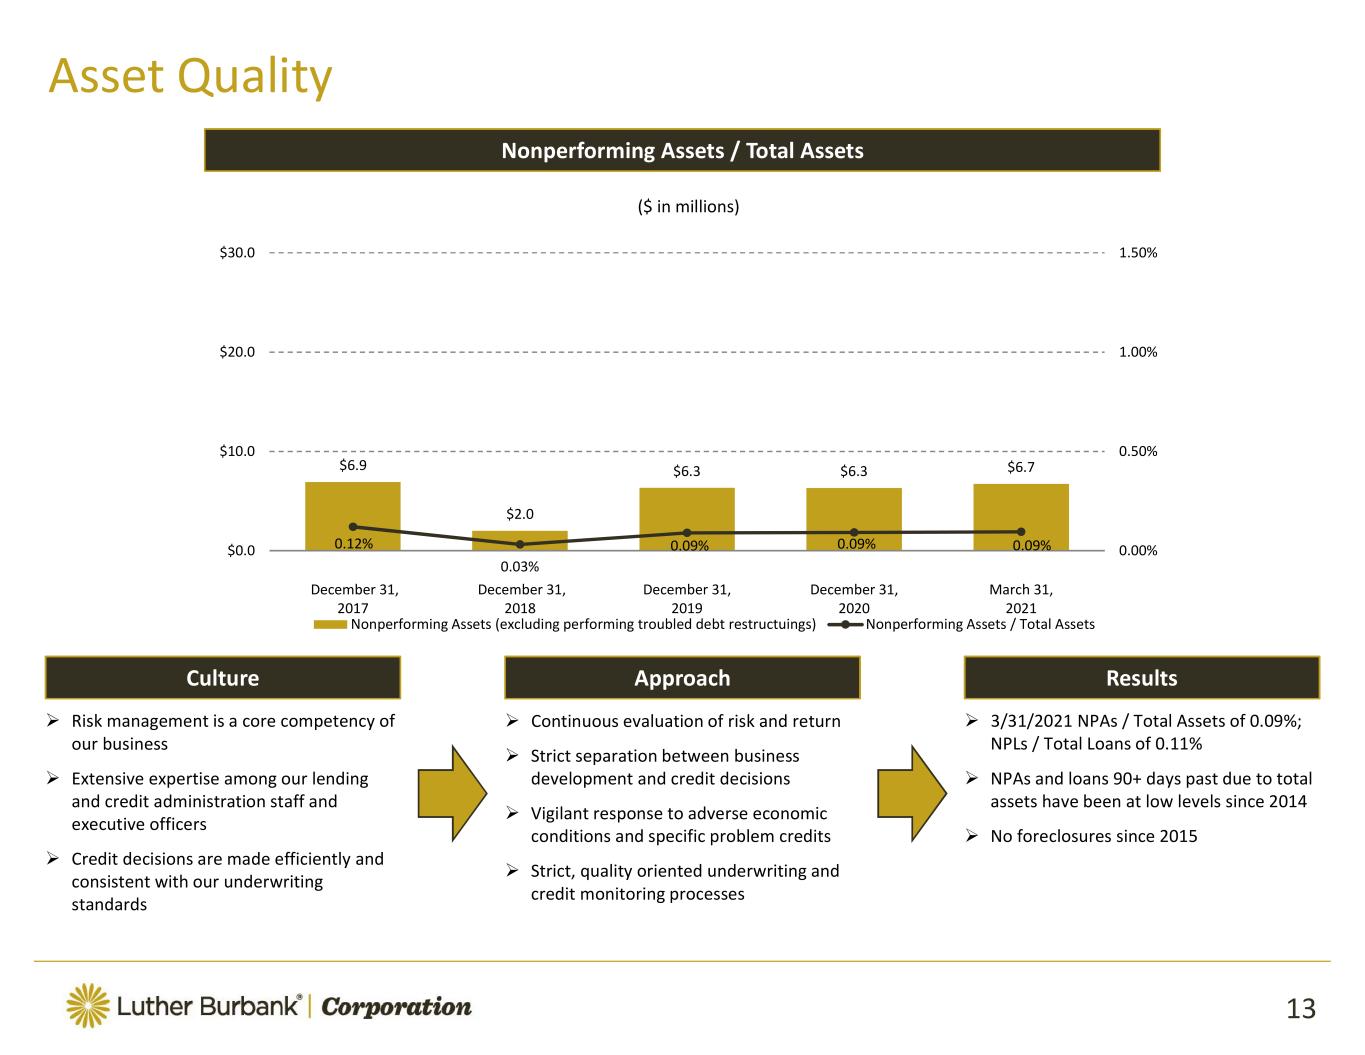
Culture Approach Results Nonperforming Assets / Total Assets

$1,441.4 Q4 Q3 Q2 Q1
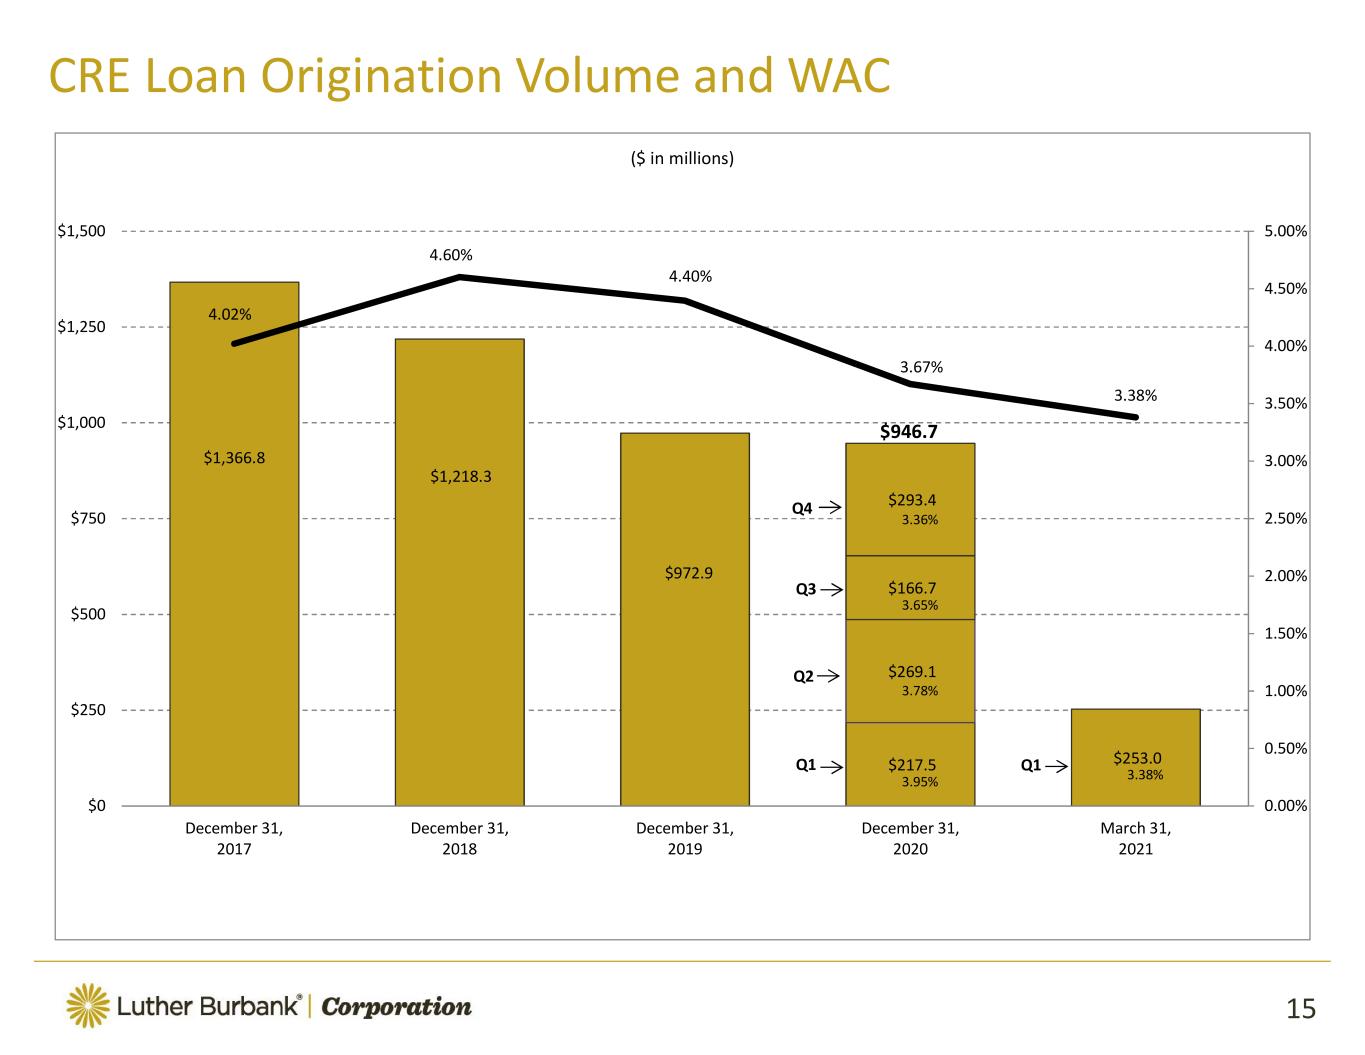
$946.7 Q1 Q4 Q3 Q2 Q1

$494.8 Q4 Q3 Q2 Q1 Q1

CP R
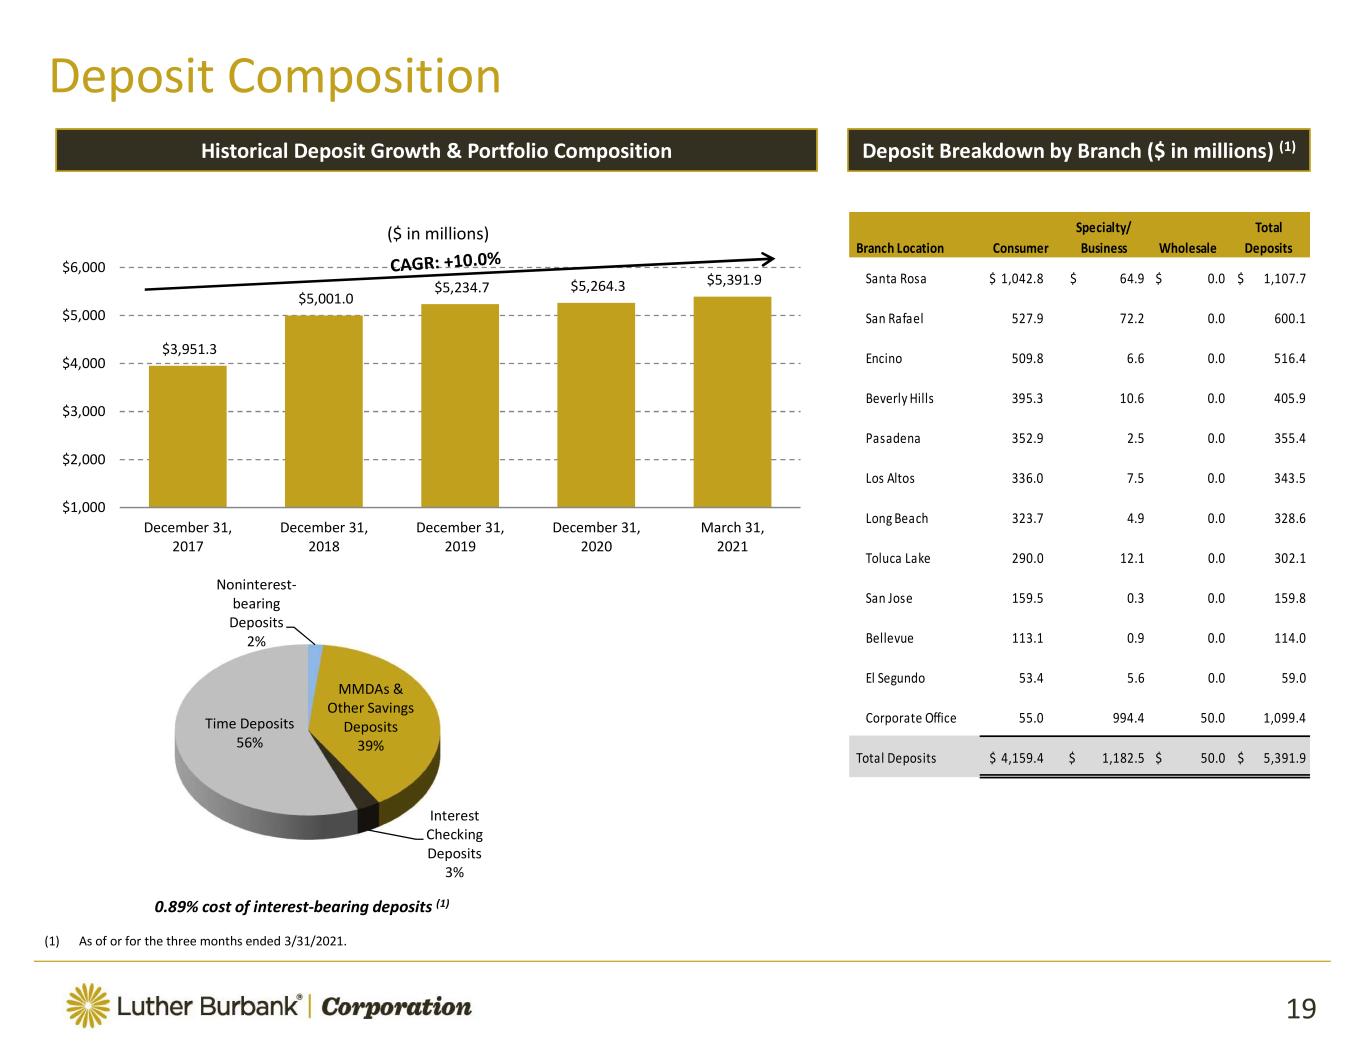
Historical Deposit Growth & Portfolio Composition 0.89% cost of interest bearing deposits (1) Deposit Breakdown by Branch ($ in millions) (1) Branch Location Consumer Specialty/ Business Wholesale Total Deposits
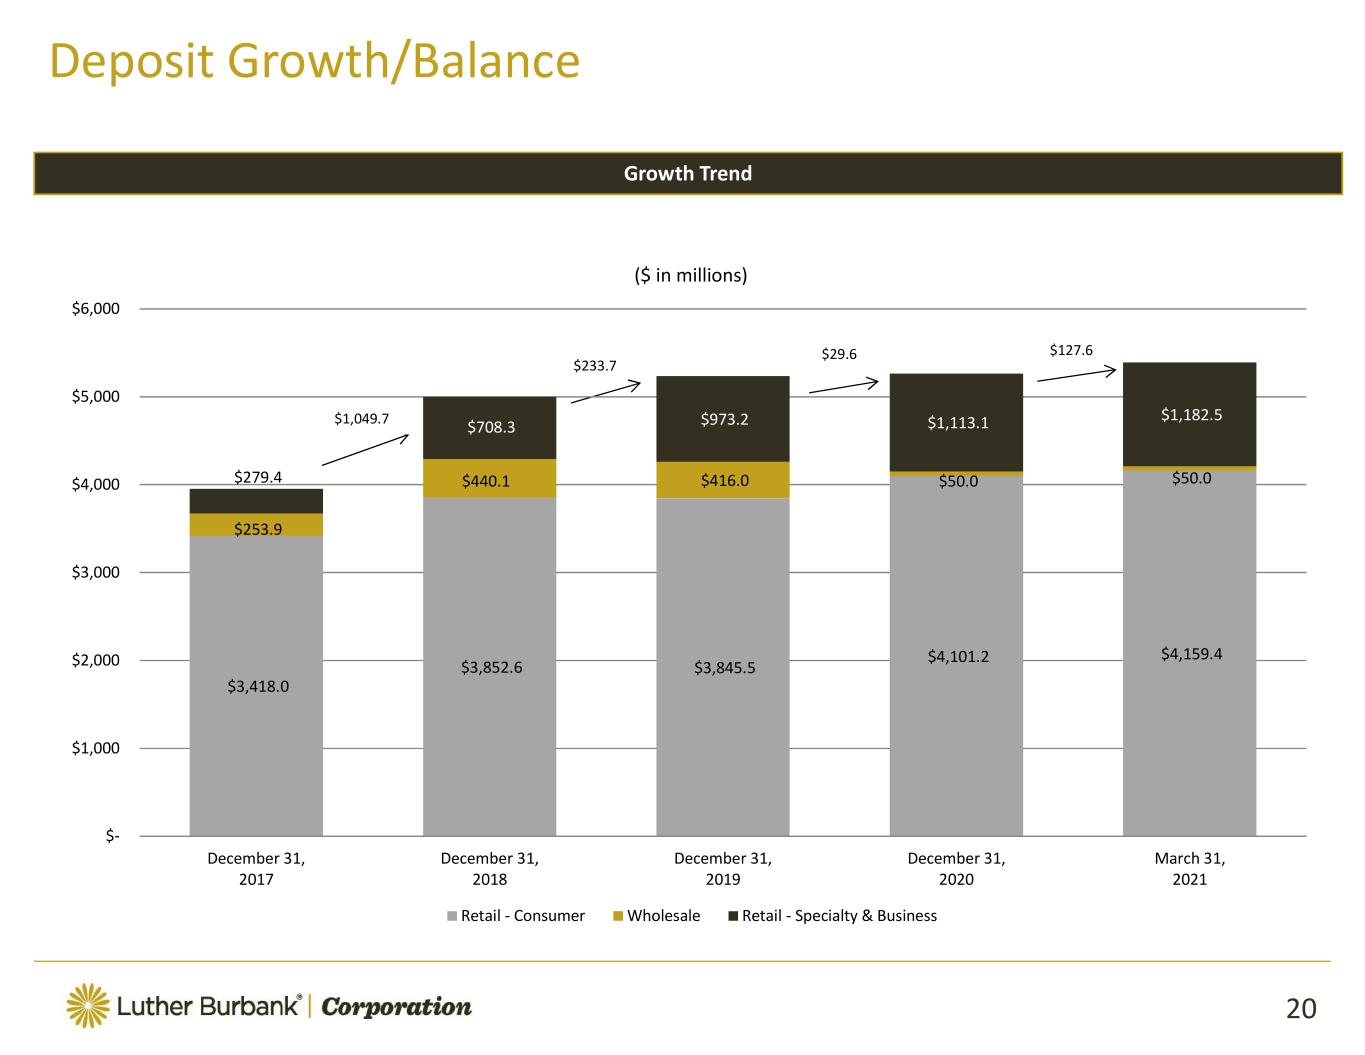
Growth Trend
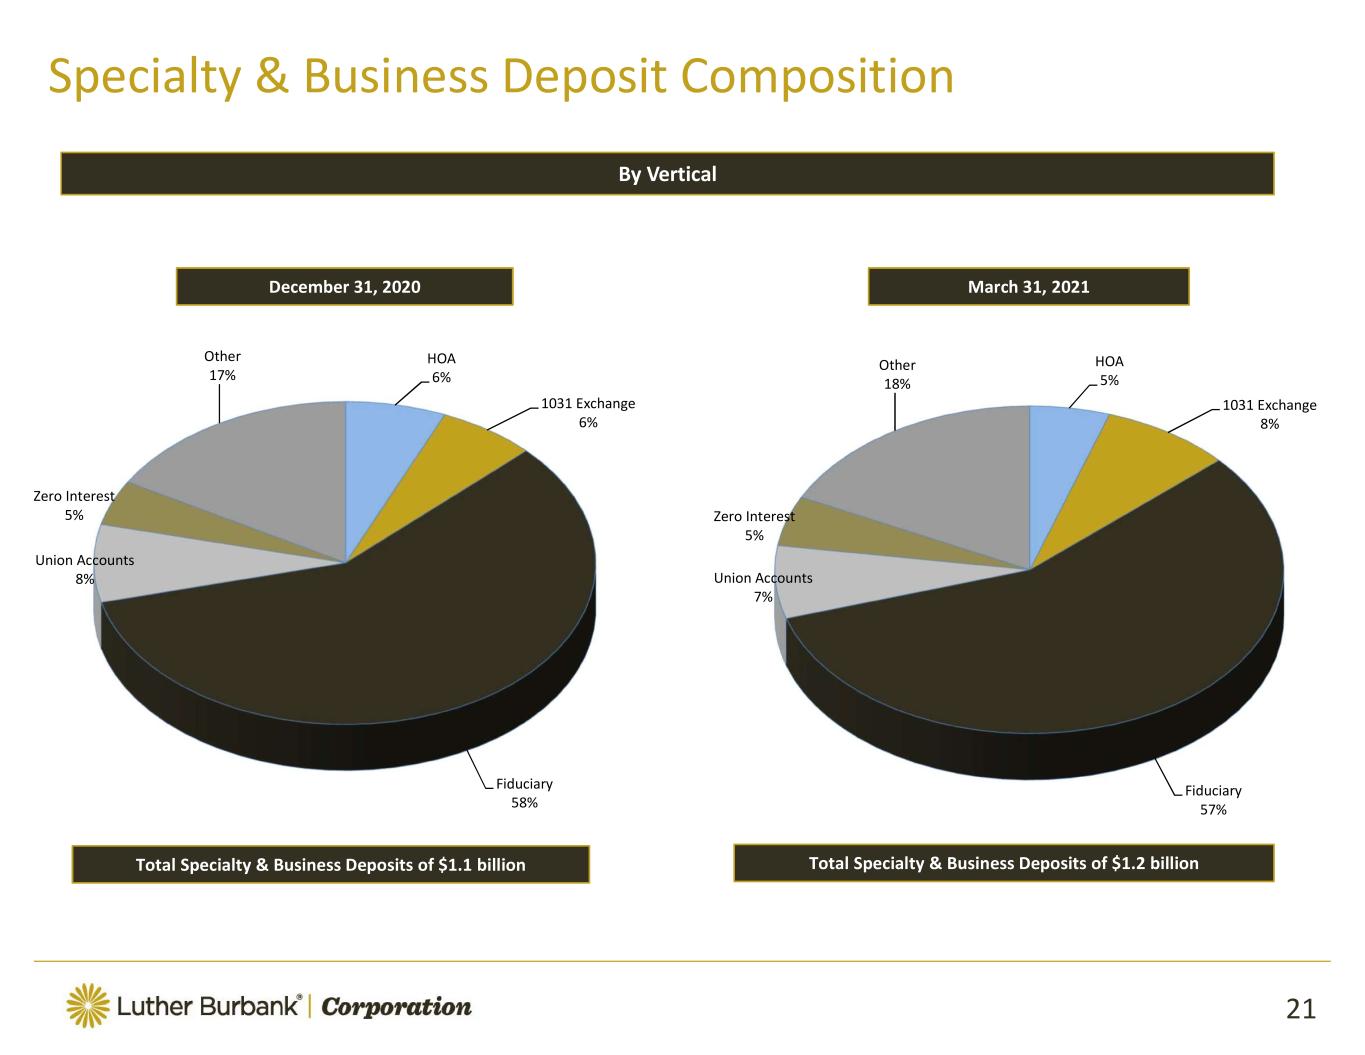
By Vertical December 31, 2020 March 31, 2021 Total Specialty & Business Deposits of $1.1 billion Total Specialty & Business Deposits of $1.2 billion

Return on Average Assets(1) Return on Average Equity(1) Efficiency Ratio Noninterest Expense to Average Assets

Quarterly Net Interest Margin Net Interest Margin
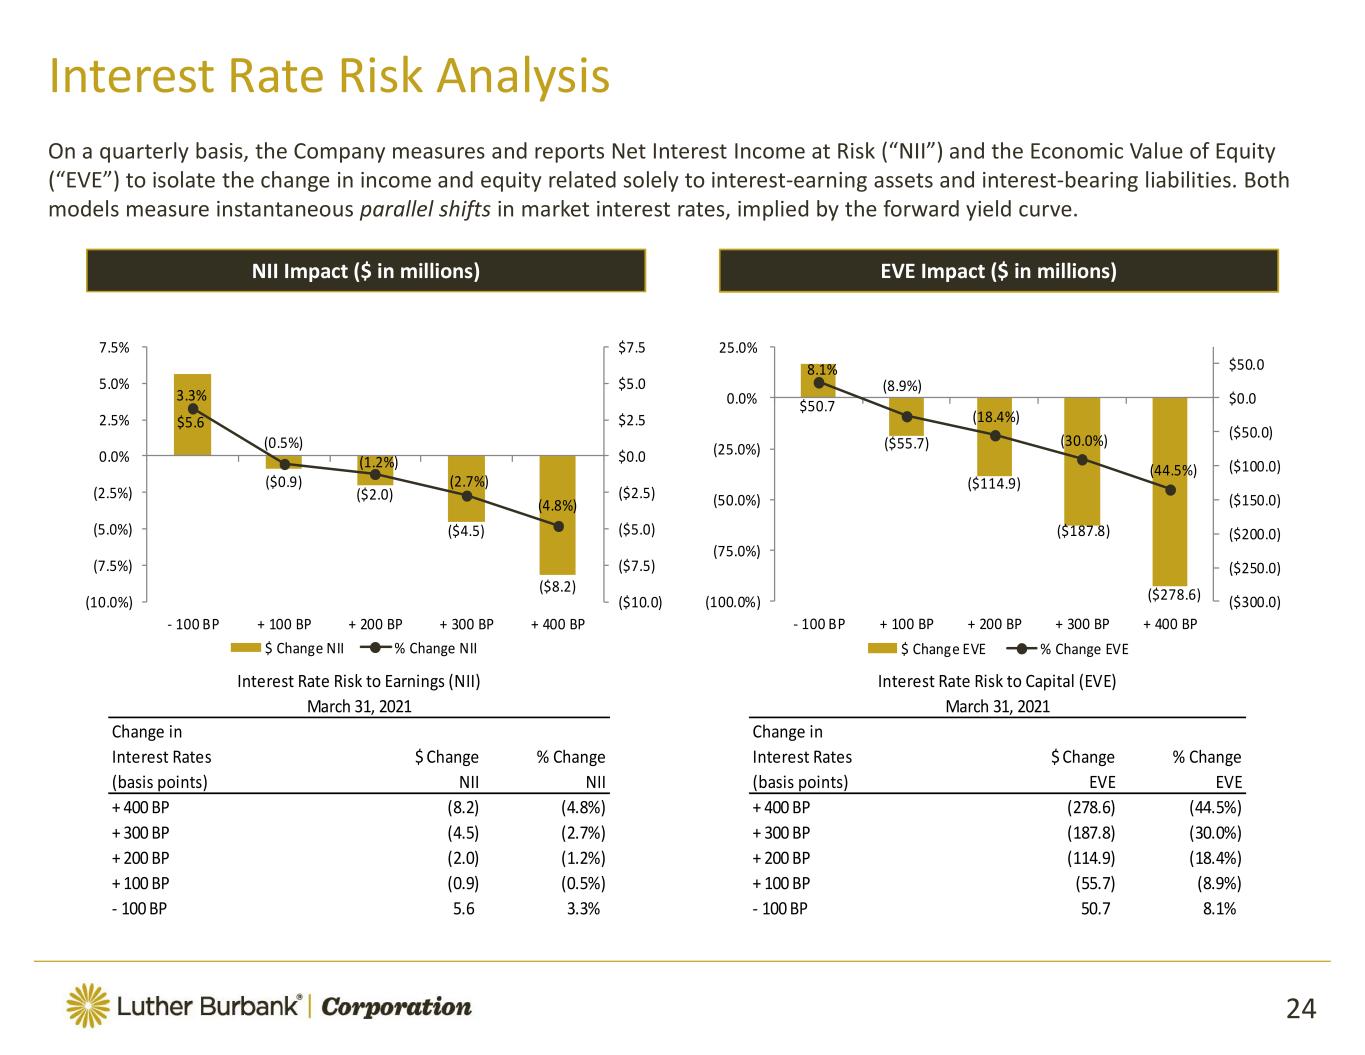
parallel shifts NII Impact ($ in millions) EVE Impact ($ in millions)

(1) (1)

A ve .M on th ly R at e %
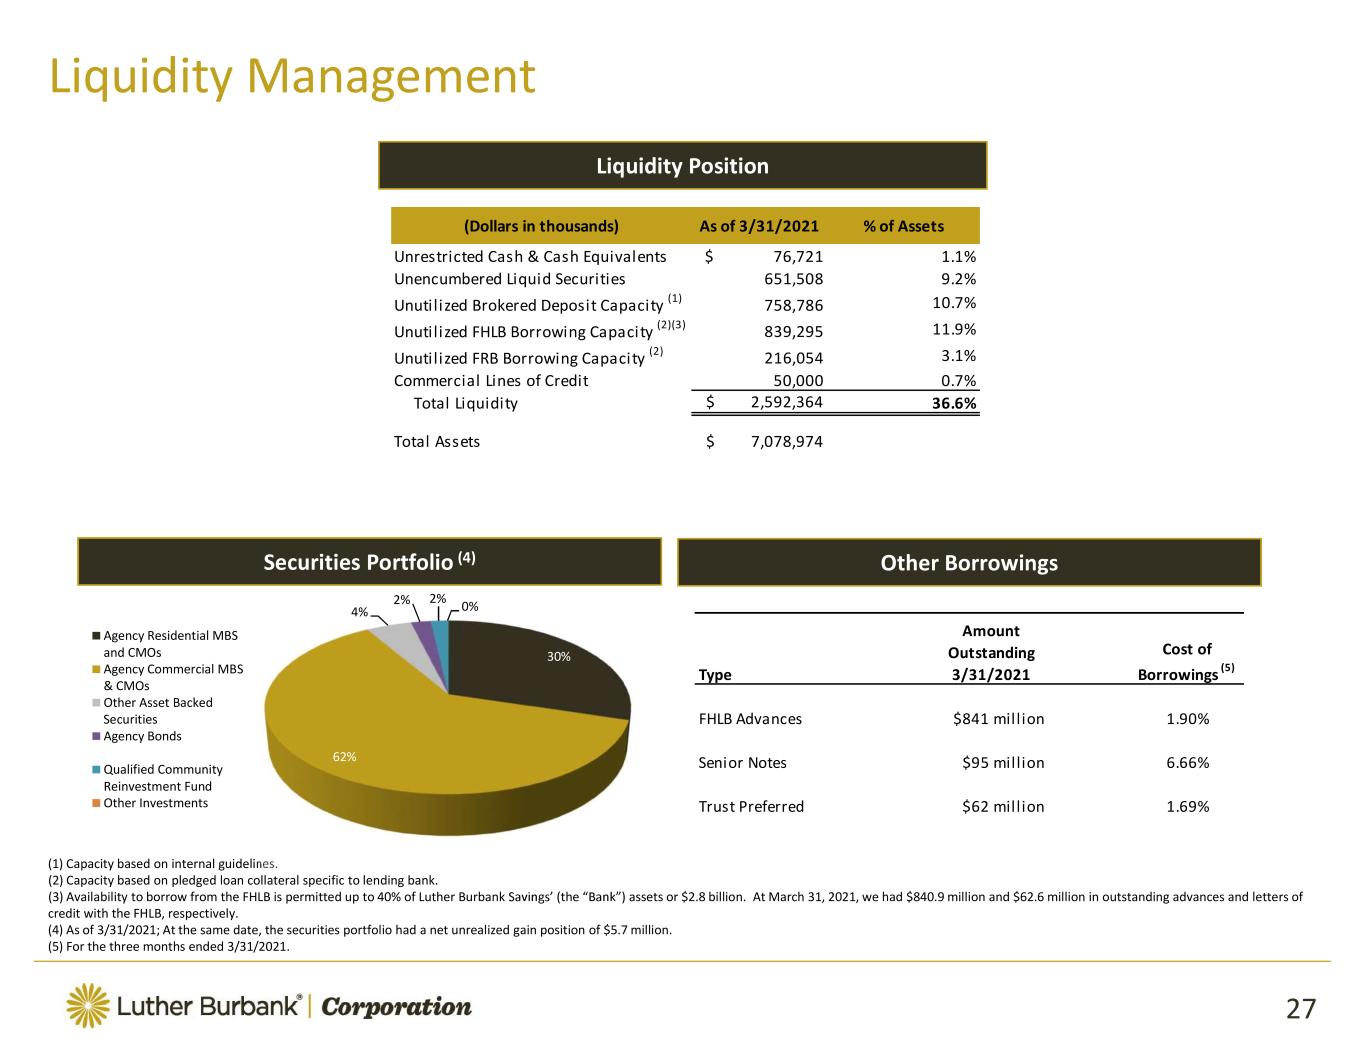
Other BorrowingsSecurities Portfolio (4) Liquidity Position Type Amount Outstanding 3/31/2021 Cost of Borrowings (5) (Dollars in thousands) As of 3/31/2021 % of Assets 36.6%
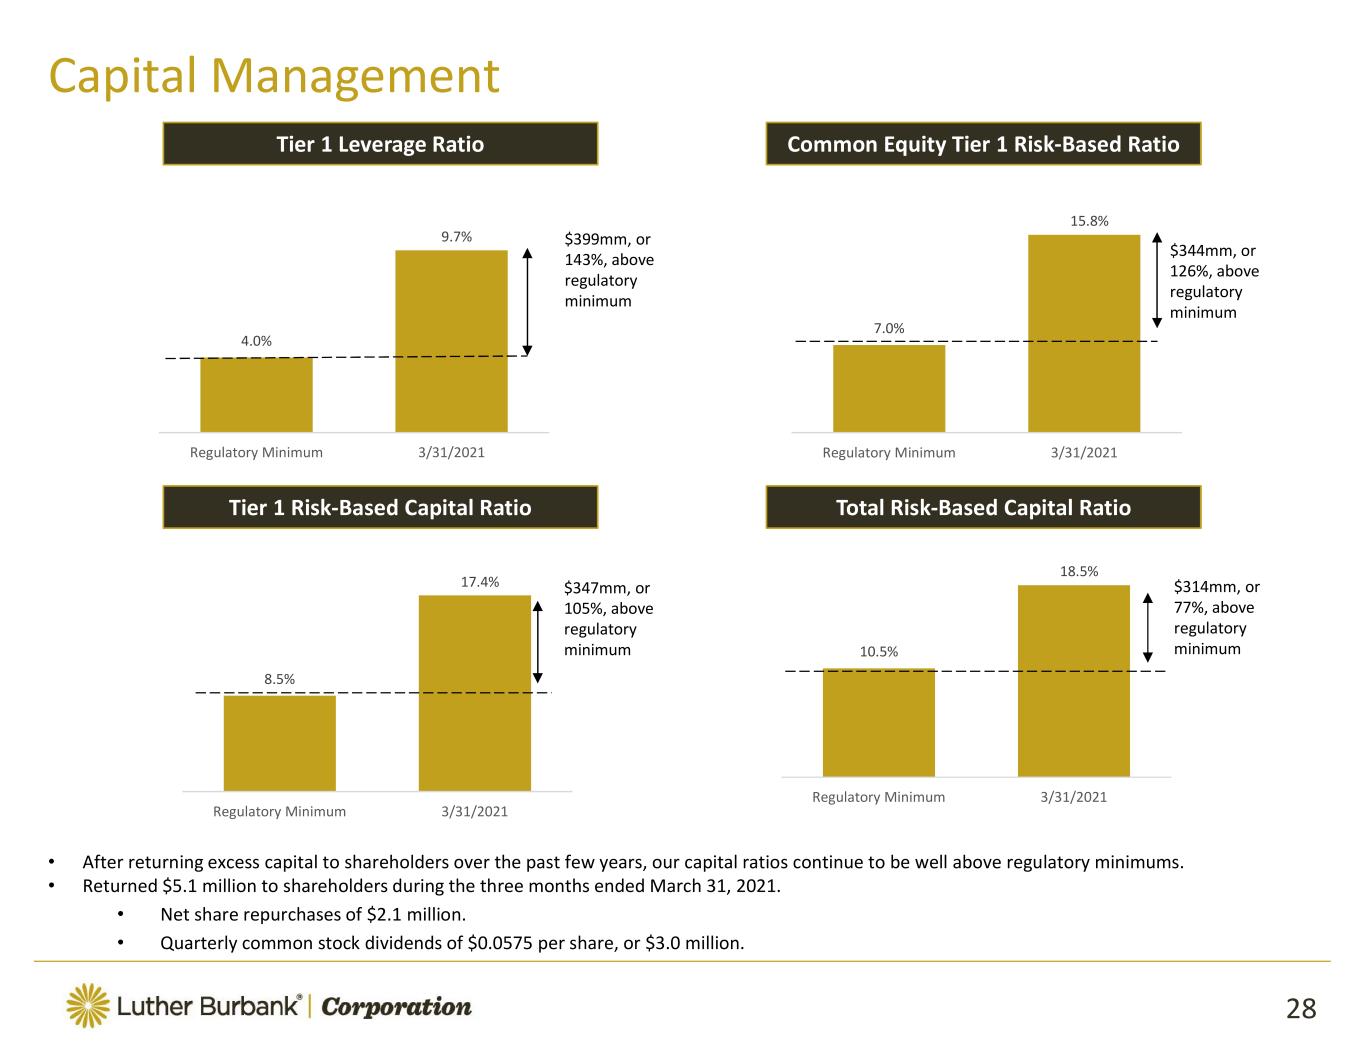
Common Equity Tier 1 Risk Based RatioTier 1 Leverage Ratio Tier 1 Risk Based Capital Ratio Total Risk Based Capital Ratio

Simone Lagomarsino. Laura Tarantino. Bill Fanter.

Tammy Mahoney. Parham Medhat. Liana Prieto. Alex Stefani.

Victor S. Trione. Renu Agrawal. John C. Erickson. Jack Krouskup.
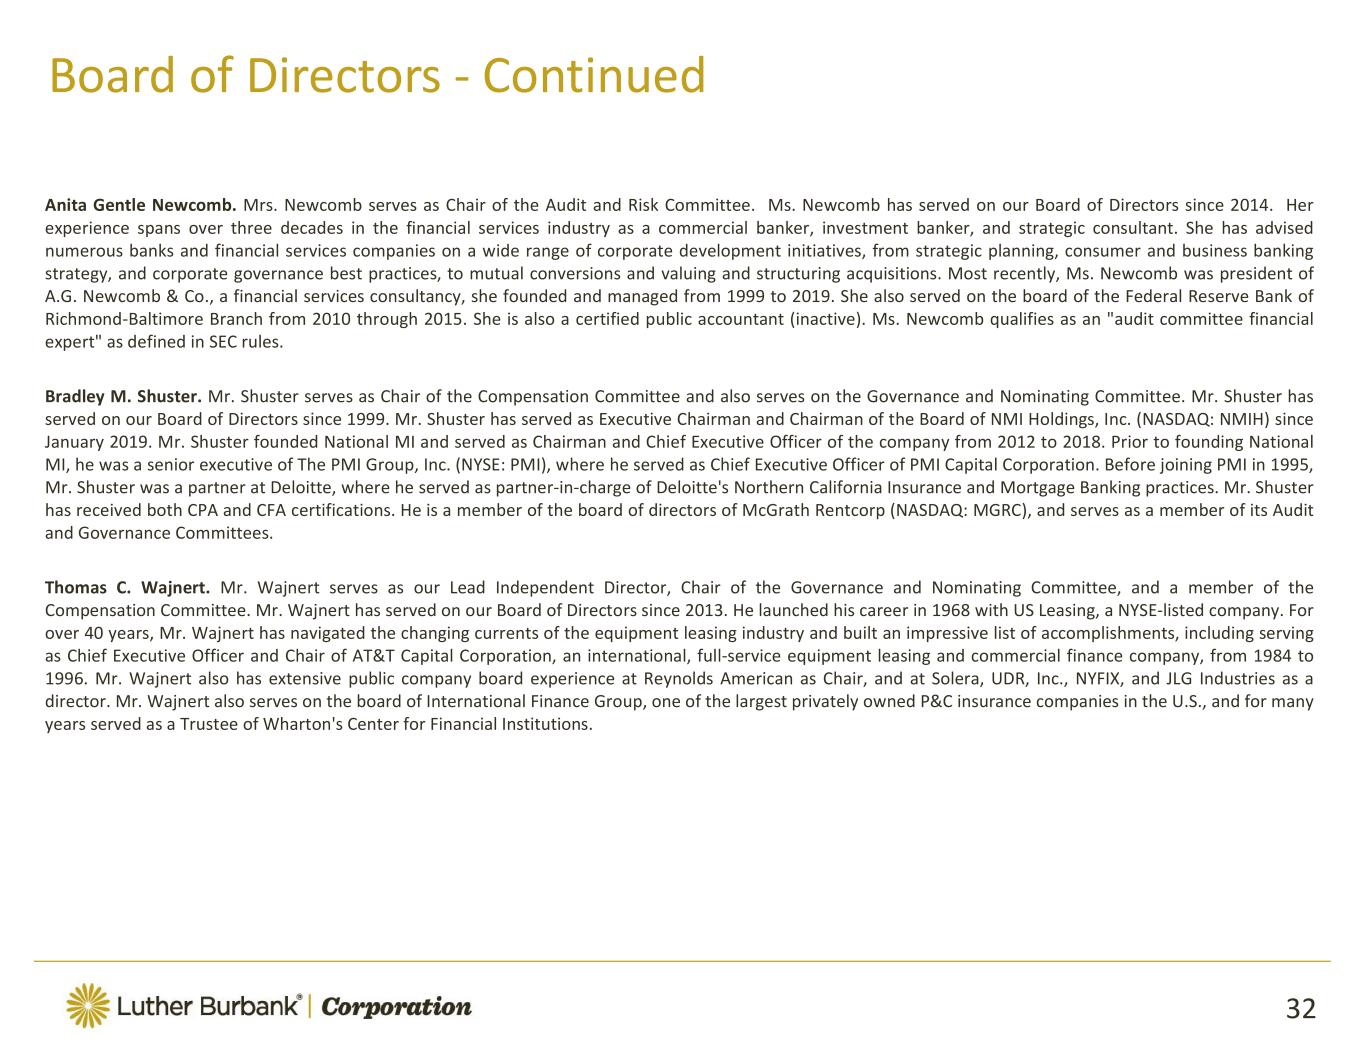
Anita Gentle Newcomb. Bradley M. Shuster. Thomas C. Wajnert.

Appendix

March 31, 2021 (1) December 31, 2020 ASSETS Total assets LIABILITIES AND STOCKHOLDERS' EQUITY Liabilities: Total liabilities Stockholders' equity: Total stockholders' equity Total liabilities and stockholders' equity As of
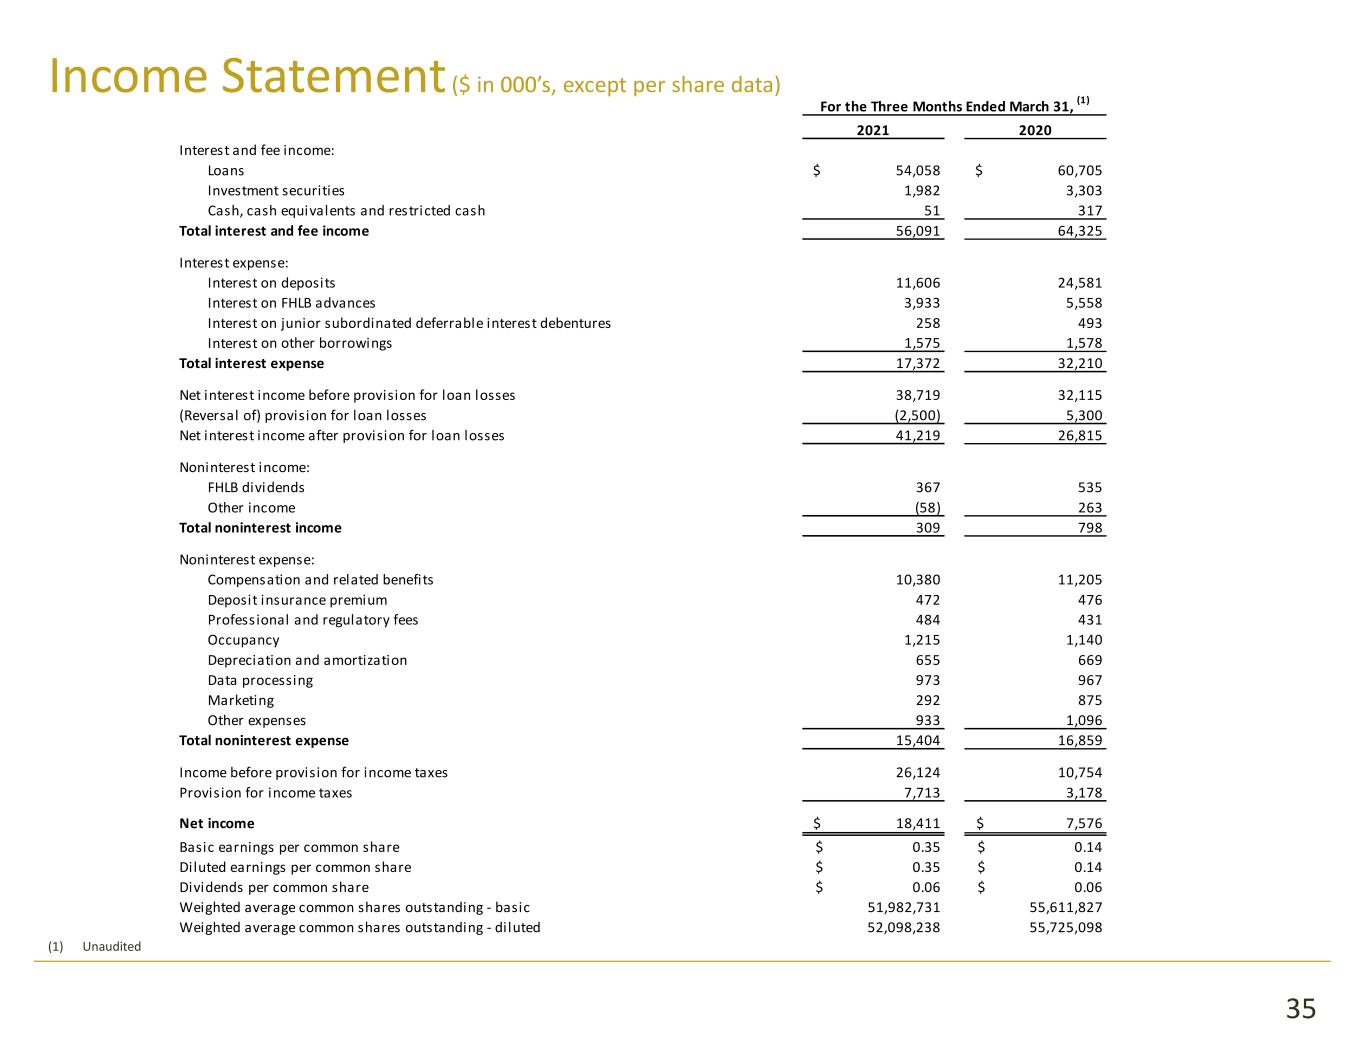
2021 2020 Total interest and fee income Total interest expense Total noninterest income Total noninterest expense Net income For the Three Months Ended March 31, (1)

Average Interest Average Average Interest Average Balance Inc / Exp Yield/Rate (5) Balance Inc / Exp Yield/Rate (5) Interest Earning Assets Total interest earning assets Total assets Interest Bearing Liabilities Total interest bearing liabilities Total liabilities Total liabilities and stockholders' equity Net interest spread (3) 2.11% 2.02% Net interest income/margin (4) 38,719$ 2.23% 37,248$ 2.13% For the Three Months Ended March 31, 2021 For the Three Months Ended December 31, 2020
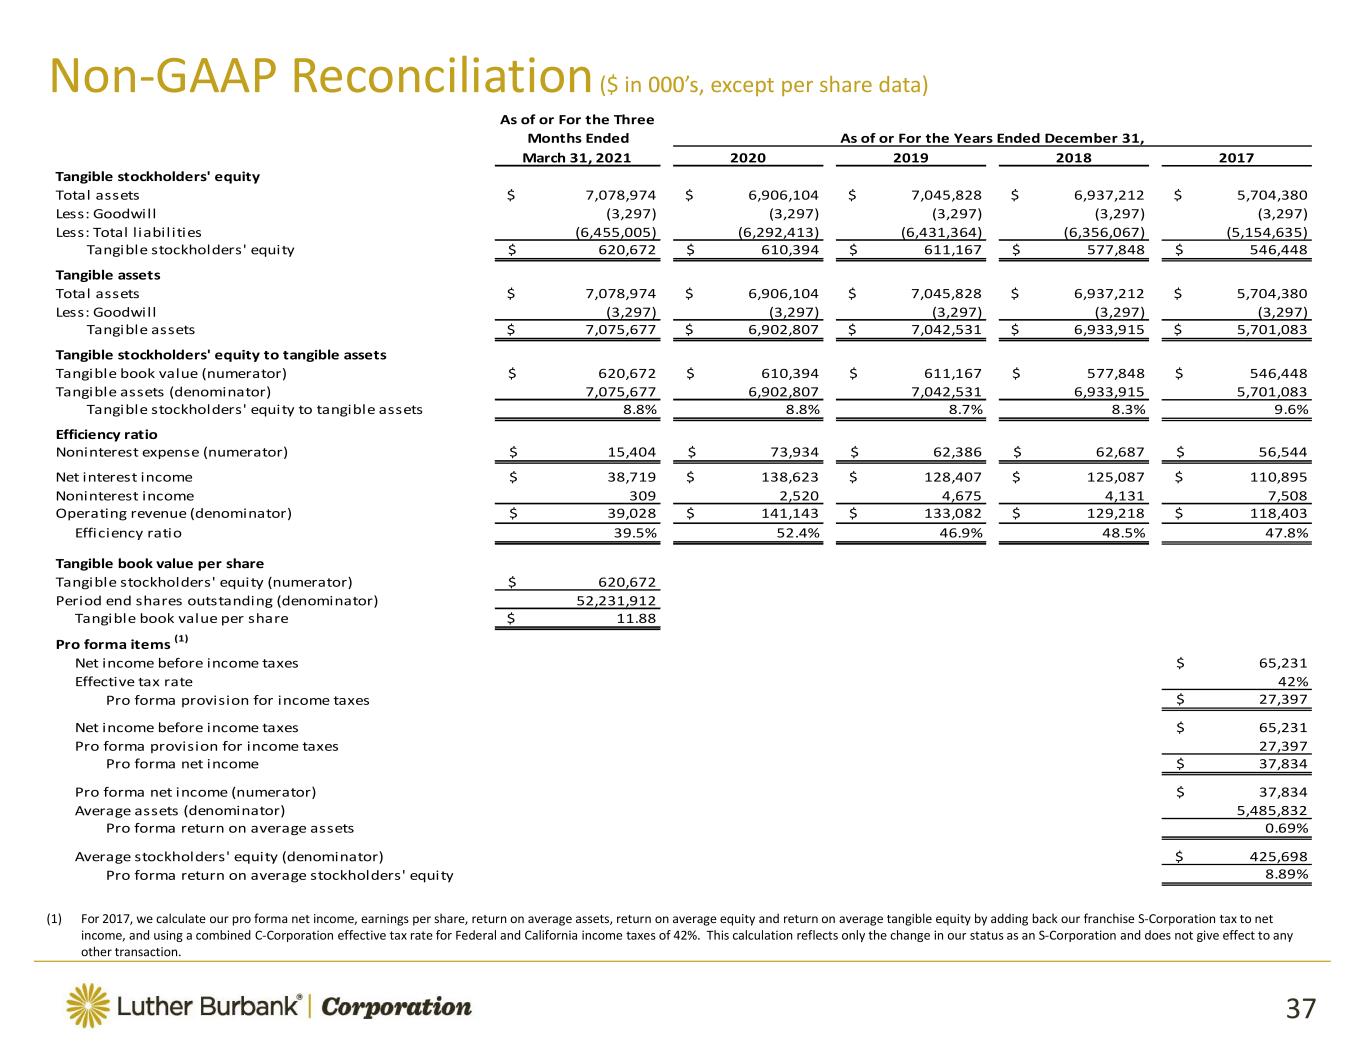
March 31, 2021 2020 2019 2018 2017 Tangible stockholders' equity Tangible assets Tangible stockholders' equity to tangible assets Efficiency ratio Tangible book value per share Pro forma items (1) As of or For the Three Months Ended As of or For the Years Ended December 31,
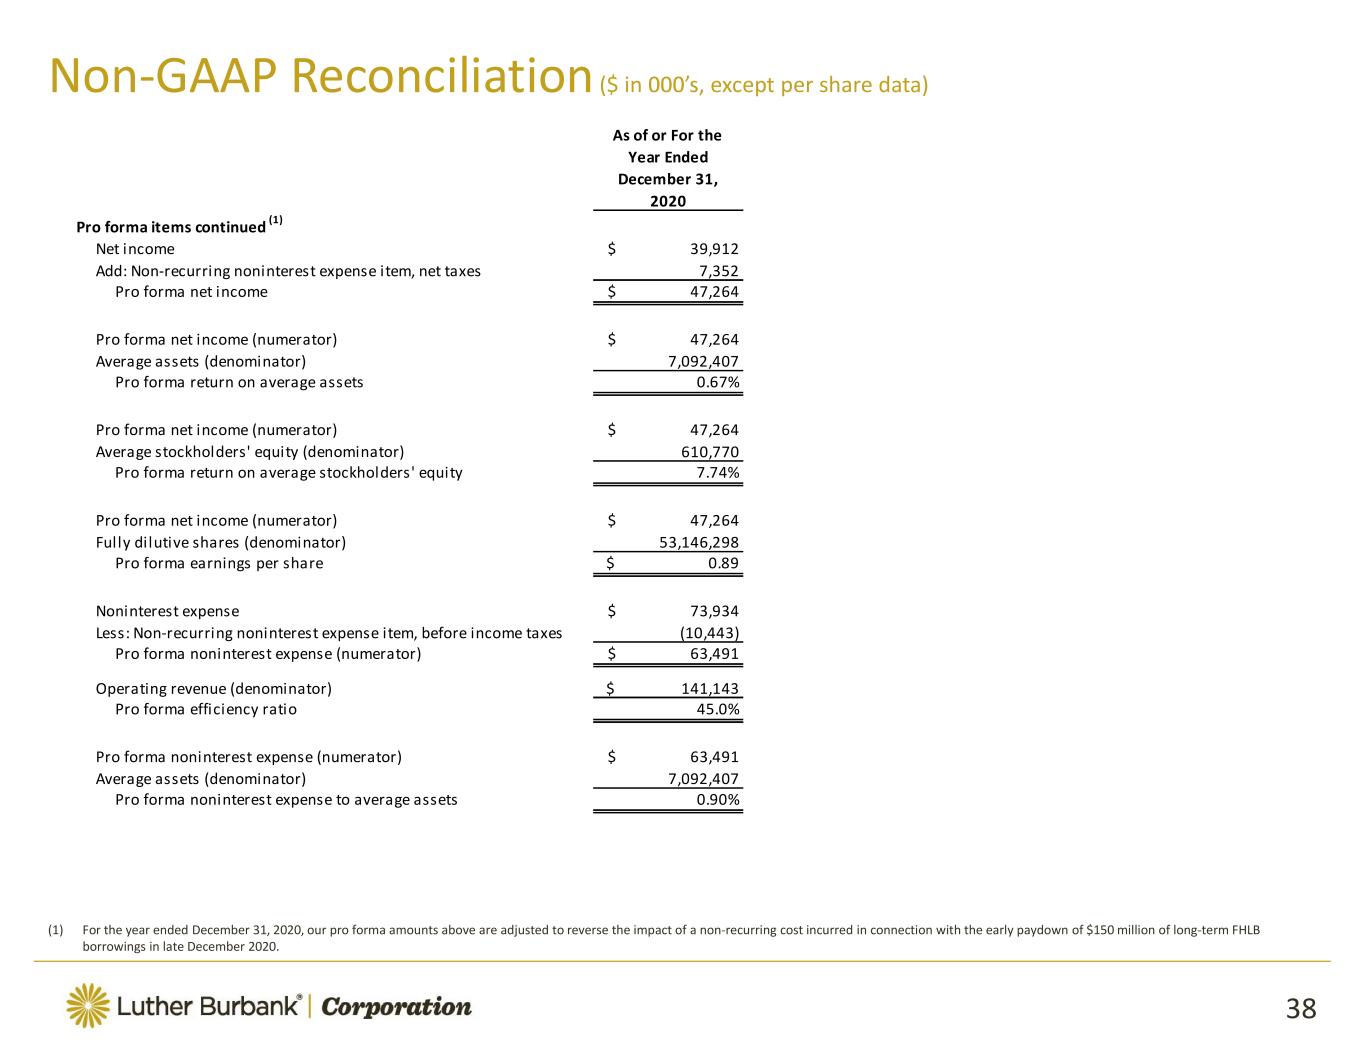
As of or For the Year Ended December 31, 2020 Pro forma items continued (1)

