4 Q 2022 Investor Presentation |
Disclosure 1 This presentation contains forward-looking statements within the meaning of the Private Securities Litigation Reform Act of 1995. Examples of forward-looking statements include but are not limited to the Companys future financial condition and capital ratios, results of operations and the Companys outlook and business. Forward-looking statements are not historical facts. Such statements may be identified by the use of such words as may, believe, expect, anticipate, plan, continue or similar terminology. These statements relate to future events or our future financial performance and involve risks and uncertainties that may cause our actual results, levels of activity, performance or achievements to differ materially from those expressed or implied by these forward-looking statements. Although we believe that the expectations reflected in the forward-looking statements are reasonable, we caution you not to place undue reliance on these forward-looking statements. Factors which may cause our forward-looking statements to be materially inaccurate include, but are not limited to the continuing impact of the COVID-19 pandemic on our business and results of operation, an unexpected deterioration in our loan or securities portfolios, unexpected increases in our expenses, different than anticipated growth and our ability to manage our growth, unanticipated regulatory action or changes in regulations, unexpected changes in interest rates, inflation, potential recessionary conditions, an unanticipated decrease in deposits, an unanticipated loss of key personnel or existing customers, competition from other institutions resulting in unanticipated changes in our loan or deposit rates, an unexpected adverse financial, regulatory or bankruptcy event experienced by our fintech partners, unanticipated increases in FDIC costs, changes in regulations, legislation or tax or accounting rules, monetary and fiscal policies of the U.S. Government including policies of the U.S. Treasury and the Board of Governors of the Federal Reserve System, the current or anticipated impact of military conflict, terrorism or other geopolitical events, the costs, including possibly incurring fines, penalties or other negative effects (including reputational harm), of any adverse judicial, administrative, or arbitral rulings or proceedings, regulatory enforcement actions, or other legal actions, a failure in or breach of the Companys operational or security systems or infrastructure, including cyberattacks, the failure to maintain current technologies, failure to retain or attract employees and unanticipated adverse changes in our customers economic conditions or general economic conditions, as well as those discussed under the heading Risk Factors in our Annual Report on Form 10-K and Quarterly Reports on Form 10-Q.. Forward-looking statements speak only as of the date of this presentation. We do not undertake any obligation to update or revise any forward-looking statement. |
2 A Diversified Financial Institution We are More than a Commercial Bank Personal Banking Broad range of hallmark personal checking and savings accounts A full suite of electronic banking services that allow clients to easily manage their everyday financing needs Commercial Lending Relationship-based commercial real estate lending Growth driven by expertise in specific lending verticals Business Banking Checking, deposit, lending and cash management products and services for small and middle-market businesses MCB Business Bankers with deep knowledge and expertise in multiple industries, including law firms, resident healthcare, real estate property management, U.S. Trustee and municipalities Global Digital Payments (BaaS) Settlement for domestic and international digital payments Delivers critical financial infrastructure Provides Banking-as-a-Service to high growth fintechs Our mission To offer a full range of banking and innovative financial services to businesses and individuals Serve markets underserved by the ever-consolidating financial services industry and advance our leading edge model that combines new technologies with the best of traditional banking practices Our history Founded in 1999 in New York City with the goal of helping clients build and sustain generational wealth Business model focused on providing high-touch service with industry expertise and delivering customized solutions for our clients Commercial banking business is relationship driven and predominantly located in the highly attractive New York metro area Global payments business provides Banking-as-a-Service (BaaS) to leading fintech partners, which includes serving as an issuing bank for third-party managed debit card programs nationwide and providing other financial infrastructure, including cash settlement and custodian deposit services 2017 IPO raised $125mm of common equity and fueled industry-leading balance sheet and earnings growth In September 2021, MCB raised $172.5 million of common equity in a follow on offering of 2.3 million shares at $75 per share As of December 31, 2022, MCB has $6.3bnof assets; 29% compound annual growth rate since the IPO |
Proven high growth business model 3 Loans $ millions $1,404 $1,661 $2,791 $3,830 $6,436 $5,278 2017 2018 2019 2020 2021 2022 Deposits $ millions $63 $83 $108 $142 $181 $256 2017 2018 2019 2020 2021 2022 Revenue $ millions $12 $26 $30 $39 $60 $59 2017 2018 2019 2020 2021 2022 Adjusted Net Income Net Income and Adjusted Net Income 4 $ millions 1 CAGR from December 31, 2017 through 2022. 2 CAGR from December 31, 2017 through 2022. 3 Adjusted Net Income CAGR from December 31, 2017 through 2022. 4 Non-GAAP financial measure. Adjusted amounts exclude the effect of costs related to the $35.0 million regulatory settlement reserve. See reconciliation to GAAP measure beginning on page 19. $1,421 $1,867 $2,678 $3,137 $3,732 $4,841 2017 2018 2019 2020 2021 2022 $94 |
36.4% 19.5% 10.7% Metropolitan Commercial Bank High-growth banks KRX Index Revenue CAGR 1 20172022Q3 Investors have been rewarded for our strong performance Tangible book value per share CAGR 1 20172022Q3 Earnings per share CAGR 1 20172022Q3 32.5% 22.4% 14.4% Metropolitan Commercial Bank High-growth banks KRX Index Share price performance since IPO 4 versus KRX Index 3 14.9% 13.1% 2.0% Metropolitan Commercial Bank High-growth banks KRX Index (60%) 0% 60% 120% 180% 240% Nov-17 Aug-18 May-19 Jan-20 Oct-20 Jul-21 Apr-22 Jan-23 Metropolitan Commercial Bank High-growth banks KRX Index +74% +50% Source: FactSet, SNL Financial 1 CAGR from December 31, 2017 through September 30, 2022 (if applicable for High-growth banks and KRX Index). 2 Includes banks with market capitalization of $500mm+ and revenue, EPS, and TBVPS CAGRs >10% (2015-2021); Includes AX, BFC, CASH, FFIN, FFWM, FRC, HIFS, MBIN, PNFP, QCRH, SFBS, SIVB, and WAL. 3 KRX Index represents the KBW Regional Bank Index. 4 Performance since November 7, 2017 (MCB offering price of $35.00 per share) through January 12, 2023. +11% |
Delivering Financial Results 5 Annual Financial Highlights Year-Over-Year Revenues increased 41.5%. Net interest income of $229.2 million, an increase of 46.0%. Net interest margin of 3.49%, an increase of 72 basis points. Net income of $59.4 million, inclusive of a $35.0 million charge for a regulatory settlement reserve and adjusted net income** of $94.4 million. Diluted earnings per share of $5.29, inclusive of a $3.13 per share charge for a regulatory settlement reserve and adjusted diluted earnings per share** of $8.42. Loans totaled $4.8 billion, an increase of 29.7%. Return on average equity of 10.3% and return on average tangible common equity1 of 10.4%. Adjusted return on average equity** of 16.3% and adjusted return on average tangible common equity** of 16.6%. *Total Revenues includes Net Interest Income and Non-Interest Income. **Non-GAAP financial measure. See reconciliation to GAAP measure beginning on page 19. 1 Total non-interest expense divided by Total revenues. $60,013 $78,744 $102,596 $133,460 $164,253 $236,410 $3,369 $4,640 $5,643 $8,464 $16,445 $19,341 2017 2018 2019 2020 2021 2022 $255,751 $83,384 Total Revenues* Full year, December 31, 2022| $ thousands $108,239 $141,924 $180,698 Global Payments Group (GPG) Revenues Excluding GPG $63,382 $19,021 $19,021 $12,117 $6,097 $8,531 $3,291 $2,549 $23,189 $23,189 $13,336 $10,811 $6,057 $5,865 $2,651 $24,955 $24,955 $16,215 $10,783 $7,683 $7,113 $3,845 -$7,740 $18,887 $11,775 $7,863 $6,285 $3,324 $27,260 Adjusted Net Income 2022** 2022 2021 2020 2019 2018 2017 Adjusted Q4 4Q 3Q 2Q 1Q Quarterly Net Income and Adjusted Quarterly Net Income** $ thousands $94,425 $12,369 $25,554 $30,134 $39,466 $60,555 $59,425 10.5% 10.8% 11.3% 12.9% 15.2% 10.4% 2017 2018 2019 2020 2021 2022 Adjusted ROATCE ROATCE and Adjusted ROATCE** at December 31, 2022 16.6% |
Loan Portfolio Growth and Diversification 6 1 Gross of deferred fees and unamortized costs. 2 Certain prior period amounts adjusted to conform to current presentation. * Includes consumer and 1-4 family loans. ** Includes commercial real estate, multifamily and construction loans. $4.85 billion Gross Loan Portfolio 1, 2 at December 31, 2022 | $ millions A Diversified Portfolio at December 31, 2022 67% 19% 10% 3% CRE C&I Multifamily Contruction Other $2,122 $2,140 $2,239 $2,259 $2,388 $2,504 $780 $855 $1,085 $1,268 $1,296 $1,362 $611 $654 $724 $781 $869 $909 $97 $90 $82 $78 $76 $78 3Q 20214Q 20211Q 20222Q 20223Q 20224Q 2022 $3,610 $3,739 $4,130 $4,629 Total loans: $4.85mm Average 4Q Yield: 5.98% CRE/RBC ratio: MCB 366% $4,853 $4,368 |
Commercial Growth Driven by Expertise in Specific Lending Verticals 7 Commercial and Industrial Overview Target Market Middle market businesses with annual revenues below $200 million Well-diversified across industries Key Metrics Strong historical credit performance - Pledged collateral and/or personal guarantees from high- net-worth individuals support most loans - Target borrowers have strong historical cash flows, good asset coverage and positive industry outlooks C&I Composition at December 31, 2022 25% 18% 13% 11% 11% 10% 6% 5% 25% Finance & Insurance 18% Individuals Secured 13% Skilled Nursing Facilities 11% Healthcare 11% Retail 10% Other 6% Manufacturing 5% Wholesale 1% Individuals Unsecured Total C&I loans: $905mm 1 1 Net of deferred fees and unamortized costs. |
Relationship-Based Commercial Real Estate Lending 8 Target Market New York metropolitan area real estate entrepreneurs with a net worth in excess of $50 million Primarily concentrated in the New York MSA Well-diversified across various property types Key Metrics Weighted average LTV of 61% Multifamily loans 34.5% rent regulated Average LTV of 42% on stabilized rent regulated properties provide a cushion against any falling values Composition by Type at December 31, 2022 Composition by Region at December 31, 2022 18% 17% 11% 8% 8% 6% 6% 3% 21% 18% Manhattan 17% Brooklyn 11% Queens 8% Florida 8% Bronx 6% Long Island 6% New Jersey 3% Other NY 1% Staten Island 1% Connecticut 21% Other States Majority of loans are originated through direct relationships or referrals from existing clients. 31% 12% 11% 9% 9% 10% 5% 4% 4% 4% 31% Nursing Home CRE 12% Multifamily 11% Other CRE 9% Mixed Use 9% Retail 10% Office 5% Hospitality 4% Land 4% Construction 4% Warehouse 1% 1-4 Family Total CRE loans: $3,858mm 1 1 Net of deferred fees and unamortized costs. |
Well-Developed, Sector Diversified Healthcare Portfolio 9 Active in Healthcare lending since 2002 Highly selective regarding the quality of Skilled Nursing Operators that we finance Borrowers typically have over 1,000 beds under management Loans are made primarily in certificate of need states which limits the supply of beds and supports stable occupancy rates. Stabilized SNF 71% of CRE SNF portfolio. Stabilized facility provides adequate cash flows to support debt service and collateral value. Borrowers primary motive for acquisition of a stabilized property is for synergies with existing portfolio of SNFs. Average debt service coverage ratio is 2.55x. Non-stabilized SNF typically turn-around older SNFs acquired from owners who mismanaged the business, relied too heavily on long-term care (Medicaid reimbursement) or did not stay current with changes in the marketplace. Opportunity for owner to create value by renovating and adding services with higher Medicaid reimbursements rates (rehabilitation services, dialysis, etc.). C&I Healthcare Composition at December 31, 2022 54% 22% 15% 4% 3% 54% Nursing & Residential Care Facilities 22% Ambulatory Health Care Services 15% Medical Labs 4% Ambulance Services 3% Doctor Office 1% Offices and Clinics of Dentists 1% Misc. Health Practitioners CRE SNF - $1.217 bn C&I SNF - $119 mm C&I Other Healthcare - $100 mm CRE SNF $1,217 mm C&I SNF $119 mm C&I Other $100 mm Diversified Healthcare Portfolio at December 31, 2022 Total Healthcare loans: $1,436mm |
Well-Developed, Geographically Diversified Skilled Nursing Facility Portfolio 10 CRE Skilled Nursing Facility Exposure by State at December 31, 2022 C&I Skilled Nursing Facility Exposure by State at December 31, 2022 33% 25% 10% 7% 6% 4% 4% 2% 3% 3% 33% New York 25% Florida 10% New Jersey 7% Virginia 6% Indiana 4% Pennsylvania 4% Ohio 2% Other States 3% Kentucky 3% Arizona 1% Georgia 1% Tennessee 1% Michigan 24% 22% 18% 10% 10% 8% 7% 24% New York 22% Florida 18% New Jersey 10% Pennsylvania 10% Other 8% District of Columbia 7% Indiana 1% Michigan |
$1,320 $1,501 $1,492 $1,529 $1,654 $1,832 $940 $934 $930 $882 $714 $425 $1,044 $1,121 $1,129 $1,041 $941 $840 $796 $736 $734 $868 $894 $869 $447 $495 $481 $545 $707 $747 $132 $128 $69 $65 $60 $70 $4,679 $4,915 $4,835 $4,930 $4,970 $4,784 3Q 20214Q 20211Q 20222Q 20223Q 20224Q 2022 Specialty Deposits** Fintech BaaS* Retail Deposits with Loan Customers Property Managers Bankruptcy Trustees Retail Deposits 46% 53% 1% 46% Non-interest-bearing demand deposits 53% Money market & savings account 1% Time deposits 4Q Cost of total deposits: 0.49% Deposit Composition 11 * Certain prior period amounts have been reclassified for consistency with the current period presentation. ** Includes liquidation, receivership, and litigation settlement. Deposits Verticals Composition Over Time | $ millions Total Deposits | $ millions $4,679 $4,915 $4,835 $4,930 $4,970 $4,784 $778 $1,520 $1,104 $1,248 $762 $494 $5,457 $6,435 $5,939 $6,178 $5,732 $5,278 3Q 2021 4Q 2021 1Q 2022 2Q 2022 3Q 2022 4Q 2022 Digital Currency Businesses* Deposit Verticals Deposits Composition at December 31, 2022 |
Customer Centric Digital Payments Worldwide Global Payments Group 12 Domestic and international digital payments settlements Gateway to payment networks Wire, ACH, Visa, Mastercard, Remittance Custodian of deposits on behalf of clients and their customers Sponsorship for select clients as an extension of MCBs expertise and legal authority e.g., money transmitter, issuing bank, acquiring bank, lending activities Regulatory oversight by experienced MCB bankers with the expertise to deploy and manage regulatory compliance across a broad spectrum of client sectors including fintech, digital payments and money services businesses A leading national issuer of third-party debit cards status In addition to reported revenues, GPG-Fintech also contributed average non-interest bearing deposits of $737 million in the fourth quarter. About Global Payments $4,628 $5,358 $7,331 $8,823 $10,006 $12 $285 $1,133 $7,622 $9,335 $4,640 $5,643 $8,464 2018 2019 2020 2021 2022* Digital Currency Businesses Fintech BaaS** $ 16,445 $19,341 GPG Revenue $ thousands Global Payments Group Revenue as a % of Total Bank Non-Interest Income 38% 53% 69% 50% 73% 1 CAGR from December 31, 2018 through 2022. ** Does not include digital currency businesses. 38.60 42.30 51.08 53.31 63.80 3.46 39.23 43.94 2018 2019 2020 2021 2022 Digital Currency Businesses Fintech BaaS** 38.60 42.30 54.54 92.54 107.74 GPG Transactions | Millions |
13.00 13.24 13.70 15.93 13.26 17.65 38.60 42.30 51.08 13.35 16.98 2018 2019 2020 2021 2022 4Q 3Q 2Q 1Q Customer Centric Digital Payments Worldwide Global Payments Group Fintech BaaS 13 Fintech BaaS 1 Client Transactions | Millions 53.31 63.80 1 Does not include digital currency businesses. 2 Certain prior periods amounts have been reclassified for consistency with the current period presentation. * CAGR from December 31, 2018 through 2022. ** General Purpose Re-Loadable (GPR). *** Represents the percentage of total revenue from new clients who went live since 2021. Total Fintech BaaS 1 Revenue by Category 2 | Thousands $930 $997 $884 $791 $872 $292 $373 $517 $512 $693 $273 $122 $203 $104 $196 $443 $444 $415 $809 $1,171 $186 $182 $213 $328 $180 4Q 2021 1Q 2022 2Q 2022 3Q 2022 4Q 2022 Disbursements Digital bank acct Other Corporate Disbursement GPR card** $2,544 $2,124 $3,112 15% *** 13% *** 17% *** 19% *** $2,118 14% *** $2,232 |
14 Well Managed Net Interest Margin 1 Represents full-year NIM. 2 Represents effective average daily FRB funds rate . Net Interest Margin Analysis 1.00% 1.83% 2.16% 0.36% 0.08% 1.68% 3.52% 3.70% 3.46% 3.26% 2.77% 3.49% 2017 2018 2019 2020 2021 2022 MCB Net Interest Margin ("NIM") 1 Average Fed Funds Rate 2 Estimated Sensitivity of Projected Annualized Net Interest Income as of December 31, 2022 Fixed vs. Floating Rate Loans at December 31, 2022, for loans due after one year Fixed 64% Floating 36% 2.32% 1.42% -1.86% -4.01% -200 bps -100 bps +100 bps +200 bps Giventhestrengthof our deposit verticals and overall asset sensitivity,wearewell- positionedtobenefitfroma risinginterest rateenvironmentaswemaintainour margin managementdiscipline. Approximately 79% of floating rate loans have floors Weighted average floor of 4.84% |
Highly Profitable, Scalable Model 15 ^ This represents the percentage of total non-interest income (less any gains on sale of securities) as compared to total revenue. * Annualized 1 Non-GAAP financial measure. See reconciliation to GAAP measure beginning on page 19. 17.8% 14.7% 9.8% 9.7% 12.8% 10.4% 2017 2018 2019 2020 2021 2022 Non-Interest Income ratio 1,^ Efficiency ratio and Adjusted Efficiency ratio 1 16.6% 10.5% 10.8% 11.3% 12.9% 15.2% 10.4% 2017 2018 2019 2020 2021 2022 Adjusted ROATCE ROATCE and Adjusted ROATCE 1 52.1% 52.1% 55.4% 52.5% 48.3% 58.2% 44.5% 2017 2018 2019 2020 2021 2022 Adjusted Efficiency Ratio Net Interest Margin 3.52% 3.70% 3.46% 3.26% 2.77% 3.49% 2017 2018 2019 2020 2021 2022 |
Credit Metrics 16 NCOs/Average Loans Non-Performing Loans/Loans ALLL/Loans Non-Performing Loans/ALLL 0.32% -0.06% -0.13% 0.01% 0.13% 0.00% 2017 2018 2019 2020 2021 2022 1.05% 1.02% 0.98% 1.13% 0.93% 0.93% 2017 2018 2019 2020 2021 2022 0.24% 0.02% 0.17% 0.20% 0.28% 0.00% 2017 2018 2019 2020 2021 2022 22.8% 1.5% 17.1% 18.0% 29.6% 0.0% 2017 2018 2019 2020 2021 2022 |
Capital ratios* 17 Common Equity Tier 1 Capital Ratio 18.4% 15.6% 11.8% 11.6% 14.4% 12.3% 2017 2018 2019 2020 2021 2022 * These capital ratios are for Metropolitan Commercial Bank Only 1 Non-GAAP financial measure. See reconciliation to GAAP measure beginning on page 19. Tier 1 Leverage Ratio 14.7% 14.7% 10.1% 9.0% 8.4% 10.0% 2017 2018 2019 2020 2021 2022 19.4% 16.7% 12.7% 12.7% 15.2% 13.1% 2017 2018 2019 2020 2021 2022 Total Risk-Based Capital Ratio TCE / TA 1 12.7% 11.5% 8.5% 7.5% 7.7% 9.0% 2017 2018 2019 2020 2021 2022 |
Appendix 18 |
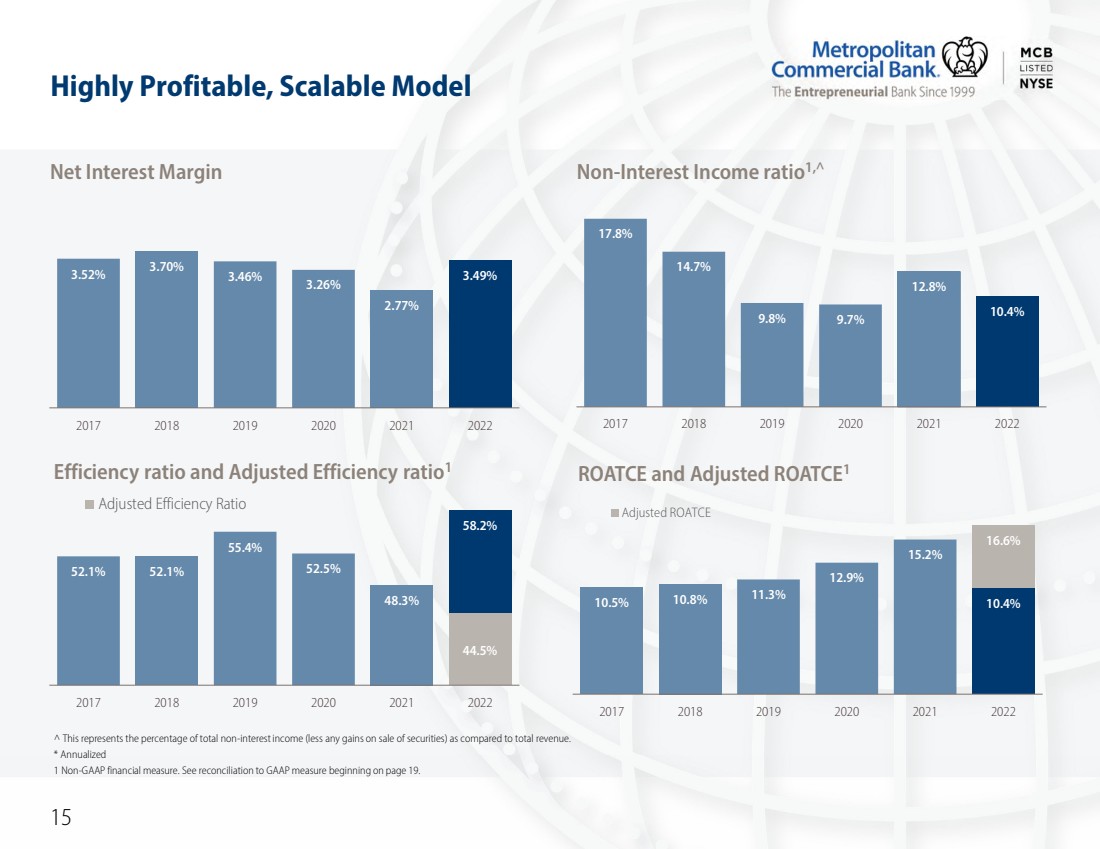
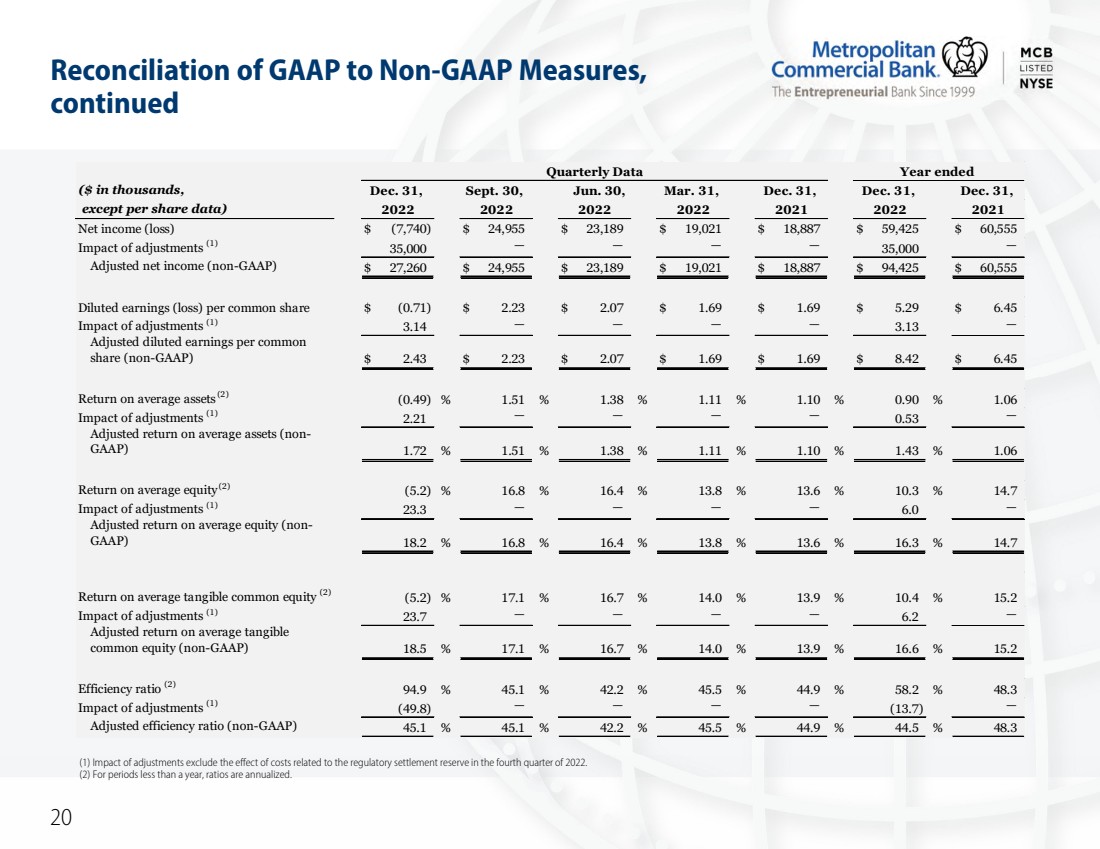
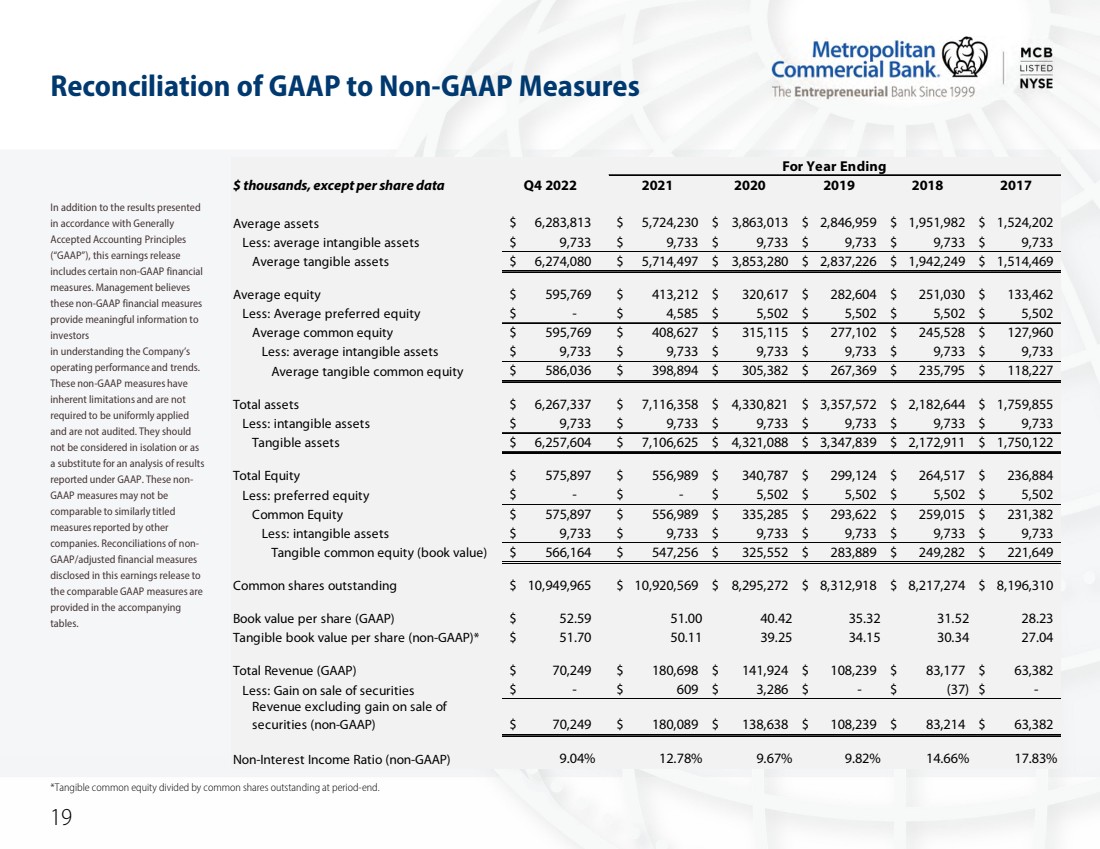
Reconciliation of GAAP to Non-GAAP Measures 19 *Tangible common equity divided by common shares outstanding at period-end. In addition to the results presented in accordance with Generally Accepted Accounting Principles (GAAP), this earnings release includes certain non-GAAP financial measures. Management believes these non-GAAP financial measures provide meaningful information to investors in understanding the Companys operating performance and trends. These non-GAAP measures have inherent limitations and are not required to be uniformly applied and are not audited. They should not be considered in isolation or as a substitute for an analysis of results reported under GAAP. These non- GAAP measures may not be comparable to similarly titled measures reported by other companies. Reconciliations of non- GAAP/adjusted financial measures disclosed in this earnings release to the comparable GAAP measures are provided in the accompanying tables. $ thousands, except per share data Q4 2022 2021 2020 2019 2018 2017 Average assets 6,283,813 $ 5,724,230 $ 3,863,013 $ 2,846,959 $ 1,951,982 $ 1,524,202 $ Less: average intangible assets 9,733 $ 9,733 $ 9,733 $ 9,733 $ 9,733 $ 9,733 $ Average tangible assets 6,274,080 $ 5,714,497 $ 3,853,280 $ 2,837,226 $ 1,942,249 $ 1,514,469 $ Average equity 595,769 $ 413,212 $ 320,617 $ 282,604 $ 251,030 $ 133,462 $ Less: Average preferred equity - $ 4,585 $ 5,502 $ 5,502 $ 5,502 $ 5,502 $ Average common equity 595,769 $ 408,627 $ 315,115 $ 277,102 $ 245,528 $ 127,960 $ Less: average intangible assets 9,733 $ 9,733 $ 9,733 $ 9,733 $ 9,733 $ 9,733 $ Average tangible common equity 586,036 $ 398,894 $ 305,382 $ 267,369 $ 235,795 $ 118,227 $ Total assets 6,267,337 $ 7,116,358 $ 4,330,821 $ 3,357,572 $ 2,182,644 $ 1,759,855 $ Less: intangible assets 9,733 $ 9,733 $ 9,733 $ 9,733 $ 9,733 $ 9,733 $ Tangible assets 6,257,604 $ 7,106,625 $ 4,321,088 $ 3,347,839 $ 2,172,911 $ 1,750,122 $ Total Equity 575,897 $ 556,989 $ 340,787 $ 299,124 $ 264,517 $ 236,884 $ Less: preferred equity - $ - $ 5,502 $ 5,502 $ 5,502 $ 5,502 $ Common Equity 575,897 $ 556,989 $ 335,285 $ 293,622 $ 259,015 $ 231,382 $ Less: intangible assets 9,733 $ 9,733 $ 9,733 $ 9,733 $ 9,733 $ 9,733 $ Tangible common equity (book value) 566,164 $ 547,256 $ 325,552 $ 283,889 $ 249,282 $ 221,649 $ Common shares outstanding 10,949,965 $ 10,920,569 $ 8,295,272 $ 8,312,918 $ 8,217,274 $ 8,196,310 $ Book value per share (GAAP) 52.59 $ 51.00 40.42 35.32 31.52 28.23 Tangible book value per share (non-GAAP)* 51.70 $ 50.11 39.25 34.15 30.34 27.04 Total Revenue (GAAP) 70,249 $ 180,698 $ 141,924 $ 108,239 $ 83,177 $ 63,382 $ Less: Gain on sale of securities - $ 609 $ 3,286 $ - $ (37) $ - $ Revenue excluding gain on sale of securities (non-GAAP) 70,249 $ 180,089 $ 138,638 $ 108,239 $ 83,214 $ 63,382 $ Non-Interest Income Ratio (non-GAAP) 9.04% 12.78% 9.67% 9.82% 14.66% 17.83% For Year Ending |
Reconciliation of GAAP to Non-GAAP Measures, continued 20 (1) Impact of adjustments exclude the effect of costs related to the regulatory settlement reserve in the fourth quarter of 2022. (2) For periods less than a year, ratios are annualized. ($ in thousands, except per share data) Net income (loss) $(7,740) $24,955 $23,189 $19,021 $18,887 $59,425 $60,555 Impact of adjustments (1) 35,000 35,000 Adjusted net income (non-GAAP) $27,260 $24,955 $23,189 $19,021 $18,887 $94,425 $60,555 Diluted earnings (loss) per common share $(0.71) $ 2.23 $ 2.07 $ 1.69 $ 1.69 $ 5.29 $ 6.45 Impact of adjustments (1) 3.14 3.13 Adjusted diluted earnings per common share (non-GAAP) $ 2.43 $ 2.23 $ 2.07 $ 1.69 $ 1.69 $ 8.42 $ 6.45 Return on average assets (2) (0.49) % 1.51 % 1.38 % 1.11 % 1.10 % 0.90 % 1.06 Impact of adjustments (1) 2.21 0.53 Adjusted return on average assets (non- GAAP) 1.72 % 1.51 % 1.38 % 1.11 % 1.10 % 1.43 % 1.06 Return on average equity (2) (5.2) % 16.8 % 16.4 % 13.8 % 13.6 % 10.3 % 14.7 Impact of adjustments (1) 23.3 6.0 Adjusted return on average equity (non- GAAP) 18.2 % 16.8 % 16.4 % 13.8 % 13.6 % 16.3 % 14.7 Return on average tangible common equity (2) (5.2) % 17.1 % 16.7 % 14.0 % 13.9 % 10.4 % 15.2 Impact of adjustments (1) 23.7 6.2 Adjusted return on average tangible common equity (non-GAAP) 18.5 % 17.1 % 16.7 % 14.0 % 13.9 % 16.6 % 15.2 Efficiency ratio (2) 94.9 % 45.1 % 42.2 % 45.5 % 44.9 % 58.2 % 48.3 Impact of adjustments (1) (49.8) (13.7) Adjusted efficiency ratio (non-GAAP) 45.1 % 45.1 % 42.2 % 45.5 % 44.9 % 44.5 % 48.3 Quarterly Data Year ended Dec. 31, Sept. 30, Mar. 31, Dec. 31, Dec. 31, Dec. 31, 2022 2021 Jun. 30, 2022 2022 2022 2022 2021 |
$11 $34 $56 $125 $172 $238 $304 $360 $390 $490 $494 $439 $410 $412 $494 $627 $810 $1,043 $1,405 $1,846 $2,647 $3,101 $3,697 $4,796 199920002001200220032004200520062007200820092010201120122013201420152016201720182019202020212022 Since our founding, we have delivered exceptional core-funded loan growth . . . 21 Net Loans since December 31, 1999 | $ millions Deposits since December 31, 1999 | $ millions $10 $52 $69 $126 $184 $248 $316 $370 $349 $438 $449 $445 $464 $435 $492 $616 $766 $994 $1,404 $1,661 $2,791 $3,830 $6,435 5,278 199920002001200220032004200520062007200820092010201120122013201420152016201720182019202020212022 1 CAGR from December 31, 1999 through 2022. |
A Diversified Financial Institution We are More than a Commercial Bank 22 How We Succeed 23-Years of Reliable Asset Quality and Financial Performance Organic business loan origination platform Core funded organic deposit franchise Helping our clients build and sustain generational wealth since 1999 Our Strategic Priorities Enhance our position as a leader in the settlement of global and digital payments that brings people around the world closer together. Be the critical financial infrastructure for select fintechs to access our global payments settlement platform. Our Mission To offer a full range of banking and innovative financial services to businesses and individuals embracing the new digital banking era. Serve markets underserved by the ever-consolidating financial services industry and advance our leading- edge model that combines new technologies with the best of traditional banking practices .. |
Delivering Critical Financial Infrastructure, Every Day Global Payments Group 23 Domestic and international digital payments settlements, every day Gateway to payment networks Wire, ACH, Visa, Mastercard, Remittance, every day Custodian of deposits on behalf of clients and their customers, every day Sponsorship for select clients as an extension of MCBs expertise and legal authority e.g., money transmitter, issuing bank, lending activities, every day Regulatory oversight by experienced MCB bankers with the expertise to deploy and manage regulatory compliance across a broad spectrum of client sectors including fintech, digital payments and money services businesses, every day A leading national issuer of third-party debit cards status, every day Digital payment platforms are the underpinnings of E-commerce E-commerce 1.0 was about selling goods, starting with Dell.comand Book Stacks Unlimited in the early 1990s. E-commerce 2.0 is about buying, selling and connecting a limitless array of products and services with desktop and mobile devices: Video, movies, TV programs, music, books, podcasts and news streaming services DIY online learning from around the corner to around the world; how to knit to PhD Global gig work opportunities Tickets to in-person and virtual sporting and entertainment events Grocery and prepared meals delivered The list goes on and on... |
Delivering Critical Financial Infrastructure, Every Day 24 U.S. Treasury Government Payments Pension Companies Public and Private Pension Payments Law Firms Payouts for Legal Settlements Other Load Types MG, WU, GD, VRL, MCR Direct Deposits/ ACH Loads Network Loads WU, MG GD Corporate Prefund Adjustment Account Charge Back Disputes or Provisional Credits Program Revenue Account Programs Revenue Operating Account Net Network Settlement Cardholder Activity MCB Settlement Account Net of Fees (Program Earnings and Expenses) MCB Pooled Funds Account MCB Revenue Account MCBs Revenue MCB Reserve Account Extraordinary Events MCB Prepaid Invoice Account External Activity MCB Owned Program Owned Moved by External Party Moved by MCB MCB Clients Moved by External Party Global Payments Group |
Client Case Study Global Payments Group 25 The B2B and B2C infrastructure Broxel has built in Mexico combined with MCBs total support infrastructure in the United States is the blueprint for our mutual success. Gustavo Gutierrez Broxel Overview Broxel is a FinTech leader founded in 2011 and based in Mexico City, Mexico. The Company is an innovator of tailor-made payments solutions that create efficient, agile, disruptive and available financial B2B and B2C ecosystems anywhere in the world. broxel.com/us-en/ Leadership Gustavo Gutierrez, CEO and Founder Vision We will transform money into something more valuable. Markets Mexico, United States Hispanic Primary Business Broxel offers prepaid debit cards and a mobile app that accepts direct deposits and can make payments online and at retail locations in MXN and USD. Broxel is a Mexican company that is always looking out for the Hispanic community living in the United States. Metropolitan Commercial Bank Global Payments Group Broxel has been a client since 2018 Mobile app-based bank account and card that works as a remittance product |
Client Case Study Global Payments Group 26 CIBanco Overview Consultora Internacional (CI) was established in 1983 and became known as CIBanco in 2008. CIBanco became a signatory of the Equator Principles from the World Bank in 2012 in response to the environmental challenges that the world is facing. Aligned with a renewed corporate philosophy CIBanco became the first green bank in Mexico to provide sustainable financial solutions. CIBanco, CICasa de Bolsa, CIFondos de Inversion, Finamadrid, are wholly-owned subsidiaries of Tenedora CI, S. A. de C.V. Financial Group. cibanco.com Leadership Jorge Rangel de Alba Brunel, Chairman of the Board Norman Hagemeister Rey, Chief Executive Director and Board Member Luis Miguel Osio Barroso, Chief Executive Director and Board Member Salvador Arroyo Rodriguez, Chief Executive Director and Board Member Mario Maciel Castro, CEO Vision To stand apart from traditional vertically integrated banks in specific niches that favor sustainability through unparalleled service, reliability, security and leadership. Markets Mexico, United States Hispanic | Spain and Latin America Primary Business Mexico- based bank providing banked, unbanked and underbanked financial service, leaders in Trust Funds, FX & Foreign Trade Units. Financial services including auto loans, trust funds, online and mobile banking, currency and investment options, and lines of credit, in and outside of Mexico. CIBanco serves SME, large and corporate entities and individuals providing all financial services, settling electronic and wire transfers from and to the U.S.; thanks to its export and import profile and the commercial relevance between both countries and the world. Metropolitan Commercial Bank Global Payments Group CIBanco has been a client since 2019 Mobile app-based bank account and card that works as a remittance product Metropolitan Commercial Bank has demonstrated from the very beginning and throughout the journey, collaboration between institutions outside the transactional scope suggests a long-term relationship, in which there is trust to point out everything right or wrong; seeking to consolidate a bilateral and joint reputation. It is not every day you have the openness and willingness to grow and mature with a partner who is on your side while committing to each entity daily. Luis Miguel Osio Barroso |
Client Case Study Global Payments Group 27 Mesh Payments Overview Corporate HQ New York, NY, International office Tel Aviv, Israel; 20+ employees, privately held company founded in 2018 with VC backers and a recent round of favorable financing; strong growth in the virtual card space, which is a fraction of the corporate card space. meshpayments.com Leadership Globally recognized payment and technology leaders. Oded Zehavi, CEO and Co-founder Before Mesh: COO, Kaymera Technologies; Payoneer, Chief Revenue Officer; PayPal, Director Global Business Development Board Member: ReWire.tp; Advisory Board Member: Fiverr, AU10TIX, CreditStacks Vision Re-writing the way corporate payments are made. One-stop hub to orchestrate, manage, analyze and optimize, reconcile, and reduce their corporate spend and subscription payments. Markets Global B2B cardlesspayments. Primary Business Cardless corporate payments solutions via virtual cards SaaS (software as a service) subscriptions On-Demand to employees and gig workers Payment intelligence manage corporate spending and protect companies from failed payment risks Receipt Automation collects and matches digital receipts automatically for all tracked payments. Accounting Integrations works with existing accounting software Metropolitan Commercial Bank Global Payments Group Mesh Payments has been a client since 2018 MCB holds deposits on behalf of Mesh Payments clients MCB provides Mesh Payments with access to ACH and wire payment systems MCB sponsors Mesh Payments Visa branded virtual cards Metropolitan Commercial Bank checks all the boxes when it comes to innovation mindset and execution and strong relationships and fintech support. Oded Zehavi |
Client Case Study Global Payments Group 28 Revolut Overview A global fintech financial services company Corporate HQ London, England International offices including Asia, Europe and Oceania North American offices, San Francisco, CA and New York, NY 2,000+ employees revolut.com/en-US Leadership Revolut, Martin Gilbert, Chairman; Nik Storonsky, CEO and Co-founder; Vlad Yatsenko, CTO and Co-founder Revolut USA, Ronald Oliveira, CEO since November 2019 The Companys executive leadership is a Whos Who of global fintech and finance superstars. Vision Revolut is building the worlds first truly global financial super app. Markets Global, individuals and businesses Primary Business Around the world use dozens of Revoluts innovative banking, investment and wealth management products to make more than 100 million transactions a month. Across Revoluts personal and business accounts, the Company helps customers improve their financial health, give them more control, and connect people seamlessly across the world. Metropolitan Commercial Bank Global Payments Group Revolut has been a client since 2018 MCB holds deposits on behalf of Revoluts clients MCB provides Revolut with: Access to ACH and wire payment systems Correspondent relationships for FX services Tailored solutions for Revolut clients in other jurisdictions MCB sponsors Revolut card processing services for its Visa and MasterCard products Metropolitan Commercial Bank is not only a bank with excellent financial health, a deep bench of experienced fintech bankers and a track record across a wide arena of fintech sectors, their people listen and are open to new and interesting banking solutions. Ronald Oliveira |
Partner with the Leading Processors and Payment Processing Networks, Every Day Global Payments Group 29 Leading Processors Leading Payment Processing Networks |
Who Are Our Payment Clients? 30 Global Payments Group |
Engaging in Our Diverse Digital Payment Products Ecosystem, Every Day Global Payments Group 31 Illustrative photography and captions, not actual customers. Accounts Payable/ Expense Management ACH Processing and Settlement Bill Payment Card Present Debit Card Claim Handling and Processing E-Wallet Debit Card Government Benefits Settlement International Remittance Loan Advance / Payment Settlement Mobile Payment Settlement Due cappuccino date night with my prefunded e-wallet watch app in Naples, Italy. I dont know how its done but I am glad my phone helps me travel around with ease. Peer-To-Peer (P2P) Payments Push Payments Real Time Domestic and International Rebate Settlement Virtual Debit Card Credit score is up so now I can get approved for a new car and visit my folks in Ontario. Sent my sister money to pay for books at St. Georges University in Granada. My benefit payments arrive like clockwork to my debit card every month. Easy peazy. Morning coffee with my loyalty rewards prepaid debit card in Seattle, Washington. Paying in for Sallys wedding gift was easier than deciding what the gift should be. Traded in my wallet for paying mobile. More space in my purse for makeup. Foreign travel is exciting, not having to think about exchange rates is joyful. Now I can view and comment on everyones expenses no matter where they are. This auto insurance claim app is a snap to use. No more needless repair estimates. I really enjoy the security of my debit card over cash. A feeling of safety I was missing. Check writing, stamps, check registers, so yesterday. Billpayapp happy to meet you. Our international business runs smoother when we are paid digitally. |
Establishing Our Place in a Diverse Digital Payment Industry Complex, Every Day Global Payments Group 32 Illustrative photography and captions, not actual customers. Auto Consumer Lending Corporate Accounts Payable Management Corporate Payroll Correspondent Banking Criminal Justice and Corrections Financial Services to the Unbanked/Underbanked Foreign Exchange Government Payments Healthcare Co-Pay Hospitality Mobile Banking Online Gambling Online Gaming Travel Trucking Pharmaceutical Prepaid Phonecards |