Filed Pursuant to Rule 424(B)(3)
Registration No. 333-164313
PhiLLIPS EDISON – ARC sHOPPING cENTER reit INC.
SUPPLEMENT NO. 12 DATED april 16, 2013
TO THE PROSPECTUS DATED OCtober 26, 2012
This document supplements, and should be read in conjunction with, our prospectus dated October 26, 2012 relating to our offering of 180 million shares of common stock, as supplemented by Supplement No. 7 dated January 28, 2013, Supplement No. 8 dated February 5, 2013, Supplement No. 9 dated February 19, 2013, Supplement No. 10 dated March 12, 2013 and Supplement No. 11 dated March 25, 2013. Unless otherwise defined in this Supplement No. 12, capitalized terms used have the same meanings as set forth in the prospectus. The purpose of this supplement is to disclose the following:
· the status of the offering; and
· updated information regarding the prior performance of programs operated by our sponsors, including prior performance tables, as of December 31, 2012.
Status of the Offering
We commenced this initial public offering on August 12, 2010, pursuant to which we are offering up to 150 million shares of our common stock in a primary offering at $10.00 per share, with discounts available for certain categories of purchasers, and up to 30 million shares of our common stock pursuant to our dividend reinvestment plan at $9.50 per share. As of April 3, 2013, we had raised aggregate gross offering proceeds of approximately $230.5 million from the sale of approximately 23.3 million shares in our initial public offering, including shares sold under our dividend reinvestment plan.
PRIOR PERFORMANCE SUMMARY
The information presented in this section represents the historical experience of all real estate programs managed over the last ten years by Messrs. Phillips and Edison, our individual Phillips Edison sponsors, and Messrs. Schorsch and Kahane, our individual AR Capital sponsors. In assessing the relative importance of this information with respect to a decision to invest in this offering, you should keep in mind that we rely primarily on affiliates of our Phillips Edison sponsor to identify acquisitions and manage our portfolio and we rely primarily on affiliates of our AR Capital sponsor with respect to our capital-raising efforts, although both AR Capital Advisor and Phillips Edison Sub-Advisor jointly participate in major decisions as described in this prospectus at “Management – Our Advisor and Sub-Advisor.” You should also note that only programs sponsored by Phillips Edison have invested in our targeted portfolio of grocery-anchored neighborhood and community shopping centers.
Unless otherwise indicated, the information presented below with respect to the historical experience of Phillips Edison and the private real estate funds sponsored by Phillips Edison and of AR Capital and the prior programs sponsored by AR Capital is as of the 10-years ended December 31, 2012. By purchasing shares in this offering, you will not acquire any ownership interest in any funds to which the information in this section relates and you should not assume that you will experience returns, if any, comparable to those experienced by the investors in the real estate funds discussed. Further, the private funds discussed in this section were conducted through privately held entities that were subject neither to the up-front commissions, fees and expenses associated with this offering nor all of the laws and regulations that will apply to us as a publicly offered REIT.
We intend to conduct this offering in conjunction with future offerings by one or more public and private real estate entities sponsored by Phillips Edison and AR Capital and their respective affiliates. To the extent that such entities have the same or similar objectives as ours or involve similar or nearby properties, such entities may be in competition with the properties acquired by us. See the section entitled “Conflicts of Interest” in this prospectus for additional information.
Appendix A includes five tables with information about the public programs and private funds discussed in this section. They present information with respect to (1) the experience of our sponsors in raising and investing in funds, (2) the compensation paid by prior funds to the sponsor and its affiliates, (3) the operating results of prior funds, (4) sales or disposals of properties by prior funds, and (5) results of completed funds. In all cases, the tables presenting information about the historical experience of programs sponsored by Phillips Edison appear first, followed by tables summarizing similar information for AR Capital.
1
Private Programs Sponsored by Phillips Edison
Since 1991, Michael C. Phillips and Jeffrey S. Edison, have partnered to acquire, manage and reposition necessity-driven retail properties, primarily grocery-anchored neighborhood and community shopping centers across the United States. Phillips Edison has operated with financial partners through both property-specific and multi-asset discretionary funds, and to date, Phillips Edison has sponsored six private real estate funds and raised approximately $674 million of equity from high-net-worth individuals and institutional investors.
During the 10-year period ended December 31, 2012, Phillips Edison managed six private real estate funds, all of which were multi-investor, commingled funds. All of these private funds were limited partnerships for which affiliates of Messrs. Phillips and Edison act or acted as general partner. In all cases, affiliates of Messrs. Phillips and Edison had responsibility for acquiring, investing, managing, leasing, developing and selling the real estate and real estate-related assets of each of the funds.
Two of the six private real estate funds managed by Phillips Edison raised approximately $395 million of equity capital from 12 institutional investors during the 10-year period ended December 31, 2012. The institutional investors investing in the private funds include public pension funds, sovereign wealth funds, insurance companies, financial institutions, endowments and foundations. For more information regarding the experience of our sponsors in raising funds from investors, see Table I and Table II of the Prior Performance Tables contained in Appendix A of this prospectus.
During the 10-year period ended December 31, 2012, Phillips Edison acquired 242 real estate investments and invested over $1.8 billion in these assets (purchase price) on behalf of the six private funds raising capital for new investments during this period. Debt financing was used in acquiring the properties in all of these six private funds.
Four of the six private funds managed by Phillips Edison during the 10-year period ended December 31, 2012 have or had investment objectives that are similar to ours. Like ours, their primary investment objectives are to provide investors with stable returns, to preserve and return their capital contributions and to realize growth in the value of their investments. In addition, investments in real estate and real estate-related assets involve similar assessments of the risks and rewards of the operation of the underlying real estate and financing thereof as well as an understanding of the real estate and real estate-finance markets. For each of the private funds, Phillips Edison has focused on acquiring a diverse portfolio of real estate investments. Phillips Edison has typically diversified the portfolios of the private funds by geographic region, investment size, and tenant mix. In constructing the portfolios of the six private funds, Phillips Edison specialized in acquiring a mix of value-added and enhanced-return properties. Value-added and enhanced-return assets are assets that are undervalued or that could be repositioned to enhance their value.
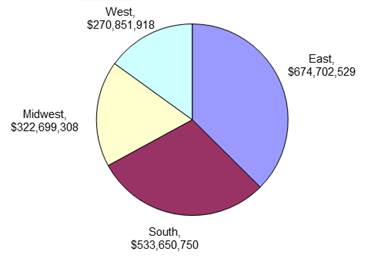
Phillips Edison has sought to diversify investments in its private funds by geographic region as illustrated by the chart below. The chart below outlines investments of the private funds by amounts invested (purchase price) during the 10-year period ended December 31, 2012. All were within the United States. The geographic dispersion of properties acquired during the 10-year period ended December 31, 2012 is as follows: 37.0% of the amount was invested in 95 properties located in the eastern United States, 30.0% of the amount was invested in 63 properties located in the southern United States, 15.0% of the amount was invested in 46 properties located in the western United States and 18.0% of the amount was invested in 38 properties located in the midwestern United States.
2
PHILLIPS EDISON - PRIVATE PROGRAMS
INVESTMENT BY REGION
In addition to diversifying the private fund portfolios by geographic region, Phillips Edison has primarily focused on necessity-driven retail investments that include the following categories: grocery, general merchandise, discount, health and beauty, and office supply retailers. Unlike industries that are routinely affected by cyclical fluctuations in the economy, shopping centers anchored by these retailers have historically been more resistant to economic downturns. In general, the consistent consumer demand for items such as food, pharmaceutical goods, postal services, general retail and hardware is present in all cycles of the economy.
In seeking to diversify the portfolios of the private funds by investment risk, Phillips Edison has purchased a mix of low-risk, high-quality properties and high-quality but under-performing properties in need of repositioning. The majority of the properties purchased by the private funds had prior owners and operators.
During the 10-year period ended December 31, 2012, Phillips Edison sold 57 properties on behalf of these six private funds. Phillips Edison continues to actively manage the remaining unsold properties of these private funds.
Though the private funds were not subject to the up-front commissions, fees and expenses associated with this offering, the private funds have fee arrangements with Phillips Edison affiliates structured similar to ours. The percentage of the fees varied based on the market factors at the time the particular fund was formed. For more information regarding the fees paid to Phillips Edison affiliates by these private funds and the operating results of these private funds, please see Tables II and III of the Prior Performance Tables in Appendix A of this supplement.
Two of the six private real estate funds managed by Phillips Edison (referred to as Fund I and Fund II) both experienced a liquidity event in 2004, at which time, investors in these funds were given the option to liquidate their investments or to convert their investments into shares of Phillips Edison Limited Partnership. Approximately 80.0% of the investors in Fund I and Fund II remained in the funds. The remaining four private real estate funds managed by Phillips Edison are fully invested, but have not yet had a liquidity event under the terms of their respective fund agreements. Note that an investment in this offering is substantially different than an investment in any of the Phillips Edison sponsored private offerings. Prior offerings have focused on purchasing value-add grocery-anchored shopping centers. We will invest the proceeds from this offering primarily in core and core plus grocery-anchored shopping centers that are well-occupied, have a higher ratio of national and regional retailers and are located in more heavily populated locations.
Adverse Business Developments and Conditions
Market timing is a strategy of buying or selling assets based on predictions of future market price movements. Phillips Edison has not tried to time the sponsorship of real estate programs based on its predictions of the real estate market as a whole. For most of the last 10 years, sponsored programs have been raising capital in order to acquire a desirable portfolio of real estate. As the money has been raised, sponsored programs have sought to acquire real estate at favorable prices based on then-current market conditions. In other words, such programs have generally sought to put capital to use promptly if suitable investments are available rather than hold substantial amounts of cash for long periods. Although our Phillips Edison sponsor believes that this strategy has generally served the
3
investors in Phillips Edison-sponsored programs well, some of the assets acquired by Phillips Edison-sponsored programs were acquired at times when real estate was generally more expensive than during the later stages of the life of the program. As a result, at any given time some acquired assets of a Phillips Edison-sponsored program might sell for prices that are lower than the prices paid for them if those assets had to be liquidated at that time. This can be true even if the property remains leased to creditworthy tenants with long-term leases such that the program continues to project strong income yields. This possibility is the primary reason why Phillips Edison-sponsored programs are sold as long-term investments. With a long-term investment horizon, Phillips Edison-sponsored programs have more flexibility to liquidate or list at a more favorable time during a real estate cycle. Nevertheless, we cannot make any assurances regarding our ability to liquidate or list at a time when real estate prices are attractive relative to the prices we will pay for our portfolio.
Fund III is one of the six private funds managed by Phillips Edison. Phillips Edison Limited Partnership owns 10.2% of Fund III. Fund III acquired all of its 116 properties from 2005 through 2007, during a market period characterized by historically low capitalization rates. Subsequent to these acquisitions, market conditions weakened and, as a result, real property values declined. The total occupancy of Fund III’s properties decreased from 86.6% in September 2007 to an overall low of 81.7% in March 2009. Due to the deterioration of overall market conditions, Fund III recognized impairments for accounting purposes during the period from 2008 to 2011. As of December 2012, the total occupancy of Fund III’s properties increased to 88.7%, reflecting an increase of 7.0% from the overall low total occupancy in March 2009.
Prior Investment Programs Sponsored by AR Capital
The information presented in this section represents the historical experience of the real estate programs managed or sponsored over the last ten years by Messrs. Schorsch and Kahane, the principals of our AR Capital sponsor and its affiliates. Investors should not assume that they will experience returns, if any, comparable to those experienced by investors in such prior real estate programs. The prior performance of real estate investment programs sponsored by affiliates of Messrs. Schorsch and Kahane and AR Capital Advisor may not be indicative of our future results. The information summarized below is current as of December 31, 2012 (unless specifically stated otherwise) and is set forth in greater detail in the Prior Performance Tables included in this supplement. In addition, we will provide upon request to us and without charge, a copy of the most recent Annual Report on Form 10-K filed with the SEC by any public program within the last 24 months, and for a reasonable fee, a copy of the exhibits filed with such report.
We intend to conduct this offering in conjunction with future offerings by one or more public and private real estate entities sponsored by AR Capital and its affiliates. To the extent that such entities have the same or similar investment strategies or objectives as ours, such entities may be in competition with us for the investments we make. We do not believe that any of our affiliated programs are in direct competition with this program. See the section entitled “Conflicts of Interest” in this prospectus for additional information.
Summary Information
During the period from August 2007 (inception of the first program) to December 31, 2012, affiliates of AR Capital Advisor have sponsored ten public programs, all of which had raised funds as of December 31, 2012 and five non-public programs. From August 2007 (inception of the first public program) to December 31, 2012, AR Capital’s public programs, which include ARCT, NYRR, ARC RCA, ARC HT, ARC DNAV, ARCT III, ARCP, ARC Global and ARCT IV and the programs consolidated into ARCT, which were ARC Income Properties II and all of the Section 1031 Exchange Programs described below, had raised $4.7 billion from 70,663 investors in public offerings and an additional $37.5 million from 205 investors in a private offering by ARC Income Properties II and 45 investors in private offerings by the Section 1031 Exchange Programs. The public programs purchased 1,321 properties with an aggregate purchase price of $5.5 billion, including acquisition fees, in 49 states and U.S. territories and one property in the United Kingdom. The investment objectives of each of these public programs are substantially identical to our investment objectives of (1) paying attractive and stable cash distributions, (2) preserving and returning stockholders’ capital contributions and (3) realizing appreciation in the value of our investments.
4
The following table details the percentage of properties located in the following U.S. states as well as the United Kingdom based on purchase price:
State/Possession/Country |
| Purchase | ||
Alabama |
|
| 1.7 | % |
Arizona |
|
| 2.0 | % |
Arkansas |
|
| 1.2 | % |
California |
|
| 4.2 | % |
Colorado |
|
| 1.2 | % |
Connecticut |
|
| 0.4 | % |
Delaware |
|
| 0.1 | % |
Florida |
|
| 2.9 | % |
Georgia |
|
| 4.5 | % |
Idaho |
|
| 0.2 | % |
Illinois |
|
| 9.2 | % |
Indiana |
|
| 2.8 | % |
Iowa |
|
| 1.4 | % |
Kansas |
|
| 1.9 | % |
Kentucky |
|
| 2.1 | % |
Louisiana |
|
| 1.2 | % |
Maine |
|
| 0.2 | % |
Maryland |
|
| 1.2 | % |
Massachusetts |
|
| 1.2 | % |
Michigan |
|
| 3.7 | % |
Minnesota |
|
| 1.0 | % |
Mississippi |
|
| 1.9 | % |
Missouri |
|
| 4.2 | % |
Montana |
|
| 0.2 | % |
Nebraska |
|
| 0.6 | % |
Nevada |
|
| 1.6 | % |
New Hampshire |
|
| 0.5 | % |
New Jersey |
|
| 1.4 | % |
New Mexico |
|
| 0.1 | % |
New York |
|
| 13.7 | % |
North Carolina |
|
| 2.9 | % |
North Dakota |
|
| 0.2 | % |
5
Ohio |
|
| 5.1 | % |
Oklahoma |
|
| 0.7 | % |
Oregon |
|
| 0.2 | % |
Pennsylvania |
|
| 4.6 | % |
Puerto Rico |
|
| 0.2 | % |
Rhode Island |
|
| 0.3 | % |
South Carolina |
|
| 2.3 | % |
South Dakota |
|
| 0.1 | % |
Tennessee |
|
| 1.1 | % |
Texas |
|
| 8.8 | % |
United Kingdom |
|
| 0.0 | % |
Utah |
|
| 0.6 | % |
Vermont |
|
| 0.3 | % |
Virginia |
|
| 1.0 | % |
Washington |
|
| 0.8 | % |
West Virginia |
|
| 0.6 | % |
Wisconsin |
|
| 1.9 | % |
Wyoming |
|
| 0.1 | % |
|
|
| 100 | % |
The properties are used by our tenants in the following industries based on purchase price.
| ||||
Industry |
| Purchase | ||
Aerospace |
|
| 0.9 | % |
Auto Retail |
|
| 1.5 | % |
Auto Services |
|
| 1.6 | % |
Consumer Goods |
|
| 0.7 | % |
Consumer Products |
|
| 6.7 | % |
Discount Retail |
|
| 7.4 | % |
Financial Services |
|
| 0.5 | % |
Freight |
|
| 10.6 | % |
Gas/Convenience |
|
| 2.4 | % |
Government Services |
|
| 2.7 | % |
Healthcare |
|
| 16.7 | % |
Home Maintenance |
|
| 1.5 | % |
6
Insurance |
|
| 2.7 | % |
Manufacturing |
|
| 2.2 | % |
Office |
|
| 2.1 | % |
Parking |
|
| 0.1 | % |
Pharmacy |
|
| 10.9 | % |
Residential |
|
| 0.6 | % |
Restaurant |
|
| 2.8 | % |
Retail |
|
| 11.2 | % |
Retail Banking |
|
| 7.7 | % |
Specialty Retail |
|
| 4.5 | % |
Storage Facility |
|
| 0.1 | % |
Supermarket |
|
| 1.1 | % |
Technology |
|
| 0.6 | % |
Telecommunications |
|
| 0.2 | % |
|
|
| 100.0 | % |
The purchased properties were 26.7% new and 73.3% used, based on purchase price. None of the purchased properties were construction properties. As of December 31, 2012, two properties had been sold. The acquired properties were purchased with a combination of proceeds from the issuance of common stock, the issuance of convertible preferred stock, mortgage notes payable, short-term notes payable, revolving lines of credit, long-term notes payable issued in private placements and joint venture arrangements.
During the period from June 2008 (inception of the first non-public program) to December 31, 2012, the non-public programs, which were ARC Income Properties, ARC Income Properties II, ARC Income Properties III, ARC Income Properties IV and ARC Growth Fund, LLC, had raised $54.4 million from 694 investors. The non-public programs purchased 171 properties with an aggregate purchase price of $247.9 million including acquisition fees, in 18 states.
The following table details the percentage of properties by state based on purchase price:
State location |
| Purchase | ||
Alabama |
|
| 0.1 | % |
Connecticut |
|
| 0.6 | % |
Delaware |
|
| 4.8 | % |
Florida |
|
| 11.0 | % |
Georgia |
|
| 3.5 | % |
Illinois |
|
| 6.6 | % |
Louisiana |
|
| 2.3 | % |
Michigan |
|
| 11.5 | % |
North Carolina |
|
| 0.1 | % |
7
New Hampshire |
|
| 0.5 | % |
New Jersey |
|
| 13.0 | % |
New York |
|
| 9.7 | % |
Ohio |
|
| 10.3 | % |
Pennsylvania |
|
| 9.5 | % |
South Carolina |
|
| 8.4 | % |
Texas |
|
| 5.0 | % |
Virginia |
|
| 1.2 | % |
Vermont |
|
| 2.2 | % |
|
|
| 100 | % |
The properties are all commercial single tenant facilities with 81.0% retail banking, 10.5% retail distribution facilities and 8.6% specialty retail. The purchased properties were 11.0% new and 89.0% used, based on purchase price. None of the purchased properties were construction properties. As of December 31, 2012, 53 properties had been sold. The acquired properties were purchased with a combination of equity investments, mortgage notes payable and long-term notes payable issued in private placements.
Programs of Our AR Capital Sponsor
American Realty Capital Trust, Inc.
American Realty Capital Trust, Inc., or ARCT, incorporated on August 17, 2007, is a Maryland corporation that qualified as a REIT for federal income tax purposes. ARCT was formed to acquire a diversified portfolio of commercial real estate, primarily freestanding single tenant properties net leased to creditworthy tenants on a long-term basis. In January 2008, ARCT commenced an initial public offering on a “best efforts” basis to sell up to 150.0 million shares of common stock, excluding 25.0 million shares issuable pursuant to a distribution reinvestment plan, offered at a price of $10.00 per share, subject to certain volume and other discounts. In March 2008, ARCT commenced real estate operations. ARCT’s initial public offering closed in July 2011 having raised $1.7 billion in gross proceeds from the sale of 179.4 million shares of common stock and having incurred, cumulatively to that date, $198.0 million in offering costs, commissions and dealer manager fees for the sale of its common stock. ARCT operated as a non-traded REIT through February 29, 2012. Effective as of March 1, 2012, ARCT internalized the management services previously provided by American Realty Capital Advisors, LLC and its affiliates, as a result of which ARCT became a self-administered REIT managed full-time by its own management team, or the Internalization. Concurrent with the Internalization, the ARCT listed its common stock on The NASDAQ Global Select Market under the symbol “ARCT”, or the Listing. In connection with the Listing, ARCT offered to purchase up to $220.0 million in shares of common stock from its stockholders, pursuant to a modified “Dutch Auction” cash tender offer, or the Tender Offer. As a result of the Tender Offer, in April 2012, ARCT had purchased 21.0 million shares of its common stock at a purchase price of $10.50 per share, for an aggregate cost of $220.0 million, excluding fees and expenses relating to the Tender Offer. On September 6, 2012, ARCT entered into an Agreement and Plan of Merger with Realty Income Corporation, a Maryland corporation and its subsidiary, which was subsequently amended on January 6, 2013. The merger was approved by both companies’ boards of directors and was subsequently approved by both companies’ stockholders on January 16, 2013. The merger closed on January 22, 2013, pursuant to which ARCT merged with and into a subsidiary of Realty Income Corporation and trading of ARCT’s shares was suspended at market close on that date. As of December 31, 2012, ARCT had total real estate investments, at cost, of $2.2 billion, comprised of 515 properties.
American Realty Capital New York Recovery REIT, Inc.
American Realty Capital New York Recovery REIT, Inc., or NYRR, a Maryland corporation, is the second publicly offered REIT sponsored by American Realty Capital. NYRR was incorporated on October 6, 2009 and qualified as a REIT beginning with the taxable year ended December 31, 2010. NYRR filed its initial registration statement with the SEC on November 12, 2009 and became
8
effective on September 2, 2010. NYRR had received aggregate gross offering proceeds of $17.0 million from the sale of 2.0 million shares from a private offering to “accredited investors” (as defined in Regulation D as promulgated under the Securities Act). On December 15, 2011, NYRR exercised its option to convert all its outstanding preferred shares into 2.0 million shares of common stock on a one-to-one basis. As of February 28, 2013, NYRR had received aggregate gross proceeds of $217.4 million which includes the sale of 21.4 million shares in its public offering and $4.7 million from its distribution reinvestment plan. As of February 28, 2013, there were 23.9 million shares of NYRR common stock outstanding, including restricted stock, converted preferred shares, and shares issued under its distribution reinvestment plan. As of February 28, 2013, NYRR had total real estate investments, at cost, of $350.7 million, comprised of 16 properties. As of December 31, 2012, NYRR had incurred, cumulatively to that date, $25.7 million in selling commissions, dealer manager fees and offering costs for the sale of its common stock and $9.1 million for acquisition costs related to its portfolio of properties.
American Realty Capital Healthcare Trust, Inc.
American Realty Capital Healthcare Trust, Inc., or ARC HT, a Maryland corporation, is the fourth publicly offered REIT sponsored by American Realty Capital. ARC HT was organized on August 23, 2010 and qualified as a REIT beginning with the taxable year ended December 31, 2011. ARC HT filed its registration statement with the SEC on August 27, 2010 and became effective on February 18, 2011. As of February 28, 2013, ARC HT had received aggregate gross offering proceeds of $816.5 million which includes the sale of 81.0 million shares in its public offering and $9.9 million from its distribution reinvestment plan. As of February 28, 2013, ARC HT had acquired 51 commercial properties, for a purchase price of $677.0 million. As of December 31, 2012, ARC HT had incurred, cumulatively to that date, $76.3 million in offering costs for the sale of its common stock and $12.8 million for acquisition costs related to its portfolio of properties.
American Realty Capital — Retail Centers of America, Inc.
American Realty Capital — Retail Centers of America, Inc., or ARC RCA, a Maryland corporation, is the fifth publicly offered REIT sponsored by American Realty Capital. ARC RCA was organized on July 29, 2010 and intends to qualify as a REIT beginning with the taxable year ending December 31, 2012. ARC RCA filed its registration statement with the SEC on September 14, 2010 and became effective on March 17, 2011. As of February 28, 2013, ARC RCA had received aggregate gross proceeds of $9.2 million from the sale of 0.9 million shares in its public offering, including proceeds from its distribution reinvestment plan. As of February 28, 2013, ARC RCA had acquired two properties for a purchase price of $54.2 million. As of December 31, 2012, ARC RCA has incurred, cumulatively to that date, $6.6 million in offering costs from the sale of its common stock and $1.0 million for acquisition costs related to its portfolio of properties.
American Realty Capital Daily Net Asset Value Trust, Inc.
American Realty Capital Daily Net Asset Value Trust, Inc. (formerly known as American Realty Capital Trust II, Inc.), or ARC DNAV, a Maryland corporation, is the sixth publicly offered REIT sponsored by American Realty Capital. ARC DNAV was incorporated on September 10, 2010 and intends to qualify as a REIT beginning with the taxable year ending December 31, 2013, ARC DNAV filed its registration statement with the SEC on October 8, 2010 and became effective on August 15, 2011. As of February 28, 2013, ARC DNAV had received aggregate gross proceeds of $9.9 million from the sale of 1.0 million shares in its public offering. As of February 28, 2013, ARC DNAV had acquired eight properties with total real estate investments, at cost, of $27.4 million. As of December 31, 2012, ARC DNAV had incurred, cumulatively to that date, $3.9 million in offering costs from the sale of its common stock and $0.7 million for acquisition costs related to its portfolio of properties.
American Realty Capital Trust III, Inc.
American Realty Capital Trust III, Inc., or ARCT III, a Maryland corporation, was the seventh publicly offered REIT sponsored by American Realty Capital. ARCT III was incorporated on October 15, 2010 and qualified as a REIT beginning with the taxable year ended December 31, 2011. ARCT III filed its registration statement with the SEC on November 2, 2010 and became effective on March 31, 2011. As of February 28, 2013, ARCT III had received aggregate gross proceeds of $1.8 billion which includes the sale of 174.0 million shares in its public offering and $31.9 million from its distribution reinvestment plan. As of February 28, 2013, immediately prior to the closing of the merger described below, ARCT III owned 533 single tenant, freestanding properties and had total real estate investments, at cost, of $1.7 billion. As of December 31, 2012, ARCT III had incurred, cumulatively to that date, $196.5 million in offering costs for the sale of its common stock and $40.8 million for acquisition costs related to its portfolio of properties. On December 17, 2012, ARCT III and ARCP entered into an Agreement and Plan of Merger under which ARCP acquired all of the outstanding shares of ARCT III. The merger was approved by the independent members of both companies’ boards of
9
directors and was subsequently approved by both companies’ stockholders on February 26, 2013. On February 26, 2013, ARCP stockholders approved the issuance of common stock in connection with the merger and ARCT III stockholders approved the merger. The merger closed on February 28, 2013, pursuant to which ARCT III merged with and into a subsidiary of ARCP. On March 1, 2013, in connection with the merger, ARCT III stockholders received their respective cash or stock consideration from ARCP, as elected, pursuant to terms of the Agreement and Plans of Merger on March 1, 2013.
American Realty Capital Properties, Inc.
American Realty Capital Properties, Inc., or ARCP, a Maryland corporation, is the eighth publicly offered REIT sponsored by American Realty Capital. ARCP was incorporated on December 2, 2010 and qualified as a REIT beginning with the taxable year ended December 31, 2011. On September 6, 2011, ARCP completed its initial public offering of 5.6 million shares of common stock. ARCP’s common stock is traded on The NASDAQ Stock Market under the symbol “ARCP.” On November 2, 2011, ARCP completed an underwritten follow-on offering of 1.5 million shares of common stock. In addition, on November 7, 2011, ARCP closed on the underwriters’ overallotment option of an additional 0.1 million shares of common stock. On June 18, 2012 ARCP closed a second underwritten follow-on offering of 3.3 million shares of common stock. In addition, on July 9, 2012, ARCP closed on the underwriters’ overallotment option of an additional 0.5 million shares of common stock. In January 2013, ARCP commenced its “at the market” equity offering. In aggregate, ARCP has received $128.7 million of proceeds from the sale of common and convertible preferred stock. As of February 28, 2013, immediately prior to the closing of the merger described below, ARCP owned 158 single tenant, freestanding properties and real estate investments, at a purchase price of $307.7 million. On December 17, 2012, ARCT III and ARCP entered into an Agreement and Plan of Merger under which ARCP acquired all of the outstanding shares of ARCT III. The merger has been approved by the independent members of both companies’ boards of directors and was subsequently approved by both companies’ stockholders on February 26, 2013. On February 26, 2013, ARCP stockholders approved the issuance of common stock in connection with the merger and ARCT III stockholders approved the merger. The merger closed on February 28, 2013, pursuant to which ARCT III merged with and into a subsidiary of ARCP. On March 1, 2013, in connection with the merger, ARCT III stockholders received pursuant to terms of the Agreement and Plan of Merger their respective cash or stock consideration from ARCP, as elected. On March 18, 2013, the closing price per share of common stock of ARCP was $13.93.
American Realty Capital Global Trust, Inc.
American Realty Capital Global Trust, Inc., or ARC Global, a Maryland corporation, is the ninth publicly offered REIT sponsored by American Realty Capital. ARC Global was incorporated on July 13, 2011 and intends to qualify as a REIT beginning with the taxable year ending December 31, 2013. ARC Global filed its registration statement with the SEC on October 27, 2011, which was declared effective by the SEC on April 20, 2012. As of February 28, 2013, ARC Global received aggregate gross proceeds of $3.9 million from the sale of 0.4 million shares in its public offering. As of February 28, 2013, ARC Global had acquired one property with a base purchase price of $2.6 million. As of December 31, 2012, ARC Global had incurred, cumulatively to that date, $2.6 million in offering costs for the sale of its common stock and $0.2 million for acquisition costs related to its property acquisition.
American Realty Capital Trust IV, Inc.
American Realty Capital Trust IV, Inc., or ARCT IV, a Maryland corporation, is the tenth publicly offered REIT sponsored by American Realty Capital. ARCT IV was incorporated on February 14, 2012 and intends to qualify as a REIT beginning with the taxable year ending December 31, 2012. ARCT IV filed its registration statement with the SEC on March 22, 2012, which was declared effective by the SEC on June 8, 2012. As of February 28, 2013, ARCT IV received aggregate gross proceeds of $671.5 million from the sale of 27.2 million shares in its public offering and $1.7 million under its distribution reinvestment plan. As of February 28, 2013, ARCT IV owned 74 freestanding properties at a purchase price of $154.2 million. As of December 31, 2012, ARCT IV had incurred, cumulatively to that date, $36.8 million in offering costs for the sale of its common stock and $2.3 million for acquisition costs related to its portfolio of properties.
American Realty Capital Healthcare Trust II, Inc.
American Realty Capital Healthcare Trust II, Inc., or ARC HT II, a Maryland corporation, is the eleventh publicly offered REIT sponsored by American Realty Capital. ARC HT II was incorporated on October 15, 2012 and intends to qualify as a REIT beginning with the taxable year ending December 31, 2013. ARC HT II filed its registration statement with the SEC on October 31, 2012, which was declared effective by the SEC on February 14, 2013. As of February 28, 2013, ARC HT II received aggregate gross proceeds of $0.2 million from the sale of 8,888 shares in a private placement. As of February 28, 2013, ARC HT II has not acquired
10
any properties. As of December 31, 2012, ARC HT II had incurred, cumulatively to that date, $0.8 million in offering costs for the sale of its common stock.
ARC Realty Finance Trust, Inc.
ARC Realty Finance Trust, Inc., or ARC RFT, a Maryland corporation, is the twelfth publicly offered REIT sponsored by American Realty Capital. ARC RFT was incorporated on November 15, 2012 and intends to qualify as a REIT beginning with the taxable year ending December 31, 2013. ARC RFT filed its registration statement publicly with the SEC on January 22, 2013, which was declared effective by the SEC on February 12, 2013. As of February 28, 2013, ARC RFT received aggregate gross proceeds of $0.2 million from the sale of 8,888 shares in a private placement. As of February 28, 2013, ARC RFT has not made any investments. As of December 31, 2012, ARC RFT had incurred, cumulatively to that date, $0.9 million in offering costs for the sale of its common stock.
American Realty Capital Trust V, Inc.
American Realty Capital Trust V, Inc., or ARCT V, a Maryland corporation, is the thirteenth publicly offered REIT sponsored by American Realty Capital. ARCT V was incorporated on January 22, 2013 and intends to qualify as a REIT beginning with the taxable year ending December 31, 2013. ARCT V filed its registration statement publicly with the SEC on March 6, 2013, which has yet to be declared effective. As of February 28, 2013, ARCT V received aggregate gross proceeds of $0.2 million from the sale of 8,888 shares in a private placement. As of February 28, 2013, ARCT V has yet to make any investments. As of January 31, 2013, ARCT V had incurred, cumulatively to that date, $0.2 million in offering costs for the sale of its common stock.
Business Development Corporation of America
The American Realty Capital group of companies also has sponsored Business Development Corporation of America, or BDCA, a Maryland corporation. BDCA was organized on May 5, 2010 and is a publicly offered specialty finance company which has elected to be treated as a business development company under the Investment Company Act. As of February 28, 2013, BDCA had raised gross proceeds of $204.7 million which includes the sale of 19.5 million shares in its public offering and $2.7 million from its distribution reinvestment program. As of February 28, 2013, BDCA’s investments, at original cost, were $290.9 million. As of December 31, 2012, BDCA had incurred, cumulatively to that date, $2.0 million in offering costs for the sale of its common stock.
Liquidity of Public Programs
FINRA Rule 2310(b)(3)(D) requires that we disclose the liquidity of prior public programs sponsored by American Realty Capital, our sponsor, which for this purpose excludes ARCP, a REIT that is and always has been listed on The NASDAQ Stock Market. American Realty Capital has sponsored the following other public programs (excluding ARCP): ARCT, NYRR, ARC HT, ARC RCA, ARC DNAV, ARCT III, ARC Global Trust, ARCT IV, ARC HT II, ARCT V and BDCA. ARCT was a non-traded REIT until March 1, 2012, when it listed its shares of common stock on The NASDAQ Global Select Market. ARCT’s prospectus for its initial public offering provided that it would seek to consummate a listing of its shares of common stock on a national securities exchange by the tenth anniversary of the commencement of its initial public offering. By listing its common stock on The NASDAQ Global Select Market, ARCT achieved a listing on a national securities exchange within the time it contemplated to do so. On February 28, 2013, ARCT III and ARCP consummated an Agreement and Plan of Merger under which ARCP acquired all the outstanding shares of ARCT III. ARCT III was a non-traded REIT until February 28, 2013, when it merged with and into a subsidiary of ARCP. ARCT III’s prospectus for its initial public offering provided that it would seek to effect a sale or merger of ARCT III by the fifth anniversary of the termination of its initial public offering. By consummating the merger of itself with and into a subsidiary of ARCP, ARCT III achieved a sale or merger of ARCT III within the time that it contemplated to do so.
The prospectus for each of these other public programs states a date or time period by which it may be liquidated or engage in another liquidity event. Further, NYRR, ARC HT, ARC RCA, ARC DNAV, ARC Global Trust, ARC HT II, ARC RFT and BDCA are in their offering and acquisition stages. Other than ARCT and ARCT III none of these public programs have reached the stated date or time period by which they may be liquidated or engage in another liquidity event.
11
Private Note Programs
ARC Income Properties, LLC implemented a note program that raised aggregate gross proceeds of $19.5 million. The net proceeds were used to acquire, and pay related expenses in connection with, a portfolio of 65 bank branch properties triple-net leased to RBS Citizens, N.A. and Citizens Bank of Pennsylvania. The purchase price for those bank branch properties also was funded with proceeds received from mortgage loans, as well as equity capital invested by our AR Capital sponsor. Such properties contain approximately 323,000 square feet with a purchase price of approximately $98.8 million. The properties are triple-net leased for a primary term of five years and include extension provisions. The notes issued under this note program by ARC Income Properties, LLC were sold by our dealer manager through soliciting dealers. On September 7, 2011, the note holders were repaid, the properties were contributed to ARCP as part of its formation transaction, and the mortgage loans were repaid.
ARC Income Properties II, LLC implemented a note program that raised aggregate gross proceeds of $13.0 million. The net proceeds were used to acquire, and pay related expenses in connection with, a portfolio of 50 bank branch properties triple-net leased to PNC Bank. The purchase price for those bank branch properties also was funded with proceeds received from a mortgage loan, as well as equity capital raised by ARCT in connection with its public offering of equity securities. The properties are triple-net leased with a primary term of ten years with a 10% rent increase after five years. The notes issued under this note program by ARC Income Properties II, LLC were sold by our dealer manager through soliciting dealers. In May 2011, the notes were repaid in full including accrued interest and the program was closed.
ARC Income Properties III, LLC implemented a note program that raised aggregate gross proceeds of $11.2 million. The net proceeds were used to acquire, and pay related expenses in connection with the acquisition of a distribution facility triple-net leased to Home Depot. The purchase price for the property was also funded with proceeds received from a mortgage loan. The property has a primary lease term of 20 years which commenced on January 30, 2010 with a 2% escalation each year. The notes issued under this note program by ARC Income Properties III, LLC were sold by our dealer manager through soliciting dealers. On September 7, 2011, the note holders were repaid and the property was contributed to ARCP as part of its formation transaction.
ARC Income Properties IV, LLC implemented a note program that raised gross proceeds of $5.4 million. The proceeds were used to acquire and pay related expenses in connection with the acquisition of six retail stores triple net leased to Tractor Supply stores for $21.2 million. An existing mortgage loan of $16.5 million was assumed in connection with the acquisition. The properties had a remaining average lease term of 11.8 years with a 6.25% rental escalation every five years. The notes issued under this program by ARC Income Properties IV, LLC were sold by our dealer manager through soliciting dealers.
ARC Growth Fund, LLC
ARC Growth Fund, LLC is a non-public real estate program formed to acquire vacant bank branch properties and opportunistically sell such properties, either vacant or subsequent to leasing the bank branch to a financial institution or other third-party tenant. Total gross proceeds of approximately $7.9 million were used to acquire, and pay related expenses in connection with, a portfolio of vacant bank branches. The purchase price of the properties also was funded with proceeds received from a one-year revolving warehouse facility. The purchase price for each bank branch is derived from a formulated price contract entered into with a financial institution. During the period from July 2008 to January 2009, ARC Growth Fund, LLC acquired 54 vacant bank branches from Wachovia Bank, N.A., under nine separate transactions. Such properties contain approximately 230,000 square feet with a gross purchase price of approximately $63.6 million. As of December 31, 2010, all properties were sold, 28 of which were acquired and simultaneously sold, resulting in an aggregate gain of approximately $4.8 million.
Section 1031 Exchange Programs
American Realty Capital Exchange, LLC, or ARCX, an affiliate of American Realty Capital, developed a program pursuant to which persons selling real estate held for investment can reinvest the proceeds of that sale in another real estate investment in an effort to obtain favorable tax treatment under Section 1031 of the Internal Revenue Code, or a Section 1031 Exchange Program. ARCX acquires real estate to be owned in co-tenancy arrangements with persons desiring to engage in such like-kind exchanges. ARCX acquires the subject property or portfolio of properties and, either concurrently with or following such acquisition, prepares and markets a private placement memorandum for the sale of co-tenancy interests in that property. ARCX has engaged in four Section 1031 Exchange Programs raising aggregate gross proceeds of $10.1 million.
12
American Realty Capital Operating Partnership, L.P. purchased a Walgreens property in Sealy, TX under a tenant in common structure with an unaffiliated third party, a Section 1031 Exchange Program. The third party’s investment of $1.1 million represented a 44.0% ownership interest in the property. The remaining interest of 56% will be retained by American Realty Capital Operating Partnership, L.P. To date, $1.1 million has been accepted by American Realty Capital Operating Partnership, L.P. pursuant to this program. In November 2012, the third party’s interest was purchased by American Realty Capital Operating Partnership, L.P.
American Realty Capital Operating Partnership, L.P. previously had transferred 49% of its ownership interest in a Federal Express distribution facility, located in Snowshoe, Pennsylvania, and a PNC Bank branch, located in Palm Coast, Florida, to American Realty Capital DST I, or ARC DST I, a Section 1031 Exchange Program. Realty Capital Securities, LLC, our dealer manager, has offered membership interests of up to 49%, or $2.6 million, in ARC DST I to investors in a private offering. The remaining interests of no less than 51% will be retained by American Realty Capital Operating Partnership, L.P. To date, cash payments of $2.6 million have been accepted by American Realty Capital Operating Partnership, L.P. pursuant to this program. In October through November 2012, the third party’s interests in the properties were purchased by American Realty Capital Operating Partnership, L.P.
American Realty Capital Operating Partnership, L.P. also has transferred 35.2% of its ownership interest in a PNC Bank branch location, located in Pompano Beach, Florida, to American Realty Capital DST II, or ARC DST II, a Section 1031 Exchange Program. Realty Capital Securities, our dealer manager, has offered membership interests of 35.2%, or $0.5 million, in ARC DST II to investors in a private offering. The remaining interests of no less than 64.8% will be retained by American Realty Capital Operating Partnership, L.P. To date, cash payments of $0.5 million have been accepted by American Realty Capital Operating Partnership, L.P. pursuant to this program. In October 2012, the third party’s interests in the properties were purchased by American Realty Capital Operating Partnership, L.P.
American Realty Capital Operating Partnership, L.P. also has transferred 49% of its ownership interest in three CVS properties, located in Smyrna, Georgia, Chicago, Illinois and Visalia, California, to American Realty Capital DST III, or ARC DST III, a Section 1031 Exchange Program. Realty Capital Securities, our dealer manager, has offered membership interests of up to 49%, or $3.1 million, in ARC DST III to investors in a private offering. The remaining interests of no less than 51% will be retained by American Realty Capital Operating Partnership, L.P. To date, cash payments of $3.1 million have been accepted by American Realty Capital Operating Partnership, L.P. pursuant to this program. In October 2012, the third party’s interests in the properties were purchased by American Realty Capital Operating Partnership, L.P.
American Realty Capital Operating Partnership, L.P. has transferred 49% of its ownership interest in six Bridgestone Firestone properties, located in Texas and New Mexico, to American Realty Capital DST IV, or ARC DST IV, a Section 1031 Exchange Program. Realty Capital Securities, our dealer manager, has offered membership interests of up to 49%, or $7.3 million, in ARC DST IV to investors in a private offering. The remaining interests of no less than 51% will be retained by American Realty Capital Operating Partnership, L.P. To date, cash payments of $7.3 million had been accepted by American Realty Capital Operating Partnership, L.P. pursuant to this program. American Realty Capital Operating Partnership, L.P. also has sold 24.9% of its ownership interest in a Jared Jewelry property located in Lake Grove, NY, under a tenant-in- common structure with an affiliated third party. The remaining interest of 75.1% will be retained by American Realty Capital Operating Partnership, L.P. To date cash payments of $0.6 million has been accepted by American Realty Capital Operating Partnership, L.P. pursuant to this program. In October 2012, the third party’s interests in the properties were purchased by American Realty Capital Operating Partnership, L.P.
Adverse Business Developments and Conditions
The net losses incurred by public and non-public programs are primarily attributable to non-cash items and acquisition expenses incurred for the purchases of properties which are not ongoing expenses for the operation of the properties and not the impairment of the programs’ real estate assets. With respect to ARCT, AR Capital’s largest program to date, for the years ended December 31, 2012, 2011, 2010 and 2009, the entire net loss was attributable to depreciation and amortization expenses incurred on the properties during the ownership period; and for the year ended December 31, 2008, 71% of the net losses were attributable to depreciation and amortization, and the remaining 29% of the net losses was attributable to the fair market valuation of certain derivative investments held.
Additionally, each of ARC Income Properties, LLC, ARC Income Properties II, LLC, ARC Income Properties III, LLC and ARC Income Properties IV, LLC was an offering of debt securities. Despite incurring net losses during certain periods, all anticipated distributions to investors have been paid on these programs through interest payments on the debt securities. The equity interests in each of these entities were owned by Nicholas Schorsch and William Kahane and their respective families. Any losses pursuant to a
13
reduction in value of the equity in any of these entities (which did not occur), will be borne by Messrs. Schorsch and Kahane and their respective families. On September 7, 2011, the note holders in ARC Income Properties, LLC and ARC Income Properties III, LLC were repaid and the properties were contributed to ARCP as part of its formation transaction. Additionally, the mortgage loans in ARC Income Properties, LLC were repaid.
ARC Growth Fund, LLC was different from AR Capital’s other programs in that all of the properties were vacant when the portfolio was purchased and the properties were purchased with the intention of reselling them. Losses from operations represent carrying costs on the properties as well as acquisition and disposition costs in addition to non-cash depreciation and amortization costs. Upon final distribution in 2010, all investors received their entire investment plus an incremental return based on a percentage of their initial investment and the sponsor retained the remaining available funds and four properties which were unsold at the end of the program.
From 2008 through 2012, the AR Capital programs referenced above have experienced a non-renewal of eight leases, five units of which were leased to new tenants. ARCP sold one of the related properties in 2012. Further, none of these programs have been subject to mortgage foreclosure or significant losses on the sales of properties during the same period of time.
Other than as disclosed above, there have been no major adverse business developments or conditions experienced by any program or non-program property that would be material to investors, including as a result of recent general economic conditions.
14
APPENDIX A
PRIOR PERFORMANCE TABLES
The following prior performance tables (the “Tables”) provide information relating to the real estate investment programs sponsored by Phillips Edison and programs sponsored by AR Capital. Each of Phillips Edison’s previous programs and investments and some of AR Capital’s prior programs and investments were conducted through privately held entities not subject to the up-front commissions, fees and expenses associated with this offering or all of the laws and regulations to which we will be subject. In addition, we are Phillips Edison’s first publicly offered investment program and Phillips Edison has never before operated a public REIT. Because of these facts, our investors should not assume that the prior performance of programs sponsored by Phillips Edison or AR Capital will be indicative of our future performance. In assessing the relative importance of this information with respect to a decision to invest in this offering, you should keep in mind that we will rely primarily on affiliates of our Phillips Edison sponsor to identify acquisitions and manage our portfolio and we will rely primarily on affiliates of our AR Capital sponsor with respect to our capital-raising efforts, although both AR Capital Advisor and Phillips Edison Sub-Advisor will jointly participate in major decisions as described in the prospectus at “Management – Our Advisor and Sub-Advisor.” You should also note that only programs sponsored by Phillips Edison have invested in our targeted portfolio of grocery-anchored neighborhood and community shopping centers.
Generally, Phillips Edison’s prior programs described in the following tables have investment objectives similar to ours except that Phillips Edison Strategic Investment Fund LLC focuses on acquiring power and lifestyle centers. None of the AR Capital programs had or have investment objectives similar to ours. We consider programs invested primarily in neighborhood and community shopping centers to have investment objectives similar to ours.
The Tables below provide information on the performance of a number of private programs of Phillips Edison and public and private programs of AR Capital. This information should be read together with the summary information included in the “Prior Performance Summary” section of this prospectus.
The inclusion of the Tables does not imply that we will make investments comparable to those reflected in the Tables or that investors in our shares will experience returns comparable to the returns experienced in the programs referred to in the Tables. In addition, you may not experience any return on your investment. If you purchase our shares, you will not acquire any ownership in any of the programs to which the Tables relate.
The following tables are included herein for each of Phillips Edison and AR Capital:
TABLE I Experience in Raising and Investing Funds
TABLE II Compensation to Sponsor
TABLE III Operating Results of Prior Programs
TABLE IV Results of Completed Programs
TABLE V Sales or Disposals of Properties
A-1
EXPERIENCE IN RAISING AND INVESTING FUNDS
(UNAUDITED)
Prior Performance is not Indicative of Future Results
Table I provides a summary of the experience of Phillips Edison in raising and investing in funds for programs that have had an offering close during the three years ended December 31, 2012. Information is provided as to the manner in which the proceeds of the offering have been applied.
(in thousands) | Phillips Edison Strategic Investment Fund II LLC | Percentage of Total Dollar Amount Raised |
|
|
|
|
|
|
Dollar amount offered | $ 75,000 |
|
Dollar amount raised | $ 57,150 | 100.0% |
|
|
|
Less offering expenses: |
|
|
Selling commissions and discounts | - | 0.0% |
Organizational and offering expenses | 1,391 | 2.4% |
Reserve for operations | - | 0.0% |
Other | - | 0.0% |
|
|
|
Available for investment | $ 55,759 | 97.6% |
|
|
|
Acquisition costs: |
|
|
Cash down Payment | $ 48,244 | 84.4% |
Acquisition fees | 350 | 0.6% |
Other (1) | 1,341 | 2.3% |
Mortgage loan | 20,343 | 35.6% |
|
|
|
Total acquisition costs | $ 70,278 | 123.0% |
|
|
|
Percent leveraged | 29% |
|
|
|
|
Date offering began | September 2010 |
|
|
|
|
Length of offering (in months) | 12 |
|
|
|
|
Months to invest 90% available for investment (measured from date of offering) | N/A |
|
(1) Includes legal fees, the costs of environmental studies, title costs and other closing costs. |
(2) As of December 31, 2012, Phillips Edison Strategic Investment Fund II LLC was in its investment period and had not invested 90% of its committed capital. As assets are identified for investment, capital will be called to fund acquisitions throughout the remainder of the investment period.
|
A-2
Table II
COMPENSATION TO SPONSOR
(UNAUDITED)
Prior Performance is not Indicative of Future Results
Table II provides the amount and type of compensation paid to Phillips Edison affiliates during the three years ended December 31, 2012 in connection with 1) each program sponsored by a Phillips Edison investment advisor that had offerings close during this period and 2) all other programs that have made payments to Phillips Edison affiliates during this period. All figures are as of December 31, 2012.
|
| Similar Programs | Other Programs | |||||
(in thousands) |
| Phillips Edison Shopping Center Fund III, LP |
| Phillips Edison Shopping Center Fund IV, LP |
| Phillips Edison Strategic Investment Fund LLC |
| Phillips Edison Strategic Investment Fund II LLC |
|
|
|
|
|
|
|
|
|
Date offering commenced |
| January 2005 |
| September 2007 |
| January 2007 |
| September 2010 |
Dollar amount raised | $ | 275,000 | $ | 119,910 | $ | 64,866 | $ | 57,150 |
|
|
|
|
|
|
|
|
|
Amount paid to sponsor from proceeds of offering: |
|
|
|
|
|
|
|
|
Underwriting fees |
| - |
| - |
| - |
| - |
Acquisition fees: |
|
|
|
|
|
|
|
|
Real estate commissions |
| - |
| - |
| - |
| - |
Advisory fees |
| - |
| - |
| - |
| - |
Other |
| - |
| - |
| - |
| - |
Total amount paid to sponsor |
| - |
| - |
| - |
| - |
|
|
|
|
|
|
|
|
|
Dollar amount of cash generated from operations before deducting payments to sponsor | $ | 86,917 | $ | 23,272 | $ | 21,113 | $ | 1,204 |
|
|
|
|
|
|
|
|
|
Amount paid to sponsor from operations: |
|
|
|
|
|
|
|
|
Property management fees |
| 13,193 |
| 1,701 |
| 1,385 |
| 188 |
Partnership management fees |
| 12,063 |
| 3,480 |
| 2,794 |
| 1,429 |
Reimbursements |
| 5,379 |
| 675 |
| 391 |
| 537 |
Leasing commissions |
| 9,150 |
| 1,325 |
| 1,236 |
| 164 |
Acquisition fees |
| - |
| - |
| 200 |
| 350 |
Financing fees |
| - |
| - |
| 395 |
| 8 |
Construction management fees |
| 1,861 |
| 412 |
| 503 |
| 115 |
Totals | $ | 41,646 | $ | 7,593 | $ | 6,904 | $ | 2,791 |
|
|
|
|
|
|
|
|
|
Dollar amount of sales and refinancing before deducting payments to sponsor: |
|
|
|
|
|
|
|
|
Cash | $ | 5,587 | $ | - | $ | - | $ | - |
Notes |
| - |
| - |
| - |
| - |
|
|
|
|
|
|
|
|
|
Amount paid to sponsor from sales and refinancing: |
|
|
|
|
|
|
|
|
Selling commissions | $ | 390 | $ | 124 | $ | - | $ | - |
Incentive fees |
| - |
| - |
| - |
| - |
Other |
| - |
| - |
| - |
| - |
Totals | $ | 390 | $ | 124 | $ | - | $ | - |
A-3
Table III | |||||
OPERATING RESULTS OF PRIOR PROGRAMS | |||||
(UNAUDITED) | |||||
Prior Performance is not Indicative of Future Results | |||||
|
|
|
|
|
|
Table III summarizes the operating results of programs sponsored by Phillips Edison that have had offerings close during the five years ended December 31, 2012. For these programs, this table shows: the income or loss of such programs (based upon U.S. generally accepted accounting principles ("GAAP")); the cash generated from operations, sales and refinancings; and information regarding cash distributions. All figures are as of or for the year ended December 31 of the year indicated. | |||||
|
|
|
|
|
|
|
|
|
|
|
|
A-4
Table III | |||||||||||||||||
OPERATING RESULTS OF PRIOR PROGRAMS (Continued) | |||||||||||||||||
(UNAUDITED) | |||||||||||||||||
Prior Performance is not Indicative of Future Results | |||||||||||||||||
|
|
| |||||||||||||||
|
| Phillips Edison Limited Partnership(4) | |||||||||||||||
(in thousands) |
| 2005 |
| 2006 |
| 2007 |
| 2008 |
| 2009 |
| 2010 |
| 2011 |
| 2012 | |
|
|
|
|
|
|
|
|
|
|
|
|
|
|
|
|
| |
Gross revenues | $ | 85,295 | $ | 113,282 | $ | 175,683 | $ | 210,681 | $ | 199,433 | $ | 190,016 | $ | 195,817 | $ | 212,769 | |
Profit (loss) on sale of properties |
| 6,104 |
| 7,889 |
| 3,620 |
| 264 |
| (524) |
| 54,254 |
| 13,913 |
| 5,312 | |
Other income (loss) |
| (4,165) |
| (40) |
| (122) |
| (2,123) |
| 9,551 |
| (51,202) |
| (21,169) |
| (3,622) | |
|
|
|
|
|
|
|
|
|
|
|
|
|
|
|
|
| |
Less: Operating expenses (1) |
| 34,359 |
| 44,092 |
| 71,678 |
| 96,315 |
| 86,134 |
| 84,307 |
| 79,271 |
| 91,234 | |
Interest expense |
| 32,341 |
| 47,218 |
| 84,444 |
| 110,143 |
| 75,465 |
| 70,261 |
| 64,192 |
| 74,959 | |
Depreciation and amortization |
| 29,325 |
| 38,298 |
| 71,955 |
| 92,578 |
| 80,221 |
| 63,939 |
| 58,775 |
| 59,634 | |
|
|
|
|
|
|
|
|
|
|
|
|
|
|
|
|
| |
Net income (loss) before non-controlling interests |
| (8,791) |
| (8,477) |
| (48,896) |
| (90,214) |
| (33,360) |
| (25,799) |
| (13,677) |
| (11,368) | |
|
|
|
|
|
|
|
|
|
|
|
|
|
|
|
|
| |
Net loss (income) allocated to non-controlling interests |
| − |
| 9,817 |
| 31,802 |
| 55,112 |
| 19,511 |
| 58,275 |
| 12,678 |
| 14,118 | |
Net income (loss) - GAAP basis | $ | (8,791) | $ | 1,340 | $ | (17,094) | $ | (35,102) | $ | (13,849) | $ | 32,476 | $ | (999) | $ | 2,750 | |
|
|
|
|
|
|
|
|
|
|
|
|
|
|
|
|
| |
Taxable (Loss) Income: (2) |
|
|
|
|
|
|
|
|
|
|
|
|
|
|
|
| |
--from operations | $ | (1,377) | $ | 4,182 | $ | 3,180 | $ | (8,273) | $ | (3,293) | $ | (3,696) | $ | 5,249 | $ | 5,407 | |
--from gain on sale |
| − |
| 476 |
| 2,043 |
| 379 |
| 2,361 |
| 35,889 |
| 2,520 |
| 4,589 | |
|
|
|
|
|
|
|
|
|
|
|
|
|
|
|
|
| |
Cash generated from operations |
| 11,661 |
| 20,146 |
| 32,135 |
| 35,272 |
| 44,296 |
| 46,743 |
| 32,390 |
| 55,142 | |
Cash generated from sales |
| 22,011 |
| 35,614 |
| 27,603 |
| 20,497 |
| 30,770 |
| 126,187 |
| 119,771 |
| 15,492 | |
Cash generated from financing / refinancing (3) |
| 104,799 |
| 309,302 |
| 688,314 |
| 82,652 |
| 58,544 |
| (19,935) |
| (81,602) |
| 29,504 | |
Total cash generated from operations, sales and refinancing |
| 138,471 |
| 365,062 |
| 748,052 |
| 138,421 |
| 133,610 |
| 152,995 |
| 70,559 |
| 100,138 | |
|
|
|
|
|
|
|
|
|
|
|
|
|
|
|
|
| |
Less: Cash distributions to investors: |
|
|
|
|
|
|
|
|
|
|
|
|
|
|
|
| |
--from operating cash flow |
| 11,661 |
| 16,735 |
| 17,675 |
| 18,617 |
| 10,857 |
| 8,853 |
| 15,643 |
| 12,954 | |
--from sales and refinancing |
| 3,890 |
| − |
| − |
| − |
| − |
| − |
| − |
| − | |
--from other |
| − |
| − |
| − |
| − |
| − |
| − |
| − |
| − | |
|
|
|
|
|
|
|
|
|
|
|
|
|
|
|
|
| |
Cash generated after cash distributions |
| 122,920 |
| 348,327 |
| 730,377 |
| 119,804 |
| 122,753 |
| 144,142 |
| 54,916 |
| 87,184 | |
|
|
|
|
|
|
|
|
|
|
|
|
|
|
|
|
| |
Less: Special items (not including sales and refinancing) |
| − |
| − |
| − |
| − |
| − |
| − |
| − |
| − | |
|
|
|
|
|
|
|
|
|
|
|
|
|
|
|
|
| |
Cash generated after cash distributions and special items | $ | 122,920 | $ | 348,327 | $ | 730,377 | $ | 119,804 | $ | 122,753 | $ | 144,142 | $ | 54,916 | $ | 87,184 | |
|
|
|
|
|
|
|
|
|
|
|
|
|
|
|
|
| |
Tax and distribution data per $1,000 invested |
|
|
|
|
|
|
|
|
|
|
|
|
|
|
|
| |
U.S. federal income tax results: |
|
|
|
|
|
|
|
|
|
|
|
|
|
|
|
| |
Ordinary income (loss) |
|
|
|
|
|
|
|
|
|
|
|
|
|
|
|
| |
- from operations | $ | (6.18) | $ | 18.79 | $ | 14.29 | $ | (31.01) | $ | (12.34) | $ | (13.86) | $ | 19.68 | $ | 20.27 | |
- from recapture |
| − |
| − |
| − |
| − |
| − |
| − |
| − |
| − | |
Capital gain (loss) |
| − |
| 2.14 |
| 9.18 |
| 1.42 |
| 8.85 |
| 134.54 |
| 9.45 |
| 17.20 | |
Cash distributions to investors |
|
|
|
|
|
|
|
|
|
|
|
|
|
|
|
| |
Source (on a GAAP basis) |
|
|
|
|
|
|
|
|
|
|
|
|
|
|
|
| |
- from investment income |
| − |
| 5.61 |
| − |
| − |
| − |
| 37.00 |
| − |
| 10.31 | |
- from return of capital |
| 65.00 |
| 64.39 |
| 74.00 |
| 74.00 |
| 37.00 |
| − |
| 48.50 |
| 38.25 | |
Total distribution on GAAP basis | $ | 65.00 | $ | 70.00 | $ | 74.00 | $ | 74.00 | $ | 37.00 | $ | 37.00 | $ | 48.50 | $ | 48.56 | |
Source (on cash basis) |
|
|
|
|
|
|
|
|
|
|
|
|
|
|
|
| |
- from sales | $ | 16.26 | $ | − | $ | − | $ | − | $ | − | $ | − | $ | − | $ | − | |
- from refinancings |
| − |
| − |
| − |
| − |
| − |
| − |
| − |
| − | |
- from operations |
| 48.74 |
| 70.00 |
| 74.00 |
| 74.00 |
| 37.00 |
| 37.00 |
| 48.50 |
| 48.56 | |
Total distributions on cash basis | $ | 65.00 | $ | 70.00 | $ | 74.00 | $ | 74.00 | $ | 37.00 | $ | 37.00 | $ | 48.50 | $ | 48.56 | |
|
|
|
|
|
|
|
|
|
|
|
|
| |||||
Amounts (in percentage terms) remaining in program properties as of December 31, 2012 |
|
| 56% | ||||||||||||||
|
|
|
|
|
|
|
|
|
|
|
|
| |||||
| (1) Operating expenses include all general and administrative expenses. | ||||||||||||||||
| (2) Program is comprised of partnerships, limited liability companies, real estate investment trusts and subchapter S corporations, which file tax returns for which the partners, members and stockholders are taxed on their respective shares of entity income, and accordingly, no provision for income taxes is included in the consolidated financial statements. | ||||||||||||||||
| (3) Cash generated from financing / refinancing includes original mortgage proceeds when assets were acquired. | ||||||||||||||||
| (4) Consolidated financial statements of Phillips Edison Limited Partnership and its subsidiaries. As well as being the general partner in all Phillips Edison-sponsored programs, Phillips Edison Limited Partnership has limited partnership interests in the programs reported. | ||||||||||||||||
A-5
Table III | |||||||||||||||
OPERATING RESULTS OF PRIOR PROGRAMS (Continued) | |||||||||||||||
(UNAUDITED) | |||||||||||||||
Prior Performance is not Indicative of Future Results | |||||||||||||||
|
|
|
| ||||||||||||
|
|
| Phillips Edison Shopping Center Fund III, L.P. | ||||||||||||
(in thousands) |
|
| 2006 |
| 2007 |
| 2008 |
| 2009 |
| 2010 |
| 2011 |
| 2012 |
|
|
|
|
|
|
|
|
|
|
|
|
|
|
|
|
Gross revenues |
| $ | 20,293 | $ | 76,076 | $ | 106,147 | $ | 97,705 | $ | 82,810 | $ | 81,415 | $ | 82,993 |
Profit (loss) on sale of properties |
|
| − |
| − |
| 264 |
| (551) |
| 3,077 |
| 6,535 |
| − |
Other loss |
|
| − |
| (30) |
| (2,186) |
| (1,694) |
| (49,249) |
| (10,235) |
| (10,001) |
|
|
|
|
|
|
|
|
|
|
|
|
|
|
|
|
Less: Operating expenses (1) |
|
| 11,415 |
| 29,115 |
| 40,062 |
| 36,476 |
| 33,237 |
| 31,669 |
| 34,089 |
Interest expense |
|
| 9,653 |
| 42,131 |
| 62,297 |
| 38,563 |
| 35,366 |
| 31,291 |
| 34,111 |
Depreciation and amortization |
|
| 9,161 |
| 38,015 |
| 56,106 |
| 49,444 |
| 32,638 |
| 26,978 |
| 23,818 |
|
|
|
|
|
|
|
|
|
|
|
|
|
|
|
|
Net loss - GAAP basis |
| $ | (9,936) | $ | (33,215) | $ | (54,240) | $ | (29,023) | $ | (64,603) | $ | (12,223) | $ | (19,026) |
|
|
|
|
|
|
|
|
|
|
|
|
|
|
|
|
Taxable (Loss) Income: (2) |
|
|
|
|
|
|
|
|
|
|
|
|
|
|
|
--from operations |
| $ | (422) | $ | 8,549 | $ | 4,940 | $ | (3,889) | $ | 988 | $ | (4,855) | $ | 1,503 |
--from gain on sale |
|
| − |
| − |
| − |
| − |
| − |
| − |
| − |
|
|
|
|
|
|
|
|
|
|
|
|
|
|
|
|
Cash generated (deficiency) from operations |
|
| (104) |
| 14,939 |
| 21,792 |
| 14,250 |
| 18,324 |
| 5,046 |
| 22,007 |
Cash generated (deficiency) from sales |
|
| − |
| − |
| 1,778 |
| 4,956 |
| 14,395 |
| 96,145 |
| 9,036 |
Cash generated from financing / refinancing (3) |
|
| 275,355 |
| 605,075 |
| (13,637) |
| (3,280) |
| (11,608) |
| (90,146) |
| (16,559) |
Total cash generated from operations, sales and refinancing |
|
| 275,251 |
| 620,014 |
| 9,933 |
| 15,926 |
| 21,111 |
| 11,045 |
| 14,484 |
|
|
|
|
|
|
|
|
|
|
|
|
|
|
|
|
Less: Cash distributions to investors: |
|
|
|
|
|
|
|
|
|
|
|
|
|
|
|
--from operating cash flow |
|
| − |
| 14,939 |
| − |
| − |
| − |
| 1,526 |
| 4,926 |
--from sales and refinancing |
|
| − |
| 7,561 |
| − |
| − |
| − |
| − |
| − |
--from other |
|
| − |
| − |
| − |
| − |
| − |
| − |
| − |
|
|
|
|
|
|
|
|
|
|
|
|
|
|
|
|
Cash generated after cash distributions |
|
| 275,251 |
| 597,514 |
| 9,933 |
| 15,926 |
| 21,111 |
| 9,519 |
| 9,558 |
|
|
|
|
|
|
|
|
|
|
|
|
|
|
|
|
Less: Special items (not including sales and refinancing) |
|
| − |
| − |
| − |
| − |
| − |
| − |
| − |
|
|
|
|
|
|
|
|
|
|
|
|
|
|
|
|
Cash generated after cash distributions and special items |
| $ | 275,251 | $ | 597,514 | $ | 9,933 | $ | 15,926 | $ | 21,111 | $ | 9,519 | $ | 9,558 |
|
|
|
|
|
|
|
|
|
|
|
|
|
|
|
|
Tax and distribution Data per $1,000 Invested |
|
|
|
|
|
|
|
|
|
|
|
|
|
|
|
Federal income tax results: |
|
|
|
|
|
|
|
|
|
|
|
|
|
|
|
Ordinary income (loss) |
|
|
|
|
|
|
|
|
|
|
|
|
|
|
|
- from operations |
| $ | (3.47) | $ | 31.09 | $ | 18.43 | $ | (14.51) | $ | 3.69 | $ | (16.29) | $ | 5.04 |
- from recapture |
|
| − |
| − |
| − |
| − |
| − |
| − |
| − |
Capital gain (loss) |
|
| − |
| − |
| − |
| − |
| − |
| − |
| − |
Cash distributions to investors |
|
|
|
|
|
|
|
|
|
|
|
|
|
|
|
Source (on a GAAP basis) |
|
|
|
|
|
|
|
|
|
|
|
|
|
|
|
- from investment income |
|
| − |
| 56.55 |
| − |
| − |
| − |
| 5.12 |
| 16.53 |
- from return of capital |
|
| − |
| 5.27 |
|
|
|
|
|
|
|
|
|
|
Total distribution on GAAP basis |
| $ | − | $ | 81.82 | $ | − | $ | − | $ | − | $ | 5.12 | $ | 16.53 |
Source (on cash basis) |
|
|
|
|
|
|
|
|
|
|
|
|
|
|
|
- from sales |
| $ | − | $ | − | $ | − | $ | − | $ | − | $ | − | $ | − |
- from refinancings |
|
| − |
| 27.50 |
| − |
| − |
| − |
| − |
| − |
- from operations |
|
| − |
| 54.32 |
| − |
| − |
| − |
| 5.12 |
| 16.53 |
Total distributions on cash basis |
| $ | − | $ | 81.82 | $ | − | $ | − | $ | − | $ | 5.12 | $ | 16.53 |
|
|
|
|
|
|
|
|
|
|
|
|
|
|
|
|
|
|
|
|
|
|
|
|
|
|
|
|
|
|
|
|
Amounts (in percentage terms) remaining in program properties as of December 31, 2012 |
|
|
|
|
|
|
|
|
|
|
|
|
|
| 80% |
|
|
|
|
|
|
|
|
|
|
|
|
|
|
|
|
(1) Operating expenses include all general and administrative expenses. | |||||||||||||||
(2) Program qualifies as a REIT under the Internal Revenue Code for federal income tax purposes. To qualify as a REIT, the program must meet a number of organizational and operational requirements, including requirements to distribute at least 90% of the ordinary taxable income and to distribute to stockholders or pay tax on 100% of capital gains and to meet certain asset and income tests. As such, the program is generally not subject to U.S. federal income tax to the extent it distributes its REIT taxable income to its stockholders. | |||||||||||||||
(3) Cash generated from financing / refinancing includes original mortgage proceeds and capital contributions when assets were acquired. | |||||||||||||||
A-6
Table III | ||||||||||||||
OPERATING RESULTS OF PRIOR PROGRAMS (Continued) | ||||||||||||||
(UNAUDITED) | ||||||||||||||
Prior Performance is not Indicative of Future Results | ||||||||||||||
|
|
| ||||||||||||
|
| Phillips Edison Shopping Center Fund IV, L.P. | ||||||||||||
(in thousands) |
| 2007 |
| 2008 |
| 2009 |
| 2010 |
| 2011 |
| 2012 | ||
|
|
|
|
|
|
|
|
|
|
|
|
| ||
Gross revenues | $ | − | $ | 2,950 | $ | 6,622 | $ | 9,490 | $ | 13,837 | $ | 14,517 | ||
Profit on sale of properties |
| − |
| − |
| − |
| 8,431 |
| − |
| − | ||
Other income (loss) |
| − |
| − |
| (1,390) |
| (9,566) |
| − |
| − | ||
|
|
|
|
|
|
|
|
|
|
|
|
| ||
Less: Operating expenses (1) |
| 509 |
| 4,066 |
| 5,049 |
| 6,033 |
| 5,778 |
| 5,514 | ||
Interest expense |
| − |
| 1,533 |
| 2,278 |
| 2,692 |
| 1,769 |
| 1,670 | ||
Depreciation and amortization |
| − |
| 1,351 |
| 2,679 |
| 3,809 |
| 5,265 |
| 4,986 | ||
|
|
|
|
|
|
|
|
|
|
|
|
| ||
Net (loss) income - GAAP basis | $ | (509) | $ | (4,000) | $ | (4,774) | $ | (4,179) | $ | 1,025 | $ | 2,347 | ||
|
|
|
|
|
|
|
|
|
|
|
|
| ||
Taxable (Loss) Income: (2) |
|
|
|
|
|
|
|
|
|
|
|
| ||
--from operations | $ | − | $ | (1,373) | $ | (87) | $ | (155) | $ | 5,084 | $ | 6,979 | ||
--from gain on sale |
| − |
| − |
| − |
| − |
| − |
| − | ||
|
|
|
|
|
|
|
|
|
|
|
|
| ||
Cash generated (deficiency) from operations |
| 336 |
| (1,473) |
| (730) |
| 1,940 |
| 6,049 |
| 7,763 | ||
Cash generated (deficiency) from sales |
| − |
| − |
| − |
| 1,884 |
| − |
| − | ||
Cash generated from financing / refinancing (3) |
| (217) |
| 49,524 |
| 14,093 |
| 51,813 |
| 14,719 |
| 3,967 | ||
Total cash generated from operations, sales and refinancing |
| 119 |
| 48,051 |
| 13,363 |
| 55,637 |
| 20,768 |
| 11,730 | ||
|
|
|
|
|
|
|
|
|
|
|
|
| ||
Less: Cash distributions to investors: |
|
|
|
|
|
|
|
|
|
|
|
| ||
--from operating cash flow |
| − |
| − |
| − |
| − |
| 6,049 |
| 7,763 | ||
--from sales and refinancing |
| − |
| 913 |
| − |
| − |
| 10,951 |
| 3,467 | ||
--from other |
| − |
| − |
| − |
| − |
| − |
| − | ||
|
|
|
|
|
|
|
|
|
|
|
|
| ||
Cash generated after cash distributions |
| 119 |
| 47,138 |
| 13,363 |
| 55,637 |
| 3,768 |
| 500 | ||
|
|
|
|
|
|
|
|
|
|
|
|
| ||
Less: Special items (not including sales and refinancing) |
| − |
| − |
| − |
| − |
| − |
| − | ||
|
|
|
|
|
|
|
|
|
|
|
|
| ||
Cash generated after cash distributions and special items | $ | 119 | $ | 47,138 | $ | 13,363 | $ | 55,637 | $ | 3,768 | $ | 500 | ||
|
|
|
|
|
|
|
|
|
|
|
|
| ||
Tax and distribution data per $1,000 invested |
|
|
|
|
|
|
|
|
|
|
|
| ||
U.S. federal income tax results: |
|
|
|
|
|
|
|
|
|
|
|
| ||
Ordinary (loss) income |
|
|
|
|
|
|
|
|
|
|
|
| ||
- from operations | $ | − | $ | (62.33) | $ | (3.41) | $ | 21.94 | $ | 92.91 | $ | 141.21 | ||
- from recapture |
| − |
| − |
| − |
| − |
| − |
| − | ||
Capital gain (loss) |
| − |
| − |
| − |
| − |
| − |
| − | ||
Cash distributions to investors |
|
|
|
|
|
|
|
|
|
|
|
| ||
Source (on a GAAP basis) |
|
|
|
|
|
|
|
|
|
|
|
| ||
- from investment income |
| − |
| − |
| − |
| − |
| 171.24 |
| 120.05 | ||
- from return of capital |
| − |
| 41.45 |
| − |
| − |
| 139.44 |
| 107.18 | ||
Total distribution on GAAP basis | $ | − | $ | 41.45 | $ | − | $ | − | $ | 310.68 | $ | 227.23 | ||
Source (on cash basis) |
|
|
|
|
|
|
|
|
|
|
|
| ||
- from sales | $ | − | $ | − | $ | − | $ | − | $ | − | $ | − | ||
- from refinancings |
| − |
| 41.45 |
| − |
| − |
| 220.19 |
| 76.85 | ||
- from operations |
| − |
| − |
| − |
| − |
| 90.49 |
| 150.38 | ||
Total distributions on cash basis | $ | − | $ | 41.45 | $ | − | $ | − | $ | 310.68 | $ | 227.23 | ||
|
|
|
|
|
|
|
|
|
| |||||
Amounts (in percentage terms) remaining in program properties as of December 31, 2012 |
|
|
|
|
|
|
|
| 86% | |||||
|
|
|
|
|
|
|
|
|
| |||||
(1) Operating expenses include all general and administrative expenses. | ||||||||||||||
(2) Program qualifies as a REIT under the Internal Revenue Code for U.S. federal income tax purposes. To qualify as a REIT, the program must meet a number of organizational and operational requirements, including requirements to distribute at least 90% of the ordinary taxable income and to distribute to stockholders or pay tax on 100% of capital gains and to meet certain asset and income tests. As such, the program is generally not subject to U.S. federal income tax to the extent it distributes its REIT taxable income to its stockholders. | ||||||||||||||
(3) Cash generated from financing / refinancing includes original mortgage financing and subsequent financings. | ||||||||||||||
| ||||||||||||||
A-7
Table III | ||||||||||||||
OPERATING RESULTS OF PRIOR PROGRAMS (Continued) | ||||||||||||||
(UNAUDITED) | ||||||||||||||
Prior Performance is not Indicative of Future Results | ||||||||||||||
|
|
| ||||||||||||
|
| Phillips Edison Strategic Investment Fund | ||||||||||||
(in thousands) |
| 2007 |
| 2008 |
| 2009 |
| 2010 |
| 2011 |
| 2012 | ||
|
|
|
|
|
|
|
|
|
|
|
|
| ||
Gross revenues | $ | − | $ | − | $ | 1,743 | $ | 8,160 | $ | 11,441 | $ | 14,163 | ||
Profit on sale of properties |
| − |
| − |
| − |
| − |
|
|
| − | ||
Other income (loss) |
| 6 |
| 10 |
| 14,114 |
| 4,322 |
| (2,089) |
| 968 | ||
|
|
|
|
|
|
|
|
|
|
|
|
| ||
Less: Operating expenses (1) |
| 99 |
| 1,840 |
| 2,718 |
| 4,943 |
| 5,551 |
| 4,858 | ||
Interest expense |
| − |
| 9 |
| 468 |
| 1,498 |
| 1,718 |
| 6,097 | ||
Depreciation and amortization |
| − |
| − |
| 742 |
| 2,947 |
| 4,312 |
| 5,342 | ||
|
|
|
|
|
|
|
|
|
|
|
|
| ||
Net income (loss) - GAAP Basis | $ | (93) | $ | (1,839) | $ | 11,929 | $ | 3,094 | $ | (2,229) | $ | (1,166) | ||
|
|
|
|
|
|
|
|
|
|
|
|
| ||
Taxable (Loss) Income: (2) |
|
|
|
|
|
|
|
|
|
|
|
| ||
--from operations | $ | − | $ | − | $ | (1,468) | $ | (258) | $ | 682 | $ | (1,663) | ||
--from gain on sale |
| − |
| − |
| − |
| − |
| − |
| − | ||
|
|
|
|
|
|
|
|
|
|
|
|
| ||
Cash generated (deficiency) from operations |
| (132) |
| (1,826) |
| 1,318 |
| 5,639 |
| 5,597 |
| 3,768 | ||
Cash generated (deficiency) from sales |
| − |
| − |
| − |
| − |
| − |
| − | ||
Cash generated from financing / refinancing (3) |
| 7,204 |
| 2,783 |
| 60,261 |
| 41,238 |
| 16,171 |
| 46,870 | ||
Total cash generated from operations, sales and refinancing |
| 7,072 |
| 957 |
| 61,579 |
| 46,877 |
| 21,768 |
| 50,638 | ||
|
|
|
|
|
|
|
|
|
|
|
|
| ||
Less: Cash distributions to investors: |
|
|
|
|
|
|
|
|
|
|
|
| ||
--from operating cash flow |
| − |
| − |
| − |
| 1,000 |
| 5,597 |
| 3,768 | ||
--from sales and refinancing |
| − |
| − |
| − |
| − |
| 13,402 |
| 42,704 | ||
--from other |
| − |
| − |
| − |
| − |
| − |
| − | ||
|
|
|
|
|
|
|
|
|
|
|
|
| ||
Cash generated after cash distributions |
| 7,072 |
| 957 |
| 61,579 |
| 45,877 |
| 2,769 |
| 4,166 | ||
|
|
|
|
|
|
|
|
|
|
|
|
| ||
Less: Special items (not including sales and refinancing) |
| − |
| − |
| − |
| − |
| − |
| − | ||
|
|
|
|
|
|
|
|
|
|
|
|
| ||
Cash generated after cash distributions and special items | $ | 7,072 | $ | 957 | $ | 61,579 | $ | 45,877 | $ | 2,769 | $ | 4,166 | ||
|
|
|
|
|
|
|
|
|
|
|
|
| ||
Tax and distribution data per $1,000 invested |
|
|
|
|
|
|
|
|
|
|
|
| ||
U.S. federal income tax results: |
|
|
|
|
|
|
|
|
|
|
|
| ||
Ordinary income (loss) |
|
|
|
|
|
|
|
|
|
|
|
| ||
- from operations | $ | − | $ | − | $ | (48.98) | $ | (3.99) | $ | 12.57 | $ | (146.97) | ||
- from recapture |
| − |
| − |
| − |
| − |
| − |
| − | ||
Capital gain (loss) |
| − |
| − |
| − |
| − |
| − |
| − | ||
Cash distributions to investors |
|
|
|
|
|
|
|
|
|
|
|
| ||
Source (on a GAAP basis) |
|
|
|
|
|
|
|
|
|
|
|
| ||
- from investment income |
| − |
| − |
| − |
| 15.46 |
| 154.81 |
| 64.84 | ||
- from return of capital |
| − |
| − |
| − |
| − |
| 195.29 |
| 791.50 | ||
Total distribution on GAAP basis | $ | − | $ | − | $ | − | $ | 15.46 | $ | 350.10 | $ | 856.34 | ||
Source (on cash basis) |
|
|
|
|
|
|
|
|
|
|
|
| ||
- from sales | $ | − | $ | − | $ | − | $ | − | $ | − | $ | − | ||
- from refinancings |
| − |
| − |
| − |
| − |
| 260.08 |
| 792.62 | ||
- from operations |
| − |
| − |
| − |
| 15.46 |
| 90.02 |
| 63.72 | ||
Total distributions on cash basis | $ | − | $ | − | $ | − | $ | 15.46 | $ | 350.10 | $ | 856.34 | ||
|
|
|
|
|
|
|
|
|
|
|
|
| ||
Amounts (in percentage terms) remaining in program properties as of December 31, 2012 |
|
|
|
|
|
|
|
|
|
|
| 96% | ||
|
|
|
|
|
|
|
|
|
|
|
|
| ||
(1) Operating expenses include all general and administrative expenses. | ||||||||||||||
(2) Program is organized as a partnership, which files tax returns for which the partners are taxed on their respective shares of entity income, and accordingly, no provision for income taxes is included in the consolidated financial statements. | ||||||||||||||
(3) Cash generated from financing / refinancing includes original mortgage proceeds when assets were acquired. |
| |||||||||||||
A-8
Table III | |||||
OPERATING RESULTS OF PRIOR PROGRAMS (Continued) | |||||
(UNAUDITED) | |||||
Prior Performance is not Indicative of Future Results | |||||
| |||||
|
|
| Phillips Edison Strategic Investment Fund II | ||
(in thousands) |
|
| 2011 |
| 2012 |
|
|
|
|
|
|
Gross revenues |
| $ | 600 | $ | 5,053 |
Profit on sale of properties |
|
| − |
| − |
Other income (loss) |
|
| − |
| 7,513 |
|
|
|
|
|
|
Less: Operating expenses (1) |
|
| 884 |
| 6,461 |
Interest expense |
|
| 91 |
| 501 |
Depreciation and amortization |
|
| 255 |
| 1,826 |
|
|
|
|
|
|
Net income (loss) - GAAP Basis |
| $ | (630) | $ | 3,778 |
|
|
|
|
|
|
Taxable income: (2) |
|
|
|
|
|
--from operations |
|
| 200 |
| (2,072) |
--from gain on sale |
|
| − |
| − |
|
|
|
|
|
|
Cash generated (deficiency) from operations |
|
| 542 |
| (1,445) |
Cash generated (deficiency) from sales |
|
| − |
| − |
Cash generated from financing / refinancing (3) |
|
| 20,054 |
| 57,129 |
Total cash generated from operations, sales and refinancing |
|
| 20,596 |
| 55,684 |
|
|
|
|
|
|
Less: Cash distributions to investors: |
|
|
|
|
|
--from operating cash flow |
|
| − |
| − |
--from sales and refinancing |
|
| − |
| 4 |
--from other |
|
| − |
| − |
|
|
|
|
|
|
Cash generated after cash distributions |
|
| 20,596 |
| 55,680 |
|
|
|
|
|
|
Less: Special items (not including sales and refinancing) |
|
| − |
| − |
|
|
|
|
|
|
Cash generated after cash distributions and special items |
| $ | 20,596 | $ | 55,680 |
|
|
|
|
|
|
Tax and distribution data per $1,000 invested |
|
|
|
|
|
U.S. federal income tax results: |
|
|
|
|
|
Ordinary income |
|
|
|
|
|
- from operations |
| $ | 17.64 | $ | (37.86) |
- from recapture |
|
| − |
| − |
Capital gain (loss) |
|
| − |
| − |
Cash distributions to investors (4) |
|
|
|
|
|
Source (on a GAAP basis) |
|
|
|
|
|
- from investment income |
|
| − |
| − |
- from return of capital |
|
| − |
| 0.07 |
Total distribution on GAAP basis |
| $ | − | $ | 0.07 |
Source (on cash basis) |
|
|
|
|
|
- from sales |
| $ | − | $ | − |
- from refinancings |
|
| − |
| 0.07 |
- from operations |
|
| − |
| − |
Total distributions on cash basis |
| $ | − | $ | 0.07 |
|
|
|
|
|
|
Amounts (in percentage terms) remaining in program properties as of December 31, 2012 |
|
|
|
| 100% |
|
|
|
|
|
|
(1) Operating expenses include all general and administrative expenses. | |||||
(2) Program is organized as a partnership, which files tax returns for which the partners are taxed on their respective shares of entity income, and accordingly, no provision for income taxes is included in the consolidated financial statements. | |||||
(3) Cash generated from financing / refinancing includes original mortgage proceeds when assets were acquired. | |||||
(4) As of this offering, this commingled fund is currently in its investment period and has not invested its entire committed capital. As such, as assets are identified for investment, capital will be called to fund the acquisition throughout the remainder of the investment period. | |||||
A-9
Table IV
RESULTS OF COMPLETED PROGRAMS
NOT APPLICABLE
A-10
| Table V | ||||||||||||||||||||||||
| SALES AND DISPOSALS OF PROPERTIES | ||||||||||||||||||||||||
| (UNAUDITED) | ||||||||||||||||||||||||
| Prior Performance is not Indicative of Future Results | ||||||||||||||||||||||||
|
| ||||||||||||||||||||||||
| Table V presents summary information with respect to the results of sales or disposals of properties by programs sponsored by Phillips Edison during the three years ended December 31, 2012. The table includes information about the sales proceeds received, the cash invested in the properties, the taxable gain or loss from the sales and the cash flow from the operation of the properties. Each of the programs represented in the table has or had investment objectives similar to ours. | ||||||||||||||||||||||||
|
| ||||||||||||||||||||||||
|
|
|
|
|
|
|
| Selling Price, Net of Closing costs and GAAP Adjustments |
| Costs of Properties Including Closing and Soft Costs |
|
| |||||||||||||
|
| Property |
| Date Acquired |
| Date of Sale |
| Cash received net of closing costs |
| Mortgage balance at time of sale |
| Purchase money mortgage taken back by program |
| Adjustments resulting from application of GAAP |
| Total(1) |
| Original mortgage financing |
| Total acquisition cost, capital improvement closing and soft costs |
| Total |
| Excess (deficiency) of property operating cash receipts over cash expenditures total | |
|
|
|
|
|
|
|
|
|
|
|
|
|
|
|
|
|
|
|
|
|
|
|
|
| |
Phillips Edison Shopping Center Fund III, LP |
|
|
|
|
|
|
|
|
|
|
|
|
|
|
|
|
|
|
|
|
|
|
|
| |
|
| Tops Plaza-Canandaaigua |
| 8/20/2007 |
| 3/17/2010 | $ | 4,094,538 | $ | 4,171,783 | $ | - | $ | - | $ | 8,266,321 | $ | 5,102,233 | $ | 161,392 | $ | 5,263,626 | $ | 1,073,218 | |
|
| Family Station |
| 6/27/2007 |
| 2/23/2010 |
| 115,099 |
| 4,496,054 |
| - |
| - |
| 4,611,152 |
| 3,705,000 |
| 2,028,206 |
| 5,733,206 |
| 399,858 | |
|
| Forestdale Plaza |
| 6/27/2007 |
| 4/28/2011 |
| 422,847 |
| 4,960,000 |
| - |
| - |
| 5,382,847 |
| 5,167,500 |
| 2,929,129 |
| 8,096,629 |
| (1,252,083) | |
|
| Genito |
| 6/27/2007 |
| 4/28/2011 |
| 504,182 |
| 4,640,000 |
| - |
| - |
| 5,144,182 |
| 5,167,500 |
| 3,128,701 |
| 8,296,201 |
| (256,125) | |
|
| Stella Station |
| 12/20/2006 |
| 4/30/2011 |
| 1,390,488 |
| 5,181,930 |
| - |
| - |
| 6,572,418 |
| 4,725,396 |
| 3,796,652 |
| 8,522,048 |
| 1,025,778 | |
|
| Liberty Station |
| 5/15/2006 |
| 4/30/2011 |
| 722,614 |
| 2,531,180 |
| - |
| - |
| 3,253,794 |
| 2,076,027 |
| 1,458,557 |
| 3,534,584 |
| 688,650 | |
|
| Western Lights Station |
| 9/19/2005 |
| 5/1/2011 |
| 8,819,672 |
| 12,629,067 |
| - |
| - |
| 21,448,739 |
| 9,182,570 |
| 15,787,913 |
| 24,970,483 |
| 6,178,195 | |
|
| Northgate |
| 11/1/2007 |
| 5/3/2011 |
| - |
| 13,170,505 |
| - |
| - |
| 13,170,505 |
| 13,822,517 |
| 2,820,071 |
| 16,642,588 |
| (4,354,330) | |
|
| Monroe Shopping Ctr |
| 6/27/2007 |
| 5/27/2011 |
| 117,609 |
| 711,644 |
| - |
| - |
| 829,253 |
| 2,015,000 |
| 1,119,030 |
| 3,134,030 |
| 1,594,860 | |
|
| Horizon Park |
| 6/27/2007 |
| 7/15/2011 |
| 3,188,431 |
| 15,200,000 |
| - |
| - |
| 18,388,431 |
| 18,915,000 |
| 11,465,207 |
| 30,380,207 |
| (5,323,112) | |
|
| Bear Road Plaza |
| 6/27/2007 |
| 8/23/2011 |
| 1,208,393 |
| 2,160,000 |
| - |
| - |
| 3,368,393 |
| 3,380,000 |
| 1,958,321 |
| 5,338,321 |
| 487,209 | |
|
| Riverchase Station |
| 6/6/2006 |
| 9/15/2011 |
| 2,696,392 |
| 10,400,000 |
| - |
| - |
| 13,096,392 |
| 10,520,534 |
| 6,695,991 |
| 17,216,525 |
| 3,573,418 | |
|
| Del-Ton Plaza |
| 6/27/2007 |
| 10/11/2011 |
| 526,817 |
| 3,680,000 |
| - |
| - |
| 4,206,817 |
| 3,770,000 |
| 2,136,602 |
| 5,906,602 |
| 591,302 | |
|
| Hannaford |
| 6/27/2007 |
| 12/20/2011 |
| 2,572,419 |
| 10,960,000 |
| - |
| - |
| 13,532,419 |
| 12,350,000 |
| 6,830,482 |
| 19,180,482 |
| 2,359,450 | |
|
| Athens |
| 9/14/2007 |
| 6/22/2012 |
| 161,300 |
| 7,966,609 |
| - |
| - |
| 8,127,909 |
| 8,540,976 |
| 5,054,072 |
| 13,595,048 |
| 350,190 | |
|
| CVS Center |
| 6/27/2007 |
| 9/26/2012 |
| 165,365 |
| 728,000 |
| - |
| - |
| 893,365 |
| 650,000 |
| 1,019,922 |
| 1,669,922 |
| 66,369 | |
|
|
|
|
|
|
| $ | 26,703,474 | $ | 103,586,772 | $ | - | $ | - | $ | 130,290,246 | $ | 109,090,253 | $ | 68,390,249 | $ | 177,480,502 | $ | 17,720,664 | |
|
|
|
|
|
|
|
|
|
|
|
|
|
|
|
|
|
|
|
|
|
|
|
|
| |
Phillips Edison Shopping Center Fund IV, LP |
|
|
|
|
|
|
|
|
|
|
|
|
|
|
|
|
|
|
|
|
|
|
|
| |
|
| Village Shoppes at East Cherokee |
| 8/22/2008 |
| 9/7/2010 | $ | - | $ | 15,784,000 | $ | - | $ | - | $ | 15,784,000 | $ | 15,784,000 | $ | 2,971,188 | $ | 18,755,188 | $ | (30,314) | |
|
|
|
|
|
|
| $ | - | $ | 15,784,000 | $ | - | $ | - | $ | 15,784,000 | $ | 15,784,000 | $ | 2,971,188 | $ | 18,755,188 | $ | (30,314) | |
|
|
|
|
|
|
|
|
|
|
|
|
|
|
|
|
|
|
|
|
|
|
|
|
| |
Phillips Edison Limited Partnership |
|
|
|
|
|
|
|
|
|
|
|
|
|
|
|
|
|
|
|
|
|
|
|
| |
|
| Unser & McMahon Walgreen’s |
| 6/27/2008 |
| 1/6/2010 | $ | 297,246 | $ | 4,896,106 | $ | - | $ | - | $ | 5,193,353 | $ | 5,057,379 | $ | 364,621 | $ | 5,422,000 | $ | 69,148 | |
|
| Renton |
| 3/3/2008 |
| 3/12/2010 |
| 160,579 |
| 6,684,119 |
| - |
| - |
| 6,844,699 |
| 6,678,540 |
| 501,472 |
| 7,180,012 |
| 404,995 | |
|
| Cape Henry Station |
| 3/1/2003 |
| 6/15/2010 |
| 2,811,053 |
| 3,410,873 |
| - |
| - |
| 6,221,926 |
| 3,800,000 |
| 722,313 |
| 4,522,313 |
| 2,078,442 | |
|
| Knollview |
| 6/5/2005 |
| 7/16/2010 |
| (410,815) |
| 2,104,083 |
| - |
| - |
| 1,693,268 |
| 2,100,000 |
| 162,645 |
| 2,262,645 |
| (133,782) | |
|
| Pablo Plaza Station |
| 3/1/2003 |
| 8/31/2010 |
| 11,379,033 |
| 7,515,335 |
| - |
| - |
| 18,894,368 |
| 8,400,000 |
| 6,453,217 |
| 14,853,217 |
| 5,227,204 | |
|
| Westbird Station |
| 3/1/2003 |
| 8/31/2010 |
| 8,539,772 |
| 8,454,779 |
| - |
| - |
| 16,994,551 |
| 9,450,000 |
| 2,066,318 |
| 11,516,318 |
| 4,286,095 | |
|
| Gunston Station |
| 8/1/2001 |
| 11/22/2010 |
| 11,574,886 |
| 16,113,422 |
| - |
| - |
| 27,688,308 |
| 9,801,617 |
| 7,149,196 |
| 16,950,813 |
| 11,567,339 | |
|
| Applewood Station |
| 3/1/2003 |
| 11/2/2010 |
| 3,486,025 |
| 5,261,235 |
| - |
| - |
| 8,747,260 |
| 5,900,000 |
| 1,379,569 |
| 7,279,569 |
| 3,296,550 | |
|
| Milford Station |
| 9/1/1997 |
| 12/8/2010 |
| 531,990 |
| - |
| - |
| - |
| 531,990 |
| 2,142,566 |
| 267,849 |
| 2,410,415 |
| (247,472) | |
|
| Lake Stevens Northwest Walgreens |
| 6/13/2008 |
| 10/19/2010 |
| 670,804 |
| 6,221,367 |
| - |
| - |
| 6,892,171 |
| 2,590,708 |
| 7,896,115 |
| 10,486,823 |
| 382,209 | |
|
| River Road Northwest Retail |
| 1/5/2009 |
| 10/15/2010 |
| 1,342,443 |
| 937,970 |
| - |
| - |
| 2,280,413 |
| - |
| 1,942,068 |
| 1,942,068 |
| 782,803 | |
|
| Old Bridge & Smoketown Walgreens |
| 12/27/2006 |
| 12/17/2010 |
| 1,771,878 |
| 3,132,513 |
| - |
| - |
| 4,904,391 |
| - |
| 4,395,801 |
| 4,395,801 |
| 22,182 | |
|
| Springdale |
| 9/22/1997 |
| 2/22/2011 |
| 1,244,667 |
| - |
| - |
| - |
| 1,244,667 |
| 1,012,500 |
| 2,252,884 |
| 3,265,384 |
| 564,861 | |
|
| Fond du Lac |
| 4/29/2005 |
| 4/13/2011 |
| - |
| 5,054,917 |
| - |
| - |
| 5,054,917 |
| 3,630,750 |
| 1,196,298 |
| 4,827,048 |
| (1,222,974) | |
|
| Queensbury |
| 11/17/1998 |
| 8/12/2011 |
| - |
| 1,284,206 |
| - |
| - |
| 1,284,206 |
| 1,566,000 |
| (86,274) |
| 1,479,726 |
| (1,224,081) | |
|
| Southern Hills |
| 8/6/2007 |
| 12/1/2011 |
| 3,957,823 |
| 7,380,000 |
| - |
| - |
| 11,337,823 |
| 7,828,469 |
| 5,284,902 |
| 13,113,371 |
| 2,790,846 | |
|
| Town West Station |
| 3/26/2003 |
| 12/6/2012 |
| - |
| 5,348,887 |
| - |
| - |
| 5,348,887 |
| 3,100,000 |
| 3,055,239 |
| 6,155,239 |
| (196,656) | |
|
| Blue Ash Station |
| 9/22/1997 |
| 12/20/2012 |
| 4,226,552 |
| - |
| - |
| - |
| 4,226,552 |
| 3,725,424 |
| 844,772 |
| 4,570,196 |
| 2,440,513 | |
|
|
|
|
|
|
| $ | 51,583,936 | $ | 83,799,812 | $ | - | $ | - | $ | 135,383,748 | $ | 76,783,953 | $ | 45,849,005 | $ | 122,632,958 | $ | 33,828,690 | |
(1) Phillips Edison Limited Partnership recognized capital gain on the properties that it sold; Phillips Edison Shopping Center Fund III, L.P. recognized ordinary gain on the properties that it sold.
A-11
TABLE I
EXPERIENCE IN RAISING AND INVESTING FUNDS FOR PUBLIC PROGRAM PROPERTIES
Table I provides a summary of the experience of the parent of our AR Capital sponsor and its affiliates in raising and investing funds for American Realty Capital Trust, Inc. from its inception on August 17, 2007 to December 31, 2011, its last year before termination, and American Realty Capital Trust III, Inc. from its inception on October 15, 2010 to December 31, 2012, its last year before termination. Information is provided as to the manner in which the proceeds of the offering have been applied, the timing and length of this offering and the time period over which the proceeds have been reinvested.
| American Realty |
| American Realty | ||||||||||||||||
|
|
| Percentage of total Dollar Amount Raised |
|
| Percentage | |||||||||||||
(dollars in thousands) |
| Dollar Amount |
|
|
| Dollar Amount |
|
| |||||||||||
Dollar amount offered |
| $ | 1,500,000 |
|
|
|
|
|
| $ | 1,500,000 |
|
|
|
|
| |||
Dollar amount raised |
|
| 1,695,813 |
|
|
|
|
|
|
| 1,750,291 |
|
|
|
|
| |||
Dollar amount raised from non-public program and private investments |
|
| 37,460 | (1) |
|
|
|
|
| — |
|
|
|
| |||||
Total dollar amount raised |
| $ | 1,733,273 |
|
|
| 100.00 | % |
| $ | 1,750,291 |
|
|
| 100.00 | % | |||
Less offering expenses: |
|
|
|
|
|
|
|
|
|
|
|
|
|
|
|
| |||
Selling commissions and discounts retained by affiliates |
| $ | 168,269 |
|
|
| 9.71 | % |
| $ | 170,433 |
|
|
| 9.74 | % | |||
Organizational expenses |
|
| 29,692 | (2) |
|
| 1.71 | % |
|
| 26,052 |
|
|
| 1.49 | % | |||
Other |
|
| — |
|
|
| 0.00 | % |
|
| — |
|
|
| 0.00 | % | |||
Reserves |
|
| — |
|
|
| 0.00 | % |
|
| — |
|
|
| 0.00 | % | |||
Available for investment |
| $ | 1,535,312 |
|
|
| 88.58 | % |
| $ | 1,553,806 |
|
|
| 88.77 | % | |||
Acquisition costs: |
|
|
|
|
|
|
|
|
|
|
|
|
|
|
|
| |||
Prepaid items related to purchase of property |
| $ | — |
|
|
| 0.00 | % |
| $ | — |
|
|
| 0.00 | % | |||
Cash down payment |
|
| 2,157,713 | (3) |
|
| 124.49 | % |
|
| 1,529,812 |
|
|
| 87.40 | % | |||
Acquisition fees |
|
| 41,320 |
|
|
| 2.38 | % |
|
| 38,646 |
|
|
| 2.21 | % | |||
Other |
|
| — |
|
|
| 0.00 | % |
|
| — |
|
|
| 0.00 | % | |||
Total acquisition costs |
| $ | 2,199,033 |
|
|
| 126.87 | % |
| $ | 1,568,458 |
|
|
| 89.61 | % | |||
Percentage leverage (mortgage financing divided by total acquisition costs) |
|
| 32.8 | 0% |
|
|
|
|
|
| 14.60 | % |
|
|
|
| |||
Date offering began |
|
| 3/18/2008 |
|
|
|
|
|
|
| 3/31/2011 |
|
|
|
|
| |||
Number of offerings in the year |
|
| 1 |
|
|
| �� |
|
|
| 1 |
|
|
|
|
| |||
Length of offerings (in months) |
|
| 39 | (4) |
|
|
|
|
|
| 18 | (5) |
|
|
|
| |||
Months to invest 90% of amount available for investment (from beginning of the offering) |
|
| 39 |
|
|
|
|
|
|
| 18 |
|
|
| |||||
| (1) | American Realty Capital Trust, Inc. sold non-controlling interests in certain properties in nine separate arrangements. The total amount contributed in these arrangements was $24.5 million. In addition, $13.0 million was raised in a private offering of debt securities through ARC Income Properties II, Inc. The structure of these arrangements and program is such that they are required to be consolidated with the results of American Realty Capital Trust, Inc. and therefore are included with this program. ARC Income Properties II, Inc is also included as a stand-alone program and is included separately in information about private programs. |
| (2) | Excludes offering costs from proceeds assumed from the distribution reinvestment plan. |
| (3) | Includes $12.0 million investment made in joint venture with American Realty Capital New York Recovery REIT, Inc. for the purchase of real estate and $17.3 million of other investments in common stock. |
| (4) | American Realty Capital Trust, Inc. completed its offering in July 2011. The data above includes uses of offering proceeds through December 31, 2011. |
| (5) | American Realty Capital Trust III, Inc. completed its offering in September 2012. The data above includes uses of offering proceeds through December 31, 2012. |
A-13
TABLE I
EXPERIENCE IN RAISING AND INVESTING FUNDS FOR NON-PUBLIC PROGRAM PROPERTIES
Table I provides a summary of the experience of our AR Capital sponsor and its affiliates as a sponsor in raising and investing funds in ARC Income Properties, LLC from its inception on June 5, 2008 to its termination on September 6, 2011, ARC Income Properties II, LLC from its inception on August 12, 2008 to its termination on May 16, 2011, ARC Income Properties III, LLC from its inception on September 29, 2009 to its termination on September 6, 2011, ARC Income Properties IV, LLC from its inception on June 23, 2010 to December 31, 2011 and ARC Growth Fund, LLC from its inception on July 24, 2008 to its termination on December 31, 2010. Information is provided as to the manner in which the proceeds of the offerings have been applied, the timing and length of this offering and the time period over which the proceeds have been invested.
|
|
|
|
|
|
|
|
|
| |||||||||||||||||||||||||||||||
| ARC Income |
| ARC Income |
| ARC Income Properties, III, LLC |
| ARC Income Properties, IV, LLC |
| ARC Growth | |||||||||||||||||||||||||||||||
(dollars in thousands) |
| Dollar |
| Percentage of Total Dollar Amount Raised |
| Dollar |
| Percentage of Total Dollar Amount Raised |
| Dollar |
| Percentage of Total Dollar Amount Raised |
| Dollar |
| Percentage of Total Dollar Amount Raised |
| Dollar |
| Percentage of Total Dollar Amount Raised | ||||||||||||||||||||
Dollar amount offered |
| $ | 19,537 |
|
|
|
|
|
| $ | 13,000 |
|
|
|
|
|
| $ | 11,243 |
|
|
|
|
|
| $ | 5,350 |
|
|
|
|
|
| $ | 7,850 |
|
|
|
|
|
Dollar amount raised |
|
| 19,537 |
|
|
|
|
|
|
| 13,000 |
|
|
|
|
|
|
| 11,243 |
|
|
|
|
|
|
| 5,215 |
|
|
|
|
|
|
| 5,275 |
|
|
|
|
|
Dollar amount contributed from sponsor and affiliates(1) |
|
| 1,975 |
|
|
|
|
|
| — |
|
|
|
|
|
| — |
|
|
|
|
|
| — |
|
|
|
|
|
| 2,575 |
|
|
|
| |||||
Total dollar amount raised |
| $ | 21,512 |
|
|
| 100.00 | % |
| $ | 13,000 |
|
|
| 100.00 | % |
| $ | 11,243 |
|
|
| 100.00 | % |
| $ | 5,215 |
|
|
| 100.00 | % |
| $ | 7,850 |
|
|
| 100.00 | % |
Less offering expenses: |
|
|
|
|
|
|
|
|
|
|
|
|
|
|
|
|
|
|
|
|
|
|
|
|
|
|
|
|
|
|
|
|
|
|
|
|
|
|
|
|
Selling commissions and discounts retained by affiliates |
| $ | 1,196 |
|
|
| 5.56 | % |
| $ | 323 |
|
|
| 2.48 | % |
| $ | 666 |
|
|
| 5.92 | % |
| $ | 397 |
|
|
| 7.61 | % |
| $ | — |
|
|
| 0.00 | % |
Organizational expenses |
|
| — |
|
|
| 0.00 | % |
|
| — |
|
|
| 0.00 | % |
|
| — |
|
|
| 0.00 | % |
|
| — |
|
|
| 0.00 | % |
|
| — |
|
|
| 0.00 | % |
Other |
|
| — |
|
|
| 0.00 | % |
|
| — |
|
|
| 0.00 | % |
|
| — |
|
|
| 0.00 | % |
|
| — |
|
|
| 0.00 | % |
|
| — |
|
|
| 0.00 | % |
Reserves |
|
| — |
|
|
| 0.00 | % |
|
| — |
|
|
| 0.00 | % |
|
| — |
|
|
| 0.00 | % |
|
| — |
|
|
| 0.00 | % |
|
| — |
|
|
| 0.00 | % |
Available for investment |
| $ | 20,316 |
|
|
| 94.44 | % |
| $ | 12,677 |
|
|
| 97.52 | % |
| $ | 10,577 |
|
|
| 94.08 | % |
| $ | 4,818 |
|
|
| 92.39 | % |
| $ | 7,850 |
|
|
| 100.00 | % |
Acquisition costs: |
|
|
|
|
|
|
|
|
|
|
|
|
|
|
|
|
|
|
|
|
|
|
|
|
|
|
|
|
|
|
|
|
|
|
|
|
|
|
|
|
Prepaid items and fees related to purchased property |
| $ | — |
|
|
| 0.00 | % |
| $ | — |
|
|
| 0.00 | % |
| $ | — |
|
|
| 0.00 | % |
| $ | — |
|
|
| 0.00 | % |
| $ | — |
|
|
| 0.00 | % |
Cash down payment |
|
| 11,302 |
|
|
| 52.54 | % |
|
| 9,086 |
|
|
| 69.89 | % |
|
| 9,895 |
|
|
| 88.01 | % |
|
| 4,780 |
|
|
| 91.66 | % |
|
| 5,440 |
|
|
| 69.30 | % |
Acquisition fees |
|
| 7,693 |
|
|
| 35.76 | % |
|
| 2,328 |
|
|
| 17.91 | % |
|
| 682 |
|
|
| 6.07 | % |
|
| — |
|
|
| 0.00 | % |
|
| 2,410 |
|
|
| 30.70 | % |
Other |
|
| — |
|
|
| 0.00 | % |
|
| — |
|
|
| 0.00 | % |
|
| — |
|
|
| 0.00 | % |
|
| — |
|
|
| 0.00 | % |
|
| — |
|
|
| 0.00 | % |
Total acquisition costs |
| $ | 18,995 (2) |
|
|
| 88.30 | % |
| $ | 11,414 (3) |
|
|
| 87.80 | % |
| $ | 10,577 | (4) |
|
| 94.08 | % |
| $ | 4,780 (5) |
|
|
| 91.66 | % |
| $ | 7,850 (6) |
|
|
| 100.00 | % |
A-14
Percentage leverage (mortgage financing divided by total acquisition costs) |
|
| 434.97 | % |
|
|
|
|
|
| 292.61 | % |
|
|
|
|
|
| 141.19 | % |
|
|
|
|
|
| 344.35 | % |
|
|
|
|
|
| 253.20 | % |
|
|
|
|
Date offering began |
|
| 6/09/2008 |
|
|
|
|
|
|
| 9/17/2008 |
|
|
|
|
|
|
| 9/29/2009 |
|
|
|
|
|
|
| 6/23/2011 |
|
|
|
|
|
|
| 7/24/2008 |
|
|
|
|
|
Number of offerings in the year |
|
| 1 |
|
|
|
|
|
|
| 1 |
|
|
|
|
|
|
| 1 |
|
|
|
|
|
|
| 1 |
|
|
|
|
|
|
| 1 |
|
|
|
|
|
Length of offerings (in months) |
|
| 7 |
|
|
|
|
|
|
| 4 |
|
|
|
|
|
|
| 3 |
|
|
|
|
|
|
| 4 |
|
|
|
|
|
|
| 1 |
|
|
|
|
|
Months to invest 90% of amount available for investment (from the beginning of the offering) |
|
| 7 |
|
|
|
|
|
|
| 4 |
|
|
|
|
|
|
| 3 |
|
|
|
|
|
|
| 4 |
|
|
|
|
|
|
| 1 |
| (1) | Includes separate investment contributed by sponsor and affiliates for purchase of portfolio properties and related expenses. |
| (2) | Total acquisition costs of properties exclude $82.6 million purchased with mortgage financing. Including borrowings, the total acquisition purchase price was $101.6 million. The leverage ratio was 83.6% at December 31, 2010. This program ended when it contributed its real estate assets and certain liabilities to American Realty Capital Properties, Inc. on September 6, 2011. |
| (3) | Total acquisition costs of properties exclude $33.4 million purchased with mortgage financing. Including borrowings, the total acquisition purchase price was $101.6 million. The leverage ratio was 60.1% at December 31, 2010. This program ended when the notes were repaid on May 16, 2011. The related properties were owned by American Realty Capital Trust, Inc. on December 31, 2012. |
| (4) | Total acquisition costs of properties exclude $14.9 million purchased with mortgage financing and $3.5 million related to a final purchase price adjustment which was initially held in escrow until conditions for its release were satisfied in 2010. Including borrowings, the total acquisition purchase price was $25.9 million. The leverage ratio was 59.2% at December 31, 2010. This program ended when it contributed its real estate assets and certain liabilities to American Realty Capital Properties, Inc. on September 6, 2011. |
| (5) | Total acquisition costs of properties exclude a $16.5 million purchased with assumed mortgage financing. Including borrowings, the total acquisition purchase price was $21.2 million. The leverage ratio was 77.5% at December 31, 2011. |
| (6) | Total acquisition costs of properties exclude a $20.0 million purchased with assumed mortgage financing. Including borrowings and $36.3 million purchased with proceeds from the sale of properties, the total acquisition purchase price was $63.6 million. The program was concluded at December 31, 2010. |
A-15
TABLE II
COMPENSATION TO SPONSOR FROM PUBLIC PROGRAM PROPERTIES
Table II summarizes the amount and type of compensation paid to the parent of our AR Capital sponsor and its affiliates for American Realty Capital Trust, Inc. from its inception on August 17, 2007 to December 31, 2011, the year before termination and American Realty Capital Trust III, Inc. from its inception on October 15, 2010 to December 31, 2012, its year before termination.
|
| |||||||
(dollars in thousands) |
| American Realty Capital Trust, Inc. |
| American Realty Capital Trust III, Inc. | ||||
Date offering commenced |
|
| 3/18/2008 |
|
|
| 3/31/2011 |
|
Dollar amount raised |
| $ | 1,733,273 |
|
| $ | 1,750,291 |
|
Amount paid to sponsor from proceeds of offering |
|
|
|
|
|
|
|
|
Underwriting fees |
| $ | 168,269 |
|
| $ | 170,433 |
|
Acquisition fees: |
|
|
|
|
|
|
|
|
Real estate commissions |
| $ | — |
|
| $ | — |
|
Advisory fees – acquisition fees |
|
| 21,281 |
|
|
| 15,298 |
|
Other – organizational and offering costs |
|
| 15,944 |
|
|
| 20,464 |
|
Other – financing coordination fees |
|
| 9,257 |
|
|
| 3,029 |
|
Other – acquisition expense reimbursements |
|
| 11,921 |
|
|
| 10,779 |
|
Dollar amount of cash generated from operations before deducting payments to sponsor |
| $ | 60,876 |
|
| $ | 4,365 |
|
Actual amount paid to sponsor from operations: |
|
|
|
|
|
|
|
|
Property management fees |
| $ | — |
|
| $ | — |
|
Partnership management fees |
|
| — |
|
|
| — |
|
Reimbursements |
|
| — |
|
|
| — |
|
Leasing commissions |
|
| — |
|
|
| — |
|
Other (asset management fees) |
|
| 7,071 |
|
|
| 212 |
|
Total amount paid to sponsor from operations |
| $ | 7,071 |
|
| $ | 212 |
|
Dollar amount of property sales and refinancing before deducting payment to sponsor |
|
|
|
|
|
|
|
|
Cash |
| $ | 1,485 |
|
| $ | — |
|
Notes |
|
| — |
|
|
| — |
|
Amount paid to sponsor from property sale and refinancing: |
|
|
|
|
|
|
|
|
Real estate commissions |
| $ | 45 |
|
| $ | — |
|
Incentive fees |
|
| — |
|
|
| — |
|
Other – Financing coordination fees |
| $ | — |
|
| $ | — |
|
A-16
TABLE II
COMPENSATION TO SPONSOR FROM NON-PUBLIC PROGRAM PROPERTIES
Table II summarizes the amount and type of compensation paid to our AR Capital sponsor and its affiliates for ARC Income Properties, LLC from its inception on June 5, 2008 to its termination on September 6, 2011, ARC Income Properties II, LLC from its inception on August 12, 2008 to its termination on May 16, 2011, ARC Income Properties III, LLC from its inception on September 29, 2009 to its termination on September 6, 2011. ARC Income Properties IV, LLC from its inception on June 23, 2010 to December 31, 2011 and ARC Growth Fund, LLC. from its inception on July 24, 2008 to its termination on December 31, 2010.
|
|
|
|
| ||||||||||||||||
(dollars in thousands) |
| ARC Income Properties, LLC |
| ARC Income Properties II, LLC |
| ARC Income Properties III, LLC |
| ARC Income Properties IV, LLC |
| ARC Growth Fund, LLC | ||||||||||
Date offering commenced |
|
| 6/05/2008 |
|
|
| 8/12/2008 |
|
|
| 9/29/2009 |
|
|
| 6/23/2011 |
|
|
| 7/24/2008 |
|
Dollar amount raised |
| $ | 21,512 | (1) |
| $ | 13,000 | (2) |
| $ | 11,243 | (2) |
| $ | 5,215 | (2) |
| $ | 7,850 | (3) |
Amount paid to sponsor from proceeds of offering |
|
|
|
|
|
|
|
|
|
|
|
|
|
|
|
|
|
|
|
|
Underwriting fees |
| $ | 785 |
|
| $ | 323 |
|
| $ | 666 |
|
| $ | 397 |
|
| $ | — |
|
Acquisition fees |
|
|
|
|
|
|
|
|
|
|
|
|
|
|
|
|
|
|
|
|
Real estate commissions |
| $ | — |
|
| $ | — |
|
| $ | — |
|
| $ | — |
|
| $ | — |
|
Advisory fees – acquisition fees |
| $ | 2,959 |
|
| $ | 423 |
|
| $ | 662 |
|
| $ | — |
|
| $ | 1,316 |
|
Other – organizational and offering costs |
| $ | — |
|
| $ | — |
|
| $ | — |
|
| $ | — |
|
| $ | — |
|
Other – financing coordination fees |
| $ | 939 |
|
| $ | 333 |
|
| $ | 149 |
|
| $ | — |
|
| $ | 45 |
|
Dollar amount of cash generated from operations before deducting payments to sponsor |
| $ | (3,091 | ) |
| $ | 2,291 |
|
| $ | (724 | ) |
| $ | (691 | ) |
| $ | (5,325 | ) |
Actual amount paid to sponsor from operations: |
|
|
|
|
|
|
|
|
|
|
|
|
|
|
|
|
|
|
|
|
Property management fees |
| $ | — |
|
| $ | — |
|
| $ | — |
|
| $ | — |
|
| $ | — |
|
Partnership management fees |
|
| — |
|
|
| — |
|
|
| — |
|
|
| — |
|
|
| — |
|
Reimbursements |
|
| — |
|
|
| — |
|
|
| — |
|
|
| — |
|
|
| — |
|
Leasing commissions |
|
| — |
|
|
| — |
|
|
| — |
|
|
| — |
|
|
| — |
|
Other (explain) |
|
| — |
|
|
| — |
|
|
| — |
|
|
| — |
|
|
| — |
|
A-17
Total amount paid to sponsor from operations |
| $ | — |
|
| $ | — |
|
| $ | — |
|
| $ | — |
|
| $ | — |
|
Dollar amount of property sales and refinancing before deducting payment to sponsor |
|
|
|
|
|
|
|
|
|
|
|
|
|
|
|
|
|
|
|
|
Cash |
| $ | — |
|
| $ | — |
|
| $ | — |
|
| $ | — |
|
| $ | 13,560 |
|
Notes |
|
| — |
|
|
| — |
|
|
| — |
|
|
| — |
|
| 18,281 |
| |
Amount paid to sponsor from property sale and refinancing: |
|
|
|
|
|
|
|
|
|
|
|
|
|
|
|
|
|
|
|
|
Real estate commissions |
|
| — |
|
|
| — |
|
|
| — |
|
|
| — |
|
|
| — |
|
Incentive fees |
|
| — |
|
|
| — |
|
|
| — |
|
|
| — |
|
|
| — |
|
Other (disposition fees) |
|
| — |
|
|
| — |
|
|
| — |
|
|
| — |
|
| 1,169 |
| |
Other (refinancing fees) |
|
| — |
|
|
| — |
|
|
| — |
|
|
| — |
|
| 39 |
|
(1) Includes $19.5 million raised from investors and $2.0 million raised from sponsor and affiliates.
(2) Amounts raised from investors.
(3) Includes $5.2 million raised from investors and $2.6 million raised from the sponsor and affiliates.
A-18
TABLE III
OPERATING RESULTS OF PUBLIC PROGRAM PROPERTIES
Table III summarizes the operating results of American Realty Capital Trust, Inc. from its inception on August 17, 2007 to December 31, 2011, its last year before termination and American Realty Capital Trust III, Inc. from its inception on October 15, 2010 to December 31, 2012, its last year before termination. Information is provided as to the manner in which the proceeds of the offering have been applied, the timing and length of this offering and the time period over which the proceeds have been reinvested.
|
|
|
|
|
|
| ||||||||||||||||||||||
| American Realty Capital Trust, Inc. |
| American Realty Capital Trust III, Inc. | |||||||||||||||||||||||||
(dollars in thousands) |
| Year Ended December 31, |
| Year Ended December 31, |
| Year Ended December 31, 2009 |
| Year Ended December 31, 2008 |
| Year Ended December 31, 2012 |
| Year Ended December 31, 2011 |
| Period From | ||||||||||||||
Gross revenues |
| $ | 129,982 |
|
| $ | 45,233 |
|
| $ | 15,511 |
|
| $ | 5,549 |
|
| $ | 49,971 |
|
| $ | 795 |
|
| $ | — |
|
Profit (loss) on sales of properties |
|
| (44 | ) |
|
| 143 |
|
|
| — |
|
|
| — |
|
|
| — |
|
|
| — |
|
|
| — |
|
Less: |
|
|
|
|
|
|
|
|
|
|
|
|
|
|
|
|
|
|
|
|
|
|
|
|
|
|
|
|
Operating expenses |
|
| 45,041 |
|
|
| 15,265 |
|
|
| 1,158 |
|
|
| 2,002 |
|
|
| 44,202 |
|
|
| 2,385 |
|
|
| — |
|
Interest expense |
|
| 39,912 |
|
|
| 18,109 |
|
|
| 10,352 |
|
|
| 4,774 |
|
|
| 6,542 |
|
|
| 35 |
|
|
| — |
|
Depreciation |
|
| 54,764 |
|
|
| 17,280 |
|
|
| 6,581 |
|
|
| 2,534 |
|
|
| 25,524 |
|
|
| 414 |
|
|
| — |
|
Amortization |
|
| 14,176 |
|
|
| 4,374 |
|
|
| 1,735 |
|
|
| 522 |
|
|
| 5,854 |
|
|
| 85 |
|
|
| — |
|
Net loss before noncontrolling interests – GAAP Basis |
|
| (23,955 | ) |
|
| (9,652 | ) |
|
| (4,315 | ) |
|
| (4,283 | ) |
|
| (32,151 | ) |
|
| (2,124 | ) |
|
| — |
|
Loss from discontinued operations |
|
| — |
|
|
| — |
|
|
| — |
|
|
| — |
|
|
| — |
|
|
| — |
|
|
| — |
|
Net income (loss) attributable to noncontrolling interests – GAAP Basis |
|
| (1,121 | ) |
|
| (181 | ) |
|
| 49 |
|
|
| — |
|
|
| 30 |
|
|
| — |
|
|
| — |
|
Net loss GAAP basis |
| $ | (25,076 | ) |
| $ | (9,833 | ) |
| $ | (4,266 | ) |
| $ | (4,283 | ) |
| $ | (32,121 | ) |
| $ | (2,124 | ) |
| $ | — |
|
Taxable income (loss) |
|
|
|
|
|
|
|
|
|
|
|
|
|
|
|
|
|
|
|
|
|
|
|
|
|
|
|
|
From operations |
| $ | (25,032 | ) |
| $ | (9,976 | ) |
| $ | (4,266 | ) |
| $ | (4,283 | ) |
| $ | (32,121 | ) |
| $ | (2,124 | ) |
| $ | — |
|
From gain (loss) on sale |
|
| (44 | ) |
|
| 143 |
|
|
| — |
|
|
| — |
|
|
| — |
|
|
| — |
|
|
| — |
|
Cash generated (deficiency) from (used by) operations(1) |
|
| 49,525 |
|
|
| 9,864 |
|
| (2,526 | ) |
| 4,013 |
|
|
| 5,542 |
|
|
| (1,177 | ) |
|
| — |
| ||
Cash generated from sales |
|
| 581 |
|
|
| 900 |
|
|
| — |
|
|
| — |
|
|
| — |
|
|
| — |
|
|
| — |
|
Cash generated from refinancing |
|
| — |
|
|
| — |
|
|
| — |
|
|
| — |
|
|
| 224,300 |
|
|
| 5,060 |
|
|
| — |
|
A-19
Cash generated (deficiency) from operations, sales and refinancing |
| $ | 50,106 |
|
| $ | 10,764 |
|
| $ | (2,526 | ) |
| $ | 4,013 |
|
| $ | 229,842 |
|
| $ | 3,883 |
|
| $ | — |
|
Less: Cash distribution to investors |
|
|
|
|
|
|
|
|
|
|
|
|
|
|
|
|
|
|
|
|
|
|
|
|
|
|
|
|
From operating cash flow |
| $ | 47,524 |
|
| $ | 9,864 |
|
| $ | 1,818 |
|
| $ | 296 |
|
| $ | 5,542 |
|
| $ | — |
|
| $ | — |
|
From sales and refinancing |
|
| — |
|
|
| 900 |
|
|
| — |
|
|
| — |
|
|
| 23,285 |
|
|
| 294 |
|
|
| — |
|
From other(2) |
|
| — |
|
|
| 647 |
|
|
| 70 |
|
|
| — |
|
|
| 26,784 |
|
|
| 271 |
|
|
| — |
|
Cash generated (deficiency) after cash distributions |
| $ | 2,582 |
|
| $ | (647 | ) |
| $ | (4,414 | ) |
| $ | 3,717 |
|
| $ | 174,231 |
|
| $ | 3,318 |
|
| $ | — |
|
Less: Special items |
|
|
|
|
|
|
|
|
|
|
|
|
|
|
|
|
|
|
|
|
|
|
|
|
|
| ||
Cash generated (deficiency) after cash distributions and special items |
| $ | 2,582 |
|
| $ | (647 | ) |
| $ | (4,414 | ) |
| $ | 3,717 |
|
| $ | 174,231 |
|
| $ | 3,318 |
|
| $ | — |
|
Tax and distribution data per $1,000 invested |
|
|
|
|
|
|
|
|
|
|
|
|
|
|
|
|
|
|
|
|
|
|
|
|
|
|
|
|
Federal income tax results:(3)(4) |
|
|
|
|
|
|
|
|
|
|
|
|
|
|
|
|
|
|
|
|
|
|
|
|
|
|
|
|
Ordinary income (loss) |
|
|
|
|
|
|
|
|
|
|
|
|
|
|
|
|
|
|
|
|
|
|
|
|
|
| ||
from operations |
| $ | (19.00 | ) |
| $ | (23.55 | ) |
| $ | (22.75 | ) |
| $ | (0.33 | ) |
| $ | (13.96 | ) |
| $ | (4.04 | ) |
| $ | — |
|
from recapture |
|
| — |
|
|
| — |
|
|
| — |
|
|
| — |
|
|
| — |
|
|
| — |
|
|
| — |
|
Capital gain (loss) |
|
| — |
|
|
| — |
|
|
| — |
|
|
| — |
|
|
| — |
|
|
| — |
|
|
| — |
|
Cash distributions to investors |
|
|
|
|
|
|
|
|
|
|
|
|
|
|
|
|
|
|
|
|
|
|
|
|
| |||
Source (on GAAP Basis) |
|
|
|
|
|
|
|
|
|
|
|
|
|
|
|
|
|
|
|
|
|
|
|
|
| |||
Investment income |
| $ | — |
|
| $ | 1.44 |
|
| $ | — |
|
| $ | — |
|
| $ | — |
|
| $ | — |
|
| $ | — |
|
Return of capital |
|
| 43.51 |
|
|
| 16.78 |
|
|
| (13.06 | ) |
|
| 1.22 |
|
|
| 31.77 |
|
|
| 5.52 |
|
|
| — |
|
Source (on GAAP basis) |
|
|
|
|
|
|
|
|
|
|
|
|
|
|
|
|
|
|
|
|
|
|
|
|
| |||
Sales |
| $ | — |
|
| $ | 1.44 |
|
| $ | — |
|
| $ | — |
|
| $ | — |
|
| $ | — |
|
| $ | — |
|
Refinancing |
|
| — |
|
|
| — |
|
|
| — |
|
|
| — |
|
|
| 13.30 |
|
|
| 2.87 |
|
|
| — |
|
Operations |
|
| 43.51 |
|
|
| 15.75 |
|
|
| 12.57 |
|
|
| 1.22 |
|
|
| 3.17 |
|
|
| — |
|
|
| — |
|
Other |
|
| — |
|
|
| — |
|
|
| — |
|
|
| — |
|
|
| 15.30 |
|
|
| 2.65 |
|
|
| — |
|
| (1) | Includes cash paid for interest and acquisition costs |
| (2) | Distributions paid from proceeds from the sale of common stock and through distribution reinvestment plan. |
| (3) | Based on amounts raised as of the end of each period. |
| (4) | Federal tax results for the year ended December 31, 2012 are not available as of the date of this filing. Extensions of time to file tax returns of the year ended December 31, 2012 have been filed for each program, and estimated information is provided for all programs based on preliminary tax returns by outside accountants. |
A-20
TABLE III
OPERATING RESULTS OF NON-PUBLIC PROGRAM PROPERTIES
Table III summarizes the consolidated operating results of ARC Income Properties, LLC, ARC Income Properties II, LLC, ARC Income Properties III, LLC, ARC Income Properties IV, LLC, and ARC Growth Fund, LLC as of the dates indicated.
|
|
|
|
|
|
|
|
|
|
|
|
|
|
|
|
|
|
|
|
|
|
|
|
|
|
|
|
|
|
|
|
|
|
|
|
|
|
|
|
|
|
|
|
|
|
|
|
|
|
|
|
|
|
|
|
|
|
|
|
|
|
|
(dollars in thousands) |
| ARC Income Properties, LLC |
| ARC Income Properties II, LLC |
| ARC Income Properties III, LLC | ARC Income Properties IV, LLC |
| ARC Growth Fund, LLC | |||||||||||||||||||||||||||||||||||||||||||||||||||||
|
| Period from January 1, 2011 to September 6, 2011(1) |
| Year Ended December 31, 2010 |
| Year Ended December 31, 2009 |
| Period from June 5, 2008 (Date of Inception) to December 31, 2008 |
| Five Months ended |
| Year Ended December 31, 2010 |
| Year Ended December 31, 2009 |
| Period from August 12, 2008 to December 31, 2008 |
| Period from January 1, 2011 to September 6, 2011(1) |
| Year Ended December 31, 2010 |
| Period from September 29, 2009 to December 31, 2009 | Year Ended December 31, 2011 |
| June 24, 2010 (Date of Inception) to December 31, 2010 |
| Year Ended December 31, 2011 |
| Year Ended December 31, 2010 | Year | Period | |||||||||||||||||||||||||||||||
Gross revenues |
| $ | 4,652 |
|
| $ | 7,008 |
|
| $ | 5,347 |
|
| $ | 1,341 |
|
| $ | 1,383 |
|
| $ | 3,507 |
|
| $ | 3,423 |
|
| $ | 337 |
|
| $ | 1,548 |
|
| $ | 2,237 |
|
| $ | 341 |
| $ | 1,549 |
|
| $ | 94 |
|
| $ | — |
|
| $ | 95 |
| $ | 185 | $8 |
Profit (loss) on sales of properties |
|
| — |
|
|
| — |
|
|
| — |
|
|
| — |
|
|
| (44 | ) |
|
| 143 |
|
|
| — |
|
|
| — |
|
|
| — |
|
|
| — |
|
|
| — |
|
| — |
|
|
| — |
|
|
| — |
|
|
| (251 | ) | (4,682) | 9,746 | |
Less: |
|
|
|
|
|
|
|
|
|
|
|
|
|
|
|
|
|
|
|
|
|
|
|
|
|
|
|
|
|
|
|
|
|
|
|
|
|
|
|
|
|
|
|
|
|
|
|
|
|
|
|
|
|
|
|
|
|
|
|
|
| |
Operating expenses |
|
| 122 |
|
|
| 320 |
|
|
| 2,847 |
|
|
| 5 |
|
|
| 45 |
|
|
| 113 |
|
|
| 7 |
|
|
| — |
|
|
| 51 |
|
|
| 36 |
|
|
| 918 |
|
| 86 |
|
|
| 489 |
|
|
| — |
|
|
| 234 |
| 528 | 2,004 | |
Interest expense |
|
| 4,504 |
|
|
| 6,525 |
|
|
| 4,993 |
|
|
| 688 |
|
|
| 1,690 |
|
|
| 2,151 |
|
|
| 2,161 |
|
|
| 162 |
|
|
| 1,434 |
|
|
| 1,359 |
|
|
| 186 |
|
| 1,134 |
|
|
| 100 |
|
|
| — |
|
|
| — |
| 1,494 | 597 | |
Interest expense – investors notes |
|
| 1,323 |
|
|
| 1,935 |
|
|
| 1,583 |
|
|
| 381 |
|
|
| 430 |
|
|
| 1,167 |
|
|
| 1,024 |
|
|
| 11 |
|
|
| 671 |
|
|
| 986 |
|
|
| 201 |
|
| 446 |
|
|
| 90 |
|
|
| — |
|
|
| — |
|
| — | — |
Depreciation |
|
| 2,346 |
|
|
| 3,519 |
|
|
| 2,676 |
|
|
| 909 |
|
|
| 710 |
|
|
| 1,748 |
|
|
| 1,758 |
|
|
| 200 |
|
|
| 495 |
|
|
| 642 |
|
|
| 127 |
|
| 642 |
|
|
| 54 |
|
|
| — |
|
|
| 195 |
|
| 592 | 344 |
Amortization |
|
| 527 |
|
|
| 976 |
|
|
| 886 |
|
|
| — |
|
|
| 268 |
|
|
| 663 |
|
|
| 670 |
|
|
| — |
|
|
| 187 |
|
|
| 249 |
|
|
| 42 |
|
| 218 |
|
|
| 18 |
|
|
| — |
|
|
| — |
|
| — | — |
Net income (loss) – GAAP Basis |
| $ | (4,170 | ) |
| $ | (6,267 | ) |
| $ | (7,638 | ) |
| $ | (642 | ) |
| $ | (1,804 | ) |
| $ | (2,192 | ) |
| $ | (2,197 | ) |
| $ | (36 | ) |
| $ | (1,290 | ) |
| $ | (1,035 | ) |
| $ | (1,133 | ) | $ | (977 | ) |
| $ | (657 | ) |
| $ | — |
|
| $ | (585 | ) | $ | (7,111) | $6,809 |
Taxable income (loss) |
|
|
|
|
|
|
|
|
|
|
|
|
|
|
|
|
|
|
|
|
|
|
|
|
|
|
|
|
|
|
|
|
|
|
|
|
|
|
|
|
|
|
|
|
|
|
|
|
|
|
|
|
|
|
|
|
|
|
|
|
|
|
From operations |
|
| (4,170 | ) |
|
| (6,267 | ) |
|
| (7,638 | ) |
|
| (642 | ) |
| (1,760 | ) |
|
| (2,335 | ) |
|
| (2,197 | ) |
|
| (36 | ) |
|
| (1,290 | ) |
|
| (1,035 | ) |
|
| (1,133 | ) |
| (977 | ) |
|
| (443 | ) |
|
| — |
|
|
| (334 | ) |
| (2,429) | (2,937) | |
From gain (loss) on sale |
|
| — |
|
|
| — |
|
|
| — |
|
|
| — |
|
| (44 | ) |
|
| 143 |
|
|
| — |
|
|
| — |
|
|
| — |
|
|
| — |
|
|
| — |
|
| — |
|
|
| — |
|
|
| — |
|
|
| (251 | ) |
| (4,682) | 9,746 | |
Cash generated from (used by) operations(3) |
|
| (1,297 | ) |
|
| (1,896 | ) |
|
| (2,349 | ) |
|
| 1,154 |
|
| (782 | ) |
|
| 560 |
|
|
| (2,282 | ) |
|
| 4,013 |
|
|
| (608 | ) |
|
| (33 | ) |
|
| (691 | ) |
| (117 | ) |
|
| (691 | ) |
|
| — |
|
|
| (330 | ) |
| (1,769) | (3,226) | |
Cash generated from sales |
|
| — |
|
|
| — |
|
|
| — |
|
|
| — |
|
|
| — |
|
|
| 246 |
|
|
| — |
|
|
| — |
|
|
| — |
|
|
| — |
|
|
| — |
|
| — |
|
|
| — |
|
|
| — |
|
|
| — |
|
| (447) | 11,158 |
Cash generated from refinancing |
|
| — |
|
|
| — |
|
|
| — |
|
|
| — |
|
|
| — |
|
|
| — |
|
|
| — |
|
|
| — |
|
|
| — |
|
|
| — |
|
|
| — |
|
| — |
|
|
| — |
|
|
| — |
|
|
| — |
|
| — | — |
A-21
Cash generated from (used by) operations, sales and refinancing |
| $ | (1,297 | ) |
| $ | (1,896 | ) |
| $ | (2,349 | ) |
| $ | 1,154 |
|
| $ | (782 | ) |
| $ | 806 |
|
| $ | (2,282 | ) |
| $ | 4,013 |
|
| $ | (608 | ) |
| $ | (33 | ) |
| $ | (691 | ) | $ | (117 | ) |
| $ | (691 | ) |
| $ | — |
|
| $ | (330 | ) | $ | (2,216) | $7,932 |
Less: Cash interest payments made to investors |
|
|
|
|
|
|
|
|
|
|
|
|
|
|
|
|
|
|
|
|
|
|
|
|
|
|
|
|
|
|
|
|
|
|
|
|
|
|
|
|
|
|
|
|
|
|
|
|
|
|
|
|
|
|
|
|
|
|
|
|
|
|
From operating cash flow |
|
| — |
|
|
| — |
|
|
| — |
|
|
| — |
|
|
| — |
|
|
| — |
|
|
| — |
|
|
| — |
|
|
| — |
|
|
| — |
|
|
| — |
|
| — |
|
|
| — |
|
| — |
|
| — |
|
| — | — | ||
From sales and refinancing |
|
| — |
|
|
| — |
|
|
| — |
|
|
| — |
|
|
| — |
|
|
| — |
|
|
| — |
|
|
| — |
|
|
| — |
|
|
| — |
|
|
| — |
|
| — |
|
|
| — |
|
| — |
|
| — |
|
| — | — | ||
From other |
|
| — |
|
|
| — |
|
|
| — |
|
|
| — |
|
|
| — |
|
|
| — |
|
|
| — |
|
|
| — |
|
|
| — |
|
|
| — |
|
|
| — |
|
| — |
|
|
| — |
|
| — |
|
| — |
|
| — | — | ||
Cash generated after cash distributions |
| $ | (1,297 | ) |
| $ | (1,896 | ) |
| $ | (2,349 | ) |
| $ | 1,154 |
|
| $ | (782 | ) |
| $ | 806 |
|
| $ | (2,282 | ) |
| $ | 4,013 |
|
| $ | (608 | ) |
| $ | (33 | ) |
| $ | (691 | ) | $ | (117 | ) |
| $ | — |
|
| $ | (691 | ) |
| $ | (330 | ) | $ | (2,216) | $7,932 |
Less: Special items |
|
|
|
|
|
|
|
|
|
|
|
|
|
|
|
|
|
|
|
|
|
|
|
|
|
|
|
|
|
|
|
|
|
|
|
|
|
|
|
|
|
|
|
|
|
|
|
|
|
|
|
|
|
|
|
|
|
|
|
|
|
|
Cash generated after cash distributions and special items |
| $ | (1,297 | ) |
| $ | (1,896 | ) |
| $ | (2,349 | ) |
| $ | 1,154 |
|
| $ | (782 | ) |
| $ | 806 |
|
| $ | (2,282 | ) |
| $ | 4,013 |
|
| $ | (608 | ) |
| $ | (33 | ) |
| $ | (691 | ) | $ | (117 | ) |
| $ | — |
|
| $ | (691 | ) |
| $ | (330 | ) | $ | (2,216) | $7,932 |
| (1) | On September 6, 2011, the real estate assets and certain liabilities of ARC Income Properties, LLC and ARC Income Properties III, LLC were contributed in the formation transaction of ARC Properties, Inc. |
| (2) | The program ended on May 16, 2011, when the notes were repaid. These properties were owned by American Realty Capital Trust, Inc. on December 31, 2012. |
| (3) | Includes cash paid for interest, including interest payments to investors |
Non-public programs are combined with other entities for U.S. federal income tax reporting purposes, therefore, U.S. Federal income tax results for these programs are not presented.
A-22
TABLE IV
RESULTS OF COMPLETED PUBLIC PROGRAMS OF THE SPONSOR AND ITS AFFILIATES
Table IV includes the operations of American Realty Capital Trust, Inc., which completed its operations on March 1, 2012 when it listed its common stock on The NASDAQ Global Select Market and internalized its management.
| ||||
Program name |
| American Realty Capital Trust, Inc. | ||
Dollar amount raised |
| $ | 1,733,273,000 |
|
Number of properties purchased |
|
| 487 |
|
Date of closing of offering |
|
| 7/18/2011 |
|
Date of first sale of property |
|
| 3/1/2012 |
|
Date of final sale of property |
|
| 3/1/2012 |
|
Tax and distribution data per $1,000 invested through |
|
|
|
|
Federal income tax results: |
|
|
|
|
Ordinary income (loss) |
|
|
|
|
– from operations |
| $ | (46.96 | ) |
– from recapture |
|
| — |
|
Capital gain (loss) |
|
| 0.02 |
|
Deferred gain |
|
| — |
|
Capital |
|
| — |
|
Ordinary |
|
| — |
|
Cash distributions to investors |
|
|
|
|
Source (on GAAP Basis) |
|
|
|
|
– Investment income |
| $ | 1.44 |
|
– Return of capital |
|
| 47.74 |
|
Source (on cash basis) |
|
|
|
|
– Sales |
| $ | 1.44 |
|
– Refinancing |
|
| — |
|
– Operations |
|
| 47.74 |
|
– Other(1) |
|
| 10.49 |
|
Receivable on net purchase money financing |
|
| — |
|
(1) | American Realty Capital Trust, Inc.'s price per share was $10.49 on March 1, 2012, at the end of its first day of trading on the NASDAQ Global Select Market. |
A-23
TABLE IV
RESULTS OF COMPLETED NON-PUBLIC PROGRAMS OF THE SPONSOR AND ITS AFFILIATES
Table IV summarizes the results of ARC Income Properties, LLC, ARC Income Properties II, LLC, ARC Income Properties III, LLC and ARC Growth Fund, LLC, each a completed program of affiliates of our sponsor as of December 31, 2011.
(dollars in thousands) |
| ARC Income |
| ARC Income Properties II, LLC |
| ARC Income |
| ARC Growth | ||||||||
Dollar amount raised |
| $ | 21,512 |
|
| $ | 13,000 |
|
| $ | 11,243 |
|
| $ | 7,850 |
|
Number of properties purchased |
|
| 62 |
|
|
| 50 |
|
|
| 1 |
|
|
| 52 |
|
Date of closing of offering |
|
| June 2008 |
|
|
| September 2008 |
|
|
| September 2009 |
|
|
| July 2008 |
|
Date of first sale of property |
|
| September 2011(2) |
|
|
| May 2011(3) |
|
|
| September 2011(2) |
|
|
| July 2008 |
|
Date of final sale of property |
|
| September 2011(2) |
|
|
| May 2011(3) |
|
|
| September 2011(2) |
|
|
| December 2010 |
|
Tax and distribution data per $1,000 investment through 12/31/2010(1) |
|
|
|
|
|
|
|
|
|
|
|
|
|
|
|
|
Federal income tax results: |
|
|
|
|
|
|
|
|
|
|
|
|
|
|
|
|
Ordinary income (loss) |
|
|
|
|
|
|
|
|
|
|
|
|
|
|
|
|
- From operations |
| $ | — |
|
| $ | — |
|
| $ | — |
|
| $ | — |
|
- From recapture |
| $ | — |
|
| $ | — |
|
| $ | — |
|
| $ | — |
|
Capital gain (loss) |
| $ | — |
|
| $ | — |
|
| $ | — |
|
| $ | — |
|
Deferred gain |
| $ | — |
|
| $ | — |
|
| $ | — |
|
| $ | — |
|
Capital |
| $ | — |
|
| $ | — |
|
| $ | — |
|
| $ | — |
|
Ordinary |
| $ | — |
|
| $ | — |
|
| $ | — |
|
| $ | — |
|
Cash distributions to investors |
|
|
|
|
|
|
|
|
|
|
|
|
|
|
|
|
Source (on GAAP basis) |
|
|
|
|
|
|
|
|
|
|
|
|
|
|
|
|
- Investment income |
|
| — |
|
|
| — |
|
|
| — |
|
|
| — |
|
- Return of capital |
| $ | 19,537 |
|
| $ | 13,000 |
|
| $ | 11,243 |
|
| $ | 7,226 |
|
Source (on cash basis) |
|
|
|
|
|
|
|
|
|
|
|
|
|
|
|
|
- Sales |
| $ | 19,537 |
|
| $ | 13,000 |
|
| $ | 11,243 |
|
| $ | 7,226 |
|
- Refinancing |
| $ | — |
|
| $ | — |
|
| $ | — |
|
| $ | — |
|
- Operations |
| $ | — |
|
| $ | — |
|
| $ | — |
|
| $ | — |
|
- Other |
|
|
|
|
|
|
|
|
|
|
|
|
|
|
|
|
Receivable on net purchase money financing |
| $ | — |
|
| $ | — |
|
| $ | — |
|
| $ | — |
|
(1) Programs are combined with other entities for U.S. federal income tax reporting purposes, therefore, U.S. Federal income tax results for this program is not presented.
(2) The real estate assets and certain liabilities of these programs were contributed to ARC Properties, Inc. as part of its formation transaction.
(3) The notes used to purchase these properties were paid off in May 2011, these properties were owned by American Realty Capital Trust, Inc. on December 31, 2012.
A-24
TABLE V
SALES OR DISPOSALS OF PUBLIC PROGRAM PROPERTIES
(UNAUDITED)
Table V summarizes the sales or disposals of properties by American Realty Capital Trust, Inc. from its inception on August 17, 2007 to December 31, 2011, its last year before termination and American Realty Capital Trust III, Inc. from its inception on October 15, 2010 to December 31, 2012, its last year before termination. Information is provided as to the manner in which the proceeds of the offering have been applied, the timing and length of this offering and the time period over which the proceeds have been reinvested.
|
|
|
|
|
|
|
|
|
|
| ||||||||||||||||||||||||||||||||||
(dollars in thousands) | ||||||||||||||||||||||||||||||||||||||||||||
|
|
|
| Selling Price, Net of Closing costs and GAAP Adjustments |
| Cost of Properties Including |
| Excess | ||||||||||||||||||||||||||||||||||||
Property |
| Date |
| Date of Sale |
| Cash |
| Mortgage |
| Purchase |
| Adjustments |
| Total(3) |
| Original |
| Total |
| Total | ||||||||||||||||||||||||
American Realty Capital Trust, Inc.: |
| |||||||||||||||||||||||||||||||||||||||||||
PNC Bank Branch – New Jersey |
|
| November 2008 |
|
|
| September 2010 |
|
| $ | 388 |
|
| $ | 512 |
|
| $ | — |
|
| $ | — |
|
| $ | 900 |
|
| $ | 512 |
|
| $ | 187 |
|
| $ | 699 |
|
| $ | 1,035 |
|
PNC Bank Branch – New Jersey |
|
| November 2008 |
|
|
| January 2011 |
|
| $ | 79 |
|
| $ | 502 |
|
| $ | — |
|
| $ | — |
|
| $ | 581 |
|
| $ | 502 |
|
| $ | 178 |
|
| $ | 680 |
|
| $ | 1,305 |
|
American Realty Capital Trust III, Inc.: Not applicable
| (1) | No purchase money mortgages were taken back by the program. |
| (2) | Financial information was prepared in accordance with GAAP; therefore GAAP adjustments are not applicable. |
| (3) | All taxable gains were categorized as capital gains. None of these sales were reported on the installment basis. |
| (4) | Amounts shown do not include a pro rata share of the offering costs. There were no carried interests received in lieu of commissions in connection with the acquisition of the property. |
| (5) | Amounts exclude the amounts included under “Selling Price Net of Closing Costs and GAAP Adjustments” or “Costs of Properties Including Closing Costs and Soft Costs” and exclude costs incurred in administration of the program not related to the operations of the property. |
A-25
TABLE V
SALES OR DISPOSALS OF NON-PUBLIC PROGRAM PROPERTIES
(UNAUDITED)
Table V provides summary information on the results of sales or disposals of properties by non-public prior programs. All figures below are through December 31, 2012.
|
|
|
|
|
|
|
|
|
|
| ||||||||||||||||||||||||||||||||||
|
|
| Selling Price Net of Closing Costs and GAAP Adjustments |
| Costs of properties Including Closing Costs and Soft Costs |
| Excess | |||||||||||||||||||||||||||||||||||||
Property |
| Date |
| Date of Sale |
| Cash |
| Mortgage |
| Purchase |
| Adjustments |
| Total(4) |
| Original |
| Total |
| Total | ||||||||||||||||||||||||
ARC Income Properties, LLC: |
|
|
|
|
|
|
|
|
|
|
|
|
|
|
|
|
|
|
|
|
|
|
|
|
|
|
|
|
|
|
|
|
|
|
|
| ||||||||
Citizens Bank branches(1) |
|
| July to |
|
|
| September-11 |
|
| $ | 23,300 |
|
| $ | 82,622 |
|
| $ | — |
|
| $ | — |
|
| $ | 105,922 |
|
| $ | 96,883 |
|
| $ | 4,734 |
|
| $ | 101,617 |
|
| $ | 6,815 |
|
ARC Income Properties II, LLC: |
|
|
|
|
|
|
|
|
|
|
|
|
|
|
|
|
|
|
|
|
|
|
|
|
|
|
|
|
|
|
|
|
|
|
|
| ||||||||
PNC Bank Branch – New Jersey |
|
| November-08 |
|
|
| September-10 |
|
| $ | 388 |
|
| $ | 512 |
|
| $ | — |
|
| $ | — |
|
| $ | 900 |
|
| $ | 512 |
|
| $ | 187 |
|
| $ | 699 |
|
| $ | 1,035 |
|
PNC Bank Branch – New Jersey |
|
| November-08 |
|
|
| January-11 |
|
|
| 79 |
|
|
| 502 |
|
|
| — |
|
|
| — |
|
|
| 581 |
|
|
| 502 |
|
|
| 178 |
|
|
| 680 |
|
|
| 1,305 |
|
|
|
|
|
|
|
|
| $ | 467 |
|
| $ | 1,014 |
|
| $ | — |
|
| $ | — |
|
| $ | 1,481 |
|
| $ | 1,014 |
|
| $ | 365 |
|
| $ | 1,379 |
|
| $ | 2,340 |
| ||
ARC Income Properties III, LLC: |
|
|
|
|
|
|
|
|
|
|
|
|
|
|
|
|
|
|
|
|
|
|
|
|
|
|
|
|
|
|
|
|
|
|
|
| ||||||||
Home Depot(1) |
|
| November-09 |
|
|
| September-11 |
|
| $ | 11,325 |
|
| $ | 13,850 |
|
| $ | — |
|
| $ | — |
|
| $ | 25,175 |
|
| $ | 25,925 |
|
| $ | 20 |
|
| $ | 25,945 |
|
| $ | 2,288 |
|
ARC Growth Fund, LLC: |
|
|
|
|
|
|
|
|
|
|
|
|
|
|
|
|
|
|
|
|
|
|
|
|
|
|
|
|
|
|
|
|
|
|
|
|
|
|
|
| ||||
Bayonet Point, FL |
|
| July-08 |
|
|
| July-08 |
|
| $ | 628 |
|
| $ | — |
|
| $ | — |
|
| $ | — |
|
| $ | 628 |
|
| $ | — |
|
| $ | 642 |
|
| $ | 642 |
|
| $ | — |
|
Boca Raton, FL |
|
| July-08 |
|
|
| July-08 |
|
|
| 2,434 |
|
|
| — |
|
|
| — |
|
|
| — |
|
|
| 2,434 |
|
|
| — |
|
|
| 2,000 |
|
|
| 2,000 |
|
|
| — |
|
Bonita Springs, FL |
|
| July-08 |
|
|
| May-09 |
|
|
| (459 | ) |
|
| 1,207 |
|
|
| — |
|
|
| — |
|
|
| 748 |
|
|
| 1,207 |
|
|
| 543 |
|
|
| 1,750 |
|
|
| (29 | ) |
Clearwater, FL |
|
| July-08 |
|
|
| September-08 |
|
|
| 253 |
|
|
| 539 |
|
|
| — |
|
|
| — |
|
|
| 792 |
|
|
| 539 |
|
|
| 371 |
|
|
| 910 |
|
|
| (3 | ) |
Clearwater, FL |
|
| July-08 |
|
|
| October-08 |
|
|
| (223 | ) |
|
| 582 |
|
|
| — |
|
|
| — |
|
|
| 359 |
|
|
| 582 |
|
|
| 400 |
|
|
| 982 |
|
|
| (3 | ) |
Destin, FL |
|
| July-08 |
|
|
| July-08 |
|
|
| 1,358 |
|
|
| — |
|
|
| — |
|
|
| — |
|
|
| 1,358 |
|
|
| — |
|
|
| 1,183 |
|
|
| 1,183 |
|
|
| — |
|
Englewood, FL |
|
| July-08 |
|
|
| November-08 |
|
|
| 138 |
|
|
| 929 |
|
|
| — |
|
|
| — |
|
|
| 1,067 |
|
|
| 929 |
|
|
| 632 |
|
|
| 1,561 |
|
|
| (13 | ) |
Fort Myers, FL |
|
| July-08 |
|
|
| July-08 |
|
|
| 2,434 |
|
|
| — |
|
|
| — |
|
|
| — |
|
|
| 2,434 |
|
|
| — |
|
|
| 1,566 |
|
|
| 1,566 |
|
|
| — |
|
Naples, FL |
|
| July-08 |
|
|
| July-08 |
|
|
| 2,727 |
|
|
| — |
|
|
| — |
|
|
| — |
|
|
| 2,727 |
|
|
| — |
|
|
| 1,566 |
|
|
| 1,566 |
|
|
| — |
|
Palm Coast, FL |
|
| July-08 |
|
|
| September-08 |
|
|
| 891 |
|
|
| 1,770 |
|
|
| — |
|
|
| — |
|
|
| 2,661 |
|
|
| 1,770 |
|
|
| -530 |
|
|
| 1,240 |
|
|
| (8 | ) |
Pompano Beach, FL |
|
| July-08 |
|
|
| October-08 |
|
|
| 1,206 |
|
|
| 2,162 |
|
|
| — |
|
|
| — |
|
|
| 3,368 |
|
|
| 2,162 |
|
|
| -411 |
|
|
| 1,751 |
|
|
| (8 | ) |
Port St. Lucie, FL |
|
| July-08 |
|
|
| August-09 |
|
|
| (60 | ) |
|
| 654 |
|
|
| — |
|
|
| — |
|
|
| 594 |
|
|
| 654 |
|
|
| 648 |
|
|
| 1,302 |
|
|
| (40 | ) |
Punta Gorda, FL |
|
| July-08 |
|
|
| July-08 |
|
|
| 2,337 |
|
|
| — |
|
|
| — |
|
|
| — |
|
|
| 2,337 |
|
|
| — |
|
|
| 2,143 |
|
|
| 2,143 |
|
|
| — |
|
A-26
Vero Beach, FL |
|
| July-08 |
|
|
| February-09 |
|
|
| 87 |
|
|
| 830 |
|
|
| — |
|
|
| — |
|
|
| 917 |
|
|
| 830 |
|
|
| 565 |
|
|
| 1,395 |
|
|
| (13 | ) |
Cherry Hill, NJ |
|
| July-08 |
|
|
| July-08 |
|
|
| 1,946 |
|
|
| — |
|
|
| — |
|
|
| — |
|
|
| 1,946 |
|
|
| — |
|
|
| 2,225 |
|
|
| 2,225 |
|
|
| — |
|
Cranford, NJ |
|
| July-08 |
|
|
| July-08 |
|
|
| 1,453 |
|
|
| — |
|
|
| — |
|
|
| — |
|
|
| 1,453 |
|
|
| — |
|
|
| 725 |
|
|
| 725 |
|
|
| — |
|
Warren, NJ |
|
| July-08 |
|
|
| July-08 |
|
|
| 1,375 |
|
|
| — |
|
|
| — |
|
|
| — |
|
|
| 1,375 |
|
|
| — |
|
|
| 1,556 |
|
|
| 1,556 |
|
|
| — |
|
Westfield, NJ |
|
| July-08 |
|
|
| July-08 |
|
|
| 2,539 |
|
|
| — |
|
|
| — |
|
|
| — |
|
|
| 2,539 |
|
|
| — |
|
|
| 2,230 |
|
|
| 2,230 |
|
|
| — |
|
Lehigh Acres, FL |
|
| July-08 |
|
|
| August-09 |
|
|
| (207 | ) |
|
| 758 |
|
|
| — |
|
|
| — |
|
|
| 551 |
|
|
| 758 |
|
|
| 752 |
|
|
| 1,510 |
|
|
| (28 | ) |
Alpharetta, GA |
|
| July-08 |
|
|
| December-08 |
|
|
| 98 |
|
|
| 914 |
|
|
| — |
|
|
| — |
|
|
| 1,012 |
|
|
| 914 |
|
|
| 617 |
|
|
| 1,531 |
|
|
| (9 | ) |
Atlanta, GA |
|
| July-08 |
|
|
| September-08 |
|
|
| 825 |
|
|
| 1,282 |
|
|
| — |
|
|
| — |
|
|
| 2,107 |
|
|
| 1,282 |
|
|
| 862 |
|
|
| 2,144 |
|
|
| (27 | ) |
Columbus, GA |
|
| July-08 |
|
|
| December-08 |
|
|
| (43 | ) |
|
| 111 |
|
|
| — |
|
|
| — |
|
|
| 68 |
|
|
| 111 |
|
|
| 85 |
|
|
| 196 |
|
|
| (3 | ) |
Duluth, GA |
|
| July-08 |
|
|
| July-08 |
|
|
| 1,851 |
|
|
| — |
|
|
| — |
|
|
| — |
|
|
| 1,851 |
|
|
| — |
|
|
| 1,457 |
|
|
| 1,457 |
|
|
| — |
|
Oakwood, GA |
|
| July-08 |
|
|
| September-08 |
|
|
| 49 |
|
|
| 898 |
|
|
| — |
|
|
| — |
|
|
| 947 |
|
|
| 898 |
|
|
| 607 |
|
|
| 1,505 |
|
|
| (1 | ) |
Riverdale, GA |
|
| July-08 |
|
|
| August-09 |
|
|
| (104 | ) |
|
| 471 |
|
|
| — |
|
|
| — |
|
|
| 367 |
|
|
| 471 |
|
|
| 286 |
|
|
| 757 |
|
|
| (12 | ) |
Laurinburg, NC |
|
| July-08 |
|
|
| July-08 |
|
|
| 188 |
|
|
| — |
|
|
| — |
|
|
| — |
|
|
| 188 |
|
|
| — |
|
|
| 197 |
|
|
| 197 |
|
|
| — |
|
Haworth, NJ |
|
| July-08 |
|
|
| July-08 |
|
|
| 1,781 |
|
|
| — |
|
|
| — |
|
|
| — |
|
|
| 1,781 |
|
|
| — |
|
|
| 1,834 |
|
|
| 1,834 |
|
|
| — |
|
Fredericksburg, VA |
|
| August-08 |
|
|
| August-08 |
|
|
| 2,432 |
|
|
| — |
|
|
| — |
|
|
| — |
|
|
| 2,432 |
|
|
| — |
|
|
| 2,568 |
|
|
| 2,568 |
|
|
| — |
|
Dallas, PA |
|
| August-08 |
|
|
| August-08 |
|
|
| 1,539 |
|
|
| — |
|
|
| — |
|
|
| — |
|
|
| 1,539 |
|
|
| — |
|
|
| 366 |
|
|
| 366 |
|
|
| — |
|
Virginia Beach, VA |
|
| August-08 |
|
|
| August-08 |
|
|
| 1,210 |
|
|
| — |
|
|
| — |
|
|
| — |
|
|
| 1,210 |
|
|
| — |
|
|
| 930 |
|
|
| 930 |
|
|
| — |
|
Baytown, TX |
|
| August-08 |
|
|
| August-08 |
|
|
| 3,205 |
|
|
| — |
|
|
| — |
|
|
| — |
|
|
| 3,205 |
|
|
| — |
|
|
| 1,355 |
|
|
| 1,355 |
|
|
| — |
|
Bradenton, FL |
|
| November-08 |
|
|
| November-08 |
|
|
| 778 |
|
|
| — |
|
|
| — |
|
|
| — |
|
|
| 778 |
|
|
| — |
|
|
| 748 |
|
|
| 748 |
|
|
| — |
|
Sarasota, FL |
|
| November-08 |
|
|
| November-08 |
|
|
| 1,688 |
|
|
| — |
|
|
| — |
|
|
| — |
|
|
| 1,688 |
|
|
| — |
|
|
| 867 |
|
|
| 867 |
|
|
| — |
|
Tuscaloosa, AL |
|
| November-08 |
|
|
| November-08 |
|
|
| 580 |
|
|
| — |
|
|
| — |
|
|
| — |
|
|
| 580 |
|
|
| — |
|
|
| 242 |
|
|
| 242 |
|
|
| — |
|
Palm Harbor, FL |
|
| November-08 |
|
|
| November-08 |
|
|
| 1,064 |
|
|
| — |
|
|
| — |
|
|
| — |
|
|
| 1,064 |
|
|
| — |
|
|
| 790 |
|
|
| 790 |
|
|
| — |
|
Reading, PA |
|
| November-08 |
|
|
| November-08 |
|
|
| 137 |
|
|
| — |
|
|
| — |
|
|
| — |
|
|
| 137 |
|
|
| — |
|
|
| 248 |
|
|
| 248 |
|
|
| — |
|
St. Augustine, FL |
|
| November-08 |
|
|
| November-08 |
|
|
| 1,936 |
|
|
| — |
|
|
| — |
|
|
| — |
|
|
| 1,936 |
|
|
| — |
|
|
| 1,428 |
|
|
| 1,428 |
|
|
| — |
|
Cumming, GA |
|
| December-08 |
|
|
| December-08 |
|
|
| 1,227 |
|
|
| — |
|
|
| — |
|
|
| — |
|
|
| 1,227 |
|
|
| — |
|
|
| 810 |
|
|
| 810 |
|
|
| — |
|
Suffolk, VA |
|
| December-08 |
|
|
| February-09 |
|
|
| 115 |
|
|
| 172 |
|
|
| — |
|
|
| — |
|
|
| 287 |
|
|
| 172 |
|
|
| 129 |
|
|
| 301 |
|
|
| (1) |
|
Titusville, FL |
|
| December-08 |
|
|
| December-08 |
|
|
| 321 |
|
|
| — |
|
|
| — |
|
|
| — |
|
|
| 321 |
|
|
| — |
|
|
| 260 |
|
|
| 260 |
|
|
| — |
|
West Caldwell, NJ(1) |
|
| December-08 |
|
|
| September-09 |
|
|
| 333 |
|
|
| 898 |
|
|
| — |
|
|
| — |
|
|
| 1,231 |
|
|
| 357 |
|
|
| 358 |
|
|
| 715 |
|
|
| 15 |
|
Palm Coast, FL |
|
| December-08 |
|
|
| December-08 |
|
|
| 507 |
|
|
| — |
|
|
| — |
|
|
| — |
|
|
| 507 |
|
|
| — |
|
|
| 599 |
|
|
| 599 |
|
|
| — |
|
Mableton, GA |
|
| December-08 |
|
|
| December-08 |
|
|
| 676 |
|
|
| — |
|
|
| — |
|
|
| — |
|
|
| 676 |
|
|
| — |
|
|
| 696 |
|
|
| 696 |
|
|
| — |
|
Warner Robins, GA |
|
| January-09 |
|
|
| January-09 |
|
|
| 149 |
|
|
| — |
|
|
| — |
|
|
| — |
|
|
| 149 |
|
|
| — |
|
|
| 257 |
|
|
| 257 |
|
|
| — |
|
Philadelphia(1) |
|
| January-09 |
|
|
| October-09 |
|
|
| 291 |
|
|
| 1,474 |
|
|
| — |
|
|
| — |
|
|
| 1,765 |
|
|
| 552 |
|
|
| 1,105 |
|
|
| 1,657 |
|
|
| 3 |
|
A-27
Stockholm, NJ |
|
| December-08 |
|
|
| November-09 |
|
|
| (29 | ) |
|
| 240 |
|
|
| — |
|
|
| — |
|
|
| 211 |
|
|
| 240 |
|
|
| 438 |
|
|
| 678 |
|
|
| (46 | ) |
Sebastian, FL |
|
| July-08 |
|
|
| December-09 |
|
|
| (104 | ) |
|
| 654 |
|
|
| — |
|
|
| — |
|
|
| 550 |
|
|
| 654 |
|
|
| 1,302 |
|
|
| 1,956 |
|
|
| (102 | ) |
Fort Myers, FL |
|
| July-08 |
|
|
| December-09 |
|
|
| (314 | ) |
|
| 795 |
|
|
| — |
|
|
| — |
|
|
| 481 |
|
|
| 795 |
|
|
| 1,582 |
|
|
| 2,377 |
|
|
| (113 | ) |
Seminole, FL |
|
| July-08 |
|
|
| March-10 |
|
|
| — |
|
|
| 1,098 |
|
|
|
|
|
|
|
|
|
|
| 1,098 |
|
|
| 1,098 |
|
|
| 1,061 |
|
|
| 2,159 |
|
|
| (48 | ) |
Port Richey, FL(1) |
|
| July-08 |
|
|
| December-10 |
|
|
| — |
|
|
| 544 |
|
|
| — |
|
|
| — |
|
|
| 544 |
|
|
| 544 |
|
|
| 1,086 |
|
|
| 1,630 |
|
|
| (71 | ) |
Punta Gorda, FL(1) |
|
| July-08 |
|
|
| December-10 |
|
|
| — |
|
|
| 690 |
|
|
| — |
|
|
| — |
|
|
| 690 |
|
|
| 690 |
|
|
| 1,550 |
|
|
| 2,240 |
|
|
| (72 | ) |
Lawrenceville, GA(1) |
|
| July-08 |
|
|
| December-10 |
|
|
| — |
|
|
| 695 |
|
|
| — |
|
|
| — |
|
|
| 695 |
|
|
| 695 |
|
|
| 1,381 |
|
|
| 2,076 |
|
|
| (73 | ) |
Norristown, PA(1) |
|
| July-08 |
|
|
| December-10 |
|
|
| — |
|
|
| 471 |
|
|
| — |
|
|
| — |
|
|
| 471 |
|
|
| 471 |
|
|
| 943 |
|
|
| 1,414 |
|
|
| (83 | ) |
|
|
|
|
|
|
|
|
|
| $ | 43,243 |
|
| $ | 20,838 |
|
| $ | — |
|
| $ | — |
|
| $ | 64,081 |
|
| $ | 19,375 |
|
| $ | 47,850 |
|
| $ | 67,225 |
|
| $ | (788 | ) |
| (1) | Sale of property was to related party. |
| (2) | No purchase money mortgages were taken back by the program. |
| (3) | Financial information for programs was prepared in accordance with GAAP; therefore GAAP adjustments are not applicable. |
| (4) | All taxable gains were categorized as capital gains. None of these sales were reported on an installment basis. |
| (5) | Amounts shown do not include a pro rata share of the offering costs. There were no carried interests received in lieu of commissions on connection with the acquisition of property. |
| (6) | Amounts exclude the amounts included under “Selling Price Net of Closing Costs and GAAP Adjustments” or “Costs of Properties Including Closing Costs and Soft Costs” and exclude costs incurred in administration of the program not related to the operations of the property. |
A-28