
Q1 2017 Results Presentation InvestorRelations@PhillipsEdison.com www.grocerycenterREIT1.com DST: (888) 518-8073 Griffin Capital Securities: (866) 788-8614
2www.grocerycenterREIT1.com Agenda R. Mark Addy - President and COO • Portfolio & Results • Financials • Estimated value per share update

3www.grocerycenterREIT1.com Forward-Looking Statement Disclosure This presentation and the corresponding call may contain forward-looking statements within the meaning of Section 27A of the Securities Act of 1933 and Section 21E of the Securities Exchange Act of 1934. These statements include, but are not limited to, statements related to the Company’s expectations regarding the performance of its business, its financial results, its liquidity and capital resources, the quality of the Company’s portfolio of grocery anchored shopping centers and other non-historical statements. You can identify these forward-looking statements by the use of words such as “outlook,” “believes,” “expects,” “potential,” “continues,” “may,” “will,” “should,” “seeks,” “approximately,” “projects,” “predicts,” “intends,” “plans,” “estimates,” “anticipates,” or the negative version of these words or other comparable words. Such forward- looking statements are subject to various risks and uncertainties, such as the risks that retail conditions may adversely affect our base rent and, subsequently, our income, and that our properties consist primarily of retail properties and our performance, therefore, is linked to the market for retail space generally, as well as other risks described under the section entitled "Risk Factors" in the Company's Annual Report on Form 10-K for the year ended December 31, 2016, and the Company's Quarterly Report on Form 10-Q for the quarter ended March 31, 2017, as such factors may be updated from time to time in the Company’s periodic filings with the SEC, which are accessible on the SEC’s website at www.sec.gov. Accordingly, there are or will be important factors that could cause actual outcomes or results to differ materially from those indicated in these statements. These factors should not be construed as exhaustive and should be read in conjunction with the other cautionary statements that are included in this presentation, the corresponding call and in the Company’s filings with the SEC. The Company undertakes no obligation to publicly update or revise any forward-looking statement, whether as a result of new information, future events, or otherwise.
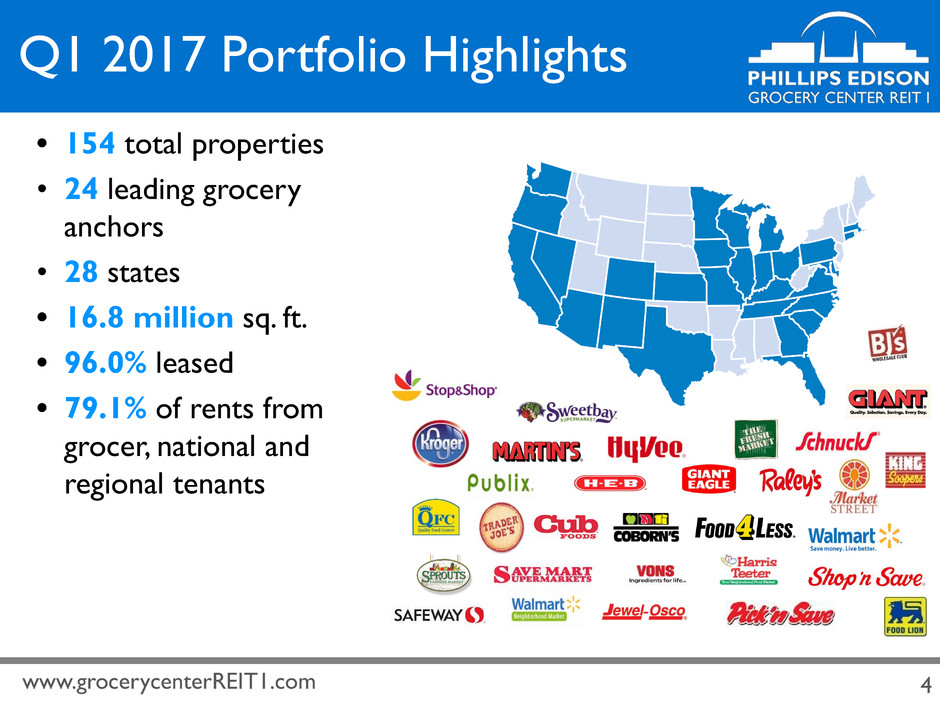
4www.grocerycenterREIT1.com Q1 2017 Portfolio Highlights • 154 total properties • 24 leading grocery anchors • 28 states • 16.8 million sq. ft. • 96.0% leased • 79.1% of rents from grocer, national and regional tenants
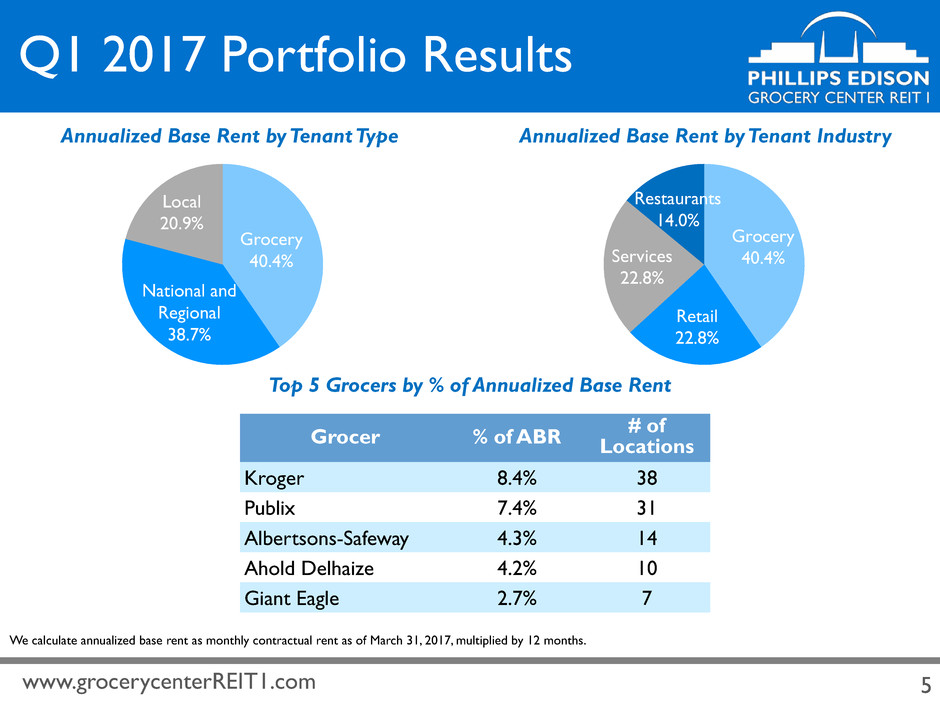
5www.grocerycenterREIT1.com Q1 2017 Portfolio Results Grocer % of ABR # ofLocations Kroger 8.4% 38 Publix 7.4% 31 Albertsons-Safeway 4.3% 14 Ahold Delhaize 4.2% 10 Giant Eagle 2.7% 7 Top 5 Grocers by % of Annualized Base Rent Annualized Base Rent by Tenant Type Annualized Base Rent by Tenant Industry We calculate annualized base rent as monthly contractual rent as of March 31, 2017, multiplied by 12 months. Grocery 40.4% National and Regional 38.7% Local 20.9% Grocery 40.4% Retail 22.8% Services 22.8% Restaurants 14.0%

6www.grocerycenterREIT1.com Q1 2017 Acquisition Highlights Name Location Grocer GLA Atwater Marketplace Atwater, California Save Mart 96,224 sq. ft. Atwater Marketplace
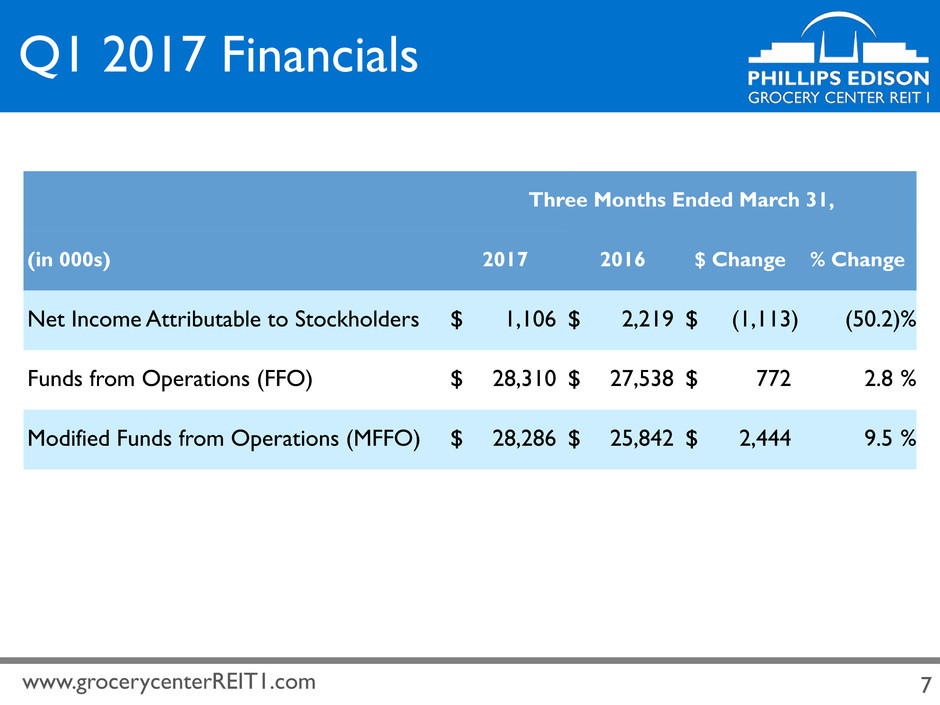
7www.grocerycenterREIT1.com Q1 2017 Financials Three Months Ended March 31, (in 000s) 2017 2016 $ Change % Change Net Income Attributable to Stockholders $ 1,106 $ 2,219 $ (1,113) (50.2)% Funds from Operations (FFO) $ 28,310 $ 27,538 $ 772 2.8 % Modified Funds from Operations (MFFO) $ 28,286 $ 25,842 $ 2,444 9.5 %

8www.grocerycenterREIT1.com Q1 2017 Same-Center(1) Net Operating Income (NOI) Three Months Ended March 31, (in 000s) 2017 2016 $ Change % Change Revenues: Rental income(2) $ 42,677 $ 41,374 $ 1,303 Tenant recovery income 14,051 14,468 (417) Other property income 204 151 53 56,932 55,993 939 1.7 % Operating expenses: Property operating expenses 9,295 9,181 114 Real estate taxes 8,261 8,555 (294) 17,556 17,736 (180) (1.0)% Total Same-Center NOI $ 39,376 $ 38,257 $ 1,119 2.9 % (1) Represents 137 properties that we owned and operated prior to January 1, 2016, excluding nine properties classified as redevelopment. (2) Excludes straight-line rental income, net amortization of above- and below-market leases, and lease buyout income.

9www.grocerycenterREIT1.com Q1 2017 Debt Profile • Debt to Enterprise Value: 36.2%* • Weighted-Average Interest Rate: 3.0% • Weighted-Average Years to Maturity: 3.2 • Fixed-Rate Debt: 77.1%** • Variable-Rate Debt: 22.9% *Calculated as net debt (total debt, excluding below-market debt adjustments and deferred financing costs, less cash and cash equivalents) as a percentage of enterprise value (equity value, calculated as total common shares and OP units outstanding multiplied by the estimated value per share of $10.20, plus net debt). **Includes $255 million of variable-rate debt that will be fixed through a forward starting interest rate swap agreement effective July 2017. Excluding the effect of this interest rate swap, 53.5% of the total debt was fixed-rate debt.
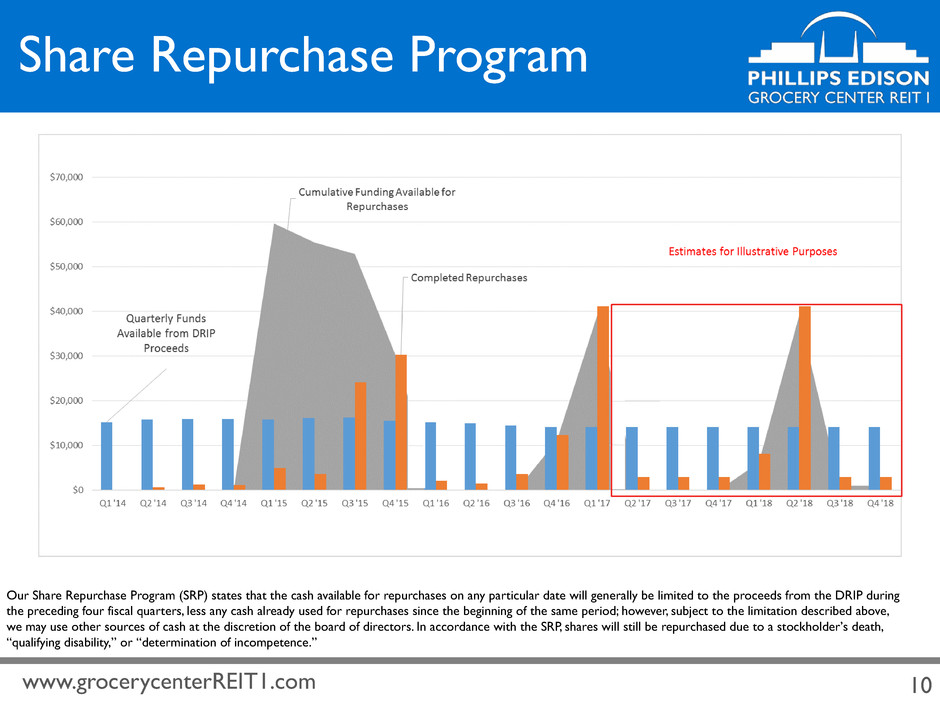
10www.grocerycenterREIT1.com Share Repurchase Program Our Share Repurchase Program (SRP) states that the cash available for repurchases on any particular date will generally be limited to the proceeds from the DRIP during the preceding four fiscal quarters, less any cash already used for repurchases since the beginning of the same period; however, subject to the limitation described above, we may use other sources of cash at the discretion of the board of directors. In accordance with the SRP, shares will still be repurchased due to a stockholder’s death, “qualifying disability,” or “determination of incompetence.”
11www.grocerycenterREIT1.com Company Updates • Duff & Phelps, a third-party valuation firm, produced an estimated value per share in the range of $9.97 to $11.24 as of March 31, 2017 • The Board of Directors reaffirmed the estimated value per share of $10.20* ◦ Above the offering price of $10.00 per share ◦ Represents a stabilized portfolio ◦ Real Estate value holding well in a time of volatility for publicly traded REITs *As of March 31, 2017. Please note that the estimated value per share is not intended to represent an enterprise or liquidation value of our company. It is important to remember that the estimated value per share may not reflect the amount you would obtain if you were to sell your shares or if we liquidated our assets. Further, the estimated value per share is as of a moment in time, and the value of our shares and assets may change over time as a result of several factors including, but not limited to, future acquisitions or dispositions, other developments related to individual assets, and changes in the real estate and capital markets, and we do not undertake to update the estimated value per share to account for any such events. You should not rely on the estimated value per share as being an accurate measure of the then-current value of your shares in making a decision to buy or sell your shares, including whether to participate in our dividend reinvestment plan or our SRP. For a description of the methodology and assumptions used to determine the estimated value per share, see our Quarterly Report on Form 10-Q filed with the U.S. Securities and Exchange Commission on May 11, 2017.

For More Information: Thank You InvestorRelations@PhillipsEdison.com www.grocerycenterREIT1.com DST: (888) 518-8073 Griffin Capital Securities: (866) 788-8614

Appendix

14www.grocerycenterREIT1.com We present Same-Center Net Operating Income (“Same-Center NOI”) as a supplemental measure of our performance. We define Net Operating Income (“NOI”) as total operating revenues, adjusted to exclude lease buy-out income and non-cash revenue items, less property operating expenses and real estate taxes. Same-Center NOI represents the NOI for the 137 properties that were owned and operational for the entire portion of both comparable reporting periods, except for those properties we classify as redevelopment during either of the periods presented. A property is removed from the Same-Center pool and classified as redevelopment when it is being repositioned in the market and such repositioning is expected to have a significant impact on property operating income. While there is judgment surrounding changes in designations, once a redevelopment property has stabilized, it is typically moved to the Same-Center pool the following year. Currently we have identified nine properties that we classify as redevelopment properties. We believe that NOI and Same-Center NOI provide useful information to our investors about our financial and operating performance because each provides a performance measure of the revenues and expenses directly involved in owning and operating real estate assets and provides a perspective not immediately apparent from net income. Because Same-Center NOI excludes the change in NOI from properties acquired after December 31, 2015 and those considered redevelopment properties, it highlights operating trends such as occupancy levels, rental rates, and operating costs on properties that were operational for both comparable periods. Other REITs may use different methodologies for calculating Same-Center NOI, and accordingly, our Same-Center NOI may not be comparable to other REITs. Same-Center NOI should not be viewed as an alternative measure of our financial performance since it does not reflect the operations of our entire portfolio, nor does it reflect the impact of general and administrative expenses, acquisition expenses, depreciation and amortization, interest expense, other income, or the level of capital expenditures and leasing costs necessary to maintain the operating performance of our properties that could materially impact our results from operations. The table below is a comparison of Same-Center NOI for the three months ended March 31, 2017 and 2016 (in thousands): Three Months Ended March 31, (in 000s) 2017 2016 $ Change % Change Revenues: Rental income(1) $ 42,677 $ 41,374 $ 1,303 Tenant recovery income 14,051 14,468 (417) Other property income 204 151 53 56,932 55,993 939 1.7 % Operating expenses: Property operating expenses 9,295 9,181 114 Real estate taxes 8,261 8,555 (294) 17,556 17,736 (180) (1.0)% Total Same-Center NOI $ 39,376 $ 38,257 $ 1,119 2.9 % (1) Excludes straight-line rental income, net amortization of above- and below-market leases, and lease buyout income. Reconciliation of Non-GAAP Financials

15www.grocerycenterREIT1.com Below is a reconciliation of net income to NOI and Same-Center NOI for the three months ended March 31, 2017 and 2016 (in thousands): Three Months Ended March 31, 2017 2016(1) Net income $ 1,134 $ 2,253 Adjusted to exclude: Straight-line rental income (493) (899) Net amortization of above- and below-market leases (331) (272) Lease buyout income (27) (365) General and administrative expenses 7,830 7,553 Depreciation and amortization 27,624 25,706 Interest expense, net 8,390 7,732 Other 1,650 149 NOI 45,777 41,857 Less: NOI from centers excluded from Same-Center (6,401) (3,600) Total Same-Center NOI $ 39,376 $ 38,257 Reconciliation of Non-GAAP Financials (1) Certain prior period amounts have been restated to conform with current year presentation.

16www.grocerycenterREIT1.com Funds from Operations and Modified Funds from Operations Funds from operations (“FFO”) is a non-GAAP performance financial measure that is widely recognized as a measure of REIT operating performance. We use FFO as defined by the National Association of Real Estate Investment Trusts (“NAREIT”) to be net income (loss), computed in accordance with GAAP, and gains (or losses) from sales of depreciable real estate property (including deemed sales and settlements of pre-existing relationships), plus depreciation and amortization on real estate assets and impairment charges, and after related adjustments for unconsolidated partnerships, joint ventures, and noncontrolling interests. We believe that FFO is helpful to our investors and our management as a measure of operating performance because, when compared year to year, it reflects the impact on operations from trends in occupancy rates, rental rates, operating costs, development activities, general and administrative expenses, and interest costs, which are not immediately apparent from net income. Since the definition of FFO was promulgated by NAREIT, GAAP has expanded to include several new accounting pronouncements, such that management and many investors and analysts have considered the presentation of FFO alone to be insufficient. Accordingly, in addition to FFO, we use modified funds from operations (“MFFO”), which excludes from FFO the following items: �� transaction expenses; • straight-line rent amounts, both income and expense; • amortization of above- or below-market intangible lease assets and liabilities; • amortization of discounts and premiums on debt investments; • gains or losses from the early extinguishment of debt; • gains or losses on the extinguishment of derivatives, except where the trading of such instruments is a fundamental attribute of our operations; • gains or losses related to fair value adjustments for derivatives not qualifying for hedge accounting; • adjustments related to the above items for joint ventures and noncontrolling interests and unconsolidated entities in the application of equity accounting. We believe that MFFO is helpful in assisting management and investors with the assessment of the sustainability of operating performance in future periods and, in particular, after our acquisition stage is complete, because MFFO excludes acquisition expenses that affect operations only in the period in which the property is acquired. Thus, MFFO provides helpful information relevant to evaluating our operating performance in periods in which there is no acquisition activity. Reconciliation of Non-GAAP Financials

17www.grocerycenterREIT1.com Many of the adjustments in arriving at MFFO are not applicable to us. Nevertheless, as explained below, management’s evaluation of our operating performance may also exclude items considered in the calculation of MFFO based on the following economic considerations. • Adjustments for straight-line rents and amortization of discounts and premiums on debt investments—GAAP requires rental receipts and discounts and premiums on debt investments to be recognized using various systematic methodologies. This may result in income recognition that could be significantly different than underlying contract terms. By adjusting for these items, MFFO provides useful supplemental information on the realized economic impact of lease terms and debt investments and aligns results with management’s analysis of operating performance. The adjustment to MFFO for straight-line rents, in particular, is made to reflect rent and lease payments from a GAAP accrual basis to a cash basis. • Adjustments for amortization of above- or below-market intangible lease assets—Similar to depreciation and amortization of other real estate-related assets that are excluded from FFO, GAAP implicitly assumes that the value of intangibles diminishes ratably over the lease term and should be recognized in revenue. Since real estate values and market lease rates in the aggregate have historically risen or fallen with market conditions, and the intangible value is not adjusted to reflect these changes, management believes that by excluding these charges, MFFO provides useful supplemental information on the performance of the real estate. • Gains or losses related to fair value adjustments for derivatives not qualifying for hedge accounting—This item relates to a fair value adjustment, which is based on the impact of current market fluctuations and underlying assessments of general market conditions and specific performance of the holding, which may not be directly attributable to current operating performance. As these gains or losses relate to underlying long-term assets and liabilities, management believes MFFO provides useful supplemental information by focusing on the changes in core operating fundamentals rather than changes that may reflect anticipated, but unknown, gains or losses. • Adjustment for gains or losses related to early extinguishment of derivatives and debt instruments—These adjustments are not related to continuing operations. By excluding these items, management believes that MFFO provides supplemental information related to sustainable operations that will be more comparable between other reporting periods and to other real estate operators. Neither FFO nor MFFO should be considered as an alternative to net income (loss) or income (loss) from continuing operations under GAAP, nor as an indication of our liquidity, nor is either of these measures indicative of funds available to fund our cash needs, including our ability to fund distributions. MFFO may not be a useful measure of the impact of long-term operating performance on value if we do not continue to operate our business plan in the manner currently contemplated. Accordingly, FFO and MFFO should be reviewed in connection with other GAAP measurements. FFO and MFFO should not be viewed as more prominent measures of performance than our net income or cash flows from operations prepared in accordance with GAAP. Our FFO and MFFO, as presented, may not be comparable to amounts calculated by other REITs. Reconciliation of Non-GAAP Financials
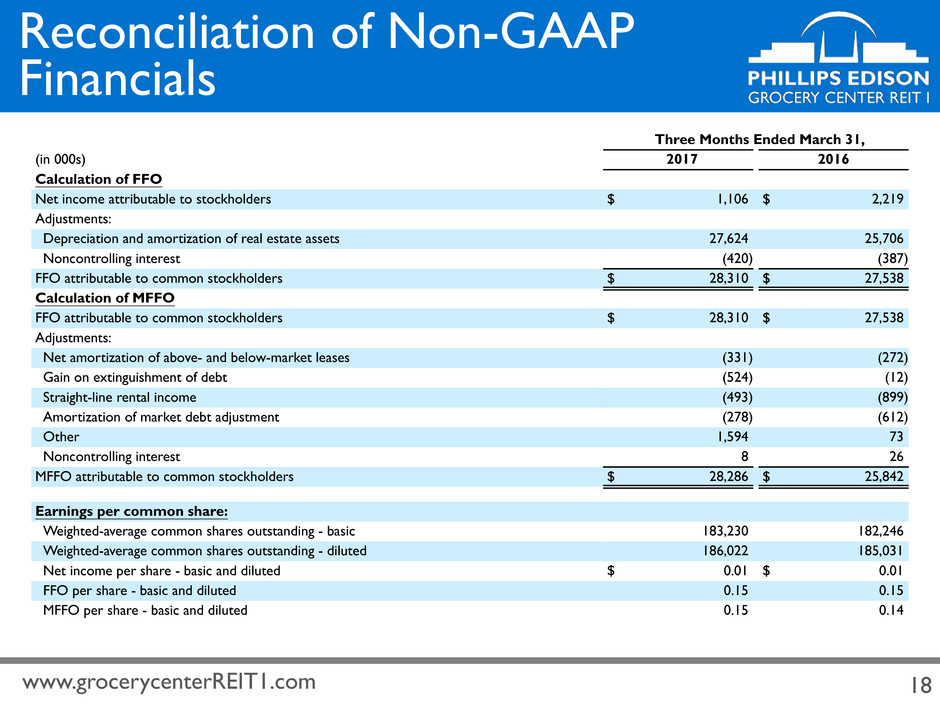
18www.grocerycenterREIT1.com Three Months Ended March 31, (in 000s) 2017 2016 Calculation of FFO Net income attributable to stockholders $ 1,106 $ 2,219 Adjustments: Depreciation and amortization of real estate assets 27,624 25,706 Noncontrolling interest (420) (387) FFO attributable to common stockholders $ 28,310 $ 27,538 Calculation of MFFO FFO attributable to common stockholders $ 28,310 $ 27,538 Adjustments: Net amortization of above- and below-market leases (331) (272) Gain on extinguishment of debt (524) (12) Straight-line rental income (493) (899) Amortization of market debt adjustment (278) (612) Other 1,594 73 Noncontrolling interest 8 26 MFFO attributable to common stockholders $ 28,286 $ 25,842 Earnings per common share: Weighted-average common shares outstanding - basic 183,230 182,246 Weighted-average common shares outstanding - diluted 186,022 185,031 Net income per share - basic and diluted $ 0.01 $ 0.01 FFO per share - basic and diluted 0.15 0.15 MFFO per share - basic and diluted 0.15 0.14 Reconciliation of Non-GAAP Financials


