First Quarter 2019 Results Presentation Thursday, May 9, 2019
Agenda Prepared Remarks Jeff Edison - Chairman and CEO • Highlights • Estimated Value Per Share Update • Portfolio Update Devin Murphy - CFO • Financial Results • Balance Sheet • Share Repurchase Program Jeff Edison - Chairman and CEO • Update on 2019 Initiatives Question and Answer Session www.phillipsedison.com/investors 2
Forward-Looking Statement Disclosure Certain statements contained in this presentation of Phillips Edison & Company, Inc. (“we,” the “Company,” “our,” or “us”) other than historical facts may be considered forward-looking statements within the meaning of Section 27A of the Securities Act of 1933, as amended (the “Securities Act”), and Section 21E of the Securities Exchange Act of 1934, as amended (the “Exchange Act”). We intend for all such forward-looking statements to be covered by the applicable safe harbor provisions for forward-looking statements contained in those acts. Such forward-looking statements can generally be identified by our use of forward-looking terminology such as “may,” “will,” “expect,” “estimate,” “believe,” “continue,” “priority,” “goal,” “range,” “strategies,” “initiatives,” “plan,” “strategic alternatives,” “potential,” “future,” or other similar words. Readers are cautioned not to place undue reliance on these forward-looking statements, which speak only as of the date this report is filed with the U.S. Securities and Exchange Commission (“SEC”). Such statements include, in particular, statements about our plans, strategies, and prospects, and are subject to certain risks and uncertainties, including known and unknown risks, which could cause actual results to differ materially from those projected or anticipated. These risks include, without limitation, (i) changes in national, regional, or local economic climates; (ii) local market conditions, including an oversupply of space in, or a reduction in demand for, properties similar to those in our portfolio; (iii) vacancies, changes in market rental rates, and the need to periodically repair, renovate, and re-let space; (iv) changes in interest rates and the availability of permanent mortgage financing; (v) competition from other available properties and the attractiveness of properties in our portfolio to our tenants; (vi) the financial stability of tenants, including the ability of tenants to pay rent; (vii) changes in tax, real estate, environmental, and zoning laws; (viii) the concentration of our portfolio in a limited number of industries, geographies, or investments; and (ix) any of the other risks included in the Company’s SEC filings. Therefore, such statements are not intended to be a guarantee of our performance in future periods. See Part I, Item 1A. Risk Factors of our 2018 Annual Report on Form 10-K, filed with the SEC on March 13, 2019, for a discussion of some of the risks and uncertainties, although not all of the risks and uncertainties, that could cause actual results to differ materially from those presented in our forward-looking statements. Except as required by law, we do not undertake any obligation to update or revise any forward-looking statements contained in this presentation. www.phillipsedison.com/investors 3
Highlights First Quarter 2019 Highlights • Net loss totaled $5.8 million • FFO per diluted share increased 5.6% to $0.19 • FFO represented 111.3% of total distributions made during the quarter • Pro forma same-center net operating income (“NOI”)* increased 2.5% to $87.3 million • Comparable new lease spreads were 17.2%, comparable renewal lease spreads were 12.3%, and combined lease spreads were 13.5% Estimated Value Per Share Update • On May 8, 2019, the Company’s board of directors increased the estimated value per share of its common stock to $11.10 as of March 31, 2019 Pro forma NOI reflects assets acquired from the merger Phillips Edison Grocery Center REIT II, Inc. (“REIT II”) in November 2018. See Appendix for reconciliation and more information. www.phillipsedison.com/investors 4
Estimated Value Per Share Increase • Duff & Phelps, an independent third-party valuation firm, produced an estimated value per share (“EVPS”) range of $10.07 to $11.48 as of March 31, 2019 • On May 8, 2019, the Company’s board of directors increased the estimated value per share of its common stock to $11.10 ◦ An 11% increase from original offering price of $10.00 per share • Rationale behind the increase in EVPS: ◦ Strength in its property-level fundamentals ◦ Leading fully-integrated operating platform ◦ Meaningful growth potential within its investment management business Please note that the estimated value per share is not intended to represent an enterprise or liquidation value of our company. It is important to remember that the estimated value per share may not reflect the amount you would obtain if you were to sell your shares or if we liquidated our assets. Further, the estimated value per share is as of a moment in time, and the value of our shares and assets may change over time as a result of several factors including, but not limited to, future acquisitions or dispositions, other developments related to individual assets, and changes in the real estate and capital markets, and we do not undertake to update the estimated value per share to account for any such events. You should not rely on the estimated value per share as being an accurate measure of the then-current value of your shares in making a decision to buy or sell your shares, including whether to participate in our dividend reinvestment plan or our share repurchase program. For a description of the methodology and assumptions used to determine the estimated value per share, see our recent 10-Q filing made with the U.S. Securities and Exchange Commission. www.phillipsedison.com/investors 5
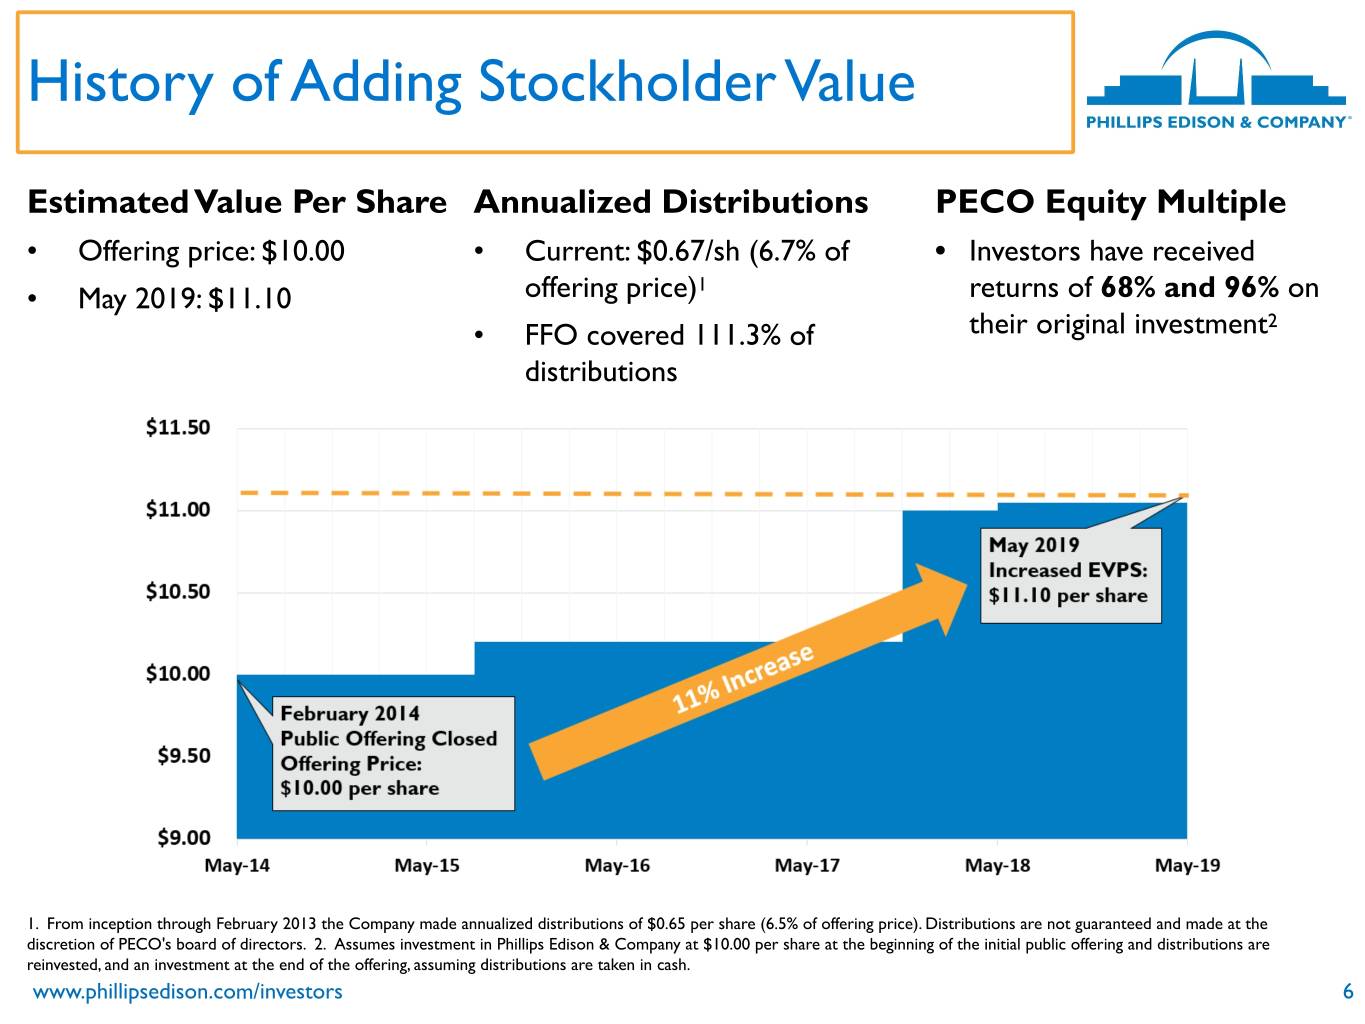
History of Adding Stockholder Value Estimated Value Per Share Annualized Distributions PECO Equity Multiple • Offering price: $10.00 • Current: $0.67/sh (6.7% of • Investors have received • May 2019: $11.10 offering price)1 returns of 68% and 96% on • FFO covered 111.3% of their original investment2 distributions 1. From inception through February 2013 the Company made annualized distributions of $0.65 per share (6.5% of offering price). Distributions are not guaranteed and made at the discretion of PECO's board of directors. 2. Assumes investment in Phillips Edison & Company at $10.00 per share at the beginning of the initial public offering and distributions are reinvested, and an investment at the end of the offering, assuming distributions are taken in cash. www.phillipsedison.com/investors 6
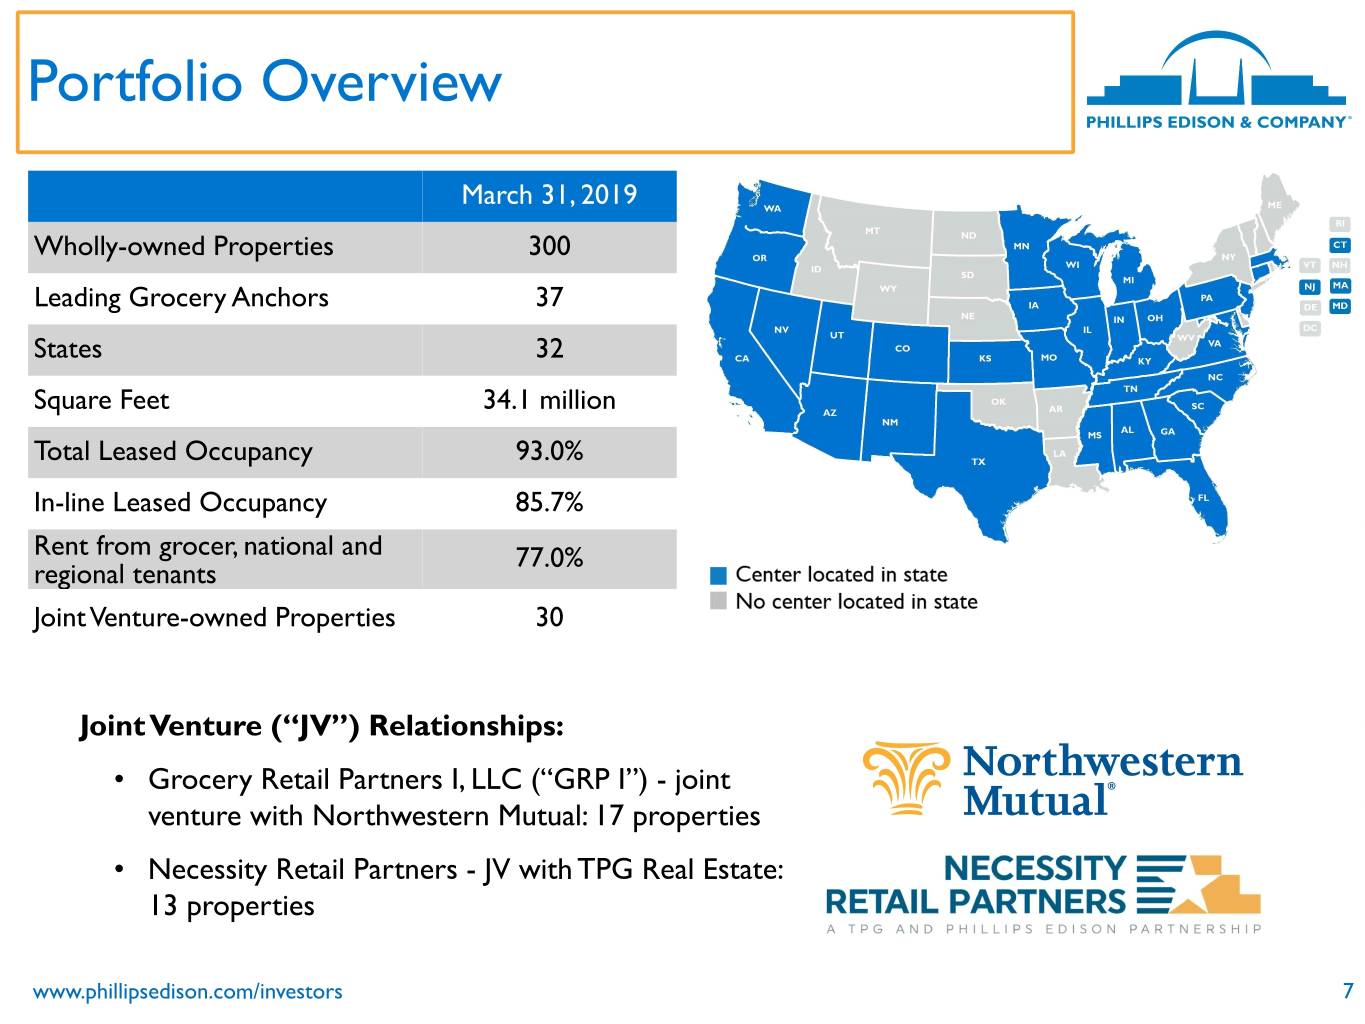
Portfolio Overview March 31, 2019 Wholly-owned Properties 300 Leading Grocery Anchors 37 States 32 Square Feet 34.1 million Total Leased Occupancy 93.0% In-line Leased Occupancy 85.7% Rent from grocer, national and 77.0% regional tenants Joint Venture-owned Properties 30 Joint Venture (“JV”) Relationships: • Grocery Retail Partners I, LLC (“GRP I”) - joint venture with Northwestern Mutual: 17 properties • Necessity Retail Partners - JV with TPG Real Estate: 13 properties www.phillipsedison.com/investors 7
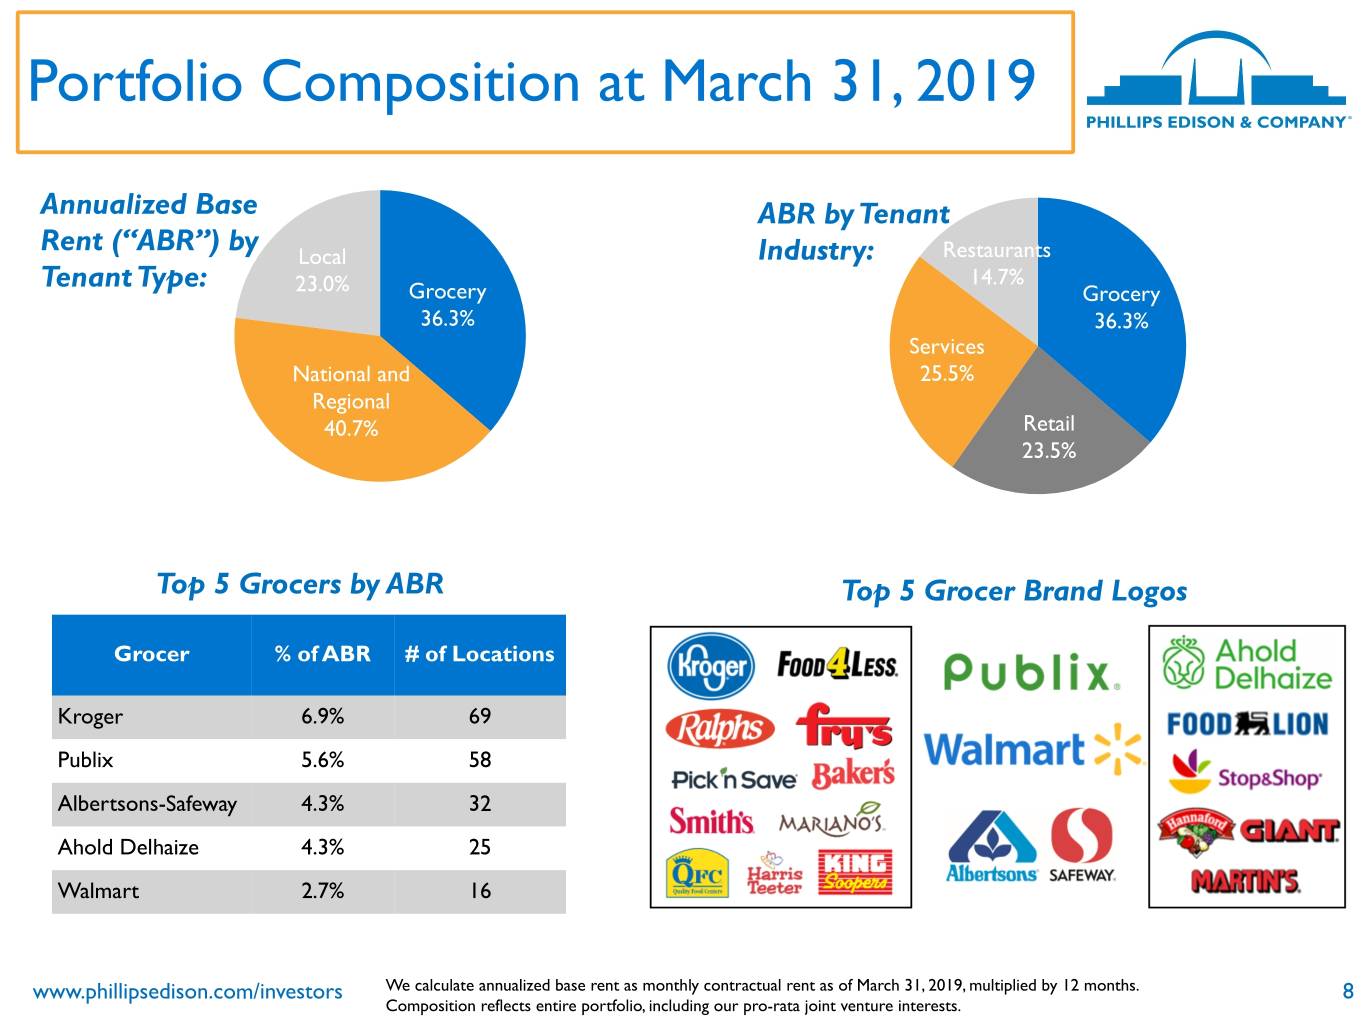
Portfolio Composition at March 31, 2019 Annualized Base ABR by Tenant Rent (“ABR”) by Local Industry: Restaurants Tenant Type: 14.7% 23.0% Grocery Grocery 36.3% 36.3% Services National and 25.5% Regional 40.7% Retail 23.5% Top 5 Grocers by ABR Top 5 Grocer Brand Logos Grocer % of ABR # of Locations Kroger 6.9% 69 Publix 5.6% 58 Albertsons-Safeway 4.3% 32 Ahold Delhaize 4.3% 25 Walmart 2.7% 16 www.phillipsedison.com/investors We calculate annualized base rent as monthly contractual rent as of March 31, 2019, multiplied by 12 months. 8 Composition reflects entire portfolio, including our pro-rata joint venture interests.
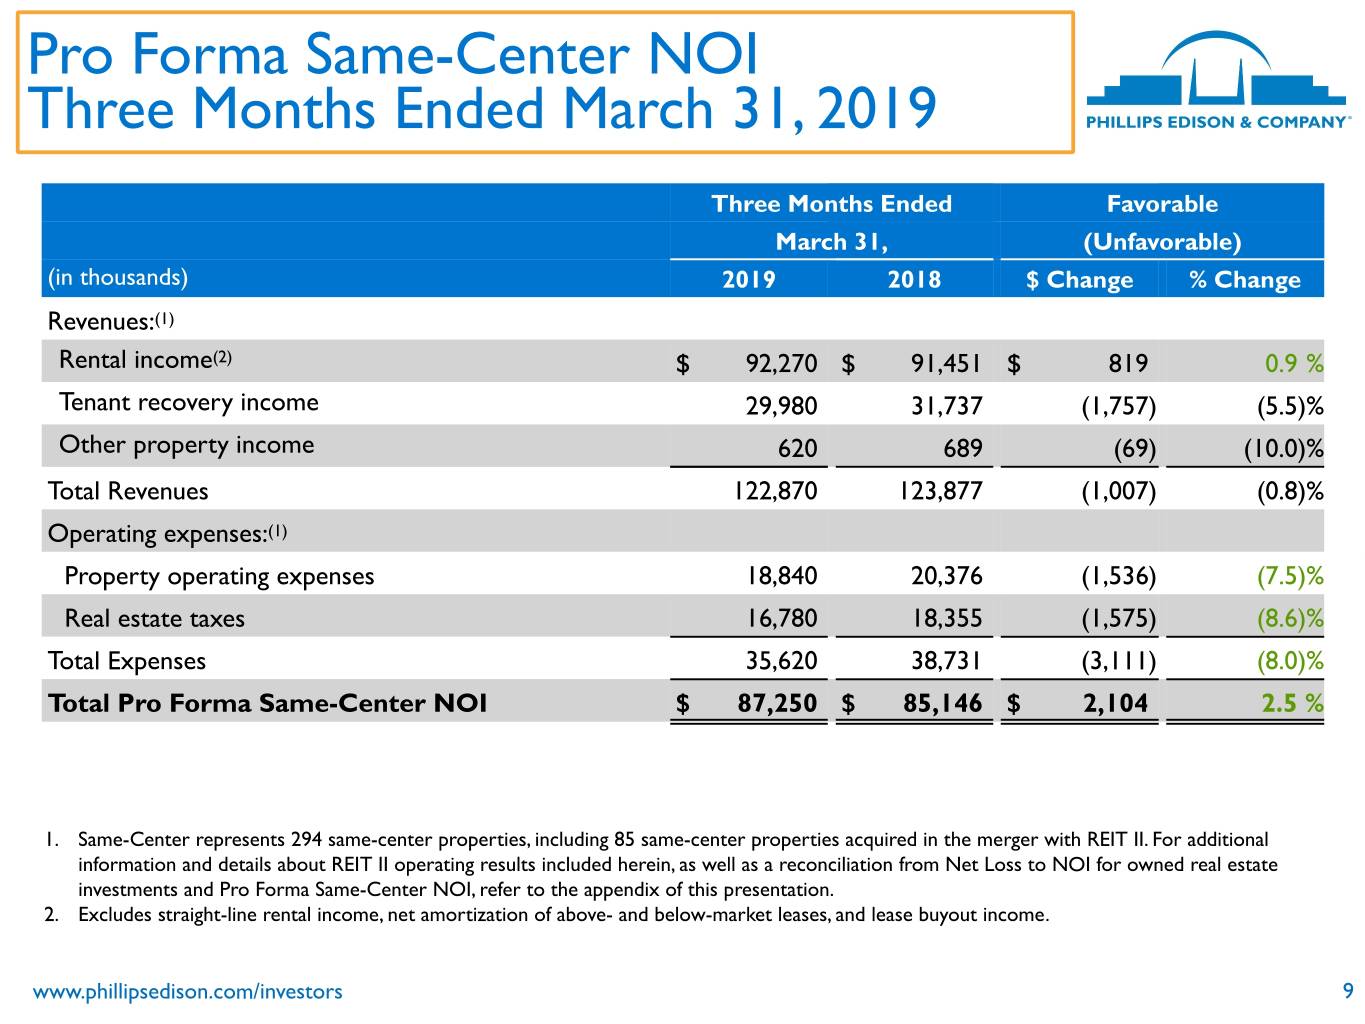
Pro Forma Same-Center NOI Three Months Ended March 31, 2019 Three Months Ended Favorable March 31, (Unfavorable) (in thousands) 2019 2018 $ Change % Change Revenues:(1) Rental income(2) $ 92,270 $ 91,451 $ 819 0.9 % Tenant recovery income 29,980 31,737 (1,757) (5.5)% Other property income 620 689 (69) (10.0)% Total Revenues 122,870 123,877 (1,007) (0.8)% Operating expenses:(1) Property operating expenses 18,840 20,376 (1,536) (7.5)% Real estate taxes 16,780 18,355 (1,575) (8.6)% Total Expenses 35,620 38,731 (3,111) (8.0)% Total Pro Forma Same-Center NOI $ 87,250 $ 85,146 $ 2,104 2.5 % 1. Same-Center represents 294 same-center properties, including 85 same-center properties acquired in the merger with REIT II. For additional information and details about REIT II operating results included herein, as well as a reconciliation from Net Loss to NOI for owned real estate investments and Pro Forma Same-Center NOI, refer to the appendix of this presentation. 2. Excludes straight-line rental income, net amortization of above- and below-market leases, and lease buyout income. www.phillipsedison.com/investors 9

Financial Results Three Months Ended March 31, 2019 Three Months Ended Favorable March 31, (Unfavorable) (in thousands) 2019 2018 $ Change % Change Net Loss $ (5,788) $ (1,837) $ (3,951) NM Adjustments(1) 66,803 42,202 24,601 58.3 % FFO Attributable to Stockholders and Convertible 61,015 40,365 20,650 51.2 % Noncontrolling Interests(2) Adjustments(3) (6,040) 1,823 (7,863) NM MFFO $ 54,975 $ 42,188 $ 12,787 30.3 % Diluted FFO Attributable to Stockholders and Convertible $ 0.19 $ 0.18 $ 0.01 5.6 % Noncontrolling Interests(2)/Share Diluted MFFO/Share $ 0.17 $ 0.18 $ (0.01) (5.6)% 1. Adjustments include depreciation and amortization of real estate assets, adjustments for impairment losses on depreciable real estate, gain on disposal of property, net, adjustments related to unconsolidated joint ventures, and noncontrolling interest not convertible into common stock. 2. Convertible non controlling interest = Phillips Edison Grocery Center Operating Partnership I, L.P. operating partnership units (“OP Units”) 3. Adjustments include amortization of above- and below market leases, amortization and depreciation of corporate assets, straight-line rent, amortization of market debt adjustment and derivatives, change in fair value of earn-out liabilities, adjustments related to unconsolidated joint ventures, and other. * See Appendix for a complete reconciliation of net loss to FFO and MFFO www.phillipsedison.com/investors 10
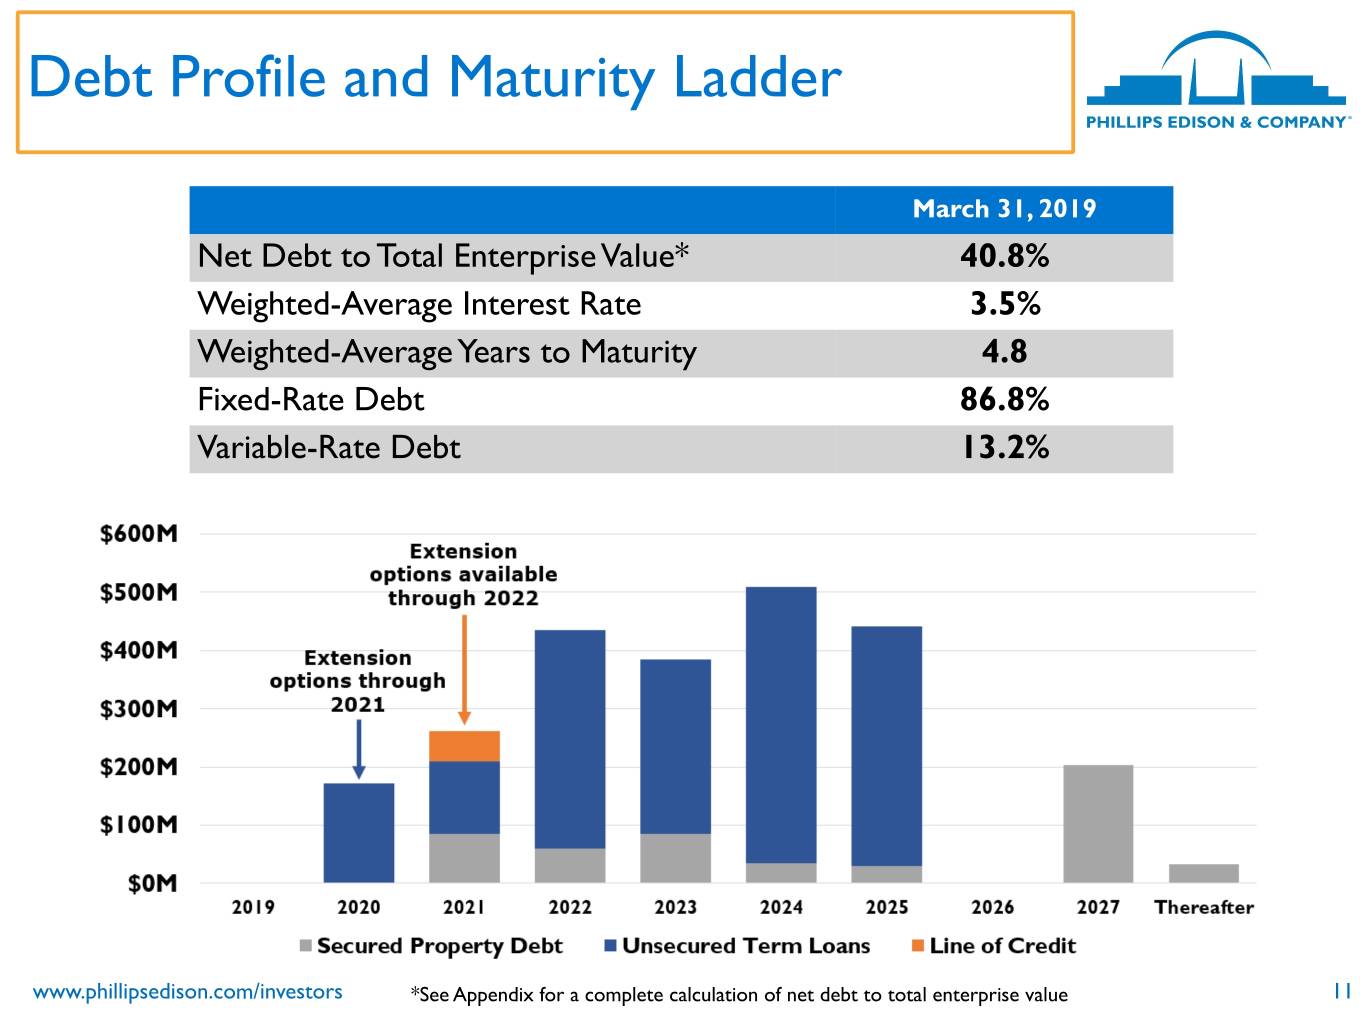
Debt Profile and Maturity Ladder March 31, 2019 Net Debt to Total Enterprise Value* 40.8% Weighted-Average Interest Rate 3.5% Weighted-Average Years to Maturity 4.8 Fixed-Rate Debt 86.8% Variable-Rate Debt 13.2% www.phillipsedison.com/investors *See Appendix for a complete calculation of net debt to total enterprise value 11

Share Repurchase Program • During the first quarter of 2019, PECO repurchased 605,000 shares totaling $6.7 million. • The Company fulfilled all repurchases sought upon a stockholder’s death, qualifying disability, or determination of incompetence in accordance with the terms of the SRP. • All standard repurchase requests must be on file and in good order by the close of business on July 24, 2019 to be included for the next standard repurchase, which is expected to occur on July 31, 2019. • At that time, the demand for standard redemptions is expected to exceed the funding the Company makes available for repurchases and, as a result, the Company expects to make redemptions on a pro-rata basis. www.phillipsedison.com/investors 12

2019 Initiatives Important strategies to maximize our potential future valuation in the public equity markets: 1. Focus on growth, operating fundamentals, and NOI at the property level a. Driving occupancy, leasing spreads and merchandising b. Investment in redevelopment and repositioning projects to provide greater growth and returns 2. Active disposition program to: a. Recycle capital into higher-quality, better-performing assets b. Reinvest capital into redevelopment projects with attractive yields c. Monetize stabilized assets and capture value to delever balance sheet to be more reflective of our publicly traded peers 3. Grow our investment management business and its recurring high-margin revenue www.phillipsedison.com/investors 13

Question and Answer Session If you are logged in to the webcast presentation, you can submit a question by typing it into the text box, and clicking submit. www.phillipsedison.com/investors 14

For More Information: InvestorRelations@PhillipsEdison.com www.phillipsedison.com/investors Investor Services: (888) 518-8073 Advisor Services - Griffin Capital Securities: (866) 788-8614
Appendix

Reconciliation of Non-GAAP Financials Funds from Operations and Modified Funds from Operations FFO is a non-GAAP performance financial measure that is widely recognized as a measure of REIT operating performance. The National Association of Real Estate Investment Trusts (“NAREIT”) defines FFO as net income (loss) attributable to common stockholders computed in accordance with GAAP, excluding gains (or losses) from sales of property and gains (or losses) from change in control, plus depreciation and amortization, and after adjustments for impairment losses on depreciable real estate and impairments of in-substance real estate investments in investees that are driven by measurable decreases in the fair value of the depreciable real estate held by the unconsolidated partnerships and joint ventures. Adjustments for unconsolidated partnerships and joint ventures are calculated to reflect FFO on the same basis. We calculate FFO Attributable to Stockholders and Convertible Noncontrolling Interests in a manner consistent with the NAREIT definition, with an additional adjustment made for noncontrolling interests that are not convertible into common stock. MFFO is an additional performance financial measure used by us as FFO includes certain non-comparable items that affect our performance over time. We believe that MFFO is helpful in assisting management and investors with the assessment of the sustainability of operating performance in future periods. We believe it is more reflective of our core operating performance and provides an additional measure to compare our performance across reporting periods on a consistent basis by excluding items that may cause short-term fluctuations in net income (loss) but have no impact on cash flows. FFO, FFO Attributable to Stockholders and Convertible Noncontrolling Interests, and MFFO should not be considered alternatives to net income (loss) or income (loss) from continuing operations under GAAP, as an indication of our liquidity, nor as an indication of funds available to cover our cash needs, including our ability to fund distributions. MFFO may not be a useful measure of the impact of long-term operating performance on value if we do not continue to operate our business plan in the manner currently contemplated. Accordingly, FFO, FFO Attributable to Stockholders and Convertible Noncontrolling Interests, and MFFO should be reviewed in connection with other GAAP measurements, and should not be viewed as more prominent measures of performance than net income (loss) or cash flows from operations prepared in accordance with GAAP. Our FFO, FFO Attributable to Stockholders and Convertible Noncontrolling Interests, and MFFO, as presented, may not be comparable to amounts calculated by other REITs. www.phillipsedison.com/investors 17
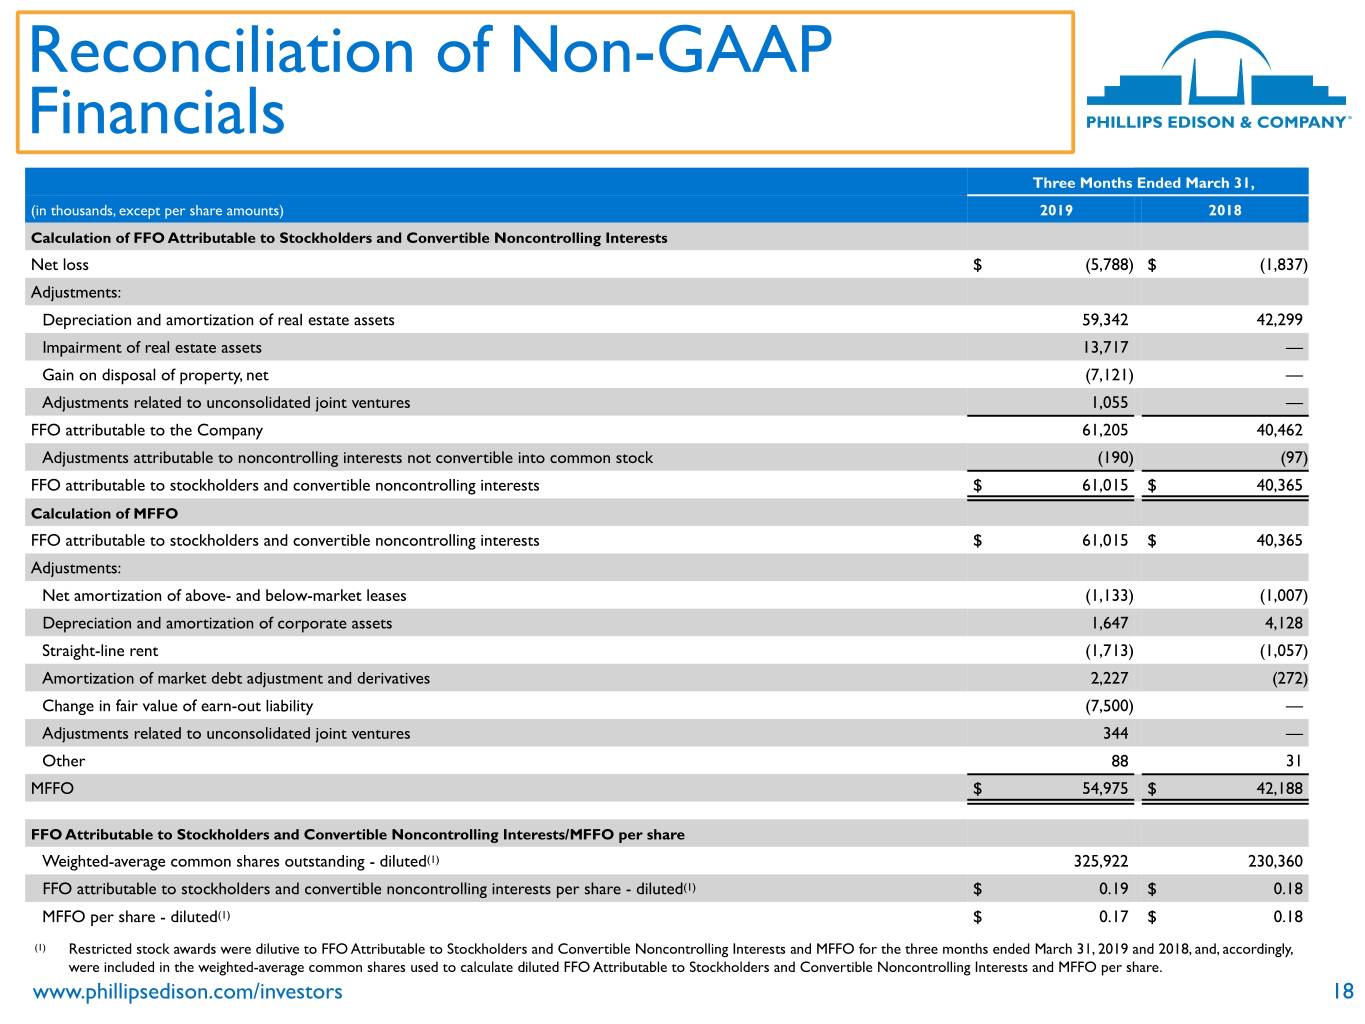
Reconciliation of Non-GAAP Financials Three Months Ended March 31, (in thousands, except per share amounts) 2019 2018 Calculation of FFO Attributable to Stockholders and Convertible Noncontrolling Interests Net loss $ (5,788) $ (1,837) Adjustments: Depreciation and amortization of real estate assets 59,342 42,299 Impairment of real estate assets 13,717 — Gain on disposal of property, net (7,121) — Adjustments related to unconsolidated joint ventures 1,055 — FFO attributable to the Company 61,205 40,462 Adjustments attributable to noncontrolling interests not convertible into common stock (190) (97) FFO attributable to stockholders and convertible noncontrolling interests $ 61,015 $ 40,365 Calculation of MFFO FFO attributable to stockholders and convertible noncontrolling interests $ 61,015 $ 40,365 Adjustments: Net amortization of above- and below-market leases (1,133) (1,007) Depreciation and amortization of corporate assets 1,647 4,128 Straight-line rent (1,713) (1,057) Amortization of market debt adjustment and derivatives 2,227 (272) Change in fair value of earn-out liability (7,500) — Adjustments related to unconsolidated joint ventures 344 — Other 88 31 MFFO $ 54,975 $ 42,188 FFO Attributable to Stockholders and Convertible Noncontrolling Interests/MFFO per share Weighted-average common shares outstanding - diluted(1) 325,922 230,360 FFO attributable to stockholders and convertible noncontrolling interests per share - diluted(1) $ 0.19 $ 0.18 MFFO per share - diluted(1) $ 0.17 $ 0.18 (1) Restricted stock awards were dilutive to FFO Attributable to Stockholders and Convertible Noncontrolling Interests and MFFO for the three months ended March 31, 2019 and 2018, and, accordingly, were included in the weighted-average common shares used to calculate diluted FFO Attributable to Stockholders and Convertible Noncontrolling Interests and MFFO per share. www.phillipsedison.com/investors 18

Reconciliation of Non-GAAP Financials Same-Center NOI represents the NOI for the properties that were owned and operational for the entire portion of both comparable reporting periods. For purposes of evaluating Same-Center NOI on a comparative basis, we are presenting Pro Forma Same-Center NOI, which is Same-Center NOI on a pro forma basis as if the Merger had occurred on January 1, 2018. This perspective allows us to evaluate Same-Center NOI growth over a comparable period. As of March 31, 2019, we had 294 same-center properties, including 85 same-center properties acquired in the Merger. Pro Forma Same-Center NOI is not necessarily indicative of what actual Same-Center NOI and growth would have been if the Merger had occurred on January 1, 2018, nor does it purport to represent Same-Center NOI and growth for future periods. Pro Forma Same-Center NOI highlights operating trends such as occupancy rates, rental rates, and operating costs on properties that were operational for both comparable periods. Other REITs may use different methodologies for calculating Same-Center NOI, and accordingly, our Pro Forma Same-Center NOI may not be comparable to other REITs. Pro Forma Same-Center NOI should not be viewed as an alternative measure of our financial performance since it does not reflect the operations of our entire portfolio, nor does it reflect the impact of general and administrative expenses, acquisition expenses, depreciation and amortization, interest expense, other income, or the level of capital expenditures and leasing costs necessary to maintain the operating performance of our properties that could materially impact our results from operations. www.phillipsedison.com/investors 19
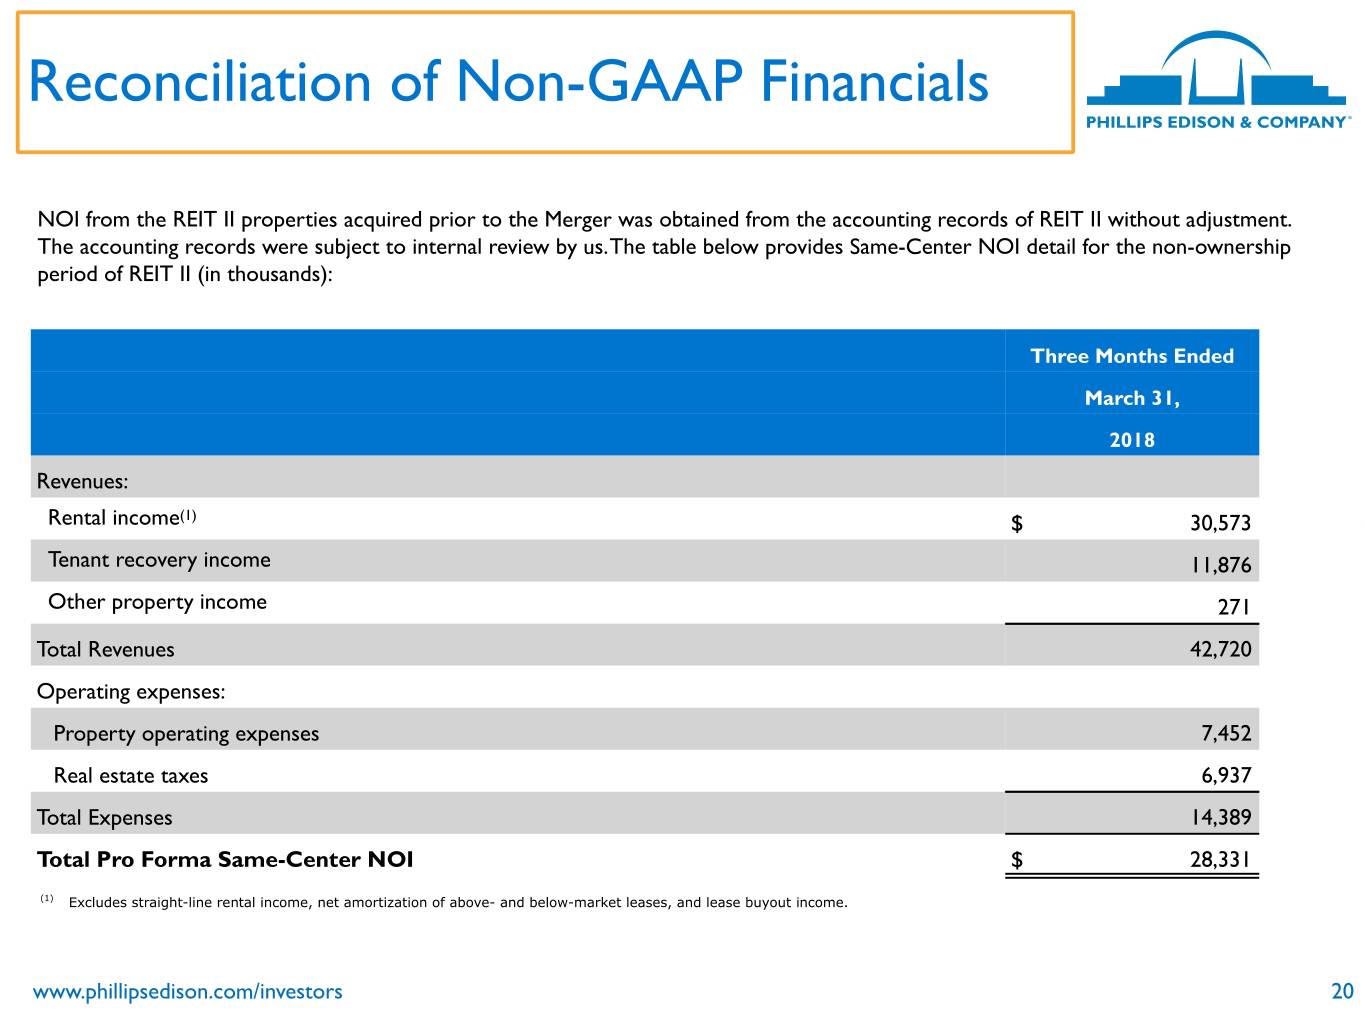
Reconciliation of Non-GAAP Financials NOI from the REIT II properties acquired prior to the Merger was obtained from the accounting records of REIT II without adjustment. The accounting records were subject to internal review by us. The table below provides Same-Center NOI detail for the non-ownership period of REIT II (in thousands): Three Months Ended March 31, 2018 Revenues: Rental income(1) $ 30,573 Tenant recovery income 11,876 Other property income 271 Total Revenues 42,720 Operating expenses: Property operating expenses 7,452 Real estate taxes 6,937 Total Expenses 14,389 Total Pro Forma Same-Center NOI $ 28,331 (1) Excludes straight-line rental income, net amortization of above- and below-market leases, and lease buyout income. www.phillipsedison.com/investors 20
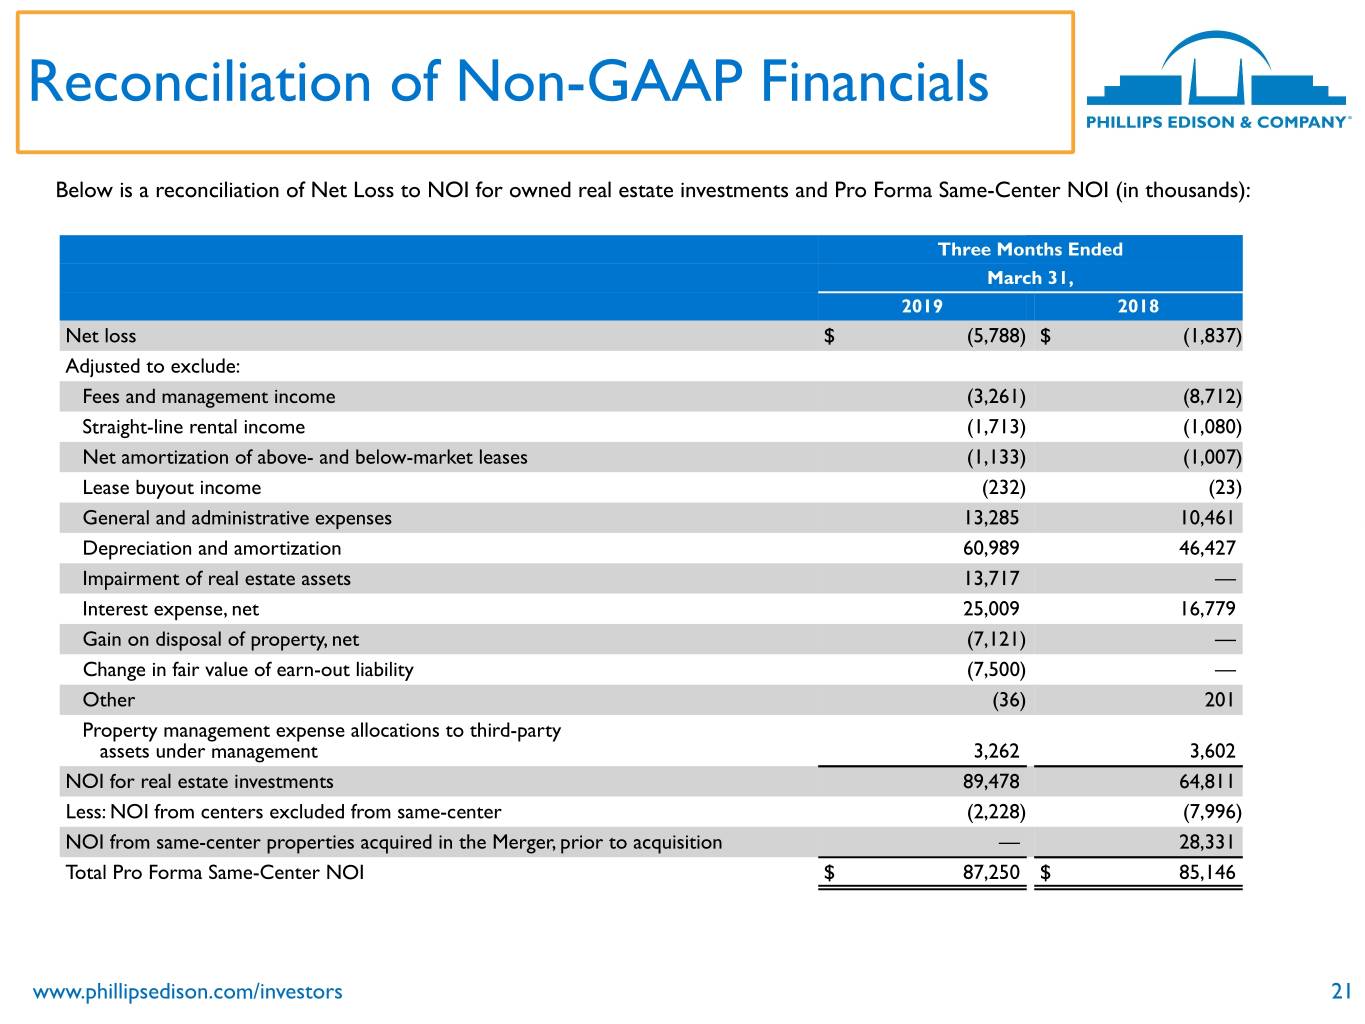
Reconciliation of Non-GAAP Financials Below is a reconciliation of Net Loss to NOI for owned real estate investments and Pro Forma Same-Center NOI (in thousands): Three Months Ended March 31, 2019 2018 Net loss $ (5,788) $ (1,837) Adjusted to exclude: Fees and management income (3,261) (8,712) Straight-line rental income (1,713) (1,080) Net amortization of above- and below-market leases (1,133) (1,007) Lease buyout income (232) (23) General and administrative expenses 13,285 10,461 Depreciation and amortization 60,989 46,427 Impairment of real estate assets 13,717 — Interest expense, net 25,009 16,779 Gain on disposal of property, net (7,121) — Change in fair value of earn-out liability (7,500) — Other (36) 201 Property management expense allocations to third-party assets under management 3,262 3,602 NOI for real estate investments 89,478 64,811 Less: NOI from centers excluded from same-center (2,228) (7,996) NOI from same-center properties acquired in the Merger, prior to acquisition — 28,331 Total Pro Forma Same-Center NOI $ 87,250 $ 85,146 www.phillipsedison.com/investors 21

Net Debt to Total Enterprise Value Our debt is subject to certain covenants and, as of March 31, 2019, we were in compliance with the restrictive covenants of our outstanding debt obligations. We expect to continue to meet the requirements of our debt covenants over the short- and long-term. Our debt to total enterprise value and debt covenant compliance as of March 31, 2019, allow us access to future borrowings as needed. The following table presents our calculation of net debt to total enterprise value as of March 31, 2019 and December 31, 2018 (dollars in thousands): March 31, 2019 December 31, 2018 Net debt(1): Total debt, excluding below-market adjustments and deferred financing costs $ 2,498,024 $ 2,522,432 Less: Cash and cash equivalents 13,753 18,186 Total net debt $ 2,484,271 $ 2,504,246 Enterprise Value: Total net debt $ 2,484,271 $ 2,504,246 Total equity value(2) 3,603,085 3,583,029 Total enterprise value $ 6,087,356 $ 6,087,275 Net debt to total enterprise value 40.8% 41.1% (1) Net debt includes our prorated share of the net debt obligations of our joint ventures. (2) Total equity value is calculated as the product of the number of diluted shares outstanding and the estimated value per share at the end of the period. There were 326.1 million and 324.6 million diluted shares outstanding as of March 31, 2019 and December 31, 2018, respectively. www.phillipsedison.com/investors 22


