Second Quarter 2019 Earnings Presentation Tuesday, August 13, 2019
Agenda Prepared Remarks Jeff Edison - Chairman and CEO • Highlights • Portfolio & Tenant Overview • Leasing Activity Devin Murphy - CFO • Investment Management Business & Joint Ventures • Financial Results • Balance Sheet • Liquidity / Share Repurchase Program Changes Jeff Edison - Chairman and CEO • Executive Changes and Board of Directors Additions • Update on 2019 Initiatives & Summary Question and Answer Session www.phillipsedison.com/investors 2
Forward-Looking Statement Disclosure Certain statements contained in this presentation of Phillips Edison & Company, Inc. (“we,” the “Company,” “our,” or “us”) other than historical facts may be considered forward-looking statements within the meaning of Section 27A of the Securities Act of 1933, as amended (the “Securities Act”), and Section 21E of the Securities Exchange Act of 1934, as amended (the “Exchange Act”). We intend for all such forward-looking statements to be covered by the applicable safe harbor provisions for forward-looking statements contained in those acts. Such forward-looking statements can generally be identified by our use of forward-looking terminology such as “may,” “will,” “expect,” “intend,” “anticipate,” “estimate,” “believe,” “continue,” “seek,” “objective,” “goal,” “strategy,” “plan,” “should,” “could,” or other similar words. Readers are cautioned not to place undue reliance on these forward-looking statements, which speak only as of the date this report is filed with the U.S. Securities and Exchange Commission (“SEC”). Such statements include, in particular, statements about our plans, strategies, and prospects, and are subject to certain risks and uncertainties, including known and unknown risks, which could cause actual results to differ materially from those projected or anticipated. These risks include, without limitation, (i) changes in national, regional, or local economic climates; (ii) local market conditions, including an oversupply of space in, or a reduction in demand for, properties similar to those in our portfolio; (iii) vacancies, changes in market rental rates, and the need to periodically repair, renovate, and re-let space; (iv) changes in interest rates and the availability of permanent mortgage financing; (v) competition from other available properties and the attractiveness of properties in our portfolio to our tenants; (vi) the financial stability of tenants, including the ability of tenants to pay rent; (vii) changes in tax, real estate, environmental, and zoning laws; (viii) the concentration of our portfolio in a limited number of industries, geographies, or investments; and (ix) any of the other risks included in the Company’s SEC filings. Therefore, such statements are not intended to be a guarantee of our performance in future periods. See Part I, Item 1A. Risk Factors of our 2018 Annual Report on Form 10-K, filed with the SEC on March 13, 2019, and Part II, Item 1A. Risk Factors of our Quarterly Report on Form 10-Q, filed with the SEC on August 12, 2019 for a discussion of some of the risks and uncertainties, although not all of the risks and uncertainties, that could cause actual results to differ materially from those presented in our forward-looking statements. Except as required by law, we do not undertake any obligation to update or revise any forward-looking statements contained in this presentation. www.phillipsedison.com/investors 3

2019 Initiatives - Update The following strategies will improve our earnings growth rate and leverage ratios in order to maximize our potential future valuation in the public equity markets 1. Improving operating fundamentals and growing NOI at the property level a. Increasing occupancy, optimizing leasing spreads, and focusing on merchandising b. Outparcel development and redevelopment c. Strict expense management 2. Active disposition program to improve the portfolio and delever a. Recycle capital into higher-quality, better-performing assets b. Monetize stabilized assets to capture value and reduce our leverage c. Reinvest capital into redevelopment projects with attractive yields 3. Grow our investment management business and its recurring high-margin revenue www.phillipsedison.com/investors 4
Highlights Second Quarter 2019 Highlights (vs. Second Quarter 2018) • Leased portfolio occupancy totaled 94.6%, an improvement from 93.2% at December 31, 2018 • Comparable new lease spreads were 10.5% and comparable renewal lease spreads were 10.8% • Net loss totaled $42.2 million while FFO increased 11.5% to $43.1 million • Pro forma same-center NOI* increased 1.5% to $87.0 million • Comparable new lease spreads were 10.5% and comparable renewal lease spreads were 10.8% • On August 7, 2019, the PECO Board of Directors declared a monthly distribution for September, October and November at an annualized rate of $0.67 per share Six Months Ended June 30, 2019 Highlights (vs. Six Months Ended June 30, 2018) • Decreased our leverage to 40.7% compared to 42.2% at June 30, 2018 • Executed 529 leases (new, renewal, and options) totaling 2.1 million square feet • Comparable new lease spreads were 14.6% and comparable renewal lease spreads were 11.6% • Realized $50.1 million in gross proceeds from the sale of six properties and one outparcel; acquired one property (1031 exchange) and one outparcel for a total cost of $49.9 million • Net loss totaled $48.0 million while FFO increased 31.7% to $104.1 million • MFFO increased 30.5% to $108.5 million • Pro forma same-center NOI* increased 2.0% to $173.8 million www.phillipsedison.com/investors Pro forma NOI reflects assets acquired from the merger Phillips Edison Grocery Center REIT II, Inc. (“REIT II”) in November 5 2018. See Appendix for reconciliation and more information.
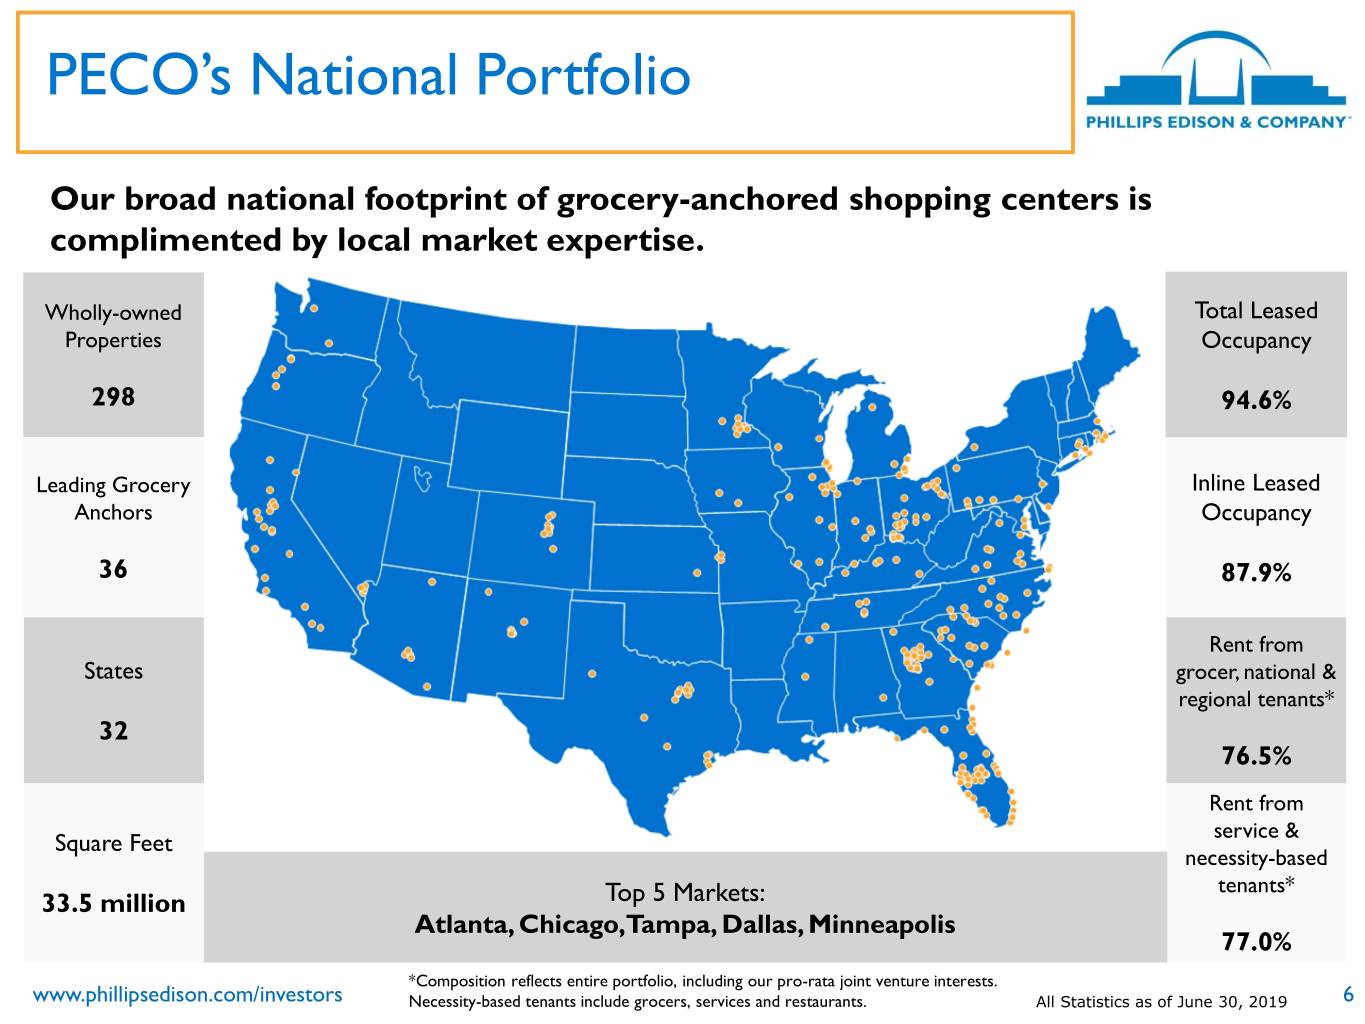
PECO’s National Portfolio Our broad national footprint of grocery-anchored shopping centers is complimented by local market expertise. Wholly-owned Total Leased Properties Occupancy 298 94.6% Leading Grocery Inline Leased Anchors Occupancy 36 87.9% Rent from States grocer, national & regional tenants* 32 76.5% Rent from service & Square Feet necessity-based tenants* 33.5 million Top 5 Markets: Atlanta, Chicago, Tampa, Dallas, Minneapolis 77.0% *Composition reflects entire portfolio, including our pro-rata joint venture interests. www.phillipsedison.com/investors Necessity-based tenants include grocers, services and restaurants. All Statistics as of June 30, 2019 6
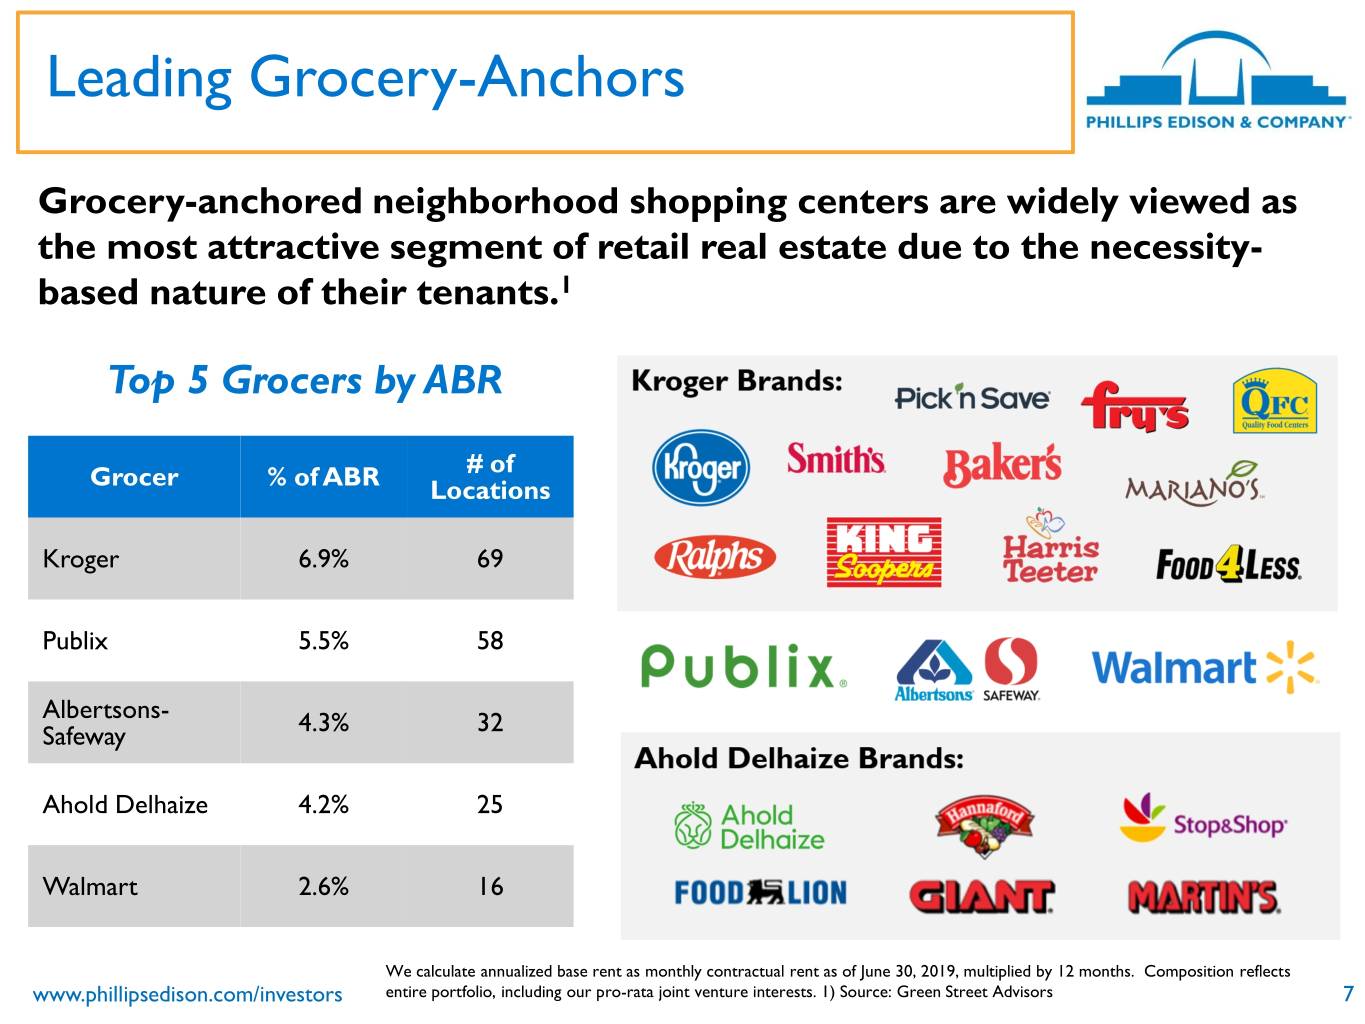
Leading Grocery-Anchors Grocery-anchored neighborhood shopping centers are widely viewed as the most attractive segment of retail real estate due to the necessity- based nature of their tenants.1 Top 5 Grocers by ABR Grocer % of ABR # of Locations Kroger 6.9% 69 Publix 5.5% 58 Albertsons- 4.3% 32 Safeway Ahold Delhaize 4.2% 25 Walmart 2.6% 16 We calculate annualized base rent as monthly contractual rent as of June 30, 2019, multiplied by 12 months. Composition reflects www.phillipsedison.com/investors entire portfolio, including our pro-rata joint venture interests. 1) Source: Green Street Advisors 7
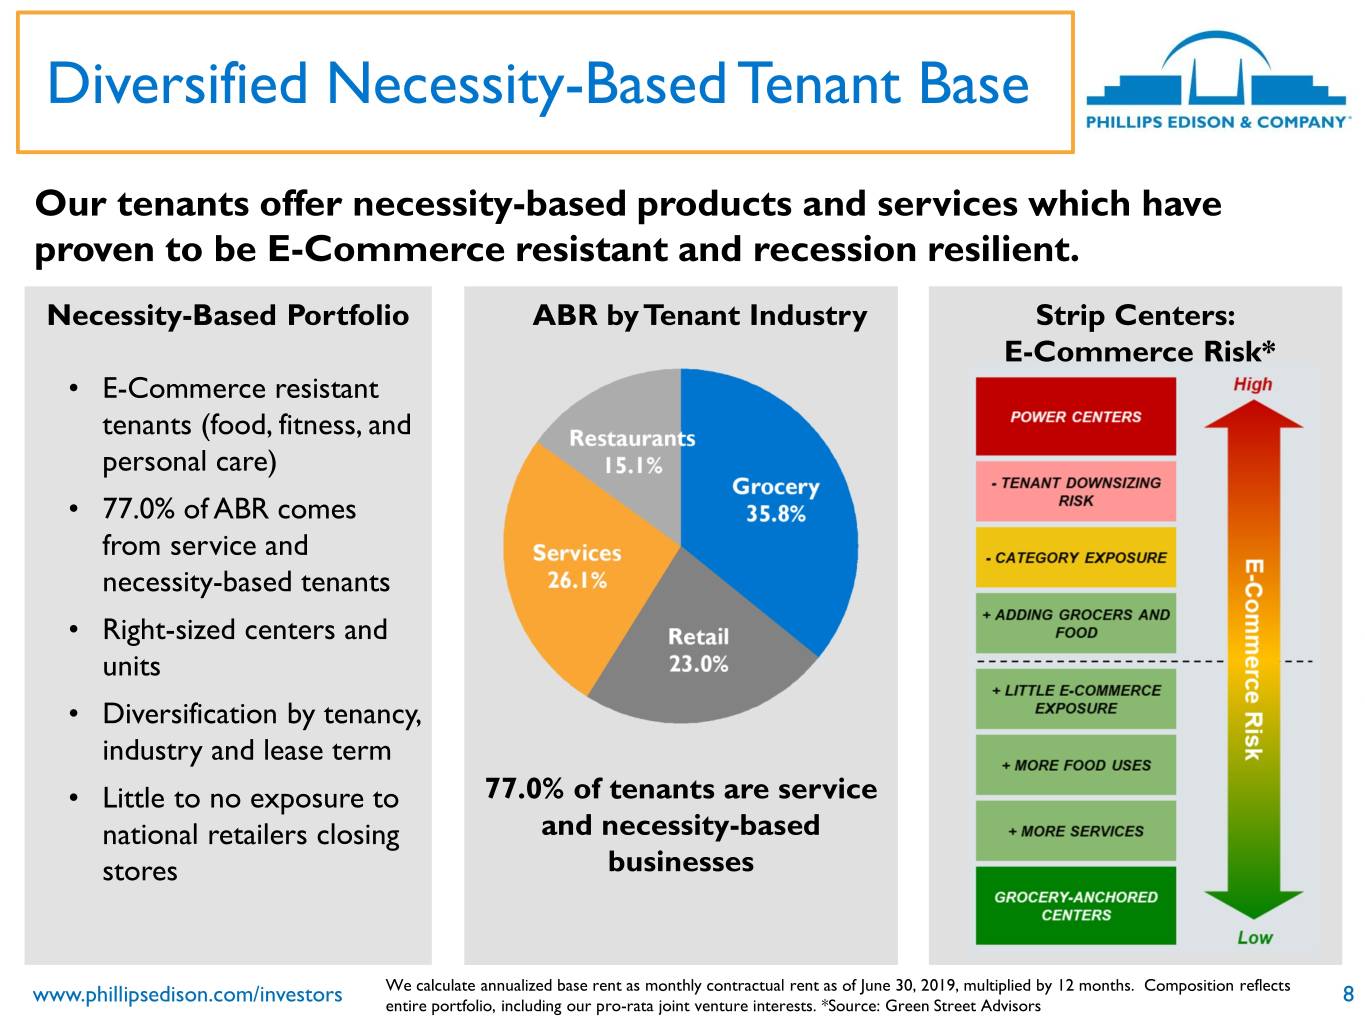
Diversified Necessity-Based Tenant Base Our tenants offer necessity-based products and services which have proven to be E-Commerce resistant and recession resilient. Necessity-Based Portfolio ABR by Tenant Industry Strip Centers: E-Commerce Risk* • E-Commerce resistant tenants (food, fitness, and personal care) • 77.0% of ABR comes from service and necessity-based tenants • Right-sized centers and units • Diversification by tenancy, industry and lease term • Little to no exposure to 77.0% of tenants are service national retailers closing and necessity-based stores businesses We calculate annualized base rent as monthly contractual rent as of June 30, 2019, multiplied by 12 months. Composition reflects www.phillipsedison.com/investors entire portfolio, including our pro-rata joint venture interests. *Source: Green Street Advisors 8

Q2 2019 Key Metrics (vs Q2 2018) Leased Portfolio Occupancy at June 30, 2019 vs June 30, 2018 Total: 94.6%; increased from 93.8% Anchor: 98.0%; stable at 98.0% In-line: 87.9%; increased from 85.7% Total ABR Inline ABR We calculate annualized base rent as monthly contractual rent as of June 30, 2019, and 2018 multiplied by 12 months. www.phillipsedison.com/investors Composition reflects entire portfolio, including our pro-rata joint venture interests. 9

Leases Signed with Necessity-based National Tenants During Q2 2019 www.phillipsedison.com/investors 10
Investment Management Business Our investment management business currently provides asset and real estate management for properties currently owned by third parties totaling approximately $725 million in value • Ongoing fee revenue provides consistent, recurring income streams and allows PECO to continue to grow without additional investment • Leverages and strengthens PECO’s operating platform to deliver property management, asset management, and tenant support services • Enhances the PECO brand with key constituencies in the private and public investor markets • Assets under management include: ⦁ Grocery Retail Partners I, LLC (“GRP I”) - joint venture (“JV”) with Northwestern Mutual ⦁ Grocery Retail Partners II, LLC (“GRP II”) - JV between Northwestern Mutual and Phillips Edison Grocery Center REIT III, Inc. ⦁ Necessity Retail Partners - JV with TPG Real Estate ⦁ Phillips Edison Grocery Center REIT III, Inc. ⦁ Phillips Edison Limited Partnership www.phillipsedison.com/investors 11
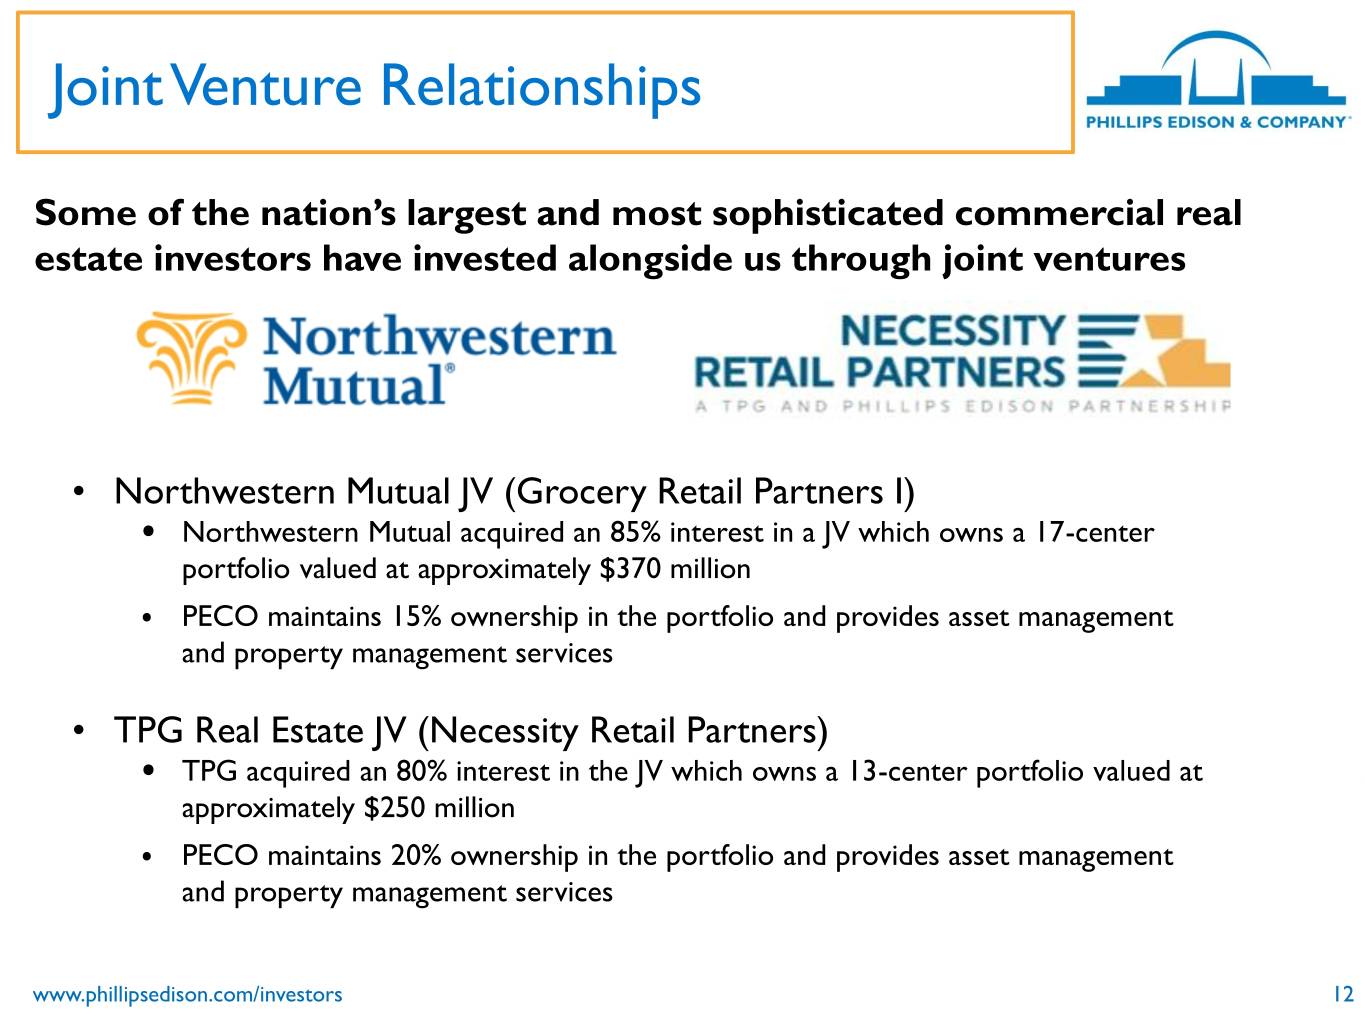
Joint Venture Relationships Some of the nation’s largest and most sophisticated commercial real estate investors have invested alongside us through joint ventures • Northwestern Mutual JV (Grocery Retail Partners I) ⦁ Northwestern Mutual acquired an 85% interest in a JV which owns a 17-center portfolio valued at approximately $370 million ⦁ PECO maintains 15% ownership in the portfolio and provides asset management and property management services • TPG Real Estate JV (Necessity Retail Partners) ⦁ TPG acquired an 80% interest in the JV which owns a 13-center portfolio valued at approximately $250 million ⦁ PECO maintains 20% ownership in the portfolio and provides asset management and property management services www.phillipsedison.com/investors 12

History of Adding Stockholder Value Estimated Value Per Distributions1 PECO Equity Multiple Share • Offering price: $10.00 • Current: $0.67/share (annualized) • Original PECO investors have seen total returns between • August 2019: $11.10 • 6.7% of offering price of $10.00 per share 48% and 99% on their • PECO’s Board recently authorized original investment monthly distributions for the next ⦁ Ranges from $3.67 and three months $8.76 per share2 • Over $1.1 Billion returned to stockholders in the form of REIT II Equity Multiple monthly distributions • Former REIT II investors • Our August 2019 distribution (now PECO investors) have marked 104 months of seen total returns between consecutive distributions 15% and 32% on their original investment3 1. Distributions are not guaranteed and are made at the discretion of PECO's board of directors. 2. Assumes investment in Phillips Edison & Company at $10.00 per share at the beginning of the initial public offering and distributions are reinvested, and an investment at the end of the offering, assuming distributions are taken in cash. 3. Assumes investment in Phillips Edison Grocery Center REIT II, Inc. at $25.00 per share at the beginning of the initial public offering and distributions are reinvested, and an investment at the end of the offering, assuming distributions are taken in cash www.phillipsedison.com/investors 13

Pro Forma Same-Center NOI Six Months Ended June 30, 2019 Six Months Ended Favorable June 30, (Unfavorable) (in thousands) 2019 2018 $ Change % Change Revenues:(1) Rental income(2) $ 184,159 $ 182,928 $ 1,231 0.7% Tenant recovery income 58,346 61,541 (3,195) (5.2)% Other property income 1,079 1,195 (116) (9.7)% Total Revenues 243,584 245,664 (2,080) (0.8)% Operating expenses:(1) Property operating expenses 35,575 38,466 2,891 7.5% Real estate taxes 34,209 36,871 2,662 7.2% Total Expenses 69,784 75,337 5,553 7.4% Total Pro Forma Same-Center NOI $ 173,800 $ 170,327 $ 3,473 2.0% 1. Same-Center represents 291 same-center properties, including 85 same-center properties acquired in the merger with REIT II. For additional information and details about REIT II Same-Center NOI included herein, as well as a reconciliation from Net Loss to NOI for owned real estate investments and Pro Forma Same-Center NOI, refer to the appendix of this presentation. 2. Excludes straight-line rental income, net amortization of above- and below-market leases, and lease buyout income. In accordance with ASC 842, revenue amounts deemed uncollectible are included in rental income for 2019 and property operating expense in 2018. www.phillipsedison.com/investors 14
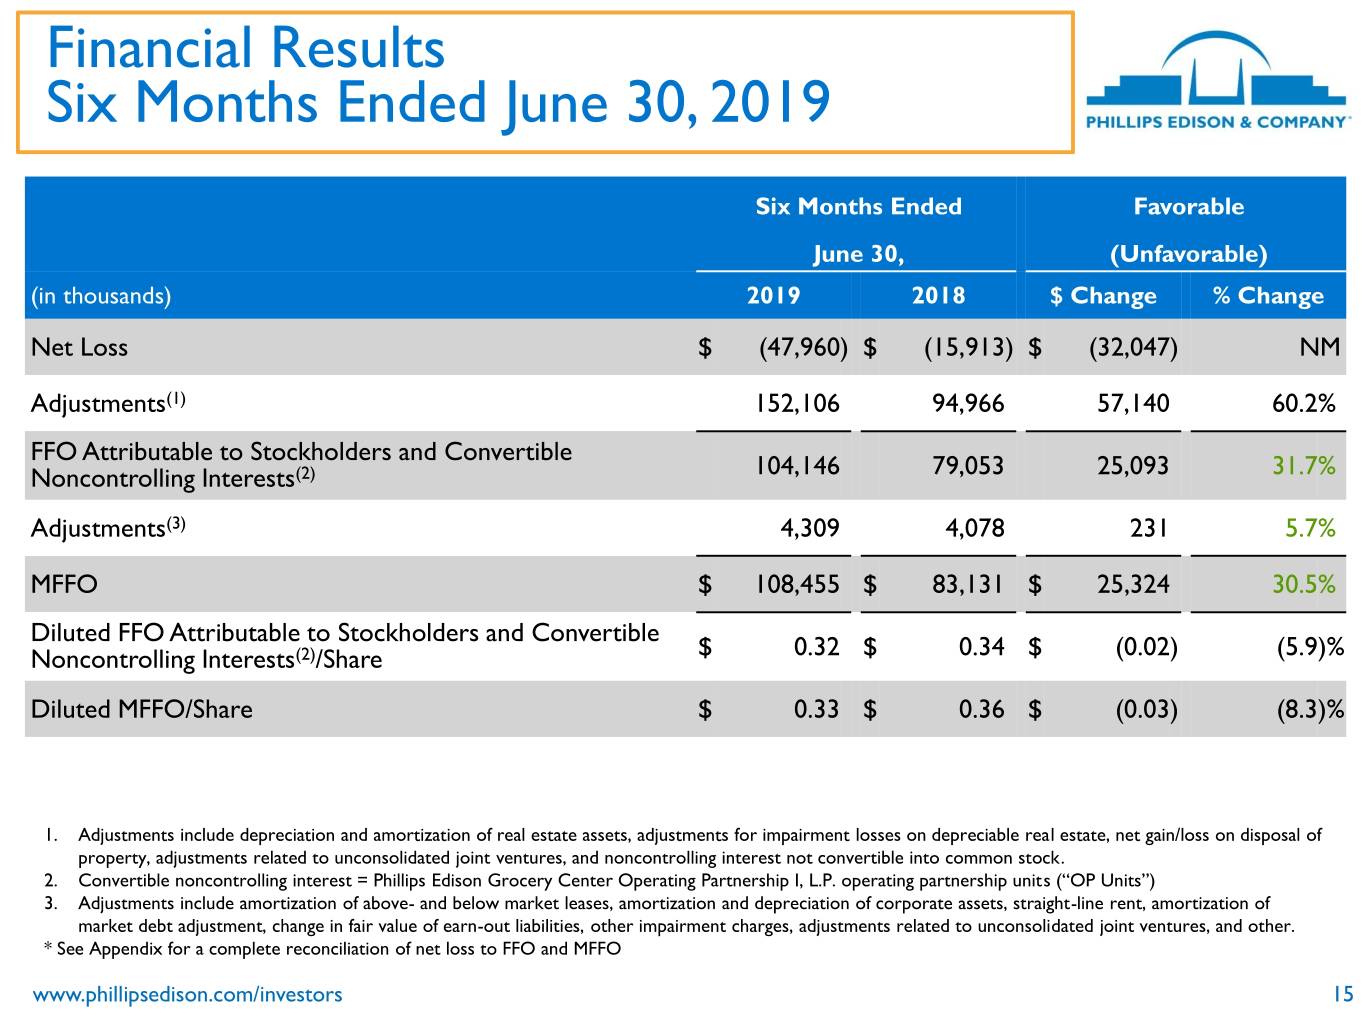
Financial Results Six Months Ended June 30, 2019 Six Months Ended Favorable June 30, (Unfavorable) (in thousands) 2019 2018 $ Change % Change Net Loss $ (47,960) $ (15,913) $ (32,047) NM Adjustments(1) 152,106 94,966 57,140 60.2% FFO Attributable to Stockholders and Convertible Noncontrolling Interests(2) 104,146 79,053 25,093 31.7% Adjustments(3) 4,309 4,078 231 5.7% MFFO $ 108,455 $ 83,131 $ 25,324 30.5% Diluted FFO Attributable to Stockholders and Convertible Noncontrolling Interests(2)/Share $ 0.32 $ 0.34 $ (0.02) (5.9)% Diluted MFFO/Share $ 0.33 $ 0.36 $ (0.03) (8.3)% 1. Adjustments include depreciation and amortization of real estate assets, adjustments for impairment losses on depreciable real estate, net gain/loss on disposal of property, adjustments related to unconsolidated joint ventures, and noncontrolling interest not convertible into common stock. 2. Convertible noncontrolling interest = Phillips Edison Grocery Center Operating Partnership I, L.P. operating partnership units (“OP Units”) 3. Adjustments include amortization of above- and below market leases, amortization and depreciation of corporate assets, straight-line rent, amortization of market debt adjustment, change in fair value of earn-out liabilities, other impairment charges, adjustments related to unconsolidated joint ventures, and other. * See Appendix for a complete reconciliation of net loss to FFO and MFFO www.phillipsedison.com/investors 15
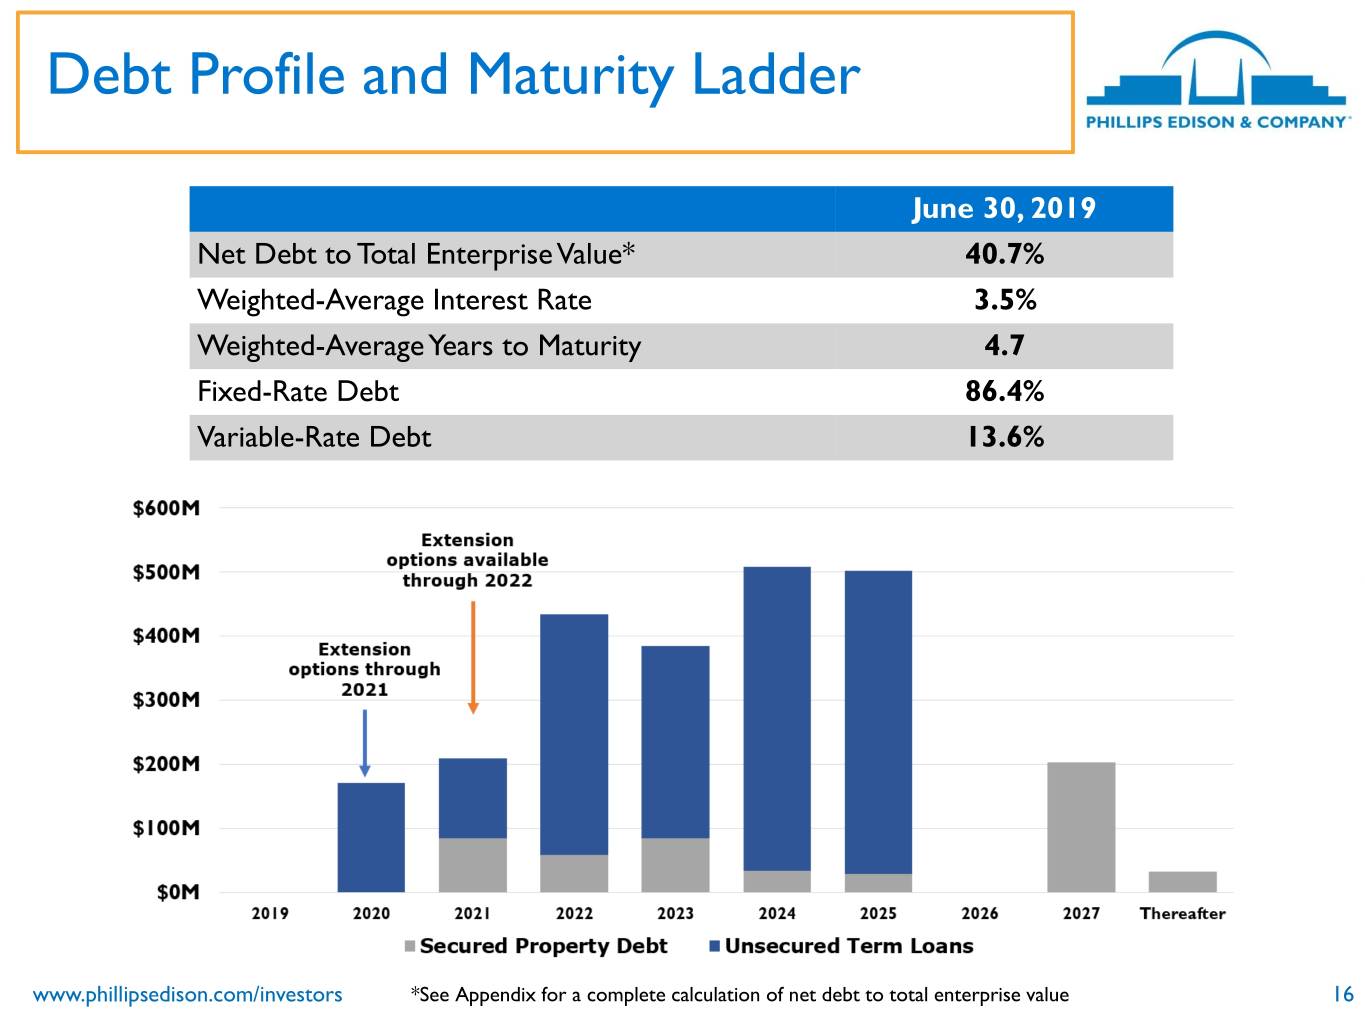
Debt Profile and Maturity Ladder June 30, 2019 Net Debt to Total Enterprise Value* 40.7% Weighted-Average Interest Rate 3.5% Weighted-Average Years to Maturity 4.7 Fixed-Rate Debt 86.4% Variable-Rate Debt 13.6% www.phillipsedison.com/investors *See Appendix for a complete calculation of net debt to total enterprise value 16

Share Repurchase Program - Activity • During the second quarter of 2019, we repurchased 541,000 shares totaling $6.0 million under the SRP ⦁ DDI: We fulfilled all repurchases sought upon a stockholder’s death, qualifying disability, or determination of incompetence (“DDI”) in accordance with the terms of the SRP ⦁ Standard: We did not have funding made available for standard repurchases • Subsequent to the quarter end, on July 31, 2019, we repurchased 1.2 million shares of common stock under the SRP ⦁ DDI: We fulfilled all repurchases sought upon a stockholder’s death, qualifying disability, or determination of incompetence (“DDI”) in accordance with the terms of the SRP for the month of July 2019 ⦁ Standard: On July 31, 2019, we processed a standard redemption at $11.10 per share under the SRP. Because standard repurchase requests surpassed funding available, we processed standard requests on a pro rata basis. www.phillipsedison.com/investors 17
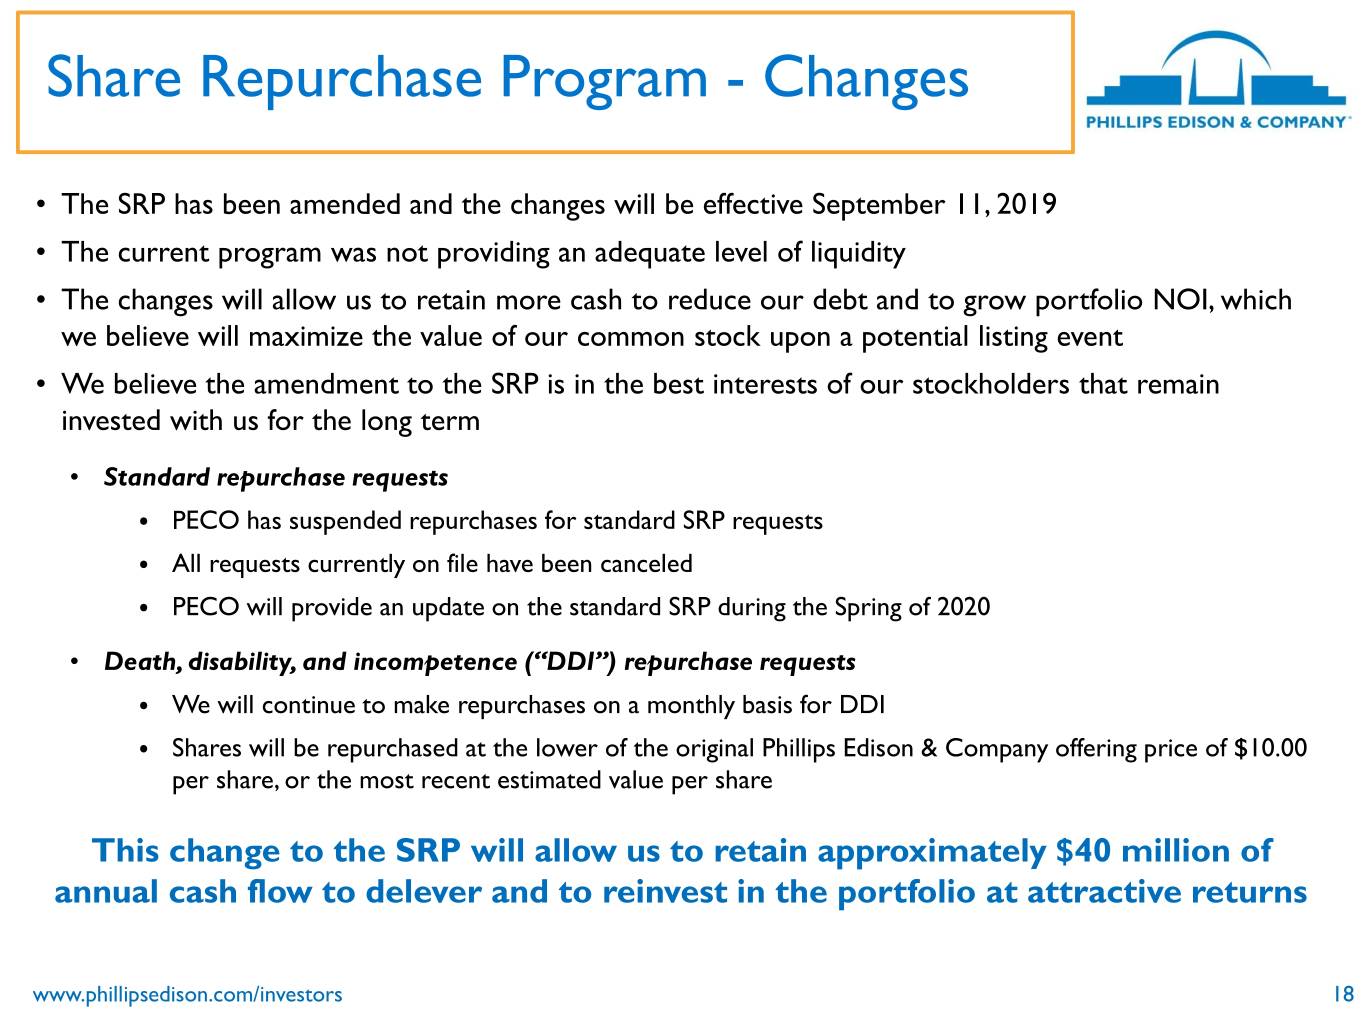
Share Repurchase Program - Changes • The SRP has been amended and the changes will be effective September 11, 2019 • The current program was not providing an adequate level of liquidity • The changes will allow us to retain more cash to reduce our debt and to grow portfolio NOI, which we believe will maximize the value of our common stock upon a potential listing event • We believe the amendment to the SRP is in the best interests of our stockholders that remain invested with us for the long term • Standard repurchase requests ⦁ PECO has suspended repurchases for standard SRP requests ⦁ All requests currently on file have been canceled ⦁ PECO will provide an update on the standard SRP during the Spring of 2020 • Death, disability, and incompetence (“DDI”) repurchase requests ⦁ We will continue to make repurchases on a monthly basis for DDI ⦁ Shares will be repurchased at the lower of the original Phillips Edison & Company offering price of $10.00 per share, or the most recent estimated value per share This change to the SRP will allow us to retain approximately $40 million of annual cash flow to delever and to reinvest in the portfolio at attractive returns www.phillipsedison.com/investors 18

Executive Changes and Board of Directors Additions Executive Changes (effective August 15, 2019) • CFO Devin Murphy has been promoted to President ⦁ Responsibilities include expanding our investment management business and managing our current joint ventures • Senior Vice President – Finance John Caulfield has been promoted to CFO and Treasurer ⦁ Responsibilities include day-to-day financial operations and our capital markets initiatives Adding Two New Board Members (effective November 1, 2019) • Elizabeth Fischer and Jane Silfen ⦁ Two new board members bring a breadth of finance, capital markets and diversified investment experience to our board, as well as sustainability and clean technology acumen ⦁ The addition of these two new independent directors increases the size of the board to nine members, with eight serving independently ⦁ New board members increase the diversity of our Board www.phillipsedison.com/investors 19

Summary 1. Improving operating fundamentals and growing NOI at the property level a. Leased portfolio occupancy increased to 94.6% from 93.2% at December 31, 2018 b. Pro forma same-center NOI grew 2.0% compared to June 30, 2018 c. Comparable new lease spreads were 10.5% and comparable renewal lease spreads were 10.8% for Q2 2. Active disposition program to improve the portfolio and delever a. Realized $50.1 million in gross proceeds from the sale of six properties and one outparcel during the first six months of 2019 b. Acquired one property (1031 exchange) and one outparcel for a total cost of $49.9 million during the first six months of 2019 c. Approximately $58 million in development/redevelopment pipeline expected to generate attractive returns on investment in excess of 15% d. Decreased our leverage to 40.7% compared to 42.2% at June 30, 2018 3. Grow our investment management business and its recurring high-margin revenue www.phillipsedison.com/investors 20
Phillips Edison Advisor Services We are pleased to inform you that Phillips Edison & Company’s Advisor Services team will begin serving as the main support resource for our financial advisors beginning Tuesday, September 3, 2019. Phillips Edison Advisor Services • (833) 347-5717 • Monday - Friday, 9 a.m. - 5 p.m. Eastern time The Phillips Edison Advisor Services team will serve in conjunction with our investor relations efforts currently offered by our transfer agent and record keeper, DST Systems, Inc. (“DST”). DST: Maintenance and Investor Services • (888) 518-8073 • Monday - Friday, 10 a.m. - 6 p.m. Eastern time www.phillipsedison.com/investors 21
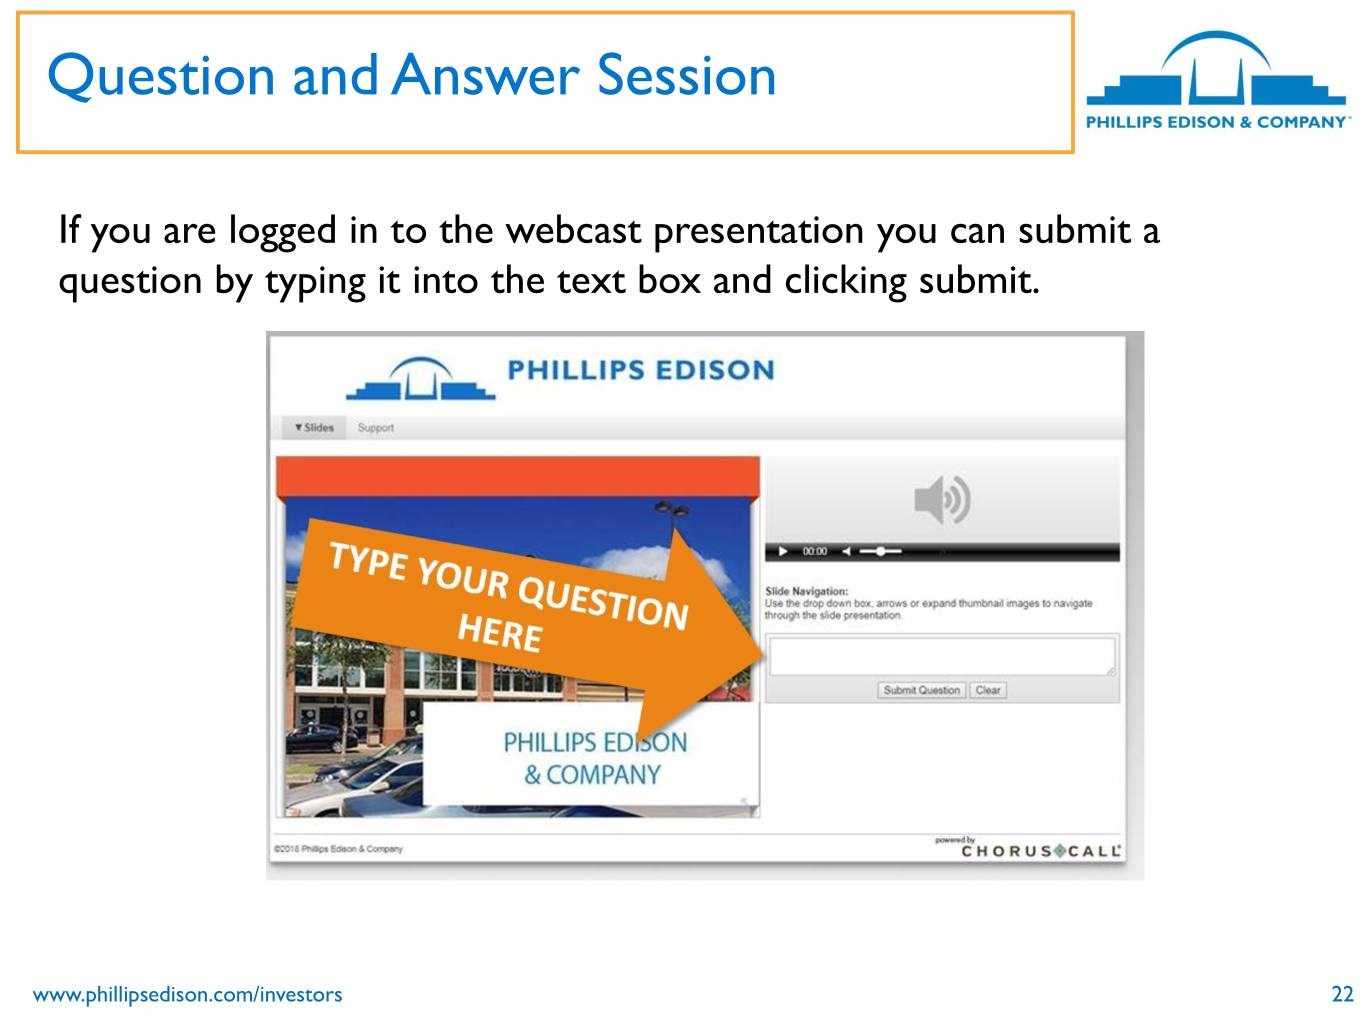
Question and Answer Session If you are logged in to the webcast presentation you can submit a question by typing it into the text box and clicking submit. www.phillipsedison.com/investors 22

For More Information: InvestorRelations@PhillipsEdison.com www.phillipsedison.com/investors Investor Services: (888) 518-8073 Phillips Edison Advisor Services: (833) 347-5717
Appendix

Non-GAAP Measures Same-Center NOI represents the NOI for the properties that were owned and operational for the entire portion of both comparable reporting periods. For purposes of evaluating Same-Center NOI on a comparative basis, we are presenting Pro Forma Same-Center NOI, which is Same-Center NOI on a pro forma basis as if the Merger had occurred on January 1, 2018. This perspective allows us to evaluate Same-Center NOI growth over a comparable period. As of June 30, 2019, we had 291 same-center properties, including 85 same-center properties acquired in the Merger. Pro Forma Same-Center NOI is not necessarily indicative of what actual Same-Center NOI and growth would have been if the Merger had occurred on January 1, 2018, nor does it purport to represent Same-Center NOI and growth for future periods. Pro Forma Same-Center NOI highlights operating trends such as occupancy rates, rental rates, and operating costs on properties that were operational for both comparable periods. Other REITs may use different methodologies for calculating Same-Center NOI, and accordingly, our Pro Forma Same-Center NOI may not be comparable to other REITs. Pro Forma Same-Center NOI should not be viewed as an alternative measure of our financial performance since it does not reflect the operations of our entire portfolio, nor does it reflect the impact of general and administrative expenses, acquisition expenses, depreciation and amortization, interest expense, other income, or the level of capital expenditures and leasing costs necessary to maintain the operating performance of our properties that could materially impact our results from operations. www.phillipsedison.com/investors 25

Non-GAAP Measures The table below provides Pro Forma Same-Center NOI (in thousands): Three Months Ended Favorable Six Months Ended Favorable June 30, (Unfavorable) June 30, (Unfavorable) (in thousands) 2019 2018 $ Change % Change 2019 2018 $ Change % Change Revenues:(1) Rental income(2) $ 92,448 $ 92,072 $ 376 0.4% $ 184,159 $ 182,928 $ 1,231 0.7% Tenant recovery income 28,452 29,908 (1,456) (4.9)% 58,346 61,541 (3,195) (5.2)% Other property income 458 508 (50) (9.8)% 1,079 1,195 (116) (9.7)% Total Revenues 121,358 122,488 (1,130) (0.9)% 243,584 245,664 (2,080) (0.8)% Operating expenses:(1) Property operating expenses 16,859 18,211 1,352 7.4% 35,575 38,466 2,891 7.5% Real estate taxes 17,488 18,585 1,097 5.9% 34,209 36,871 2,662 7.2% Total Expenses 34,347 36,796 2,449 6.7% 69,784 75,337 5,553 7.4% Total Pro Forma Same-Center NOI $ 87,011 $ 85,692 $ 1,319 1.5% $ 173,800 $ 170,327 $ 3,473 2.0% (1) Same-Center represents 291 same-center properties, including 85 same-center properties acquired in the merger with REIT II. For additional information and details about REIT II operating results included herein, as well as a reconciliation from Net Loss to NOI for owned real estate investments and Pro Forma Same-Center NOI, refer to the REIT II Same-Center NOI table. (2) Excludes straight-line rental income, net amortization of above- and below-market leases, and lease buyout income. In accordance with ASC 842, revenue amounts deemed uncollectible are included in rental income for 2019 and property operating expense in 2018. www.phillipsedison.com/investors 26
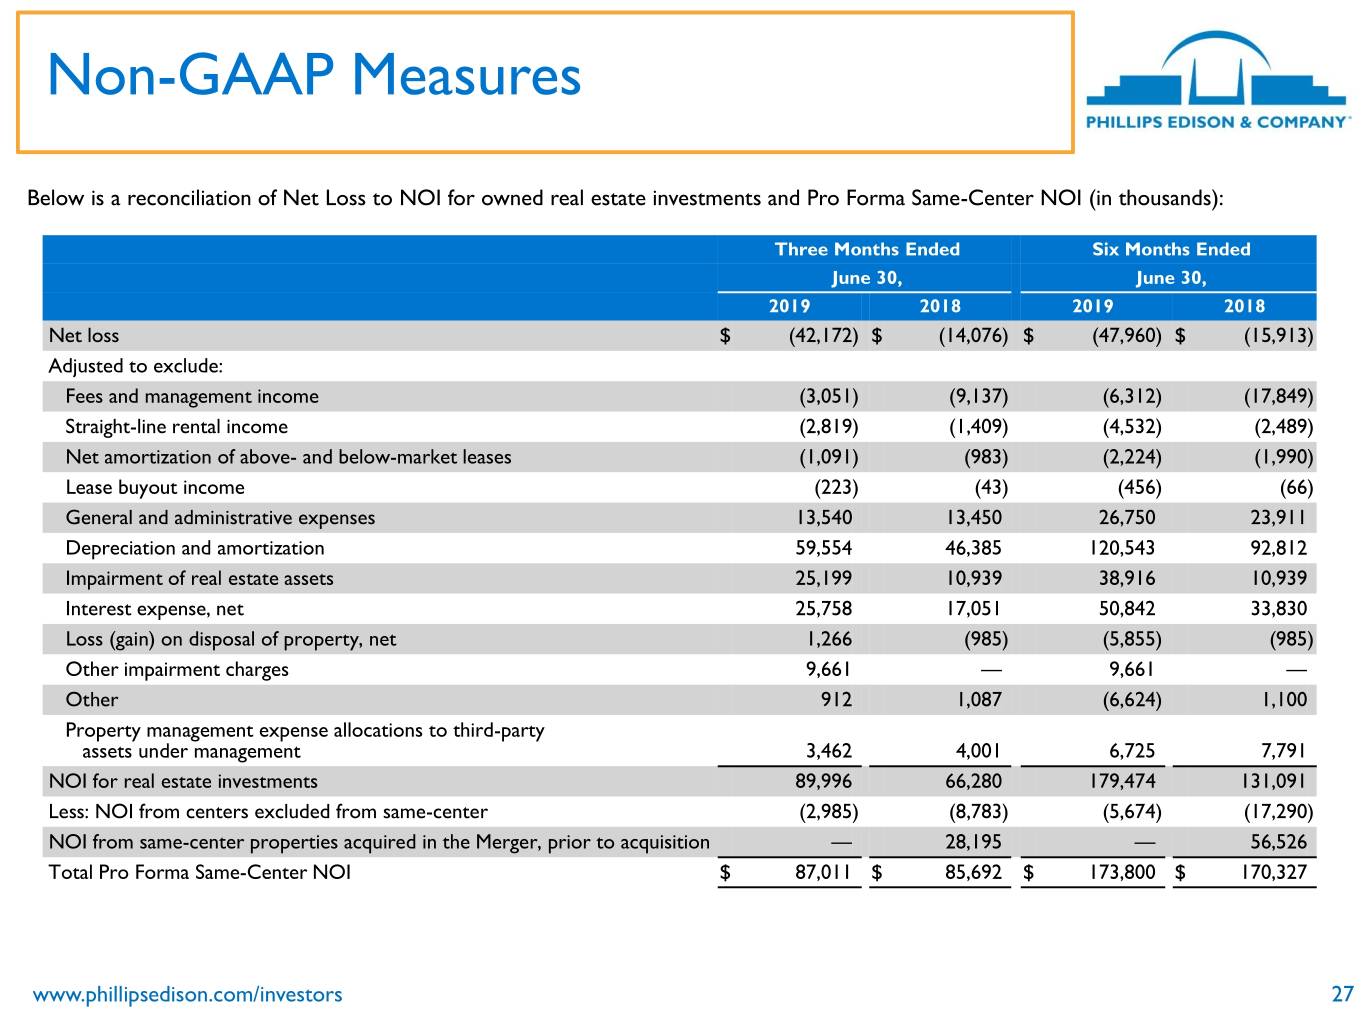
Non-GAAP Measures Below is a reconciliation of Net Loss to NOI for owned real estate investments and Pro Forma Same-Center NOI (in thousands): Three Months Ended Six Months Ended June 30, June 30, 2019 2018 2019 2018 Net loss $ (42,172) $ (14,076) $ (47,960) $ (15,913) Adjusted to exclude: Fees and management income (3,051) (9,137) (6,312) (17,849) Straight-line rental income (2,819) (1,409) (4,532) (2,489) Net amortization of above- and below-market leases (1,091) (983) (2,224) (1,990) Lease buyout income (223) (43) (456) (66) General and administrative expenses 13,540 13,450 26,750 23,911 Depreciation and amortization 59,554 46,385 120,543 92,812 Impairment of real estate assets 25,199 10,939 38,916 10,939 Interest expense, net 25,758 17,051 50,842 33,830 Loss (gain) on disposal of property, net 1,266 (985) (5,855) (985) Other impairment charges 9,661 — 9,661 — Other 912 1,087 (6,624) 1,100 Property management expense allocations to third-party assets under management 3,462 4,001 6,725 7,791 NOI for real estate investments 89,996 66,280 179,474 131,091 Less: NOI from centers excluded from same-center (2,985) (8,783) (5,674) (17,290) NOI from same-center properties acquired in the Merger, prior to acquisition — 28,195 — 56,526 Total Pro Forma Same-Center NOI $ 87,011 $ 85,692 $ 173,800 $ 170,327 www.phillipsedison.com/investors 27

Non-GAAP Measures NOI from the REIT II properties acquired in the Merger, prior to acquisition, was obtained from the accounting records of REIT II without adjustment. The accounting records were subject to internal review by us. The table below provides Same-Center NOI detail for the non- ownership period of REIT II (in thousands): Three Months Ended Six Months Ended June 30, 2018 June 30, 2018 Revenues: Rental income(1) $ 30,731 $ 61,304 Tenant recovery income 10,946 22,821 Other property income 172 443 Total revenues 41,849 84,568 Operating expenses: Property operating expenses 6,823 14,275 Real estate taxes 6,831 13,767 Total operating expenses 13,654 28,042 Total Same-Center NOI $ 28,195 $ 56,526 (1) Excludes straight-line rental income, net amortization of above- and below-market leases, and lease buyout income. www.phillipsedison.com/investors 28
Non-GAAP Measures Funds from Operations and Modified Funds from Operations FFO is a non-GAAP performance financial measure that is widely recognized as a measure of REIT operating performance. The National Association of Real Estate Investment Trusts (“NAREIT”) defines FFO as net income (loss) attributable to common stockholders computed in accordance with GAAP, excluding gains (or losses) from sales of property and gains (or losses) from change in control, plus depreciation and amortization, and after adjustments for impairment losses on depreciable real estate and impairments of in-substance real estate investments in investees that are driven by measurable decreases in the fair value of the depreciable real estate held by the unconsolidated partnerships and joint ventures. Adjustments for unconsolidated partnerships and joint ventures are calculated to reflect FFO on the same basis. We calculate FFO Attributable to Stockholders and Convertible Noncontrolling Interests in a manner consistent with the NAREIT definition, with an additional adjustment made for noncontrolling interests that are not convertible into common stock. MFFO is an additional performance financial measure used by us as FFO includes certain non-comparable items that affect our performance over time. We believe that MFFO is helpful in assisting management and investors with the assessment of the sustainability of operating performance in future periods. We believe it is more reflective of our core operating performance and provides an additional measure to compare our performance across reporting periods on a consistent basis by excluding items that may cause short-term fluctuations in net income (loss) but have no impact on cash flows. FFO, FFO Attributable to Stockholders and Convertible Noncontrolling Interests, and MFFO should not be considered alternatives to net income (loss) or income (loss) from continuing operations under GAAP, as an indication of our liquidity, nor as an indication of funds available to cover our cash needs, including our ability to fund distributions. MFFO may not be a useful measure of the impact of long-term operating performance on value if we do not continue to operate our business plan in the manner currently contemplated. Accordingly, FFO, FFO Attributable to Stockholders and Convertible Noncontrolling Interests, and MFFO should be reviewed in connection with other GAAP measurements, and should not be viewed as more prominent measures of performance than net income (loss) or cash flows from operations prepared in accordance with GAAP. Our FFO, FFO Attributable to Stockholders and Convertible Noncontrolling Interests, and MFFO, as presented, may not be comparable to amounts calculated by other REITs. www.phillipsedison.com/investors 29
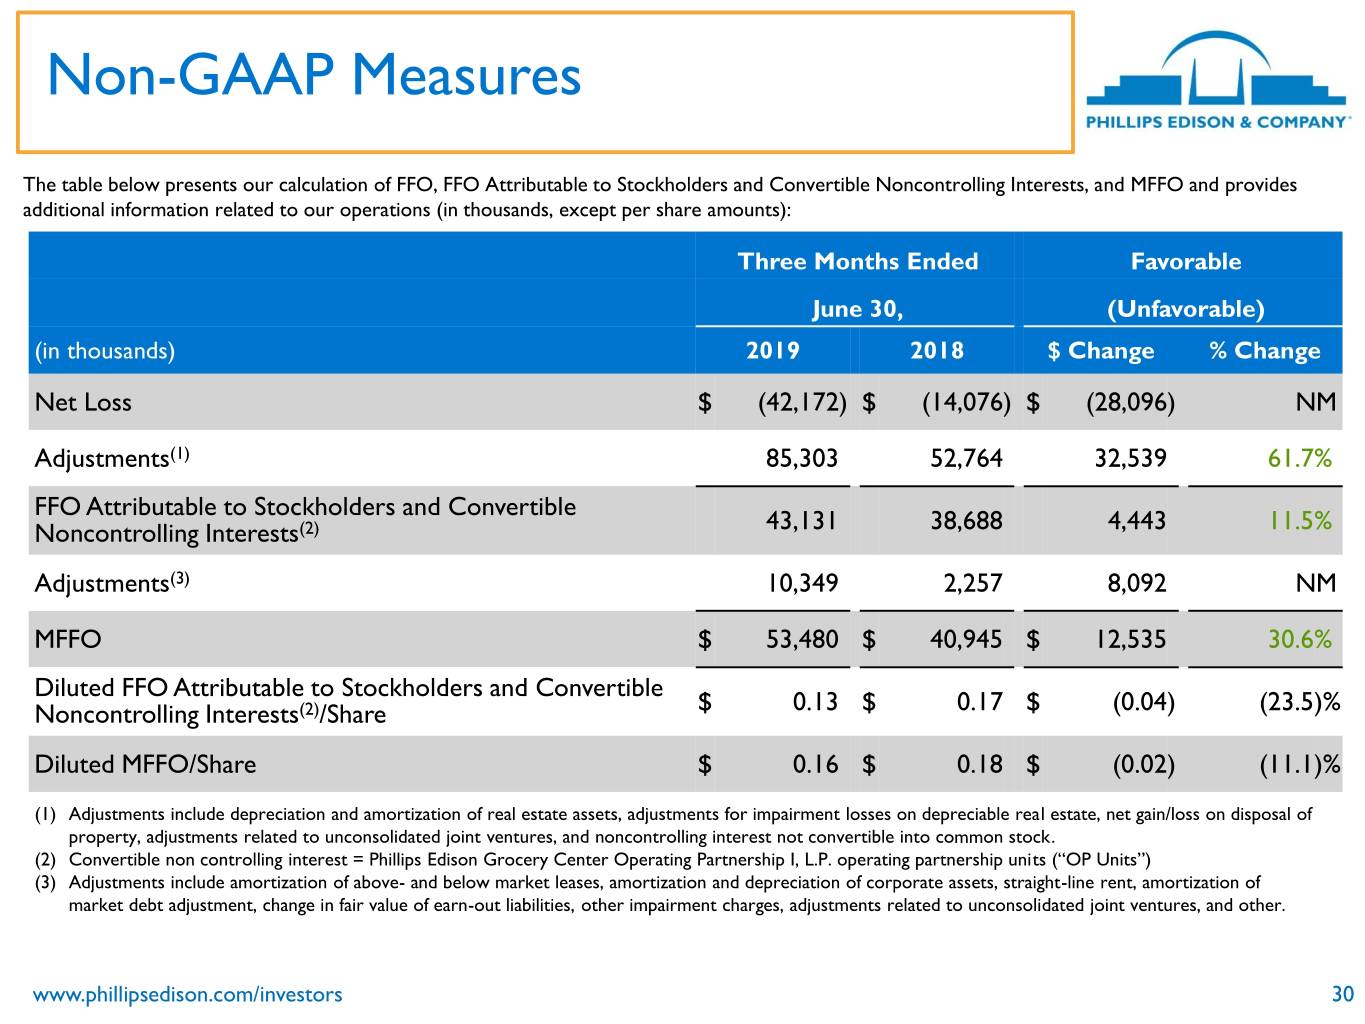
Non-GAAP Measures The table below presents our calculation of FFO, FFO Attributable to Stockholders and Convertible Noncontrolling Interests, and MFFO and provides additional information related to our operations (in thousands, except per share amounts): Three Months Ended Favorable June 30, (Unfavorable) (in thousands) 2019 2018 $ Change % Change Net Loss $ (42,172) $ (14,076) $ (28,096) NM Adjustments(1) 85,303 52,764 32,539 61.7% FFO Attributable to Stockholders and Convertible Noncontrolling Interests(2) 43,131 38,688 4,443 11.5% Adjustments(3) 10,349 2,257 8,092 NM MFFO $ 53,480 $ 40,945 $ 12,535 30.6% Diluted FFO Attributable to Stockholders and Convertible Noncontrolling Interests(2)/Share $ 0.13 $ 0.17 $ (0.04) (23.5)% Diluted MFFO/Share $ 0.16 $ 0.18 $ (0.02) (11.1)% (1) Adjustments include depreciation and amortization of real estate assets, adjustments for impairment losses on depreciable real estate, net gain/loss on disposal of property, adjustments related to unconsolidated joint ventures, and noncontrolling interest not convertible into common stock. (2) Convertible non controlling interest = Phillips Edison Grocery Center Operating Partnership I, L.P. operating partnership units (“OP Units”) (3) Adjustments include amortization of above- and below market leases, amortization and depreciation of corporate assets, straight-line rent, amortization of market debt adjustment, change in fair value of earn-out liabilities, other impairment charges, adjustments related to unconsolidated joint ventures, and other. www.phillipsedison.com/investors 30
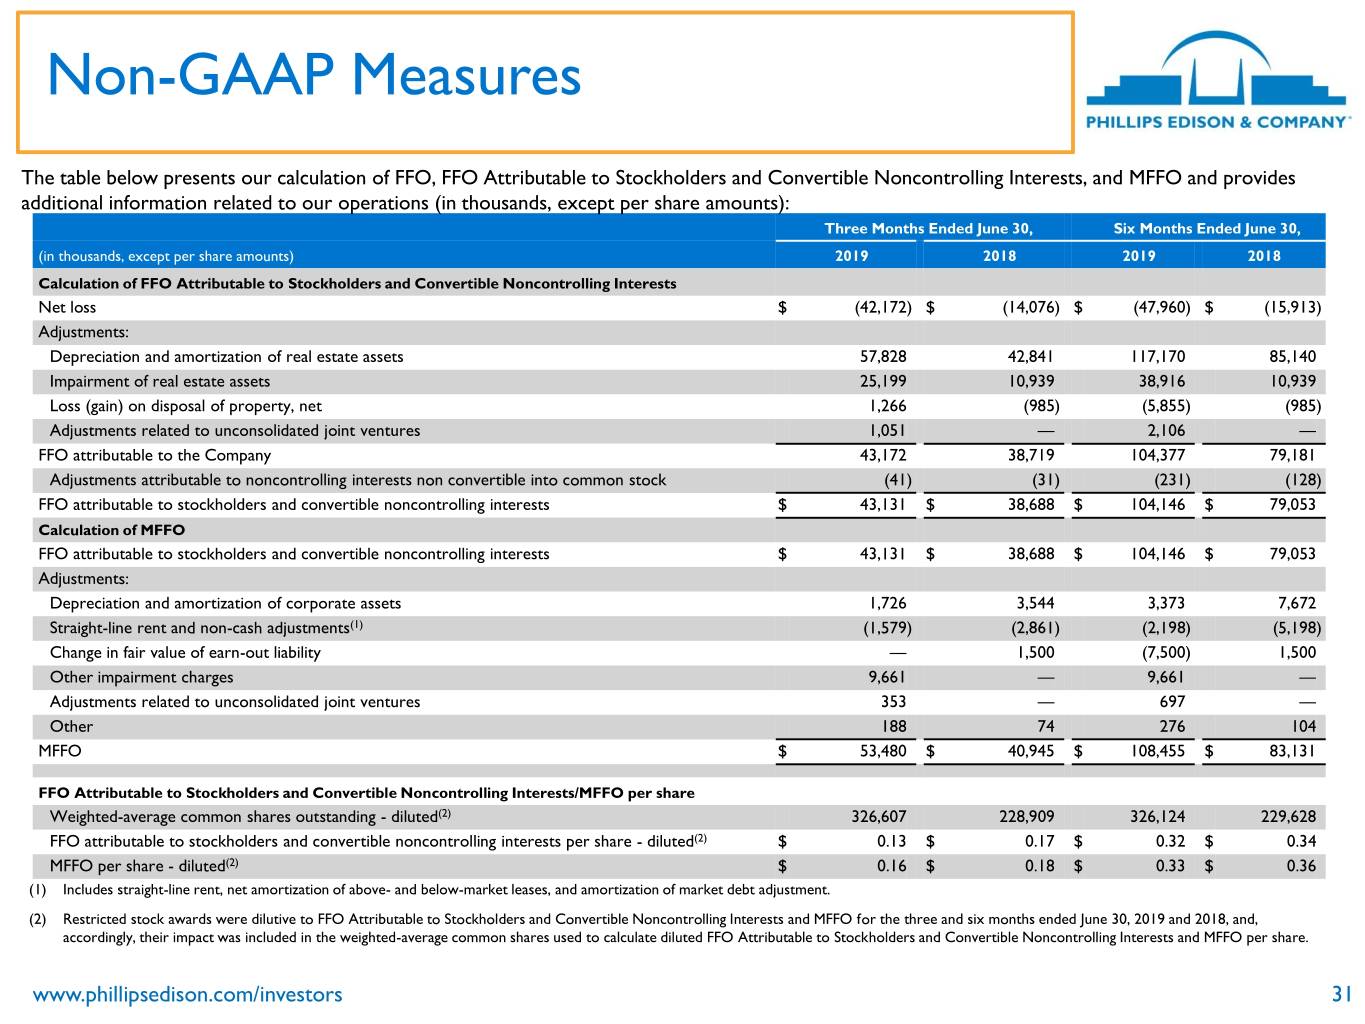
Non-GAAP Measures The table below presents our calculation of FFO, FFO Attributable to Stockholders and Convertible Noncontrolling Interests, and MFFO and provides additional information related to our operations (in thousands, except per share amounts): Three Months Ended June 30, Six Months Ended June 30, (in thousands, except per share amounts) 2019 2018 2019 2018 Calculation of FFO Attributable to Stockholders and Convertible Noncontrolling Interests Net loss $ (42,172) $ (14,076) $ (47,960) $ (15,913) Adjustments: Depreciation and amortization of real estate assets 57,828 42,841 117,170 85,140 Impairment of real estate assets 25,199 10,939 38,916 10,939 Loss (gain) on disposal of property, net 1,266 (985) (5,855) (985) Adjustments related to unconsolidated joint ventures 1,051 — 2,106 — FFO attributable to the Company 43,172 38,719 104,377 79,181 Adjustments attributable to noncontrolling interests non convertible into common stock (41) (31) (231) (128) FFO attributable to stockholders and convertible noncontrolling interests $ 43,131 $ 38,688 $ 104,146 $ 79,053 Calculation of MFFO FFO attributable to stockholders and convertible noncontrolling interests $ 43,131 $ 38,688 $ 104,146 $ 79,053 Adjustments: Depreciation and amortization of corporate assets 1,726 3,544 3,373 7,672 Straight-line rent and non-cash adjustments(1) (1,579) (2,861) (2,198) (5,198) Change in fair value of earn-out liability — 1,500 (7,500) 1,500 Other impairment charges 9,661 — 9,661 — Adjustments related to unconsolidated joint ventures 353 — 697 — Other 188 74 276 104 MFFO $ 53,480 $ 40,945 $ 108,455 $ 83,131 FFO Attributable to Stockholders and Convertible Noncontrolling Interests/MFFO per share Weighted-average common shares outstanding - diluted(2) 326,607 228,909 326,124 229,628 FFO attributable to stockholders and convertible noncontrolling interests per share - diluted(2) $ 0.13 $ 0.17 $ 0.32 $ 0.34 MFFO per share - diluted(2) $ 0.16 $ 0.18 $ 0.33 $ 0.36 (1) Includes straight-line rent, net amortization of above- and below-market leases, and amortization of market debt adjustment. (2) Restricted stock awards were dilutive to FFO Attributable to Stockholders and Convertible Noncontrolling Interests and MFFO for the three and six months ended June 30, 2019 and 2018, and, accordingly, their impact was included in the weighted-average common shares used to calculate diluted FFO Attributable to Stockholders and Convertible Noncontrolling Interests and MFFO per share. www.phillipsedison.com/investors 31

Non-GAAP Measures Our debt is subject to certain covenants and, as of June 30, 2019, we were in compliance with the restrictive covenants of our outstanding debt obligations. We expect to continue to meet the requirements of our debt covenants over the short- and long-term. Our debt to total enterprise value and debt covenant compliance as of June 30, 2019, allow us access to future borrowings as needed. The following table presents our calculation of net debt to total enterprise value, inclusive of our prorated portion of net debt owned through our joint ventures, as of June 30, 2019, December 31, 2018, and June 30, 2018 (dollars in thousands): June 30, 2019 December 31, 2018 June 30, 2018 Net debt: Total debt, excluding below-market adjustments and deferred financing expenses $ 2,504,389 $ 2,522,432 $ 1,847,983 Less: Cash and cash equivalents 18,492 18,186 8,310 Total net debt $ 2,485,897 $ 2,504,246 $ 1,839,673 Enterprise Value: Total net debt $ 2,485,897 $ 2,504,246 $ 1,839,673 Total equity value(1) 3,627,314 3,583,029 2,517,544 Total enterprise value $ 6,113,211 $ 6,087,275 $ 4,357,217 Net debt to total enterprise value 40.7% 41.1% 42.2% (1) Total equity value is calculated as the product of the number of diluted shares outstanding and the estimated value per share at the end of the period. There were 326.8 million, 324.6 million, and 227.8 million diluted shares outstanding as of June 30, 2019, December 31, 2018, and June 30, 2018, respectively. www.phillipsedison.com/investors 32


