Exhibit 99.1

GOLUB CAPITAL BDC, INC. INVESTOR PRESENTATION QUARTER ENDED JUNE 30, 2020

Disclaimer Some of the statements in this presentation constitute forward - looking statements, which relate to future events or our future performance or financial condition . The forward - looking statements contained in this presentation involve risks and uncertainties, including statements as to : our future operating results ; our business prospects and the prospects of our portfolio companies including our and their ability to achieve our and their respective objectives as a result of the coronavirus ("COVID - 19 ") pandemic ; the effect of investments that we expect to make and the competition for those investments ; our contractual arrangements and relationships with third parties ; actual and potential conflicts of interest with GC Advisors LLC ("GC Advisors"), our investment adviser, and other affiliates of Golub Capital LLC (collectively, "Golub Capital") ; the dependence of our future success on the general economy and its effect on the industries in which we invest ; the ability of our portfolio companies to achieve their objectives ; the use of borrowed money to finance a portion of our investments and the effect of the COVID - 19 pandemic on the availability of equity and debt capital and our use of borrowed funds to finance a portion of our investments ; the adequacy of our financing sources and working capital ; the timing of cash flows, if any, from the operations of our portfolio companies ; general economic and political trends and other external factors, including the COVID - 19 pandemic ; changes in political, economic or industry conditions, the interest rate environment or conditions affecting the financial and capital markets that could result in changes to the value of our assets, including changes from the impact of the COVID - 19 pandemic ; the ability of GC Advisors to locate suitable investments for us and to monitor and administer our investments ; the ability of GC Advisors or its affiliates to attract and retain highly talented professionals ; the ability of GC Advisors to continue to effectively manage our business due to the disruptions caused by the COVID - 19 pandemic ; our ability to qualify and maintain our qualification as a regulated investment company and as a business development company ; general price and volume fluctuations in the stock market ; the impact on our business of the Dodd - Frank Wall Street Reform and Consumer Protection Act and the rules and regulations issued thereunder and any actions toward repeal thereof ; and the effect of changes to tax legislation and our tax position . Such forward - looking statements may include statements preceded by, followed by or that otherwise include the words “may,” “might,” “will,” “intend,” “should,” “could,” “can,” “would,” “expect,” “believe,” “estimate,” “anticipate,” “predict,” “potential,” “plan” or similar words . We have based the forward - looking statements included in this presentation on information available to us on the date of this presentation . Actual results could differ materially from those anticipated in our forward - looking statements and future results could differ materially from historical performance . We undertake no obligation to revise or update any forward - looking statements, whether as a result of new information, future events or otherwise . You are advised to consult any additional disclosures that we may make directly to you or through reports that we have filed or in the future may file with the Securities and Exchange Commission (“SEC”), including annual reports on Form 10 - K, registration statements on Form N - 2 , quarterly reports on Form 10 - Q and current reports on Form 8 - K . This presentation contains statistics and other data that have been obtained from or compiled from information made available by third - party service providers . We have not independently verified such statistics or data . In evaluating prior performance information in this presentation, you should remember that past performance is not a guarantee, prediction, or projection of future results, and there can be no assurance that we will achieve similar results in the future . 2

Summary of Financial Results vs. Preliminary Estimates 01
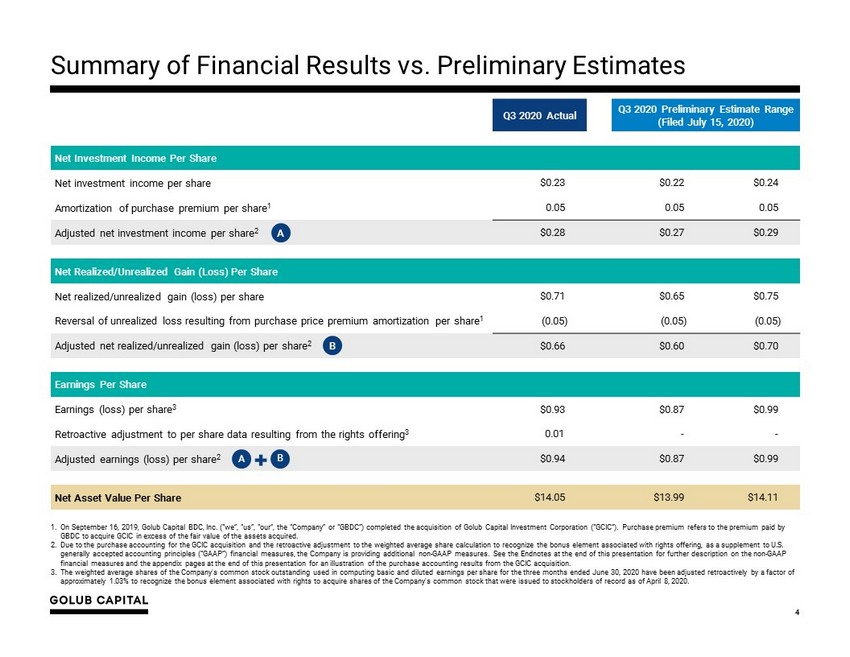
4 Summary of Financial Results vs. Preliminary Estimates 1. On September 16, 2019, Golub Capital BDC, Inc. (“we”, “us”, “our”, the “Company” or “GBDC”) completed the acquisition of Golu b C apital Investment Corporation (“GCIC”). Purchase premium refers to the premium paid by GBDC to acquire GCIC in excess of the fair value of the assets acquired. 2. Due to the purchase accounting for the GCIC acquisition and the retroactive adjustment to the weighted average share calculat ion to recognize the bonus element associated with rights offering, a s a supplement to U.S. generally accepted accounting principles (“GAAP”) financial measures, the Company is providing additional non - GAAP measures. Se e the Endnotes at the end of this presentation for further description on the non - GAAP financial measures and the appendix pages at the end of this presentation for an illustration of the purchase accounting resu lts from the GCIC acquisition. 3. The weighted average shares of the Company's common stock outstanding used in computing basic and diluted earnings per share for the three months ended June 30, 2020 have been adjusted retroactively by a factor of approximately 1.03% to recognize the bonus element associated with rights to acquire shares of the Company's common stock tha t w ere issued to stockholders of record as of April 8, 2020. Q3 2020 Actual Q3 2020 Preliminary Estimate Range (Filed July 15, 2020) Net Investment Income Per Share Net investment income per share $0.23 $0.22 $0.24 Amortization of purchase premium per share 1 0.05 0.05 0.05 Adjusted net investment income per share 2 $0.28 $0.27 $0.29 Net Realized/Unrealized Gain (Loss) Per Share Net realized /unrealized gain (loss) per share $0.71 $0.65 $0.75 Reversal of unrealized loss resulting from purchase price premium amortization per share 1 (0.05) (0.05) (0.05) Adjusted net realized/unrealized gain (loss) per share 2 $0.66 $0.60 $0.70 Earnings Per Share Earnings (loss) per share 3 $0.93 $0.87 $0.99 Retroactive adjustment to per share data resulting from the rights offering 3 0.01 - - Adjusted earnings (loss) per share 2 $0.94 $0.87 $0.99 Net Asset Value Per Share $14.05 $13.99 $14.11 A B A B
GBDC Performance Drivers 02

Drivers of GBDC’s Strong FQ3 2020 Earnings 6 □ Improved internal performance ratings 1 □ Low new non - accruals 2 □ Low net realized losses 3 □ Solid net unrealized gains, reversing a portion of FQ2 2020 unrealized losses 3 Key Themes from FQ3 2020 Impact on GBDC □ U.S. economy began reopening sooner than anticipated □ GBDC portfolio companies generally performed better than expected, especially those in COVID - impacted subsectors □ Private equity sponsors generally have stepped up to support their portfolio companies 1. Please see page titled, “Earlier U.S. Reopening, Improved Borrower Performance and Increased Sponsor Support Drove Positive Trends in GBDC’s Risk Rat ing s”. 2. Please see page titled, “Portfolio Highlights – Credit Quality”. 3. Please see page titled, “Low Net Realized Losses and Strong Unrealized Gains Drove a NAV Per Share Increase from March 31 NAV Pr o Forma for Rights Offering”.
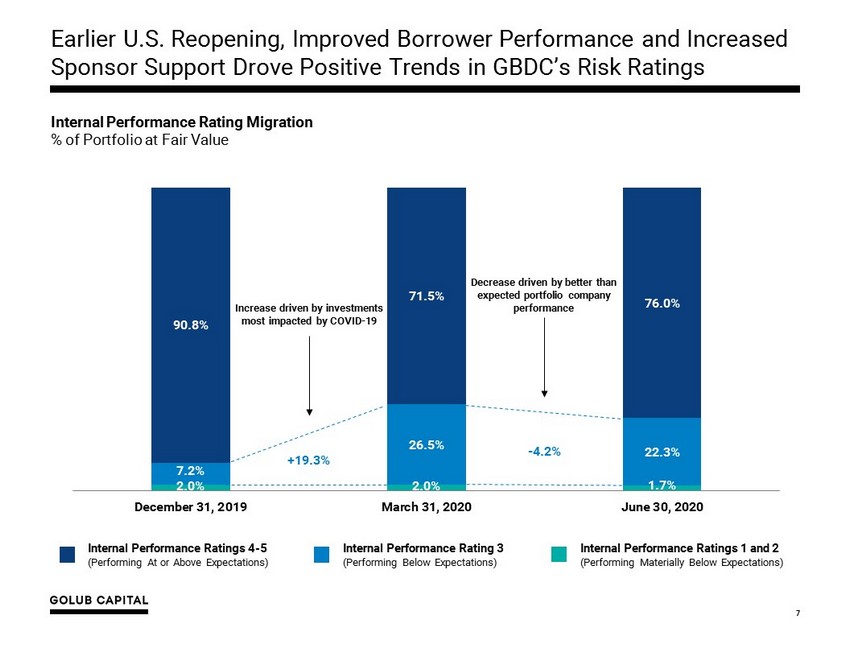
Earlier U.S. Reopening, Improved Borrower Performance and Increased Sponsor Support Drove Positive Trends in GBDC’s Risk Ratings 7 Internal Performance Rating Migration % of Portfolio at Fair Value 2.0% 2.0% 1.7% 7.2% 26.5% 22.3% 90.8% 71.5% 76.0% December 31, 2019 March 31, 2020 June 30, 2020 Internal Performance Ratings 4 - 5 (Performing At or Above Expectations) Internal Performance Rating 3 (Performing Below Expectations) Internal Performance Ratings 1 and 2 (Performing Materially Below Expectations) +19.3% Increase driven by investments most impacted by COVID - 19 - 4.2% Decrease driven by better than expected portfolio company performance

$14.62 $13.49 $14.05 $0.28 $0.74 ( $1.13 ) ( $0.29 ) ( $0.03 ) ( $0.05 ) ( $0.09 ) 3/31/20 NAV 3/31/20 Pro Forma NAV after Dilution from the Rights Offering¹ Adjusted NII² FQ3 2020 Dividend Net Realized Gain (Loss) on Investments Net Change in Unrealized Apprecication (Depreciation) on Investments Net Reversal of Realized/Unrealized Loss Resulting from the Purchase Premium³ Other Changes in Net Unrealized Depreciation⁴ 6/30/20 NAV Note: Footnotes located in the Endnotes at the end of this presentation. Low Net Realized Losses and Strong Unrealized Gains Drove a NAV Per Share Increase from March 31 NAV Pro Forma for Rights Offering 8 NAV Per Share Bridge Net Realized & Unrealized Gain: $0.71 $0.23 NII + $0.05 Reversal of Amortization of Purchase Premium
Navigating COVID - 19: Strategic Response Update 03
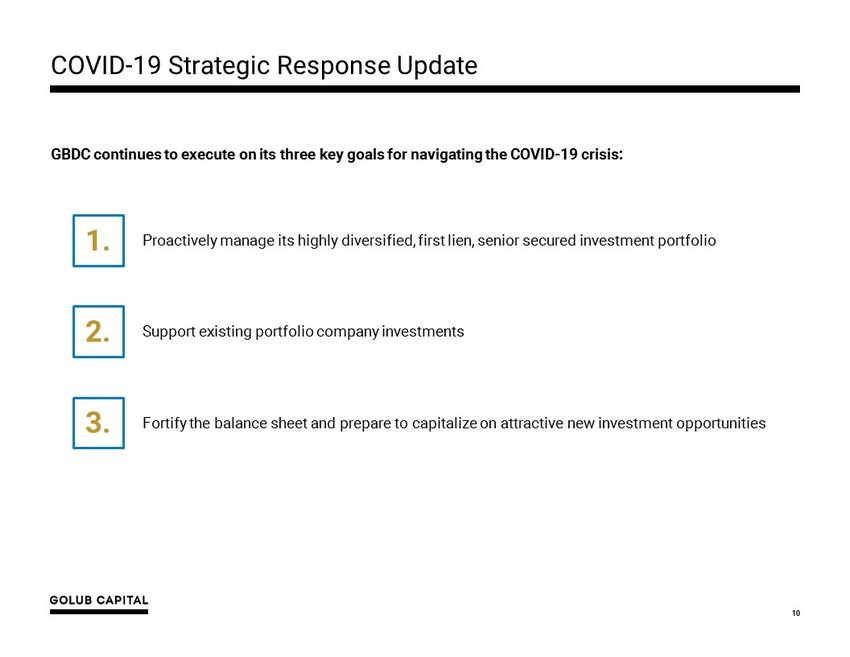
COVID - 19 Strategic Response Update 10 1. Proactively manage its highly diversified, first lien, senior secured investment portfolio 2. Support existing portfolio company investments 3. Fortify the balance sheet and prepare to capitalize on attractive new investment opportunities GBDC continues to execute on its three key goals for navigating the COVID - 19 crisis:
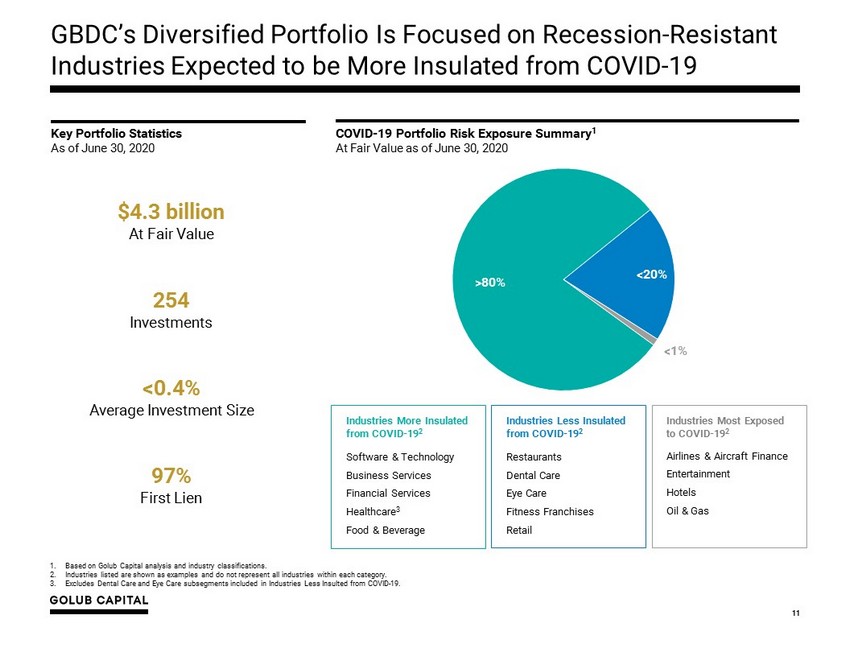
1. Based on Golub Capital analysis and industry classifications. 2. Industries listed are shown as examples and do not represent all industries within each category. 3. Excludes Dental Care and Eye Care subsegments included in Industries Less Insulted from COVID - 19. GBDC’s Diversified Portfolio Is Focused on Recession - Resistant Industries Expected to be More Insulated from COVID - 19 11 $4.3 billion At Fair Value 254 Investments <0.4% Average Investment Size 97% First Lien >80% < 20% < 1% COVID - 19 Portfolio Risk Exposure Summary 1 At Fair V alue as of June 30, 2020 Key Portfolio Statistics As of June 30, 2020 Industries More Insulated from COVID - 19 2 Software & Technology Business Services Financial Services Healthcare 3 Food & Beverage Industries Less Insulated from COVID - 19 2 Restaurants Dental Care Eye Care Fitness Franchises Retail Industries Most Exposed to COVID - 19 2 Airlines & Aircraft Finance Entertainment Hotels Oil & Gas
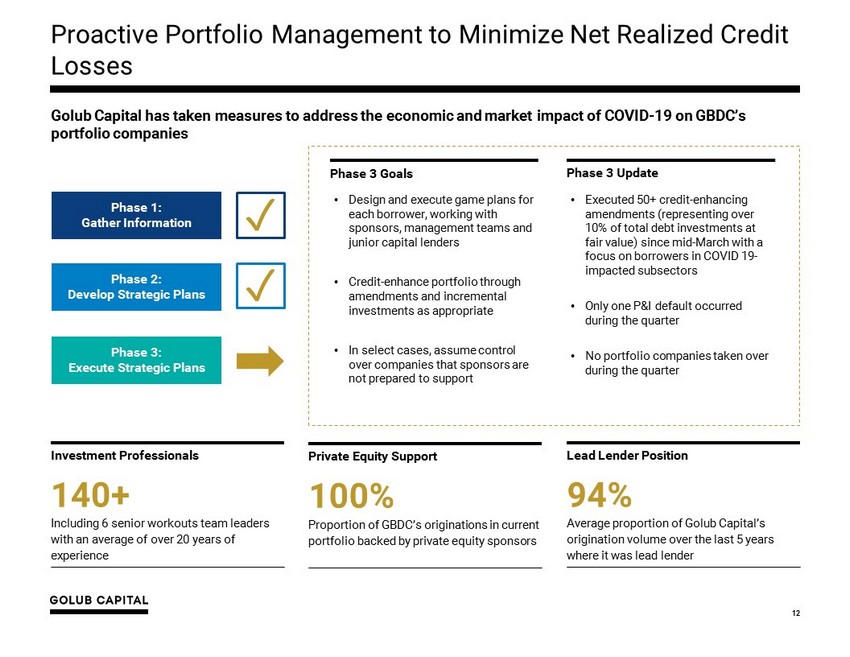
Proactive Portfolio Management to Minimize Net Realized Credit Losses 12 Golub Capital has taken measures to address the economic and market impact of COVID - 19 on GBDC’s portfolio companies 140+ Including 6 senior workouts team leaders with an average of over 20 years of experience Investment Professionals Private Equity Support 100% Proportion of GBDC’s originations in current portfolio backed by private equity sponsors Lead Lender Position 94% Average proportion of Golub Capital’s origination volume over the last 5 years where it was lead lender Phase 1: Gather Information Phase 2: Develop Strategic Plans Phase 3: Execute Strategic Plans • Design and execute game plans for each borrower, working with sponsors, management teams and junior capital lenders • Credit - enhance portfolio through amendments and incremental investments as appropriate • In select cases, assume control over companies that sponsors are not prepared to support • Executed 50+ credit - enhancing amendments (representing over 10% of total debt investments at fair value) since mid - March with a focus on borrowers in COVID 19 - impacted subsectors • Only one P &I default occurred during the quarter • No portfolio companies taken over during the quarter ✓ ✓ Phase 3 Goals Phase 3 Update

13 Increasing Opportunity Set for Credit - Enhancing Incremental Investments Credit Enhancement (vs. Existing Investment) ― Higher spreads ― Enhanced downside protection Company B Company A Situation Overview ― Company was seeking continued ability to do acquisitions by extending the term of its delayed draw term loan (“DDTL”) ― Company deemed an “essential” service with stable performance We expect to have significant opportunities to credit - enhance our portfolio through amendments and incremental investments Situation Overview ― Company was experiencing COVID - related revenue declines and was seeking incremental liquidity Credit Enhancement (vs. Existing Investment) ― Higher spreads ― Enhanced downside protection Illustrative Examples Credit - Enhancing Solution ― Golub Capital agreed to extend the DDTL in conjunction with a commitment by the sponsor to contribute additional equity and a repricing of the existing facility Credit - Enhancing Solution ― Golub Capital agreed to covenant relief in connection with an incremental investment by the sponsor, agreement by the junior lenders to defer interest, and increased pricing for senior lenders Note: Not all investments will have all the above characteristics. Past performance does not guarantee future results. Source: Golub Capital.
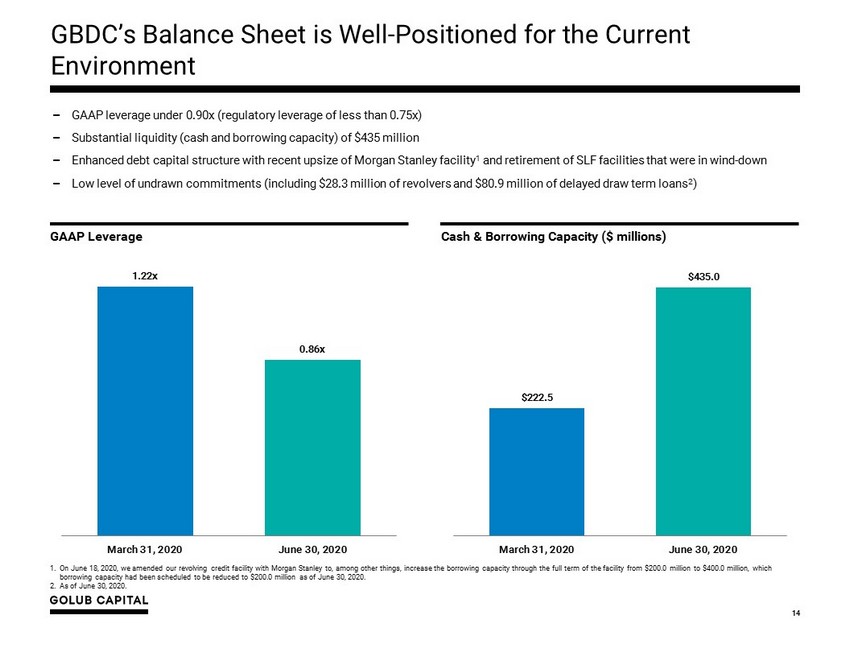
GBDC’s Balance Sheet is Well - Positioned for the Current Environment 14 GAAP Leverage Cash & Borrowing Capacity ($ millions) 1.22x 0.86x March 31, 2020 June 30, 2020 $222.5 $435.0 March 31, 2020 June 30, 2020 − GAAP leverage under 0.90x (regulatory leverage of less than 0.75x) − Substantial liquidity (cash and borrowing capacity) of $435 million − Enhanced debt capital structure with recent upsize of Morgan Stanley facility 1 and retirement of SLF facilities that were in wind - down − Low level of undrawn commitments (including $28.3 million of revolvers and $80.9 million of delayed draw term loans 2 ) 1. On June 18, 2020, we amended our revolving credit facility with Morgan Stanley to, among other things, increase the borrowing ca pacity through the full term of the facility from $200.0 million to $400.0 million, which borrowing capacity had been scheduled to be reduced to $200.0 million as of June 30, 2020. 2. As of June 30, 2020.
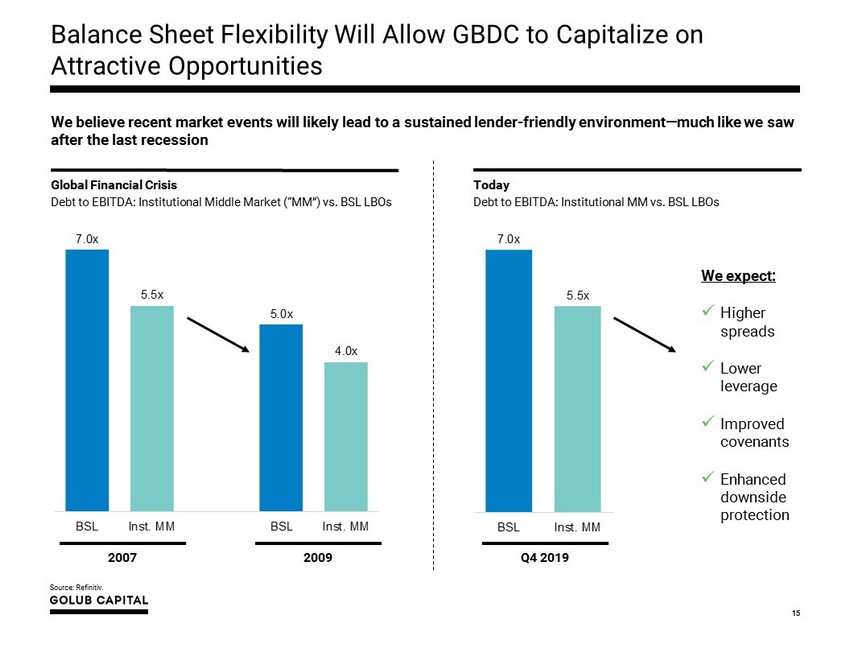
Balance Sheet Flexibility Will Allow GBDC to Capitalize on Attractive Opportunities 15 7.0x 5.5x 5.0x 4.0x BSL Inst. MM BSL Inst. MM Source: Refinitiv. Global Financial Crisis Debt to EBITDA: Institutional Middle Market (“MM”) vs. BSL LBOs Today Debt to EBITDA: Institutional MM vs. BSL LBOs 2007 2009 Q4 2019 We believe recent market events will likely lead to a sustained lender - friendly environment — much like we saw after the last recession We expect: x Higher spreads x Lower leverage x Improved covenants x Enhanced downside protection 7.0x 5.5x BSL Inst. MM

GBDC Is Well - Positioned to Navigate COVID - 19 16 1. Managed by Golub Capital, a platform with over $30 billion of capital under management and over a 25 - year history of successful investing in the middle market 2. Conservative investment strategy focused on first lien, senior secured loans to resilient U.S. middle market companies backed by well - reputed private equity firms 3. Highly diversified, granular portfolio 4. Low - cost, diversified and long - dated financing 5. Ample liquidity and cushion to asset coverage limit 6. Best - in - class fee and expense structure with significant shareholder alignment 7. Compelling long - term credit track record
Summary of Financial Results for the Quarter Ended June 30, 2020 04
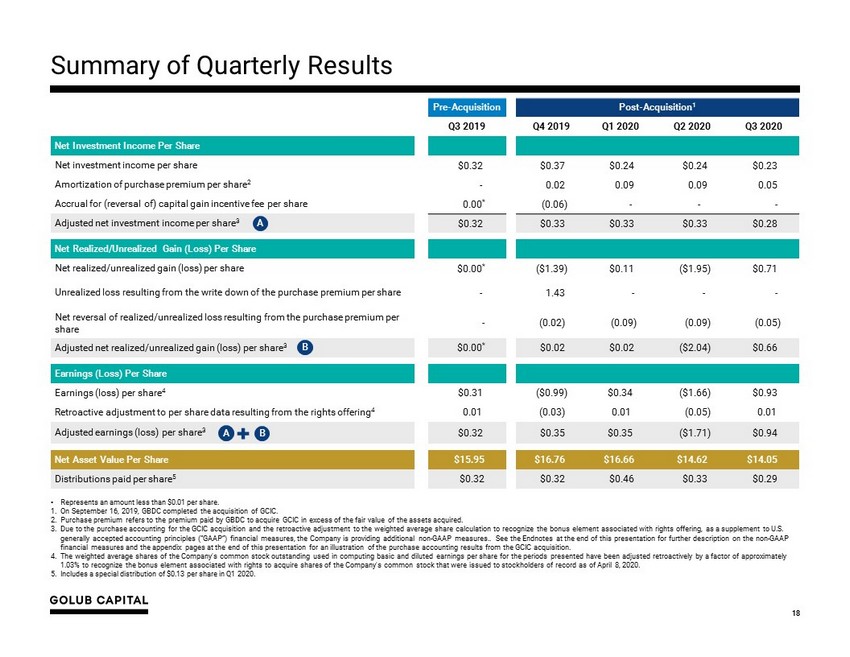
• Represents an amount less than $0.01 per share. 1. On September 16, 2019, GBDC completed the acquisition of GCIC. 2. Purchase premium refers to the premium paid by GBDC to acquire GCIC in excess of the fair value of the assets acquired. 3. Due to the purchase accounting for the GCIC acquisition and the retroactive adjustment to the weighted average share calculat ion to recognize the bonus element associated with rights offering, a s a supplement to U.S. generally accepted accounting principles (“GAAP”) financial measures, the Company is providing additional non - GAAP measures.. S ee the Endnotes at the end of this presentation for further description on the non - GAAP financial measures and the appendix pages at the end of this presentation for an illustration of the purchase accounting resu lts from the GCIC acquisition. 4. The weighted average shares of the Company's common stock outstanding used in computing basic and diluted earnings per share for the periods presented have been adjusted retroactively by a factor of approximately 1.03% to recognize the bonus element associated with rights to acquire shares of the Company's common stock that were issued to stockholders of record as of April 8, 2020. 5. Includes a special distribution of $0.13 per share in Q1 2020. 18 Pre - Acquisition Post - Acquisition 1 Q3 2019 Q4 2019 Q1 2020 Q2 2020 Q3 2020 Net Investment Income Per Share Net investment income per share $0.32 $0.37 $0.24 $0.24 $0.23 Amortization of purchase premium per share 2 - 0.02 0.09 0.09 0.05 Accrual for (reversal of) capital gain incentive fee per share 0.00 * (0.06) - - - Adjusted net investment income per share 3 $0.32 $0.33 $0.33 $0.33 $0.28 Net Realized/Unrealized Gain (Loss) Per Share Net realized /unrealized gain (loss) per share $0.00 * ($1.39) $0.11 ($1.95) $0.71 Unrealized loss resulting from the write down of the purchase premium per share - 1.43 - - - Net reversal of realized/unrealized loss resulting from the purchase premium per share - (0.02) (0.09) (0.09) (0.05) Adjusted net realized/unrealized gain (loss) per share 3 $0.00 * $0.02 $0.02 ($2.04) $0.66 Earnings (Loss) Per Share Earnings (loss) per share 4 $0.31 ($0.99) $0.34 ($1.66) $0.93 Retroactive adjustment to per share data resulting from the rights offering 4 0.01 (0.03) 0.01 (0.05) 0.01 Adjusted earnings (loss) per share 3 $0.32 $0.35 $0.35 ($1.71) $0.94 Net Asset Value Per Share $15.95 $16.76 $16.66 $14.62 $14.05 Distributions paid per share 5 $0.32 $0.32 $0.46 $0.33 $0.29 A B B A Summary of Quarterly Results
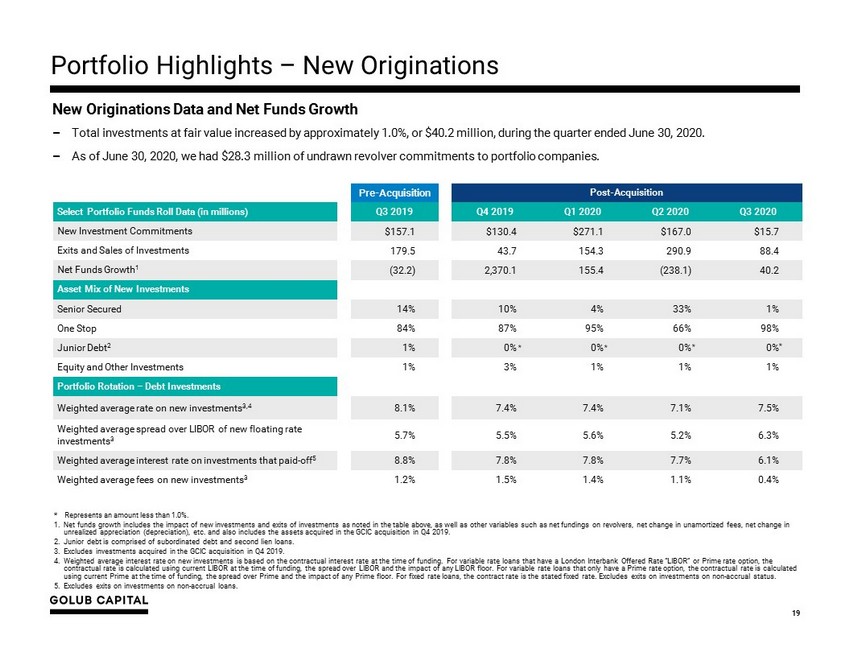
Pre - Acquisition Post - Acquisition Select Portfolio Funds Roll Data (in millions) Q3 2 019 Q4 2 019 Q1 2 020 Q2 2 020 Q3 2020 New Investment Commitments $157.1 $130.4 $271.1 $167.0 $15.7 Exits and Sales of Investments 179.5 43.7 154.3 290.9 88.4 Net Funds Growth 1 (32.2) 2,370.1 155.4 (238.1) 40.2 Asset Mix of New Investments Senior Secured 14% 10% 4% 33% 1% One Stop 84% 87% 95% 66% 98% Junior Debt 2 1% 0% 0% 0% 0% Equity and Other Investments 1% 3% 1% 1% 1% Portfolio Rotation – Debt Investments Weighted average rate on new investments 3,4 8.1% 7.4% 7.4% 7.1% 7.5% Weighted average spread over LIBOR of new floating rate investments 3 5.7% 5.5% 5.6% 5.2% 6.3% Weighted average interest rate on investments that paid - off 5 8.8% 7.8% 7.8% 7.7% 6.1% Weighted average fees on new investments 3 1.2% 1.5% 1.4% 1.1% 0.4% * Represents an amount less than 1.0%. 1. Net funds growth includes the impact of new investments and exits of investments as noted in the table above, as well as othe r v ariables such as net fundings on revolvers, net change in unamortized fees, net change in unrealized appreciation (depreciation), etc. and also includes the assets acquired in the GCIC acquisition in Q4 2019. 2. Junior debt is comprised of subordinated debt and second lien loans. 3. Excludes investments acquired in the GCIC acquisition in Q4 2019. 4. Weighted average interest rate on new investments is based on the contractual interest rate at the time of funding. For varia ble rate loans that have a London Interbank Offered Rate “LIBOR” or Prime rate option, the contractual rate is calculated using current LIBOR at the time of funding, the spread over LIBOR and the impact of any LIBOR flo or. For variable rate loans that only have a Prime rate option, the contractual rate is calculated using current Prime at the time of funding, the spread over Prime and the impact of any Prime floor. For fixed rate loans, th e c ontract rate is the stated fixed rate. Excludes exits on investments on non - accrual status. 5. Excludes exits on investments on non - accrual loans. 19 New Originations Data and Net Funds Growth − Total investments at fair value increased by approximately 1.0%, or $40.2 million, during the quarter ended June 30, 2020. − As of June 30, 2020, we had $28.3 million of undrawn revolver commitments to portfolio companies. * * Portfolio Highlights – New Originations * *
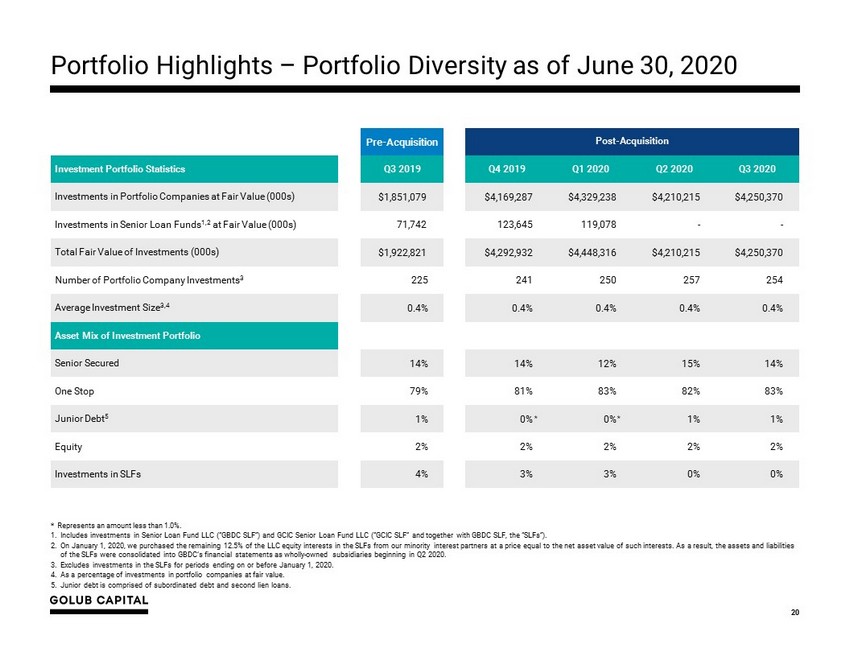
Pre - Acquisition Post - Acquisition Investment Portfolio Statistics Q3 2 019 Q4 2 019 Q1 2 020 Q2 2 020 Q3 2 020 Investments in Portfolio Companies at Fair Value (000s) $1,851,079 $4,169,287 $4,329,238 $4,210,215 $4,250,370 Investments in Senior Loan Funds 1,2 at Fair Value (000s) 71,742 123,645 119,078 - - Total Fair Value of Investments (000s) $1,922,821 $4,292,932 $4,448,316 $4,210,215 $4,250,370 Number of Portfolio Company Investments 3 225 241 250 257 254 Average Investment Size 3,4 0.4% 0.4% 0.4% 0.4% 0.4% Asset Mix of Investment Portfolio Senior Secured 14% 14% 12% 15% 14% One Stop 79% 81% 83% 82% 83% Junior Debt 5 1% 0% 0% 1% 1% Equity 2% 2% 2% 2% 2% Investments in SLFs 4% 3% 3% 0% 0% * Represents an amount less than 1.0%. 1. Includes investments in Senior Loan Fund LLC (“GBDC SLF”) and GCIC Senior Loan Fund LLC (“GCIC SLF” and together with GBDC SLF, the “SLFs” ). 2. On January 1, 2020, we purchased the remaining 12.5% of the LLC equity interests in the SLFs from our minority interest partn ers at a price equal to the net asset value of such interests. As a result, the assets and liabilities of the SLFs were consolidated into GBDC’s financial statements as wholly - owned subsidiaries beginning in Q2 2020. 3. Excludes investments in the SLFs for periods ending on or before January 1, 2020. 4. As a percentage of investments in portfolio companies at fair value. 5. Junior debt is comprised of subordinated debt and second lien loans. 20 Portfolio Highlights – Portfolio Diversity as of June 30, 2020 * *
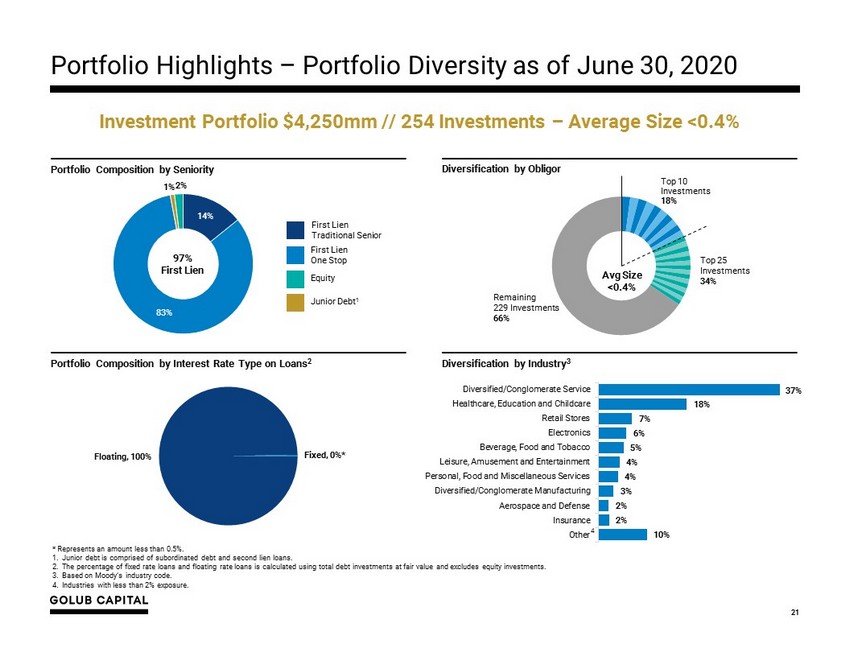
Portfolio Highlights – Portfolio Diversity as of June 30, 2020 21 * Represents an amount less than 0.5%. 1. Junior debt is comprised of subordinated debt and second lien loans. 2. The percentage of fixed rate loans and floating rate loans is calculated using total debt investments at fair value and exclu des equity investments. 3. Based on Moody’s industry code. 4. Industries with less than 2% exposure. Portfolio Composition by Seniority Diversification by Obligor 14% 83% 1% 2% Equity Junior Debt 1 First Lien One Stop First Lien Traditional Senior 97% First Lien Top 25 Investments 34% Remaining 229 Investments 66% Top 10 Investments 18% Avg Size <0.4% Portfolio Composition by Interest Rate Type on Loans 2 Floating , 100% Fixed , 0% * 37% 18% 7% 6% 5% 4% 4% 3% 2% 2% 10% Diversified/Conglomerate Service Healthcare, Education and Childcare Retail Stores Electronics Beverage, Food and Tobacco Leisure, Amusement and Entertainment Personal, Food and Miscellaneous Services Diversified/Conglomerate Manufacturing Aerospace and Defense Insurance Other Diversification by Industry 3 Investment Portfolio $4,250mm // 254 Investments – Average Size <0.4% 4
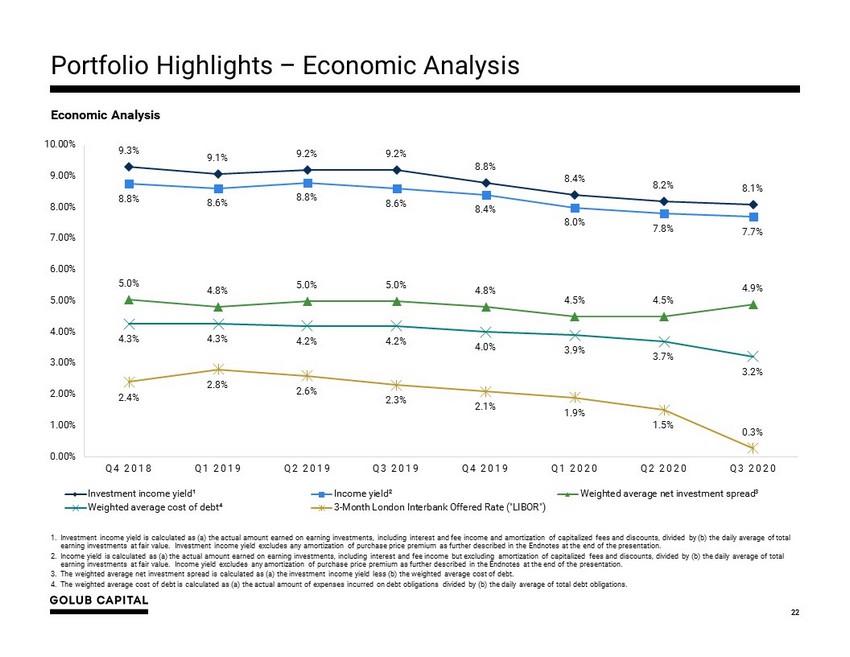
1. Investment income yield is calculated as (a) the actual amount earned on earning investments, including interest and fee inco me and amortization of capitalized fees and discounts, divided by (b) the daily average of total earning investments at fair value. Investment income yield excludes any amortization of purchase price premium as further de scr ibed in the Endnotes at the end of the presentation. 2. Income yield is calculated as (a) the actual amount earned on earning investments, including interest and fee income but excl udi ng amortization of capitalized fees and discounts, divided by (b) the daily average of total earning investments at fair value. Income yield excludes any amortization of purchase price premium as further described in the Endnotes at the end of the presentation. 3. The weighted average net investment spread is calculated as (a) the investment income yield less (b) the weighted average cos t o f debt. 4. The weighted average cost of debt is calculated as (a) the actual amount of expenses incurred on debt obligations divided by (b) the daily average of total debt obligations. 22 Economic Analysis Portfolio Highlights – Economic Analysis 9.3% 9.1% 9.2% 9.2% 8.8% 8.4% 8.2% 8.1% 8.8% 8.6% 8.8% 8.6% 8.4% 8.0% 7.8% 7.7% 5.0% 4.8% 5.0% 5.0% 4.8% 4.5% 4.5% 4.9% 4.3% 4.3% 4.2% 4.2% 4.0% 3.9% 3.7% 3.2% 2.4% 2.8% 2.6% 2.3% 2.1% 1.9% 1.5% 0.3% 0.00% 1.00% 2.00% 3.00% 4.00% 5.00% 6.00% 7.00% 8.00% 9.00% 10.00% Q4 2018 Q1 2019 Q2 2019 Q3 2019 Q4 2019 Q1 2020 Q2 2020 Q3 2020 Investment income yield¹ Income yield² Weighted average net investment spread³ Weighted average cost of debt⁴ 3-Month London Interbank Offered Rate ("LIBOR")
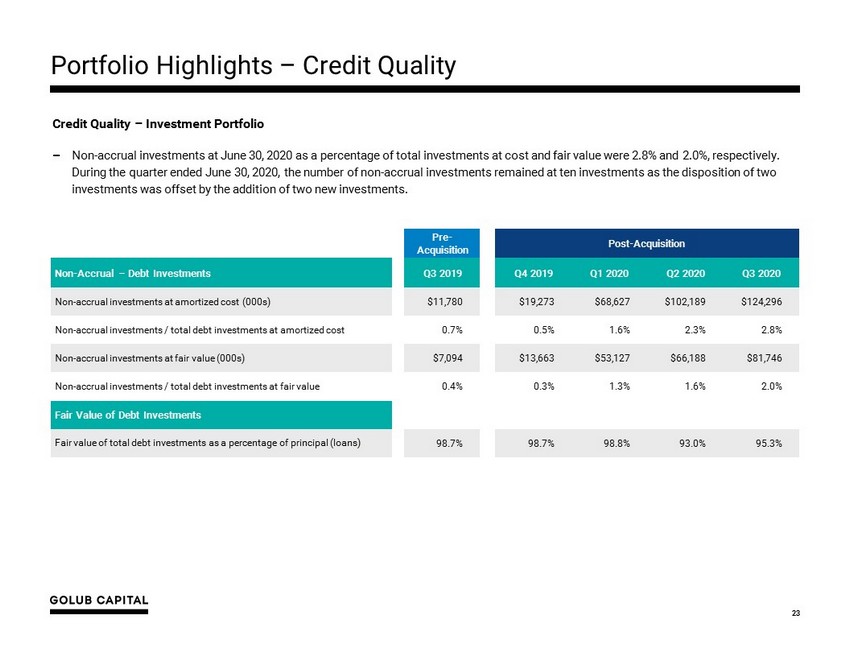
Portfolio Highlights – Credit Quality 23 Credit Quality – Investment Portfolio − Non - accrual investments at June 30, 2020 as a percentage of total investments at cost and fair value were 2.8% and 2.0%, respect ively. During the quarter ended June 30, 2020, the number of non - accrual investments remained at ten investments as the disposition of two investments was offset by the addition of two new investments. Pre - Acquisition Post - Acquisition Non - Accrual – Debt Investments Q3 2 019 Q4 2 019 Q1 2 020 Q2 2 020 Q3 2 020 Non - accrual investments at amortized cost (000s) $11,780 $19,273 $68,627 $102,189 $124,296 Non - accrual investments / total debt investments at amortized cost 0.7% 0.5% 1.6% 2.3% 2.8% Non - accrual investments at fair value (000s) $7,094 $13,663 $53,127 $66,188 $81,746 Non - accrual investments / total debt investments at fair value 0.4% 0.3% 1.3% 1.6% 2.0% Fair Value of Debt Investments Fair value of total debt investments as a percentage of principal (loans) 98.7% 98.7% 98.8% 93.0% 95.3%
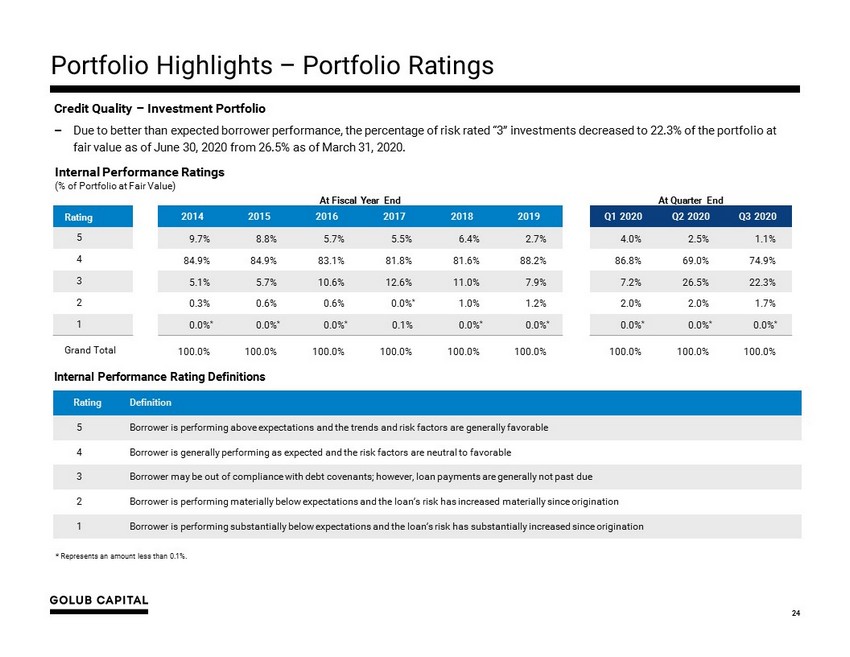
Portfolio Highlights – Portfolio Ratings 24 Credit Quality – Investment Portfolio − Due to better than expected borrower performance, the percentage of risk rated “3” investments decreased to 22.3% of the port fol io at fair value as of June 30, 2020 from 26.5% as of March 31, 2020. * Represents an amount less than 0.1%. Internal Performance Ratings (% of Portfolio at Fair Value) Rating Definition 5 Borrower is performing above expectations and the trends and risk factors are generally favorable 4 Borrower is generally performing as expected and the risk factors are neutral to favorable 3 Borrower may be out of compliance with debt covenants; however, loan payments are generally not past due 2 Borrower is performing materially below expectations and the loan’s risk has increased materially since origination 1 Borrower is p erforming substantially below expectations and the loan’s risk has substantially increased since origination Internal Performance Rating Definitions At Fiscal Year End At Quarter End Rating 2014 2015 2016 2017 2018 2019 Q1 2020 Q2 2020 Q3 2020 5 9.7% 8.8% 5.7% 5.5% 6.4% 2.7% 4.0% 2.5% 1.1% 4 84.9% 84.9% 83.1% 81.8% 81.6% 88.2% 86.8% 69.0% 74.9% 3 5.1% 5.7% 10.6% 12.6% 11.0% 7.9% 7.2% 26.5% 22.3% 2 0.3% 0.6% 0.6% 0.0% * 1.0% 1.2% 2.0% 2.0% 1.7% 1 0.0% * 0.0% * 0.0% * 0.1% 0.0% * 0.0% * 0.0% * 0.0% * 0.0% * Grand Total 100.0% 100.0% 100.0% 100.0% 100.0% 100.0% 100.0% 100.0% 100.0%
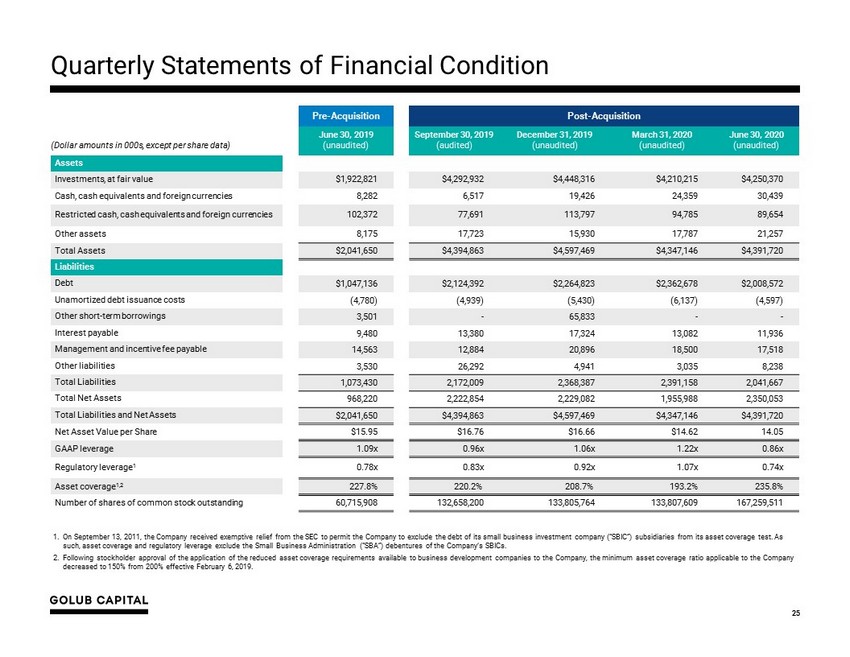
Quarterly Statements of Financial Condition 25 1. On September 13, 2011, the Company received exemptive relief from the SEC to permit the Company to exclude the debt of its sm all business investment company (“SBIC”) subsidiaries from its asset coverage test. As such, asset coverage and regulatory leverage exclude the Small Business Administration (“SBA”) debentures of the Company’s SB ICs . 2. Following stockholder approval of the application of the reduced asset coverage requirements available to business developmen t c ompanies to the Company, the minimum asset coverage ratio applicable to the Company decreased to 150% from 200% effective February 6, 2019. Pre - Acquisition Post - Acquisition (Dollar amounts in 000s, except per share data) June 30, 2019 (unaudited) September 30, 2019 (audited) December 31, 2019 (unaudited) March 31, 2020 (unaudited) June 30, 2020 (unaudited) Assets Investments, at fair value $1,922,821 $4,292,932 $4,448,316 $4,210,215 $4,250,370 Cash, cash equivalents and foreign currencies 8,282 6,517 19,426 24,359 30,439 Restricted cash , cash equivalents and foreign currencies 102,372 77,691 113,797 94,785 89,654 Other assets 8,175 17,723 15,930 17,787 21,257 Total Assets $2,041,650 $4,394,863 $4,597,469 $4,347,146 $4,391,720 Liabilities Debt $1,047,136 $2,124,392 $2,264,823 $2,362,678 $2,008,572 Unamortized debt issuance costs (4,780) (4,939) (5,430) (6,137) (4,597) Other short - term borrowings 3,501 - 65,833 - - Interest payable 9,480 13,380 17,324 13,082 11,936 Management and incentive fee payable 14,563 12,884 20,896 18,500 17,518 Other liabilities 3,530 26,292 4,941 3,035 8,238 Total Liabilities 1,073,430 2,172,009 2,368,387 2,391,158 2,041,667 Total Net Assets 968,220 2,222,854 2,229,082 1,955,988 2,350,053 Total Liabilities and Net Assets $2,041,650 $4,394,863 $4,597,469 $4,347,146 $4,391,720 Net Asset Value per Share $15.95 $16.76 $16.66 $14.62 14.05 GAAP leverage 1.09x 0.96x 1.06x 1.22x 0.86x Regulatory leverage 1 0.78x 0.83x 0.92x 1.07x 0.74x Asset coverage 1,2 227.8% 220.2% 208.7% 193.2% 235.8% Number of shares of common stock outstanding 60,715,908 132,658,200 133,805,764 133,807,609 167,259,511
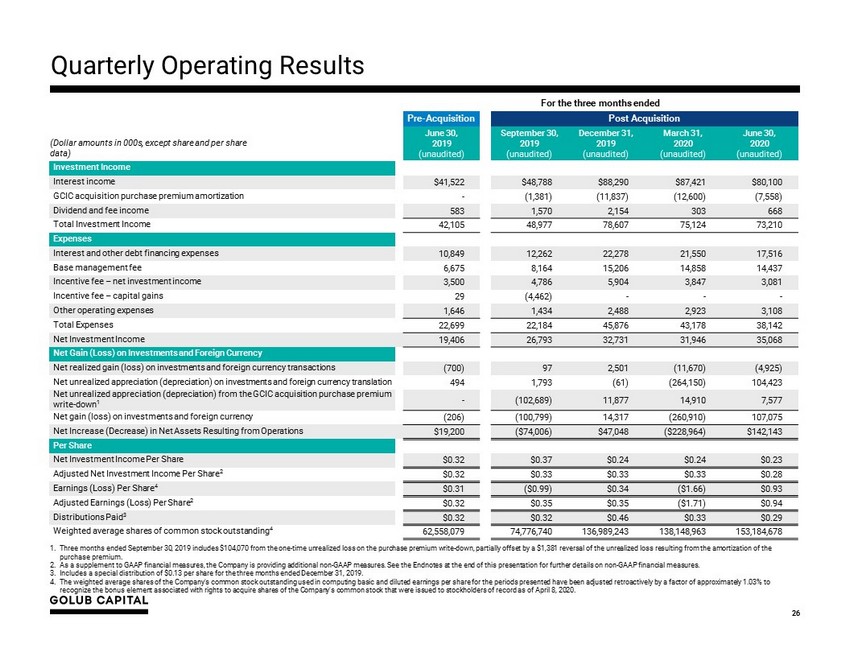
Quarterly Operating Results 26 For the three months ended Pre - Acquisition Post Acquisition (Dollar amounts in 000s, except share and per share data) June 30, 2019 (unaudited) September 30, 2019 (unaudited) December 31, 2019 (unaudited) March 31, 2020 (unaudited) June 30, 2020 (unaudited) Investment Income Interest income $41,522 $48,788 $88,290 $87,421 $80,100 GCIC acquisition purchase premium amortization - (1,381) (11,837) (12,600) (7,558) Dividend and fee income 583 1,570 2,154 303 668 Total Investment Income 42,105 48,977 78,607 75,124 73,210 Expenses Interest and other debt financing expenses 10,849 12,262 22,278 21,550 17,516 Base management fee 6,675 8,164 15,206 14,858 14,437 Incentive fee – net investment income 3,500 4,786 5,904 3,847 3,081 Incentive fee – capital gains 29 (4,462) - - - Other operating expenses 1,646 1,434 2,488 2,923 3,108 Total Expenses 22,699 22,184 45,876 43,178 38,142 Net Investment Income 19,406 26,793 32,731 31,946 35,068 Net Gain (Loss) on Investments and Foreign Currency Net realized gain (loss) on investments and foreign currency transactions (700) 97 2,501 (11,670) (4,925) Net unrealized appreciation (depreciation) on investments and foreign currency translation 494 1,793 (61) (264,150) 104,423 Net unrealized appreciation (depreciation) from the GCIC acquisition purchase premium write - down 1 - (102,689) 11,877 14,910 7,577 Net gain (loss) on investments and foreign currency (206) (100,799) 14,317 (260,910) 107,075 Net Increase (Decrease) in Net Assets Resulting from Operations $19,200 ($74,006) $47,048 ($228,964) $142,143 Per Share Net Investment Income Per Share $0.32 $0.37 $0.24 $0.24 $0.23 Adjusted Net Investment Income Per Share 2 $0.32 $0.33 $0.33 $0.33 $0.28 Earnings (Loss) Per Share 4 $0.31 ($0.99) $0.34 ($1.66) $0.93 Adjusted Earnings (Loss) Per Share 2 $0.32 $0.35 $0.35 ($1.71) $0.94 Distributions Paid 3 $0.32 $0.32 $0.46 $0.33 $0.29 Weighted average shares of common stock outstanding 4 62,558,079 74,776,740 136,989,243 138,148,963 153,184,678 1. Three months ended September 30, 2019 includes $104,070 from the one - time unrealized loss on the purchase premium write - down, pa rtially offset by a $1,381 reversal of the unrealized loss resulting from the amortization of the purchase premium. 2. As a supplement to GAAP financial measures, the Company is providing additional non - GAAP measures. See the Endnotes at the end o f this presentation for further details on non - GAAP financial measures. 3. Includes a special distribution of $0.13 per share for the three months ended December 31, 2019. 4. The weighted average shares of the Company's common stock outstanding used in computing basic and diluted earnings per share for the periods presented have been adjusted retroactively by a factor of approximately 1.03% to recognize the bonus element associated with rights to acquire shares of the Company's common stock that were issued to stockh old ers of record as of April 8, 2020.

Financial Performance Highlights 27 * The quarterly return on equity is calculated as the annualized return on average equity divided by four. The annualized re tur n on average equity for the periods ended through Q3 2019 are calculated as (a) the net increase in net assets resulting from operations (i.e. net income) for the period presented divided by (b) the daily average of total net assets, then (c) com pou nded over one year. The annualized return on average equity for quarters Q4 2019 and after is calculated as (a) adjusted net income, as defined in the Endnotes at the end of this presentation, divided by (b) the daily average of total net assets, th en (c) compounded over one year. Adjusted net income is a non - GAAP measure and the Company believes this non - GAAP measure is useful as it excludes the non - cash expense/loss from the purchase premium as further described in the Endnotes at the end of this presentation. These returns do not represent an actual return to any investor in the Company. Quarterly Return on Equity and Quarterly Distributions (Last 5 Years) $0.32 $0.32 $0.32 $0.32 $0.32 $0.32 $0.32 $0.32 $0.32 $0.32 $0.32 $0.32 $0.32 $0.32 $0.32 $0.32 $0.32 $0.32 $0.33 $0.33 $0.29 $0.57 $0.40 $0.44 $0.46 2.3% 2.4% 2.5% 1.8% 2.3% 1.9% 2.2% 2.4% 2.2% 2.3% 2.2% 2.4% 2.3% 1.6% 1.9% 1.9% 2.0% 2.2% 2.1% - 10.5% 6.7% Q3'15 Q4'15 Q1'16 Q2'16 Q3'16 Q4'16 Q1'17 Q2'17 Q3'17 Q4'17 Q1'18 Q2'18 Q3'18 Q4'18 Q1'19 Q2'19 Q3'19 Q4'19 Q1'20 Q2'20 Q3'20 Regular Distribution Special Distribution Quarterly Return on Equity*
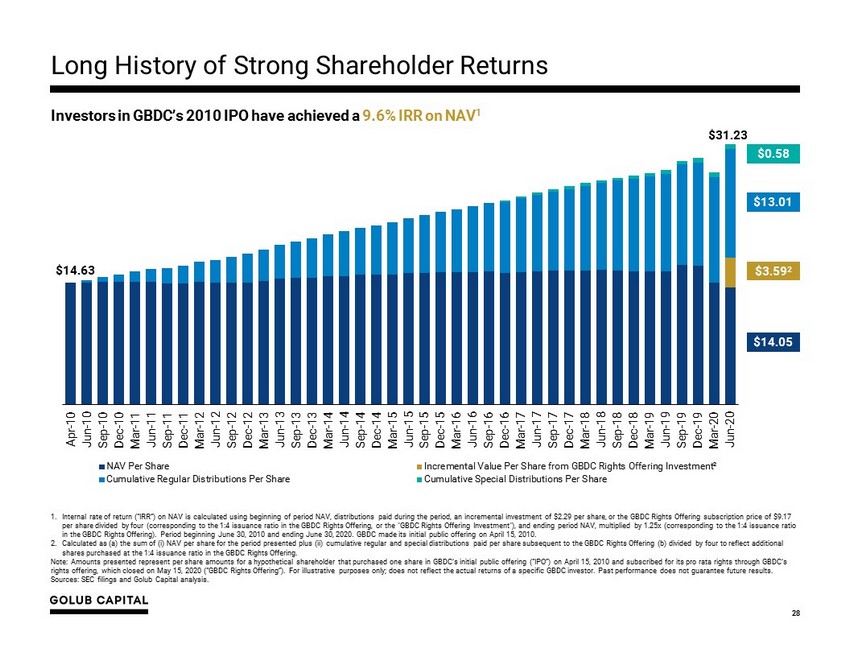
28 Long History of Strong Shareholder Returns Investors in GBDC’s 2010 IPO have achieved a 9.6% IRR on NAV 1 $14.63 $31.23 Apr-10 Jun-10 Sep-10 Dec-10 Mar-11 Jun-11 Sep-11 Dec-11 Mar-12 Jun-12 Sep-12 Dec-12 Mar-13 Jun-13 Sep-13 Dec-13 Mar-14 Jun-14 Sep-14 Dec-14 Mar-15 Jun-15 Sep-15 Dec-15 Mar-16 Jun-16 Sep-16 Dec-16 Mar-17 Jun-17 Sep-17 Dec-17 Mar-18 Jun-18 Sep-18 Dec-18 Mar-19 Jun-19 Sep-19 Dec-19 Mar-20 Jun-20 NAV Per Share Incremental Value Per Share from GBDC Rights Offering Investment² Cumulative Regular Distributions Per Share Cumulative Special Distributions Per Share 1. Internal rate of return (“IRR”) on NAV is calculated using beginning of period NAV, distributions paid during the period, an inc remental investment of $2.29 per share, or the GBDC Rights Offering subscription price of $9.17 per share divided by four (corresponding to the 1:4 issuance ratio in the GBDC Rights Offering, or the "GBDC Rights Offering Inv estment"), and ending period NAV, multiplied by 1.25x (corresponding to the 1:4 issuance ratio in the GBDC Rights Offering). Period beginning June 30, 2010 and ending June 30, 2020. GBDC made its initial public offering on April 15, 2010. 2. Calculated as (a) the sum of ( i ) NAV per share for the period presented plus (ii) cumulative regular and special distributions paid per share subsequent to the GBDC Rights Offering (b) divided by four to reflect additional shares purchased at the 1:4 issuance ratio in the GBDC Rights Offering. Note: Amounts presented represent per share amounts for a hypothetical shareholder that purchased one share in GBDC’s initial pu blic offering (“IPO”) on April 15, 2010 and subscribed for its pro rata rights through GBDC’s rights offering, which closed on May 15, 2020 (“GBDC Rights Offering”). For illustrative purposes only; does not reflect the act ual returns of a specific GBDC investor. Past performance does not guarantee future results. Sources: SEC filings and Golub Capital analysis. $14.05 $13.01 $0.58 $3.59 2

Liquidity and Investment Capacity 29 Cash and Cash Equivalents − Unrestricted cash and cash equivalents and foreign currencies totaled $30.4 million as of June 30, 2020. − Restricted cash, cash equivalents and foreign currencies totaled $89.7 million as of June 30, 2020. Restricted cash is held i n o ur securitization vehicles, SBIC subsidiaries and our revolving credit facilities and is reserved for quarterly interest payment s a nd is also available for new investments that qualify for reinvestment by these entities. Debt Facilities - Availability − Revolving Credit Facilities – On June 18, 2020, we amended our revolving credit facility with Morgan Stanley to, among other thi ngs, increase the borrowing capacity through the full term of the facility from $200.0 million to $400.0 million, which borrowing cap acity had been scheduled to be reduced to $200.0 million as of June 30, 2020. As of June 30, 2020, subject to leverage and borrowing base restrictions, we had approximately $259.5 million of remaining commitments and $185.9 million of availability, in the aggrega te, on our revolving credit facilities with Deutsche Bank, Morgan Stanley and Wells Fargo. − SLF Credit Facilities – In connection with the acquisition of the SLFs equity interests on January 1, 2020, we assumed the liabi lities of each of SLF and GCIC SLF, including their respective credit facilities with Wells Fargo. On June 29, 2020, the two credit facilities with Wells Fargo were repaid in full and subsequently terminated. Prior to termination, the two credit facilities had total commitments and outstandings of $54.7 million. − SBIC Debentures – As of June 30, 2020, through our SBIC licensees, we had $29.0 million of unfunded debenture commitments availa ble to be drawn, subject to customary SBA regulatory requirements. − GC Advisors Revolver – As of June 30, 2020, we had $100.0 million of remaining commitments and availability on our unsecured lin e of credit with GC Advisors. Common Stock Rights Offering − On May 15, 2020, we issued 33,451,902 shares for net proceeds of $300.4 million when we closed on the transferable subscripti on rights offering issued to stockholders of record on April 8, 2020.

Debt Capital Structure 30 Funding Source Debt Commitment Outstanding Par Undrawn Commitment Reinvestment Period Stated Maturity Interest Rate 1 Securitizations: 2014 Debt Securitization $ 80,527 $ 80,527 $ - April 28, 2018 April 25, 2026 3 Month LIBOR + 1.08% 2018 Debt Securitization 408,200 408,200 - January 20, 2023 January 20, 2031 3 Month LIBOR + 1.64% GCIC 2018 Debt Securitization 541,927 541,927 - January 20, 2023 January 20, 2031 3 Month LIBOR + 1.51% Bank Facilities: Deutsche Bank Credit Facility 250,000 150,280 99,720 December 31, 2021 December 31, 2024 3 Month LIBOR + 1.90% Morgan Stanley Credit Facility 400,000 325,831 74,169 February 1, 2021 February 1, 2024 1 Month LIBOR + 2.45% Wells Fargo Credit Facility 300,000 214,357 85,643 March 20, 2021 March 21, 2024 1 Month LIBOR + 2.00% GC Advisors Revolver 100,000 - 100,000 N/A June 21, 2022 Applicable Federal Rate SBA Debentures: GC SBIC IV, L.P. 69,700 69,700 - N/A 10 - year maturity after drawn 3.2% GC SBIC V, L.P. 151,750 151,750 - N/A 10 - year maturity after drawn 3.3% GC SBIC VI, L.P. 95,000 66,000 29,000 N/A 10 - year maturity after drawn 3.0% Key Funding Vehicles 3 – 5 years 36% 1 – 3 years 4% 5+ years 60 % Debt Mix By Vehicle Type – Par Outstanding * Information is presented as of June 30, 2020. 1. Interest rate for securitizations represents the weighted average spread over 3 month LIBOR for the various tranches of issue d n otes, excluding tranches retained by the Company. The weighted average interest rate for the GCIC 2018 Debt Securitization excludes a $38.5 million note that has a fixed interest rate of 4.67%. For bank facilities, the in terest rate represents the interest rate as stated in the applicable credit agreement. For SBA debentures, interest rates are fixed at various pooling dates and the interest rate presented represents the weighted average ra te on all outstanding debentures for each licensee as of June 30, 2020. * Debt Mix by Remaining Legal Tenor – Par Outstanding Bank Facilities 35 % SBA Debentures 14% Securitizations 51 %
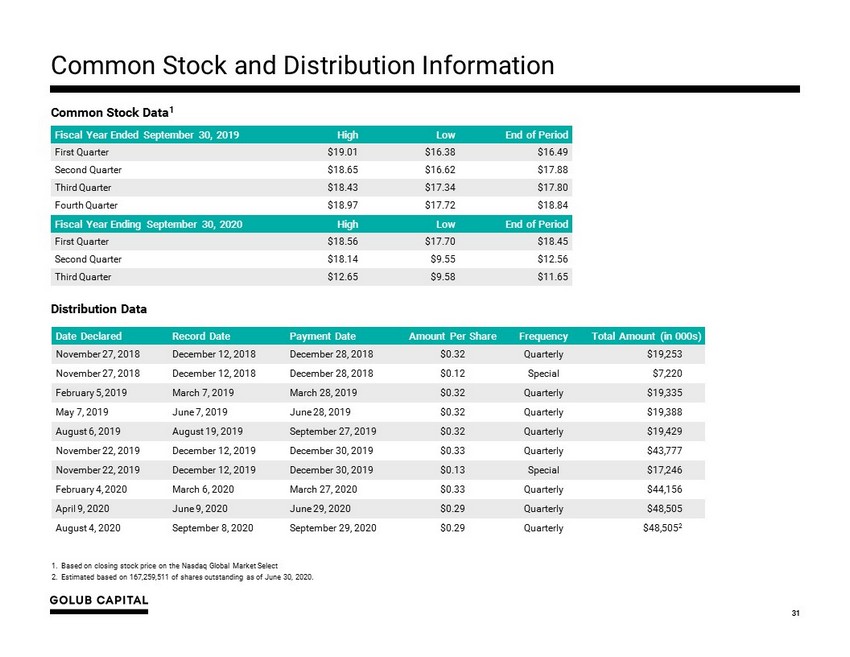
Common Stock and Distribution Information 31 Common Stock Data 1 Distribution Data Date Declared Record Date Payment Date Amount Per Share Frequency Total Amount (in 000s) November 27, 2018 December 12 , 2018 December 28, 2018 $0.32 Quarterly $19,253 November 27, 2018 December 12 , 2018 December 28, 2018 $0.12 Special $7,220 February 5, 2019 March 7, 2019 March 28, 2019 $0.32 Quarterly $19,335 May 7, 2019 June 7, 2019 June 28, 2019 $0.32 Quarterly $19,388 August 6, 2019 August 19, 2019 September 27, 2019 $0.32 Quarterly $19,429 November 22, 2019 December 12 , 2019 December 30, 2019 $0.33 Quarterly $43,777 November 22, 2019 December 12 , 2019 December 30, 2019 $0.13 Special $17,246 February 4, 2020 March 6, 2020 March 27, 2020 $0.33 Quarterly $44,156 April 9, 2020 June 9, 2020 June 29, 2020 $0.29 Quarterly $48,505 August 4, 2020 September 8, 2020 September 29, 2020 $0.29 Quarterly $48,505 2 Fiscal Year Ended September 30, 2019 High Low End of Period First Quarter $19.01 $16.38 $16.49 Second Quarter $18.65 $16.62 $17.88 Third Quarter $18.43 $17.34 $17.80 Fourth Quarter $18.97 $17.72 $18.84 Fiscal Year Ending September 30, 2020 High Low End of Period First Quarter $18.56 $17.70 $18.45 Second Quarter $18.14 $9.55 $12.56 Third Quarter $12.65 $9.58 $11.65 1. Based on closing stock price on the Nasdaq Global Market Select 2. Estimated based on 167,259,511 of shares outstanding as of June 30, 2020.
Appendix: Endnotes and Illustration of the Purchase Accounting for the GCIC Acquisition A

1. On September 16, 2019, the Company completed its acquisition of GCIC. The merger was accounted for under the asset acquisition method of accounting in accordance with Accounting Standards Codification (“ASC”) 805 - 50, Business Combinations — Related Issues. Under asset acquisition accounting, wh ere the consideration paid to GCIC’s stockholders exceeded the relative fair values of the assets acquired, the premium paid by GBDC was allocated to the cost of the GCIC assets acquired by GBDC pro - rata based on their relative fair value. Immediately following the acquisition of GCIC, GBDC recorded its assets at their respective fair v alu es and, as a result, the purchase premium allocated to the cost basis of the GCIC assets acquired was immediately recognized as unrealized depreciation on the Company's Consolidated St ate ment of Operations. The purchase premium allocated to investments in loan securities will amortize over the life of the loans through interest income with a correspon din g reversal of the unrealized depreciation on the GCIC loans acquired through their ultimate disposition. The purchase premium allocated to investments in equity securities will no t a mortize over the life of the equity securities through interest income and, assuming no subsequent change to the fair value of the GCIC equity securities acquired and disposition o f s uch equity securities at fair value, the Company will recognize a realized loss with a corresponding reversal of the unrealized depreciation upon disposition of the GCIC equity se cur ities acquired. On May 15, 2020, the Company completed a transferable rights offering, issuing 33,451,902 shares at a subscription price of $ 9. 17 per share. In accordance with ASC 260 – Earnings Per Share, it was determined the Company’s rights offering contained a bonus element as the exercise price at issuance was le ss than the fair market value of the stock. In accordance with ASC 260, basic and diluted EPS are required to be adjusted retroactively for the bonus element for all period s p resented by applying an adjustment factor to weighted average shares outstanding. The adjustment factor that was calculated in accordance with ASC 260 was 1.03%. As a supplement to U.S. generally accepted accounting principles (“GAAP”) financial measures, the Company has provided the fo llo wing non - GAAP financial measures: ▪ “Adjusted Net Investment Income” and “Adjusted Net Investment Income Per Share” - excludes the amortization of the purchase premium and the accrual for the capital gain incentive fee required under GAAP (including the portion of such accrual that is not payable under GBDC’s investment advisory ag reement) from net investment income calculated in accordance with GAAP. ▪ “Adjusted Net Realized and Unrealized Gain/(Loss)” and “Adjusted Net Realized and Unrealized Gain/(Loss) Per Share” - excludes the unrealized loss resulting from the purchase premium write - down and the corresponding reversal of the unrealized loss resulting from the amortization of the premium on loans or from the sale of equity investments from the determination of realized and unrealized gain/(loss) in accordance with GAAP. ▪ “Adjusted Net Income” and “Adjusted Earnings/(Loss) Per Share” – calculates net income and earnings per share based on Adjusted Net Investment Income and Adjusted Net Realized and Unrealized Gain/(Loss). “Adjusted Earnings/(Loss ) Per S hare ” also excludes the impact of the retroactive adjustment to the weighted average shares calculation due to the rights offering and the resulting impact on earnings per share. The Company believes that excluding the financial impact of the purchase premium in the above non - GAAP financial measures is use ful for investors as this is a non - cash expense/loss and is one method the Company uses to measure its financial condition and results of operations. In addition, th e C ompany believes excluding the accrual of the capital gain incentive fee in the above non - GAAP financial measures is useful as a portion of such accrual is not contractually payable under the terms of either the Company’s current investment advisory agreement with GC Advisors, which was effective September 16, 2019, or its prior investment advis ory agreement with GC Advisors, (each an, “Investment Advisory Agreement”). In accordance with GAAP, the Company is required to include aggregate unrealized appreciati on on investments in the calculation and accrue a capital gain incentive fee on a quarterly basis as if such unrealized capital appreciation were realized, even though such un rea lized capital appreciation is not permitted to be considered in calculating the fee actually payable under either Investment Advisory Agreement. As of each of June 30, 2020, March 31, 2020, and September 30, 2019, the cumulative capital gain incentive fee accrued by the Company in accordance with GAAP is $0, and none was payable as a capital gain incen tiv e fee pursuant to the current Investment Advisory Agreement as of December 31, 2019. Any payment due under the terms of the current Investment Advisory Agreement is based on t he calculation at the end of each calendar year or upon termination of the Investment Advisory Agreement. The Company paid capital gain incentive fees in the amounts of $1.2 m ill ion and $1.6 million calculated in accordance with its prior Investment Advisory Agreement as of December 31, 2017 and 2018 , respectively. The Company did not pay any capital ga in incentive fee under the Investment Advisory Agreement for any period ended prior to December 31, 2017. Finally, the Company believes excluding the impact of the retroac tiv e adjustment to the weighted average shares calculation due the rights offering and the resulting impact on per share data is useful for investors as it presents per sha re financial data that is consistent with what was previously reported. Although these non - GAAP financial measures are intended to enhance investors’ understanding of the Company’s business and perfor mance, these non - GAAP financial measures should not be considered an alternative to GAAP. Refer to slide ‘Summary of Quarterly Results’ for a reconciliation to the n ear est GAAP measures. Endnotes – Non - GAAP Financial Measures 33
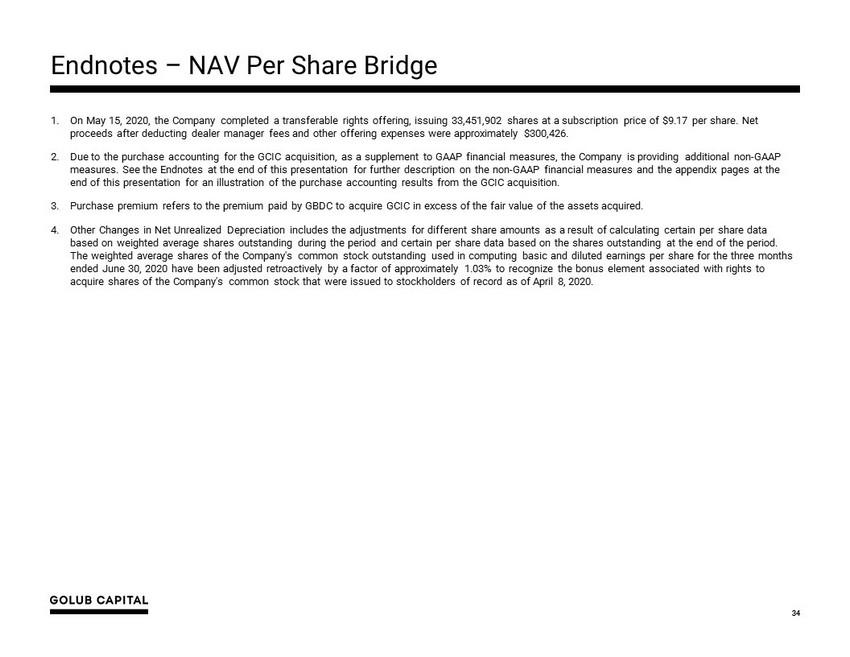
1. On May 15, 2020, the Company completed a transferable rights offering, issuing 33,451,902 shares at a subscription price of $ 9.1 7 per share. Net proceeds after deducting dealer manager fees and other offering expenses were approximately $300,426. 2. Due to the purchase accounting for the GCIC acquisition, as a supplement to GAAP financial measures, the Company is providing ad ditional non - GAAP measures. See the Endnotes at the end of this presentation for further description on the non - GAAP financial measures and the ap pendix pages at the end of this presentation for an illustration of the purchase accounting results from the GCIC acquisition. 3. Purchase premium refers to the premium paid by GBDC to acquire GCIC in excess of the fair value of the assets acquired. 4. Other Changes in Net Unrealized Depreciation includes the adjustments for different share amounts as a result of calculating cer tain per share data based on weighted average shares outstanding during the period and certain per share data based on the shares outstanding at the end of the period. The weighted average shares of the Company's common stock outstanding used in computing basic and diluted earnings per share for the three months ended June 30, 2020 have been adjusted retroactively by a factor of approximately 1.03% to recognize the bonus element associ ate d with rights to acquire shares of the Company's common stock that were issued to stockholders of record as of April 8, 2020. Endnotes – NAV Per Share Bridge 34

Accounting Treatment of the Purchase Premium 35 Acquisition of GCIC Assets at a Premium Determine GBDC’s Cost Basis in Acquired Assets Recognize One - Time Write - Down of Purchase Premium Purchase Premium Fair Value of Former GCIC Assets GBDC Cost Basis = Purchase Premium + Fair Value of Former GCIC Assets Write Down to Fair Value One - Time Unrealized Loss on Purchase Premium Fair Value of Former GCIC Assets
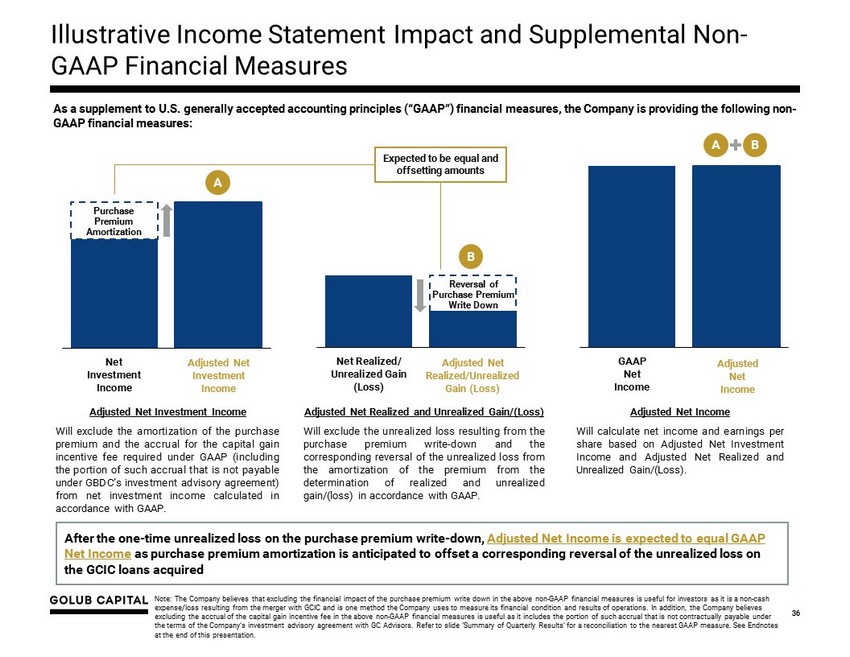
Illustrative Income Statement Impact and Supplemental Non - GAAP Financial Measures 36 As a supplement to U.S. generally accepted accounting principles (“GAAP”) financial measures, the Company is providing the fo llo wing non - GAAP financial measures: Note: The Company believes that excluding the financial impact of the purchase premium write down in the above non - GAAP financia l measures is useful for investors as it is a non - cash expense/loss resulting from the merger with GCIC and is one method the Company uses to measure its financial condition and re sul ts of operations. In addition, the Company believes excluding the accrual of the capital gain incentive fee in the above non - GAAP financial measures is useful as it includes the po rtion of such accrual that is not contractually payable under the terms of the Company’s investment advisory agreement with GC Advisors. Refer to slide ‘Summary of Quarterly Results’ for a r econciliation to the nearest GAAP measure. See Endnotes at the end of this presentation. Net Investment Income Adjusted Net Investment Income Will exclude the amortization of the purchase premium and the accrual for the capital gain incentive fee required under GAAP (including the portion of such accrual that is not payable under GBDC’s investment advisory agreement) from net investment income calculated in accordance with GAAP . Adjusted Net Realized and Unrealized Gain/(Loss) Will exclude the unrealized loss resulting from the purchase premium write - down and the corresponding reversal of the unrealized loss from the amortization of the premium from the determination of realized and unrealized gain/(loss) in accordance with GAAP . Adjusted Net Income Will calculate net income and earnings per share based on Adjusted Net Investment Income and Adjusted Net Realized and Unrealized Gain/(Loss) . Purchase Premium Amortization Net Realized/ Unrealized Gain (Loss) Reversal of Purchase Premium Write Down A B GAAP Net Income A B Expected to be equal and offsetting amounts After the one - time unrealized loss on the purchase premium write - down, Adjusted Net Income is expected to equal GAAP Net Income as purchase premium amortization is anticipated to offset a corresponding reversal of the unrealized loss on the GCIC loans acquired Adjusted Net Investment Income Adjusted Net Realized/Unrealized Gain (Loss) Adjusted Net Income