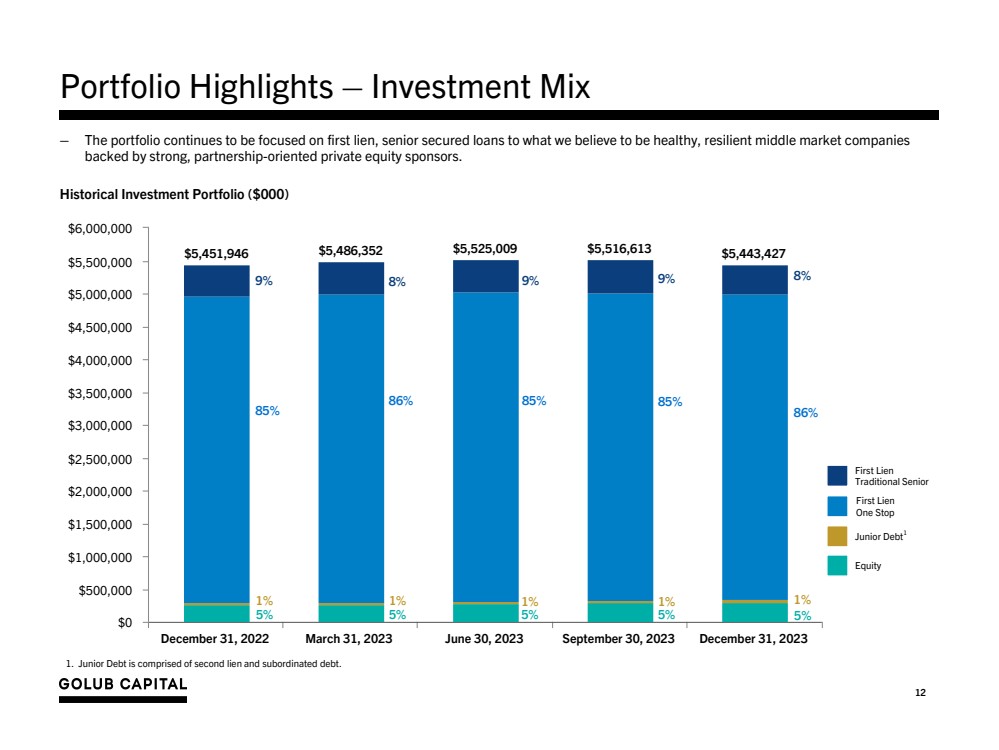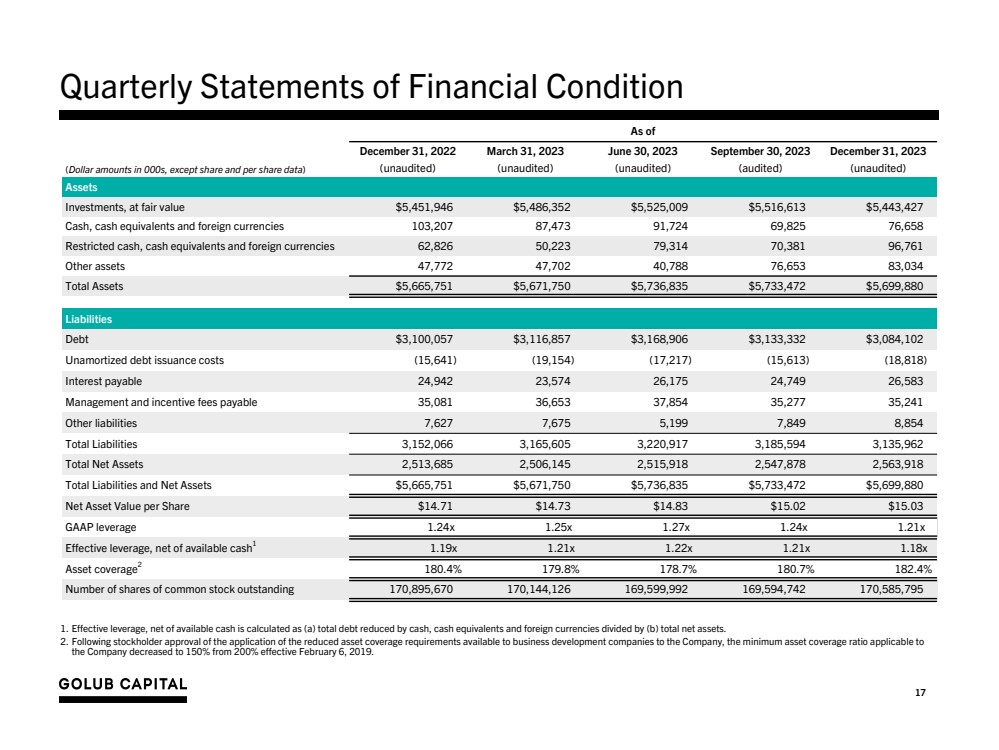
| 17 Quarterly Statements of Financial Condition As of (Dollar amounts in 000s, except share and per share data) December 31, 2022 March 31, 2023 June 30, 2023 September 30, 2023 December 31, 2023 (unaudited) (unaudited) (unaudited) (audited) (unaudited) Assets Investments, at fair value $5,451,946 $5,486,352 $5,525,009 $5,516,613 $5,443,427 Cash, cash equivalents and foreign currencies 103,207 87,473 91,724 69,825 76,658 Restricted cash, cash equivalents and foreign currencies 62,826 50,223 79,314 70,381 96,761 Other assets 47,772 47,702 40,788 76,653 83,034 Total Assets $5,665,751 $5,671,750 $5,736,835 $5,733,472 $5,699,880 Liabilities Debt $3,100,057 $3,116,857 $3,168,906 $3,133,332 $3,084,102 Unamortized debt issuance costs (15,641) (19,154) (17,217) (15,613) (18,818) Interest payable 24,942 23,574 26,175 24,749 26,583 Management and incentive fees payable 35,081 36,653 37,854 35,277 35,241 Other liabilities 7,627 7,675 5,199 7,849 8,854 Total Liabilities 3,152,066 3,165,605 3,220,917 3,185,594 3,135,962 Total Net Assets 2,513,685 2,506,145 2,515,918 2,547,878 2,563,918 Total Liabilities and Net Assets $5,665,751 $5,671,750 $5,736,835 $5,733,472 $5,699,880 Net Asset Value per Share $14.71 $14.73 $14.83 $15.02 $15.03 GAAP leverage 1.24x 1.25x 1.27x 1.24x 1.21x Effective leverage, net of available cash1 1.19x 1.21x 1.22x 1.21x 1.18x Asset coverage2 180.4% 179.8% 178.7% 180.7% 182.4% Number of shares of common stock outstanding 170,895,670 170,144,126 169,599,992 169,594,742 170,585,795 1. Effective leverage, net of available cash is calculated as (a) total debt reduced by cash, cash equivalents and foreign currencies divided by (b) total net assets. 2. Following stockholder approval of the application of the reduced asset coverage requirements available to business development companies to the Company, the minimum asset coverage ratio applicable to the Company decreased to 150% from 200% effective February 6, 2019. |