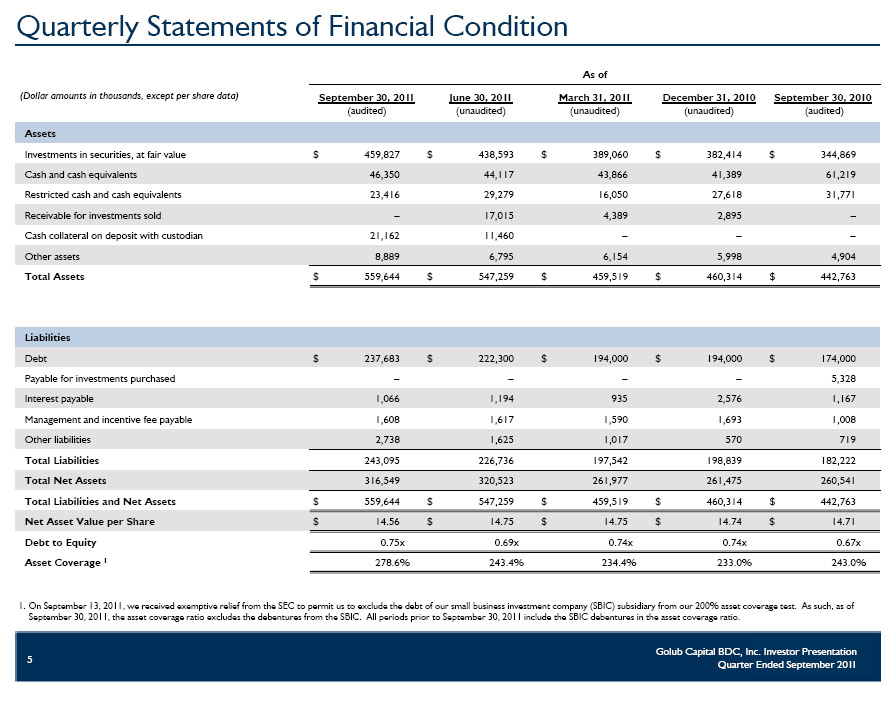
Quarterly Statements of Financial Condition As of (Dollar amounts in thousands, except per share data)September 30, 2011 (audited)June 30, 2011 (unaudited)March 31, 2011 (unaudited)December 31, 2010 (unaudited)September 30, 2010 (audited) Assets Investments in securities, at fair value $ 459,827 $ 438,593 $ 389,060 $ 382,414 $ 344,869 Cash and cash equivalents 46,350 44,117 43,866 41,389 61,219 Restricted cash and cash equivalents 23,416 29,279 16,050 27,618 31,771 Receivable for investments sold – 17,015 4,389 2,895 – Cash collateral on deposit with custodian 21,162 11,460 – – – Other assets 8,889 6,795 6,154 5,998 4,904 Total Assets $ 559,644 $ 547,259 $ 459,519 $ 460,314 $ 442,763 Liabilities Debt $ 237,683 $ 222,300 $ 194,000 $ 194,000 $ 174,000 Payable for investments purchased – – – – 5,328 Interest payable 1,066 1,194 935 2,576 1,167 Management and incentive fee payable 1,608 1,617 1,590 1,693 1,008 Other liabilities 2,738 1,625 1,017 570 719 Total Liabilities 243,095 226,736 197,542 198,839 182,222 Total Net Assets 316,549 320,523 261,977 261,475 260,541 Total Liabilities and Net Assets $ 559,644 $ 547,259 $ 459,519 $ 460,314 $ 442,763 Net Asset Value per Share $ 14.56 $ 14.75 $ 14.75 $ 14.74 $ 14.71 Debt to Equity 0.75x 0.69x 0.74x 0.74x 0.67x Asset Coverage 1 278.6% 243.4% 234.4% 233.0% 243.0% 1 On September 13, 2011, we received exemptive relief from the SEC to permit us to exclude the debt of our small business investment company (SBIC) subsidiary from our 200% asset coverage test. As such, as of September 30, 2011, the asset coverage ratio excludes the debentures from the SBIC. All periods prior to September 30, 2011 include the SBIC debentures in the asset coverage ratio.