GBDC Golub Capital BDC, Inc. Investor Presentation Quarter Ended March 31, 2013 www.golubcapitalbdc.com
1 Disclaimer Some of the statements in this presentation constitute forward - looking statements, which relate to future events or our future performance or financial condition. The forward - looking statements contained in this presentation involve risks and uncertainties, including statements as to: our future operating results; our business prospects and the prospects of our portfolio companies; the effect of investments that we expect to make; our contractual arrangements and relationships with third parties; actual and potential conflicts of interest with GC Advisors LLC ("GC Advisors"), our investment adviser, and other affiliates of Golub Capital Incorporated and Golub Capital LLC (collectively, "Golub Capital"); the dependence of our future success on the general economy and its effect on the industries in which we invest; the ability of our portfolio companies to achieve their objectives; the use of borrowed money to finance a portion of our investments; the adequacy of our financing sources and working capital; the timing of cash flows, if any, from the operations of our portfolio companies; the ability of GC Advisors to locate suitable investments for us and to monitor and administer our investments; the ability of GC Advisors or its affiliates to attract and retain highly talented professionals; our ability to qualify and maintain our qualification as a regulated investment company and as a business development company; the impact on our business of the Dodd - Frank Wall Street Reform and Consumer Protection Act and the rules and regulations issued thereunder; and the effect of changes to tax legislation and our tax position. Such forward - looking statements may include statements preceded by, followed by or that otherwise include the words “may,” “might,” “will,” “intend,” “should,” “could,” “can,” “would,” “expect,” “believe,” “estimate,” “anticipate,” “predict,” “potential,” “plan” or similar words. We have based the forward - looking statements included in this presentation on information available to us on the date of this presentation, and we assume no obligation to update any such forward - looking statements. Actual results could differ materially from those implied or expressed in our forward - looking statements for any reason, and future results could differ materially from historical performance. Although we undertake no obligation to revise or update any forward - looking statements, whether as a result of new information, future events or otherwise, you are advised to consult any additional disclosures that we may make directly to you or through reports that we have filed or in the future may file with the Securities and Exchange Commission (“SEC”), including annual reports on Form 10 - K, quarterly reports on Form 10 - Q and current reports on Form 8 - K. This presentation contains statistics and other data that have been obtained from or compiled from information made available by third - party service providers. We have not independently verified such statistics or data. 5/2/2013

2 Summary of Quarterly Results Second Fiscal Quarter 2013 Highlights ▪ Net investment income for the quarter ended March 31, 2013 was $10.4 million, or $0.32 per share, as compared to $9.6 million, or $0.34 per share, for the quarter ended December 31, 2012. ▪ Net increase in net assets resulting from operations for the quarter ended March 31, 2013 was $12.3 million, or $0.38 per share, as compared to $9.3 million, or $0.33 per share, for the quarter ended December 31, 2012. ▪ New middle - market investment commitments in the amount of $58.1 million were made for the quarter ended March 31, 2013. Approximately 36% of the new investment commitments were senior secured loans, 25% were one stop loans, 38% were second lien loans and 1% were equity securities. Of the new investment commitments, $53.0 million funded at close. Overall, total investments in portfolio companies at fair value increased by approximately $20.1 million during the three months ended March 31, 2013. ▪ We amended our term debt securitization, which, among other things, increased the size of the total notes outstanding by $50.0 million, lowered the pricing on the Class A notes from LIBOR + 2.40% to LIBOR + 1.74% and extended the reinvestment period through July 2015.
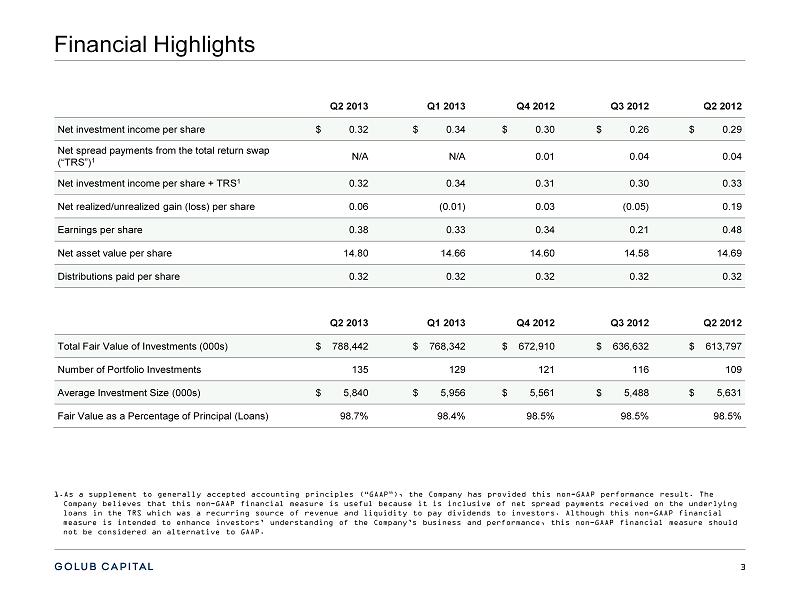
3 Financial Highlights Q2 2 013 Q1 2 013 Q4 2 01 2 Q3 2 01 2 Q2 2 01 2 Net investment income per share $ 0.32 $ 0.34 $ 0.30 $ 0.26 $ 0.29 Net spread payments from the total return swap (“TRS”) 1 N/A N/A 0.01 0.04 0.04 Net investment income per share + TRS 1 0.32 0.34 0.31 0.30 0.33 Net realized /unrealized gain (loss) per share 0.06 (0.01) 0.03 (0.05) 0 .1 9 Earnings per share 0. 38 0. 33 0. 34 0. 2 1 0.48 Net asset value per share 1 4.80 1 4.66 1 4.60 1 4.58 1 4.69 Distributions paid per share 0.32 0.32 0.32 0.32 0.32 Q2 2 013 Q1 2 013 Q4 2 01 2 Q3 2 01 2 Q2 2 01 2 Total Fair Value of Investments (000s) $ 788,442 $ 768,342 $ 672,910 $ 636,632 $ 61 3,797 Number of Portfolio Investments 135 129 121 11 6 1 09 Average Investment Size (000s) $ 5,840 $ 5,956 $ 5,561 $ 5,488 $ 5,6 3 1 Fair Value as a Percentage of Principal (Loans) 98.7% 98.4% 98.5% 98.5% 98.5% 1. As a supplement to generally accepted accounting principles (“GAAP”), the Company has provided this non - GAAP performance result. The Company believes that this non - GAAP financial measure is useful because it is inclusive of net spread payments received on the u nderlying loans in the TRS which was a recurring source of revenue and liquidity to pay dividends to investors. Although this non - GAAP fin ancial measure is intended to enhance investors’ understanding of the Company’s business and performance, this non - GAAP financial measure should not be considered an alternative to GAAP.
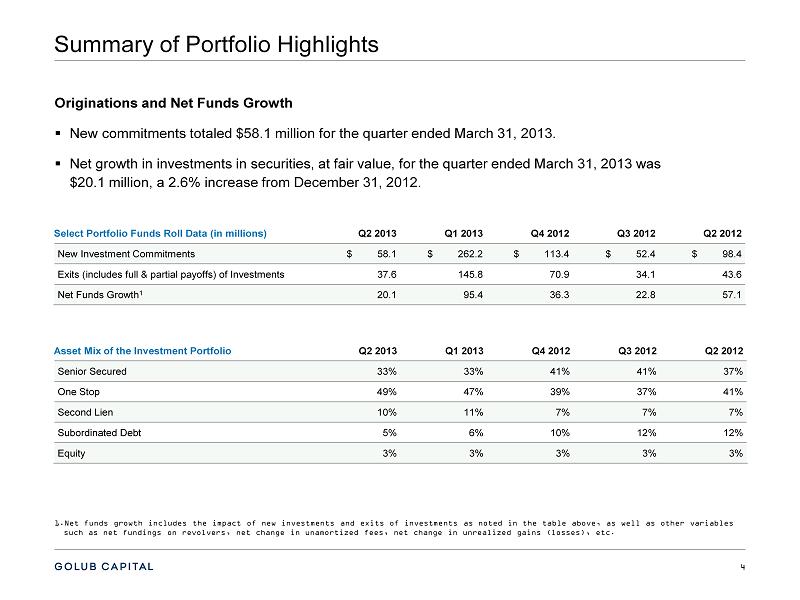
4 Summary of Portfolio Highlights Originations and Net Funds Growth ▪ New commitments totaled $58.1 million for the quarter ended March 31, 2013. ▪ Net growth in investments in securities, at fair value, for the quarter ended March 31, 2013 was $20.1 million, a 2.6% increase from December 31, 2012. Select Portfolio Funds Roll Data (in millions) Q2 2 013 Q1 2 013 Q4 2 01 2 Q3 2 01 2 Q2 2 01 2 New Investment Commitments $ 58.1 $ 262.2 $ 113.4 $ 52.4 $ 98.4 Exits (includes full & partial payoffs) of Investments 37.6 145.8 70.9 34 . 1 43.6 Net Funds Growth 1 20.1 95.4 36.3 22.8 57 . 1 Asset Mix of the Investment Portfolio Q2 2 013 Q1 2 013 Q4 2 01 2 Q3 2 01 2 Q2 2 01 2 Senior Secured 33% 33% 41 % 41 % 37% One Stop 49% 47% 39% 37% 41 % Second Lien 10% 11% 7% 7% 7% Subordinated Debt 5 % 6 % 10 % 1 2% 12 % Equity 3% 3% 3% 3% 3% 1. Net funds growth includes the impact of new investments and exits of investments as noted in the table above, as well as othe r v ariables such as net fundings on revolvers, net change in unamortized fees, net change in unrealized gains (losses), etc.
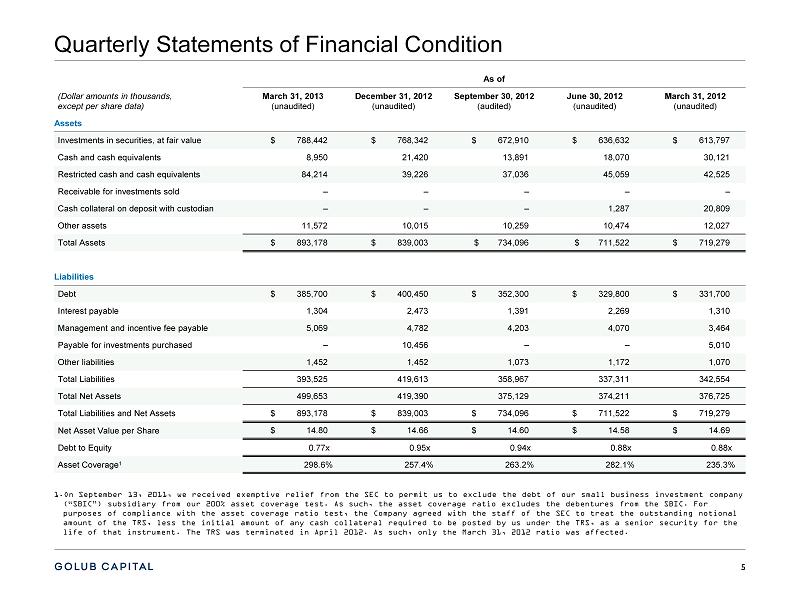
5 Quarterly Statements of Financial Condition As of ( Dollar amounts in thousands , except per share data) March 31, 2013 (unaudited ) December 31, 2012 (unaudited ) September 30, 2012 (audited ) June 30, 2012 (unaudited ) March 31, 2012 (unaudited ) Assets Investments in securities, at fair value $ 788,442 $ 768,342 $ 672,910 $ 636,632 $ 613,797 Cash and cash equivalents 8,950 21,420 13,891 18,070 30,121 Restricted cash and cash equivalents 84,214 39,226 37,036 45,059 42,525 Receivable for investments sold – – – – – Cash collateral on deposit with custodian – – – 1,287 20,809 Other assets 11,572 10,015 10,259 10,474 12,027 Total Assets $ 893,178 $ 839,003 $ 734,096 $ 711,522 $ 719,279 Liabilities Debt $ 385,700 $ 400,450 $ 352,300 $ 329,800 $ 331,700 Interest payable 1,304 2,473 1,391 2,269 1,310 Management and incentive fee payable 5,069 4,782 4,203 4,070 3,464 Payable for investments purchased – 10,456 – – 5,010 Other liabilities 1,452 1,452 1,073 1,172 1,070 Total Liabilities 393,525 419,613 358,967 337,311 342,554 Total Net Assets 499,653 419,390 375,129 374,211 376,725 Total Liabilities and Net Assets $ 893,178 $ 839,003 $ 734,096 $ 711,522 $ 719,279 Net Asset Value per Share $ 14.80 $ 14.66 $ 14.60 $ 14.58 $ 14.69 Debt to Equity 0.77x 0.95x 0.94x 0.88x 0.88x Asset Coverage 1 298.6% 257.4% 263.2% 282.1% 235.3% 1. On September 13, 2011, we received exemptive relief from the SEC to permit us to exclude the debt of our small business inves tme nt company (“SBIC”) subsidiary from our 200% asset coverage test. As such, the asset coverage ratio excludes the debentures from the SBIC. For purposes of compliance with the asset coverage ratio test, the Company agreed with the staff of the SEC to treat the outstand ing notional amount of the TRS, less the initial amount of any cash collateral required to be posted by us under the TRS, as a senior secu rit y for the life of that instrument. The TRS was terminated in April 2012. As such, only the March 31, 2012 ratio was affected.
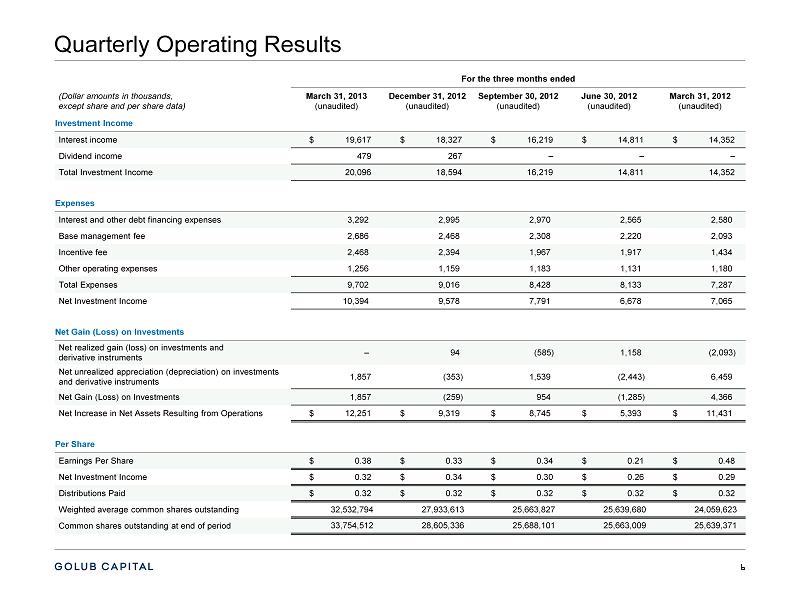
6 Quarterly Operating Results For the three months ended ( Dollar amounts in thousands , except share and per share data) March 31, 2013 (unaudited) December 31 , 2 01 2 (unaudited) September 30 , 2 01 2 (unaudited) June 30 , 2 01 2 (unaudited) March 31 , 2 01 2 (unaudited) Investment Income Interest income $ 19,617 $ 18,327 $ 16,219 $ 14,811 $ 14,352 Dividend income 479 267 – – – Total Investment Income 20,096 18,594 16,219 14,811 14,352 Expenses Interest and other debt financing expenses 3,292 2,995 2,970 2,565 2,580 Base management fee 2,686 2,468 2,308 2,220 2,093 Incentive fee 2,468 2,394 1,967 1,917 1,434 Other operating expenses 1,256 1,159 1,183 1,131 1,180 Total Expenses 9,702 9,016 8,428 8,133 7,287 Net Investment Income 10,394 9,578 7,791 6,678 7,065 Net Gain (Loss) on Investments Net realized gain (loss) on investments and derivative instruments – 94 (585) 1,158 (2,093) Net unrealized appreciation (depreciation) on investments and derivative instruments 1,857 (353) 1,539 (2,443) 6,459 Net Gain (Loss) on Investments 1,857 (259) 954 (1,285) 4,366 Net Increase in Net Assets Resulting from Operations $ 12,251 $ 9,319 $ 8,745 $ 5,393 $ 11,431 Per Share Earnings P er Share $ 0.38 $ 0.33 $ 0.34 $ 0.21 $ 0.48 Net Investment Income $ 0.32 $ 0.34 $ 0.30 $ 0.26 $ 0.29 Distributions Paid $ 0.32 $ 0.32 $ 0.32 $ 0.32 $ 0.32 Weighted average common shares outstanding 32,532,794 27,933,613 25,663,827 25,639,680 24,059,623 Common shares outstanding at end of period 33,754,512 28,605,336 25,688,101 25,663,009 25,639,371

7 37% 41% 41% 33% 33% 41% 37% 39% 47% 49% 7% 7% 7% 11% 10% 12% 12% 10% 6% 5% 0 100,000 200,000 300,000 400,000 500,000 600,000 700,000 800,000 900,000 Q2 2012 Q3 2012 Q4 2012 Q1 2013 Q2 2013 Senior Secured One Stop Second Lien Subordinated Debt Equity Portfolio Highlights – Asset Mix $613,797 $636,632 New Investment Commitments End of Period Investments 39% 92% 34% 22% 36% 36% 63% 61% 25% 12% 15% 38% 9% 0 50,000 100,000 150,000 200,000 250,000 300,000 Q2 2012 Q3 2012 Q4 2012 Q1 2013 Q2 2013 Senior Secured One Stop Second Lien Subordinated Debt Equity 4 % $98,354 3 % $52,363 5 % 3% 3 % 3 % $113,354 $672,910 3 % $262,247 2 % 3 % $768,342 1 % $58,115 $788,442 3 %
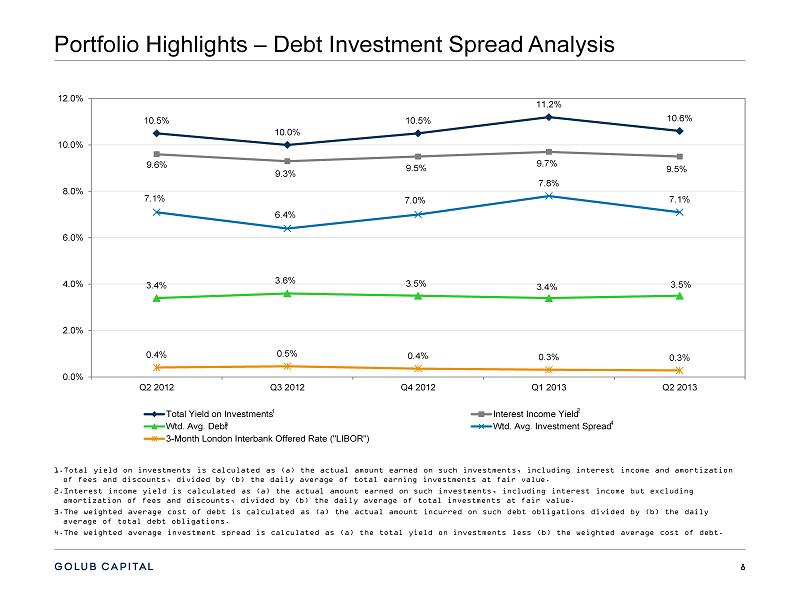
8 Portfolio Highlights – Debt Investment Spread Analysis 1. Total yield on investments is calculated as (a) the actual amount earned on such investments, including interest income and a mor tization of fees and discounts, divided by (b) the daily average of total earning investments at fair value. 2. Interest income yield is calculated as (a) the actual amount earned on such investments, including interest income but exclud ing amortization of fees and discounts, divided by (b) the daily average of total investments at fair value. 3. The weighted average cost of debt is calculated as (a) the actual amount incurred on such debt obligations divided by (b) the da ily average of total debt obligations. 4. The weighted average investment spread is calculated as (a) the total yield on investments less (b) the weighted average cost of debt. 10.5% 10.0% 10.5% 11.2% 10.6% 9.6% 9.3% 9.5% 9.7% 9.5% 3.4% 3.6% 3.5% 3.4% 3.5% 7.1% 6.4% 7.0% 7.8% 7.1% 0.4% 0.5% 0.4% 0.3% 0.3% 0.0% 2.0% 4.0% 6.0% 8.0% 10.0% 12.0% Q2 2012 Q3 2012 Q4 2012 Q1 2013 Q2 2013 Total Yield on Investments Interest Income Yield Wtd. Avg. Debt Wtd. Avg. Investment Spread 3-Month London Interbank Offered Rate ("LIBOR") 1 3 2 4
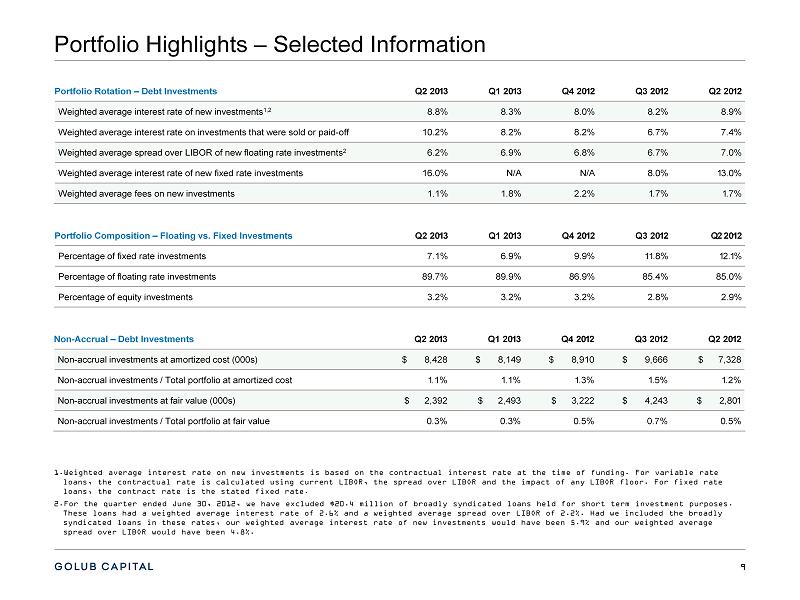
9 Portfolio Highlights – Selected Information Portfolio Rotation – Debt Investments Q2 2 01 3 Q1 2 01 3 Q4 2 01 2 Q3 2 01 2 Q2 2 01 2 Weighted average interest rate of new investments 1,2 8.8% 8.3% 8.0% 8.2% 8.9% Weighted average interest rate on investments that were sold or paid - off 10.2% 8.2% 8.2% 6.7% 7.4% Weighted average spread over LIBOR of new floating rate investments 2 6.2% 6.9% 6.8% 6.7% 7.0% Weighted average interest rate of new fixed rate investments 16.0% N/A N/A 8.0% 1 3.0% Weighted average fees on new investments 1.1% 1.8% 2.2% 1 .7% 1 .7% Portfolio Composition – Floating vs. Fixed Investments Q2 2 01 3 Q1 2 01 3 Q4 2 01 2 Q3 2 01 2 Q2 2 01 2 Percentage of fixed rate investments 7.1% 6.9% 9.9% 11 .8% 1 2 .1 % Percentage of floating rate investments 89.7% 89.9% 86.9% 85.4% 85.0% Percentage of equity investments 3.2% 3.2% 3.2% 2.8% 2.9% Non - Accrual – Debt Investments Q2 2 01 3 Q1 2 01 3 Q4 2 01 2 Q3 2 01 2 Q2 2 01 2 Non - accrual investments at amortized cost (000s) $ 8,428 $ 8,149 $ 8,910 $ 9,666 $ 7,328 Non - accrual investments / Total portfolio at amortized cost 1 .1% 1 .1% 1 .3% 1 .5% 1 .2% Non - accrual investments at fair value (000s) $ 2,392 $ 2,493 $ 3,222 $ 4,243 $ 2,8 0 1 Non - accrual investments / Total portfolio at fair value 0.3% 0.3% 0.5% 0.7% 0.5% 1. Weighted average interest rate on new investments is based on the contractual interest rate at the time of funding. For varia ble rate loans, the contractual rate is calculated using current LIBOR, the spread over LIBOR and the impact of any LIBOR floor. For f ixe d rate loans, the contract rate is the stated fixed rate. 2. For the quarter ended June 30, 2012, we have excluded $20.4 million of broadly syndicated loans held for short term investment purposes. These loans had a weighted average interest rate of 2.6% and a weighted average spread over LIBOR of 2.2%. Had we included th e b roadly syndicated loans in these rates, our weighted average interest rate of new investments would have been 5.9% and our weighted ave rage spread over LIBOR would have been 4.8 %.
10 Credit Quality Credit Quality – Investment Portfolio ▪ Fundamental credit quality remains strong with non - earning assets representing 0.3% of the total investments at fair value as of March 31, 2013. One new non - earning account was added during the quarter which has cost and fair value of $0.5 million and $0.2 million, respectively, as of March 31, 2013. ▪ Performance ratings on the investment portfolio have remained stable for the past several quarters and over 90.0% of the investments in our portfolio had a risk rating of 4 or higher as of March 31, 2013. ▪ The fair value of debt investments as a percentage of principal amount remained stable at 98.7% for the period ended March 31, 2013.
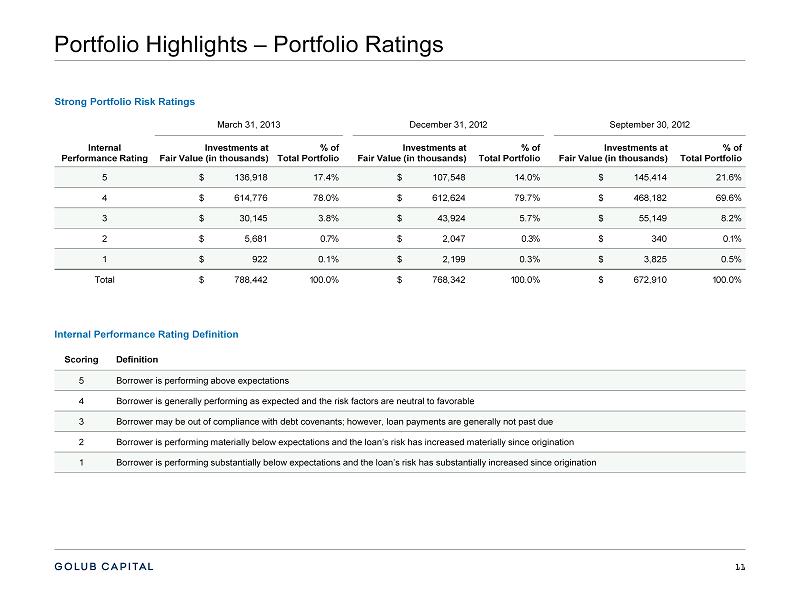
11 Portfolio Highlights – Portfolio Ratings Scoring Definition 5 Borrower is performing above expectations 4 Borrower is generally performing as expected and the risk factors are neutral to favorable 3 Borrower may be out of compliance with debt covenants; however, loan payments are generally not past due 2 Borrower is performing materially below expectations and the loan’s risk has increased materially since origination 1 Borrower is p erforming substantially below expectations and the loan’s risk has substantially increased since origination March 31, 2013 December 31 , 2 01 2 September 30 , 2 01 2 Internal Performance Rating Investments at Fair Value (in thousands) % of Total Portfolio Investments at Fair Value (in thousands) % of Total Portfolio Investments at Fair Value (in thousands) % of Total Portfolio 5 $ 136,918 17.4% $ 107,548 14.0% $ 145,414 21.6% 4 $ 614,776 78.0% $ 612,624 79.7% $ 468,182 69.6% 3 $ 30,145 3.8% $ 43,924 5.7% $ 55,149 8.2% 2 $ 5,681 0 .7 % $ 2,047 0 .3 % $ 340 0 .1 % 1 $ 922 0.1% $ 2,199 0.3% $ 3,825 0.5% Total $ 788,442 1 00.0% $ 768,342 1 00.0% $ 672,910 1 00.0% Strong Portfolio Risk Ratings Internal Performance Rating Definition
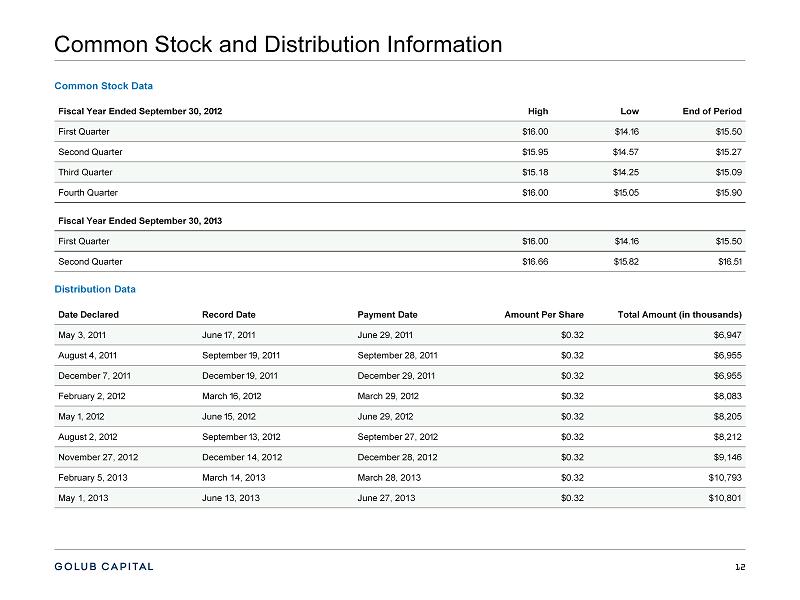
12 Common Stock and Distribution Information Common Stock Data Distribution Data Date Declared Record Date Payment Date Amount Per Share Total Amount (in thousands) May 3, 2 01 1 June 1 7, 2 01 1 June 29, 2 01 1 $0.32 $6,947 August 4, 2 01 1 September 1 9, 2 01 1 September 28, 2 01 1 $0.32 $6,955 December 7, 2 01 1 December 1 9, 2 01 1 December 29, 2 01 1 $0.32 $6,955 February 2, 2 01 2 March 1 6, 2 01 2 March 29, 2 01 2 $0.32 $8,083 May 1 , 2 01 2 June 1 5, 2 01 2 June 29, 2 01 2 $0.32 $8,205 August 2, 2 01 2 September 1 3, 2 01 2 September 27, 2 01 2 $0.32 $8,212 November 27, 2012 December 14, 2012 December 28, 2012 $0.32 $9,146 February 5, 2013 March 14, 2013 March 28, 2013 $0.32 $10,793 May 1, 2013 June 13, 2013 June 27, 2013 $0.32 $10,801 Fiscal Year Ended September 30, 2 01 2 High Low End of Period First Quarter $1 6.00 $1 4 .1 6 $1 5.50 Second Quarter $1 5.95 $1 4.57 $1 5.27 Third Quarter $1 5.18 $1 4.25 $1 5.09 Fourth Quarter $1 6 .00 $15 .05 $1 5.90 Fiscal Year Ended September 30, 2 01 3 First Quarter $1 6.00 $1 4 .1 6 $1 5.50 Second Quarter $1 6 .66 $15 .82 $16..51

13 Liquidity and Investment Capacity Cash and Cash Equivalents ▪ Unrestricted cash totaled $9.0 million as of March 31, 2013. ▪ Restricted cash totaled $84.2 million as of March 31, 2013. Restricted cash was held in our securitization vehicle, SBIC subsidiaries and our revolving credit facility and is available for new investments that qualify for acquisition by these entities. Debt Facilities ▪ On February 15, 2013, we amended our term debt securitization as follows: ▫ Issued an additional $ 50.0 million of notes (increasing the Class A Notes by $ 29.0 million, increasing the Class B Notes by $ 2.0 million and increasing the Subordinated Notes by $ 19.0 million) ▫ Extended the reinvestment period by two years to July 20, 2015 ▫ E xtended the stated maturity date of the notes by two years to July 20, 2023 ▫ R e - priced the Class A Notes to bear interest at the London Interbank Offered Rate, or LIBOR, plus 1.74%. The Class A Notes previously bore interest at LIBOR plus 2.40%. ▪ As a result of receiving our second SBIC license and increasing the size of our term debt securitization, on March 8, 2013, we amended our revolving credit facility to reduce the size from $150.0 million to $100.0 million. ▪ As of March 31, 2013, subject to leverage and borrowing base restrictions, we had $52.3 million available for additional borrowings on our revolving credit facility.
14 Liquidity and Investment Capacity Debt Facilities - continued ▪ As of March 31, 2013, we had $15.0 million in available and approved debentures through our wholly owned SBIC subsidiaries. An additional $75.0 million of debentures are also available through our SBIC subsidiaries, subject to customary SBA regulatory requirements.