GOLUB CAPITAL BDC, INC. INVESTOR PRESENTATION QUARTER ENDED SEPTEMBER 30, 2020
Disclaimer Some of the statements in this presentation constitute forward-looking statements, which relate to future events or our future performance or financial condition. The forward-looking statements contained in this presentation involve risks and uncertainties, including statements as to: our future operating results; our business prospects and the prospects of our portfolio companies including our and their ability to achieve our and their respective objectives as a result of the coronavirus ("COVID-19") pandemic ; the effect of investments that we expect to make and the competition for those investments; our contractual arrangements and relationships with third parties; actual and potential conflicts of interest with GC Advisors LLC ("GC Advisors"), our investment adviser, and other affiliates of Golub Capital LLC (collectively, "Golub Capital"); the dependence of our future success on the general economy and its effect on the industries in which we invest; the ability of our portfolio companies to achieve their objectives; the use of borrowed money to finance a portion of our investments and the effect of the COVID-19 pandemic on the availability of equity and debt capital and our use of borrowed funds to finance a portion of our investments; the adequacy of our financing sources and working capital; the timing of cash flows, if any, from the operations of our portfolio companies; general economic and political trends and other external factors, including the COVID-19 pandemic; changes in political, economic or industry conditions, the interest rate environment or conditions affecting the financial and capital markets that could result in changes to the value of our assets, including changes from the impact of the COVID-19 pandemic; the ability of GC Advisors to locate suitable investments for us and to monitor and administer our investments; the ability of GC Advisors or its affiliates to attract and retain highly talented professionals; the ability of GC Advisors to continue to effectively manage our business due to the disruptions caused by the COVID-19 pandemic; our ability to qualify and maintain our qualification as a regulated investment company and as a business development company; general price and volume fluctuations in the stock market; the impact on our business of the Dodd-Frank Wall Street Reform and Consumer Protection Act and the rules and regulations issued thereunder and any actions toward repeal thereof; and the effect of changes to tax legislation and our tax position. Such forward-looking statements may include statements preceded by, followed by or that otherwise include the words “may,” “might,” “will,” “intend,” “should,” “could,” “can,” “would,” “expect,” “believe,” “estimate,” “anticipate,” “predict,” “potential,” “plan” or similar words. We have based the forward-looking statements included in this presentation on information available to us on the date of this presentation. Actual results could differ materially from those anticipated in our forward-looking statements and future results could differ materially from historical performance. We undertake no obligation to revise or update any forward-looking statements, whether as a result of new information, future events or otherwise. You are advised to consult any additional disclosures that we may make directly to you or through reports that we have filed or in the future may file with the Securities and Exchange Commission (“SEC”), including annual reports on Form 10-K, registration statements on Form N-2, quarterly reports on Form 10-Q and current reports on Form 8-K. This presentation contains statistics and other data that have been obtained from or compiled from information made available by third-party service providers. We have not independently verified such statistics or data. In evaluating prior performance information in this presentation, you should remember that past performance is not a guarantee, prediction, or projection of future results, and there can be no assurance that we will achieve similar results in the future. 2

Summary of Financial Results vs. Preliminary Estimates 01

4 Summary of Financial Results vs. Preliminary Estimates 1. On September 16, 2019, Golub Capital BDC, Inc. (“we”, “us”, “our”, the “Company” or “GBDC”) completed the acquisition of Golub Capital Investment Corporation (“GCIC”). Purchase premium refers to the premium paid by GBDC to acquire GCIC in excess of the fair value of the assets acquired. 2. Due to the purchase accounting for the GCIC acquisition, as a supplement to U.S. generally accepted accounting principles (“GAAP”) financial measures, the Company is providing additional non-GAAP measures. See the Endnotes at the end of this presentation for further description on the non-GAAP financial measures and the appendix pages at the end of this presentation for an illustration of the purchase accounting results from the GCIC acquisition. FQ4 2020 Actual FQ4 2020 Preliminary Estimate Range (Filed October 19, 2020) Net Investment Income Per Share Net investment income per share $0.23 $0.22 $0.24 Amortization of purchase premium per share1 0.05 0.05 0.05 Adjusted net investment income per share2 $0.28 $0.27 $0.29 Net Realized/Unrealized Gain (Loss) Per Share Net realized/unrealized gain (loss) per share $0.34 $0.31 $0.37 Reversal of unrealized loss resulting from purchase price premium amortization per share1 (0.05) (0.05) (0.05) Adjusted net realized/unrealized gain (loss) per share2 $0.29 $0.26 $0.32 Earnings Per Share Earnings (loss) per share $0.57 $0.53 $0.61 Adjusted earnings (loss) per share2 $0.57 $0.53 $0.61 Net Asset Value Per Share $14.33 $14.29 $14.37 A B A B
GBDC Performance Drivers 02
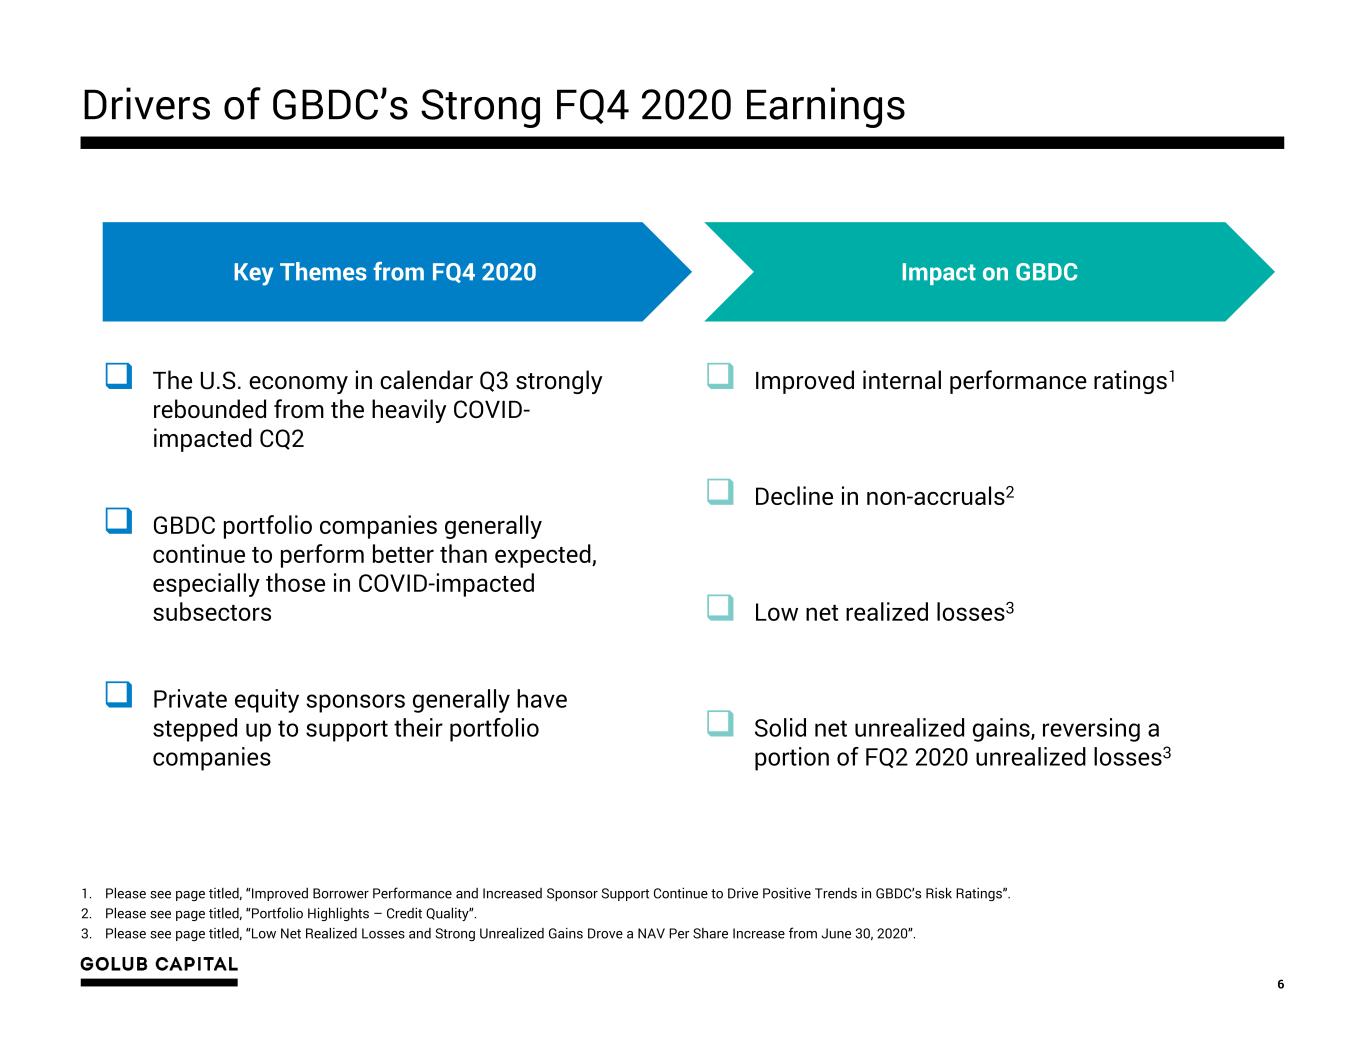
Drivers of GBDC’s Strong FQ4 2020 Earnings 6 Improved internal performance ratings1 Decline in non-accruals2 Low net realized losses3 Solid net unrealized gains, reversing a portion of FQ2 2020 unrealized losses3 Key Themes from FQ4 2020 Impact on GBDC The U.S. economy in calendar Q3 strongly rebounded from the heavily COVID- impacted CQ2 GBDC portfolio companies generally continue to perform better than expected, especially those in COVID-impacted subsectors Private equity sponsors generally have stepped up to support their portfolio companies 1. Please see page titled, “Improved Borrower Performance and Increased Sponsor Support Continue to Drive Positive Trends in GBDC’s Risk Ratings”. 2. Please see page titled, “Portfolio Highlights – Credit Quality”. 3. Please see page titled, “Low Net Realized Losses and Strong Unrealized Gains Drove a NAV Per Share Increase from June 30, 2020”.
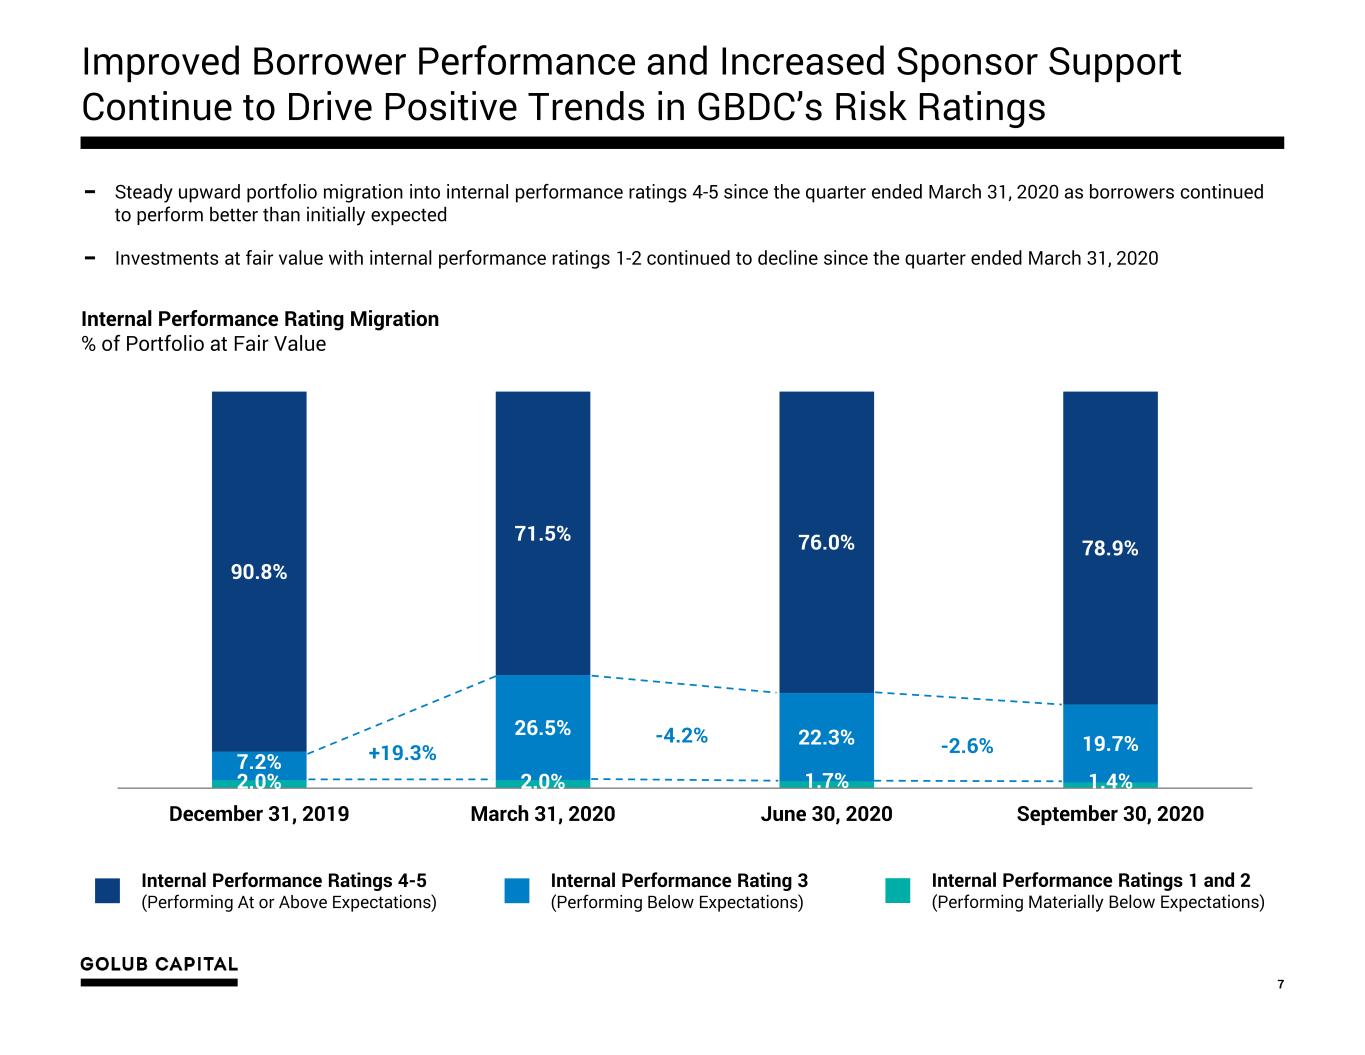
Improved Borrower Performance and Increased Sponsor Support Continue to Drive Positive Trends in GBDC’s Risk Ratings 7 Internal Performance Rating Migration % of Portfolio at Fair Value 2.0% 2.0% 1.7% 1.4% 7.2% 26.5% 22.3% 19.7% 90.8% 71.5% 76.0% 78.9% December 31, 2019 March 31, 2020 June 30, 2020 September 30, 2020 Internal Performance Ratings 4-5 (Performing At or Above Expectations) Internal Performance Rating 3 (Performing Below Expectations) Internal Performance Ratings 1 and 2 (Performing Materially Below Expectations) -2.6%-4.2%+19.3% − Steady upward portfolio migration into internal performance ratings 4-5 since the quarter ended March 31, 2020 as borrowers continued to perform better than initially expected − Investments at fair value with internal performance ratings 1-2 continued to decline since the quarter ended March 31, 2020
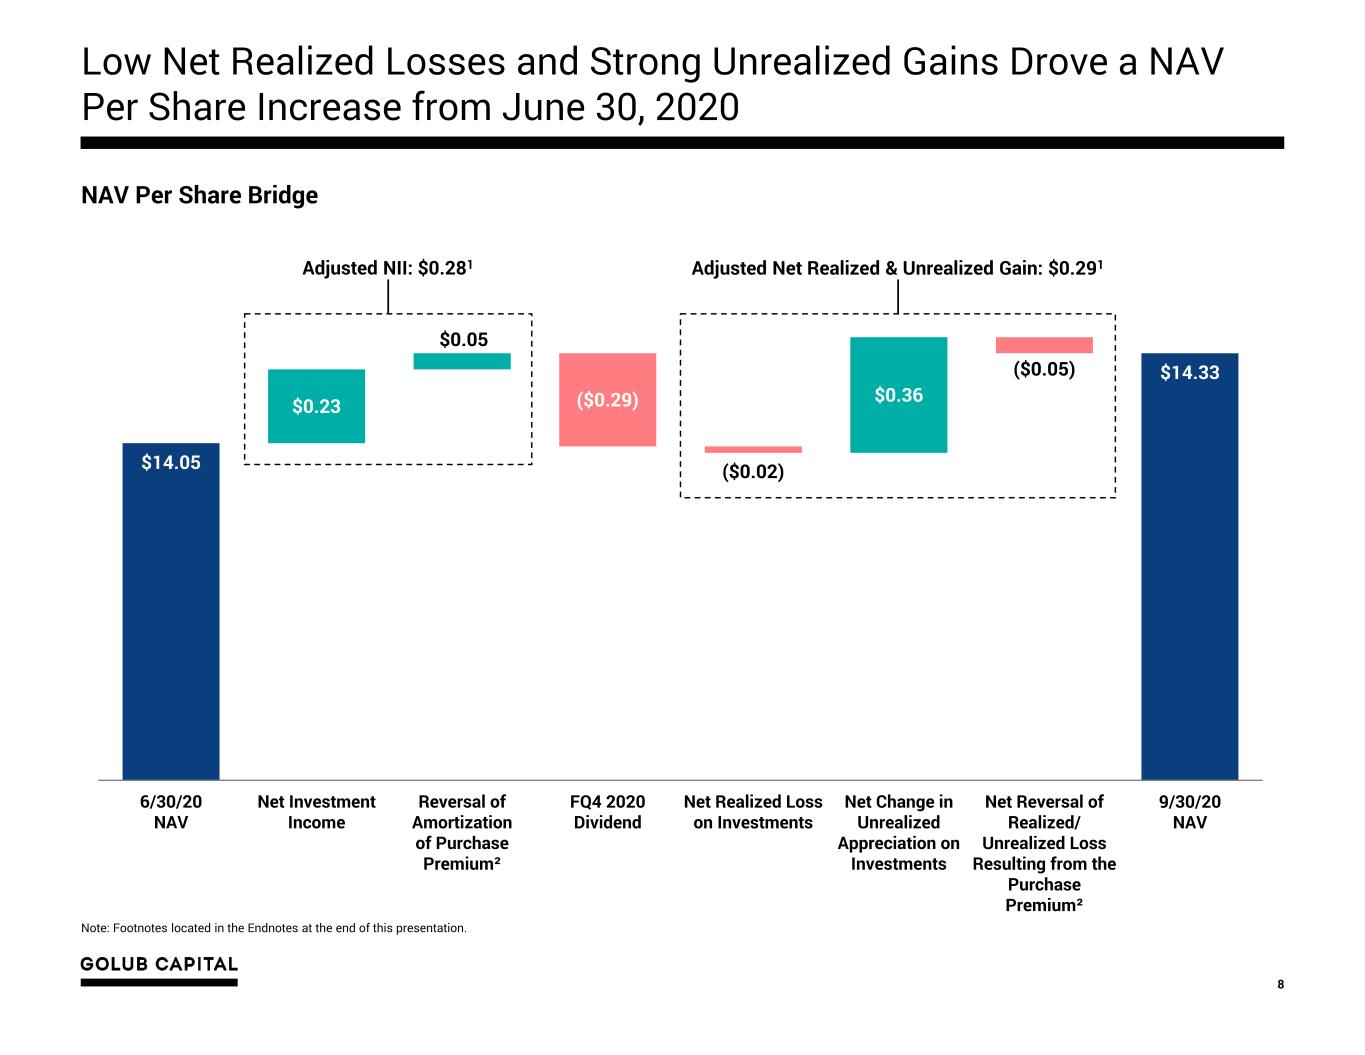
$14.05 $14.33 $0.23 $0.05 $0.36 ($0.29) ($0.02) ($0.05) 6/30/20 NAV Net Investment Income Reversal of Amortization of Purchase Premium² FQ4 2020 Dividend Net Realized Loss on Investments Net Change in Unrealized Appreciation on Investments Net Reversal of Realized/ Unrealized Loss Resulting from the Purchase Premium² 9/30/20 NAV Note: Footnotes located in the Endnotes at the end of this presentation. Low Net Realized Losses and Strong Unrealized Gains Drove a NAV Per Share Increase from June 30, 2020 8 NAV Per Share Bridge Adjusted NII: $0.281 Adjusted Net Realized & Unrealized Gain: $0.291
Navigating COVID-19: Strategic Response Update 03

COVID-19 Strategic Response Update 10 1. Proactively manage its highly diversified, first lien, senior secured investment portfolio 2. Optimize the balance sheet 3. Capitalize on attractive new investment opportunities GBDC continues to execute on its three key goals for navigating the COVID-19 crisis:

Proactive Portfolio Management to Minimize Net Realized Credit Losses 11 Golub Capital has taken measures to address the economic and market impact of COVID-19 on GBDC’s portfolio companies 130+ Including 7 senior workouts team leaders with an average of over 20 years of experience Investment Professionals Private Equity Support 100% Proportion of GBDC’s originations in current portfolio backed by private equity sponsors Lead Lender Position 94% Average proportion of Golub Capital’s origination volume over the last 5 years where it was lead lender Phase 1: Gather Information Phase 2: Develop Strategic Plans Phase 3: Execute Strategic Plans • Design and execute game plans for each borrower, working with sponsors, management teams and junior capital lenders • Credit-enhance portfolio through amendments and incremental investments as appropriate • In select cases, assume control over companies that sponsors are not prepared to support • Executed 90+ credit-enhancing amendments (representing over 20% of total debt investments at fair value) since mid-March with a focus on borrowers in COVID 19- impacted subsectors • Only one default occurred during the quarter ended September 30, 2020—a consensual restructuring that resulted in Golub Capital taking over a controlling equity interest ✓ ✓ Phase 3 Goals Phase 3 Update

GBDC’s Balance Sheet is Well-Positioned for the Current Environment 12 Debt Mix by Vehicle Type – Par Outstanding − GAAP leverage of 0.85x (regulatory leverage of 0.76x) as of September 30, 2020 − Substantial liquidity (cash and borrowing capacity) of nearly $500 million − Resilient and flexible debt capital structure that was enhanced by the following recent transactions: On August 26, 2020, we issued $189.0 million in notes through a term debt securitization (“2020 Debt Securitization”). A portion of the proceeds was used to retire the 2014 Debt Securitization that was out of its reinvestment period On September 30, 2020, we priced our debut unsecured bond offering—a $400.0 million investment grade-rated, unsecured note issuance with a fixed interest rate of 3.375%1 and a maturity date of April 15, 2024. The offering closed on October 2, 2020 and proceeds were used to pay down our revolving bank credit facilities 1. Notes were issued at 99.8% of par with a yield to maturity of 3.399%. 2. Pro forma for the $400.0 million unsecured notes offering that closed on October 2, 2020 with proceeds being used to pay down revolving bank facilities. SBA Debentures 14% Bank Facilities 35% Securitizations 51% Bank Facilities 13% SBA Debentures 11% Securitizations 56% Unsecured Notes 20% June 30, 2020 September 30, 2020 (Pro Forma)2
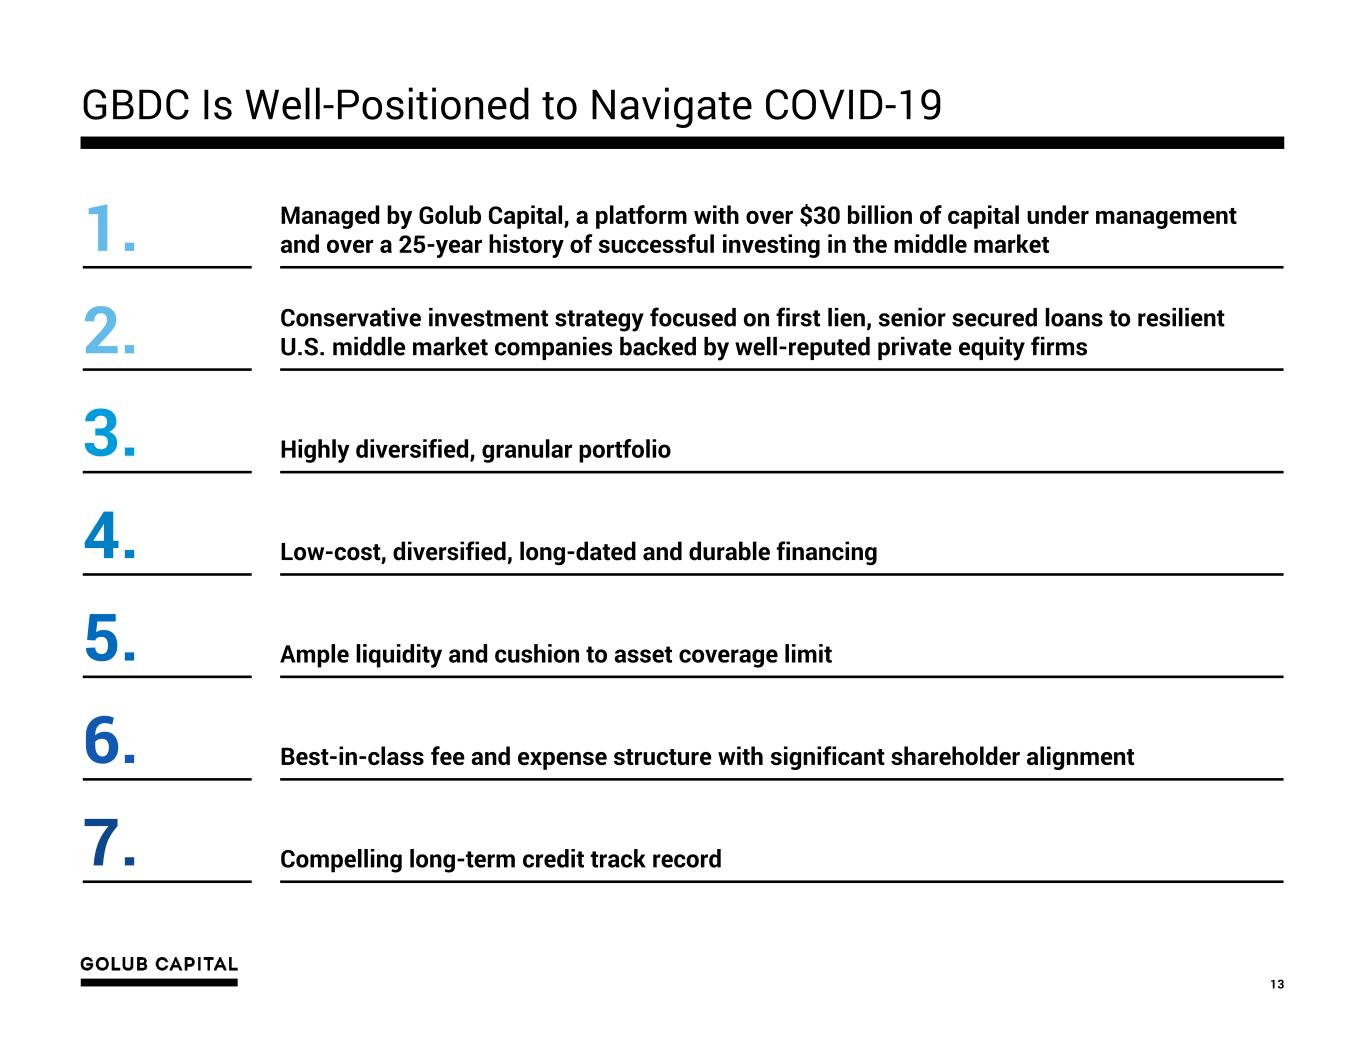
GBDC Is Well-Positioned to Navigate COVID-19 13 1. Managed by Golub Capital, a platform with over $30 billion of capital under management and over a 25-year history of successful investing in the middle market 2. Conservative investment strategy focused on first lien, senior secured loans to resilient U.S. middle market companies backed by well-reputed private equity firms 3. Highly diversified, granular portfolio 4. Low-cost, diversified, long-dated and durable financing 5. Ample liquidity and cushion to asset coverage limit 6. Best-in-class fee and expense structure with significant shareholder alignment 7. Compelling long-term credit track record
Summary of Financial Results for the Quarter Ended September 30, 2020 04
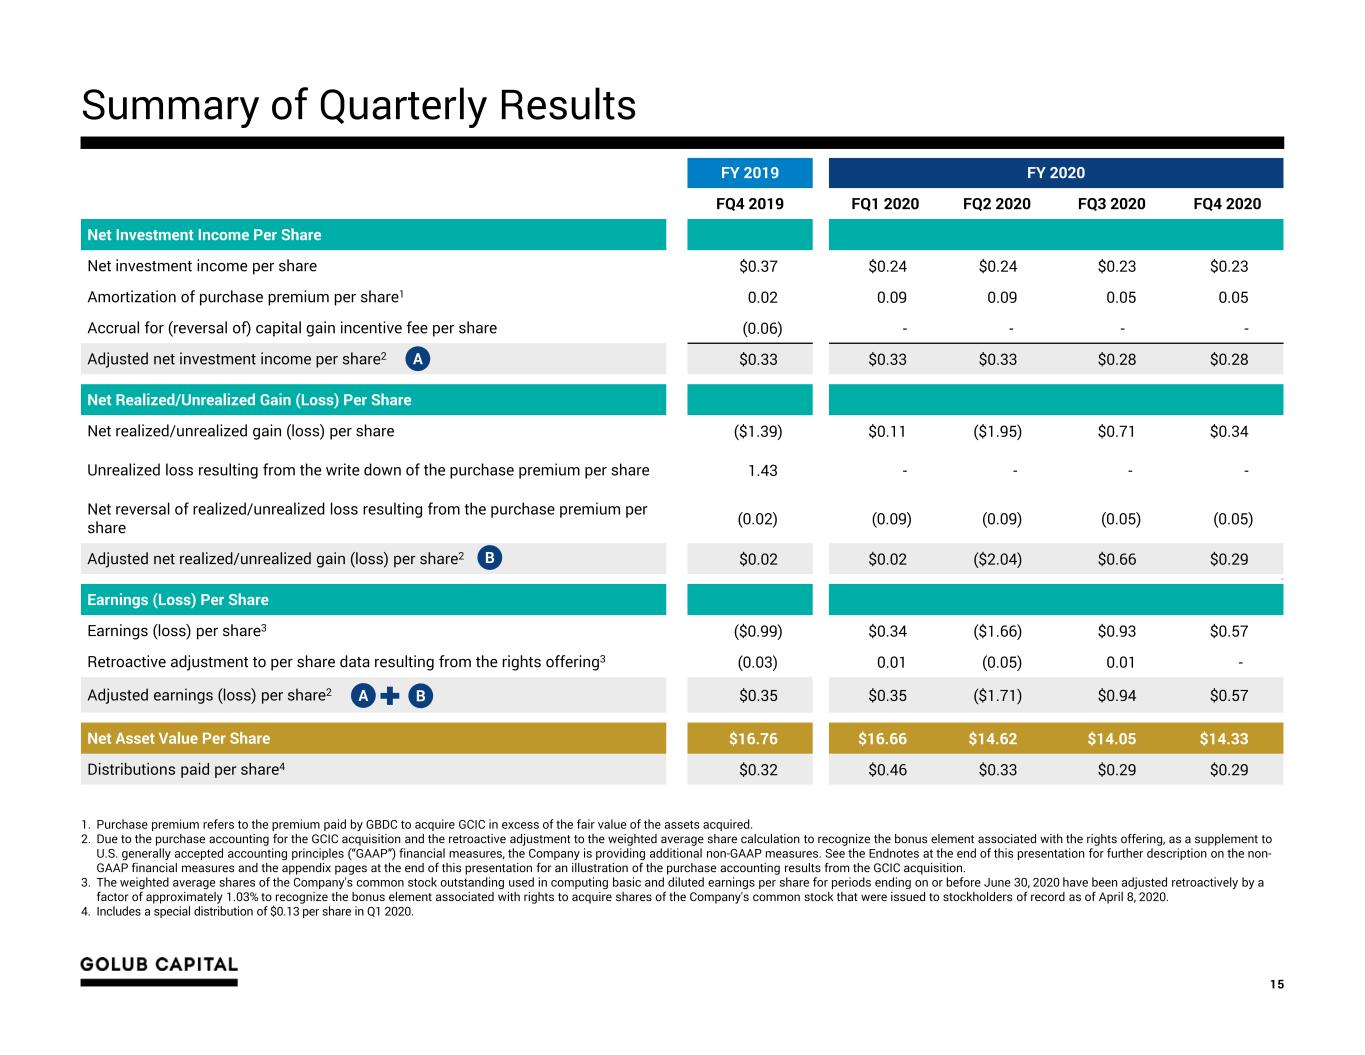
1. Purchase premium refers to the premium paid by GBDC to acquire GCIC in excess of the fair value of the assets acquired. 2. Due to the purchase accounting for the GCIC acquisition and the retroactive adjustment to the weighted average share calculation to recognize the bonus element associated with the rights offering, as a supplement to U.S. generally accepted accounting principles (“GAAP”) financial measures, the Company is providing additional non-GAAP measures. See the Endnotes at the end of this presentation for further description on the non- GAAP financial measures and the appendix pages at the end of this presentation for an illustration of the purchase accounting results from the GCIC acquisition. 3. The weighted average shares of the Company's common stock outstanding used in computing basic and diluted earnings per share for periods ending on or before June 30, 2020 have been adjusted retroactively by a factor of approximately 1.03% to recognize the bonus element associated with rights to acquire shares of the Company's common stock that were issued to stockholders of record as of April 8, 2020. 4. Includes a special distribution of $0.13 per share in Q1 2020. 15 FY 2019 FY 2020 FQ4 2019 FQ1 2020 FQ2 2020 FQ3 2020 FQ4 2020 Net Investment Income Per Share Net investment income per share $0.37 $0.24 $0.24 $0.23 $0.23 Amortization of purchase premium per share1 0.02 0.09 0.09 0.05 0.05 Accrual for (reversal of) capital gain incentive fee per share (0.06) - - - - Adjusted net investment income per share2 $0.33 $0.33 $0.33 $0.28 $0.28 Net Realized/Unrealized Gain (Loss) Per Share Net realized/unrealized gain (loss) per share ($1.39) $0.11 ($1.95) $0.71 $0.34 Unrealized loss resulting from the write down of the purchase premium per share 1.43 - - - - Net reversal of realized/unrealized loss resulting from the purchase premium per share (0.02) (0.09) (0.09) (0.05) (0.05) Adjusted net realized/unrealized gain (loss) per share2 $0.02 $0.02 ($2.04) $0.66 $0.29 00 Earnings (Loss) Per Share Earnings (loss) per share3 ($0.99) $0.34 ($1.66) $0.93 $0.57 Retroactive adjustment to per share data resulting from the rights offering3 (0.03) 0.01 (0.05) 0.01 - Adjusted earnings (loss) per share2 $0.35 $0.35 ($1.71) $0.94 $0.57 Net Asset Value Per Share $16.76 $16.66 $14.62 $14.05 $14.33 Distributions paid per share4 $0.32 $0.46 $0.33 $0.29 $0.29 A B B A Summary of Quarterly Results
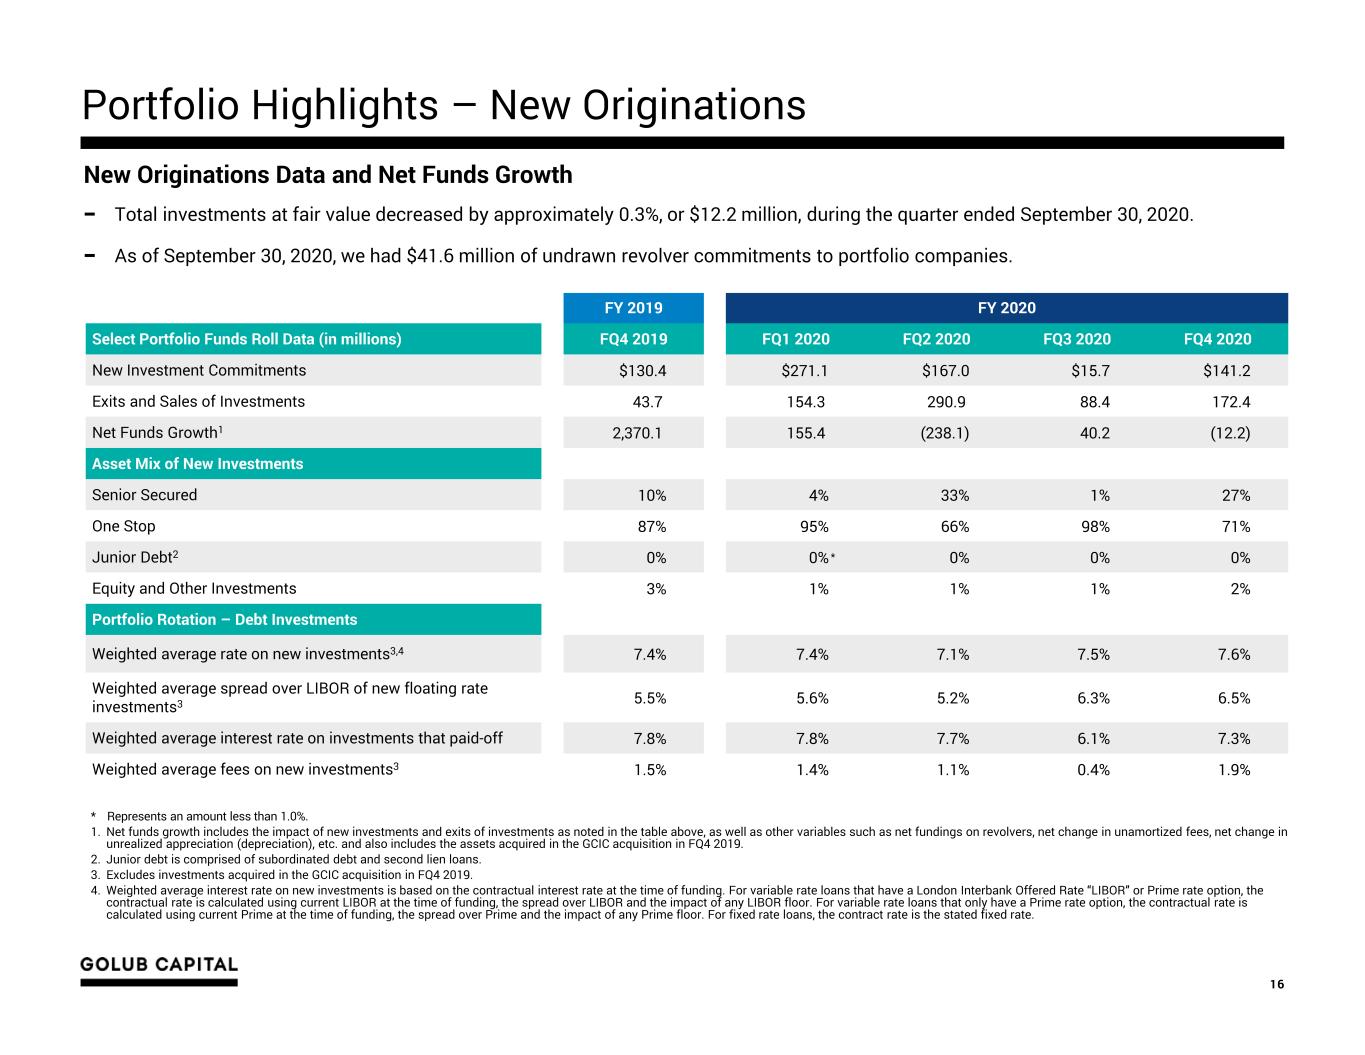
FY 2019 FY 2020 Select Portfolio Funds Roll Data (in millions) FQ4 2019 FQ1 2020 FQ2 2020 FQ3 2020 FQ4 2020 New Investment Commitments $130.4 $271.1 $167.0 $15.7 $141.2 Exits and Sales of Investments 43.7 154.3 290.9 88.4 172.4 Net Funds Growth1 2,370.1 155.4 (238.1) 40.2 (12.2) Asset Mix of New Investments Senior Secured 10% 4% 33% 1% 27% One Stop 87% 95% 66% 98% 71% Junior Debt2 0% 0% 0% 0% 0% Equity and Other Investments 3% 1% 1% 1% 2% Portfolio Rotation – Debt Investments Weighted average rate on new investments3,4 7.4% 7.4% 7.1% 7.5% 7.6% Weighted average spread over LIBOR of new floating rate investments3 5.5% 5.6% 5.2% 6.3% 6.5% Weighted average interest rate on investments that paid-off 7.8% 7.8% 7.7% 6.1% 7.3% Weighted average fees on new investments3 1.5% 1.4% 1.1% 0.4% 1.9% * Represents an amount less than 1.0%. 1. Net funds growth includes the impact of new investments and exits of investments as noted in the table above, as well as other variables such as net fundings on revolvers, net change in unamortized fees, net change in unrealized appreciation (depreciation), etc. and also includes the assets acquired in the GCIC acquisition in FQ4 2019. 2. Junior debt is comprised of subordinated debt and second lien loans. 3. Excludes investments acquired in the GCIC acquisition in FQ4 2019. 4. Weighted average interest rate on new investments is based on the contractual interest rate at the time of funding. For variable rate loans that have a London Interbank Offered Rate “LIBOR” or Prime rate option, the contractual rate is calculated using current LIBOR at the time of funding, the spread over LIBOR and the impact of any LIBOR floor. For variable rate loans that only have a Prime rate option, the contractual rate is calculated using current Prime at the time of funding, the spread over Prime and the impact of any Prime floor. For fixed rate loans, the contract rate is the stated fixed rate. 16 New Originations Data and Net Funds Growth − Total investments at fair value decreased by approximately 0.3%, or $12.2 million, during the quarter ended September 30, 2020. − As of September 30, 2020, we had $41.6 million of undrawn revolver commitments to portfolio companies. * Portfolio Highlights – New Originations
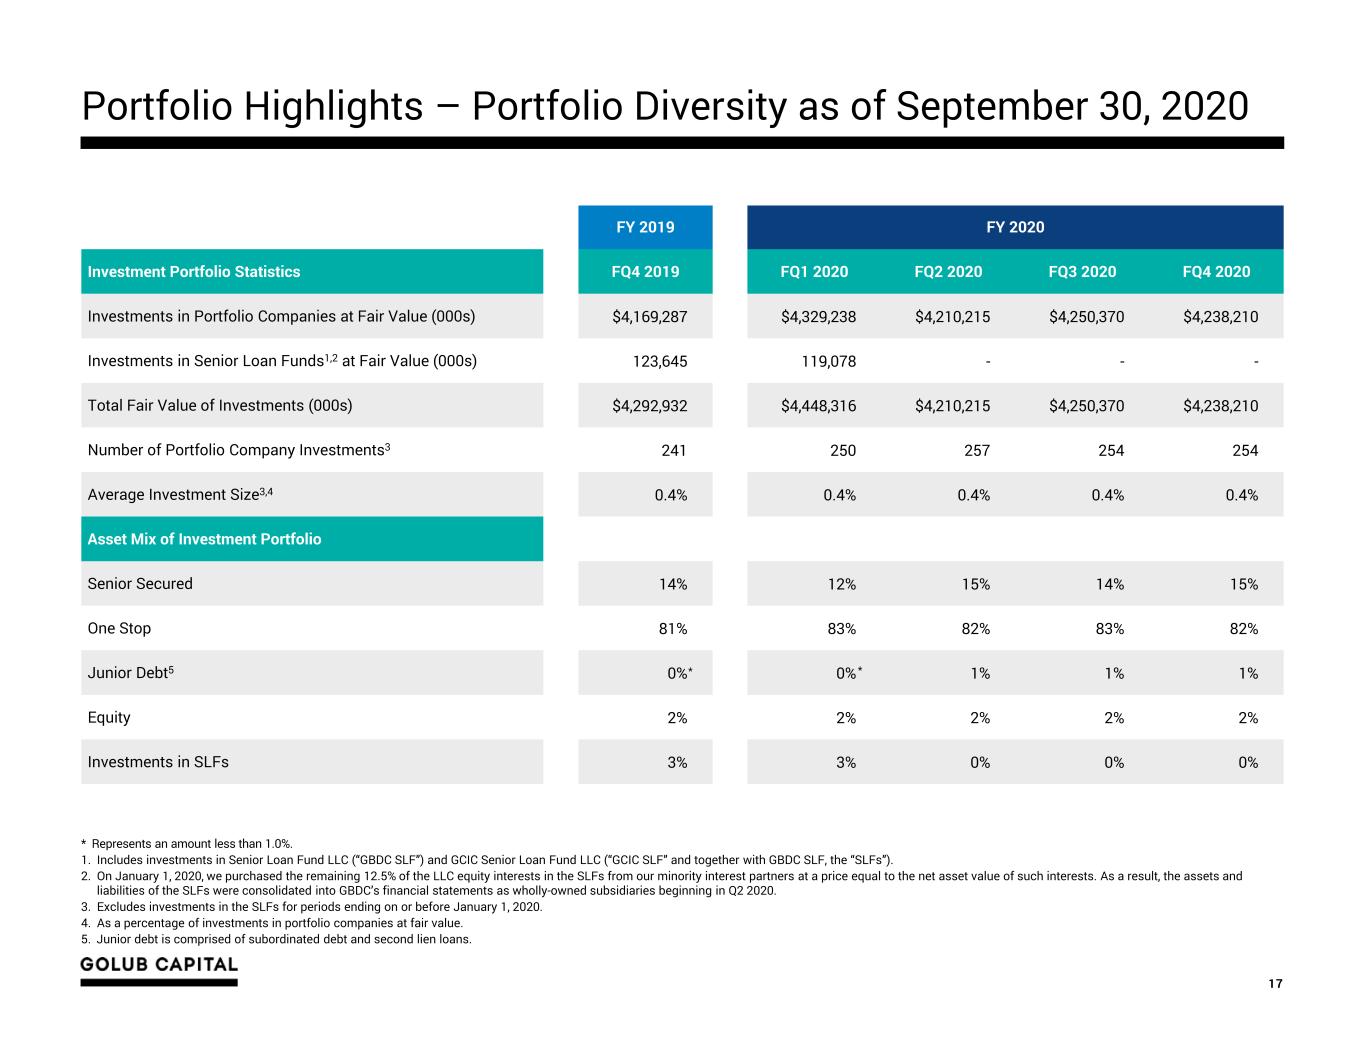
FY 2019 FY 2020 Investment Portfolio Statistics FQ4 2019 FQ1 2020 FQ2 2020 FQ3 2020 FQ4 2020 Investments in Portfolio Companies at Fair Value (000s) $4,169,287 $4,329,238 $4,210,215 $4,250,370 $4,238,210 Investments in Senior Loan Funds1,2 at Fair Value (000s) 123,645 119,078 - - - Total Fair Value of Investments (000s) $4,292,932 $4,448,316 $4,210,215 $4,250,370 $4,238,210 Number of Portfolio Company Investments3 241 250 257 254 254 Average Investment Size3,4 0.4% 0.4% 0.4% 0.4% 0.4% Asset Mix of Investment Portfolio Senior Secured 14% 12% 15% 14% 15% One Stop 81% 83% 82% 83% 82% Junior Debt5 0% 0% 1% 1% 1% Equity 2% 2% 2% 2% 2% Investments in SLFs 3% 3% 0% 0% 0% * Represents an amount less than 1.0%. 1. Includes investments in Senior Loan Fund LLC (“GBDC SLF”) and GCIC Senior Loan Fund LLC (“GCIC SLF” and together with GBDC SLF, the “SLFs”). 2. On January 1, 2020, we purchased the remaining 12.5% of the LLC equity interests in the SLFs from our minority interest partners at a price equal to the net asset value of such interests. As a result, the assets and liabilities of the SLFs were consolidated into GBDC’s financial statements as wholly-owned subsidiaries beginning in Q2 2020. 3. Excludes investments in the SLFs for periods ending on or before January 1, 2020. 4. As a percentage of investments in portfolio companies at fair value. 5. Junior debt is comprised of subordinated debt and second lien loans. 17 Portfolio Highlights – Portfolio Diversity as of September 30, 2020 **
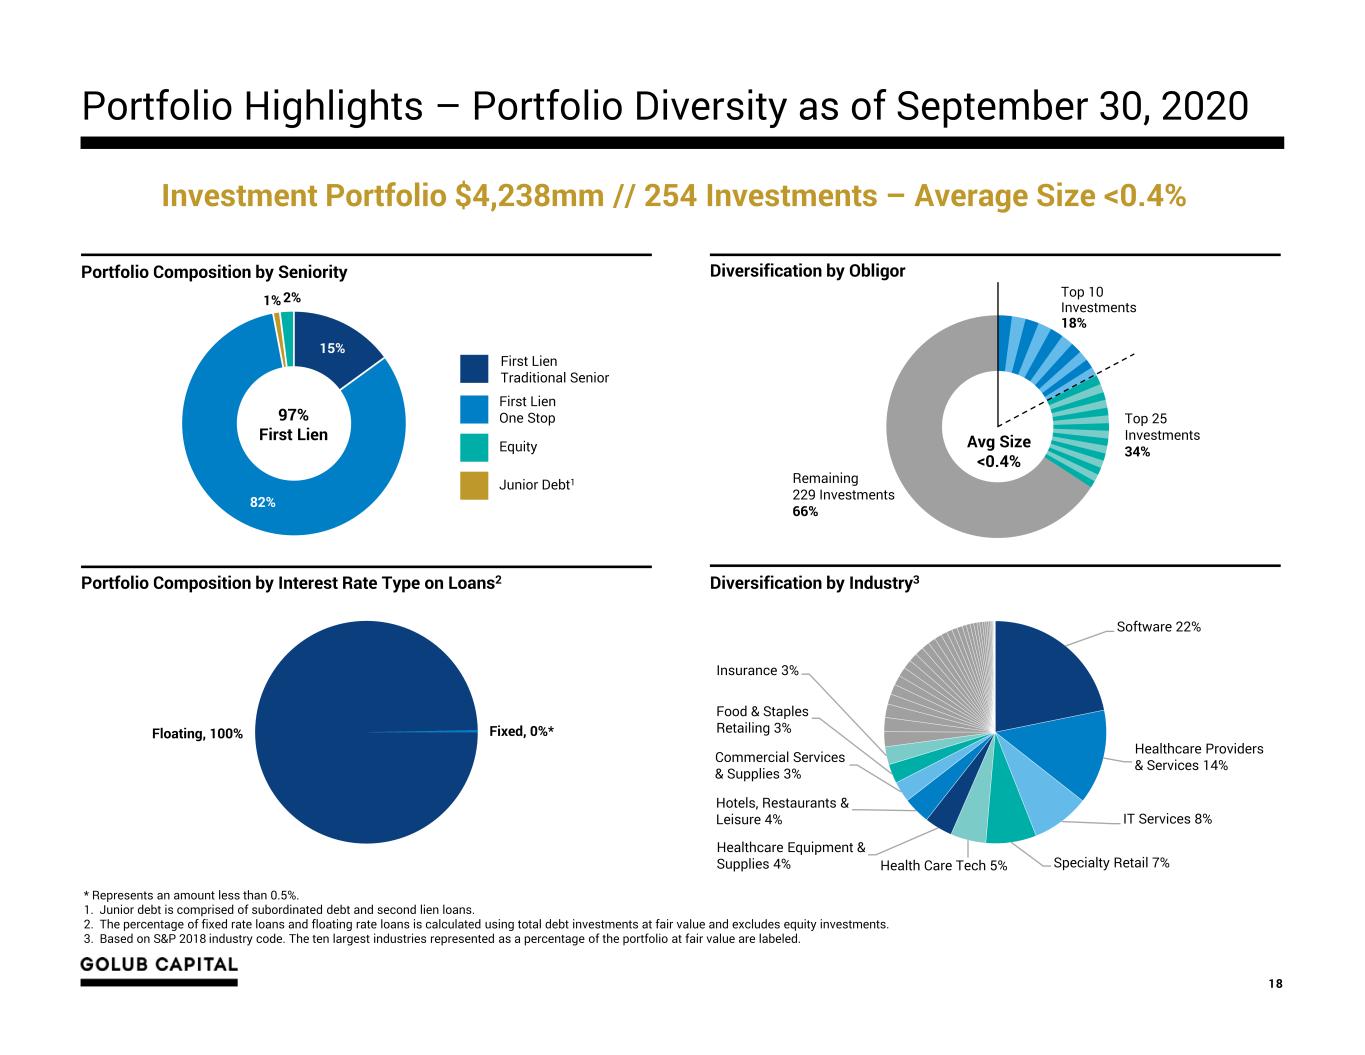
Portfolio Highlights – Portfolio Diversity as of September 30, 2020 18 * Represents an amount less than 0.5%. 1. Junior debt is comprised of subordinated debt and second lien loans. 2. The percentage of fixed rate loans and floating rate loans is calculated using total debt investments at fair value and excludes equity investments. 3. Based on S&P 2018 industry code. The ten largest industries represented as a percentage of the portfolio at fair value are labeled. Portfolio Composition by Seniority Diversification by Obligor 15% 82% 1% 2% Equity Junior Debt1 First Lien One Stop First Lien Traditional Senior 97% First Lien Top 25 Investments 34% Remaining 229 Investments 66% Top 10 Investments 18% Avg Size <0.4% Portfolio Composition by Interest Rate Type on Loans2 Floating, 100% Fixed, 0%* Diversification by Industry3 Investment Portfolio $4,238mm // 254 Investments – Average Size <0.4% Software 22% Healthcare Providers & Services 14% IT Services 8% Specialty Retail 7%Health Care Tech 5% Healthcare Equipment & Supplies 4% Hotels, Restaurants & Leisure 4% Commercial Services & Supplies 3% Food & Staples Retailing 3% Insurance 3%
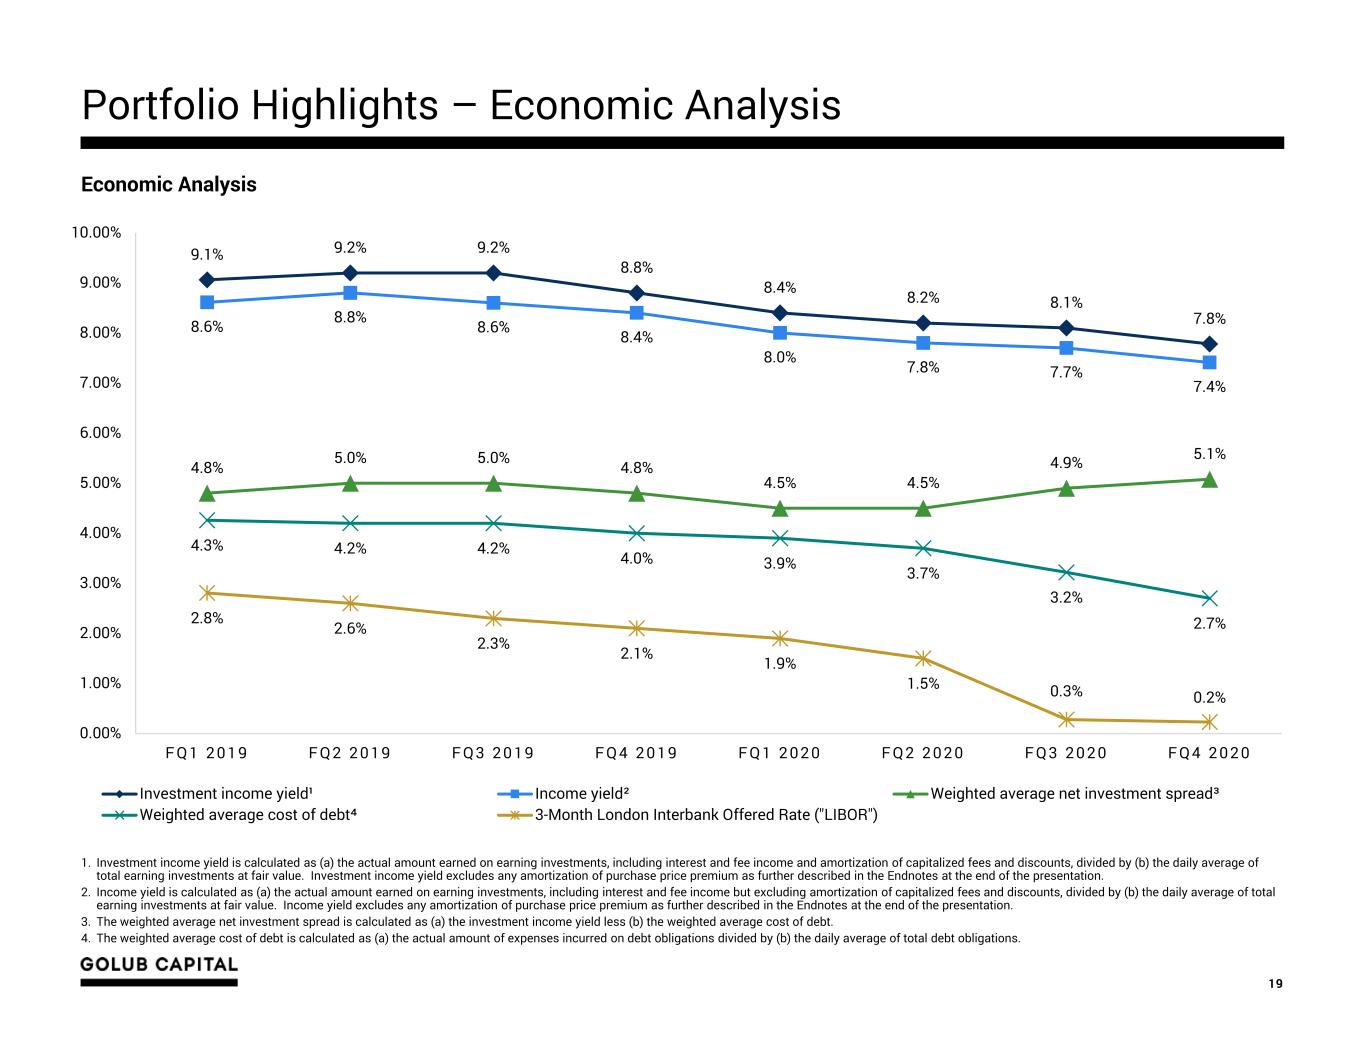
1. Investment income yield is calculated as (a) the actual amount earned on earning investments, including interest and fee income and amortization of capitalized fees and discounts, divided by (b) the daily average of total earning investments at fair value. Investment income yield excludes any amortization of purchase price premium as further described in the Endnotes at the end of the presentation. 2. Income yield is calculated as (a) the actual amount earned on earning investments, including interest and fee income but excluding amortization of capitalized fees and discounts, divided by (b) the daily average of total earning investments at fair value. Income yield excludes any amortization of purchase price premium as further described in the Endnotes at the end of the presentation. 3. The weighted average net investment spread is calculated as (a) the investment income yield less (b) the weighted average cost of debt. 4. The weighted average cost of debt is calculated as (a) the actual amount of expenses incurred on debt obligations divided by (b) the daily average of total debt obligations. 19 Economic Analysis Portfolio Highlights – Economic Analysis 9.1% 9.2% 9.2% 8.8% 8.4% 8.2% 8.1% 7.8%8.6% 8.8% 8.6% 8.4% 8.0% 7.8% 7.7% 7.4% 4.8% 5.0% 5.0% 4.8% 4.5% 4.5% 4.9% 5.1% 4.3% 4.2% 4.2% 4.0% 3.9% 3.7% 3.2% 2.7%2.8% 2.6% 2.3% 2.1% 1.9% 1.5% 0.3% 0.2% 0.00% 1.00% 2.00% 3.00% 4.00% 5.00% 6.00% 7.00% 8.00% 9.00% 10.00% F Q 1 2 0 1 9 F Q 2 2 0 1 9 F Q 3 2 0 1 9 F Q 4 2 0 1 9 F Q 1 2 0 2 0 F Q 2 2 0 2 0 F Q 3 2 0 2 0 F Q 4 2 0 2 0 Investment income yield¹ Income yield² Weighted average net investment spread³ Weighted average cost of debt⁴ 3-Month London Interbank Offered Rate ("LIBOR")
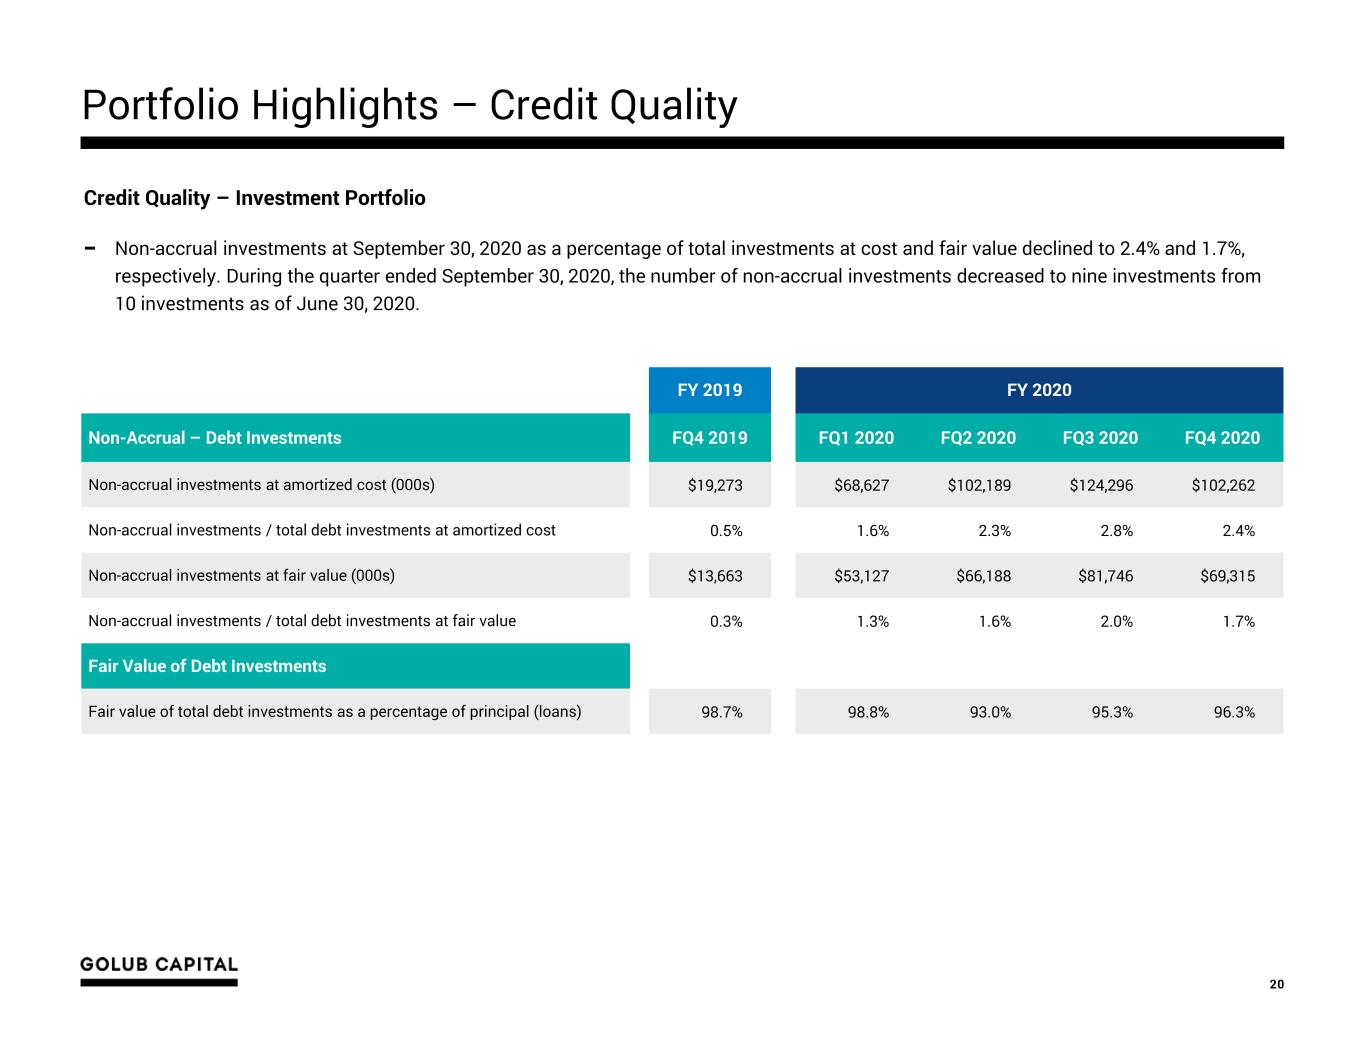
Portfolio Highlights – Credit Quality 20 Credit Quality – Investment Portfolio − Non-accrual investments at September 30, 2020 as a percentage of total investments at cost and fair value declined to 2.4% and 1.7%, respectively. During the quarter ended September 30, 2020, the number of non-accrual investments decreased to nine investments from 10 investments as of June 30, 2020. FY 2019 FY 2020 Non-Accrual – Debt Investments FQ4 2019 FQ1 2020 FQ2 2020 FQ3 2020 FQ4 2020 Non-accrual investments at amortized cost (000s) $19,273 $68,627 $102,189 $124,296 $102,262 Non-accrual investments / total debt investments at amortized cost 0.5% 1.6% 2.3% 2.8% 2.4% Non-accrual investments at fair value (000s) $13,663 $53,127 $66,188 $81,746 $69,315 Non-accrual investments / total debt investments at fair value 0.3% 1.3% 1.6% 2.0% 1.7% Fair Value of Debt Investments Q4 2019 Q1 2020 Q2 2020 Q3 2020 Q4 2020 Fair value of total debt investments as a percentage of principal (loans) 98.7% 98.8% 93.0% 95.3% 96.3%

Portfolio Highlights – Portfolio Ratings 21 Credit Quality – Investment Portfolio − Due to continued better than expected borrower performance, the percentage of risk rated “3” investments decreased to 19.7% of the portfolio at fair value as of September 30, 2020 from 22.3% as of June 30, 2020. * Represents an amount less than 0.1%. Internal Performance Ratings (% of Portfolio at Fair Value) Rating Definition 5 Borrower is performing above expectations and the trends and risk factors are generally favorable 4 Borrower is generally performing as expected and the risk factors are neutral to favorable 3 Borrower may be out of compliance with debt covenants; however, loan payments are generally not past due 2 Borrower is performing materially below expectations and the loan’s risk has increased materially since origination 1 Borrower is performing substantially below expectations and the loan’s risk has substantially increased since origination Internal Performance Rating Definitions At Fiscal Year End At Quarter End Rating 2014 2015 2016 2017 2018 2019 FQ1 2020 FQ2 2020 FQ3 2020 FQ4 2020 5 9.7% 8.8% 5.7% 5.5% 6.4% 2.7% 4.0% 2.5% 1.1% 6.1% 4 84.9% 84.9% 83.1% 81.8% 81.6% 88.2% 86.8% 69.0% 74.9% 72.8% 3 5.1% 5.7% 10.6% 12.6% 11.0% 7.9% 7.2% 26.5% 22.3% 19.7% 2 0.3% 0.6% 0.6% 0.0%* 1.0% 1.2% 2.0% 2.0% 1.7% 1.4% 1 0.0%* 0.0%* 0.0%* 0.1% 0.0%* 0.0%* 0.0%* 0.0%* 0.0%* 0.0%* Grand Total 100.0% 100.0% 100.0% 100.0% 100.0% 100.0% 100.0% 100.0% 100.0% 100.0%
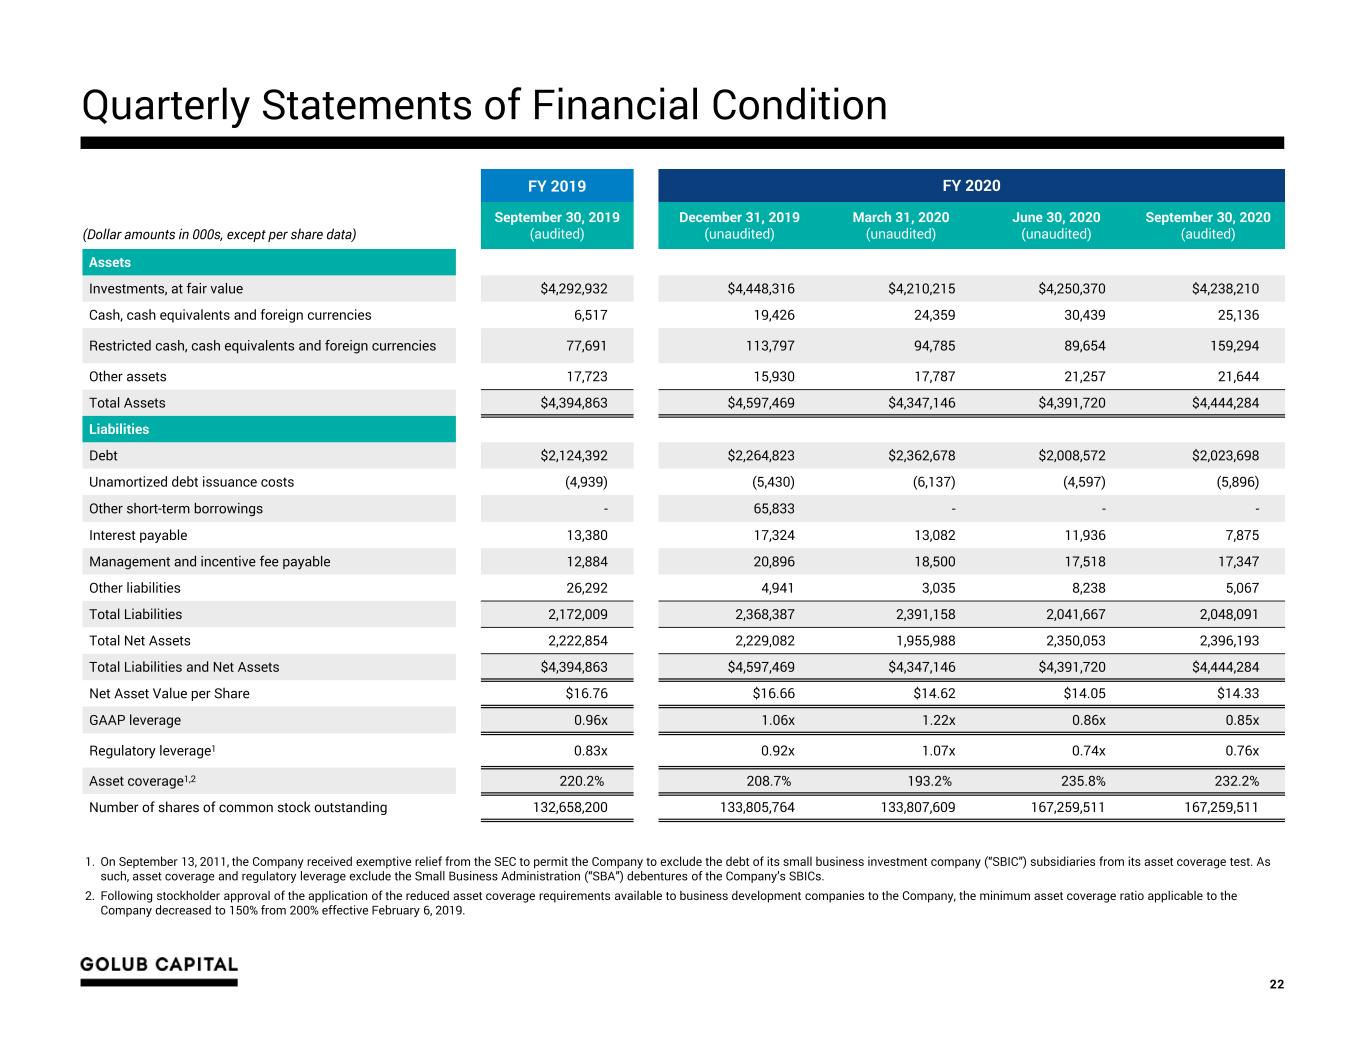
Quarterly Statements of Financial Condition 22 1. On September 13, 2011, the Company received exemptive relief from the SEC to permit the Company to exclude the debt of its small business investment company (“SBIC”) subsidiaries from its asset coverage test. As such, asset coverage and regulatory leverage exclude the Small Business Administration (“SBA”) debentures of the Company’s SBICs. 2. Following stockholder approval of the application of the reduced asset coverage requirements available to business development companies to the Company, the minimum asset coverage ratio applicable to the Company decreased to 150% from 200% effective February 6, 2019. FY 2019 FY 2020 (Dollar amounts in 000s, except per share data) September 30, 2019 (audited) December 31, 2019 (unaudited) March 31, 2020 (unaudited) June 30, 2020 (unaudited) September 30, 2020 (audited) Assets Investments, at fair value $4,292,932 $4,448,316 $4,210,215 $4,250,370 $4,238,210 Cash, cash equivalents and foreign currencies 6,517 19,426 24,359 30,439 25,136 Restricted cash, cash equivalents and foreign currencies 77,691 113,797 94,785 89,654 159,294 Other assets 17,723 15,930 17,787 21,257 21,644 Total Assets $4,394,863 $4,597,469 $4,347,146 $4,391,720 $4,444,284 Liabilities Debt $2,124,392 $2,264,823 $2,362,678 $2,008,572 $2,023,698 Unamortized debt issuance costs (4,939) (5,430) (6,137) (4,597) (5,896) Other short-term borrowings - 65,833 - - - Interest payable 13,380 17,324 13,082 11,936 7,875 Management and incentive fee payable 12,884 20,896 18,500 17,518 17,347 Other liabilities 26,292 4,941 3,035 8,238 5,067 Total Liabilities 2,172,009 2,368,387 2,391,158 2,041,667 2,048,091 Total Net Assets 2,222,854 2,229,082 1,955,988 2,350,053 2,396,193 Total Liabilities and Net Assets $4,394,863 $4,597,469 $4,347,146 $4,391,720 $4,444,284 Net Asset Value per Share $16.76 $16.66 $14.62 $14.05 $14.33 GAAP leverage 0.96x 1.06x 1.22x 0.86x 0.85x Regulatory leverage1 0.83x 0.92x 1.07x 0.74x 0.76x Asset coverage1,2 220.2% 208.7% 193.2% 235.8% 232.2% Number of shares of common stock outstanding 132,658,200 133,805,764 133,807,609 167,259,511 167,259,511
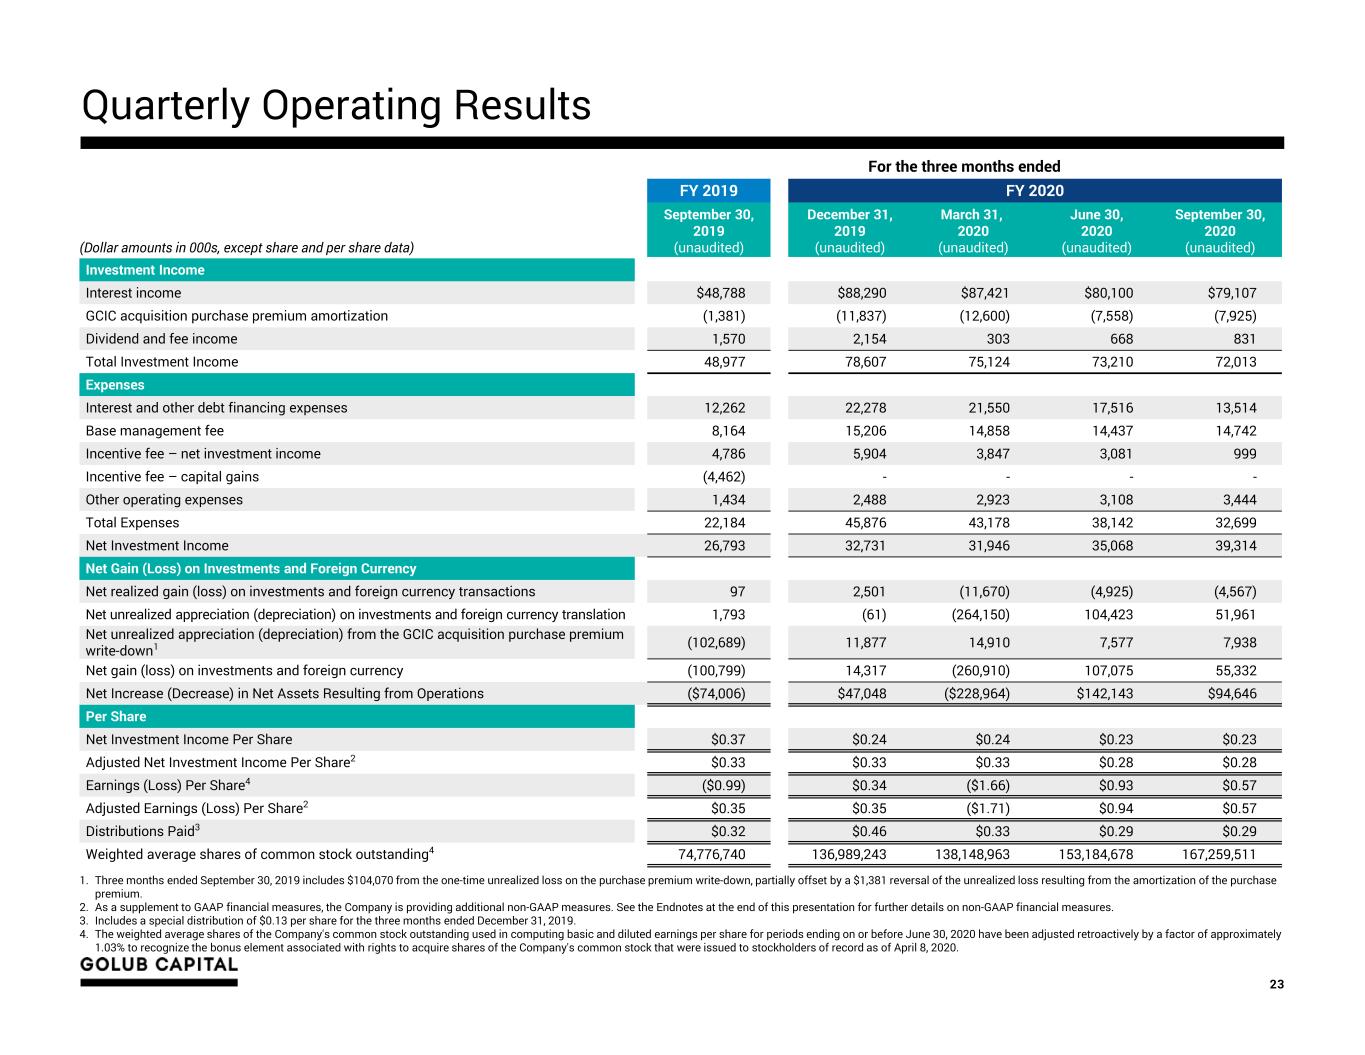
Quarterly Operating Results 23 For the three months ended FY 2019 FY 2020 (Dollar amounts in 000s, except share and per share data) September 30, 2019 (unaudited) December 31, 2019 (unaudited) March 31, 2020 (unaudited) June 30, 2020 (unaudited) September 30, 2020 (unaudited) Investment Income Interest income $48,788 $88,290 $87,421 $80,100 $79,107 GCIC acquisition purchase premium amortization (1,381) (11,837) (12,600) (7,558) (7,925) Dividend and fee income 1,570 2,154 303 668 831 Total Investment Income 48,977 78,607 75,124 73,210 72,013 Expenses Interest and other debt financing expenses 12,262 22,278 21,550 17,516 13,514 Base management fee 8,164 15,206 14,858 14,437 14,742 Incentive fee – net investment income 4,786 5,904 3,847 3,081 999 Incentive fee – capital gains (4,462) - - - - Other operating expenses 1,434 2,488 2,923 3,108 3,444 Total Expenses 22,184 45,876 43,178 38,142 32,699 Net Investment Income 26,793 32,731 31,946 35,068 39,314 Net Gain (Loss) on Investments and Foreign Currency Net realized gain (loss) on investments and foreign currency transactions 97 2,501 (11,670) (4,925) (4,567) Net unrealized appreciation (depreciation) on investments and foreign currency translation 1,793 (61) (264,150) 104,423 51,961 Net unrealized appreciation (depreciation) from the GCIC acquisition purchase premium write-down1 (102,689) 11,877 14,910 7,577 7,938 Net gain (loss) on investments and foreign currency (100,799) 14,317 (260,910) 107,075 55,332 Net Increase (Decrease) in Net Assets Resulting from Operations ($74,006) $47,048 ($228,964) $142,143 $94,646 Per Share Net Investment Income Per Share $0.37 $0.24 $0.24 $0.23 $0.23 Adjusted Net Investment Income Per Share2 $0.33 $0.33 $0.33 $0.28 $0.28 Earnings (Loss) Per Share4 ($0.99) $0.34 ($1.66) $0.93 $0.57 Adjusted Earnings (Loss) Per Share2 $0.35 $0.35 ($1.71) $0.94 $0.57 Distributions Paid3 $0.32 $0.46 $0.33 $0.29 $0.29 Weighted average shares of common stock outstanding4 74,776,740 136,989,243 138,148,963 153,184,678 167,259,511 1. Three months ended September 30, 2019 includes $104,070 from the one-time unrealized loss on the purchase premium write-down, partially offset by a $1,381 reversal of the unrealized loss resulting from the amortization of the purchase premium. 2. As a supplement to GAAP financial measures, the Company is providing additional non-GAAP measures. See the Endnotes at the end of this presentation for further details on non-GAAP financial measures. 3. Includes a special distribution of $0.13 per share for the three months ended December 31, 2019. 4. The weighted average shares of the Company's common stock outstanding used in computing basic and diluted earnings per share for periods ending on or before June 30, 2020 have been adjusted retroactively by a factor of approximately 1.03% to recognize the bonus element associated with rights to acquire shares of the Company's common stock that were issued to stockholders of record as of April 8, 2020.
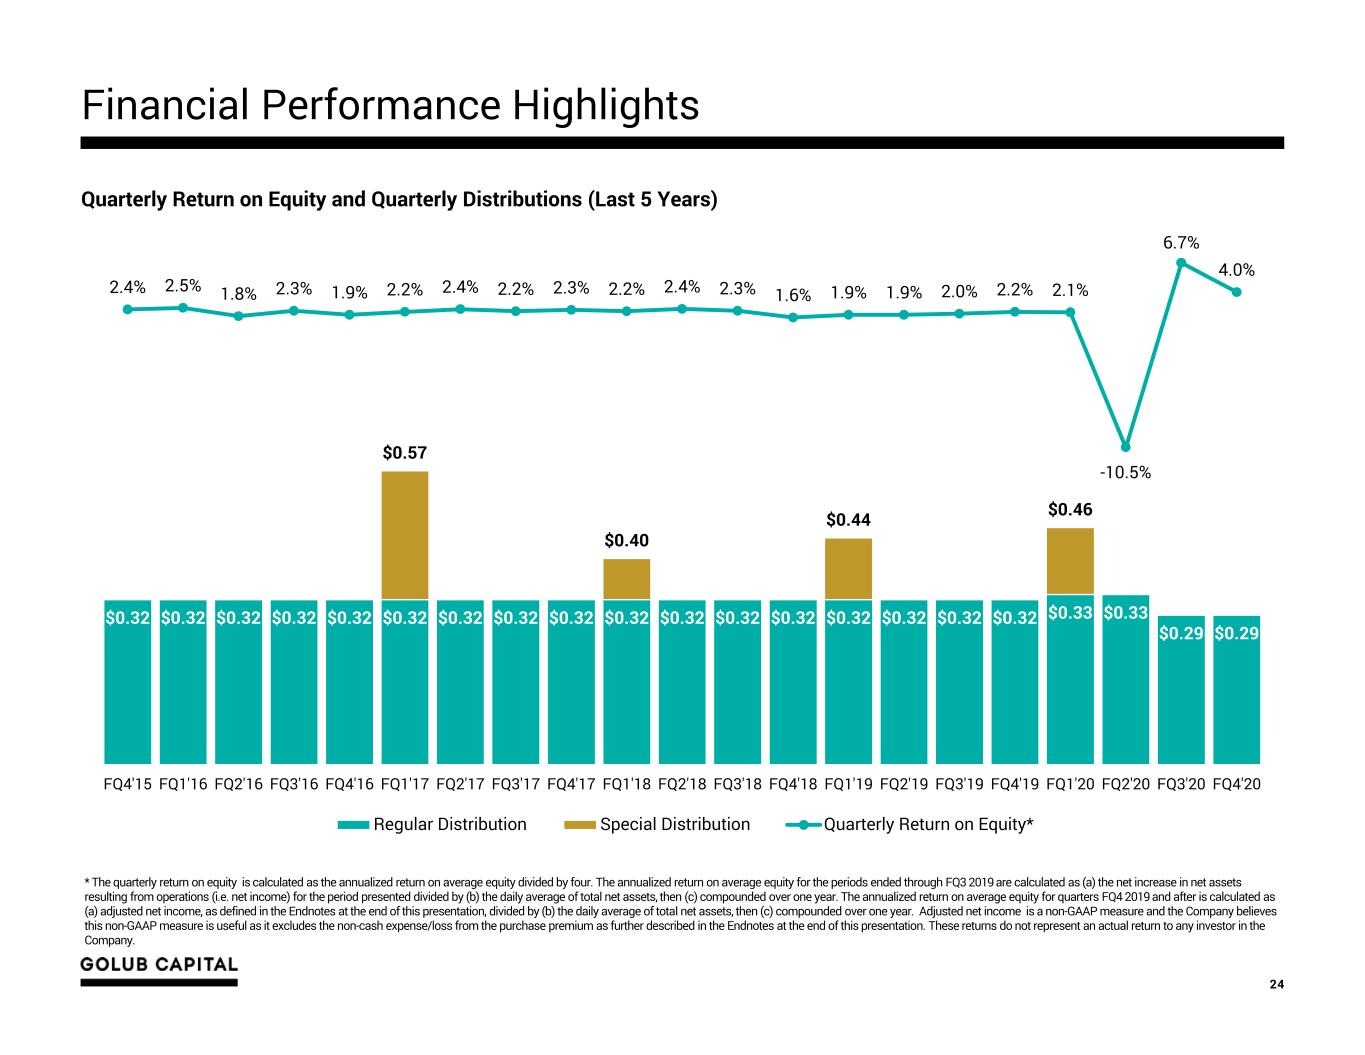
Financial Performance Highlights 24 * The quarterly return on equity is calculated as the annualized return on average equity divided by four. The annualized return on average equity for the periods ended through FQ3 2019 are calculated as (a) the net increase in net assets resulting from operations (i.e. net income) for the period presented divided by (b) the daily average of total net assets, then (c) compounded over one year. The annualized return on average equity for quarters FQ4 2019 and after is calculated as (a) adjusted net income, as defined in the Endnotes at the end of this presentation, divided by (b) the daily average of total net assets, then (c) compounded over one year. Adjusted net income is a non-GAAP measure and the Company believes this non-GAAP measure is useful as it excludes the non-cash expense/loss from the purchase premium as further described in the Endnotes at the end of this presentation. These returns do not represent an actual return to any investor in the Company. Quarterly Return on Equity and Quarterly Distributions (Last 5 Years) $0.32 $0.32 $0.32 $0.32 $0.32 $0.32 $0.32 $0.32 $0.32 $0.32 $0.32 $0.32 $0.32 $0.32 $0.32 $0.32 $0.32 $0.33 $0.33 $0.29 $0.29 $0.57 $0.40 $0.44 $0.46 2.4% 2.5% 1.8% 2.3% 1.9% 2.2% 2.4% 2.2% 2.3% 2.2% 2.4% 2.3% 1.6% 1.9% 1.9% 2.0% 2.2% 2.1% -10.5% 6.7% 4.0% FQ4'15 FQ1'16 FQ2'16 FQ3'16 FQ4'16 FQ1'17 FQ2'17 FQ3'17 FQ4'17 FQ1'18 FQ2'18 FQ3'18 FQ4'18 FQ1'19 FQ2'19 FQ3'19 FQ4'19 FQ1'20 FQ2'20 FQ3'20 FQ4'20 Regular Distribution Special Distribution Quarterly Return on Equity*

25 Long History of Strong Shareholder Returns Investors in GBDC’s 2010 IPO have achieved a 9.7% IRR on NAV1 1. Internal rate of return (“IRR”) on NAV is calculated using beginning of period NAV, distributions paid during the period, an incremental investment of $2.29 per share, or the GBDC Rights Offering subscription price of $9.17 per share divided by four (corresponding to the 1:4 issuance ratio in the GBDC Rights Offering, or the "GBDC Rights Offering Investment"), and ending period NAV, multiplied by 1.25x (corresponding to the 1:4 issuance ratio in the GBDC Rights Offering). Period beginning June 30, 2010 and ending September 30, 2020. GBDC made its initial public offering on April 15, 2010. 2. Calculated as (a) the sum of (i) NAV per share for the period presented plus (ii) cumulative regular and special distributions paid per share subsequent to the GBDC Rights Offering (b) divided by four to reflect additional shares purchased at the 1:4 issuance ratio in the GBDC Rights Offering. Note: Amounts presented represent per share amounts for a hypothetical shareholder that purchased one share in GBDC’s initial public offering (“IPO”) on April 15, 2010 and subscribed for its pro rata rights through GBDC’s rights offering, which closed on May 15, 2020 (“GBDC Rights Offering”). For illustrative purposes only; does not reflect the actual returns of a specific GBDC investor. Past performance does not guarantee future results. Sources: SEC filings and Golub Capital analysis. $14.63 $31.94 A pr -1 0 Ju n- 10 S ep -1 0 D ec -1 0 M ar -1 1 Ju n- 11 S ep -1 1 D ec -1 1 M ar -1 2 Ju n- 12 S ep -1 2 D ec -1 2 M ar -1 3 Ju n- 13 S ep -1 3 D ec -1 3 M ar -1 4 Ju n- 14 S ep -1 4 D ec -1 4 M ar -1 5 Ju n- 15 S ep -1 5 D ec -1 5 M ar -1 6 Ju n- 16 S ep -1 6 D ec -1 6 M ar -1 7 Ju n- 17 S ep -1 7 D ec -1 7 M ar -1 8 Ju n- 18 S ep -1 8 D ec -1 8 M ar -1 9 Ju n- 19 S ep -1 9 D ec -1 9 M ar -2 0 Ju n- 20 S ep -2 0 NAV Per Share Incremental Value Per Share from GBDC Rights Offering Investment² Cumulative Regular Distributions Per Share Cumulative Special Distributions Per Share $14.33 $13.30 $0.58 $3.732
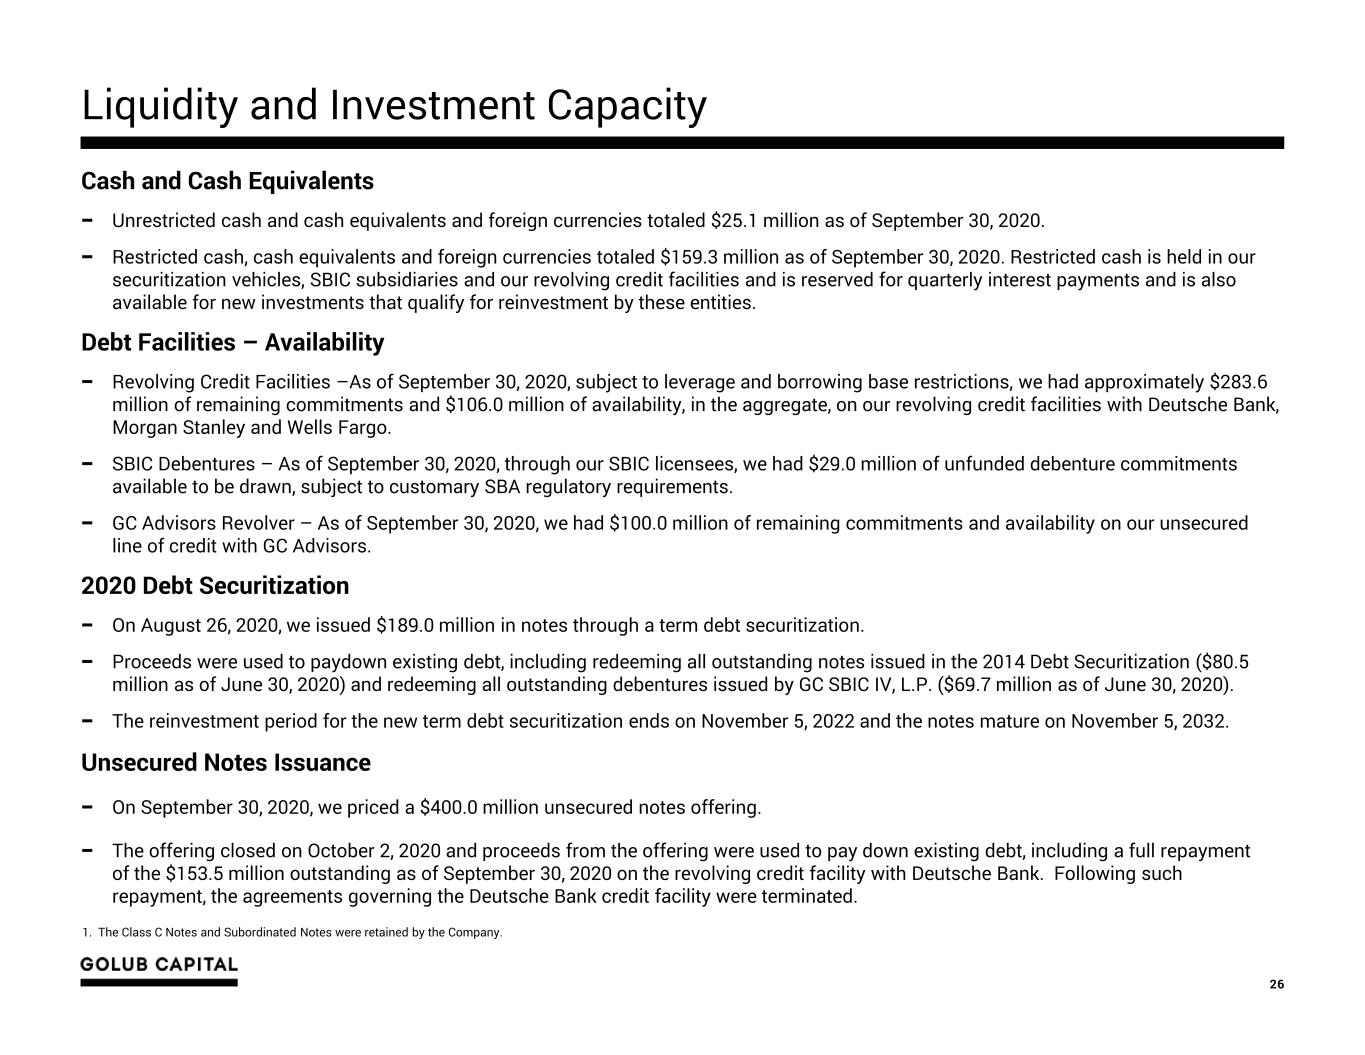
Liquidity and Investment Capacity 26 Cash and Cash Equivalents − Unrestricted cash and cash equivalents and foreign currencies totaled $25.1 million as of September 30, 2020. − Restricted cash, cash equivalents and foreign currencies totaled $159.3 million as of September 30, 2020. Restricted cash is held in our securitization vehicles, SBIC subsidiaries and our revolving credit facilities and is reserved for quarterly interest payments and is also available for new investments that qualify for reinvestment by these entities. Debt Facilities – Availability − Revolving Credit Facilities –As of September 30, 2020, subject to leverage and borrowing base restrictions, we had approximately $283.6 million of remaining commitments and $106.0 million of availability, in the aggregate, on our revolving credit facilities with Deutsche Bank, Morgan Stanley and Wells Fargo. − SBIC Debentures – As of September 30, 2020, through our SBIC licensees, we had $29.0 million of unfunded debenture commitments available to be drawn, subject to customary SBA regulatory requirements. − GC Advisors Revolver – As of September 30, 2020, we had $100.0 million of remaining commitments and availability on our unsecured line of credit with GC Advisors. 2020 Debt Securitization − On August 26, 2020, we issued $189.0 million in notes through a term debt securitization. − Proceeds were used to paydown existing debt, including redeeming all outstanding notes issued in the 2014 Debt Securitization ($80.5 million as of June 30, 2020) and redeeming all outstanding debentures issued by GC SBIC IV, L.P. ($69.7 million as of June 30, 2020). − The reinvestment period for the new term debt securitization ends on November 5, 2022 and the notes mature on November 5, 2032. Unsecured Notes Issuance − On September 30, 2020, we priced a $400.0 million unsecured notes offering. − The offering closed on October 2, 2020 and proceeds from the offering were used to pay down existing debt, including a full repayment of the $153.5 million outstanding as of September 30, 2020 on the revolving credit facility with Deutsche Bank. Following such repayment, the agreements governing the Deutsche Bank credit facility were terminated. 1. The Class C Notes and Subordinated Notes were retained by the Company.
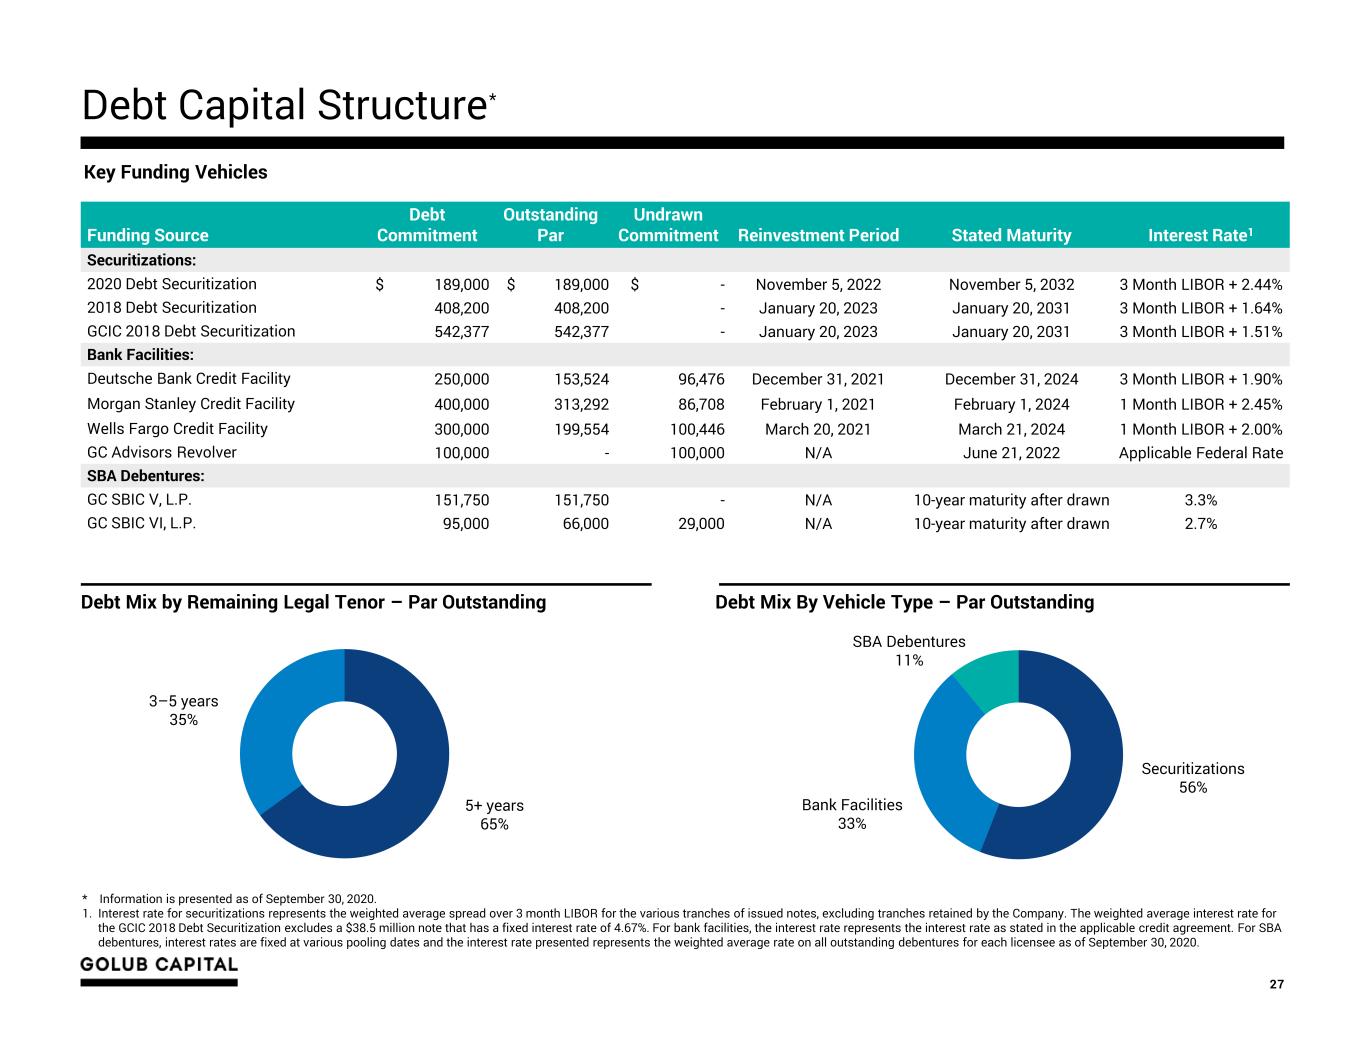
Debt Capital Structure 27 Funding Source Debt Commitment Outstanding Par Undrawn Commitment Reinvestment Period Stated Maturity Interest Rate1 Securitizations: 2020 Debt Securitization $ 189,000 $ 189,000 $ - November 5, 2022 November 5, 2032 3 Month LIBOR + 2.44% 2018 Debt Securitization 408,200 408,200 - January 20, 2023 January 20, 2031 3 Month LIBOR + 1.64% GCIC 2018 Debt Securitization 542,377 542,377 - January 20, 2023 January 20, 2031 3 Month LIBOR + 1.51% Bank Facilities: Deutsche Bank Credit Facility 250,000 153,524 96,476 December 31, 2021 December 31, 2024 3 Month LIBOR + 1.90% Morgan Stanley Credit Facility 400,000 313,292 86,708 February 1, 2021 February 1, 2024 1 Month LIBOR + 2.45% Wells Fargo Credit Facility 300,000 199,554 100,446 March 20, 2021 March 21, 2024 1 Month LIBOR + 2.00% GC Advisors Revolver 100,000 - 100,000 N/A June 21, 2022 Applicable Federal Rate SBA Debentures: GC SBIC V, L.P. 151,750 151,750 - N/A 10-year maturity after drawn 3.3% GC SBIC VI, L.P. 95,000 66,000 29,000 N/A 10-year maturity after drawn 2.7% Key Funding Vehicles 3–5 years 35% 5+ years 65% Debt Mix By Vehicle Type – Par Outstanding * Information is presented as of September 30, 2020. 1. Interest rate for securitizations represents the weighted average spread over 3 month LIBOR for the various tranches of issued notes, excluding tranches retained by the Company. The weighted average interest rate for the GCIC 2018 Debt Securitization excludes a $38.5 million note that has a fixed interest rate of 4.67%. For bank facilities, the interest rate represents the interest rate as stated in the applicable credit agreement. For SBA debentures, interest rates are fixed at various pooling dates and the interest rate presented represents the weighted average rate on all outstanding debentures for each licensee as of September 30, 2020. * Debt Mix by Remaining Legal Tenor – Par Outstanding Bank Facilities 33% SBA Debentures 11% Securitizations 56%
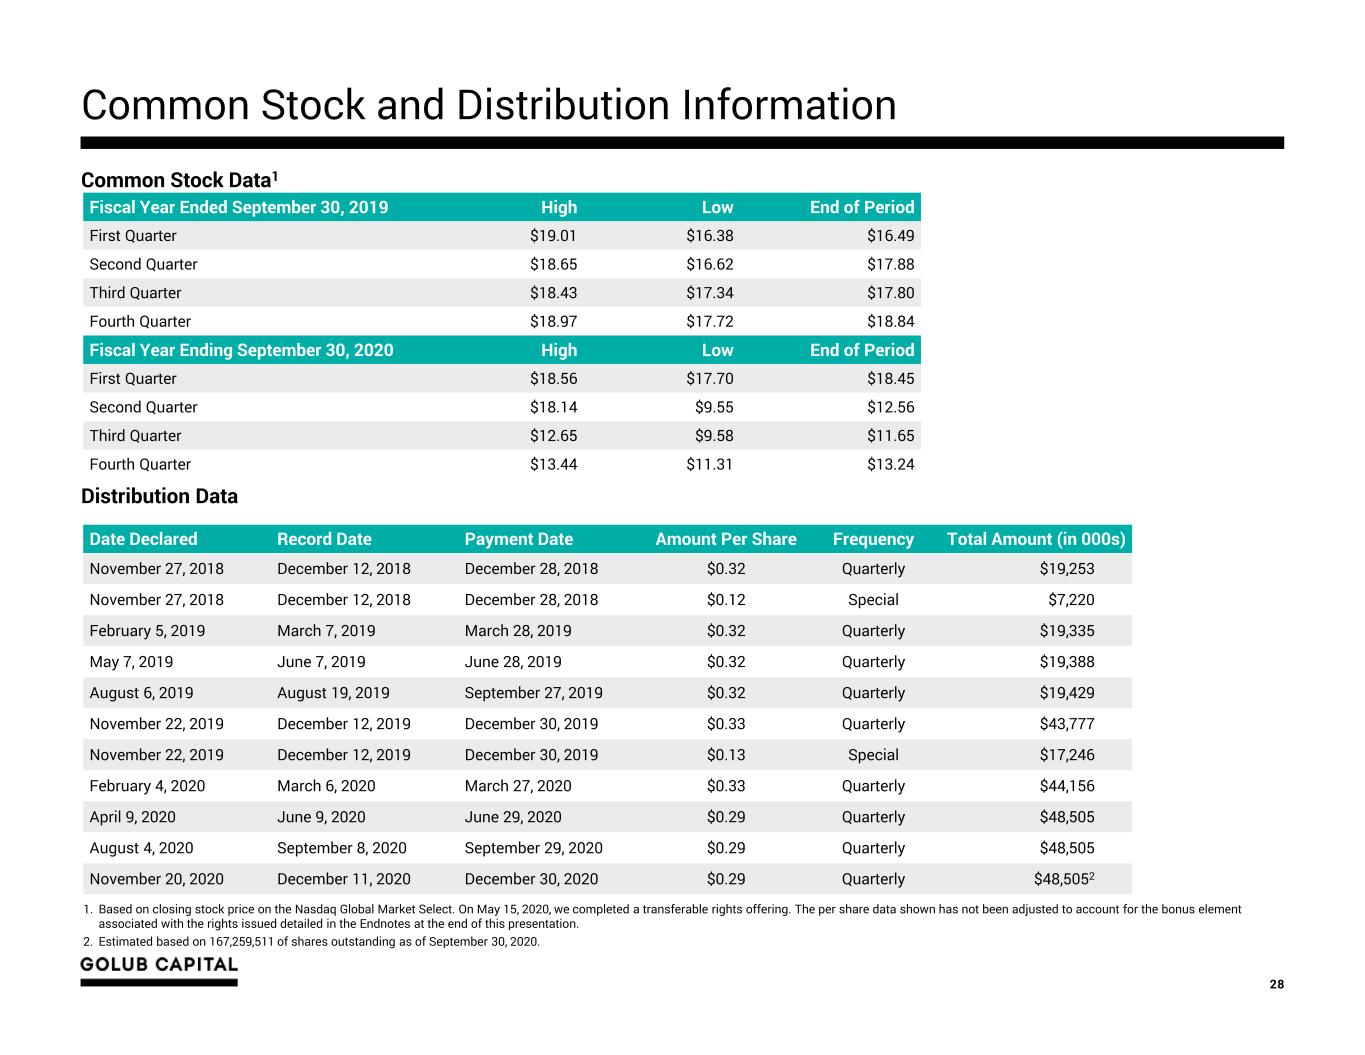
Common Stock and Distribution Information 28 Common Stock Data1 Distribution Data Date Declared Record Date Payment Date Amount Per Share Frequency Total Amount (in 000s) November 27, 2018 December 12, 2018 December 28, 2018 $0.32 Quarterly $19,253 November 27, 2018 December 12, 2018 December 28, 2018 $0.12 Special $7,220 February 5, 2019 March 7, 2019 March 28, 2019 $0.32 Quarterly $19,335 May 7, 2019 June 7, 2019 June 28, 2019 $0.32 Quarterly $19,388 August 6, 2019 August 19, 2019 September 27, 2019 $0.32 Quarterly $19,429 November 22, 2019 December 12, 2019 December 30, 2019 $0.33 Quarterly $43,777 November 22, 2019 December 12, 2019 December 30, 2019 $0.13 Special $17,246 February 4, 2020 March 6, 2020 March 27, 2020 $0.33 Quarterly $44,156 April 9, 2020 June 9, 2020 June 29, 2020 $0.29 Quarterly $48,505 August 4, 2020 September 8, 2020 September 29, 2020 $0.29 Quarterly $48,505 November 20, 2020 December 11, 2020 December 30, 2020 $0.29 Quarterly $48,5052 Fiscal Year Ended September 30, 2019 High Low End of Period First Quarter $19.01 $16.38 $16.49 Second Quarter $18.65 $16.62 $17.88 Third Quarter $18.43 $17.34 $17.80 Fourth Quarter $18.97 $17.72 $18.84 Fiscal Year Ending September 30, 2020 High Low End of Period First Quarter $18.56 $17.70 $18.45 Second Quarter $18.14 $9.55 $12.56 Third Quarter $12.65 $9.58 $11.65 Fourth Quarter $13.44 $11.31 $13.24 1. Based on closing stock price on the Nasdaq Global Market Select. On May 15, 2020, we completed a transferable rights offering. The per share data shown has not been adjusted to account for the bonus element associated with the rights issued detailed in the Endnotes at the end of this presentation. 2. Estimated based on 167,259,511 of shares outstanding as of September 30, 2020.
Appendix: Endnotes and Illustration of the Purchase Accounting for the GCIC Acquisition A

1. On September 16, 2019, the Company completed its acquisition of GCIC. The merger was accounted for under the asset acquisition method of accounting in accordance with Accounting Standards Codification (“ASC”) 805-50, Business Combinations — Related Issues. Under asset acquisition accounting, where the consideration paid to GCIC’s stockholders exceeded the relative fair values of the assets acquired, the premium paid by GBDC was allocated to the cost of the GCIC assets acquired by GBDC pro-rata based on their relative fair value. Immediately following the acquisition of GCIC, GBDC recorded its assets at their respective fair values and, as a result, the purchase premium allocated to the cost basis of the GCIC assets acquired was immediately recognized as unrealized depreciation on the Company's Consolidated Statement of Operations. The purchase premium allocated to investments in loan securities will amortize over the life of the loans through interest income with a corresponding reversal of the unrealized depreciation on the GCIC loans acquired through their ultimate disposition. The purchase premium allocated to investments in equity securities will not amortize over the life of the equity securities through interest income and, assuming no subsequent change to the fair value of the GCIC equity securities acquired and disposition of such equity securities at fair value, the Company will recognize a realized loss with a corresponding reversal of the unrealized depreciation upon disposition of the GCIC equity securities acquired. On May 15, 2020, the Company completed a transferable rights offering, issuing 33,451,902 shares at a subscription price of $9.17 per share. In accordance with ASC 260 – Earnings Per Share, it was determined the Company’s rights offering contained a bonus element as the exercise price at issuance was less than the fair market value of the stock. In accordance with ASC 260, basic and diluted EPS are required to be adjusted retroactively for the bonus element for all periods ending on or before June 30, 2020 by applying an adjustment factor to weighted average shares outstanding. The adjustment factor that was calculated in accordance with ASC 260 was 1.03%. As a supplement to U.S. generally accepted accounting principles (“GAAP”) financial measures, the Company has provided the following non-GAAP financial measures: “Adjusted Net Investment Income” and “Adjusted Net Investment Income Per Share” - excludes the amortization of the purchase premium and the accrual for the capital gain incentive fee required under GAAP (including the portion of such accrual that is not payable under GBDC’s investment advisory agreement) from net investment income calculated in accordance with GAAP. “Adjusted Net Realized and Unrealized Gain/(Loss)” and “Adjusted Net Realized and Unrealized Gain/(Loss) Per Share” - excludes the unrealized loss resulting from the purchase premium write-down and the corresponding reversal of the unrealized loss resulting from the amortization of the premium on loans or from the sale of equity investments from the determination of realized and unrealized gain/(loss) in accordance with GAAP. “Adjusted Net Income” and “Adjusted Earnings/(Loss) Per Share” – calculates net income and earnings per share based on Adjusted Net Investment Income and Adjusted Net Realized and Unrealized Gain/(Loss). “Adjusted Earnings/(Loss) Per Share” also excludes the impact of the retroactive adjustment to the weighted average shares calculation due to the rights offering and the resulting impact on earnings per share. The Company believes that excluding the financial impact of the purchase premium in the above non-GAAP financial measures is useful for investors as this is a non-cash expense/loss and is one method the Company uses to measure its financial condition and results of operations. In addition, the Company believes excluding the accrual of the capital gain incentive fee in the above non-GAAP financial measures is useful as a portion of such accrual is not contractually payable under the terms of either the Company’s current investment advisory agreement with GC Advisors, which was effective September 16, 2019, or its prior investment advisory agreement with GC Advisors, (each an, “Investment Advisory Agreement”). In accordance with GAAP, the Company is required to include aggregate unrealized appreciation on investments in the calculation and accrue a capital gain incentive fee on a quarterly basis as if such unrealized capital appreciation were realized, even though such unrealized capital appreciation is not permitted to be considered in calculating the fee actually payable under either Investment Advisory Agreement. As of each of June 30, 2020, March 31, 2020, and September 30, 2019, the cumulative capital gain incentive fee accrued by the Company in accordance with GAAP is $0, and none was payable as a capital gain incentive fee pursuant to the current Investment Advisory Agreement as of December 31, 2019. Any payment due under the terms of the current Investment Advisory Agreement is based on the calculation at the end of each calendar year or upon termination of the Investment Advisory Agreement. The Company paid capital gain incentive fees in the amounts of $1.2 million and $1.6 million calculated in accordance with its prior Investment Advisory Agreement as of December 31, 2017 and 2018 , respectively. The Company did not pay any capital gain incentive fee under the Investment Advisory Agreement for any period ended prior to December 31, 2017. Finally, the Company believes excluding the impact of the retroactive adjustment to the weighted average shares calculation due the rights offering and the resulting impact on per share data is useful for investors as it presents per share financial data that is consistent with what was previously reported. Although these non-GAAP financial measures are intended to enhance investors’ understanding of the Company’s business and performance, these non-GAAP financial measures should not be considered an alternative to GAAP. Refer to slide ‘Summary of Quarterly Results’ for a reconciliation to the nearest GAAP measures. 2. Purchase premium refers to the premium paid by GBDC to acquire GCIC in excess of the fair value of the assets acquired. Endnotes – Non-GAAP Financial Measures 30

Accounting Treatment of the Purchase Premium 31 Acquisition of GCIC Assets at a Premium Determine GBDC’s Cost Basis in Acquired Assets Recognize One- Time Write-Down of Purchase Premium Purchase Premium Fair Value of Former GCIC Assets GBDC Cost Basis = Purchase Premium + Fair Value of Former GCIC Assets Write Down to Fair Value One-Time Unrealized Loss on Purchase Premium Fair Value of Former GCIC Assets

Illustrative Income Statement Impact and Supplemental Non- GAAP Financial Measures 32 As a supplement to U.S. generally accepted accounting principles (“GAAP”) financial measures, the Company is providing the following non- GAAP financial measures: Note: The Company believes that excluding the financial impact of the purchase premium write down in the above non-GAAP financial measures is useful for investors as it is a non-cash expense/loss resulting from the merger with GCIC and is one method the Company uses to measure its financial condition and results of operations. In addition, the Company believes excluding the accrual of the capital gain incentive fee in the above non-GAAP financial measures is useful as it includes the portion of such accrual that is not contractually payable under the terms of the Company’s investment advisory agreement with GC Advisors. Refer to slide ‘Summary of Quarterly Results’ for a reconciliation to the nearest GAAP measure. See Endnotes at the end of this presentation. Net Investment Income Adjusted Net Investment Income Will exclude the amortization of the purchase premium and the accrual for the capital gain incentive fee required under GAAP (including the portion of such accrual that is not payable under GBDC’s investment advisory agreement) from net investment income calculated in accordance with GAAP. Adjusted Net Realized and Unrealized Gain/(Loss) Will exclude the unrealized loss resulting from the purchase premium write-down and the corresponding reversal of the unrealized loss from the amortization of the premium from the determination of realized and unrealized gain/(loss) in accordance with GAAP. Adjusted Net Income Will calculate net income and earnings per share based on Adjusted Net Investment Income and Adjusted Net Realized and Unrealized Gain/(Loss). Purchase Premium Amortization Net Realized/ Unrealized Gain (Loss) Reversal of Purchase Premium Write Down A B GAAP Net Income A B Expected to be equal and offsetting amounts After the one-time unrealized loss on the purchase premium write-down, Adjusted Net Income is expected to equal GAAP Net Income as purchase premium amortization is anticipated to offset a corresponding reversal of the unrealized loss on the GCIC loans acquired Adjusted Net Investment Income Adjusted Net Realized/Unrealized Gain (Loss) Adjusted Net Income


