Exhibit 99.1
TECHNICAL SUMMARY REPORT
AMERICAN WEST POTASH, LLC
2011 POTASH RESOURCE ASSESSMENT FOR THE HOLBROOK
BASIN PROJECT HOLBROOK, ARIZONA, USA
Prepared For:
American West Potash, LLC
600 17th Street, Suite #2800 South
Denver, Colorado 80202
Prepared By:
Tabetha A. Stirrett, Professional Geologist
North Rim Exploration, Ltd.
Avord Tower, 1020 — 606 Spadina Crescent East
Saskatoon, Saskatchewan S7K 3H1
Reviewed By:
Earl J. Gebhardt, Professional Engineer
North Rim Exploration, Ltd.
October 17, 2011
FINAL
Report Number: 10-912
Avord Tower, 1020-606 Spadina Crescent East·Saskatoon, Saskatchewan·S7K 3H1·(306) 244-4878
| | |
| | | |
 | | American West Potash, LLC Holbrook Basin Project
2011 Potash Resource Assessment
October 17, 2011 |
| | | | | |
| | | | | |
CONTENTS | | | | |
| | | | | |
| CONTENTS | | | 1 | |
| | | | | |
| LIST OF FIGURES | | | 3 | |
| | | | | |
| LIST OF TABLES | | | 4 | |
| | | | | |
| LIST OF APPENDICES | | | 4 | |
| | | | | |
| 1.0SUMMARY | | | 5 | |
| | | | | |
| 2.0INTRODUCTION AND TERMS OF REFERENCE | | | 10 | |
| | | | | |
| 2.1 INTRODUCTION | | | 10 | |
| | | | | |
| 2.2 AVAILABLE DATA | | | 11 | |
| | | | | |
| 2.3 TERMS OF REFERENCE | | | 12 | |
| | | | | |
| 2.4 SITE VISIT | | | 13 | |
| | | | | |
| 3.0RELIANCE ON OTHER EXPERTS | | | 14 | |
| | | | | |
| 3.1 Other Technical Contributors | | | 14 | |
| | | | | |
| 4.0PROPERTY DESCRIPTION AND LOCATION | | | 15 | |
| | | | | |
| 4.1 PROPERTY DESCRIPTION AND LOCATION | | | 15 | |
| | | | | |
| 4.2 PROPERTY TITLES IN ARIZONA | | | 17 | |
| | | | | |
| 4.3 MINERAL TENURE IN ARIZONA | | | 17 | |
| | | | | |
| 5.0ACCESSIBILITY, CLIMATE, LOCAL RESOURCES, INFRASTRUCTURE, AND PHYSIOGRAPHY | | | 18 | |
| | | | | |
| 5.1 ACCESSIBILITY | | | 18 | |
| | | | | |
| 5.2 CLIMATE | | | 18 | |
| | | | | |
| 5.3 LOCAL RESOURCES | | | 19 | |
| | | | | |
| 5.4 INFRASTRUCTURE | | | 19 | |
| | | | | |
| 5.5 PHYSIOGRAPHY | | | 20 | |
| | | | | |
| 6.0HISTORY | | | 23 | |
| | | | | |
| 6.1 HISTORY OF POTASH EXPLORATION IN THE HOLBROOK BASIN | | | 23 | |
| | | | | |
| 6.2 RESOURCE EXPLOITATION HISTORY IN THE HOLBROOK BASIN | | | 25 | |
| | | | | |
| 7.0GEOLOGICAL SETTING AND MINERALIZATION | | | 25 | |
| | | | | |
| 7.1 GEOLOGICAL SETTING | | | 25 | |
| | | | | |
| 7.2 LOCAL GEOLOGY AND MINERALIZATION | | | 32 | |
| | | | | |
| 7.3 STRUCTURAL GEOLOGY AND GEOLOGICAL CROSS SECTIONS | | | 42 | |
| | | | | |
| 7.4 DISTURBANCES AFFECTING GEOLOGY OF THE POTASH-BEARING MEMBERS | | | 42 | |
| | |
| | | |
| | American West Potash, LLC Holbrook Basin Project
2011 Potash Resource Assessment
October 17, 2011 |
| | | | | |
| 7.5 CARLSBAD POTASH MINE, NEW MEXICO: AN ANALOG | | | 45 | |
| | | | | |
| 8.0DEPOSIT TYPE | | | 46 | |
| | | | | |
| 9.0EXPLORATION | | | 50 | |
| | | | | |
| 9.1 SEISMIC PROGRAM | | | 50 | |
| | | | | |
| 10.0DRILLING | | | 54 | |
| | | | | |
| 10.1 2011 DRILLING PROGRAM | | | 54 | |
| | | | | |
| 10.2 DRILLING PROCEDURES | | | 55 | |
| | | | | |
| 10.3 CORE RETRIEVAL | | | 56 | |
| | | | | |
| 10.4 GEOPHYSICAL WIRELINE PROGRAM | | | 58 | |
| | | | | |
| 11.0SAMPLE PREPARATION, ANALYSIS AND SECURITY | | | 59 | |
| | | | | |
| 11.1 GEOCHEMICAL SAMPLING | | | 59 | |
| | | | | |
| 11.2 CONTROLS ON SAMPLE INTERVAL DETERMINATION | | | 60 | |
| | | | | |
| 11.3 SAMPLING METHOD AND APPROACH | | | 61 | |
| | | | | |
| 11.4 SAMPLE SECURITY | | | 65 | |
| | | | | |
| 11.5 QUALITY CONTROL PROCEDURES | | | 66 | |
| | | | | |
| 12.0DATA VERIFICATION | | | 68 | |
| | | | | |
| 12.1 HISTORICAL DATA | | | 68 | |
| | | | | |
| 12.2 RECENT DATA | | | 69 | |
| | | | | |
| 12.3 ASSAY-TO-GAMMA CORRELATION STUDY | | | 70 | |
| | | | | |
| 12.4 COMPARISON OF GREC METHOD TO ACTUAL HISTORICAL ASSAY DATA | | | 72 | |
| | | | | |
| 12.5 COMPARISON OF GREC METHOD TO 2011 DRILL HOLE ASSAY DATA | | | 75 | |
| | | | | |
| 12.6 REVIEW OF STANDARDS AND REPEAT ANALYSIS | | | 75 | |
| | | | | |
| 13.0MINERAL PROCESSING AND METALLURGICAL TESTING | | | 77 | |
| | | | | |
| 14.0MINERAL RESOURCE ESTIMATES | | | 77 | |
| | | | | |
| 14.1 Mineral and Private Lands | | | 77 | |
| | | | | |
| 14.2 Assumptions and Methodology | | | 77 | |
| | | | | |
| 14.3 Mineral Resource | | | 78 | |
| | | | | |
| 14.3.1 Inferred Mineral Resource | | | 78 | |
| | | | | |
| 14.3.2 Indicated Mineral Resource | | | 79 | |
| | | | | |
| 14.3.3 Measured Mineral Resource | | | 79 | |
| | | | | |
| 14.4 Potential Conventional Mining Intervals | | | 80 | |
| | | | | |
| 14.4.1 KR-1 Inferred Resource Discussion | | | 82 | |
| | |
| | | |
| | American West Potash, LLC Holbrook Basin Project
2011 Potash Resource Assessment
October 17, 2011 |
| | | | | |
| 14.4.2 KR-2 Indicated and Inferred Resource Discussion | | | 82 | |
| | | | | |
| 15.0MINERAL RESERVE ESTIMATES | | | 84 | |
| | | | | |
| 16.0MINING METHODS | | | 84 | |
| | | | | |
| 17.0RECOVERY METHODS | | | 84 | |
| | | | | |
| 18.0PROJECT INFRASTRUCTURE | | | 84 | |
| | | | | |
| 19.0MARKET STUDIES AND CONTRACTS | | | 84 | |
| | | | | |
| 20.0ENVIRONMENTAL STUDIES, PERMITTING AND SOCIAL OR COMMUNITY IMPACT | | | 84 | |
| | | | | |
| 21.0CAPITAL AND OPERATING COSTS | | | 84 | |
| | | | | |
| 22.0ECONOMIC ANALYSIS | | | 84 | |
| | | | | |
| 23.0ADJACENT PROPERTIES | | | 85 | |
| | | | | |
| 24.0OTHER RELEVANT DATA AND INFORMATION | | | 87 | |
| | | | | |
| 25.0INTERPRETATION AND CONCLUSIONS | | | 87 | |
| | | | | |
| 26.0RECOMMENDATIONS | | | 88 | |
| | | | | |
| 27.0References | | | 89 | |
| | | | | |
| 28.0Certification of Qualified Person | | | 90 | |
LIST OF FIGURES
| | | | | |
| Figure 4-1: General Location Map of Project Area | | | 16 | |
| | | | | |
| Figure 5-1: Project Area with surrounding infrastructure and rail lines | | | 22 | |
| | | | | |
| Figure 5-2: Solution Collapse Basin with respect to potash basin (modified from Warren, 2006) | | | 23 | |
| | | | | |
| Figure 7-1: Geological map of north east Arizona and Project Area | | | 26 | |
| | | | | |
| Figure 7-2: Isopach map of the Upper Potash Bed interval | | | 29 | |
| | | | | |
| Figure 7-3: Isopach map of the combined Medial and Lower Potash Bed intervals | | | 30 | |
| | | | | |
| Figure 7-4: Isopach map of the total gross potash interval (Upper to Lower Potash Beds) | | | 31 | |
| | | | | |
| Figure 7-5: Simplified stratigraphic column of the Holbrook Basin | | | 36 | |
| | | | | |
| Figure 7-6: Simplified cross section through the Holbrook Basin | | | 37 | |
| | | | | |
| Figure 7-7: Type section of KG-06 correlating geophysical log signatures with core photography in “Cycle 5” beds | | | 38 | |
| | | | | |
| Figure 7-8: Type section of drill hole KG-04 including the potash and resource intervals | | | 41 | |
| | | | | |
| Figure 7-9: Anomalies affecting Potash- bearing horizons | | | 44 | |
| | | | | |
| Figure 9-1: Location of the 2011 Seismic Lines | | | 51 | |
| | | | | |
| Figure 9-2: Supai to Marker 1 Isochron Map | | | 53 | |
| | | | | |
| Figure 10-1: Sunbelt Drilling Rig (left) and Stewart Brothers Drilling’s Rig (right) | | | 55 | |
| | | | | |
| Figure 10-2: Stewart Brothers Drilling performing core recovery with North Rim Core Supervisor | | | 58 | |
| | | | | |
| Figure 11-1: Photograph taken inside of AWP’s Core Lab Facility | | | 61 | |
| | | | | |
| Figure 11-2: AWP’s dry 2-horsepower band saw with dust collection system | | | 63 | |
| | | | | |
| Figure 11-3: Sampling interval from drill hole “KG-06” (Core 3, Box 5) | | | 64 | |
| | | | | |
| Figure 12-1: Bannatyne (1983) GREC Method | | | 71 | |
| | | | | |
| Figure 12-2: Alger and Crain GREC Method (1965) | | | 71 | |
| | | | | |
| Figure 12-3: Historical Drill Hole 01-23 Gamma ray / Assay / GREC Comparison | | | 74 | |
| | | | | |
Figure 12-4: K2O POT003/POT004 Standard Limits | | | 76 | |
| | |
| | | |
| | American West Potash, LLC Holbrook Basin Project
2011 Potash Resource Assessment
October 17, 2011 |
| | | | | |
| Figure 12-5: MgO POT003/POT004 Standard Limits | | | 76 | |
| | | | | |
| Figure 14-1: Resource Buffers for KR-1 and KR-2 (Indicated and Inferred) | | | 83 | |
| | | | | |
| Figure 23-1: Adjacent property land holdings with respect to the Project Area | | | 86 | |
LIST OF TABLES
| | | | | |
| Table 1-1: Resource Summary Table | | | 7 | |
| | | | | |
| Table 2-1: Glossary of Terms and Phrases | | | 12 | |
| | | | | |
| Table 5-1: Approximate Ground Elevation at Well Center for the 2011 Drill Locations | | | 21 | |
| | | | | |
| Table 7-1: Summary of Potash Mineralization | | | 40 | |
| | | | | |
| Table 8-1: Summary of potassium salts | | | 48 | |
| | | | | |
| Table 8-2: Stoichiometric and chemical equivalencies and calculations | | | 49 | |
| | | | | |
| Table 9-1: Summary of 2011 Exploration Program | | | 50 | |
| | | | | |
| Table 10-1: Drill Hole 2011 Wireline Program | | | 59 | |
| | | | | |
| Table 11-1: Assay Intervals Summarized by Test Well | | | 60 | |
| | | | | |
| Table 12-1: Assay vs. GREC Correlation for the Holbrook Basin Historical Wells | | | 72 | |
| | | | | |
| Table 14-1: Project Area Resource Summary Table | | | 81 | |
LIST OF APPENDICES
All appendices are located at the end of the report following Section 27.0
Appendix A — Seismic Data
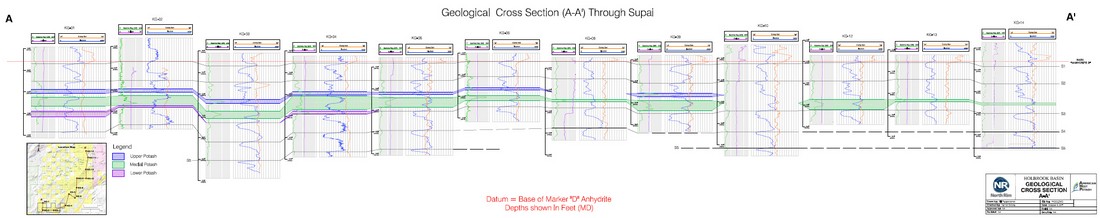
Appendix B — Geological Cross Section
Appendix C — Assay Standards
Appendix D — Assay Results
Appendix E — Tonnage Tables
| | |
| | | |
| | American West Potash, LLC Holbrook Basin Project
2011 Potash Resource Assessment
October 17, 2011 |
1.0SUMMARY
Introduction
North Rim Exploration Ltd. (hereinafter referred to as North Rim) was engaged by America West Potash (hereinafter referred to as AWP) to assist with the implementation of an exploration program. The program consisted of seismic, drilling and core assaying in order to complete a National Instrument 43-101 (NI 43-101) compliant Mineral Resource estimation on their potash property located in the Holbrook Basin in Arizona, USA (hereinafter referred to as the “Project Area”). The Project Area is located approximately 50 kilometers (30 miles) east of the city of Holbrook, Arizona and encompasses approximately 94,000 acres (38,000 hectares) of both state and private land for which AWP has negotiated mineral leases, mineral rights, surface rights and state exploratory approvals.
The following Technical Report prepared by North Rim summarizes the Inferred and Indicated potash resources for AWP’s property. The data used in the Mineral Resource calculation incorporates historical data from the surrounding area, recent seismic work, and the results from twelve potash exploration drill holes completed in 2011.
The Holbrook Basin is a 13,000 km2 (5000 mi2) sub-circular to kidney shaped sedimentary basin in east-central Arizona located along the southern edge of the Colorado Plateau. Its basin-fill strata are characterized by Pennsylvanian to Permian aged siliciclastic sediments interbedded with a relatively thick sequence of halite and other evaporites which define its depositional edges. Potash occurs as discreet mineralized horizons within the uppermost halite beds of this evaporite sequence. The most laterally extensive mineralization identified to date occurs within the second uppermost salt bed (“Sequence 2”) of the so-called “5-B Salt Phase.” This interval was the primary exploration target during AWP’s 2011 Phase 1 exploration program.
The Holbrook Basin is similar geologically and in size with other evaporite basins currently producing potash in the United States, namely Intrepid Potash’s mines in Carlsbad, New Mexico and Moab, Utah. The Carlsbad Mine is extracting potash from depths of 243 to 457 m (800 to 1500 ft) using conventional, continuous mining machines that can target potash beds as thin as 40 inches but can cut a minimum bed thickness of 52 inches. The Cane Creek Mine near Moab, Utah originally extracted potash using conventional mining methods at 914 m (3000 ft); however, in 1970 the operation was converted to a solution mine. The minimum K2O grades that have been recovered from Intrepid’s mines are as low as 8.0 % (12.66 % KCl) but are dependent on individual mine operating procedures. The Holbrook Basin potash does not have Langbinite, has lower carnallite content and lower insoluble than currently seen at the Intrepid Carlsbad Mine.
| | |
| | | |
| | American West Potash, LLC Holbrook Basin Project
2011 Potash Resource Assessment
October 17, 2011 |
Zonge International Inc. of Colorado recorded 2D seismic data on 70 linear miles (112.7 km) over the Project Area, on behalf of AWP. RPS Boyd Petrosearch of Calgary Alberta interpreted the data to identify possible geological or structural anomalies. In general the Project Area was found to be relatively undisturbed and with generally flat lying geology. As identified in the RPS Boyd PetroSearch seismic report there are no features which would indicate large scale salt dissolution, removal or channelling. Minor features are present and may be avoided or delineated further with additional seismic data to assist in future drill holes or mine planning.
Mineral Resource Estimate
For the purpose of this report the Mineral Resource Estimate is based on the assumption that recovery of the potash will be by conventional underground mining methods as they exist today. No Preliminary Economic Assessment (PEA) or Preliminary Feasibility Study (PFS) has been prepared for potash extraction in the Project Area; therefore no Measured Mineral Resource or Mineral Reserves can be defined at this time. The 2011 program was designed such that future “measured” Mineral Resources may be possible with a favourable economic analysis of either a PEA or PFS.
The calculation was performed through a combination of assay results from 11 of the 12 newly drilled wells and the equivalent K2O values calculated from the numerous historical wells’ Gamma Ray Estimation Curves (GREC). In determining the resource for conventional mining a “Geological Interval” was chosen to calculate the resource. The “Geological Resource” is defined as the laterally correlatable potash horizons occurring within Sequence 2 of the 5-B Salt Phase. These horizons are identified, differentiated and correlated by their unique stratigraphic position within the depositional sequence. The intervals were verified with wireline logs using consistent inflection points off of the gamma ray log.
Three potash horizons were identified on the AWP Project Area and have been deemed, in descending stratigraphic order, the Upper, Medial and Lower potash horizons. For the purposes of the Mineral Resource Calculation, these horizons were grouped into KR-1 (Upper) and KR-2 (Medial and Lower) Geological Resource.
The following criteria were used when selecting the “Geological Resource”:
| | • | | G x T = 12 (meters) or 40 (feet) |
| | • | | Minimum bed thickness of 1.2 meters (4 feet) |
| | • | | Less than 8 to 10 % insoluble content |
| | • | | Less than 10 % carnallite |
| | |
| | | |
| | American West Potash, LLC Holbrook Basin Project
2011 Potash Resource Assessment
October 17, 2011 |
At this time no engineering feasibility studies have been conducted on the Project Area so the above criteria may change or may not be applicable after such studies are completed. The thicknesses used for the Resource calculation are not a ‘mining cut’ and will likely be reduced once engineering studies are completed.
Indicated and Inferred Resource Summaries
Inferred and Indicated Resources are based on the results of either the assayed drill holes or GREC calculated grade and the distances between the wells. Based on interpreted geological and property constraints and confidence in lateral continuity of the potash beds the following resource radius of influence (ROI) were selected: Indicated 0 to 1.6 kilometers (0 to 1 mile) and Inferred 1.6 to 3.2 kilometers (1 to 2 miles). All historical wells were assigned to the Inferred category due to a lack of reliable assay data and the lack of historical core available for verification assay. As defined by CIM standards a Measured Resource is not reported at this time based on the lack of production planning and evaluation of economic viability. If a PEA or PFS is completed with favorable economics, some of the reported resource may possibly be placed into a “measured” category.
A summary of Inferred and Indicated potash resources are presented below in Table 1-1 below.
Table 1-1: Resource Summary Table
RESOURCE SUMMARY TABLE
INDICATED1 RESOURCE SUMMARY
| | | | | | | | | | | | | | | | | | | | | | | | | | | | | |
| | | | | | | | | | | | | | | Weighted | | | Total | | | | | | | K2O | |
| | | | | | | Area with Seismic | | | Weighted | | | Average | | | Sylvinite | | | Total K2O | | | MMT3 | |
| | | Area | | | Deductions of | | | Average | | | K2O | | | Tonnage | | | Tonnage | | | per | |
| Member | | (km2) | | | 15% (km2) | | | Thickness (m) | | | Grade (%)4 | | | (MMT3)5 | | | (MMT3)6 | | | Section7 | |
KR-1 | | | 0.00 | | | | 0.00 | | | | 0.00 | | | | 0.00 | | | | 0.00 | | | | 0.00 | | | | 0.00 | |
KR-2 | | | 45.26 | | | | 38.47 | | | | 1.98 | | | | 10.09 | | | | 158.10 | | | | 15.95 | | | | 1.07 | |
Total | | | 45.26 | | | | 38.47 | | | | N/A | | | | N/A | | | | 158.10 | | | | 15.95 | | | | N/A | |
INFERRED2 RESOURCE SUMMARY
| | | | | | | | | | | | | | | | | | | | | | | | | | | | | |
| | | | | | | | | | | | | | | Weighted | | | Total | | | | | | | K2O | |
| | | | | | | Area with Seismic | | | Weighted | | | Average | | | Sylvinite | | | Total K2O | | | MMT3 | |
| | | Area | | | Deductions of | | | Average | | | K2O | | | Tonnage | | | Tonnage | | | per | |
| Member | | (km2) | | | 15% (km2) | | | Thickness (m) | | | Grade (%)4 | | | (MMT3)5 | | | (MMT3)6 | | | Section7 | |
KR-1 | | | 42.70 | | | | 36.29 | | | | 1.69 | | | | 13.44 | | | | 127.58 | | | | 17.15 | | | | 1.22 | |
KR-2 | | | 125.56 | | | | 106.72 | | | | 1.95 | | | | 11.39 | | | | 432.75 | | | | 49.29 | | | | 1.20 | |
Total | | | 168.26 | | | | 143.01 | | | | N/A | | | | N/A | | | | 560.33 | | | | 66.44 | | | | N/A | |
| | | |
| 1. | | Indicated Resource radius of influence is 0.0-1.6KM for Potash Units KR-1 and KR-2 |
| |
| 2. | | Inferred Resource radius of influence is 1.6-3.2KM for Potash Units KR-1 and KR-2 |
| |
| 3. | | MMT = Million Metric Tonnes |
| |
| 4. | | “Average K2O Grade” and “Average Thickness” refer to weighted averages. |
| |
| 5. | | “Total Sylvinite Tonnage” refers to total amount of in-situ resource in the Project Area (i.e. Area x Thickness x Density x Deductions) |
| | |
| | | |
| | American West Potash, LLC Holbrook Basin Project
2011 Potash Resource Assessment
October 17, 2011 |
| | | |
| 6. | | “Total K2O Tonnage” refers to the total amount of K2O resource in the Project Area (i.e. Area x Thickness x Density x Deductions x Grade). Deductions include 15% for unknown anomalies (Does not include mining extraction ratio or plant and transport losses) |
| |
| 7. | | Assuming 640 acres or 2,589,988m2per section. |
Conclusions
AWP’s Project Area, when compared to other sedimentary basins hosting potash deposits, exhibits several positive factors that make it favourable for further potash exploration, resource delineation, and possible mine development:
| | • | | The resource calculated at this time for the Project Area appears to be sufficient enough to support further detailed resource, process and PEA studies. |
| | • | | Potash resources appear to be of comparable grade, thickness and with low impurities, such as insolubles and carnallite, when compared to Intrepid’s Carlsbad Mine. |
| | • | | The potash beds in the Project Area occur at relatively shallow depths, less than 551 m (1600 ft). |
| | • | | Seasonal climate variations are minimal compared to Canadian and Russian potash operations which lower operation costs. |
| | • | | Unlike other parts of the world where potash is mined, there is no competition with the Oil and Gas industry in the Holbrook Area (Rauzi S. L., 2008). |
| | • | | The Project Area is close to very large, year round potash markets in Arizona, California and Mexico. The US imports more than 80 % of the potash it consumes and is the second largest consumer of potash in the world. The Project Area is close to four international export ports. |
| | • | | The state of Arizona supports the development of its mineral resources, works closely with the mining industry and has a favourable potash royalty structure. |
| | • | | The Project Area is in close vicinity to infrastructure including rail, major highways, gas and power. |
| | • | | The infill drilling program and additional exploration work should focus in the north central part of the Project Area. The historical work conducted by Rauzi (Rauzi S. L., 2008) and the updated potash isopach figures shown in Section 7.1 suggests that the potash may be of better quality in that part of the Project Area. |
Potential Risks Requiring Further Investigation
Permitting and Licensing: AWP has followed a strategy of acquiring only state and private lands and mineral rights, thus, permitting will be conducted through Arizona State agencies. Primary agencies include:
| | • | | Arizona State Land Department — application for mineral leasing. |
| | • | | Department of Environmental Quality — air, water and wastewater permits. |
| | |
| | | |
| | American West Potash, LLC Holbrook Basin Project
2011 Potash Resource Assessment
October 17, 2011 |
| | • | | Department of Water Resources — fresh water wells and water usage. |
| | • | | State Mine Inspector — permit for mining operations which would include safety, hazardous materials and control. |
Petrified Forest National Park: AWP will have to work closely with State and Park officials in minimizing the impact on the surface areas and Park visitors.
Water Supply: AWP will have to work with the Department of Water Resources to obtain, prove and be granted a water right, or will have to obtain these from area wells and existing rights.
Salt Back Thickness: It has been observed in the core that the roof or “back” above the upper potash resource interval (KR-1) and localized areas of the lower potash resource interval (KR-2) is made up of insoluble materials such as clays and anhydrites. This can present challenges with roof control and the mining progress. Rock mechanics studies will be required to assess the “salt back” and provide recommendations for control.
Recommendations
The Project Area has adequate Indicated and Inferred Resource base to proceed with a PEA or a PFS. The following recommendations are made by the author:
| | • | | Additional seismic that was acquired in the northwest portion of the Project Area during the 2011 program should be processed and interpreted to identify and assist with placing any new wells. Estimated cost $25,000. |
| | • | | Complete a PEA or PFS. This study will focus on determining the economics of a conventional underground mining operation in the Project Area, and may also include beginning baseline environmental studies, metallurgical, hydrogeological and geotechnical studies. Estimated cost $150,000. |
| | • | | Conduct infill drilling of 5 to 10 wells to increase the resource base and define parameters for a Feasibility Study. Estimated cost $2,000,000 to $3,000,000. |
| | |
| | | |
| | American West Potash, LLC Holbrook Basin Project
2011 Potash Resource Assessment
October 17, 2011 |
2.0INTRODUCTION AND TERMS OF REFERENCE
This report was prepared by North Rim Exploration Ltd. (hereinafter referred to as “North Rim) at the request of American West Potash, LLC (hereafter known as “AWP”) to present the Mineral Resource estimate generated for its Holbrook Basin Project (herein referred to as the “Project Area”) following the completion of a potash exploration drilling program. AWP is a corporation based in Denver, Colorado whose goal is to assess the economic potential of potash deposits in the Holbrook Basin. This report discusses historical exploration efforts and AWP’s recent drilling and seismic activities in the Project Area, and outlines the details of a potash Mineral Resource estimate compliant with National Instrument 43-101 Report Form F-1. North Rim is entirely independent of AWP and has no interest in any manner in the property in question.
2.1INTRODUCTION
The information upon which this report is based was obtained from 12 recently drilled test holes completed by AWP, public historical exploration data acquired by various companies between 1960 and 1970, as well as publicly available record sources including technical reports, geological reports, and potash geochemical analyses.
October 17th, 2011 is the effective report date. The seismic survey data presented in this report is effective as of September 29, 2011. The geoanalytical assay results obtained from Huffman Laboratories Inc. of Golden, Colorado is effective as of October 4, 2011.
For this report, North Rim performed the following scope of work:
| | • | | Planned and assisted AWP with the implementation of the 2011 exploration drill program; |
| | • | | Reviewed the recovered cores and generated detailed geological core descriptions; |
| | • | | Compiled and interpreted the regional and local geology; |
| | • | | Performed core analysis, geochemical sampling, and summary of assay results; |
| | • | | Reviewed 63 historical wells (LAS and PDF files) of which 57 met the criteria for inclusion in the Resource calculation and 21 of which did not contain potash; |
| | • | | Reviewed land agreements as provided by AWP to verify land tenure; |
| | • | | Reviewed RPS Boyd PetroSearch’s 2D seismic reports; and |
| | • | | Calculated Inferred and Indicated Resources based on NI-43-101 compliance requirements. |
| | |
| | | |
| | American West Potash, LLC Holbrook Basin Project
2011 Potash Resource Assessment
October 17, 2011 |
2.2AVAILABLE DATA
Cores from the 12 recent potash test holes completed on the Project Area, and which are referenced throughout this report, are all available for inspection at AWP’s core facility located in Holbrook, Arizona. The core from four of the 12 test holes has been inspected by the principal author, Mrs. Tabetha Stirrett to verify their contents. The remainder of the core was inspected by other geological professionals under the direction of the principal author.
As with other potash deposits, the Mineral Resource may be affected by geological phenomena that have deleterious effects upon the Mineral Resource, these include but are not limited to:
| | • | | Depositional limitations and local paleotopography; |
| | • | | Absence of material due to erosion; and |
| | • | | Leach, washout, and salt collapse anomalies. |
Although no critical anomalies have yet been identified on the property, the possibility of the above mentioned anomalies does exist for the Project Area (see Section 7.4). While the present study incorporates estimates as to the extent of such anomalous ground based upon knowledge gained in the 2011 2D seismic reports (Edgecombe, 2011), further work, such as regional 2D extensions and possibly a 3D seismic investigation, may identify subsurface anomalies in other portions of the Project Area.
The Permian stratigraphy of the Holbrook Area and the local processes affecting evaporite formation, potash precipitation, preservation, diagenesis, and dissolution are topics of both historical and on-going research by numerous industry, academic, and government bodies. The detailed stratigraphic correlations that are presented herein are based upon these reports; however, they have been modified by the author based on personal experience with other potash deposits.
Property descriptions and land status were obtained from the list of lands as set forth in the documents provided by AWP. No attempt to independently verify the land tenure information was made by the author. Mineral Resource estimate calculations were based upon review of available technical sources and were completed under the direct supervision of Mr. Earl Gebhardt. The economic potential of the Project Area is beyond the scope of this report.
The reader is reminded that the term “ore” should not be used, disclosed, or implied unless proven reserves have been estimated on the property. To be called ore, the economic factor must be taken into account and it must be possible to extract metals or minerals profitably from the ore. Since no proven reserves have been identified during the course of work undertaken to prepare this report, the term “ore” has not be used; however, where the term “ore” is used in this report, it is in the context of a direct quote taken from third-party reports or papers and as such is not compliant with recommendations set forth in NI 43-101.
| | |
| | | |
| | American West Potash, LLC Holbrook Basin Project
2011 Potash Resource Assessment
October 17, 2011 |
2.3TERMS OF REFERENCE
Throughout this report geological, technical, and potash industry specific terminology is commonly employed. Table 2-1, below, provides an alphabetized list of definitions for many of these terms and phrases.
Table 2-1: Glossary of Terms and Phrases.
GLOSSARY OF TERMS
| | | | | |
| | | Chemical | | |
| Term | | Formula | | Definition |
| Assay | | N/A | | A test performed to determine a sample’s chemical content. |
| | | | | |
| Carnallite | | KCl.MgCl2· 6H2O | | A mineral containing hydrated potassium and magnesium chloride. |
| | | | | |
| Halite | | NaCl | | Sodium Chloride — Naturally occurring salt mineral. |
| | | | | |
| G x T | | N/A | | Grade multiplied by thickness in either meters or feet. |
| | | | | |
| Sylvite | | KCl | | Potassium Chloride — A metal halide salt composed of potassium and chorine. Generally known as potash. |
| | | | | |
| Sylvinite | | N/A | | Mineralogical mixture of halite and sylvite +/- minor clay and carnallite. |
| | | | | |
K2O | | K2O | | Potassium Oxide — A standard generally used to indicate and report ore grade. |
| | | | | |
| Insoluble | | N/A | | Water-insoluble impurities, generally clay, anhydrite, dolomite or quartz. |
| | | | | |
| Seismic Anomaly | | N/A | | A structural change in the natural, uniformly bedded geology. |
| | | | | |
| Dissolution and Collapse Anomaly | | N/A | | Occurs where the sylvinite bed has been removed by dissolution of salt and the resulting void is in-filled by material caved from above. |
| | | | | |
| Leach Anomaly | | N/A | | Occurs where the sylvinite bed has been altered such that the sylvite has been removed and replaced by halite. |
| | | | | |
| Washout Anomaly | | N/A | | Occurs where sylvite bed has been replaced or altered to a halite mass that consists of medium to large halite crystals within a groundmass of smaller intermixed halite and clay insolubles. |
| | | | | |
| CIM | | N/A | | The Canadian Institute of Mining, Metallurgy and Petroleum. |
North Rim Exploration Ltd. is a privately held geological and mine engineering consulting firm based in Saskatoon, Saskatchewan that was founded in 1984 by Mr. Steve Halabura, P.Geo, F.E.C. (Hon.). North Rim has been issued a Certificate of Authorization No. C905 with the Association of Professional Engineers and Geoscientists of Saskatchewan (APEGS), and holds a “Permission to Consult” in the field of geology for petroleum, potash, and other precious and industrial minerals resources.
The Qualified Person (QP) for this report is Mrs. Tabetha A. Stirrett, P. Geo. of North Rim Exploration Ltd. Mrs. Stirrett graduated from the University of Saskatchewan in Saskatoon, Saskatchewan in 1997 with a Bachelor of Science in Geology. Mrs. Stirrett has over 14 years of experience in both the mining and oil and gas sectors. In November 2008, she joined North Rim as a senior geologist and has since been part of several potash and coal projects. Among Mrs.
| | |
| | | |
| | American West Potash, LLC Holbrook Basin Project
2011 Potash Resource Assessment
October 17, 2011 |
Stirrett’s most recent experiences is the management of a drilling program and Mineral Resource calculation for Encanto Potash Corp.’s Muskowekwan property in Saskatchewan (Stirrett T. A., 2011). She has worked on the Athabasca Potash “Burr Project” and on the Boree Salt Deposit in Queensland, Australia. She was Project Team Lead of an extensive coal exploration and delineation program for NuCoal Energy Corp. in south-central Saskatchewan. Mrs. Stirrett is currently North Rim’s Business Development Manager and is responsible for developing a diversified portfolio of new sustainable clients for North Rim. Mrs. Stirrett is classified under NI 43-101 Rules and Policies as an Independent Qualified Person.
Mr. Earl Gebhardt P. Eng., reviewed the contents of this report. Mr. Gebhardt graduated with a Bachelor of Engineering in mining from the University of Saskatchewan in 1974. He is a Professional Engineer registered with the Association of Professional Engineers and Geoscientists of Saskatchewan since 1977 (Member No. 04239). Mr. Gebhardt has worked in various engineering capacities at the Potash Corporation of Saskatchewan from 1981 to the end of 2004. He was employed for 20 years at the Lanigan operations in Saskatchewan primarily as the Chief Mine Engineer, and held other supervisory and managerial positions. Working on various mining engineering projects, Mr. Gebhardt has spent roughly 10 years working in hard rock mining. Since 2005, he has been acting as an independent contractor to North Rim involved in a number of potash exploration related projects for different clients in Saskatchewan and other Canadian provinces. The projects have ranged from exploration permits to pre-feasibility studies incorporating both geological and mining engineering work aspects. Mr. Earl Gebhardt is classified under NI 43-101 Rules and Policies as an Independent Qualified Person.
2.4SITE VISIT
As required by National Instrument 43-101, a site visit was made by the principal author to the Project Area in 2011 from June 6 to 12th. During this visit the following activities were undertaken:
| | • | | Reviewed the drilling locations; |
| | • | | Monitored core retrieval process for KG-04; |
| | • | | Reviewed the cores from KG-01, KG-02, KG-03 and KG-04; |
| | • | | Assisted and reviewed sampling procedures for KG-04; and |
| | • | | Observed the infrastructure, local communities and general lay of the land surrounding the Project Area. |
| | |
| | | |
| | American West Potash, LLC Holbrook Basin Project
2011 Potash Resource Assessment
October 17, 2011 |
3.0RELIANCE ON OTHER EXPERTS
In the preparation of this report, North Rim has acquired and employed information from publically available technical sources which are based upon the results of previous potash exploration activities carried out in north eastern Arizona. These sources are filed through the Arizona State Energy Offices and contain opinions and statements that were not prepared under North Rim’s supervision. North Rim does not take responsibility for the accuracy of this historical data and these items will hereinafter be referred to as “third-party-reports” or “historical information.” It is not known if the personnel, facilities, or analytical procedures used by previous evaluators were independent, or if the authors of those reports were considered “Qualified Persons” (QP) as defined by National Instrument 43-101.
North Rim has held internal discussions with company management as well as other external experts in the potash industry who have been involved with the Holbrook Potash Project. The author has relied upon the following experts for technical information:
| | • | | Mr. Pat Avery of AWP, who provided North Rim with the land owner agreements and state land agreements (Section 4). |
| | • | | Roger Edgecombe of RPS Boyd PetroSearch, for the 2D seismic interpretations used in calculating the Mineral Resource (Section 9). |
| | • | | Mr. Ron Keil from Huffman Laboratories, for geochemical analyses (Section 11). |
| | • | | Mr. Jim Lewis and Mr. Hugh Eisler formerly of Intrepid Potash Carlsbad, for guidance on selection of parameters utilized in the Mineral Resource calculations. |
| | • | | Lawyer Jeff Knetsch of Brownstein, Hyatt, Farber, Schreck LLP is the lead attorney who represents AWP, and was the law firm responsible for creating and reviewing the legal agreements made between AWP and the private land owners in the area. |
| | • | | Mr. Roger Smith, an independent consultant, who assisted in planning and permitting during the 2011 exploration program, assisted North Rim with the non-potash, shallow geology well site services for the duration of the 2011 drilling program. |
3.1Other Technical Contributors
Mr. Tanner Soroka of North Rim, geologist who performed detailed geological core descriptions, geochemical assay sampling, and provided geological expertise (Sections 7, 8, and 12).
Ms. Kelsey Mayes of North Rim, geologist who performed detailed geological core descriptions, geochemical assay sampling, and provided geological expertise (Section 7, 11, 12 and 23).
Mr. Brett Dueck of North Rim, engineer who performed detailed resource calculations, and provided engineering and drilling expertise (Sections 10 and 14).
| | |
| | | |
| | American West Potash, LLC Holbrook Basin Project
2011 Potash Resource Assessment
October 17, 2011 |
Mr. Alan Bent of North Rim, engineer who performed detailed resource calculations, and provided engineering expertise (Sections 12 and 14).
Ms. Tricia Fehr of North Rim, geologist who performed detailed geological core descriptions, geochemical assay sampling, and provided geological expertise.
4.0PROPERTY DESCRIPTION AND LOCATION
4.1PROPERTY DESCRIPTION AND LOCATION
The Holbrook Salt Basin spans the Coconino, Navajo and Apache Counties in Arizona, USA. AWP’s Project Area is completely located within Apache County, immediately east of the Petrified Forest National Park (PFNP), and south of Navajo, Arizona. The map shown in Figure 4-1 illustrates AWP’s current land positions. As of the time of writing this report, AWP has control of 157 sections of land comprising of approximately 94,000 acres. This total was calculated in ArcGIS. The Client has leased 42 sections from Arizona State Land Department (ASLD) and approximately 115 sections from private landowners.
| | |
| | | |
| | American West Potash, LLC Holbrook Basin Project
2011 Potash Resource Assessment
October 17, 2011 |
Figure 4-1: General Location Map of Project Area.
| | |
| | | |
| | American West Potash, LLC Holbrook Basin Project
2011 Potash Resource Assessment
October 17, 2011 |
4.2PROPERTY TITLES IN ARIZONA
Land in Arizona is owned by a wide variety of organizations including Federal, Indian Trust, private interest, and the State Trust. According to the 2009-2010 Arizona State Land Department (ASLD) Annual Report (Brewer, 2010), the ASLD’s “mission has been to manage the Land Trust and to maximize its revenue for its beneficiaries. All uses of the land must benefit the Trust, a fact that distinguishes it from the way public land, such as parks or national forests, may be used.” The State Trust has 13 beneficiaries, of which, state education accounts for over 90 % of revenue disbursements. Historically, most State Trust lands have been leased for grazing; however, in recent years revenue from mineral exploration, development and production activities have significantly increased in revenue.
4.3MINERAL TENURE IN ARIZONA
Pursuant to the ASLD’s application for Mineral Exploration Permits, the ASLD requires an “Exploration Plan of Operation” to be filed and approved by that agency before any exploration work begins. AWP’s permit was approved on November 17th, 2010.
The State of Arizona issues Exploration Permits which are valid for a period of one year and are renewable for a period of up to five years. The annual rental fee for an exploration permit is as follows:
| | • | | $2.00 per acre for the first year, which payment also covers the second year’s rental fee. |
| | • | | For years three through five, $1.00 per acre per year. |
| | • | | $500 fee associated with each annual renewal. |
The State of Arizona requires the following minimum exploration expenditures and allows cash payment in lieu of exploration activity:
| | • | | $10.00 per acre per year for years one and two. |
| | • | | $20.00 per acre per year for years three through five. |
The client has indicated that each state lease, 42 in total, is either in its first or second lease year. This converts to the following required expenditure amount due for 2011 payments:
25,710 acres x $10 = $257,100.00
The holder of the permit has the surface rights necessary for prospecting and exploration and the right to access the land covered by the permit. The permit holder is liable to and must compensate the owner and any lessee of the surface of the State Land covered by the permit for any loss to the owner and for any damage resulting from exploration activities. An Exploration Plan of Operation must be valid during all exploration activities annually and be approved by the Arizona State Land Department prior to startup of exploration activities. An exploration permit is not a right to mine and a mineral lease must be obtained before mining activities can begin.
| | |
| | | |
| | American West Potash, LLC Holbrook Basin Project
2011 Potash Resource Assessment
October 17, 2011 |
On the privately owned sections, AWP has negotiated nearly 100 % of the potash mineral rights and also has a long term surface rights lease agreement that can be extended indefinitely as long as AWP continues to actively pursue the exploration, development, operations and/or reclamation of mineral deposits on these privately owned sections. These lease agreements allow AWP the ability to perform the necessary exploration activities on the property as required. The following details AWP’s obligations to the private leases:
| | • | | On 5,107 acres the agreement is as follows: |
| | o | | $1.00 per acre per year for the first two years. |
| |
| | o | | $2.00 per acre per year for years three and four. |
| |
| | o | | $5.00/acre per year thereafter. |
| |
| | o | | This equates to a $5,075 lease payment for 2011. |
| | • | | On 61,238 acres the agreement is as follows: |
| | o | | Annual rental fee and access fees of $90,000 per year in aggregate starting on January 1, 2012. |
5.0ACCESSIBILITY, CLIMATE, LOCAL RESOURCES, INFRASTRUCTURE, AND PHYSIOGRAPHY
5.1ACCESSIBILITY
The Project area is located within the Holbrook Salt Basin and is situated entirely within Apache County in northeastern Arizona. Access to the area is provided via Interstate Route 40 (I-40) to Navajo, Arizona, and then south on Kerr McGee Road and Route 2015. It is defined as having the Navajo Indian Reservation at its north and northeastern boundary and the PNFP to the west, and does not extend south of Township 16. The area is well covered by both highways and secondary roads. Secondary and ranch roads allow all-weather access to most locations in the Project Area. All locations not accessible via existing roads can be accessed by either four-wheel drive or all-terrain vehicles. The Santa Fe Railway transects the Northern part of the Project Area.
5.2CLIMATE
The Project Area is located in a high desert, semi-arid region. Weather patterns are characterized by relatively dry conditions with hot spring, summer, and fall temperatures ranging from 11°C to 34°C (52°F to 93°F), and cool winter temperatures ranging from -7°C to 17°C (18°F to 63°F). The area experiences two rainy seasons occurring in the winter,
| | |
| | | |
| | American West Potash, LLC Holbrook Basin Project
2011 Potash Resource Assessment
October 17, 2011 |
caused by cold fronts originating from the Pacific Ocean, and the other occurring as a monsoon during the summer. The worst operating hazard to drilling and field operations are monsoon induced flash floods (Cox, 1965). Aside from this, seasonal variations do not hinder industrial operations. The average annual rainfall is 21.6 cm (Butrenchuk, 2009), mostly occurring as thunder showers with little recharge. The winter months are generally cool and precipitation is of a low-energy type. Seasonal variations in weather do not typically constrain exploration or mining.
5.3LOCAL RESOURCES
The nearby towns of Holbrook, St. Johns, and Show Low provide locations for personnel, supplies, equipment and accommodation. Holbrook was utilized as a base of operations during the 2011 exploration program. These centers can serve as shipping locations, and also as the sources of gas and water (Butrenchuk, 2009). Electricity is provided to the area by a coal-fired power station, the Cholla Plant, which is located just east of Holbrook near Joseph City. In addition, water for drilling can also be obtained from range tanks, wells, and the Little Colorado River. Drilling mud, diesel and other resources can be obtained locally or from Silver City, New Mexico which is approximately 370 km (231 miles) from the project. The Project Area is well covered by an electrical distribution network and a gas supply system. The gas and power lines follow the general trend of historic Route U.S. 66 and the Santa Fe Railway; however, in some areas the power line extensions are somewhat limited (Cox, 1965).
5.4INFRASTRUCTURE
The Project Area is bound on the north by the heavy service Interstate 40 (1-40). I-40 is the third longest major west—east Interstate Highway in the United States with its western end extending to Interstate 15 in Barstow, California. Spanning from Oklahoma City to Barstow, the modern part of the I-40 overlays historic U.S. Route 66. I-40 intersects with eight of the ten primary north—south interstates, and five in the western United States. Through Texas, New Mexico, Arizona and California it connects and crosses over 20 connecting federal or state highways. These routes connect essentially all neighboring states; Nevada, Utah, and Colorado. Other connecting highways flow to three US-Mexico crossings.
The vast assortment of highways in the area means that there is full service truck transport and support system throughout the southwest U.S. by way of route I-40. AWP plans to use, highly cost effective, lower freight cost truck service, in the nearest 320 — 480 km (200 — 300 miles). This would conceivably work within New Mexico, Arizona, Utah, Colorado and southern California. AWP estimates that the freights run would cost approximately $15 to $25 per ton range.
| | |
| | | |
| | American West Potash, LLC Holbrook Basin Project
2011 Potash Resource Assessment
October 17, 2011 |
The Project Area is bound on the north by the Burlington Northern Santa Fe (BNSF) mainline (Figure 5-1). This is a dual track, dual direction mainline for heavy duty service. It is part of the Southwest system and runs through Fort Worth Texas, BNSF headquarters, westward through New Mexico, Arizona and into California. At the Barstow California Yard, a main line splits and services the Los Angeles area and the other one north to Stockton, Sacramento and northern exchanges. Branch lines and independent short lines serve every western state. These lines will be practical to ship any produced product locally. If international shipments of product are planned export is readily possible from the Ports of Stockton, Long Beach and the Mexican Ports of Guymas and Topolabampo. BNSF directly serves Long Beach and Stockton and has rail service to the two Mexican ports, through the BNSF affiliate FXE, a rail line in Mexico. BNSF provides tariff and specialty rates across its system. The BNSF webpage (About BNSF Railway) provides information on tariff rates.
BNSF also runs a heavy duty spur line southward on the Southwest Line. This East Coronado Junction Line parallels the Project Area on the eastern boundary and would be well suited for a potash rail loading facility. This heavy duty line carries unit trains (65-100 cars) of coal to the coal fired power plants, Coronado Generating Station (Salt River Project) and Springerville Station (Tucson Electric Power).
In addition to the two coal-fired power plants, a third named Pacific Power’s Cholla Station mentioned in Section 5.3 is found near Holbrook. AWP staff has communicated with the power stations and has confirmed that they do sell to new users and quoted preliminary rates in the 6-7 cent/kw range.
5.5PHYSIOGRAPHY
The regional lands are flat in general with minor low lying rolling hills, supporting ranching, light industry and areas of historical mining. Limited vegetation in the range land consists of minor salt cedar and scrub grasses. There is a little hay production in the valley bottoms and there are numerous ranches scattered throughout the Project Area. The area is transected by the Little Colorado, a permanent stream, and the Puerco River, an intermittent stream (Cox, 1965). Their confluence lies about three miles east of Holbrook and tends to generally produce fresh water. It is reported to be brackish to saline in the surrounding areas. The divide area between the rivers is characterized by generally low grassland ridges, broad drainage areas and ledge form buttes and mesas. The topography remains similar south of the Little Colorado, but with considerable pinon and cedar cover (Carr, 1966). Ground water occurs throughout the area within the Coconino Sandstone Formation and forms a regional aquifer. There are extensive areas of sink holes reaching the land surface which suggests major salt solution that likely contributes to the salinity of the water in the Coconino Sandstone (Cox, 1965). These features are located approximately 50-60 km (31 to 37 miles) south of the Project Area and are shown in Figure 5-2. Ground level elevations from the 2011 drilling program are located in Table 5-1 and range from 1708 to 1876 m (5604 to 6155 ft) Mean Sea Level. These elevations are taken from the USGS Digital Elevation Model and are reported to be accurate within five feet.
| | |
| | | |
| | American West Potash, LLC Holbrook Basin Project
2011 Potash Resource Assessment
October 17, 2011 |
Table 5-1: Approximate Ground Elevation at Well Center for the 2011 Drill Locations.
| | | | | | | | | |
| Drill Hole ID | | Elevation (Feet) | | | Elevation (Meters) | |
| KG-1 | | | 5608 | | | | 1709 | |
| KG-2 | | | 5650 | | | | 1722 | |
| KG-3 | | | 5605 | | | | 1708 | |
| KG-4 | | | 5640 | | | | 1719 | |
| KG-5 | | | 5795 | | | | 1766 | |
| KG-6 | | | 5745 | | | | 1751 | |
| KG-8 | | | 5860 | | | | 1786 | |
| KG-9 | | | 6020 | | | | 1835 | |
| KG-10 | | | 5995 | | | | 1827 | |
| KG-12 | | | 6155 | | | | 1876 | |
| KG-13 | | | 5990 | | | | 1826 | |
| KG-14 | | | 5980 | | | | 1823 | |
| | |
| | | |
| | American West Potash, LLC Holbrook Basin Project
2011 Potash Resource Assessment
October 17, 2011 |
Figure 5-1: Project Area with surrounding infrastructure and rail lines.
| | |
| | | |
| | American West Potash, LLC Holbrook Basin Project
2011 Potash Resource Assessment
October 17, 2011 |
Figure 5-2: Solution Collapse Basin with respect to potash basin (modified from Warren, 2006).
6.0HISTORY
6.1HISTORY OF POTASH EXPLORATION IN THE HOLBROOK BASIN
Potash exploration in the Holbrook Basin can be traced back more than fifty years. Prior to AWP’s exploration program there have been many companies exploring potash in this area since the 1970’s.
In the 1960’s and 1970’s, a total of 135 holes were drilled to delineate the potash in the area. Arkla Exploration Company and Duval Corporation drilled 105 holes. Other potash holes were drilled by Kern County Land, National Potash, New Mexico and Arizona Land, St. Joe American, and U.S. Borax. Indications of potash in previously drilled oil tests started the potash play (Cox, 1965). Only five holes penetrated the entire salt package, but 127 holes were drilled into the upper 30 to 90 m (100 to 300 ft) of salt where the potash is typically present. Most of the historical holes were cored through the upper 30 m (100 ft) of salt to get direct information about the nature of the potash deposits. Arkla and Duval reported the presence of potassium minerals sylvite (KCl), carnallite (KMgCl3), and polyhalite (K2Ca2Mg(SO4)4•H2O) in the main potash
| | |
| | | |
| | American West Potash, LLC Holbrook Basin Project
2011 Potash Resource Assessment
October 17, 2011 |
“pay zone” (Cox,1965); (Carr,1966). Cox further indicated that carnallite was only locally present in the ore and that none of Duval’s holes encountered carnallite at the time of his report. Six holes drilled by Kern County Land and Arkla contained as much as 3.0 % K2O (4.75 % KCl) as carnallite and a section below the main potash “pay zone” contained as much as 6.0 % K2O (9.50 % KCl) as carnallite (Cox, 1965). Duval made a visual estimate of the K2O content by dragging a sharp 4-H pencil across the surface of a core. The hardness of sylvite was such that the 4-H pencil gouged the sylvite but left a black mark on the halite. As a result, the geologist was able to estimate the K2O content within 2.0 % to 3.0 % (Cox, 1965). Scattered blebs and traces of potash persist to about 9 m (30 ft) below the main potash “pay zone”. Well logs, samples, core descriptions, and six assay reports from the potash drilling are available in the well files of the Arizona Oil and Gas Conservation Commission at the Arizona Geological Survey in Tucson.
To date, there has been no commercial production of potash in Arizona, either by conventional or solution mining, even though drilling by late 1965 indicated about 450 million tons of potential K2O covering an area of 80 square miles (Cox, 1965). Cox estimated that 100 million tons of at least 60.0 % K2O (94.97 % KCl) product were economically recoverable. By early 1966, Arkla estimated a potential of more than 285 million tons of nearly 20.0 % average grade K2O (31.66 % KCl) to be underlying its lease block, which left about 92.0 % of nearly 55,000 acres untested (Carr, 1966). Carr reported that the amount of potash under Arkla’s prospective area exceeded the minimum economic requirement to justify installation of mining and ore-processing facilities by 540.0 %. Overproduction of potash in Saskatchewan during a period of government subsidies and a global glut of potash in the late 1960s may have been the biggest factors in preventing development of Arizona potash at the time.
For Historical Mineral Resource estimates the reader is cautioned that a qualified person has not done sufficient work to classify the historical estimates as current Mineral Resources or Mineral Reserves. The Issuer is not treating the historical estimate as current Mineral Resources or Mineral Reserves as defined in Sections 1.2, 1.3 and 2.4 of NI 43-101.
Another factor in the lack of exploration of Arizona potash may be that the area underlain by potash in east-central Arizona is approximately centered under Petrified Forest National Park (PFNP). The Petrified Forest Expansion Act of 2004 substantially increases the area of potash underlying the park. Isopach mapping originally performed by Rauzi suggests that some of the thickest potash may lie beneath the southern part of the PFNP. A combination of State Trust and public and private land is available for potential development east and southwest of the PFNP (Rauzi S.L., 2008).
| | |
| | | |
| | American West Potash, LLC Holbrook Basin Project
2011 Potash Resource Assessment
October 17, 2011 |
6.2RESOURCE EXPLOITATION HISTORY IN THE HOLBROOK BASIN
The first discovery of salt in the Holbrook Basin seems to have been in 1920 during petroleum exploration drilling near Holbrook (Peirce W., 1981). Indications of potash among previously drilled oil tests started the potash play in the early 1960’s (Cox, 1965). Since then, many additional drill holes in this region have penetrated salt, and as a consequence have helped to outline the Holbrook Salt Basin.
Helium was explored and produced near the northeastern limit of the potash deposit area from 1961 to 1976. Two helium fields, the Pinta Dome and Navajo Springs produced nearly 700 million cubic feet of grade-A helium from the Coconino Sandstone Formation (Rauzi S. L., 2008). Concentrations of helium from these fields reached 10.0 % with an average of 8.0 %, making it some of the richest helium-bearing gas ever produced (Rauzi S. L., 2008).
In the early 1970’s the salt commonly associated with potash was first used as a subsurface storage facility to store liquefied petroleum gas (LPG) at Adamana, east of Holbrook, AZ. Stable and clean areas of salt were dissolved underground to create the storage caverns, creating 11 storage wells at Adamana still operating today and served by the BNSF railroad (Rauzi S. L., 2008). The total capacity of the 11 caverns is approximately 90 million gallons, with individual cavern volumes ranging from 7 to 11 million gallons (Rauzi S. L., 2008).
7.0GEOLOGICAL SETTING AND MINERALIZATION
7.1GEOLOGICAL SETTING
The Holbrook Basin is a 13,000 km2 (5000 mi2) sub-circular to kidney shaped sedimentary basin in east-central Arizona located along the southern edge of the Colorado Plateau. The basin is orientated roughly northeast-southwest and spans the Coconino, Navajo and Apache Counties in Arizona with its eastern limits extending just over the Arizona-New Mexico State border. It is situated along the gently north-dipping slope of the Mogollan Rim, a topographic high delineating the southern escarpment edge of the Colorado Plateau. The basin is bound to the northeast by the Defiance Uplift (Figure 7-1).
| | |
| | | |
| | American West Potash, LLC Holbrook Basin Project
2011 Potash Resource Assessment
October 17, 2011 |
Figure 7-1: Geological map of north east Arizona and Project Area.
| | |
| | | |
| | American West Potash, LLC Holbrook Basin Project
2011 Potash Resource Assessment
October 17, 2011 |
Basin-fill halite deposits of the Pennsylvanian to Permian aged Supai Group define the depositional edges of the Holbrook Basin. Within the basin area, the Supai Group can be subdivided into four Members as described by Winters (1963). In ascending stratigraphic order they are the; “Amos Wash”, “Big A Butte”, “Fort Apache”, and “Corduroy” Members. The “Amos Wash” and “Big A Butte” Members are comprised predominantly of reddish-brown siliciclastics, the latter of which is interbedded with gypsum and limestone (Winters, 1963). The “Fort Apache” Member is a wide-spread fossiliferous limestone marker and the “Corduroy” Member, while lithologically similar to the “Big A Butte” Member in most parts of Arizona, contains thick accumulations of evaporite strata and halite within the confines of the Holbrook Salt Basin. The Supai Group is overlain by the Permian Coconino Sandstone Formation, and underlain by the Pennsylvanian Naco Formation carbonates, which onlap unconformably onto Precambrian basement lithologies.
The majority of the salt deposits occur within the medial strata of the “Corduroy” Member, extending nearly 160 km (99 miles) in width from east to west and 60 km (37 miles) from north to south. These beds underlie Arizona Townships 10 through 20 north and Ranges 16 through 31. The salt is thickest in the basin center near Section 19, Township 16 north, Range 24 east, where it reaches a maximum composite thickness of approximately 180.0 m (590 ft) in historical test well “Arkla #1 NMA” (Figure 7-1). Towards the basin margins the halite deposits intertongue with gypsum and anhydrite and eventually give way to siliciclastic-dominated “Corduroy” Member lithologies. Structurally, the salt-bearing strata remain relatively flat-lying and undeformed, with little evidence of dissolution and faulting. Seismic interpretation from 2011 suggests that faulting propagating from the underlying basement is present along the north easternmost edge of the basin.
During the Early Permian when east-central Arizona was characterized by an arid climate and vast dry coastal plains, the Holbrook Basin salt deposits are interpreted to have been laid down in restricted low-energy marine conditions (Rauzi S. L., 2000). During this time, the Holbrook Basin was a shallow isolated epeiric sea with prolonged periods of hypersaline sabkah-like conditions. These conditions occurred due to restricted brine communication between the basin waters and the ancient world ocean, in turn, over saturating the waters with salt (Rauzi S. L., 2000). These basinal conditions likely arose due to the presence of a naturally-restrictive geological barrier between the sea and the ancient ocean. This barrier inhibited brine mixing and resulted in the formation of extensive bedded evaporite sequences. The exact nature of this barrier is uncertain, but researchers interpret that its position may have been roughly coincident with the position of the present Mogollan Rim escarpment (Rauzi S. L., 2000).
| | |
| | | |
| | American West Potash, LLC Holbrook Basin Project
2011 Potash Resource Assessment
October 17, 2011 |
Five cycles of salt deposition within the Holbrook Basin are described by Carr (1966) below. As summarized by Rauzi (2000) “... each cycle starts with halitic mudstone and halite and ends with a fining upward sequence of siltstone and shale overlain by carbonate, which could represent flooding of the marginal and inner sabkha by marine water.” Carbonate laminites deposited during brine freshening events mark the start of each cycle. These deposits are interpreted to represent marine re-connection and flooding of the Basin during a rapid influx of sea water. As brine communication again became restricted, evaporation and brine concentration progressed until gypsum and halite precipitated. Continued evaporation of the basin waters resulted in sub-aerial exposure and the deposition of oxidized siliciclastics during desiccation of the basin and influx of terrestrial sediments (Carr, 1966).
Using this stratigraphic scheme, “Cycle 1” starts at the base of the “Big A Butte” Member, and ends with the deposition of the “Fort Apache” Member limestone which marks the start of “Cycle 2”. “Cycle 2” through “Cycle 5” subdivides the “Corduroy” Member, with a correlatable carbonate unit marking the start of each new cycle. “Cycle 5”, the uppermost cycle described by Carr (1966), is further subdivided into smaller-scale depositional events and is described in more detail in Section 7.2.
According to Rauzi (2000), nearly 1,000 km2 of salt within the northeastern and deepest parts of the Holbrook Basin are thought to host stratiform potash mineralization. The mineralization occurs as relatively thin continuous beds within the uppermost salt sequences of the last major brining-upward cycle (Carr, 1966). The “final cycle” salt beds are capped by several regionally-correlatable anhydrite marker beds which straddle the contact with the overlying Upper Supai Group redbed shales. These anhydrite markers serve as excellent stratigraphic indicators as the potash mineralization is observed to occur at relatively consistent and uniform depths below them, although the salt between them can vary in thickness to some degree.
Figure 7-2, Figure 7-3 and Figure 7-4 depict the thicknesses over the Project Area of the known “Cycle 5” potash mineralized portion of the Holbrook Salt Basin.
It is important to note when looking at the above mentioned figures that the Resource Calculated thicknesses may vary from those listed on the isopach maps due to conditions and requirements outlined in Section 14.0 for calculating Resource areas and volumes. Due to limited well control in certain portions of the Project Area the potash thicknesses have not been extrapolated beyond what was reviewed for the purposes of this report and in no way does North Rim confirm or deny the presence of potash beyond the maps extents or the limitations of the current well control.
| | |
| | | |
| | American West Potash, LLC Holbrook Basin Project
2011 Potash Resource Assessment
October 17, 2011 |
Figure 7-2: Isopach map of the Upper Potash Bed interval.
| | |
| | | |
| | American West Potash, LLC Holbrook Basin Project
2011 Potash Resource Assessment
October 17, 2011 |
Figure 7-3: Isopach map of the combined Medial and Lower Potash Bed intervals.
| | |
| | | |
| | American West Potash, LLC Holbrook Basin Project
2011 Potash Resource Assessment
October 17, 2011 |
Figure 7-4: Isopach map of the total gross potash interval (Upper to Lower Potash Beds).
Note: Interbedded salts have been included.
7.2LOCAL GEOLOGY AND MINERALIZATION
The subsurface stratigraphy of the Project Area was interpreted through examination of several datasets which included historical exploration records, seismic investigations, geophysical borehole logs, drill cuttings and cores. A simplified stratigraphic column of the Holbrook Basin within the Project Area is provided in Figure 7-5. For practical purposes, the geology of the Holbrook Basin within the Project Area can be broadly subdivided as follows into:
| | 1) | | A thick uppermost Triassic to Permian-aged shale-dominated clastic sequence of interbedded mudstones, siltstones, and minor sandstones. This sequence includes the Lower Triassic Chinle Formation and the underlying Permian Moenkopi Formation. Also considered to be included within this stratigraphic interval are the sands and silts of the Bidahochi Formation, which caps the entire sequence locally and forms surface exposures within the Puerco Ridge Area; |
| | 2) | | A relatively thick “upper-medial” sandstone unit with minor shaley interbeds termed the Permian Coconino Formation. This unit is ubiquitous across the Project Area and its upper contact with the overlying Moenkopi is easily identifiable on geophysical well logs. The Coconino Sandstone is characterized by highly porous, water saturated, cross bedded quartzose sandstone and exhibits good intergranular porosity and pore fluid communication. The Coconino Sandstone is the principal source of groundwater in much of northern Arizona (Montgomery 2003), and is considered a significant brackish to fresh-water aquifer. This unit is observed along surface exposures in the Holbrook Basin area to exhibit prominent regional fracturing (Lorenz & Cooper, 2001) and often is accountable for numerous drilling issues and circulation losses. |
| | 3) | | A “lower-medial” sequence of Pennsylvanian to Permian-aged Supai Group sediments comprised of a lowermost unit of clastic sands, silts, and muds which are separated from an uppermost “redbed” shale unit by a relatively thick package of cyclically-bedded evaporite-carbonate rocks. The evaporite beds are found at depths ranging from approximately 300 to 550 m (1000 to 1600 ft) in the Project Area. Potash mineralization is hosted within the uppermost salt beds of the evaporite unit; and |
| | 4) | | A basal sequence comprised of Devonian and Lower Pennsylvanian carbonate rocks. These include the limestones and sandstones of the Pennsylvanian Naco Formation and local remnant occurrences of Devonian Martin Formation dolostones. These rocks lie unconformably onto Precambrian basement rocks to the northeast (Rauzi S. L.,2000). |
| | |
| | | |
| | American West Potash, LLC Holbrook Basin Project
2011 Potash Resource Assessment
October 17, 2011 |
A simplified SW-NE geological section (Figure 7-6) modified from Peirce et al. (1966) provides a generalized summary of the spatial and stratigraphic relationships between these four subdivided units within the Project Area.
As mentioned in Section 7.1, the Supai Group sediments within the Holbrook Basin can be subdivided into five high order depositional cycles (Carr, 1966) with potash mineralization restricted to only the uppermost “Cycle 5” beds. “Cycle 5”, in turn, can be subdivided into several smaller-scale depositional sequences. These sequences are readily identifiable in drill core (Figure 7-7) and show up especially well on gamma-ray and neutron logs. Figure 7-7 shows the relationship between the upper evaporite stratigraphy of the “Cycle 5” beds of the Holbrook Basin and the wire line log response. It highlights the specific correlation of gamma-ray and neutron log signatures to multiple brining-upwards sequences and local potash mineralization. Potash mineralization is recognized as an abrupt increase in radioactivity on the gamma ray log curve due to the concentration of naturally radioactive potassium (K40) bound within the crystal lattice of various potash ore minerals (e.g. sylvite and carnallite).
The detailed “Cycle 5” stratigraphy within the Project Area is summarized in descending stratigraphic order as follows:
| | | |
Upper Supai Redbed Shale: | | Readily identified in drill cuttings by its distinct reddish-brown color and high shale content, the upper contact of the Supai Redbed Shale intercalates with the overlying Coconino Sandstone. Silty mudstone characterizes the upper portion of this Supai unit and grades downwards into mud-dominated laminated redbed lithologies where it contains multiple gypsum-anhydrite stringers and seams. Two relatively thick regionally correlatable “Marker Anhydrites” (“A” and “B”) occur near its base. In the Project Area the Upper Supai Redbed Shale is between 27.0 to 37.0 m (90.0 to 120.0 ft) in vertical thickness from top to the base of the Marker “B” anhydrite. |
| | | |
Marker “A” Anhydrite: | | The Marker “A” Anhydrite is the uppermost correlatable evaporite marker bed in the Project Area and occurs approximately 15.0 m (50.0 ft) below the top of the Supai Group. It is observed to pinch and swell across the Project Area, ranging in thickness from less than 1.5 m to more than 3.0 m (5.0 to ≥10.0 ft). Anhydrite beds are observed to occur above the Marker “A” Anhydrite, but their distribution is typically local and their use as a stratigraphic marker is limited. |
| | | |
Marker “B” Anhydrite: | | The Marker “B” Anhydrite is present in all potash test wells drilled in the Project Area to date. It is separated from the overlying Marker “A” Anhydrite by a sequence of redbed mudstones of variable thickness, ranging anywhere from 3.0 to 9.0 m (10.0 to 30.0 ft). The Marker “B” is actually a dual-bedded unit comprised of a thin (~ 0.6 m or 2 ft) upper anhydrite and a thick (~ 3.0 to 6.0 m) (10.0 to 20 ft) to lower anhydrite which are separated by a thin (~ 0.6 m or 2 ft) mud layer. This leads to a distinctive “double boxcar” gamma ray-neutron log response that serves as a good stratigraphic marker. The base of the Marker “B” Anhydrite directly overlies top of the uppermost Holbrook Salt beds. |
| | | |
“5-A” Salt: | | The “5-A” Salt is the uppermost preserved halite package in the Project Area and is comprised of multiple stacked brining-upwards (shallowing) sequences of halite and redbed mudstone. Each sequence is characterized by a clean, fine-grained basal halite (± anhydrite stringers) that grades upwards into a coarser, mudstone-rich salt that is capped by a thin redbed mudstone. The start of the subsequent overlying sequence is then marked by an abrupt transition to clean fine-grained halite, sometimes with a thin argillaceous gypsum band marking its base. Four sequences of similar composition comprise the “5-A” Salt within the Project Area. For simplicity, the uppermost sequence is deemed “5-A Salt 1” and the lowermost “5-A Salt 4”. Each sequence is 1.5 to 6.0 m (5.0 to 20.0 ft) thick, resulting in an average “5-A” Salt package thickness of 14.0 to 18.0 m (45.0 to 60.0 ft). Where post-depositional salt dissolution has occurred, the amount of material separating the Marker “B” and Marker “D” Anhydrites is reduced, in some cases to less than 4.5 m (15 ft). |
| | | |
| | | A relatively thin (~ 0.6 to 1.0 m) but correlative gypsum/anhydrite bed, deemed the Marker “C” Anhydrite, occurs within the third “5-A” Salt sequence. This marker is generally thin and difficult to identify on well logs, therefore Marker “C” Anhydrite is not considered a significant stratigraphic horizon. |
| | | |
Marker “D” Anhydrite: | | Anhydrite “D”, historically referred to as the “Puerco Anhydrite”, is present in all potash test wells located within the Project Area and marks the base of the “5-A” Salt Phase. It has historically been used as a stratigraphic datum as it is readily identified in drill core because of its thickness (~4.5 m or 15 ft) and characteristic mottled appearance. Its textural attributes are due to a network of coarse halite crystals entrained within its basal sulphate beds. |
| | | |
| | | The Marker “D” Anhydrite directly overlies the top of the “5-B” Salt Phase. |
| | | |
“5-B” Salt: | | The “5-B” Salt Phase is represented by six stacked brining-upwards sequences of halite and mud below the Marker “D” Anhydrite that have gamma-ray-neutron log signatures similar to the overlying “5-A” Salt Phase on account of their similar lithologies. Sequences range in thickness from 3.0 to 9.0 m (10.0 to 30.0 ft) each, yielding a total average package thickness of approximately 30.0 m (100 ft). The uppermost “5-B” Salt sequence is deemed “5-B Salt 1” and the lowermost sequence the “5-B Salt 6.” Within the Project Area, the “5-B Salt 6” sequence contains two to three thin argillaceous anhydrite beds, the lowermost of which denotes the base of the “5-B” Salt Phase. |
| | | |
| | | The “5-B” Salt is the primary targeted exploration horizon in the Holbrook Salt Basin. All of the potash mineralization within the Basin to date has been found within these beds. |
| | | |
“5-C” Salt: | | The “5-C” Salt is the basal salt unit of “Cycle 5.” Similar to the “5-A” and “5-B” Salt Phases, the “5-C” Salt Phase is comprised of seven or eight stacked brining-upwards sequences of salt and mud that can be differentiated from the overlying “5-B” Salt Phase by their reduced neutron log response (i.e. increased mud content). Only the upper two sequences of the “5-C” Salt Phase (“5-C Salt 1” and “5-C Salt 2”) were penetrated in a few of the 2011 potash test wells and where cored they were not observed to contain potash mineralization. The entire “5-C” Salt Phase is estimated at 40.0 to 43.0 m (130.0 to 140.0 ft) thick. |
| | | |
| | | The base of the “5-C” Salt terminates with a basal carbonate bed marking the base of “Cycle 5.” |
| | | |
| | American West Potash, LLC Holbrook Basin Project
2011 Potash Resource Assessment
October 17, 2011 |
Figure 7-5: Simplified stratigraphic column of the Holbrook Basin.
Page 36 of 100
| | | |
| | American West Potash, LLC Holbrook Basin Project
2011 Potash Resource Assessment
October 17, 2011 |
Figure 7-6: Simplified cross section through the Holbrook Basin.
Page 37 of 100
| | | |
| | American West Potash, LLC Holbrook Basin Project
2011 Potash Resource Assessment
October 17, 2011 |
Figure 7-7: Type section of KG-06 correlating geophysical log signatures with core photography in
“Cycle 5” beds
(Note: “5-B” Sequence 3 continues below 1480’, but appears truncated as it is simply correlated to the photographs).
Page 38 of 100
| | | |
| | American West Potash, LLC Holbrook Basin Project
2011 Potash Resource Assessment
October 17, 2011 |
Although historically potash minerals have been identified within each of the six “5-B” sequences (Carr, 1966), only the “5-B Salt 2” sequence exhibits laterally continuous potash beds with thicknesses and grades of economic potential. The “5-B Salt 2” sequence is actually a dual-bedded unit that is separated into upper and lower halite beds by a regionally correlatable 0.5 to 1.0 m (2.0 to 3.0 feet) thick insoluble-bearing salt marker band (Figure 7-7) that occurs 6.0 to 7.0 m (20.0 to 22.0 feet) below the top of the “5-B Salt 2” sequence. The “5-B Salt 2” sequence is essentially comprised of two brining-upwards sub-sequences:
| | 1) | | A lower incomplete sub-sequence grading upwards from ‘clean’ pink halite into brown clay-rich halite; and |
| |
| | 2) | | An upper complete sub-sequence grading upwards from a ‘clean’ pink to beige gypsum-bearing halite into brown clay-rich halite capped by a thick reddish-brown mudstone bed. |
Regardless of whether or not the unit is barren or mineralized, the “5-B Salt 2” sequence exhibits a relatively uniform average bed thickness of 8.0 m (26.0 ft) and retains both upper and lower sub-sequences.
Potash mineralization may occur in up to three horizons within the “5-B Salt 2” sequence. For the purposes of correlation and the determination of lateral continuity, North Rim has determined the stratigraphic limits and assigned names to each of the potash-bearing horizons. They are, in descending stratigraphic order (as defined by the Resource cut-offs discussed in Section 14.0) the “Upper”, “Medial” and “Lower” Potash Beds as shown in Figure 7-8. A summary of each is provided as follows:
| | | |
“Upper” Potash Bed: | | The uppermost potash-bearing horizon, was encountered in most of the mineralized 2011 potash test wells, with the exception of KG-08, KG-12, KG-13 and KG-14. Where present, it occurs within the thick (~ 4.5 m or 15 ft) halitic, redbed mudstone cap that marks the top of the “5-B Salt 2” sequence. Its potash is characterized by weakly carnallitic sylvinite mineralization with a high insoluble grade averaging approximately 12.0 to 18.0% . K2O values for this horizon vary widely from 2.68 to 31.95% K2O (4.24 to 50.57% KCl) with the highest concentration of potash typically occurring within the lowermost beds of the mudstone cap. This mineralized horizon is generally very thin, averaging ~ 0.5 to 1.0 m (1.64 3.28 ft) across the Project Area. |
Page 39 of 100
| | | |
| | American West Potash, LLC Holbrook Basin Project
2011 Potash Resource Assessment
October 17, 2011 |
| | | |
“Medial” Potash Bed: | | The medial and lowermost potash-bearing horizons constitute the “Lower Potash Resource” which exhibits the most laterally continuous mineralization identified on the Project Area to date. It tends to be closely associated with the insoluble-bearing salt band that subdivides the “5-B Salt 2” sequence. The mineralization occurs immediately above or below this marker, and in some cases is observed to straddle it; however, mineralization may also extend well away from this marker such that it is essentially contiguous with the “Upper” Potash Bed, as found in KG-04. Average mineralized bed thickness is approximately 2.0 m (6.5 ft) and is typically dominated by sylvite with a low average insoluble grade of ≤1.0 to 3.0% . It is locally found to be weakly carnallitic. K2O values for the “Medial” Potash Bed average 10.0% (15.83% KCl), making it the primary target for future exploration. |
| | | |
“Lower” Potash Bed: | | The lowermost potash-bearing horizon is intermittent in occurrence across the Project Area and where present is found as a relatively thin bed within the basal salt of the “5-B Salt 2” sequence. It occurs immediately above the redbed mudstone cap that marks the top of the “5-B Salt 3” sequence, although in places it is observed to persist into the uppermost foot or so of this mudstone bed. The “Lower” mineralized horizon may be separated from the “Medial” horizon by an interval of barren halite (as in KG-01 for example) but most often is found to be relatively contiguous with and only differentiated from the “Medial” Potash Bed by a thin bed of lower-grade mineralization. |
For the purposes of calculating the potash Mineral Resource (as defined by the Resource cut-offs discussed in Section 14.0), the three horizons have been grouped into two separate units deemed the “Upper” and “Lower Potash Resources” as shown inTable 7-1. The “Upper” potash horizon comprises the “KR-1” Resource. The “Lower” and “Medial” horizons have been combined to form the “KR-2” Potash Resource, as the “Lower” potash horizon is often thin and only intermittent in occurrence across the Project Area.
Table 7-1: Summary of Potash Mineralization
| | | | | |
| Potash Mineralized Horizon | | Potash Resource |
| “Upper Potash Bed” | | “KR-1” |
| “Medial Potash Bed” | | “KR-2” |
| “Lower Potash Bed” | | | | “KR-2” |
Page 40 of 100
| | | |
| | American West Potash, LLC Holbrook Basin Project
2011 Potash Resource Assessment
October 17, 2011 |
Figure 7-8: Type section of drill hole KG-04 including the potash and resource intervals.
Page 41 of 100
| | | |
| | American West Potash, LLC Holbrook Basin Project
2011 Potash Resource Assessment
October 17, 2011 |
7.3STRUCTURAL GEOLOGY AND GEOLOGICAL CROSS SECTIONS
Several geological cross-sections were generated to provide a solid geological framework of AWP’s land base. A representative southwest-northeast (A — A’) geological section across the Project Area is shown in Appendix B and incorporates each of the 2011 potash test wells. This section correlates each of the “5-B” Salt sequences and the interpreted distribution of known potash mineralization across the Project Area. As shown, the thicknesses of the “5-B” Salt sequences remain relatively consistent within both mineralized and non-mineralized wells alike. The reduction or absence of potash mineralization suggests an area of non-deposition of penecontemporaneous potash mineralization rather than post-depositional erosion of pre-existing mineralized strata. An alternative mechanism of potash removal, pertaining in particular to the complete absence of potash in KG-10, may be argued where sylvite is replaced by halite during post-depositional “leaching.” These types of post-depositional anomalies which affect potash basins are described further in Section 7.4. Further studies and additional coring will be required to assess the validity of these arguments in the Project Area.
Potash mineralization within the Project Area may be favorably distributed in small potash sub-basins within the larger Holbrook Salt Pan. These sub-basins often exhibit minor topographic relief, allowing for a natural host for potash and salt accumulation during periods of sea water influx. Variable influxes of potassium rich brines could have also occurred during periods when the salt basin was a closed system. Seawater could have percolated through the lower Naco and Martin carbonate Formations, reacting with the rocks until it entered the basin as groundwater (Williams-Stroud, 1994).
7.4DISTURBANCES AFFECTING GEOLOGY OF THE POTASH-BEARING MEMBERS
A disturbance that affects the normal characteristics of a potash-bearing salt horizon is considered to be an “anomaly” and thereby represents an area which is generally not suitable for mining. Salt anomalies can substantially reduce the thickness and grade of the potash mineralized zone resulting in ore of undesirable composition being fed into the mill. Salt anomalies also can indicate proximity to collapse structures (Warren, 2006) which, if water-bearing, may be disastrous to a potash mine.
The identification and delineation of deleterious anomalies must be taken into consideration during the exploration, mine planning and development phases of any potash project. Geological anomalies are known to affect potash beds of similar age in New Mexico’s potash mines (Warren, 2006). To date evidence from the 2011 2D seismic and exploration drilling programs suggest the absence of any significantly extensive evaporite removal features within the immediate Project Area; however, this is not to say that geological anomalies outside of the resolution of the available datasets may not exist. The results of the 2D seismic survey are discussed in Boyd’s 2011 Holbrook 2D Seismic Interpretation Report found in Appendix A. Refer to Figure 7-9.
Page 42 of 100
| | | |
| | American West Potash, LLC Holbrook Basin Project
2011 Potash Resource Assessment
October 17, 2011 |
A “Leach anomaly” describes a post-depositional situation where the sylvinite bed has been replaced by a halite mass through introduction of diagenetic sodium-saturated brine. Such anomalies are colloquially referred to as “salt horses”, a corruption of the term “salt horst” by miners. Leach anomalies up to 100 meters in width and 200 m (656 ft) in length are well documented in New Mexico’s potash mines (Warren, 2006). The anomalies are believed to be associated with an underlying permeable carbonate unit which provides a source for deep circulating meteoric fluids to migrate up into the overlying potash-bearing strata (Warren, 2006). The potash beds within leach anomalies are often thinner than their unaltered equivalents (Warren 2006), although stratigraphic boundaries are commonly preserved (Halabura & Hardy, 2007). Several indicators of proximity to this type of anomaly exist at the mining scale as described by Warren (2006) and include: a transition in clay color to mottled brown, patches of sylvite-poor potash crosscutting the stratigraphy, and significant drops in marker seam topography. Unusually high grade zones encountered while mining may also serve as an indicator of proximity to a leach anomaly. These zones occur where replacement of sylvite to halite takes place at the locus of fluid entry and is subsequently mobilized to and precipitated at the anomaly perimeter. This, in essence, forms a high grade ore halo or shell surrounding the barren halite pod (Warren, 2006). Miners commonly refer to these enriched zones as “sweet spots.” The absence of potash in KG-10 may be the result of a leach anomaly.
Active dissolution of salt and subsequent karsting and collapsing is documented along the southwestern up-dip edge of the Holbrook Basin. Here a linear active dissolution front (Figure 5-2) responsible for the so called “Holbrook Anticline” has thinned the subsurface halite deposits and resulted in collapse of the overlying stratigraphic pile (Lorenz & Cooper, 2001). The salt removal is expressed by more than 300 sinkholes, fissures and topographic depressions with up to 100.0 m in relief (Neal, 1995). The responsible dissolution mechanism is likely gravity driven meteoric waters originating near the Mogollan Rim percolating along the dip through the subsurface to interact with the Supai Group evaporites. This area of dissolution is safely located approximately 50 to 60 km (31 to 37 miles) to the northeast of the potash-bearing portion of the basin.
Page 43 of 100
| | | |
| | American West Potash, LLC Holbrook Basin Project
2011 Potash Resource Assessment
October 17, 2011 |
Figure 7-9: Anomalies affecting Potash- bearing horizons.
Page 44 of 100
| | | |
| | American West Potash, LLC Holbrook Basin Project
2011 Potash Resource Assessment
October 17, 2011 |
Anomalies pose potential hazards for conventional underground potash mines and have varying impacts on mining operations. An important aspect of estimating the potash potential of an area is to identify portions of the ground that may contain disturbances which affect the potash-bearing strata. Generally, a combination of surface reflection seismic studies, both 2D and 3D, and careful examination of surface drill holes, underground (“in-seam”) geophysics, and geological observations of mining rooms is sufficient to identify potentially anomalous ground. If a drill hole penetrates a disturbance, it may offer a vertical profile of an anomaly, but will not provide any information as to its lateral extent. Reflection seismic surveys offer the possibility of mapping the lateral extent of such anomalies. Seismic may not necessarily define the lateral extent of more subtle anomalies such as washout or leach anomalies.
Within the Project Area, interpretation of the 2D seismic data did not highlight any significantly extensive anomalous features on AWP’s land holdings which may hinder future development efforts. The interpretations are only based on the datasets available at the time of writing this report and further investigations should be pursued.
Seismic interpretations are provided by RPS Boyd Petroseach of Calgary, Alberta and are presented in Appendix A.
7.5CARLSBAD POTASH MINE, NEW MEXICO: AN ANALOG
Intrepid Potash’s Carlsbad Mine produces potassium chloride, langbeinite and sodium chloride at depths between 245 to 450 m (800 to 1500 ft) below ground surface (Mine Site Locations: Intrepid Potash Website, 2010). Intrepid Potash utilizes continuous mining methods mining grades as low as 8.0% K2O (12.66% KCl) (personal communication Tetra Tech, 2011). The continuous mining machines have been modified to target a minimum mineralized interval of 40 inches, but cut a minimum of 52 inches of potash due to head room requirements (Cox, 1965). Carlsbad has developed mining patterns that allow them to extract up to 80.0% of the ore (Hustrulid & Bullock, 2001).
Page 45 of 100
| | | |
| | American West Potash, LLC Holbrook Basin Project
2011 Potash Resource Assessment
October 17, 2011 |
8.0 DEPOSIT TYPE
The word “potash” is a contraction of the term “muriate of potash” which is widely applied to naturally occurring potassium-bearing salts and their manufactured products and is often expressed by the chemical formula “KCl” (“potassium chloride”). While several salt species are classified as potash minerals, sylvite (“KCl”) is the natural form of the principal ore mineral. Typical potash ore dominated by sylvite is therefore called “sylvinite.” One tonne of chemically pure “KCl” contains an equivalent of 0.63 tonnes of “K2O” (potassium oxide), which permits comparison of the nutrient levels in various forms of potash. Specifying “K2O” is a common way to indicate the amount of potassium in ore, or fertilizer. Potash has historically been used in the manufacturing of many industrial and commercial materials including soaps, glass, and textiles. The most common use for potash, however, is as a primary ingredient in the production of crop fertilizers.
Potash deposits are a type of industrial mineral deposit that occurs primarily within sequences of salt-bearing evaporite sediments. Evaporite bodies are usually laterally extensive, layered and tabular in shape, although they can be structurally deformed and folded to varying degrees syn/post burial. As they share a common formative genesis, potash mineral accumulations are hosted within the bedded halite layers of these evaporitic sequences, and are typically confined to relatively narrow stratiform intervals within the depositional sequence. Most of the world’s salt and potash resources are extracted from these types of deposits with the majority of Canadian deposits employing conventional mining methods (Warren, 2006). In situations where the deposit cannot be conventionally mined due to depth, solution mining may be employed. Solution mining is done by injecting sodium brine into the deposit to favorably dissolve only the potash minerals. The potash is recovered and crystallized into potassium salts from the potash-bearing liquor at surface. Potassium salts may also be directly crystallized through brine pumping and solar evaporation as is done by various companies along the southern end of the Dead Sea (Warren, 2006). The immense size of many worldwide potash deposits means that a potash processing facility may exploit a single deposit for decades.
The extreme solubility of potash salts results in their formation in only highly restricted settings, precipitating towards the end of the carbonate-evaporite depositional series (Warren, 2006). Potash salts are precipitated from saturated potassic brines as chemical sediments deposited at, or very near the depositional surface as the basin approaches desiccation. Their geologic provenance therefore dictates that, excluding deformation, erosion, and other post-depositional destructive processes, nearly all potash deposits will exhibit some degree of lateral continuity. Potash grade, however, may vary greatly between deposits. As described by Warren (2006), two controls (or combination of) determining potash grade are currently proposed:
Page 46 of 100
| | | |
| | American West Potash, LLC Holbrook Basin Project
2011 Potash Resource Assessment
October 17, 2011 |
| | 1) | | Sylvite and carnallite are precipitated from solution at or within a few meters of the depositional surface by the actions of brine reflux and brine cooling. Potash grade and mineralogical character are directly related to and controlled by original brine chemistry as well as the geological mechanisms affecting the deposit at the time of deposition; or |
| |
| | 2) | | As the absence of primary sylvite in modern day analogues suggests, potash grade is controlled by the post-depositional alteration and replacement of primary carnallite-bearing sediments to sylvite. The character of the deposit continually evolves while it is in contact with diagenetic fluids. |
The author proposes that potash deposits can be of either “simple” or “complex” mineralogical character. For the purposes of this report, a “simple” potash is considered to be any deposit characterized by “sylvinite” dominated ore with variable concentrations of impurities including halite, carnallite (KMgCl3•6H2O), and insolubles. The potash deposits underlying the plains of Saskatchewan, Canada can also be considered a mineralogically “simple” potash deposit. Deposits with ores bearing mixtures of various bittern potash salts and other exotic contaminant species are considered to be of a “complex” nature. The potash deposits mined at Carlsbad, New Mexico contain sylvite dominated ores with minor langbeinite (2MgSO4•K2SO4), polyhalite (2CaSO4•MgSO4•K2SO4•2H2O) and variable proportions of insoluble contaminants, and can therefore be considered an example of a “complex” deposit. Table 8-1 from Warren (2006) provides a summary of the various potash minerals and ores.
Page 47 of 100
| | | |
| | American West Potash, LLC Holbrook Basin Project
2011 Potash Resource Assessment
October 17, 2011 |
Table 8-1: Summary of potassium salts.
| | | | | | | |
| Mineral | | Composition | | K2O % | | Comments |
Chlorides | | | | | | |
| Sylvite | | KCI | | 63.2 | | Principal ore mineral |
| Carnallite | | MgCl2.KCl.6H2O | | 16.9 | | Ore mineral and contaminant |
| Kainite | | 4MgSO4.4KCl.11H2O | | 19.3 | | Important ore mineral |
| |
Sulphates | | | | | | |
| Polyhalite | | 2CaSO4.MgSO4.K2SO4.2H2O | | 15.6 | | Ore contaminant |
| Langbeinite | | 2MgSO4.K2SO4 | | 22.7 | | Important ore mineral |
| Leonite | | MgSO4.K2SO4.4H2O | | 25.7 | | Ore contaminant |
| Schoenite (picromerite) | | MgSO4.K2SO4.6H2O | | 23.4 | | Accessory |
| Glaserite (aphthitalite) | | K2SO4.(Na,K)SO4 | | 42.5 | | Accessory |
| Syngenite | | CaSO4. K2SO4. H2O | | 28.7 | | Accessory |
| |
Associated minerals | | | | | | |
| Halite | | NaCl | | 0 | | Principal ore contaminant |
| Anhydrite | | CaSO4 | | 0 | | Common ore contaminant |
| Bischofite | | 2MgCI2.12H2O | | 0 | | Accessory contaminant |
| Bloedite (astrakanite) | | Na2SO4.MgSO4.2H2O | | 0 | | Accessory |
| Loewite | | 2MgSO4.2Na2SO4.5H2O | | 0 | | Accessory |
| Vanthoffite | | MgSO4.3Na2SO4 | | 0 | | Accessory |
| Kieserite | | MgSO4.H2O | | 0 | | Common ore contaminant |
| Hexahydrite | | MgSO4.6H2O | | 0 | | Accessory |
| Epsomite | | MgSO4.7H2O | | 0 | | Accessory |
| |
Ores | | | | | | |
| Sylvinite | | KCI+NaCI | | 10-35 | | Canada, USA, Russia, Brazil, Congo, Thailand |
| Hartsalz | | KCl + NaCl + CaSO4 + (MgSO4.H2O) | | 10-20 | | Germany |
| Carnallitite | | MgCl2.KCl.6H2O + NaCl | | 10-16 | | Germany, Spain, Thailand |
| Langbeinitite | | 2MgSO4.K2SO4 + NaCI | | 7-12 | | USA, Russia |
| Mischsalz | | Hartsalz + Carnallite | | 8-20 | | Germany |
| Kainitite | | 4MgSO4.4KCI.11H2O+NaCI | | 13-18 | | Italy |
The potash deposits underlying AWP’s Holbrook Basin Project, particularly the mineralized “Medial” bed, appear to express a fair degree of lateral continuity across the Project Area. The lateral persistence of this bed, in combination with relatively shallow burial depths, supports the possibility of extraction by means of conventional underground mining operations similar to Intrepid Potash Inc.’s potash operation near Carlsbad, New Mexico. The recently acquired exploration data also indicates that the Holbrook Basin potash is characterized by a relatively “simple” deposit mineralogy dominated by sylvinitic ore. The
Page 48 of 100
| | | |
| | American West Potash, LLC Holbrook Basin Project
2011 Potash Resource Assessment
October 17, 2011 |
typical potash interval from the Project Area can be described as a mixture of coarsely crystalline, interlocking, subhedral to euhedral sylvite and halite, with minor interstitial disseminations and stringers of clay and gypsum. Sylvite is typically rimmed by red hematitic clays and in some instances carnallite. Carnallite, however, is not ubiquitous in occurrence and does not appear to be stratigraphically controlled or patterned in distribution.
It should be noted that the presence of magnesium (“Mg”) is typically unfavorable in current technology flotation potash plants as concentrations over 0.25% Mg may decrease the efficiency of the plant as additional processing may be required. In Saskatchewan current processing plants technology can handle up to 0.51% Mg, or 5.84% carnallite (2.0% MgCl2), in the mill feed. The presence of carnallite is unfavorable in conventional underground mine workings as it may present stability issues due to the mineral’s affinity for moisture and natural deliquescent nature and lower compressive strength. Conventional underground mines will avoid areas that have higher than 8.0 to 10.0% carnallite (3.43% MgCl2) due to mining instability issues.
Chemical assay records report the Mg concentration as weight percent (“wt. %”) magnesium oxide (“MgO”). “Carnallite” is a calculated equivalent value based on the present MgO content rather than a direct laboratory chemical analysis. As the amount of soluble Mg present in a “simple” potash sample is directly attributed to its original mineralogical character (i.e. carnallite concentration) the equivalent carnallite content can be calculated by multiplying the MgO values by a stoichiometric factor of 6.8943; likewise, the equivalent magnesium chloride (“MgCl2”) content can be described as 2.3623 times the MgO content. Throughout this report the magnesium content is reported both as equivalent carnallite (KMgCl3•6H2O) and equivalent magnesium chloride (MgCl2). Table 8-2 below outlines the stoichiometric, chemical equivalencies and calculations used in the resource calculations.
Table 8-2: Stoichiometric and chemical equivalencies and calculations.
| | | | | | | | | | | | | | | | | |
| Mineral | | KCl MgCl2 x 6H2O | | Mg | | MgCl2 | | MgO |
Formula Weight | | | 277.8688 | | | | 24.3050 | | | | 95.2110 | | | | 40.3040 | |
2x Formula Weight | | | 555.7376 | | | | | | | | | | | | | |
KCl MgCl2x 6H2O | | | | | | | 0.0875 | | | | 0.3426 | | | | 0.1450 | |
Mg | | | 11.4326 | | | | | | | | 3.9173 | | | | 1.6583 | |
MgCl2 | | | 2.9185 | | | | 0.2553 | | | | | | | | 0.4233 | |
MgO | | | 6.8943 | | | | 0.6030 | | | | 2.3623 | | | | | |
MgO x 6.8943à KClMgCl2 •6H2O
|
MgO x 2.3623à MgCl2
|
MgCl2x 2.9185à KClMgCl2•6H2O
|
Page 49 of 100
| | | |
| | American West Potash, LLC Holbrook Basin Project
2011 Potash Resource Assessment
October 17, 2011 |
9.0EXPLORATION
AWP has not conducted any previous potash exploration on the property prior to the 2011 program. The seismic program and subsequent 2011 drilling program are part of AWP’s exploration strategy to identify sufficient accumulations of potash to support a potential mining operation. The exploration activities were initiated in 2010 following the assessment of the available historical data and subsequent internal report generated by North Rim for AWP (Stirrett T. A., 2010). The intent of the internal report was to provide AWP with an evaluation of the historical data as well as to provide guidance in developing a 2D seismic program and subsequent exploration drilling program. Figure 9.1 summarizes the Exploration Program for 2011, including the drilling program which will be discussed in further detail in Section 10.1.
9.1SEISMIC PROGRAM
A 2D seismic program data acquisition was conducted in 2011 by Zonge International of Tucson, Arizona from February 22 to April 2, 2011. The survey was planned to ensure coverage over the core portion of the Project Area and Figure 9-1 shows the location of the seismic lines. The program was designed as a tool for regional evaluation of geological structures including faults and possible salt dissolution features to determine the potential for laterally continuous potash. The program was also designed to aid in the placement of the drill holes to optimize the area to be utilized in the Resource calculation. The seismic data was tied to the sonic logs from the following historical wells; 1-4 and 1-68 and all new wells drilled in 2011 were positioned as close to, or on, the seismic lines.
RPS Boyd PetroSearch of Calgary, Alberta, Canada, was contracted by AWP to interpret the results of the 2011 2D seismic survey. North Rim, in conjunction with Boyd, reviewed the seismic interpretation to ensure that the drill holes were placed in locations to avoid potentially anomalous ground.
Table 9-1: Summary of 2011 Exploration Program.
| | | | | | | | | |
| | | | | Completion | | | | |
| Exploration Program | | Start Date | | Date | | Area / Holes | | Drilled |
| Phase 1 — 2D Seismic Survey | | February 2011 | | April, 2011 | | 50.8 miles (81.7 km) | | N/A |
| Phase 1 — 2D Interpretation | | May 2011 | | September 2011 | | N/A | | N/A |
| Drilling Program | | June 2011 | | September 2011 | | 12 holes | | 18,700 ft (5,700 m) |
| Phase 2 — 2D Seismic Survey | | June 2011 | | September 2011 | | 23.8 m (38.3 km) | | N/A |
Page 50 of 100
| | | |
| | American West Potash, LLC Holbrook Basin Project
2011 Potash Resource Assessment
October 17, 2011 |
Figure 9-1: Location of the 2011 Seismic Lines.
Page 51 of 100
| | | |
| | American West Potash, LLC Holbrook Basin Project
2011 Potash Resource Assessment
October 17, 2011 |
The following discussion is taken from Boyd PetroSearch’s report entitled, “American West Potash Corp. 2011 Holbrook 2D Final Depth Interpretation”. Based on the integrated work completed to date, the following conclusions are derived:
| • | | The seismic data is accurately correlated to the geologic formations. The new drilling, with modern geophysical logs, has provided synthetic seismograms from which the zone of interest can be identified. The additional well ties allow seismic events to be followed laterally with confidence. |
| |
| • | | The seismic time structure of the Supai Formation correlates well to the elevations determined from boreholes. As a result, the elevation of the Supai can be confidently predicted from the seismic data in areas away from the wells. The elevation of the potash zones could be derived from the Supai, but will be limited by the consistency of the geology. This will allow further exploration programs to be developed more accurately in terms of well placement and depth to the potash bearing formations. |
| |
| • | | Information provided from the 2D seismic data set allows for the determination of the overall basin configuration. The isochrons of the Upper Supai show a thin edge conforming to previously published work (Rauzi S. L., 2008) for the basin (Figure 9-2). Additional seismic coverage in the area near the basin edge will allow for better definition of this boundary. |
| |
| • | | Lateral continuity of the geologic strata is confirmed over most of the project area. No areas of large scale salt dissolution and/or removal, nor any other features indicative of erosion or channelling which might remove the formations, have been identified in the data. Minor features are present, but are easily avoided by evaluating the seismic dataset prior to positioning new drill locations. |
| |
| • | | No faulting of the Upper Supai strata has been identified, apart from the small areas with limited extent over the small scale dissolution features discussed in the report. Deep faulting is evident, but does not impact the upper strata, except to provide post depositional uplift in some cases. |
| |
| • | | Based on current well information, directly correlating seismic isochron maps to potash isopachs does not provide a reliable quantitative relationship. However, the isochron maps are useful in a qualitative sense, to confirm lateral continuity of formations away from the well ties, but lack predictive accuracy of potash thickness. |
| |
| • | | Shown in Figure 9-2 is the seismic isochron (in milliseconds) for the Upper Supai Group strata; from the “Marker 1” horizon (interpreted as the manifestation of the basal “Cycle 5” carbonate marker) to the top of the Upper Supai Redbed Shale. An apparent relationship is observed to exist between the thickness of this isochron and the presence of potash mineralization, perhaps suggesting that the paleotopography of the basin floor is a major controlling factor on potash distribution. More investigation is necessary to explain this relationship better. |
Page 52 of 100
| | | |
| | American West Potash, LLC Holbrook Basin Project
2011 Potash Resource Assessment
October 17, 2011 |
Figure 9-2: Supai to Marker 1 Isochron Map
Page 53 of 100
| | | |
| | American West Potash, LLC Holbrook Basin Project
2011 Potash Resource Assessment
October 17, 2011 |
10.0 DRILLING
10.12011 DRILLING PROGRAM
Twelve stratigraphic test holes were drilled on the Project Area between May and September 2011. Stewart Brothers Drilling Company (completed ten wells) and Sunbelt Drilling (completed two wells) were contracted by AWP to provide the drilling services, while North Rim conducted the supervision of all twelve drill holes. A photograph of the drilling equipment is shown in Figure 10-1.
The drill holes were designed to further evaluate the potash mineral potential of the Supai Formation on the Project Area and were spaced with consideration to specific Mineral Resource buffers and proximity to historical wells. All holes completed during the 2011 drilling program were vertical and targeted the Supai Formation. Cores were collected through the potash-bearing zones for all holes with the exception of KG-08, due to discrepancies in the interpretation of the anhydrite markers in the Project Area.
The objective of the drilling program was to define, within the Project Area, a geological dataset suitable for the development of a robust Mineral Resource estimation. Drill hole locations were selected based on the following parameters:
| | • | | The presence of laterally continuous potash-bearing strata (avoiding anomalous ground); |
| |
| | • | | Positive results arising from RPS Boyd PetroSearch’s seismic interpretation and recommendations; |
| |
| | • | | A strategic plan incorporating the future acquisition of lands to the north of the Project Area; and |
| |
| | • | | The availability of historical drill hole data suitable for the documentation of an NI 43-101-compliant potash Mineral Resource. |
Page 54 of 100
| | | |
| | American West Potash, LLC Holbrook Basin Project
2011 Potash Resource Assessment
October 17, 2011 |
Figure 10-1: Sunbelt Drilling Rig (left) and Stewart Brothers Drilling’s Rig (right).
10.2DRILLING PROCEDURES
Drilling proved to be more difficult than expected due to unfavourable geological conditions. Loss of circulation zones were prevalent throughout the Coconino Sandstone Formation; it is speculated that these problems arise from a highly fractured Coconino Formation in which large, vertical fractures have formed over geological events. These vertical fractures were difficult to heal and resulted in the required use of aerated mud. In addition to the loss of circulation, the top of the hole in the Moen Kopi had stability issues which could not be maintained with aerated drilling fluids. Therefore, 9.625” casing was required above the Coconino to maintain borehole integrity and enable the use of aerated drilling fluid.
To ensure the KCl brine, which was used to core the potash interval, was not contaminated with fresh water and to protect the fresh water aquifer, a temporary 7“intermediate casing string was installed prior to coring. The casing isolated the Coconino Formation and the fresh water from the potash bearing zone so no washing or dissolution occurred during coring.
Page 55 of 100
| | | |
| | American West Potash, LLC Holbrook Basin Project
2011 Potash Resource Assessment
October 17, 2011 |
The following drilling procedures were followed for all drill holes completed in 2011:
| | • | | Drilled with a 12.25” bit diameter and freshwater gel chemical drilling mud to an approximate depth of ~ 215.0 m (~ 700.0 ft), where a 9.625” Intermediate #1 casing string was set, to stabilize the top of the borehole so aerated drilling fluid could be used without running the risk of shallow borehole instability; |
| |
| | • | | Cemented 9.625” Intermediate #1 casing; |
| |
| | • | | Drilled a 8.75” diameter borehole with aerated freshwater drilling fluid from Intermediate #1 casing to core point, which was located approximately 6.0 to 18.0 m (20.0 to 60 ft) above the top of the potash bearing interval located in the Supai Formation; |
| |
| | • | | 3” diameter core barrels were made up and 6.0 and 12.0 m (20.0 and 40.0 ft) cores were drilled and recovered; the length of core was dependent on the capability of the drill rig being used. Cores were taken beginning from the various anhydrite marker beds which varied across the Project Area (typically Anhydrite B or D markers) and continued down through the potash horizon until no visible sylvite was present at the base of the cored interval. During the coring operation, brine fluid was used to inhibit dissolution of the potash zone. Chloride levels between at least 200,000-300,000 ppm NaCl and KCl combined were required for coring to commence; |
| |
| | • | | Southwest Exploration Services (Southwest) was contracted by AWP to a run a suite of geophysical wireline tools (Table 10-1) in each drill hole. The open hole (before the casing string was set) section was logged using the wireline program recommended by North Rim. Southwest also logged the cored interval before abandonment commenced. Cement plugs were set after the logging was complete, as per the abandonment regulations. |
10.3CORE RETRIEVAL
Coring was completed by Stewart Brothers Drilling and Sunbelt Drilling with all core retrievals, except the lowest section of KG-01, was supervised and performed by North Rim personnel. A routine set of procedures were strictly followed by onsite personnel to ensure the integrity of the Supai Formation and potash interval, as well as to prevent the loss of materials. In addition to the drill rig personnel, at least one North Rim employee supervised every core recovery, except KG-01, for the 2011 drill holes (Figure 10-2).
Page 56 of 100
| | | |
| | American West Potash, LLC Holbrook Basin Project
2011 Potash Resource Assessment
October 17, 2011 |
The following is the core handling protocol and procedures as developed by North Rim:
| | 1) | | A safety meeting was held prior to the recovery of each core. During the meeting, all safety issues were discussed along with proper core handling procedures. |
| |
| | 2) | | The core supervisor was present at the drill site while the core was being recovered from the barrel. The North Rim Core Supervisor oversaw the core retrieval on the floor and ensured that the rig crew understood the importance of the process and what each person’s responsibility was. |
| |
| | 3) | | A core brake was bolted to the core barrel, which allowed precise control of the core as it was let out of the barrel. The drill rig tool push was in charge of the core brake at all times. The tool push would let the core out of the barrel in pieces (~0.5 m (1.64 ft) sections) and the derrick hand would break the piece gently in order to fit it in the core boxes. Due to the natural breaks common in the cored intervals, often the core would not require breaking. The core pieces were passed to the North Rim Core Supervisor after the bottoms were marked with grease crayons to eliminate confusion when boxing. |
| |
| | 4) | | With a clearly marked core bottom, the core was wiped clean and placed into the box by the North Rim Core Supervisor. This process was repeated until all core was recovered from the barrel. |
| |
| | 5) | | At the end of each core, a core chaser was run through the barrel to ensure no core was remaining inside it. The core boxes were then laid out in stratigraphic order and examined by the North Rim Core Supervisor for potash or any sign of pitting or loss of core integrity. The core was measured to determine the recovery factor of the interval. |
| |
| | 6) | | The core boxes were clearly labelled with the location, well name and the interval cut. |
| |
| | 7) | | After the core was boxed, it was carried to the vehicle for transportation to the core laboratory. All core was kept out of the rain to avoid pitting. |
Page 57 of 100
| | | |
| | American West Potash, LLC Holbrook Basin Project
2011 Potash Resource Assessment
October 17, 2011 |
Figure 10-2: Stewart Brothers Drilling performing core recovery with North Rim Core Supervisor.
10.4GEOPHYSICAL WIRELINE PROGRAM
Each drill hole was logged with geophysical wireline tools from total depth (TD) to surface casing by Southwest Exploration Services. The wireline logs provided geophysical information that was used to cross-reference lithology, mineralogy, and geochemical assay data and were referenced while completing the detailed core descriptions and depth corrections. The 2011 wireline program is summarized in Table 10-1. The tools ran throughout the twelve exploration holes was consistent, but occasionally the suite had to be modified depending on the condition of the borehole, an example of this was when the tools had to be run through casing due to bridging part way down the borehole in KG-12.
Page 58 of 100
| | | |
| | American West Potash, LLC Holbrook Basin Project
2011 Potash Resource Assessment
October 17, 2011 |
The geophysical parameters measured with the wireline tools include the resistivity, natural gamma, sonic, caliper, density and neutron. The gamma log provides a depth-recorded dataset of the natural formation radioactivity and is displayed in American Petroleum Institute (API) units. As isotopic potassium undergoes radioactive decay which is read by the wireline gamma tool, the natural gamma log is then proportional to the sylvite concentration through the potash interval; therefore the natural gamma log can be used to provide an estimate of the potash grade and is excellent for depth correcting cored intervals. The density, sonic, neutron, and resistivity are useful tools for assessing the mineralogy of formations and the presence of impurities such as clay, carnallite and anhydrite. The caliper log indicates the size of the borehole and is a useful tool when looking for areas of washout or buildup on the borehole walls.
Table 10-1: Drill Hole 2011 Wireline Program.
| | | |
Intermediate Casing (Surface to Core Point)
|
| Gamma Ray | | Caliper |
| Single Point Resistivity | | Sonic |
Main Hole (Core Point to TD)
|
| Gamma Ray | | Caliper |
| Dual Guard Resistivity | | Sonic |
| Neutron | | Density |
11.0 SAMPLE PREPARATION, ANALYSIS AND SECURITY
11.1GEOCHEMICAL SAMPLING
Geochemical sampling was carried out to acquire a fundamental understanding of the mineralogical character, grade, and thickness of potash-bearing horizons present within the Project Area. The goal of the geochemical analysis was to acquire sufficient data to develop an NI 43-101 potash Mineral Resource estimate. As the mineralized beds encountered were found to be variable in depth, thickness, and occurrence and spatial distribution between each of the 2011 potash test wells, the number of samples taken also varied dependent on the thickness and distribution of the mineralized beds.
Page 59 of 100
| | | |
| | American West Potash, LLC Holbrook Basin Project
2011 Potash Resource Assessment
October 17, 2011 |
All geochemical sampling activities were carried out at AWP’s Core Lab facility located along West Vista Drive in Holbrook, Arizona (Figure 11-1). A total of 296 samples from the twelve 2011 potash test wells were collected for geochemical analyses. Analyses were performed by Huffman Laboratories Inc. in Golden, Colorado. A summary of samples by well is provided in Table 11-1.
Table 11-1: Assay Intervals Summarized by Test Well.
| | | | | | | | | | | | | | | | | | | | | | | | | | | | | |
| Potash Test Well ID | | Assay Top (ft) | | | Assay Base (ft) | | | Interval Length (ft) | | | Samples | | | Avg. Sample Length (ft) | | | Standards | | | Repeats | |
KG-01 | | | 1248.71 | | | | 1284.1 | | | | 35.39 | | | | 43 | | | | 0.82 | | | | 5 | | | | 4 | |
KG-02 | | | 1237.16 | | | | 1258.61 | | | | 21.45 | | | | 33 | | | | 0.65 | | | | 3 | | | | 4 | |
KG-03 | | | 1264.19 | | | | 1285.55 | | | | 21.36 | | | | 37 | | | | 0.58 | | | | 4 | | | | 4 | |
KG-04 | | | 1351.95 | | | | 1382.5 | | | | 30.55 | | | | 49 | | | | 0.62 | | | | 4 | | | | 6 | |
KG-05 | | | 1420.98 | | | | 1442.37 | | | | 21.39 | | | | 29 | | | | 0.74 | | | | 2 | | | | 4 | |
KG-06 | | | 1452.08 | | | | 1467.93 | | | | 15.85 | | | | 22 | | | | 0.72 | | | | 2 | | | | 3 | |
KG-08 | | | — | | | | — | | | | — | | | | — | | | | — | | | | | | | | — | |
KG-09 | | | 1628.62 | | | | 1649.95 | | | | 21.33 | | | | 29 | | | | 0.74 | | | | 2 | | | | 4 | |
KG-10 | | | — | | | | — | | | | — | | | | — | | | | — | | | | | | | | — | |
KG-12 | | | 1770.94 | | | | 1785.15 | | | | 14.21 | | | | 21 | | | | 0.68 | | | | 2 | | | | 3 | |
KG-13 | | | 1762.02 | | | | 1772.29 | | | | 10.27 | | | | 17 | | | | 0.60 | | | | 1 | | | | 2 | |
KG-14 | | | 1767.04 | | | | 1777.37 | | | | 10.33 | | | | 16 | | | | 0.65 | | | | 1 | | | | 2 | |
| | | | | | | | | | | | | | | | | | | | | |
Average / Total | | | — | | | | — | | | | | | | | 296 | | | | | | | | 26 | | | | 36 | |
| | | | | | | | | | | | | | | | | | | | | |
11.2CONTROLS ON SAMPLE INTERVAL DETERMINATION
The upper and lower contacts of the mineralized interval were identified by matching potash mineral concentrations visible within each core to their respective gamma-ray log responses. For each mineralized core, selection of the correct interval to be assayed was conducted by North Rim Geologists. In order to ensure all mineralization was captured within the assay interval, shoulder samples often ranged from 1.0 to 2.0 m (3.3 to 6.6 ft) and were taken from above and below the mineralization contacts. The extent of the shoulder sampling was at the discretion of the geologist by reviewing the gamma ray log response.
Sample determinations within an assay interval were based on the following geological parameters:
| | 1) | | Changes in lithology, mineralogy, estimated K2O grade, crystal size, or insoluble content warranted a new sample. Clay seams were broken out as individual samples, with approximately 2.5 cm (1.0 inch) of overlap on either side of the seam. |
| |
| | 2) | | Samples did not span geological contacts including the upper and lower boundaries of the potash members. |
| |
| | 3) | | When possible, existing breaks within the core were used. |
| |
| | 4) | | In order to provide a high geochemical resolution, samples were restricted to approximately 30.0 cm (12 inches) or less in length. |
Page 60 of 100
| | | |
| | American West Potash, LLC Holbrook Basin Project
2011 Potash Resource Assessment
October 17, 2011 |
Figure 11-1: Photograph taken inside of AWP’s Core Lab Facility.
Visual inspection of the core in conjunction with consultation of the respective gamma, density, neutron, caliper and resistivity tools for the drill holes provided sufficient information to accurately assess changes in mineralogy, lithology, and grade. Within mineralized zones, new sampling intervals were established where changes in grade occurred. It is the opinion of the author that the samples chosen for geochemical analyses are representative of the selected mineralized intervals based on the above discussed parameters and guidelines.
11.3SAMPLING METHOD AND APPROACH
Sampling procedures utilized for the Holbrook cores were modeled after methods currently practiced by the Canadian Potash Industry. The following points summarize the specific procedures carried out by North Rim staff during the geochemical sampling of mineralized AWP cores:
| | 1) | | Core boxes were transported from the drill to the lab in Holbrook by North Rim staff for all wells drilled during the 2011 drilling program. |
| |
| | 2) | | Upon arrival at the lab the core boxes were carefully unloaded from the transport vehicle and laid out in sequential order onto the examining tables. |
Page 61 of 100
| | | |
| | American West Potash, LLC Holbrook Basin Project
2011 Potash Resource Assessment
October 17, 2011 |
| | 3) | | The box lids were removed and stored beside the examining tables in proper order. Due to the low ambient humidity in the lab and the absence or minor occurrence of carnallite in the core was left unwrapped for the duration of the examination and sampling process. |
| |
| | 4) | | The core surfaces were cleaned by scraping off residual mud and loose debris using a blade. This was performed for every piece of core as the Holbrook evaporites have a very high mud content which often smeared onto adjacent cores making geological examination difficult. Once scraped, a cloth or shop towel was wetted with a saturated brine solution and was used to clean and to remove the excess material left from scraping. This step was important to ensure the correct identification of potash beds, clay seams, and mineralogical changes within the core. |
| |
| | 5) | | The formation contacts were chosen from the geophysical logs, as the tops were occasionally ambiguous in the core making them difficult to identify. The core was then depth corrected by matching intervals of core to their corresponding intervals on the geophysical wireline logs. |
| |
| | 6) | | Once depth corrected, the core was prepared for assaying. The assay interval size was dependant on the thickness and distribution of the potash bed(s) present in each drill core. If multiple potash members were present, the interbedded salts and/or mud between them were also sampled in order to provide a complete and thorough data set through the potash-bearing zone. The first and last samples taken over the potash interval were intended to capture the initial and final presence of potash mineralization. As discussed in Section 11.2, shoulder sampling was utilized to ensure all of the potash mineralization was captured within the assay interval. |
| |
| | 7) | | After logging was completed, each piece of core was tightly wrapped in masking tape with the bottom of each piece marked for correct replacement into the boxes after ‘slabbing’ (i.e. sawing core longitudinally into halves). Tape was used to maintain core integrity during the slabbing procedure as the salt beds were quite brittle and splintered easily. A dry, 2-horsepower band saw equipped with a dust collection system was used for cutting (Figure 11-2). Only one piece of core was removed from the assay interval and slabbed at any one time to prevent mixing of core segments from the mineralized zones. |
Page 62 of 100
| | | |
| | American West Potash, LLC Holbrook Basin Project
2011 Potash Resource Assessment
October 17, 2011 |
| | 8) | | Once slabbed, the two complimentary core halves were placed back into their respective box in proper stratigraphic order, with both cut surfaces facing up. The cutting process was supervised at all times by a North Rim Geologist. Saw blades were replaced frequently when any breach of core integrity was noted (i.e. crystal fracturing or splintering). |
| |
| | 9) | | The sawn surfaces were wiped with a cloth wetted with a brine saturated solution in order to remove any rock powder generated by the cutting process. |
Figure 11-2: AWP’s dry 2-horsepower band saw with dust collection system.
| | 9) | | The upper core half was then divided into individual assay samples by drawing straight lines across the core diameter in permanent black marker, utilizing natural core breaks where possible. |
| |
| | 10) | | Samples were given unique identifier labels using a numbering scheme incorporating both the drill hole and sample number. For example, sample “KG6-015” indicates it was the 15th sample from the drill hole “KG-06.” The number was written on the upper core half in permanent black marker. A sample tag bearing this number was prepared for better identification in the core photo and at the receiving geoanalytical facility. Figure 11-3 provides an example of a slabbed AWP potash core that has been properly subdivided into samples and labelled. |
Page 63 of 100
| | | |
| | American West Potash, LLC Holbrook Basin Project
2011 Potash Resource Assessment
October 17, 2011 |
| | 11) | | The core was photographed with a stationary high resolution digital camera. The core was moistening with a damp cloth to enhance the quality of the photos. |
| |
| | 12) | | From the corrected depths, each sample was carefully measured to the nearest centimeter and the results were recorded into logging spreadsheets. Sample intervals and numbers were transposed onto the underlying second half of the core in the box. This preserved the sample data on one core half, as the submitted half was destroyed during the geoanalytical procedure. |
| |
| | 13) | | The upper core half was cross-cut into the designated sample intervals. Each sample and its corresponding sample tag were placed into a waterproof plastic sample bag, which was labelled with the sample number and stapled shut. |
| |
| | 14) | | Samples were finally packed into plastic shipping containers and sealed along with sample batch manifests. |
Figure 11-3: Sampling interval from drill hole “KG-06” (Core 3, Box 5).
Page 64 of 100
| | | |
| | American West Potash, LLC Holbrook Basin Project
2011 Potash Resource Assessment
October 17, 2011 |
It is worth noting that the core recovery was generally good for all wells, although minor core loss was noted in KG-08 and more substantial core loss in KG-13 due to the core barrel jamming. The drilling brines were adjusted and monitored to maintain the core integrity; however, minor pitting and core surface corrosion was noted in several of the cores. Slabbing did not result in substantial material loss, although some splintering of the core was inevitable because of the brittle nature of the Holbrook Basin evaporites. The accuracy and reliability of the assay samples was not compromised during the sampling procedure.
11.4SAMPLE SECURITY
Security procedures were closely followed to ensure that the core was under the supervision of qualified personnel at all times. Once retrieved from the core barrel the core was under the direct care of either the Wellsite Geologist or a North Rim Representative. The core was boxed and secured at the drilling site and, following the completion of coring, was immediately transported by the supervising party to AWP’s core Lab facility in Holbrook, Arizona. AWP’s core lab is equipped with locking doors to ensure the security and integrity of the core when the lab is not under direct surveillance. To prevent the dissemination of project specific information, only individuals employed by or in direct association with the exploration team were allowed entry into the lab.
Under the supervision of a North Rim Geologist all samples were selected, cut, and packaged in a timely manner to limit their exposure. Upon completion of North Rim’s core examination and sampling, the cores from each test well were wrapped in plastic wrap, re-boxed, and stacked onto pallets. Pallets were then placed into a metal SECAN container for temporary storage. An industrial duty alphanumeric lock was installed on the container door for security.
Samples were delivered to Huffman Laboratories Inc. at 4630 Indiana Street in Golden, Colorado via United Parcel Service (UPS). Information sent along with the sample shipment included the client name, address, distribution email list, and a sample manifest. Upon arrival the samples were under the direct care of Huffman Laboratories personnel. Mr. Ron Kiel, Huffman’s Laboratory Director was North Rim’s direct contact for the duration of the program. Huffman Laboratories maintains its own quality assurance / quality control program, which is available upon request. North Rim was not involved in procedures performed at Huffman Laboratories, nor was North Rim present to supervise the analysis process. Assay results generated were reviewed and approved by Huffman Laboratories prior to release.
Page 65 of 100
| | | |
| | American West Potash, LLC Holbrook Basin Project
2011 Potash Resource Assessment
October 17, 2011 |
11.5QUALITY CONTROL PROCEDURES
Each sample batch was submitted by Huffman Laboratories to a third party company for material preparation. Hazen Research Inc. located at 4601 Indiana Street Golden, Colorado provided the sample preparation services. Hazen’s Research Inc.’s quality control programs are documented and available upon request. Sample crushing, splitting, grinding, and homogenization were performed according to parameters outlined by Mr. Ron Keil of Huffman Laboratories. The potash sample preparation instructions are as follows (modified from original letter from Mr. Ron Keil to Hazen dated August 4, 2011):
| | 1) | | Samples were mostly dry when processed (other than hydrated minerals), but dried if necessary at 90°C overnight. |
| |
| | 2) | | Entire samples were crushed to 3.0 mm (1/8”) with jaws and/or rolls/gyrolls as appropriate. |
| |
| | 3) | | Enough samples were riffle split to fill the labeled jars provided until about 2/3 full. If that was the entire sample, the entire sample was put in the jar. If there were crushed rejects remaining, these rejects were placed into a new plastic bag, along with the original plastic bag and sample tag (the new outer plastic bag was not re-labeled as the old tag and bag were still visible with the sample number). |
| |
| | 4) | | The entire sample in the jar was pulverized (large puck or ring puck mill) to 200.0 mm mesh and poured back into the jar. The jar was filled no more than about 80.0% full so it could be remixed after each aliquot. Pulp that didn’t go in the jar was discarded. Jars were wiped or blown clean for each new sample. |
| |
| | 5) | | Pulverized samples were returned to Huffman Laboratories as soon as preparation was complete along with the extra reject material. Rejects were put in new heavy duty poly bags and sealed with wire ties. |
Once the prepared materials were returned, analyses were carried out according to Huffman’s standard potash analytical procedures as follows (modified from original email dated September 2, 2011):
| | 1) | | Moisture by Loss on Drying: |
| | a. | | 2.0 gram samples were weighed into 20.0 ml screw cap Pyrex glass tubes (pre-weighed) and heated overnight in a forced air oven. |
| |
| | b. | | The tubes were capped while hot and allowed to cool. |
Page 66 of 100
| | | |
| | American West Potash, LLC Holbrook Basin Project
2011 Potash Resource Assessment
October 17, 2011 |
| | c. | | Caps were removed as each sample was weighed, then immediately replaced. |
| |
| | d. | | Weight loss was calculated and reported on an “as received” ground sample basis. The loss was used to convert all of the other data (insolubles and elemental analyses) to a ground, moisture free basis. |
| | a. | | 1.0 gram samples were weighed into new Nalgene 4.0 oz. polypropylene bottles. |
| |
| | b. | | 100.0 ml of “Type 1” high purity deionized water was added by weight for improved accuracy. |
| |
| | c. | | The bottles were stabilized at 30.0°C, and shaken vigorously on a mechanical shaker for 1 hour. |
| |
| | d. | | The bottles were removed from the shaker, and allowed to settle for 24 hours. |
| |
| | e. | | Clear aliquots of 20.0 ml were withdrawn from the top and placed in new Nalgene 50.0 ml polypropylene centrifuge tubes for metals analysis. |
| |
| | f. | | The remaining 80.0 ml of liquid and insoluble solids left in the 4.0 oz polypropylene bottles were shaken by hand and rinsed into a filtration apparatus holding glass fiber filters. The filters were Whatman 934-AH 47.0 mm that had been conditioned at 105.0°C and pre-weighed. |
| |
| | g. | | The bottle and the solids on the filter were well rinsed with deionized water, dried at 105.0° C, cooled in a desiccator, and re-weighed. |
| |
| | h. | | Insolubles were calculated on an “as received” sample weight basis, and corrected to a ground, moisture free basis using the measured loss on drying. |
| | a. | | Metals (K, Mg, Na, Ca, and S) were measured by ICP-AES using a Perkin-Elmer 5300DV (dual radial and axial view measurements). |
| |
| | b. | | 20.0 ml of clarified solution aliquots in 50.0 ml centrifuge tubes were diluted to instrument appropriate concentrations based on the specific element and concentration. |
| |
| | c. | | Dilutions were made in 1.0% v/v nitric acid on a weight basis to improve accuracy (most readings were made from 1/100 dilutions of the original leach liquid). |
| |
| | d. | | Metals were measured as the element then calculated and reported as the equivalent oxides on a ground, moisture free sample weight basis. |
Page 67 of 100
| | |
| | American West Potash, LLC Holbrook Basin Project
2011 Potash Resource Assessment
October 17, 2011 |
Two different powdered reference materials (“POT003” and “POT004”) of varying mineralogical composition and potash grade were systematically inserted as standard samples into the mineralized sample batches. A standard was included by North Rim Geologists in every AWP drill hole after every ten samples and were intended to verify that the instruments used for analysis at the Huffman Laboratories were correctly calibrated and cleaned. Section 12.6 elaborates further on the standard selection and results. The “POT003” standard is a compositionally homogeneous lower grade (19.5 % K2O or 30.9 % KCl) potash material while the “POT004” standard has higher grade (60.4 % K2O or 95.6 % KCl) potash values. The reference materials were supplied to North Rim by the Saskatchewan Research Council’s (SRC) Geoanalytical Laboratories located at 125 — 15 Innovation Boulevard in Saskatoon, Saskatchewan. Detailed geochemical quality control limits for these standards are provided in Appendix D.
Systematic repeat analyses were conducted by Huffman Laboratories every tenth sample. The purpose of these procedures was to ensure that only quality geochemical datasets were generated from the sampling process by demonstrating the accuracy, precision, and repeatability of the analyzing party. The results are discussed in Section 12.6.
The author did not directly supervise or observe the above procedures and has relied on the credibility of the Huffman Laboratories for the accuracy of the results. Huffman Laboratories have been qualified by the State of Colorado and the United States Geological Survey (USGS) to analyze a variety of materials and undergo periodic reviews and audits from clients of both private and government organizations. Huffman Laboratories is an independent company from North Rim. It is the author’s opinion that the security of the core and analytical procedures performed on the assay samples met current industry standards and best practices, and were of adequate quality, accuracy and precision.
12.0 DATA VERIFICATION
12.1HISTORICAL DATA
During the 1960s and 1970s, a total of 135 historical exploration wells were drilled in the Holbrook Basin, 69 of which were targeted in the northeast near the Project Area. In total, 59 historical wells were drilled within a two mile buffer of AWP’s current land holdings. The remaining 10 wells fall outside of this buffer but don’t exceed a distance greater than 8.2 miles from AWP’s nearest land holding. As many of the earlier drilled wells were exploring for oil and gas, several of them did not drill deep enough to penetrate the potash-bearing Supai Group strata. In 2008, the Arizona Geological Survey released an Open File Report (Rauzi S. L., 2008)) on the potash potential of the Holbrook Salt Basin, reporting potential for up to 812 million metric tonnes of potash mineralization (Rauzi S. L., 2008). Companies which have explored the region in the past have reported K2O values ranging anywhere from 6.0 % to 48.0 % (9.5 to 76.0 % KCl) (Carr, 1966). These reports are not compliant with current industry NI 43-101 standards.
Page 68 of 100
| | |
| | American West Potash, LLC Holbrook Basin Project
2011 Potash Resource Assessment
October 17, 2011 |
A review of the available historical data by North Rim established that few chemical assay data sets were available. North Rim recommended that the available historical well wireline data be digitized so that % K2O Gamma Ray Equivalent Calculations (GREC) for potential potash zones could be calculated. Divestco of Calgary, Alberta, digitized the available wireline logs in 2010 and the resulting values were used by North Rim to calculate an equivalent % K2O grade estimate for each well. Where available, lithology logs were used to constrain the stratigraphic limits of the mineralized horizons.
The purpose of the 2011 drilling program was to confirm and enhance the historical drilling results, and acquire quality data from new wells sufficient for the preparation of an NI 43-101 compliant potash Mineral Resource estimate. The mineralized horizons were determined for a total of 58 historical wells of sufficient data quality and were considered for inclusion in the 2011 Mineral Resource calculation. Of these, 46 were incorporated into the inferred Mineral Resource calculation based on their proximity to AWP’s Holbrook Basin properties and the outlined resource buffers.
12.2RECENT DATA
The information upon which this report is based is primarily obtained from twelve potash test wells drilled by AWP in 2011. Contribution to the general knowledge and understanding of the geology and Holbrook Basin area was taken from historical drill data and public record sources which include technical reports, geological reports and geochemical assay results. The author of this technical report in part relied upon historical results, opinions, and statements not prepared under their supervision; therefore, the author hereby does not take responsibility for the accuracy of the historical data. None of the historical information is proprietary and was primarily obtained from the records of the Arizona Geological Survey Document Repository, as well as other publically available technical papers and reports.
Cores from the AWP’s 2011 exploration program are available for inspection at AWP’s core lab facility in Holbrook, Arizona. Cores from four of these test holes (KG-01 to KG-04) have been inspected by the principal author to verify their contents. The remainder of the core was inspected by other geological professionals under the direction of the principal author.
Page 69 of 100
| | |
| | American West Potash, LLC Holbrook Basin Project
2011 Potash Resource Assessment
October 17, 2011 |
The author is able to provide verification of the geotechnical data collected during AWP’s 2011 exploration program and all associated geochemical results, as North Rim’s geotechnical staff was involved in all aspects of the geoanalytical process. Due diligence and care was taken to ensure the geochemical sampling and assay procedures detailed in Section 11 of this report were of the highest quality and were compatible with current potash industry methods. Mrs. Tabetha A. Stirrett has verified the data relied upon for all aspects of the Mineral Resource calculation.
12.3ASSAY-TO-GAMMA CORRELATION STUDY
Bannatyne (1983) developed a method by which to calculate the equivalent % K2O content of a particular point in a potash bed from its respective wireline gamma ray log amplitude. The Bannatyne (1983) method is a linear relationship and does not account for variables such as drill hole diameter, logging speed, tool centralization and mud weight (Figure 12-1). As the gamma ray tool is affected by such factors, proper correction factors must be employed to ensure these variables are accounted for in the calculation. Crain and Alger (1965) previously developed a method to correct for these variables (Figure 12-2). Taking these variables into consideration and correcting for them, one can determine the % K2O present in potash encountered in the historical wells that do not have available geochemical assay data. North Rim has developed an in-house calculation for this task by incorporating techniques from both the Bannatyne (1983) and Crain and Alger (1965) methods. The resulting equivalent % K2O curve is referred to as a “Gamma Ray Estimation Curve” (GREC).
Page 70 of 100
| | |
| | American West Potash, LLC Holbrook Basin Project
2011 Potash Resource Assessment
October 17, 2011 |
Figure 12-1: Bannatyne (1983) GREC Method
Figure 12-2: Alger and Crain GREC Method (1965).
Page 71 of 100
| | | |
| | American West Potash, LLC Holbrook Basin Project
2011 Potash Resource Assessment
October 17, 2011 |
12.4COMPARISON OF GREC METHOD TO ACTUAL HISTORICAL ASSAY DATA
Historical wells which had both quality wireline data and geochemical assays were utilized for the purposes of this study. The five resulting LAS files produced through digitization of their respective wireline curves were input into North Rim’s in-house GREC equation, and the corresponding equivalent % K2O values were calculated. These calculated values were compared with the respective historical geochemical assay-derived % K2O values. The purpose of this study was to cross-reference the two data sets as a data verification procedure, with greater confidence being weighted to the historical assays. The two data sets were plotted graphically for each hole, with potash grade along the x-axis and depth along the y-axis. The depths recorded by the gamma wireline curve were taken as true depths and the assay sample intervals were adjusted to these curves using a best-fit approach.
These adjustments were completed on an individual core run scale over the sampled intervals. For each potash member, a weighted % K2O was calculated from both the assay and the GREC over the same interval. The following formula was used to compare these values:
Where A = %K2O from Assay, G = %K2O from GREC and is the absolute value.
 An overall correlation between the assay and gamma data of 87.9 % was obtained for the five historical wells listed in Table 12-1.
Table 12-1: Assay vs. GREC Correlation for the Holbrook Basin Historical Wells.
| | | | | |
| Drill Hole | | Assay vs. GREC % Correlation | |
| 01-23 | | | 92.8 | |
| 01-24 | | | 63.6 | |
| 01-26 | | | 95.8 | |
| 01-36 | | | 89.2 | |
| 01-44 | | | 98.3 | |
Page 72 of 100
| | | |
| | American West Potash, LLC Holbrook Basin Project
2011 Potash Resource Assessment
October 17, 2011 |
Table 12-1 summarizes how closely the assayed values correlate to the equivalent % K2O grades produced by North Rim’s GREC formula. Results typically showed an approximate correlation factor of 90.0 %; the only discrepancy being drill hole 01-24 which only had a correlation of 63.6%. This may be the result of a number of factors including utilization of improper correction factors, drilling-related errors, logging errors or a combination of compounding minor issues. A common issue with older logging equipment is the poor vertical resolution of the logging tools and an increased “sidewall effect” produced by thinly bedded potash layers. Drill hole 01-24 happens to contain thin high grade potash beds (approximately 30.0 — 49.0 % K2O) which have produced a severe “sidewall” effect resulting in an artificially thickened mineralized potash zone on the gamma ray log from 0.5 m to 1.5 m. This anomaly has caused the GREC to essentially overestimate the actual K2O present.
An example comparison of the actual assay-derived % K2O values to the GREC equivalent % K2O is presented in Figure 12-3. As shown, the method does not produce an exact match. First, when the wireline log was initially digitized, a 0.076 m (0.25 feet) resolution was used which will not provide the amount of detail that an actual assayed interval provides. Secondly, the vertical resolution of the Southwest Exploration wireline gamma ray tool is less than 0.6 meters (2.0 ft). This means that beds less than this will not be resolved. This is apparent in the interval between 469.0 m and 473.0 m. The actual assay detects the individual higher grade zones as samples are selectively submitted for analysis; the GREC curve is suppressed due to the “sidewall”. Between approximately 464.0 m and 466.0 m, the mineralized bed is thicker resulting is relatively more similar GREC and assay values. Finally, the hole size, washouts and drilling mud composition may have great influence on the gamma ray tool reading. The Southwest Exploration gamma tool has not been compensated for these issues, nor does the company have charts to correct for these factors. As a result of all of the factors noted above, the gamma response to assay correlation will not be exact and the reader is reminded that the % K2O calculated using the GREC method is an estimate and may not represent the true assay value.
Page 73 of 100
| | | |
| | American West Potash, LLC Holbrook Basin Project
2011 Potash Resource Assessment
October 17, 2011 |
Figure 12-3: Historical Drill Hole 01-23 Gamma ray / Assay / GREC Comparison.
Page 74 of 100
| | | |
| | American West Potash, LLC Holbrook Basin Project
2011 Potash Resource Assessment
October 17, 2011 |
12.5COMPARISON OF GREC METHOD TO 2011 DRILL HOLE ASSAY DATA
AWP’s 2011 exploration drilling program provides a new consistent dataset whose results acceptably meet today’s standards for reporting. The analytical results from systematically employed assay standard reference materials indicates that the grade results obtained for the assayed intervals are adequate and are considered reliable. The resulting gamma ray curves from the wireline program, however, are not considered to be entirely adequate.
The resulting geophysical curves show the basic trace of potash beds, but do not provide a high enough resolution to resolve thin discreet potash seams or thinly interbedded units. The acquired gamma ray API values for the 2011 drill holes are generally found to underestimate the actual % K2O present within mineralized zones, again suggesting a significant “sidewall” influence. As the Holbrook Basin mineralization is generally thinly-bedded in nature, the overall result was that the North Rim’s GREC calculations consistently under-represented the actual % K2O within the formation. Utilizing the assay-derived values, North Rim developed a correction factor which essentially compensated for the “sidewall” effect within the dataset. It was found that not every hole within the dataset required the same correction, but on average a factor of 0.12 was applied to the gamma ray API to provide a more accurate % K2O estimate.
12.6REVIEW OF STANDARDS AND REPEAT ANALYSIS
As part of the AWP’s 2011 geochemical assay procedures, reference material standards and sample retesting was systematically employed at the time of analyses in order to ensure only quality geochemical results were obtained. As previously discussed in Section 11, two known powdered reference materials were inserted into the sample stream every ten samples. These materials were developed and provided to North Rim by the SRC. Complete information sheets for these materials are provided in Appendix C.
The analytical results obtained from the standard samples were compared against the known values and reporting limits for K2O and MgO in order to determine the accuracy and precision of the analyses. The results are shown in Figure 12-4 and Figure 12-5. In general, most reported values were found to lie within acceptable limits. The geoanalytical results provided in Appendix D show that sample repeats (denoted by a lower case “d”) were generally precise.
Page 75 of 100
| | | |
| | American West Potash, LLC Holbrook Basin Project
2011 Potash Resource Assessment
October 17, 2011 |
Figure 12-4: K2O POT003/POT004 Standard Limits.
The blue dots indicate within the specified tolerance, red dots indicate out of the tolerance.
Figure 12-5: MgO POT003/POT004 Standard Limits.
The blue dots indicate within the specified tolerance, red dots indicate out of the tolerance.
Page 76 of 100
| | | |
| | American West Potash, LLC Holbrook Basin Project
2011 Potash Resource Assessment
October 17, 2011 |
13.0MINERAL PROCESSING AND METALLURGICAL TESTING
This section is not applicable at this time.
14.0MINERAL RESOURCE ESTIMATES
For the purpose of this report the Mineral Resource is based on the assumption that the recovery of the potash will be by conventional underground mining methods, similar to the mining practices at the Carlsbad Mine.
The Mineral Resources derived herein were estimated by Qualified Persons Ms. Tabetha Stirrett, P. Geo. and Mr. Earl Gebhardt, P. Eng., with the assistance of Mr. Brett Dueck (Engineer in Training) of North Rim.
14.1Mineral and Private Lands
The Project Area consists of approximately 94,000 acres of both private and state lands. Those state lands not belonging to AWP or those private lands without access and mineral agreements have not been included into the Resource calculation.
14.2Assumptions and Methodology
The following principles of exploration techniques and sampling methods commonly employed by other potash mine operators were used in determining the potential extent, quality, and volume of the potash Mineral Resource:
| | 1. | | The primary method employed to determine thickness and concentration of potash mineralization was the 2011 drill core. The historical well LAS files were utilized to calculate an equivalent K2O value (as described in Section 12.0). |
| | 2. | | The extent of potash mineralization and continuity between drill holes (i.e., areal extent of potash beds) is determined by subsurface mapping as well as maps compiled from the 2D seismic survey as interpreted by Boyd PetroSearch. The limiting factors are the AWP property boundaries, the interpreted “zero edge” potash line and any wells where no potash was encountered. |
| | 3. | | The 2D seismic showed very little in terms of anomalies. A general deduction of 15% has been made to account for undetectable anomalies that may be encountered while mining. General deductions to the Mineral Resource have been made for unknown anomalies such as high carnallite, or low grade beds not detectable by seismic. |
Page 77 of 100
| | | |
| | American West Potash, LLC Holbrook Basin Project
2011 Potash Resource Assessment
October 17, 2011 |
| | 4. | | For estimation of the Mineral Resource the areal extent surrounding a drill hole for which it is reasonable to infer geological continuity is termed the “radius of influence” (ROI). This is estimated at the hole centre to 1.6 km (0 to 1 mile) for an Indicated Resource and 1.6 km to 3.2 km (1 to 2 mile) for an Inferred resource. A 3.2 km Inferred ROI was selected as it covers the area of the 2D seismic survey and hole spacing sufficiently to provide confidence in the continuity of the potash in the Project Area. |
| | 5. | | Based on review of the 2D seismic survey conducted by RPS Boyd PetroSearch and the drill hole information, it is possible to divide the Project Area into three areas for the purpose of estimating the presence of a Mineral Resource as follows: |
| | a) | | Areas that have thin or no potash as interpreted from drill hole data. |
| |
| | b) | | Areas outside the interpreted potash zero edge. |
| |
| | c) | | Areas that are judged to have continuous potash with no subsurface dissolution or alteration of the Supai formation as determined from review of the seismic data. |
The reader is cautioned that additional seismic should be conducted in order to identify further unknown anomalies. In particular a 3D survey is recommended in order to determine continuity of the potash. The seismic does not assist in delineating the areas of non-deposition and/or leach anomalies, as seen in KG-10.
14.3Mineral Resource
The following definitions in sections on the Mineral Resource definitions can be found in the November 22, 2005 CIM Definition Standards document prepared for Mineral Resources and Mineral Reserves.
14.3.1Inferred Mineral Resource
“An ‘Inferred Mineral Resource’ is that part of a Mineral Resource for which quantity and grade or quality can be estimated on the basis of geological evidence and limited sampling and reasonably assumed, but not verified, geological and grade continuity. The estimate is based on limited information and sampling gathered through appropriate techniques from locations such as outcrops, trenches, pits, workings and drill holes.”
Page 78 of 100
| | | |
| | American West Potash, LLC Holbrook Basin Project
2011 Potash Resource Assessment
October 17, 2011 |
“Due to the uncertainty that may be attached to Inferred Mineral Resources, it cannot be assumed that all or any part of an Inferred Mineral Resource will be upgraded to an Indicated or Measured Mineral Resource as a result of continued exploration. Confidence in the estimate is insufficient to allow the meaningful application of technical and economic parameters or to enable an evaluation of economic viability worthy of public disclosure. Inferred Mineral Resources must be excluded from estimates forming the basis of feasibility or other economic studies.”
14.3.2Indicated Mineral Resource
“An ‘Indicated Mineral Resource’ is that part of a Mineral Resource for which quantity, grade or quality, densities, shape and physical characteristics can be estimated with a level of confidence sufficient to allow the appropriate application of technical and economic parameters, to support mine planning and evaluation of the economic viability of the deposit. The estimate is based on detailed and reliable exploration and testing information gathered through appropriate techniques from locations such as outcrops, trenches, pits, workings and drill holes that are spaced closely enough for geological and grade continuity to be reasonably assumed.”
“Mineralization may be classified as an Indicated Mineral Resource by the Qualified Person when the nature, quality, quantity and distribution of data are such as to allow confident interpretation of the geological framework and to reasonably assume the continuity of mineralization. The Qualified Person must recognize the importance of the Indicated Mineral Resource category to the advancement of the feasibility of the project. An Indicated Mineral Resource estimate is of sufficient quality to support a Preliminary Feasibility Study which can serve as the basis for major development decisions.”
14.3.3Measured Mineral Resource
“A ‘Measured Mineral Resource’ is that part of a Mineral Resource for which quantity, grade or quality, densities, shape, and physical characteristics are so well established that they can be estimated with confidence sufficient to allow the appropriate application of technical and economic parameters, to support production planning and evaluation of the economic viability of the deposit. The estimate is based on detailed and reliable exploration, sampling and testing information gathered through appropriate techniques from locations such as outcrops, trenches, pits, workings and drill holes that are spaced closely enough to confirm both geological and grade continuity.”
Page 79 of 100
| | | |
| | American West Potash, LLC Holbrook Basin Project
2011 Potash Resource Assessment
October 17, 2011 |
“Mineralization or other natural material of economic interest may be classified as a Measured Mineral Resource by the Qualified Person when the nature, quality, quantity and distribution of data are such that the tonnage and grade of the mineralization can be estimated to within close limits and that variation from the estimate would not significantly affect potential economic viability. This category requires a high level of confidence in, and understanding of, the geology and controls of the mineral deposit.”
14.4Potential Conventional Mining Intervals
In determining the resource the following criteria were used when selecting the “Geological Resource”:
| | • | | Grade (%) x Thickness (m) greater than 12.2 or Grade (%) x Thickness (feet) greater than 40 (see Appendix E for a summary of this data). |
| | • | | When possible an overall geological interval grade cut off of 8% K2O was utilized. |
| | • | | Minimum bed thickness of 1.2 meters (4 feet). |
| | • | | Less than 8 to 10 % insoluble content. |
| | • | | Less than 10 % carnallite. |
At this time no engineering feasibility studies have been conducted on the Project Area so the above criteria may change or may not be applicable after such studies are completed. The thicknesses used for the Resource calculation are not a ‘mining cut’ and will likely be reduced once engineering studies are completed.
In determining the resource, a “Geological Interval” was chosen to calculate the resource and was selected based on optimization of the grade in the interval while still remaining within the “Geological Resource” criteria. These grades were based on assays from the current wells, in addition to the GREC curves calculated for the historical wells. The intervals were also verified with wireline logs using consistent inflection points off of the gamma ray log.
The reader is cautioned that the thicknesses used for this calculation are not a ‘mining cut’ and will likely be reduced if a conventional mining method is determined feasible. Thick stable roof ‘salt back’ is necessary when mining potash conventionally. Current operating mines in the US prefer to have at minimum of around 4 feet (1.2 meters) of stable salt back. The PEA will identify the necessary mechanics studies to ensure a stable back and mining configurations; for instance, the KR-1 and KR-2 resource intervals have been identified, but the mine layout of individual beds will have to be determined in the PEA study yet to be completed.
Page 80 of 100
| | | |
| | American West Potash, LLC Holbrook Basin Project
2011 Potash Resource Assessment
October 17, 2011 |
Table 14-1 shows a summary of the tonnages calculated for the conventional mining resource scenario. The grade and thicknesses used from the individual wells in the Project area can be found in Appendix E.
Table 14-1: Project Area Resource Summary Table.
RESOURCE SUMMARY TABLE
INDICATED1RESOURCE SUMMARY
| | | | | | | | | | | | | | | | | | | | | | | | | | | | | |
| | | | | | | | | | | | | | | | | | | Total | | | | | | | K2O | |
| | | | | | | Area with Seismic | | | Weighted | | | Weighted | | | Sylvinite | | | Total K2O | | | MMT3 | |
| | | Area | | | Deductions of | | | Average | | | Average K2O | | | Tonnage | | | Tonnage | | | per | |
| Member | | (km2) | | | 15% (km2) | | | Thickness (m) | | | Grade (%)4 | | | (MMT3)5 | | | (MMT3)6 | | | Section7 | |
KR-1 | | | 0.00 | | | | 0.00 | | | | 0.00 | | | | 0.00 | | | | 0.00 | | | | 0.00 | | | | 0.00 | |
KR-2 | | | 45.26 | | | | 38.47 | | | | 1.98 | | | | 10.09 | | | | 158.10 | | | | 15.95 | | | | 1.07 | |
| | | | | | | | | | | | | | | | | | | | | | |
Total | | | 45.26 | | | | 38.47 | | | | N/A | | | | N/A | | | | 158.10 | | | | 15.95 | | | | N/A | |
| | | | | | | | | | | | | | | | | | | | | | |
INFERRED2RESOURCE SUMMARY
| | | | | | | | | | | | | | | | | | | | | | | | | | | | | |
| | | | | | | | | | | | | | | | | | | Total | | | | | | | K2O | |
| | | | | | | Area with Seismic | | | Weighted | | | Weighted | | | Sylvinite | | | Total K2O | | | MMT3 | |
| | | Area | | | Deductions of | | | Average | | | Average K2O | | | Tonnage | | | Tonnage | | | per | |
| Member | | (km2) | | | 15% (km2) | | | Thickness (m) | | | Grade (%)4 | | | (MMT3)5 | | | (MMT3)6 | | | Section7 | |
KR-1 | | | 42.70 | | | | 36.29 | | | | 1.69 | | | | 13.44 | | | | 127.58 | | | | 17.15 | | | | 1.22 | |
KR-2 | | | 125.56 | | | | 106.72 | | | | 1.95 | | | | 11.39 | | | | 432.75 | | | | 49.29 | | | | 1.20 | |
| | | | | | | | | | | | | | | | | | | | | | |
Total | | | 168.26 | | | | 143.01 | | | | N/A | | | | N/A | | | | 560.33 | | | | 66.44 | | | | N/A | |
| | | | | | | | | | | | | | | | | | | | | | |
| | | |
| 1. | | Indicated Resource radius of influence is 0.0-1.6KM for Potash Units KR-1 and KR-2 |
| |
| 2. | | Inferred Resource radius of influence is 1.6-3.2KM for Potash Units KR-1 and KR-2 |
| |
| 3. | | MMT = Million Metric Tonnes |
| |
| 4. | | “Average K2O Grade” and “Average Thickness” refer to weighted averages. |
| |
| 5. | | “Total Sylvinite Tonnage” refers to total amount of in-situ resource in the Project Area (i.e. Area x Thickness x Density x Deductions) |
| |
| 6. | | “Total K2O Tonnage” refers to the total amount of K2O resource in the Project Area (i.e. Area x Thickness x Density x Deductions x Grade). Deductions include 15% for unknown anomalies (Does not include mining extraction ratio or plant and transport losses) |
| |
| 7. | | Assuming 640 acres or 2,589,988m2per section. |
Figure 14-1 illustrates the polygons used to calculate the Resource area. The Indicated and Inferred Resource has been broken into 4 categories. The purpose of this division is to illustrate the continuity of the higher grade areas versus the areas with lower grade that may be determined economic. It will be important to understand the continuity of the grade and thickness when developing the mine plans in order to maximize the higher grade resource areas. This would be similar to the mine planning practices at Carlsbad.
The categories are (reported in metric):
| | • | | G x T is greater than 12 |
| | • | | G x T is between 8 and 12 |
| | • | | G x T is between 1 and 8 |
| | • | | Those areas without potash |
Page 81 of 100
| | | |
| | American West Potash, LLC Holbrook Basin Project
2011 Potash Resource Assessment
October 17, 2011 |
14.4.1KR-1 Inferred Resource Discussion
The KR-1 member of the potash sequence did not meet the required criteria to include the sub member into the Indicated Resource estimate. In most cases, the KR-1 member did not have sufficient thickness or grade to meet the required cutoffs. In some wells KR-1 did have sufficient thickness and grade, but had high insoluble content resulting in it being omitted from the Resource Estimate.
The Inferred Resource estimate for KR-1 incorporated the inclusion of thirteen (13) wells’ ROI that met the required criteria as outlined in Section 14.4. In Figure 14-1 the dark green areas illustrate the wells that met the criteria and are included in the Resource Estimate. In addition, wells with low grade and/or thickness have been specified in light green and wells with no potash present are shown in white. Although the map only shows grades multiplied by thicknesses, some wells were excluded from the calculation due to high insolubles, high carnallite, or unreliable data and are listed in Appendix E.
14.4.2KR-2 Indicated and Inferred Resource Discussion
The KR-2 member had seven (7) wells that met the required criteria and ROI to be included in the Indicated Resource; these wells have been identified by the dark pink color in Figure 14-1. Indicated Resource was only considered for the new wells drilled in 2011 due to the lack of core from the historic wells. From the map, it can be seen that KG-13 and KG-14 did not have sufficient G x T to meet the cutoffs; KG-10 had no potash present. KG-01 has not been included as an Indicated Resource due to unreliable assay data and the grades were calculated using gamma ray correlations.
The Inferred Resource estimate for KR-2 included thirty-five (35) wells that demonstrated the criteria from Section 14.4. In Figure 14-1, these wells are shown in dark green. In addition, wells with low grade and/or thickness have been specified in light green and wells with no potash present are shown in white.
Page 82 of 100
Figure 14-1: Resource Buffers for KR-1 and KR-2 (Indicated and Inferred)
Page 83 of 100
| | | |
| | American West Potash, LLC Holbrook Basin Project
2011 Potash Resource Assessment
October 17, 2011 |
15.0MINERAL RESERVE ESTIMATES
This section is not applicable at this time.
16.0MINING METHODS
This section is not applicable at this time.
17.0RECOVERY METHODS
This section is not applicable at this time.
18.0PROJECT INFRASTRUCTURE
This section is not applicable at this time.
19.0MARKET STUDIES AND CONTRACTS
This section is not applicable at this time.
20.0ENVIRONMENTAL STUDIES, PERMITTING AND SOCIAL OR COMMUNITY IMPACT
This section is not applicable at this time.
21.0CAPITAL AND OPERATING COSTS
This section is not applicable at this time.
22.0ECONOMIC ANALYSIS
This section is not applicable at this time.
Page 84 of 100
| | | |
| | American West Potash, LLC Holbrook Basin Project
2011 Potash Resource Assessment
October 17, 2011 |
23.0ADJACENT PROPERTIES
Adjacent properties to the Project Area are displayed in Figure 23-1. Passport Potash Inc. of Vancouver, BC, Canada holds land predominantly along the southern and western edges of the Project Area. Passport’s land holdings are bound on at least three sides by AWP holdings and form a ‘checkerboard’ like appearance. Passport is actively developing their areas by completing drilling and seismic programs. In 2009 Passport Metals Inc. conducted a drilling program recommended after the completion of a NI 43-101 on their property (Passport Metals Inc. News Release, 2009). Four wells, drilled in the 1960’s and 1970’s on Passport’s land were twinned (within 500 feet) to verify the viability of the historical results.
To the south and south west of the Project Area the land position is held by HNZ Potash which is a joint venture of Hunt Oil and NZ Legacy Resources, an Arizona based land and ranching company. HNZ Potash is also currently undertaking a drilling program in the Holbrook Basin.
The Petrified Forest National Park borders the western edge of the Project Area and continues to the northwest. A proposed expansion project of the Park boundaries is outlined in Figure 23-1 which would overlap with current AWP holdings and may impact the surface exploration in the future. Reservation land, private and State holdings encompass the majority of the remainder of the land surrounding the Project Area.
For over 10 years, the National Park Service (NPS) has sought to expand the Petrified National Forest Park boundaries. They have identified land on both the east and west side of the current park boundaries. Through Congressional programs the NPS and certain Conservation groups have received funds to purchase some of the identified expansion private ground. The National Park Service and the Park have made it clear in conversations with American West Potash that they obtained surface access only and will work to inventory, assess and one day, open the surface to visitors (Avery, 2011). Park officials have also made it clear that they have no ownership or control of ASLD mineral leases, nor private mineral rights and leases. The Arizona State Land Department has a state Constitutional requirement to maximize the value of State trust lands. Pat Avery of AWP has had discussions with the state officials and they have discussed that the State Land Department will likely lease these sections for the extremely large benefits to the state of severance, royalty, fees and tax values. This has not however been accepted in Congress at the time of the writing of this report. American West Potash has obtained the rights to use and mine minerals in private sections.
To date the author is unaware of any other exploration activities in the immediate vicinity and no potash mines have ever been nor are currently active in the Holbrook Basin in Arizona.
Page 85 of 100
| | | |
| | American West Potash, LLC Holbrook Basin Project
2011 Potash Resource Assessment
October 17, 2011 |
Figure 23-1: Adjacent property land holdings with respect to the Project Area.
Page 86 of 100
| | | |
| | American West Potash, LLC Holbrook Basin Project
2011 Potash Resource Assessment
October 17, 2011 |
24.0OTHER RELEVANT DATA AND INFORMATION
No other data and information is considered necessary at this time.
25.0INTERPRETATION AND CONCLUSIONS
The Holbrook Basin, when compared to other sedimentary basins hosting potash deposits, exhibits several positive factors that make it favourable for further potash exploration, resource delineation, and possible mine development:
| | • | | The resource calculated at this time for the Project Area appears to be sufficient enough to support further detailed resource, process and PEA studies. |
| | • | | Potash resources appear to be of comparable grade, thickness and with low impurities, such as insolubles and carnallite, when compared to Intrepid’s Carlsbad Mine. |
| | • | | The potash beds in the Project Area occur at relatively shallow depths, less than 600 m (1968 ft). |
| | • | | Seasonal climate variations are minimal and allows for lower operation costs when compared to Canadian and Russian Potash operations which lowers operation costs. |
| | • | | Unlike other parts of the world where potash is mined, there is no competition with the Oil and Gas industry in the Project Area. |
| | • | | The Project Area is close to very large, year round potash markets in Arizona, California and Mexico. The US imports more than 80 % of the potash it consumes and is the second largest consumer of potash in the world. The Project Area is also close to four international export ports. |
| | • | | The state of Arizona supports the development of its mineral resources, works closely with the mining industry and has a favourable potash royalty structure. |
| | • | | The Project Area is in close vicinity to infrastructure including rail, major highways, gas and power. |
| | • | | Additional seismic should be conducted to identify further unknown anomalies. In particular a 3D survey is recommended in order to determine continuity of the potash. |
| | • | | The infill drilling program and additional exploration work should focus in the north central part of the Project Area. The historical work conducted by Rauzi (Rauzi S. L., 2008) and the newly created potash isopach maps (see section 7.1) suggest that the potash may be of better quality in that part of the Project Area. |
Page 87 of 100
| | | |
| | American West Potash, LLC Holbrook Basin Project
2011 Potash Resource Assessment
October 17, 2011 |
Potential Risks Requiring Further Investigation-
Permitting and Licensing: AWP have followed a strategy of acquiring only state and private lands and mineral rights. Thus, permitting will be conducted through Arizona State agencies. Primary agencies include:
| | • | | ASLD- application for mineral leasing. |
| | • | | Department of Environmental Quality- air, water and wastewater permits. |
| | • | | Department of Water Resources- fresh water wells and water usage. |
| | • | | State Mine Inspector- permit for mining operations which would include safety, hazardous materials and control. |
Petrified Forest National Park: AWP will work closely with the State and the Park officials to provide guidance, for they plan to minimize their impact on the surface areas and park visitors.
Water Supply: American West Potash will have to work with the Department of Water Resources to obtain, prove and be granted a water right, or to obtain these from area wells and the existing water rights.
Salt Back Thickness:It has been observed in the core that the roof or “back” above the upper potash resource interval (KR-1) and in localized areas of the lower potash resource interval (KR-2) is made up of insoluble materials such as clays and anhydrites. This can present challenges with roof back control and the mining progress. Rock mechanic engineering will be required to assess the “salt back” and provide recommendations for control.
26.0RECOMMENDATIONS
The Project Area has enough of an Indicated and Inferred Resource base to proceed with a PEA or a PFS. The following recommendations are made by the author:
| | • | | The additional Phase 2 seismic acquired in the northwest portion of the Project Area during the 2011 program should be processed and interpreted to identify and assist with placing any new wells. Estimated costs $25,000. |
| | • | | Complete a PEA or PFS. This study will focus on determining the economics of a conventional underground mining operation in the Project Area, and may also include beginning baseline environmental studies, metallurgical, hydrogeological and geotechnical studies. Estimated cost $150,000. |
| | • | | Conduct infill drilling of 5 to 10 wells to increase the resource base and define parameters of a Feasibility Study. Estimated cost is $2,000,000 to $3,000,000. |
Page 88 of 100
| | | |
| | American West Potash, LLC Holbrook Basin Project
2011 Potash Resource Assessment
October 17, 2011 |
27.0References
Passport Metals Inc. News Release. (2009, November 06). Vancouver, BC, Canada.
Mine Site Locations: Intrepid Potash Website. (2010, May 13). Retrieved May 13, 2010, from Intrepid Potash Website: http://www.intrepidpotash.com/loc/carlsbad.html
About BNSF Railway. (n.d.). Retrieved 09 02, 2011, from BNSF Railway: http://www.bnsf.com/about-bnsf/
Alger, R., & Crain, E. (1965). Defining evaporite deposits with electrical well logs.Trans. Northern Ohio Geo. Soc. Second Symp. on Salt,2, pp. 116-130.
Avery, P. (. (2011, October 09). (T. Stirrett, Interviewer)
Bannatyne, B. (1983).Devionian Potash Deposits in Manitoba; Manitoba Department of Energy and Mines, Open File report OF83-3.
Brewer, J. K. (2010).State Land Department Annual Report. Retrieved September 29, 2011, from Arizona State Land Department: http://www.land.state.az.us/report/report2010_full.pdf
Butrenchuk, S. B. (2009). Holbrook Basin Potash Project.N1 43-101 Technical Report.
Carr, W. E. (1966, March 21). A review of Potash Exploration, Holbrook Drilling Project. Holbrook, Arizona, USA: Internal Document.
Cox, M. W. (1965, September 22). Report on the Holbrook Potash Deposits.Manning W. Cox Associates, 13. Bakersfield, California, USA.
Danyluk, T. K., Phillips, G. D., Prugger, A. F., & Pesowski, M. S. (May 2-5, 1999). Geophysical Analysis of an Unusual Collapse Structure at PCS Potash, Lanigan Division. InMining: Catalyst for Social and Economic Growth.101st Annual General Meeting of CIM.
Edgecombe, R. (2011, 02 15). Manager Potash Division. (P. Communication, Interviewer)
Halabura, S. P., & Hardy, M. P. (2007). An Overview of the Geology of Solution Mining of Potash in Saskatchewan.Solution Mining Research Institute.Halifax, Nova Scotia.
Hustrulid, W. A., & Bullock, R. L. (2001).Underground Mining Methods: Engineering Fundamentals and International Case Studies.
Lorenz, J. C., & Cooper, S. P. (2001).Interpreting Fracture Patterns in Sandstones Interbedded with Ductile Strata at the Salt Valley Anticline, Arches National Park, Utah.Retrieved from All U.S Government Documents (Utah Regional Depository) : http://digitalcommons.usu.edu/govdocs/9
Mackintosh, A. a. (1983). Geological Anomalies Observed at the Cominco Ltd. Saskatchewan Potash Mine.Potash Technology — Mining, Processing, Maintenance, Transportation, Occupational Health and Safety, Environment. Toronto: Pergamon Press.
Neal, J. T. (1995).Supai Salt Karst Features: Holbrook Basin, Arizona.Albuquerque, New Mexico: Sandia National Laboratories.
Page 89 of 100
| | | |
| | American West Potash, LLC Holbrook Basin Project
2011 Potash Resource Assessment
October 17, 2011 |
Peirce, W. (1981, December). Major Arizona Salt Deposits.Field Notes, 11(4), 4.
Peirce, W. H., & Gerrard, T. A. (1966). Evaporite Deposits of the Permian Holbrook Basin, Arizona.Second Symposium on Salt. 1, pp. 1-10. Cleveland Northern Ohio Geological Society.
Rauzi, S. L. (2000).Permian Salt in the Holbrook Basin, Arizona.Arizona Geological Survey Open-File Report 00-03.
Rauzi, S. L. (2008). Potash and related resources of the Holbrook basin, Arizona.Arizona Geological Survey, Open-file Report OFR 08-07, 23.
Stirrett, T. A. (2010).Historical Geological Resource Calculation for Karlsson Group Property Holdings Holbrook Basin, Arizona, USA.Saskatoon: North Rim Exploration.
Stirrett, T. A. (2011).Technical Summary Report for 2011 Encanto Potash Inc. Potash Resource Assessment for Muskowekwan First Nations Home Reserve.Saskatoon: North Rim.
Warren, J. K. (2006).Evaporites, Sediments, Resources and Hydrocarbons.Germany: Springer.
Williams-Stroud, S. (1994). The Evolution of an Inland Sea of Marine Origin to a Non-Marine Saline Lake: The Pennsylvanian Paradox Salt.Society for Sedimentary Geology. Special Publication No. 50, 293 — 306.
Winters, S. (1963).Supai Formation (Permian) of Eastern Arizona.Geological Society of America Memoir.
28.0Certification of Qualified Person
Page 90 of 100
| | | |
| | Avord Tower
1020 - 606 Spadina Crescent East
Saskatoon, SK, S7K 3H1 Canada
Telephone: (306) 244-4878 |
I, Tabetha A. Stirrett, P.Geo., of Saskatoon, Saskatchewan, do hereby certify:
| | • | | I am a consultant of North Rim Exploration Ltd, Avord Tower, 1020-606 Spadina Crescent, Saskatoon, SK, Canada S7K 3H1. |
| |
| | • | | This certificate applies to the technical report entitled Technical Summary Report, American West Potash, LLC, 2011 Potash Resource Assessment for the Holbrook Basin Project, dated October 17, 2011 (the “Technical Report”). |
| |
| | • | | I am a graduate of University of Saskatchewan, (B.Sc. of Science, Geology Major, 1997). I am a member in good standing of the Association of Professional Engineers and Geoscientists of Saskatchewan, License 10699. My relevant experience I have been involved with potash, coal, oil and gas, and mineral exploration, including since 1997. Tasks included: Planned and supervised potash, coal and gold drill hole programs. Logged and interpreted potash, coal and gold mineral cores. Assisted in the preparation of technical reports. Conducted due diligence reviews on potash properties in Australia, Arizona (USA), North Dakota (USA) and Saskatchewan (Canada). Acquisition, review and interpretation of geophysical wireline logs. I am a “Qualified Person” for purposes of National Instrument 43-101 (the “Instrument”). |
| |
| | • | | My most recent personal inspection of the Property was from June 6 to 12th, 2011. |
| |
| | • | | I am responsible for all of Sections of the Technical Report. |
| |
| | • | | I am independent of American West Potash as defined by Section 1.4 of the instrument. |
| |
| | • | | I have prior involvement with the Property that is the subject of the Technical Report. |
| |
| | • | | I have read the Instrument and the parts of the Technical Report that I am responsible for and they have been prepared in compliance with the Instrument. |
| |
| | • | | As of the date of this certificate, to the best of my knowledge, information and belief, the parts of the Technical Report that I am responsible for contains all scientific and technical information that is required to be disclosed to make the Technical Report not misleading. |
Signed and dated this 17th day of October, 2011 at Saskatoon, Saskatchewan.
| | | |
| | |
| | | |
| /s/ Tabetha Stirrett | | |
Tabetha Stirrett, P.Geo. North Rim Exploration Ltd. | | |
| | | |
| | Avord Tower
1020 - 606 Spadina Crescent East
Saskatoon, SK, S7K 3H1 Canada
Telephone: (306) 244-4878 |
October 17, 2011
Consent of Qualified Person
I, Tabetha A. Stirrett, P. Geo., consent to the public filing of the Technical Report titled “Technical Summary Report, American West Potash, LLC, 2011 Potash Resource Assessment for the Holbrook Basin Project”, and dated October 17, 2011 (the “Technical Report”) by North Rim Exploration Ltd.
I also consent to any extracts from or a summary of the Technical Report for the Holbrook Basin Project, dated October 17, 2011, of North Rim Exploration Ltd.
I certify that I have read the Technical Report for the Holbrook Basin Project being filed by American West Potash LLC and that it fairly and accurately represents the information in the sections of the Technical Report for which I am responsible.
| | | |
Dated this 17th day of October, 2011 | | |
| | |
| | | |
| /s/ Tabetha A. Stirrett | | |
Signature of Qualified Person | | |
| | | |
| Tabetha A. Stirrett, P.Geo. | | |
Print name of Qualified Person | | |
| | | |
| | Avord Tower
1020 - 606 Spadina Crescent East
Saskatoon, SK, S7K 3H1 Canada
Telephone: (306) 244-4878 |
I, Earl Gebhardt, of Saskatoon, Saskatchewan, do hereby certify:
| | • | | I am an Independent Engineering Consultant with North Rim Exploration Ltd. with a business address at Avord Tower, 1020-606 Spadina Crescent, Saskatoon, SK, Canada S7K 3H1. |
| |
| | • | | This certificate applies to the technical report entitled Technical Summary Report, American West Potash, LLC, 2011 Potash Resource Assessment for the Holbrook Basin Project, dated October 17, 2011 (the “Technical Report”). |
| |
| | • | | I am a graduate of University of Saskatchewan, (Degree in Mining Engineering in 1974). l am a member in good standing of the Association of Professional Engineers and Geoscientists of Saskatchewan, License #04239. My relevant experience is related to work at various engineering capacities for the Potash Corporation of Saskatchewan from 1981 to the end of 2004. I was employed for 20 years at the Lanigan operations primarily as Chief Mine Engineer, but also in other supervisory and managerial capacities. I spent about 10 years in hard rock mining in various mining engineering projects. I am a “Qualified Person” for purposes of National Instrument 43-101 (the “Instrument”). |
| |
| | • | | I have not visited the project area site. |
| |
| | • | | I am responsible for reviewing all sections of the Technical Report. |
| |
| | • | | I am independent of American West Potash LLC of the tests presented in Section 1.4 of National Instrument 43-101. |
| |
| | • | | I have prior involvement with the Property that is the subject of the Technical Report. |
| |
| | • | | I have read the Instrument and the parts of the Technical Report that I am responsible for and have been prepared in compliance with the Instrument. |
| |
| | • | | As of the date of this certificate, to the best of my knowledge, information and belief, the parts of the Technical Report that I am responsible for contains all scientific and technical information that is required to be disclosed to make the Technical Report not misleading. |
Signed and dated this 17th day of October, 2011 at Saskatoon, Saskatchewan.
| | | |
| /s/ Earl J. Gebhardt | |  |
Earl J. Gebhardt, P.Eng. Independent Engineering Consultant North Rim Exploration Ltd. | |
| | | |
| | Avord Tower
1020 - 606 Spadina crescent East
Saskatoon, SK, S7K 3H1 Canada
Telephone: (306) 244-4878 |
October 17, 2011
Consent of Qualified Person
I, Earl J. Gebhardt, P.Eng., consent to the public filing of the Technical Report titled “Technical Summary Report, American West Potash, LLC, 2011 Potash Resource Assessment for the Holbrook Basin Project”, and dated October 17, 2011 (the “Technical Report”) by North Rim Exploration Ltd.
I also consent to any extracts from or a summary of the Technical Report for the Holbrook Basin Project, dated October 17, 2011, of North Rim Exploration Ltd.
I certify that I have read the Technical Report for the Holbrook Basin Project being filed by American West Potash LLC and that it fairly and accurately represents the information in the sections of the Technical Report for which I am responsible.
Dated this 17th day of October, 2011
| | | |
| /s/ Earl J. Gebhardt | |  |
Signature of Qualified Person | |
| | |
| Earl J. Gebhardt, P.Eng. | |
Print name of Qualified Person | | |
| | |
| | | |
 | | American West Potash, LLC Holbrook Basin project
2011 Potash Resource Assessment |
Appendix A
Seismic Data
2011 Holbrook 2D
Seismic Interpretation
Phase 1 Report
Holbrook, Arizona
Prepared for:
Prospect Global
600 — 17th Ave SE
Denver, CO
80202
Prepared by:
RPS Boyd PetroSearch
1200, 800 — 6th Ave S.W.
Calgary, AB
T2P 3G3
September 29th, 2011
Project 20111009
boydpetro.com | rpsgroup.com/canada

Suite 1200, 800 — Sixth Avenue S.W., Calgary, Alberta T2P 3G3 Canada
T +1 403 233 2455 F +1 403 262 4344 E rpscal@rpsgroup.com
w www rpsgroup.com/canada
September 29th, 2011
Job No. 20111009
| | |
| Re: | | 2011 Holbrook 2D — Phase 1 Interpretation Report |
Dear Pat,
Please find attached our report documenting the Interpretation of Phase 1 of the 2011 Holbrook 2D seismic program completed by RPS Boyd PetroSearch on behalf of Prospect Global.
We have thoroughly enjoyed working on this project with you and your team and look forward to working on the next phases of your exploration efforts.
Yours sincerely,
RPS Energy

Roger Edgecombe, M.Sc., P.Geo., P.Geoph.
Manager Potash Division
encl.
| | |
| | | |
| United Kingdom | USA | Canada | Australia | Malaysia | Ireland | Netherlands | Singapore | Russia | Brazil | |  |
EXECUTIVE SUMMARY
As part of a subsurface investigation for the development of a future mine site, Prospect Global contracted RPS Boyd PetroSearch to provide technical oversight and to interpret approximately 53 linear miles of two dimensional (2D) seismic data in the area of Holbrook Arizona, USA. The primary objective of the project was to extend the geological knowledge in an area where previous information was spatially limited, specifically with the intent of delineating the Supai Evaporite sequence. The 2D seismic data provide subsurface information that facilitates the assessment of geologic conditions for potential future mining operations. Maps created from the 2D data will be used to assist mine planners in assessing potash potential in this area, in directing future drilling programs and may also be used for defining future seismic operations.
The 2011 Holbrook 2D program was located within a portion of Townships 16-19N, Ranges 25-26E, in Apache County, Arizona. In general, the quality of the processed Holbrook 2D data is fair (shallow) to good (deep). The data have usable frequencies up to 100 Hz, and provide only sufficient resolution for the broad objectives of the project; regional structural mapping, identifying areas of salt collapse/removal and fault delineation. Direct identification and mapping of the potash beds is beyond the data’s resolution.
Initially, only two wells containing sonic information (1-17 in T16N R25E & 1-56 in T19N R27E) existed within the project area. Neither well had logs which penetrated the Permian Upper Supai Evaporite, though, and so calibration to the zone of interest had to be based on wells up to 12 miles from the nearest seismic line. Horizon identifications were made based on the sonic logs from Well 1-4 in T14N R25E and Well 1-68 in T19N R27E. As the new drilling proceeded, the new sonic log information was continually incorporated into the data set, allowing a more precise and accurate identification of horizons to be made.
At the time of the writing of this report the Holbrook 2D dataset has not been depth converted.
A published map of the Permian Coconino Sandstone structure (stratigraphically above the Supai Formation) shows the project area to be located within a broad “saddle” feature, where the bedding is relatively flat. The recent drilling results confirm that, as the elevation of the Supai in all wells to date are within +/- 50 feet of each other despite separations of up to 13 miles. Several isolated structural features have been identified within the Holbrook 2D dataset, from minor seismic “bumps” to larger structural highs and some deep-seated faults.
No new evidence of extensive Supai Evaporite removal/collapse anomalies has been identified on the 2011 Holbrook 2D. However, a large salt removal feature can be seen to the southeast of the area on Lines 4 and 7, corresponding to the published edge of potash deposition. Minor features on the order of 300-400 feet across are apparent elsewhere. Further 2D and/or 3D delineation would be required to evaluate the possibility of undetected collapse features between the widely-spaced 2D lines.
Ongoing geological/geophysical interpretation of the area is required, as surface drilling and additional 2D data acquisition continues. Future programs would be used to identify and resolve collapse features, direct drilling programs and to locate anomalies that may not have been observed within the existing 2D dataset.
| | | | | |
| RPS Boyd PetroSearch | | 2011 Holbrook 2D — Final Interpretation Report | | - i - |
TABLE OF CONTENTS
| | | | | |
EXECUTIVE SUMMARY | | | I | |
| | | | | |
TABLE OF CONTENTS | | | II | |
| | | | | |
LIST OF FIGURES | | | IV | |
| | | | | |
LEGAL NOTICE | | | V | |
| | | | | |
1.0 INTRODUCTION | | | 1 | |
| | | | | |
2.0 POTASH INDUSTRY SEISMIC EXPERIENCE | | | 3 | |
| | | | | |
| 2.1 SEISMIC INVESTIGATION TECHNIQUES | | | 3 | |
| | | | | |
| 2.2 TWO DIMENSIONAL SEISMIC ACQUISITION | | | 4 | |
| | | | | |
| 2.3 THREE DIMENSIONAL SEISMIC ACQUISITION | | | 4 | |
| | | | | |
| 2.4 PROJECT DESIGN AND MANAGEMENT | | | 4 | |
| | | | | |
3.0 DATA PROCESSING & CORRELATION | | | 6 | |
| | | | | |
| 3.1 DATA ACQUISITION | | | 6 | |
| | | | | |
| 3.2 DATA PROCESSING IN TIME DOMAIN | | | 6 | |
| | | | | |
| 3.3 SEISMIC CORRELATION | | | 6 | |
| | | | | |
| 3.4 SEISMIC HORIZON PICKING | | | 8 | |
| | | | | |
| 3.5 SEISMIC EVENTS | | | 10 | |
| | | | | |
| 3.5.1 LOWER CHINLE | | | 10 | |
| | | | | |
| 3.5.2 COCONINO | | | 10 | |
| | | | | |
| 3.5.3 SUPAI | | | 10 | |
| | | | | |
| 3.5.4 BASE POTASH | | | 10 | |
| | | | | |
| 3.5.5 MKR1 | | | 10 | |
| | | | | |
| 3.5.6 MKR2 | | | 11 | |
| | | | | |
| 3.5.7 PRECAMBRIAN | | | 11 | |
| | | | | |
4.0 INTERPRETATION PROCEDURES | | | 12 | |
| | | | | |
| 4.1 GENERAL COMMENTS | | | 12 | |
| | | | | |
| 4.2 INTERPRETATION RISK ASSESSMENT | | | 12 | |
| | | | | |
| 4.2.1 STRUCTURAL ERRORS | | | 12 | |
| | | | | |
| 4.2.2 ISOCHRON ERRORS | | | 14 | |
| | | | | |
5.0 INTERPRETATION ANALYSIS | | | 17 | |
| | | | | |
| 5.1 COLLAPSE FEATURES | | | 17 | |
| | | | | |
| 5.2 SUPAI TIME STRUCTURE | | | 17 | |
| | | | | |
| 5.3 SUPAI TO MKR1 ISOCHRON | | | 21 | |
| | | | | |
| 5.4 PRECAMBRIAN STRUCTURE | | | 23 | |
| | | | | |
| RPS Boyd PetroSearch | | 2011 Holbrook 2D — Final Interpretation Report | | - ii - |
| | | | | |
6.0 Conclusions | | | 27 | |
| | | | | |
7.0 RECOMMENDATIONS | | | 28 | |
| | | | | |
8.0 DIGITAL INFORMATION | | | 29 | |
| | | | | |
| 8.1 FINAL PRODUCTS | | | 29 | |
| | | | | |
| 8.2 DATA STORAGE | | | 29 | |
| | | | | |
APPENDIX A — LIST OF MAP ENCLOSURES | | | 31 | |
| | | | | |
| A-1 MAP ENCLOSURES | | | 31 | |
| | | | | |
| RPS Boyd PetroSearch | | 2011 Holbrook 2D — Final Interpretation Report | | - iii - |
LIST OF FIGURES
| | | | | |
| FIGURE 1: MAP ILLUSTRATING THE 2011 HOLBROOK 2D SEISMIC PROJECT DATASET | | | 2 | |
| FIGURE 2: WELLS WITH SONIC LOGS FOR USE IN THE 2011 HOLBROOK 2D PROJECT INTERPRETATION, SHOWN IN SQUARE OUTLINES | | | 7 | |
| FIGURE 3: ILLUSTRATION OF A WELL TIE FOR THE 2011 HOLBROOK 2D PROJECT, USING LOGS FROM KG-8 ON LINE 8 | | | 8 | |
| FIGURE 4: 2D SEISMIC LINE 3 ILLUSTRATING THE SEISMIC HORIZONS PICKED THROUGHOUT THE HOLBROOK DATASET | | | 9 | |
| FIGURE 5: REPRESENTATIVE AMPLITUDE SPECTRUM OF LINE 5 FROM THE 2011 HOLBROOK 2D DATASET AT WELL KG-10 | | | 13 | |
| FIGURE 6: CROSS PLOT OF SUPAI STRUCTURAL ELEVATION AGAINST SUPAI SEISMIC TIME | | | 14 | |
| FIGURE 7: CROSS PLOT OF NET POTASH THICKNESS AGAINST SUPAI TO BASE POTASH SEISMIC ISOCHRON | | | 15 | |
| FIGURE 8: CROSS PLOT OF NET POTASH THICKNESS AGAINST SUPAI TO MKR1 SEISMIC ISOCHRON | | | 16 | |
| FIGURE 9: ILLUSTRATION OF DISSOLUTION COLLAPSE FEATURES DUE TO SALT REMOVAL ON LINE 3 | | | 18 | |
| FIGURE 10: LOCATION OF SALT COLLAPSE FEATURES ON LINE 3, BETWEEN WELLS KG-4 AND KG-6 | | | 19 | |
| FIGURE 11: SUPAI TIME STRUCTURE MAP (MS) | | | 20 | |
| FIGURE 12: SUPAI TO MKR1 ISOCHRON MAP (MS) | | | 22 | |
| FIGURE 13: SE END OF LINE 4 SHOWING PROBABLE EDGE OF UPPER SUPAI EVAPORITES | | | 23 | |
| FIGURE 14: PRECAMBRIAN TIME STRUCTURE MAP (MS) | | | 25 | |
| FIGURE 15: LINE 9 SHOWING PRECAMBRIAN FAULTS AND ASSOCIATED CHARACTER ANOMALY | | | 26 | |
| | | | | |
| RPS Boyd PetroSearch | | 2011 Holbrook 2D — Final Interpretation Report | | - iv - |
LEGAL NOTICE
This document was prepared by Boyd Exploration Consultants Ltd. (operating as RPS Boyd PetroSearch) solely for the benefit of Prospect Global.
Neither RPS Boyd PetroSearch, their parent corporations or affiliates, nor any person acting in their behalf:
| | • | | make any warranty, expressed or implied, with respect to the use of any information or methods disclosed in this document; or |
| |
| | • | | assumes any liability with respect to the use of any information or methods disclosed in this document. |
Any recipient of this document, by their acceptance or use of this document, releases RPS Boyd PetroSearch and their sub-contractors, their parent corporations and affiliates from any liability for direct, indirect, consequential, or special loss or damage whether arising in contract, warranty, express or implied, tort or otherwise, and irrespective of fault, negligence, and strict liability.
| | | | | | | |
| Project Title | | 2011 Holbrook 2D — Seismic Interpretation — Phase 1 Report |
| | | | | | | |
| Project Number | | 20111009 | | | | |
| | | | | Date of Issue | | September 29th, 2011 |
| | | AUTHOR: | | Project Manager | | Peer Review |
| Name | | Bob Borowski | | Roger Edgecombe | | Roger Edgecombe |
| | | | | | | |
| | | RPS Boyd PetroSearch |
| | | 1200, 800 - 6th Ave S.W. |
| File Location: | | Calgary, AB T2P 3G3 |
| | | T : (403) 233-2455 | F : (403) 262-4344 | E : rpscal@rpsgroup.com |
| | | | | |
| RPS Boyd PetroSearch | | 2011 Holbrook 2D — Final Interpretation Report | | - v - |
1.0 INTRODUCTION
Over the last decade, the surface seismic method has gained widespread recognition in the potash industry, both as a valuable mine planning tool and as an analytical tool for anomalous underground encounters at the mining level. Today, problems such as analysis of site-specific solution collapse anomalies, void space mapping, and brine inflow site identification are being solved through the use of surface seismic investigations.
Historically, the seismic method was first employed in the potash industry in Canada during the 1950’s and 1960’s. Despite slow acceptance, the potash industry began to view the seismic method as a useful tool. By incorporating regional two dimensional (2D) studies over large areas, mine planning progressed from simple geological extrapolation between test holes to more detailed evaluation of the subsurface. These initial 2D programs allowed for the identification and mapping of regional collapses as well as larger Winnipegosis mound features.
As the demand for seismic increased, the acceptance of the seismic method’s ability to answer questions about the subsurface grew, and in turn, the ability of the seismic method to resolve smaller features evolved. From the initial regional density of two mile grids to seismic lines every 400 metres, the two dimensional seismic method evolved to be used for the identification of smaller and smaller features. In the mid 1980’s, the three dimensional (3D) seismic method was introduced and the ability to create finely detailed, spatially correct images of the subsurface gained popularity. Today, six to ten 3D seismic surveys are acquired each year for potash mines in Canada.
The recognition by earth scientists and mining engineers of the on-going potential of seismic to contribute to the success of a mining operation has driven the continual evolution of the method. Today, the seismic method is used in a variety of applications in the potash industry, some proven by successes and some in the research and development stage.
The 2011 Holbrook 2D program was located within a portion of Townships 16-19N, Ranges 25-26E in Apache County, Arizona, about 24 miles east of the town of Holbrook. As illustrated in Figure 1, the dataset consists of nine two dimensional (2D) seismic lines, totalling 53 linear miles, shot on behalf of Prospect Global by Zonge International Inc. The data was recorded in the spring of 2011 using an accelerated weight drop source, with 30 m source/15 m group intervals, and processed by Excel Geophysical in Denver, Colorado. Field design, parameter selection and processing procedures were conducted by the acquisition and processing contractors independently of RPS Boyd recommendations.
The target of the seismic survey are potash beds in the Supai Evaporite, part of Permian aged Upper Supai Formation which occurs at approximately 1000 to 1500 feet below ground level in this area. This report presents the results of the interpretation of the 2011 Holbrook 2D dataset (Figure 1) completed by RPS Boyd PetroSearch on behalf of Prospect Global. The interpretation results presented in this report contain cross sectional views of individual lines and plan view maps of surface structure and isopach maps. Full scale digital copies of the maps are provided as enclosures to this report (Appendix A).
| | | | | |
| RPS Boyd PetroSearch | | 2011 Holbrook 2D — Final Interpretation Report | | - 1 - |
Figure 1: Map illustrating the 2011 Holbrook 2D seismic project dataset.
| | | | | |
| RPS Boyd PetroSearch | | 2011 Holbrook 2D — Final Interpretation Report | | - 2 - |
2.0 POTASH INDUSTRY SEISMIC EXPERIENCE
RPS Boyd PetroSearch is well qualified to perform the services outlined. RPS Boyd PetroSearch (RPS) has been involved with seismic acquisition and interpretation since 1977. Specifically, RPS has been involved with potash mine development, salt mine development and gas and chemical storage facilities since 1984. RPS has conducted similar potash projects for a number of companies, including BHP Billiton Canada, Potash Corporation of Saskatchewan, International Minerals Corporation, Mosaic Potash, Potash One, Western Potash, Vale Potash, and Agrium Potash.
RPS Boyd PetroSearch has been the primary seismic consulting firm for all operators in the Canadian potash industry since 1986. As a seismic technology services provider for Potash Corporation of Saskatchewan, Mosaic Potash, Vale Potash Canada, Western Potash, and Agrium Potash, RPS has an unprecedented understanding of evaporitic geological sequences gleaned from thousands of kilometres of 2D and thousands of square kilometres of 3D seismic.
Over the last 25 years RPS has undertaken in excess of 70 projects at 13 different mine sites. Mining depths on these projects have ranged from less than 450 meters to over 1200 meters. Geological conditions have included both horizontally layered Western Canadian sites and highly structured sites in Canada’s Maritime Provinces. Projects have included high priority, fast track seismic imaging to resolve critical, time-sensitive, and operational concerns. Re-evaluating seismic interpretations subsequent to mining operations has helped our clients ‘calibrate’ seismic signatures to actual mined geology.
Projects typically involve all facets of seismic exploration: survey design, acquisition, processing, interpretation, reporting, and final presentation. For each mine site, all available seismic data (current and historic) is maintained in a single interpretation project for reference when mine operations require immediate information. Final reports and maps are delivered in hard copy and digital formats.
2.1 Seismic Investigation Techniques
The seismic technique involves generating a wave of energy which is transmitted downward through the earth. Seismic energy is generated by small dynamite charges placed in shallow (usually <10 m) auger holes, mechanical weight drop, or vibroseis sources. This energy is reflected upward by many rock boundaries in the subsurface, detected by sophisticated receiving devices on the surface and digitally recorded on magnetic tape. The recorded data is processed and assembled for interpretation. The geophysicist then interprets the processed seismic data and formulates an image of the subsurface.
The interpretation of reflection seismic data is facilitated through the use of synthetic seismograms generated from down hole sonic and density measurements obtained from nearby drill holes. Comparing the computer generated synthetic seismograms to the time based seismic sections allows for the identification of key geological horizons and/or layers.
At the present time it is not possible to directly detect potash ore using surface seismic surveys. This is due to the similar acoustic properties of the potash ore with the surrounding salt. The application of seismic to potash mining has been primarily to map the characteristics of surrounding, seismically visible, strata and infer any changes of these strata to the mining level.
There are several methods of seismic acquisition which can be utilized in the mining industry; however the two predominant techniques are the 2D and 3D seismic methods. Both of these techniques have associated strengths and weaknesses. The primary difference lies in the lateral spatial resolution and the cost of acquisition.
| | | | | |
| RPS Boyd PetroSearch | | 2011 Holbrook 2D — Final Interpretation Report | | - 3 - |
2.2 Two Dimensional Seismic Acquisition
Two dimensional seismic data consists of a straight-line profile which characterizes the subsurface as a vertical plane directly beneath the line. Data is acquired as a straight line with little flexibility for bends or gaps in the line. Uninterrupted lineal surface access is important for good data quality, (i.e. there should be as few gaps in the line for buildings, water wells, lakes etc. as possible). Geological features that are off the line of the profile will generally not be observed, however, in areas with structurally complex geology, 2D seismic will image off-line features. These artefacts are commonly referred to as ‘side-swipe’ features or ‘off-line effects’. Side swipe, even when recognized, can have adverse effects on mapping since measurements made from the seismic data are posted at the data collection point. Furthermore, with 2D data only, there is no evidence to determine which side of the line an off-line effect came from.
2.3 Three Dimensional Seismic Acquisition
Three dimensional seismic data is represented as a volume in which information about the subsurface is contained in all directions. All geological features within the resolution of the seismic frequencies will therefore be observed. Data is acquired as a net of orthogonal source and receiver lines where there is great flexibility in the positioning of the source and receiver points. In addition to logistical benefits, greater benefits are also obtained from 3D datasets in their ability to calculate attributes, amplitude based analyses and in the mapping of geobodies.
2.4 Project Design and Management
RPS Boyd PetroSearch uses customized procedures for project management and interpretation and works continually with the client representatives to optimize these procedures.
| | 1) | | Project Design |
| |
| | | | In conjunction and cooperation with the Client, RPS will: |
| | • | | Determine project requirements and objectives |
| |
| | • | | Review budget constraints |
| |
| | • | | Review available trade seismic data and make any purchase recommendations to Client |
| |
| | • | | Design technical layout and acquisition parameters for new acquisition projects |
| | 2) | | Project Management |
| |
| | | | On behalf of and in conjunction with the Client, RPS will: |
| | • | | Create and submit RFP documents for subcontractors for competitive bidding |
| |
| | • | | Review subcontractor bid proposals and make selections |
| |
| | • | | Provide field supervision as required to ensure contractor compliance to technical specifications |
| |
| | • | | Audit safety component of all subcontractors |
| |
| | • | | Provide daily cost tracking against budget to ensure timely cost management and risk mitigation |
| |
| | • | | Once field operations are completed, provide client with Field Operations Report |
| | | | | |
| RPS Boyd PetroSearch | | 2011 Holbrook 2D — Final Interpretation Report | | - 4 - |
| | 3) | | Data Processing |
| |
| | | | On behalf of and in conjunction with the Client, RPS will: |
| | • | | Oversee processing run stream to ensure optimal data processing |
| |
| | • | | Supervise processing flow and select appropriate technical parameters |
| | • | | Load data from processor onto interpretation workstations |
| |
| | • | | Incorporate new data into existing datasets |
| |
| | • | | Compile well information, existing maps and depth controls to assist in interpretation |
| |
| | • | | Create synthetic seismograms from available sonic log control as required to assist in reflection identification |
| |
| | • | | Perform detailed investigation and analysis of data to identify anomalous features |
| |
| | • | | Where appropriate, convert seismic into depth domain and create depth maps for all key horizons |
| |
| | • | | Present results to Client |
| |
| | • | | Produce report and provide digital copies of all data and interpretation to Client |
It should be noted that for the 2011 Holbrook 2D project, RPS Boyd PetroSearch did not fulfill the role defined above. RPS Boyd PetroSearch was contracted to provide technical oversight. Parameter and contractor selection were completed independently of RPS recommendations.
| | | | | |
| RPS Boyd PetroSearch | | 2011 Holbrook 2D — Final Interpretation Report | | - 5 - |
3.0 DATA PROCESSING & CORRELATION
3.1 Data Acquisition
As previously outlined, the 2011 Holbrook dataset consists of nine 2D seismic lines acquired by Prospect Global in an effort to provide subsurface information over the area (Fig. 1). Field acquisition was performed by Zonge International Inc., during the months of February and March, 2011. At the start up of field operations, RPS Field Supervisor Geoff Boedeker travelled to the site to assist in source parameter selection. A field testing sequence was conducted, with data processing by Excel Geophysical to ensure optimal source effort during the Phase 1 seismic operations
3.2 Data Processing in Time Domain
Seismic data is acquired in the time domain where vertical units are in two-way travel time from the seismic datum to a reflection. The processing, sequence and parameters used for the 2011 Holbrook 2D project were provided by Excel Geophysical, under the supervision of Jerry Schwinkendorf. Final sections were delivered to RPS Boyd for interpretation on April 23rd, 2011. Processing parameters and the processing run stream are not known as the industry practise of including the above information in the seismic header was not completed at the time of writing this report.
3.3 Seismic Correlation
The identification of seismic events is accomplished with the use of synthetic seismograms generated from down-hole density and sonic logs from nearby wells. At the onset of the project, well control with sonic logs was very limited and correlations had to be ‘jumped’ from wells up to 12 miles away (Well 1-4 in T14N R25E and Well 1-68 in T19N R27E). As the drilling program progressed more direct information became available, allowing the seismic events to become confidently defined. Figure 2 shows the well control that is currently available for use in the interpretation.
Additionally, using synthetic seismograms allows the phase of the seismic data to be determined, so the data can then be phase rotated to replicate a positive zero phase wavelet. This is an important step in the interpretation as it is imperative to know if a ‘peak’ on the data represents a positive or negative reflection coefficient, corresponding to a velocity increase or decrease. A positive zero phase wavelet is preferred, as it represents a velocity increase, with the maximum energy return being centred on that wavelet’s peak. Ultimately, to obtain this wavelet, a phase rotation of 180 degrees was applied to all the Holbrook lines except Line 1, which tied best at a rotation of -130 degrees.
Figure 3 illustrates the result of the phase correction process, showing the tie of Line 8 to the synthetic of Well KG-8 after the rotation was applied.
| | | | | |
| RPS Boyd PetroSearch | | 2011 Holbrook 2D — Final Interpretation Report | | - 6 - |
Figure 2: wells with sonic logs for use in the 2011 Holbrook 2D Project interpretation, shown in square outlines.
| | | | | |
| RPS Boyd PetroSearch | | 2011 Holbrook 2D — Final Interpretation Report | | - 7 - |
Figure 3: Illustration of a well tie for the 2011 Holbrook 2D Project, using logs from KG-8 on Line 8.
3.4 Seismic Horizon Picking
Following the identification of the seismic signature of individual geological layers from the synthetic seismograms, the seismic events are picked on the stacked processed data. The time structure information of the seismic data has very little inherent interpretive risk where the quality of the reflection is good. Picked horizons where the quality of the reflection is not as strong or consistent may have greater inherent interpretive risk.
Seismic horizon picking is itself based on decisions made by the interpreting geophysicist. Most of the horizons picked for the 2011 Holbrook 2D survey were made using guided automatic computer tracking of laterally continuous and stable seismic horizons. The automatic picking pass is then followed meticulously by manual edits through areas of poorer data.
Overall, the data quality in the Holbrook area through the zone of interest is only fair, due to the relative shallowness of the strata (on the order of 200 to 300 milliseconds depth, in time below the surface). This puts the target formations in a zone of very low fold and makes the data very sensitive to gaps in the acquisition due to surface impediments. Overall, though, there is low interpretive risk associated with this dataset, as the well control provided by the recent drilling has been used to guide the picking throughout the project.
Using Line 3 as an example, Figure 4 illustrates the seismic horizons interpreted throughout the Holbrook dataset.
| | | | | |
| RPS Boyd PetroSearch | | 2011 Holbrook 2D — Final Interpretation Report | | - 8 - |
Figure 4: 2D Seismic Line 3 illustrating the seismic horizons picked throughout the Holbrook dataset.
| | | | | |
| RPS Boyd PetroSearch | | 2011 Holbrook 2D — Final Interpretation Report | | - 9 - |
3.5 Seismic Events
Based on local synthetic well ties, geological markers were extrapolated to the 2011 Holbrook 2D (Fig. 4). In total, seven horizons were extrapolated and interpreted throughout the dataset. The following is a complete description of these seismic horizons, from shallowest to deepest.
3.5.1Lower Chinle
As illustrated in Figure 4, the Lower Chinle peak is the shallowest horizon picked, and one of the least coherent and continuous. The Chinle and Moenkopi Formations are Triassic strata which immediately overlie the Permian. The Lower Chinle event is close to the top of Moenkopi, but was chosen as it provides a somewhat more continuous reflector for picking. Although the Triassic has no particular geologic significance for this study, the horizon provided a useful datum to flatten on in some areas where the lower events were poor and difficult to pick.
3.5.2Coconino
The Coconino is a sandstone unit of Permian age above the Supai. The seismic horizon is picked as a trough (Fig. 4). The trough is a fairly continuous, stable event throughout the data set. The sonic logs are inconsistent at the Coconino top, with some showing negative contrasts, some positive and others with none at all, possibly due to logging effects as well as lithologic changes. Initially picked as a peak event, this was changed as better well ties became available, particularly in the northern portion of the project area.
3.5.3Supai
The Supai peak event correlates closely to the top of the Supai Formation, which is the primary zone of interest in this area as it contains the evaporate sequence in which the potash is found. This event forms at the contrast between the overlying Coconino Sandstone and the underlying Supai clastics. The event is somewhat discontinuous and had to be picked manually in areas. Although the sonic logs were somewhat variable in the event generated at the Supai, a decision was made to change the initial pick of the Supai (a trough) to the peak as that event proved to be a closer representation of the Supai Formation geologic top.
3.5.4Base Potash
This peak event is unidentified, but was chosen as the first event below the potash bearing strata as determined from the well ties. As such, it helps to narrow the definition of that zone, and could be a more precise indicator of the zone’s overall thickness relative to the top of the Supai. However, it is often inconsistent and had to be picked manually in many areas, making it potentially inaccurate.
3.5.5Mkr1
The Mkr1 seismic event represents a geological boundary that is unidentified. The Mkr1 event is a laterally continuous trough that is picked throughout the data set. Although a known geological equivalent is not determined, the seismic horizon is used as a flattening datum, in order to remove regional dip, for interpreting and for isochron mapping. The Mkr1 event is likely to be an internal member of the Upper Supai Formation, but well below the potash beds. Although none of the recently drilled wells have penetrated deep enough to determine a geological correlation, Well 1-7 in T15N R23E does but no tops are available for the deep portion of this well. Thus, no geological correlation is determined.
| | | | | |
| RPS Boyd PetroSearch | | 2011 Holbrook 2D — Final Interpretation Report | | - 10 - |
3.5.6Mkr2
Also unidentified, this deeper peak event is very consistent across the Holbrook area, and is possibly related to the Fort Apache carbonates in the mid Supai. Again, there is no well control in the area to identify the horizon. Although it does seem to correlate to deep events in the 1-7 well’s synthetic, the 1-7 well log looks to have been incorrectly digitized as the derived velocities are unrealistically low, so this apparent correlation is likely spurious and not useable for identifying the event.
3.5.7Precambrian
A peak, this is the deepest reasonably continuous event on the data, below which the data deteriorates into incoherence, and so is interpreted to represent the Precambrian basement surface. It is also the most ‘interpretative’ pick of the project, with no geologic control, but is a valuable horizon in providing definition of the basin as a whole. Deep seated faults can be seen to be originating from beneath this event, which do not appear to significantly impact the upper strata except in the northernmost area. It is thought that these faults may be conduits by which overlying strata might be charged with gas (helium) generated by radioactive decay in the basement rocks.
| | | | | |
| RPS Boyd PetroSearch | | 2011 Holbrook 2D — Final Interpretation Report | | - 11 - |
4.0 INTERPRETATION PROCEDURES
4.1 General Comments
In general, the data quality of the 2011 Holbrook 2D is only fair in the shallow section, from 0 to about 400 ms, but gets better with increasing depth so that events below about 500 ms are quite clear and consistent. As mentioned previously, this is a function of the fold of the data increasing with depth in time. Increasing fold provides much better noise cancellation, as well as more accurate velocity picking and stacking, producing a better signal to noise ratio in the data. Given the shallowness of the zone of interest here, the only way higher fold could be obtained is by recording the data with more closely spaced receiver groups.
The amplitude spectrum in Figure 5 provides an analytical representation of the frequency content typical of the 2D seismic data from the Holbrook area. Using the high frequency of 100 Hz in modelling produces a wavelength of about 150 feet through the Upper Supai interval, for a1/4 wavelength (the limit of resolution) of 37.5 feet. (This is somewhat unrealistic as the wavelet produced by the data’s bandwidth is less than 100 Hz, but it does illustrate the maximum resolution that might be obtained). As the individual potash beds are not found in any well in the Holbrook basin to be over 30 feet thick, this means the potash cannot be seen directly on the seismic data. Its presence or absence can only be inferred indirectly by looking for evidence in the data which could represent thicks, thins or other stratigraphic changes in the Upper Supai. Consequently, only structure and isochon maps have been prepared, with no character interpretation being performed.
The analysis and interpretation of the 2D dataset was completed using WinPics seismic interpretation software on a PC workstation.
4.2 Interpretation Risk Assessment
Although all efforts are made to ensure that the interpretation is correct, some level of uncertainty is always present in the interpretation of any remote sensing data. This level of uncertainty is termed interpretation risk and is discussed in the following sub-sections.
4.2.1Structural Errors
During the processing of 2D and/or 3D seismic data several factors can contribute to structural error. Interactive processing techniques such as velocity analysis and surface static corrections affect the accuracy of the structural interpretation, and are greatly influenced by the quality and fold of the data. Furthermore, the depth migration algorithm can affect the accuracy of the structural placement of reflections, especially in 2D data where ‘out of the plane’ events can be misrepresented. To determine structural accuracy of the Holbrook data, a cross plot showing the relationship of the geologic top’s elevation from the wells against the associated seismic event’s time has been produced for the Supai (Figure 6). This plot shows a very strong linear relationship between the two, indicating that the seismic time structure is accurately representing the geology. Considering the well elevations are only known to within +/- 5 feet, the few wells that fall outside the linear trend on this plot could be attributable to that inaccuracy. Using the trend values will allow the time to be converted to depth, however as the trend is quite linear, this would essentially just amount to relabeling the time contours and would not alter the overall appearance of the time structure maps.
| | | | | |
| RPS Boyd PetroSearch | | 2011 Holbrook 2D — Final Interpretation Report | | - 12 - |
Figure 5: Representative amplitude spectrum of Line 5 from the 2011 Holbrook 2D dataset at Well kg-10.
| | | | | |
| RPS Boyd PetroSearch | | 2011 Holbrook 2D — Final Interpretation Report | | - 13 - |
Figure 6: Cross Plot of Supai Structural Elevation against Supai Seismic Time.
4.2.2Isochron Errors
As an isochron is the time difference between two events, it represents the interval thickness between the two seismic horizons in time. The isochron value is then only as accurate as the events that are picked, and any error in either of the two events will impact the isochron. Although it has been shown above that the Supai event’s time structure is accurate, the same analysis is not possible on deeper events due to the lack of geologic/well control. Also, the isochron will be affected by lateral changes in the velocity of the sediments as well as their thickness, so that if low velocity sediments are replaced by higher velocity materials, the isochron will show a change that is not an actual physical change in overall sediment thickness. At the time of the writing of this report insufficient control exists to determine how stable the isochron interval velocity is in the Holbrook dataset.
Cross plots of an interval’s thickness (total potash in this case) versus the isochron time containing the interval can be made to determine if the isochron is an accurate predictor of that interval. Figure 7 is a plot of the total potash encountered in the new wells versus the isochron of Supai to Base Potash event. Figure 8 is the plot of total potash against the Supai to Mkr1 event. Both the figure labels show the potash value as an elevation, not a thickness. The change in the axis label was necessary to input the data into the interpretation software which generated the plots. Unfortunately, a good linear relationship does not exist between the two in either graph, suggesting neither isochron can accurately predict the potash thickness. It is likely that other factors, such as erosion on the top of the Supai or variations in the salts and anhydrites within the Upper Supai are overwhelming any contributions the potash beds may have on these intervals.
| | | | | |
| RPS Boyd PetroSearch | | 2011 Holbrook 2D — Final Interpretation Report | | - 14 - |
Despite the fact that the quantitative relationship between potash thickness and seismic derived isochrons values cannot be delineated, it is noteworthy that both the continuity of the seismic horizons and the icochron values provide a qualitative assessment of the lateral continuity of the subsurface geology.
Figure 7: Cross plot of net potash thickness against Supai to Base Potash seismic isochron.
| | | | | |
| RPS Boyd PetroSearch | | 2011 Holbrook 2D — Final Interpretation Report | | - 15 - |
Figure 8: Cross plot of net potash thickness against Supai to Mkr1 seismic isochron.
| | | | | |
| RPS Boyd PetroSearch | | 2011 Holbrook 2D — Final Interpretation Report | | - 16 - |
5.0 INTERPRETATION ANALYSIS
The interpretation results are presented in this report as a series of cross sectional views of individual lines and plan view maps of surface structure and isopach maps. Full scale digital copies of the maps are provided as enclosures to this report (Appendix A).
Structural maps for all the horizons picked have been prepared. As the horizons are largely conformable in the Holbrook Project area, with the exception of the Precambrian, the structure maps of the various horizons are similar in appearance. Analysis of the accuracy of these maps was discussed previously, and was shown to be quite good where sufficient geologic control exists. It has been assumed that such accuracy is then true for all the events mapped. Time to depth conversions have not been performed at this time, but could be done for the shallower horizons (Lower Chinle, Coconino and Supai) where accurate well control exists. Conversion factors for deeper events could be estimated but would not be as reliable.
5.1 Collapse Features
Changes in the Supai Horizon indicative of salt removal can be seen in the data. Figure 9, taken from Line 3, is an example. The Supai event here can be seen to show two minor collapse features (i.e. localized thinning of the interval from the Supai to lower events), the location of which is shown in Figure 10. It would be risky to drill into these features as the potash beds are likely to be absent. Given their apparent widths of 300 — 400 feet on the data, it is difficult to depict these features on the maps at the scale at which the project as a whole can be shown (in which the gridding to produce the maps was done using 100 by 100 feet bins), as such small features tend to be smoothed out. One can only be aware such features exist and the data must be examined closely, line by line, to avoid them. Once an area of interest is identified, larger scale maps can be produced to locate the collapses, but these will be constrained by the limitations of the 2D data set’s wide line spacing as to their true size and orientation.
5.2 Supai Time Structure
Figure 11 is the Supai Horizon Time Structure Map, which has been shown above to be quite accurate in depicting the true geologic structure of the Supai Formation. The trend formula given by the cross plot in Figure 6, Y = -1.325X + 1903.036, can be used to calculate the elevation of the Supai from this map by substituting the seismic time for ‘X’ (read from the map) and solving for elevation ‘Y’.
The most prominent feature of this map is the high trending NNE through the north of T17N R26E into T18N R26E. As KG-10 was drilled on this high and had no potash, it was thought that the high might be influencing the deposition of the potash. However, since Wells KG-8 and KG-12 were also drilled on this structure, and both had potash, that does not seem to be the case. It is more likely the high is related to post Triassic movements of the Precambrian, and so had no bearing on the Permian sediments.
The Supai structure may be used to predict the elevation of the potash zone as well, by assuming a relatively consistent isopach between the two. Results of the new drilling show considerable variations in this isopach (Supai to top potash), from as little as 151 feet in KG-13 to as much as 215 feet in KG-4, but averaging 185 feet. This implies accuracy only on the order of +/- 30 feet, which may still be useful but is not as precise as could be desired. From the well logs, it appears that thickness changes are occurring in the overlying salt and anhydrites immediately above the potash zone. It may be that the lower event, the Base Potash, might be more representative of the potash zone structure, but without well control, that cannot be verified.
| | | | | |
| RPS Boyd PetroSearch | | 2011 Holbrook 2D — Final Interpretation Report | | - 17 - |
Figure 9: Illustration of dissolution collapse features due to salt removal on Line 3.
| | | | | |
| RPS Boyd PetroSearch | | 2011 Holbrook 2D — Final Interpretation Report | | - 18 - |
Figure 10: Location of Salt Collapse Features on Line 3, between Wells KG-4 and KG-6.
| | | | | |
| RPS Boyd PetroSearch | | 2011 Holbrook 2D — Final Interpretation Report | | - 19 - |
Figure 11: Supai Time Structure Map (ms).
| | | | | |
| RPS Boyd PetroSearch | | 2011 Holbrook 2D — Final Interpretation Report | | - 20 - |
5.3 Supai to Mkr1 Isochron
The most prominent feature of Supai to Mkr1 Isochron Map is the thinning of the isochron on the SE ends of Line 4 and Line 7 (Figure 12). Figure 13 depicts the thinning on Line 4. The abrupt dropping of all horizons above the Mkr1 Horizon with the deeper horizons continuing unaffected is clear to see. As the thinning is confined to the Upper Supai interval above Mkr1, in which the potash bearing evaporate sequences are found, salt removal and subsequent collapse of the overlying strata seems the logical explanation. This interpretation suggests there is an area of large scale salt removal to the SE of the Holbrook Project area, coincident with, and the reason for, the mapped zero edge of the potash beds. It should be noted that such large features have not been found anywhere else in the project area.
Smaller areas of possible salt removal and collapse are evident on some of the seismic lines and have been discussed previously. Areas on the Supai to Mkr1 Isochron Map which have a light blue to greenish colour, are relative thins and should be examined in more detail in assessing the potash potential (Figure 12). Again, though, the true extent and configuration of these thins cannot be determined from the limited 2D coverage presently available.
| | | | | |
| RPS Boyd PetroSearch | | 2011 Holbrook 2D — Final Interpretation Report | | - 21 - |
Figure 12: Supai to Mkr1 Isochron Map (ms).
| | | | | |
| RPS Boyd PetroSearch | | 2011 Holbrook 2D — Final Interpretation Report | | - 22 - |
Figure 13: SE End of Line 4 showing probable edge of Upper Supai Evaporites.
5.4 Precambrian Structure
Figure 14is the Precambrian Time Structure Map. It only differs significantly from the other maps in the area immediately east of KG-3 (in T17N R25E), where the event drops quite abruptly into a low filled with angularly unconformable sediments. This low is evident in Figure 4, shown previously to illustrate the horizons picked in the interpretation. The overlying Supai Formation strata do not seem to be influenced by this low in either structure or isopach however. Given the complete lack of deep geologic control, the feature is pointed out only as an academic interest.
Some other features of possible interest are basement faults and associated character anomalies seen on lines 8 and 9 to the north (T18N R26E), and represented as the dark blue lines in Figure 14. Figure 15 is a coloured variable area display of Line 9, chosen to enhance amplitude variations. A band of anomalously strong amplitudes (‘bright spots’) are evident at about 600 ms, which are clearly associated with Precambrian faulting and uplift. These events are about 200 ms below the top of the Supai, which would equate to an interval of about 1500 feet. Stratigraphically, that would likely place the events in the Fort Apache Member or Lower Supai. Although lower velocity and density evaporite beds could have the contrasts necessary to produce these high amplitudes, the occurrence of such sediments in the Fort Apache or Lower Supai has not been documented to the author’s knowledge.
| | | | | |
| RPS Boyd PetroSearch | | 2011 Holbrook 2D — Final Interpretation Report | | - 23 - |
It is possible that the bright spots may be a gas effect (reduction of rock velocity and density due to replacement of pore fluids with gas), caused by gas seeping up along the faults and becoming trapped in porous beds. Such gas effects are common in other sedimentary basins, where they can be direct hydrocarbon indicators. In this case, the gas would likely be helium, which is found trapped in the Coconino Sandstone in wells to the north of the prospect area. As a product of radioactive decay in granitic rocks (i.e. the Precambrian), migration of the gas along basement fault planes seems entirely plausible.
Again, the bright spots are only of academic interest but they do offer interesting alternative exploration possibilities.
| | | | | |
| RPS Boyd PetroSearch | | 2011 Holbrook 2D — Final Interpretation Report | | - 24 - |
Figure 14: Precambrian Time Structure Map (ms).
| | | | | |
| RPS Boyd PetroSearch | | 2011 Holbrook 2D — Final Interpretation Report | | - 25 - |
Figure 15: Line 9 showing Precambrian faults and associated character anomaly.
| | | | | |
| RPS Boyd PetroSearch | | 2011 Holbrook 2D — Final Interpretation Report | | - 26 - |
6.0 CONCLUSIONS
The 2011 Holbrook 2D program was conducted to complement and enhance the geologic knowledge of the Holbrook Basin in an area of sparse well control. The specific intent of the program was to delineate the Upper Supai Evaporite sequence by providing subsurface information to allow regional structural mapping, to identify areas of salt dissolution and removal, and to locate any faulting in the geological section which could adversely affect the planned drilling operations.
Prior to the onset of drilling, a preliminary interpretation was provided which illustrated that the proposed drilling locations were well positioned and avoided subsurface anomalies. As additional information in the form of well logs and digits were received, the seismic interpretation was continually refined to the point described in this report.
Based on the integrated work completed to date, the following conclusions are derived:
| | • | | The seismic data is accurately correlated to the geologic formations. The new drilling, with modern geophysical logs, has provided synthetic seismograms from which the zone of interest can be identified. The additional well ties allow seismic events to be followed laterally with confidence. |
| |
| | • | | The seismic time structure of the Supai Formation correlates well to the elevations determined from boreholes. As a result, the elevation of the Supai can be confidently predicted from the seismic data in areas away from the wells. The elevation of the potash zones could be derived from the Supai, but will be limited by the consistency of the geology. |
| |
| | • | | Information provided from the 2D seismic data set allows for the determination of the overall basin configuration. The isochrons of the Upper Supai show a thin edge conforming to previously published work (Rauzi, Arizona Geologic Survey) for the potash basin. This also confirms the seismic data’s ability to detect such areas. |
| |
| | • | | Lateral continuity of the geologic strata is confirmed over most of the project area. No areas of large scale salt dissolution and/or removal, nor any other features indicative of erosion or channelling which might remove the formations, have been identified in the data. Minor features are present, but are easily avoided by evaluating the seismic dataset prior to positioning new drill locations. |
| |
| | • | | No faulting of the Upper Supai strata has been identified, apart from the small areas with limited extent over the small scale dissolution features discussed in the report. Deep faulting is evident, but does not impact the upper strata, except to provide post depositional uplift in some cases. |
| |
| | • | | Based on current well information, directly correlating seismic isochron maps to potash isopachs does not provide a reliable quantitative relationship. The isochron maps are still useful in a qualitative sense, to confirm lateral continuity of formations away from the well ties, but lack predictive accuracy of potash thickness. |
| |
| | • | | A deep exploration play, potentially for helium gas, has been identified. Although outside of the scope of the potash project, it does suggest a future exploration target and the possibility of selling the seismic data to interested parties, to help recoup some incurred expenses. |
| | | | | |
| RPS Boyd PetroSearch | | 2011 Holbrook 2D — Final Interpretation Report | | - 27 - |
7.0 RECOMMENDATIONS
The following recommendations are made based on the interpretation of the seismic data:
As a result of the spatial sampling inaccuracy associated with 2D data, the structures and anomalies identified and interpreted in the Holbrook area may not be in the correct position as they could reside on either side of a 2D seismic line. Identified features may also be of different size and shape, the full extent of which is currently unknown. In addition, it is possible that geological events may exist between the lines of the survey and as such have gone undetected to date. For these reasons, it is suggested that a 3D seismic survey covering the portion of the block with potash mining potential be undertaken prior to initiating any mine workings in the area.
The geophysical interpretation should be integrated with future geological information using a team of Prospect Global geoscientists and RPS Boyd PetroSearch personnel to provide the most comprehensive interpretation of the data. Providing correlations between anomalies at the potash level and associated seismic signature may allow the geophysicist to predict the geology more precisely.
The use of these seismic data for mine planning should rely on detailed examination of the subtle features of maps, profiles and time slices. Regular use of the WinPics archive is encouraged. Note that all of the seismic images and maps found in this report can be reproduced in the WinPics archive system.
Regular use of the GOCAD archive is also encouraged. Several images and maps found in this report can be reproduced and viewed in GOCAD, which is a valuable analytical tool.
| | | | | |
| RPS Boyd PetroSearch | | 2011 Holbrook 2D — Final Interpretation Report | | - 28 - |
8.0 DIGITAL INFORMATION
8.1 Final Products
A DVD has been included with the original copy of this report, which contains the archived data for this project. The project archive DVD is organized into eight main directories and are listed as follows:
| | • | | Report— contains the final report in Microsoft Word and Adobe PDF file formats and the larger 11“x17” report figures in Microsoft Power Point and Adobe PDF file formats. |
| |
| | • | | Images— contains all preliminary Power Point files, screen captures. |
| |
| | • | | Plots— A digital PDF version of all the full sized plots created for this report, as listed in the map enclosures, as well as a PDF of each of the interpreted seismic lines discussed in this report. |
| |
| | • | | Archive— contains horizon ASCII files, and SEGP survey files. |
| |
| | • | | Shape files— contains individual ESRI shape files for the interpreted anomalies as well as key overlay drawing files used in the creation of maps within this report. |
| |
| | • | | SEGY— contains a copy of the 2011 Holbrook 2D dataset in SEGY format. |
| |
| | • | | WinPics— an updated WinPics seismic data archived at RPS Boyd PetroSearch including all seismic data interpreted by RPS Boyd PetroSearch. |
| |
| | • | | GOCAD— merged datasets have also been loaded into GOCAD for archival purposes as well as for 3D visualization and integration of additional data. |
8.2 Data Storage
At the time of the writing of this report, it is unknown if Prospect Global has a data archive service provider. Proper data archiving is critical to ensure data integrity. RPS Boyd PetroSearch recommends that Prospect Global set up a contract with a data archive service.
| | | | | |
| RPS Boyd PetroSearch | | 2011 Holbrook 2D — Final Interpretation Report | | - 29 - |
This Interpretation Report of the 2011 Holbrook 2D Seismic Project Phase 1 is respectfully submitted September 29th, 2011.
| | | |
Roger Edgecombe, M.Sc., P.Geo, P.Geoph. | | |
| Manager Potash Division | | |
| | | | | |
| RPS Boyd PetroSearch | | 2011 Holbrook 2D — Final Interpretation Report | | - 30 - |
APPENDIX A — LIST OF MAP ENCLOSURES
A-1 MAP ENCLOSURES
Below is a list of maps which are included with the 2011 Holbrook 2D Final Interpretation Report. These maps are provided in digital form as support to the work completed. All structure maps are in milliseconds relative to seismic datum and isochron maps are also in milliseconds.
Lower Chinle Time Structure Map
Coconino Time Structure Map
Supai Time Structure Map
Base Potash Time Structure Map
Mkr1 Time Structure Map
Mkr2 Time Structure Map
Precambrian Time Structure Map
Supai to Base Potash Isochron Map
Supai to Mkr1 Isochron Map
| | | | | |
| RPS Boyd PetroSearch | | 2011 Holbrook 2D — Final Interpretation Report | | - 31 - |
| | |
| | | |
| | American West Potash, LLC Holbrook Basin project
2011 Potash Resource Assessment |
Appendix B
Geological Cross Section
| | |
| | American West Potash, LLC Holbrook Basin project
2011 Potash Resource Assessment |
Appendix C
Assay Standards
Quality Control Data
Limits
Potash Exploration Package
| | |
 | | SRC Geoanalytical Laboratories
Potash QC Limits |
POT003 Standard Information
Standard Information
POT003 standard QC values are based on replicate analysis and limits are determinded from 3 sigma
data. This standard is continuously control chart monitored by LIMS to ensure that sample sets
using this standard have passed QC limits.
POTOO3 STD QC LIMITS: I CP2 Potash Exploration Package
| | | | | | | | | |
| Analyte | | Value | | Units | | Upper Limit | | Lower Limit |
| Ag | | 0.2 | | ppm | | 0.5 | | <0.2 |
| AI203 | | O.Ol | | % | | O.Q3 | | O.Ol |
| Ba | | i | | ppm | | 2 | | <1 |
| Be | | 0.2 | | ppm | | 0.4 | | <0.2 |
| CaO | | 0.16 | | % | | 0.18 | | 0.15 |
| Cd | | 1 | | ppm | | 2 | | <1 |
| Ce | | 1 | | ppm | | 2 | | <1 |
| Co | | 1 | | ppm | | 2 | | <1 |
| Cr | | 2 | | ppm | | 3 | | <1 |
| Cu | | 1 | | ppm | | 2 | | <1 |
| Dy | | 0.2 | | ppm | | 0.4 | | <0.2 |
| Er | | 0.2 | | ppm | | 0.4 | | <0.2 |
| Eu | | 0.2 | | ppm | | 0.4 | | <0.2 |
| Fe203 | | 0.01 | | % | | 0.02 | | <0.01 |
| Ga | | 1 | | ppm | | 2 | | <1 |
| Gd | | 1 | | ppm | | 2 | | <1 |
| Hf | | 4.8 | | ppm | | 9.9 | | 1 |
| Ho | | 1 | | ppm | | 2 | | <1 |
| K20 | | 19.5 | | % | | 20.5 | | 18.5 |
| La | | 1 | | ppm | | 2 | | <1 |
| Li | | 1 | | ppm | | 2 | | <1 |
| MgO | | 1.27 | | % | | 1.41 | | 1.13 |
| MnO | | 0.01 | | % | | 0.02 | | <0.01 |
| Mo | | 1 | | ppm | | 2 | | <1 |
| Na20 | | 32.5 | | % | | 33.4 | | 31.3 |
| Nb | | 1 | | ppm | | 2 | | <1 |
| Nd | | 1 | | ppm | | 2 | | <1 |
| Ni | | 1 | | ppm | | 2 | | <1 |
| P205 | | 0.01 | | % | | 0.02 | | <0.01 |
| Pb | | 1 | | ppm | | 2 | | 1 |
| Pr | | 1 | | ppm | | 2 | | <1 |
| S | | 914 | | ppm | | 1304 | | 523 |
| Sc | | 1 | | ppm | | 2 | | <1 |
| Sm | | 1 | | ppm | | 2 | | <1 |
| Sn | | 1 | | ppm | | 2 | | < I |
| Sr | | 7 | | ppm | | 9 | | 5 |
| Ta | | 1 | | ppm | | 2 | | <1 |
| Tb | | 1 | | ppm | | 2 | | <1 |
| Th | | 1 | | ppm | | 2 | | <l |
| Ti02 | | 0.01 | | % | | 0.02 | | <0.01 |
| U, ICP | | 2 | | ppm | | 3 | | <2 |
| V | | 1 | | ppm | | 2 | | <1 |
| W | | 1 | | ppm | | 2 | | <1 |
| Y | | 1 | | ppm | | 2 | | <1 |
| Yb | | 0.1 | | ppm | | 0.2 | | <0.1 |
| Zn | | 1 | | ppm | | 2 | | <1 |
| Zr | | 1 | | ppm | | 2 | | <1 |
| Moisture | | 1.3 | | % | | 2.1 | | 0.6 |
| Insoluble | | 0.9 | | % | | 1.3 | | 0.5 |
QC Limits Potash
Standards Date: 21 June 2010
Page 2 of 3
| | |
| | SRC Geoanalytical Laboratories
Potash QC Limits |
POT004 Standard Information
Standard Information
POT004 standard QC values are based on replicate analysis and limits are determinded from 3 sigma
data. This standard is continuously control chart monitored by LIMS to ensure that sample sets
using this standard have passed QC limits.
POT004 STD QC LIMITS: ICP2 Potash Exploration Package
| | | | | | | | | |
| Analyte | | Value | | Units | | Upper Limit | | Lower Limit |
| Ag | | 0.2 | | ppm | | 0.3 | | <0.2 |
| AI2O3 | | 0.01 | | % | | 0.02 | | <0.01 |
| Ba | | 1 | | ppm | | 2 | | <1 |
| Be | | 0.2 | | ppm | | 0.4 | | <0.2 |
| CaO | | 0.05 | | % | | 0.07 | | 0.03 |
| Cd | | 1 | | ppm | | 2 | | <1 |
| Ce | | 1 | | ppm | | 2 | | <1 |
| Co | | 1 | | ppm | | 2 | | <1 |
| Cr | | 1 | | ppm | | 2 | | <1 |
| Cu | | 1 | | ppm | | 2 | | <1 |
| Dy | | 0.2 | | ppm | | 0.4 | | <0.2 |
| Er | | 0.2 | | ppm | | 0.4 | | <0.2 |
| Eu | | 0.2 | | ppm | | 0.4 | | <0.2 |
| Fe2O3 | | 0.01 | | % | | 0.02 | | <0.01 |
| Ga | | 1 | | ppm | | 2 | | <1 |
| Gd | | 1 | | ppm | | 2 | | <1 |
| Hf | | 1.6 | | ppm | | 2.2 | | 1 |
| Ho | | 1 | | ppm | | 2 | | <1 |
| K2O | | 60.4 | | % | | 62.4 | | 58.4 |
| La | | 1 | | ppm | | 2 | | <1 |
| Li | | 1 | | ppm | | 2 | | <1 |
| MgO | | 0.114 | | % | | 0.152 | | 0.076 |
| MnO | | 0.01 | | % | | 0.02 | | <0.01 |
| Mo | | 1 | | ppm | | 2 | | <1 |
| Na2O | | 1.64 | | % | | 2.03 | | 1.26 |
| Nb | | 1 | | ppm | | 2 | | <1 |
| Nd | | 1 | | ppm | | 2 | | <1 |
| Ni | | 1 | | ppm | | 2 | | <1 |
| P2O5 | | 0.01 | | % | | 0.02 | | <0.01 |
| Pb | | 1 | | ppm | | 2 | | <1 |
| Pr | | 1 | | ppm | | 2 | | <1 |
| S | | 264 | | ppm | | 386 | | 143 |
| Sc | | 1 | | ppm | | 2 | | <1 |
| Sm | | 1 | | ppm | | 2 | | <1 |
| Sn | | 1 | | ppm | | 2 | | <1 |
| Sr | | 1 | | ppm | | 2 | | <1 |
| Ta | | 1 | | ppm | | 2 | | <1 |
| Tb | | 1 | | ppm | | 2 | | <1 |
| Th | | 1 | | ppm | | 2 | | <1 |
| TiO2 | | 0.01 | | % | | 0.02 | | <0.01 |
| U, ICP | | 2 | | ppm | | 3 | | <2 |
| V | | 1 | | ppm | | 2 | | <1 |
| W | | 1 | | ppm | | 2 | | <1 |
| Y | | 1 | | ppm | | 2 | | <1 |
| Yb | | 0.1 | | ppm | | 0.2 | | <0.1 |
| Zn | | 1 | | ppm | | 2 | | <1 |
| Zr | | 1 | | ppm | | 2 | | <1 |
| Moisture | | 0.1 | | % | | 0.2 | | <0.1 |
| Insoluble | | 0.4 | | % | | 0.6 | | 0.2 |
QC Limits Potash Standards
Date: 21 June 2010
Page 3 of 3
| | |
| | American West Potash, LLC Holbrook Basin project
2011 Potash Resource Assessment |
Appendix D
Assay Results
| | | | |
| | | America West Potash
Pat Avery | | Huffman Lab No. 156611
June 15, 2011
Page 1 of 1 |
| | | | | | | | | | | | | | | | | | | | | | | |
| ANALYSIS BASISè | | ARG | | | ARG | | | ARG | | | ARG | | | ARG | |
| REPORTING BASISè | | ARG | | | GMF | | | GMF | | | GMF | | | GMF | |
| | | | | moisture | | | DI H2O | | | H2O soluble | | | H2O soluble | | | H2O soluble | |
| Huffman | | Client | | LOD 105°C | | | Insolubles | | | K as K2O | | | Mg as MgO | | | Na as Na2O | |
| Sample No. | | Sample No. | | % w/w | | | % w/w | | | % w/w | | | % w/w | | | % w/w | |
| 156611-01 | | KG1-001 | | | 0.89 | | | | 18.55 | | | | 4.09 | | | | 0.42 | | | | 39.04 | |
| 156611-01dup | | KG1-001 | | | 0.89 | | | | 18.54 | | | | 4.13 | | | | 0.42 | | | | 39.17 | |
| 156611-02 | | KG1-002 | | | 2.15 | | | | 22.55 | | | | 6.77 | | | | 1.15 | | | | 32.47 | |
| 156611-03 | | KG1-003 | | | 0.61 | | | | 4.53 | | | | 43.51 | | | | 0.30 | | | | 13.36 | |
| 156611-04 | | KG1-004 | | | 1.24 | | | | 16.89 | | | | 20.81 | | | | 0.64 | | | | 25.38 | |
| 156611-05 | | KG1-005 | | | 0.77 | | | | 8.24 | | | | 27.68 | | | | 0.32 | | | | 25.03 | |
| 156611-06 | | KG1-006 | | | 0.74 | | | | 8.66 | | | | 23.60 | | | | 0.33 | | | | 28.05 | |
| 156611-07 | | KG1-007 | | | 0.71 | | | | 7.23 | | | | 25.90 | | | | 0.32 | | | | 26.88 | |
| 156611-08 | | KG1-008 | | | 3.22 | | | | 37.34 | | | | 4.67 | | | | 1.59 | | | | 25.80 | |
| 156611-09 | | KG1-009 | | | 3.51 | | | | 32.44 | | | | 4.24 | | | | 1.80 | | | | 25.87 | |
| 156611-10 | | KG1-010 | | | 0.44 | | | | 3.68 | | | | 2.15 | | | | 0.20 | | | | 47.77 | |
| 156611-11 | | KG1-011 | | | 2.48 | | | | 0.80 | | | | 14.86 | | | | 1.41 | | | | 35.97 | |
| 156611-11dup | | KG1-011 | | | 2.47 | | | | 0.78 | | | | 14.90 | | | | 1.41 | | | | 36.06 | |
| 156611-12 | | KG1-012 | | | 0.18 | | | | 1.56 | | | | 2.22 | | | | 0.09 | | | | 49.41 | |
| 156611-13 | | KG1-013 | | | 0.23 | | | | 0.49 | | | | 2.32 | | | | 0.04 | | | | 49.71 | |
| 156611-14 | | KG1-014 | | | 0.16 | | | | 0.28 | | | | 2.41 | | | | 0.08 | | | | 48.53 | |
| 156611-15 | | KG1-015 | | | 0.08 | | | | 0.53 | | | | 34.97 | | | | 0.08 | | | | 22.40 | |
| 156611-16 | | KG1-016 | | | 0.24 | | | | 0.55 | | | | 6.77 | | | | 0.12 | | | | 42.13 | |
| 156611-17 | | KG1-017 | | | 3.55 | | | | 0.48 | | | | 5.51 | | | | 1.81 | | | | 40.93 | |
| 156611-18 | | KG1-018 | | | 2.78 | | | | 0.14 | | | | 4.28 | | | | 1.41 | | | | 42.39 | |
| 156611-19 | | KG1-019 | | | 1.04 | | | | 0.27 | | | | 1.83 | | | | 0.57 | | | | 42.32 | |
| 156611-20 | | KG1-020 | | | 3.61 | | | | 0.05 | | | | 5.73 | | | | 2.06 | | | | 42.30 | |
| 156611-21 | | KG1-021 | | | 0.37 | | | | 1.54 | | | | 57.99 | | | | 0.22 | | | | 2.78 | |
| 156611-21dup | | KG1-021 | | | 0.36 | | | | 1.57 | | | | 58.36 | | | | 0.22 | | | | 2.78 | |
| 156611-22 | | KG1-022 | | | 4.69 | | | | 0.26 | | | | 11.67 | | | | 2.82 | | | | 37.39 | |
| 156611-23 | | KG1-023 | | | 4.60 | | | | 0.30 | | | | 7.36 | | | | 2.75 | | | | 39.53 | |
| 156611-24 | | KG1-024 | | | 3.94 | | | | 4.21 | | | | 3.69 | | | | 2.32 | | | | 42.27 | |
| 156611-25 | | KG1-025 | | | 5.41 | | | | 13.65 | | | | 4.30 | | | | 2.94 | | | | 35.48 | |
| 156611-26 | | KG1-026 | | | 3.63 | | | | 6.55 | | | | 11.50 | | | | 1.98 | | | | 35.60 | |
| 156611-27 | | KG1-027 | | | 1.20 | | | | 2.47 | | | | 1.57 | | | | 0.66 | | | | 48.12 | |
| 156611-28 | | KG1-028 | | | 0.50 | | | | 0.49 | | | | 0.75 | | | | 0.28 | | | | 51.29 | |
| 156611-29 | | KG1-029 | | | 0.57 | | | | 0.33 | | | | 0.98 | | | | 0.32 | | | | 51.77 | |
| 156611-30 | | KG1-030 | | | 1.00 | | | | 0.14 | | | | 1.42 | | | | 0.53 | | | | 50.65 | |
| 156611-31 | | KG1-031 | | | 2.06 | | | | 0.79 | | | | 19.07 | | | | 1.22 | | | | 34.67 | |
| 156611-31dup | | KG1-031 | | | 2.05 | | | | 0.81 | | | | 19.05 | | | | 1.21 | | | | 34.67 | |
| 156611-32 | | KG1-032 | | | 0.34 | | | | 0.09 | | | | 0.76 | | | | 0.20 | | | | 52.18 | |
| 156611-33 | | KG1-033 | | | 0.53 | | | | 0.21 | | | | 1.11 | | | | 0.30 | | | | 51.51 | |
| 156611-34 | | KG1-034 | | | 0.82 | | | | 0.62 | | | | 2.69 | | | | 0.47 | | | | 46.46 | |
| 141511-01 | | SQ-01 | | | 10.10 | | | | 0.24 | | | | 18.43 | | | | 9.47 | | | | 18.98 | |
| 141511-02 | | SQ-02 | | | 3.04 | | | | 2.82 | | | | 41.28 | | | | 1.76 | | | | 13.89 | |
| 141511-03 | | SQ-03 | | | 0.12 | | | | 1.64 | | | | 0.55 | | | | 0.06 | | | | 51.67 | |
| 141511-04 | | SQ-04 | | | 1.29 | | | | 47.48 | | | | 2.90 | | | | 0.49 | | | | 22.28 | |
ANALYSIS AND REPORTING BASIS
ARG = As received then pre-dried at 90°C as needed for grinding, then ground sample basis
GMF = ARG sample basis calculated to ground and dried, moisture free basis at 105°C
As received samples were pre-dried as needed, crushed, split, and ground to nominal -200 mesh prior to analyses.
Aliquots were dried for 24 hours at 105°C in air for loss on drying (moisture) determination, which was used for calculation of other analyses to a moisture free basis.
Insolubles and soluble K, Na, Mg (reported as oxides) were determined from DI water leach at 30°C, with agitation for 1 hour, and nominal weight to volume ratio of 1:100 (nominal 1. gram of sample to 100.ml of DI).
| | | | |
| | | | | |
| | | America West Potash | | Huffman Lab No. 159211 |
| | | | | June 16, 2011 |
| | | Pat Avery | | Page 1 of 1 |
| | | | | | | | | | | | | | | | | | | | | | | |
| ANALYSIS BASISè | | ARG | | | ARG | | | ARG | | | ARG | | | ARG | |
| REPORTING BASISè | | ARG | | | GMF | | | GMF | | | GMF | | | GMF | |
| | | | | moisture | | | DI H2O | | | H2O soluble | | | H2O soluble | | | H2O soluble | |
| Huffman | | Client | | LOD 105°C | | | insolubles | | | K as K2O | | | Mg as MgO | | | Na as Na2O | |
| Sample No. | | Sample No. | | % w/w | | | % w/w | | | % w/w | | | % w/w | | | % w/w | |
| 159211-01 | | KG2-001 | | | 1.23 | | | | 18.10 | | | | 1.17 | | | | 0.53 | | | | 41.14 | |
| 159211-01dup | | KG2-001 | | | 1.21 | | | | 18.17 | | | | 1.17 | | | | 0.52 | | | | 41.07 | |
| 159211-02 | | KG2-002 | | | 0.90 | | | | 12.52 | | | | 0.92 | | | | 0.40 | | | | 44.30 | |
| 159211-03 | | KG2-003 | | | 0.40 | | | | 6.13 | | | | 1.05 | | | | 0.18 | | | | 46.22 | |
| 159211-04 | | KG2-004 | | | 0.10 | | | | 0.66 | | | | 6.19 | | | | 0.05 | | | | 47.38 | |
| 159211-05 | | KG2-005 | | | 1.05 | | | | 12.97 | | | | 10.52 | | | | 0.48 | | | | 30.90 | |
| 159211-06 | | KG2-006 | | | 1.26 | | | | 8.97 | | | | 8.76 | | | | 0.63 | | | | 39.39 | |
| 159211-07 | | KG2-007 | | | 2.48 | | | | 28.97 | | | | 1.91 | | | | 1.02 | | | | 33.73 | |
| 159211-08 | | KG2-008 | | | 1.45 | | | | 15.99 | | | | 3.01 | | | | 0.60 | | | | 39.85 | |
| 159211-09 | | KG2-009 | | | 0.78 | | | | 8.87 | | | | 1.63 | | | | 0.33 | | | | 44.80 | |
| 159211-10 | | KG2-010 | | | 0.19 | | | | 1.15 | | | | 1.27 | | | | 0.09 | | | | 49.66 | |
| 159211-11 | | KG2-011 | | | 0.10 | | | | 0.53 | | | | 1.56 | | | | 0.05 | | | | 49.56 | |
| 159211-11dup | | KG2-011 | | | 0.09 | | | | 0.51 | | | | 1.52 | | | | 0.05 | | | | 49.60 | |
| 159211-12 | | KG2-012 | | | 0.08 | | | | 0.32 | | | | 1.53 | | | | 0.04 | | | | 48.69 | |
| 159211-13 | | KG2-013 | | | 0.16 | | | | 1.92 | | | | 1.22 | | | | 0.07 | | | | 42.85 | |
| 159211-14 | | KG2-014 | | | 0.17 | | | | 0.32 | | | | 4.63 | | | | 0.07 | | | | 41.80 | |
| 159211-15 | | KG2-015 | | | 0.07 | | | | 0.44 | | | | 6.23 | | | | 0.04 | | | | 41.28 | |
| 159211-16 | | KG2-016 | | | 0.08 | | | | 0.35 | | | | 1.66 | | | | 0.03 | | | | 44.11 | |
| 159211-17 | | KG2-017 | | | 0.09 | | | | 0.09 | | | | 3.94 | | | | 0.03 | | | | 46.91 | |
| 159211-18 | | KG2-018 | | | 2.20 | | | | 0.04 | | | | 4.36 | | | | 1.25 | | | | 46.31 | |
| 159211-19 | | KG2-019 | | | 3.65 | | | | 0.16 | | | | 8.22 | | | | 2.17 | | | | 40.33 | |
| 159211-20 | | KG2-020 | | | 1.49 | | | | 0.17 | | | | 2.16 | | | | 0.84 | | | | 44.41 | |
| 159211-21 | | KG2-021 | | | 2.03 | | | | 6.92 | | | | 3.58 | | | | 1.11 | | | | 44.90 | |
| 159211-21dup | | KG2-021 | | | 2.05 | | | | 6.94 | | | | 3.55 | | | | 1.11 | | | | 44.84 | |
| 159211-22 | | KG2-022 | | | 3.72 | | | | 13.37 | | | | 10.31 | | | | 2.09 | | | | 33.59 | |
| 159211-23 | | KG2-023 | | | 3.11 | | | | 6.51 | | | | 12.37 | | | | 1.80 | | | | 36.41 | |
| 159211-24 | | KG2-024 | | | 1.51 | | | | 3.79 | | | | 34.67 | | | | 0.85 | | | | 20.26 | |
| 159211-25 | | KG2-025 | | | 2.08 | | | | 6.94 | | | | 3.00 | | | | 1.15 | | | | 41.80 | |
| 159211-26 | | KG2-026 | | | 1.76 | | | | 0.14 | | | | 3.96 | | | | 1.03 | | | | 45.98 | |
| 159211-27 | | KG2-027 | | | 2.17 | | | | 0.08 | | | | 9.83 | | | | 1.25 | | | | 41.42 | |
| 159211-28 | | KG2-028 | | | 1.85 | | | | 0.08 | | | | 5.54 | | | | 1.12 | | | | 45.58 | |
| 159211-29 | | KG2-029 | | | 4.61 | | | | 1.01 | | | | 4.21 | | | | 2.77 | | | | 38.68 | |
| 159211-30 | | KG2-030 | | | 1.14 | | | | 52.77 | | | | 2.65 | | | | 0.49 | | | | 8.78 | |
| 159211-31 | | KG2-031 | | | 1.05 | | | | 15.61 | | | | 1.75 | | | | 0.40 | | | | 41.76 | |
| 159211-31dup | | KG2-031 | | | 1.04 | | | | 15.77 | | | | 1.74 | | | | 0.40 | | | | 41.59 | |
| 159211-32 | | KG2-032 | | | 1.92 | | | | 25.82 | | | | 1.93 | | | | 0.73 | | | | 35.24 | |
| 159211-33 | | KG2-033 | | | 1.72 | | | | 30.26 | | | | 2.23 | | | | 0.69 | | | | 31.71 | |
| 159211-34 | | KG2-011A | | | 1.96 | | | | 1.14 | | | | 19.79 | | | | 1.24 | | | | 33.76 | |
| 159211-35 | | KG2-021A | | | 0.21 | | | | 1.01 | | | | 60.53 | | | | 0.11 | | | | 2.12 | |
| 159211-36 | | KG2-031A | | | 2.27 | | | | 0.79 | | | | 19.94 | | | | 1.25 | | | | 34.16 | |
| 141511-01 | | SQ-01 | | | 9.26 | | | | 0.23 | | | | 18.29 | | | | 9.39 | | | | 18.90 | |
| 141511-02 | | SQ-02 | | | 3.05 | | | | 3.00 | | | | 41.14 | | | | 1.75 | | | | 13.83 | |
| 141511-03 | | SQ-03 | | | 0.12 | | | | 1.63 | | | | 0.56 | | | | 0.07 | | | | 51.89 | |
| 141511-04 | | SQ-04 | | | 1.31 | | | | 48.07 | | | | 2.87 | | | | 0.47 | | | | 22.25 | |
ANALYSIS AND REPORTING BASIS
ARG = As received then pre-dried at 90°C as needed for grinding, then ground sample basis
GMF = ARG sample basis calculated to ground and dried, moisture free basis at 105°C
As received samples were pre-dried as needed, crushed, split, and ground to nominal -200 mesh prior to analyses.
Aliquots were dried for 24 hours at 105°C in air for loss on drying (moisture) determination, which was used for calculation of other analyses to a moisture free basis.
Insolubles and soluble K, Na, Mg (reported as oxides) were determined from DI water leach at 30°C, with agitation for 1 hour, and nominal weight to volume ratio of 1:100 (nominal 1. gram of sample to 100. ml of DI).
| | | | |
| | | | | |
| | | America West Potash | | Huffman Lab No. 163111 |
| | | | | June 24, 2011 |
| | | Pat Avery | | Page 1 of 1 |
| | | | | | | | | | | | | | | | | | | | | | | |
| ANALYSIS BASISè | | ARG | | | ARG | | | ARG | | | ARG | | | ARG | |
| REPORTING BASISè | | ARG | | | GMF | | | GMF | | | GMF | | | GMF | |
| | | | | moisture | | | DI H2O | | | H2O soluble | | | H2O soluble | | | H2O soluble | |
| Huffman | | Client | | LOD 105°C | | | insolubles | | | K as K2O | | | Mg as MgO | | | Na as Na2O | |
| Sample No. | | Sample No. | | % w/w | | | % w/w | | | % w/w | | | % w/w | | | % w/w | |
| 163111-01 | | KG3-001 | | | 0.47 | | | | 5.45 | | | | 0.41 | | | | 0.19 | | | | 49.49 | |
| 163111-01dup | | KG3-001 | | | 0.44 | | | | 5.42 | | | | 0.38 | | | | 0.19 | | | | 49.41 | |
| 163111-02 | | KG3-002 | | | 0.32 | | | | 3.94 | | | | 0.40 | | | | 0.16 | | | | 50.73 | |
| 163111-03 | | KG3-003 | | | 1.19 | | | | 22.77 | | | | 5.95 | | | | 0.56 | | | | 35.07 | |
| 163111-04 | | KG3-004 | | | 0.30 | | | | 3.69 | | | | 3.14 | | | | 0.14 | | | | 49.01 | |
| 163111-05 | | KG3-005 | | | 1.10 | | | | 10.17 | | | | 9.79 | | | | 0.59 | | | | 38.54 | |
| 163111-06 | | KG3-006 | | | 0.96 | | | | 8.08 | | | | 29.77 | | | | 0.51 | | | | 22.57 | |
| 163111-07 | | KG3-007 | | | 1.30 | | | | 24.34 | | | | 4.26 | | | | 0.67 | | | | 35.57 | |
| 163111-08 | | KG3-008 | | | 1.87 | | | | 21.84 | | | | 9.33 | | | | 1.03 | | | | 31.56 | |
| 163111-09 | | KG3-009 | | | 1.30 | | | | 18.70 | | | | 3.00 | | | | 0.71 | | | | 38.51 | |
| 163111-10 | | KG3-010 | | | 1.88 | | | | 29.96 | | | | 3.21 | | | | 1.13 | | | | 31.54 | |
| 163111-11 | | KG3-011 | | | 1.14 | | | | 16.00 | | | | 1.84 | | | | 0.57 | | | | 41.48 | |
| 163111-11dup | | KG3-011 | | | 1.14 | | | | 15.93 | | | | 1.82 | | | | 0.57 | | | | 41.50 | |
| 163111-12 | | KG3-012 | | | 0.23 | | | | 0.95 | | | | 1.15 | | | | 0.13 | | | | 49.60 | |
| 163111-13 | | KG3-013 | | | 0.08 | | | | 0.85 | | | | 1.12 | | | | 0.05 | | | | 51.47 | |
| 163111-14 | | KG3-014 | | | 0.06 | | | | 0.57 | | | | 0.87 | | | | 0.04 | | | | 52.85 | |
| 163111-15 | | KG3-015 | | | 0.28 | | | | 3.22 | | | | 0.96 | | | | 0.15 | | | | 47.25 | |
| 163111-16 | | KG3-016 | | | 0.25 | | | | 9.82 | | | | 1.10 | | | | 0.01 | | | | 36.58 | |
| 163111-17 | | KG3-017 | | | 0.09 | | | | 0.62 | | | | 0.72 | | | | 0.04 | | | | 49.99 | |
| 163111-18 | | KG3-018 | | | 0.10 | | | | 0.95 | | | | 0.84 | | | | 0.06 | | | | 48.20 | |
| 163111-19 | | KG3-019 | | | 0.42 | | | | 6.40 | | | | 1.56 | | | | 0.25 | | | | 42.12 | |
| 163111-20 | | KG3-020 | | | 0.08 | | | | 0.35 | | | | 0.93 | | | | 0.06 | | | | 40.77 | |
| 163111-21 | | KG3-021 | | | 0.08 | | | | 0.39 | | | | 1.21 | | | | 0.04 | | | | 51.57 | |
| 163111-21dup | | KG3-021 | | | 0.07 | | | | 0.40 | | | | 1.24 | | | | 0.04 | | | | 51.54 | |
| 163111-22 | | KG3-022 | | | 0.16 | | | | 1.26 | | | | 2.00 | | | | 0.09 | | | | 46.64 | |
| 163111-23 | | KG3-023 | | | 0.04 | | | | 0.18 | | | | 7.64 | | | | 0.04 | | | | 45.34 | |
| 163111-24 | | KG3-024 | | | -0.01 | | | | 0.07 | | | | 8.14 | | | | 0.01 | | | | 46.05 | |
| 163111-25 | | KG3-025 | | | -0.03 | | | | 0.08 | | | | 14.08 | | | | 0.02 | | | | 40.88 | |
| 163111-26 | | KG3-026 | | | 0.01 | | | | 0.05 | | | | 24.67 | | | | 0.02 | | | | 31.92 | |
| 163111-27 | | KG3-027 | | | 0.00 | | | | 0.07 | | | | 16.43 | | | | 0.02 | | | | 38.75 | |
| 163111-28 | | KG3-028 | | | 0.33 | | | | 5.22 | | | | 8.88 | | | | 0.18 | | | | 42.53 | |
| 163111-29 | | KG3-029 | | | 1.69 | | | | 23.42 | | | | 2.08 | | | | 0.87 | | | | 35.76 | |
| 163111-30 | | KG3-030 | | | 0.66 | | | | 10.63 | | | | 1.08 | | | | 0.36 | | | | 45.66 | |
| 163111-31 | | KG3-031 | | | 1.00 | | | | 14.34 | | | | 3.22 | | | | 0.47 | | | | 40.56 | |
| 163111-31dup | | KG3-031 | | | 1.01 | | | | 14.31 | | | | 3.19 | | | | 0.47 | | | | 40.59 | |
| 163111-32 | | KG3-032 | | | 0.36 | | | | 4.37 | | | | 14.09 | | | | 0.19 | | | | 38.25 | |
| 163111-33 | | KG3-033 | | | 1.26 | | | | 16.76 | | | | 0.91 | | | | 0.64 | | | | 41.59 | |
| 163111-34 | | KG3-034 | | | 0.07 | | | | 0.75 | | | | 0.47 | | | | 0.05 | | | | 49.44 | |
| 163111-35 | | KG3-035 | | | 0.03 | | | | 0.23 | | | | 1.50 | | | | 0.03 | | | | 50.79 | |
| 163111-36 | | KG3-036 | | | 0.02 | | | | 0.06 | | | | 4.98 | | | | 0.02 | | | | 46.98 | |
| 163111-37 | | KG3-037 | | | 0.04 | | | | 16.56 | | | | 0.26 | | | | 0.02 | | | | 47.90 | |
| 163111-38 | | KG3-011A | | | 0.12 | | | | 0.75 | | | | 58.75 | | | | 0.10 | | | | 2.57 | |
| 163111-39 | | KG3-021A | | | 1.96 | | | | 0.24 | | | | 19.53 | | | | 1.16 | | | | 34.06 | |
| 163111-40 | | KG3-031A | | | 0.14 | | | | 0.06 | | | | 54.64 | | | | 0.10 | | | | 5.97 | |
| 141511-01 | | SQ-01 | | | 11.92 | | | | 0.24 | | | | 18.66 | | | | 9.41 | | | | 19.32 | |
| 141511-02 | | SQ-02 | | | 2.54 | | | | 2.86 | | | | 41.22 | | | | 1.73 | | | | 13.90 | |
| 141511-03 | | SQ-03 | | | 0.08 | | | | 1.64 | | | | 0.56 | | | | 0.06 | | | | 51.67 | |
| 141511-04 | | SQ-04 | | | 1.26 | | | | 46.85 | | | | 2.91 | | | | 0.49 | | | | 22.50 | |
ANALYSIS AND REPORTING BASIS
ARG = As received then pre-dried at 90°C as needed for grinding, then ground sample basis
GMF = ARG sample basis calculated to ground and dried, moisture free basis at 105°C
As received samples were pre-dried as needed, crushed, split, and ground to nominal -200 mesh prior to analyses.
Aliquots were dried for 24 hours at 105°C in air for loss on drying (moisture) determination, which was used for calculation of other analyses to a moisture free basis.
Insolubles and soluble K, Na, Mg (reported as oxides) were determined from DI water leach at 30°C, with agitation for 1 hour, and nominal weight to volume ratio of 1:100 (nominal 1. gram of sample to 100. ml of DI).
| | | | |
| | | | | |
| | | America West Potash | | Huffman Lab No. 172011 |
| | | | | July 26, 2011 |
| | | Pat Avery | | Page 1 of 2 |
| | | | | | | | | | | | | | | | | | | | | | | |
| ANALYSIS BASISè | | ARG | | | ARG | | | ARG | | | ARG | | | ARG | |
| REPORTING BASISè | | ARG | | | GMF | | | GMF | | | GMF | | | GMF | |
| | | | | moisture | | | DI H2O | | | H2O soluble | | | H2O soluble | | | H2O soluble | |
| Huffman | | Client | | LOD 105°C | | | insolubles | | | K as K2O | | | Mg as MgO | | | Na as Na2O | |
| Sample No. | | Sample No. | | % w/w | | | % w/w | | | % w/w | | | % w/w | | | % w/w | |
| 172011-01 | | KG4-001 | | | 0.69 | | | | 21.65 | | | | 0.64 | | | | 0.34 | | | | 38.50 | |
| 172011-01dup | | KG4-001 | | | 0.61 | | | | 21.59 | | | | 0.63 | | | | 0.34 | | | | 38.79 | |
| 172011-02 | | KG4-002 | | | 0.41 | | | | 9.52 | | | | 1.45 | | | | 0.22 | | | | 45.66 | |
| 172011-03 | | KG4-003 | | | 0.61 | | | | 14.55 | | | | 1.39 | | | | 0.36 | | | | 42.28 | |
| 172011-04 | | KG4-004 | | | 0.38 | | | | 9.58 | | | | 5.22 | | | | 0.21 | | | | 42.87 | |
| 172011-05 | | KG4-005 | | | 0.79 | | | | 31.21 | | | | 3.97 | | | | 0.55 | | | | 31.42 | |
| 172011-06 | | KG4-006 | | | 0.46 | | | | 19.94 | | | | 3.50 | | | | 0.44 | | | | 37.88 | |
| 172011-07 | | KG4-007 | | | 0.34 | | | | 8.87 | | | | 4.15 | | | | 0.20 | | | | 44.62 | |
| 172011-08 | | KG4-008 | | | 0.35 | | | | 7.06 | | | | 4.32 | | | | 0.25 | | | | 44.79 | |
| 172011-09 | | KG4-009 | | | 0.70 | | | | 29.78 | | | | 2.97 | | | | 0.68 | | | | 31.49 | |
| 172011-10 | | KG4-010 | | | 0.40 | | | | 13.29 | | | | 5.21 | | | | 0.26 | | | | 39.82 | |
| 172011-11 | | KG4-011 | | | 0.72 | | | | 20.72 | | | | 3.84 | | | | 0.49 | | | | 37.34 | |
| 172011-11dup | | KG4-011 | | | 0.75 | | | | 20.57 | | | | 3.89 | | | | 0.49 | | | | 37.15 | |
| 172011-12 | | KG4-012 | | | 0.30 | | | | 5.78 | | | | 3.71 | | | | 0.17 | | | | 46.28 | |
| 172011-13 | | KG4-013 | | | 1.20 | | | | 37.67 | | | | 10.97 | | | | 0.79 | | | | 21.50 | |
| 172011-14 | | KG4-014 | | | 0.28 | | | | 4.14 | | | | 11.37 | | | | 0.14 | | | | 42.70 | |
| 172011-15 | | KG4-015 | | | 0.63 | | | | 13.61 | | | | 23.66 | | | | 0.42 | | | | 26.33 | |
| 172011-16 | | KG4-016 | | | 0.76 | | | | 23.76 | | | | 14.11 | | | | 0.72 | | | | 27.56 | |
| 172011-17 | | KG4-017 | | | 1.07 | | | | 29.33 | | | | 7.99 | | | | 1.05 | | | | 27.98 | |
| 172011-18 | | KG4-018 | | | 0.51 | | | | 22.31 | | | | 2.68 | | | | 0.69 | | | | 34.86 | |
| 172011-19 | | KG4-019 | | | 0.20 | | | | 2.07 | | | | 9.33 | | | | 0.12 | | | | 40.69 | |
| 172011-20 | | KG4-020 | | | 0.00 | | | | 0.11 | | | | 7.06 | | | | 0.02 | | | | 47.05 | |
| 172011-21 | | KG4-021 | | | 0.00 | | | | 0.10 | | | | 5.32 | | | | 0.01 | | | | 48.24 | |
| 172011-21dup | | KG4-021 | | | -0.01 | | | | 0.11 | | | | 5.34 | | | | 0.01 | | | | 48.75 | |
| 172011-22 | | KG4-022 | | | 0.18 | | | | 2.41 | | | | 9.56 | | | | 0.10 | | | | 39.99 | |
| 172011-23 | | KG4-023 | | | 0.02 | | | | 0.11 | | | | 9.73 | | | | 0.03 | | | | 43.17 | |
| 172011-24 | | KG4-024 | | | 0.00 | | | | 0.09 | | | | 10.65 | | | | 0.02 | | | | 38.93 | |
| 172011-25 | | KG4-025 | | | 0.05 | | | | 1.39 | | | | 9.03 | | | | 0.05 | | | | 34.66 | |
| 172011-26 | | KG4-026 | | | 0.21 | | | | 0.06 | | | | 13.73 | | | | 0.13 | | | | 37.98 | |
| 172011-27 | | KG4-027 | | | 0.95 | | | | 0.13 | | | | 18.71 | | | | 0.56 | | | | 31.61 | |
| 172011-28 | | KG4-028 | | | 1.41 | | | | 0.07 | | | | 3.66 | | | | 0.83 | | | | 47.32 | |
| 172011-29 | | KG4-029 | | | 2.90 | | | | 0.09 | | | | 4.83 | | | | 1.96 | | | | 44.28 | |
| 172011-30 | | KG4-030 | | | 2.88 | | | | 0.11 | | | | 9.30 | | | | 1.75 | | | | 39.86 | |
| 172011-31 | | KG4-031 | | | 2.06 | | | | 14.70 | | | | 2.31 | | | | 1.76 | | | | 37.66 | |
| 172011-31dup | | KG4-031 | | | 2.03 | | | | 14.83 | | | | 2.27 | | | | 1.77 | | | | 38.37 | |
| 172011-32 | | KG4-032 | | | 1.26 | | | | 1.55 | | | | 1.37 | | | | 0.72 | | | | 48.82 | |
| 172011-33 | | KG4-033 | | | 3.26 | | | | 6.06 | | | | 3.13 | | | | 1.99 | | | | 42.47 | |
| 172011-34 | | KG4-034 | | | 2.56 | | | | 4.07 | | | | 4.21 | | | | 1.50 | | | | 42.92 | |
| 172011-35 | | KG4-035 | | | 2.03 | | | | 1.18 | | | | 23.25 | | | | 1.19 | | | | 30.29 | |
| 172011-36 | | KG4-036 | | | 2.07 | | | | 2.36 | | | | 2.56 | | | | 1.20 | | | | 44.61 | |
| 172011-37 | | KG4-037 | | | 0.11 | | | | 0.22 | | | | 4.93 | | | | 0.07 | | | | 46.52 | |
| 172011-38 | | KG4-038 | | | 0.20 | | | | 1.91 | | | | 0.29 | | | | 0.10 | | | | 39.34 | |
| 172011-39 | | KG4-039 | | | 0.04 | | | | 0.69 | | | | 0.58 | | | | 0.04 | | | | 49.97 | |
| 172011-40 | | KG4-040 | | | 0.00 | | | | 0.12 | | | | 3.43 | | | | 0.02 | | | | 46.12 | |
| 172011-41 | | KG4-041 | | | -0.01 | | | | 0.03 | | | | 14.95 | | | | 0.02 | | | | 39.67 | |
| 172011-41dup | | KG4-041 | | | -0.03 | | | | 0.05 | | | | 15.26 | | | | 0.02 | | | | 39.46 | |
| 172011-42 | | KG4-042 | | | -0.02 | | | | 0.04 | | | | 10.17 | | | | 0.01 | | | | 43.16 | |
| | | | |
| | | | | |
| | | America West Potash | | Huffman Lab No. 172011 |
| | | | | July 26, 2011 |
| | | Pat Avery | | Page 2 of 2 |
| | | | | | | | | | | | | | | | | | | | | | | |
| ANALYSIS BASISè | | ARG | | | ARG | | | ARG | | | ARG | | | ARG | |
| REPORTING BASISè | | ARG | | | GMF | | | GMF | | | GMF | | | GMF | |
| | | | | moisture | | | DI H2O | | | H2O soluble | | | H2O soluble | | | H2O soluble | |
| Huffman | | Client | | LOD 105°C | | | insolubles | | | K as K2O | | | Mg as MgO | | | Na as Na2O | |
| Sample No. | | Sample No. | | % w/w | | | % w/w | | | % w/w | | | % w/w | | | % w/w | |
| 172011-43 | | KG4-043 | | | -0.04 | | | | 0.06 | | | | 22.79 | | | | 0.01 | | | | 31.42 | |
| 172011-44 | | KG4-044 | | | -0.01 | | | | 0.07 | | | | 0.14 | | | | 0.02 | | | | 45.03 | |
| 172011-45 | | KG4-045 | | | 0.31 | | | | 25.04 | | | | 0.56 | | | | 0.28 | | | | 24.83 | |
| 172011-46 | | KG4-046 | | | 1.77 | | | | 25.10 | | | | 3.68 | | | | 1.09 | | | | 33.20 | |
| 172011-47 | | KG4-047 | | | 1.49 | | | | 26.96 | | | | 2.04 | | | | 1.00 | | | | 34.02 | |
| 172011-48 | | KG4-048 | | | 0.59 | | | | 12.81 | | | | 0.45 | | | | 0.43 | | | | 44.09 | |
| 172011-49 | | KG4-049 | | | 0.98 | | | | 21.64 | | | | 0.52 | | | | 0.65 | | | | 38.44 | |
| 172011-50 | | KG4-011a | | | 0.11 | | | | 0.74 | | | | 59.90 | | | | 0.11 | | | | 1.53 | |
| 172011-51 | | KG4-021a | | | 2.03 | | | | 0.99 | | | | 19.46 | | | | 1.20 | | | | 32.86 | |
| 172011-51dup | | KG4-021a | | | 2.04 | | | | 1.00 | | | | 19.36 | | | | 1.20 | | | | 32.82 | |
| 172011-52 | | KG4-031a | | | 0.10 | | | | 0.66 | | | | 61.94 | | | | 0.11 | | | | 1.64 | |
| 172011-53 | | KG4-041 | | | 2.02 | | | | 0.98 | | | | 20.19 | | | | 1.20 | | | | 33.69 | |
| 141511-01 | | SQ-01 | | | 6.65 | | | | 0.26 | | | | 17.43 | | | | 8.90 | | | | 18.00 | |
| 141511-02 | | SQ-02 | | | 3.01 | | | | 2.95 | | | | 40.30 | | | | 1.72 | | | | 13.59 | |
| 141511-03 | | SQ-03 | | | 0.14 | | | | 1.63 | | | | 0.45 | | | | 0.06 | | | | 49.93 | |
| 141511-04 | | SQ-04 | | | 1.34 | | | | 47.63 | | | | 2.83 | | | | 0.49 | | | | 21.89 | |
ANALYSIS AND REPORTING BASIS
ARG = As received, pre-dried at 90oC as needed for grinding, then ground sample basis.
GMF = ARG sample basis calculated to dried, moisture free at 105°C.
As received samples were pre-dried as needed, crushed, split, and ground to nominal -200 mesh prior to all other analyses.
Aliquots were dried overnight at 105°C in air for loss on drying (moisture) determination.
Total insolubles and soluble K, Na, Mg (reported as equivalent oxides) were determined from DI water leach at 30°C, with agitation for 1 hour, and nominal weight to volume ratio of 1:100 (nominal 1. gram of sample to 100. ml of water).
| | | | |
| | | | | |
| | | America West Potash | | Huffman Lab No. Working Copy |
| | | | | July 29, 2011 |
| | | Pat Avery | | Page 1 of 1 |
| | | | | | | | | | | | | | | | | | | | | | | |
| ANALYSIS BASISè | | ARG | | | ARG | | | ARG | | | ARG | | | ARG | |
| REPORTING BASISè | | ARG | | | GMF | | | GMF | | | GMF | | | GMF | |
| | | | | moisture | | | DI H2O | | | H2O soluble | | | H2O soluble | | | H2O soluble | |
| Huffman | | Client | | LOD 105°C | | | insolubles | | | K as K2O | | | Mg as MgO | | | Na as Na2O | |
| Sample No. | | Sample No. | | % w/w | | | % w/w | | | % w/w | | | % w/w | | | % w/w | |
| 174611-01 | | KG5-001 | | | 0.58 | | | | 16.01 | | | | 1.18 | | | | 0.32 | | | | 42.01 | |
| 174611-02 | | KG5-002 | | | 0.45 | | | | 9.84 | | | | 0.70 | | | | 0.24 | | | | 46.31 | |
| 174611-03 | | KG5-003 | | | 0.11 | | | | 1.91 | | | | 0.99 | | | | 0.08 | | | | 50.95 | |
| 174611-04 | | KG5-004 | | | 1.00 | | | | 18.42 | | | | 4.45 | | | | 0.51 | | | | 38.71 | |
| 174611-05 | | KG5-005 | | | 1.43 | | | | 25.95 | | | | 3.49 | | | | 0.86 | | | | 33.92 | |
| 174611-06 | | KG5-006 | | | 0.82 | | | | 12.10 | | | | 1.75 | | | | 0.46 | | | | 44.27 | |
| 174611-07 | | KG5-007 | | | 0.42 | | | | 7.02 | | | | 0.71 | | | | 0.24 | | | | 45.20 | |
| 174611-08 | | KG5-008 | | | 0.12 | | | | 0.85 | | | | 0.32 | | | | 0.08 | | | | 51.57 | |
| 174611-09 | | KG5-009 | | | -0.03 | | | | 0.22 | | | | 0.57 | | | | 0.01 | | | | 52.09 | |
| 174611-10 | | KG5-010 | | | 0.11 | | | | 1.13 | | | | 8.64 | | | | 0.08 | | | | 43.42 | |
| 174611-11 | | KG5-011 | | | -0.01 | | | | 0.05 | | | | 18.26 | | | | 0.01 | | | | 36.90 | |
| 174611-12 | | KG5-012 | | | -0.03 | | | | 0.04 | | | | 10.63 | | | | 0.01 | | | | 40.64 | |
| 174611-13 | | KG5-013 | | | -0.03 | | | | 0.14 | | | | 12.31 | | | | 0.01 | | | | 36.34 | |
| 174611-14 | | KG5-014 | | | 0.01 | | | | 65.67 | | | | 0.30 | | | | 0.01 | | | | 3.51 | |
| 174611-15 | | KG5-015 | | | 0.00 | | | | 0.12 | | | | 9.72 | | | | 0.01 | | | | 41.78 | |
| 174611-16 | | KG5-016 | | | -0.01 | | | | 0.05 | | | | 7.09 | | | | 0.01 | | | | 46.56 | |
| 174611-17 | | KG5-017 | | | 0.00 | | | | 0.03 | | | | 9.22 | | | | 0.02 | | | | 43.97 | |
| 174611-18 | | KG5-018 | | | 0.06 | | | | 1.00 | | | | 4.45 | | | | 0.05 | | | | 47.17 | |
| 174611-19 | | KG5-019 | | | 1.83 | | | | 32.29 | | | | 4.27 | | | | 1.19 | | | | 29.26 | |
| 174611-20 | | KG5-020 | | | 0.31 | | | | 4.32 | | | | 1.83 | | | | 0.18 | | | | 48.86 | |
| 174611-21 | | KG5-021 | | | 0.18 | | | | 2.39 | | | | 6.56 | | | | 0.10 | | | | 46.01 | |
| 174611-22 | | KG5-022 | | | 0.16 | | | | 3.62 | | | | 19.58 | | | | 0.09 | | | | 34.99 | |
| 174611-23 | | KG5-023 | | | 0.28 | | | | 4.29 | | | | 3.29 | | | | 0.15 | | | | 46.33 | |
| 174611-24 | | KG5-024 | | | 0.03 | | | | 0.19 | | | | 0.29 | | | | 0.01 | | | | 51.43 | |
| 174611-25 | | KG5-025 | | | -0.02 | | | | 0.14 | | | | 0.36 | | | | 0.01 | | | | 51.44 | |
| 174611-26 | | KG5-026 | | | -0.04 | | | | 0.06 | | | | 0.15 | | | | 0.01 | | | | 51.17 | |
| 174611-27 | | KG5-027 | | | 0.03 | | | | 0.93 | | | | 0.12 | | | | 0.03 | | | | 47.39 | |
| 174611-28 | | KG5-028 | | | 0.64 | | | | 19.09 | | | | 0.27 | | | | 0.45 | | | | 39.69 | |
| 174611-29 | | KG5-029 | | | 0.96 | | | | 26.44 | | | | 0.40 | | | | 0.74 | | | | 35.14 | |
ANALYSIS AND REPORTING BASIS
ARG = As received, pre-dried at 90°C as needed for grinding, then ground sample basis.
GMF = ARG sample basis calculated to dried, moisture free at 105°C.
As received samples were pre-dried as needed, crushed, split, and ground to nominal -200 mesh prior to all other analyses.
Aliquots were dried overnight at 105°C in air for loss on drying (moisture) determination.
Total insolubles and soluble K, Na, Mg (reported as equivalent oxides) were determined from DI water leach at 30°C, with agitation for 1 hour, and nominal weight to volume ratio of 1:100 (nominal 1. gram of sample to 100. ml of water).
| | | | |
| | | | | |
| | | America West Potash | | Huffman Lab No. 172111 |
| | | | | July 26, 2011 |
| | | Pat Avery | | Page 1 of 1 |
| | | | | | | | | | | | | | | | | | | | | | | |
| ANALYSIS BASISè | | ARG | | | ARG | | | ARG | | | ARG | | | ARG | |
| REPORTING BASISè | | ARG | | | GMF | | | GMF | | | GMF | | | GMF | |
| | | | | moisture | | | DI H2O | | | H2O soluble | | | H2O soluble | | | H2O soluble | |
| Huffman | | Client | | LOD 105°C | | | insolubles | | | K as K2O | | | Mg as MgO | | | Na as Na2O | |
| Sample No. | | Sample No. | | % w/w | | | % w/w | | | % w/w | | | % w/w | | | % w/w | |
| 172111-01 | | KG6-001 | | | 0.67 | | | | 15.72 | | | | 5.47 | | | | 0.48 | | | | 38.63 | |
| 172111-01dup | | KG6-001 | | | 0.66 | | | | 15.58 | | | | 5.55 | | | | 0.48 | | | | 39.44 | |
| 172111-02 | | KG6-002 | | | 0.87 | | | | 18.96 | | | | 1.84 | | | | 0.60 | | | | 39.34 | |
| 172111-03 | | KG6-003 | | | 0.39 | | | | 8.79 | | | | 2.00 | | | | 0.29 | | | | 45.05 | |
| 172111-04 | | KG6-004 | | | 0.30 | | | | 3.25 | | | | 0.86 | | | | 0.12 | | | | 45.62 | |
| 172111-05 | | KG6-005 | | | 0.07 | | | | 0.19 | | | | 0.49 | | | | 0.04 | | | | 51.84 | |
| 172111-06 | | KG6-006 | | | 0.14 | | | | 1.18 | | | | 0.56 | | | | 0.06 | | | | 50.21 | |
| 172111-07 | | KG6-007 | | | 0.01 | | | | 0.07 | | | | 0.39 | | | | 0.01 | | | | 50.98 | |
| 172111-08 | | KG6-008 | | | 0.02 | | | | 0.00 | | | | 1.33 | | | | 0.01 | | | | 49.48 | |
| 172111-09 | | KG6-009 | | | 0.02 | | | | 4.84 | | | | 1.56 | | | | 0.01 | | | | 37.06 | |
| 172111-10 | | KG6-010 | | | 0.03 | | | | 0.08 | | | | 0.76 | | | | 0.02 | | | | 47.14 | |
| 172111-11 | | KG6-011 | | | 0.01 | | | | 0.02 | | | | 19.96 | | | | 0.01 | | | | 32.97 | |
| 172111-11dup | | KG6-011 | | | 0.01 | | | | 0.01 | | | | 19.77 | | | | 0.01 | | | | 32.63 | |
| 172111-12 | | KG6-012 | | | 0.02 | | | | 0.01 | | | | 24.04 | | | | 0.01 | | | | 30.70 | |
| 172111-13 | | KG6-013 | | | 0.01 | | | | 0.02 | | | | 14.05 | | | | 0.01 | | | | 36.40 | |
| 172111-14 | | KG6-014 | | | 0.01 | | | | 0.01 | | | | 5.19 | | | | 0.01 | | | | 44.13 | |
| 172111-15 | | KG6-015 | | | 0.27 | | | | 5.65 | | | | 14.41 | | | | 0.16 | | | | 36.27 | |
| 172111-16 | | KG6-016 | | | 0.69 | | | | 15.75 | | | | 1.59 | | | | 0.39 | | | | 40.80 | |
| 172111-17 | | KG6-017 | | | 0.35 | | | | 5.09 | | | | 3.08 | | | | 0.15 | | | | 46.98 | |
| 172111-18 | | KG6-018 | | | 0.23 | | | | 3.53 | | | | 0.87 | | | | 0.10 | | | | 49.92 | |
| 172111-19 | | KG6-019 | | | 0.17 | | | | 1.81 | | | | 1.18 | | | | 0.08 | | | | 50.95 | |
| 172111-20 | | KG6-020 | | | 0.07 | | | | 0.16 | | | | 0.22 | | | | 0.02 | | | | 49.85 | |
| 172111-21 | | KG6-021 | | | 0.06 | | | | 0.29 | | | | 0.16 | | | | 0.02 | | | | 46.60 | |
| 172111-21dup | | KG6-021 | | | 0.05 | | | | 0.27 | | | | 0.18 | | | | 0.03 | | | | 46.58 | |
| 172111-22 | | KG6-010a | | | 0.16 | | | | 0.30 | | | | 58.58 | | | | 0.10 | | | | 1.62 | |
| 172111-23 | | KG6-020a | | | 2.05 | | | | 0.97 | | | | 18.81 | | | | 1.12 | | | | 32.25 | |
| 172111-24 | | KG6-000 | | | 0.95 | | | | 14.54 | | | | 4.41 | | | | 0.50 | | | | 40.23 | |
| 141511-01 | | SQ-01 | | | 10.83 | | | | 0.21 | | | | 18.03 | | | | 9.32 | | | | 18.87 | |
| 141511-02 | | SQ-02 | | | 3.12 | | | | 2.91 | | | | 40.21 | | | | 1.74 | | | | 13.72 | |
| 141511-03 | | SQ-03 | | | 0.21 | | | | 1.49 | | | | 0.46 | | | | 0.06 | | | | 50.58 | |
| 141511-04 | | SQ-04 | | | 1.45 | | | | 47.61 | | | | 2.78 | | | | 0.49 | | | | 21.97 | |
ANALYSIS AND REPORTING BASIS
ARG = As received, pre-dried at 90°C as needed for grinding, then ground sample basis.
GMF = ARG sample basis calculated to dried, moisture free at 105°C.
As received samples were pre-dried as needed, crushed, split, and ground to nominal -200 mesh prior to all other analyses.
Aliquots were dried overnight at 105°C in air for loss on drying (moisture) determination.
Total insolubles and soluble K, Na, Mg (reported as equivalent oxides) were determined from DI water leach at 30°C,with agitation for 1 hour, and nominal weight to volume ratio of 1:100 (nominal 1. gram of sample to 100. ml of water).
| | | | |
| | | | | |
| | | America West Potash | | Huffman Lab No. 180411 |
| | | | | August 11, 2011 |
| | | Pat Avery | | Page 1 of 1 |
| | | | | | | | | | | | | | | | | | | | | | | |
| ANALYSIS BASISè | | ARG | | | ARG | | | ARG | | | ARG | | | ARG | |
| REPORTING BASISè | | ARG | | | GMF | | | GMF | | | GMF | | | GMF | |
| | | | | moisture | | | DI H2O | | | H2O soluble | | | H2O soluble | | | H2O soluble | |
| Huffman | | Client | | LOD 105°C | | | insolubles | | | K as K2O | | | Mg as MgO | | | Na as Na2O | |
| Sample No. | | Sample No. | | % w/w | | | % w/w | | | % w/w | | | % w/w | | | % w/w | |
| 180411-01 | | KG9-001 | | | 0.38 | | | | 15.29 | | | | 0.38 | | | | 0.33 | | | | 44.70 | |
| 180411-01dup | | KG9-001 | | | 0.46 | | | | 15.26 | | | | 0.45 | | | | 0.33 | | | | 44.35 | |
| 180411-02 | | KG9-002 | | | 0.32 | | | | 7.02 | | | | 0.23 | | | | 0.16 | | | | 49.57 | |
| 180411-03 | | KG9-003 | | | 0.20 | | | | 2.96 | | | | 0.18 | | | | 0.07 | | | | 51.33 | |
| 180411-04 | | KG9-004 | | | 0.25 | | | | 4.89 | | | | 31.95 | | | | 0.13 | | | | 24.08 | |
| 180411-05 | | KG9-005 | | | 0.45 | | | | 21.86 | | | | 10.51 | | | | 0.47 | | | | 32.25 | |
| 180411-06 | | KG9-006 | | | 0.71 | | | | 35.62 | | | | 3.80 | | | | 1.04 | | | | 27.44 | |
| 180411-07 | | KG9-007 | | | 0.41 | | | | 18.91 | | | | 3.89 | | | | 0.69 | | | | 36.77 | |
| 180411-08 | | KG9-008 | | | 0.22 | | | | 2.05 | | | | 0.75 | | | | 0.11 | | | | 50.08 | |
| 180411-09 | | KG9-009 | | | 0.14 | | | | 0.66 | | | | 0.29 | | | | 0.06 | | | | 51.62 | |
| 180411-10 | | KG9-010 | | | 0.10 | | | | 0.35 | | | | 0.22 | | | | 0.04 | | | | 48.35 | |
| 180411-11 | | KG9-011 | | | 0.50 | | | | 6.43 | | | | 0.41 | | | | 0.22 | | | | 47.74 | |
| 180411-11dup | | KG9-011 | | | 0.49 | | | | 6.46 | | | | 0.42 | | | | 0.22 | | | | 47.84 | |
| 180411-12 | | KG9-012 | | | 0.09 | | | | 0.40 | | | | 0.24 | | | | 0.03 | | | | 52.32 | |
| 180411-13 | | KG9-013 | | | 0.11 | | | | 0.54 | | | | 3.61 | | | | 0.03 | | | | 47.80 | |
| 180411-14 | | KG9-014 | | | 0.03 | | | | 0.07 | | | | 8.54 | | | | 0.01 | | | | 44.81 | |
| 180411-15 | | KG9-015 | | | 0.05 | | | | 0.34 | | | | 3.15 | | | | 0.01 | | | | 50.79 | |
| 180411-16 | | KG9-016 | | | 0.07 | | | | 0.22 | | | | 12.93 | | | | 0.02 | | | | 37.47 | |
| 180411-17 | | KG9-017 | | | 0.09 | | | | 6.22 | | | | 7.43 | | | | 0.02 | | | | 28.67 | |
| 180411-18 | | KG9-018 | | | 0.06 | | | | 0.11 | | | | 11.50 | | | | 0.02 | | | | 42.99 | |
| 180411-19 | | KG9-019 | | | 0.06 | | | | 0.25 | | | | 22.22 | | | | 0.02 | | | | 33.38 | |
| 180411-20 | | KG9-020 | | | 0.37 | | | | 7.03 | | | | 10.40 | | | | 0.16 | | | | 40.24 | |
| 180411-21 | | KG9-021 | | | 0.47 | | | | 8.27 | | | | 2.75 | | | | 0.20 | | | | 46.56 | |
| 180411-21dup | | KG9-021 | | | 0.47 | | | | 8.31 | | | | 2.77 | | | | 0.20 | | | | 46.86 | |
| 180411-22 | | KG9-022 | | | 0.09 | | | | 0.22 | | | | 4.90 | | | | 0.03 | | | | 52.72 | |
| 180411-23 | | KG9-023 | | | 0.16 | | | | 2.00 | | | | 28.93 | | | | 0.06 | | | | 28.05 | |
| 180411-24 | | KG9-024 | | | 0.23 | | | | 3.07 | | | | 5.98 | | | | 0.09 | | | | 44.02 | |
| 180411-25 | | KG9-025 | | | 0.07 | | | | 0.25 | | | | 2.80 | | | | 0.02 | | | | 49.22 | |
| 180411-26 | | KG9-026 | | | 0.08 | | | | 0.35 | | | | 0.24 | | | | 0.03 | | | | 51.82 | |
| 180411-27 | | KG9-027 | | | 0.06 | | | | 0.16 | | | | 1.09 | | | | 0.01 | | | | 47.73 | |
| 180411-28 | | KG9-028 | | | 0.05 | | | | 0.08 | | | | 0.16 | | | | 0.01 | | | | 49.60 | |
| 180411-29 | | KG9-029 | | | 1.22 | | | | 21.09 | | | | 0.58 | | | | 0.65 | | | | 35.01 | |
| 180411-30 | | KG9-011a | | | 0.16 | | | | 0.48 | | | | 61.06 | | | | 0.11 | | | | 2.07 | |
| 180411-31 | | KG9-021a | | | 1.98 | | | | 1.83 | | | | 20.10 | | | | 1.14 | | | | 33.53 | |
| 180411-31dup | | KG9-021a | | | 2.00 | | | | 1.85 | | | | 19.84 | | | | 1.13 | | | | 33.69 | |
| 141511-01 | | SQ-01 | | | 9.07 | | | | 0.23 | | | | 18.42 | | | | 9.29 | | | | 18.98 | |
| 141511-02 | | SQ-02 | | | 3.11 | | | | 2.96 | | | | 41.69 | | | | 1.75 | | | | 14.08 | |
| 141511-03 | | SQ-03 | | | 0.20 | | | | 1.57 | | | | 0.45 | | | | 0.06 | | | | 52.05 | |
| 141511-04 | | SQ-04 | | | 1.49 | | | | 47.84 | | | | 2.94 | | | | 0.49 | | | | 22.68 | |
ANALYSIS AND REPORTING BASIS
ARG = As received, pre-dried at 90°C as needed for grinding, then ground sample basis.
GMF = ARG sample basis calculated to dried, moisture free at 105°C.
As received samples were pre-dried as needed, crushed, split, and ground to nominal -200 mesh prior to all other analyses.
Aliquots were dried overnight at 105°C in air for loss on drying (moisture) determination.
Total insolubles and soluble K, Na, Mg (reported as equivalent oxides) were determined from DI water leach at 30°C, with agitation for 1 hour, and nominal weight to volume ratio of 1:100 (nominal 1. gram of sample to 100. ml of water).
| | | | |
| | | | | |
| | | America West Potash | | Huffman Lab No. 193111 |
| | | | | September 20, 2011 |
| | | Pat Avery | | Page 1 of 2 |
| | | | | | | | | | | | | | | | | | | | | | | |
| ANALYSIS BASISè | | ARG | | | ARG | | | ARG | | | ARG | | | ARG | |
| REPORTING BASISè | | ARG | | | GMF | | | GMF | | | GMF | | | GMF | |
| | | moisture | | | DI H2O | | | H2O soluble | | | H2O soluble | | | H2O soluble | |
| Huffman | | Client | | LOD 105°C | | | insolubles | | | K as K2O | | | Mg as MgO | | | Na as Na2O | |
| Sample No. | | Sample No. | | % w/w | | | % w/w | | | % w/w | | | % w/w | | | % w/w | |
| 193111-01 | | KG12-01 | | | 0.03 | | | | 0.08 | | | | 0.28 | | | | 0.01 | | | | 52.42 | |
| 193111-01 dup | | KG12-01 | | | 0.05 | | | | 0.07 | | | | 0.27 | | | | 0.01 | | | | 52.75 | |
| 193111-02 | | KG12-02 | | | 0.09 | | | | 0.43 | | | | 0.25 | | | | 0.03 | | | | 48.89 | |
| 193111-03 | | KG12-03 | | | 0.02 | | | | 0.04 | | | | 0.22 | | | | 0.01 | | | | 52.52 | |
| 193111-04 | | KG12-04 | | | 0.01 | | | | 0.16 | | | | 0.17 | | | | 0.01 | | | | 52.90 | |
| 193111-05 | | KG12-05 | | | 0.25 | | | | 2.32 | | | | 0.22 | | | | 0.10 | | | | 48.27 | |
| 193111-06 | | KG12-06 | | | 0.07 | | | | 0.32 | | | | 0.62 | | | | 0.02 | | | | 50.27 | |
| 193111-07 | | KG12-07 | | | 0.02 | | | | 0.16 | | | | 12.82 | | | | 0.01 | | | | 40.55 | |
| 193111-08 | | KG12-08 | | | 0.05 | | | | 0.07 | | | | 0.29 | | | | 0.01 | | | | 48.94 | |
| 193111-09 | | KG12-09 | | | 0.57 | | | | 29.64 | | | | 0.26 | | | | 0.01 | | | | 19.70 | |
| 193111-10 | | KG12-10 | | | 0.06 | | | | 0.42 | | | | 12.72 | | | | 0.02 | | | | 40.34 | |
| 193111-11 | | KG12-11 | | | 0.64 | | | | 11.08 | | | | 2.93 | | | | 0.29 | | | | 43.67 | |
| 193111-11 dup | | KG12-11 | | | 0.64 | | | | 11.17 | | | | 2.90 | | | | 0.29 | | | | 43.62 | |
| 193111-12 | | KG12-12 | | | 0.35 | | | | 6.22 | | | | 15.53 | | | | 0.14 | | | | 36.19 | |
| 193111-13 | | KG12-13 | | | 0.18 | | | | 2.59 | | | | 2.90 | | | | 0.06 | | | | 49.05 | |
| 193111-14 | | KG12-14 | | | 0.16 | | | | 3.26 | | | | 22.24 | | | | 0.06 | | | | 31.85 | |
| 193111-15 | | KG12-15 | | | 0.31 | | | | 6.43 | | | | 5.34 | | | | 0.13 | | | | 43.60 | |
| 193111-16 | | KG12-16 | | | 0.07 | | | | 0.22 | | | | 2.45 | | | | 0.03 | | | | 50.72 | |
| 193111-17 | | KG12-17 | | | 0.07 | | | | 0.20 | | | | 8.60 | | | | 0.03 | | | | 45.26 | |
| 193111-18 | | KG12-18 | | | 0.08 | | | | 0.36 | | | | 1.62 | | | | 0.03 | | | | 47.17 | |
| 193111-19 | | KG12-19 | | | 0.04 | | | | 0.07 | | | | 12.89 | | | | 0.02 | | | | 40.58 | |
| 193111-20 | | KG12-20 | | | 0.04 | | | | 0.15 | | | | 0.55 | | | | 0.01 | | | | 50.51 | |
| 193111-21 | | KG12-21 | | | 0.61 | | | | 29.44 | | | | 0.47 | | | | 0.24 | | | | 31.05 | |
| 193111-21 dup | | KG12-21 | | | 0.61 | | | | 29.39 | | | | 0.47 | | | | 0.24 | | | | 31.11 | |
| 193111-22 | | KG12-11a | | | 0.13 | | | | 0.94 | | | | 59.61 | | | | 0.09 | | | | 1.94 | |
| 193111-23 | | KG12-21a | | | 2.13 | | | | 1.63 | | | | 19.52 | | | | 1.18 | | | | 33.38 | |
| 193111-24 | | KG13-01 | | | 0.03 | | | | 0.16 | | | | 0.12 | | | | 0.01 | | | | 52.57 | |
| 193111-25 | | KG13-02 | | | 0.40 | | | | 7.61 | | | | 0.27 | | | | 0.19 | | | | 45.95 | |
| 193111-26 | | KG13-03 | | | 0.09 | | | | 1.12 | | | | 0.15 | | | | 0.04 | | | | 50.38 | |
| 193111-27 | | KG13-04 | | | 0.03 | | | | 0.12 | | | | 0.16 | | | | 0.00 | | | | 50.14 | |
| 193111-28 | | KG13-05 | | | 0.02 | | | | 0.15 | | | | 0.28 | | | | 0.00 | | | | 50.57 | |
| 193111-29 | | KG13-06 | | | 0.01 | | | | 0.05 | | | | 16.61 | | | | 0.00 | | | | 37.41 | |
| 193111-30 | | KG13-07 | | | 0.02 | | | | 0.06 | | | | 10.48 | | | | 0.00 | | | | 43.45 | |
| 193111-31 | | KG13-08 | | | 0.04 | | | | 0.13 | | | | 6.02 | | | | 0.00 | | | | 41.72 | |
| 193111-31 dup | | KG13-08 | | | 0.03 | | | | 0.12 | | | | 6.02 | | | | 0.00 | | | | 41.82 | |
| 193111-32 | | KG13-09 | | | -0.01 | | | | 0.07 | | | | 15.72 | | | | 0.00 | | | | 39.45 | |
| 193111-33 | | KG13-10 | | | 0.07 | | | | 4.76 | | | | 0.21 | | | | 0.00 | | | | 35.93 | |
| 193111-34 | | KG13-11 | | | 0.19 | | | | 30.72 | | | | 0.15 | | | | 0.05 | | | | 19.73 | |
| 193111-35 | | KG13-12 | | | 0.33 | | | | 7.97 | | | | 0.30 | | | | 0.13 | | | | 46.34 | |
| 193111-36 | | KG13-13 | | | 1.38 | | | | 33.08 | | | | 0.71 | | | | 0.69 | | | | 33.75 | |
| 193111-37 | | KG13-14 | | | 0.28 | | | | 5.46 | | | | 0.24 | | | | 0.12 | | | | 49.28 | |
| 193111-38 | | KG13-15 | | | 0.19 | | | | 3.09 | | | | 0.25 | | | | 0.07 | | | | 51.09 | |
| 193111-39 | | KG13-16 | | | 0.17 | | | | 3.32 | | | | 0.18 | | | | 0.07 | | | | 50.18 | |
| 193111-40 | | KG13-17 | | | 0.02 | | | | 0.24 | | | | 0.20 | | | | 0.01 | | | | 51.58 | |
| 193111-41 | | KG13-11a | | | 0.14 | | | | 0.71 | | | | 59.39 | | | | 0.09 | | | | 1.88 | |
| 193111-41 dup | | KG13-11a | | | 0.13 | | | | 0.74 | | | | 60.23 | | | | 0.09 | | | | 1.88 | |
| | | | |
| | | | | |
| | | America West Potash | | Huffman Lab No. 193111 |
| | | | | September 20, 2011 |
| | | Pat Avery | | Page 2 of 2 |
| | | | | | | | | | | | | | | | | | | | | | | |
| ANALYSIS BASISè | | ARG | | | ARG | | | ARG | | | ARG | | | ARG | |
| REPORTING BASISè | | ARG | | | GMF | | | GMF | | | GMF | | | GMF | |
| | | moisture | | | Dl H2O | | | H2O soluble | | | H2O soluble | | | H2O soluble | |
| Huffman | | Client | | LOD 105°C | | | insolubles | | | K as K2O | | | Mg as MgO | | | Na as Na2O | |
| Sample No. | | Sample No. | | % w/w | | | % w/w | | | % w/w | | | % w/w | | | % w/w | |
| 193111-42 | | KG1-35 | | | 0.03 | | | | 0.13 | | | | 0.33 | | | | 0.01 | | | | 51.47 | |
| 193111-43 | | KG1-36 | | | 0.03 | | | | 0.09 | | | | 0.40 | | | | 0.01 | | | | 52.43 | |
| 193111-44 | | KG1-37 | | | 0.06 | | | | 0.27 | | | | 0.55 | | | | 0.03 | | | | 52.19 | |
| 193111-45 | | KG1-38 | | | 0.04 | | | | 0.08 | | | | 0.44 | | | | 0.01 | | | | 51.04 | |
| 193111-46 | | KG1-39 | | | 0.14 | | | | 6.37 | | | | 0.51 | | | | 0.05 | | | | 36.15 | |
| 193111-47 | | KG1-40 | | | 0.06 | | | | 0.41 | | | | 0.48 | | | | 0.02 | | | | 44.43 | |
| 193111-48 | | KG1-41 | | | 0.04 | | | | 0.09 | | | | 0.55 | | | | 0.01 | | | | 47.14 | |
| 193111-49 | | KG1-42 | | | 0.04 | | | | 0.22 | | | | 0.68 | | | | 0.01 | | | | 50.34 | |
| 193111-50 | | KG1-43 | | | 0.14 | | | | 1.28 | | | | 1.43 | | | | 0.06 | | | | 49.06 | |
| 193111-51 | | KG1-44 | | | 0.14 | | | | 0.45 | | | | 59.46 | | | | 0.09 | | | | 2.20 | |
| 193111-51 dup | | KG1-44 | | | INS | | | INS | | | INS | | | INS | | | INS | |
| 193111-52 | | NR1 | | | 0.16 | | | | 0.00 | | | | 60.84 | | | | 0.01 | | | | 1.09 | |
| 193111-53 | | SQ-01 | | | 14.82 | | | | 0.21 | | | | 19.37 | | | | 9.74 | | | | 20.10 | |
| 193111-54 | | SQ-02 | | | 3.07 | | | | 2.85 | | | | 40.71 | | | | 1.70 | | | | 13.78 | |
| 193111-55 | | SQ-03 | | | 0.15 | | | | 1.55 | | | | 0.47 | | | | 0.06 | | | | 51.41 | |
| 193111-56 | | SQ-04 | | | 1.48 | | | | 48.18 | | | | 2.90 | | | | 0.46 | | | | 22.59 | |
ANALYSIS AND REPORTING BASIS
ARG = As received, pre-dried at 90°C as needed for grinding, then ground sample basis.
GMF = ARG sample basis calculated to dried, moisture free at 105°C.
As received samples were pre-dried as needed, crushed, split, and ground to nominal -200 mesh prior to all other analyses.
Aliquots were dried overnight at 105°C in air for loss on drying (moisture) determination, except for control sample SQ-01 which was dried overnight at 130°C.
Total insolubles and soluble K, Na, Mg (reported as equivalent oxides) were determined from Dl water leach at 30°C, with agitation for 1 hour, and nominal weight to volume ratio of 1:100 (nominal 1. gram of sample to 100. ml of water).
| | | | |
| | | | | |
| | | America West Potash | | Huffman Lab No. 199011 |
| | | | | October 4, 2011 |
| | | Pat Avery | | Page 1 of 1 |
| | | | | | | | | | | | | | | | | | | | | | | |
| ANALYSIS BASISè | | ARG | | | ARG | | | ARG | | | ARG | | | ARG | |
| REPORTING BASISè | | ARG | | | GMF | | | GMF | | | GMF | | | GMF | |
| | | moisture | | | Dl H2O | | | H2O soluble | | | H2O soluble | | | H2O soluble | |
| Huffman | | Client | | LOD 105°C | | | insolubles | | | K as K2O | | | Mg as MgO | | | Na as Na2O | |
| Sample No. | | Sample No. | | % w/w | | | % w/w | | | % w/w | | | % w/w | | | % w/w | |
| 199011-01 | | KG14-001 | | | 0.05 | | | | 0.61 | | | | 0.11 | | | | 0.02 | | | | 49.53 | |
| 199011-01dup | | KG14-001 | | | 0.05 | | | | 0.59 | | | | 0.11 | | | | 0.02 | | | | 49.56 | |
| 199011-02 | | KG14-002 | | | 0.05 | | | | 0.53 | | | | 0.14 | | | | 0.02 | | | | 51.09 | |
| 199011-03 | | KG14-003 | | | 0.03 | | | | 0.35 | | | | 0.14 | | | | 0.01 | | | | 43.72 | |
| 199011-04 | | KG14-004 | | | 0.02 | | | | 0.06 | | | | 0.09 | | | | 0.00 | | | | 49.60 | |
| 199011-05 | | KG14-005 | | | 0.03 | | | | 0.07 | | | | 0.21 | | | | 0.01 | | | | 49.61 | |
| 199011-06 | | KG14-006 | | | 0.02 | | | | 0.05 | | | | 7.77 | | | | 0.00 | | | | 44.63 | |
| 199011-07 | | KG14-007 | | | 0.02 | | | | 0.05 | | | | 9.63 | | | | 0.01 | | | | 42.25 | |
| 199011-08 | | KG14-008 | | | 0.04 | | | | 0.26 | | | | 4.65 | | | | 0.01 | | | | 40.34 | |
| 199011-09 | | KG14-009 | | | 0.05 | | | | 18.51 | | | | 0.30 | | | | 0.01 | | | | 28.50 | |
| 199011-10 | | KG14-010 | | | 0.32 | | | | 11.36 | | | | 0.76 | | | | 0.15 | | | | 44.32 | |
| 199011-11 | | KG14-011 | | | 0.14 | | | | 2.98 | | | | 0.66 | | | | 0.07 | | | | 49.36 | |
| 199011-11dup | | KG14-011 | | | 0.16 | | | | 2.95 | | | | 0.65 | | | | 0.07 | | | | 50.45 | |
| 199011-12 | | KG14-012 | | | 0.47 | | | | 14.27 | | | | 1.18 | | | | 0.24 | | | | 43.03 | |
| 199011-13 | | KG14-013 | | | 0.14 | | | | 3.57 | | | | 0.86 | | | | 0.07 | | | | 49.38 | |
| 199011-14 | | KG14-014 | | | 0.38 | | | | 10.05 | | | | 0.87 | | | | 0.22 | | | | 46.50 | |
| 199011-15 | | KG14-015 | | | 0.19 | | | | 4.99 | | | | 0.40 | | | | 0.09 | | | | 49.37 | |
| 199011-16 | | KG14-016 | | | 0.03 | | | | 0.32 | | | | 0.20 | | | | 0.02 | | | | 50.98 | |
| 199011-17 | | KG14-011A | | | 2.14 | | | | 0.83 | | | | 19.88 | | | | 1.23 | | | | 33.24 | |
| 141511-01 | | SQ-01 | | | 15.05 | | | | 0.24 | | | | 19.41 | | | | 9.79 | | | | 20.21 | |
| 141511-02 | | SQ-02 | | | 3.05 | | | | 3.02 | | | | 40.93 | | | | 1.71 | | | | 13.84 | |
| 141511-03 | | SQ-03 | | | 0.15 | | | | 1.61 | | | | 0.45 | | | | 0.06 | | | | 51.07 | |
| 141511-04 | | SQ-04 | | | 1.49 | | | | 47.09 | | | | 2.79 | | | | 0.48 | | | | 22.09 | |
ANALYSIS AND REPORTING BASIS
ARG = As received, pre-dried at 90°C as needed for grinding, then ground sample basis.
GMF = ARG sample basis calculated to dried, moisture free at 105°C.
As received samples were pre-dried as needed, crushed, split, and ground to nominal -200 mesh prior to all other analyses.
Aliquots were dried overnight at 105°C in air for loss on drying (moisture) determination, except for control sample SQ-01 which was dried overnight at 130°C.
Total insolubles and soluble K, Na, Mg (reported as equivalent oxides) were determined from Dl water leach at 30°C, with agitation for 1 hour, and nominal weight to volume ratio of 1:100 (nominal 1. gram of sample to 100. ml of water).
| | |
| | | |
| | American West Potash, LLC Holbrook Basin project
2011 Potash Resource Assessment |
Appendix E
Resource Tonnage Tables
RESOURCE SUMMARY TABLE
INDICATED1RESOURCE SUMMARY
| | | | | | | | | | | | | | | | | | | | | | | | | | | | | |
| | | | | | | Area with Seismic | | | | | | | | | | | | | | | | | | K2O | |
| | | | | | | Deductions of | | | Weighted Average | | | Weighted Average | | | Total Sylvinite | | | Total K2O | | | MMT3per | |
| Member | | Area (km2) | | | 15% (km2 ) | | | Thickness (m) | | | K2O Grade (%)4 | | | Tonnage(MMT3)5 | | | Tonnage (MMT3)6 | | | Section7 | |
KR-1 | | | 0.00 | | | | 0.00 | | | | 0.00 | | | | 0.00 | | | | 0.00 | | | | 0.00 | | | | 0.00 | |
KR-2 | | | 45.26 | | | | 38.47 | | | | 1.98 | | | | 10.09 | | | | 158.10 | | | | 15.95 | | | | 1.07 | |
Total | | | 45.26 | | | | 38.47 | | | | N/A | | | | N/A | | | | 158.10 | | | | 15.95 | | | | 1.07 | |
INFERRED2RESOURCE SUMMARY |
| | | | | | | | | | | | | | | | | | | | | | | | | | | | | |
| | | | | | | Area with Seismic | | | | | | | | | | | | | | | | |
| | | | | | | Deductions of | | | Weighted Average | | | Weighted Average | | | Total Tonnage | | | Total K2O Tonnage | | | K2O MMT3 per | |
| Member | | Area (km2) | | | 15% (km2) | | | Thickness (m) | | | K2O Grade (%)4 | | | (MMT3)5 | | | (MMT3)6 | | | Section7 | |
KR-1 | | | 42.70 | | | | 36.29 | | | | 1.69 | | | | 13.44 | | | | 127.58 | | | | 17.15 | | | | 1.22 | |
KR-2 | | | 125.56 | | | | 106.72 | | | | 1.95 | | | | 11.39 | | | | 432.75 | | | | 49.29 | | | | 1.20 | |
Total | | | 168.26 | | | | 143.01 | | | | N/A | | | | N/A | | | | 560.33 | | | | 66.44 | | | | 2.42 | |
| | | |
| 1 | | Indicated Resource radius of influence is 0.0-1.6KM for Potash Units KR-1 and KR-2 |
| |
| 2 | | Inferred Resource radius of influence is 1.6-3.2KM for Potash Units KR-1 and KR-2 |
| |
| 3 | | MMT = Million Metric Tonnes |
| |
| 4 | | “Average K2O Grade” and “Average Thickness” refer to weighted averages. |
| |
| 5 | | “Total Sylvinite Tonnage” refers to total amount of in-situ resource in the Project Area (i.e. Area x Thickness x Density x Deductions) |
| |
| 6 | | “Total K2O Tonnage” refers to the total amount of K2O resource in the Project Area (i.e. Area x Thickness x Density x Deductions x Grade) Deductions include 15% for unknown anomalies (Does not include extraction ratio or plant and transport losses) |
| |
| 7 | | Assuming 640 acres or 2,589,988m2 per section. |
Indicated Tonnage
0.0-1.6KM ROI
| | | | | | | | | | | | | | | | | | | | | | | | | | | | | |
| | | | | | | | | | | Mineral Estimation in KR-1 | |
| UNIT: KR-1 | | Area Calculation | | Measured Data | | Tonnage Calculation | | | | |
| | | | | | | | | Grade x | | | | Area With Seismic | | | | | | | | | | | | | | |
| POLYGON / | | | | From | | To | | Thck | | Area | | Deductions of 15% | | Thickness | | K2O Grade | | Volume | | Sylvinite Weight | | Sylvinite Tonnage | | | K2O Tonnage | |
| WELL No. | | WELL NAME | | (m) | | (m) | | >12.191 | | (m2) | | (m2) | | (m) | | (%) | | (m3) | | (kg) | | (Tonnes) | | | (Tonnes) | |
| | | 01-17 | | 0.00 | | 0.00 | | û | | Historical Well — Lack of Data (No Core) |
| | | 01-18 | | 0.00 | | 0.00 | | û | | Historical Well — Lack of Data (No Core) |
| | | 01-22 | | 0.00 | | 0.00 | | û | | Historical Well — Lack of Data (No Core) |
| | | 01-23 | | 464.97 | | 467.11 | | ü | | Historical Well — Lack of Data (No Core) |
| | | 01-24 | | 0.00 | | 0.00 | | û | | Historical Well — Lack of Data (No Core) |
| | | 01-25 | | 0.00 | | 0.00 | | û | | Historical Well — Lack of Data (No Core) |
| | | 01-26 | | 381.69 | | 384.20 | | ü | | Historical Well — Lack of Data (No Core) |
| | | 01-27 | | 394.34 | | 396.56 | | ü | | Historical Well — Lack of Data (No Core) |
| | | 01-28 | | 0.00 | | 0.00 | | û | | Historical Well — Lack of Data (No Core) |
| | | 01-29 | | 0.00 | | 0.00 | | û | | Historical Well — Lack of Data (No Core) |
| | | 01-30 | | 0.00 | | 0.00 | | û | | Historical Well — Lack of Data (No Core) |
| | | 01-32 | | 0.00 | | 0.00 | | û | | Historical Well — Lack of Data (No Core) |
| | | 01-35 | | 0.00 | | 0.00 | | û | | Historical Well — Lack of Data (No Core) |
| | | 01-36 | | 0.00 | | 0.00 | | û | | Historical Well — Lack of Data (No Core) |
| | | 01-40 | | 0.00 | | 0.00 | | û | | Historical Well — Lack of Data (No Core) |
| | | 01-41 | | 0.00 | | 0.00 | | û | | Historical Well — Lack of Data (No Core) |
| | | 01-42 | | 0.00 | | 0.00 | | û | | Historical Well — Lack of Data (No Core) |
| | | 01-43 | | 0.00 | | 0.00 | | û | | Historical Well — Lack of Data (No Core) |
| | | 01-44 | | 412.01 | | 414.07 | | ü | | Historical Well — Lack of Data (No Core) |
| | | 01-45 | | 0.00 | | 0.00 | | û | | Historical Well — Lack of Data (No Core) |
| | | 01-46 | | 0.00 | | 0.00 | | û | | Historical Well — Lack of Data (No Core) |
| | | 01-47 | | 345.57 | | 346.94 | | ü | | Historical Well — Lack of Data (No Core) |
| | | 01-48 | | 0.00 | | 0.00 | | û | | Historical Well — Lack of Data (No Core) |
| | | 01-49 | | 0.00 | | 0.00 | | û | | Historical Well — Lack of Data (No Core) |
| | | 01-50 | | 343.05 | | 344.88 | | ü | | Historical Well — Lack of Data (No Core) |
| | | 01-51 | | 0.00 | | 0.00 | | û | | Historical Well — Lack of Data (No Core) |
| | | 01-52 | | 0.00 | | 0.00 | | û | | Historical Well — Lack of Data (No Core) |
| | | 01-53 | | 0.00 | | 0.00 | | û | | Historical Well — Lack of Data (No Core) |
| | | 01-54 | | 0.00 | | 0.00 | | û | | Historical Well — Lack of Data (No Core) |
| | | 01-55 | | 0.00 | | 0.00 | | û | | Historical Well — Lack of Data (No Core) |
| | | 01-56 | | 0.00 | | 0.00 | | û | | Historical Well — Lack of Data (No Core) |
| | | 01-58 | | 0.00 | | 0.00 | | û | | Historical Well — Lack of Data (No Core) |
| | | 01-60 | | 0.00 | | 0.00 | | û | | Historical Well — Lack of Data (No Core) |
| | | 01-64 | | 0.00 | | 0.00 | | û | | Historical Well — Lack of Data (No Core) |
| | | 01-65 | | 0.00 | | 0.00 | | û | | Historical Well — Lack of Data (No Core) |
| | | 01-66 | | 563.65 | | 564.87 | | ü | | Historical Well — Lack of Data (No Core) |
| | | 01-67 | | 0.00 | | 0.00 | | û | | Historical Well — Lack of Data (No Core) |
| | | 01-68 | | 0.00 | | 0.00 | | û | | Historical Well — Lack of Data (No Core) |
| | | 01-69 | | 0.00 | | 0.00 | | û | | Historical Well — Lack of Data (No Core) |
| | | 01-70 | | 0.00 | | 0.00 | | û | | Historical Well — Lack of Data (No Core) |
| | | 01-71 | | 0.00 | | 0.00 | | û | | Historical Well — Lack of Data (No Core) |
| | | 01-72 | | 0.00 | | 0.00 | | û | | Historical Well — Lack of Data (No Core) |
| | | 01-73 | | 0.00 | | 0.00 | | û | | Historical Well — Lack of Data (No Core) |
| | | 623 | | 0.00 | | 0.00 | | û | | Historical Well — Lack of Data (No Core) |
| | | 624 | | 505.13 | | 506.81 | | ü | | Historical Well — Lack of Data (No Core) |
| | | 626 | | 0.00 | | 0.00 | | û | | Historical Well — Lack of Data (No Core) |
| | | 630 | | 0.00 | | 0.00 | | û | | Historical Well — Lack of Data (No Core) |
Indicated Tonnage
0.0-1.6KM ROI
| | | | | | | | | | | | | | | | | | | | | | | | | | | | | |
| | | | | | | | | | | Mineral Estimation in KR-1 | |
| UNIT: KR-1 | | Area Calculation | | Measured Data | | Tonnage Calculation | | | | |
| | | | | | | | | Grade x | | | | Area With Seismic | | | | | | | | | | | | | | |
| POLYGON / | | | | From | | To | | Thck | | Area | | Deductions of 15% | | Thickness | | K2O Grade | | Volume | | Sylvinite Weight | | Sylvinite Tonnage | | | K2O Tonnage | |
| WELL No. | | WELL NAME | | (m) | | (m) | | >12.191 | | (m2) | | (m2) | | (m) | | (%) | | (m3) | | (kg) | | (Tonnes) | | | (Tonnes) | |
| | | 631 | | 0.00 | | 0.00 | | û | | Historical Well — Lack of Data (No Core) |
| | | 632 | | 0.00 | | 0.00 | | û | | Historical Well — Lack of Data (No Core) |
| | | 633 | | 0.00 | | 0.00 | | û | | Historical Well — Lack of Data (No Core) |
| | | 634 | | 368.05 | | 369.27 | | ü | | Historical Well — Lack of Data (No Core) |
| | | 636 | | 0.00 | | 0.00 | | û | | Historical Well — Lack of Data (No Core) |
| | | 641 | | 449.89 | | 453.54 | | ü | | Historical Well — Lack of Data (No Core) |
| | | 642 | | 0.00 | | 0.00 | | û | | Historical Well — Lack of Data (No Core) |
| | | 645 | | 0.00 | | 0.00 | | û | | Historical Well — Lack of Data (No Core) |
| | | 650 | | 0.00 | | 0.00 | | û | | Historical Well — Lack of Data (No Core) |
| | | 652 | | 409.80 | | 411.10 | | ü | | Historical Well — Lack of Data (No Core) |
| | | 664 | | 0.00 | | 0.00 | | û | | Historical Well — Lack of Data (No Core) |
| | | 665 | | 0.00 | | 0.00 | | û | | Historical Well — Lack of Data (No Core) |
| | | 673 | | 0.00 | | 0.00 | | û | | Historical Well — Lack of Data (No Core) |
| | | 675 | | 551.92 | | 553.52 | | ü | | Historical Well — Lack of Data (No Core) |
| | | 679 | | 0.00 | | 0.00 | | û | | Historical Well — Lack of Data (No Core) |
| | | 680 | | 0.00 | | 0.00 | | û | | Historical Well — Lack of Data (No Core) |
| | | 681 | | 0.00 | | 0.00 | | û | | Historical Well — Lack of Data (No Core) |
| | | 682 | | 341.76 | | 343.13 | | ü | | Historical Well — Lack of Data (No Core) |
| | | American West Potash KG-1 | | 383.32 | | 384.54 | | ü | | Unreliable Assay Results — Lack of Confidence |
| | | American West Potash KG-2 | | 0.00 | | 0.00 | | û | | Insufficient Grade and Thickness |
| | | American West Potash KG-3 | | 0.00 | | 0.00 | | û | | High Insoluble Content |
| | | American West Potash KG-4 | | 0.00 | | 0.00 | | û | | High Insoluble Content |
| | | American West Potash KG-5 | | 0.00 | | 0.00 | | û | | Insufficient Grade and Thickness, High Insoluble Content |
| | | American West Potash KG-6 | | 0.00 | | 0.00 | | û | | Insufficient Grade and Thickness |
| | | American West Potash KG-8 | | 0.00 | | 0.00 | | û | | Insufficient Grade and Thickness |
| | | American West Potash KG-9 | | 0.00 | | 0.00 | | û | | Insufficient Grade and Thickness |
| | | American West Potash KG-10 | | 0.00 | | 0.00 | | û | | Insufficient Grade and Thickness |
| | | American West Potash KG-12 | | 0.00 | | 0.00 | | û | | Insufficient Grade and Thickness |
| | | American West Potash KG-13 | | 0.00 | | 0.00 | | û | | Insufficient Grade and Thickness |
| | | American West Potash KG-14 | | 0.00 | | 0.00 | | û | | Insufficient Grade and Thickness |
| | | | | | | | | | | Summary |
| | | | | | | | | | | | | Total Area With Seismic | | Weighted Average | | Weighted Average | | | | | | | | |
| | | | | | | | | | | Total Area | | Deductions of 15% | | Thickness | | %K2O Grade | | Total Volume | | Total Sylvinite Weight | | Total Sylvinite Tonnage | | Total %K2O |
| | | | | | | | | | | (m2) | | (m2) | | (m) | | (%) | | (m3) | | (kg) | | (Tonnes) | | Tonnage (MMT) |
| | | | | | | | | | | 0 | | 0 | | 0.00 | | 0.00 | | 0 | | 0 | | | 0 | | | | 0.00 | |
| | | | | | | | | | | | | | | | | | | | | | | Tonnage per Section ** | | | 0.00 | |
| | | |
| ** | | Assuming 640 acres (2,589,988 m2) per section |
Indicated Tonnage
0.0-1.6KM ROI
| | | | | | | | | | | | | | | | | | | | | | | | | | | | | | | | | | | | | | | | | | | | | | | |
| | | | | | | | | | | | | | | | | Mineral Estimation in KR-2 | |
| | | | | | | | | | | | | | | | | Area Calculation | | | | | | | | | | |
| UNIT: KR-2 | | | | | | | | | | Grade x | | | | | | | Area With Seismic | | | Measured Data | | | Tonnage Calculation | | | | |
| POLYGON / | | | | | | | | | | | | Thck | | | Area | | | Deductions of 15% | | | Thickness | | | K2O Grade | | | Volume | | | Sylvinite Weight | | | Sylvinite Tonnage | | | K2O Tonnage | |
| WELL No. | | WELL NAME | | From (m) | | | To (m) | | | >12.191 | | | (m2) | | | (m2) | | | (m) | | | (%) | | | (m3) | | | (kg) | | | (Tonnes) | | | (Tonnes) | |
| | | 01-17 | | | 0.00 | | | | 0.00 | | | û | | | Historic Well — Lack of Data (No Core) |
| | | 01-18 | | | 0.00 | | | | 0.00 | | | û | | | Historic Well — Lack of Data (No Core) |
| | | 01-22 | | | 0.00 | | | | 0.00 | | | û | | | Historic Well — Lack of Data (No Core) |
| | | 01-23 | | | 469.32 | | | | 472.29 | | | ü | | | Historic Well — Lack of Data (No Core) |
| | | 01-24 | | | 0.00 | | | | 0.00 | | | û | | | Historic Well — Lack of Data (No Core) |
| | | 01-25 | | | 421.39 | | | | 425.04 | | | ü | | | Historic Well — Lack of Data (No Core) |
| | | 01-26 | | | 384.51 | | | | 389.08 | | | ü | | | Historic Well — Lack of Data (No Core) |
| | | 01-27 | | | 0.00 | | | | 0.00 | | | û | | | Historic Well — Lack of Data (No Core) |
| | | 01-28 | | | 0.00 | | | | 0.00 | | | û | | | Historic Well — Lack of Data (No Core) |
| | | 01-29 | | | 0.00 | | | | 0.00 | | | ü | | | Historic Well — Lack of Data (No Core) |
| | | 01-30 | | | 0.00 | | | | 0.00 | | | û | | | Historic Well — Lack of Data (No Core) |
| | | 01-32 | | | 0.00 | | | | 0.00 | | | û | | | Historic Well — Lack of Data (No Core) |
| | | 01-35 | | | 0.00 | | | | 0.00 | | | û | | | Historic Well — Lack of Data (No Core) |
| | | 01-36 | | | 268.15 | | | | 270.74 | | | ü | | | Historic Well — Lack of Data (No Core) |
| | | 01-40 | | | 0.00 | | | | 0.00 | | | û | | | Historic Well — Lack of Data (No Core) |
| | | 01-41 | | | 0.00 | | | | 0.00 | | | û | | | Historic Well — Lack of Data (No Core) |
| | | 01-42 | | | 253.75 | | | | 254.97 | | | ü | | | Historic Well — Lack of Data (No Core) |
| | | 01-43 | | | 0.00 | | | | 0.00 | | | û | | | Historic Well — Lack of Data (No Core) |
| | | 01-44 | | | 417.58 | | | | 418.87 | | | ü | | | Historic Well — Lack of Data (No Core) |
| | | 01-45 | | | 326.52 | | | | 327.74 | | | ü | | | Historic Well — Lack of Data (No Core) |
| | | 01-46 | | | 0.00 | | | | 0.00 | | | û | | | Historic Well — Lack of Data (No Core) |
| | | 01-47 | | | 348.16 | | | | 350.98 | | | ü | | | Historic Well — Lack of Data (No Core) |
| | | 01-48 | | | 410.79 | | | | 412.78 | | | ü | | | Historic Well — Lack of Data (No Core) |
| | | 01-49 | | | 0.00 | | | | 0.00 | | | û | | | Historic Well — Lack of Data (No Core) |
| | | 01-50 | | | 346.56 | | | | 349.22 | | | ü | | | Historic Well — Lack of Data (No Core) |
| | | 01-51 | | | 368.05 | | | | 369.57 | | | ü | | | Historic Well — Lack of Data (No Core) |
| | | 01-52 | | | 0.00 | | | | 0.00 | | | û | | | Historic Well — Lack of Data (No Core) |
| | | 01-53 | | | 511.23 | | | | 512.75 | | | ü | | | Historic Well — Lack of Data (No Core) |
| | | 01-54 | | | 435.56 | | | | 438.38 | | | ü | | | Historic Well — Lack of Data (No Core) |
| | | 01-55 | | | 451.49 | | | | 453.54 | | | ü | | | Historic Well — Lack of Data (No Core) |
| | | 01-56 | | | 549.33 | | | | 551.31 | | | ü | | | Historic Well — Lack of Data (No Core) |
| | | 01-58 | | | 0.00 | | | | 0.00 | | | û | | | Historic Well — Lack of Data (No Core) |
| | | 01-60 | | | 0.00 | | | | 0.00 | | | û | | | Historic Well — Lack of Data (No Core) |
| | | 01-64 | | | 0.00 | | | | 0.00 | | | û | | | Historic Well — Lack of Data (No Core) |
| | | 01-65 | | | 0.00 | | | | 0.00 | | | û | | | Historic Well — Lack of Data (No Core) |
| | | 01-66 | | | 0.00 | | | | 0.00 | | | û | | | Historic Well — Lack of Data (No Core) |
| | | 01-67 | | | 0.00 | | | | 0.00 | | | û | | | Historic Well — Lack of Data (No Core) |
| | | 01-68 | | | 555.04 | | | | 556.57 | | | ü | | | Historic Well — Lack of Data (No Core) |
| | | 01-69 | | | 0.00 | | | | 0.00 | | | û | | | Historic Well — Lack of Data (No Core) |
| | | 01-70 | | | 591.46 | | | | 593.83 | | | ü | | | Historic Well — Lack of Data (No Core) |
| | | 01-71 | | | 0.00 | | | | 0.00 | | | û | | | Historic Well — Lack of Data (No Core) |
| | | 01-72 | | | 0.00 | | | | 0.00 | | | û | | | Historic Well — Lack of Data (No Core) |
| | | 01-73 | | | 0.00 | | | | 0.00 | | | û | | | Historic Well — Lack of Data (No Core) |
| | | 623 | | | 0.00 | | | | 0.00 | | | û | | | Historic Well — Lack of Data (No Core) |
| | | 624 | | | 508.33 | | | | 510.24 | | | ü | | | Historic Well — Lack of Data (No Core) |
| | | 626 | | | 0.00 | | | | 0.00 | | | û | | | Historic Well — Lack of Data (No Core) |
| | | 630 | | | 0.00 | | | | 0.00 | | | û | | | Historic Well — Lack of Data (No Core) |
| | | 631 | | | 0.00 | | | | 0.00 | | | û | | | Historic Well — Lack of Data (No Core) |
| | | 632 | | | 379.63 | | | | 380.92 | | | ü | | | Historic Well — Lack of Data (No Core) |
| | | 633 | | | 351.43 | | | | 353.26 | | | û | | | Historic Well — Lack of Data (No Core) |
| | | 634 | | | 372.24 | | | | 373.53 | | | ü | | | Historic Well — Lack of Data (No Core) |
| | | 636 | | | 433.88 | | | | 435.10 | | | ü | | | Historic Well — Lack of Data (No Core) |
| | | 641 | | | 454.61 | | | | 455.83 | | | ü | | | Historic Well — Lack of Data (No Core) |
Indicated Tonnage
0.0-1.6KM ROI
| | | | | | | | | | | | | | | | | | | | | | | | | | | | | | | | | | | | | | | | | | | | | | | |
| | | | | | | | | | | | | | | | | Mineral Estimation in KR-2 | |
| | | | | | | | | | | | | | | | | Area Calculation | | | | | | | | | | |
| UNIT: KR-2 | | | | | | | | | | Grade x | | | | | | | Area With Seismic | | | Measured Data | | | Tonnage Calculation | | | | |
| POLYGON / | | | | | | | | | | | | Thck | | | Area | | | Deductions of 15% | | | Thickness | | | K2O Grade | | | Volume | | | Sylvinite Weight | | | Sylvinite Tonnage | | | K2O Tonnage | |
| WELL No. | | WELL NAME | | From (m) | | | To (m) | | | >12.191 | | | (m2) | | | (m2) | | | (m) | | | (%) | | | (m3) | | | (kg) | | | (Tonnes) | | | (Tonnes) | |
| | | 642 | | | 477.90 | | | | 479.11 | | | ü | | | Historic Well — Lack of Data (No Core) |
| | | 645 | | | 0.00 | | | | 0.00 | | | û | | | Historic Well — Lack of Data (No Core) |
| | | 650 | | | 0.00 | | | | 0.00 | | | û | | | Historic Well — Lack of Data (No Core) |
| | | 652 | | | 0.00 | | | | 0.00 | | | û | | | Historic Well — Lack of Data (No Core) |
| | | 664 | | | 0.00 | | | | 0.00 | | | û | | | Historic Well — Lack of Data (No Core) |
| | | 665 | | | 421.84 | | | | 423.14 | | | ü | | | Historic Well — Lack of Data (No Core) |
| | | 673 | | | 358.29 | | | | 359.51 | | | ü | | | Historic Well — Lack of Data (No Core) |
| | | 675 | | | 554.13 | | | | 556.41 | | | ü | | | Historic Well — Lack of Data (No Core) |
| | | 679 | | | 0.00 | | | | 0.00 | | | û | | | Historic Well — Lack of Data (No Core) |
| | | 680 | | | 390.07 | | | | 392.43 | | | ü | | | Historic Well — Lack of Data (No Core) |
| | | 681 | | | 372.69 | | | | 375.67 | | | ü | | | Historic Well — Lack of Data (No Core) |
| | | 682 | | | 343.97 | | | | 346.71 | | | ü | | | Historic Well — Lack of Data (No Core) |
| | | American West Potash KG-1 | | | 385.63 | | | | 388.01 | | | ü | | | Unreliable Assay Results — Lack of Confidence |
| | | American West Potash KG-2 | | | 380.79 | | | | 382.83 | | | ü | | | | 5,416,207 | | | | 4,603,776 | | | | 2.04 | | | | 9.86 | | | | 9,391,703 | | | | 19,534,742,240 | | | | 19,534,742 | | | | 1,926,126 | |
| | | American West Potash KG-3 | | | 389.43 | | | | 390.98 | | | ü | | | | 6,857,768 | | | | 5,829,103 | | | | 1.55 | | | | 9.74 | | | | 9,035,110 | | | | 18,793,028,800 | | | | 18,793,029 | | | | 1,830,441 | |
| | | American West Potash KG-4 | | | 415.03 | | | | 416.97 | | | ü | | | | 6,690,269 | | | | 5,686,729 | | | | 1.94 | | | | 9.56 | | | | 11,032,254 | | | | 22,947,088,320 | | | | 22,947,088 | | | | 2,193,742 | |
| | | American West Potash KG-5 | | | 435.31 | | | | 438.11 | | | ü | | | | 7,496,492 | | | | 6,372,018 | | | | 2.80 | | | | 10.28 | | | | 17,841,650 | | | | 37,110,632,000 | | | | 37,110,632 | | | | 3,814,973 | |
| | | American West Potash KG-6 | | | 445.30 | | | | 446.52 | | | ü | | | | 7,449,967 | | | | 6,332,472 | | | | 1.22 | | | | 11.48 | | | | 7,725,616 | | | | 16,069,281,280 | | | | 16,069,281 | | | | 1,844,753 | |
| | | American West Potash KG-8 | | | 435.59 | | | | 437.36 | | | ü | | | Gamma Ray Calculation — Lack of Confidence |
| | | American West Potash KG-9 | | | 499.41 | | | | 501.60 | | | ü | | | | 5,858,741 | | | | 4,979,930 | | | | 2.19 | | | | 11.16 | | | | 10,906,047 | | | | 22,684,577,760 | | | | 22,684,578 | | | | 2,531,599 | |
| | | American West Potash KG-10 | | | 0.00 | | | | 0.00 | | | û | | | No Potash |
| | | American West Potash KG-12 | | | 541.64 | | | | 543.80 | | | ü | | | | 5,488,158 | | | | 4,664,934 | | | | 2.16 | | | | 8.64 | | | | 10,076,257 | | | | 20,958,614,560 | | | | 20,958,615 | | | | 1,810,824 | |
| | | American West Potash KG-13 | | | 0.00 | | | | 0.00 | | | û | | | Insufficient Grade and Thickness |
| | | American West Potash KG-14 | | | 0.00 | | | | 0.00 | | | û | | | Insufficient Grade and Thickness |
| |
| | | | | | | | | | | | | | | | | Summary |
| | | | | | | | | | | | | | | | | | | | | Total Area With Seismic | | | Weighted Average | | | Weighted Average | | | | | | | | | | | | | | | | | |
| | | | | | | | | | | | | | | | | Total Area | | | Deductions of 15% | | | Thickness | | | %K2O Grade | | | Total Volume | | | Total Sylvinite Weight | | | Total Sylvinite Tonnage | | | Total %K2O | |
| | | | | | | | | | | | | | | | | (m2) | | | (m2) | | | (m) | | | (%) | | | (m3) | | | (kg) | | | (Tonnes) | | | Tonnage (MMT) | |
| | | | | | | | | | | | | | | | | | 45,257,602 | | | | 38,468,962 | | | | 1.98 | | | | 10.09 | | | | 76,008,637 | | | | 158,097,964,960 | | | | 158,097,965 | | | | 15.95 | |
| | | | | | | | | | | | | | | | | | | | | | | | | | | | | | | | | | | | | | | | | Tonnage per Section ** | | | | 1.07 | |
| | | |
| ** | | Assuming 640 acres (2,589,988 m2) per section |
Inferred Tonnage
1.6-3.2KM ROI
UNIT: KR-1
| | | | | | | | | | | | | | | | | | | | | | | | | | | | | | | | | | | | | | | | | | | | | | | |
| | | | | | | | | | | | | | | | | Mineral Estimation in KR-1 | |
| | | | | | | | | | | | | | | | | Area Calculation | | | Measured Data | | | Tonnage Calculation | | | | |
| | | | | | | | | | | | | Grade x | | | | | | | Area With Seismic | | | | | | | | | | | | | | | | | | | | |
| POLYGON / | | | | From | | | To | | | Thck | | | Area | | | Deductions of 15% | | | Thickness | | | K2O Grade | | | Volume | | | Sylvinite Weight | | | Sylvinite Tonnage | | | K2O Tonnage | |
| WELL No. | | WELL NAME | | (m) | | | (m) | | | >12.191 | | | (m2) | | | (m2) | | | (m) | | | (%) | | | (m3) | | | (kg) | | | (Tonnes) | | | (Tonnes) | |
| | | 01-17 | | | 0.00 | | | | 0.00 | | | | û | | | Did Not Meet Resource Cutoffs — Low Grade/Thickness
|
| | | 01-18 | | | 0.00 | | | | 0.00 | | | | û | | | No Potash
|
| | | 01-22 | | | 0.00 | | | | 0.00 | | | | û | | | No Potash
|
| | | 01-23 | | | 464.97 | | | | 467.11 | | | | ü | | | | 4,914,267 | | | | 4,177,127 | | | | 2.14 | | | | 13.50 | | | | 8,939,052 | | | | 18,593,228,160 | | | | 18,593,228 | | | | 2,510,086 | |
| | | 01-24 | | | 0.00 | | | | 0.00 | | | | û | | | Unreliable Data — Gamma Ray Elevated
|
| | | 01-25 | | | 0.00 | | | | 0.00 | | | | û | | | No Potash
|
| | | 01-26 | | | 381.69 | | | | 384.20 | | | | ü | | | Duplicate Data — KG-01 Twinned Well
|
| | | 01-27 | | | 394.34 | | | | 396.56 | | | | ü | | | | 2,561,109 | | | | 2,176,943 | | | | 2.22 | | | | 21.60 | | | | 4,832,813 | | | | 10,052,251,040 | | | | 10,052,251 | | | | 2,171,286 | |
| | | 01-28 | | | 0.00 | | | | 0.00 | | | | û | | | No Potash
|
| | | 01-29 | | | 0.00 | | | | 0.00 | | | | û | | | Unreliable Data — Historic Assay, No Logs
|
| | | 01-30 | | | 0.00 | | | | 0.00 | | | | û | | | Unreliable Data — Gamma Ray/LAS Incorrect
|
| | | 01-32 | | | 0.00 | | | | 0.00 | | | | û | | | No Potash
|
| | | 01-35 | | | 0.00 | | | | 0.00 | | | | û | | | No Potash
|
| | | 01-36 | | | 0.00 | | | | 0.00 | | | | û | | | No KR-1 Member
|
| | | 01-40 | | | 0.00 | | | | 0.00 | | | | û | | | No Potash
|
| | | 01-41 | | | 0.00 | | | | 0.00 | | | | û | | | No Potash
|
| | | 01-42 | | | 0.00 | | | | 0.00 | | | | û | | | No KR-1 Member
|
| | | 01-43 | | | 0.00 | | | | 0.00 | | | | û | | | No Potash
|
| | | 01-44 | | | 412.01 | | | | 414.07 | | | | ü | | | | 1,748,707 | | | | 1,486,401 | | | | 2.06 | | | | 6.70 | | | | 3,061,986 | | | | 6,368,930,880 | | | | 6,368,931 | | | | 426,718 | |
| | | 01-45 | | | 0.00 | | | | 0.00 | | | | û | | | No KR-1 Member
|
| | | 01-46 | | | 0.00 | | | | 0.00 | | | | û | | | No KR-1 Member
|
| | | 01-47 | | | 345.57 | | | | 346.94 | | | | ü | | | | 3,456,094 | | | | 2,937,680 | | | | 1.37 | | | | 16.70 | | | | 4,024,622 | | | | 8,371,213,760 | | | | 8,371,214 | | | | 1,397,993 | |
| | | 01-48 | | | 0.00 | | | | 0.00 | | | | û | | | No KR-1 Member
|
| | | 01-49 | | | 0.00 | | | | 0.00 | | | | û | | | Did Not Meet Resource Cutoffs — Low Grade/Thickness
|
| | | 01-50 | | | 343.05 | | | | 344.88 | | | | ü | | | | 2,070,287 | | | | 1,759,744 | | | | 1.83 | | | | 11.50 | | | | 3,220,332 | | | | 6,698,290,560 | | | | 6,698,291 | | | | 770,303 | |
| | | 01-51 | | | 0.00 | | | | 0.00 | | | | û | | | Did Not Meet Resource Cutoffs — Low Grade/Thickness
|
| | | 01-52 | | | 0.00 | | | | 0.00 | | | | û | | | No Potash
|
| | | 01-53 | | | 0.00 | | | | 0.00 | | | | û | | | Did Not Meet Resource Cutoffs — Low Grade/Thickness
|
| | | 01-54 | | | 0.00 | | | | 0.00 | | | | û | | | No KR-1 Member
|
| | | 01-55 | | | 0.00 | | | | 0.00 | | | | û | | | No KR-1 Member
|
| | | 01-56 | | | 0.00 | | | | 0.00 | | | | û | | | No KR-1 Member
|
| | | 01-58 | | | 0.00 | | | | 0.00 | | | | û | | | No Potash
|
| | | 0160 | | | 0.00 | | | | 0.00 | | | | û | | | No Potash
|
| | | 01-64 | | | 0.00 | | | | 0.00 | | | | û | | | No Potash
|
| | | 01-65 | | | 0.00 | | | | 0.00 | | | | û | | | No Potash
|
| | | 01-66 | | | 563.65 | | | | 564.87 | | | | ü | | | | 964,314 | | | | 819,667 | | | | 1.22 | | | | 10.30 | | | | 999,994 | | | | 2,079,987,520 | | | | 2,079,988 | | | | 214,239 | |
| | | 01-67 | | | 0.00 | | | | 0.00 | | | | û | | | No Potash
|
| | | 01-68 | | | 0.00 | | | | 0.00 | | | | û | | | No KR-1 Member
|
| | | 01-69 | | | 0.00 | | | | 0.00 | | | | û | | | No Potash
|
| | | 01-70 | | | 0.00 | | | | 0.00 | | | | û | | | No KR-1 Member
|
| | | 01-71 | | | 0.00 | | | | 0.00 | | | | û | | | No Potash
|
| | | 01-72 | | | 0.00 | | | | 0.00 | | | | û | | | No Potash
|
| | | 01-73 | | | 0.00 | | | | 0.00 | | | | û | | | No Potash
|
| | | 623 | | | 0.00 | | | | 0.00 | | | | û | | | No Potash
|
| | | 624 | | | 505.13 | | | | 506.81 | | | | ü | | | | 2,458,950 | | | | 2,090,108 | | | | 1.68 | | | | 7.50 | | | | 3,511,381 | | | | 7,303,672,480 | | | | 7,303,672 | | | | 547,775 | |
| | | 626 | | | 0.00 | | | | 0.00 | | | | û | | | Did Not Meet Resource Cutoffs — Low Grade/Thickness
|
| | | 630 | | | 0.00 | | | | 0.00 | | | | û | | | No Potash
|
| | | 631 | | | 0.00 | | | | 0.00 | | | | û | | | No Potash
|
| | | 632 | | | 0.00 | | | | 0.00 | | | | û | | | No KR-1 Member
|
| | | 633 | | | 0.00 | | | | 0.00 | | | | û | | | Did Not Meet Resource Cutoffs — Low Grade/Thickness
|
| | | 634 | | | 368.05 | | | | 369.27 | | | | ü | | | | 3,855,907 | | | | 3,277,521 | | | | 1.22 | | | | 10.00 | | | | 3,998,576 | | | | 8,317,038,080 | | | | 8,317,038 | | | | 831,704 | |
| | | 636 | | | 0.00 | | | | 0.00 | | | | û | | | No KR-1 Member
|
1 of 4
Inferred Tonnage
1.6-3.2KM ROI
| | | | | | | | | | | | | | | | | | | | | | | | | | | | | | | | | | | | | | | | | | | | | | | |
| | | | | | | | | | | | | | | | | Mineral Estimation in KR-1 | |
| | | | | | | | | | | | | | | | | Area Calculation | | | Measured Data | | | Tonnage Calculation | | | | |
| | | | | | | | | | | | | Grade x | | | | | | | Area With Seismic | | | | | | | | | | | | | | | | | | | | |
| POLYGON / | | | | From | | | To | | | Thck | | | Area | | | Deductions of 15% | | | Thickness | | | K2O Grade | | | Volume | | | Sylvinite Weight | | | Sylvinite Tonnage | | | K2O Tonnage | |
| WELL No. | | WELL NAME | | (m) | | | (m) | | | >12.191 | | | (m2) | | | (m2) | | | (m) | | | (%) | | | (m3) | | | (kg) | | | (Tonnes) | | | (Tonnes) | |
| | | 641 | | | 449.89 | | | | 453.54 | | | | ü | | | | 2,932,815 | | | | 2,492,893 | | | | 3.65 | | | | 13.70 | | | | 9,099,059 | | | | 18,926,042,720 | | | | 18,926,043 | | | | 2,592,868 | |
| | | 642 | | | 0.00 | | | | 0.00 | | | | û | | | Did Not Meet Resource Cutoffs — Low Grade/Thickness
|
| | | 645 | | | 0.00 | | | | 0.00 | | | | û | | | No Potash
|
| | | 650 | | | 0.00 | | | | 0.00 | | | | û | | | Did Not Meet Resource Cutoffs — Low Grade/Thickness
|
| | | 652 | | | 409.80 | | | | 411.10 | | | | ü | | | | 5,957,394 | | | | 5,063,785 | | | | 1.30 | | | | 9.70 | | | | 6,582,921 | | | | 13,692,475,680 | | | | 13,692,476 | | | | 1,328,170 | |
| | | 664 | | | 0.00 | | | | 0.00 | | | | û | | | Unreliable Data — Gamma Ray/Neutron Scales
|
| | | 665 | | | 0.00 | | | | 0.00 | | | | û | | | No KR-1 Member
|
| | | 673 | | | 0.00 | | | | 0.00 | | | | û | | | No KR-1 Member
|
| | | 675 | | | 551.92 | | | | 553.52 | | | | ü | | | | 1,368,370 | | | | 1,163,115 | | | | 1.60 | | | | 8.60 | | | | 1,860,984 | | | | 3,870,846,720 | | | | 3,870,847 | | | | 332,893 | |
| | | 679 | | | 0.00 | | | | 0.00 | | | | û | | | No KR-1 Member
|
| | | 680 | | | 0.00 | | | | 0.00 | | | | û | | | Did Not Meet Resource Cutoffs — Low Grade/Thickness
|
| | | 681 | | | 0.00 | | | | 0.00 | | | | û | | | Did Not Meet Resource Cutoffs — Low Grade/Thickness
|
| | | 682 | | | 341.76 | | | | 343.13 | | | | ü | | | | 3,196,239 | | | | 2,716,803 | | | | 1.37 | | | | 11.00 | | | | 3,722,020 | | | | 7,741,801,600 | | | | 7,741,802 | | | | 851,598 | |
| | | American West Potash KG-1 | | | 383.32 | | | | 384.54 | | | | ü | | | | 7,215,308 | | | | 6,133,012 | | | | 1.22 | | | | 20.40 | | | | 7,482,275 | | | | 15,563,132,000 | | | | 15,563,132 | | | | 3,174,879 | |
| | | American West Potash KG-2 | | | 0.00 | | | | 0.00 | | | | û | | | Insufficient Grade and Thickness
|
| | | American West Potash KG-3 | | | 0.00 | | | | 0.00 | | | | û | | | High Insoluble Content
|
| | | American West Potash KG-4 | | | 0.00 | | | | 0.00 | | | | û | | | High Insoluble Content
|
| | | American West Potash KG-5 | | | 0.00 | | | | 0.00 | | | | û | | | Insufficient Grade and Thickness, High Insoluble Content
|
| | | American West Potash KG-6 | | | 0.00 | | | | 0.00 | | | | û | | | Insufficient Grade and Thickness
|
| | | American West Potash KG-8 | | | 0.00 | | | | 0.00 | | | | û | | | Insufficient Grade and Thickness
|
| | | American West Potash KG-9 | | | 0.00 | | | | 0.00 | | | | û | | | Insufficient Grade and Thickness
|
| | | American West Potash KG-10 | | | 0.00 | | | | 0.00 | | | | û | | | Insufficient Grade and Thickness
|
| | | American West Potash KG-12 | | | 0.00 | | | | 0.00 | | | | û | | | Insufficient Grade and Thickness
|
| | | American West Potash KG-13 | | | 0.00 | | | | 0.00 | | | | û | | | Insufficient Grade and Thickness
|
| | | American West Potash KG-14 | | | 0.00 | | | | 0.00 | | | | û | | | Insufficient Grade and Thickness
|
| | | | | | | | | | | | | | | | | | | | | | | | | | | | | | | | | | | | | | | | | | | | | | | |
| | | | | | | | | | | | | | | | | Summary | |
| | | | | | | | | | | | | | | | | | | | | Total Area With Seismic | | | Weighted Average | | | Weighted Average | | | | | | | | | | | | | |
| | | | | | | | | | | | | | | | | Total Area | | | Deductions of 15% | | | Thickness | | | %K2O Grade | | | Total Volume | | | Total Sylvinite Weight | | | Total Sylvinite Tonnage | | | Total % K2O | |
| | | | | | | | | | | | | | | | | (m2) | | | (m2) | | | (m) | | | (%) | | | (m3) | | | (kg) | | | (Tonnes) | | | Tonnage(MMT) | |
| | | | | | | | | | | | | | | | | | 42,699,761 | | | | 36,294,799 | | | | 1.69 | | | | 13.44 | | | | 61,336,015 | | | | 127,578,911,200 | | | | 127,578,913 | | | | 17.15 | |
| | | | | | | | | | | | | | | | | | | | | | | | | | | | | | | | | | | | | | | | | Tonnage per Section ** | | | 1.22 | |
| | | |
| ** | | Assuming 640 acres (2,589,988 m2) per section |
2 of 4
Inferred Tonnage
1.6-3.2KM ROI
UNIT: KR-2
| | | | | | | | | | | | | | | | | | | | | | | | | | | | | | | | | | | | | | | | | | | | | | | |
| | | | | | | | | | | | | | | | | Mineral Estimation in KR-2 | |
| | | | | | | | | | | | | | | | | Area Calculation | | | Measured Data | | | Tonnage Calculation | | | | |
| | | | | | | | | | | | | Grade x | | | | | | | Area With Seismic | | | | | | | | | | | | | | | | | | | | |
| POLYGON / | | | | | | | | | | | | Thck | | | Area | | | Deductions of 15% | | | Thickness | | | K2O Grade | | | Volume | | | Sylvinite Weight | | | Sylvinite Tonnage | | | K2O Tonnage | |
| WELL No. | | WELL NAME | | From (m) | | | To (m) | | | >12.191 | | | (m2) | | | (m2) | | | (m) | | | (%) | | | (m3) | | | (kg) | | | (Tonnes) | | | (Tonnes) | |
| | | 01-17 | | | 0.00 | | | | 0.00 | | | | û | | | Did Not Meet Resource Cutoffs — Low Grade/Thickness
|
| | | 01-18 | | | 0.00 | | | | 0.00 | | | | û | | | No Potash
|
| | | 01-22 | | | 0.00 | | | | 0.00 | | | | û | | | No Potash
|
| | | 01-23 | | | 469.32 | | | | 472.29 | | | | ü | | | | 4,914,267 | | | | 4,177,127 | | | | 2.97 | | | | 8.70 | | | | 12,406,067 | | | | 25,804,619,360 | | | | 25,804,619 | | | | 2,245,002 | |
| | | 01-24 | | | 0.00 | | | | 0.00 | | | | û | | | Unreliable Data — Gamma Ray Elevated
|
| | | 01-25 | | | 421.39 | | | | 425.04 | | | | ü | | | | 6,444,683 | | | | 5,477,981 | | | | 3.65 | | | | 13.60 | | | | 19,994,631 | | | | 41,588,832,480 | | | | 41,588,832 | | | | 5,656,081 | |
| | | 01-26 | | | 384.51 | | | | 389.08 | | | | ü | | | Duplicate Data — KG-01 Twinned Well
|
| | | 01-27 | | | 0.00 | | | | 0.00 | | | | û | | | No KR-2 Member
|
| | | 01-28 | | | 0.00 | | | | 0.00 | | | | û | | | No Potash
|
| | | 01-29 | | | 0.00 | | | | 0.00 | | | | ü | | | Unreliable Data — Historic Assay, No Logs
|
| | | 01-30 | | | 0.00 | | | | 0.00 | | | | û | | | Unreliable Data — Gamma Ray/LAS Incorrect
|
| | | 01-32 | | | 0.00 | | | | 0.00 | | | | û | | | No Potash
|
| | | 01-35 | | | 0.00 | | | | 0.00 | | | | û | | | No Potash
|
| | | 01-36 | | | 268.15 | | | | 270.74 | | | | ü | | | Not Within Property Boundary
|
| | | 01-40 | | | 0.00 | | | | 0.00 | | | | û | | | No Potash
|
| | | 01-41 | | | 0.00 | | | | 0.00 | | | | û | | | No Potash
|
| | | 01-42 | | | 253.75 | | | | 254.97 | | | | ü | | | | 2,184,111 | | | | 1,856,494 | | | | 1.22 | | | | 12.60 | | | | 2,264,923 | | | | 4,711,039,840 | | | | 4,711,040 | | | | 593,591 | |
| | | 01-43 | | | 0.00 | | | | 0.00 | | | | û | | | No Potash
|
| | | 01-44 | | | 417.58 | | | | 418.87 | | | | ü | | | | 1,748,707 | | | | 1,486,401 | | | | 1.29 | | | | 10.30 | | | | 1,917,457 | | | | 3,988,310,560 | | | | 3,988,311 | | | | 410,796 | |
| | | 01-45 | | | 326.52 | | | | 327.74 | | | | ü | | | | 5,068,739 | | | | 4,308,428 | | | | 1.22 | | | | 14.70 | | | | 5,256,282 | | | | 10,933,066,560 | | | | 10,933,067 | | | | 1,607,161 | |
| | | 01-46 | | | 0.00 | | | | 0.00 | | | | û | | | Did Not Meet Resource Cutoffs — Low Grade/Thickness
|
| | | 01-47 | | | 348.16 | | | | 350.98 | | | | ü | | | | 3,456,094 | | | | 2,937,680 | | | | 2.82 | | | | 5.50 | | | | 8,284,258 | | | | 17,231,256,640 | | | | 17,231,257 | | | | 947,719 | |
| | | 01-48 | | | 410.79 | | | | 412.78 | | | | ü | | | | 2,256,431 | | | | 1,917,966 | | | | 1.99 | | | | 21.20 | | | | 3,816,752 | | | | 7,938,844,160 | | | | 7,938,844 | | | | 1,683,035 | |
| | | 01-49 | | | 0.00 | | | | 0.00 | | | | û | | | Did Not Meet Resource Cutoffs — Low Grade/Thickness
|
| | | 01-50 | | | 346.56 | | | | 349.22 | | | | ü | | | | 2,070,287 | | | | 1,759,744 | | | | 2.66 | | | | 17.10 | | | | 4,680,919 | | | | 9,736,311,520 | | | | 9,736,312 | | | | 1,664,909 | |
| | | 01-51 | | | 368.05 | | | | 369.57 | | | | ü | | | | 1,507,495 | | | | 1,281,371 | | | | 1.52 | | | | 14.10 | | | | 1,947,684 | | | | 4,051,182,720 | | | | 4,051,183 | | | | 571,217 | |
| | | 01-52 | | | 0.00 | | | | 0.00 | | | | û | | | No Potash
|
| | | 01-53 | | | 511.23 | | | | 512.75 | | | | ü | | | | 3,609,483 | | | | 3,068,061 | | | | 1.52 | | | | 13.00 | | | | 4,663,453 | | | | 9,699,982,240 | | | | 9,699,982 | | | | 1,260,998 | |
| | | 01-54 | | | 435.56 | | | | 438.38 | | | | ü | | | | 4,145,172 | | | | 3,523,396 | | | | 2.82 | | | | 5.40 | | | | 9,935,977 | | | | 20,666,832,160 | | | | 20,666,832 | | | | 1,116,009 | |
| | | 01-55 | | | 451.49 | | | | 453.54 | | | | ü | | | | 6,020,749 | | | | 5,117,637 | | | | 2.05 | | | | 15.20 | | | | 10,491,156 | | | | 21,821,604,480 | | | | 21,821,604 | | | | 3,316,884 | |
| | | 01-56 | | | 549.33 | | | | 551.31 | | | | ü | | | | 789,534 | | | | 671,104 | | | | 1.98 | | | | 6.40 | | | | 1,328,786 | | | | 2,763,874,880 | | | | 2,763,875 | | | | 176,888 | |
| | | 01-58 | | | 0.00 | | | | 0.00 | | | | û | | | No Potash
|
| | | 01-60 | | | 0.00 | | | | 0.00 | | | | û | | | No Potash
|
| | | 01-64 | | | 0.00 | | | | 0.00 | | | | û | | | No Potash
|
| | | 01-65 | | | 0.00 | | | | 0.00 | | | | û | | | No Potash
|
| | | 01-66 | | | 0.00 | | | | 0.00 | | | | û | | | Did Not Meet Resource Cutoffs — Low Grade/Thickness
|
| | | 01-67 | | | 0.00 | | | | 0.00 | | | | û | | | No Potash
|
| | | 01-68 | | | 555.04 | | | | 556.57 | | | | ü | | | | 4,082,804 | | | | 3,470,383 | | | | 1.53 | | | | 11.20 | | | | 5,309,686 | | | | 11,044,146,880 | | | | 11,044,147 | | | | 1,236,944 | |
| | | 01-69 | | | 0.00 | | | | 0.00 | | | | û | | | No Potash
|
| | | 01-70 | | | 591.46 | | | | 593.83 | | | | ü | | | Not Within Property Boundary
|
| | | 01-71 | | | 0.00 | | | | 0.00 | | | | û | | | No Potash
|
| | | 01-72 | | | 0.00 | | | | 0.00 | | | | û | | | No Potash
|
| | | 01-73 | | | 0.00 | | | | 0.00 | | | | û | | | No Potash
|
| | | 623 | | | 0.00 | | | | 0.00 | | | | û | | | No Potash
|
| | | 624 | | | 508.33 | | | | 510.24 | | | | ü | | | | 2,458,950 | | | | 2,090,108 | | | | 1.91 | | | | 11.10 | | | | 3,992,106 | | | | 8,303,580,480 | | | | 8,303,580 | | | | 921,697 | |
| | | 626 | | | 0.00 | | | | 0.00 | | | | û | | | Did Not Meet Resource Cutoffs — Low Grade/Thickness
|
| | | 630 | | | 0.00 | | | | 0.00 | | | | û | | | No Potash
|
| | | 631 | | | 0.00 | | | | 0.00 | | | | û | | | No Potash
|
| | | 632 | | | 379.63 | | | | 380.92 | | | | ü | | | | 995,038 | | | | 845,782 | | | | 1.29 | | | | 13.20 | | | | 1,091,059 | | | | 2,269,402,720 | | | | 2,269,403 | | | | 299,561 | |
| | | 633 | | | 351.43 | | | | 353.26 | | | | û | | | Did Not Meet Resource Cutoffs — Low Grade/Thickness
|
| | | 634 | | | 372.24 | | | | 373.53 | | | | ü | | | | 3,855,907 | | | | 3,277,521 | | | | 1.29 | | | | 11.80 | | | | 4,228,002 | | | | 8,794,244,160 | | | | 8,794,244 | | | | 1,037,721 | |
| | | 636 | | | 433.88 | | | | 435.10 | | | | ü | | | | 5,913,374 | | | | 5,026,368 | | | | 1.22 | | | | 14.60 | | | | 6,132,169 | | | | 12,754,911,520 | | | | 12,754,912 | | | | 1,862,217 | |
| | | 641 | | | 454.61 | | | | 455.83 | | | | ü | | | | 2,932,815 | | | | 2,492,893 | | | | 1.22 | | | | 13.70 | | | | 3,041,329 | | | | 6,325,964,320 | | | | 6,325,964 | | | | 866,657 | |
| | | 642 | | | 477.90 | | | | 479.11 | | | | ü | | | | 7,447,336 | | | | 6,330,236 | | | | 1.21 | | | | 13.10 | | | | 7,659,586 | | | | 15,931,938,880 | | | | 15,931,939 | | | | 2,087,084 | |
| | | 645 | | | 0.00 | | | | 0.00 | | | | û | | | No Potash
|
| | | 650 | | | 0.00 | | | | 0.00 | | | | û | | | Did Not Meet Resource Cutoffs — Low Grade/Thickness
|
| | | 652 | | | 0.00 | | | | 0.00 | | | | û | | | Did Not Meet Resource Cutoffs — High Carnallite Content
|
| | | 664 | | | 0.00 | | | | 0.00 | | | | û | | | Unreliable Data — Gamma Ray/Neutron Incorrect
|
3 of 4
Inferred Tonnage
1.6-3.2KM ROI
UNIT: KR-2
| | | | | | | | | | | | | | | | | | | | | | | | | | | | | | | | | | | | | | | | | | | | | | | |
| | | | | | | | | | | | | | | | | Mineral Estimation in KR-2 | |
| | | | | | | | | | | | | | | | | Area Calculation | | | | | | | | | | |
| | | | | | | | | | | | | Grade x | | | | | | | Area With Seismic | | | Measured Data | | | Tonnage Calculation | | | | |
| POLYGON / | | | | | | | | | | | | Thck | | | Area | | | Deductions of 15% | | | Thickness | | | K2O Grade | | | Volume | | | Sylvinite Weight | | | Sylvinite Tonnage | | | K2O Tonnage | |
| WELL No. | | WELL NAME | | From (m) | | | To (m) | | | >12.191 | | | (m2) | | | (m2) | | | (m) | | | (%) | | | (m3) | | | (kg) | | | (Tonnes) | | | (Tonnes) | |
| | | 665 | | | 421.84 | | | | 423.14 | | | | ü | | | | 3,447,169 | | | | 2,930,094 | | | | 1.30 | | | | 17.80 | | | | 3,809,122 | | | | 7,922,973,760 | | | | 7,922,974 | | | | 1,410,289 | |
| | | 673 | | | 358.29 | | | | 359.51 | | | | ü | | | | 3,523,118 | | | | 2,994,650 | | | | 1.22 | | | | 10.20 | | | | 3,653,473 | | | | 7,599,223,840 | | | | 7,599,224 | | | | 775,121 | |
| | | 675 | | | 554.13 | | | | 556.41 | | | | ü | | | | 1,368,370 | | | | 1,163,115 | | | | 2.28 | | | | 10.60 | | | | 2,651,902 | | | | 5,515,956,160 | | | | 5,515,956 | | | | 584,691 | |
| | | 679 | | | 0.00 | | | | 0.00 | | | | û | | | Did Not Meet Resource Cutoffs — Low Grade/Thickness
|
| | | 680 | | | 390.07 | | | | 392.43 | | | | ü | | | | 2,393,756 | | | | 2,034,693 | | | | 2.36 | | | | 12.10 | | | | 4,801,875 | | | | 9,987,900,000 | | | | 9,987,900 | | | | 1,208,536 | |
| | | 681 | | | 372.69 | | | | 375.67 | | | | ü | | | | 2,545,240 | | | | 2,163,454 | | | | 2.98 | | | | 11.80 | | | | 6,447,093 | | | | 13,409,953,440 | | | | 13,409,953 | | | | 1,582,374 | |
| | | 682 | | | 343.97 | | | | 346.71 | | | | ü | | | | 3,196,239 | | | | 2,716,803 | | | | 2.74 | | | | 15.50 | | | | 7,444,040 | | | | 15,483,603,200 | | | | 15,483,603 | | | | 2,399,958 | |
| | | American West Potash KG-1 | | | 385.63 | | | | 388.01 | | | | ü | | | | 7,215,308 | | | | 6,133,012 | | | | 2.38 | | | | 8.80 | | | | 14,596,569 | | | | 30,360,863,520 | | | | 30,360,864 | | | | 2,671,756 | |
| | | American West Potash KG-2 | | | 380.79 | | | | 382.83 | | | | ü | | | | 1,070,281 | | | | 909,739 | | | | 2.04 | | | | 9.86 | | | | 1,855,868 | | | | 3,860,205,440 | | | | 3,860,205 | | | | 380,616 | |
| | | American West Potash KG-3 | | | 389.43 | | | | 390.98 | �� | | | ü | | | | 2,462,049 | | | | 2,092,742 | | | | 1.55 | | | | 9.74 | | | | 3,243,750 | | | | 6,747,000,000 | | | | 6,747,000 | | | | 657,158 | |
| | | American West Potash KG-4 | | | 415.03 | | | | 416.97 | | | | ü | | | | 4,037,607 | | | | 3,431,966 | | | | 1.94 | | | | 9.56 | | | | 6,658,014 | | | | 13,848,669,120 | | | | 13,848,669 | | | | 1,323,933 | |
| | | American West Potash KG-5 | | | 435.31 | | | | 438.11 | | | | ü | | | | 3,465,165 | | | | 2,945,390 | | | | 2.80 | | | | 10.28 | | | | 8,247,092 | | | | 17,153,951,360 | | | | 17,153,951 | | | | 1,763,426 | |
| | | American West Potash KG-6 | | | 445.30 | | | | 446.52 | | | | ü | | | | 6,206,278 | | | | 5,275,336 | | | | 1.22 | | | | 11.48 | | | | 6,435,910 | | | | 13,386,692,800 | | | | 13,386,693 | | | | 1,536,792 | |
| | | American West Potash KG-8 | | | 435.59 | | | | 437.36 | | | | ü | | | | 10,975,797 | | | | 9,329,427 | | | | 1.77 | | | | 7.80 | | | | 16,513,086 | | | | 34,347,218,880 | | | | 34,347,219 | | | | 2,679,083 | |
| | | American West Potash KG-9 | | | 499.41 | | | | 501.60 | | | | ü | | | | 1,708,122 | | | | 1,451,904 | | | | 2.19 | | | | 11.16 | | | | 3,179,670 | | | | 6,613,713,600 | | | | 6,613,714 | | | | 738,090 | |
| | | American West Potash KG-10 | | | 0.00 | | | | 0.00 | | | | û | | | No Potash | |
| | | American West Potash KG-12 | | | 541.64 | | | | 543.80 | | | | ü | | | | 39,704 | | | | 33,748 | | | | 2.16 | | | | 8.64 | | | | 72,896 | | | | 151,623,680 | | | | 151,624 | | | | 13,100 | |
| | | American West Potash KG-13 | | | 0.00 | | | | 0.00 | | | | û | | | Did Not Meet Resource Cutoffs — Low Grade/Thickness
|
| | | American West Potash KG-14 | | | 0.00 | | | | 0.00 | | | | û | | | Did Not Meet Resource Cutoffs — Low Grade/Thickness
|
| | | | | | | | | | | | | | | | | | | | | | | | | | | | | | | | | | | | | | | | | | | | | | | |
| | | | | | | | | | | | | | | | | Summary | |
| | | | | | | | | | | | | | | | | | | | | Total Area With Seismic | | | Weighted Average | | | Weighted Average | | | | | | | | | | | | | |
| | | | | | | | | | | | | | | | | Total Area | | | Deductions of 15% | | | Thickness | | | % K2O Grade | | | Total Volume | | | Total Sylvinite Weight | | | Total Sylvinite Tonnage | | | Total % K2O | |
| | | | | | | | | | | | | | | | | (m2) | | | (m2) | | | (m) | | | (%) | | | (m3) | | | (kg) | | | (Tonnes) | | | Tonnage (MMT) | |
| | | | | | | | | | | | | | | | | | 125,556,179 | | | | 106,722,754 | | | | 1.95 | | | | 11.39 | | | | 208,052,642 | | | | 432,749,495,360 | | | | 432,749,496 | | | | 49.29 | |
| | | | | | | | | | | | | | | | | | | | | | | | | | | | | | | | | | | | | | | | | Tonnage per Section ** | | | 1.20 | |
| | | |
| ** | | Assuming 640 acres (2,589,988 m2) per section |
4 of 4
Drill Hole Summary Table
| | | | | | | | | | | | | | | | | | | | | | | | | | | | | | | | | |
| | | | | | | | | | | | | | | | | | | | | | | | | | | | | | | Include in | | |
| | | | | | | | | | | | | | | | | | | | | | | | | | | | | | | Resource | | |
| | | | | | | | | | | | | | | | | | | | | | | | | | | | | | | Calculation | | |
| Drill Hole | | From (m) | | | To (m) | | | Thickness (m) | | | %K2O | | | %Carnallite | | | %Insolubles | | | Grade x Thckness | | | (>12.191) | | |
| KR-1 | | |
| 01-17 | | | 0.00 | | | | 0.00 | | | | 0.00 | | | | 0.0 | | | | | | | | | | | | 0.00 | | | û |
|
| | | 01-18 | | | 0.00 | | | | 0.00 | | | | 0.00 | | | | 0.0 | | | | | | | | | | | | 0.00 | | | û | | |
| 01-22 | | | 0.00 | | | | 0.00 | | | | 0.00 | | | | 0.0 | | | | | | | | | | | | 0.00 | | | û | | |
| 01-23 | | | 464.97 | | | | 467.11 | | | | 2.14 | | | | 13.5 | | | | | | | | | | | | 28.89 | | | ü | | |
| 01-24 | | | 0.00 | | | | 0.00 | | | | 0.00 | | | | 0.0 | | | | | | | | | | | | 0.00 | | | û | | |
| 01-25 | | | 0.00 | | | | 0.00 | | | | 0.00 | | | | 0.0 | | | | | | | | | | | | 0.00 | | | û | | |
| 01-26 | | | 381.69 | | | | 384.20 | | | | 2.51 | | | | 6.3 | | | | | | | | | | | | 15.81 | | | ü | | |
| 01-27 | | | 394.34 | | | | 396.56 | | | | 2.22 | | | | 21.6 | | | | | | | | | | | | 47.95 | | | ü | | |
| 01-28 | | | 0.00 | | | | 0.00 | | | | 0.00 | | | | 0.0 | | | | | | | | | | | | 0.00 | | | û | | |
| 01-29 | | | 0.00 | | | | 0.00 | | | | 0.00 | | | | 0.0 | | | | | | | | | | | | 0.00 | | | û | | |
| 01-30 | | | 441.50 | | | | 443.10 | | | | 1.60 | | | | 6.3 | | | | | | | | | | | | 10.08 | | | û | | |
| 01-32 | | | 0.00 | | | | 0.00 | | | | 0.00 | | | | 0.0 | | | | | | | | | | | | 0.00 | | | û | | |
| 01-35 | | | 0.00 | | | | 0.00 | | | | 0.00 | | | | 0.0 | | | | | | | | | | | | 0.00 | | | û | | |
| 01-36 | | | 0.00 | | | | 0.00 | | | | 0.00 | | | | 0.0 | | | | | | | | | | | | 0.00 | | | û | | |
| 01-40 | | | 0.00 | | | | 0.00 | | | | 0.00 | | | | 0.0 | | | | | | | | | | | | 0.00 | | | û | | |
| 01-41 | | | 0.00 | | | | 0.00 | | | | 0.00 | | | | 0.0 | | | | | | | | | | | | 0.00 | | | û | | |
| 01-42 | | | 0.00 | | | | 0.00 | | | | 0.00 | | | | 0.0 | | | | | | | | | | | | 0.00 | | | û | | |
| 01-43 | | | 0.00 | | | | 0.00 | | | | 0.00 | | | | 0.0 | | | | | | | | | | | | 0.00 | | | û | | |
| 01-44 | | | 412.01 | | | | 414.07 | | | | 2.06 | | | | 6.7 | | | | | | | | | | | | 13.80 | | | ü | | |
| 01-45 | | | 0.00 | | | | 0.00 | | | | 0.00 | | | | 0.0 | | | | | | | | | | | | 0.00 | | | û | | |
| 01-46 | | | 0.00 | | | | 0.00 | | | | 0.00 | | | | 0.0 | | | | | | | | | | | | 0.00 | | | û | | |
| 01-47 | | | 345.57 | | | | 346.94 | | | | 1.37 | | | | 16.7 | | | | | | | | | | | | 22.88 | | | ü | | |
| 01-48 | | | 0.00 | | | | 0.00 | | | | 0.00 | | | | 0.0 | | | | | | | | | | | | 0.00 | | | û | | |
| 01-49 | | | 0.00 | | | | 0.00 | | | | 0.00 | | | | 0.0 | | | | | | | | | | | | 0.00 | | | û | | |
| 01-50 | | | 343.05 | | | | 344.88 | | | | 1.83 | | | | 11.5 | | | | | | | | | | | | 21.05 | | | ü | | |
| 01-51 | | | 365.15 | | | | 365.38 | | | | 0.23 | | | | 3.5 | | | | | | | | | | | | 0.81 | | | û | | |
| 01-52 | | | 0.00 | | | | 0.00 | | | | 0.00 | | | | 0.0 | | | | | | | | | | | | 0.00 | | | û | | |
| 01-53 | | | 508.86 | | | | 509.70 | | | | 0.84 | | | | 6.9 | | | | | | | | | | | | 5.80 | | | û | | |
| 01-54 | | | 0.00 | | | | 0.00 | | | | 0.00 | | | | 0.0 | | | | | | | | | | | | 0.00 | | | û | | |
| 01-55 | | | 0.00 | | | | 0.00 | | | | 0.00 | | | | 0.0 | | | | | | | | | | | | 0.00 | | | û | | |
| 01-56 | | | 0.00 | | | | 0.00 | | | | 0.00 | | | | 0.0 | | | | | | | | | | | | 0.00 | | | û | | |
| 01-58 | | | 0.00 | | | | 0.00 | | | | 0.00 | | | | 0.0 | | | | | | | | | | | | 0.00 | | | û | | |
| 0160 | | | 0.00 | | | | 0.00 | | | | 0.00 | | | | 0.0 | | | | | | | | | | | | 0.00 | | | û | | |
| 01-64 | | | 0.00 | | | | 0.00 | | | | 0.00 | | | | 0.0 | | | | | | | | | | | | 0.00 | | | û | | |
| 01-65 | | | 0.00 | | | | 0.00 | | | | 0.00 | | | | 0.0 | | | | | | | | | | | | 0.00 | | | û | | |
| 01-66 | | | 563.65 | | | | 564.87 | | | | 1.22 | | | | 10.3 | | | | | | | | | | | | 12.57 | | | ü | | |
| 01-67 | | | 0.00 | | | | 0.00 | | | | 0.00 | | | | 0.0 | | | | | | | | | | | | 0.00 | | | û | | |
| 01-68 | | | 552.53 | | | | 553.29 | | | | 0.76 | | | | 4.7 | | | | | | | | | | | | 3.57 | | | û | | |
| 01-69 | | | 0.00 | | | | 0.00 | | | | 0.00 | | | | 0.0 | | | | | | | | | | | | 0.00 | | | û | | |
| 01-70 | | | 0.00 | | | | 0.00 | | | | 0.00 | | | | 0.0 | | | | | | | | | | | | 0.00 | | | û | | |
| 01-71 | | | 0.00 | | | | 0.00 | | | | 0.00 | | | | 0.0 | | | | | | | | | | | | 0.00 | | | û | | |
| 01-72 | | | 0.00 | | | | 0.00 | | | | 0.00 | | | | 0.0 | | | | | | | | | | | | 0.00 | | | û | | |
| 01-73 | | | 0.00 | | | | 0.00 | | | | 0.00 | | | | 0.0 | | | | | | | | | | | | 0.00 | | | û | | |
| 623 | | | 0.00 | | | | 0.00 | | | | 0.00 | | | | 0.0 | | | | | | | | | | | | 0.00 | | | û | | |
| 624 | | | 505.13 | | | | 506.81 | | | | 1.68 | | | | 7.5 | | | | | | | | | | | | 12.60 | | | ü | | |
| 626 | | | 0.00 | | | | 0.00 | | | | 0.00 | | | | 0.0 | | | | | | | | | | | | 0.00 | | | û | | |
| 630 | | | 0.00 | | | | 0.00 | | | | 0.00 | | | | 0.0 | | | | | | | | | | | | 0.00 | | | û | | |
| 631 | | | 0.00 | | | | 0.00 | | | | 0.00 | | | | 0.0 | | | | | | | | | | | | 0.00 | | | û | | |
| 632 | | | 0.00 | | | | 0.00 | | | | 0.00 | | | | 0.0 | | | | | | | | | | | | 0.00 | | | û | | |
| 633 | | | 348.16 | | | | 348.84 | | | | 0.68 | | | | 4.7 | | | | | | | | | | | | 3.20 | | | û | | |
| 634 | | | 368.05 | | | | 369.27 | | | | 1.22 | | | | 10.0 | | | | | | | | | | | | 12.20 | | | ü | | |
| 636 | | | 0.00 | | | | 0.00 | | | | 0.00 | | | | 0.0 | | | | | | | | | | | | 0.00 | | | û | | |
| 641 | | | 449.89 | | | | 453.54 | | | | 3.65 | | | | 13.7 | | | | | | | | | | | | 50.01 | | | ü | | |
| 642 | | | 474.68 | | | | 475.45 | | | | 0.77 | | | | 5.4 | | | | | | | | | | | | 4.16 | | | û | | |
| 645 | | | 0.00 | | | | 0.00 | | | | 0.00 | | | | 0.0 | | | | | | | | | | | | 0.00 | | | û | | |
| 650 | | | 422.83 | | | | 424.21 | | | | 1.37 | | | | 5.8 | | | | | | | | | | | | 7.95 | | | û | | |
| 652 | | | 409.80 | | | | 411.10 | | | | 1.30 | | | | 9.7 | | | | | | | | | | | | 12.61 | | | ü | | |
| 664 | | | 0.00 | | | | 0.00 | | | | 0.00 | | | | 0.0 | | | | | | | | | | | | 0.00 | | | û | | |
| 665 | | | 0.00 | | | | 0.00 | | | | 0.00 | | | | 0.0 | | | | | | | | | | | | 0.00 | | | û | | |
| 673 | | | 0.00 | | | | 0.00 | | | | 0.00 | | | | 0.0 | | | | | | | | | | | | 0.00 | | | û | | |
| 675 | | | 551.92 | | | | 553.52 | | | | 1.60 | | | | 8.6 | | | | | | | | | | | | 13.76 | | | ü | | |
| 679 | | | 0.00 | | | | 0.00 | | | | 0.00 | | | | 0.0 | | | | | | | | | | | | 0.00 | | | û | | |
| 680 | | | 386.87 | | | | 388.39 | | | | 1.52 | | | | 3.5 | | | | | | | | | | | | 5.32 | | | û | | |
| 681 | | | 0.00 | | | | 0.00 | | | | 0.00 | | | | 0.0 | | | | | | | | | | | | 0.00 | | | û | | |
| 682 | | | 341.76 | | | | 343.13 | | | | 1.37 | | | | 11.0 | | | | | | | | | | | | 15.07 | | | ü | | |
| American West Potash KG-1 | | | 383.32 | | | | 384.54 | | | | 1.22 | | | | 20.40 | | | | 32.30 | | | | 0.00 | | | | 24.89 | | | ü | | |
| American West Potash KG-2 | | | 377.78 | | | | 378.24 | | | | 0.46 | | | | 9.04 | | | | 0.00 | | | | 0.00 | | | | 4.16 | | | û | | |
| American West Potash KG-3 | | | 385.60 | | | | 386.90 | | | | 1.30 | | | | 9.92 | | | | 3.68 | | | | 13.44 | | | | 12.90 | | | ü | | |
| American West Potash KG-4 | | | 412.61 | | | | 414.73 | | | | 2.12 | | | | 8.42 | | | | 3.20 | | | | 17.80 | | | | 17.85 | | | ü | | |
| American West Potash KG-5 | | | 433.85 | | | | 434.40 | | | | 0.55 | | | | 4.02 | | | | 4.60 | | | | 21.85 | | | | 2.21 | | | û | | |
| American West Potash KG-6 | | | 442.60 | | | | 443.15 | | | | 0.55 | | | | 4.98 | | | | 3.38 | | | | 15.16 | | | | 2.74 | | | û | | |
| American West Potash KG-8 | | | 0.00 | | | | 0.00 | | | | 0.00 | | | | 0.00 | | | | 0.00 | | | | 0.00 | | | | 0.00 | | | û | | |
| American West Potash KG-9 | | | 497.17 | | | | 498.17 | | | | 1.00 | | | | 6.71 | | | | 0.19 | | | | 1.03 | | | | 6.71 | | | û | | |
| American West Potash KG-10 | | | 0.00 | | | | 0.00 | | | | 0.00 | | | | 0.00 | | | | 0.00 | | | | 0.00 | | | | 0.00 | | | û | | |
| American West Potash KG-12 | | | 0.00 | | | | 0.00 | | | | 0.00 | | | | 0.00 | | | | 0.00 | | | | 0.00 | | | | 0.00 | | | û | | |
| American West Potash KG-13 | | | 0.00 | | | | 0.00 | | | | 0.00 | | | | 0.00 | | | | 0.00 | | | | 0.00 | | | | 0.00 | | | û | | |
| American West Potash KG-14 | | | 0.00 | | | | 0.00 | | | | 0.00 | | | | 0.00 | | | | 0.00 | | | | 0.00 | | | | 0.00 | | | û | | |
Drill Hole Summary Table
| | | | | | | | | | | | | | | | | | | | | | | | | | | | | | | | | |
| | | | | | | | | | | | | | | | | | | | | | | | | | | | | | | Include in | |
| | | | | | | | | | | | | | | | | | | | | | | | | | | | | | | Resource | |
| | | | | | | | | | | | | | | | | | | | | | | | | | | | | | | Calculation | |
| Drill Hole | | From (m) | | | To (m) | | | Thickness (m) | | | %K2O | | | %Carnallite | | | %Insolubles | | | Grade x Thckness | | | (>12.191) | |
| KR-2 | |
| 01-17 | | | 381.76 | | | | 382.22 | | | | 0.46 | | | | 4.8 | | | | | | | | | | | | 2.21 | | | û | |
| 01-18 | | | 0.00 | | | | 0.00 | | | | 0.00 | | | | 0.0 | | | | | | | | | | | | 0.00 | | | û | |
| 01-22 | | | 0.00 | | | | 0.00 | | | | 0.00 | | | | 0.0 | | | | | | | | | | | | 0.00 | | | û | |
| 01-23 | | | 469.32 | | | | 472.29 | | | | 2.97 | | | | 8.7 | | | | | | | | | | | | 25.84 | | | ü | |
| 01-24 | | | 402.79 | | | | 406.76 | | | | 3.95 | | | | 14.6 | | | | | | | | | | | | 57.67 | | | û | |
| 01-25 | | | 421.39 | | | | 425.04 | | | | 3.65 | | | | 13.6 | | | | | | | | | | | | 49.64 | | | ü | |
| 01-26 | | | 384.51 | | | | 389.08 | | | | 4.56 | | | | 3.6 | | | | | | | | | | | | 16.42 | | | ü | |
| 01-27 | | | 0.00 | | | | 0.00 | | | | 0.00 | | | | 0.0 | | | | | | | | | | | | 0.00 | | | û | |
| 01-28 | | | 0.00 | | | | 0.00 | | | | 0.00 | | | | 0.0 | | | | | | | | | | | | 0.00 | | | û | |
| 01-29 | | | 431.51 | | | | 433.52 | | | | 2.00 | | | | 8.4 | | | | | | | | | | | | 16.80 | | | ü | |
| 01-30 | | | 445.16 | | | | 448.29 | | | | 3.12 | | | | 8.5 | | | | | | | | | | | | 26.52 | | | û | |
| 01-32 | | | 0.00 | | | | 0.00 | | | | 0.00 | | | | 0.0 | | | | | | | | | | | | 0.00 | | | û | |
| 01-35 | | | 0.00 | | | | 0.00 | | | | 0.00 | | | | 0.0 | | | | | | | | | | | | 0.00 | | | û | |
| 01-36 | | | 268.15 | | | | 270.74 | | | | 2.58 | | | | 4.8 | | | | | | | | | | | | 12.38 | | | ü | |
| 01-40 | | | 0.00 | | | | 0.00 | | | | 0.00 | | | | 0.0 | | | | | | | | | | | | 0.00 | | | û | |
| 01-41 | | | 0.00 | | | | 0.00 | | | | 0.00 | | | | 0.0 | | | | | | | | | | | | 0.00 | | | û | |
| 01-42 | | | 253.75 | | | | 254.97 | | | | 1.22 | | | | 12.6 | | | | | | | | | | | | 15.37 | | | ü | |
| 01-43 | | | 0.00 | | | | 0.00 | | | | 0.00 | | | | 0.0 | | | | | | | | | | | | 0.00 | | | û | |
| 01-44 | | | 417.58 | | | | 418.87 | | | | 1.29 | | | | 10.3 | | | | | | | | | | | | 13.29 | | | ü | |
| 01-45 | | | 326.52 | | | | 327.74 | | | | 1.22 | | | | 14.7 | | | | | | | | | | | | 17.93 | | | ü | |
| 01-46 | | | 458.50 | | | | 459.41 | | | | 0.91 | | | | 8.4 | | | | | | | | | | | | 7.64 | | | û | |
| 01-47 | | | 348.16 | | | | 350.98 | | | | 2.82 | | | | 5.5 | | | | | | | | | | | | 15.51 | | | ü | |
| 01-48 | | | 410.79 | | | | 412.78 | | | | 1.99 | | | | 21.2 | | | | | | | | | | | | 42.19 | | | ü | |
| 01-49 | | | 409.12 | | | | 410.34 | | | | 1.22 | | | | 6.9 | | | | | | | | | | | | 8.42 | | | û | |
| 01-50 | | | 346.56 | | | | 349.22 | | | | 2.66 | | | | 17.1 | | | | | | | | | | | | 45.49 | | | ü | |
| 01-51 | | | 368.05 | | | | 369.57 | | | | 1.52 | | | | 14.1 | | | | | | | | | | | | 21.43 | | | ü | |
| 01-52 | | | 0.00 | | | | 0.00 | | | | 0.00 | | | | 0.0 | | | | | | | | | | | | 0.00 | | | û | |
| 01-53 | | | 511.23 | | | | 512.75 | | | | 1.52 | | | | 13.0 | | | | | | | | | | | | 19.76 | | | ü | |
| 01-54 | | | 435.56 | | | | 438.38 | | | | 2.82 | | | | 5.4 | | | | | | | | | | | | 15.23 | | | ü | |
| 01-55 | | | 451.49 | | | | 453.54 | | | | 2.05 | | | | 15.2 | | | | | | | | | | | | 31.16 | | | ü | |
| 01-56 | | | 549.33 | | | | 551.31 | | | | 1.98 | | | | 6.4 | | | | | | | | | | | | 12.67 | | | ü | |
| 01-58 | | | 0.00 | | | | 0.00 | | | | 0.00 | | | | 0.0 | | | | | | | | | | | | 0.00 | | | û | |
| 01-60 | | | 0.00 | | | | 0.00 | | | | 0.00 | | | | 0.0 | | | | | | | | | | | | 0.00 | | | û | |
| 01-64 | | | 0.00 | | | | 0.00 | | | | 0.00 | | | | 0.0 | | | | | | | | | | | | 0.00 | | | û | |
| 01-65 | | | 0.00 | | | | 0.00 | | | | 0.00 | | | | 0.0 | | | | | | | | | | | | 0.00 | | | û | |
| 01-66 | | | 566.24 | | | | 567.39 | | | | 1.15 | | | | 4.8 | | | | | | | | | | | | 5.52 | | | û | |
| 01-67 | | | 0.00 | | | | 0.00 | | | | 0.00 | | | | 0.0 | | | | | | | | | | | | 0.00 | | | û | |
| 01-68 | | | 555.04 | | | | 556.57 | | | | 1.52 | | | | 11.2 | | | | | | | | | | | | 17.02 | | | ü | |
| 01-69 | | | 0.00 | | | | 0.00 | | | | 0.00 | | | | 0.0 | | | | | | | | | | | | 0.00 | | | û | |
| 01-70 | | | 591.46 | | | | 593.83 | | | | 1.98 | | | | 11.3 | | | | | | | | | | | | 22.37 | | | ü | |
| 01-71 | | | 0.00 | | | | 0.00 | | | | 0.00 | | | | 0.0 | | | | | | | | | | | | 0.00 | | | û | |
| 01-72 | | | 0.00 | | | | 0.00 | | | | 0.00 | | | | 0.0 | | | | | | | | | | | | 0.00 | | | û | |
| 01-73 | | | 0.00 | | | | 0.00 | | | | 0.00 | | | | 0.0 | | | | | | | | | | | | 0.00 | | | û | |
| 623 | | | 0.00 | | | | 0.00 | | | | 0.00 | | | | 0.0 | | | | | | | | | | | | 0.00 | | | û | |
| 624 | | | 508.33 | | | | 510.24 | | | | 1.91 | | | | 11.1 | | | | | | | | | | | | 21.20 | | | ü | |
| 626 | | | 598.25 | | | | 600.30 | | | | 2.05 | | | | 4.8 | | | | | | | | | | | | 9.84 | | | û | |
| 630 | | | 0.00 | | | | 0.00 | | | | 0.00 | | | | 0.0 | | | | | | | | | | | | 0.00 | | | û | |
| 631 | | | 0.00 | | | | 0.00 | | | | 0.00 | | | | 0.0 | | | | | | | | | | | | 0.00 | | | û | |
| 632 | | | 379.63 | | | | 380.92 | | | | 1.29 | | | | 13.2 | | | | | | | | | | | | 17.03 | | | ü | |
| 633 | | | 351.43 | | | | 353.26 | | | | 1.82 | | | | 5.2 | | | | | | | | | | | | 9.46 | | | û | |
| 634 | | | 372.24 | | | | 373.53 | | | | 1.29 | | | | 11.8 | | | | | | | | | | | | 15.22 | | | ü | |
| 636 | | | 433.88 | | | | 435.10 | | | | 1.22 | | | | 14.6 | | | | | | | | | | | | 17.81 | | | ü | |
| 641 | | | 454.61 | | | | 455.83 | | | | 1.22 | | | | 13.7 | | | | | | | | | | | | 16.71 | | | ü | |
| 642 | | | 477.90 | | | | 479.11 | | | | 1.21 | | | | 13.1 | | | | | | | | | | | | 15.85 | | | ü | |
| 645 | | | 0.00 | | | | 0.00 | | | | 0.00 | | | | 0.0 | | | | | | | | | | | | 0.00 | | | û | |
| 650 | | | 427.03 | | | | 428.85 | | | | 1.82 | | | | 3.8 | | | | | | | | | | | | 6.92 | | | û | |
| 652 | | | 413.54 | | | | 415.90 | | | | 2.36 | | | | 4.7 | | | | | | | | | | | | 11.09 | | | û | |
| 664 | | | 0.00 | | | | 0.00 | | | | 0.00 | | | | 0.0 | | | | | | | | | | | | 0.00 | | | û | |
| 665 | | | 421.84 | | | | 423.14 | | | | 1.30 | | | | 17.8 | | | | | | | | | | | | 23.14 | | | ü | |
| 673 | | | 358.29 | | | | 359.51 | | | | 1.22 | | | | 10.2 | | | | | | | | | | | | 12.44 | | | ü | |
| 675 | | | 554.13 | | | | 556.41 | | | | 2.28 | | | | 10.6 | | | | | | | | | | | | 24.17 | | | ü | |
| 679 | | | 411.86 | | | | 413.00 | | | | 1.14 | | | | 6.5 | | | | | | | | | | | | 7.41 | | | û | |
| 680 | | | 390.07 | | | | 392.43 | | | | 2.36 | | | | 12.1 | | | | | | | | | | | | 28.56 | | | ü | |
| 681 | | | 372.69 | | | | 375.67 | | | | 2.98 | | | | 11.8 | | | | | | | | | | | | 35.16 | | | ü | |
| 682 | | | 343.97 | | | | 346.71 | | | | 2.74 | | | | 15.5 | | | | | | | | | | | | 42.47 | | | ü | |
| American West Potash KG-1 | | | 385.63 | | | | 388.01 | | | | 2.38 | | | | 8.8 | | | | | | | | | | | | 20.94 | | | ü | |
| American West Potash KG-2 | | | 380.79 | | | | 382.83 | | | | 2.04 | | | | 9.86 | | | | 9.07 | | | | 3.96 | | | | 20.11 | | | ü | |
| American West Potash KG-3 | | | 389.43 | | | | 390.98 | | | | 1.55 | | | | 9.74 | | | | 1.40 | | | | 5.48 | | | | 15.10 | | | ü | |
| American West Potash KG-4 | | | 415.03 | | | | 416.97 | | | | 1.94 | | | | 9.56 | | | | 0.61 | | | | 0.70 | | | | 18.55 | | | ü | |
| American West Potash KG-5 | | | 435.31 | | | | 438.11 | | | | 2.80 | | | | 10.28 | | | | 0.56 | | | | 2.97 | | | | 28.78 | | | ü | |
| American West Potash KG-6 | | | 445.30 | | | | 446.52 | | | | 1.22 | | | | 11.48 | | | | 0.70 | | | | 4.94 | | | | 14.01 | | | ü | |
| American West Potash KG-8 | | | 435.59 | | | | 437.36 | | | | 1.77 | | | | 7.80 | | | | | | | | | | | | 13.81 | | | ü | |
| American West Potash KG-9 | | | 499.41 | | | | 501.60 | | | | 2.19 | | | | 11.16 | | | | 0.45 | | | | 2.83 | | | | 24.44 | | | ü | |
| American West Potash KG-10 | | | 0.00 | | | | 0.00 | | | | 0.00 | | | | 0.00 | | | | 0.00 | | | | 0.00 | | | | 0.00 | | | û | |
| American West Potash KG-12 | | | 541.64 | | | | 543.80 | | | | 2.16 | | | | 8.64 | | | | 0.61 | | | | 3.31 | | | | 18.66 | | | ü | |
| American West Potash KG-13 | | | 538.22 | | | | 538.90 | | | | 0.68 | | | | 11.34 | | | | 0.00 | | | | 0.09 | | | | 7.71 | | | û | |
| American West Potash KG-14 | | | 0.00 | | | | 0.00 | | | | 0.00 | | | | 0.00 | | | | 0.00 | | | | 0.00 | | | | 0.00 | | | û | |
| | | | | | | | | | | | | | | | | | | | | | | | | |
| | | | | | | | | | | | | | | | | | | | | | | | | | | Total KR-1 | | | 16 | |
| | | | | | | | | | | | | | | | | | | | | | | | | | | Total KR-2 | | | 39 | |
| | | | | | | | | | | | | | | | | | | | | | | | | | | | | | | |
| | | | | | | | | | | | | | | | | | | | | | | | | | | Total DH’s | | | 55 | |