united states
securities and exchange commission
washington, d.c. 20549
form N-CSR
certified shareholder report of registered management
investment companies
Investment Company Act file number 811-22356
Archer Investment Series Trust
(Exact name of registrant as specified in charter)
c/o Archer Investment Corporation
11711 N. College Ave., #200, Carmel, IN 46032
(Address of principal executive offices) (Zip code)
c/o Archer Investment Corporation
11711 N. College Ave., #200, Carmel, IN 46032
(Name and address of agent for service)
With copies to:
C. Richard Ropka, Esq.
Law Office of C. Richard Ropka
215 Fries Mill Road
Turnersville, NJ 08012
Registrant's telephone number, including area code: (800) 238-7701
Date of fiscal year end: August 31
Date of reporting period: August 31, 2024
Form N-CSR is to be used by management investment companies to file reports with the Commission not later than 10 days after the transmission to stockholders of any report that is required to be transmitted to stockholders under Rule 30e-1 under the Investment Company Act of 1940 (17 CFR 270.30e-1). The Commission may use the information provided on Form N-CSR in its regulatory, disclosure review, inspection and policymaking roles.
A registrant is required to disclose the information specified by Form N-CSR, and the Commission will make this information public. A registrant is not required to respond to the collection of information contained in Form N-CSR unless the Form displays a currently valid Office of Management and Budget ("OMB") control number. Please direct comments concerning the accuracy of the information collection burden estimate and any suggestions for reducing the burden to Secretary, Securities and Exchange Commission, 450 Fifth Street, NW, Washington, DC 20549-0609. The OMB has reviewed this collection of information under the clearance requirements of 44 U.S.C. § 3507.
Item 1. Reports to Stockholders.

ANNUAL SHAREHOLDER REPORT
August 31, 2024
ARCHER BALANCED FUND
ARCHX
ADDITIONAL INFORMATION
This annual shareholder report contains important information about the Archer Balanced Fund – ARCHX (the “Fund”) for the period September 1, 2023 to August 31, 2024.
You can find additional information about the Fund at www.thearcherfunds.com. You can also request this information by contacting us at 1-800-238-7701.
expense Information
What were the Fund costs for the past year?
(based on a hypothetical $10,000 investment)
| Fund Name | Costs of a $10,000 investment | Costs paid as a percentage of a $10,000 investment* |
| | | |
| Archer Balanced Fund | $130 | 1.20% |
*Annualized
managment’s discussion of fund performance
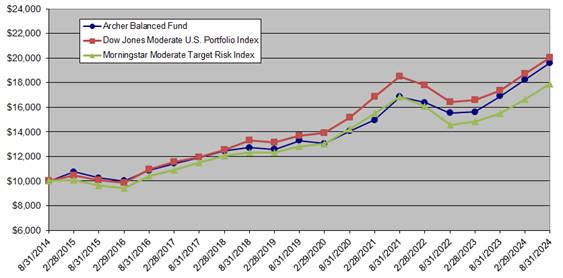
The Archer Balanced fund had a total return of 16.03% for the Year ended August 31, 2024 and an average annual return of 6.97% over the trailing ten years compared to a total return of 15.24% and 7.18% for the Dow Jones Moderate U.S. Portfolio Index, and 15.55% and 5.99% for the Morningstar Moderate Target Risk Index over the same periods.
The Fund maintained a balance of approximately 70% equities and 30% fixed income throughout most of the year. As rising valuations increased the equity weighting of the Fund, the managers selectively rebalanced the portfolio by reducing some equity positions and reallocating to capture improved yields on fixed income and money market holdings. The Fund's investment style has remained consistent within both equities and fixed income by maintaining a tilt towards large-cap value in equities and short- to intermediate-term investment grade companies in fixed income.
Equity Portfolio
We continue to focus on companies with sound balance sheets, steady revenue sources, strong cash flow, and reasonable valuations. Companies who can weather economic uncertainty by generating their own liquidity and maintain reasonable balance sheets have been rewarded as monetary policy has abruptly changed. Sectors historically favored by income investors such as Utilities, Financials, and REITs were pressured as yields rose dramatically in the bond markets throughout much of 2023. Our patience was rewarded late in the year and throughout much of 2024 as rates softened and the market began to recognize the value present in several of these beaten down sectors and companies. The fund maintains significant weighting in certain segments of the Financial, Industrial, Healthcare, and Technology sectors.
Fixed-Income Portfolio
Although the overall portfolio duration remains low, the managers have opportunistically added high quality, longer duration holdings to the portfolio. The managers believe that the risk added to the portfolio by dramatically lengthening portfolio duration and/or reducing credit quality does not offer material compensation at present. A more active Federal Reserve has added to volatility in the fixed income markets and many companies have weakened their balance sheets by issuing debt over the past several years to fund more stockholder friendly actions. We have maintained a more defensive posture by overweighting short- to intermediate-term maturities and keeping a close eye on the credit quality of issuers.
Performance graph
AVERAGE ANNUAL RETURNS
| | 1 Year | 5 Years | 10 Years | Ending Value |
| Archer Balanced Fund | 16.03% | 8.10% | 6.97% | $19,610 |
| Dow Jones Moderate U.S. Portfolio Index | 15.24% | 7.85% | 7.18% | $20,012 |
| Morningstar Moderate Target Risk Index | 15.55% | 6.94% | 5.99% | $17,895 |
Cumulative Performance Comparison of $10,000 Investment
Past performance is not a good predictor of future performance. The returns shown do not reflect taxes that a shareholder would pay on Fund distributions or on the redemption of Fund shares. Updated performance data current to the most recent month-end can be obtained by calling 1-800-238-7701.
Fund statistics
| | | | ADVISORY FEES |
| NET ASSETS: | PORTFOLIO HOLDINGS: | PORTFOLIO TURNOVER: | PAID BY FUND: |
| $50,724,730 | 92 | 11.69% | $186,230 |
INVESTMENT TYPE WEIGHTINGS
The following chart gives a visual breakdown of the Fund by the investment type. The underlying securities represent a percentage of the portfolio of investments.

| Archer Balanced Pie Chart | |
| Common Stocks | 66.80% |
| Corporate Bonds | 15.74% |
| Municipal Bonds | 3.98% |
| Real Estate Investment Trusts | 4.18% |
| Preferred Securities | 1.01% |
| Structured Notes | 0.35% |
| U.S. Govt. Agencies & Obligs. | 1.48% |
| Money Market Fund | 6.46% |
top ten holdings (% OF NET ASSETS)
| 1. | Federated Treasury Obligation Fund - Institutional Shares | 6.44% |
| 2. | Meta Platforms, Inc. Class A | 3.88% |
| 3. | WalMart, Inc. | 3.65% |
| 4. | Broadcom, Inc. | 3.34% |
| 5. | Microsoft Corp. | 3.04% |
| 6. | MasterCard, Inc. Class A | 3.00% |
| 7. | JPMorgan Chase & Co. | 2.91% |
| 8. | Lockheed Martin Corp. | 2.86% |
| 9. | Quanta Services, Inc. | 2.85% |
| 10. | NextEra Energy, Inc. | 2.84% |
| | Total % of Net Assets | 34.81% |
How has the fund changed
The Fund has not had any material changes during the year ended August 31, 2024.
Householding
To reduce Fund expenses, only one copy of most shareholder documents may be mailed to shareholders with multiple accounts at the same address (Householding). If you would prefer that your Archer Balanced Fund documents not be householded, please contact Archer Funds at 1-800-238-7701, or contact your financial intermediary. Your instructions will typically be effective within 30 days of receipt by Archer Funds or your financial intermediary.
For additional information about the Fund; including its prospectus, financial information, holdings and proxy information, visit www.thearcherfunds.com or contact us at 1-800-238-7701.
| Archer Balanced Line Graph | |
| | Balanced Fund | Dow Jones Moderate | Morningstar Moderate |
| 08/31/14 | 10,000 | 10,000 | 10,000 |
| 02/28/15 | 10,735 | 10,451 | 10,066 |
| 08/31/15 | 10,250 | 10,090 | 9,634 |
| 02/29/16 | 10,018 | 9,877 | 9,415 |
| 08/31/16 | 10,867 | 10,928 | 10,427 |
| 02/28/17 | 11,433 | 11,532 | 10,892 |
| 08/31/17 | 11,920 | 11,921 | 11,479 |
| 02/28/18 | 12,448 | 12,545 | 12,019 |
| 08/31/18 | 12,724 | 13,309 | 12,325 |
| 02/28/19 | 12,588 | 13,131 | 12,313 |
| 08/31/19 | 13,287 | 13,712 | 12,790 |
| 02/29/20 | 13,056 | 13,895 | 13,017 |
| 08/31/20 | 14,057 | 15,150 | 14,223 |
| 02/28/21 | 14,972 | 16,857 | 15,499 |
| 08/31/21 | 16,843 | 18,521 | 16,862 |
| 02/28/22 | 16,368 | 17,797 | 16,086 |
| 08/31/22 | 15,546 | 16,439 | 14,545 |
| 02/28/23 | 15,622 | 16,595 | 14,831 |
| 08/31/23 | 16,902 | 17,366 | 15,487 |
| 02/29/24 | 18,239 | 18,731 | 16,627 |
| 08/31/24 | 19,610 | 20,012 | 17,895 |

ANNUAL SHAREHOLDER REPORT
August 31, 2024
ARCHER INCOME FUND
ARINX
ADDITIONAL INFORMATION
This annual shareholder report contains important information about the Archer Income Fund - ARINX (the “Fund”) for the period September 1, 2023 to August 31, 2024.
You can find additional information about the Fund at www.thearcherfunds.com. You can also request this information by contacting us at 1-800-238-7701.
expense Information
What were the Fund costs for the past year?
(based on a hypothetical $10,000 investment)
| Fund Name | Costs of a $10,000 investment | Costs paid as a percentage of a $10,000 investment* |
| | | |
| Archer Income Fund | $99 | 0.96% |
*Annualized
managment’s discussion of fund performance
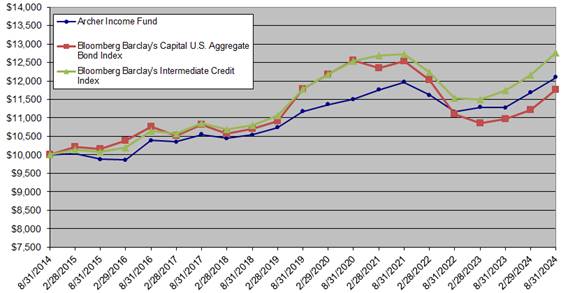
The Archer Income Fund returned 7.25% for the year ended August 31, 2024 and an average annual return of 1.92% over the trailing 10 years compared to 7.30% and 1.64% for the Bloomberg Barclay’s Capital US Aggregate Bond Index and 8.63% and 2.46% for the Bloomberg Barclay’s Intermediate Credit Index over the same time periods.
The Fund opened in March of 2011 and has turned in positive returns during what we would characterize as a volatile market for bond investors since the date of inception. The bond market continues to present investors with many challenges. As inflation concerns built in 2019, the Federal Reserve leaned towards more restrictive monetary policy, only to have to pivot to a more accommodative stance as trade related fears crept into the market. This accommodative trend accelerated dramatically as the pandemic took hold and policy makers were forced to provide fiscal stimulus while the Federal Reserve expanded its balance sheet significantly and promised to keep rates at, or near, zero percent for the foreseeable future. As it became clear that inflation created by the overwhelming accommodation of the pandemic era was not “transitory”, the Fed was forced to do another about face and begin their most aggressive tightening campaign in decades. The result was a sharp repricing of bonds across the curve with yields rising sharply and longer-term bond prices dropping significantly. More recently, the Fed reduced the benchmark Federal Funds Rate by half a percentage point and has telegraphed to the market that further measured reductions to their policy rate may be forthcoming. While broad measures of inflation have moderated, some pockets of sticky inflation remain. A more accommodative Federal Reserve, against the backdrop of continued economic growth and a growing deficit, has raised concerns about the potential for reigniting inflation and has kept a floor under longer-term interest rates.
The managers believe it is prudent to continue to position the portfolio to protect against interest-rate, default and currency risks. Our approach has allowed us to take advantage of opportunities presented when others have been forced to sell at attractive discounts, while maintaining liquidity and an effective duration much lower than that of our benchmark indices.
PERFORMANCE GRAPH
AVERAGE ANNUAL RETURNS
| | 1 Year | 5 Years | 10 Years | Ending Value |
| Archer Income Fund | 7.25% | 1.59% | 1.92% | $12,096 |
| Bloomberg Barclay's Capital U.S. Aggregate Bond Index | 7.30% | -0.04% | 1.64% | $11,765 |
| Bloomberg Barclay's Intermediate Credit Index | 8.63% | 1.58% | 2.46% | $12,758 |
Cumulative Performance Comparison of $10,000 Investment
Past performance is not a good predictor of future performance. The returns shown do not reflect taxes that a shareholder would pay on Fund distributions or on the redemption of Fund shares. Updated performance data current to the most recent month-end can be obtained by calling 1-800-238-7701.
Fund statistics
| | | | ADVISORY FEES |
| NET ASSETS: | PORTFOLIO HOLDINGS: | PORTFOLIO TURNOVER: | PAID BY FUND: |
| $19,625,873 | 106 | 23.30% | ($17,564) |
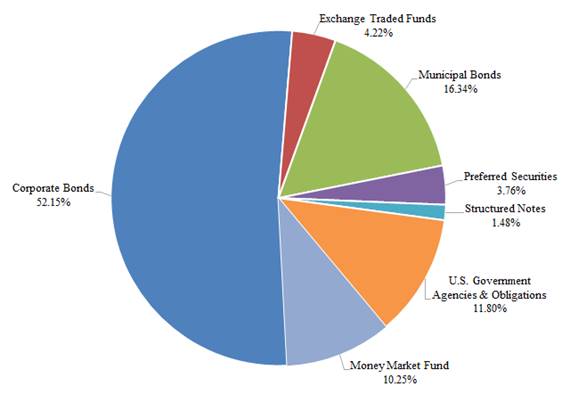
INVESTMENT TYPE WEIGHTINGS
The following chart gives a visual breakdown of the Fund by investment type. The underlying securities represent a percentage of the portfolio of investments.
| Archer income Pie Chart | |
| Corporate Bonds | 52.15% |
| Exchange Traded Funds | 4.22% |
| Municipal Bonds | 16.34% |
| Preferred Securities | 3.76% |
| Structured Notes | 1.48% |
| U.S. Govt. Agencies & Obligs. | 11.80% |
| Money Market Fund | 10.25% |
top ten holdings (% OF NET ASSETS)
| 1. | Federated Treasury Obligation Fund - Institutional Shares | 10.16% |
| 2. | U.S. Government Treasury Note/Bond, 3.875%, due 8/15/33 | 3.81% |
| 3. | Federal Home Loan Bank, 5.555%, due 2/15/33 | 2.81% |
| 4. | U.S. Government Treasury Note/Bond, 4.625%, due 2/28/25 | 2.80% |
| 5. | iShares 10+ Year Investment Grade Corporate Bond ETF | 2.67% |
| 6. | State Street Corp., 7.350%, due 6/15/26 | 2.66% |
| 7. | U.S. Government Treasury Bill, 0.000%, due 9/03/24 | 2.55% |
| 8. | Federal Farm Credit Bank, 5.570%, due 8/26/33 | 2.55% |
| 9. | U.S. Government Treasury Note/Bond, 3.875%, due 3/31/25 | 2.54% |
| 10. | Masco Corp., 7.750%, due 8/01/29 | 2.30% |
| | Total % of Net Assets | 34.85% |
How has the fund changed
The Fund has not had any material changes during the year ended August 31, 2024.
Householding
To reduce Fund expenses, only one copy of most shareholder documents may be mailed to shareholders with multiple accounts at the same address (Householding). If you would prefer that your Archer Income Fund documents not be householded, please contact Archer Funds at 1-800-238-7701, or contact your financial intermediary. Your instructions will typically be effective within 30 days of receipt by Archer Funds or your financial intermediary.
For additional information about the Fund; including its prospectus, financial information, holdings and proxy information, visit www.thearcherfunds.com or contact us at 1-800-238-7701.
| Archer Income Line Graph | |
| | Income Fund | BBG Barclays Capital Agg. | BBG Barclays Intermediate Credit |
| 08/31/14 | 10,000 | 10000 | 10000 |
| 02/28/15 | 10,042 | 10225 | 10135 |
| 08/31/15 | 9,884 | 10155 | 10081 |
| 02/29/16 | 9,859 | 10379 | 10204 |
| 08/31/16 | 10,392 | 10761 | 10657 |
| 02/28/17 | 10,349 | 10526 | 10578 |
| 08/31/17 | 10,552 | 10814 | 10862 |
| 02/28/18 | 10,448 | 10579 | 10686 |
| 08/31/18 | 10,546 | 10701 | 10792 |
| 02/28/19 | 10,742 | 10914 | 11058 |
| 08/31/19 | 11,179 | 11789 | 11793 |
| 02/29/20 | 11,361 | 12189 | 12174 |
| 08/31/20 | 11,507 | 12553 | 12546 |
| 02/28/21 | 11,763 | 12358 | 12698 |
| 08/31/21 | 11,964 | 12542 | 12728 |
| 02/28/22 | 11,619 | 12031 | 12239 |
| 08/31/22 | 11,167 | 11098 | 11536 |
| 02/28/23 | 11,292 | 10862 | 11493 |
| 08/31/23 | 11,278 | 10965 | 11745 |
| 02/29/24 | 11,686 | 11223 | 12154 |
| 08/31/24 | 12,096 | 11765 | 12758 |

ANNUAL SHAREHOLDER REPORT
August 31, 2024
ARCHER STOCK FUND
ARSKX
ADDITIONAL INFORMATION
This annual shareholder report contains important information about the Archer Stock Fund - ARSKX (the “Fund”) for the period September 1, 2023 to August 31, 2024.
You can find additional information about the Fund at www.thearcherfunds.com. You can also request this information by contacting us at 1-800-238-7701.
expense Information
What were the Fund costs for the past year?
(based on a hypothetical $10,000 investment)
| Fund Name | Costs of a $10,000 investment | Costs paid as a percentage of a $10,000 investment* |
| | | |
| Archer Stock Fund | $139 | 1.23% |
*Annualized
managment’s discussion of fund performance
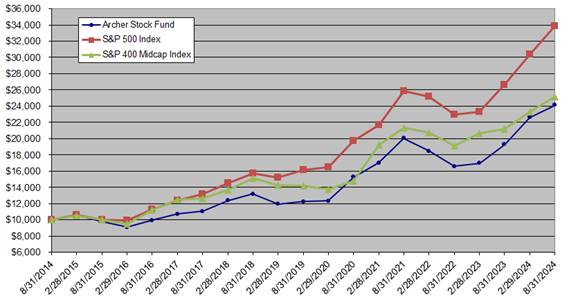
The Archer Stock Fund posted a return of 25.24% for the year ended August 31, 202 and an average annual return of 9.22% over the trailing 10 years. This compares to a return of 27.14% and 12.96% for the S&P 500 Index, and 18.72% and 9.65% for the S&P Midcap 400 Index over the same periods.
The Archer Stock Fund seeks to maximize capital appreciation by investing in the most attractive equity investment opportunities regardless of company size, sector, industry, or country domicile. Although managers closely monitor macro-economic conditions, positions in the fund are normally selected on their own merits using company fundamentals and valuation as a guide. There will be times when this method of selecting securities may lead to the relative over- or underweighting of sectors. The fund currently maintains relatively large weightings in healthcare, and technology companies. As of August 31, 2024, the Fund held 40 equity positions and a roughly 4% cash position. Although there may be times when the Fund holds greater or fewer positions, the managers will strive to limit the holdings of the Fund to 50 holdings. This results in a concentrated portfolio which can lead to periods of relative underperformance but will reduce turnover of the portfolio to create long-term shareholder value. We continue to seek out companies with strong balance sheets and the opportunity to improve sales and earnings over the long term.
Performance graph
AVERAGE ANNUAL RETURNS
| | 1 Year | 5 Years | 10 Years | Ending Value |
| Archer Stock Fund | 25.24% | 14.58% | 9.22% | $24,159 |
| S&P 500 Index | 27.14% | 15.90% | 12.96% | $33,875 |
| S&P 400 Midcap Index | 18.72% | 12.15% | 9.65% | $25,142 |
Cumulative Performance Comparison of $10,000 Investment
Past performance is not a good predictor of future performance. The returns shown do not reflect taxes that a shareholder would pay on Fund distributions or on the redemption of Fund shares. Updated performance data current to the most recent month-end can be obtained by calling 1-800-238-7701.
Fund statistics
| | | | ADVISORY FEES |
| NET ASSETS: | PORTFOLIO HOLDINGS: | PORTFOLIO TURNOVER: | PAID BY FUND: |
| $25,227,166 | 41 | 8.56% | $77,664 |
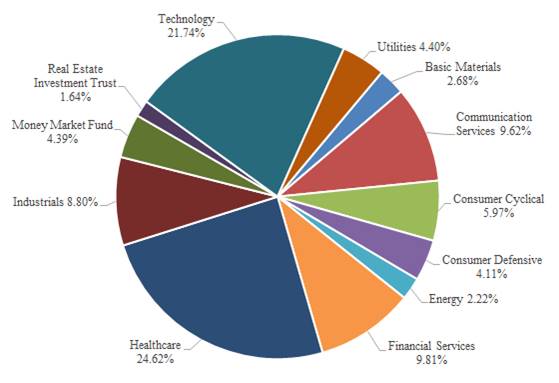
SECTOR WEIGHTINGS
The following chart gives a visual breakdown of the Fund by the sectors the underlying securities represent as a percentage of the portfolio of investments.
top ten holding (% OF NET ASSETS)
| 1. | NVIDIA Corp. | 4.64% |
| 2. | Federated Treasury Obligation Fund - Institutional Shares | 4.38% |
| 3. | Meta Platforms, Inc. Class A | 4.36% |
| 4. | NextEra Energy, Inc. | 3.59% |
| 5. | Alphabet, Inc. Class A | 3.59% |
| 6. | Microsoft Corp. | 3.44% |
| 7. | Apple, Inc. | 3.37% |
| 8. | Thermo Fisher Scientific, Inc. | 2.95% |
| 9. | JPMorgan Chase & Co. | 2.94% |
| 10. | United Rentals, Inc. | 2.88% |
| | Total % of Net Assets | 36.14% |
How has the fund changed
The Fund has not had any material changes during the year ended August 31, 2024.
Householding
To reduce Fund expenses, only one copy of most shareholder documents may be mailed to shareholders with multiple accounts at the same address (Householding). If you would prefer that your Archer Stock Fund documents not be householded, please contact Archer Funds at 1-800-238-7701, or contact your financial intermediary. Your instructions will typically be effective within 30 days of receipt by Archer Funds or your financial intermediary.
For additional information about the Fund; including its prospectus, financial information, holdings and proxy information, visit www.thearcherfunds.com or contact us at 1-800-238-7701.
| Stock Fund Pie Chart | |
| | |
| Basic Materials | 2.68% |
| Communication Services | 9.62% |
| Consumer Cyclical | 5.97% |
| Consumer Defensive | 4.11% |
| Energy | 2.22% |
| Financial Services | 9.81% |
| Healthcare | 24.62% |
| Industrials | 8.80% |
| Money Market Fund | 4.39% |
| Real Estate Investment Trust | 1.64% |
| Technology | 21.74% |
| Utilities | 4.40% |
| Archer Stock Fund Line Graph | |
| | Stock Fund | S&P 500 | S&P 400 Midcap |
| 08/31/14 | 10000 | 10000 | 10000 |
| 02/28/25 | 10552 | 10612 | 10550 |
| 08/31/15 | 9803 | 10048 | 10000 |
| 02/29/16 | 9087 | 9955 | 9496 |
| 08/31/16 | 9931 | 11309 | 11230 |
| 02/28/17 | 10732 | 12440 | 12506 |
| 08/31/17 | 11067 | 13142 | 12618 |
| 02/28/18 | 12363 | 14566 | 13695 |
| 08/31/18 | 13176 | 15726 | 15138 |
| 02/28/19 | 11957 | 15248 | 14260 |
| 08/31/19 | 12235 | 16186 | 14162 |
| 02/29/20 | 12347 | 16497 | 13773 |
| 08/31/20 | 15292 | 19736 | 14758 |
| 02/28/21 | 17027 | 21659 | 19250 |
| 08/31/21 | 20028 | 25887 | 21362 |
| 02/28/22 | 18481 | 25209 | 20781 |
| 08/31/22 | 16606 | 22981 | 19138 |
| 02/28/23 | 16967 | 23270 | 20640 |
| 08/31/23 | 19291 | 26645 | 21177 |
| 02/29/24 | 22620 | 30356 | 23326 |
| 08/31/24 | 24159 | 33875 | 25142 |
ANNUAL SHAREHOLDER REPORT
August 31, 2024
ARCHER DIVIDEND GROWTH FUND
ARDGX
ADDITIONAL INFORMATION
This annual shareholder report contains important information about the Archer Dividend Growth Fund - ARDGX (the “Fund”) for the period September 1, 2023 to August 31, 2024.
You can find additional information about the Fund at www.thearcherfunds.com. You can also request this information by contacting us at 1-800-238-7701.
expense Information
What were the Fund costs for the past year?
(based on a hypothetical $10,000 investment)
| Fund Name | Costs of a $10,000 investment | Costs paid as a percentage of a $10,000 investment* |
| | | |
| Archer Dividend Growth Fund | $108 | 0.98% |
*Annualized
managment’s discussion of fund performance
The Archer Dividend Growth Fund returned 19.39% for the year ended August 31, 2024 and 6.67% from the date of inception on September 1, 2016 compared to a return of 20.57% and 10.04% for the Dow Jones US Large-Cap Value Total Stock Market Index and 18.55% and 5.95% for the Morningstar Dividend Yield Focus Index over the same periods.
Performance Review
The Archer Dividend Growth Fund invests primarily in large and medium sized companies which we believe will provide long-term dividend payment growth for shareholders. Holdings are weighted towards companies with strong balance sheets and consistently increasing payouts to shareholders selling at an attractive discount to our estimate of fair value. This relatively deep value strategy has underperformed the broader market in recent years as the performance of many popular indices has been driven by an increasingly small number of high growth companies. The performance differential widened significantly during post-COVID rally as high growth technology and biotechnology companies attracted investor dollars away from the more stable, dividend paying, value segments of the market. Recently, the spread has begun to narrow as investors have recognized the value of stable cash flows and predictable business models. Anticipation of easier monetary policy and declining interest rates has also provided a tailwind to traditional dividend paying sectors including Utilities and REITs. Concerns surrounding the banking system early in 2023 and the sharp rise in bond market yields led to relative underperformance in 2022 and early 2023, particularly when compared to funds focusing on factors other than dividend payments.
Ultimately, we are confident in our portfolio of companies and believe value will be recognized in our holdings and offer attractive appreciation in addition to the growing dividend income stream. We believe the Archer Dividend Growth Fund offers an attractive alternative to investors seeking monthly income who are concerned about inflation and the erosion of real income.
Performance graph
AVERAGE ANNUAL RETURNS
| | 1 Year | 5 Years | Since Inception* | Ending Value |
| Archer Dividend Growth Fund | 19.39% | 7.75% | 6.76% | $16,871 |
| Dow Jones US Large-Cap Value Total Stock Market Index | 20.57% | 10.55% | 10.04% | $21,481 |
| Morningstar Dividend Yield Focus Index | 18.55% | 7.03% | 5.95% | $15,877 |
Cumulative Performance Comparison of $10,000 Investment

* Inception September 1, 2016.
Past performance is not a good predictor of future performance. The returns shown do not reflect taxes that a shareholder would pay on Fund distributions or on the redemption of Fund shares. Updated performance data current to the most recent month-end can be obtained by calling 1-800-238-7701.
Fund statistics
| | | | ADVISORY FEES |
| NET ASSETS: | PORTFOLIO HOLDINGS: | PORTFOLIO TURNOVER: | PAID BY FUND: |
| $23,518,489 | 41 | 14.03% | $12,187 |
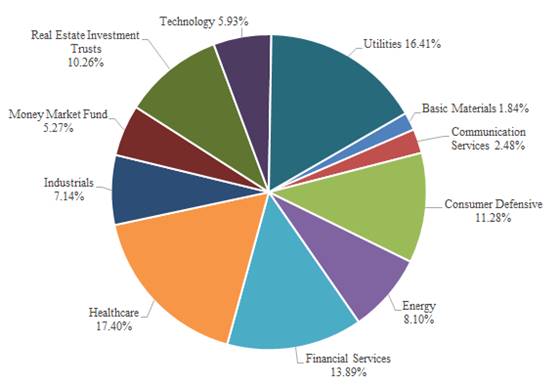
SECTOR WEIGHTINGS
The following chart gives a visual breakdown of the Fund by the sectors the underlying securities represent as a percentage of the portfolio of investments.
top ten holdings (% OF NET ASSETS)
| 1. | Federated Treasury Obligation Fund - Institutional Shares | 5.24% |
| 2. | AbbVie, Inc. | 3.83% |
| 3. | Iron Mountain, Inc. | 3.76% |
| 4. | Broadcom, Inc. | 3.32% |
| 5. | Merck & Co., Inc. | 3.23% |
| 6. | Regions Financial Corp. | 3.15% |
| 7. | Lockheed Martin Corp. | 3.08% |
| 8. | Manulife Financial Corp. | 3.02% |
| 9. | JPMorgan Chase & Co. | 3.01% |
| 10. | Coca-Cola FEMSA S.A.B. de C.V. ADR Series L | 2.81% |
| | Total % of Net Assets | 34.45% |
How has the fund changed
The Fund has not had any material changes during the year ended August 31, 2024.
Householding
To reduce Fund expenses, only one copy of most shareholder documents may be mailed to shareholders with multiple accounts at the same address (Householding). If you would prefer that your Archer Dividend Growth Fund documents not be householded, please contact Archer Funds at 1-800-238-7701, or contact your financial intermediary. Your instructions will typically be effective within 30 days of receipt by Archer Funds or your financial intermediary.
For additional information about the Fund; including its prospectus, financial information, holdings and proxy information, visit www.thearcherfunds.com or contact us at 1-800-238-7701.
| Dividend Growth Pie Chart | |
| | |
| Basic Materials | 1.84% |
| Communication Services | 2.48% |
| Consumer Defensive | 11.28% |
| Energy | 8.10% |
| Financial Services | 13.89% |
| Healthcare | 17.40% |
| Industrials | 7.14% |
| Money Market Fund | 5.27% |
| Real Estate Investment Trusts | 10.26% |
| Technology | 5.93% |
| Utilities | 16.41% |
| Archer Dividend Growth Fund Line Graph |
| | | Dow Jones US Large | Morningstar Div |
| | Div Growth Fund | Cap Val Total Stock | Yield Focus |
| 9/1/2016 | 10000 | 10000 | 10000 |
| 2/28/2017 | 10653 | 11059 | 10330 |
| 8/31/2017 | 10404 | 11302 | 10254 |
| 2/28/2018 | 11014 | 12281 | 10498 |
| 8/31/2018 | 11891 | 12909 | 10907 |
| 2/28/2019 | 11641 | 12710 | 11245 |
| 8/31/2019 | 11617 | 13004 | 11297 |
| 2/29/2020 | 11169 | 12715 | 10303 |
| 8/31/2020 | 10703 | 13167 | 10324 |
| 2/28/2021 | 11760 | 15421 | 10908 |
| 8/31/2021 | 13867 | 17770 | 11906 |
| 2/28/2022 | 14270 | 17757 | 12820 |
| 8/31/2022 | 14215 | 16563 | 12653 |
| 2/28/2023 | 14440 | 17293 | 12881 |
| 8/31/2023 | 14131 | 17816 | 13393 |
| 2/29/2024 | 15082 | 19483 | 13961 |
| 8/31/2024 | 16871 | 21481 | 15877 |

ANNUAL SHAREHOLDER REPORT
August 31, 2024
ARCHER FOCUS FUND
AFOCX
ADDITIONAL INFORMATION
This annual shareholder report contains important information about the Archer Focus Fund - AFOCX (the “Fund”) for the period September 1, 2023 to August 31, 2024.
You can find additional information about the Fund at www.thearcherfunds.com. You can also request this information by contacting us at 1-800-238-7701.
expense Information
What were the Fund costs for the past year?
(based on a hypothetical $10,000 investment)
| Fund Name | Costs of a $10,000 investment | Costs paid as a percentage of a $10,000 investment* |
| | | |
| Archer Focus Fund | $110 | 0.98% |
*Annualized
managment’s discussion of fund performance
The Archer Focus Fund returned 25.42% for the year ended August 31, 2024 and 10.97% from the date of inception on December 31, 2019 compared to a return of 22.06% and 10.72% for the Dow Jones Industrial Average Index over the same time periods.
Performance Review
The Archer Focus Fund seeks long-term growth of capital by investing in financially sound, large and medium-sized companies with dominant franchises. Under normal conditions, the Fund holds a relatively concentrated portfolio of 50 or fewer US common stocks. Potential investments are carefully screened for balance sheet strength, sustainable earnings and free cash flow, and durable market position. The Focus Fund maintained a relatively concentrated portfolio during the year and had 41 equity holdings as of August 31, 2024 with Communication Services, Healthcare, Technology, and Consumer Cyclical making up the largest sector weightings, while Basic Materials, Financials, and Energy were the smallest portfolio weightings. We remain confident in our holdings’ ability to weather shifting macroeconomic challenges as we focus on owning relatively large, financially stable companies with long-term earnings power.
Performance graph
AVERAGE ANNUAL RETURNS
| | 1 Year | Since Inception* | Ending Value |
| Archer Focus Fund | 25.42% | 10.97% | $16,264 |
| Dow Jones Industrial Average Index | 22.06% | 10.72% | $16,090 |
| S&P 500 Index | 27.14% | 14.59% | $18,893 |
Cumulative Performance Comparison of $10,000 Investment

* Inception December 30, 2019.
Past performance is not a good predictor of future performance. The returns shown do not reflect taxes that a shareholder would pay on Fund distributions or on the redemption of Fund shares. Updated performance data current to the most recent month-end can be obtained by calling 1-800-238-7701.
Fund statistics
| | | | ADVISORY FEES |
| NET ASSETS: | PORTFOLIO HOLDINGS: | PORTFOLIO TURNOVER: | PAID BY FUND: |
| $11,154,871 | 42 | 89.11% | ($17,284) |
SECTOR WEIGHTINGS
The following chart gives a visual breakdown of the Fund by the sectors the underlying securities represent as a percentage of the portfolio of investments.

top ten holdings (% OF NET ASSETS)
| 1. | Meta Platforms, Inc. Class A | 4.04% |
| 2. | Costco Wholesale Corp. | 3.80% |
| 3. | NVDIA Corp. | 3.42% |
| 4. | AvalonBay Communities, Inc. | 3.40% |
| 5. | Alphabet, Inc. Class A | 3.18% |
| 6. | PulteGroup, Inc. | 2.79% |
| 7. | Best Buy Co., Inc. | 2.74% |
| 8. | Atmos Energy Corp. | 2.72% |
| 9. | United Therapeutics Corp. | 2.57% |
| 10. | EMCOR Group, Inc. | 2.53% |
| | Total % of Net Assets | 31.19% |
How has the fund changed
The Fund has not had any material changes during the year ended August 31, 2024.
Householding
To reduce Fund expenses, only one copy of most shareholder documents may be mailed to shareholders with multiple accounts at the same address (Householding). If you would prefer that your Archer Focus Fund documents not be householded, please contact Archer Funds at 1-800-238-7701, or contact your financial intermediary. Your instructions will typically be effective within 30 days of receipt by Archer Funds or your financial intermediary.
For additional information about the Fund; including its prospectus, financial information, holdings and proxy information, visit www.thearcherfunds.com or contact us at 1-800-238-7701.
| Archer Focus Pie Chart | |
| | |
| Basic Materials | 4.99% |
| Communication Services | 12.88% |
| Consumer Cyclical | 10.47% |
| Consumer Defensive | 7.61% |
| Energy | 6.83% |
| Financial Services | 6.39% |
| Healthcare | 12.12% |
| Industrials | 10.05% |
| Money Market Fund | 1.39% |
| Real Estate Investment Trusts | 7.94% |
| Technology | 11.91% |
| Utilities | 7.42% |
| Archer Focus Fund Line Graph | |
| | | Dow Jones Industrial | |
| | Archer Focus | Average Index | S&P 500 Index |
| 12/30/2019 | 10000 | 10000 | 10000 |
| 2/29/2020 | 8975 | 8969 | 9201 |
| 8/31/2020 | 10396 | 10157 | 11007 |
| 2/28/2021 | 11115 | 11157 | 12080 |
| 8/31/2021 | 12834 | 12876 | 14438 |
| 2/28/2022 | 12788 | 12451 | 14060 |
| 8/31/2022 | 11979 | 11709 | 12817 |
| 2/28/2023 | 12670 | 12253 | 12978 |
| 8/31/2023 | 12967 | 13182 | 14860 |
| 2/29/2024 | 14218 | 14952 | 16930 |
| 8/31/2024 | 16264 | 16090 | 18893 |
ANNUAL SHAREHOLDER REPORT
August 31, 2024
ARCHER MULTI CAP FUND
ALSMX
ADDITIONAL INFORMATION
This annual shareholder report contains important information about the Archer Multi Cap Fund – ALSMX (the “Fund”) for the period September 1, 2023 to August 31, 2024.
You can find additional information about the Fund at www.thearcherfunds.com. You can also request this information by contacting us at 1-800-238-7701.
expense Information
What were the Fund costs for the past year?
(based on a hypothetical $10,000 investment)
| Fund Name | Costs of a $10,000 investment | Costs paid as a percentage of a $10,000 investment* |
| | | |
| Archer Multi Cap Fund | $108 | 0.95% |
*Annualized
managment’s discussion of fund performance
The Archer Multi Cap Fund returned 27.46% for the year ended August 31, 2024 and 10.53% from the date of inception on December 31, 2019. This compares to returns of 27.14% & 14.59% for the S&P 500 Index, 17.24% & 8.92% for the S&P 600 Small Cap Index, and 18.72% & 10.74% for the S&P 400 Mid Cap Index over the same periods.
Performance Review
The Archer Multi Cap Fund seeks long-term growth of capital by investing in up to 75 equity positions split evenly between the top 25 small, medium, and large publicly traded US companies at the beginning of each calendar year based on market capitalization. Position sizes are adjusted throughout the year driven by our proprietary quantitative and technical models and rebalanced annually. As of August 31, 2024 the Multi Cap fund maintained a slight overweighting to larger companies. Growth continues to be the overwhelming style factor of the fund. In terms of sector weightings, Industrials, Technology, Consumer Cyclical, and Healthcare companies were the largest holdings, while the fund maintained relatively little exposure to Consumer Staples, Real Estate, and Utilities. The relative overweighting of large companies aided relative performance during much of the year. A more recent broadening of performance leadership to small and midsized companies has helped improve performance relative to the blended benchmark, but the rapid changes to sector leadership and style factor performance has led to underperformance relative to the blended benchmark since inception. We continue to believe that the relatively balanced market cap exposure provided by the Fund will reward patient shareholders over time.
Performance graph
AVERAGE ANNUAL RETURNS
| | 1 Year | Since Inception* | Ending Value |
| Archer Multi Cap Fund | 27.46% | 10.53% | $15,964 |
| S&P 500 Index | 27.14% | 14.59% | $18,893 |
| S&P 600 Small Cap Index | 17.24% | 8.92% | $14,903 |
| S&P 400 Mid Cap Index | 18.72% | 10.74% | $16,111 |
| Synthetic Blend 33-33-33 | 21.00% | 11.67% | $16,745 |
Cumulative Performance Comparison of $10,000 Investment

* Inception December 30, 2019.
Past performance is not a good predictor of future performance. The returns shown do not reflect taxes that a shareholder would pay on Fund distributions or on the redemption of Fund shares. Updated performance data current to the most recent month-end can be obtained by calling 1-800-238-7701.
Fund statistics
| | | | ADVISORY FEES |
| NET ASSETS: | PORTFOLIO HOLDINGS: | PORTFOLIO TURNOVER: | PAID BY FUND: |
| $7,825,625 | 76 | 57.42% | ($21,751) |
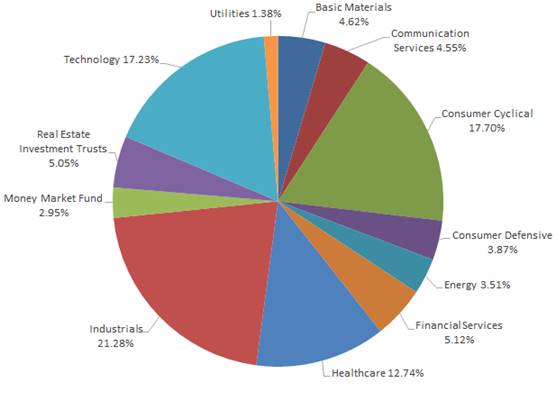
SECTOR WEIGHTINGS
The following chart gives a visual breakdown of the Fund by the sectors the underlying securities represent as a percentage of the portfolio of investments.
top ten holdings (% OF NET ASSETS)
| 1. | Morgan Stanley Institutional Liquidity Treasury Portfolio - Institutional Class | 2.94% |
| 2. | Mueller Industries, Inc. | 2.04% |
| 3. | Burlington Stores, Inc. | 1.95% |
| 4. | AAON, Inc. | 1.92% |
| 5. | Federal Signal Corp. | 1.91% |
| 6. | Abercrombie & Fitch Co. | 1.90% |
| 7. | NVDIA Corp. | 1.86% |
| 8. | AbbVie Inc. | 1.84% |
| 9. | SPX Technologies, Inc. | 1.82% |
| 10. | Broadcom, Inc. | 1.77% |
| | Total % of Net Assets | 19.95% |
How has the fund changed
The Fund has not had any material changes during the year ended August 31, 2024.
Householding
To reduce Fund expenses, only one copy of most shareholder documents may be mailed to shareholders with multiple accounts at the same address (Householding). If you would prefer that your Archer Multi Cap Fund documents not be householded, please contact Archer Funds at 1-800-238-7701, or contact your financial intermediary. Your instructions will typically be effective within 30 days of receipt by Archer Funds or your financial intermediary.
For additional information about the Fund; including its prospectus, financial information, holdings and proxy information, visit www.thearcherfunds.com or contact us at 1-800-238-7701.
| Multi Cap Pie Chart | |
| | |
| Basic Materials | 4.62% |
| Communication Services | 4.55% |
| Consumer Cyclical | 17.70% |
| Consumer Defensive | 3.87% |
| Energy | 3.51% |
| Financial Services | 5.12% |
| Healthcare | 12.74% |
| Industrials | 21.28% |
| Money Market Fund | 2.95% |
| Real Estate Investment Trusts | 5.05% |
| Technology | 17.23% |
| Utilities | 1.38% |
| Archer Multi Cap Line Graph | | | | |
| | Multi Cap Fund | S&P 500 | S&P 600 | S&P 400 | Synthetic Blend |
| 12/30/2019 | 10000 | 10000 | 10000 | 10000 | 10000 |
| 2/29/2020 | 9120 | 9201 | 8707 | 8826 | 8910 |
| 8/31/2020 | 10355 | 11007 | 8920 | 9457 | 9774 |
| 2/28/2021 | 11883 | 12080 | 12769 | 12336 | 12488 |
| 8/31/2021 | 13572 | 14438 | 13729 | 13689 | 14071 |
| 2/28/2022 | 11923 | 14060 | 13299 | 13317 | 13673 |
| 8/31/2022 | 11207 | 12817 | 12055 | 12264 | 12484 |
| 2/28/2023 | 11257 | 12978 | 12823 | 13227 | 13128 |
| 8/31/2023 | 12525 | 14860 | 12711 | 13571 | 13838 |
| 2/29/2024 | 14831 | 16930 | 13644 | 14947 | 15287 |
| 8/31/2024 | 15964 | 18893 | 14903 | 16111 | 16745 |
Item 2. Code of Ethics.
(a) As of the end of the period covered by this report, the registrant has adopted a code of ethics that applies to the registrant's principal executive officer, principal financial officer, principal accounting officer or controller, or persons performing similar functions, regardless of whether these individuals are employed by the registrant or a third party.
(b) For purposes of this item, “code of ethics” means written standards that are reasonably designed to deter wrongdoing and to promote:
(1) Honest and ethical conduct, including the ethical handling of actual or apparent conflicts of interest between personal and professional relationships;
(2) Full, fair, accurate, timely, and understandable disclosure in reports and documents that a registrant files with, or submits to, the Commission and in other public communications made by the registrant;
(3) Compliance with applicable governmental laws, rules, and regulations;
(4) The prompt internal reporting of violations of the code to an appropriate person or persons identified in the code; and
(5) Accountability for adherence to the code.
(c) Amendments: During the period covered by the report, there have not been any amendments to the provisions of the code of ethics.
(d) Waivers: During the period covered by the report, the registrant has not granted any express or implicit waivers from the provisions of the code of ethics.
(e) The Code of Ethics is not posted on registrant’s website.
(f) A copy of the Code of Ethics is attached as an exhibit.
Item 3. Audit Committee Financial Expert.
(a) The registrant’s Board of Trustees has determined that it does not have an audit committee financial expert serving on its audit committee. At this time, the registrant believes that the experience provided by each member of the audit committee together offer the registrant adequate oversight for the registrant’s level of financial complexity.
Item 4. Principal Accountant Fees and Services.
FY 2024 $ 54,000
FY 2023 $ 54,000
Registrant
FY 2024 $ 0
FY 2023 $ 0
Nature of the fees: Not applicable.
Registrant
FY 2024 $ 11,100
FY 2023 $ 11,100
Nature of the fees: Tax preparation and filing.
Registrant
FY 2024 $ 0
FY 2023 $ 0
Nature of the fees: Not applicable.
| (e) | (1) Audit Committee’s Pre-Approval Policies |
The audit committee approves all audit and non-audit related services and, therefore, has not adopted pre-approval policies and procedures described in paragraph (c)(7) of Rule 2-01 of Regulation S-X.
| (2) | Percentages of Services Approved by the Audit Committee |
None of the services described in paragraph (b) through (d) of this Item were approved by the audit committee pursuant to paragraph (c)(7)(i)(C) of Rule 2-01 of Regulation S-X.
(f) During audit of registrant's financial statements for the most recent fiscal year, less than 50 percent of the hours expended on the principal accountant's engagement were attributed to work performed by persons other than the principal accountant's full-time, permanent employees.
(g) The aggregate non-audit fees billed by the registrant's accountant for services rendered to the registrant, and rendered to the registrant's investment adviser (not including any sub-adviser whose role is primarily portfolio management and is subcontracted with or overseen by another investment adviser), and any entity controlling, controlled by, or under common control with the adviser that provides ongoing services to the registrant:
Registrant
FY 2024 $ 11,100
FY 2023 $ 11,100
(h) The registrant's audit committee has not considered whether the provision of non-audit services to the registrant's investment adviser (not including any sub-adviser whose role is primarily portfolio management and is subcontracted with or overseen by another investment adviser), and any entity controlling, controlled by, or under common control with the investment adviser that provides ongoing services to the registrant, that were not pre-approved pursuant to paragraph (c)(7)(ii) of Rule 2-01 of Regulation S-X, is compatible with maintaining the principal accountant's independence.
(i) Not applicable.
(j) Not applicable.
Item 5. Audit Committee of Listed Companies. Not applicable.
Item 6. Schedule of Investments. Not applicable – schedule filed with Item 7.
Item 7. Financial Statements and Financial Highlights for Open-End Management Companies.
THE ARCHER FUNDS
BALANCED FUND (ARCHX)
INCOME FUND (ARINX)
STOCK FUND (ARSKX)
DIVIDEND GROWTH FUND (ARDGX)
FOCUS FUND (AFOCX)
MULTI CAP FUND (ALSMX)
ANNUAL FINANCIAL STATEMENTS
August 31, 2024
| | | | |
| | | ARCHER BALANCED FUND | |
| | | SCHEDULE OF INVESTMENTS | |
| | | August 31, 2024 | |
| | | | |
| Shares/Principal | Fair Value |
| | | | |
| COMMON STOCKS - 66.55% | |
| | | | |
| Air Courier Services - 1.91% | |
| 3,250 | | FedEx Corp. | $ 971,002 |
| | | | |
| Aircraft Engines & Engine Parts - 2.05% | |
| 5,000 | | Honeywell International, Inc. | 1,039,550 |
| | | | |
| Beverages - 1.36% | |
| 4,000 | | PepsiCo, Inc. | 691,520 |
| | | | |
| Commercial Banks - 1.30% | |
| 11,000 | | Toronto Dominion Bank (Canada) | 659,120 |
| | | | |
| Electric Services - 3.51% | |
| 3,400 | | American Electric Power Company, Inc. | 340,952 |
| 17,900 | | NextEra Energy, Inc. | 1,441,129 |
| | | | 1,782,081 |
| Electrical Work - 2.85% | |
| 5,255 | | Quanta Services, Inc. | 1,445,808 |
| | | | |
| Electromedical & Electrotherapeutic Apparatus - 1.64% | |
| 9,400 | | Medtronic PLC. (Ireland) | 832,652 |
| | | | |
| Electronic Computers - 2.80% | |
| 6,200 | | Apple, Inc. | 1,419,800 |
| | | | |
| Food & Kindred Products - 1.03% | |
| 4,900 | | Nestle S.A. ADR | 523,908 |
| | | | |
| Guided Missiles & Space Vehicles & Parts - 2.86% | |
| 2,550 | | Lockheed Martin Corp. | 1,448,655 |
| | | | |
| National Commercial Banks - 2.91% | |
| 6,560 | | JPMorgan Chase & Co. | 1,474,688 |
| | | | |
| Petroleum Refining - 3.00% | |
| 6,300 | | Chevron Corp. | 932,085 |
| 5,000 | | Exxon Mobil Corp. | 589,700 |
| | | | 1,521,785 |
| Pharmaceutical Preparations - 9.11% | |
| 8,550 | | Bristol Myers Squibb Co. | 427,073 |
| 1,450 | | Eli Lilly & Co. | 1,392,029 |
| 5,000 | | Johnson & Johnson | 829,300 |
| 9,080 | | Merck & Co., Inc. | 1,075,526 |
| 31,000 | | Pfizer, Inc. | 899,310 |
| | | | 4,623,238 |
| Railroads, Line-Haul Operating - 2.32% | |
| 4,600 | | Union Pacific Corp. Class B | 1,178,014 |
| | | | |
| Retail - Drug Stores and Proprietary Stores - 1.21% | |
| 10,694 | | CVS Health Corp. | 612,125 |
| | | | |
| Retail - Lumber & Other Building Material Dealers - 1.60% | |
| 2,200 | | Home Depot, Inc. | 810,700 |
| | | | |
| Retail - Variety Stores - 3.65% | |
| 24,000 | | WalMart, Inc. | 1,853,520 |
| | | | |
| Rubber & Plastics Footwear - 0.82% | |
| 5,000 | | Nike, Inc. Class B | 416,600 |
| | | | |
| Semiconductors & Related Devices - 3.34% | |
| 10,400 | | Broadcom, Inc. | 1,693,328 |
| | | | |
| Services - Business Services - 5.02% | |
| 3,000 | | Accenture PLC. Class A (Ireland) | 1,025,850 |
| 3,150 | | MasterCard, Inc. Class A | 1,522,521 |
| | | | 2,548,371 |
| Services - Computer Programming, Data Processing, Etc. - 6.65% | |
| 8,600 | | Alphabet, Inc. Class A | 1,405,068 |
| 3,775 | | Meta Platforms, Inc. Class A | 1,967,945 |
| | | | 3,373,013 |
| Services - Medical Laboratories - 0.97% | |
| 2,150 | | Laboratory Corp. of America Holdings | 494,263 |
| | | | |
| Services - Miscellaneous Amusement & Recreation - 1.07% | |
| 6,000 | | Walt Disney Co. | 542,280 |
| | | | |
| Services - Prepackaged Software - 3.04% | |
| 3,700 | | Microsoft Corp. | 1,543,418 |
| | | | |
| Sugar & Confectionery Products - 0.53% | |
| 1,400 | | Hershey Co. | 270,284 |
| | | | |
| TOTAL FOR COMMON STOCKS (Cost $14,926,249) - 66.55% | 33,769,723 |
| | | | |
| CORPORATE BONDS - 15.70% (c) | |
| | | | |
| Air Transportation, Scheduled - 0.49% | |
| 250,000 | | Southwest Airlines Co., 5.250%, due 5/04/25 | 250,028 |
| | | | |
| Aircraft - 0.48% | |
| 250,000 | | Boeing Co., 2.600%, due 10/30/25 | 243,083 |
| | | | |
| Banks & Financial Institutions - 2.37% | |
| 500,000 | | Federal Farm Credit Bank, 5.570%, due 8/26/33 | 499,189 |
| 700,000 | | Federal Home Loan Bank, 5.555%, due 2/15/33 | 702,463 |
| | | | 1,201,652 |
| Commercial Banks - 0.19% | |
| 100,000 | | Royal Bank of Canada, 1.200%, due 4/27/26 (Canada) | 94,922 |
| | | | |
| Electric Services - 0.20% | |
| 100,000 | | Southern California Edison Co. Series E, 3.700%, due 8/01/25 | 98,947 |
| | | | |
| Financial Services - 0.26% | |
| 150,000 | | General Motors Financial Co., Inc., 3.100%, due 1/12/32 | 130,781 |
| | | | |
| Heating Equip, Except Elec & Warm Air; & Plumbing Fixtures - 1.11% | |
| 500,000 | | Masco Corp., 7.750%, due 8/01/29 | 564,335 |
| | | | |
| Investment Advice - 0.88% | |
| 200,000 | | Affiliated Managers Group, Inc., 3.500%, due 8/01/25 | 197,231 |
| 250,000 | | Janus Capital Group, Inc., 4.875%, due 8/01/25 | 249,409 |
| | | | 446,640 |
| National Commercial Banks - 2.95% | |
| 300,000 | | Banc of California, Inc., 5.250%, due 4/15/25 | 298,440 |
| 100,000 | | Bank of America Corp. Series L, 3.950%, due 4/21/25 | 99,218 |
| 150,000 | | Huntington Bancshares, Inc. Series E, 8.44298%, to 10/15/24 (3-Month SOFR + 3.14161%) (b) *** | 148,880 |
| 150,000 | | Huntington Bancshares, Inc. Series G, 4.450%, to 10/15/27 (a) (b) | 142,495 |
| 150,000 | | JPMorgan Chase & Co. Series B, 6.00929%, due 2/01/27 (3-Month SOFR + 0.76161%) *** | 146,641 |
| 150,000 | | Truist Financial Corp. Series M, 5.125%, to 12/15/27 (a) (b) | 144,656 |
| 300,000 | | US Bancorp, 3.700%, to 1/15/27 (a) (b) | 265,209 |
| 250,000 | | Wells Fargo & Co. Series MTN, 6.000%, due 10/28/25 | 250,110 |
| | | | 1,495,649 |
| Operative Builders - 0.30% | |
| 150,000 | | Lennar Corp., 4.750%, due 11/29/27 | 151,320 |
| | | | |
| Other Real Estate Investment Trust - 0.29% | |
| 6,000 | | Ready Capital Corp., 5.750%, due 2/15/26 | 145,020 |
| | | | |
| Paper Mills - 0.86% | |
| 400,000 | | Georgia-Pacifi, LLC, 7.250%, due 6/01/28 | 437,315 |
| | | | |
| Personal Credit Institutions - 0.49% | |
| 250,000 | | Discover Financial Services Series D, 6.125%, to 6/23/25 (a) (b) | 248,685 |
| | | | |
| Pharmaceutical Preparations - 0.19% | |
| 100,000 | | AbbVie, Inc., 3.200%, due 5/14/26 | 98,057 |
| | | | |
| Security Brokers, Dealers & Flotation Companies - 1.33% | |
| 400,000 | | Capital Southwest Corp., 3.375%, due 10/01/26 | 372,800 |
| 300,000 | | Jeffries Financial Group, Inc. Series MTN, 6.500%, 10/31/29 | 300,578 |
| | | | 673,378 |
| Services - Advertising Agencies - 0.39% | |
| 200,000 | | Omnicom Group, Inc., 3.600%, due 4/15/26 | 196,431 |
| | | | |
| Services - Equipment Rental & Leasing - 0.86% | |
| 200,000 | | Air Lease Corp., 3.625%, due 12/01/27 | 193,848 |
| 250,000 | | United Rentals, Inc., 3.875%, due 11/15/27 | 241,275 |
| | | | 435,123 |
| Services - Miscellaneous Amusement & Recreation - 0.51% | |
| 250,000 | | Walt Disney Co., 7.700%, due 10/30/25 | 257,751 |
| | | | |
| Services - Prepackaged Software - 0.48% | |
| 100,000 | | Oracle Corp., 1.650%, due 3/25/26 | 95,432 |
| 150,000 | | VMWare, Inc., 3.900%, due 8/21/27 | 147,421 |
| | | | 242,853 |
| State Commercial Banks - 1.07% | |
| 100,000 | | Citizens Financial Group, Inc., 4.350%, due 8/01/25 | 98,961 |
| 250,000 | | Eagle Bancorp, Inc., 5.750%, due 9/01/24 | 250,000 |
| 200,000 | | Fifth Third Bancorp Series L, 4.500%, to 9/30/25 (a) (b) | 195,974 |
| | | | 544,935 |
| | | | |
| TOTAL FOR CORPORATE BONDS (Cost $8,157,504) - 15.70% | 7,956,905 |
| | | | |
| MUNICIPAL BONDS - 3.97% (c) | |
| | | | |
| California - 0.08% | |
| 20,000 | | Porterville Unified School District, 7.250%, due 7/01/27 | 20,042 |
| 20,000 | | San Bernardino County Redevelopment Agency Series A, 3.625%, due 9/01/24 | 20,000 |
| | | | 40,042 |
| Georgia - 0.20% | |
| 99,000 | | Georgia State Local Govt. Cops Grantor Trust Series A, 4.750%, due 6/01/28 | 101,891 |
| | | | |
| Indiana - 0.62% | |
| 135,000 | | Evansville-Vanderburgh, IN School Bldg. Corp. Series B, 6.150% due 7/15/27 | 135,124 |
| 190,000 | | Fishers, IN Econ Development Revenue Taxable-P3 Project Series C, 2.650%, due 8/01/28 | 180,110 |
| | | | 315,234 |
| Maryland - 0.40% | |
| 200,000 | | Baltimore Board of School Commissioners City Schools Revenue, 5.692%, due 12/15/25 | 201,302 |
| | | | |
| Michigan - 0.49% | |
| 25,000 | | City of Coldwater, MI Water Supply & Wastewater System Revenue, 5.000%, due 8/01/26 | 26,095 |
| 227,500 | | Michigan State Taxable School Loan Series A, 3.200%, due 5/15/27 | 222,183 |
| | | | 248,278 |
| New York - 0.48% | |
| 250,000 | | New York City, NY Transitional Finance Authority Revenue, 2.760%, due 2/01/26 | 244,433 |
| | | | |
| Ohio - 0.52% | | |
| 250,000 | | New Albany, Floyd County Industry School First Mortgage, 5.000%, due 1/15/27 | 262,580 |
| | | | |
| Pennsylvania - 0.82% | |
| 250,000 | | East-Norriton-Plymouth-Whipain Joint Sewer Authority, 1.832%, due 8/01/28 | 229,570 |
| 200,000 | | Pennsylvania ST Txble-Ref-First-Refunding Series, 1.200%, due 8/01/26 | 188,948 |
| | | | 418,518 |
| Washington - 0.14% | |
| 70,000 | | Douglas County, WA School District No. 206 Eastmont Qualified School Construction, 4.700%, due 12/01/25 | 70,267 |
| | | | |
| Wisconsin - 0.22% | |
| 110,000 | | Greendale, WI Taxable Community Development, Series A, 4.750%, due 12/01/26 | 110,032 |
| | | | |
| TOTAL FOR MUNICIPAL BONDS (Cost $2,094,350) - 3.97% | 2,012,577 |
| | | | |
| REAL ESTATE INVESTMENT TRUSTS - 4.16% | |
| 5,100 | | Extra Space Storage, Inc. | 902,700 |
| 9,452 | | Prologis, Inc. | 1,208,155 |
| TOTAL FOR REAL ESTATE INVESTMENT TRUSTS (Cost $893,026) - 4.16% | 2,110,855 |
| | | | |
| PREFERRED SECURITIES - 1.00% | |
| | | | |
| Asset Management - 0.09% | |
| 4,000 | | B Riley Financial, Inc., 6.50%, due 09/30/26 | 46,280 |
| | | | |
| Motor Vehicles & Passenger Car Bodies - 0.30% | |
| 6,000 | | Ford Motor Co., 6.000%, due 12/01/59 | 150,240 |
| | | | |
| National Commercial Banks - 0.53% | |
| 150,000 | | BAC Capital Trust XIII Series F, 6.00083% (3-Month SOFR + 0.66161%) (b) *** | 125,096 |
| 150,000 | | PNC Capital Trust C, 6.177690%, due 6/01/28 (3-Month SOFR + 0.83161%) *** | 144,430 |
| | | | 269,526 |
| Telephone Communications (No Radio Telephone) - 0.08% | |
| 3,000 | | QWest Corp., 6.500%, due 9/01/56 | 42,150 |
| | | | |
| TOTAL FOR PREFERRED SECURITIES (Cost $611,396) - 1.00% | 508,196 |
| | | | |
| STRUCTURED NOTES - 0.35% (c) | |
| | | | |
| Security Brokers, Dealers & Flotation Companies - 0.35% | |
| 125,000 | | Goldman Sachs Group, Inc., 0.000%, due 11/13/28, Capped at 10% *** | 98,450 |
| 95,000 | | Morgan Stanley, Series MTN, 0.000%, due 8/30/28, Capped at 12% *** | 77,464 |
| | | | 175,914 |
| | | | |
| TOTAL FOR STRUCTURED NOTES (Cost $212,853) - 0.35% | 175,914 |
| | | | |
| U.S. GOVERNMENT AGENCIES & OBLIGATIONS- 1.48%%(c) | |
| 750,000 | | U.S. Government Treasury Note/Bond, 3.875%, due 8/15/33 | 748,682 |
| TOTAL FOR U.S. GOVERNMENT AGENCIES & OBLIGATIONS (Cost $709,044) - 1.48% | 748,682 |
| | | | |
| MONEY MARKET FUND - 6.44% | |
| 3,266,470 | | Federated Treasury Obligation Fund - Institutional Shares 5.13% ** (Cost $3,266,470) - 6.44% | 3,266,470 |
| | | | |
| TOTAL INVESTMENTS (Cost $30,870,892) - 99.65% | 50,549,322 |
| | | | |
| OTHER ASSETS LESS LIABILITIES, NET - 0.35% | 175,408 |
| | | | |
| NET ASSETS - 100.00% | $ 50,724,730 |
| | | | |
| (a) Security converts to floating rate after the indicated fixed-rate coupon period. | |
| (b) Perpetual security. Perpetual securities have no stated maturity date, but they may be called/redeemed by the issuer. | |
| (c) All Corporate Bonds, Municipal Bonds and Structured Notes are categorized as Level 2 | |
| of the fair value hierarchy. Refer to Note 3 of the accompanying notes to the financial statements for additional information. | |
| * Non-income producing security during period. | |
| ** Variable rate security; the coupon rate shown represents the yield at August 31, 2024. | |
| *** Variable Rate Security - Interest rate shown is rate in effect at August 31, 2024. | |
| For securities based on a published reference rate and spread, the reference rate and spread are indicated in the description above. | |
| ADR - American Depository Receipt | |
| SOFR- Secured Overnight Financial Rate, a benchmark interest rate for dollar-denominated derivatives and loans. | |
| 3-month is the period where it is a fixed period of 3 months a lender will lend at that cost. | |
| The accompanying notes are an integral part of these financial statements. | |
| | | | |
| | | ARCHER INCOME FUND | |
| | | SCHEDULE OF INVESTMENTS | |
| | | August 31, 2024 | |
| | | | |
| Shares/Principal | Fair Value |
| | | | |
| | | | |
| CORPORATE BONDS - 51.69% (c) | |
| | | | |
| Air Transportation, Scheduled - 0.76% | |
| 150,000 | | Southwest Airlines Co., 5.250%, due 5/04/25 | $ 150,017 |
| | | | |
| Aircraft - 0.74% | |
| 150,000 | | Boeing Co., 2.600%, due 10/30/25 | 145,850 |
| | | | |
| Banks & Financial Institutions - 5.36% | |
| 500,000 | | Federal Farm Credit Bank, 5.570%, due 8/26/33 | 499,189 |
| 550,000 | | Federal Home Loan Bank, 5.555%, due 2/15/33 | 551,935 |
| | | | 1,051,124 |
| Commercial Banks - 3.06% | |
| 100,000 | | Bank of Montreal Series MTN, 6.100%, due 8/29/28 (Canada) | 99,478 |
| 250,000 | | Bank of Montreal Series MTN, 5.650%, due 7/12/29 | 250,856 |
| 250,000 | | Toronto Dominion Bank Series GMTN, 6.100%, due 8/16/28 (Canada) | 250,078 |
| | | | 600,412 |
| Consumer Cyclical Services - 0.26% | |
| 55,000 | | Conservation Fund Series 2019, 3.4740%, due 12/15/29 | 51,523 |
| | | | |
| Dental Equipment & Supplies - 0.70% | |
| 150,000 | | Dentsply Sirona, Inc. 3.250%, to 06/01/30 | 136,327 |
| | | | |
| Financial Services - 1.50% | |
| 150,000 | | CommunityWide Federal Credit Union, 5.000%, due 12/08/25 | 151,309 |
| 150,000 | | General Motors Financial Company, Inc. Series C, 5.70%, to 9/30/30 (a) (b) | 143,817 |
| | | | 295,126 |
| General Building Contractors - Residential Buildings - 0.51% | |
| 100,000 | | Lennar Corp., 4.750%, due 11/29/27 | 100,880 |
| | | | |
| Heating Equip, Except Elec & Warm Air; & Plumbing Fixtures - 2.30% | |
| 400,000 | | Masco Corp., 7.750%, due 8/01/29 | 451,468 |
| | | | |
| Investment Advice - 1.01% | |
| 200,000 | | Affiliated Managers Group, Inc., 3.500%, due 8/01/25 | 197,231 |
| | | | |
| Miscellaneous Publishing - 0.51% | |
| 100,000 | | Thomson Reuters Corp., 3.85%, due 9/29/24 | 99,838 |
| | | | |
| Motor Vehicles & Passenger Car Bodies - 0.75% | |
| 150,000 | | Toyota Motor Credit Corp. Series MTN, 5.250%, due 2/22/2027 | 147,479 |
| | | | |
| National Commercial Banks - 10.39% | |
| 200,000 | | Banc of California, Inc., 5.250%, due 4/15/25 | 198,960 |
| 200,000 | | Bank of America Corp. Series MTN, 6.550%, due 10/20/33 | 203,296 |
| 150,000 | | Huntington Bancshares, Inc. Series E, 8.44298%, to 10/15/24 (3-Month SOFR + 3.14161%) (b) *** | 148,880 |
| 150,000 | | Huntington Bancshares, Inc. Series G, 4.450%, to 10/15/27 (a) (b) | 142,495 |
| 150,000 | | JPMorgan & Chase Co. Series B, 6.00929%, due 2/01/27 (3-Month SOFR + 0.76161%) *** | 146,642 |
| 150,000 | | JPMorgan & Chase Co. Series CC, 8.08929%, to 11/01/24 (3-Month SOFR + 2.84161) (b) *** | 151,328 |
| 200,000 | | Keycorp Series MTN, 2.250%, due 4/06/27 | 187,874 |
| 10,000 | | SouthState Bank Corp., 5.750%, to 6/01/25 (a) | 9,749 |
| 100,000 | | Truist Financial Corp. Series M, 5.125%, to 12/15/27 (a) (b) | 96,438 |
| 75,000 | | Truist Financial Corp. Series Q, 5.100%, to 3/01/30 (a) (b) | 72,797 |
| 150,000 | | TTCU Federal Credit Union Series CD, 5.000%, due 7/26/27 | 154,467 |
| 200,000 | | US Bancorp, 3.700%, to 1/15/27 (a) (b) | 176,806 |
| 350,000 | | Wells Fargo & Co. Series MTN, 5.200%, due 8/16/34 | 349,517 |
| | | | 2,039,249 |
| Natural Gas Distribution - 0.25% | |
| 50,000 | | National Fuel Gas Co., 5.200%, due 7/15/25 | 49,895 |
| | | | |
| Paper Mills - 2.55% | |
| 300,000 | | Georgia-Pacific, LLC, 7.250%, to due 6/01/28 | 327,986 |
| 150,000 | | Georgia-Pacific, LLC, 7.750%, to due 11/15/29 | 172,844 |
| | | | 500,830 |
| Personal Credit Institutions - 1.23% | |
| 100,000 | | Discover Financial Services Series D, 6.125%, to 6/23/25 (a) (b) | 99,474 |
| 150,000 | | OneMain Finance Corp., 3.500%, due 1/15/27 | 142,203 |
| | | | 241,677 |
| Real Estate Investment Trust - 0.49% | |
| 4,000 | | Ready Capital Corp., 5.750%, due 2/15/26 | 96,680 |
| | | | |
| Retail - Department Stores - 0.19% | |
| 35,000 | | Dillards, Inc., 7.750%, due 7/15/26 | 36,481 |
| | | | |
| Retail-Drug Stores and Proprietary Stores - 1.54% | |
| 300,000 | | CVS Health Corp., 5.300%, due 6/01/33 | 301,586 |
| | | | |
| Security Brokers, Dealers & Flotation Companies - 2.51% | |
| 100,000 | | Capital Southwest Corp., 3.375%, due 10/01/26 | 93,200 |
| 100,000 | | Goldman Sachs Group, Inc. Series MTN, 6.100%, due 8/31/28 | 99,644 |
| 150,000 | | Jefferies Financial Group, Inc. Series MTN, 6.000%, due 12/29/28 | 148,316 |
| 150,000 | | Jefferies Financial Group, Inc. Series MTN, 6.500%, due 10/31/29 | 150,289 |
| | | | 491,449 |
| Services - Equipment Rental & Leasing - 1.23% | |
| 100,000 | | Air Lease Corp., 3.625%, due 12/01/27 | 96,924 |
| 150,000 | | United Rentals, Inc., 3.875%, due 11/15/27 | 144,765 |
| | | | 241,689 |
| Services-Miscellaneous Amusement & Recreation - 2.69% | |
| 400,000 | | Walt Disney Co., 7.700%, due 10/30/25 | 412,401 |
| 100,000 | | Walt Disney Co., 6.750%, due 1/09/38 | 115,352 |
| | | | 527,753 |
| Services - General Medical & Surgical Hospitals - 1.36% | |
| 250,000 | | HCA Healthcare, Inc., 7.050%, due 12/01/27 | 265,672 |
| | | | |
| Services - Prepackaged Software - 0.75% | |
| 150,000 | | VMWare, Inc. 3.900%, due 8/21/27 | 147,421 |
| | | | |
| State Commercial Banks - 7.22% | |
| 150,000 | | Ally Financial, Inc. Series B, 4.700%, to 5/15/26 (a) (b) | 136,322 |
| 150,000 | | Eagle Bancorp, Inc., 5.750%, due 9/01/24 | 150,000 |
| 150,000 | | Fifth Third Bancorp Series L, 4.500%, to 9/30/25 (a) (b) | 146,981 |
| 350,000 | | First Citizens Bank, 6.125%, due 3/09/28 | 362,614 |
| 100,000 | | Hilltop Holdings, Inc., 5.000%, due 4/15/25 | 98,237 |
| 500,000 | | State Street Corp., 7.350%, due 6/15/26 | 522,246 |
| 150,000 | | SVB Financial Group, 4.100%, to 2/15/31 (a) (b) + | 562 |
| | | | 1,416,962 |
| Steel Works, Blast Furnaces & Rolling Mills (Coke Ovens) - 0.76% | |
| 150,000 | | Steel Dynamics, Inc., 5.000%, due 12/15/26 | 149,789 |
| | | | |
| Telephone Communications (No Radio Telephone) - 0.26% | |
| 50,000 | | Indiana Bell Tel Co., Inc., 7.300%, due 8/15/26 | 51,710 |
| | | | |
| Wholesale - Groceries & Related Products - 0.81% | |
| 152,000 | | Sysco Corp., 6.500%, due 8/01/28 | 158,876 |
| | | | |
| TOTAL FOR CORPORATE BONDS (Cost $10,369,098) - 51.69% | 10,144,994 |
| | | | |
| EXCHANGE TRADED FUNDS - 4.19% | |
| 5,000 | | iShares 5-10 Year Investment Grade Corporate Bond ETF | 265,300 |
| 10,000 | | iShares 10+ Year Investment Grade Corporate Bond ETF | 523,800 |
| 1,000 | | iShares US Preferred Stock ETF | 32,360 |
| TOTAL FOR EXCHANGE TRADED FUNDS (Cost $809,693) - 4.19% | 821,460 |
| | | | |
| MUNICIPAL BONDS - 16.19% (c) | |
| | | | |
| Florida -0.72% | |
| 150,000 | | North Miami Beach, FL, Water Revenue Series B, 2.311%, due 8/01/27 | 142,580 |
| | | | |
| Georgia - 1.02% | |
| 50,000 | | Georgia State Local Government Cops Grantor Trust Series A, 4.750%, due 6/01/28 | 51,460 |
| 150,000 | | Georgia Qualified School Construction Bond Series F, 4.000%, 2/01/26 | 149,115 |
| | | | 200,575 |
| Illinois - 0.93% | |
| 125,000 | | Illinois Build America Bond, 6.900%, 3/01/35 | 139,728 |
| 42,353 | | Illinois State Taxable Pension AGM CR, 5.100%, 6/01/33 | 42,726 |
| | | | 182,454 |
| Indiana - 5.30% | |
| 140,000 | | Beech Grove, IN Sch Bldg. Corp., 2.850%, due 7/05/25 | 138,271 |
| 165,000 | | Evansville-Vanderburgh, IN School Bldg. Corp. Series B, 5.900%, due 7/15/26 | 165,094 |
| 100,000 | | Evansville-Vanderburgh, IN School Bldg. Corp. Series B, 6.150%, due 7/15/27 | 100,092 |
| 50,000 | | Gary Community School Bldg. Corp., 3.200%, due 7/15/29 | 48,464 |
| 25,000 | | Gary Community School Bldg. Corp., 3.500%, due 1/15/33 | 23,728 |
| 140,000 | | Indiana State Housing & Community Development Authority Series A-2, 4.984%, 7/1/30 | 141,012 |
| 300,000 | | Plainfield Redevelopment Commission Series B, 2.000%, due 2/01/29 | 269,742 |
| 150,000 | | Schererville Income Econ Dev Revenue, 2.579%, due 1/15/30 | 133,950 |
| 20,000 | | Warsaw Industry Redevelopment District Tax Taxable Special Taxing District Series A, 4.750%, due 2/01/26 | 19,811 |
| | | | 1,040,164 |
| Maryland - 0.51% | |
| 100,000 | | Baltimore MD, Brd of Sch Commissioners City Schs Revenue, 5.692%, due 12/15/25 | 100,651 |
| | | | |
| Michigan - 0.88% | |
| 177,500 | | Michigan State Taxable School Loan Series A, 3.200%, due 5/15/27 | 173,352 |
| | | | |
| Nebraska - 0.56% | |
| 110,000 | | Omaha NE Special Obligation Taxable Ref Riverfront, 6.400%, due 2/01/26 | 111,077 |
| | | | |
| New York - 0.52% | |
| 100,000 | | New York St Dorm Auth Revenues, 5.289%, due 3/15/33 | 101,762 |
| | | | |
| Ohio - 1.96% | |
| 100,000 | | Avon, OH, General Obligations Various Purpose Improvement Refunding Bonds, Series 2020, 0.955%, due 12/01/25 | 95,699 |
| 60,000 | | Bloom & Carroll Ohio Loc Sch Dist, 5.800%, due 12/01/25 | 60,858 |
| 10,000 | | Cleveland, OH Income Tax Revenue Build America Bonds, 6.060%, due 10/01/26 | 10,150 |
| 100,000 | | Cleveland, OH Public Power Sys Revenue, 5.500%, due 11/15/38 | 100,034 |
| 125,000 | | JobsOhio Beverage Sys Stwd Lien Liquor Profits Revenue Refunding Bonds, Series 2020A, 2.268%, due 1/01/28 | 117,550 |
| | | | 384,291 |
| Oklahoma - 0.05% | |
| 10,000 | | Garfield County, OK Educational Facs Authority, 6.000%, due 9/01/24 | 10,000 |
| | | | |
| Oregon - 0.78% | |
| 150,000 | | Philomath, Oregon Sch District Series A, 5.472%, due 6/15/27 | 153,776 |
| | | | |
| Pennsylvania - 1.44% | |
| 200,000 | | East-Norriton-Plymouth-Whitpain Joint Sewer Authority, 1.832%, due 8/01/28 | 183,656 |
| 100,000 | | Pennsylvania Higher Educational Facs Authority Revenue Series AZ, 3.000%, due 6/15/25 | 98,746 |
| | | | 282,402 |
| Texas - 0.78% | |
| 43,000 | | North Texas Tollway Authority Series B-1, 8.410%, due 2/01/30 | 46,194 |
| 105,000 | | Somerset Hills Road District #4 Texas, 5.125%, 8/15/34 | 106,237 |
| | | | 152,431 |
| Washington - 0.73% | |
| 150,000 | | City of Bellevue, WA Series B, 0.751%, due 12/01/25 | 142,938 |
| | | | |
| TOTAL FOR MUNICIPAL BONDS (Cost $3,215,871) - 16.19% | 3,178,453 |
| | | | |
| PREFERRED SECURITIES - 3.73% | |
| | | | |
| Asset Management - 0.18% | |
| 3,000 | | B Riley Financial, Inc., 6.50%, due 09/30/26 | 34,710 |
| | | | |
| National Commercial Banks - 2.52% | |
| 100,000 | | BAC Capital Trust XIII Series F, 6.00083%, to 10/11/24 (3-month SOFR + 0.66161%) (b) *** | 83,398 |
| 100,000 | | Key Corp. Capital I, 6.33317%, due 7/01/28 (3-month SOFR + 1.00161%) *** | 95,637 |
| 200,000 | | Mellon Capital IV Series 1, 6.17018%, to 10/28/24 (3-Month SOFR + 0.82661%) (b) *** | 171,925 |
| 150,000 | | PNC Capital Trust C, 6.17769%, due 6/01/28 (3-Month SOFR + 0.83161) *** | 144,430 |
| | | | 495,390 |
| State Commercial Banks - 1.03% | |
| 4,000 | | Medallion Bank Utah Series F, 8.000%, to 4/01/25 (a) (b) | 99,425 |
| 4,000 | | Merchants Bancorp, Inc., 8.250%, to 10/01/27 (a) (b) | 102,840 |
| | | | 202,265 |
| | | | |
| TOTAL FOR PREFERRED SECURITIES (Cost $811,260) - 3.73% | 732,365 |
| | | | |
| STRUCTURED NOTES - 1.47% (c) | |
| | | | |
| Security Brokers, Dealers & Flotation Companies - 1.47% | |
| 100,000 | | Goldman Sachs Group, Inc. Series MTN, due 12/13/28, 0.000%, Capped at 10% *** | 80,195 |
| 120,000 | | Goldman Sachs Group, Inc., 0.000%, due 11/13/28, Capped at 10% *** | 94,512 |
| 114,000 | | Morgan Stanley, Series MTN, 0.000%, due 8/19/28, Capped at 10% *** | 92,681 |
| 25,000 | | Morgan Stanley, Series MTN, 0.000%, due 8/30/28, Capped at 12% *** | 20,385 |
| | | | 287,773 |
| | | | |
| TOTAL FOR STRUCTURED NOTES (Cost $351,737) - 1.47% | 287,773 |
| | | | |
| U.S. GOVERNMENT AGENCIES & OBLIGATIONS- 11.70% (c) | |
| 500,000 | | U.S. Government Treasury Bill, 0.000%, due 9/03/24 | 500,000 |
| 550,000 | | U.S. Government Treasury Note/Bond, 4.625%, due 2/28/25 | 549,583 |
| 500,000 | | U.S. Government Treasury Note/Bond, 3.875%, due 3/31/25 | 497,687 |
| 750,000 | | U.S. Government Treasury Note/Bond, 3.875%, due 8/15/33 | 748,682 |
| TOTAL FOR U.S. GOVERNMENT AGENCIES & OBLIGATIONS (Cost $2,256,201) - 11.70% | 2,295,952 |
| | | | |
| MONEY MARKET FUND - 10.16% | |
| 1,993,750 | | Federated Treasury Obligation Fund - Institutional Shares 5.13% ** (Cost $1,993,750) - 10.16% | 1,993,750 |
| | | | |
| TOTAL INVESTMENTS (Cost $19,807,610) - 99.13% | 19,454,747 |
| | | | |
| OTHER ASSETS LESS LIABILITIES, NET - 0.87% | 171,126 |
| | | | |
| NET ASSETS - 100.00% | $ 9,625,873 |
| | | | |
| (a) Security converts to floating rate after the indicated fixed-rate coupon period. | |
| (b) Perpetual security. Perpetual securities have no stated maturity date, but they may be called/redeemed by the issuer. | |
| (c) All Corporate Bonds, Municipal Bonds, Structured Notes, and U.S. Government Agencies & Obligations are | |
| categorized as Level 2 of the fair value hierarchy. Refer to Note 3 of the accompanying notes to the financial statements for additional information. |
| ** Variable rate security; the coupon rate shown represents the yield at August 31, 2024. | |
| *** Variable Rate Security - Interest rate shown is rate in effect at August 31, 2024. | |
| + Default Bonds | |
| For securities based on a published reference rate and spread, the reference rate and spread are indicated in the description above. | |
| SOFR- Secured Overnight Financial Rate, a benchmark interest rate for dollar-denominated derivatives and loans. | |
| 3-month is the period where it is a fixed period of 3 months a lender will lend at that cost. | |
| The accompanying notes are an integral part of these financial statements. | |
| | | | |
| | | ARCHER STOCK FUND | |
| | | SCHEDULE OF INVESTMENTS | |
| | | August 31, 2024 | |
| | | | |
| Shares/Principal | Fair Value |
| | | | |
| COMMON STOCKS - 93.76% | |
| | | | |
| Aircraft - 1.82% | |
| 2,640 | | Boeing Co. * | $ 458,674 |
| | | | |
| Aircraft Engines & Engine Parts - 1.96% | |
| 4,000 | | RTX Corp. | 493,360 |
| | | | |
| Beverages - 2.01% | |
| 7,000 | | The Coca-Cola Company | 507,290 |
| | | | |
| Electric Services - 4.39% | |
| 2,000 | | American Electric Power Company, Inc. | 200,560 |
| 11,260 | | NextEra Energy, Inc. | 906,543 |
| | | | 1,107,103 |
| Electronic Computers - 3.37% | |
| 3,714 | | Apple, Inc. | 850,506 |
| | | | |
| Fire, Marine & Casualty Insurance - 2.61% | |
| 1,385 | | Berkshire Hathaway, Inc. Class B * | 659,149 |
| | | | |
| Hospital & Medical Service Plans - 4.96% | |
| 9,200 | | Centene Corp. * | 725,236 |
| 890 | | UnitedHealth Group, Inc. | 525,278 |
| | | | 1,250,514 |
| Industrial Inorganic Chemicals - 2.68% | |
| 1,413 | | Linde PLC. (United Kingdom) | 675,767 |
| | | | |
| Industrial Instruments for Measurement, Display & Control - 1.47% | |
| 3,110 | | MKS Instruments, Inc. | 370,805 |
| | | | |
| Measuring & Controlling Devices - 2.95% | |
| 1,212 | | Thermo Fisher Scientific, Inc. | 745,465 |
| | | | |
| National Commercial Banks - 4.88% | |
| 12,000 | | Bank of America Corp. | 489,000 |
| 3,300 | | JPMorgan Chase & Co. | 741,840 |
| | | | 1,230,840 |
| Petroleum Refining - 2.21% | |
| 4,735 | | Exxon Mobil Corp. | 558,446 |
| | | | |
| Pharmaceutical Preparations - 7.26% | |
| 720 | | Eli Lilly & Co. | 691,215 |
| 3,400 | | Johnson & Johnson | 563,924 |
| 4,860 | | Merck & Co., Inc. | 575,667 |
| | | | 1,830,806 |
| Railroads, Line-Haul Operating - 2.13% | |
| 2,100 | | Union Pacific Corp. Class B | 537,789 |
| | | | |
| Retail - Catalog & Mail-Order Houses - 2.43% | |
| 3,440 | | Amazon.com, Inc. * | 614,040 |
| | | | |
| Retail - Drug Stores and Proprietary Stores - 2.07% | |
| 9,140 | | CVS Health Corp. | 523,174 |
| | | | |
| Retail - Lumber & Other Building Materials Dealers - 2.15% | |
| 1,470 | | Home Depot, Inc. | 541,695 |
| | | | |
| Retail - Retail Stores - 1.37% | |
| 980 | | Ulta Beauty, Inc. * | 345,783 |
| | | | |
| Semiconductors & Related Devices - 8.10% | |
| 3,370 | | Advanced Micro Devices, Inc. * | 500,647 |
| 9,800 | | NVIDIA Corp. | 1,169,826 |
| 3,410 | | Skyworks Solutions, Inc. | 373,702 |
| | | | 2,044,175 |
| Services - Business Services - 3.29% | |
| 1,425 | | Fiserv, Inc. * | 248,805 |
| 2,100 | | Visa, Inc. Class A | 580,377 |
| | | | 829,182 |
| Services - Computer Programming, Data Processing, Etc. - 7.95% | |
| 5,544 | | Alphabet, Inc. Class A | 905,779 |
| 2,110 | | Meta Platforms, Inc. Class A | 1,099,964 |
| | | | 2,005,743 |
| Services - Equipment Rental & Leasing - 2.88% | |
| 980 | | United Rentals, Inc. | 726,435 |
| | | | |
| Services - Medical Laboratories - 2.06% | |
| 2,260 | | Laboratory Corp. of America Holdings | 519,551 |
| | | | |
| Services - Miscellaneous Health & Allied Services - 2.81% | |
| 2,200 | | ICON PLC. (Ireland) * | 708,532 |
| | | | |
| Services - Miscellaneous Amusement & Recreation - 1.64% | |
| 4,590 | | Walt Disney Co. | 414,844 |
| | | | |
| Services - Prepackaged Software - 7.76% | |
| 1,057 | | Adobe, Inc. * | 607,151 |
| 5,870 | | Cloudflare, Inc. Class A * | 482,162 |
| 2,080 | | Microsoft Corp. | 867,651 |
| | | | 1,956,964 |
| Soap, Detergent, Cleaning Preparations, Perfumes, Cosmetics - 2.09% | |
| 3,068 | | Procter & Gamble Co. | 526,285 |
| | | | |
| Surgical & Medical Instruments & Apparatus - 2.46% | |
| 1,720 | | Stryker Corp. | 619,922 |
| | | | |
| TOTAL FOR COMMON STOCKS (Cost $10,922,615) - 93.76% | 23,652,839 |
| | | | |
| REAL ESTATE INVESTMENT TRUST - 1.63% | |
| 1,840 | | American Tower Corp. | 412,270 |
| TOTAL FOR REAL ESTATE INVESTMENT TRUST (Cost $300,523) - 1.63% | 412,270 |
| | | | |
| MONEY MARKET FUND - 4.38% | |
| 1,104,215 | | Federated Treasury Obligation Fund - Institutional Shares 5.13% ** (Cost $1,104,215) - 4.38% | 1,104,215 |
| | | | |
| TOTAL INVESTMENTS (Cost $12,327,353) - 99.77% | 25,169,324 |
| | | | |
| OTHER ASSETS LESS LIABILITIES, NET - 0.23% | 57,842 |
| | | | |
| NET ASSETS - 100.00% | $ 25,227,166 |
| | | | |
| * Non-income producing security during period. | |
| ** Variable rate security; the coupon rate shown represents the yield at August 31, 2024. | |
| The accompanying notes are an integral part of these financial statements. | |
| | | | |
| | | ARCHER FOCUS FUND | |
| | | SCHEDULE OF INVESTMENTS | |
| | | August 31, 2024 | |
| | | | |
| Shares/Principal | Fair Value |
| | | | |
| COMMON STOCKS - 90.61% | |
| | | | |
| Arrangement of Transportation of Freight & Cargo - 2.46% | |
| 2,225 | | Expeditors International of Washington, Inc. | $ 274,587 |
| | | | |
| Beverages - 2.06% | |
| 1,332 | | PepsiCo, Inc. | 230,276 |
| | | | |
| Computer Communications Equipment - 1.55% | |
| 3,417 | | Cisco Systems, Inc. | 172,695 |
| | | | |
| Crude Petroleum & Natural Gas - 2.45% | |
| 9,580 | | APA Corp. | 272,934 |
| | | | |
| Electrical Work - 2.53% | |
| 717 | | EMCOR Group, Inc. | 281,824 |
| | | | |
| Electric & Other Services Combined - 2.49% | |
| 2,731 | | Consolidated Edison, Inc. | 277,360 |
| | | | |
| Electronic Computers - 1.96% | |
| 500 | | Super Micro Computer, Inc. * | 218,850 |
| | | | |
| Fire, Marine & Casualty Insurance - 4.33% | |
| 1,520 | | American Financial Group, Inc. | 203,102 |
| 2,477 | | Arch Capital Group Ltd. (Bermuda) * | 280,124 |
| | | | 483,226 |
| Gas & Other Services Combined - 2.21% | |
| 3,005 | | Sempra | 246,951 |
| | | | |
| Guided Missiles & Space Vehicles & Parts - 2.53% | |
| 496 | | Lockheed Martin Corp. | 281,778 |
| | | | |
| Hospital & Medical Service Plans - 2.33% | |
| 441 | | UnitedHealth Group, Inc. | 260,278 |
| | | | |
| Household Appliances - 2.53% | |
| 3,365 | | Smith A.O. Corp. | 281,718 |
| | | | |
| Laboratory Analytical Instruments - 2.49% | |
| 1,940 | | Agilent Technologies, Inc. | 277,265 |
| | | | |
| Natural Gas Distribution - 2.72% | |
| 2,320 | | Atmos Energy Corp. | 303,317 |
| | | | |
| Oil & Gas Field Services - 2.38% | |
| 6,040 | | Schlumberger Ltd. | 265,700 |
| | | | |
| Operative Builders - 2.79% | |
| 2,362 | | PulteGroup, Inc. | 310,957 |
| | | | |
| Paints, Varnishes, Lacquers, Enamels & Allied Prods - 2.50% | |
| 2,148 | | PPG Industries, Inc. | 278,660 |
| | | | |
| Paperboard Containers & Boxes - 2.51% | |
| 1,335 | | Packaging Corp of America | 279,736 |
| | | | |
| Petroleum Refining - 1.99% | |
| 1,955 | | ConocoPhillips | 222,459 |
| | | | |
| Pharmaceutical Preparations - 4.52% | |
| 1,310 | | Johnson & Johnson | 217,277 |
| 790 | | United Therapeutics Corp. * | 287,204 |
| | | | 504,481 |
| Retail-Home Furniture, Furnishings & Equipment Stores - 2.43% | |
| 2,015 | | Williams-Sonoma, Inc. | 270,675 |
| | | | |
| Retail - Radio TV & Consumer Electronics Stores - 2.74% | |
| 3,048 | | Best Buy Co., Inc. | 306,019 |
| | | | |
| Retail - Variety Stores - 3.80% | |
| 475 | | Costco Wholesale Corp. | 423,880 |
| | | | |
| Security Brokers, Dealers & Flotation Companies - 2.05% | |
| 2,157 | | T. Rowe Price Group, Inc. | 228,728 |
| | | | |
| Semiconductors & Related Devices - 3.42% | |
| 3,200 | | NVIDIA Corp. | 381,984 |
| | | | |
| Services - Advertising Agencies - 3.16% | |
| 4,450 | | Interpublic Group of Cos., Inc. | 145,115 |
| 2,070 | | Omnicom Group, Inc. | 207,890 |
| | | | 353,005 |
| Services-Business Services - 2.47% | |
| 805 | | Accenture PLC. Class A (Ireland) | 275,270 |
| | | | |
| Services - Computer Programming, Data Processing, Etc. - 7.22% | |
| 2,170 | | Alphabet, Inc. Class A | 354,535 |
| 865 | | Meta Platforms, Inc. Class A | 450,933 |
| | | | 805,468 |
| Services-Prepackaged Software - 4.99% | |
| 485 | | Adobe, Inc. * | 278,589 |
| 1,830 | | Electronic Arts, Inc. | 277,831 |
| | | | 556,420 |
| Sugar & Confectionery Products - 1.74% | |
| 1,003 | | Hershey Co. | 193,639 |
| | | | |
| Surgical & Medical Instruments & Apparatus - 2.77% | |
| 1,135 | | RESMED, Inc. | 278,098 |
| 485 | | Solventum Corp. * | 31,093 |
| | | | 309,191 |
| Wholesale-Metals Service Centers & Offices - 2.49% | |
| 970 | | Reliance, Inc. | 278,051 |
| | | | |
| TOTAL FOR COMMON STOCKS (Cost $8,814,392) - 90.61% | 10,107,382 |
| | | | |
| REAL ESTATE INVESTMENT TRUSTS - 7.93% | |
| 1,680 | | Avalonbay Communities, Inc. | 379,227 |
| 3,723 | | Equity Residential | 278,778 |
| 660 | | Public Storage | 226,855 |
| TOTAL FOR REAL ESTATE INVESTMENT TRUSTS (Cost $742,108) - 7.93% | 884,860 |
| | | | |
| MONEY MARKET FUND - 1.39% | |
| 154,941 | | Morgan Stanley Institutional Liquidity Treasury Portfolio - Institutional Class - 5.11% ** (Cost $154,941) - 1.39% | 154,941 |
| | | | |
| TOTAL INVESTMENTS (Cost $9,711,441) - 99.93% | 11,147,183 |
| | | | |
| OTHER ASSETS LESS LIABILITIES, NET - 0.07% | 7,688 |
| | | | |
| NET ASSETS - 100.00% | $ 11,154,871 |
| | | | |
| * Non-income producing security during period. | |
| ** Variable rate security; the coupon rate shown represents the yield at August 31, 2024. | |
| The accompanying notes are an integral part of these financial statements. | |
| | | | |
| | | ARCHER MULTI CAP FUND | |
| | | SCHEDULE OF INVESTMENTS | |
| | | August 31, 2024 | |
| | | | |
| Shares/Principal | Fair Value |
| | | | |
| COMMON STOCKS - 91.60% | |
| | | | |
| Abrasive, Asbestos & Miscellaneous Nonmetallic Mineral Products - 1.21% | |
| 560 | | Owens Corning | $ 94,489 |
| | | | |
| Air Conditioning & Warm Air Heating Equipment & Commercial & Industrial Refrigerator Equipment - 3.32% | |
| 1,575 | | AAON, Inc. | 150,428 |
| 185 | | Lennox International, Inc. | 109,185 |
| | | | 259,613 |
| Air Transportation, Scheduled - 0.98% | |
| 2,130 | | Alaska Air Group | 76,914 |
| | | | |
| Biological Products (No Diagnostic Substances) - 1.19% | |
| 730 | | Neurocrine Biosciences, Inc. * | 92,753 |
| | | | |
| Chemicals & Allied Products - 1.25% | |
| 551 | | Balchem Corp. | 97,544 |
| | | | |
| Construction Special Trade Contractors - 1.21% | |
| 240 | | TopBuild Corp. * | 94,325 |
| | | | |
| Crude Petroleum & Natural Gas - 1.13% | |
| 1,930 | | SM Energy Co. | 88,066 |
| | | | |
| Electric Services - 1.38% | |
| 1,260 | | Vistra Corp. | 107,642 |
| | | | |
| Electronic Computers - 1.68% | |
| 461 | | Apple, Inc. | 105,569 |
| 60 | | Super Micro Computer, Inc. * | 26,262 |
| | | | 131,831 |
| Fabricated Rubber Products - 1.57% | |
| 290 | | Carlisle Cos., Inc. | 122,902 |
| | | | |
| Fire, Marine & Casualty Insurance - 1.42% | |
| 234 | | Berkshire Hathaway, Inc. Class B * | 111,365 |
| | | | |
| Hospital & Medical Service Plans - 1.57% | |
| 208 | | UnitedHealth Group, Inc. | 122,762 |
| | | | |
| Metalworking Machinery & Equipment - 2.76% | |
| 380 | | Lincoln Electric Holdings, Inc. | 73,572 |
| 875 | | SPX Technologies, Inc. * | 142,747 |
| | | | 216,319 |
| Motor Vehicles & Passenger Car Bodies - 2.83% | |
| 1,580 | | Federal Signal Corp. | 149,294 |
| 337 | | Tesla, Inc. * | 72,155 |
| | | | 221,449 |
| National Commercial Banks - 1.51% | |
| 527 | | JPMorgan Chase & Co. | 118,470 |
| | | | |
| Operative Builders - 1.71% | |
| 675 | | Meritage Homes Corp. | 133,697 |
| | | | |
| Paints, Varnishes, Lacquers, Enamels, & Allied Products - 1.08% | |
| 725 | | RPM International, Inc. | 84,281 |
| | | | |
| Perfumes, Cosmetics & Other Toilet Preparations - 1.19% | |
| 620 | | e.l.f. Beauty, Inc. * | 92,870 |
| | | | |
| Petroleum Refining - 2.37% | |
| 555 | | Chevron Corp. | 82,112 |
| 878 | | Exxon Mobil Corp. | 103,551 |
| | | | 185,663 |
| Pharmaceutical Preparations - 8.24% | |
| 735 | | AbbVie, Inc. | 144,288 |
| 4,500 | | Alkermes PLC (Ireland) * | 128,025 |
| 1,040 | | Cytokinetics, Inc. * | 59,363 |
| 144 | | Eli Lilly & Co. | 138,243 |
| 539 | | Johnson & Johnson | 89,399 |
| 725 | | Merck & Co., Inc. | 85,876 |
| | | | 645,194 |
| Pumps & Pumping Equipment - 1.01% | |
| 948 | | Graco, Inc. | 79,016 |
| | | | |
| Retail - Auto Dealers & Gasoline Stations - 1.11% | |
| 355 | | Asbury Automotive Group, Inc. * | 87,202 |
| | | | |
| Retail - Catalog & Mail-Order Houses - 1.27% | |
| 558 | | Amazon.com, Inc. * | 99,603 |
| | | | |
| Retail - Department Stores - 1.95% | |
| 570 | | Burlington Stores, Inc. * | 152,897 |
| | | | |
| Retail - Family Clothing Stores - 3.21% | |
| 1,010 | | Abercrombie & Fitch Co. Class A * | 149,046 |
| 470 | | Insight Enterprises, Inc. * | 102,023 |
| | | | 251,069 |
| Retail - Home Furniture, Furnishings & Equipment Stores - 1.03% | |
| 600 | | Williams-Sonoma, Inc. | 80,598 |
| | | | |
| Retail - Jewelry Stores - 0.81% | |
| 750 | | Signet Jewelers Ltd. (Bermuda) | 63,075 |
| | | | |
| Retail - Lumber & Other Building Materials Dealers - 2.45% | |
| 740 | | Floor & Décor Holdings, Inc. Class A * | 83,206 |
| 295 | | Home Depot, Inc. | 108,707 |
| | | | 191,913 |
| Retail - Miscellaneous Shopping Goods Stores - 0.99% | |
| 1,400 | | Academy Sports & Outdoors, Inc. | 77,672 |
| | | | |
| Retail - Variety Stores - 1.81% | |
| 125 | | Costco Wholesale Corp. | 111,547 |
| 400 | | Five Below, Inc. * | 30,172 |
| | | | 141,719 |
| Rolling Drawing & Extruding of Nonferrous Metals - 2.04% | |
| 2,200 | | Mueller Industries, Inc. | 159,962 |
| | | | |
| Rubber & Plastics Footwear - 1.65% | |
| 135 | | Deckers Outdoor Corp. * | 129,504 |
| | | | |
| Semiconductors & Related Devices - 3.94% | |
| 850 | | Broadcom, Inc. | 138,397 |
| 1,220 | | NVIDIA Corp. | 145,631 |
| 990 | | SolarEdge Technologies, Inc. (Israel) * | 24,087 |
| | | | 308,115 |
| Services - Business Services - 2.16% | |
| 165 | | MasterCard, Inc. Class A | 79,751 |
| 322 | | Visa, Inc. Class A | 88,991 |
| | | | 168,742 |
| Services - Computer Integrated Systems Design - 1.68% | |
| 785 | | GoDaddy, Inc. Class A * | 131,417 |
| | | | |
| Services - Computer Programming, Data Processing - 5.12% | |
| 701 | | Alphabet, Inc. Class A | 114,529 |
| 694 | | Alphabet, Inc. Class C | 114,586 |
| 2,360 | | DoubleVerify Holdings, Inc. * | 46,492 |
| 240 | | Meta Platforms, Inc. Class A | 125,114 |
| | | | 400,721 |
| Services - Engineering Services - 1.15% | |
| 900 | | Aecom | 90,126 |
| | | | |
| Services - Prepackaged Software - 6.43% | |
| 140 | | Adobe, Inc. * | 80,417 |
| 1,525 | | Dynatrace, Inc. * | 77,196 |
| 385 | | Manhattan Associates, Inc. * | 101,806 |
| 225 | | Microsoft Corp. | 93,856 |
| 315 | | Salesforce.com, Inc. | 79,664 |
| 353 | | SPS Commerce, Inc. * | 70,508 |
| | | | 503,447 |
| Services - Skilled Nursing Care Facilities - 1.68% | |
| 871 | | Ensign Group, Inc. | 131,835 |
| | | | |
| Soap, Detergent, Cleaning Preparations, Perfumes, Cosmetics - 1.24% | |
| 566 | | Procter & Gamble Co. | 97,092 |
| | | | |
| Steel Pipe & Tubes - 1.54% | |
| 1,880 | | Ati, Inc. * | 120,094 |
| | | | |
| Telephone & Telegraph Apparatus - 1.53% | |
| 490 | | Fabrinet (Thailand) * | 119,389 |
| | | | |
| Totalizing Fluid Meters & Counting Devices - 1.43% | |
| 540 | | Badger Meter, Inc. | 111,748 |
| | | | |
| Wholesale - Hardware & Plumbing & Heating Equipment & Supplies - 1.19% | |
| 195 | | Watsco, Inc. | 92,707 |
| | | | |
| Wholesale - Lumber & Other Construction Materials - 1.12% | |
| 645 | | Boise Cascade Co. | 87,475 |
| | | | |
| Wholesale - Machinery, Equipment & Supplies - 1.31% | |
| 500 | | Applied Industrial Technologies, Inc. | 102,560 |
| | | | |
| Wholesale - Metals Service Centers & Offices - 1.15% | |
| 315 | | Reliance, Inc. | 90,295 |
| | | | |
| TOTAL FOR COMMON STOCKS (Cost $5,442,467) - 91.60% | 7,168,142 |
| | | | |
| REAL ESTATE INVESTMENT TRUSTS - 5.03% | |
| 1,680 | | Equity Lifestyle Properties, Inc. | 122,153 |
| 1,690 | | Gaming & Leisure Properties, Inc. | 87,914 |
| 2,100 | | Rexford Industrials Realty, Inc. | 106,932 |
| 1,280 | | W.P. Carey, Inc. | 76,825 |
| TOTAL FOR REAL ESTATE INVESTMENT TRUSTS (Cost $418,227) - 5.03% | 393,824 |
| | | | |
| MONEY MARKET FUND - 2.94% | |
| 229,821 | | Morgan Stanley Institutional Liquidity Treasury Portfolio - Institutional Class - 5.11% ** (Cost $229,821) - 2.94% | 229,821 |
| | | | |
| TOTAL INVESTMENTS (Cost $6,090,515) - 99.57% | 7,791,787 |
| | | | |
| OTHER ASSETS LESS LIABILITIES, NET - 0.43% | 33,838 |
| | | | |
| NET ASSETS - 100.00% | $ 7,825,625 |
| | | | |
| | | | |
| * Non-income producing security during period. | |
| ** Variable rate security; the coupon rate shown represents the yield at August 31, 2024. | |
| The accompanying notes are an integral part of these financial statements. | |
| | | | | | | | |
| ARCHER FUNDS |
| STATEMENTS OF ASSETS & LIABILITIES |
| August 31, 2024 |
| | | | | | | | |
| | | Balanced | Income | Stock | Dividend | Focus | Multi Cap |
| Assets: | | Fund | Fund | Fund | Growth Fund | Fund | Fund |
| Investments in Securities, at Fair Value (Cost $30,870,892, | $ 50,549,322 | $ 19,454,747 | $ 25,169,324 | $ 23,409,343 | $ 11,147,183 | $ 7,791,787 |
| $19,807,610, $12,327,353, $17,160,178, $9,711,441, and | | | | | | |
| $6,090,515, respectively) | | | | | | |
| Cash | | 2,500 | - | - | - | - | - |
| Receivables: | | | | | | |
| Shareholder Subscriptions | 19,041 | 3,976 | 41,364 | 30,020 | - | 33,364 |
| Interest | 113,643 | 180,633 | 6,249 | 4,906 | 1,441 | 1,300 |
| Dividend | 81,643 | - | 33,201 | 90,039 | 14,557 | 4,257 |
| Due from Advisor | - | - | - | - | - | 1,560 |
| Prepaid Expenses | 16,766 | 9,871 | 10,126 | 17,402 | 5,580 | 6,369 |
| Total Assets | 50,782,915 | 19,649,227 | 25,260,264 | 23,551,710 | 11,168,761 | 7,838,637 |
| Liabilities: | | | | | | | |
| Payables: | | | | | | | |
| Shareholder Redemptions | 1,133 | 288 | 32 | - | - | - |
| Due to Advisor | 36,829 | 7,409 | 18,215 | 18,641 | 50 | - |
| Due to Compliance Officer | 374 | 143 | 186 | 164 | - | 57 |
| Due to Trustees | 1,740 | 599 | 895 | 727 | 308 | 228 |
| Due to Transfer Agent | 3,835 | 2,525 | 2,525 | 2,532 | 2,525 | 1,768 |
| Accrued Expenses | 14,274 | 12,390 | 11,245 | 11,157 | 11,007 | 10,959 |
| Total Liabilities | 58,185 | 23,354 | 33,098 | 33,221 | 13,890 | 13,012 |
| Net Assets | | $ 50,724,730 | $ 19,625,873 | $ 25,227,166 | $ 23,518,489 | $ 11,154,871 | $ 7,825,625 |
| | | | | | | | |
| Net Assets Consist of: | | | | | | |
| Paid In Capital | $ 29,516,689 | $ 20,393,610 | $ 10,677,589 | $ 18,009,365 | $ 8,671,637 | $ 5,838,632 |
| Distributable Earnings (Deficit) | 21,208,041 | (767,737) | 14,549,577 | 5,509,124 | 2,483,234 | 1,986,993 |
| Net Assets (unlimited shares authorized; 2,813,790, 1,083,446, | | | | | | |
| 333,486, 872,353, 411,541, and 539,057 shares outstanding, respectively) | $ 50,724,730 | $ 19,625,873 | $ 25,227,166 | $ 23,518,489 | $ 11,154,871 | $ 7,825,625 |
| Net Asset Value and Offering Price Per Share | $ 18.03 | $ 18.11 | $ 75.65 | $ 26.96 | $ 27.11 | $ 14.52 |
| | | | | | | | |
| Redemption Price Per Share ($18.03 x 0.99), | | | | | | |
| ($18.11 x 0.99), ($75.65 x 0.99), ($26.96 x 0.99), ($27.11 x 0.99), & | | | | | | |
| ($14.37 x 0.99), respectively * | $ 17.85 | $ 17.93 | $ 74.89 | $ 26.69 | $ 26.83 | $ 14.37 |
| | | | | | | | |
| | | | | | | | |
| *The Funds will deduct a 1.00% redemption fee from redemption proceeds if purchased and redeemed within 90 days. | | | | | |
| The accompanying notes are an integral part of these financial statements. | | | | | | |
| | | | | | | |
| | | | | | | | | |
| ARCHER FUNDS |
| STATEMENTS OF OPERATIONS |
| FOR THE YEAR ENDED AUGUST 31, 2024 |
| | | | | | | | | |
| | | | | | | | | |
| | | | | | | | | |
| Investment Income: | Balanced Fund | Income Fund | | Stock Fund | Dividend Growth Fund | Focus Fund | Multi Cap Fund |
| Dividends (net of foreign withholding taxes of $10,557, $0, $0, $3,380, $0, and $0, respectively) | $ 730,107 | $ 31,890 | | $ 269,509 | $ 784,041 | $ 230,591 | $ 67,323 |
| Interest | | 438,918 | 810,924 | | 36,254 | 30,272 | 18,560 | 12,150 |
| Total Investment Income | 1,169,025 | 842,814 | | 305,763 | 814,313 | 249,151 | 79,473 |
| | | | | | | | | |
| Expenses: | | | | | | | | |
| Advisory Fees (a) | 232,807 | 86,372 | | 113,197 | 101,542 | 48,963 | 33,245 |
| Administrative (a) | 232,716 | 86,372 | | 113,197 | 101,542 | 48,963 | 33,635 |
| Transfer Agent | 45,633 | 30,300 | | 30,300 | 30,320 | 28,011 | 18,685 |
| Registration | 22,831 | 21,956 | | 21,186 | 22,519 | 11,736 | 11,578 |
| Legal | | 21,495 | 8,212 | | 9,541 | 7,065 | 4,514 | 2,794 |
| Audit | | 10,850 | 10,669 | | 10,850 | 10,850 | 10,850 | 10,850 |
| Compliance Officer Fees | 4,534 | 1,501 | | 2,203 | 1,976 | 879 | 649 |
| Custody | | 7,582 | 3,409 | | 3,926 | 3,606 | 3,295 | 3,260 |
| Trustee | | 6,072 | 2,240 | | 2,942 | 2,559 | 1,267 | 888 |
| Miscellaneous | 13,715 | 15,590 | (b) | 3,060 | 2,987 | 2,121 | 1,662 |
| Insurance | 3,665 | 1,377 | | 1,693 | 1,605 | 708 | 464 |
| Printing and Mailing | 3,413 | 1,772 | | 1,903 | 1,807 | 908 | 451 |
| Total Expenses | 605,313 | 269,770 | | 313,998 | 288,378 | 162,215 | 118,161 |
| Fees Waived and/or Reimbursed by the Advisor (a) | | (46,577) | (103,936) | | (35,533) | (89,355) | (66,247) | (54,996) |
| Net Expenses | 558,736 | 165,834 | | 278,465 | 199,023 | 95,968 | 63,165 |
| | | | | | | | | |
| Net Investment Income | 610,289 | 676,980 | | 27,298 | 615,290 | 153,183 | 16,308 |
| | | | | | | | | |
| Realized and Unrealized Gain on Investments: | | | | | | | |
| Net Realized Gain on Investments | 1,727,156 | 22,836 | | 2,223,904 | 399,334 | 1,203,911 | 773,649 |
| Net Change in Unrealized Appreciation on Derivatives | 13,005 | 19,913 | | - | - | - | - |
| Net Change in Unrealized Appreciation on Investments | 4,596,296 | 492,884 | | 2,867,816 | 2,712,761 | 907,454 | 836,592 |
| Net Realized and Unrealized Gain on Investments | 6,336,457 | 535,633 | | 5,091,720 | 3,112,095 | 2,111,365 | 1,610,241 |
| | | | | | | | | |
| Net Increase in Net Assets Resulting from Operations | $ 6,946,746 | $ 1,212,613 | | $ 5,119,018 | $ 3,727,385 | $2,264,548 | $ 1,626,549 |
| | | | | | | | | |
| (a) See Note 5 in the Notes to the Financial Statements. | | | | | | | |
| (b) The Miscellaneous Expenses include Bond Pricing Services of $11,156. | | | | | | | |
| The accompanying notes are an integral part of these financial statements. | | | | | | | |
| | | | | |
| ARCHER BALANCED FUND |
| STATEMENTS OF CHANGES IN NET ASSETS |
| | | | | |
| | | | | |
| | | | | |
| | | | | |
| | | Year Ended | | Year Ended |
| | | 8/31/2024 | | 8/31/2023 |
| Increase (Decrease) in Net Assets From Operations: | | | |
| Net Investment Income | $ 610,289 | | $ 549,307 |
| Net Realized Gain (Loss) on Investments | 1,727,156 | | (276,151) |
| Net Change in Unrealized Appreciation on Derivatives & Investments | 4,609,301 | | 3,392,337 |
| Net Increase in Net Assets Resulting from Operations | 6,946,746 | | 3,665,493 |
| | | | | |
| Distributions to Shareholders: | | | |
| Distributions | (626,363) | | (1,427,953) |
| Total Distributions | (626,363) | | (1,427,953) |
| | | | | |
| Capital Share Transactions: | | | |
| Proceeds from Sale of Shares | 5,313,178 | | 4,614,883 |
| Shares Issued on Reinvestment of Dividends | 512,789 | | 1,191,003 |
| Early Redemption Fees (Note 2) | 902 | | 743 |
| Cost of Shares Redeemed | (6,873,114) | | (6,808,166) |
| Net Decrease from Capital Share Transactions | (1,046,245) | | (1,001,537) |
| | | | | |
| Net Assets: | | | | |
| Net Increase in Net Assets | 5,274,138 | | 1,236,003 |
| Beginning of Year | 45,450,592 | | 44,214,589 |
| End of Year | $ 50,724,730 | | $ 45,450,592 |
| | | | | |
| Share Transactions: | | | |
| Shares Sold | 317,296 | | 309,266 |
| Shares Issued on Reinvestment of Dividends | 31,022 | | 81,278 |
| Shares Redeemed | (419,511) | | (456,626) |
| Net Decrease in Shares | (71,193) | | (66,082) |
| Outstanding at Beginning of Year | 2,884,983 | | 2,951,065 |
| Outstanding at End of Year | 2,813,790 | | 2,884,983 |
| | | | | |
| | | | | |
| The accompanying notes are an integral part of these financial statements. | | | |
| | | | | |
| ARCHER INCOME FUND |
| STATEMENTS OF CHANGES IN NET ASSETS |
| | | | | |
| | | | | |
| | | | | |
| | | | | |
| | | Year Ended | | Year Ended |
| | | 8/31/2024 | | 8/31/2023 |
| Increase (Decrease) in Net Assets From Operations: | | | |
| Net Investment Income | $ 676,980 | | $ 449,796 |
| Net Realized Gain (Loss) on Investments | 22,836 | | (32,121) |
| Net Change in Unrealized Appreciation (Depreciation) on Derivatives & Investments | 512,797 | | (175,203) |
| Net Increase in Net Assets Resulting from Operations | 1,212,613 | | 242,472 |
| | | | | |
| Distributions to Shareholders: | | | |
| Distributions | (687,398) | | (443,852) |
| Total Distributions | (687,398) | | (443,852) |
| | | | | |
| Capital Share Transactions: | | | |
| Proceeds from Sale of Shares | 4,745,770 | | 9,397,072 |
| Shares Issued on Reinvestment of Dividends | 444,926 | | 332,472 |
| Early Redemption Fees (Note 2) | 564 | | 2,990 |
| Cost of Shares Redeemed | (3,164,824) | | (1,888,031) |
| Net Increase from Capital Share Transactions | 2,026,436 | | 7,844,503 |
| | | | | |
| Net Assets: | | | | |
| Net Increase in Net Assets | 2,551,651 | | 7,643,123 |
| Beginning of Year | 17,074,222 | | 9,431,099 |
| End of Year | $ 19,625,873 | | $ 17,074,222 |
| | | | | |
| Share Transactions: | | | |
| Shares Sold | 264,825 | | 535,924 |
| Shares Issued on Reinvestment of Dividends | 25,010 | | 18,880 |
| Shares Redeemed | (178,326) | | (107,190) |
| Net Increase in Shares | 111,509 | | 447,614 |
| Outstanding at Beginning of Year | 971,937 | | 524,323 |
| Outstanding at End of Year | 1,083,446 | | 971,937 |
| | | | | |
| | | | | |
| The accompanying notes are an integral part of these financial statements. | | | |
| | | | | |
| ARCHER STOCK FUND |
| STATEMENTS OF CHANGES IN NET ASSETS |
| | | | | |
| | | | | |
| | | | | |
| | | | | |
| | | Year Ended | | Year Ended |
| | | 8/31/2024 | | 8/31/2023 |
| Increase in Net Assets From Operations: | | | |
| Net Investment Income | $ 27,298 | | $ 29,970 |
| Net Realized Gain on Investments | 2,223,904 | | 806,100 |
| Net Change in Unrealized Appreciation on Investments | 2,867,816 | | 2,141,545 |
| Net Increase in Net Assets Resulting from Operations | 5,119,018 | | 2,977,615 |
| | | | | |
| Distributions to Shareholders: | | | |
| Distributions | (1,362,233) | | (608,695) |
| Total Distributions | (1,362,233) | | (608,695) |
| | | | | |
| Capital Share Transactions: | | | |
| Proceeds from Sale of Shares | 3,007,767 | | 2,585,110 |
| Shares Issued on Reinvestment of Dividends | 1,117,613 | | 488,552 |
| Early Redemption Fees (Note 2) | 134 | | 427 |
| Cost of Shares Redeemed | (3,548,007) | | (6,667,577) |
| Net Increase (Decrease) from Capital Share Transactions | 577,507 | | (3,593,488) |
| | | | | |
| Net Assets: | | | | |
| Net Increase (Decrease) in Net Assets | 4,334,292 | | (1,224,568) |
| Beginning of Year | 20,892,874 | | 22,117,442 |
| End of Year | $ 25,227,166 | | $ 20,892,874 |
| | | | | |
| Share Transactions: | | | |
| Shares Sold | 43,239 | | 44,451 |
| Shares Issued on Reinvestment of Dividends | 17,223 | | 8,832 |
| Shares Redeemed | (51,214) | | (116,354) |
| Net Increase (Decrease) in Shares | 9,248 | | (63,071) |
| Outstanding at Beginning of Year | 324,238 | | 387,309 |
| Outstanding at End of Year | 333,486 | | 324,238 |
| | | | | |
| | | | | |
| The accompanying notes are an integral part of these financial statements. | | | |
| | | | | | |
| ARCHER DIVIDEND GROWTH FUND |
| STATEMENTS OF CHANGES IN NET ASSETS |
| | | | | | |
| | | | | | |
| | | | | | |
| | | | | | |
| | | Year Ended | | Year Ended | |
| | | 8/31/2024 | | 8/31/2023 | |
| Increase (Decrease) in Net Assets From Operations: | | | | |
| Net Investment Income | $ 615,290 | | $ 705,111 | |
| Net Realized Gain on Investments | 399,334 | | 42,232 | |
| Net Change in Unrealized Appreciation (Depreciation) on Investments | 2,712,761 | | (962,472) | |
| Net Increase (Decrease) in Net Assets Resulting from Operations | 3,727,385 | | (215,129) | |
| | | | | | |
| Distributions to Shareholders: | | | | |
| Distributions | (617,317) | | (653,470) | |
| Total Distributions | (617,317) | | (653,470) | |
| | | | | | |
| Capital Share Transactions: | | | | |
| Proceeds from Sale of Shares | 3,227,946 | | 3,214,330 | |
| Shares Issued on Reinvestment of Dividends | 496,269 | | 522,363 | |
| Early Redemption Fees (Note 2) | 332 | | 499 | |
| Cost of Shares Redeemed | (2,676,832) | | (8,053,146) | |
| Net Increase (Decrease) from Capital Share Transactions | 1,047,715 | | (4,315,954) | |
| | | | | | |
| Net Assets: | | | | | |
| Net Increase (Decrease) in Net Assets | 4,157,783 | | (5,184,553) | |
| Beginning of Year | 19,360,706 | | 24,545,259 | |
| End of Year | $ 23,518,489 | | $ 19,360,706 | |
| | | | | | |
| Share Transactions: | | | | |
| Shares Sold | 130,893 | | 135,105 | |
| Shares Issued on Reinvestment of Dividends | 20,566 | | 21,973 | |
| Shares Redeemed | (110,857) | | (342,589) | |
| Net Increase (Decrease) in Shares | 40,602 | | (185,511) | |
| Outstanding at Beginning of Year | 831,751 | | 1,017,262 | |
| Outstanding at End of Year | 872,353 | | 831,751 | |
| | | | | | |
| | | | | | |
| The accompanying notes are an integral part of these financial statements. | | | | |
| | | | | | |
| ARCHER FOCUS FUND | |
| STATEMENTS OF CHANGES IN NET ASSETS | |
| | | | | | |
| | | | | | |
| | | | | | |
| | | | | | |
| | | Year Ended | | Year Ended | |
| | | 8/31/2024 | | 8/31/2023 | |
| Increase (Decrease) in Net Assets From Operations: | | | | |
| Net Investment Income | $ 153,183 | | $ 123,399 | |
| Net Realized Gain (Loss) on Investments | 1,203,911 | | (251,814) | |
| Net Change in Unrealized Appreciation on Investments | 907,454 | | 678,341 | |
| Net Increase in Net Assets Resulting from Operations | 2,264,548 | | 549,926 | |
| | | | | | |
| Distributions to Shareholders: | | | | |
| Distributions | (82,045) | | (280,419) | |
| Total Distributions | (82,045) | | (280,419) | |
| | | | | | |
| Capital Share Transactions: | | | | |
| Proceeds from Sale of Shares | 1,069,149 | | 6,232,642 | |
| Shares Issued on Reinvestment of Dividends | 56,046 | | 241,254 | |
| Early Redemption Fees (Note 2) | 1,576 | | 1,056 | |
| Cost of Shares Redeemed | (1,182,848) | | (1,154,434) | |
| Net Increase (Decrease) from Capital Share Transactions | (56,077) | | 5,320,518 | |
| | | | | | |
| Net Assets: | | | | | |
| Net Increase in Net Assets | 2,126,426 | | 5,590,025 | |
| Beginning of Year | 9,028,445 | | 3,438,420 | |
| End of Year | $ 11,154,871 | | $ 9,028,445 | |
| | | | | | |
| Share Transactions: | | | | |
| Shares Sold | 45,269 | | 295,813 | |
| Shares Issued on Reinvestment of Dividends | 2,544 | | 11,714 | |
| Shares Redeemed | (50,242) | | (53,361) | |
| Net Increase (Decrease) in Shares | (2,429) | | 254,166 | |
| Outstanding at Beginning of Year | 413,970 | | 159,804 | |
| Outstanding at End of Year | 411,541 | | 413,970 | |
| | | | | | |
| | | | | | |
| The accompanying notes are an integral part of these financial statements. | | | | |
| | | | | | | |
| | | | | | |
| ARCHER MULTI CAP FUND |
| STATEMENTS OF CHANGES IN NET ASSETS |
| | | | | | |
| | | | | | |
| | | | | | |
| | | | | | |
| | | Year Ended | | Year Ended | |
| | | 8/31/2024 | | 8/31/2023 | |
| Increase (Decrease) in Net Assets From Operations: | | | | |
| Net Investment Income | $ 16,308 | | $ 24,436 | |
| Net Realized Gain (Loss) on Investments | 773,649 | | (490,625) | |
| Net Change in Unrealized Appreciation on Investments | 836,592 | | 1,152,600 | |
| Net Increase in Net Assets Resulting from Operations | 1,626,549 | | 686,411 | |
| | | | | | |
| Distributions to Shareholders: | | | | |
| Distributions | (15,143) | | (331,933) | |
| Total Distributions | (15,143) | | (331,933) | |
| | | | | | |
| Capital Share Transactions: | | | | |
| Proceeds from Sale of Shares | 797,462 | | 1,556,728 | |
| Shares Issued on Reinvestment of Dividends | 14,192 | | 312,973 | |
| Early Redemption Fees (Note 2) | - | | 14 | |
| Cost of Shares Redeemed | (340,192) | | (743,016) | |
| Net Increase from Capital Share Transactions | 471,462 | | 1,126,699 | |
| | | | | | |
| Net Assets: | | | | | |
| Net Increase in Net Assets | 2,082,868 | | 1,481,177 | |
| Beginning of Year | 5,742,757 | | 4,261,580 | |
| End of Year | $ 7,825,625 | | $ 5,742,757 | |
| | | | | | |
| Share Transactions: | | | | |
| Shares Sold | 61,359 | | 151,296 | |
| Shares Issued on Reinvestment of Dividends | 1,175 | | 31,473 | |
| Shares Redeemed | (26,234) | | (68,608) | |
| Net Increase in Shares | 36,300 | | 114,161 | |
| Outstanding at Beginning of Year | 502,757 | | 388,596 | |
| Outstanding at End of Year | 539,057 | | 502,757 | |
| | | | | | |
| | | | | | |
| The accompanying notes are an integral part of these financial statements. | | | | |
| | | | | | | | |
| ARCHER BALANCED FUND |
| FINANCIAL HIGHLIGHTS |
| SELECTED DATA FOR A SHARE OUTSTANDING THROUGHOUT THE YEAR. |
| | | | | | | | |
| | | | | | | | |
| | | | | | | | |
| | | Years Ended |
| | | 8/31/2024 | | 8/31/2023 | 8/31/2022 | 8/31/2021 | 8/31/2020 |
| | | | | | | | |
| Net Asset Value, at Beginning of Year | $ 15.75 | | $ 14.98 | $ 16.54 | $ 13.96 | $ 13.45 |
| | | | | | | | |
| Income (Loss) From Investment Operations: | | | | | | |
| Net Investment Income * | 0.22 | | 0.19 | 0.17 | 0.16 | 0.21 |
| Net Gain (Loss) on Securities (Realized and Unrealized) | 2.28 | | 1.07 | (1.42) | 2.59 | 0.55 |
| Total from Investment Operations | 2.50 | | 1.26 | (1.25) | 2.75 | 0.76 |
| | | | | | | | |
| Distributions: | | | | | | | |
| Net Investment Income | (0.22) | | (0.19) | (0.15) | (0.17) | (0.21) |
| Realized Gains | - | ** | (0.30) | (0.16) | - | (0.04) |
| Total from Distributions | (0.22) | | (0.49) | (0.31) | (0.17) | (0.25) |
| | | | | | | | |
| Proceeds from Redemption Fees ** | - | | - | - | - | - |
| | | | | | | | |
| Net Asset Value, at End of Year | $ 18.03 | | $ 15.75 | $ 14.98 | $ 16.54 | $ 13.96 |
| | | | | | | | |
| Total Return *** | 16.03% | | 8.72% | (7.70)% | 19.82% | 5.79% |
| | | | | | | | |
| Ratios/Supplemental Data: | | | | | | |
| Net Assets at End of Year (Thousands) | $ 50,725 | | $ 45,451 | $ 44,215 | $ 51,011 | $ 41,621 |
| Before Waivers and Reimbursements | | | | | | |
| Ratio of Expenses to Average Net Assets | 1.30% | | 1.31% | 1.30% | 1.27% | 1.36% |
| Ratio of Net Investment Income to Average Net Assets | 1.21% | | 1.15% | 0.94% | 0.98% | 1.38% |
| After Waivers and Reimbursements | | | | | | |
| Ratio of Expenses to Average Net Assets | 1.20% | | 1.20% | 1.20% | 1.20% | 1.20% |
| Ratio of Net Investment Income to Average Net Assets | 1.31% | | 1.26% | 1.04% | 1.05% | 1.55% |
| Portfolio Turnover | 11.69% | | 1.79% | 6.35% | 17.23% | 25.35% |
| | | | | | | | |
| * Per share net investment income (loss) has been determined on the basis of average shares outstanding during the period. | | | |
| ** Amount less than $0.005 per share. | | | | | | |
| *** Total return in the above table represents the rate that the investor would have earned or lost on an investment in the Fund assuming | | |
| reinvestment of dividends. | | | | | | |
| The accompanying notes are an integral part of these financial statements. | | | | | | |
| | | | | | | |
| ARCHER INCOME FUND |
| FINANCIAL HIGHLIGHTS |
| SELECTED DATA FOR A SHARE OUTSTANDING THROUGHOUT THE YEAR. |
| | | | | | | |
| | | | | | | |
| | | | | | | |
| | | Years Ended |
| | | 8/31/2024 | 8/31/2023 | 8/31/2022 | 8/31/2021 | 8/31/2020 |
| | | | | | | |
| Net Asset Value, at Beginning of Year | $ 17.57 | $ 17.99 | $ 19.76 | $ 19.51 | $ 19.47 |
| | | | | | | |
| Income (Loss) From Investment Operations: | | | | | |
| Net Investment Income * | 0.70 | 0.62 | 0.47 | 0.51 | 0.51 |
| Net Gain (Loss) on Securities (Realized and Unrealized) | 0.55 | (0.45) | (1.77) | 0.26 | 0.05 |
| Total from Investment Operations | 1.25 | 0.17 | (1.30) | 0.77 | 0.56 |
| | | | | | | |
| Distributions: | | | | | | |
| Net Investment Income | (0.71) | (0.59) | (0.47) | (0.52) | (0.52) |
| Total from Distributions | (0.71) | (0.59) | (0.47) | (0.52) | (0.52) |
| | | | | | | |
| Proceeds from Redemption Fees ** | - | - | - | - | - |
| | | | | | | |
| Net Asset Value, at End of Year | $ 18.11 | $ 17.57 | $ 17.99 | $ 19.76 | $ 19.51 |
| | | | | | | |
| Total Return *** | 7.25% | 0.99% | (6.66)% | 3.97% | 2.93% |
| | | | | | | |
| Ratios/Supplemental Data: | | | | | |
| Net Assets at End of Year (Thousands) | $ 19,626 | $ 17,074 | $ 9,431 | $ 11,309 | $ 11,715 |
| Before Waivers and Reimbursements | | | | | |
| Ratio of Expenses to Average Net Assets | 1.56% | 1.66% | 1.83% | 1.73% | 1.71% |
| Ratio of Net Investment Income to Average Net Assets | 3.32% | 2.81% | 1.60% | 1.84% | 1.91% |
| After Waivers and Reimbursements | | | | | |
| Ratio of Expenses to Average Net Assets | 0.96% | 0.96% | 0.96% | 0.96% | 0.96% |
| Ratio of Net Investment Income to Average Net Assets | 3.92% | 3.52% | 2.47% | 2.61% | 2.67% |
| Portfolio Turnover | 23.30% | 16.24% | 14.52% | 29.76% | 20.48% |
| | | | | | | |
| * Per share net investment income (loss) has been determined on the basis of average shares outstanding during the period. | | | |
| ** Amount less than $0.005 per share. | | | | | |
| *** Total return in the above table represents the rate that the investor would have earned or lost on an investment in the Fund assuming | | |
| reinvestment of dividends. | | | | | |
| The accompanying notes are an integral part of these financial statements. | | | | | |
| | | | | | | |
| | | | | | | |
| ARCHER STOCK FUND |
| FINANCIAL HIGHLIGHTS |
| SELECTED DATA FOR A SHARE OUTSTANDING THROUGHOUT THE YEAR. |
| | | | | | | |
| | | | | | | |
| | | | | | | |
| | | Years Ended |
| | | 8/31/2024 | 8/31/2023 | 8/31/2022 | 8/31/2021 | 8/31/2020 |
| | | | | | | |
| Net Asset Value, at Beginning of Year | $ 64.44 | $ 57.11 | $ 71.62 | $ 54.69 | $ 45.90 |
| | | | | | | |
| Income (Loss) From Investment Operations: | | | | | |
| Net Investment Income (Loss) * | 0.08 | 0.08 | (0.09) | (0.15) | 0.10 |
| Net Gain (Loss) on Securities (Realized and Unrealized) | 15.46 | 8.89 | (11.58) | 17.09 | 11.03 |
| Total from Investment Operations | 15.54 | 8.97 | (11.67) | 16.94 | 11.13 |
| | | | | | | |
| Distributions: | | | | | | |
| Net Investment Income | (0.04) | (0.05) | - | (0.01) | (0.15) |
| Realized Gains | | (4.29) | (1.59) | (2.84) | - | (2.19) |
| Total from Distributions | (4.33) | (1.64) | (2.84) | (0.01) | (2.34) |
| | | | | | | |
| Proceeds from Redemption Fees ** | - | - | - | - | - |
| | | | | | | |
| Net Asset Value, at End of Year | $ 75.65 | $ 64.44 | $ 57.11 | $ 71.62 | $ 54.69 |
| | | | | | | |
| Total Return *** | 25.24% | 16.17% | (17.09)% | 30.97% | 24.99% |
| | | | | | | |
| Ratios/Supplemental Data: | | | | | |
| Net Assets at End of Year (Thousands) | $ 5,227 | $ 0,893 | $ 2,117 | $ 7,990 | $ 1,889 |
| Before Waivers and Reimbursements | | | | | |
| Ratio of Expenses to Average Net Assets | 1.39% | 1.44% | 1.38% | 1.38% | 1.46% |
| Ratio of Net Investment Loss to Average Net Assets | (0.04)% | (0.07)% | (0.29)% | (0.40)% | (0.02)% |
| After Waivers and Reimbursements | | | | | |
| Ratio of Expenses to Average Net Assets | 1.23% | 1.23% | 1.23% | 1.23% | 1.23% |
| Ratio of Net Investment Income (Loss) to Average Net Assets | 0.12% | 0.14% | (0.14)% | (0.24)% | 0.22% |
| Portfolio Turnover | 8.56% | 6.58% | 8.04% | 14.90% | 22.05% |
| | | | | | | |
| * Per share net investment income (loss) has been determined on the basis of average shares outstanding during the period. | | |
| ** Amount less than $0.005 per share. | | | | | |
| *** Total return in the above table represents the rate that the investor would have earned or lost on an investment in the Fund assuming | |
| reinvestment of dividends. | | | | | |
| The accompanying notes are an integral part of these financial statements. | | | | | |
| | | | | | | |
| | | | | | | |
| ARCHER DIVIDEND GROWTH FUND |
| FINANCIAL HIGHLIGHTS |
| SELECTED DATA FOR A SHARE OUTSTANDING THROUGHOUT THE YEAR. |
| | | | | | | |
| | | | | | | |
| | | | | | | |
| | | Years Ended |
| | | 8/31/2024 | 8/31/2023 | 8/31/2022 | 8/31/2021 | 8/31/2020 |
| | | | | | | |
| Net Asset Value, at Beginning of Year | $ 23.28 | $ 24.13 | $ 4.02 | $ 18.99 | $ 21.36 |
| | | | | | | |
| Income (Loss) From Investment Operations: | | | | | |
| Net Investment Income * | 0.73 | 0.75 | 0.58 | 0.53 | 0.69 |
| Net Gain (Loss) on Securities (Realized and Unrealized) | 3.69 | (0.89) | 0.03 | 5.02 | (2.35) |
| Total from Investment Operations | 4.42 | (0.14) | 0.61 | 5.55 | (1.66) |
| | | | | | | |
| Distributions: | | | | | | |
| Net Investment Income | (0.74) | (0.71) | (0.50) | (0.52) | (0.71) |
| Total from Distributions | (0.74) | (0.71) | (0.50) | (0.52) | (0.71) |
| | | | | | | |
| Proceeds from Redemption Fees ** | - | - | - | - | - |
| | | | | | | |
| Net Asset Value, at End of Year | $ 26.96 | $ 23.28 | $ 24.13 | $ 24.02 | $ 18.99 |
| | | | | | | |
| Total Return *** | 19.39% | (0.59)% | 2.51% | 29.56% | (7.87)% |
| | | | | | | |
| Ratios/Supplemental Data: | | | | | |
| Net Assets at End of Year (Thousands) | $ 3,518 | $ 19,361 | $ 24,545 | $ 3,596 | $ 7,504 |
| Before Waivers and Reimbursements | | | | | |
| Ratio of Expenses to Average Net Assets | 1.42% | 1.43% | 1.38% | 1.44% | 1.49% |
| Ratio of Net Investment Income to Average Net Assets | 2.59% | 2.71% | 1.94% | 2.02% | 2.90% |
| After Waivers and Reimbursements | | | | | |
| Ratio of Expenses to Average Net Assets | 0.98% | 0.98% | 0.98% | 0.98% | 0.98% |
| Ratio of Net Investment Income to Average Net Assets | 3.03% | 3.15% | 2.34% | 2.47% | 3.40% |
| Portfolio Turnover | 14.03% | 10.37% | 18.05% | 25.30% | 37.00% |
| | | | | | | |
| * Per share net investment income has been determined on the basis of average shares outstanding during the period. | | | | |
| ** Amount less than $0.005 per share. | | | | | |
| *** Total return in the above table represents the rate that the investor would have earned or lost on an investment in the Fund assuming reinvestment of dividends. | | | |
| | | | | | |
| The accompanying notes are an integral part of these financial statements. | | | | | |
| | | | | | | |
| | | | | | | | |
| ARCHER FOCUS FUND | |
| FINANCIAL HIGHLIGHTS | |
| SELECTED DATA FOR A SHARE OUTSTANDING THROUGHOUT THE PERIOD/YEAR. | |
| | | | | | | | |
| | | | | | | | |
| | | | | | | | |
| | | Years Ended | Period Ended | |
| | | 8/31/2024 | 8/31/2023 | 8/31/2022 | 8/31/2021 | 8/31/2020 | + |
| | | | | | | | |
| Net Asset Value, at Beginning of Period/Year | $ 21.81 | $ 21.51 | $ 25.41 | $ 20.67 | $ 20.00 | |
| | | | | | | | |
| Income (Loss) From Investment Operations: | | | | | | |
| Net Investment Income * | 0.37 | 0.44 | 0.34 | 0.15 | 0.12 | |
| Net Gain (Loss) on Securities (Realized and Unrealized) | 5.13 | 1.23 | (1.82) | 4.69 | 0.65 | |
| Total from Investment Operations | 5.50 | 1.67 | (1.48) | 4.84 | 0.77 | |
| | | | | | | | |
| Distributions: | | | | | | | |
| Net Investment Income | (0.20) | (0.40) | (0.29) | (0.10) | (0.10) | |
| Realized Gains | | - | (0.97) | (2.13) | - | - | |
| Total from Distributions | (0.20) | (1.37) | (2.42) | (0.10) | (0.10) | |
| | | | | | | | |
| Proceeds from Redemption Fees ** | - | - | - | - | - | |
| | | | | | | | |
| Net Asset Value, at End of Period/Year | $ 27.11 | $ 21.81 | $ 21.51 | $ 25.41 | $ 20.67 | |
| | | | | | | | |
| Total Return *** | 25.42% | 8.25% | (6.67)% | 23.46% | 3.96% | (b) |
| | | | | | | | |
| Ratios/Supplemental Data: | | | | | | |
| Net Assets at End of Period/Year (Thousands) | $ 11,155 | $ 9,028 | $ 3,438 | $ 3,691 | $ 1,964 | |
| Before Waivers and Reimbursements | | | | | | |
| Ratio of Expenses to Average Net Assets | 1.66% | 1.77% | 2.61% | 3.28% | 4.68% | (a) |
| Ratio of Net Investment Income (Loss) to Average Net Assets | 0.89% | 1.24% | (0.17)% | (1.51)% | (2.46)% | (a) |
| After Waivers and Reimbursements | | | | | | |
| Ratio of Expenses to Average Net Assets | 0.98% | 0.98% | 0.98% | 1.12% | 1.20% | (a) |
| Ratio of Net Investment Income to Average Net Assets | 1.56% | 2.03% | 1.45% | 0.64% | 1.01% | (a) |
| Portfolio Turnover | 89.11% | 69.27% | 64.39% | 120.30% | 56.25% | (b) |
| | | | | | | | |
| * Per share net investment income has been determined on the basis of average shares outstanding during the period. | | | | | |
| ** Amount less than $0.005 per share. | | | | | | |
| *** Total return in the above table represents the rate that the investor would have earned or lost on an investment in the Fund assuming reinvestment of dividends. | | | | | |
| + For the period December 30, 2019 (commencement of investment operations) through August 31, 2020. | | | | | | |
| (a) Annualized | | | | | | |
| (b) Not annualized | | | | | | |
| The accompanying notes are an integral part of these financial statements. | | | | | | |
| | | | | | | | | |
| | | | | | | | | |
| ARCHER MULTI CAP FUND |
| FINANCIAL HIGHLIGHTS |
| SELECTED DATA FOR A SHARE OUTSTANDING THROUGHOUT THE PERIOD/YEAR. |
| | | | | | | | | |
| | | | | | | | | |
| | | | | | | | | |
| | | Years Ended | Period Ended | |
| | | 8/31/2024 | 8/31/2023 | 8/31/2022 | | 8/31/2021 | 8/31/2020 | + |
| | | | | | | | | |
| Net Asset Value, at Beginning of Period/Year | $ 11.42 | $ 10.97 | $ 13.50 | | $ 10.32 | $ 10.00 | |
| | | | | | | | | |
| Income (Loss) From Investment Operations: | | | | | | | |
| Net Investment Income (Loss) * | 0.03 | 0.05 | (0.02) | | (0.03) | 0.04 | |
| Net Gain (Loss) on Securities (Realized and Unrealized) | 3.10 | 1.13 | (2.29) | | 3.23 | 0.31 | |
| Total from Investment Operations | 3.13 | 1.18 | (2.31) | | 3.20 | 0.35 | |
| | | | | | | | | |
| Distributions: | | | | | | | | |
| Net Investment Income | (0.03) | (0.04) | - | ** | (0.02) | (0.03) | |
| Realized Gains | - | (0.69) | (0.22) | | - | - | |
| Total from Distributions | (0.03) | (0.73) | (0.22) | | (0.02) | (0.03) | |
| | | | | | | | | |
| Proceeds from Redemption Fees ** | - | - | - | | - | - | |
| | | | | | | | | |
| Net Asset Value, at End of Period/Year | $ 14.52 | $ 11.42 | $ 10.97 | | $ 13.50 | $ 10.32 | |
| | | | | | | | | |
| Total Return *** | 27.46% | 11.75% | (17.42)% | | 31.07% | 3.55% | (b) |
| | | | | | | | | |
| Ratios/Supplemental Data: | | | | | | | |
| Net Assets at End of Period/Year (Thousands) | $ 7,826 | $ 5,743 | $ 4,262 | | $ 4,856 | $ 2,274 | |
| Before Waivers and Reimbursements | | | | | | | |
| Ratio of Expenses to Average Net Assets | 1.78% | 1.88% | 1.98% | | 2.39% | 3.05% | (a) |
| Ratio of Net Investment Loss to Average Net Assets | (0.58)% | (0.46)% | (1.16)% | | (1.70)% | (1.51)% | (a) |
| After Waivers and Reimbursements | | | | | | | |
| Ratio of Expenses to Average Net Assets | 0.95% | 0.95% | 0.95% | | 0.95% | 0.95% | (a) |
| Ratio of Net Investment Income (Loss) to Average Net Assets | 0.25% | 0.47% | (0.13)% | | (0.26)% | 0.58% | (a) |
| Portfolio Turnover | 57.42% | 52.08% | 62.50% | | 39.02% | 39.09% | (b) |
| | | | | | | | | |
| * Per share net investment income has been determined on the basis of average shares outstanding during the period. | | | | | | | |
| ** Amount less than $0.005 per share. | | | | | | | |
| *** Total return in the above table represents the rate that the investor would have earned or lost on an investment in the Fund assuming reinvestment of dividends. | | | | | | | |
| + For the period December 30, 2019 (commencement of investment operations) through August 31, 2020. | | | | | | | |
| (a) Annualized | | | | | | | |
| (b) Not annualized | | | | | | | |
| The accompanying notes are an integral part of these financial statements. | | | | | | | |
Archer Funds
Notes to Financial Statements
August 31, 2024
NOTE 1. ORGANIZATION
The Archer Investment Series Trust, an Ohio business trust (the “Trust”), is an open-end investment management company established under the laws of Ohio by an Agreement and Declaration of Trust dated October 7, 2009 (the “Trust Agreement”). The Trust Agreement permits the Board of Trustees (the “Board”) to issue an unlimited number of shares of beneficial interest of separate series. The Trust currently consists of six funds: The Archer Balanced Fund (the “Balanced Fund”), the Archer Income Fund (the “Income Fund”), the Archer Stock Fund (the “Stock Fund”), the Archer Dividend Growth Fund (the “Dividend Growth Fund”), the Archer Focus Fund (the “Focus Fund), and the Archer Multi Cap Fund (the “Multi Cap Fund), each a diversified fund, (collectively referred to as the “Funds”).
The Balanced Fund commenced operations on September 27, 2005. The investment objective of the Balanced Fund is total return. Total return is comprised of both income and capital appreciation. The Income Fund and the Stock Fund each commenced investment operations on March 11, 2011. The investment objective of the Income Fund is income while secondarily striving for capital appreciation. The investment objective of the Stock Fund is capital appreciation. The Archer Dividend Growth Fund commenced operations on September 1, 2016. The investment objective of the Dividend Growth Fund is to provide income and, as a secondary focus, long-term capital appreciation. The Focus Fund and Multi Cap Fund each commenced operations on December 30, 2019. The investment objective of the Focus Fund is long-term growth of capital. The investment objective of the Multi Cap Fund is long-term growth of capital. The investment advisor to the Funds is Archer Investment Corporation, Inc. (the “Advisor”). See Note 5 for additional information regarding the Advisor.
NOTE 2. SIGNIFICANT ACCOUNTING POLICIES
The following is a summary of the significant accounting policies followed by the Funds in the preparation of their financial statements. The Funds are investment companies that follow the accounting and reporting guidance of Accounting Standards Codification Topic 946 applicable to investment companies.
Securities Valuation – All investments in securities are recorded at their estimated fair value as described in Note 3.
Federal Income Taxes- The Funds make no provision for federal income or excise tax. The Funds intend to qualify each year as “regulated investment companies” (“RIC”) under subchapter M of the Internal Revenue Code of 1986, as amended, by complying with the requirements applicable to RICs and by distributing substantially all of their taxable income. The Funds also intend to distribute sufficient net investment income and net capital gains, if any, so that they will not be subject to excise tax on undistributed income and gains. If the required amount of net investment income or gains is not distributed, the Funds could incur a tax expense. Therefore, no federal income tax or excise provision is required.
The Funds recognize the tax benefits of uncertain tax positions only when the position is more likely than not to be sustained, assuming examination by tax authorities. Management has analyzed the Funds’ tax positions and concluded that no liability for unrecognized tax benefits should be recorded related to uncertain tax positions taken on returns filed for open tax years (2021-2023) or expected to be taken in the Funds’ 2024 tax returns. The Funds identify their major tax jurisdiction as U.S. Federal, however the Funds are not aware of any tax positions for which it is reasonably possible that the total amounts of unrecognized tax benefits will change materially in the next 12 months.
The Funds recognize interest and penalties, if any, related to unrecognized tax benefits as income tax expense in the Statement of Operations. During the year ended August 31, 2024, the Funds did not incur any interest or penalties.
Security Transactions and Related Income - The Funds follow industry practice and record security transactions on the trade date. Realized gains and losses are computed using the specific cost of the security. Dividend income is recorded on the ex-dividend date and interest income is recorded on an accrual basis. Discounts and premiums on securities purchased are accreted or amortized using the straight line method. Withholding taxes on foreign dividends have been provided for in accordance with the Funds’ understanding of the applicable country’s tax rules and rates. Distributions received from certain investments held by the Funds may be comprised of dividends, realized gains and returns of capital. The amounts may subsequently be reclassified upon receipt of information from the issuer.
Dividends and Distributions – The Funds typically will distribute substantially all of their net investment income in the form of dividends and capital gains to its shareholders. The Balanced Fund will distribute dividends quarterly and capital gains annually, and expects that distributions will consist primarily of ordinary income. The Income and Dividend Growth Fund will distribute dividends monthly and capital gains annually, and expect that distributions will consist primarily of ordinary income. The Stock Fund, Focus Fund, and Multi Cap Fund may distribute dividends quarterly and capital gains annually, and expect that distributions will consist primarily of ordinary income. Distributions to shareholders, which are determined in accordance with income tax regulations, are recorded on the ex-dividend date. The treatment for financial reporting purposes of distributions made to shareholders during the year from net investment income or net realized capital gains may differ from their ultimate treatment for federal income tax purposes. These differences are caused primarily by differences in the timing of the recognition of certain components of income, expenses or realized capital gain for federal income tax purposes. Where such differences are permanent in nature, they are reclassified in the components of the net assets based on their ultimate characterization for federal income tax purposes. Any such reclassifications will have no effect on net assets, results of operations or net asset values per share of the Funds.
Redemption Fee - To discourage short-term trades by investors, the Funds will impose a redemption fee. The Funds will each impose a redemption fee of 1.00% of the total redemption amount (calculated at market value) if shares are redeemed within 90 calendar days of purchase. For the year ended August 31, 2024, the Balanced Fund, Income Fund, Stock Fund, Dividend Growth Fund, Focus Fund, and Multi Cap Fund collected $902, $564, $134, $332, $1,576, and $0 in redemption fees, respectively.
Options - The Balanced and Income Funds may sell covered call options as part of their investment programs to obtain market exposure or to manage risk or hedge against adverse market conditions. When a fund writes an option, an amount equal to the premium received by the fund is recorded as a liability and is subsequently adjusted to the current fair value of the option written. Premiums received from writing options that expire unexercised are treated by the fund on the expiration date as realized gains from investments. The difference between the premium and the amount paid on effecting a closing purchase transaction, including brokerage commissions, is also treated as a realized gain, or if the premium is less than the amount paid for the closing purchase transaction, as a realized loss.
If a call option is exercised, the premium is added to the proceeds from the sale of the underlying security or currency in determining whether the fund has realized a gain or loss. If a put option is exercised, the premium reduces the cost basis of the securities purchased by the fund. The fund, as writer of an option, bears the market risk of an unfavorable change in the price of the security underlying the written option. Neither the Balanced or Income Funds engaged in options activity during the fiscal year ended August 31, 2024.
Structured Notes – The Balanced Fund and Income Fund invest in structured notes which are subject to a number of fixed income risks including general market risk, interest rate risk, as well as the risk that the issuer on the note may fail to make interest and/ or principal payments when due, or may default on its obligations entirely. In addition, as a result of imbedded derivative features in these securities, structured notes generally are subject to more risk than investing in a simple note or bond issued by the same issuer. See Note 4 for additional information related to Structured Notes.
Expenses – Expenses incurred by the Trust that do not relate to a specific Fund of the Trust are allocated to the individual Funds based on each Fund’s relative net assets or other appropriate basis as determined by the Board.
Use of Estimates - The preparation of financial statements in conformity with generally accepted accounting principles requires management to make estimates and assumptions that affect the reported amounts of assets and liabilities and disclosure of contingent assets and liabilities at the date of the financial statements and the reported amounts of increases and decreases in net assets from operations during the reporting period. Actual results could differ from these estimates.
NOTE 3. SECURITIES VALUATION
Processes and Structure
The Funds’ Board of Trustees has adopted guidelines for valuing securities including in circumstances in which market quotes are not readily available and has delegated to the Adviser the responsibility for determining fair value prices, subject to review by the Board of Trustees.
In accordance with the Trust’s good faith pricing guidelines, the Advisor is required to consider all appropriate factors relevant to the value of securities for which it has determined other pricing sources are not available or reliable. No single standard exists for determining fair value, because fair value depends upon the circumstances of each individual case. As a general principle, the current fair value of an issue of securities being valued by the Advisor would appear to be the amount which the owner might reasonably expect to receive for them upon their current sale. Methods which are in accordance with this principle may, for example, be based on (i) a multiple of earnings; (ii) a discount from market of a similar freely traded security (including a derivative security or a basket of securities traded on other markets, exchanges or among dealers); or (iii) yield to maturity with respect to debt issues, or a combination of these and other methods. Good faith pricing is permitted if, in the Advisor’s opinion, the validity of market quotations appears to be questionable based on factors such as evidence of a thin market in the security based on a small number of quotations, a significant event occurs after the close of a market but before a Funds’ NAV calculation that may affect a security’s value, or the Advisor is aware of any other data that calls into question the reliability of market quotations. Good faith pricing may also be used in instances when the bonds the Funds invest in may default or otherwise cease to have market quotations readily available.
Hierarchy of Fair Value Inputs
The Funds utilize various methods to measure the fair value of most of their investments on a recurring basis. GAAP establishes a hierarchy that prioritizes inputs to valuation techniques used to measure fair value. The three levels of inputs are as follows:
| · | Level 1. Unadjusted quoted prices in active markets for identical assets or liabilities that the company has the ability to access. |
| · | Level 2. Observable inputs other than quoted prices included in level 1 that are observable for the asset or liability either directly or indirectly. These inputs may include quoted prices for the identical instrument on an inactive market, prices for similar instruments, interest rates, prepayment speeds, credit risk, yield curves, default rates, and similar data. |
| · | Level 3. Unobservable inputs for the asset or liability to the extent that relevant observable inputs are not available, representing the company's own assumptions about the assumptions that a market participant would use in valuing the asset or liability, and that would be based on the best information available. |
The availability of observable inputs can vary from security to security and is affected by a wide variety of factors, including, for example, the type of security, whether the security is new and not yet established in the marketplace, the liquidity of markets, and other characteristics particular to the security. To the extent that valuation is based on models or inputs that are less observable or unobservable in the market, the determination of fair value requires more judgment. Accordingly, the degree of judgment exercised in determining fair value is greatest for instruments categorized in level 3.
The inputs used to measure fair value may fall into different levels of the fair value hierarchy. In such cases, for disclosure purposes, the level in the fair value hierarchy within which the fair value measurement falls in its entirety is determined based on the lowest level input that is significant to the fair value measurement in its entirety.
Fair Value Measurements
A description of the valuation techniques applied to each Fund’s major categories of assets and liabilities measured at fair value on a recurring basis follows:
Equity securities (common and preferred stock, exchange traded fund/notes, real estate investment trusts). Securities traded on a national securities exchange (or reported on the NASDAQ national market) are stated at the last reported sales price on the day of valuation. To the extent these securities are actively traded, and valuation adjustments are not applied, they are categorized in level 1 of the fair value hierarchy. Certain foreign securities may be fair valued using a pricing service that considers the correlation of the trading patterns of the foreign security to the intraday trading in the U.S. markets for investments such as American Depositary Receipts, financial futures, Exchange Traded Funds, and the movement of the certain indexes of securities based on a statistical analysis of the historical relationship and that are categorized in level 2. Preferred stock and other equities traded on inactive markets or valued by reference to similar instruments are also categorized in level 2.
Fixed income securities (corporate bonds, municipal bonds, preferred bonds and structured notes). The fair value of fixed income securities is estimated using various techniques, which may consider recently executed transactions in securities of the issuer or comparable issuers, market price quotations (when observable), bond spreads, fundamental data relating to the issuer, and credit default swap spreads adjusted for any basis difference between cash and derivative instruments. Although most fixed income securities are categorized in level 2 of the fair value hierarchy, in instances when lower relative weight is placed on transaction prices, quotations, or similar observable inputs, they are categorized in level 3.
U.S. government agencies & obligations. U.S. government agencies & obligations are normally valued using a model that incorporates market observable data, such as reported sales of similar securities, broker quotes, yields, bids, offers, and reference data. Certain securities are valued principally using dealer quotations. U.S. government obligations are categorized in level 1 or level 2 of the fair value hierarchy, depending on the inputs used and market activity levels for specific securities.
Investments in open-end mutual funds including money market funds are valued at their closing net asset value each business day and are classified in Level 1 of the fair value hierarchy.
The following table summarizes the inputs used to value Balanced Fund’s assets measured at fair value as of August 31, 2024:
| BALANCED FUND | Financial Instruments—Assets |
| | | | | |
| Categories | Level 1 | Level 2 | Level 3 | Fair Value |
| Common Stocks * | $ 33,769,723 | $ - | $ - | $ 33,769,723 |
| Corporate Bonds * | - | 7,956,905 | - | 7,956,905 |
| Municipal Bonds | - | 2,012,577 | - | 2,012,577 |
| Real Estate Investment Trusts | 2,110,855 | - | - | 2,110,855 |
| Preferred Securities * | 238,670 | 269,526 | - | 508,196 |
| Structured Notes * | - | 175,914 | - | 175,914 |
| U.S. Government Agencies & Obligations | - | 748,682 | - | 748,682 |
| Money Market Fund | 3,266,470 | - | - | 3,266,470 |
| | $ 39,385,718 | $11,163,604 | $ - | $ 50,549,322 |
The following table summarizes the inputs used to value Income Fund’s assets measured at fair value as of August 31, 2024:
| INCOME FUND | Financial Instruments—Assets |
| | | | | |
| Categories | Level 1 | Level 2 | Level 3 | Fair Value |
| Corporate Bonds * | $ - | $ 10,144,994 | $ - | $10,144,994 |
| Exchange Traded Funds | 821,460 | - | - | 821,460 |
| Municipal Bonds | - | 3,178,453 | - | 3,178,453 |
| Preferred Securities * | 236,975 | 495,390 | - | 732,365 |
| Structured Notes * | - | 287,773 | - | 287,773 |
| U.S. Government Agencies & Obligations | - | 2,295,952 | - | 2,295,952 |
| Money Market Fund | 1,993,750 | - | - | 1,993,750 |
| | $ 3,052,185 | $ 16,402,562 | $ - | $19,454,747 |
The following table summarizes the inputs used to value Stock Fund’s assets measured at fair value as of August 31, 2024:
| STOCK FUND | Financial Instruments—Assets |
| | | | | |
| Categories | Level 1 | Level 2 | Level 3 | Fair Value |
| Common Stocks * | $ 23,652,839 | $ - | $ - | $ 23,652,839 |
| Real Estate Investment Trust | 412,270 | | | 412,270 |
| Money Market Fund | 1,104,215 | - | - | 1,104,215 |
| | $ 25,169,324 | $ - | $ - | $ 25,169,324 |
The following table summarizes the inputs used to value Dividend Growth Fund’s assets measured at fair value as of August 31, 2024:
| DIVIDEND GROWTH FUND | Financial Instruments—Assets |
| | | | | |
| Categories | Level 1 | Level 2 | Level 3 | Fair Value |
| Common Stocks * | $ 19,774,554 | $ - | $ - | $ 19,774,554 |
| Real Estate Investment Trusts | 2,401,958 | - | - | 2,401,958 |
| Money Market Fund | 1,232,831 | - | - | 1,232,831 |
| | $ 23,409,343 | $ - | $ - | $ 23,409,343 |
The following table summarizes the inputs used to value Focus Fund’s assets measured at fair value as of August 31, 2024:
| FOCUS FUND | Financial Instruments—Assets |
| | | | | |
| Categories | Level 1 | Level 2 | Level 3 | Fair Value |
| Common Stocks * | $ 10,107,382 | $ - | $ - | $ 10,107,382 |
| Real Estate Investment Trusts | 884,860 | - | - | 884,860 |
| Money Market Fund | 154,941 | - | - | 154,941 |
| | $ 11,147,183 | $ - | $ - | $ 11,147,183 |
The following table summarizes the inputs used to value Multi Cap Fund’s assets measured at fair value as of August 31, 2024:
| MULTI CAP FUND | Financial Instruments—Assets |
| | | | | |
| Categories | Level 1 | Level 2 | Level 3 | Fair Value |
| Common Stocks * | $ 7,168,142 | $ - | $ - | $ 7,168,142 |
| Real Estate Investment Trusts | 393,824 | - | - | 393,824 |
| Money Market Fund | 229,821 | - | - | 229,821 |
| | $ 7,791,787 | $ - | $ - | $ 7,791,787 |
*Industry classifications of these categories are detailed on each Fund’s Schedule of Investments.
The Funds did not hold any Level 3 assets during the year ended August 31, 2024; therefore a reconciliation of assets in which significant unobservable inputs were used in determining fair value is not applicable. There were no significant transfers into or out of Level 1 or Level 2 during the period. It is each Fund’s policy to recognize transfers into and out of Level 1 and Level 2 at the end of the reporting period.
NOTE 4. DERIVATIVE TRANSACTIONS
The Funds may use certain options (both traded on an exchange and over-the-counter), futures contracts and options on futures contracts (collectively, “Derivative Instruments”) as a substitute for a comparable market position in the underlying security, to attempt to hedge or limit the exposure of the Fund’s position, to create a synthetic money market position, for certain tax-related purposes and to effect closing transactions.
As of August 31, 2024, there were no options outstanding in any Fund. The Funds did not have any options transactions during the year ended August 31, 2024.
The location on the Statement of Assets and Liabilities of the Balanced and Income Funds’ derivative positions, which are not accounted for as hedging instruments under GAAP, is as follows:
Asset Derivatives
Investment in Securities, at Value
Structured Notes
Balanced Fund $ 175,914
Income Fund $ 287,773
Unrealized gains and losses on derivatives during the year ended August 31, 2024, for the Balanced and Income Funds, are included in the Statement of Operations, in the location, “Net Change in Unrealized Appreciation on Derivatives” as follows:
Balanced Fund $ 13,005 Income Fund $ 19,913
There were no realized gains or losses on sales of Structured Notes, included in the Statement of Operations, in the location, “Net Realized Gain on Investments” for the year ended August 31, 2024 for the Balanced and Income Funds, respectively.
NOTE 5. FEES AND OTHER TRANSACTIONS WITH AFFILIATES
The Advisor, under the terms of the management agreement (the “Agreement”), manages the Funds’ investments. As compensation for its management services, each Fund is obligated to pay the Advisor a fee computed and accrued daily and paid monthly at an annual rate of 0.50% of each Fund’s average daily net assets. For the year ended August 31, 2024, the Advisor accrued the following fees before the waivers and reimbursements described below:
| | Balanced Fund | Income Fund | Stock Fund | Dividend Growth Fund | Focus Fund | Multi Cap Fund |
| Advisor Fees Accrued | $ 232,807 | $ 86,372 | $ 113,197 | $ 101,542 | $ 48,963 | $ 33,245 |
At August 31, 2024, the following fees were due to the Advisor or due from the Advisor after Advisor waived fees and owed the fund for reimbursement of expenses:
| | Balanced Fund | Income Fund | Stock Fund | Dividend Growth Fund | Focus Fund | Multi Cap Fund |
| Due to Advisor | $ 15,819 | $ - | $ 7,664 | $ 8,958 | $ - | $ - |
| Due from Advisor | $ - | $ 717 | $ - | $ - | $ 4,552 | $ 4,774 |
The Advisor also performs administrative duties for the Funds including all regulatory reporting and necessary office equipment, personnel and facilities, in which the Advisor receives administrative fees. Administrative fees are paid according to the following schedule for each of the Funds: 0.50% on average net assets under $50 million, 0.07% on assets from $50 million up to $100 million, 0.05% on average net assets over $100 million up to $150 million, and 0.03% on assets over $150 million. The minimum monthly fee is $2,500. As of and for the years ended August 31, 2024, Administrative fees earned and payable to the Advisor were as follows:
| | Balanced Fund | Income Fund | Stock Fund | Dividend Growth Fund | Focus Fund | Multi Cap Fund |
| Administrative Fees Accrued | $ 232,716 | $ 86,372 | $ 113,197 | $ 101,542 | $ 48,963 | $ 33,635 |
| Administrative Fees Due | $ 21,010 | $ 8,126 | $ 10,551 | $ 9,683 | $ 4,602 | $ 3,214 |
Archer Balanced Fund
The Advisor has contractually agreed to waive its management fee and/or reimburse expenses through December 31, 2026 so that total annual operating expenses, excluding brokerage fees and commissions, 12b-1 fees, borrowing costs (such as interest and dividend expenses on securities sold short), taxes, extraordinary expenses, and any indirect expenses (such as expenses incurred by other investment companies in which the Balanced Fund invests) do not exceed 1.20% of the Balanced Fund’s average daily net assets. For the year ended August 31, 2024, the Advisor waived fees of $46,577. Pursuant to the Expense Limitation Agreement, if the Adviser so requests, any Fund Operating Expenses waived or reimbursed by the Adviser pursuant to the Agreement that had the effect of reducing Fund Operating Expenses to 1.20% within the most recent three years prior to recoupment shall be repaid to the Adviser by the Fund; provided, however, that such recoupment will not cause the Fund’s expense ratio, after recoupment has been taken into account, to exceed the lesser of the expense cap in effect at the time of the waiver or the expense cap in effect at the time of recoupment. Advisory fees waived and/or reimbursed expenses that may be subject to potential recoupment by the Advisor through August 31, 2027 totaled $142,436.
The amounts subject to repayment by the Balanced Fund, pursuant to the aforementioned conditions, at August 31, 2024 were as follows:
| | Subject to Repayment |
| Amount | by August 31, |
| $ 47,506 | 2025 |
| $ 48,353 | 2026 |
| $ 46,577 | 2027 |
Archer Income Fund
The Advisor has contractually agreed to waive its management fee and/or reimburse expenses through December 31, 2026 so that total annual operating expenses, excluding brokerage fees and commissions, 12b-1 fees, borrowing costs (such as interest and dividend expenses on securities sold short), taxes, extraordinary expenses, and any indirect expenses (such as expenses incurred by other investment companies in which the Income Fund invests) do not exceed 0.96% of the Income Fund’s average daily net assets. For the year ended August 31, 2024, the Advisor waived fees of $86,372 and reimbursed the Income Fund $17,564 in expenses. Pursuant to the Expense Limitation Agreement, if the Adviser so requests, any Fund Operating Expenses waived or reimbursed by the Adviser pursuant to the Agreement that had the effect of reducing Fund Operating Expenses to 0.96% within the most recent three years prior to recoupment shall be repaid to the Adviser by the Fund; provided, however, that such recoupment will not cause the Fund’s expense ratio, after recoupment has been taken into account, to exceed the lesser of the expense cap in effect at the time of the waiver or the expense cap in effect at the time of recoupment. Advisory fees waived and/or reimbursed expenses that may be subject to potential recoupment by the Advisor through August 31, 2027 totaled $282,491.
The amounts subject to repayment by the Income Fund, pursuant to the aforementioned conditions, at August 31, 2024 were as follows:
| | Subject to Repayment |
| Amount | by August 31, |
| $ 88,259 | 2025 |
| $ 90,296 | 2026 |
| $103,936 | 2027 |
Archer Stock Fund
The Advisor has contractually agreed to waive its management fee and/or reimburse expenses through December 31, 2026 so that total annual operating expenses, excluding brokerage fees and commissions, 12b-1 fees, borrowing costs (such as interest and dividend expenses on securities sold short), taxes, extraordinary expenses, and any indirect expenses (such as expenses incurred by other investment companies in which the Balanced Fund invests) do not exceed 1.23% of the Stock Fund’s average daily net assets. For the year ended August 31, 2024, the Advisor waived fees of $35,533. Pursuant to the Expense Limitation Agreement, if the Adviser so requests, any Fund Operating Expenses waived or reimbursed by the Adviser pursuant to the Agreement that had the effect of reducing Fund Operating Expenses to 1.23% within the most recent three years prior to recoupment shall be repaid to the Adviser by the Fund; provided, however, that such recoupment will not cause the Fund’s expense ratio, after recoupment has been taken into account, to exceed the lesser of the expense cap in effect at the time of the waiver or the expense cap in effect at the time of recoupment. Advisory fees waived and/or reimbursed expenses that may be subject to potential recoupment by the Advisor through August 31, 2027 totaled $116,607.
The amounts subject to repayment by the Stock Fund, pursuant to the aforementioned conditions, at August 31, 2024 were as follows:
| | Subject to Repayment |
| Amount | by August 31, |
| $ 37,281 | 2025 |
| $ 43,793 | 2026 |
| $ 35,533 | 2027 |
Archer Dividend Growth Fund
The Advisor has contractually agreed to waive its management fee and/or reimburse expenses through December 31, 2026 so that total annual operating expenses, excluding brokerage fees and commissions, 12b-1 fees, borrowing costs (such as interest and dividend expenses on securities sold short), taxes, extraordinary expenses, and any indirect expenses (such as expenses incurred by other investment companies in which the Dividend Growth Fund invests) do not exceed 0.98% of the Dividend Growth Fund’s average daily net assets. For the year ended August 31, 2024, the Advisor waived fees of $89,355. Pursuant to the Expense Limitation Agreement, if the Adviser so requests, any Fund Operating Expenses waived or reimbursed by the Adviser pursuant to the Agreement that had the effect of reducing Fund Operating Expenses to 0.98% within the most recent three years prior to recoupment shall be repaid to the Adviser by the Fund; provided, however, that such recoupment will not cause the Fund’s expense ratio, after recoupment has been taken into account, to exceed the lesser of the expense cap in effect at the time of the waiver or the expense cap in effect at the time of recoupment. Advisory fees waived and/or reimbursed expenses that may be subject to potential recoupment by the Advisor through August 31, 2027 totaled $287,453.
The amounts subject to repayment by the Dividend Growth Fund, pursuant to the aforementioned conditions, at August 31, 2024 were as follows:
| | Subject to Repayment |
| Amount | by August 31, |
| $ 98,432 | 2025 |
| $ 99,666 | 2026 |
| $ 89,355 | 2027 |
Archer Focus Fund
The Advisor has contractually agreed to waive its management fee and/or reimburse expenses through December 31, 2026 so that total annual operating expenses, excluding brokerage fees and commissions, 12b-1 fees, borrowing costs (such as interest and dividend expenses on securities sold short), taxes, extraordinary expenses, and any indirect expenses (such as expenses incurred by other investment companies in which the Focus Fund invests) do not exceed 0.98% of the Focus Fund’s average daily net assets. For the year ended August 31, 2024, the Advisor waived fees of $48,963 and reimbursed the Focus Fund $17,284 in expenses. Pursuant to the Expense Limitation Agreement, if the Adviser so requests, any Fund Operating Expenses waived or reimbursed by the Adviser pursuant to the Agreement that had the effect of reducing Fund Operating Expenses to 0.98% within the most recent three years prior to recoupment shall be repaid to the Adviser by the Fund; provided, however, that such recoupment will not cause the Fund’s expense ratio, after recoupment has been taken into account, to exceed the lesser of the expense cap in effect at the time of the waiver or the expense cap in effect at the time of recoupment. Advisory fees waived and/or reimbursed expenses that may be subject to potential recoupment by the Advisor through August 31, 2027 totaled $174,434.
The amounts subject to repayment by the Focus Fund, pursuant to the aforementioned conditions, at August 31, 2024 were as follows:
| | Subject to Repayment |
| Amount | by August 31, |
| $ 60,070 | 2025 |
| $ 48,117 | 2026 |
| $ 66,247 | 2027 |
Archer Multi Cap Fund
The Advisor has contractually agreed to waive its management fee and/or reimburse expenses through December 31, 2026 so that total annual operating expenses, excluding brokerage fees and commissions, 12b-1 fees, borrowing costs (such as interest and dividend expenses on securities sold short), taxes, extraordinary expenses, and any indirect expenses (such as expenses incurred by other investment companies in which the Multi Cap invests) do not exceed 0.95% of the Multi Cap Fund’s average daily net assets. For the year ended August 31, 2024, the Advisor waived fees of $33,245 and reimbursed the Multi Cap Fund $21,751 in expenses. Pursuant to the Expense Limitation Agreement, if the Adviser so requests, any Fund Operating Expenses waived or reimbursed by the Adviser pursuant to the Agreement that had the effect of reducing Fund Operating Expenses to 0.95% within the most recent three years prior to recoupment shall be repaid to the Adviser by the Fund; provided, however, that such recoupment will not cause the Fund’s expense ratio, after recoupment has been taken into account, to exceed the lesser of the expense cap in effect at the time of the waiver or the expense cap in effect at the time of recoupment. Advisory fees waived and/or reimbursed expenses that may be subject to potential recoupment by the Advisor through August 31, 2027 totaled $150,151.
The amounts subject to repayment by the Multi Cap Fund, pursuant to the aforementioned conditions, at August 31, 2024 were as follows:
| | Subject to Repayment |
| Amount | by August 31, |
| $ 46,990 | 2025 |
| $ 48,165 | 2026 |
| $ 54,996 | 2027 |
Related Party
Umberto Anastasi is an officer of the Trust, and therefore an interested person. Mr. Anastasi is an employee of Mutual Shareholder Services, LLC (“MSS”). MSS is the transfer agent and fund accountant of the Funds. For the year ended August 31, 2024, MSS earned fees of $183,249 from the Trust. The Multi Cap Fund will receive a discount of between 10% - 50% on fund accounting fees until assets reach $10 million.
Brandon Pokersnik is the chief compliance officer of the Trust as of November 2017, and therefore an interested person. Mr. Pokersnik is an employee of MSS. For the year ended August 31, 2024, Mr. Pokersnik earned fees of $11,742 from the Trust.
Troy Patton is an officer of the Trust and President of the Adviser, and therefore an interested person. There are certain shareholders of the Funds that also have a direct, regular discretionary investment accounts with the Adviser. As compensation for its management services for these particular shareholder accounts, the Adviser’s annual fee shall be 1% of the market value of the assets under management. These fees are in addition to the Management Fees earned by the Adviser as reported on the Statement of Operations of each Fund and are included in shareholder redemptions in each Fund’s Statement of Changes in Net Assets. For the year ended August 31, 2024, the Advisor earned fees from these shareholder accounts as follows:
| | Balanced Fund | Income Fund | Stock Fund | Dividend Growth Fund | Focus Fund | Multi Cap Fund |
| | $ 6,244 | $ 200 | $ 5,642 | $ 802 | $ 55 | $ 6 |
NOTE 6. INVESTMENTS
For the year ended August 31, 2024, purchases and sales of investment securities, other than short-term investments and short-term U.S. government obligations were as follows:
| | Balanced Fund | Income Fund | Stock Fund | Dividend Growth Fund | Focus Fund | Multi Cap Fund |
| Purchases | $ 5,185,607 | $ 6,528,956 | $ 1,876,660 | $ 3,091,793 | $ 8,609,202 | $ 3,982,771 |
| Sales | $ 7,857,956 | $ 3,402,500 | $ 3,578,812 | $ 2,771,000 | $ 8,421,603 | $ 3,678,678 |
For the year ended August 31, 2024, long-term purchases and sales of U.S. government obligations were $705,264 and $0, respectively, for the Balanced Fund. For the year ended August 31, 2024, long-term purchases and sales of U.S. government obligations were $705,264 and $800,000, respectively, for the Income Fund.
NOTE 7. BENEFICIAL OWNERSHIP
The beneficial ownership, either directly or indirectly, of more than 25% of the voting securities of a fund creates a presumption of control of the fund, under Section 2(a)(9) of the Investment Company Act of 1940 as amended. As of August 31, 2024, the shareholders listed in the table below held, for the benefit of their customers, the following percentages of the outstanding shares of each Fund and may be deemed to control each of the respective Funds:
| | Balanced Fund | Income Fund | Stock Fund | Dividend Growth Fund | Focus Fund | Multi Cap Fund |
| First Clearing, LLC. | 27% | N/A | 29% | 26% | N/A | N/A |
| Wells Fargo Clearing Services, LLC. | 32% | 41% | 36% | 46% | 68% | 95% |
| NFS, LLC. | N/A | 28% | N/A | N/A | 28% | N/A |
NOTE 8. TAX MATTERS
Each Fund’s distributable earnings on a tax basis are determined only at the end of each fiscal year. As of August 31, 2024, the Trust’s most recent fiscal year-end, the components of distributable earnings on a tax basis were as follows:
| | Balanced Fund | Income Fund | Stock Fund | Dividend Growth Fund | Focus Fund | Multi Cap Fund |
| Unrealized Appreciation/(Depreciation) | $19,671,935 | $ (352,863) | $12,841,971 | $ 6,249,165 | $1,435,742 | $1,699,238 |
| Undistributed Ordinary Income | 95,042 | - | 175,061 | 143,589 | 537,088 | 134,496 |
| Deferral of Post-October Losses | - | (1,605) | - | - | - | - |
| Undistributed long-term capital gains | 1,441,064 | - | 1,532,545 | - | 510,404 | 153,259 |
| Capital loss carryforward: + | | | | | | |
| Short term (no expiration) | - | (209,633) | - | (883,630) | - | - |
| Long term (no expiration) | - | (203,636) | - | - | - | - |
Total Distributable
Earnings/(Deficit) | $21,208,041 | $(767,737) | $14,549,577 | $ 5,509,124 | $2,483,234 | $1,986,993 |
Under current tax law, net capital losses realized after October 31st and net ordinary losses incurred after December 31st may be deferred and treated as occurring on the first day of the following fiscal year. Each Fund’s carryforward losses, post-October losses and post December ordinary losses are determined only at the end of each fiscal year.
+ The capital loss carryforward will be used to offset any capital gains realized by the Funds in future years. The Funds will not make distributions from capital gains while a capital loss remains.
As of August 31, 2024 for U.S. Federal income tax purposes, the cost of securities owned, unrealized appreciation (depreciation) of investments for the Funds was as follows:
| | | Balanced | | Income | | Stock | | Dividend | | Focus | | Multi |
| | | Fund | | Fund | | Fund | | Growth Fund | | Fund | | Cap Fund |
| | | | | | | | | | | | | |
| Gross unrealized appreciation on investment securities | | $20,409,600 | | $ 189,204 | | $12,969,515 | | $ 6,715,638 | | $1,561,328 | | $ 1,970,851 |
| Gross unrealized depreciation on investment securities | | (737,665) | | (542,067) | | (127,544) | | (466,473) | | (125,586) | | (271,613) |
| Net unrealized appreciation/(depreciation) | | $19,671,935 | | $ (352,863) | | $12,841,971 | | $ 6,249,165 | | $1,435,742 | | $ 1,699,238 |
| | | | | | | | | | | | | |
| Tax cost of investments (including short-term investments) * | | $30,877,387 | | $ 19,807,610 | | $12,327,353 | | $17,160,178 | | $9,711,441 | | $ 6,092,549 |
* The difference between book and tax cost represents disallowed wash sales for tax purposes for the Balanced Fund and Multi Cap Fund.
The Funds paid the following distributions for the years ended August 31, 2024 and 2023, as applicable:
| | | Period Ended | | $ Amount | | Tax Character |
| | | | | | | |
| Balanced Fund | | 8/31/2024 | | $ 616,422 | | Ordinary Income |
| Balanced Fund | | 8/31/2024 | | $ 9,941 | | Long Term Capital Gain |
| | | | | | | |
| Income Fund | | 8/31/2024 | | $ 687,398 | | Ordinary Income |
| | | | | | | |
| Stock Fund | | 8/31/2024 | | $ 12,537 | | Ordinary Income |
| Stock Fund | | 8/31/2024 | | $ 1,349,696 | | Long Term Capital Gain |
| | | | | | | |
| Dividend Growth Fund | | 8/31/2024 | | $ 617,317 | | Ordinary Income |
| | | | | | | |
| Focus Fund | | 8/31/2024 | | $ 82,045 | | Ordinary Income |
| | | | | | | |
| Multi Cap Fund | | 8/31/2024 | | $ 15,143 | | Ordinary Income |
| | | | | | | |
| | | Year Ended | | $ Amount | | Tax Character |
| | | | | | | |
| Balanced Fund | | 8/31/2023 | | $ 570,289 | | Ordinary Income |
| Balanced Fund | | 8/31/2023 | | $ 857,664 | | Long Term Capital Gain |
| | | | | | | |
| Income Fund | | 8/31/2023 | | $ 443,852 | | Ordinary Income |
| | | | | | | |
| Stock Fund | | 8/31/2023 | | $ 15,291 | | Ordinary Income |
| Stock Fund | | 8/31/2023 | | $ 593,404 | | Long Term Capital Gain |
| | | | | | | |
| Dividend Growth Fund | | 8/31/2023 | | $ 653,470 | | Ordinary Income |
| | | | | | | |
| Focus Fund | | 8/31/2023 | | $ 215,267 | | Ordinary Income |
| Focus Fund | | 8/31/2023 | | $ 65,152 | | Long Term Capital Gain |
| | | | | | | |
| Multi Cap Fund | | 8/31/2023 | | $ 20,869 | | Ordinary Income |
| Multi Cap Fund | | 8/31/2023 | | $ 311,064 | | Long Term Capital Gain |
NOTE 9. INDEMNIFICATIONS
In the normal course of business, the Funds enter into contracts that contain general indemnification to other parties. The Funds’ maximum exposure under these contracts is unknown as this would involve future claims that may be made against the Funds that have not yet occurred. The Funds expect the risk of loss to be remote.
NOTE 10. MARKET RISK
Overall market risks may also affect the value of the Funds. Factors such as domestic economic growth and market conditions, interest rate levels and political events affect the securities markets. Local, regional or global events such as war, acts of terrorism, the spread of infectious illness or other public health issue, recessions and depressions, or other events could have a significant impact on each Fund and its investments and could result in increased premiums or discounts to each Fund’s net asset value, and may impair market liquidity, thereby increasing liquidity risk. The Funds could lose money over short periods due to short-term market movements and over longer periods during more prolonged market downturns. During a general market downturn, multiple asset classes may be negatively affected. Changes in market conditions and interest rates can have the same impact on all types of securities and instruments.
NOTE 11. ACCOUNTING PRONOUCEMENTS
In September 2023, the SEC adopted a final rule relating to “Names Rule” under the 1940 Act. The amendments expanded the rule to require more funds to adopt an 80 percent investment policy, including funds with names suggesting a focus in investments with particular characteristics (e.g., growth or value) or with terms that reference a thematic investment focus (e.g., environmental, social, or governance factors). The amendments will require that a fund review its name for compliance with the rule. If needed, a fund may need to adopt an 80 percent investment policy and review its portfolio assets’ treatment under such policy at least quarterly. The rule also requires additional prospectus disclosure and reporting and record keeping requirements. The amendments became effective on April 9, 2024. The compliance date is February 9, 2026 for Funds with more than $1 billion in assets and August 9, 2026 for Funds with less than $1 billion in assets. The Funds are in compliance with this new rule.
NOTE 12. SUBSEQUENT EVENTS
On September 27, 2024, the following Funds declared distributions form ordinary income to shareholders of record as of September 27, 2024:
Ordinary Income Per Share Amount
Balanced Fund $163,649 $0.06
Income Fund $ 63,972 $0.06
Dividend Growth Fund $ 43,077 $0.05
Management has evaluated the impact of all subsequent events through the date the financial statements were available to be issued and has determined that there were no additional subsequent events requiring disclosure in the financial statements for the Funds.
REPORT OF INDEPENDENT REGISTERED PUBLIC ACCOUNTING FIRM
To the Shareholders and Board of Trustees of
Archer Balanced Fund, Archer Income Fund, Archer Stock Fund, Archer Dividend Growth Fund, Archer Focus Fund and Archer Multi Cap Fund, each a Series of the Archer Investment Series Trust
Opinion on the Financial Statements
We have audited the accompanying statements of assets and liabilities of the Archer Balanced Fund, Archer Income Fund, Archer Stock Fund, Archer Dividend Growth Fund, Archer Focus Fund, and Archer Multi Cap Fund, collectively the Funds, each a series of the Archer Investment Series Trust (the “Trust”), including the schedules of investments, as of August 31, 2024, the related statements of operations, the statements of changes in net assets, the related notes and the financial highlights for the periods indicated below (collectively referred to as the “financial statements”). In our opinion, the financial statements and financial highlights present fairly, in all material respects, the financial positions of the Funds as of August 31, 2024, the results of their operations, the changes in their net assets, and the financial highlights for each of the periods indicated below, in conformity with accounting principles generally accepted in the United States of America.
Fund Name | Statements of Operations | Statements of Changes in Net Assets | Financial Highlights |
| Archer Balanced Fund | For the year ended August 31, 2024 | For the years ended August 31, 2024 and 2023 | For the years ended August 31, 2024, 2023, 2022, 2021 and 2020 |
| Archer Income Fund | For the year ended August 31, 2024 | For the years ended August 31, 2024 and 2023 | For the years ended August 31, 2024, 2023, 2022, 2021 and 2020 |
| Archer Stock Fund | For the year ended August 31, 2024 | For the years ended August 31, 2024 and 2023 | For the years ended August 31, 2024, 2023, 2022, 2021 and 2020 |
| Archer Dividend Growth Fund | For the year ended August 31, 2024 | For the years ended August 31, 2024 and 2023 | For the years ended August 31, 2024, 2023, 2022, 2021 and 2020 |
| Archer Focus Fund | For the year ended August 31, 2024 | For the years ended August 31, 2024 and 2023 | For the years ended August 31, 2024, 2023, 2022 and 2021 and period from December 30, 2019 (commencement of investment operations) through August 31, 2020 |
| Archer Multi Cap Fund | For the year ended August 31, 2024 | For the years ended August 31, 2024 and 2023 | For the years ended August 31, 2024, 2023, 2022 and 2021 and period from December 30, 2019 (commencement of investment operations) through August 31, 2020 |
Basis for Opinion
These financial statements and financial highlights are the responsibility of the Funds’ management. Our responsibility is to express an opinion on these financial statements based on our audits. We are a public accounting firm registered with the Public Company Accounting Oversight Board (United States) (PCAOB) and are required to be independent with respect to the Funds in accordance with the U.S. federal securities laws and the applicable rules and regulations of the Securities and Exchange Commission and the PCAOB.
We conducted our audits in accordance with the standards of the PCAOB. Those standards require that we plan and perform the audits to obtain reasonable assurance about whether the financial statements and financial highlights are free of material misstatement, whether due to error or fraud. The Funds are not required to have, nor were we engaged to perform, an audit of their internal control over financial reporting. As part of our audits, we are required to obtain an understanding of internal control over financial reporting but not for the purpose of expressing an opinion on the effectiveness of the Funds’ internal control over financial reporting. Accordingly, we express no such opinion.
Our audits included performing procedures to assess the risks of material misstatement of the financial statements and financial highlights, whether due to error or fraud, and performing procedures that respond to those risks. Such procedures included examining, on a test basis, evidence regarding the amounts and disclosures in the financial statements and financial highlights. Our procedures included confirmation of securities owned as of August 31, 2024, by correspondence with the custodian. Our audits also included evaluating the accounting principles used and significant estimates made by management, as well as evaluating the overall presentation of the financial statements and financial highlights. We believe that our audits provide a reasonable basis for our opinion.

We have served as the auditor of the
Archer Investment Series Trust since 2011
Huntingdon Valley, Pennsylvania
October 28, 2024
Archer Funds
Additional Information
August 31, 2024 (Unaudited)
Information Regarding Proxy Voting
A description of the policies and procedures that the Fund uses to determine how to vote proxies relating to portfolio securities and information regarding how the Fund voted proxies during the most recent 12-month period ended June 30, are available without charge upon request by (1) calling the Fund at (800)238-7701 and (2) from Fund documents filed with the Securities and Exchange Commission ("SEC") on the SEC's website at www.sec.gov.
Annual Renewal of the Management Services Agreement with Archer Investment Corporation with respect to the Archer Balanced Fund, the Archer Income Fund, the Archer Stock Fund, the Archer Dividend Growth Fund, the Archer Focus Fund, and the Archer Multi Cap Fund.
The Board of Trustees of the Archer Investment Series Trust, including the Independent Trustees voting separately, reviewed and approved the continuance of the Funds’ Investment Advisory Agreement (“Advisory Agreement”) with Archer Investment Corporation(the “Advisor”) at a meeting held on August 15, 2024 (the “Meeting”). All the Trustees, including all of the Independent Trustees, were present electronically for the Board’s consideration and approval of these matters.1
At the meeting, the Trustees requested and reviewed information provided by the Adviser related to the following: (i) the nature, extent, and quality of the services provided by the Adviser, (ii) the investment performance of the Fund; (iii) the costs of the services provided and the profits realized by the Adviser from its relationship with each individual Archer Fund; (iv) the financial condition general of the Adviser; (v) the extent to which economies of scale would be realized as each Fund grows; and (vi) whether fee levels reflect these economies of scale for the benefit of the Fund’s shareholders.
The Trustees reviewed a variety of materials addressing the items set forth above, which they received in advance of the meeting, relating to each Fund. The Independent Trustees: (a) reviewed the information with their independent legal counsel; (b) received materials from their independent legal counsel discussing their fiduciary duties and responsibilities applicable in reviewing and considering each Management Services Agreement renewal; and (c) met with their independent legal counsel in private sessions at which no representatives of management were present. Throughout the process, the Trustees had the opportunity to ask questions to both the Advisor and legal counsel, and answers to their questions were considered along with the other materials provided.
With respect to the consideration of the nature, extent, and quality of the services provided by the Adviser to the Funds, the Trustees reviewed the background, qualifications, and experience of the Adviser’s investment, operational, and compliance personnel.
_____________________________
1 All of the participants in the Meeting, including the Executive Session, participated telephonically and/or by video conference. Because of the Covid 19 pandemic, the SEC by no-action letter has waived in-person voting requirements for the approvals and renewals of advisory contracts, as well as other matters for which jn person voting is required. For the time period approved by the no-action letter, such matters may now be approved and telephone or electronic meetings, provided all of the Trustees can hear and be heard. The Fund relied on this no-action authority to conduct the August 15, 2024 Meeting electronically even though the agenda items to the Meeting included the renewal of advisory and distribution contracts for the Fund as well as the reappointment of the Fund's auditor.
The Trustees considered the roles of each person as well as their relevant experience in the financial services industry, noting that Troy Patton had managed the Adviser and the Funds’ assets since their inception and that John Rosebrough had co-managed the Funds during that period. The Trustees also discussed and considered the responsibilities of the Adviser under the Management Services Agreement. the Adviser’s compliance program, and the Adviser’s role in coordinating such services and programs.
After reviewing the foregoing information and further information in the materials provided by the Adviser, the Board concluded that the nature, extent, and quality of the services provided by the Adviser were of high quality, reasonable, and consistent with the Board's expectations and those set forth in the current and proposed Management Services Agreement.
With respect to each Fund’s performance, the Trustees reviewed each Funds’ performance over various periods and compared such performance to the returns of relevant securities and averages of comparably managed mutual funds. The Trustees considered the consistency of the Adviser’s management of the Funds with their respective investment objectives and policies along with the overall performance of each Fund as presented to the Trustees in the materials at this meeting and those which the Trustees had reviewed at each prior quarterly Board meeting throughout the past fiscal year.
As to the Archer Balanced Fund, the Trustees recognized that the Fund is the flagship fund of the Archer fund complex and had achieved an overall four-star rating from Morningstar, and that over a ten-year period, the Fund had outpaced its Morningstar category average return. The Fund has generally performed above average of funds in its category since inception, while in 2023 and year-to-date the Fund is ranked in the top 50% of Funds in its category. The Trustees noted that the Fund’s Net Expense Ratio is 1.20% while the average in its Moderate Allocation category was 0.800% which is lower than the Fund. It was noted that the Fund’s Net Expense Ratio was in line with other Funds Net Expense Ratios in its category of comparable asset size. The Trustees noted that the Adviser’s Management Fee is 0.50%, while the average in the Fund’s comparative category and asset size was 0.66%. The Trustees noted that the Fund’s three-year tax cost ratio at 0.72% was comparatively lower than its category, which was 1.62%. In particular, the Trustees further noted that a $10,000.00 investment in the Fund would have yielded a return of $20,625.00 compared to its category which would have yielded a $18,744.00 return. Finally, the Trustees noted that the Fund had generally achieved positive annualized returns across its longer-term standard annualized performance measurement time frames, three-, five- and ten-year periods of 4.70%, 7.22%, and 6.71%, respectively, compared to funds of a similar asset size in its category which were reported as 3.29%, 7.21%, and 6.33%, respectively.
They also noted that the Fund’s calendar year-to-date performance through June 28,2024, was negative. With respect to its performance relative to its primary benchmark, the Trustees noted the Fund had outperformed the benchmark for the calendar year-to-date (15.71% v. 7.33%).
As to the Archer Income Fund, the Trustees found that the Fund was rated as a five-star fund by Morningstar and it had outperformed its benchmark, the Barclays US Aggregate Bond Index, for the most recent three-month period 1.2% vs. .70%, year-to-date period 2.3% v. -1.0%, three-year period -0.1% v. -3.10% and five-year period 1.4% v. -0.3%. The Trustees noted that the Fund’s Net Expense Ratio is 0.98% while the average in its Intermediate Term No-Load category was 0.550%. The Trustees noted that the Adviser’s Management Fee is 0.50% while the average in the Fund’s comparative category and of similar asset size was also 0.40%. The Trustees also noted that the Fund’s three-year tax cost ratio at 1.29% was comparatively lower than its category, which was 1.36%. The Trustees further noted that a $10,000.00 investment in the Fund would have yielded a return of $12,678.00 compared to its category, which would have yielded a $12,157.00 return. Finally, the Trustees noted that the Fund had generally achieved mixed annualized returns across its standard annualized performance measurement time frames, three-, five- and ten-year periods of -0.11%, 1.40%, and 1.80%, respectively, compared to its category ad funds of similar size, which were reported as -3.36%, -0.14%, and 1.14%, respectively.
They also noted that the Fund’s calendar year-to-date performance through June 28, 2024, was positive, which was inconsistent with the market during that period. With respect to its performance relative to its category and benchmark, the Trustees noted the Fund had outperformed its category and its benchmark for a calendar year-to-date (2.30% v. -0.19% and -0.73%).
As to the Archer Dividend Growth Fund, the Trustees found that Fund was rated as a one-star fund by Morningstar and in the bottom quartile of the Fund’s category. The Trustees noted that Fund underperformed its category and benchmark during the three- and five-year period. The Fund’s total return year-to-date was 4.91% compared to the Fund’s category, which was 7.33%. The Trustees noted that the Fund’s Net Expense Ratio is 0.97% while the average in its Large Cap No-Load category was 0.80%. The Trustees also noted that the Adviser’s Management Fee is 0.50% while the average in the Fund’s comparative category is also 0.63%. The Trustees noted that the Fund’s three-year tax cost ratio at 1.07% was comparatively lower than its category, which was 1.67%. The Trustees further noted that a $10,000.00 investment in the Fund since inception would have yielded a return of $15,432.00 compared to its category, which would have yielded a $20,476.00 return and its benchmark having a yield of $23,022. Finally, the Trustees noted that the Fund had generally achieved mixed annualized returns across its standard annualized performance measurement time frames, three-, and five-year periods of 4.79%, and 5.62%, respectively, compared to funds of a similar asset size in its category, which were reported as 5.54%, and 8.51%, respectively.
As to the Archer Focus Fund, the Trustees found that the Fund was currently rated as a three-star fund by Morningstar. The Trustees noted that the Fund’s Net Expense Ratio is 0.98% while the average in its Large Cap Blend No-Load category was 0.800%. The Trustees noted that the Adviser’s Management Fee is 0.50% while the average in the Fund’s comparative category is also 0.63%. The Trustees further noted that a $10,000.00 investment in the Fund would have yielded a return of $15,252.00 compared to its category, which would have yielded a $16,531.00 return. Finally, the Trustees noted that the Fund had generally mixed returns across its standard annualized performance measurement time frames of calendar years 2022 and 2023, and year-to-date of -9.37%, 14.14%, and 11.60, respectively, compared to its category, which were reported as -16.96%, 22.32%, and 13.31%, respectively, with similar comparable figures to its benchmark. With respect to its performance relative to its category and benchmark, the Trustees noted the Fund had outperformed its category and its benchmark year-to-date (11.60% v. 13.31% and 15.97%).
As to the Archer Multi Cap Fund, the Trustees found that that the Fund was rated as a four-star fund by Morningstar. The Trustees noted that the Fund’s total return year-to-date (June 28, 2024) was 20.54% compared to the Fund’s benchmark, which was 12.79%. The Trustees noted that the Fund’s Net Expense Ratio is 0.960% while the average in its Mid Cap No-Load category was 0.990%. The Trustees noted that the Adviser’s Management Fee is 0.50% while the average in the Fund’s comparative category is also 0.78%. The Trustees further noted that a $10,000.00 investment in the Fund would have yielded a return of $15,410.00 compared to its category, which would have yielded a $14,472.00 return. Finally, the Trustees noted that the Fund had generally mixed annualized returns across its standard annualized performance measurement time frames of calendar years 2022 and 2023, and year-to-date of -20.23%, 25.13%, and 14.16, respectively, compared to its category, which were reported as -14.01%, 16.00%, and 5.06%, respectively, with similar comparable figures to its benchmark.
As to the Archer Stock Fund, the Trustees noted that the Fund had underperformed funds in its Large-Cap No-Load category. Trustees noted that the Fund’s Net Expense Ratio is 1.230%, while the average in its large-cap category was 0.800%, which the Trustees recognize is lower than the Fund. The Trustees noted that the Adviser’s Management Fee is 0.50% while the average in the Fund’s comparative category is also 0.54%. The Trustees noted that the Fund’s three-year tax cost ratio at 1.04% was comparatively lower than its category, which was 1.47%. The Trustees further noted that a $10,000.00 investment in the Fund would have yielded a return of $25,579.00 compared to its category, which would have yielded a $28.860.00 return. Finally, the Trustees noted that the Fund had generally achieved positive annualized returns across its longer-term standard annualized performance measurement time frames, three, five- and ten-year periods of 6.35%, 13.03%, and 8.72%, respectively, compared to its category, which were reported as 8.37%, 13.72%, and 11.08%, respectively. The Trustees noted that the Fund underperformed in all its standard annualized performance measurement time frames compared to its category and its benchmark.
They also noted that the Fund’s calendar year-to-date performance through June 28, 2024, was negative which was consistent with the market during that period. With respect to its performance relative to its primary benchmark, the S&P 500 Index, the Trustees noted the Fund had underperformed the benchmark for a calendar year-to-date 12.27% v. 15.29%).
After considering and discussing the performance of each of the Funds further, the Board found that each Fund's performance reflected the Adviser’s ability to effectively manage the Funds’ assets on a long-term basis in different market environments. The Trustees also concluded that the Adviser’s experience and the historical performance data provided, and other relevant support, was satisfactory.
In considering the fees and expenses paid by each Archer Fund, in addition to each Fund’s category comparable expense and funds of similar asset sizes, the Trustees were provided with the overall expenses of each Fund and the asset levels of each Fund. The Adviser provided the Board with information on its profitability in serving as the Funds’ Adviser. The Board discussed with the Adviser the methodology utilized in assembling the information regarding profitability and considered its reasonableness, noting that the Adviser is profitable regarding its relationship with the Funds and the Adviser’s desire to remain competitive as reflected by its desire to continue to reduce both its adviser fees and administration fees accessed to the shareholders. The Trustees also considered potential benefits for the Adviser in managing the Archer Funds, noting also that the Adviser has been engaged by the Trust to perform certain administrative services under a separate agreement. The Independent Trustees, based on the foregoing, concluded that the fees to be paid to the Adviser by the Funds and the profits to be realized by the Adviser, considering all the facts and circumstances, were fair and reasonable in relation to the nature and quality of the services provided by the Adviser and that the Adviser is financially capable of satisfying its obligations under the Management Services Agreement.
The Trustees further recognized that the Adviser’s reputation, as well as other intangibles, remain a benefit to it, having an association with the Archer Funds. The Trustees discussed other potential benefits to be derived by the Adviser and concluded that they were consistent with the types of benefits derived by investment managers to mutual funds.
After reviewing and considering the foregoing information and other information they deemed relevant regarding these matters, the Trustees concluded, considering all the facts and circumstances, that the other benefits derived by the Adviser from their relationship with the Funds were satisfactory.
With respect to economies of scale, the Trustees noted that the Management Services Agreement did not have breakpoints that would reduce the advisory fee rate on assets above specified levels. However, the Trustees did note that the Adviser has historically voluntarily reduced certain of the Archer Funds’ expense limitations which benefited the shareholders, and that the Adviser remains contractually obligated to maintain the current expense limitation agreement in place until December 31, 2026. The Trustees also considered the potential benefits for the Adviser in managing multiple series under the Trust and that the Adviser did not currently engage in any soft dollar relationships.
Prior to voting, the Independent Trustees reviewed the proposed renewal of the Management Services Agreement with management and had the opportunity to meet in a private session at which no representatives of the Adviser were present.
Having requested and received such information from the Adviser as the Independent Trustees of the Board of Trustees believed to be reasonably necessary to evaluate renewing the Management Services Agreement, and as assisted by the advice of legal counsel, the Trustees using their reasonable business judgment, concluded that the overall arrangement provided under the terms of the Management Services Agreement with each Fund was a reasonable business arrangement and that the approval of the Management Services Agreement was in the best interests of the Trust and each Fund’s shareholders. The Independent Trustees concluded that no single factor was considered in isolation to be determinative to the decision of the Trustees to approve continuance of the Management Services Agreement. Rather, the Trustees concluded, considering a weighing, and balancing of all factors considered, that it would be in the best interests of each Fund and its shareholders to renew the Management Services Agreement for an additional annual period. As a result of their considerations, the Board of Trustees, including all the Independent Trustees, adopted resolutions to that effect.
This report is intended only for the information of shareholders or those who have received the Funds’ prospectus which contains information about the Funds’ management fee and expenses. Please read the prospectus carefully before investing.
Item 8. Changes in and Disagreements with Accountants for Open-End Management Investment Companies. Not applicable.
Item 9. Proxy Disclosures for Open-End Management Investment Companies. Not applicable.
Item 10. Remuneration Paid to Directors, Officers, and Others of Open-End Management Investment Companies. The information is included as part of the material filed under Item 7 of this Form.
Item 11. Statement Regarding Basis for Approval of Investment Advisory Contract. The information is included as part of the material filed under Item 7 of this Form.
Item 12. Disclosure of Proxy Voting Policies and Procedures for Closed-End Funds. Not applicable.
Item 13. Portfolio Managers of Closed-End Funds. Not applicable.
Item 14. Purchases of Equity Securities by Closed-End Funds. Not applicable.
Item 15. Submission of Matters to a Vote of Security Holders. Not Applicable
Item 16. Controls and Procedures.
(a) The registrant’s principal executive and principal financial officers, or persons performing similar functions, have concluded that the registrant’s disclosure controls and procedures (as defined in Rule 30a-3(c) under the Investment Company Act of 1940, as amended (the “1940 Act”) (17 CFR 270.30a-3(c))) are effective, as of a date within 90 days of the filing date of this report that includes the disclosure required by this paragraph, based on their evaluation of the controls and procedures required by Rule 30a-3(b) under the 1940 Act (17 CFR 270.30a-3(b)) and Rules 13a-15(b) or 15d-15(b) under the Securities Exchange Act of 1934, as amended (the “Exchange Act”) (17 CFR 240.13a-15(b) or 240.15d-15(b)).
(b) There were no changes in the registrant’s internal control over financial reporting (as defined in Rule 30a-3(d) under the 1940 Act (17 CFR 270.30a-3(d)) that occurred during the period covered by this report that has materially affected, or is reasonably likely to materially affect, the registrant’s internal control over financial reporting.
Item 17. Disclosures of Securities Lending Activities for Closed-End Management Investment Companies. Not applicable.
Item 18. Recovery of Erroneously Awarded Compensation.
(a) Not applicable.
(b) Not applicable.
Item 19. Exhibits.
(a)(1) EX-99.CODE ETH. Filed herewith.
(a)(2) EX-99.CERT. Filed herewith.
(a)(3) Any written solicitation to purchase securities under Rule 23c-1 under the Act (17 CFR 270.23c-1) sent or given during the period covered by the report by or on behalf of the registrant to 10 or more persons. Not applicable.
(b) EX-99.906CERT. Filed herewith.
SIGNATURES
Pursuant to the requirements of the Securities Exchange Act of 1934 and the Investment Company Act of 1940, the registrant has duly caused this report to be signed on its behalf by the undersigned, thereunto duly authorized.
Archer Investment Series Trust
By /s/Troy C. Patton
* Troy C. Patton
President and Chief Executive Officer
Date: November 11, 2024
Pursuant to the requirements of the Securities Exchange Act of 1934 and the Investment Company Act of 1940, this report has been signed below by the following persons on behalf of the registrant and in the capacities and on the dates indicated.
By /s/Umberto Anastasi
* Umberto Anastasi
Treasurer and Chief Financial Officer
Date: November 11, 2024
* Print the name and title of each signing officer under his or her signature.