Income tax expense. Income tax expenses were $165.6 million in 2023, compared to $577.2 million in 2022, primarily due to lower income before income taxes.
Net income. As a result of the foregoing, net income was $652.9 million in 2023, compared to $2,479.6 million in 2022.
Net income attributable to our shareholders. As a result of the factors described above, we had net profit attributable to our shareholders of $429.5 million in 2023, a 76.4% decrease from $1,819.8 million in 2022.
Year Ended December 31, 2022 Compared to Year Ended December 31, 2021
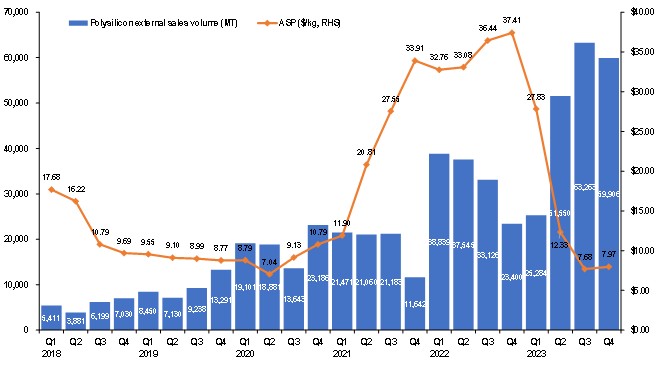
Revenue. The revenue was $4,608.4 million in 2022, representing an increase of 174.5% from $1,678.8 million in 2021, primarily due to higher polysilicon ASPs and higher sales volume. All of the polysilicon sold in 2022 and 2021 was manufactured in our Xinjiang facilities. Our external sales volume increased by 76.4% from 75,356 MT in 2021 to 132,909 MT in 2022. Our annual average selling prices increased by 55.3% from $22.19/kg in 2021 to $34.47/kg in 2022.
Cost of revenue. The cost of revenue was $1,200.4 million in 2022, representing an increase of 106.4% from 581.6 million in 2021. The increase in cost of revenue from product sales was attributable primarily to increased sales volume.
Gross profit. We had a gross profit of $3,407.9 million in 2022, representing an increase of 210.6% from $1,097.2 million in 2021.
Selling, general and administrative expenses. Our selling, general and administrative expenses for continuing operations increased to $354.1 million in 2022, compared to $39.9 million in 2021, primarily due to non-cash share-based compensation cost related to the Company’s 2022 share incentive plan, which was $299.3 million and $8.4 million in 2022 and 2021, respectively.
Research and development expenses. Our research and development expenses were $10.0 million in 2022, compared to $6.5 million in 2021. The research and development expenses vary from period to period reflecting the R&D activities that occur in such period.
Other operating income (expenses), net. Other operating expenses were $3.2 million in 2022, compared to other operating income of $0.6 million in 2021. Our other operating expenses were primarily attributable to our loss on disposal of fixed assets. Our other operating income mainly consisted of unrestricted cash subsidies that we received from local government authorities, which vary from period to period at the discretion of the corresponding local government authorities.
Interest expense, net. Our net interest income was $14.5 million in 2022, compared to net interest expenses of $20.5 million in 2021. The increase in interest income was primarily due to higher cash at banks balance.
Income tax expense. Income tax expenses were $577.2 million in 2022, compared to $170.1 million in 2021, primarily due to higher income before income taxes.
Net income. As a result of the foregoing, net income was $2,479.6 million, compared to $864.8 million in 2021.
Net income attributable to our shareholders. As a result of the factors described above, we had net profit attributable to our shareholders of $1,819.8 million in 2022, a 143.0% increase from $748.9 million in 2021.
B.Liquidity and Capital Resources
Liquidity
Our cash, cash equivalents and restricted cash increased by $605.6 million during 2021 and $2,796.4 million during 2022 and decreased by $472.4 million during 2023. Net cash provided by operating activities was $639.0 million, $2,462.7 million and $1,616.0 million in 2021, 2022 and 2023, respectively. Net cash used in investing activities was $781.9 million, $998.4 million and $1,196.0 million in 2021, 2022 and 2023, respectively. Net cash provided by financing activities was $736.2 million, $1,472.1 million and $795.4 million in 2021, 2022 and 2023, respectively.
We believe that our cash, cash equivalents, cash flows from operating activities and our subsidiary Xinjiang Daqo’s equity offerings will be sufficient to meet our working capital, capital expenditure needs that will arise in 2024 and beyond.