UNITED STATES
SECURITIES AND EXCHANGE COMMISSION
Washington, D.C. 20549
FORM N-CSR
CERTIFIED SHAREHOLDER REPORT OF REGISTERED
MANAGEMENT INVESTMENT COMPANIES
Investment Company Act file number | 811-22369 |
|
Western Asset Mortgage Defined Opportunity Fund Inc. |
(Exact name of registrant as specified in charter) |
|
55 Water Street, New York, NY | | 10041 |
(Address of principal executive offices) | | (Zip code) |
|
Robert I. Frenkel, Esq. Legg Mason & Co., LLC 100 First Stamford Place Stamford, CT 06902 |
(Name and address of agent for service) |
|
Registrant’s telephone number, including area code: | (888)777-0102 | |
|
Date of fiscal year end: | December 31 | |
|
Date of reporting period: | June 30, 2010 | |
| | | | | | | | |
ITEM 1. REPORT TO STOCKHOLDERS.
The Semi-Annual Report to Stockholders is filed herewith.
June 30, 2010 | | 
|
Semi-Annual Report
Western Asset Mortgage Defined Opportunity Fund Inc.
(DMO)
| |
| INVESTMENT PRODUCTS: NOT FDIC INSURED · NO BANK GUARANTEE · MAY LOSE VALUE |
| |
II | | Western Asset Mortgage Defined Opportunity Fund Inc. | | |
Fund objectives
The Fund’s primary investment objective is to provide current income. As a secondary investment objective, the Fund will seek capital appreciation.
What’s inside
Letter from the chairman | II |
| |
Investment commentary | III |
| |
Fund at a glance | 1 |
| |
Schedule of investments | 2 |
| |
Statement of assets and liabilities | 8 |
| |
Statement of operations | 9 |
| |
Statements of changes in net assets | 10 |
| |
Statement of cash flow | 11 |
| |
Financial highlights | 12 |
| |
Notes to financial statements | 13 |
| |
Board approval of management and subadvisory agreements | 21 |
| |
Dividend reinvestment plan | 26 |
Letter from the chairman | 
|
Dear Shareholder,
We are pleased to provide the semi-annual report of Western Asset Mortgage Defined Opportunity Fund Inc. for the period from the Fund’s commencement of operations on February 24, 2010 through June 30, 2010 (the “reporting period”).
Please read on for Fund performance information and a detailed look at prevailing economic and market conditions during the Fund’s reporting period. Important information with regard to recent regulatory developments that may affect the Fund is contained in the Notes to Financial Statements included in this report.
As always, we remain committed to providing you with excellent service and a full spectrum of investment choices. We also remain committed to supplementing the support you receive from your financial advisor. One way we accomplish this is through our website, www.leggmason.com/cef. Here you can gain immediate access to market and investment information, including:
· Fund prices and performance,
· Market insights and commentaries from our portfolio managers, and
· A host of educational resources.
We look forward to helping you meet your financial goals.
Sincerely,

R. Jay Gerken, CFA
Chairman, President and Chief Executive Officer
July 30, 2010
| | Western Asset Mortgage Defined Opportunity Fund Inc. | | III |
Investment commentary
Economic review
While the overall U.S. economy continued to expand over the course of the reporting period from February 24, 2010 through June 30, 2010 (the “reporting period”), several economic data points weakened toward the end of the reporting period. This, in combination with sovereign debt woes in Europe, caused investor sentiment to turn negative and had significant implications for the financial markets.
Looking back, the U.S. Department of Commerce reported that U.S. gross domestic product (“GDP”)i contracted four consecutive quarters, beginning in the third quarter of 2008 through the second quarter of 2009. Economic conditions then began to improve in the third quarter of 2009, as GDP growth was 1.6%. A variety of factors helped the economy to regain its footing, including the government’s $787 billion stimulus program. Economic growth then accelerated during the fourth quarter of 2009, as GDP growth was 5.0%. A slower drawdown in business inventories and renewed consumer spending were contributing factors spurring the economy’s higher growth rate. While the recovery continued during the first half of 2010, it did so at a more modest pace, as GDP growth was 3.7% during the first quarter of 2010 and an estimated 2.4% during the second quarter. The slower pace of growth in the second quarter was due, in part, to slower consumer spending, which rose an annualized 1.6% during the quarter, versus a 1.9% gain over the first three months of the year.
Even before GDP growth turned positive, there were signs that the economy was on the mend. The manufacturing sector, as measured by the Institute for Supply Management’s PMIii, rose to 52.8 in August 2009, the first time it surpassed 50 since January 2008 (a reading below 50 indicates a contraction, whereas a reading above 50 indicates an expansion). While June 2010’s PMI reading of 56.2 was lower than May’s reading of 59.7, manufacturing has now expanded eleven consecutive months according to PMI data. The manufacturing sector’s growth remained fairly broad-based with thirteen of the eighteen industries tracked by the Institute for Supply Management expanding during June.
After experiencing sharp job losses in 2009, the U.S. Department of Labor reported that over one million new positions were added during the first five months of 2010. Included in that total, however, were 700,000 temporary government jobs tied to the 2010 Census. In June, 225,000 of these temporary positions were eliminated, offsetting private sector growth and resulting in a net loss of 125,000 jobs for the month. However, the unemployment rate fell to 9.5% in June, versus 9.7% and 9.9% in May and April, respectively.
There was mixed news in the housing market during the period. According to the National Association of Realtors, existing home sales increased 7.0% and 8.0% in March and April, respectively, after sales had fallen for the period from December 2009 through February 2010. The rebound was largely attributed to people rushing to take advantage of the government’s $8,000 tax credit for first-time home buyers that expired at the end of April. However, with the end of the tax credit, existing home sales then declined 2.2% and 5.1% in May and June, respectively. In addition, the inventory of unsold homes increased 2.5% to 3.99 million in June. Looking at home prices, the S&P/Case-Shiller Home Price Indexiii indicated that month-to-month U.S. home prices rose 1.3% in May. This marked the second straight monthly increase following six consecutive months of declining prices.
Financial market overview
During the first part of the reporting period, the financial markets were largely characterized by healthy investor risk appetite and solid results by lower-quality bonds. However, the market experienced a sharp sell-off during the latter part of the reporting period, during which risk aversion returned and investors flocked to the relative safety of U.S. Treasury securities.
Given certain pockets of weakness in the economy, including elevated unemployment in the U.S., the Federal Reserve Board (“Fed”)iv remained cautious. At its meeting in June 2010, the Fed said it “will maintain the target range for the federal funds ratev at 0 to 1/4 percent and continues to anticipate that economic conditions, including low rates of resource utilization, subdued inflation trends, and stable inflation expectations, are likely to warrant exceptionally low levels of the federal funds rate for an extended period.”
However, the Fed took several steps in reversing its accommodative monetary stance. On February 18, 2010, the Fed raised the discount rate, the interest rate it charges banks for temporary loans, from 1/2 to 3/4 percent. The Fed also
IV | | Western Asset Mortgage Defined Opportunity Fund Inc. | | |
Investment commentary (cont’d)
concluded its $1.25 trillion mortgage securities purchase program at the end of the first quarter of 2010. However, the Fed left the door open for future stimulus measures if needed. In the minutes of its June meeting that were released on July 14th (after the reporting period ended), the Fed said, “In addition to continuing to develop and test instruments to exit from the period of unusually accommodative monetary policy, the Committee would need to consider whether further policy stimulus might become appropriate if the outlook were to worsen appreciably.”
Fixed-income market review
Continuing the trend that began in the second quarter of 2009, nearly every spread sector (non-Treasury) outperformed equal-durationvi Treasuries during the first half of the reporting period. Over that time, investor confidence was high given encouraging economic data, continued low interest rates, benign inflation and rebounding corporate profits. However, robust investor appetite was replaced with heightened risk aversion toward the end of April and during the month of May. This was due to the escalating sovereign debt crisis in Europe, uncertainties regarding new financial reforms in the U.S. and some worse-than-expected economic data. Most spread sectors then produced positive absolute returns in June, as investor demand for these securities began to again increase.
Both short- and long-term Treasury yields fluctuated during the reporting period but generally moved lower. When the period began, two- and ten-year Treasury yields were 0.87% and 3.69%, respectively. Two- and ten-year Treasury yields initially rose, reaching as high as 1.18% and 4.01%, respectively, in early April. Yields then largely declined amid the investor “flight to quality.” On June 30, 2010, two- and ten-year Treasury yields reached their lows for the reporting period: 0.61% and 2.97%, respectively. Over the reporting period, the yield curvevii flattened, with longer-term Treasury yields declining more than their shorter-term counterparts. For the reporting period, the Barclays Capital U.S. Aggregate Indexviii returned 3.76%.
Both residential mortgage-backed securities (“RMBS”) and commercial mortgage-backed securities (“CMBS”) generated positive results over the course of the reporting period. Despite increased investor risk aversion, RMBS held up relatively well, as investors appeared to view them as being relatively safer alternatives than certain other spread sectors. During the reporting period, the Barclays Capital U.S. Mortgage-Backed Securities Indexix returned 3.06%. CMBS also generated solid results, as investors were drawn to their attractive yields. Despite poor performance in May 2010, the Barclays Capital CMBS Indexx returned 19.71% over the reporting period.
Performance review
For the period from its commencement of operations on February 24, 2010 through June 30, 2010, Western Asset Mortgage Defined Opportunity Fund Inc. returned 5.75% based on its net asset value (“NAV”)xi and 1.18% based on its New York Stock Exchange (“NYSE”) market price per share. The Fund’s unmanaged benchmark, the BofA Merrill Lynch U.S. Floating Rate Home Equity Loan Asset Backed Securities Indexxii, returned 3.54% over the same time frame. The Lipper U.S. Mortgage Closed-End Funds Category Averagexiii returned 5.27% for the period from February 28, 2010 through June 30, 2010. Please note that Lipper performance returns are based on each fund’s NAV.
During the reporting period, the Fund made distributions to shareholders totaling $0.28 per share, which may have included a return of capital. The performance table shows the Fund’s total return since its commencement of operations based on its NAV and market price as of June 30, 2010. Past performance is no guarantee of future results.
Performance Snapshot as of June 30, 2010 (unaudited)
Price Per Share | | Total Return*
Since Commencement of Operations** | |
$19.87 (NAV) | | 5.75% | |
$19.95 (Market Price) | | 1.18% | |
All figures represent past performance and are not a guarantee of future results.
* Total returns are based on changes in NAV or market price, respectively. Total returns assume the reinvestment of all distributions, including returns of capital, if any, in additional shares in accordance with the Fund’s Dividend Reinvestment Plan. Performance figures for periods shorter than one year represent cumulative figures and are not annualized.
** The Fund commenced operations on February 24, 2010.
Looking for additional information?
The Fund is traded under the symbol “DMO” and its closing market price is available in most newspapers under the NYSE listings. The daily NAV is
| | Western Asset Mortgage Defined Opportunity Fund Inc. | | V |
available on-line under the symbol “XDMOX” on most financial websites. Barron’s and the Wall Street Journal’s Monday edition both carry closed-end fund tables that provide additional information. In addition, the Fund issues a quarterly press release that can be found on most major financial websites as well as www.leggmason.com/cef.
In a continuing effort to provide information concerning the Fund, shareholders may call 1-888-777-0102 (toll free), Monday through Friday from 8:00 a.m. to 5:30 p.m. Eastern Time, for the Fund’s current NAV, market price and other information.
As always, thank you for your confidence in our stewardship of your assets.
Sincerely,

R. Jay Gerken, CFA
Chairman, President and Chief Executive Officer
July 30, 2010
RISKS: The Fund’s investments are subject to liquidity risk, credit risk, inflation risk and interest rate risk. As interest rates rise, bond prices fall, reducing the value of the Fund’s fixed-income holdings. The Fund may invest in lower-rated high-yield bonds which are subject to greater credit risk (risk of default) than higher-rated obligations. Mortgage-backed securities are subject to additional risks, including prepayment risk, which can limit the potential gains in a declining interest rate environment. The Fund may invest in securities backed by subprime or distressed mortgages which involve a higher degree of risk and chance of loss.
Leverage may result in greater volatility of NAV and the market price of common shares and increases a shareholder’s risk of loss. The Fund may make significant investments in derivative instruments. Derivative instruments can be illiquid, may disproportionately increase losses, and have a potentially large impact on Fund performance. The Fund is not guaranteed by the U.S. government, the U.S. Treasury or any government agency.
All investments are subject to risk including the possible loss of principal. All index performance reflects no deduction for fees, expenses or taxes. Please note that an investor cannot invest directly in an index.
The information provided is not intended to be a forecast of future events, a guarantee of future results or investment advice. Views expressed may differ from those of the firm as a whole.
i Gross domestic product (“GDP”) is the market value of all final goods and services produced within a country in a given period of time.
ii The Institute for Supply Management’s PMI is based on a survey of purchasing executives who buy the raw materials for manufacturing at more than 350 companies. It offers an early reading on the health of the manufacturing sector.
iii The S&P/Case-Shiller Home Price Index measures the residential housing market, tracking changes in the value of the residential real estate market in twenty metropolitan regions across the United States.
iv The Federal Reserve Board (“Fed”) is responsible for the formulation of policies designed to promote economic growth, full employment, stable prices and a sustainable pattern of international trade and payments.
v The federal funds rate is the rate charged by one depository institution on an overnight sale of immediately available funds (balances at the Federal Reserve) to another depository institution; the rate may vary from depository institution to depository institution and from day to day.
vi Duration is the measure of the price sensitivity of a fixed-income security to an interest rate change of 100 basis points. Calculation is based on the weighted average of the present values for all cash flows.
vii The yield curve is the graphical depiction of the relationship between the yield on bonds of the same credit quality but different maturities.
viii The Barclays Capital U.S. Aggregate Index is a broad-based bond index comprised of government, corporate, mortgage- and asset-backed issues, rated investment grade or higher, and having at least one year to maturity.
ix The Barclays Capital U.S. Mortgage-Backed Securities Index is an unmanaged index composed of agency mortgage-backed pass-through securities, both fixed-rate and hybrid adjustable rate mortgages, issued by the Government National Mortgage Association, Federal National Mortgage Association and Federal Home Loan Mortgage Corporation.
x The Barclays Capital CMBS Index measures the performance of the commercial mortgage-backed securities market.
xi Net asset value (“NAV”) is calculated by subtracting total liabilities and outstanding preferred stock (if any) from the closing value of all securities held by the Fund (plus all other assets) and dividing the result (total net assets) by the total number of the common shares outstanding. The NAV fluctuates with changes in the market prices of securities in which the Fund has invested. However, the price at which an investor may buy or sell shares of the Fund is the Fund’s market price as determined by supply of and demand for the Fund’s shares.
xii The BofA Merrill Lynch U.S. Floating Rate Home Equity Loan Asset Backed Securities Index tracks the performance of U.S. dollar-denominated investment grade floating-rate asset-backed securities collateralized by home equity loans publicly issued in the U.S. domestic market. Qualifying securities must have an investment grade rating, at least one year remaining to final stated maturity, a floating-rate coupon, and an original deal size for the collateral group of at least $250 million.
xiii Lipper, Inc., a wholly-owned subsidiary of Reuters, provides independent insight on global collective investments. Returns are based on the period from February 28, 2010 through June 30, 2010, including the reinvestment of all distributions, including returns of capital, if any, calculated among the 9 funds in the Fund’s Lipper category.
| | Western Asset Mortgage Defined Opportunity Fund Inc. 2010 Semi-Annual Report | | 1 |
Fund at a glance† (unaudited)
Investment breakdown (%) as a percent of total investments
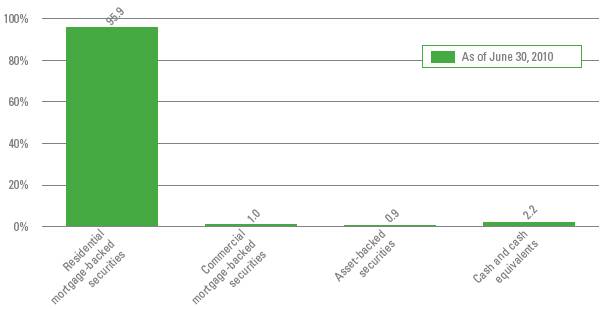
† The bar graph above represents the composition of the Fund’s direct investments and the exposure to these markets that the Fund receives through its investment in the PPIP Limited Partnership as of June 30, 2010. This bar graph does not include derivatives. The Fund is actively managed. As a result, the composition of the Fund’s investments is subject to change at any time.
2 | | Western Asset Mortgage Defined Opportunity Fund Inc. 2010 Semi-Annual Report | | |
Schedule of investments (unaudited)
June 30, 2010
Western Asset Mortgage Defined Opportunity Fund Inc.
Security | | Rate | | Maturity
Date | | Face
Amount | | Value | |
Commercial Mortgage-Backed Securities — 0.8% | | | | | | | | | |
Bayview Commercial Asset Trust, 2004-3 A1 | | 0.717 | % | 1/25/35 | | $ | 959,730 | | $ | 731,766 | (a)(b) |
Morgan Stanley Capital I, 1999-LIFE E | | 7.094 | % | 4/15/33 | | 1,167,409 | | 1,167,409 | (b) |
Total Commercial Mortgage-Backed Securities (Cost — $1,892,464) | | | | 1,899,175 | |
Residential Mortgage-Backed Securities — 68.9% | | | | | | | | | |
ABFS Mortgage Loan Trust, 2002-3 M1 | | 5.902 | % | 9/15/33 | | 1,510,000 | | 1,030,652 | |
Accredited Mortgage Loan Trust, 2003-3 A1 | | 4.460 | % | 1/25/34 | | 2,234,514 | | 1,768,919 | (c) |
Accredited Mortgage Loan Trust, 2006-1 A4 | | 0.627 | % | 4/25/36 | | 2,309,000 | | 1,097,478 | (b) |
American Home Mortgage Assets, 2005-2 2A1A | | 3.233 | % | 1/25/36 | | 1,481,813 | | 700,046 | (b) |
American Home Mortgage Investment Trust, 2005-1 6A | | 2.749 | % | 6/25/45 | | 212,801 | | 173,375 | (b) |
American Home Mortgage Investment Trust, 2005-SD1 1A1 | | 0.797 | % | 9/25/35 | | 682,007 | | 358,748 | (a)(b) |
American Home Mortgage Investment Trust, 2007-2 2A | | 0.747 | % | 3/25/47 | | 4,830,720 | | 357,640 | (b) |
American Home Mortgage Investment Trust, 2007-A 4A | | 0.797 | % | 7/25/46 | | 687,270 | | 302,437 | (a)(b) |
Ameriquest Mortgage Securities Inc., 2005-R1 M1 | | 0.797 | % | 3/25/35 | | 2,825,996 | | 2,282,337 | (b)(c) |
ARM Trust, 2005-5 1A1 | | 2.628 | % | 9/25/35 | | 476,605 | | 317,331 | (b) |
ARM Trust, 2005-10 1A21 | | 3.280 | % | 1/25/36 | | 707,065 | | 481,598 | (b) |
ARM Trust, 2007-1 1A1 | | 3.666 | % | 3/25/37 | | 921,461 | | 479,681 | (b) |
Banc of America Funding Corp., 2004-C 3A1 | | 3.467 | % | 12/20/34 | | 1,414,059 | | 1,148,196 | (b) |
Banc of America Funding Corp., 2006-5 4A5 | | 6.000 | % | 9/25/36 | | 3,600,000 | | 2,918,529 | (c) |
Banc of America Funding Corp., 2006-D 6A1 | | 5.684 | % | 5/20/36 | | 3,129,520 | | 2,040,506 | (b) |
Banc of America Funding Corp., 2006-F 1A1 | | 5.146 | % | 7/20/36 | | 1,522,436 | | 1,327,001 | (b) |
Banc of America Funding Corp., 2006-H 3A1 | | 5.993 | % | 9/20/46 | | 637,003 | | 467,008 | (b) |
Banc of America Funding Corp., 2007-A 2A1 | | 0.508 | % | 2/20/47 | | 765,950 | | 504,249 | (b) |
Banc of America Funding Corp., 2007-E CA9 | | 5.985 | % | 7/20/47 | | 5,230,690 | | 1,359,745 | (b) |
Banc of America Mortgage Securities Inc., 2005-E 2A7 | | 2.869 | % | 6/25/35 | | 700,000 | | 637,644 | (b) |
Bayview Financial Acquisition Trust, 2005-B M1 | | 0.797 | % | 4/28/39 | | 3,490,000 | | 2,447,064 | (b)(c) |
Bayview Financial Asset Trust, 2007-SR1A M2 | | 1.247 | % | 3/25/37 | | 4,782,342 | | 2,391,171 | (a)(b) |
Bayview Financial Asset Trust, 2007-SR1A M3 | | 1.497 | % | 3/25/37 | | 3,314,223 | | 1,325,689 | (a)(b) |
Bear Stearns Alt-A Trust, 2005-2 2A4 | | 3.007 | % | 4/25/35 | | 319,065 | | 238,953 | (b) |
Bear Stearns Alt-A Trust, 2005-3 4A3 | | 2.728 | % | 3/25/35 | | 703,779 | | 494,708 | (b) |
Bear Stearns Alt-A Trust, 2005-4 24A1 | | 5.253 | % | 5/25/35 | | 961,994 | | 804,115 | (b) |
Bear Stearns Alt-A Trust, 2005-9 25A1 | | 5.614 | % | 11/25/35 | | 822,264 | | 604,736 | (b) |
Bear Stearns Alt-A Trust, 2006-2 23A1 | | 5.572 | % | 3/25/36 | | 2,979,511 | | 1,566,277 | (b) |
Bear Stearns ARM Trust, 2005-1 2A1 | | 3.113 | % | 3/25/35 | | 930,152 | | 724,488 | (b) |
Bear Stearns ARM Trust, 2005-3 2A1 | | 2.811 | % | 6/25/35 | | 3,094,553 | | 2,491,912 | (b) |
Bear Stearns Asset Backed Securities Trust, 2004-HE10 M1 | | 1.000 | % | 12/25/34 | | 1,931,365 | | 1,445,211 | (b) |
Bear Stearns Asset Backed Securities Trust, 2005-CL1 A1 | | 0.847 | % | 9/25/34 | | 305,423 | | 238,765 | (b) |
Chase Funding Mortgage Loan Asset-Backed Certificates, 2002-1 1A5 | | 6.595 | % | 2/25/32 | | 489,308 | | 502,730 | |
Chase Mortgage Finance Corp., 2005-A2 1A5 | | 5.409 | % | 1/25/36 | | 4,000,000 | | 3,119,790 | (b)(c) |
Chase Mortgage Finance Corp., 2006-S3 2A1 | | 5.500 | % | 11/25/21 | | 1,687,605 | | 1,558,062 | (c) |
Chevy Chase Mortgage Funding Corp., 2006-2A A1 | | 0.477 | % | 4/25/47 | | 452,414 | | 216,296 | (a)(b) |
Citigroup Mortgage Loan Trust Inc., 2005-10 1A1A | | 3.273 | % | 12/25/35 | | 672,522 | | 363,304 | (b) |
Citigroup Mortgage Loan Trust Inc., 2006-AR5 2A1A | | 3.140 | % | 7/25/36 | | 1,305,817 | | 630,101 | (b) |
| | | | | | | | | | | |
See Notes to Financial Statements.
| | Western Asset Mortgage Defined Opportunity Fund Inc. 2010 Semi-Annual Report | | 3 |
Western Asset Mortgage Defined Opportunity Fund Inc.
Security | | Rate | | Maturity
Date | | Face
Amount | | Value | |
Citigroup Mortgage Loan Trust Inc., 2007-6 1A1A | | 3.078 | % | 5/25/37 | | $ | 920,790 | | $ | 445,045 | (b) |
Citigroup Mortgage Loan Trust Inc., 2007-AR8 1A1A | | 5.620 | % | 8/25/47 | | 628,181 | | 472,094 | (b) |
Citigroup Mortgage Loan Trust Inc., 2007-SHL1 A | | 0.747 | % | 11/25/46 | | 997,482 | | 453,613 | (a)(b) |
Countrywide Alternative Loan Trust, 2005-14 3A1 | | 3.319 | % | 5/25/35 | | 769,990 | | 366,283 | (b) |
Countrywide Alternative Loan Trust, 2005-3CB 1A6 | | 6.803 | % | 3/25/35 | | 2,173,797 | | 273,465 | (b) |
Countrywide Alternative Loan Trust, 2005-7CB 1A3 | | 6.253 | % | 4/25/35 | | 6,818,757 | | 809,038 | (b) |
Countrywide Alternative Loan Trust, 2005-J10 1A1 | | 0.847 | % | 10/25/35 | | 600,244 | | 396,050 | (b) |
Countrywide Alternative Loan Trust, 2005-J8 2A1 | | 5.000 | % | 6/25/20 | | 501,450 | | 443,631 | |
Countrywide Alternative Loan Trust, 2006-J8 A5 | | 6.000 | % | 2/25/37 | | 300,000 | | 191,075 | |
Countrywide Alternative Loan Trust, 2007-3T1 2A1 | | 6.000 | % | 3/25/27 | | 3,163,509 | | 2,595,777 | |
Countrywide Asset-Backed Certificates, 2003-5 AF5 | | 5.739 | % | 2/25/34 | | 311,054 | | 265,684 | |
Countrywide Home Loans Mortgage Pass-Through Trust, 2005-2 2A1 | | 0.667 | % | 3/25/35 | | 242,992 | | 143,345 | (b) |
Countrywide Home Loans Mortgage Pass-Through Trust, 2005-7 2A1 | | 0.657 | % | 3/25/35 | | 597,259 | | 335,601 | (b) |
Countrywide Home Loan Mortgage Pass-Through Trust, 2005-9 1A1 | | 0.647 | % | 5/25/35 | | 313,777 | | 181,108 | (b) |
Countrywide Home Loans Mortgage Pass-Through Trust, 2005-HY10 1A1 | | 3.702 | % | 2/20/36 | | 564,450 | | 339,170 | (b) |
Countrywide Home Loans Mortgage Pass-Through Trust, 2005-HYB6 1A1 | | 2.958 | % | 10/20/35 | | 1,851,298 | | 1,143,784 | (b) |
Countrywide Home Loans Mortgage Pass-Through Trust, 2005-J2 3A10 | | 46.781 | % | 8/25/35 | | 157,184 | | 251,279 | (b) |
Countrywide Home Loans Mortgage Pass-Through Trust, 2005-R1 1AF1 | | 0.707 | % | 3/25/35 | | 328,857 | | 269,803 | (a)(b) |
Countrywide Home Loans Mortgage Pass-Through Trust, 2005-R2 2A3 | | 8.000 | % | 6/25/35 | | 305,286 | | 271,597 | (a) |
Countrywide Home Loans Mortgage Pass-Through Trust, 2006-3 2A1 | | 0.597 | % | 3/25/36 | | 1,176,141 | | 684,827 | (b) |
Credit-Based Asset Servicing and Securitization LLC, 2004-CB2 M1 | | 0.867 | % | 7/25/33 | | 777,640 | | 521,944 | (b) |
Credit Suisse Mortgage Capital Certificates, 2006-8 2A1 | | 5.500 | % | 10/25/21 | | 4,516,951 | | 3,799,460 | (c) |
Credit Suisse First Boston Mortgage Securities Corp., 2005-10 12A1 | | 5.250 | % | 11/25/20 | | 688,640 | | 646,187 | |
Credit Suisse First Boston Mortgage Securities Corp., 2005-10 3A3 | | 5.500 | % | 11/25/35 | | 1,350,000 | | 1,017,363 | |
Deutsche ALT-A Securities Inc. Mortgage Loan Trust, 2005-AR2 3A1 | | 2.740 | % | 10/25/35 | | 2,388,396 | | 1,469,503 | (b) |
Deutsche ALT-A Securities Inc. Mortgage Loan Trust, 2006-AR1 2A1 | | 3.156 | % | 2/25/36 | | 407,280 | | 227,738 | (b) |
Deutsche ALT-A Securities Inc. Mortgage Loan Trust, 2007-1 2A1 | | 0.447 | % | 8/25/37 | | 1,272,958 | | 668,303 | (b) |
Deutsche Mortgage Securities Inc., 2005-WF1 1A3 | | 5.180 | % | 6/26/35 | | 2,200,000 | | 1,833,030 | (a)(b)(c) |
Downey Savings & Loan Association Mortgage Loan Trust, 2005-AR2 2A1A | | 0.558 | % | 3/19/45 | | 862,765 | | 491,529 | (b) |
First Horizon Alternative Mortgage Securities, 2005-AA6 3A1 | | 4.358 | % | 8/25/35 | | 2,066,565 | | 1,622,079 | (b)(c) |
First Horizon Alternative Mortgage Securities, 2006-FA6 2A1 | | 6.250 | % | 11/25/36 | | 597,763 | | 467,421 | |
| | | | | | | | | | | |
See Notes to Financial Statements.
4 | | Western Asset Mortgage Defined Opportunity Fund Inc. 2010 Semi-Annual Report | | |
Schedule of investments (unaudited) (cont’d)
June 30, 2010
Western Asset Mortgage Defined Opportunity Fund Inc.
Security | | Rate | | Maturity
Date | | Face
Amount | | Value | |
First Horizon Alternative Mortgage Securities, 2006-FA8 1A8 | | 0.717 | % | 2/25/37 | | $ | 902,433 | | $ | 450,419 | (b) |
First Horizon Mortgage Pass-Through Trust, 2005-AR4 2A1 | | 5.266 | % | 10/25/35 | | 1,201,408 | | 947,451 | (b) |
GMAC Mortgage Corp. Loan Trust, 2005-AR6 2A1 | | 5.031 | % | 11/19/35 | | 598,898 | | 454,198 | (b) |
Greenpoint Mortgage Funding Trust, 2006-AR3 4A1 | | 0.557 | % | 4/25/36 | | 2,047,283 | | 1,194,788 | (b) |
Greenpoint Mortgage Funding Trust, 2006-AR5 A1A | | 0.427 | % | 10/25/46 | | 367,697 | | 333,412 | (b) |
GSMPS Mortgage Loan Trust, 2004-4 2A1 | | 4.693 | % | 6/25/34 | | 436,202 | | 375,357 | (a)(b) |
GSMPS Mortgage Loan Trust, 2005-LT1 A1 | | 0.577 | % | 2/25/35 | | 496,130 | | 391,942 | (a)(b)(d) |
GSMPS Mortgage Loan Trust, 2005-RP3 1AF | | 0.697 | % | 9/25/35 | | 432,897 | | 347,237 | (a)(b) |
GSMPS Mortgage Loan Trust, 2006-RP1 1A2 | | 7.500 | % | 1/25/36 | | 937,775 | | 881,208 | (a) |
GSR Mortgage Loan Trust, 2005-AR3 3A1 | | 2.889 | % | 5/25/35 | | 540,970 | | 403,586 | (b) |
GSR Mortgage Loan Trust, 2005-AR4 2A1 | | 2.894 | % | 7/25/35 | | 846,508 | | 551,014 | (b) |
GSR Mortgage Loan Trust, 2005-AR5 1A1 | | 3.041 | % | 10/25/35 | | 402,956 | | 295,852 | (b) |
GSR Mortgage Loan Trust, 2006-10F 4A2 | | 6.303 | % | 1/25/37 | | 3,896,438 | | 541,303 | (b) |
Home Equity Asset Trust, 2004-2 M1 | | 1.142 | % | 7/25/34 | | 580,665 | | 414,471 | (b) |
Home Equity Asset Trust, 2005-3 M2 | | 0.787 | % | 8/25/35 | | 1,010,000 | | 918,709 | (b) |
HSI Asset Loan Obligation Trust, 2007-AR1 4A1 | | 5.827 | % | 1/25/37 | | 766,124 | | 504,928 | (b) |
IMPAC Secured Assets Corp., 2006-1 1A2B | | 0.547 | % | 5/25/36 | | 294,472 | | 129,841 | (b) |
IMPAC Secured Assets Corp., 2007-1 A2 | | 0.507 | % | 3/25/37 | | 1,200,000 | | 541,418 | (b) |
Indymac Inda Mortgage Loan Trust, 2007-AR3 1A1 | | 5.759 | % | 7/25/37 | | 374,512 | | 320,434 | (b) |
Indymac Inda Mortgage Loan Trust, 2007-AR7 1A1 | | 6.020 | % | 11/25/37 | | 74,614 | | 56,863 | (b) |
Indymac Index Mortgage Loan Trust, 2004-AR13 1A1 | | 3.106 | % | 1/25/35 | | 245,322 | | 178,364 | (b) |
Indymac Index Mortgage Loan Trust, 2005-AR15 A2 | | 5.099 | % | 9/25/35 | | 271,912 | | 198,151 | (b) |
Indymac Index Mortgage Loan Trust, 2005-AR31 3A1 | | 5.374 | % | 1/25/36 | | 706,817 | | 432,673 | (b) |
Indymac Index Mortgage Loan Trust, 2006-AR11 1A1 | | 2.953 | % | 6/25/36 | | 916,471 | | 478,671 | (b) |
Indymac Index Mortgage Loan Trust, 2006-AR25 4A3 | | 5.054 | % | 9/25/36 | | 1,400,000 | | 511,153 | (b) |
Indymac Index Mortgage Loan Trust, 2006-AR4 A1A | | 0.557 | % | 5/25/46 | | 718,686 | | 375,284 | (b) |
Indymac Index Mortgage Loan Trust, 2006-AR7 3A1 | | 5.539 | % | 5/25/36 | | 1,178,830 | | 661,928 | (b) |
Indymac Index Mortgage Loan Trust, 2006-AR7 5A1 | | 5.156 | % | 3/25/36 | | 1,139,745 | | 645,726 | (b) |
Indymac Index Mortgage Loan Trust, 2006-AR9 3A3 | | 5.527 | % | 6/25/36 | | 1,600,000 | | 1,201,826 | (b) |
Indymac Index Mortgage Loan Trust, 2007-AR5 2A1 | | 5.397 | % | 5/25/37 | | 5,093,808 | | 2,738,435 | (b)(c) |
Indymac Index Mortgage Loan Trust, 2007-AR15 2A1 | | 5.415 | % | 8/25/37 | | 738,711 | | 391,424 | (b) |
JPMorgan Alternative Loan Trust, 2006-A4 A7 | | 6.300 | % | 9/25/36 | | 1,000,000 | | 497,018 | (b) |
JPMorgan Alternative Loan Trust, 2006-S3 A3A | | 6.000 | % | 8/25/36 | | 2,000,000 | | 1,354,128 | (c) |
JPMorgan Alternative Loan Trust, 2007-A1 3A1 | | 6.164 | % | 3/25/37 | | 1,297,565 | | 832,036 | (b) |
JPMorgan Mortgage Trust, 2005-A3 3A4 | | 5.026 | % | 6/25/35 | | 3,354,920 | | 2,955,072 | (b)(c) |
JPMorgan Mortgage Trust, 2005-S3 1A1 | | 6.500 | % | 1/25/36 | | 2,263,062 | | 1,497,128 | |
JPMorgan Mortgage Trust, 2006-S2 1A24 | | 5.000 | % | 7/25/36 | | 654,702 | | 538,739 | |
JPMorgan Mortgage Trust, 2006-S2 2A1 | | 5.000 | % | 7/25/36 | | 422,244 | | 399,011 | |
JPMorgan Mortgage Trust, 2006-S2 2A2 | | 5.875 | % | 7/25/36 | | 573,585 | | 523,157 | |
JPMorgan Mortgage Trust, 2006-S4 A3 | | 6.000 | % | 1/25/37 | | 653,000 | | 477,633 | |
JPMorgan Mortgage Trust, 2007-S2 3A2 | | 6.000 | % | 6/25/37 | | 598,810 | | 541,551 | |
JPMorgan Mortgage Trust, 2007-S2 3A3 | | 6.500 | % | 6/25/37 | | 151,596 | | 137,527 | |
JPMorgan Mortgage Trust, 2007-S3 2A3 | | 6.000 | % | 8/25/22 | | 248,543 | | 231,171 | |
Lehman Mortgage Trust, 2006-3 2A2 | | 6.793 | % | 7/25/36 | | 8,883,113 | | 1,288,691 | (b) |
| | | | | | | | | | | |
See Notes to Financial Statements.
| | Western Asset Mortgage Defined Opportunity Fund Inc. 2010 Semi-Annual Report | | 5 |
Western Asset Mortgage Defined Opportunity Fund Inc.
Security | | Rate | | Maturity
Date | | Face
Amount | | Value | |
Lehman XS Trust, 2005-9N 1A1 | | 0.617 | % | 2/25/36 | | $ | 542,188 | | $ | 276,120 | (b) |
Lehman XS Trust, 2006-14N 3A2 | | 0.467 | % | 8/25/36 | | 605,775 | | 261,991 | (b) |
Lehman XS Trust, 2006-19 A4 | | 0.517 | % | 12/25/36 | | 1,047,866 | | 486,394 | (b) |
MASTR Adjustable Rate Mortgages Trust, 2004-12 5A1 | | 3.946 | % | 10/25/34 | | 343,187 | | 283,644 | (b) |
MASTR Adjustable Rate Mortgages Trust, 2004-13 3A7 | | 2.959 | % | 11/21/34 | | 600,000 | | 521,044 | (b)(c) |
MASTR Adjustable Rate Mortgages Trust, 2004-15 1A1 | | 3.753 | % | 12/25/34 | | 162,089 | | 117,033 | (b) |
MASTR Adjustable Rate Mortgages Trust, 2006-OA1 1A1 | | 0.557 | % | 4/25/46 | | 642,405 | | 339,468 | (b) |
MASTR Alternative Loans Trust, 2006-2 2A4 | | 6.803 | % | 3/25/36 | | 3,191,000 | | 501,805 | (b) |
MASTR Reperforming Loan Trust, 2006-2 1A1 | | 5.688 | % | 5/25/36 | | 2,924,282 | | 2,726,543 | (a)(b)(c) |
Merrill Lynch Mortgage Investors Trust, 2005-A2 A5 | | 2.800 | % | 2/25/35 | | 650,000 | | 591,110 | (b)(c) |
Merrill Lynch Mortgage Investors Trust, 2006-A1 2A1 | | 5.964 | % | 3/25/36 | | 191,499 | | 127,953 | (b) |
Morgan Stanley Mortgage Loan Trust, 2004-6AR 2A2 | | 3.317 | % | 8/25/34 | | 822,529 | | 714,482 | (b) |
Morgan Stanley Mortgage Loan Trust, 2005-5AR 4A1 | | 5.460 | % | 9/25/35 | | 93,773 | | 70,653 | (b) |
Morgan Stanley Mortgage Loan Trust, 2006-3AR 1A3 | | 0.607 | % | 3/25/36 | | 1,389,199 | | 662,109 | (b) |
Morgan Stanley Mortgage Loan Trust, 2006-8AR 1A2 | | 0.417 | % | 6/25/36 | | 545,512 | | 268,941 | (b) |
Morgan Stanley Mortgage Loan Trust, 2007-15AR 4A1 | | 5.848 | % | 11/25/37 | | 3,205,147 | | 1,967,097 | (b)(c) |
Nomura Asset Acceptance Corp., 2004-R1 A1 | | 6.500 | % | 3/25/34 | | 240,724 | | 237,036 | (a)(c) |
Park Place Securities Inc., 2004-WCW1 M2 | | 1.027 | % | 9/25/34 | | 4,900,000 | | 4,126,057 | (b)(c) |
Prime Mortgage Trust, 2006-DR1 2A1 | | 5.500 | % | 5/25/35 | | 1,962,127 | | 1,663,552 | (a) |
RAAC Series, 2006-RP3 A | | 0.617 | % | 5/25/36 | | 1,455,843 | | 810,539 | (a)(b) |
RAAC Series, 2007-RP2 A | | 0.697 | % | 2/25/46 | | 728,430 | | 374,397 | (a)(b) |
RAAC Series, 2007-RP3 A | | 0.727 | % | 10/25/46 | | 2,143,598 | | 1,249,294 | (a)(b) |
RAAC Series, 2007-SP1 A2 | | 0.697 | % | 3/25/37 | | 3,000,000 | | 2,201,346 | (b)(c) |
RAAC Series, 2007-SP3 A1 | | 1.547 | % | 9/25/47 | | 1,072,980 | | 742,320 | (b) |
Renaissance Home Equity Loan Trust, 2002-3 A | | 1.107 | % | 12/25/32 | | 1,629,564 | | 1,177,658 | (b)(c) |
Renaissance Home Equity Loan Trust, 2006-2 AV3 | | 0.587 | % | 8/25/36 | | 800,000 | | 416,754 | (b) |
Residential Accredit Loans Inc., 2006-QA1 A11 | | 3.802 | % | 1/25/36 | | 1,400,113 | | 720,697 | (b) |
Residential Accredit Loans Inc., 2006-QA1 A31 | | 6.156 | % | 1/25/36 | | 4,690,204 | | 2,824,774 | (b)(c) |
Residential Accredit Loans Inc., 2006-QA4 A | | 0.527 | % | 5/25/36 | | 1,021,124 | | 458,105 | (b) |
Residential Accredit Loans Inc., 2007-QA2 A1 | | 0.477 | % | 2/25/37 | | 1,233,232 | | 660,779 | (b) |
Residential Asset Securitization Trust, 2005-A5 A1 | | 0.647 | % | 5/25/35 | | 1,280,623 | | 1,046,083 | (b) |
Residential Asset Securitization Trust, 2005-A5 A2 | | 4.853 | % | 5/25/35 | | 4,224,394 | | 290,880 | (b) |
Residential Asset Securitization Trust, 2005-A13 1A3 | | 0.817 | % | 10/25/35 | | 499,425 | | 339,294 | (b) |
Residential Asset Securitization Trust, 2005-A13 1A4 | | 4.683 | % | 10/25/35 | | 499,425 | | 51,494 | (b) |
Residential Asset Securitization Trust, 2006-A1 1A6 | | 0.847 | % | 4/25/36 | | 3,245,963 | | 1,966,043 | (b)(c) |
Residential Asset Securitization Trust, 2006-A1 1A7 | | 5.153 | % | 4/25/36 | | 3,245,963 | | 331,028 | (b) |
Residential Asset Securitization Trust, 2007-A2 1A1 | | 6.000 | % | 4/25/37 | | 1,010,328 | | 706,787 | |
Residential Funding Mortgage Securities I, 2006-SA2 4A1 | | 5.822 | % | 8/25/36 | | 1,512,744 | | 1,296,323 | (b) |
Residential Funding Securities Corp., 2003-RP2 A1 | | 0.797 | % | 6/25/33 | | 104,439 | | 81,792 | (a)(b) |
Structured ARM Loan Trust, 2004-7 A3 | | 1.078 | % | 6/25/34 | | 288,923 | | 223,789 | (b) |
Structured ARM Loan Trust, 2004-16 1A2 | | 2.650 | % | 11/25/34 | | 1,010,422 | | 754,479 | (b) |
Structured ARM Loan Trust, 2004-18 1A2 | | 2.805 | % | 12/25/34 | | 1,079,822 | | 838,776 | (b) |
Structured ARM Loan Trust, 2005-1 1A1 | | 2.744 | % | 2/25/35 | | 2,273,205 | | 1,597,747 | (b)(c) |
Structured ARM Loan Trust, 2005-4 3A1 | | 2.727 | % | 3/25/35 | | 184,689 | | 140,717 | (b) |
| | | | | | | | | | | |
See Notes to Financial Statements.
6 | | Western Asset Mortgage Defined Opportunity Fund Inc. 2010 Semi-Annual Report | | |
Schedule of investments (unaudited) (cont’d)
June 30, 2010
Western Asset Mortgage Defined Opportunity Fund Inc.
Security | | Rate | | Maturity
Date | | Face
Amount | | Value | |
Structured ARM Loan Trust, 2005-4 5A | | 5.555 | % | 3/25/35 | | $ | 1,128,610 | | $ | 1,021,734 | (b) |
Structured ARM Loan Trust, 2005-7 1A3 | | 2.593 | % | 4/25/35 | | 239,730 | | 164,779 | (b) |
Structured ARM Loan Trust, 2005-12 3A1 | | 2.568 | % | 6/25/35 | | 282,825 | | 204,127 | (b) |
Structured ARM Loan Trust, 2005-15 1A1 | | 4.599 | % | 7/25/35 | | 617,362 | | 433,154 | (b) |
Structured ARM Loan Trust, 2006-1 5A2 | | 5.209 | % | 2/25/36 | | 550,000 | | 336,991 | (b) |
Structured ARM Loan Trust, 2006-4 4A1 | | 5.685 | % | 5/25/36 | | 1,081,754 | | 825,675 | (b) |
Structured ARM Loan Trust, 2006-8 3A5 | | 5.501 | % | 9/25/36 | | 2,470,000 | | 1,682,755 | (b) |
Structured ARM Loan Trust, 2007-7 1A1 | | 0.647 | % | 8/25/37 | | 3,229,382 | | 1,919,800 | (b) |
Structured Asset Investment Loan Trust, 2003-BC10 A4 | | 1.347 | % | 10/25/33 | | 860,000 | | 635,211 | (b) |
Structured Asset Mortgage Investments Inc., 2006-AR5 4A1 | | 0.567 | % | 5/25/46 | | 976,549 | | 486,449 | (b) |
Structured Asset Securities Corp., 2003-37A 3A7 | | 2.464 | % | 12/25/33 | | 572,854 | | 516,874 | (b)(c) |
Structured Asset Securities Corp., 2004-NP1 A | | 0.747 | % | 9/25/33 | | 477,797 | | 387,016 | (a)(b)(c)(d)(e) |
Structured Asset Securities Corp., 2005-2XS 1A5B | | 4.650 | % | 2/25/35 | | 3,332,020 | | 2,906,018 | |
Structured Asset Securities Corp., 2005-4XS 3A4 | | 4.790 | % | 3/25/35 | | 2,710,000 | | 2,490,911 | (c) |
Structured Asset Securities Corp., 2005-5 2A2 | | 5.500 | % | 4/25/35 | | 500,000 | | 395,147 | |
Structured Asset Securities Corp., 2006-RF3 1A1 | | 6.000 | % | 10/25/36 | | 231,014 | | 224,024 | (a) |
Structured Asset Securities Corp., 2006-RF4 2A1 | | 6.000 | % | 10/25/36 | | 195,425 | | 169,369 | (a) |
Thornburg Mortgage Securities Trust, 2007-4 2A1 | | 6.207 | % | 9/25/37 | | 1,879,964 | | 1,794,136 | (b)(c) |
Truman Capital Mortgage Loan Trust, 2006-1 A | | 0.607 | % | 3/25/36 | | 512,177 | | 312,428 | (a)(b)(d) |
Wachovia Mortgage Loan Trust LLC, 2005-B 2A2 | | 5.032 | % | 10/20/35 | | 562,636 | | 530,547 | (b) |
Wachovia Mortgage Loan Trust LLC, 2005-B 2A3 | | 5.032 | % | 10/20/35 | | 1,450,000 | | 1,231,419 | (b) |
Wachovia Mortgage Loan Trust LLC, 2006-ALT1 A2 | | 0.527 | % | 1/25/37 | | 2,350,000 | | 1,203,501 | (b) |
WaMu Mortgage Pass-Through Certificates, 2004-AR10 A3 | | 0.925 | % | 7/25/44 | | 211,400 | | 165,945 | (b) |
WaMu Mortgage Pass-Through Certificates, 2005-7 1A6 | | 46.231 | % | 9/25/35 | | 127,821 | | 182,187 | (b) |
WaMu Mortgage Pass-Through Certificates, 2005-9 5A4 | | 33.387 | % | 11/25/35 | | 254,931 | | 283,211 | (b) |
WaMu Mortgage Pass-Through Certificates, 2005-10 2A3 | | 1.247 | % | 11/25/35 | | 462,968 | | 276,680 | (b) |
WaMu Mortgage Pass Through Certificates, 2005-AR5 A5 | | 2.703 | % | 5/25/35 | | 3,400,000 | | 3,036,999 | (b)(c) |
WaMu Mortgage Pass Through Certificates, 2005-AR5 A6 | | 2.703 | % | 5/25/35 | | 550,000 | | 510,713 | (b) |
WaMu Mortgage Pass Through Certificates, 2005-AR14 1A1 | | 5.029 | % | 12/25/35 | | 439,466 | | 412,798 | (b) |
WaMu Mortgage Pass Through Certificates, 2005-AR18 1A3A | | 5.198 | % | 1/25/36 | | 440,000 | | 349,914 | (b) |
WaMu Mortgage Pass-Through Certificates, 2006-AR8 3A2 | | 6.013 | % | 8/25/36 | | 290,000 | | 227,694 | (b) |
WaMu Mortgage Pass Through Certificates, 2006-AR10 1A2 | | 5.871 | % | 9/25/36 | | 331,221 | | 290,190 | (b) |
WaMu Mortgage Pass-Through Certificates, 2006-AR10 A1 | | 0.447 | % | 12/25/36 | | 1,122,827 | | 576,488 | (b) |
WaMu Mortgage Pass-Through Certificates, 2006-AR16 2A2 | | 5.578 | % | 12/25/36 | | 800,000 | | 629,082 | (b) |
WaMu Mortgage Pass-Through Certificates, 2007-HY3 1A1 | | 5.487 | % | 3/25/37 | | 1,995,235 | | 1,477,041 | (b) |
WaMu Mortgage Pass-Through Certificates, 2007-HY6 1A1 | | 5.540 | % | 6/25/37 | | 5,488,448 | | 4,022,180 | (b) |
WaMu Mortgage Pass-Through Certificates, 2007-HY7 1A1 | | 4.515 | % | 7/25/37 | | 325,824 | | 227,196 | (b) |
WaMu Mortgage Pass-Through Certificates, 2007-HY7 3A1 | | 5.765 | % | 7/25/37 | | 713,963 | | 552,745 | (b) |
WaMu Mortgage Pass Through Certificates, 2007-OA2 1A | | 1.121 | % | 3/25/47 | | 448,161 | | 246,722 | (b) |
WaMu Mortgage Pass-Through Certificates, 2007-OA2 2A | | 3.109 | % | 3/25/47 | | 453,828 | | 249,954 | (b) |
WaMu Alternative Mortgage Pass-Through Certificates, 2006-5 1A1 | | 0.947 | % | 7/25/36 | | 360,559 | | 175,213 | (b) |
WaMu Alternative Mortgage Pass-Through Certificates, 2007-3 A9 | | 6.317 | % | 4/25/37 | | 10,184,441 | | 1,232,692 | (b) |
| | | | | | | | | | | |
See Notes to Financial Statements.
| | Western Asset Mortgage Defined Opportunity Fund Inc. 2010 Semi-Annual Report | | 7 |
Western Asset Mortgage Defined Opportunity Fund Inc.
Security | | Rate | | Maturity
Date | | Face
Amount | | Value | |
WaMu Inc. Pass-Through Certificates, 2007-HY3 4A1 | | 5.293 | % | 3/25/37 | | $ | 370,415 | | $ | 314,800 | (b) |
Wells Fargo Mortgage Backed Securities Trust, 2007-8 1A14 | | 37.697 | % | 7/25/37 | | 592,677 | | 881,268 | (b) |
Wells Fargo Mortgage Backed Securities Trust, 2007-8 2A6 | | 6.000 | % | 7/25/37 | | 350,000 | | 276,497 | |
Total Residential Mortgage-Backed Securities (Cost — $163,813,147) | | | | 166,869,447 | |
Asset-Backed Securities — 0.9% | | | | | | | | | |
Manufactured Housing — 0.9% | | | | | | | | | |
Associates Manufactured Housing Pass-Through Certificates, 1997-1 B1 | | 7.600 | % | 6/15/28 | | 502,000 | | 529,588 | (b)(e) |
Mid-State Trust, 2005-1 M2 | | 7.079 | % | 1/15/40 | | 1,759,829 | | 1,591,050 | |
Total Asset-Backed Securities (Cost — $2,046,036) | | | | | | | | 2,120,638 | |
| | | | | | | | | |
| | | | | | Shares | | | |
PPIP Limited Partnership — 27.7% | | | | | | | | | |
RLJ Western Asset Public Private Master Fund, LP (Cost — $65,454,386) | | | | | | 1 | | 67,121,476 | (a)(d)(e) |
Total Investments before Short-Term Investment (Cost — $233,206,033) | | | | 238,010,736 | |
Short-Term Investment — 1.7% | | | | | | | | | |
Repurchase Agreement — 1.7% | | | | | | | | | |
State Street Bank & Trust Co., repurchase agreement dated 6/30/10; Proceeds at maturity — $4,282,000 (Fully collateralized by U.S. Treasury Notes, 1.000% due 4/30/12; Market Value — $4,369,836) (Cost — $4,282,000) | | 0.000 | % | 7/1/10 | | $ | 4,282,000 | | 4,282,000 | |
Total Investments — 100.0% (Cost — $237,488,033#) | | | | | | | | 242,292,736 | |
| | | | | | | | | | | |
(a) Security is exempt from registration under Rule 144A of the Securities Act of 1933. This security may be resold in transactions that are exempt from registration, normally to qualified institutional buyers. This security has been deemed liquid pursuant to guidelines approved by the Board of Directors, unless otherwise noted.
(b) Variable rate security. Interest rate disclosed is that which is in effect at June 30, 2010.
(c) All or a portion of this security is held by the counterparty as collateral for open reverse repurchase agreements.
(d) Security is valued in good faith at fair value in accordance with procedures approved by the Board of Directors (See Note 1).
(e) Illiquid security.
# Aggregate cost for federal income tax purposes is substantially the same.
Abbreviation used in this schedule:
ARM — Adjustable Rate Mortgage
See Notes to Financial Statements.
8 | | Western Asset Mortgage Defined Opportunity Fund Inc. 2010 Semi-Annual Report | | |
Statement of assets and liabilities (unaudited)
June 30, 2010
Assets: | | | |
Investments, at value (Cost — $172,033,647) | | $ | 175,171,260 | |
PPIP Limited Partnership, at value (Cost — $65,454,386) | | 67,121,476 | |
Cash | | 781 | |
Interest receivable | | 731,091 | |
Receivable for securities sold | | 20,243 | |
Prepaid expenses | | 17,999 | |
Total Assets | | 243,062,850 | |
| | | |
Liabilities: | | | |
Payable for open reverse repurchase agreement (Note 3) | | 36,786,750 | |
Investment management fee payable | | 245,338 | |
Interest payable (Note 3) | | 64,271 | |
Allocation subadvisor fee payable | | 12,267 | |
Directors’ fees payable | | 3,220 | |
Accrued expenses | | 157,007 | |
Total Liabilities | | 37,268,853 | |
Total Net Assets | | $ | 205,793,997 | |
| | | |
Net Assets: | | | |
Par value ($0.001 par value, 10,354,697 shares issued and outstanding; 100,000,000 shares authorized) | | $ | 10,355 | |
Paid-in capital in excess of par value | | 197,352,410 | |
Undistributed net investment income | | 3,577,867 | |
Accumulated net realized gain on investments | | 48,662 | |
Net unrealized appreciation on investments | | 4,804,703 | |
Total Net Assets | | $ | 205,793,997 | |
| | | |
Shares Outstanding | | 10,354,697 | |
| | | |
Net Asset Value | | $19.87 | |
See Notes to Financial Statements.
| | Western Asset Mortgage Defined Opportunity Fund Inc. 2010 Semi-Annual Report | | 9 |
Statement of operations (unaudited)
For the Period Ended June 30, 2010†
Investment Income: | | | |
Interest | | $ | 4,825,980 | |
Income from PPIP Limited Partnership (Note 1) | | 2,820,476 | |
Total Investment Income | | 7,646,456 | |
| | | |
Expenses: | | | |
Investment management fee (Note 2) | | 869,100 | |
Audit and tax | | 72,411 | |
Interest expense (Note 3) | | 64,271 | |
Allocation subadvisor fee (Note 2) | | 43,455 | |
Legal fees | | 40,453 | |
Shareholder reports | | 39,240 | |
Directors’ fees | | 19,788 | |
Transfer agent fees | | 8,686 | |
Custody fees | | 3,742 | |
Miscellaneous expenses | | 9,025 | |
Total Expenses | | 1,170,171 | |
Net Investment Income | | 6,476,285 | |
| | | |
Realized and Unrealized Gain (Loss) on Investments (Notes 1 and 3): | | | |
Net Realized Gain From Investment Transactions | | 48,662 | |
Change in Net Unrealized Appreciation/Depreciation From Investments | | 4,804,703 | |
Net Gain on Investments | | 4,853,365 | |
Increase in Net Assets From Operations | | $ | 11,329,650 | |
† For the period February 24, 2010 (inception date) to June 30, 2010. | | | |
See Notes to Financial Statements.
10 | | Western Asset Mortgage Defined Opportunity Fund Inc. 2010 Semi-Annual Report | | |
Statement of changes in net assets (unaudited)
For the Period Ended June 30, | | 2010† |
| | | |
Operations: | | | |
Net investment income | | $ | 6,476,285 | |
Net realized gain | | 48,662 | |
Change in net unrealized appreciation/depreciation | | 4,804,703 | |
Increase in Net Assets From Operations | | 11,329,650 | |
| | | |
Distributions to Shareholders From (Note 1): | | | |
Net investment income | | (2,898,418) | |
Decrease in Net Assets From Distributions to Shareholders | | (2,898,418) | |
| | | |
Fund Share Transactions: | | | |
Net proceeds from sale of shares (10,350,543 shares issued) | | 197,281,552 | |
Reinvestment of distributions (4,154 shares reinvested) | | 81,213 | |
Increase in Net Assets From Fund Share Transactions | | 197,362,765 | |
Increase in Net Assets | | 205,793,997 | |
| | | |
Net Assets: | | | |
Beginning of period | | — | |
End of period* | | $ | 205,793,997 | |
* Includes undistributed net investment income of: | | $3,577,867 | |
† For the period February 24, 2010 (inception date) to June 30, 2010. | | | |
See Notes to Financial Statements.
| | Western Asset Mortgage Defined Opportunity Fund Inc. 2010 Semi-Annual Report | | 11 |
Statement of cash flows (unaudited)
For the Period Ended June 30, 2010†
Cash Flows Provided (Used) by Operating Activities: | | | |
Interest and dividends received | | $ | 6,174,364 | |
Operating expenses paid | | (706,067) | |
Net purchases of short-term investments | | (4,282,000) | |
Purchases of long-term investments | | (227,597,027) | |
Proceeds from disposition of long-term investments | | (4,839,586) | |
Net Cash Used By Operating Activities | | (231,250,316) | |
| | | |
Cash Flows Provided (Used) by Financing Activities: | | | |
Cash distributions paid on Common Stock | | (2,817,205) | |
Proceeds from sale of shares | | 197,281,552 | |
Proceeds from reverse repurchase agreements | | 36,786,750 | |
Net Cash Provided By Financing Activities | | 231,251,097 | |
Net Increase in Cash | | 781 | |
Cash, Beginning of year | | 0 | |
Cash, End of year | | $ | 781 | |
| | | |
Reconciliation of Increase in Net Assets from Operations to Net Cash Flows Provided (Used) by Operating Activities: | | | |
Increase in Net Assets From Operations | | $ | 11,329,650 | |
Accretion of discount on investments | | (883,695) | |
Amortization of premium on investments | | 142,694 | |
Increase in investments, at value | | (241,551,735) | |
Increase in interest and dividends receivable | | (731,091) | |
Increase in receivable for securities sold | | (20,243) | |
Increase in prepaid expenses | | (17,999) | |
Increase in interest payable | | 64,271 | |
Increase in accrued expenses | | 417,832 | |
Total Adjustments | | (242,579,966) | |
Net Cash Flows Used by Operating Activities | | $ | (231,250,316) | |
| | | |
Non-Cash Financing Activities: | | | |
Proceeds from reinvestment of distributions | | $81,213 | |
† For the period February 24, 2010 (inception date) to June 30, 2010. | | | |
See Notes to Financial Statements.
12 | | Western Asset Mortgage Defined Opportunity Fund Inc. 2010 Semi-Annual Report | | |
Financial highlights
For a share of capital stock outstanding throughout the period ended December 31, unless otherwise noted:
| | 20101 | |
| | | |
Net asset value, beginning of period | | $19.06 | 2 |
| | | |
Income (loss) from operations: | | | |
Net investment income | | 0.63 | |
Net realized and unrealized gain | | 0.46 | |
Total income from operations | | 1.09 | |
| | | |
Less distributions from: | | | |
Net investment income | | (0.28) | |
Total distributions | | (0.28) | |
| | | |
Net asset value, end of period | | $19.87 | |
| | | |
Market price, end of period | | $19.95 | |
Total return, based on NAV 3,4 | | 5.75 | % |
Total return, based on Market Price 4 | | 1.18 | % |
| | | |
Net assets, end of period (000s) | | $205,794 | |
| | | |
Ratios to average net assets: | | | |
Gross expenses5 | | 1.72 | % |
Gross expenses, excluding interest expense5 | | 1.63 | |
Net expenses5 | | 1.72 | |
Net expenses, excluding interest expense5 | | 1.63 | |
Net investment income5 | | 9.54 | |
| | | |
Portfolio turnover rate | | 4 | % |
1 For the period February 24, 2010 (inception date) to June 30, 2010.
2 Initial public offering price of $20.00 per share less offering costs and sales load totaling $0.94 per share.
3 Performance figures may reflect fee waivers and/or expense reimbursements. In the absence of fee waivers and/or expense reimbursements, the total return would have been lower. Past performance is no guarantee of future results. Total returns for periods of less than one year are not annualized.
4 The total return calculation assumes that distributions are reinvested in accordance with the Fund’s dividend reinvestment plan. Past performance is no guarantee of future results. Total returns for periods of less than one year are not annualized.
5 Annualized.
See Notes to Financial Statements.
| | Western Asset Mortgage Defined Opportunity Fund Inc. 2010 Semi-Annual Report | | 13 |
Notes to financial statements (unaudited)
1. Organization and significant accounting policies
Western Asset Mortgage Defined Opportunity Fund Inc. (the “Fund”) was incorporated in Maryland on December 11, 2009, and is registered as a non-diversified, limited term, closed-end management investment company under the Investment Company Act of 1940, as amended, (the “1940 Act”). The Fund’s primary investment objective is to provide current income by investing primarily in a diverse portfolio of mortgage-backed securities (“MBS”), consisting primarily of non-agency residential mortgage-backed securities (“RMBS”) and commercial mortgage-backed securities (“CMBS”). The Fund invests at least 80% of its Managed Assets (total assets of the Fund plus any implicit leverage at the Master Fund (defined below) level attributable to the Fund’s investment in the Feeder Fund (defined below)) in MBS directly, and indirectly by investing in a private feeder fund (the “Feeder Fund”) which invests substantially all of its assets available for investment, alongside the U.S. Department of the Treasury (the “Treasury”), in a master fund (the “Master Fund”) that has been organized to invest directly in MBS and other assets eligible for purchase under the Legacy Securities Public-Private Investment Program (“PPIP”). As a secondary investment objective, the Fund will seek capital appreciation.
The following are significant accounting policies consistently followed by the Fund and are in conformity with U.S. generally accepted accounting principles (“GAAP”). Estimates and assumptions are required to be made regarding assets, liabilities and changes in net assets resulting from operations when financial statements are prepared. Changes in the economic environment, financial markets and any other parameters used in determining these estimates could cause actual results to differ. Subsequent events have been evaluated through the date the financial statements were issued.
(a) Investment valuation. Debt securities are valued at the mean between the last quoted bid and asked prices provided by an independent pricing service, which are based on transactions in debt obligations, quotations from bond dealers, market transactions in comparable securities and various other relationships between securities. Equity securities for which market quotations are available are valued at the last reported sales price or official closing price on the primary market or exchange on which they trade. When prices are not readily available, or are determined not to reflect fair value, such as when the value of a security has been significantly affected by events after the close of the exchange or market on which the security is principally traded, but before the Fund calculates its net asset value, the Fund values these securities at fair value as determined in accordance with procedures approved by the Fund’s Board of Directors. Short-term obligations with maturities of 60 days or less are valued at amortized cost, which approximates fair value.
The Fund’s investment in the Feeder Fund is valued by determining the Fund’s pro rata ownership interest in the net assets of the Master Fund. On a daily basis, the Fund receives the net asset value of the Master Fund, which is used along with other inputs to derive a value for the Fund’s investment in the Feeder Fund.
The Fund has adopted Financial Accounting Standards Board Codification Topic 820 (“ASC Topic 820”). ASC Topic 820 establishes a single definition of fair value, creates a three-tier hierarchy as a framework for measuring fair value based on inputs used to value the Fund’s investments, and requires additional disclosure about fair value. The hierarchy of inputs is summarized below.
· Level 1 – quoted prices in active markets for identical investments
· Level 2 – other significant observable inputs (including quoted prices for similar investments, interest rates, prepayment speeds, credit risk, etc.)
· Level 3 – significant unobservable inputs (including the Fund’s own assumptions in determining the fair value of investments)
The inputs or methodology used for valuing securities are not necessarily an indication of the risk associated with investing in those securities.
The Fund uses valuation techniques to measure fair value that are consistent with the market approach and/or income approach, depending on the type of the security and the particular circumstance. The market approach uses prices and other relevant information generated by market transactions involving
14 | | Western Asset Mortgage Defined Opportunity Fund Inc. 2010 Semi-Annual Report | | |
Notes to financial statements (unaudited) (cont’d)
identical or comparable securities. The income approach uses valuation techniques to convert future amounts of cash flow to a single present amount.
The following is a summary of the inputs used in valuing the Fund’s assets carried at fair value:
Description | | Quoted Prices
(Level 1) | | Other Significant
Observable Inputs
(Level 2) | | Significant
Unobservable
Inputs
(Level 3) | | Total | |
Long-term investments†: | | | | | | | | | |
Residential mortgage-backed securities | | — | | $ | 166,869,447 | | — | | $ | 166,869,447 | |
Asset-backed securities | | — | | 2,120,638 | | — | | 2,120,638 | |
Commercial mortgage-backed securities | | — | | 1,899,175 | | — | | 1,899,175 | |
PPIP limited partnership | | — | | — | | $ | 67,121,476 | | 67,121,476 | |
Total long-term investments | | — | | $ | 170,889,260 | | $ | 67,121,476 | | $ | 238,010,736 | |
Short-term investment† | | — | | 4,282,000 | | — | | 4,282,000 | |
Total investments | | — | | $ | 175,171,260 | | $ | 67,121,476 | | $ | 242,292,736 | |
† See Schedule of Investments for additional detailed categorizations.
(b) Repurchase agreements. The Fund may enter into repurchase agreements with institutions that its investment adviser has determined are creditworthy. Each repurchase agreement is recorded at cost. Under the terms of a typical repurchase agreement, a fund takes possession of an underlying debt obligation subject to an obligation of the seller to repurchase, and of the fund to resell, the obligation at an agreed-upon price and time, thereby determining the yield during a fund’s holding period. When entering into repurchase agreements, it is the Fund’s policy that its custodian or a third party custodian, acting on the Fund’s behalf, take possession of the underlying collateral securities, the market value of which, at all times, at least equals the principal amount of the repurchase transaction, including accrued interest. To the extent that any repurchase transaction maturity exceeds one business day, the value of the collateral is marked to market and measured against the value of the agreement in an effort to ensure the adequacy of the collateral. If the counterparty defaults, the Fund generally has the right to use the collateral to satisfy the terms of the repurchase transaction. However, if the market value of the collateral declines during the period in which the Fund seeks to assert its rights or if bankruptcy proceedings are commenced with respect to the seller of the security, realization of the collateral by the Fund may be delayed or limited.
(c) Reverse repurchase agreements. The Fund may enter into reverse repurchase agreements. Under the terms of a typical reverse repurchase agreement, a Fund sells a security subject to an obligation to repurchase the security from the buyer at an agreed-upon time and price. In the event the buyer of securities under a reverse repurchase agreement files for bankruptcy or becomes insolvent, the fund’s use of the proceeds of the agreement may be restricted pending a determination by the counterparty, or its trustee or receiver, whether to enforce the Fund’s obligation to repurchase the securities. In entering into reverse repurchase agreements, the Fund will maintain cash, U.S. government securities or other liquid debt obligations at least equal in value to its obligations with respect to reverse repurchase agreements or will take other actions permitted by law to cover its obligations.
(d) PPIP investment. On March 23, 2009, the Treasury, in conjunction with the Federal Deposit Insurance Corporation and the Board of Governors of the United States Federal Reserve (the “Federal Reserve”), announced the creation of PPIP. PPIP calls for the creation of public private investment funds, such as the Master Fund, through which privately raised capital and Treasury capital are pooled together to facilitate the purchase of PPIP Eligible Assets. PPIP Eligible Assets are those assets determined by the Treasury, from time to time, to be eligible for investment by the Master Fund. Eligible Assets currently include RMBS and CMBS issued prior to 2009 that were originally rated AAA or that received an equivalent rating by two or more nationally recognized statistical rating organizations without ratings enhancement and that are secured directly by actual mortgage loans, leases or other assets and not other securities (other than certain swap positions, as determined by the Treasury).
| | Western Asset Mortgage Defined Opportunity Fund Inc. 2010 Semi-Annual Report | | 15 |
The Feeder Fund and Master Fund are Delaware limited partnerships formed to provide certain qualified institutional investors with access to PPIP. The Feeder Fund will participate in PPIP by investing all or substantially all of its assets available for investment, alongside the Treasury, in the Master Fund. The Feeder Fund’s investment objective is to generate attractive returns for investors through long term opportunistic investments in PPIP Eligible Assets. The Master Fund has an investment objective that is consistent with that of the Feeder Fund. The Fund’s interests in the Feeder Fund will be substantially identical to those of the other investors in the Feeder Fund in all material respects except with respect to fees payable in connection with PPIP. Investors in the Fund pay a management fee on the Fund’s Managed Assets, which includes total assets attributable to the Fund’s direct investments and its indirect investment in the leveraged Master Fund. The Feeder Fund invests all of its assets in the Master Fund. The Master Fund invests directly in a portfolio of PPIP Eligible Assets and borrows from the Treasury through a senior secured term loan facility. Neither the Feeder Fund nor the Master Fund is registered with the Securities and Exchange Commission as an investment company under the 1940 Act, and neither the Feeder Fund nor the Master Fund’s interests are registered under the Securities Act of 1933, as amended.
On March 12, 2010 the Fund made a subscription for an investment into the Feeder Fund of $68,000,000, $51,000,000 of which was immediately drawn and invested into the Feeder Fund. The Fund made additional investments into the Feeder Fund of $6,800,000 and $5,440,000 on April 27, 2010 and May 20, 2010, respectively. As of June 30, 2010, the Fund had a remaining undrawn capital commitment to the Feeder Fund of $4,760,000.
The Fund, as a new investor in the Feeder Fund, was required to pay interest on a portion of its investment into the Feeder Fund at an annual rate equal to the prime rate plus 2%. This interest equivalent or “equalization” payment, which totaled $432,312, compensated prior investors for the use of their contributed capital between prior and subsequent closings and to therefore ensure the equitable treatment of all investors.
(e) Leverage. The Fund may seek to enhance the level of its current distributions to holders of common stock through the use of leverage. The Fund may use leverage directly at the Fund level through borrowings, including loans from certain financial institutions or through a qualified government sponsored program, the use of reverse repurchase agreements and/or the issuance of debt securities (collectively, “Borrowings”), and possibly through the issuance of preferred stock (“Preferred Stock”), in an aggregate amount of up to approximately 33 1/3% of the Fund’s Total Assets immediately after such Borrowings and/or issuances of Preferred Stock. “Total Assets” means net assets of the Fund plus the amount of any Borrowings and assets attributable to Preferred Stock that may be outstanding. Currently, the Fund has no intention to issue notes or debt securities or Preferred Stock. In addition, the Fund may enter into additional reverse repurchase agreements and/or use similar investment management techniques that may provide leverage, but which are not subject to the foregoing 33 1/3% limitation so long as the Fund has covered its commitment with respect to such techniques by segregating liquid assets, entering into offsetting transactions or owning positions covering related obligations.
The Master Fund is expected to borrow money from the Treasury for investment purposes in an amount equal to approximately 50% of the Master Fund’s total assets immediately after giving effect to the borrowing (the “Treasury Debt Financing”). The Master Fund will bear the interest expense and other financing costs arising out of its use of the Treasury Debt Financing. To the extent the Fund invests in the Master Fund, through its investment in the Feeder Fund, the Fund will be subject to the implicit risks (and potential benefits) of such leverage. The Fund will also bear its allocable share of the Master Fund’s cost of leverage. While such implicit leverage will not constitute actual borrowing of the Fund for purposes of the Investment Company Act of 1940, as amended (the “1940 Act”), in an effort to mitigate the overall risk of leverage, the Fund does not intend to incur additional direct leverage at the Fund level to the extent that its existing direct leverage at the Fund level and its implicit leverage through its investment in the Master Fund exceeds 33 1/3% of the Fund’s Managed Assets immediately after Borrowings and/or issuances Preferred Stock at the Fund level. “Managed
16 | | Western Asset Mortgage Defined Opportunity Fund Inc. 2010 Semi-Annual Report | | |
Notes to financial statements (unaudited) (cont’d)
Assets” means the Total Assets of the Fund plus any implicit leverage at the Master Fund level attributable to the Fund’s investment in the Feeder Fund.
(f) Cash flow information. The Fund invests in securities and distributes dividends from net investment income and net realized gains, which are paid in cash and may be reinvested at the discretion of shareholders. These activities are reported in the Statement of Changes in Net Assets and additional information on cash receipts and cash payments are presented in the Statement of Cash Flows.
(g) Credit and market risk. Investments in securities that are collateralized by residential real estate mortgages are subject to certain credit and liquidity risks. When market conditions result in an increase in default rates of the underlying mortgages and the foreclosure values of underlying real estate properties are materially below the outstanding amount of these underlying mortgages, collection of the full amount of accrued interest and principal on these investments may be doubtful. Such market conditions may significantly impair the value and liquidity of these investments and may result in a lack of correlation between their credit ratings and values.
(h) Security transactions and investment income. Security transactions are accounted for on a trade date basis. Interest income, adjusted for amortization of premium and accretion of discount, is recorded on the accrual basis. Dividend income is recorded on the ex-dividend date. The cost of investments sold is determined by use of the specific identification method. To the extent any issuer defaults or a credit event occurs that impacts the issuer, the Fund may halt any additional interest income accruals and consider the realizability of interest accrued up to the date of default or credit event.
PPIP makes distributions from net investment income to the Fund, if any, on a monthly basis. In the event that PPIP’s net investment income for the month exceeds its distribution, the difference will be recorded on the Fund’s books as income and offset by a reduction to the cost of the PPIP investment. For the period February 24, 2010 to June 30, 2010 the Fund has recorded $2,820,476 in net investment income from PPIP.
(i) Distributions to shareholders. Distributions from net investment income for the Fund, if any, are declared and paid on a monthly basis. Distributions of net realized gains, if any, are declared at least annually. Distributions are recorded on the ex-dividend date and are determined in accordance with income tax regulations, which may differ from GAAP.
(j) Federal and other taxes. It is the Fund’s policy to comply with the federal income and excise tax requirements of the Internal Revenue Code of 1986 (the “Code”), as amended, applicable to regulated investment companies. Accordingly, the Fund intends to distribute its taxable income and net realized gains, if any, to shareholders in accordance with timing requirements imposed by the Code. Therefore, no federal income tax provision is required in the Fund’s financial statements.
Management has analyzed the Fund’s tax positions taken on federal income tax returns for all open tax years and has concluded that as of June 30, 2010, no provision for income tax is required in the Fund’s financial statements. The Fund’s federal and state income and federal excise tax returns for tax years for which the applicable statutes of limitations have not expired are subject to examination by Internal Revenue Service and state departments of revenue.
(k) Reclassification. GAAP requires that certain components of net assets be reclassified to reflect permanent differences between financial and tax reporting. These reclassifications have no effect on net assets or net asset value per share.
2. Investment management agreement and other transactions with affiliates
Legg Mason Partners Fund Advisor, LLC (“LMPFA”) is the Fund’s investment manager. Western Asset Management Company (“Western Asset”) and Western Asset Management Company Limited (“Western Asset Limited”) are the Fund’s subadvisers. LMPFA, Western Asset and Western Asset Limited are wholly-owned subsidiaries of Legg Mason, Inc. (“Legg Mason”).
| | Western Asset Mortgage Defined Opportunity Fund Inc. 2010 Semi-Annual Report | | 17 |
Under the investment management agreement, the Fund pays an investment management fee, calculated daily and paid monthly, at an annual rate of 1.00% of the Fund’s average daily Managed Assets.
The Fund will pay all of its offering expenses up to and including $0.04 per share of Common Stock. The Fund’s management fees and other expenses are borne by the Common Stockholders. LMPFA has agreed to pay (i) all of the Fund’s organizational expenses, which are estimated to be $25,000, and (ii) the Fund’s offering expenses (other than sales load, but inclusive of the partial expense reimbursement) to the extent offering expenses are in excess of $0.04 per share.
LMPFA provides administrative and certain oversight services to the Fund. LMPFA delegates to the subadviser the day-to-day portfolio management of the Fund. For its services, LMPFA pays Western Asset 70% of the net management fee it receives from the Fund. In turn, Western Asset pays Western Asset Limited a subadvisory fee of 0.70% of the Fund’s daily Managed Assets that the subadviser allocates to Western Asset Limited to manage.
Wilshire Associates Incorporated (the “Allocation Subadviser”), a registered investment adviser unaffiliated with Legg Mason, LMPFA, Western Asset or Western Asset Limited will determine whether and to what extent the Fund will invest in the Feeder Fund, subject to the supervision of the Fund’s Board of Directors and LMPFA. Assets not allocated by the Allocation Subadviser to the Feeder Fund will be managed directly by Western Asset. In addition, during the invest-up period of the Feeder Fund, the Allocation Subadviser may direct Western Asset to manage assets that have been committed to the Feeder Fund by the Allocation Subadviser, but have not yet been called by the Feeder Fund.
The Allocation Subadviser will receive an annual fee, payable monthly, from the Fund in an amount equal to 0.05% of the Fund’s average daily Managed Assets, subject to a minimum compensation guarantee between the Allocation Subadviser and LMPFA.
All officers and one Director of the Fund are employees of Legg Mason or its affiliates and do not receive compensation from the Fund.
3. Investments
For the period February 24, 2010 to June 30, 2010, the aggregate cost of purchases and proceeds from sales of investments (excluding short-term investments) and U.S Government & Agency Obligations were as follows:
| | PPIP Limited Partnership | | Investments | | | |
Purchases | | $51,432,312 | | $176,164,715 | | | |
Sales | | — | | 9,278,913 | | | |
At June 30, 2010, the aggregate gross unrealized appreciation and depreciation of investments for federal income tax purposes were substantially as follows:
Gross unrealized appreciation | | $ | 6,855,713 | |
Gross unrealized depreciation | | (2,051,010 | ) |
Net unrealized appreciation | | $ | 4,804,703 | |
Transactions in reverse repurchase agreements for the Fund during the period ended June 30, 2010 were as follows:
Average Daily
Balance* | | Weighted Average
Interest Rate | | Maximum Amount
Outstanding | |
$33,214,979 | | 1.42% | | $36,786,750 | |
* Average based on the number of days the Fund had the reverse repurchase agreements outstanding.
Interest rates on reverse repurchase agreements ranged from 1.000% to 1.788% for the period February 24, 2010 to June 30, 2010. Interest expense incurred on reverse repurchase agreements totaled $64,271.
18 | | Western Asset Mortgage Defined Opportunity Fund Inc. 2010 Semi-Annual Report | | |
Notes to financial statements (unaudited) (cont’d)
At June 30, 2010, the Fund had the following open reverse repurchase agreements:
Security | | Face
Amount |
Reverse Repurchase Agreement with Barclays, dated 5/13/10 bearing 1.472% to be repurchased at $1,687,539 on 11/15/10, collateralized by: $2,825,996 Ameriquest Mortgage Securities Inc., 0.797% due 3/25/35;
Market value (including accrued interest) $2,282,713 | | $ | 1,674,799 | |
Reverse Repurchase Agreement with Barclays, dated 5/13/10 bearing 1.472% to be repurchased at $1,576,389 on 11/15/10, collateralized by: $3,490,000 Bayview Financial Acquisition Trust, 0.797% due 4/28/39;
Market value (including accrued interest) $2,447,296 | | 1,564,489 | |
Reverse Repurchase Agreement with Barclays, dated 5/13/10 bearing 1.472% to be repurchased at $2,548,304 on 11/15/10, collateralized by: $3,354,920 JPMorgan Mortgage Trust, 5.026% due 6/25/35;
Market value (including accrued interest) $2,969,122 | | 2,529,066 | |
Reverse Repurchase Agreement with Barclays, dated 5/13/10 bearing 1.472% to be repurchased at $453,255 on 11/15/10, collateralized by: $600,000 MASTR Adjustable Rate Mortgage Trust, 2.959% due 11/21/34;
Market value (including accrued interest) $522,523 | | 449,833 | |
Reverse Repurchase Agreement with Barclays, dated 5/13/10 bearing 1.472% to be repurchased at $411,574 on 11/15/10, collateralized by: $650,000 Merrill Lynch Mortgage Investors Trust, 2.800% due 2/25/35;
Market value (including accrued interest) $592,627 | | 408,466 | |
Reverse Repurchase Agreement with Barclays, dated 5/13/10 bearing 1.472% to be repurchased at $210,427 on 11/15/10, collateralized by: $240,724 Nomura Asset Acceptance Corp., 6.500% due 3/25/34;
Market value (including accrued interest) $238,339 | | 208,839 | |
Reverse Repurchase Agreement with Barclays, dated 5/13/10 bearing 1.472% to be repurchased at $2,111,486 on 11/15/10, collateralized by: $3,700,000 Park Place Securities Inc., 1.027% due 9/25/34;
Market value (including accrued interest) $3,116,228 | | 2,095,545 | |
Reverse Repurchase Agreement with Barclays, dated 5/13/10 bearing 1.472% to be repurchased at $862,067 on 11/15/10, collateralized by: $1,629,564 Renaissance Home Equity Loan Trust, 1.107% due 12/25/32;
Market value (including accrued interest) $1,177,959 | | 855,559 | |
Reverse Repurchase Agreement with Barclays, dated 5/13/10 bearing 1.472% to be repurchased at $1,246,313 on 11/15/10, collateralized by: $1,580,000 Structured Asset Securities Corp., 4.790% due 3/25/35;
Market value (including accrued interest) $1,458,573 | | 1,236,904 | |
Reverse Repurchase Agreement with Barclays, dated 5/13/10 bearing 1.472% to be repurchased at $428,935 on 11/15/10, collateralized by: $572,854 Structured Asset Securities Corp., 2.464% due 12/25/33;
Market value (including accrued interest) $518,050 | | 425,697 | |
Reverse Repurchase Agreement with Barclays, dated 5/13/10 bearing 1.472% to be repurchased at $337,706 on 11/15/10, collateralized by: $477,797 Structured Asset Securities Corp., 0.747% due 9/25/33;
Market value (including accrued interest) $387,075 | | 335,157 | |
Reverse Repurchase Agreement with Barclays, dated 5/20/10 bearing 1.788% to be repurchased at $953,848 on 11/22/10, collateralized by: $2,234,514 Accredited Mortgage Loan Trust, 4.460% due 1/25/34;
Market value (including accrued interest) $1,777,224 | | 945,119 | |
Reverse Repurchase Agreement with Barclays, dated 5/20/10 bearing 1.788% to be repurchased at $2,316,195 on 11/22/10, collateralized by: $3,600,000 Banc of America Funding Corp., 6.000% due 9/25/36;
Market value (including accrued interest) $2,936,529 | | 2,295,000 | |
Reverse Repurchase Agreement with Barclays, dated 5/20/10 bearing 1.788% to be repurchased at $2,034,619 on 11/22/10, collateralized by: $4,000,000 Chase Mortgage Finance Corp., 5.409% due 1/25/36;
Market value (including accrued interest) $3,137,820 | | 2,016,000 | |
| | Western Asset Mortgage Defined Opportunity Fund Inc. 2010 Semi-Annual Report | | 19 |
Security | | Face
Amount | |
Reverse Repurchase Agreement with Barclays, dated 5/20/10 bearing 1.788% to be repurchased at $2,155,400 on 11/22/10, collateralized by: $3,472,959 Credit Suisse Mortgage Capital Certificates, 5.500% due 10/25/21;
Market value (including accrued interest) $2,937,218 | | $ | 2,135,676 | |
Reverse Repurchase Agreement with Barclays, dated 5/20/10 bearing 1.788% to be repurchased at $1,137,027 on 11/22/10, collateralized by: $2,066,565 First Horizon Alternative Mortgage Securities, 4.358% due 8/25/35;
Market value (including accrued interest) $1,629,583 | | 1,126,622 | |
Reverse Repurchase Agreement with Barclays, dated 5/20/10 bearing 1.788% to be repurchased at $1,730,315 on 11/22/10, collateralized by: $5,093,808 Indymac Index Mortgage Loan Trust, 5.397% due 5/25/37;
Market value (including accrued interest) $2,761,343 | | 1,714,481 | |
Reverse Repurchase Agreement with Barclays, dated 5/20/10 bearing 1.788% to be repurchased at $2,290,460 on 11/22/10, collateralized by: $3,400,000 WaMu Mortgage Pass Through Certificates, 2.703% due 5/25/35;
Market value (including accrued interest) $3,044,657 | | 2,269,500 | |
Reverse Repurchase Agreement with Credit Suisse, dated 5/20/10 bearing 1.000% to be repurchased $1,283,199 on 8/18/10, collateralized by: $1,687,605 Chase Mortgage Finance Corp., 5.500% due 11/25/21;
Market value (including accrued interest) $1,565,797 | | 1,279,999 | |
Reverse Repurchase Agreement with Credit Suisse, dated 5/20/10 bearing 1.000% to be repurchased $1,328,313 on 8/18/10, collateralized by: $2,200,000 Deutsche Mortgage Securities Inc., 5.180% due 6/26/35;
Market value (including accrued interest) $1,842,527 | | 1,325,001 | |
Reverse Repurchase Agreement with Credit Suisse, dated 5/20/10 bearing 1.000% to be repurchased $1,604,000 on 8/18/10, collateralized by: $3,245,963 Residential Asset Securitization Trust, 0.847% due 4/25/36;
Market value (including accrued interest) $1,966,501 | | 1,600,000 | |
Reverse Repurchase Agreement with Credit Suisse, dated 5/20/10 bearing 1.000% to be repurchased $246,615 on 8/18/10, collateralized by: $415,000 JPMorgan Alternative Loan Trust, 6.000% due 8/25/36;
Market value (including accrued interest) $283,057 | | 246,000 | |
Reverse Repurchase Agreement with Credit Suisse, dated 5/20/10 bearing 1.000% to be repurchased $1,461,644 on 8/18/10, collateralized by: $1,421,794 MASTR Reperforming Loan Trust, 5.688% due 5/25/36;
Market value (including accrued interest) $1,332,393 | | 1,457,999 | |
Reverse Repurchase Agreement with Credit Suisse, dated 5/20/10 bearing 1.000% to be repurchased $1,483,700 on 8/18/10, collateralized by: $3,205,147 Morgan Stanley Mortgage Loan Trust, 5.848% due 11/25/37;
Market value (including accrued interest) $1,982,717 | | 1,480,000 | |
Reverse Repurchase Agreement with Credit Suisse, dated 5/20/10 bearing 1.000% to be repurchased $1,669,163 on 8/18/10, collateralized by: $3,000,000 RAAC Series, 0.697% due 3/25/37;
Market value (including accrued interest) $2,201,695 | | 1,665,000 | |
Reverse Repurchase Agreement with Credit Suisse, dated 5/20/10 bearing 1.000% to be repurchased $2,091,213 on 8/18/10, collateralized by: $4,690,204 Residential Accredit Loans Inc., 6.156% due 1/25/36;
Market value (including accrued interest) $2,848,835 | | 2,085,998 | |
Reverse Repurchase Agreement with Credit Suisse, dated 5/20/10 bearing 1.000% to be repurchased $1,363,401 on 8/18/10, collateralized by: $1,879,964 Thornburg Mortgage Securities Trust, 6.207% due 9/25/37;
Market value (including accrued interest) $1,803,861 | | 1,360,001 | |
Total Reverse Repurchase Agreements
(Proceeds — $36,786,750) | | $ | 36,786,750 | |
20 | | Western Asset Mortgage Defined Opportunity Fund Inc. 2010 Semi-Annual Report | | |
Notes to financial statements (unaudited) (cont’d)
4. Summarized financial data — PPIP Limited Partnership Master Fund (unaudited)
At June 30, 2010, the Fund had $67,121,476 invested in the Master Fund. Summarized financial data for the Master Fund is presented in the following table:
Statement of Assets, Liabilities and Partners’ Capital
June 30, 2010
Assets | | | |
Investments, at value (Cost — $2,312,694,065) | | $ | 2,329,386,532 | |
Other assets | | 127,189,528 | |
Total Assets | | $ | 2,456,576,060 | |
| | | |
Liabilities | | | |
Borrowings | | 1,154,000,000 | |
Other liabilities | | 76,405,072 | |
Total Liabilities | | $ | 1,230,405,072 | |
Partners’ Capital | | $ | 1,226,170,988 | |
Total Liabilities and Partners Capital | | $ | 2,456,576,060 | |
Statement of Operations
For the six months ended June 30, 2010
Investment Income | | | |
Interest income | | $ | 80,975,207 | |
Expenses | | | |
Interest expense | | 5,130,985 | |
Operating expenses | | 999,617 | |
Total Expenses | | $ | 6,130,602 | |
Net investment income | | $ | 74,844,605 | |
Realized gain from investments | | 1,588,880 | |
Change in unrealized gain on investments | | 12,644,474 | |
Net Gain on Investments | | $ | 14,233,354 | |
Net Increase in Partners Capital Resulting from Operations | | $ | 89,077,959 | |
For the six months ended June 30, 2010, the Master Fund had an expense ratio and net investment income ratio of 0.42% and 16.97%, respectively. The Master Fund’s total return for the six months ended June 30, 2010 was 12.91%.
5. Derivative instruments and hedging activities
Financial Accounting Standards Board Codification Topic 815 requires enhanced disclosure about an entity’s derivative and hedging activities.
For the period February 24, 2010 to June 30, 2010, the Fund did not invest in any derivative instruments.
6. Distributions subsequent to June 30, 2010
On April 23, 2010, the Board of Directors of the Fund (“Board”) declared two dividends, each in the amount of $0.1400 per share, payable on July 30, 2010 and August 27, 2010 to shareholders of record on July 23, 2010 and August 20, 2010, respectively.
On August 16, 2010, the Fund’s Board declared three dividends, each in the amount of $0.1400 per share, payable on September 24, 2010, October 29, 2010 and November 26, 2010 to shareholders of record on September 17, 2010, October 22, 2010 and November 19, 2010, respectively.
| | Western Asset Mortgage Defined Opportunity Fund Inc. | | 21 |
Board approval of management and subadvisory agreements (unaudited)
At a meeting of the Board of Directors (the “Board”) of Western Asset Mortgage Defined Opportunity Fund, Inc. (the “Fund”) held by conference telephone call on January 20, 2010 (the “Telephonic Meeting”), the Board received a proposal from Legg Mason, Inc. (“Legg Mason”) to launch a non-diversified, closed-end management investment company registered under the Investment Company Act of 1940 (the “1940 Act”). As part of this proposal, the Board at an in-person meeting held on February 11, 2010 (the “Contract Evaluation Meeting” and with the Telephonic Meeting, the “Organization Meetings”) considered the initial approval for a two-year period of the Fund’s management agreement (the “Management Agreement”), pursuant to which Legg Mason Partners Fund Advisor, LLC (the “Manager”) provides the Fund with investment advisory and administrative services. At the Contract Evaluation Meeting, the Board also approved sub-advisory agreements (individually, a “Sub-Advisory Agreement” and collectively, the “Sub-Advisory Agreements”) with the Manager’s affiliates, Western Asset Management Company (“Western Asset”) and Western Asset Limited in London (“Western Asset London” and, with Western Asset, the “Western Asset Sub-Advisers”). The Board further approved a sub-advisory agreement (the “Allocation Agreement”) with Wilshire Associates Incorporated (the “Allocation Sub-Adviser” and with the Western Asset Sub-Advisers, the “Sub-Advisers”). The Sub-Advisers provide sub-advisory services to the Fund pursuant to the Sub-Advisory Agreements and the Allocation Agreement. The Manager and the Western Asset Sub-Advisers are wholly-owned subsidiaries of Legg Mason, Inc. (“Legg Mason”). The Fund’s primary investment objective is to provide current income and then to liquidate and distribute all of the Fund’s net assets to shareholders on or about March 1, 2022. As a secondary investment objective, the Fund will seek capital appreciation. The Fund intends to pursue its investment objective by investing, under normal market conditions, at least 80% of its total managed assets in a diverse portfolio of mortgage-backed securities (“MBS”), consisting primarily of non-agency residential mortgage-backed securities and commercial mortgage-backed securities. The Fund intends to invest in MBS directly and indirectly through a separate investment in a public-private investment fund formed in connection with the Legacy Securities Public-Private Investment Program (“PPIP”) established by the U.S. Department of Treasury (the “Treasury”). Under normal circumstances, the Fund will invest at least 80% of its total managed assets in MBS directly and indirectly by investing in a private feeder fund (the “Feeder Fund”) which invests substantially all of its assets, alongside the Treasury, in a master fund (the “Master Fund”) that has been organized to invest directly in MBS and other assets eligible for purchase under PPIP. The Fund also may invest up to 20% of its total managed assets directly in other permitted investments, including cash and cash equivalents, Treasury securities, non-mortgage-related securities backed by various other asset classes, such as small balance commercial mortgages, aircrafts, automobiles, credit cards, equipment, manufactured housing, franchises, recreational vehicles and student loans, and investment grade and below-investment grade fixed income securities, including bonds, debentures, notes, commercial paper and other similar types of debt instruments (including hybrid securities). Under no circumstances will the Fund invest more than 40% of the net proceeds of the Fund’s initial public offering of common stock in the Feeder Fund, reflecting a regulatory limit set by the U.S. Securities and Exchange Commission. The Fund may use leverage through borrowing, including loans from certain financial institutions, the use of reverse repurchase agreements and/or the issuance of debt securities and possibly through the issuance of preferred stock in an aggregate amount of up to 33 1/3% of the Fund’s total assets immediately after such borrowings and/or issuances. The Fund may not use leverage at all times and the amount of leverage may vary depending upon Western Asset’s outlook for the market and the costs that would be incurred as a result of such leverage. The Manager advised that the Fund currently had no intention to issue debt securities or preferred stock. The Master Fund is expected to borrow money from the Treasury for investment purposes in an amount equal to approximately 50% of the Master Fund’s total assets immediately after giving effect to the borrowing (the “Treasury Debt Financing”). To the extent that the Fund invests in the Master Fund, through its investment in the Feeder Fund, the Fund will be subject to the implicit risks (and potential benefits) of such leverage and will bear its allocable share of the expenses and costs incurred by the Master Fund in connection with the Treasury Debt Financing. In an effort to mitigate the overall risk of leverage, the Fund
22 | | Western Asset Mortgage Defined Opportunity Fund Inc. | | |
Board approval of management and subadvisory agreements (unaudited) (cont’d)
does not intend to incur additional direct leverage at the Fund level to the extent that its existing direct leverage at the Fund level and its implicit leverage through its Master Fund investment exceeds 33 1/3% of the Fund’s managed assets immediately after borrowings and/or issuances of preferred stock at the Fund level. The Manager discussed the structure and operations of the Feeder Fund and Master Fund and the fees, costs and expenses that will be incurred by the Fund in connection with any investments in the Feeder Fund (“Feeder Fund Expenses”). The Directors of the Board who are not “interested persons” (as defined in the 1940 Act (the “Independent Directors”)) of the Fund were assisted in their review by Fund counsel and independent legal counsel and met with independent legal counsel in executive session at the Contract Evaluation Meeting separate from representatives of the Manager and Western Asset London. At the Organization Meetings, the Independent Directors requested and received information from the Manager and the Western Asset Sub-Advisers that they deemed reasonably necessary for their review of the Management Agreement, the Sub-Advisory Agreements and the Allocation Agreement and also received information from the Allocation Sub-Adviser that they deemed reasonably necessary for their review of the Allocation Agreement. The discussion below reflects all of these reviews.
Nature, extent and quality of the services to be provided to the Fund under the management agreement, the sub-advisory agreements and the allocation agreement
The Board received and considered information regarding the nature, extent and quality of the respective services to be provided to the Fund and its shareholders by the Manager and the Western Asset Sub-Advisers under the Management Agreement and the Sub-Advisory Agreements and Western Asset’s supervisory responsibilities in respect of Western Asset London. The Board also considered the Manager’s supervisory responsibilities in respect of the Sub-Advisers. The Board noted that the Fund is newly-organized and has no operating history but took into consideration its knowledge gained and information received at regular meetings throughout the year related to the services rendered by the Manager in its management of other funds under the supervision of the Board, including the Manager’s coordination and oversight of the activities of sub-advisers and other service providers to those funds and Western Asset’s coordination and oversight of Western Asset London. The Board reviewed information received from the Manager and the Fund’s Chief Compliance Officer (the “CCO”) regarding the compliance policies and procedures established pursuant to the 1940 Act and reviewed the investment program of Western Asset London with the CCO. The Board also reviewed information from the CCO regarding the compliance policies and procedures established by the Western Asset Sub-Advisers pursuant to the 1940 Act.
As a newly-organized fund, the Fund had no historical performance information available at the time of the Organization Meetings for the Board to consider in its evaluation of the terms and conditions of the Management Agreement, the Sub-Advisory Agreements and the Allocation Agreement. The Board reviewed the investment objectives and policies of the Fund with the Manager and Western Asset and the qualifications, backgrounds and responsibilities of the senior personnel of the Fund and the portfolio management team that would be primarily responsible for the day-to-day portfolio management of the Fund. The Board members discussed with representatives of the Manager and Western Asset the Western Asset Sub-Advisers’ experience and capabilities in the management of funds and investment vehicles comparable to the Fund and also discussed the Western Asset Sub-Advisers’ compliance capabilities. The Board also considered, based on its knowledge of the Manager and the Manager’s affiliates, the financial resources available to be employed by Legg Mason for the benefit of the Fund.
The Board reviewed the services to be provided by the Allocation Sub-Adviser under the Allocation Agreement with representatives of the Allocation Sub-Adviser and the experience, qualifications, background and responsibilities of the Allocation Sub-Adviser’s personnel that would be primarily responsible for such services; the allocation methodologies to be utilized by the Allocation
| | Western Asset Mortgage Defined Opportunity Fund Inc. | | 23 |
Sub-Adviser in providing such services; and the financial and other resources available to the Allocation Sub-Adviser to support its activities in respect of the Fund. The Board reviewed with the CCO the compliance policies and procedures established by the Allocation Sub-Advisers pursuant to the 1940 Act.
The Board also considered the division of responsibilities of the Manager and the Western Asset Sub-Advisers under the Management Agreement and Sub-Advisory Agreements, respectively, including the Manager’s coordination and oversight of services provided to the Fund by the Sub-Advisers and others and Western Asset’s coordination and oversight of services provided by Western Asset London. The Manager does not provide day-to-day portfolio management services to the Fund. Rather, management of Fund assets not invested in the Feeder Fund is provided by Western Asset pursuant to the Sub-Advisory Agreement between the Manager and Western Asset (the “Western Asset Sub-Advisory Agreement”). The Western Asset Sub-Advisory Agreement permits Western Asset to delegate certain of Western Asset responsibilities, including its sub-advisory duties thereunder, provided that Western Asset in each case will supervise the activities of the delegee. Western Asset London helps provide certain sub-advisory services to the Fund pursuant to a separate Sub-Advisory Agreement with Western Asset.
The Allocation Sub-Adviser is responsible for determining whether and to what extent the Fund will invest in the Feeder Fund, subject to the supervision of the Fund’s Board of Directors and the Manager. As noted above, assets not allocated by the Allocation Sub-Adviser to the Feeder Fund are managed directly by Western Asset. In addition, during the invest-up period of the Feeder Fund, the Allocation Sub-Adviser may direct the Western Asset to manage assets that have been committed to the Feeder Fund by the Allocation Sub-Adviser but have not yet been called by the Feeder Fund.
The Board concluded that, overall, it was satisfied with the nature, extent and quality of the respective services expected to be provided by the Manager under the Management Agreement, by the Western Asset Sub-Advisers under the Sub-Advisory Agreements, and by the Allocation Sub-Adviser under the Allocation Agreement.
Management fees, expense ratios and profitability
The Board reviewed and considered the contractual management fee (the “Contractual Management Fee”) payable by the Fund to the Manager under the Management Agreement and the contractual management fees (the “Western Asset Contractual Sub-Advisory Fees”) payable to the Western Asset Sub-Advisers under the respective Sub-Advisory Agreements in light of the nature, extent and quality of the management and sub-advisory services expected to be provided by the Manager and the Western Asset Sub-Advisers to the Fund. The Contractual Management Fee is an annual fee, payable monthly, in an amount equal to 1.00% of the Fund’s average daily managed assets. The Board noted that the Manager, and not the Fund, is responsible for payment of the Western Asset Contractual Sub-Advisory Fees to Western Asset and, accordingly, that the retention of Western Asset would not increase the fees and expenses to be incurred by the Fund. Similarly, the Board noted that Western Asset, and not the Fund, is responsible for payment of the Western Asset Contractual Sub-Advisory Fees to Western Asset London and, accordingly, that the retention of Western Asset London would not increase the fees and expenses to be incurred by the Fund. The Board also noted that the Manager will provide the Fund with regulatory compliance and administrative services, office facilities and officers (including the chief financial, chief legal and chief compliance officers), and that the Manager will coordinate and oversee the provision of services to the Fund by other fund service providers, including the Sub-Advisers.
The Board reviewed and considered the fee (the “Allocation Sub-Adviser Fee”) payable by the Fund to the Allocation Sub-Adviser under the Allocation Agreement in light of the nature, extent and quality of services expected to be provided thereunder to the Fund. The Allocation Sub-Adviser Fee is an annual fee, payable monthly from the Fund, in an amount equal to 0.05% of the Fund’s average daily
24 | | Western Asset Mortgage Defined Opportunity Fund Inc. | | |
Board approval of management and subadvisory agreements (unaudited) (cont’d)
managed assets. The Manager reported to the Board that it has a separate agreement with the Allocation Sub-Adviser to assure that the Allocation Sub-Adviser Fee will be no less than $100,000 per year for each year the Allocation Agreement remains in effect through November 2013 and that it also has entered into an indemnification agreement for up to $100,000 with the Allocation Sub-Adviser. Any difference between the Allocation Sub-Adviser Fee and $100,000 and any amount paid in connection with the indemnification would be paid by the Manager, not the Fund. The Board considered the Manager’s advice that the fee and indemnification arrangements are not dependent to any extent upon the investment of Fund assets in the Feeder Fund in order to provide for the independent exercise of the Allocation Sub-Adviser’s judgment in carrying out its responsibilities under the Allocation Agreement.
The Board received and considered information comparing the Contractual Management Fee on a gross basis with those of a group of comparable funds and investment vehicles. The Board obtained confirmation from the Manager that the fees and expenses of the Fund are in line with those of comparable funds and investment vehicles. The Board noted that during periods when the Fund or Master Fund is using leverage through borrowings or, in the case of the Fund, the issuance of preferred stock, the fees paid to the Manager, the Western Asset Sub-Advisers and the Allocation Sub-Adviser for advisory services will be higher than if the Fund or Master Fund did not use leverage because the fees paid will be calculated on the basis of the Fund’s managed assets, which includes the principal amount of the Fund’s borrowings and any Fund assets attributable to the issuance of preferred stock as well as the Fund’s pro rata share of the principal amount of any Feeder Fund borrowings. The Manager discussed the expected expense ratio of the Fund, which reflects Feeder Fund Expenses, and the costs of organization. The Manager discussed with the Board the Fund’s proposed underwriting arrangements. Among other things, underwriters were to receive a sales load of 4.50% of the offering price of each share. The Board noted a proposal by the Manager to pay (i) all of the Fund’s organizational expenses and (ii) the Fund’s offering expenses (other than sales load) in excess of $0.04 per share. As a newly-organized fund, the Board noted that the Fund had no historical profitability information available for the Board to consider at the time of the Organization Meetings, but the Board received and reviewed with the Manager pro forma information regarding the projected profitability to the Manager of its services to the Fund. The profitability to the Western Asset Sub-Advisers was not considered to be a material factor in the Board’s consideration since such fees are paid by the Manager, in the case of Western Asset, and by Western Asset, in the case of Western Asset London. Under the circumstances, the Board concluded that the profitability to the Manager projected in the pro forma information was reasonable but did not give such information significant weight in its evaluations.
Information regarding comparability of the Allocation Sub-Adviser Fee and the projected profitability to the Allocation Sub-Adviser was not provided to the Board. However, such information was not regarded as relevant to the Board’s evaluation of the Allocation Agreement because the willingness of the Allocation Sub-Adviser to serve in such capacity was dependent upon arm’s-length negotiations with the Manager. The Manager engaged in discussions with other candidates to provide services in the capacity of Allocation Sub-Adviser and, based upon such discussions, advised the Board that the fees negotiated with the Allocation Sub-Adviser were advantageous to the Fund and were reasonable, especially when viewed in relation to the anticipated quality of the services to be rendered by the Allocation Sub-Adviser. The Board further noted that profitability information, if provided, would have been pro forma in nature and likely would not have been given significant weight. The Board considered the Manager’s assurances that the Fund’s fees and expenses, which included the Allocation Sub-Adviser Fee, would be in line with those of comparable funds and investment vehicles.
| | Western Asset Mortgage Defined Opportunity Fund Inc. | | 25 |
Economies of scale
The Manager stated that as the Fund’s assets increase over time, the Fund and its shareholders should realize economies of scale as certain expenses, such as fixed fund fees, become a smaller percentage of overall assets. However, the Board noted that the Manager, in the Contractual Management Fee, incorporates no breakpoints to reflect the potential for reducing the Contractual Management Fee or the Western Asset Contractual Sub-Advisory Fees as assets grow. The Allocation Sub-Adviser similarly incorporates no breakpoints in the Allocation Sub-Adviser Fee. The Board considered that, as a newly-organized fund, there was uncertainty regarding the ability of the Fund to attract assets and the rate of asset growth that will be achieved. In light of the uncertainties as to the growth of assets, the Board concluded the Contractual Management Fee, the Western Asset Contractual Sub-Advisory Fees and the Allocation Sub-Adviser Fee structure each is appropriate at this time.
Taking all of the above into consideration, the Board determined that the Contractual Management Fee, the Western Asset Contractual Sub-Advisory Fees and Allocation Sub-Adviser Fee were reasonable in light of the expense information presented and the nature, extent and quality of the services expected to be provided under the Management Agreement, the Sub-Advisory Agreements and the Allocation Agreement, respectively.
Other benefits to the manager
The Board considered other benefits expected to be received by the Manager and its affiliates, including the Western Asset Sub-Advisers, as a result of the Manager’s relationship with the Fund, and by the Allocation Sub-Adviser as a result of its relationship with the Fund. In light of the expected costs of providing investment management and other services to the Fund and the Manager’s commitment to the Fund, the other ancillary benefits that the Manager and its affiliates expect to receive were not considered excessive. It was noted by the Manager that Western Asset is also the investment adviser to the Feeder Fund and the Master Fund but has agreed to waive any investment management fee and performance allocation with respect to any Fund investment in the Feeder Fund and indirect investment in the Master Fund. Any ancillary benefits to be received by the Allocation Sub-Adviser were regarded as likely to be insignificant.
Based on their discussions and considerations, including those described above, the Board, including the Independent Directors, approved the Management Agreement, the Sub-Advisory Agreements and the Allocation Agreement.
No single factor reviewed by the Board was identified by the Board as the principal factor in determining whether to approve the Management Agreement, the Sub-Advisory Agreements and the Allocation Agreement.
26 | | Western Asset Mortgage Defined Opportunity Fund Inc. | | |
Dividend reinvestment plan (unaudited)
Unless you elect to receive distributions in cash (i.e., opt-out), all dividends, including any capital gain dividends, on your Common Stock will be automatically reinvested by American Stock Transfer & Trust Company LLC, as agent for the stockholders (the “Plan Agent”), in additional shares of Common Stock under the Fund’s Dividend Reinvestment Plan (the “Plan”). You may elect not to participate in the Plan by contacting the Plan Agent. If you do not participate, you will receive all cash distributions paid by check mailed directly to you by American Stock Transfer & Trust Company LLC, as dividend paying agent.
If you participate in the Plan, the number of shares of Common Stock you will receive will be determined as follows:
(1) If the market price of the Common Stock on the record date (or, if the record date is not a NYSE trading day, the immediately preceding trading day) for determining stockholders eligible to receive the relevant dividend or distribution (the “determination date”) is equal to or exceeds 98% of the net asset value per share of the Common Stock, the Fund will issue new Common Stock at a price equal to the greater of
(a) 98% of the net asset value per share at the close of trading on the NYSE on the determination date or
(b) 95% of the market price per share of the Common Stock on the determination date.
(2) If 98% of the net asset value per share of the Common Stock exceeds the market price of the Common Stock on the determination date, the Plan Agent will receive the dividend or distribution in cash and will buy Common Stock in the open market, on the NYSE or elsewhere, for your account as soon as practicable commencing on the trading day following the determination date and terminating no later than the earlier of (a) 30 days after the dividend or distribution payment date, or (b) the record date for the next succeeding dividend or distribution to be made to the stockholders; except when necessary to comply with applicable provisions of the federal securities laws. If during this period: (i) the market price rises so that it equals or exceeds 98% of the net asset value per share of the Common Stock at the close of trading on the NYSE on the determination date before the Plan Agent has completed the open market purchases or (ii) if the Plan Agent is unable to invest the full amount eligible to be reinvested in open market purchases, the Plan Agent will cease purchasing Common Stock in the open market and the Fund shall issue the remaining Common Stock at a price per share equal to the greater of (a) 98% of the net asset value per share at the close of trading on the NYSE on the determination date or (b) 95% of the then current market price per share.
Common Stock in your account will be held by the Plan Agent in non-certificated form. Any proxy you receive will include all shares of Common Stock you have received under the Plan.
You may withdraw from the Plan (i.e., opt-out) by notifying the Plan Agent in writing at P.O. Box 922, Wall Street Station, New York, NY 10269-0560 or by calling the Plan Agent at 877-366-6441. Such withdrawal will be effective immediately if notice is received by the Plan Agent not less than ten business days prior to any dividend or distribution record date; otherwise such withdrawal will be effective as soon as practicable after the Plan Agent’s investment of the most recently declared dividend or distribution on the Common Stock.
Upon any termination, you will be sent a certificate or certificates for the full number of shares of Common Stock held for you under the Plan and cash for any fractional share of Common Stock. You may elect to notify the Plan Agent in advance of such termination to have the Plan Agent sell part or all of your Common Stock on your behalf. You will be charged a service charge and the Plan Agent is authorized to deduct brokerage charges actually incurred for this transaction from the proceeds.
There is no service charge for reinvestment of your dividends or distributions in Common Stock. However, all participants will pay a pro rata share of brokerage commissions incurred by the Plan Agent when it makes open market purchases. Because all dividends and distributions will be automatically reinvested in additional shares of Common Stock, this allows you to add to your investment
| | Western Asset Mortgage Defined Opportunity Fund Inc. | | 27 |
through dollar cost averaging, which may lower the average cost of your Common Stock over time. Dollar cost averaging is a technique for lowering the average cost per share over time if the Fund’s net asset value declines. While dollar cost averaging has definite advantages, it cannot assure profit or protect against loss in declining markets.
Automatically reinvesting dividends and distributions does not mean that you do not have to pay income taxes due upon receiving dividends and distributions. Investors will be subject to income tax on amounts reinvested under the Plan.
The Fund reserves the right to amend or terminate the Plan if, in the judgment of the Board of Directors, the change is warranted. There is no direct service charge to participants in the Plan; however, the Fund reserves the right to amend the Plan to include a service charge payable by the participants. The Plan may be amended or supplemented by the Fund upon notice in writing mailed to stockholders at least 30 days prior to the record date for the payment of any dividend or distribution by the Fund for which the amendment or supplement is to be effective. Additional information about the Plan and your account may be obtained from the Plan Agent at 6201 15th Avenue, Brooklyn, New York 11219 or by calling the Plan Agent at 877-366-6441.
Western Asset
Mortgage Defined Opportunity Fund Inc.
Directors
Carol L. Colman | | Western Asset Mortgage Defined Opportunity Fund Inc. | | Independent registered public accounting firm
KPMG LLP |
Daniel P. Cronin | | 55 Water Street | | 345 Park Avenue |
Paolo M. Cucchi | | New York, NY 10041 | | New York, NY 10154 |
Leslie H. Gelb | | | | |
R. Jay Gerken, CFA | | Investment manager | | Legal counsel |
Chairman | | Legg Mason Partners Fund Advisor, LLC | | Simpson Thacher & Bartlett LLP |
William R. Hutchinson | | | | 425 Lexington Avenue |
Riordan Roett | | Subadvisers | | New York, NY 10017 |
Jeswald W. Salacuse | | Western Asset Management Company | | |
| | Western Asset Management Company Limited | | New York Stock Exchange Symbol |
Officers | | | | DMO |
R. Jay Gerken, CFA | | Allocation Subadviser | | |
President and | | Wilshire Associates Incorporated | | |
Chief Executive Officer | | | | |
Kaprel Ozsolak | | Custodian | | |
Chief Financial Officer | | State Street Bank and Trust Company | | |
Ted P. Becker | | 1 Lincoln Street | | |
Chief Compliance Officer | | Boston, MA 02111 | | |
John Chiota | | | | |
Identity Theft Protection Officer | | Transfer agent | | |
Robert I. Frenkel | | American Stock Transfer & Trust Company | | |
Secretary and | | 59 Maiden Lane | | |
Chief Legal Officer | | New York, NY 10038 | | |
Thomas C. Mandia | | | | |
Assistant Secretary | | | | |
Steven Frank | | | | |
Treasurer | | | | |
Jeanne M. Kelly | | | | |
Senior Vice President | | | | |
Privacy policy
We are committed to keeping nonpublic personal information about you secure and confidential. This notice is intended to help you understand how we fulfill this commitment. From time to time, we may collect a variety of personal information about you, including:
· Information we receive from you on applications and forms, via the telephone, and through our websites;
· Information about your transactions with us, our affiliates, or others (such as your purchases, sales, or account balances); and
· Information we receive from consumer reporting agencies.
We do not disclose nonpublic personal information about our customers or former customers, except to our affiliates (such as broker-dealers or investment advisers within the Legg Mason family of companies) or as is otherwise permitted by applicable law or regulation. For example, we may share this information with others in order to process your transactions or service an account. We may also provide this information to companies that perform marketing services on our behalf, such as printing and mailing, or to other financial institutions with whom we have joint marketing agreements. When we enter into such agreements, we will require these companies to protect the confidentiality of this information and to use it only to perform the services for which we hired them.
With respect to our internal security procedures, we maintain physical, electronic, and procedural safeguards to protect your nonpublic personal information, and we restrict access to this information.
If you decide at some point either to close your account(s) or become an inactive customer, we will continue to adhere to our privacy policies and practices with respect to your nonpublic personal information.
| | | | |
| | NOT PART OF THE SEMI-ANNUAL REPORT | | |
| | | | |
Western Asset Mortgage Defined Opportunity Fund Inc.
Western Asset Mortgage Defined Opportunity Fund Inc.
55 Water Street
New York, NY 10041
Notice is hereby given in accordance with Section 23(c) of the Investment Company Act of 1940, as amended, that from time to time the Fund may purchase at market price shares of its common stock in the open market.
The Fund files its complete schedule of portfolio holdings with the Securities and Exchange Commission (“SEC”) for the first and third quarters of each fiscal year on Form N-Q. The Fund’s Forms N-Q are available on the SEC’s website at www.sec.gov. The Fund’s Forms N-Q may be reviewed and copied at the SEC’s Public Reference Room in Washington, D.C., and information on the operation of the Public Reference Room may be obtained by calling 1-800-SEC-0330. To obtain information on Form N-Q from the Fund, shareholders can call 1-888-777-0102.
Information on how the Fund voted proxies relating to portfolio securities during the prior 12-month period ended June 30th of each year and a description of the policies and procedures that the Fund uses to determine how to vote proxies related to portfolio transactions are available (1) without charge, upon request, by calling 1-888-777-0102, (2) on the Fund’s website at www.leggmason.com/cef and (3) on the SEC’s website at www.sec.gov.
This report is transmitted to the shareholders of Western Asset Mortgage Defined Opportunity Fund Inc. for their information. This is not a prospectus, circular or representation intended for use in the purchase of shares of the Fund or any securities mentioned in this report.
American Stock
Transfer & Trust Company
59 Maiden Lane
New York, NY 10038
WASX012835 8/10 SR10-1183
ITEM 2. CODE OF ETHICS.
Not applicable.
ITEM 3. AUDIT COMMITTEE FINANCIAL EXPERT.
Not applicable.
ITEM 4. PRINCIPAL ACCOUNTANT FEES AND SERVICES.
Not applicable.
ITEM 5. AUDIT COMMITTEE OF LISTED REGISTRANTS.
Not applicable.
ITEM 6. SCHEDULE OF INVESTMENTS.
Included herein under Item 1.
ITEM 7. DISCLOSURE OF PROXY VOTING POLICIES AND PROCEDURES FOR CLOSED-END MANAGEMENT INVESTMENT COMPANIES.
Not applicable.
ITEM 8. PORTFOLIO MANAGERS OF CLOSED-END MANAGEMENT INVESTMENT COMPANIES.
Not applicable.
ITEM 9. PURCHASES OF EQUITY SECURITIES BY CLOSED-END MANAGEMENT INVESTMENT COMPANY AND AFFILIATED PURCHASERS.
Not applicable.
ITEM 10. SUBMISSION OF MATTERS TO A VOTE OF SECURITY HOLDERS.
Not applicable.
ITEM 11. CONTROLS AND PROCEDURES.
(a) The registrant’s principal executive officer and principal financial officer have concluded that the registrant’s disclosure controls and procedures (as defined in Rule 30a- 3(c) under the Investment Company Act of 1940, as amended (the “1940 Act”)) are effective as of a date within 90 days of the filing date of this report that includes the disclosure required by this paragraph, based on their evaluation of the disclosure controls and procedures required by Rule 30a-3(b) under the 1940 Act and 15d-15(b) under the Securities Exchange Act of 1934.
(b) There were no changes in the registrant’s internal control over financial reporting (as defined in Rule 30a-3(d) under the 1940 Act) that occurred during the registrant’s last fiscal half-year (the registrant’s second fiscal half-year in the case of an annual report) that have materially affected, or are likely to materially affect the registrant’s internal control over financial reporting.
ITEM 12. EXHIBITS.
(a) (1) Not applicable.
Exhibit 99.CODE ETH
(a) (2) Certifications pursuant to section 302 of the Sarbanes-Oxley Act of 2002 attached hereto.
Exhibit 99.CERT
(b) Certifications pursuant to Section 906 of the Sarbanes-Oxley Act of 2002 attached hereto.
Exhibit 99.906CERT
SIGNATURES
Pursuant to the requirements of the Securities Exchange Act of 1934 and the Investment Company Act of 1940, the registrant has duly caused this Report to be signed on its behalf by the undersigned, there unto duly authorized.
Western Asset Mortgage Defined Opportunity Fund Inc.
By: | /s/ R. Jay Gerken | |
| (R. Jay Gerken) | |
| Chief Executive Officer of | |
| Western Asset Mortgage Defined Opportunity Fund Inc. | |
| | |
Date: | August 31, 2010 | |
Pursuant to the requirements of the Securities Exchange Act of 1934 and the Investment Company Act of 1940, this report has been signed below by the following persons on behalf of the registrant and in the capacities and on the dates indicated.
By: | /s/ R. Jay Gerken | |
| (R. Jay Gerken) | |
| Chief Executive Officer of | |
| Western Asset Mortgage Defined Opportunity Fund Inc. | |
| | |
Date: | August 31, 2010 | |
| | |
| | |
By: | /s/ Kaprel Ozsolak | |
| (Kaprel Ozsolak) | |
| Chief Financial Officer of | |
| Western Asset Mortgage Defined Opportunity Fund Inc. | |
| | |
Date: | August 31, 2010 | |