UNITED STATES
SECURITIES AND EXCHANGE COMMISSION
Washington, D.C. 20549
FORM N-CSR
CERTIFIED SHAREHOLDER REPORT OF REGISTERED
MANAGEMENT INVESTMENT COMPANIES
Investment Company Act file number | 811-22369 |
|
Western Asset Mortgage Defined Opportunity Fund Inc. |
(Exact name of registrant as specified in charter) |
|
55 Water Street, New York, NY | | 10041 |
(Address of principal executive offices) | | (Zip code) |
|
Robert I. Frenkel, Esq.
Legg Mason & Co., LLC
100 First Stamford Place
Stamford, CT 06902 |
(Name and address of agent for service) |
|
Registrant’s telephone number, including area code: | (888)777-0102 | |
|
Date of fiscal year end: | December 31 | |
|
Date of reporting period: | December 31, 2010 | |
| | | | | | | | |
ITEM 1. REPORT TO STOCKHOLDERS.
The Annual Report to Stockholders is filed herewith.
December 31, 2010 | 
|
Annual Report
Western Asset Mortgage Defined Opportunity Fund Inc.
(DMO)
INVESTMENT PRODUCTS: NOT FDIC INSURED · NO BANK GUARANTEE · MAY LOSE VALUE |
II | | Western Asset Mortgage Defined Opportunity Fund Inc. |
Fund objectives
The Fund’s primary investment objective is to provide current income. As a secondary investment objective, the Fund will seek capital appreciation.
What’s inside
Letter from the chairman | | II |
| | |
Investment commentary | | III |
| | |
Fund overview | | 1 |
| | |
Fund at a glance | | 6 |
| | |
Spread duration | | 7 |
| | |
Effective duration | | 8 |
| | |
Schedule of investments | | 9 |
| | |
Statement of assets and liabilities | | 18 |
| | |
Statement of operations | | 19 |
| | |
Statement of changes in net assets | | 20 |
| | |
Statement of cash flows | | 21 |
| | |
Financial highlights | | 22 |
| | |
Notes to financial statements | | 23 |
| | |
Report of independent registered public accounting firm | | 37 |
| | |
Additional information | | 38 |
| | |
Annual chief executive officer and chief financial officer certifications | | 44 |
| | |
Dividend reinvestment plan | | 45 |
| | |
Additional shareholder information | | 47 |
Letter from the chairman | 
|
|
|
Dear Shareholder,
We are pleased to provide the annual report of Western Asset Mortgage Defined Opportunity Fund Inc. for the period from the Fund’s commencement of operations on February 24, 2010 through December 31, 2010 (the “reporting period”). Please read on for a detailed look at prevailing economic and market conditions during the Fund’s reporting period and to learn how those conditions have affected Fund performance.
As always, we remain committed to providing you with excellent service and a full spectrum of investment choices. We also remain committed to supplementing the support you receive from your financial advisor. One way we accomplish this is through our website, www.leggmason.com/cef. Here you can gain immediate access to market and investment information, including:
· Fund prices and performance,
· Market insights and commentaries from our portfolio managers, and
· A host of educational resources.
We look forward to helping you meet your financial goals.
Sincerely,

R. Jay Gerken, CFA
Chairman, President and Chief Executive Officer
February 9, 2011
Western Asset Mortgage Defined Opportunity Fund Inc. | | III |
Investment commentary
Economic review
Despite continued headwinds from high unemployment and issues in the housing market, the U.S. economy continued to expand during the period from the Fund’s commencement of operations on February 24, 2010 through December 31, 2010 (the “reporting period”). Toward the end of the reporting period, fears regarding moderating economic growth were replaced with optimism for a strengthening economy in 2011. With investor sentiment improving, U.S. equities moved sharply higher in the fourth quarter, while rising interest rates negatively impacted some sectors of the fixed-income market. All told, during 2010, investors who took on additional risk in their portfolios were generally rewarded.
In September 2010, the National Bureau of Economic Research (“NBER”), the organization charged with determining when recessions start and end, announced that the recession that began in December 2007 had concluded in June 2009. However, the NBER said, “In determining that a trough occurred in June 2009, the committee did not conclude that economic conditions since that month have been favorable or that the economy has returned to operating at normal capacity.” The NBER’s point is well-taken given continued areas of weakness in the U.S. economy.
Although the U.S. Department of Commerce continued to report positive U.S. gross domestic product (“GDP”)i growth, the expansion has moderated since peaking at 5.0% in the fourth quarter of 2009. A slower drawdown in business inventories and renewed consumer spending were contributing factors spurring the economy’s solid growth at the end of 2009. However, the economy grew at a more modest pace in 2010. According to the Commerce Department, GDP growth was 3.7%, 1.7% and 2.6% during the first, second and third quarters of 2010, respectively. The initial estimate for fourth quarter GDP was a 3.2% expansion.
Turning to the job market, while the unemployment rate moved lower in December 2010, it remained elevated throughout the reporting period. While 384,000 new jobs were created during the fourth quarter and the unemployment rate fell from 9.8% in November to 9.4% in December 2010, there continued to be some disturbing trends in the labor market. The unemployment rate has now exceeded 9.0% for twenty consecutive months, the longest period since the government began tracking this data in 1949. In addition, the U.S. Department of Labor reported in December that a total of 14.5 million Americans looking for work have yet to find a job, and 44% of these individuals have been out of work for more than six months.
There was mixed news in the housing market during the period. According to the National Association of Realtors (“NAR”), existing-home sales increased 7.0% and 8.0% in March and April, respectively, after sales had fallen for the period from December 2009 through February 2010. The rebound was largely attributed to people rushing to take advantage of the government’s $8,000 tax credit for first-time home buyers that expired at the end of April. However, with the end of the tax credit, existing-home sales then declined from May through July. Sales then generally rose from August through the end of the year. In total, existing-home sales volume in 2010 was 4.9 million, the lowest amount since 1997. Looking at home prices, the NAR reported that the median existing-home price for all housing types rose a tepid 0.3% in 2010. The
IV | | Western Asset Mortgage Defined Opportunity Fund Inc. |
Investment commentary (cont’d)
inventory of unsold homes was an 8.1 month supply in December at the current sales level, versus a 9.5 month supply in November.
The manufacturing sector was one area of the economy that remained relatively strong during 2010. Based on the Institute for Supply Management’s PMIii, the manufacturing sector has grown seventeen consecutive months since it began expanding in August 2009. After reaching a six-year peak of 60.4 in April 2010 (a reading below 50 indicates a contraction, whereas a reading above 50 indicates an expansion), PMI data indicated somewhat more modest growth through the remainder of the year. However, in December, the manufacturing sector expanded at its fastest pace in seven months, with a reading of 57.0 versus 56.6 in November.
Financial market overview
The financial markets experienced several periods of volatility during the reporting period that tested the resolve of novice and experienced investors alike. During most of the first two months of the reporting period, the financial markets were largely characterized by healthy investor risk appetite and solid results by stocks and lower-quality bonds. The market then experienced sharp sell-offs in late April and in May, and again beginning in mid-November. During those periods, investors tended to favor the relative safety of U.S. Treasury securities. However, these setbacks proved to be only temporary and, in each case, risk aversion was replaced with solid demand for riskier assets.
Due to signs that certain areas of the economy were moderating in the second half of the reporting period, the Federal Reserve Board (“Fed”)iii took further actions to spur the economy. At its August 10th meeting, the Fed announced an ongoing program that calls for using the proceeds from expiring agency debt and agency mortgage-backed securities to purchase longer-dated Treasury securities.
In addition, the Fed remained cautious throughout the reporting period given pockets of weakness in the economy. At its meeting in September 2010, the Fed said, “The Committee will continue to monitor the economic outlook and financial developments and is prepared to provide additional accommodation if needed to support the economic recovery. . . .” This led to speculation that the Fed may again move to purchase large amounts of agency and Treasury securities in an attempt to avoid a double-dip recession and ward off deflation.
The Fed then took additional action in early November. Citing that “the pace of recovery in output and employment continues to be slow,” the Fed announced another round of quantitative easing to help stimulate the economy, entailing the purchase of $600 billion of long-term U.S. Treasury securities by the end of the second quarter of 2011. This, coupled with the Fed’s previously announced program to use the proceeds of expiring securities to purchase Treasuries, means it could buy a total of $850 billion to $900 billion of Treasury securities by the end of June 2011. At its final meeting of the year in December, the Fed said it “will regularly review the pace of its securities purchases and the overall size of the asset-purchase program in light of incoming information and will adjust the program as needed to best foster maximum employment and price stability.”
Western Asset Mortgage Defined Opportunity Fund Inc. | | V |
Fixed-income market review
Continuing the trend that began in the second quarter of 2009, nearly every spread sector (non-Treasury) outperformed equal-durationiv Treasuries during most of the first two months of the reporting period. Over that time, investor confidence was high given encouraging economic data, continued low interest rates, benign inflation and rebounding corporate profits. Robust investor appetite was then replaced with heightened risk aversion toward the end of April and during the month of May. This was due to the escalating sovereign debt crisis in Europe, uncertainties regarding new financial reforms in the U.S. and some worse-than-expected economic data. Most spread sectors then produced positive absolute returns in June and July, as investor demand for these securities again inc reased. There was another bout of risk aversion in August, given fears that the economy may slip back into a recession. However, with the Fed indicating the possibility of another round of quantitative easing, most spread sectors rallied in September and October. The spread sectors started to weaken again toward the middle of November as financial troubles in Ireland resulted in a re-emergence of the European sovereign debt crisis. While several spread sectors regained their footing in December, others remained weak given ongoing uncertainties in Europe and concerns regarding economic growth in China and its potential impact on the global economy.
Both short- and long-term Treasury yields fluctuated but, overall, moved lower during the reporting period. When the period began, two- and ten-year Treasury yields were 0.87% and 3.69%, respectively. On April 5, 2010, two- and ten-year Treasury yields peaked at 1.18% and 4.01%, respectively. Subsequent to hitting their highs for the period, yields largely declined during much of the next six months, with two-year Treasuries hitting their low for the year of 0.33% on November 4, 2010. Ten-year Treasuries reached their 2010 trough of 2.41% in early October. Yields then moved sharply higher given expectations for stronger growth in 2011 and the potential for rising inflation. When the period ended on December 31, 2010, two-year Treasury yields were 0.61% and ten-year Treasury yields were 3.30%. Over the reporting period, the Barclays Capital U.S. Aggregate Indexv returned 4.98%.
Overall strong demand from investors seeking incremental yield helped commercial mortgage-backed securities (“CMBS”) to produce strong returns during the reporting period. This more than offset continued weak fundamentals in the CMBS market. During the reporting period, the CMBS market, as measured by the Barclays Capital CMBS Indexvi returned 14.05%. Residential mortgage-backed securities, as measured by the Barclays Capital U.S. Mortgage-Backed Securities Indexvii, generated solid results but lagged the CMBS market during the reporting period, returning 4.02%.
As always, thank you for your confidence in our stewardship of your assets.
Sincerely,

R. Jay Gerken, CFA
Chairman, President and
Chief Executive Officer
January 28, 2011
All investments are subject to risk including the possible loss of principal. Past performance is no guarantee of future results. All index performance reflects no deduction for fees, expenses or taxes. Please note that an investor cannot invest directly in an index.
VI | | Western Asset Mortgage Defined Opportunity Fund Inc. |
Investment commentary (cont’d)
i Gross domestic product (“GDP”) is the market value of all final goods and services produced within a country in a given period of time.
ii The Institute for Supply Management’s PMI is based on a survey of purchasing executives who buy the raw materials for manufacturing at more than 350 companies. It offers an early reading on the health of the manufacturing sector.
iii The Federal Reserve Board (“Fed”) is responsible for the formulation of policies designed to promote economic growth, full employment, stable prices and a sustainable pattern of international trade and payments.
iv Duration is the measure of the price sensitivity of a fixed-income security to an interest rate change of 100 basis points. Calculation is based on the weighted average of the present values for all cash flows.
v The Barclays Capital U.S. Aggregate Index is a broad-based bond index comprised of government, corporate, mortgage- and asset-backed issues, rated investment grade or higher, and having at least one year to maturity.
vi The Barclays Capital CMBS Index measures the performance of the commercial mortgage-backed securities market.
vii The Barclays Capital U.S. Mortgage-Backed Securities Index is an unmanaged index composed of agency mortgage-backed pass-through securities, both fixed-rate and hybrid adjustable rate mortgages, issued by the Government National Mortgage Association, Federal National Mortgage Association and Federal Home Loan Mortgage Corporation.
Western Asset Mortgage Defined Opportunity Fund Inc. 2010 Annual Report | | 1 |
Fund overview
Q. What is the Fund’s investment strategy?
A. The Fund’s investment objective is to provide current income. As a secondary investment objective, the Fund will seek capital appreciation. The Fund seeks to achieve its investment objectives by investing primarily in a diverse portfolio of mortgage-backed securities (“MBS”), consisting primarily of non-agency residential mortgage-backed securities (“RMBS”) and commercial mortgage-backed securities (“CMBS”). The Fund intends to invest in MBS directly, and indirectly through a separate investment in a public-private investment fund (“PPIF”) formed in connection with the Legacy Securities Public-Private Investment Program (“PPIP”) established by the U.S. Department of the Treasury.
At Western Asset Management Company (“Western Asset”), the Fund’s subadviser, we utilize a fixed-income team approach, with decisions derived from interaction among various investment management sector specialists. The sector teams are comprised of Western Asset’s senior portfolio managers, research analysts and an in-house economist. Under this team approach, management of client fixed-income portfolios will reflect a consensus of interdisciplinary views within the Western Asset organization. The portfolio managers who have day-to-day responsibility for managing the Fund’s direct investments in MBS and other permitted investments are Stephen A. Walsh, S. Kenneth Leech and Ronald D. Mass.
Wilshire Associates Incorporated (“Wilshire”), a registered investment adviser unaffiliated with Legg Mason, Inc., serves as the Fund’s allocation subadviser. Wilshire is responsible for determining whether and to what extent the Fund will invest in the PPIF.
Q. What were the overall market conditions during the Fund’s reporting period?
A. During the period from February 24, 2010 through December 31, 2010 (the “reporting period”), the riskier segments of the fixed-income market produced strong results and outperformed U.S. Treasuries. This was due, in part, to improving economic conditions following the lengthy downturn from mid-2008 through mid-2009. Also supporting the spread sectors (non-U.S. Treasuries) was overall solid demand from investors seeking incremental yields given the low rates available from short-term fixed-income securities.
The spread sectors rallied during most of the reporting period, with notable exceptions being in late April and May 2010, as well as August and November 2010. Starting toward the end of April, there was a “flight to quality,” triggered by concerns regarding the escalating sovereign debt crisis in Europe. In addition, investor sentiment was negatively impacted by uncertainties surrounding financial reform legislation in the U.S. and signs that economic growth was moderating. Collectively, this caused investors to flock to the relative safety of Treasury securities, driving their yields lower and prices higher.
Robust investor risk appetite largely resumed during June and July, and again in September and October. These turnarounds occurred as the situation in Europe appeared to stabilize, the financial reform bill was signed into law and the Federal Reserve Board (“Fed”)i continued to indicate that it would keep short-term rates low for an
2 | | Western Asset Mortgage Defined Opportunity Fund Inc. 2010 Annual Report |
Fund overview (cont’d)
extended period. Investor risk aversion briefly returned in November when fears regarding the European debt crisis re-emerged. However, investor sentiment improved in December, given expectations for strengthening economic conditions in 2011.
The yields on two- and ten-year Treasuries began the reporting period at 0.87% and 3.70%, respectively. Treasury yields fluctuated during the reporting period given mixed signals regarding the economy and uncertainties regarding Fed monetary policy. Yields moved sharply lower in October 2010 in anticipation of additional quantitative easing (“QE2”) by the Fed. Yields then reversed course toward the end of the period as certain economic data were stronger than expected and there were concerns regarding future inflation. During the reporting period, two-year Treasury yields moved as high as 1.18% and as low as 0.33%, while ten-year Treasuries rose as high as 4.01% and fell as low as 2.41%.
CMBS generated very strong results during the reporting period, with the Barclays Capital CMBS Indexii returning 14.05%. The sector was supported by generally strong investor demand, as CMBS typically offered higher yields than other investment grade bond sectors. RMBS produced positive results but underperformed their CMBS counterparts during the reporting period. Over that time, the Barclays Capital U.S. Mortgage-Backed Securities Indexiii returned 4.02%.
Q. How did we respond to these changing market conditions?
A. By the end of June 2010, we had invested the cash from the Fund’s initial public offering, with the vast majority being allocated to RMBS. This allocation was diversified in direct investments to RMBS via Alt-Aiv mortgages and prime residential non-agency MBS, as well as smaller exposures to subprime mortgages and option adjustable-rate mortgages (“ARMs”). The Fund also accessed the RMBS market indirectly through a separate investment in the PPIF, which invests substantially all of its assets available for investment, alongside the Treasury Department, in a master fund that has been organized to invest directly in MBS and other assets eligible for purchase under the PPIP. In addition, the Fu nd had a modest allocation to CMBS. However, our focus was on RMBS, as we felt they offered more attractive values and stronger fundamentals than CMBS.
Performance review
For the period from its commencement of operations on February 24, 2010 through December 31, 2010, Western Asset Mortgage Defined Opportunity Fund Inc. returned 21.81% based on its net asset value (“NAV”)v and 14.08% based on its New York Stock Exchange (“NYSE”) market price per share. The Fund’s unmanaged benchmark, the BofA Merrill Lynch U.S. Floating Rate Home Equity Loan Asset Backed Securities Indexvi, returned 11.12% over the same time frame. The Lipper U.S. Mortgage Closed-End Funds Category Averagevii returned 13.34% for the period from February 28, 2010 through December 31, 2010. Please note that Lipper performance returns are based on each fund’s NAV.
During the reporting period, the Fund made distributions to shareholders totaling $1.12 per share. The performance table shows the Fund’s total return since its commencement of operations based on its NAV and market price as
Western Asset Mortgage Defined Opportunity Fund Inc. 2010 Annual Report | | 3 |
of December 31, 2010. Past performance is no guarantee of future results.
Performance Snapshot as of December 31, 2010 (unaudited)
Price Per Share | | Total Return*
Since Commencement
of Operations** | |
$21.98 (NAV) | | 21.81% | |
$21.60 (Market Price) | | 14.08% | |
All figures represent past performance and are not a guarantee of future results.
* Total returns are based on changes in NAV or market price, respectively. Total returns assume the reinvestment of all distributions in additional shares in accordance with the Fund’s Dividend Reinvestment Plan. Performance figures for periods shorter than one year represent cumulative figures and are not annualized.
** The Fund commenced operations on February 24, 2010.
Q. What were the leading contributors to performance?
A. The largest contributor to the Fund’s absolute performance during the reporting period was its allocation to non-agency MBS. The combination of the government’s aggressive programs to aid the housing market and signs that housing prices appeared to be stabilizing helped these securities generate strong results. The sector was supported by ongoing demand from a broader investor base, including asset managers participating in the PPIP and insurance companies buying non-agency MBS as a result of changing capital requirements. The non-agency MBS investable universe has shrunk 16% in 2010, with virtually no new issuance, which helped contribute to strong supply/demand trends in the sector. In addition, the reinvestment of paydowns from many existing investors helped to generate strong performance. Specifically, the Fund’s alloc ation to the PPIF contributed to performance, as it produced very strong results during the reporting period. Our exposure to Alt-A RMBS also significantly enhanced results. Alt-A mortgages are generally less risky than subprime mortgages but are typically riskier than prime mortgages. Our exposure to prime mortgages was also beneficial for performance. Both Alt-A and prime mortgages performed well given strong demand from investors searching to generate incremental yield.
Also contributing to the Fund’s results during the reporting period were its allocations to subprime mortgages and option ARMs. Finally, the Fund’s use of leverage, both through the PPIF and with its direct investments to RMBS, contributed to results as the leverage amplified the positive performance in these investments during the reporting period.
Q. What were the leading detractors from performance?
A. On an absolute basis, there were no detractors from performance for the period. The Fund’s allocation to cash was atypically high early in the period as we were in the process of investing the cash from the Fund’s initial public offering; therefore, the Fund did not reap the benefit of the sharp market rally during the beginning of the period.
Looking for additional information?
The Fund is traded under the symbol “DMO” and its closing market price is available in most newspapers under the NYSE listings. The daily NAV is available on-line under the symbol “XDMOX” on most financial websites. Barron’s and the Wall Street Journal’s Monday edition both carry closed-end
4 | | Western Asset Mortgage Defined Opportunity Fund Inc. 2010 Annual Report |
Fund overview (cont’d)
fund tables that provide additional information. In addition, the Fund issues a quarterly press release that can be found on most major financial websites as well as www.leggmason.com/cef.
In a continuing effort to provide information concerning the Fund, shareholders may call 1-888-777-0102 (toll free), Monday through Friday from 8:00 a.m. to 5:30 p.m. Eastern Time, for the Fund’s current NAV, market price and other information.
Thank you for your investment in Western Asset Mortgage Defined Opportunity Fund Inc. As always, we appreciate that you have chosen us to manage your assets and we remain focused on achieving the Fund’s investment goals.
Sincerely,
Western Asset Management Company
January 18, 2011
RISKS: The Fund’s investments are subject to liquidity risk, credit risk, inflation risk and interest rate risk. As interest rates rise, bond prices fall, reducing the value of the Fund’s fixed-income holdings. The Fund may invest in lower-rated high-yield bonds which are subject to greater credit risk (risk of default) than higher-rated obligations. MBS are subject to additional risks, including prepayment risk, which can limit the potential gains in a declining interest rate environment. The Fund may invest in securities backed by subprime or distressed mortgages which involve a higher degree of risk and chance of loss.
Leverage may result in greater volatility of NAV and the market price of common shares and increases a shareholder’s risk of loss. The Fund may make significant investments in derivative instruments. Derivative instruments can be illiquid, may disproportionately increase losses, and have a potentially large impact on Fund performance. The Fund is not guaranteed by the U.S. government, the U.S. Treasury or any government agency.
All investments are subject to risk including the possible loss of principal. Past performance is no guarantee of future results. All index performance reflects no deduction for fees, expenses or taxes. Please note that an investor cannot invest directly in an index.
The information provided is not intended to be a forecast of future events, a guarantee of future results or investment advice. Views expressed may differ from those of the firm as a whole.
Western Asset Mortgage Defined Opportunity Fund Inc. 2010 Annual Report | | 5 |
i | The Federal Reserve Board (“Fed”) is responsible for the formulation of policies designed to promote economic growth, full employment, stable prices and a sustainable pattern of international trade and payments. |
ii | The Barclays Capital CMBS Index measures the performance of the commercial mortgage-backed securities market. |
iii | The Barclays Capital U.S. Mortgage-Backed Securities Index is an unmanaged index composed of agency mortgage-backed pass-through securities, both fixed-rate and hybrid adjustable rate mortgages, issued by the Government National Mortgage Association, Federal National Mortgage Association and Federal Home Loan Mortgage Corporation. |
iv | Alternative A-Paper (“Alt-A”) is a classification of mortgages where the risk profile falls between prime and subprime. The borrowers behind these mortgages will typically have clean credit histories, but the mortgage itself will generally have some issues that increase its risk profile. |
v | Net asset value (“NAV”) is calculated by subtracting total liabilities and outstanding preferred stock (if any) from the closing value of all securities held by the Fund (plus all other assets) and dividing the result (total net assets) by the total number of the common shares outstanding. The NAV fluctuates with changes in the market prices of securities in which the Fund has invested. However, the price at which an investor may buy or sell shares of the Fund is the Fund’s market price as determined by supply of and demand for the Fund’s shares. |
vi | The BofA Merrill Lynch U.S. Floating Rate Home Equity Loan Asset Backed Securities Index tracks the performance of U.S. dollar-denominated investment grade floating-rate asset-backed securities collateralized by home equity loans publicly issued in the U.S. domestic market. Qualifying securities must have an investment grade rating, at least one year remaining to final stated maturity, a floating-rate coupon, and an original deal size for the collateral group of at least $250 million. |
vii | Lipper, Inc., a wholly-owned subsidiary of Reuters, provides independent insight on global collective investments. Returns are based on the period from February 28, 2010 through December 31, 2010, including the reinvestment of all distributions, including returns of capital, if any, calculated among the 11 funds in the Fund’s Lipper category. |
6 | | Western Asset Mortgage Defined Opportunity Fund Inc. 2010 Annual Report |
Fund at a glance† (unaudited)
Investment breakdown (%) as a percent of total investments
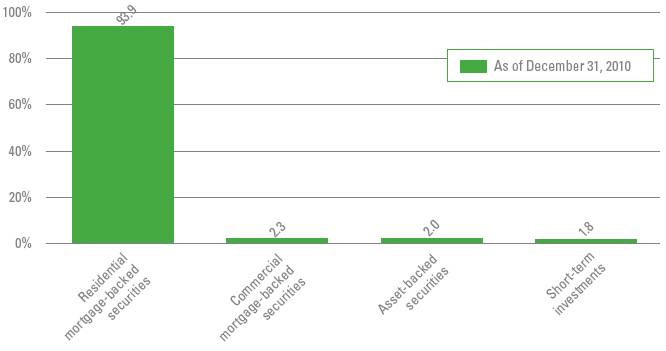
† The bar graph above represents the composition of the Fund’s direct investments and the exposure to these markets that the Fund receives through its investment in the RLJ Western Asset Public/Private Master Fund, LP as of December 31, 2010. This bar graph does not include derivatives. The Fund is actively managed. As a result, the composition of the Fund’s investments is subject to change at any time.
Western Asset Mortgage Defined Opportunity Fund Inc. 2010 Annual Report | | 7 |
Spread duration (unaudited)
Economic Exposure — December 31, 2010
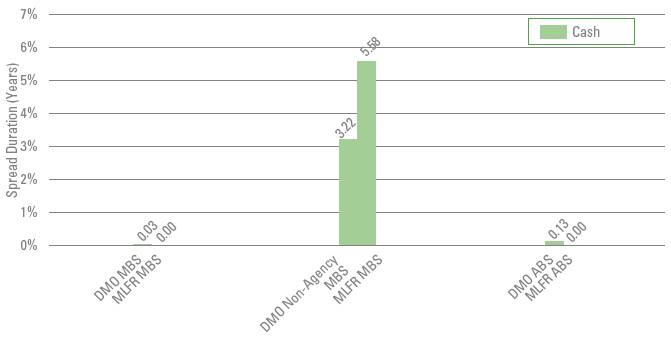
Spread duration measures the sensitivity to changes in spreads. The spread over Treasuries is the annual risk premium demanded by investors to hold non-Treasury securities. Spread duration is quantified as the % change in price resulting from a 100 basis points change in spreads. For a security with positive spread duration, an increase in spreads would result in a price decline and a decline in spreads would result in a price increase. This chart highlights the market sector exposure of the Fund’s sectors relative to the selected benchmark sectors as of the end of the reporting period.
ABS | — Asset Backed Securities |
DMO | — Western Asset Mortgage Defined Opportunity Fund Inc. |
MBS | — Mortgage-Backed Securities |
MLFR | — BofA Merrill Lynch U.S. Floating Rate Home Equity Loan Asset Backed Securities Index |
8 | | Western Asset Mortgage Defined Opportunity Fund Inc. 2010 Annual Report |
Effective duration (unaudited)
Interest Rate Exposure — December 31, 2010

Effective duration measures the sensitivity to changes in relevant interest rates. Effective duration is quantified as the % change in price resulting from a 100 basis points change in interest rates. For a security with positive effective duration, an increase in interest rates would result in a price decline and a decline in interest rates would result in a price increase. This chart highlights the interest rate exposure of the Fund’s sectors relative to the selected benchmark sectors as of the end of the reporting period.
ABS | — Asset Backed Securities |
DMO | — Western Asset Mortgage Defined Opportunity Fund Inc. |
MBS | — Mortgage-Backed Securities |
MLFR | — BofA Merrill Lynch U.S. Floating Rate Home Equity Loan Asset Backed Securities Index |
Western Asset Mortgage Defined Opportunity Fund Inc. 2010 Annual Report | | 9 |
Schedule of investments
December 31, 2010
Western Asset Mortgage Defined Opportunity Fund Inc.
Security | | Rate | | Maturity
Date | | Face
Amount | | Value | |
Commercial Mortgage-Backed Securities — 2.2% | | | | | | | | | |
Bayview Commercial Asset Trust, 2004-3 A1 | | 0.631 | % | 1/25/35 | | $ | 930,346 | | $ | 776,160 | (a)(b) |
Bayview Commercial Asset Trust, 2007-1 B1 | | 0.931 | % | 3/25/37 | | 1,380,571 | | 276,114 | (a)(b) |
CVS Corp. | | 9.350 | % | 1/10/23 | | 80,000 | | 82,594 | (a) |
Extended Stay America Trust, 2010-ESHA XB1 | | 1.165 | % | 1/5/16 | | 41,000,000 | | 943,201 | (a)(b) |
Federal Home Loan Mortgage Corp. (FHLMC), K007 X1 | | 1.245 | % | 4/25/20 | | 7,463,894 | | 564,147 | (b) |
Federal Home Loan Mortgage Corp. (FHLMC), K009 X1 | | 1.522 | % | 8/25/20 | | 8,172,985 | | 757,420 | (b) |
GS Mortgage Securities Corp., 2010-C1 X | | 1.587 | % | 8/10/43 | | 17,127,566 | | 1,543,089 | (a)(b) |
Morgan Stanley Capital I, 1999-LIFE E | | 6.969 | % | 4/15/33 | | 1,039,067 | | 1,042,253 | (b) |
Total Commercial Mortgage-Backed Securities (Cost — $5,885,934) | | | | | | 5,984,978 | |
Residential Mortgage-Backed Securities — 62.5% | | | | | | | | | |
ABFS Mortgage Loan Trust, 2002-3 M1 | | 5.902 | % | 9/15/33 | | 1,510,000 | | 1,197,077 | |
Accredited Mortgage Loan Trust, 2003-3 A1 | | 4.460 | % | 1/25/34 | | 2,116,381 | | 1,680,153 | (c) |
American Home Mortgage Assets, 2005-2 2A1A | | 3.150 | % | 1/25/36 | | 1,414,254 | | 724,739 | (b) |
American Home Mortgage Investment Trust, 2005-1 6A | | 2.457 | % | 6/25/45 | | 198,420 | | 174,509 | (b) |
American Home Mortgage Investment Trust, 2005-SD1 1A1 | | 0.711 | % | 9/25/35 | | 638,000 | | 374,583 | (a)(b) |
American Home Mortgage Investment Trust, 2007-2 2A | | 0.661 | % | 3/25/47 | | 4,748,494 | | 662,486 | (b) |
American Home Mortgage Investment Trust, 2007-A 4A | | 0.711 | % | 7/25/46 | | 654,257 | | 223,586 | (a)(b) |
ARM Trust, 2005-5 1A1 | | 2.799 | % | 9/25/35 | | 462,726 | | 333,545 | (b) |
ARM Trust, 2005-10 1A21 | | 3.047 | % | 1/25/36 | | 660,017 | | 468,434 | (b) |
ARM Trust, 2005-12 5A1 | | 0.511 | % | 3/25/36 | | 617,106 | | 346,476 | (b) |
ARM Trust, 2007-1 1A1 | | 3.065 | % | 3/25/37 | | 897,690 | | 476,966 | (b) |
Banc of America Funding Corp., 2004-B 6A1 | | 3.470 | % | 12/20/34 | | 1,192,004 | | 648,214 | (b) |
Banc of America Funding Corp., 2004-C 3A1 | | 3.187 | % | 12/20/34 | | 1,367,780 | | 1,152,194 | (b) |
Banc of America Funding Corp., 2006-5 4A5 | | 6.000 | % | 9/25/36 | | 3,600,000 | | 3,111,799 | (c) |
Banc of America Funding Corp., 2006-D 6A1 | | 5.644 | % | 5/20/36 | | 2,973,066 | | 1,978,284 | (b)(c) |
Banc of America Funding Corp., 2006-F 1A1 | | 4.965 | % | 7/20/36 | | 1,449,554 | | 1,280,628 | (b) |
Banc of America Funding Corp., 2006-H 3A1 | | 6.030 | % | 9/20/46 | | 478,176 | | 435,221 | (b) |
Banc of America Funding Corp., 2007-A 2A1 | | 0.421 | % | 2/20/47 | | 695,001 | | 505,789 | (b) |
Banc of America Funding Corp., 2007-E CA9 | | 5.892 | % | 7/20/47 | | 5,183,947 | | 1,245,205 | (b) |
Banc of America Mortgage Securities Inc., 2005-E 2A7 | | 2.866 | % | 6/25/35 | | 700,000 | | 572,155 | (b) |
Bayview Financial Acquisition Trust, 2005-B M1 | | 0.711 | % | 4/28/39 | | 3,490,000 | | 2,690,532 | (b)(c) |
Bayview Financial Acquisition Trust, Series 2007-A, Class 2A | | 0.611 | % | 5/28/37 | | 2,985,393 | | 1,732,546 | (b)(c) |
| | | | | | | | | | | |
See Notes to Financial Statements.
10 | | Western Asset Mortgage Defined Opportunity Fund Inc. 2010 Annual Report |
Schedule of investments (cont’d)
December 31, 2010
Western Asset Mortgage Defined Opportunity Fund Inc.
Security | | Rate | | Maturity
Date | | Face
Amount | | Value | |
Bayview Financial Asset Trust, 2007-SR1A M2 | | 1.161 | % | 3/25/37 | | $ | 4,567,966 | | $ | 2,558,061 | (a)(b) |
Bayview Financial Asset Trust, 2007-SR1A M3 | | 1.411 | % | 3/25/37 | | 3,165,658 | | 1,456,203 | (a)(b) |
Bear Stearns Alt-A Trust, 2005-2 2A4 | | 2.923 | % | 4/25/35 | | 313,342 | | 250,191 | (b) |
Bear Stearns Alt-A Trust, 2005-3 4A3 | | 2.734 | % | 3/25/35 | | 661,173 | | 480,076 | (b) |
Bear Stearns Alt-A Trust, 2005-4 24A1 | | 5.254 | % | 5/25/35 | | 895,971 | | 806,976 | (b) |
Bear Stearns Alt-A Trust, 2005-9 25A1 | | 5.551 | % | 11/25/35 | | 783,118 | | 598,368 | (b) |
Bear Stearns Alt-A Trust, 2006-2 23A1 | | 4.885 | % | 3/25/36 | | 2,925,975 | | 1,551,011 | (b) |
Bear Stearns ARM Trust, 2005-1 2A1 | | 3.060 | % | 3/25/35 | | 856,758 | | 709,041 | (b) |
Bear Stearns ARM Trust, 2005-6 1A1 | | 2.941 | % | 8/25/35 | | 262,597 | | 191,533 | (b) |
Bear Stearns Asset Backed Securities Trust, 2003-SD2 1A | | 4.180 | % | 6/25/43 | | 115,680 | | 110,046 | (b) |
Bear Stearns Asset Backed Securities Trust, 2005-CL1 A1 | | 0.761 | % | 9/25/34 | | 285,183 | | 215,226 | (b) |
Chase Mortgage Finance Corp., 2005-A2 1A5 | | 3.960 | % | 1/25/36 | | 4,000,000 | | 3,194,966 | (b) |
Chase Mortgage Finance Corp., 2006-S3 2A1 | | 5.500 | % | 11/25/21 | | 1,323,946 | | 1,264,651 | (c) |
Chevy Chase Mortgage Funding Corp., 2006-2A A1 | | 0.391 | % | 4/25/47 | | 423,439 | | 218,147 | (a)(b) |
Citigroup Mortgage Loan Trust Inc., 2005-10 1A1A | | 3.078 | % | 12/25/35 | | 620,933 | | 412,240 | (b) |
Citigroup Mortgage Loan Trust Inc., 2006-AR5 2A1A | | 2.918 | % | 7/25/36 | | 1,255,757 | | 615,693 | (b) |
Citigroup Mortgage Loan Trust Inc., 2007-6 1A1A | | 3.060 | % | 5/25/37 | | 871,669 | | 452,346 | (b) |
Citigroup Mortgage Loan Trust Inc., 2007-AR8 1A1A | | 5.522 | % | 8/25/47 | | 872,972 | | 673,059 | (b) |
Citigroup Mortgage Loan Trust Inc., 2007-SHL1 A | | 0.661 | % | 11/25/46 | | 938,046 | | 489,915 | (a)(b) |
Countrywide Alternative Loan Trust, 2005-14 3A1 | | 3.336 | % | 5/25/35 | | 745,400 | | 392,011 | (b) |
Countrywide Alternative Loan Trust, 2005-3CB 1A6 | | 6.889 | % | 3/25/35 | | 1,978,203 | | 322,014 | (b) |
Countrywide Alternative Loan Trust, 2005-7CB 1A3 | | 6.339 | % | 4/25/35 | | 6,076,547 | | 789,898 | (b) |
Countrywide Alternative Loan Trust, 2005-J10 1A1 | | 0.761 | % | 10/25/35 | | 554,608 | | 397,738 | (b) |
Countrywide Alternative Loan Trust, 2005-J8 2A1 | | 5.000 | % | 6/25/20 | | 432,991 | | 390,097 | |
Countrywide Alternative Loan Trust, 2006-HY10 1A1 | | 5.407 | % | 5/25/36 | | 1,561,900 | | 999,542 | (b) |
Countrywide Alternative Loan Trust, 2006-J8 A5 | | 6.000 | % | 2/25/37 | | 295,198 | | 209,474 | |
Countrywide Alternative Loan Trust, 2007-3T1 2A1 | | 6.000 | % | 3/25/27 | | 2,561,356 | | 2,170,126 | |
Countrywide Home Loans Mortgage Pass-Through Trust, 2004-23 A | | 2.519 | % | 11/25/34 | | 565,607 | | 378,498 | (b) |
Countrywide Home Loans Mortgage Pass-Through Trust, 2005-2 2A1 | | 0.581 | % | 3/25/35 | | 233,562 | | 149,989 | (b) |
Countrywide Home Loans Mortgage Pass-Through Trust, 2005-7 2A1 | | 0.571 | % | 3/25/35 | | 560,372 | | 359,699 | (b) |
Countrywide Home Loans Mortgage Pass-Through Trust, 2005-9 1A1 | | 0.561 | % | 5/25/35 | | 303,436 | | 199,522 | (b) |
Countrywide Home Loans Mortgage Pass-Through 2005-11 6A1 | | 0.561 | % | 3/25/35 | | 200,625 | | 129,369 | (b) |
Countrywide Home Loans Mortgage Pass-Through 2005-18 A7 | | 18.808 | % | 10/25/35 | | 136,420 | | 148,454 | (b) |
Countrywide Home Loans Mortgage Pass-Through Trust, 2005-HY10 1A1 | | 3.369 | % | 2/20/36 | | 526,861 | | 305,848 | (b) |
| | | | | | | | | | | |
See Notes to Financial Statements.
Western Asset Mortgage Defined Opportunity Fund Inc. 2010 Annual Report | | 11 |
Western Asset Mortgage Defined Opportunity Fund Inc.
Security | | Rate | | Maturity
Date | | Face
Amount | | Value | |
Countrywide Home Loans Mortgage Pass-Through Trust, 2005-HYB6 1A1 | | 2.816 | % | 10/20/35 | | $ | 1,749,142 | | $ | 1,120,367 | (b) |
Countrywide Home Loans Mortgage Pass-Through Trust, 2005-J2 3A10 | | 47.733 | % | 8/25/35 | | 155,544 | | 296,298 | (b) |
Countrywide Home Loans Mortgage Pass-Through Trust, 2005-R1 1AF1 | | 0.621 | % | 3/25/35 | | 1,422,633 | | 1,179,575 | (a)(b) |
Countrywide Home Loans Mortgage Pass-Through Trust, 2005-R2 2A3 | | 8.000 | % | 6/25/35 | | 277,153 | | 248,558 | (a) |
Countrywide Home Loans Mortgage Pass-Through Trust, 2006-3 2A1 | | 0.511 | % | 3/25/36 | | 1,060,900 | | 688,669 | (b) |
Credit Suisse First Boston Mortgage Securities Corp., 2005-10 3A3 | | 5.500 | % | 11/25/35 | | 1,336,604 | | 1,077,385 | |
Credit Suisse First Boston Mortgage Securities Corp., 2005-10 12A1 | | 5.250 | % | 11/25/20 | | 593,869 | | 584,267 | |
Credit Suisse Mortgage Capital Certificates, 2006-8 2A1 | | 5.500 | % | 10/25/21 | | 3,960,641 | | 3,558,836 | (c) |
Credit Suisse Mortgage Capital Certificates, 2009-5R 2A3 | | 6.036 | % | 7/26/49 | | 4,000,000 | | 2,380,000 | (a)(b)(d) |
Credit-Based Asset Servicing and Securitization LLC, 2004-CB2 M1 | | 0.781 | % | 7/25/33 | | 777,640 | | 569,691 | (b) |
Deutsche ALT-A Securities Inc. Mortgage Loan Trust, 2005-AR2 3A1 | | 2.954 | % | 10/25/35 | | 2,358,863 | | 1,521,142 | (b) |
Deutsche ALT-A Securities Inc. Mortgage Loan Trust, 2006-AR1 2A1 | | 3.008 | % | 2/25/36 | | 390,658 | | 248,197 | (b) |
Deutsche ALT-A Securities Inc. Mortgage Loan Trust, 2007-1 2A1 | | 0.361 | % | 8/25/37 | | 944,013 | | 627,467 | (b) |
Deutsche Mortgage Securities Inc., 2005-WF1 1A3 | | 5.200 | % | 6/26/35 | | 2,200,000 | | 2,036,862 | (a)(b)(c) |
Downey Savings & Loan Association Mortgage Loan Trust, 2005-AR2 2A1A | | 0.471 | % | 3/19/45 | | 822,136 | | 559,206 | (b) |
First Horizon Alternative Mortgage Securities, 2005-AA6 3A1 | | 2.383 | % | 8/25/35 | | 1,984,385 | | 1,531,822 | (b)(c) |
First Horizon Alternative Mortgage Securities, 2006-FA6 2A1 | | 6.250 | % | 11/25/36 | | 431,037 | | 361,057 | |
First Horizon Alternative Mortgage Securities, 2006-FA8 1A8 | | 0.631 | % | 2/25/37 | | 852,911 | | 444,936 | (b) |
First Horizon Mortgage Pass-Through Trust, 2005-AR4 2A1 | | 2.880 | % | 10/25/35 | | 1,162,077 | | 951,318 | (b) |
Greenpoint Mortgage Funding Trust, 2005-AR4 A1 | | 0.521 | % | 10/25/45 | | 931,180 | | 625,460 | (b) |
Greenpoint Mortgage Funding Trust, 2006-AR3 4A1 | | 0.471 | % | 4/25/36 | | 1,948,976 | | 1,188,370 | (b) |
Greenpoint Mortgage Funding Trust, 2006-AR5 A1A | | 0.341 | % | 10/25/46 | | 260,810 | | 238,323 | (b) |
GSMPS Mortgage Loan Trust, 2004-4 2A1 | | 4.324 | % | 6/25/34 | | 416,775 | | 354,894 | (a)(b) |
GSMPS Mortgage Loan Trust, 2005-LT1 A1 | | 0.491 | % | 2/25/35 | | 446,754 | | 384,209 | (a)(b) |
GSMPS Mortgage Loan Trust, 2005-RP3 1AF | | 0.611 | % | 9/25/35 | | 422,648 | | 353,030 | (a)(b) |
GSMPS Mortgage Loan Trust, 2006-RP1 1A2 | | 7.500 | % | 1/25/36 | | 873,183 | | 809,890 | (a) |
| | | | | | | | | | | |
See Notes to Financial Statements.
12 | | Western Asset Mortgage Defined Opportunity Fund Inc. 2010 Annual Report |
Schedule of investments (cont’d)
December 31, 2010
Western Asset Mortgage Defined Opportunity Fund Inc.
Security | | Rate | | Maturity
Date | | Face
Amount | | Value | |
GSR Mortgage Loan Trust, 2005-3F 1A15 | | 22.854 | % | 3/25/35 | | $ | 341,547 | | $ | 382,194 | (b) |
GSR Mortgage Loan Trust, 2005-AR3 3A1 | | 2.939 | % | 5/25/35 | | 516,202 | | 391,057 | (b) |
GSR Mortgage Loan Trust, 2005-AR4 2A1 | | 2.911 | % | 7/25/35 | | 786,420 | | 593,695 | (b) |
GSR Mortgage Loan Trust, 2005-AR5 1A1 | | 3.040 | % | 10/25/35 | | 393,616 | | 294,970 | (b) |
GSR Mortgage Loan Trust, 2006-10F 4A2 | | 6.389 | % | 1/25/37 | | 3,070,224 | | 618,280 | (b) |
Harborview Mortgage Loan Trust, 2006-2 | | 2.978 | % | 2/25/36 | | 99,966 | | 56,581 | (b) |
Home Equity Asset Trust, 2004-2 M1 | | 1.056 | % | 7/25/34 | | 580,665 | | 443,840 | (b) |
Home Equity Asset Trust, 2005-3 M2 | | 0.701 | % | 8/25/35 | | 1,010,000 | | 967,654 | (b) |
HSI Asset Loan Obligation Trust, 2007-AR1 4A1 | | 5.560 | % | 1/25/37 | | 733,553 | | 487,709 | (b) |
IMPAC Secured Assets Corp., 2006-1 1A2B | | 0.461 | % | 5/25/36 | | 283,849 | | 125,702 | (b) |
IMPAC Secured Assets Corp., 2007-1 A2 | | 0.421 | % | 3/25/37 | | 1,200,000 | | 583,428 | (b) |
Indymac Inda Mortgage Loan Trust, 2005-AR2 1A1 | | 2.592 | % | 1/25/36 | | 270,975 | | 232,490 | (b) |
Indymac Inda Mortgage Loan Trust, 2007-AR3 1A1 | | 5.668 | % | 7/25/37 | | 358,397 | | 294,484 | (b) |
Indymac Inda Mortgage Loan Trust, 2007-AR7 1A1 | | 5.874 | % | 11/25/37 | | 67,908 | | 55,012 | (b) |
Indymac Index Mortgage Loan Trust, 2004-AR13 1A1 | | 2.830 | % | 1/25/35 | | 224,338 | | 167,703 | (b) |
Indymac Index Mortgage Loan Trust, 2005-AR15 A2 | | 5.047 | % | 9/25/35 | | 256,200 | | 214,809 | (b) |
Indymac Index Mortgage Loan Trust, 2006-AR4 A1A | | 0.471 | % | 5/25/46 | | 675,403 | | 409,656 | (b) |
Indymac Index Mortgage Loan Trust, 2006-AR7 3A1 | | 5.217 | % | 5/25/36 | | 1,068,652 | | 614,524 | (b) |
Indymac Index Mortgage Loan Trust, 2006-AR7 5A1 | | 4.902 | % | 3/25/36 | | 967,642 | | 610,476 | (b) |
Indymac Index Mortgage Loan Trust, 2006-AR11 1A1 | | 2.875 | % | 6/25/36 | | 902,878 | | 510,861 | (b) |
Indymac Index Mortgage Loan Trust, 2006-AR25 4A3 | | 4.752 | % | 9/25/36 | | 2,990,000 | | 1,353,785 | (b) |
Indymac Index Mortgage Loan Trust, 2006-AR9 3A3 | | 5.334 | % | 6/25/36 | | 1,554,728 | | 1,194,473 | (b)(c) |
Indymac Index Mortgage Loan Trust, 2007-AR05 2A1 | | 5.114 | % | 5/25/37 | | 4,732,516 | | 2,649,530 | (b)(c) |
Indymac Index Mortgage Loan Trust, 2007-AR15 2A1 | | 5.261 | % | 8/25/37 | | 676,812 | | 455,095 | (b) |
Jefferies & Co., 2009-R3 2A2 | | 3.165 | % | 11/26/34 | | 4,040,045 | | 2,565,429 | (a)(b) |
JPMorgan Alternative Loan Trust, 2006-A4 A7 | | 6.300 | % | 9/25/36 | | 1,000,000 | | 518,501 | (b) |
JPMorgan Alternative Loan Trust, 2006-S3 A3A | | 6.000 | % | 8/25/36 | | 2,000,000 | | 1,766,074 | (c) |
JPMorgan Alternative Loan Trust, 2007-A1 3A1 | | 6.128 | % | 3/25/37 | | 1,220,128 | | 783,200 | (b) |
JPMorgan Mortgage Trust, 2005-S3 1A1 | | 6.500 | % | 1/25/36 | | 2,188,869 | | 1,554,544 | (c) |
JPMorgan Mortgage Trust, 2006-S2 1A24 | | 5.000 | % | 7/25/36 | | 522,368 | | 463,034 | |
JPMorgan Mortgage Trust, 2006-S2 2A1 | | 5.000 | % | 7/25/36 | | 369,878 | | 345,121 | |
JPMorgan Mortgage Trust, 2006-S2 2A2 | | 5.875 | % | 7/25/36 | | 477,793 | | 454,688 | |
JPMorgan Mortgage Trust, 2007-S2 3A2 | | 6.000 | % | 6/25/37 | | 505,542 | | 495,159 | |
JPMorgan Mortgage Trust, 2007-S2 3A3 | | 6.500 | % | 6/25/37 | | 140,936 | | 138,511 | |
JPMorgan Mortgage Trust, 2007-S3 2A3 | | 6.000 | % | 8/25/22 | | 198,060 | | 194,584 | |
Lehman Mortgage Trust, 2006-3 2A1 | | 0.621 | % | 7/25/36 | | 7,622,825 | | 3,682,385 | (b)(c) |
Lehman Mortgage Trust, 2006-3 2A2 | | 6.879 | % | 7/25/36 | | 8,607,323 | | 1,520,182 | (b) |
Lehman XS Trust, 2005-9N 1A1 | | 0.531 | % | 2/25/36 | | 505,879 | | 315,619 | (b) |
Lehman XS Trust, 2006-14N 3A2 | | 0.381 | % | 8/25/36 | | 571,819 | | 306,171 | (b) |
Lehman XS Trust, 2006-19 A4 | | 0.431 | % | 12/25/36 | | 968,365 | | 486,751 | (b) |
| | | | | | | | | | | |
See Notes to Financial Statements.
Western Asset Mortgage Defined Opportunity Fund Inc. 2010 Annual Report | | 13 |
Western Asset Mortgage Defined Opportunity Fund Inc.
Security | | Rate | | Maturity
Date | | Face
Amount | | Value | |
MASTR Adjustable Rate Mortgages Trust, 2004-12 5A1 | | 3.660 | % | 10/25/34 | | $ | 329,254 | | $ | 278,945 | (b) |
MASTR Adjustable Rate Mortgages Trust, 2004-13 3A7 | | 2.899 | % | 11/21/34 | | 600,000 | | 562,871 | (b)(c) |
MASTR Adjustable Rate Mortgages Trust, 2004-15 1A1 | | 3.572 | % | 12/25/34 | | 151,343 | | 113,847 | (b) |
MASTR Adjustable Rate Mortgages Trust, 2006-2 4A1 | | 4.969 | % | 2/25/36 | | 338,946 | | 320,799 | (b) |
MASTR Adjustable Rate Mortgages Trust, 2006-OA1 1A1 | | 0.471 | % | 4/25/46 | | 610,566 | | 363,863 | (b) |
MASTR Alternative Loans Trust, 2006-2 2A4 | | 6.889 | % | 3/25/36 | | 2,892,468 | | 664,429 | (b) |
MASTR Reperforming Loan Trust, 2005-2 1A3 | | 7.500 | % | 5/25/35 | | 25,936 | | 24,471 | (a) |
MASTR Reperforming Loan Trust, 2006-2 1A1 | | 5.521 | % | 5/25/36 | | 2,977,221 | | 2,763,171 | (a)(b)(c) |
Merrill Lynch Mortgage Investors Trust, 2005-A2 A5 | | 2.773 | % | 2/25/35 | | 650,000 | | 592,026 | (b)(c) |
Merrill Lynch Mortgage Investors Trust, 2006-A1 2A1 | | 5.889 | % | 3/25/36 | | 179,947 | | 119,485 | (b) |
Morgan Stanley Mortgage Loan Trust, 2004-6AR 2A2 | | 2.931 | % | 8/25/34 | | 763,652 | | 661,187 | (b) |
Morgan Stanley Mortgage Loan Trust, 2005-5AR 4A1 | | 5.417 | % | 9/25/35 | | 89,806 | | 65,164 | (b) |
Morgan Stanley Mortgage Loan Trust, 2006-1AR 1A1 | | 0.541 | % | 2/25/36 | | 1,189,952 | | 706,995 | (b) |
Morgan Stanley Mortgage Loan Trust, 2006-8AR 1A2 | | 0.331 | % | 6/25/36 | | 515,608 | | 264,579 | (b) |
Morgan Stanley Mortgage Loan Trust, 2007-15AR 4A1 | | 5.565 | % | 11/25/37 | | 3,153,731 | | 2,106,535 | (b)(c) |
Nomura Asset Acceptance Corp., 2004-R1 A1 | | 6.500 | % | 3/25/34 | | 231,914 | | 233,905 | (a)(c) |
Prime Mortgage Trust, 2006-DR1 2A1 | | 5.500 | % | 5/25/35 | | 1,883,052 | | 1,660,984 | (a)(c) |
RAAC Series, 2006-RP3 A | | 0.531 | % | 5/25/36 | | 1,355,551 | | 872,745 | (a)(b) |
RAAC Series, 2007-RP2 A | | 0.611 | % | 2/25/46 | | 668,720 | | 436,887 | (a)(b) |
RAAC Series, 2007-RP3 A | | 0.641 | % | 10/25/46 | | 1,993,924 | | 1,234,387 | (a)(b) |
RAAC Series, 2007-SP1 A2 | | 0.611 | % | 3/25/37 | | 3,000,000 | | 2,436,616 | (b)(c) |
RAAC Series, 2007-SP3 A1 | | 1.461 | % | 9/25/47 | | 1,000,425 | | 765,819 | (b) |
Renaissance Home Equity Loan Trust, 2002-3 A | | 1.021 | % | 12/25/32 | | 1,629,564 | | 1,220,026 | (b)(c) |
Renaissance Home Equity Loan Trust, 2006-2 AV3 | | 0.501 | % | 8/25/36 | | 800,000 | | 474,012 | (b) |
Residential Accredit Loans Inc., 2006-QA1 A11 | | 3.733 | % | 1/25/36 | | 1,327,225 | | 722,384 | (b) |
Residential Accredit Loans Inc., 2006-QA1 A31 | | 6.172 | % | 1/25/36 | | 4,543,522 | | 2,826,489 | (b)(c) |
Residential Accredit Loans Inc., 2006-QA4 A | | 0.441 | % | 5/25/36 | | 916,654 | | 456,769 | (b) |
Residential Accredit Loans Inc., 2007-QA2 A1 | | 0.391 | % | 2/25/37 | | 1,091,351 | | 616,444 | (b) |
Residential Asset Securitization Trust, 2005-A05 A1 | | 0.561 | % | 5/25/35 | | 1,103,484 | | 961,713 | (b) |
Residential Asset Securitization Trust, 2005-A05 A2 | | 4.939 | % | 5/25/35 | | 3,640,063 | | 316,206 | (b) |
Residential Asset Securitization Trust, 2005-A13 1A3 | | 0.731 | % | 10/25/35 | | 468,199 | | 348,351 | (b) |
Residential Asset Securitization Trust, 2005-A13 1A4 | | 4.769 | % | 10/25/35 | | 468,199 | | 76,734 | (b) |
Residential Asset Securitization Trust, 2006-A1 1A6 | | 0.761 | % | 4/25/36 | | 3,076,333 | | 1,919,260 | (b)(c) |
Residential Asset Securitization Trust, 2006-A1 1A7 | | 5.239 | % | 4/25/36 | | 3,076,333 | | 406,353 | (b) |
Residential Asset Securitization Trust, 2007-A2 1A1 | | 6.000 | % | 4/25/37 | | 910,366 | | 662,252 | |
| | | | | | | | | | | |
See Notes to Financial Statements.
14 | | Western Asset Mortgage Defined Opportunity Fund Inc. 2010 Annual Report |
Schedule of investments (cont’d)
December 31, 2010
Western Asset Mortgage Defined Opportunity Fund Inc.
Security | | Rate | | Maturity
Date | | Face
Amount | | Value | |
Residential Funding Mortgage Securities I, 2006-SA2 4A1 | | 5.869 | % | 8/25/36 | | $ | 1,337,599 | | $ | 1,161,714 | (b) |
Residential Funding Securities LLC, 2003-RP2 A1 | | 0.711 | % | 6/25/33 | | 97,504 | | 81,089 | (a)(b) |
Structured ARM Loan Trust, 2004-07 A3 | | 0.751 | % | 6/25/34 | | 277,232 | | 220,917 | (b) |
Structured ARM Loan Trust, 2004-16 1A2 | | 2.719 | % | 11/25/34 | | 957,338 | | 764,844 | (b) |
Structured ARM Loan Trust, 2004-18 1A2 | | 2.750 | % | 12/25/34 | | 1,029,617 | | 818,342 | (b) |
Structured ARM Loan Trust, 2005-01 1A1 | | 2.780 | % | 2/25/35 | | 2,155,653 | | 1,569,887 | (b)(c) |
Structured ARM Loan Trust, 2005-04 1A1 | | 2.921 | % | 3/25/35 | | 430,119 | | 292,097 | (b) |
Structured ARM Loan Trust, 2005-04 3A1 | | 2.836 | % | 3/25/35 | | 175,666 | | 141,837 | (b) |
Structured ARM Loan Trust, 2005-04 5A | | 5.483 | % | 3/25/35 | | 1,078,913 | | 1,001,916 | (b) |
Structured ARM Loan Trust, 2005-07 1A3 | | 2.791 | % | 4/25/35 | | 229,628 | | 173,258 | (b) |
Structured ARM Loan Trust, 2005-12 3A1 | | 2.579 | % | 6/25/35 | | 277,335 | | 221,254 | (b) |
Structured ARM Loan Trust, 2005-15 1A1 | | 2.621 | % | 7/25/35 | | 581,170 | | 407,098 | (b) |
Structured ARM Loan Trust, 2005-22 1A4 | | 2.600 | % | 12/25/35 | | 1,870,000 | | 744,448 | (b) |
Structured ARM Loan Trust, 2006-1 5A2 | | 3.306 | % | 2/25/36 | | 550,000 | | 349,756 | (b) |
Structured ARM Loan Trust, 2006-4 4A1 | | 5.567 | % | 5/25/36 | | 974,008 | | 762,111 | (b) |
Structured ARM Loan Trust, 2006-8 3A5 | | 5.312 | % | 9/25/36 | | 2,470,000 | | 1,729,677 | (b) |
Structured ARM Loan Trust, 2007-5 2A2 | | 5.379 | % | 6/25/37 | | 1,300,000 | | 740,864 | (b) |
Structured ARM Loan Trust, 2007-7 1A1 | | 0.561 | % | 8/25/37 | | 3,021,635 | | 1,982,305 | (b) |
Structured Asset Investment Loan Trust, 2003-BC10 A4 | | 1.261 | % | 10/25/33 | | 860,000 | | 738,487 | (b) |
Structured Asset Mortgage Investments Inc., 2006-AR5 4A1 | | 0.481 | % | 5/25/46 | | 958,362 | | 512,257 | (b) |
Structured Asset Securities Corp., 1999-RF1 A | | 7.503 | % | 10/15/28 | | 1,435,276 | | 1,398,314 | (a)(b) |
Structured Asset Securities Corp., 2003-37A 3A7 | | 2.581 | % | 12/25/33 | | 1,051,744 | | 931,119 | (b)(c) |
Structured Asset Securities Corp., 2004-NP1 A | | 0.661 | % | 9/25/33 | | 429,901 | | 371,615 | (a)(b)(c) |
Structured Asset Securities Corp., 2005-2XS 1A5B | | 4.650 | % | 2/25/35 | | 3,215,932 | | 2,858,608 | (c) |
Structured Asset Securities Corp., 2005-4XS 3A4 | | 4.790 | % | 3/25/35 | | 2,710,000 | | 2,668,521 | (c) |
Structured Asset Securities Corp., 2005-5 2A2 | | 5.500 | % | 4/25/35 | | 500,000 | | 413,804 | |
Structured Asset Securities Corp., 2005-RF1 A | | 0.611 | % | 3/25/35 | | 159,556 | | 132,600 | (a)(b) |
Structured Asset Securities Corp., 2005-RF2 A | | 0.611 | % | 4/25/35 | | 151,531 | | 129,642 | (a)(b) |
Structured Asset Securities Corp., 2006-RF3 1A1 | | 6.000 | % | 10/25/36 | | 219,293 | | 217,553 | (a) |
Structured Asset Securities Corp., 2006-RF4 2A1 | | 6.000 | % | 10/25/36 | | 189,283 | | 169,974 | (a) |
Thornburg Mortgage Securities Trust, 2007-4 2A1 | | 6.196 | % | 9/25/37 | | 1,665,572 | | 1,561,824 | (b)(c) |
Truman Capital Mortgage Loan Trust, 2006-1 A | | 0.521 | % | 3/25/36 | | 482,810 | | 313,931 | (a)(b) |
Wachovia Mortgage Loan Trust LLC, 2005-B 2A2 | | 3.076 | % | 10/20/35 | | 450,469 | | 433,188 | (b) |
Wachovia Mortgage Loan Trust LLC, 2005-B 2A3 | | 3.076 | % | 10/20/35 | | 1,450,000 | | 1,252,961 | (b) |
Wachovia Mortgage Loan Trust LLC, 2006-ALT1 A1 | | 0.341 | % | 1/25/37 | | 490,891 | | 287,636 | (b) |
Wachovia Mortgage Loan Trust LLC, 2006-ALT1 A2 | | 0.441 | % | 1/25/37 | | 1,156,613 | | 680,165 | (b) |
WaMu Alternative Mortgage Pass-Through Certificates, 2005-07 1A6 | | 47.183 | % | 9/25/35 | | 127,821 | | 196,724 | (b) |
| | | | | | | | | | | |
See Notes to Financial Statements.
Western Asset Mortgage Defined Opportunity Fund Inc. 2010 Annual Report | | 15 |
Western Asset Mortgage Defined Opportunity Fund Inc.
Security | | Rate | | Maturity
Date | | Face
Amount | | Value | |
WaMu Alternative Mortgage Pass-Through Certificates, 2005-09 5A4 | | 34.022 | % | 11/25/35 | | $ | 246,089 | | $ | 310,044 | (b) |
WaMu Alternative Mortgage Pass-Through Certificates, 2005-10 2A3 | | 1.161 | % | 11/25/35 | | 452,436 | | 289,727 | (b) |
WaMu Alternative Mortgage Pass-Through Certificates, 2006-AR10 A1 | | 0.361 | % | 12/25/36 | | 1,061,887 | | 622,039 | (b) |
WaMu Alternative Mortgage Pass-Through Certificates, 2006-5 1A1 | | 0.861 | % | 7/25/36 | | 322,114 | | 184,893 | (b) |
WaMu Alternative Mortgage Pass-Through Certificates, 2007-3 A9 | | 6.399 | % | 4/25/37 | | 9,772,751 | | 1,753,926 | (b) |
WaMu Mortgage Pass-Through Certificates, 2007-HY3 4A1 | | 5.009 | % | 3/25/37 | | 343,376 | | 299,830 | (b) |
WaMu Mortgage Pass-Through Certificates, 2004-AR10 A3 | | 0.800 | % | 7/25/44 | | 200,530 | | 158,619 | (b) |
WaMu Mortgage Pass-Through Certificates, 2005-AR05 A5 | | 2.705 | % | 5/25/35 | | 1,030,000 | | 949,246 | (b) |
WaMu Mortgage Pass-Through Certificates, 2005-AR05 A6 | | 2.705 | % | 5/25/35 | | 550,000 | | 461,363 | (b) |
WaMu Mortgage Pass-Through Certificates, 2005-AR14 1A1 | | 2.671 | % | 12/25/35 | | 315,481 | | 306,169 | (b) |
WaMu Mortgage Pass-Through Certificates, 2006-AR08 3A2 | | 5.942 | % | 8/25/36 | | 290,000 | | 242,439 | (b) |
WaMu Mortgage Pass-Through Certificates, 2006-AR10 1A2 | | 5.854 | % | 9/25/36 | | 237,267 | | 217,274 | (b) |
WaMu Mortgage Pass-Through Certificates, 2006-AR16 2A2 | | 5.559 | % | 12/25/36 | | 800,000 | | 662,213 | (b) |
WaMu Mortgage Pass-Through Certificates, 2007-HY3 1A1 | | 5.385 | % | 3/25/37 | | 1,885,440 | | 1,400,096 | (b) |
WaMu Mortgage Pass-Through Certificates, 2007-HY6 1A1 | | 5.414 | % | 6/25/37 | | 5,100,178 | | 3,839,766 | (b)(c) |
WaMu Mortgage Pass-Through Certificates, 2007-HY7 1A1 | | 3.483 | % | 7/25/37 | | 305,532 | | 221,633 | (b) |
WaMu Mortgage Pass-Through Certificates, 2007-HY7 3A1 | | 5.680 | % | 7/25/37 | | 672,817 | | 536,758 | (b) |
WaMu Mortgage Pass-Through Certificates, 2007-OA2 1A | | 1.028 | % | 3/25/47 | | 422,770 | | 262,888 | (b) |
WaMu Mortgage Pass-Through Certificates, 2007-OA2 2A | | 2.913 | % | 3/25/47 | | 419,003 | | 254,145 | (b) |
WaMu Mortgage Pass-Through Certificates, 2005-AR18 1A3A | | 4.221 | % | 1/25/36 | | 440,000 | | 375,323 | (b) |
Wells Fargo Mortgage Backed Securities Trust, 2006-AR8 3A2 | | 3.287 | % | 4/25/36 | | 100,000 | | 79,360 | (b) |
Wells Fargo Mortgage Backed Securities Trust, 2007-8 1A14 | | 38.216 | % | 7/25/37 | | 513,831 | | 792,404 | (b) |
| | | | | | | | | | | |
See Notes to Financial Statements.
16 | | Western Asset Mortgage Defined Opportunity Fund Inc. 2010 Annual Report |
Schedule of investments (cont’d)
December 31, 2010
Western Asset Mortgage Defined Opportunity Fund Inc.
Security | | Rate | | Maturity
Date | | Face
Amount | | Value | |
Wells Fargo Mortgage Backed Securities Trust, 2007-8 2A6 | | 6.000 | % | 7/25/37 | | $ | 350,000 | | $ | 303,389 | |
Total Residential Mortgage-Backed Securities (Cost — $159,098,621) | | | | 170,055,523 | |
Asset-Backed Securities — 4.5% | | | | | | | | | |
Access Group Inc., 2001 1A2 | | 0.458 | % | 5/25/29 | | 2,041,036 | | 1,891,281 | (b)(c) |
Associates Manufactured Housing Pass-Through Certificates, 1997-1 B1 | | 7.600 | % | 6/15/28 | | 502,000 | | 527,806 | (b)(e) |
Credit-Based Asset Servicing & Securitization, 2005-CB4 M1 | | 0.681 | % | 8/25/35 | | 2,000,000 | | 1,491,253 | (b)(c) |
MASTR Asset-Backed Securities Trust, 2005-AB1 A5A | | 5.712 | % | 11/25/35 | | 3,360,000 | | 1,569,979 | |
Mid-State Trust, 2005-1 M2 | | 7.079 | % | 1/15/40 | | 1,728,336 | | 1,545,279 | |
Option One Mortgage Loan Trust, 2001-4 A | | 0.861 | % | 1/25/32 | | 20,421 | | 18,382 | (b) |
Origen Manufactured Housing, 2006-A A2 | | 1.756 | % | 10/15/37 | | 2,100,000 | | 1,344,000 | (b) |
Origen Manufactured Housing, 2007-A A2 | | 3.756 | % | 4/15/37 | | 3,100,000 | | 1,922,000 | (b)(d) |
Structured Asset Securities Corp., 2006-GEL3 A2 | | 0.491 | % | 7/25/36 | | 2,420,000 | | 1,773,510 | (a)(b)(c) |
Total Asset-Backed Securities (Cost — $12,044,442) | | | | | | | | 12,083,490 | |
PPIP Limited Partnership — 30.3% | | | | | | | | | |
RLJ Western Asset Public/Private Master Fund, LP (Cost — $76,033,483) | | N/A | | N/A | | N/A | | 82,487,040 | (d)(e)(f) |
Total Investments before Short-Term Investments (Cost — $253,062,480) | | | | 270,611,031 | |
Short-Term Investments — 0.5% | | | | | | | | | |
Repurchase Agreements — 0.5% | | | | | | | | | |
Barclays Capital Inc. repurchase agreement dated 12/31/10; Proceeds at maturity — $1,400,014; (Fully collateralized by U.S. government obligations, 4.500% due 5/15/38; Market value — $1,428,000) | | 0.120 | % | 1/3/11 | | $ | 1,400,000 | | 1,400,000 | |
State Street Bank & Trust Co. repurchase agreement dated 12/31/10; Proceeds at maturity — $36,000 (Fully collateralized by U.S. Treasury Notes, 2.500% due 4/30/15; Market Value — $41,500) | | 0.010 | % | 1/3/11 | | 36,000 | | 36,000 | |
Total Short-Term Investments (Cost — $1,436,000) | | | | | | | | 1,436,000 | |
Total Investments — 100.0% (Cost — $254,498,480 #) | | | | | | | | $ | 272,047,031 | |
(a) Security is exempt from registration under Rule 144A of the Securities Act of 1933. This security may be resold in transactions that are exempt from registration, normally to qualified institutional buyers. This security has been deemed liquid pursuant to guidelines approved by the Board of Trustees, unless otherwise noted.
(b) Variable rate security. Interest rate disclosed is as of the most recent information available.
(c) All or a portion of this security is held by the counterparty as collateral for open reverse repurchase agreements.
(d) Security is valued in good faith at fair value in accordance with procedures approved by the Board of Directors (See Note 1).
(e) Illiquid security (unaudited).
See Notes to Financial Statements.
Western Asset Mortgage Defined Opportunity Fund Inc. 2010 Annual Report | | 17 |
Western Asset Mortgage Defined Opportunity Fund Inc.
(f) Investment through RLJ Western Asset Public/Private Collector Fund, LP
# Aggregate cost for federal income tax purposes is $248,853,705.
Abbreviation used in this schedule:
ARM — Adjustable Rate Mortgage
See Notes to Financial Statements.
18 | | Western Asset Mortgage Defined Opportunity Fund Inc. 2010 Annual Report |
Statement of assets and liabilities
December 31, 2010
Assets: | | | |
Investments, at value (Cost — $178,464,997) | | $189,559,991 | |
PPIP Limited Partnership, at value (Cost — $76,033,483) (Note 1) | | 82,487,040 | |
Cash | | 3,903 | |
Interest receivable | | 816,370 | |
Prepaid expenses | | 13,560 | |
Total Assets | | 272,880,864 | |
| | | |
Liabilities: | | | |
Payable for open reverse repurchase agreement (Note 3) | | 44,182,643 | |
Investment management fee payable | | 288,221 | |
Interest payable (Note 3) | | 89,234 | |
Allocation subadvisor fee payable | | 14,411 | |
Directors’ fees payable | | 5,007 | |
Accrued expenses | | 467,156 | |
Total Liabilities | | 45,046,672 | |
Total Net Assets | | $227,834,192 | |
| | | |
Net Assets: | | | |
Par value ($0.001 par value, 10,364,227 shares issued and outstanding; 100,000,000 shares authorized) | | $ 10,364 | |
Paid-in capital in excess of par value | | 197,286,218 | |
Undistributed net investment income | | 6,363,212 | |
Accumulated net realized gain on investments | | 6,625,847 | |
Net unrealized appreciation on investments | | 17,548,551 | |
Total Net Assets | | $227,834,192 | |
| | | |
Shares Outstanding | | 10,364,227 | |
| | | |
Net Asset Value | | $21.98 | |
See Notes to Financial Statements.
Western Asset Mortgage Defined Opportunity Fund Inc. 2010 Annual Report | | 19 |
Statement of operations
For the Period Ended December 31, 2010†
Investment Income: | | | |
Interest | | $10,151,658 | |
Income from PPIP Limited Partnership (Note 1) | | 11,774,355 | |
Total Investment Income | | 21,926,013 | |
| | | |
Expenses: | | | |
Investment management fee (Note 2) | | 2,500,518 | |
Interest expense (Note 3) | | 347,139 | |
Excise tax (Note 1) | | 260,000 | |
Audit and tax | | 141,744 | |
Allocation subadvisor fee (Note 2) | | 125,025 | |
Legal fees | | 75,000 | |
Shareholder reports | | 70,990 | |
Directors’ fees | | 43,284 | |
Transfer agent fees | | 37,856 | |
Stock exchange listing fees | | 7,986 | |
Custody fees | | 2,456 | |
Insurance | | 2,309 | |
Miscellaneous expenses | | 14,745 | |
Total Expenses | | 3,629,052 | |
Net Investment Income | | 18,296,961 | |
| | | |
Realized and Unrealized Gain on Investments (Notes 1 and 3): | | | |
Net Realized Gain From Investment Transactions | | 6,033,132 | |
| | | |
Change in Net Unrealized Appreciation (Depreciation) From: | | | |
Investment Transactions | | 11,094,994 | |
Investment in PPIP Limited Partnership | | 6,453,557 | |
Changes in Net Unrealized Appreciation (Depreciation) From Investments | | 17,548,551 | |
Net Gain on Investments | | 23,581,683 | |
Increase in Net Assets from Operations | | $41,878,644 | |
† For the period February 24, 2010 (commencement of operations) to December 31, 2010.
See Notes to Financial Statements.
20 | | Western Asset Mortgage Defined Opportunity Fund Inc. 2010 Annual Report |
Statement of changes in net assets
For the Period Ended December 31, | | 2010† | |
| | | |
Operations: | | | |
Net investment income | | $ 18,296,961 | |
Net realized gain | | 6,033,132 | |
Change in net unrealized appreciation (depreciation) | | 17,548,551 | |
Increase in Net Assets From Operations | | 41,878,644 | |
| | | |
Distributions to Shareholders From (Note 1): | | | |
Net investment income | | (11,601,034 | ) |
Decrease in Net Assets From Distributions to Shareholders | | (11,601,034 | ) |
| | | |
Fund Share Transactions: | | | |
Net proceeds from sale of shares (10,350,543 shares issued) | | 197,281,551 | |
Reinvestment of distributions (13,684 shares issued) | | 275,031 | |
Increase in Net Assets From Fund Share Transactions | | 197,556,582 | |
Increase in Net Assets | | 227,834,192 | |
| | | |
Net Assets: | | | |
Beginning of period | | — | |
End of period* | | $227,834,192 | |
* Includes undistributed net investment income of: | | $6,363,212 | |
† For the period February 24, 2010 (commencement of operations) to December 31, 2010.
See Notes to Financial Statements.
Western Asset Mortgage Defined Opportunity Fund Inc. 2010 Annual Report | | 21 |
Statement of cash flows
For the period ended December 31, 2010†
Cash Flows Provided (Used) by Operating Activities: | | | |
Interest received | | $ 7,837,217 | |
Distributions received from PPIP Limited Partnership | | 4,173,185 | |
Operating expenses paid | | (2,520,678 | ) |
Interest paid | | (257,905 | ) |
Net purchases of short-term investments | | (1,436,000 | ) |
Purchases of long-term investments | | (212,390,518 | ) |
Contributions to PPIP Limited Partnership | | (68,432,312 | ) |
Proceeds from disposition of long-term investments | | 42,892,723 | |
Net Cash Used By Operating Activities | | (230,134,288 | ) |
| | | |
Cash Flows Provided (Used) by Financing Activities: | | | |
Cash distributions paid on Common Stock | | (11,326,003 | ) |
Proceeds from sale of shares | | 197,281,551 | |
Proceeds from reverse repurchase agreements | | 44,182,643 | |
Net Cash Provided By Financing Activities | | 230,138,191 | |
Net Increase in Cash | | 3,903 | |
Cash, Beginning of year | | 0 | |
Cash, End of year | | $ 3,903 | |
| | | |
Reconciliation of Increase in Net Assets from Operations to Net Cash Flows Provided (Used) by Operating Activities: | | | |
Increase in Net Assets From Operations | | $ 41,878,644 | |
Accretion of discount on investments | | (3,327,348 | ) |
Amortization of premium on investments | | 748,421 | |
Increase in investments, at value | | (186,981,064 | ) |
Increase in PPIP Limited Partnership | | (82,487,040 | ) |
Increase in interest receivable | | (816,370 | ) |
Increase in prepaid expenses | | (13,560 | ) |
Increase in interest payable | | 89,234 | |
Increase in accrued expenses | | 774,795 | |
Total Adjustments | | (272,012,932 | ) |
Net Cash Flows Used by Operating Activities | | $(230,134,288 | ) |
| | | |
Non-Cash Financing Activities: | | | |
Proceeds from reinvestment of dividends | | $ 275,031 | |
† For the period February 24, 2010 (commencement of operations) to December 31, 2010.
See Notes to Financial Statements.
22 | | Western Asset Mortgage Defined Opportunity Fund Inc. 2010 Annual Report |
Financial highlights
For a share of capital stock outstanding throughout the period ended December 31, unless otherwise noted:
| | 20101 | |
| | | |
Net asset value, beginning of period | | $19.06 | 2 |
| | | |
Income from operations: | | | |
Net investment income | | 1.77 | |
Net realized and unrealized gain | | 2.27 | |
Total income from operations | | 4.04 | |
| | | |
Less distributions from: | | | |
Net investment income | | (1.12 | ) |
Total distributions | | (1.12 | ) |
| | | |
Net asset value, end of period | | $21.98 | |
| | | |
Market price, end of period | | $21.60 | |
Total return, based on NAV3,4 | | 21.81 | % |
Total return, based on Market Price4 | | 14.08 | % |
| | | |
Net assets, end of period (000s) | | $227,834 | |
| | | |
Ratios to average net assets: | | | |
Gross expenses5,6 | | 2.04 | % |
Gross expenses, excluding interest expense5,6 | | 1.84 | |
Net expenses5,6 | | 2.04 | |
Net expenses, excluding interest expense5,6 | | 1.84 | |
Net investment income5,6 | | 10.27 | |
| | | |
Portfolio turnover rate | | 18 | % |
1 For the period February 24, 2010 (commencement of operations) to December 31, 2010.
2 Initial public offering price of $20.00 per share less offering costs and sales load totaling $0.94 per share.
3 Performance figures may reflect compensating balance arrangements, fee waivers and/or expense reimbursements. In the absence of compensating balance arrangements, fee waivers and/or expense reimbursements, the total return would have been lower. Past performance is no guarantee of future results. Total returns for periods of less than one year are not annualized.
4 The total return calculation assumes that distributions are reinvested in accordance with the Fund’s dividend reinvestment plan. Past performance is no guarantee of future results. Total returns for periods of less than one year are not annualized.
5 Annualized.
6 Does not include expenses of PPIP Limited Partnership in which the Fund invests (Note 4).
See Notes to Financial Statements.
Western Asset Mortgage Defined Opportunity Fund Inc. 2010 Annual Report | | 23 |
Notes to financial statements
1. Organization and significant accounting policies
Western Asset Mortgage Defined Opportunity Fund Inc. (the “Fund”) was incorporated in Maryland on December 11, 2009, and is registered as a non-diversified, limited term, closed-end management investment company under the Investment Company Act of 1940, as amended (the “1940 Act”). The Fund’s primary investment objective is to provide current income by investing primarily in a diverse portfolio of mortgage-backed securities (“MBS”), consisting primarily of non-agency residential mortgage-backed securities (“RMBS”) and commercial mortgage-backed securities (“CMBS”). The Fund intends to liquidate and distribute substantially all of the Fund’s net assets to shareholders on or about March 1, 2022. The Fund invests at least 80% of its Managed Assets (total assets of the Fund plus any implicit leverage at the Master Fund (defined below) level attri butable to the Fund’s investment in the Feeder Fund (defined below)) in MBS directly, and indirectly by investing in the RLJ Western Asset Public/Private Collector Fund, LP (the “Feeder Fund”) which invests substantially all of its assets available for investment, alongside the U.S. Department of the Treasury (the “Treasury”), in the RLJ Western Asset Public/Private Master Fund, LP (the “Master Fund”) that has been organized to invest directly in MBS and other assets eligible for purchase under the Legacy Securities Public-Private Investment Program (“PPIP”). As a secondary investment objective, the Fund will seek capital appreciation.
The following are significant accounting policies consistently followed by the Fund and are in conformity with U.S. generally accepted accounting principles (“GAAP”). Estimates and assumptions are required to be made regarding assets, liabilities and changes in net assets resulting from operations when financial statements are prepared. Changes in the economic environment, financial markets and any other parameters used in determining these estimates could cause actual results to differ. Subsequent events have been evaluated through the date the financial statements were issued.
(a) Investment valuation. Debt securities are valued at the mean between the last quoted bid and asked prices provided by an independent pricing service, which are based on transactions in debt obligations, quotations from bond dealers, market transactions in comparable securities and various other relationships between securities. Equity securities for which market quotations are available are valued at the last reported sales price or official closing price on the primary market or exchange on which they trade. When reliable prices are not readily available, such as when the value of a security has been significantly affected by events after the close of the exchange or market on which the security is principally traded, but before the Fund calculates its net asset value, the Fund values these securities as determined in accordance w ith procedures approved by the Fund’s Board of Directors. Short-term obligations with maturities of 60 days or less are valued at amortized cost, which approximates fair value.
24 | | Western Asset Mortgage Defined Opportunity Fund Inc. 2010 Annual Report |
Notes to financial statements (cont’d)
The Fund’s investment in the Feeder Fund is valued by determining the Fund’s pro rata ownership interest in the net assets of the Master Fund. On a daily basis, the Fund receives the net asset value of the Master Fund, which is used along with other inputs to derive a value for the Fund’s investment in the Feeder Fund.
The Fund has adopted Financial Accounting Standards Board Codification Topic 820 (“ASC Topic 820”). ASC Topic 820 establishes a single definition of fair value, creates a three-tier hierarchy as a framework for measuring fair value based on inputs used to value the Fund’s investments, and requires additional disclosure about fair value. The hierarchy of inputs is summarized below.
· Level 1 — quoted prices in active markets for identical investments
· Level 2 — other significant observable inputs (including quoted prices for similar investments, interest rates, prepayment speeds, credit risk, etc.)
· Level 3 — significant unobservable inputs (including the Fund’s own assumptions in determining the fair value of investments)
The inputs or methodology used for valuing securities are not necessarily an indication of the risk associated with investing in those securities.
The Fund uses valuation techniques to measure fair value that are consistent with the market approach and/or income approach, depending on the type of security and the particular circumstance. The market approach uses prices and other relevant information generated by market transactions involving identical or comparable securities. The income approach uses valuation techniques to discount estimated future cash flows to present value.
The following is a summary of the inputs used in valuing the Fund’s assets carried at fair value:
ASSETS |
| | | | | | | | | |
Description | | Quoted Prices
(Level 1) | | Other Significant
Observable Inputs
(Level 2) | | Significant
Unobservable
Inputs
(Level 3) | | Total | |
Long-term investments†: | | | | | | | | | | | |
Commercial mortgage-backed securities | | — | | $ 5,984,978 | | | — | | | $ 5,984,978 | |
Residential mortgage-backed securities | | — | | 167,675,523 | | | $ 2,380,000 | | | 170,055,523 | |
Asset-backed securities | | — | | 10,161,490 | | | 1,922,000 | | | 12,083,490 | |
PPIP limited partnership | | — | | — | | | 82,487,040 | | | 82,487,040 | |
Total long-term investments | | — | | $183,821,991 | | | $86,789,040 | | | $270,611,031 | |
Short-term investments† | | — | | 1,436,000 | | | — | | | 1,436,000 | |
Total investments | | — | | $185,257,991 | | | $86,789,040 | | | $272,047,031 | |
† See Schedule of Investments for additional detailed categorizations.
Western Asset Mortgage Defined Opportunity Fund Inc. 2010 Annual Report | | 25 |
The following is a reconciliation of investments in which significant unobservable inputs (Level 3) were used in determining fair value:
Investments In Securities | | Residential
Mortgage-
Backed
Securities | | Asset-
Backed
Securities | | PPIP Limited
Partnership | | Total | |
Balance as of February 24, 2010 | | — | | — | | — | | — | |
Accrued premiums/discounts | | $ 11,596 | | $ 123 | | — | | $ 11,719 | |
Realized gain(loss) | | — | | — | | — | | — | |
Change in unrealized appreciation (depreciation)1 | | (11,596 | ) | (123 | ) | $ 6,453,557 | | 6,441,838 | |
Net purchases (sales) | | 2,380,000 | | 1,922,000 | | 68,432,312 | | 72,734,312 | |
Undistributed earnings | | — | | — | | 7,601,171 | | 7,601,171 | |
Transfers into Level 3 | | — | | — | | — | | — | |
Transfers out of Level 3 | | — | | — | | — | | — | |
Balance as of December 31, 2010 | | $2,380,000 | | $1,922,000 | | $82,487,040 | | $86,789,040 | |
Net change in unrealized appreciation (depreciation) for investments in securities still held at December 31, 20101 | | $ (11,596 | ) | $ (123 | ) | $ 6,453,557 | | $ 6,441,838 | |
1 This amount is included in the change in net unrealized appreciation (depreciation) in the accompanying Statement of Operations. Change in unrealized appreciation (depreciation) includes net unrealized appreciation (depreciation) resulting from changes in investment values during the reporting period and the reversal of previously recorded unrealized appreciation (depreciation) when gains or losses are realized.
(b) Repurchase agreements. The Fund may enter into repurchase agreements with institutions that its investment adviser has determined are creditworthy. Each repurchase agreement is recorded at cost. Under the terms of a typical repurchase agreement, the Fund acquires a debt security subject to an obligation of the seller to repurchase, and of the Fund to resell, the security at an agreed-upon price and time, thereby determining the yield during the Fund’s holding period. When entering into repurchase agreements, it is the Fund’s policy that its custodian or a third party custodian, acting on the Fund’s behalf, take possession of the underlying collateral securities, the market value of which, at all times, at least equals the principal amount of the repurchase transaction, including accrued interest. To the extent that a ny repurchase transaction maturity exceeds one business day, the value of the collateral is marked-to-market and measured against the value of the agreement in an effort to ensure the adequacy of the collateral. If the counterparty defaults, the Fund generally has the right to use the collateral to satisfy the terms of the repurchase transaction. However, if the market value of the collateral declines during the period in which the Fund seeks to assert its rights or if bankruptcy proceedings are commenced with respect to the seller of the security, realization of the collateral by the Fund may be delayed or limited.
(c) Reverse repurchase agreements. The Fund may enter into reverse repurchase agreements. Under the terms of a typical reverse repurchase agreement, a Fund sells a security subject to an obligation to repurchase the security from the buyer at an agreed-upon time and price. In the event the buyer of securities under a reverse repurchase agreement files for bankruptcy or
26 | | Western Asset Mortgage Defined Opportunity Fund Inc. 2010 Annual Report |
Notes to financial statements (cont’d)
becomes insolvent, the Fund’s use of the proceeds of the agreement may be restricted pending a determination by the counterparty, or its trustee or receiver, whether to enforce the Fund’s obligation to repurchase the securities. In entering into reverse repurchase agreements, the Fund will maintain cash, U.S. government securities or other liquid debt obligations at least equal in value to its obligations with respect to reverse repurchase agreements or will take other actions permitted by law to cover its obligations.
(d) PPIP investment. On March 23, 2009, the Treasury, in conjunction with the Federal Deposit Insurance Corporation and the Board of Governors of the United States Federal Reserve (the “Federal Reserve”), announced the creation of PPIP. PPIP calls for the creation of public private investment funds (“PPIP Limited Partnerships”), such as the Master Fund, through which privately raised capital and Treasury capital are pooled together to facilitate the purchase of PPIP Eligible Assets. PPIP Eligible Assets are those assets determined by the Treasury, from time to time, to be eligible for investment by the Master Fund. Eligible Assets currently include RMBS and CMBS issued prior to 2009 that were originally rated AAA or that received an equivalent rating by two or more nationally recognized statistical rating organ izations without ratings enhancement and that are secured directly by actual mortgage loans, leases or other assets and not other securities (other than certain swap positions, as determined by the Treasury).
The Feeder Fund and Master Fund are Delaware limited partnerships formed to provide certain qualified institutional investors with access to PPIP. The Feeder Fund will participate in PPIP by investing all or substantially all of its assets available for investment, alongside the Treasury, in the Master Fund. The Feeder Fund’s investment objective is to generate attractive returns for investors through long term opportunistic investments in PPIP Eligible Assets. The Master Fund has an investment objective that is consistent with that of the Feeder Fund. The Fund’s interests in the Feeder Fund will be substantially identical to those of the other investors in the Feeder Fund in all material respects except with respect to fees payable in connection with PPIP. Investors in the Fund pay a management fee on the Fund’s Managed Assets, which includes total assets attributable to the Fund’s direct i nvestments and its indirect investment in the leveraged Master Fund. The Feeder Fund invests all of its assets in the Master Fund. The Master Fund invests directly in a portfolio of PPIP Eligible Assets and borrows from the Treasury through a senior secured term loan facility. Neither the Feeder Fund nor the Master Fund is registered with the Securities and Exchange Commission as an investment company under the 1940 Act, and neither the Feeder Fund nor the Master Fund’s interests are registered under the Securities Act of 1933, as amended.
Pursuant to the terms of the partnership agreement governing the Feeder Fund, the Fund generally may not withdraw from the Feeder Fund, and the Fund may not, directly or indirectly, sell, assign, pledge, exchange or otherwise transfer its interest in the Feeder Fund, in whole or in part, without the
Western Asset Mortgage Defined Opportunity Fund Inc. 2010 Annual Report | | 27 |
prior written consent of the General Partner. As a result, the Fund’s investment in the Feeder Fund is illiquid.
The Master Fund is expected to terminate on or around November 5, 2017 (unless terminated earlier pursuant to certain conditions), subject to extension at the discretion of the General Partner with the written consent of the Treasury for consecutive periods of up to one year each and up to a maximum of two years. Upon its termination, it is anticipated that the Master Fund (and in turn the Feeder Fund) will distribute substantially all of its net assets to its partners on a pro-rata basis.
On March 12, 2010 the Fund made a subscription for an investment into the Feeder Fund of $68,000,000, $51,000,000 of which was immediately drawn and invested into the Feeder Fund. The Fund made additional investments into the Feeder Fund of $6,800,000, $5,440,000 and $4,760,000 on April 27, 2010, May 20, 2010 and July 6, 2010, respectively. As of December 31, 2010, the Fund has a 12.52% ownership interest in the Feeder Fund and indirectly, 5.48% in the Master Fund through its investment in the Feeder Fund. Additionally, as of December 31, 2010, the Fund had no undrawn capital commitment to the Feeder Fund.
The Fund, as a new investor in the Feeder Fund, was required to pay interest on a portion of its investment into the Feeder Fund at an annual rate equal to the prime rate plus 2%. This interest equivalent or “equalization” payment, which totaled $432,312, compensated prior investors for the use of their contributed capital between initial and subsequent closings and to therefore ensure the equitable treatment of all investors.
(e) Leverage. The Fund may seek to enhance the level of its current distributions to holders of common stock through the use of leverage. The Fund may use leverage directly at the Fund level through borrowings, including loans from certain financial institutions or through a qualified government sponsored program, the use of reverse repurchase agreements and/or the issuance of debt securities (collectively, “Borrowings”), and possibly through the issuance of preferred stock (“Preferred Stock”), in an aggregate amount of up to approximately 33 1/3% of the Fund’s Total Assets immediately after such Borrowings and/or issuances of Preferred Stock. “Total Assets” means net assets of the Fund plus the amount of any Borrowings and assets attributable to Preferred Stock that may be outstanding. Currently, the Fund has no intention to issue notes or debt securities or Preferred Stock. In addition, the Fund may enter into additional reverse repurchase agreements and/or use similar investment management techniques that may provide leverage, but which are not subject to the foregoing 33 1/3% limitation so long as the Fund has covered its commitment with respect to such techniques by segregating liquid assets, entering into offsetting transactions or owning positions covering related obligations.
The Master Fund is expected to borrow money from the Treasury for investment purposes in an amount equal to approximately 50% of the Master
28 | | Western Asset Mortgage Defined Opportunity Fund Inc. 2010 Annual Report |
Notes to financial statements (cont’d)
Fund’s total assets immediately after giving effect to the borrowing (the “Treasury Debt Financing”). The Master Fund will bear the interest expense and other financing costs arising out of its use of the Treasury Debt Financing. To the extent the Fund invests in the Master Fund, through its investment in the Feeder Fund, the Fund will be subject to the implicit risks (and potential benefits) of such leverage. The Fund will also bear its allocable share of the Master Fund’s cost of leverage. While such implicit leverage will not constitute actual borrowing of the Fund for purposes of the 1940 Act, in an effort to mitigate the overall risk of leverage, the Fund does not intend to incur additional direct leverage at the Fund level to the extent that its existing direct leverage at the Fund level and its implicit leverage through its investment in the Master Fund exceeds 33 1/3% of the Fund� 6;s Managed Assets immediately after Borrowings and/or issuances Preferred Stock at the Fund level. “Managed Assets” means the Total Assets of the Fund plus any implicit leverage at the Master Fund level attributable to the Fund’s investment in the Feeder Fund.
(f) Cash flow information. The Fund invests in securities and distributes dividends from net investment income and net realized gains, which are paid in cash and may be reinvested at the discretion of shareholders. These activities are reported in the Statement of Changes in Net Assets and additional information on cash receipts and cash payments are presented in the Statement of Cash Flows.
(g) Credit and market risk. Investments in securities that are collateralized by residential real estate mortgages are subject to certain credit and liquidity risks. When market conditions result in an increase in default rates of the underlying mortgages and the foreclosure values of underlying real estate properties are materially below the outstanding amount of these underlying mortgages, collection of the full amount of accrued interest and principal on these investments may be doubtful. Such market conditions may significantly impair the value and liquidity of these investments and may result in a lack of correlation between their credit ratings and values.
(h) Mortgage-backed securities. Mortgage-Backed Securities (“MBS”) include CMBS and RMBS. These securities depend on payments (except for rights or other assets designed to assure the servicing or timely distribution of proceeds to holders of such securities) primarily from the cash flow from secured commercial or residential mortgage loans made to borrowers. Such loans are secured (on a first priority basis or second priority basis, subject to permitted liens, easements and other encumbrances) by commercial or residential real estate, the proceeds of which are used to purchase and or to construct commercial or residential real estate. The value of some mortgage-backed securities may be particularly sensitive to changes in prevailing interest rates. Early repayment of principal on some mortgage-related securities may expose t he Master Fund to a lower rate of return upon reinvestment of principal. The value of these securities may fluctuate in response to the market’s perception of the creditworthiness of the issuers. Additionally, although
Western Asset Mortgage Defined Opportunity Fund Inc. 2010 Annual Report | | 29 |
certain mortgage-related securities are supported by some form of government or private guarantee and/or insurance, there is no assurance that private guarantors or insurers will meet their obligations.
(i) Security transactions and investment income. Security transactions are accounted for on a trade date basis. Interest income, adjusted for amortization of premium and accretion of discount, is recorded on the accrual basis. Dividend income is recorded on the ex-dividend date. The cost of investments sold is determined by use of the specific identification method. To the extent any issuer defaults or a credit event occurs that impacts the issuer, the Fund may halt any additional interest income accruals and consider the realizability of interest accrued up to the date of default or credit event.
PPIP makes distributions from net investment income to the Fund, if any, on a monthly basis. In the event that PPIP’s net investment income for the month exceeds its distribution, the difference will be recorded on the Fund’s books as income and offset by a increase to the cost of the PPIP investment. For the period February 24, 2010 to December 31, 2010 the Fund has recorded $11,774,355 in net investment income from PPIP.
(j) Distributions to shareholders. Distributions from net investment income for the Fund, if any, are declared and paid on a monthly basis. Distributions of net realized gains, if any, are declared at least annually. Distributions are recorded on the ex-dividend date and are determined in accordance with income tax regulations, which may differ from GAAP.
(k) Compensating balance arrangements. The Fund has an arrangement with its custodian bank whereby a portion of the custodian’s fees is paid indirectly by credits earned on the Fund’s cash on deposit with the bank. This amount is shown as a reduction of expenses on the Statement of Operations.
(l) Federal and other taxes. It is the Fund’s policy to comply with the federal income tax requirements of the Internal Revenue Code of 1986 (the “Code”), as amended, applicable to regulated investment companies. Accordingly, the Fund intends to distribute its taxable income and realized gains, if any, to shareholders in accordance with the requirements imposed by the Code. Therefore, no federal or state income tax provision is required in the Fund’s financial statements.
However, due to the timing of when distributions are made by the Fund, the Fund may be subject to an excise tax of 4% of the amount by which 98% of the Fund’s annual taxable income and net realized gains exceed the distributions from such taxable income and realized gains for the calendar year. The Fund expects to pay a federal excise tax of approximately $260,000 attributable to calendar year 2010. Under the recently enacted Regulated Investment Company Modernization Act of 2010, the minimum distribution requirement for capital gains that must be met in order to avoid the imposition of excise
30 | | Western Asset Mortgage Defined Opportunity Fund Inc. 2010 Annual Report |
Notes to financial statements (cont’d)
tax has been raised from 98% to 98.2% for calendar years beginning after December 22, 2010.
(m) Reclassification. GAAP requires that certain components of net assets be reclassified to reflect permanent differences between financial and tax reporting. These reclassifications have no effect on net assets or net asset values per share. During the current year, the following reclassifications have been made:
| | Undistributed Net
Investment Income | | Accumulated Net
Realized Gain | | Paid-in Capital | |
(a) | | $260,000 | | — | | $(260,000) | |
(b) | | (592,715) | | $592,715 | | — | |
(a) Reclassifications are primarily due to a non-deductible excise tax accrued by the Fund.
(b) Reclassifications are primarily due to differences between the book and tax recognition of market discount and premiums on mortgage backed securities and the book vs taxable income recognized from the PPIP limited partnership investment.
2. Investment management agreement and other transactions with affiliates
Legg Mason Partners Fund Advisor, LLC (“LMPFA”) is the Fund’s investment manager. Western Asset Management Company (“Western Asset”) and Western Asset Management Company Limited (“Western Asset Limited”) are the Fund’s subadvisers. LMPFA, Western Asset and Western Asset Limited are wholly-owned subsidiaries of Legg Mason, Inc. (“Legg Mason”). Western Asset is also the investment advisor to the Feeder Fund and the Master Fund.
Under the investment management agreement, the Fund pays an investment management fee, calculated daily and paid monthly, at an annual rate of 1.00% of the Fund’s average daily Managed Assets.
The Fund paid all of its offering expenses up to and including $0.04 per share of Common Stock. The Fund’s management fees and other expenses are borne by the Common Stockholders. LMPFA has agreed to pay (i) all of the Fund’s organizational expenses, and (ii) the Fund’s offering expenses (other than sales load, but inclusive of the partial expense reimbursement) to the extent offering expenses are in excess of $0.04 per share.
LMPFA provides administrative and certain oversight services to the Fund. LMPFA delegates to the subadviser the day-to-day portfolio management of the Fund. For its services, LMPFA pays Western Asset 70% of the net management fee it receives from the Fund. In turn, Western Asset pays Western Asset Limited a subadvisory fee of 0.70% of the Fund’s daily Managed Assets that the subadviser allocates to Western Asset Limited to manage.
Wilshire Associates Incorporated (the “Allocation Subadviser”), a registered investment adviser unaffiliated with Legg Mason, LMPFA, Western Asset or Western Asset Limited, determines whether and to what extent the Fund will invest in the Feeder Fund, subject to the supervision of the Fund’s Board of Directors and LMPFA. Assets not allocated by the Allocation Subadviser to the Feeder Fund will be managed directly by Western Asset.
Western Asset Mortgage Defined Opportunity Fund Inc. 2010 Annual Report | | 31 |
The Allocation Subadviser will receive an annual fee, payable monthly, from the Fund in an amount equal to 0.05% of the Fund’s average daily Managed Assets, subject to a minimum compensation guarantee between the Allocation Subadviser and LMPFA.
All officers and one Director of the Fund are employees of Legg Mason or its affiliates and do not receive compensation from the Fund.
3. Investments
For the period February 24, 2010 to December 31, 2010, the aggregate cost of purchases and proceeds from sales of investments (excluding short-term investments) and U.S Government & Agency Obligations were as follows:
| | PPIP Limited Partnership | | Investments | |
Purchases | | $68,432,312 | | | $212,390,518 | |
Sales | | — | | | 42,892,723 | |
At December 31, 2010, the aggregate gross unrealized appreciation and depreciation of investments for federal income tax purposes were as follows:
Gross unrealized appreciation | | $23,933,582 | |
Gross unrealized depreciation | | (740,256 | ) |
Net unrealized appreciation | | $23,193,326 | |
Transactions in reverse repurchase agreements for the Fund during the period ended December 31, 2010 were as follows:
Average Daily
Balance* | | Weighted Average
Interest Rate* | | Maximum Amount
Outstanding | |
$37,893,441 | | 1.42% | | $44,182,643 | |
* Average based on the number of days the Fund had reverse repurchase agreements outstanding.
Interest rates on reverse repurchase agreements ranged from 1.000% to 1.779% for the period May 13, 2010 to December 31, 2010. Interest expense incurred on reverse repurchase agreements totaled $347,139.
At December 31, 2010, the Fund had the following open reverse repurchase agreements:
Security | | Value | |
Reverse Repurchase Agreement with Barclays, dated 10/5/10 bearing 1.563% to be repurchased at $1,413,489 on 3/31/11, collateralized by: $2,973,066 Banc of America Funding Corp., 5.644% due 5/20/36; Market value (including accrued interest) $1,992,268 | | $ | 1,402,713 | |
Reverse Repurchase Agreement with Barclays, dated 10/5/10 bearing 1.563% to be repurchased at $1,269,980 on 3/31/11, collateralized by: $2,985,393 Bayview Financial Acquisition Trust, 0.611% due 5/28/37; Market value (including accrued interest) $1,732,748 | | 1,260,298 | |
Reverse Repurchase Agreement with Barclays, dated 10/5/10 bearing 1.563% to be repurchased at $927,633 on 3/31/11, collateralized by: $1,554,728 Indymac Index Mortgage Loan Trust, 5.334% due 6/25/36; Market value (including accrued interest) $1,201,383 | | 920,561 | |
| | | | |
32 | | Western Asset Mortgage Defined Opportunity Fund Inc. 2010 Annual Report |
Notes to financial statements (cont’d)
Security | | Value | |
Reverse Repurchase Agreement with Barclays, dated 10/5/10 bearing 1.563% to be repurchased at $1,395,865 on 3/31/11, collateralized by: $1,883,052 Prime Mortgage Trust, 5.500% due 5/25/35; Market value (including accrued interest) $1,669,615 | | $ | 1,385,223 | |
Reverse Repurchase Agreement with Barclays, dated 10/5/10 bearing 1.563% to be repurchased at $1,033,820 on 3/31/11, collateralized by: $2,155,653 Structured ARM Loan Trust, 2.780% due 2/25/35; Market value (including accrued interest) $1,574,881 | | 1,025,938 | |
Reverse Repurchase Agreement with Barclays, dated 10/5/10 bearing 1.563% to be repurchased at $2,524,181 on 3/31/11, collateralized by: $4,670,043 WaMu Mortgage Pass-Through Certificates, 5.414% due 6/25/37; Market value (including accrued interest) $3,537,001 | | 2,504,937 | |
Reverse Repurchase Agreement with Barclays, dated 11/5/10 bearing 1.542% to be repurchased at $589,883 on 5/6/11, collateralized by: $915,414 Credit Suisse Mortgage Capital Certificates, 5.500% due 10/25/21; Market value (including accrued interest) $826,741 | | 585,321 | |
Reverse Repurchase Agreement with Barclays, dated 11/5/10 bearing 1.542% to be repurchased at $880,868 on 5/6/11, collateralized by: $1,130,000 Structured Asset Securities Corp., 4.790% due 3/25/35; Market value (including accrued interest) $1,117,215 | | 874,055 | |
Reverse Repurchase Agreement with Barclays, dated 11/10/10 bearing 1.542% to be repurchased at $2,016,769 on 5/6/11, collateralized by: $7,622,825 Lehman Mortgage Trust, 0.621% due 7/25/36; Market value (including accrued interest) $3,683,275 | | 2,001,595 | |
Reverse Repurchase Agreement with Barclays, dated 11/15/10 bearing 1.293% to be repurchased at $1,524,557 on 5/16/11, collateralized by: $3,490,000 Bayview Financial Acquisition Trust, 0.711% due 4/28/39; Market value (including accrued interest) $2,690,807 | | 1,514,660 | |
Reverse Repurchase Agreement with Barclays, dated 11/15/10 bearing 1.293% to be repurchased at $441,466 on 5/16/11, collateralized by: $600,000 MASTR Adjustable Rate Mortgages Trust, 2.899% due 11/21/34; Market value (including accrued interest) $564,320 | | 438,600 | |
Reverse Repurchase Agreement with Barclays, dated 11/15/10 bearing 1.293% to be repurchased at $413,484 on 5/16/11, collateralized by: $650,000 Merrill Lynch Mortgage Investors Trust 2.773% due 2/25/35; Market value (including accrued interest) $593,543 | | 410,800 | |
Reverse Repurchase Agreement with Barclays, dated 11/15/10 bearing 1.293% to be repurchased at $204,251 on 5/16/11, collateralized by: $231,914 Nomura Asset Acceptance Corp., 6.500% due 3/25/34; Market value (including accrued interest) $235,161 | | 202,925 | |
Reverse Repurchase Agreement with Barclays, dated 11/15/10 bearing 1.293% to be repurchased at $574,074 on 5/16/11, collateralized by: $1,086,376 Renaissance Home Equity Loan Trust, 1.021% due 12/25/32; Market value (including accrued interest) $813,566 | | 570,347 | |
Reverse Repurchase Agreement with Barclays, dated 11/15/10 bearing 1.293% to be repurchased at $287,037 on 5/16/11, collateralized by: $543,188 Renaissance Home Equity Loan Trust, 1.021% due 12/25/32; Market value (including accrued interest) $406,783 | | 285,174 | |
Reverse Repurchase Agreement with Barclays, dated 11/15/10 bearing 1.293% to be repurchased at $411,311 on 5/16/11, collateralized by: $554,383 Structured Asset Securities Corp., 2.581% due 12/25/33; Market value (including accrued interest) $491,993 | | 408,640 | |
Reverse Repurchase Agreement with Barclays, dated 11/15/10 bearing 1.293% to be repurchased at $328,204 on 5/16/11, collateralized by: $429,901 Structured Asset Securities Corp., 0.661% due 9/25/33; Market value (including accrued interest) $371,671 | | 326,073 | |
| | | | |
Western Asset Mortgage Defined Opportunity Fund Inc. 2010 Annual Report | | 33 |
Security | | Face Amount | |
Reverse Repurchase Agreement with Barclays, dated 11/15/10 bearing 1.543% to be repurchased at $1,231,660 on 5/16/11, collateralized by: $1,580,000 Structured Asset Securities Corp. 4.790% due 3/25/35; Market value (including accrued interest) $1,562,123 | | $ | 1,222,130 | |
Reverse Repurchase Agreement with Barclays, dated 11/22/10 bearing 1.543% to be repurchased at $1,066,771 on 5/16/11, collateralized by: $2,116,381 Accredited Mortgage Loan Trust, 4.460% due 1/25/34; Market value (including accrued interest) $1,688,019 | | 1,058,831 | |
Reverse Repurchase Agreement with Barclays, dated 11/22/10 bearing 1.543% to be repurchased at $2,312,209 on 5/16/11, collateralized by: $3,600,000 Banc of America Funding Corp., 6.000% due 9/25/36; Market value (including accrued interest) $3,129,799 | | 2,295,000 | |
Reverse Repurchase Agreement with Barclays, dated 11/22/10 bearing 1.543% to be repurchased at $1,961,736 on 5/16/11, collateralized by: $3,045,227 Credit Suisse Mortgage Capital Certificates, 5.500% due 10/25/21; Market value (including accrued interest) $2,750,248 | | 1,947,136 | |
Reverse Repurchase Agreement with Barclays, dated 11/22/10 bearing 1.543% to be repurchased at $1,087,718 on 5/16/11, collateralized by: $1,984,385 First Horizon Alternative Mortgage Securities, 2.383% due 8/25/35; Market value (including accrued interest) $1,535,763 | | 1,079,623 | |
Reverse Repurchase Agreement with Barclays, dated 11/22/10 bearing 1.543% to be repurchased $1,639,114 on 5/16/11, collateralized by: $4,732,516 Indymac Index Mortgage Loan Trust, 5.114% due 5/25/37; Market value (including accrued interest) $2,669,696 | | 1,626,915 | |
Reverse Repurchase Agreement with Barclays, dated 11/22/10 bearing 1.543% to be repurchased $1,093,885 on 5/16/11, collateralized by: $2,188,869 JPMorgan Mortgage Trust, 6.500% due 1/25/36; Market value (including accrued interest) $1,566,400 | | 1,085,744 | |
Reverse Repurchase Agreement with Barclays, dated 11/22/10 bearing 1.543% to be repurchased $2,318,821 on 5/16/11, collateralized by: $3,215,932 Structured Asset Securities Corp., 4.650% due 2/25/35; Market value (including accrued interest) $2,871,070 | | 2,301,563 | |
Reverse Repurchase Agreement with Credit Suisse, dated 11/16/10 bearing 1.100% to be repurchased $1,041,730 on 5/16/11, collateralized by: $2,000,000 Credit-Based Asset Servicing & Securitization, 0.681% due 8/25/35; Market value (including accrued interest) $1,491,518 | | 1,036,000 | |
Reverse Repurchase Agreement with Credit Suisse, dated 11/16/10 bearing 1.100% to be repurchased $1,010,812 on 5/16/11, collateralized by: $1,323,946 Chase Mortgage Finance Corp., 5.500% due 11/25/21; Market value (including accrued interest) $1,270,719 | | 1,005,252 | |
Reverse Repurchase Agreement with Credit Suisse, dated 11/16/10 bearing 1.100% to be repurchased $1,327,300 on 5/16/11, collateralized by: $2,200,000 Deutsche Mortgage Securities Inc., Mortgage Loan Trust 5.200% due 6/26/35; Market value (including accrued interest) $2,046,396 | | 1,320,000 | |
Reverse Repurchase Agreement with Credit Suisse, dated 11/16/10 bearing 1.100% to be repurchased $1,562,902 on 5/16/11, collateralized by: $3,076,333 Residential Asset Securitization Trust, 0.761% due 4/25/36; Market value (including accrued interest) $1,919,700 | | 1,554,306 | |
Reverse Repurchase Agreement with Credit Suisse, dated 11/16/10 bearing 1.100% to be repurchased $529,412 on 5/16/11, collateralized by: $900,000 JPMorgan Alternative Loan Trust, 6.000% due 8/25/36; Market value (including accrued interest) $799,233 | | 526,500 | |
Reverse Repurchase Agreement with Credit Suisse, dated 11/16/10 bearing 1.100% to be repurchased $1,406,023 on 5/16/11, collateralized by: $2,052,148 MASTR Reperforming Loan Trust, 5.521% due 5/25/36; Market value (including accrued interest) $1,914,048 | | 1,398,290 | |
| | | | |
34 | | Western Asset Mortgage Defined Opportunity Fund Inc. 2010 Annual Report |
Notes to financial statements (cont’d)
Security | | Face Amount | |
Reverse Repurchase Agreement with Credit Suisse, dated 11/16/10 bearing 1.100% to be repurchased $1,435,843 on 5/16/11, collateralized by: $3,153,731 Morgan Stanley Mortgage Loan Trust, 5.565% due 11/25/37; Market value (including accrued interest) $2,121,159 | | $ | 1,427,946 | |
Reverse Repurchase Agreement with Credit Suisse, dated 11/16/10 bearing 1.100% to be repurchased $1,674,208 on 5/16/11, collateralized by: $3,000,000 RAAC Series, 0.611% due 3/25/37; Market value (including accrued interest) $2,436,973 | | 1,665,000 | |
Reverse Repurchase Agreement with Credit Suisse, dated 11/16/10 bearing 1.100% to be repurchased $2,000,253 on 5/16/11, collateralized by: $4,543,522 Residential Accredit Loans Inc., 6.172% due 1/25/36; Market value (including accrued interest) $2,849,857 | | 1,989,251 | |
Reverse Repurchase Agreement with Credit Suisse, dated 11/16/10 bearing 1.100% to be repurchased $1,216,005 on 5/16/11, collateralized by: $1,665,572 Thornburg Mortgage Securities Trust, 6.196% due 9/25/37; Market value (including accrued interest) $1,570,424 | | 1,209,317 | |
Reverse Repurchase Agreement with Credit Suisse, dated 12/16/10 bearing 1.250% to be repurchased $1,329,874 on 6/6/11, collateralized by: $1,632,829 Access Group Inc., 0.458% due 5/25/29; Market value (including accrued interest) $1,513,793 | | 1,321,979 | |
Reverse Repurchase Agreement with Credit Suisse, dated 12/16/10 bearing 1.250% to be repurchased $999,936 on 6/6/11, collateralized by: $2,000,000 Structured Asset Securities Corp., 0.491% due 7/25/36; Market value (including accrued interest) $1,465,902 | | 994,000 | |
Total reverse repurchase agreements (Proceeds — $44,182,643) | | $44,182,643 | |
| | | | |
4. Summarized financial data — Master Fund (unaudited)
At December 31, 2010, the Fund had $82,487,040 invested indirectly in the Master Fund through its investment in the Feeder Fund. Summarized financial data for the Master Fund is presented in the following table:
Statement of assets, liabilities and partners’ capital
December 31, 2010
Assets | | | |
Investments, at value (Cost — $2,516,099,000) | | $2,633,919,501 | |
Other assets | | 125,610,404 | |
Total Assets | | 2,759,529,905 | |
Liabilities | | | |
Borrowings | | 1,241,000,000 | |
Other liabilities | | 8,714,118 | |
Total Liabilities | | 1,249,714,118 | |
Partners’ Capital | | 1,509,815,787 | |
Total Liabilities and Partners Capital | | $2,759,529,905 | |
Western Asset Mortgage Defined Opportunity Fund Inc. 2010 Annual Report | | 35 |
Statement of operations
For the year ended December 31, 2010
Investment Income | | | |
Interest Income | | $ | 235,349,840 | |
Expenses | | | |
Interest expense | | 13,677,383 | |
Operating expenses | | 2,111,336 | |
Total Expenses | | 15,788,719 | |
Net Investment Income | | 219,561,121 | |
Realized gain from investments | | 10,405,547 | |
Change in unrealized gain on investments | | 113,631,408 | |
Net Gain on Investments | | 124,036,955 | |
Net Increase in Partners Capital Resulting from Operations | | $ | 343,598,076 | |
The return on the Fund’s investment in the Master Fund for the period ended December 31, 2010 was approximately 27%.
5. Derivative instruments and hedging activities
Financial Accounting Standards Board Codification Topic 815 requires enhanced disclosure about an entity’s derivative and hedging activities.
During the period ended December 31, 2010, the Fund did not invest in any derivative instruments.
6. Distributions subsequent to December 31, 2010
On November 15, 2010, the Board of Directors (the “Board”) of the Fund declared two dividends, each in the amount of $0.1400 per share, payable on January 28, 2011 and February 25, 2011 to shareholders of record on January 21, 2011 and February 18, 2011, respectively.
On February 14, 2011, the Board declared three dividends, each in the amount of $0.1400 per share, payable on March 25, 2011, April 29, 2011 and May 27, 2011, to shareholders of record on March 18, 2011, April 21, 2011 and May 20, 2011, respectively.
7. Income tax information and distributions to shareholders
The tax character of distributions paid during the fiscal year ended December 31, was as follows:
| | 2010 | |
Distributions Paid From: | | | |
Ordinary income | | $11,601,034 | |
36 | | Western Asset Mortgage Defined Opportunity Fund Inc. 2010 Annual Report |
Notes to financial statements (cont’d)
As of December 31, 2010, the components of accumulated earnings on a tax basis were as follows:
Undistributed ordinary income — net | | $ 7,531,479 | |
Other book/tax temporary differences(a) | | (187,414 | ) |
Unrealized appreciation (depreciation)(b) | | 23,193,545 | |
Total accumulated earnings (losses) — net | | $30,537,610 | |
(a) Other book/tax temporary differences are attributable primarily to the book tax differences in the timing of the deductibility of various expenses.
(b) The difference between book-basis and tax-basis unrealized appreciation (depreciation) is attributable primarily to differences between the book and tax recognition of market discount and premiums on mortgage backed securities and the book vs taxable income recognized from the PPIP limited partnership investment.
8. Other tax information
On December 22, 2010, President Obama signed into law the Regulated Investment Company Modernization Act of 2010 (the “Act”). The Act updates certain tax rules applicable to regulated investment companies (“RICs”). The various provisions of the Act will generally be effective for RICs with taxable years beginning after December 22, 2010. Additional information regarding the impact of the Act on the Fund, if any, will be contained within the relevant sections of the notes to the financial statements for the fiscal year ending December 31, 2011.
Western Asset Mortgage Defined Opportunity Fund Inc. 2010 Annual Report | | 37 |
Report of independent registered public accounting firm
The Board of Directors and Shareholders
Western Asset Mortgage Defined Opportunity Fund Inc.:
We have audited the accompanying statement of assets and liabilities of Western Asset Mortgage Defined Opportunity Fund Inc., including the schedule of investments, as of December 31, 2010, and the related statements of operations, changes in net assets, cash flows, and the financial highlights for the period from February 24, 2010 (commencement of operations) to December 31, 2010. These financial statements and financial highlights are the responsibility of the Fund’s management. Our responsibility is to express an opinion on these financial statements and financial highlights based on our audit.
We conducted our audit in accordance with the standards of the Public Company Accounting Oversight Board (United States). Those standards require that we plan and perform the audit to obtain reasonable assurance about whether the financial statements and financial highlights are free of material misstatement. An audit includes examining, on a test basis, evidence supporting the amounts and disclosures in the financial statements. Our procedures included confirmation of securities owned as of December 31, 2010, by correspondence with the custodian and brokers. An audit also includes assessing the accounting principles used and significant estimates made by management, as well as evaluating the overall financial statement presentation. We believe that our audit provides a reasonable basis for our opinion.
In our opinion, the financial statements and financial highlights referred to above present fairly, in all material respects, the financial position of Western Asset Mortgage Defined Opportunity Fund Inc. as of December 31, 2010, the results of its operations, changes in its net assets, cash flows and the financial highlights for the period from February 24, 2010 (commencement of operations) to December 31, 2010, in conformity with U.S. generally accepted accounting principles.
New York, New York
February 18, 2011
38 | | Western Asset Mortgage Defined Opportunity Fund Inc. |
Additional information (unaudited)
Information about Directors and Officers
The business and affairs of Western Asset Mortgage Defined Opportunity Fund Inc. (the “Fund”) are conducted by management under the supervision and subject to the direction of its Board of Directors. The business address of each Director is c/o R. Jay Gerken, 620 Eighth Avenue, New York, New York 10018. Information pertaining to the Directors and officers of the Fund is set forth below.
Independent Directors†:
Carol L. Colman | |
Year of birth | 1946 |
Position(s) held with Fund1 | Director and Member of the Nominating and Audit Committees, Class I |
Term of office1 and length of time served | Since 2010 |
Principal occupation(s) during past five years | President, Colman Consulting Company (consulting) |
Number of portfolios in fund complex overseen by Director (including the Fund) | 24 |
Other board memberships held by Director | None |
| |
Daniel P. Cronin | |
Year of birth | 1946 |
Position(s) held with Fund1 | Director and Member of the Nominating and Audit Committees, Class I |
Term of office1 and length of time served | Since 2010 |
Principal occupation(s) during past five years | Retired; formerly, Associate General Counsel, Pfizer Inc. (prior to and including 2004) |
Number of portfolios in fund complex overseen by Director (including the Fund) | 24 |
Other board memberships held by Director | None |
| |
Paolo M. Cucchi | |
Year of birth | 1941 |
Position(s) held with Fund1 | Director and Member of the Nominating and Audit Committees, Class I |
Term of office1 and length of time served | Since 2010 |
Principal occupation(s) during past five years | Professor of French and Italian at Drew University; formerly, Vice President and Dean of College of Liberal Arts at Drew University (1984 to 2009) |
Number of portfolios in fund complex overseen by Director (including the Fund) | 24 |
Other board memberships held by Director | None |
Western Asset Mortgage Defined Opportunity Fund Inc. | | 39 |
Independent Directors cont’d
Leslie H. Gelb | |
Year of birth | 1937 |
Position(s) held with Fund1 | Director and Member of the Nominating and Audit Committees, Class II |
Term of office1 and length of time served | Since 2010 |
Principal occupation(s) during past five years | President Emeritus and Senior Board Fellow (since 2003), The Council on Foreign Relations; formerly, President, (prior to 2003), The Council on Foreign Relations; formerly, Columnist, Deputy Editorial Page Editor and Editor, Op-Ed Page, The New York Times |
Number of portfolios in fund complex overseen by Director (including the Fund) | 24 |
Other board memberships held by Director | Director of two registered investment companies advised by Blackstone Asia Advisors LLC: India Fund, Inc. and Asia Tigers Fund, Inc. (since 1994) |
| |
William R. Hutchinson | |
Year of birth | 1942 |
Position(s) held with Fund1 | Director and Member of the Nominating and Audit Committees, Class II |
Term of office1 and length of time served | Since 2010 |
Principal occupation(s) during past five years | President, W.R. Hutchinson & Associates Inc. (Consulting) (since 2001) |
Number of portfolios in fund complex overseen by Director (including the Fund) | 24 |
Other board memberships held by Director | Director (Non-Executive Chairman of the Board (since December 1, 2009)), Associated Banc Corp. (banking) (since 1994) |
| |
Riordan Roett | |
Year of birth | 1938 |
Position(s) held with Fund1 | Director and Member of the Nominating and Audit Committees, Class III |
Term of office1 and length of time served | Since 2010 |
Principal occupation(s) during past five years | The Sarita and Don Johnston Professor of Political Science and Director of Western Hemisphere Studies, Paul H. Nitze School of Advanced International Studies, The John Hopkins University (since 1973) |
Number of portfolios in fund complex overseen by Director (including the Fund) | 24 |
Other board memberships held by Director | None |
40 | | Western Asset Mortgage Defined Opportunity Fund Inc. |
Additional information (unaudited) (cont’d)
Information about Directors and Officers
Independent Directors cont’d
Jeswald W. Salacuse | | |
Year of birth | | 1938 |
Position(s) held with Fund1 | | Director and Member of the Nominating and Audit Committees, Class III |
Term of office1 and length of time served | | Since 2010 |
Principal occupation(s) during past five years | | Henry J. Braker Professor of Commercial Law, The Fletcher School of Law and Diplomacy, Tufts University (since 1986); President and Member, Arbitration Tribunal, World Bank/ICSID (since 2004) |
Number of portfolios in fund complex overseen by Director (including the Fund) | | 24 |
Other board memberships held by Director | | Director of two registered investment companies advised by Blackstone Asia Advisors LLC; India Fund, Inc. and Asia Tigers Fund, Inc. (since 1993) |
Interested Director and Officer:
R. Jay Gerken, CFA2 | | |
Year of birth | | 1951 |
Position(s) held with Fund1 | | Director, Chairman, President and Chief Executive Officer, Class II |
Term of office1 and length of time served | | Since 2010 |
Principal occupation(s) during past five years | | Managing Director of Legg Mason & Co., LLC (“Legg Mason & Co.”) (since 2005); Officer and Trustee/Director of 148 funds associated with Legg Mason Partners Fund Advisor, LLC (“LMPFA”) or its affiliates (since 2006) and Legg Mason & Co. predecessors (prior to 2006); President and Chief Executive Officer (“CEO”) of LMPFA (since 2006); President and CEO of Smith Barney Fund Management LLC (“SBFM”) and Citi Fund Management Inc. (“CFM”) (formerly registered investment advisers) (since 2002); formerly, Chairman, President and CEO, Travelers Investment Adviser Inc. (prior to 2005) |
Number of portfolios in fund complex overseen by Director (including the Fund) | | 136 |
Other board memberships held by Director | | Former Trustee, Consulting Group Capital Markets Funds (11 funds) (prior to 2006) |
Western Asset Mortgage Defined Opportunity Fund Inc. | | 41 |
Additional Officers:
Ted P. Becker | | |
Legg Mason | | |
620 Eighth Avenue, New York, NY 10018 | | |
Year of birth | | 1951 |
Position(s) held with Fund1 | | Chief Compliance Officer |
Term of office1 and length of time served | | Since 2010 |
Principal occupation(s) during past five years | | Director of Global Compliance at Legg Mason (since 2006); Chief Compliance Officer of LMPFA (since 2006); Managing Director of Compliance of Legg Mason & Co. (since 2005); Chief Compliance Officer of certain mutual funds associated with Legg Mason & Co. or its affiliates (since 2006) and Legg Mason & Co. predecessors (prior to 2006) |
| | |
John Chiota | | |
Legg Mason | | |
100 First Stamford Place, Stamford, CT 06902 | | |
Year of birth | | 1968 |
Position(s) with Fund1 | | Identity Theft Prevention Officer |
Term of office1 and length of time served | | Since 2010 |
Principal occupation(s) during past five years | | Identity Theft Prevention Officer of certain mutual funds associated with Legg Mason & Co. or its affiliates (since 2008); Chief Anti-Money Laundering Compliance Officer of certain mutual funds associated with Legg Mason & Co. or its affiliates (since 2006); Vice President of Legg Mason & Co. (since 2006) and Legg Mason & Co. predecessors (prior to 2006); formerly, Chief Anti-Money Laundering Compliance Officer of TD Waterhouse (prior to 2004) |
| | |
Robert I. Frenkel | | |
Legg Mason | | |
100 First Stamford Place, Stamford, CT 06902 | | |
Year of birth | | 1954 |
Position(s) held with Fund1 | | Secretary and Chief Legal Officer |
Term of office1 and length of time served | | Since 2010 |
Principal occupation(s) during past five years | | Vice President and Deputy General Counsel of Legg Mason (since 2006); Managing Director and General Counsel of Global Mutual Funds for Legg Mason & Co. (since 2006) and Legg Mason & Co. predecessors (since 1994); Secretary and Chief Legal Officer of certain mutual funds associated with Legg Mason & Co. or its affiliates (since 2006) and Legg Mason & Co. predecessors (prior to 2006) |
42 | | Western Asset Mortgage Defined Opportunity Fund Inc. |
Additional information (unaudited) (cont’d)
Information about Directors and Officers
Additional Officers cont’d
Thomas C. Mandia | | |
Legg Mason | | |
100 First Stamford Place, Stamford, CT 06902 | | |
Year of birth | | 1962 |
Position(s) held with Fund1 | | Assistant Secretary |
Term of office1 and length of time served | | Since 2010 |
Principal occupation(s) during past five years | | Managing Director and Deputy General Counsel of Legg Mason & Co. (since 2005) and Legg Mason & Co. predecessors (prior to 2005); Secretary of LMPFA (since 2006); Assistant Secretary of certain mutual funds associated with Legg Mason & Co. or its affiliates (since 2006) and Legg Mason & Co. predecessors (prior to 2006); Secretary of SBFM and CFM (since 2002) |
| | |
Kaprel Ozsolak | | |
Legg Mason | | |
55 Water Street, New York, NY 10041 | | |
Year of birth | | 1965 |
Position(s) held with Fund1 | | Chief Financial Officer |
Term of office1 and length of time served | | Since 2010 |
Principal occupation(s) during past five years | | Director of Legg Mason & Co. (since 2005); Chief Financial Officer of certain mutual funds associated with Legg Mason & Co. or its affiliates (since 2007) and Legg Mason & Co. predecessors (prior to 2007); formerly, Treasurer of certain mutual funds associated with Legg Mason & Co. or its affiliates (prior to 2010) and Legg Mason & Co. predecessors (prior to 2005); formerly, Controller of certain mutual funds associated with Legg Mason & Co. predecessors (prior to 2004) |
| | |
Steven Frank | | |
Legg Mason | | |
55 Water Street, New York, NY 10041 | | |
Year of birth | | 1967 |
Position(s) held with Fund1 | | Treasurer |
Term of office1 and length of time served | | Since 2010 |
Principal occupation(s) during past five years | | Vice President of Legg Mason & Co. and Legg Mason & Co. predecessors (since 2002); Treasurer of certain mutual funds associated with Legg Mason & Co. or its affiliates (since 2010); formerly, Controller of certain mutual funds associated with Legg Mason & Co. or its affiliates (prior to 2010); formerly, Assistant Controller of certain mutual funds associated with Legg Mason & Co. predecessors (prior to 2005) |
Western Asset Mortgage Defined Opportunity Fund Inc. | | 43 |
Additional Officers cont’d
Jeanne M. Kelly | | |
Legg Mason | | |
620 Eighth Avenue, New York, NY 10018 | | |
Year of birth | | 1951 |
Position(s) with Fund1 | | Senior Vice President |
Term of office1 and length of time served | | Since 2010 |
Principal occupation(s) during past five years | | Senior Vice President of certain mutual funds associated with Legg Mason & Co. or its affiliates (since 2007); Senior Vice President of LMPFA (since 2006); Managing Director of Legg Mason & Co. (since 2005) and Legg Mason & Co. predecessors (prior to 2005) |
† Directors who are not “interested persons” of the Fund within the meaning of Section 2(a)(19) of the 1940 Act.
1 The Fund’s Board of Directors is divided into three classes: Class I, Class II and Class III. The terms of office of the Class I, II and III Directors expire at the Annual Meetings of Stockholders in the year 2011, year 2012 and year 2013, respectively, or thereafter in each case when their respective successors are duly elected and qualified. The Fund’s executive officers are chosen each year at the first meeting of the Fund’s Board of Directors following the Annual Meeting of Stockholders, to hold office until the meeting of the Board following the next Annual Meeting of Stockholders and until their successors are duly elected and qualified.
2 Mr. Gerken is an “interested person” of the Fund as defined in the 1940 Act because Mr. Gerken is an officer of LMPFA and certain of its affiliates.
44 | | Western Asset Mortgage Defined Opportunity Fund Inc. |
Annual chief executive officer and chief financial officer certifications (unaudited)
The Fund’s Chief Executive Officer (“CEO”) has submitted to the NYSE the required annual certification and the Fund also has included the certifications of the Fund’s CEO and Chief Financial Officer required by Section 302 of the Sarbanes-Oxley Act in the Fund’s Form N-CSR filed with the SEC for the period of this report.
Western Asset Mortgage Defined Opportunity Fund Inc. | | 45 |
Dividend reinvestment plan (unaudited)
Unless you elect to receive distributions in cash (i.e., opt-out), all dividends, including any capital gain dividends, on your Common Stock will be automatically reinvested by American Stock Transfer & Trust Company LLC, as agent for the stockholders (the “Plan Agent”), in additional shares of Common Stock under the Fund’s Dividend Reinvestment Plan (the “Plan”). You may elect not to participate in the Plan by contacting the Plan Agent. If you do not participate, you will receive all cash distributions paid by check mailed directly to you by American Stock Transfer & Trust Company LLC, as dividend paying agent.
If you participate in the Plan, the number of shares of Common Stock you will receive will be determined as follows:
(1) If the market price of the Common Stock on the record date (or, if the record date is not a NYSE trading day, the immediately preceding trading day) for determining stockholders eligible to receive the relevant dividend or distribution (the “determination date”) is equal to or exceeds 98% of the net asset value per share of the Common Stock, the Fund will issue new Common Stock at a price equal to the greater of
(a) 98% of the net asset value per share at the close of trading on the NYSE on the determination date or
(b) 95% of the market price per share of the Common Stock on the determination date.
(2) If 98% of the net asset value per share of the Common Stock exceeds the market price of the Common Stock on the determination date, the Plan Agent will receive the dividend or distribution in cash and will buy Common Stock in the open market, on the NYSE or elsewhere, for your account as soon as practicable commencing on the trading day following the determination date and terminating no later than the earlier of (a) 30 days after the dividend or distribution payment date, or (b) the record date for the next succeeding dividend or distribution to be made to the stockholders; except when necessary to comply with applicable provisions of the federal securities laws. If during this period: (i) the market price rises so that it equals or exceeds 98% of the net asset value per share of the Common Stock at the close of trading on the NYSE on the determination date before the Plan Agent h as completed the open market purchases or (ii) if the Plan Agent is unable to invest the full amount eligible to be reinvested in open market purchases, the Plan Agent will cease purchasing Common Stock in the open market and the Fund shall issue the remaining Common Stock at a price per share equal to the greater of (a) 98% of the net asset value per share at the close of trading on the NYSE on the determination date or (b) 95% of the then current market price per share.
46 | | Western Asset Mortgage Defined Opportunity Fund Inc. |
Dividend reinvestment plan (unaudited) (cont’d)
Common Stock in your account will be held by the Plan Agent in non-certificated form. Any proxy you receive will include all shares of Common Stock you have received under the Plan.
You may withdraw from the Plan (i.e., opt-out) by notifying the Plan Agent in writing at P.O. Box 922, Wall Street Station, New York, NY 10269-0560 or by calling the Plan Agent at 877-366-6441. Such withdrawal will be effective immediately if notice is received by the Plan Agent not less than ten business days prior to any dividend or distribution record date; otherwise such withdrawal will be effective as soon as practicable after the Plan Agent’s investment of the most recently declared dividend or distribution on the Common Stock.
Upon any termination, you will be sent a certificate or certificates for the full number of shares of Common Stock held for you under the Plan and cash for any fractional share of Common Stock. You may elect to notify the Plan Agent in advance of such termination to have the Plan Agent sell part or all of your Common Stock on your behalf. You will be charged a service charge and the Plan Agent is authorized to deduct brokerage charges actually incurred for this transaction from the proceeds.
There is no service charge for reinvestment of your dividends or distributions in Common Stock. However, all participants will pay a pro rata share of brokerage commissions incurred by the Plan Agent when it makes open market purchases. Because all dividends and distributions will be automatically reinvested in additional shares of Common Stock, this allows you to add to your investment through dollar cost averaging, which may lower the average cost of your Common Stock over time. Dollar cost averaging is a technique for lowering the average cost per share over time if the Fund’s net asset value declines. While dollar cost averaging has definite advantages, it cannot assure profit or protect against loss in declining markets.
Automatically reinvesting dividends and distributions does not mean that you do not have to pay income taxes due upon receiving dividends and distributions. Investors will be subject to income tax on amounts reinvested under the Plan.
The Fund reserves the right to amend or terminate the Plan if, in the judgment of the Board of Directors, the change is warranted. There is no direct service charge to participants in the Plan; however, the Fund reserves the right to amend the Plan to include a service charge payable by the participants. The Plan may be amended or supplemented by the Fund upon notice in writing mailed to stockholders at least 30 days prior to the record date for the payment of any dividend or distribution by the Fund for which the amendment or supplement is to be effective. Additional information about the Plan and your account may be obtained from the Plan Agent at 6201 15th Avenue, Brooklyn, New York 11219 or by calling the Plan Agent at 1-888-888-0151.
Western Asset Mortgage Defined Opportunity Fund Inc. | | 47 |
Additional shareholder information (unaudited)
Results of first annual meeting of shareholders
The first Annual Meeting of Shareholders of Western Asset Mortgage Defined Opportunity Fund Inc. was held on November 12, 2010, for the purpose of considering and voting upon the election of Directors. The following table provides information concerning the matter voted upon at the meeting:
Election of directors
Nominees | | Votes For | | Votes Withheld | |
Carol L. Colman | | 9,925,966 | | 157,362 | |
Daniel P. Cronin | | 9,896,692 | | 186,636 | |
Paolo M. Cucchi | | 9,896,692 | | 186,636 | |
Leslie H. Gelb | | 9,920,366 | | 162,962 | |
William R. Hutchinson | | 9,925,966 | | 157,362 | |
Riordan Roett | | 9,895,692 | | 187,636 | |
Jeswald W. Salacuse | | 9,896,692 | | 186,636 | |
R. Jay Gerken, CFA | | 9,923,266 | | 160,062 | |
Western Asset
Mortgage Defined Opportunity Fund Inc.
Directors | | Western Asset Mortgage Defined Opportunity Fund Inc. | | Independent registered public accounting firm |
Carol L. Colman | | 55 Water Street | | KPMG LLP |
Daniel P. Cronin | | New York, NY 10041 | | 345 Park Avenue |
Paolo M. Cucchi | | | | New York, NY 10154 |
Leslie H. Gelb | | Investment manager | | |
R. Jay Gerken, CFA | | Legg Mason Partners Fund | | Legal counsel |
Chairman | | Advisor, LLC | | Simpson Thacher & Bartlett LLP |
William R. Hutchinson | | | | 425 Lexington Avenue |
Riordan Roett | | Subadvisers | | New York, NY 10017 |
Jeswald W. Salacuse | | Western Asset Management Company | | |
| | Western Asset Management Company Limited | | New York Stock Exchange Symbol |
Officers | | Allocation subadviser | | DMO |
R. Jay Gerken, CFA | | Wilshire Associates Incorporated | | |
President and Chief Executive Officer | | Custodian | | |
Kaprel Ozsolak | | State Street Bank and Trust Company | | |
Chief Financial Officer | | 1 Lincoln Street | | |
Ted P. Becker | | Boston, MA 02111 | | |
Chief Compliance Officer | | | | |
John Chiota | | Transfer agent | | |
Identity Theft Protection Officer | | American Stock Transfer & Trust Company | | |
Robert I. Frenkel | | 59 Maiden Lane | | |
Secretary and Chief Legal Officer | | New York, NY 10038 | | |
Thomas C. Mandia | | | | |
Assistant Secretary | | | | |
Steven Frank | | | | |
Treasurer | | | | |
Jeanne M. Kelly | | | | |
Senior Vice President | | | | |
Privacy policy
We are committed to keeping nonpublic personal information about you secure and confidential. This notice is intended to help you understand how we fulfill this commitment. From time to time, we may collect a variety of personal information about you, including:
· Information we receive from you on applications and forms, via the telephone, and through our websites;
· Information about your transactions with us, our affiliates, or others (such as your purchases, sales, or account balances); and
· Information we receive from consumer reporting agencies.
We do not disclose nonpublic personal information about our customers or former customers, except to our affiliates (such as broker-dealers or investment advisers within the Legg Mason family of companies) or as is otherwise permitted by applicable law or regulation. For example, we may share this information with others in order to process your transactions or service an account. We may also provide this information to companies that perform marketing services on our behalf, such as printing and mailing, or to other financial institutions with whom we have joint marketing agreements. When we enter into such agreements, we will require these companies to protect the confidentiality of this information and to use it only to perform the services for which we hired them.
With respect to our internal security procedures, we maintain physical, electronic, and procedural safeguards to protect your nonpublic personal information, and we restrict access to this information.
If you decide at some point either to close your account(s) or become an inactive customer, we will continue to adhere to our privacy policies and practices with respect to your nonpublic personal information.
| NOT PART OF THE ANNUAL REPORT | |
Western Asset Mortgage Defined Opportunity Fund Inc.
Western Asset Mortgage Defined Opportunity Fund Inc.
55 Water Street
New York, NY 10041
Notice is hereby given in accordance with Section 23(c) of the Investment Company Act of 1940, as amended, that from time to time the Fund may purchase at market price shares of its common stock in the open market.
The Fund files its complete schedule of portfolio holdings with the Securities and Exchange Commission (“SEC”) for the first and third quarters of each fiscal year on Form N-Q. The Fund’s Forms N-Q are available on the SEC’s website at www.sec.gov. The Fund’s Forms N-Q may be reviewed and copied at the SEC’s Public Reference Room in Washington, D.C., and information on the operation of the Public Reference Room may be obtained by calling 1-800-SEC-0330. To obtain information on Form N-Q from the Fund, shareholders can call 1-888-777-0102.
Information on how the Fund voted proxies relating to portfolio securities during the prior 12-month period ended June 30th of each year and a description of the policies and procedures that the Fund uses to determine how to vote proxies related to portfolio transactions are available (1) without charge, upon request, by calling 1-888-777-0102, (2) on the Fund’s website at www.leggmason.com/cef and (3) on the SEC’s website at www.sec.gov.
This report is transmitted to the shareholders of Western Asset Mortgage Defined Opportunity Fund Inc. for their information. This is not a prospectus, circular or representation intended for use in the purchase of shares of the Fund or any securities mentioned in this report.
American Stock
Transfer & Trust Company
59 Maiden Lane
New York, NY 10038
WASX013171 2/11 SR11-1322
ITEM 2. CODE OF ETHICS.
The registrant has adopted a code of ethics that applies to the registrant’s principal executive officer, principal financial officer, principal accounting officer or controller.
ITEM 3. AUDIT COMMITTEE FINANCIAL EXPERT.
The Board of Directors of the registrant has determined that William R. Hutchinson, the Chairman of the Board’s Audit Committee, possesses the technical attributes identified in Instruction 2(b) of Item 3 to Form N-CSR to qualify as an “audit committee financial expert,” and has designated Mr. Hutchinson as the Audit Committee’s financial expert. Mr. Hutchinson is an “independent” Director pursuant to paragraph (a)(2) of Item 3 to Form N-CSR.
ITEM 4. PRINCIPAL ACCOUNTANT FEES AND SERVICES.
a) Audit Fees. The aggregate fees billed in the last fiscal period ending December 31, 2010 (the “Reporting Period”) for professional services rendered by the Registrant’s principal accountant (the “Auditor”) for the audit of the Registrant’s annual financial statements, or services that are normally provided by the Auditor in connection with the statutory and regulatory filings or engagements for the Reporting Period, was $0 in 2010.
b) Audit-Related Fees. The aggregate fees billed in the Reporting Period for assurance and related services by the Auditor that are reasonably related to the performance of the Registrant’s financial statements were $0 in 2010.
In addition, there were no Audit-Related Fees billed in the Reporting Period for assurance and related services by the Auditor to the Registrant’s investment adviser (not including any sub-adviser whose role is primarily portfolio management and is subcontracted with or overseen by another investment adviser), and any entity controlling, controlled by or under common control with the investment adviser that provides ongoing services to the Western Asset Mortgage Defined Opportunity Fund Inc. (“service affiliates”), that were reasonably related to the performance of the annual audit of the service affiliates. Accordingly, there were no such fees that required pre-approval by the Audit Committee for the Reporting Period.
(c) Tax Fees. The aggregate fees billed in the Reporting Period for professional services rendered by the Auditor for tax compliance, tax advice and tax planning (“Tax Services”) were $0 in 2010. These services consisted of (i) review or preparation of U.S. federal, state, local and excise tax returns; (ii) U.S. federal, state and local tax planning, advice and assistance regarding statutory, regulatory or administrative developments, and (iii) tax advice regarding tax qualification matters and/or treatment of various financial instruments held or proposed to be acquired or held.
There were no fees billed for tax services by the Auditors to service affiliates during the Reporting Period that required pre-approval by the Audit Committee.
d) All Other Fees. There were no other fees billed in the Reporting Period for products and services provided by the Auditor, other than the services reported in paragraphs (a) through (c) of this Item for the Western Asset Mortgage Defined Opportunity Fund Inc..
All Other Fees. There were no other non-audit services rendered by the Auditor to Legg Mason Partners Fund Advisor, LLC (“LMPFA”) and any entity controlling, controlled by or under common control with LMPFA that provided ongoing services to Western Asset Mortgage Defined Opportunity Fund Inc. requiring pre-approval by the Audit Committee in the Reporting Period.
(e) Audit Committee’s pre–approval policies and procedures described in paragraph (c)
(7) of Rule 2-01 of Regulation S-X.
(1) The Charter for the Audit Committee (the “Committee”) of the Board of each registered investment company (the “Fund”) advised by LMPFA or one of their affiliates (each, an “Adviser”) requires that the Committee shall approve (a) all audit and permissible non-audit services to be provided to the Fund and (b) all permissible non-audit services to be provided by the Fund’s independent auditors to the Adviser and any Covered Service Providers if the engagement relates directly to the operations and financial reporting of the Fund. The Committee may implement policies and procedures by which such services are approved other than by the full Committee.
The Committee shall not approve non-audit services that the Committee believes may impair the independence of the auditors. As of the date of the approval of this Audit Committee Charter, permissible non-audit services include any professional services (including tax services), that are not prohibited services as described below, provided to the Fund by the independent auditors, other than those provided to the Fund in connection with an audit or a review of the financial statements of the Fund. Permissible non-audit services may not include: (i) bookkeeping or other services related to the accounting records or financial statements of the Fund; (ii) financial information systems design and implementation; (iii) appraisal or valuation services, fairness opinions or contribution-in-kind reports; (iv) actuarial services; (v) internal audit outsourcing services; (vi) management functions or human resources; (vii) broker or dealer, investment adviser or investment banking services; (viii) legal services and expert services unrelated to the audit; and (ix) any other service the Public Company Accounting Oversight Board determines, by regulation, is impermissible.
Pre-approval by the Committee of any permissible non-audit services is not required so long as: (i) the aggregate amount of all such permissible non-audit services provided to the Fund, the Adviser and any service providers controlling, controlled by or under common control with the Adviser that provide ongoing services to the Fund (“Covered Service Providers”) constitutes not more than 5% of the total amount of revenues paid to the independent auditors during the fiscal year in which the permissible non-audit services are provided to (a) the Fund, (b) the Adviser and (c) any entity controlling, controlled by or under common control with the Adviser that provides ongoing services to the Fund during the fiscal year in which the services are provided that would have to be approved by the Committee; (ii) the permissible non-audit services were not recognized by the Fund at the time of the engagemen t to be non-audit services; and (iii) such services are promptly brought to the attention of the Committee and approved by the Committee (or its delegate(s)) prior to the completion of the audit.
(2) For the Western Asset Mortgage Defined Opportunity Fund Inc., the percentage of fees that were approved by the audit committee, with respect to: Audit-Related Fees were 100% for 2010; Tax Fees were 100% for 2010; and Other Fees were 100% for 2010.
(f) N/A
(g) Non-audit fees billed by the Auditor for services rendered to Western Asset Mortgage Defined Opportunity Fund Inc., LMPFA and any entity controlling, controlled by, or under common control with LMPFA that provides ongoing services to Western Asset Mortgage Defined Opportunity Fund Inc. during the reporting period were $0 in 2010.
(h) Yes. Western Asset Mortgage Defined Opportunity Fund Inc.’s Audit Committee has considered whether the provision of non-audit services that were rendered to Service Affiliates, which were not pre-approved (not requiring pre-approval), is compatible with maintaining the Accountant’s independence. All services provided by the Auditor to the Western Asset Mortgage Defined Opportunity Fund Inc. or to Service Affiliates, which were required to be pre-approved, were pre-approved as required.
ITEM 5. AUDIT COMMITTEE OF LISTED REGISTRANTS.
a) Registrant has a separately-designated standing Audit Committee established in accordance with Section 3(a)58(A) of the Exchange Act. The Audit Committee consists of the following Board members:
William R. Hutchinson
Paolo M. Cucchi
Daniel P. Cronin
Carol L. Colman
Leslie H. Gelb
Dr. Riordan Roett
Jeswald W. Salacuse
b) Not applicable
ITEM 6. SCHEDULE OF INVESTMENTS.
Included herein under Item 1.
ITEM 7. DISCLOSURE OF PROXY VOTING POLICIES AND PROCEDURES FOR CLOSED-END MANAGEMENT INVESTMENT COMPANIES.
Proxy Voting Guidelines and Procedures
Legg Mason Partners Fund Advisor, LLC (“LMPFA”) delegates the responsibility for voting proxies for the fund to the subadviser through its contracts with the subadviser. The subadviser will use its own proxy voting policies and procedures to vote proxies. Accordingly, LMPFA does not expect to have proxy-voting responsibility for the fund. Should LMPFA become responsible for voting proxies for any reason, such as the inability of the subadviser to provide investment advisory services, LMPFA shall utilize the proxy voting guidelines established by the most recent subadviser to vote proxies until a new subadviser is retained.
The subadviser’s Proxy Voting Policies and Procedures govern in determining how proxies relating to the fund’s portfolio securities are voted and are provided below. Information regarding how each fund voted proxies (if any) relating to portfolio securities during the most recent 12-month period ended June 30 is available without charge (1) by calling 888-425-6432, (2) on the fund’s website at http://www.leggmason.com/individualinvestors and (3) on the SEC’s website at http://www.sec.gov.
Background
Western Asset Management Company (“WA”) and Western Asset Management Company Limited (“WAML”) (together “Western Asset”) have adopted and implemented policies and procedures that we believe are reasonably designed to ensure that proxies are voted in the best interest of clients, in accordance with our fiduciary duties and SEC Rule 206(4)-6 under the Investment Advisers Act of 1940 (“Advisers Act”). Our authority to vote the proxies of our clients is established through investment management agreements or comparable documents, and our proxy voting guidelines have been tailored to reflect these specific contractual obligations. In addition to SEC requirements governing advisers, our proxy voting policies reflect the long-standing fiduciary standards and responsibilities for ERISA accounts. Unless a manager of ERISA assets has been expressly precluded from voting proxies, th e Department of Labor has determined that the responsibility for these votes lies with the Investment Manager.
In exercising its voting authority, Western Asset will not consult or enter into agreements with officers, directors or employees of Legg Mason Inc. or any of its affiliates (except that WA and WAML may so consult and agree with each other) regarding the voting of any securities owned by its clients.
Policy
Western Asset’s proxy voting procedures are designed and implemented in a way that is reasonably expected to ensure that proxy matters are handled in the best interest of our clients. While the guidelines included in the procedures are intended to provide a benchmark for voting standards, each vote is ultimately cast on a case-by-case basis, taking into consideration Western Asset’s contractual obligations to our clients and all other relevant facts and circumstances at the time of the vote (such that these guidelines may be overridden to the extent Western Asset deems appropriate).
Procedures
Responsibility and Oversight
The Western Asset Compliance Department (“Compliance Department”) is responsible for administering and overseeing the proxy voting process. The gathering of proxies is coordinated through the Corporate Actions area of Investment Support (“Corporate Actions”). Research analysts and portfolio managers are responsible for determining appropriate voting positions on each proxy utilizing any applicable guidelines contained in these procedures.
Client Authority
Prior to August 1, 2003, all existing client investment management agreements (“IMAs”) will be reviewed to determine whether Western Asset has authority to vote client proxies. At account start-up, or upon amendment of an IMA, the applicable client IMA are similarly reviewed. If an agreement is silent on proxy voting, but contains an overall delegation of discretionary authority or if the account represents assets of an ERISA plan, Western Asset will assume responsibility for proxy voting. The Client Account Transition Team maintains a matrix of proxy voting authority.
Proxy Gathering
Registered owners of record, client custodians, client banks and trustees (“Proxy Recipients”) that receive proxy materials on behalf of clients should forward them to Corporate Actions. Prior to August 1, 2003, Proxy Recipients of existing clients will be reminded of the appropriate routing to Corporate Actions for proxy materials received and reminded of their responsibility to forward all proxy materials on a timely basis. Proxy Recipients for new clients (or, if Western Asset becomes aware that the applicable Proxy Recipient for an existing client has changed, the Proxy Recipient for the existing client) are notified at start-up of appropriate routing to Corporate Actions of proxy materials received and reminded of their responsibility to forward all proxy materials on a timely basis. If Western Asset personnel other than Corporate Actions receive proxy materials, they should promptly forward the materials to Corporate Actions.
Proxy Voting
Once proxy materials are received by Corporate Actions, they are forwarded to the Compliance Department for coordination and the following actions:
a. Proxies are reviewed to determine accounts impacted.
b. Impacted accounts are checked to confirm Western Asset voting authority.
c. Compliance Department staff reviews proxy issues to determine any material conflicts of interest. (See conflicts of interest section of these procedures for further information on determining material conflicts of interest.)
d. If a material conflict of interest exists, (i) to the extent reasonably practicable and permitted by applicable law, the client is promptly notified, the conflict is disclosed and Western Asset obtains the client’s proxy voting instructions, and (ii) to the extent that it is not reasonably practicable or permitted by applicable law to notify the client and obtain such instructions (e.g., the client is a mutual fund or other commingled vehicle or is an ERISA plan client), Western Asset seeks voting instructions from an independent third party.
e. Compliance Department staff provides proxy material to the appropriate research analyst or portfolio manager to obtain their recommended vote. Research analysts and portfolio managers determine votes on a case-by-case basis taking into account the voting guidelines contained in these procedures. For avoidance of doubt, depending on the best interest of each individual client, Western Asset may vote the same proxy differently for different clients. The analyst’s or portfolio manager’s basis for their decision is documented and maintained by the Compliance Department.
f. Compliance Department staff votes the proxy pursuant to the instructions received in (d) or (e) and returns the voted proxy as indicated in the proxy materials.
Timing
Western Asset personnel act in such a manner to ensure that, absent special circumstances, the proxy gathering and proxy voting steps noted above can be completed before the applicable deadline for returning proxy votes.
Recordkeeping
Western Asset maintains records of proxies voted pursuant to Section 204-2 of the Advisers Act and ERISA DOL Bulletin 94-2. These records include:
a. A copy of Western Asset’s policies and procedures.
b. Copies of proxy statements received regarding client securities.
c. A copy of any document created by Western Asset that was material to making a decision how to vote proxies.
d. Each written client request for proxy voting records and Western Asset’s written response to both verbal and written client requests.
e. A proxy log including:
1. Issuer name;
2. Exchange ticker symbol of the issuer’s shares to be voted;
3. Council on Uniform Securities Identification Procedures (“CUSIP”) number for the shares to be voted;
4. A brief identification of the matter voted on;
5. Whether the matter was proposed by the issuer or by a shareholder of the issuer;
6. Whether a vote was cast on the matter;
7. A record of how the vote was cast; and
8. Whether the vote was cast for or against the recommendation of the issuer’s management team.
Records are maintained in an easily accessible place for five years, the first two in Western Asset’s offices.
Disclosure
Part II of the WA Form ADV and the WAML Form ADV, each, contain a description of Western Asset’s proxy policies. Prior to August 1, 2003, Western Asset will deliver Part II of its revised Form ADV to all existing clients, along with a letter identifying the new disclosure. Clients will be provided a copy of these policies and procedures upon request. In addition, upon request, clients may receive reports on how their proxies have been voted.
Conflicts of Interest
All proxies are reviewed by the Compliance Department for material conflicts of interest. Issues to be reviewed include, but are not limited to:
1. Whether Western Asset (or, to the extent required to be considered by applicable law, its affiliates) manages assets for the company or an employee group of the company or otherwise has an interest in the company;
2. Whether Western Asset or an officer or director of Western Asset or the applicable portfolio manager or analyst responsible for recommending the proxy vote (together, “Voting Persons”) is a close relative of or has a personal or business relationship with an executive, director or person who is a candidate for director of the company or is a participant in a proxy contest; and
3. Whether there is any other business or personal relationship where a Voting Person has a personal interest in the outcome of the matter before shareholders.
Voting Guidelines
Western Asset’s substantive voting decisions turn on the particular facts and circumstances of each proxy vote and are evaluated by the designated research analyst or portfolio manager. The examples outlined below are meant as guidelines to aid in the decision making process.
Guidelines are grouped according to the types of proposals generally presented to shareholders. Part I deals with proposals which have been approved and are recommended by a company’s board of directors; Part II deals with proposals submitted by shareholders for inclusion in proxy statements; Part III addresses issues relating to voting shares of investment companies; and Part IV addresses unique considerations pertaining to foreign issuers.
I. Board Approved Proposals
The vast majority of matters presented to shareholders for a vote involve proposals made by a company itself that have been approved and recommended by its board of directors. In view of the enhanced corporate governance practices currently being implemented in public companies, Western Asset generally votes in
support of decisions reached by independent boards of directors. More specific guidelines related to certain board-approved proposals are as follows:
1. Matters relating to the Board of Directors
Western Asset votes proxies for the election of the company’s nominees for directors and for board-approved proposals on other matters relating to the board of directors with the following exceptions:
a. Votes are withheld for the entire board of directors if the board does not have a majority of independent directors or the board does not have nominating, audit and compensation committees composed solely of independent directors.
b. Votes are withheld for any nominee for director who is considered an independent director by the company and who has received compensation from the company other than for service as a director.
c. Votes are withheld for any nominee for director who attends less than 75% of board and committee meetings without valid reasons for absences.
d. Votes are cast on a case-by-case basis in contested elections of directors.
2. Matters relating to Executive Compensation
Western Asset generally favors compensation programs that relate executive compensation to a company’s long-term performance. Votes are cast on a case-by-case basis on board-approved proposals relating to executive compensation, except as follows:
a. Except where the firm is otherwise withholding votes for the entire board of directors, Western Asset votes for stock option plans that will result in a minimal annual dilution.
b. Western Asset votes against stock option plans or proposals that permit replacing or repricing of underwater options.
c. Western Asset votes against stock option plans that permit issuance of options with an exercise price below the stock’s current market price.
d. Except where the firm is otherwise withholding votes for the entire board of directors, Western Asset votes for employee stock purchase plans that limit the discount for shares purchased under the plan to no more than 15% of their market value, have an offering period of 27 months or less and result in dilution of 10% or less.
3. Matters relating to Capitalization
The management of a company’s capital structure involves a number of important issues, including cash flows, financing needs and market conditions that are unique to the circumstances of each company. As a result, Western Asset votes on a case-by-case basis on board-approved proposals involving changes to a company’s capitalization except where Western Asset is otherwise withholding votes for the entire board of directors.
a. Western Asset votes for proposals relating to the authorization of additional common stock.
b. Western Asset votes for proposals to effect stock splits (excluding reverse stock splits).
c. Western Asset votes for proposals authorizing share repurchase programs.
4. Matters relating to Acquisitions, Mergers, Reorganizations and Other Transactions
Western Asset votes these issues on a case-by-case basis on board-approved transactions.
5. Matters relating to Anti-Takeover Measures
Western Asset votes against board-approved proposals to adopt anti-takeover measures except as follows:
a. Western Asset votes on a case-by-case basis on proposals to ratify or approve shareholder rights plans.
b. Western Asset votes on a case-by-case basis on proposals to adopt fair price provisions.
6. Other Business Matters
Western Asset votes for board-approved proposals approving such routine business matters such as changing the company’s name, ratifying the appointment of auditors and procedural matters relating to the shareholder meeting.
a. Western Asset votes on a case-by-case basis on proposals to amend a company’s charter or bylaws.
b. Western Asset votes against authorization to transact other unidentified, substantive business at the meeting.
II. Shareholder Proposals
SEC regulations permit shareholders to submit proposals for inclusion in a company’s proxy statement. These proposals generally seek to change some aspect of a company’s corporate governance structure or to change some aspect of its business operations. Western Asset votes in accordance with the recommendation of the company’s board of directors on all shareholder proposals, except as follows:
1. Western Asset votes for shareholder proposals to require shareholder approval of shareholder rights plans.
2. Western Asset votes for shareholder proposals that are consistent with Western Asset’s proxy voting guidelines for board-approved proposals.
3. Western Asset votes on a case-by-case basis on other shareholder proposals where the firm is otherwise withholding votes for the entire board of directors.
III. Voting Shares of Investment Companies
Western Asset may utilize shares of open or closed-end investment companies to implement its investment strategies. Shareholder votes for investment companies that fall within the categories listed in Parts I and II above are voted in accordance with those guidelines.
1. Western Asset votes on a case-by-case basis on proposals relating to changes in the investment objectives of an investment company taking into account the original intent of the fund and the role the fund plays in the clients’ portfolios.
2. Western Asset votes on a case-by-case basis all proposals that would result in increases in expenses (e.g., proposals to adopt 12b-1 plans, alter investment advisory arrangements or approve fund mergers) taking into account comparable expenses for similar funds and the services to be provided.
IV. Voting Shares of Foreign Issuers
In the event Western Asset is required to vote on securities held in foreign issuers — i.e. issuers that are incorporated under the laws of a foreign jurisdiction and that are not listed on a U.S. securities exchange or the NASDAQ stock market, the following guidelines are used, which are premised on the existence of a sound corporate governance and disclosure framework. These guidelines, however, may not be appropriate under some circumstances for foreign issuers and therefore apply only where applicable.
1. Western Asset votes for shareholder proposals calling for a majority of the directors to be independent of management.
2. Western Asset votes for shareholder proposals seeking to increase the independence of board nominating, audit and compensation committees.
3. Western Asset votes for shareholder proposals that implement corporate governance standards similar to those established under U.S. federal law and the listing requirements of U.S. stock exchanges, and that do not otherwise violate the laws of the jurisdiction under which the company is incorporated.
4. Western Asset votes on a case-by-case basis on proposals relating to (1) the issuance of common stock in excess of 20% of a company’s outstanding common stock where shareholders do not have preemptive rights, or (2) the issuance of common stock in excess of 100% of a company’s outstanding common stock where shareholders have preemptive rights.
ITEM 8. PORTFOLIO MANAGERS OF CLOSED-END MANAGEMENT INVESTMENT COMPANIES.
(a)(1):
NAME AND | | LENGTH OF | | PRINCIPAL OCCUPATION(S) DURING |
ADDRESS | | TIME SERVED | | PAST 5 YEARS |
| | | | |
S. Kenneth Leech
Western Asset
385 East Colorado Blvd.
Pasadena, CA 91101 | | Since 2010 | | Co-portfolio manager of the fund; Chief Investment Officer of Western Asset from 1998 to 2008; Senior Advisor/Chief Investment Officer Emeritus of Western Asset. |
Stephen A. Walsh
Western Asset
385 East Colorado Blvd.
Pasadena, CA 91101 | | Since 2010 | | Co-portfolio manager of the fund; Deputy Chief Investment Officer of Western Asset from 2000 to 2008; Chief Investment Officer of Western Asset since 2008. |
| | | | |
Ronald D. Mass
Western Asset
385 East Colorado Blvd.
Pasadena, CA | | Since 2010 | | Co-portfolio manager of the fund; Head of Structured Products of Western Asset for more than five years |
(a)(2): DATA TO BE PROVIDED BY FINANCIAL CONTROL
The following tables set forth certain additional information with respect to the fund’s portfolio managers for the fund. Unless noted otherwise, all information is provided as of December 31, 2010.
Other Accounts Managed by Portfolio Managers
The table below identifies the number of accounts (other than the fund) for which the fund’s portfolio managers have day-to-day management responsibilities and the total assets in such accounts, within each of the following categories: registered investment companies, other pooled investment vehicles, and other accounts. For each category, the number of accounts and total assets in the accounts where fees are based on performance is also indicated.
| | Registered | | Other Pooled | | |
Portfolio | | Investment | | Investment | | Other |
Manager(s) | | Companies | | Vehicles | | Accounts |
| | | | | | |
S. Kenneth Leech‡ | | 103 registered investment companies with $169.5 billion in total assets under management | | 215 Other pooled investment vehicles with $109.3 billion in assets under management* | | 780 Other accounts with $175.0 on in total assets under management** |
| | | | | | |
Stephen A. Walsh‡ | | 103 registered investment companies with $169.5 billion in total assets under management | | 215 Other pooled investment vehicles with $109.3 billion in assets under management* | | 780 Other accounts with $175.0 billion in total assets under management** |
| | | | | | |
Ronald D. Mass ‡ | | 3 registered investment Companies with $0.9 billion in total assets | | 10 Other pooled investment vehicles with $5.4 billion in | | 6 Other accounts with $0.3 billion in total assets under management |
| | Under management | | assets under management *** | | |
* Includes 7 accounts managed, totaling $1.2 billion, for which advisory fee is performance based.
** Includes 81 accounts managed, totaling $19.4 billion, for which advisory fee is performance based.
*** Includes 3 accounts managed, totaling $0.5 billion, for which advisory fee is performance based.
*** Includes 3 accounts managed, totaling $0.5 billion, for which advisory fee is performance based.
‡ The numbers above reflect the overall number of portfolios managed by employees of Western Asset Management Company (“Western Asset”). Mr. Leech and Mr. Walsh are involved in the management of all the Firm’s portfolios, but they are not solely responsible for particular portfolios. Western Asset’s investment discipline emphasizes a team approach that combines the efforts of groups of specialists working in different market sectors. They are responsible for overseeing implementation of Western Asset’s overall investment ideas and coordinating the work of the various sector teams. This structure ensures that client portfolios benefit from a consensus that draws on the expertise of all team members.
(a)(3): Portfolio Manager Compensation
With respect to the compensation of the portfolio managers, Western Asset’s compensation system assigns each employee a total compensation range, which is derived from annual market surveys that benchmark each role with its job function and peer universe. This method is designed to reward employees with total compensation reflective of the external market value of their skills, experience, and ability to produce desired results. Standard compensation includes competitive base salaries, generous employee benefits, and a retirement plan.
In addition, the subadviser’s employees are eligible for bonuses. These are structured to closely align the interests of employees with those of the subadviser, and are determined by the professional’s job function and pre-tax performance as measured by a formal review process. All bonuses are completely discretionary. The principal factor considered is a portfolio manager’s investment performance versus appropriate peer groups and benchmarks (e.g., a securities index and with respect to a fund, the benchmark set forth in the fund’s Prospectus to which the fund’s average annual total returns are compared or, if none, the benchmark set forth in the fund’s annual report). Performance is reviewed on a 1, 3 and 5 year basis for compensation—with 3 years having the most emphasis. The subadviser may also measure a portfolio manager’s pre-tax investment performance against other benchmarks, as it determines appropriate. Because portfolio managers are generally responsible for multiple accounts (including the funds) with similar investment strategies, they are generally compensated on the performance of the aggregate group of similar accounts, rather than a specific account. Other factors that may be considered when making bonus decisions include client service, business development, length of service to the subadviser, management or supervisory responsibilities, contributions to developing business strategy and overall contributions to the subadviser’s business.
Finally, in order to attract and retain top talent, all professionals are eligible for additional incentives in recognition of outstanding performance. These are determined based upon the factors described above and include Legg Mason stock options and long-term incentives that vest over a set period of time past the award date.
Potential Conflicts of Interest
Conflicts of Interest
The manager, subadvisers and portfolio managers have interests which conflict with the interests of the fund. There is no guarantee that the policies and procedures adopted by the manager, the subadvisers and the fund will be able to identify or mitigate these conflicts of interest.
Some examples of material conflicts of interest include:
Allocation of Limited Time and Attention. A portfolio manager who is responsible for managing multiple funds and/or accounts may devote unequal time and attention to the management of those funds and/or accounts. A portfolio manager may not be able to formulate as complete a strategy or identify equally attractive investment opportunities for each of those funds and accounts as might be the case if he or she were to devote substantially more attention to the management of a single fund. Such a portfolio manager may make general determinations across multiple funds, rather than tailoring a unique approach for each fund. The effects of this conflict may be more pronounced where funds and/or accounts overseen by a particular portfolio manager have different investment strategies.
Allocation of Limited Investment Opportunities; Aggregation of Orders. If a portfolio manager identifies a limited investment opportunity that may be suitable for multiple funds and/or accounts, the opportunity may be allocated among these several funds or accounts, which may limit the fund’s ability to take full advantage of the investment opportunity. Additionally, a subadviser may aggregate transaction orders for multiple accounts for purpose of execution. Such aggregation may cause the price or brokerage costs to be less favorable to a particular client than if similar transactions were not being executed concurrently for other accounts. In addition, a subadviser’s trade allocation policies may result in the fund’s orders not being fully executed or being delayed in execution.
Pursuit of Differing Strategies. At times, a portfolio manager may determine that an investment opportunity may be appropriate for only some of the funds and/or accounts for which he or she exercises investment responsibility, or may decide that certain of the funds and/or accounts should take differing positions with respect to a particular security. In these cases, the portfolio manager may place separate transactions for one or more funds or accounts which may affect the market price of the security or the execution of the transaction, or both, to the detriment or benefit of one or more other funds and/or accounts. For example, a portfolio manager may determine that it would be in the interest of another account to sell a security that the fund holds long, potentially resulting in a decrease in the market value of th e security held by the fund.
Cross Trades. Portfolio managers may manage funds that engage in cross trades, where one of the manager’s funds or accounts sells a particular security to another fund or account managed by the same manager. Cross trades may pose conflicts of interest because of, for example, the possibility that one account sells a security to another account at a higher price than an independent third party would pay or otherwise enters into a transaction that it would not enter into with an independent party, such as the sale of a difficult-to-obtain security.
Selection of Broker/Dealers. Portfolio managers may select or influence the selection of the brokers and dealers that are used to execute securities transactions for the funds and/or accounts that they supervise. In addition to executing trades, some brokers and dealers provide subadvisers with brokerage and research services, These services may be taken into account in the selection of brokers and dealers whether a broker is being selected to effect a trade on an agency basis for a commission or (as is normally the case for the funds) whether a dealer is being selected to effect a trade on a principal basis. This may result in the payment of higher brokerage fees and/or execution at a less favorable price than might have otherwise been available. The services obtained may ultimately be more beneficial to certain of the manager’s funds or accounts than to others (but not necessarily to the funds that pay the increased commission or incur the less favorable execution). A decision as to the selection of brokers and dealers could therefore yield disproportionate costs and benefits among the funds and/or accounts managed.
Variation in Financial and Other Benefits. A conflict of interest arises where the financial or other benefits available to a portfolio manager differ among the funds and/or accounts that he or she manages. If the amount or structure of the investment manager’s management fee and/or a portfolio manager’s compensation differs among funds and/or accounts (such as where certain funds or accounts pay higher management fees or performance-based management fees), the portfolio manager might be motivated to help certain funds and/or accounts over others. Similarly, the desire to maintain assets under management or to enhance the portfolio manager’s performance record or to derive other rewards, financial or otherwise, could influence the portfolio manager in affording preferential treatment to those funds and/or accounts that could most significantly benefit the portfolio manager. A portfolio manager may, for example, have an incentive to allocate favorable or limited opportunity investments or structure the timing of investments to favor such funds and/or accounts. Also, a portfolio manager’s or the manager’s or a subadviser’s desire to increase assets under management could influence the portfolio manager to keep a fund open for new investors without regard to potential benefits of closing the fund to new investors. Additionally, the portfolio manager might be motivated to favor funds and/or accounts in which he or she has an ownership interest or in which the investment manager and/or its affiliates have ownership interests. Conversely, if a portfolio manager does not personally hold an investment in the fund, the portfolio manager’s conflicts of interest with respect to the fund may be more acute.
Related Business Opportunities. The investment manager or its affiliates may provide more services (such as distribution or recordkeeping) for some types of funds or accounts than for others. In such cases, a portfolio manager may benefit, either directly or indirectly, by devoting disproportionate attention to the management of funds and/or accounts that provide greater overall returns to the investment manager and its affiliates.
(a)(4): Portfolio Manager Securities Ownership
The table below identifies the dollar range of securities beneficially owned by each portfolio managers as of December 31, 2010.
Portfolio Manager(s) | | Dollar Range of
Portfolio
Securities
Beneficially
Owned | |
| | | |
S. Kenneth Leech | | A | |
Stephen A. Walsh | | E | |
Ronald D. Mass | | E | |
Dollar Range ownership is as follows:
A: none
B: $1 - $10,000
C: 10,001 - $50,000
D: $50,001 - $100,000
E: $100,001 - $500,000
F: $500,001 - $1 million
G: over $1 million
ITEM 9. PURCHASES OF EQUITY SECURITIES BY CLOSED-END MANAGEMENT INVESTMENT COMPANY AND AFFILIATED PURCHASERS.
Not applicable.
ITEM 10. SUBMISSION OF MATTERS TO A VOTE OF SECURITY HOLDERS.
Not applicable.
ITEM 11. CONTROLS AND PROCEDURES.
(a) The registrant’s principal executive officer and principal financial officer have concluded that the registrant’s disclosure controls and procedures (as defined in Rule 30a- 3(c) under the Investment Company Act of 1940, as amended (the “1940 Act”)) are effective as of a date within 90 days of the filing date of this report that includes the disclosure required by this paragraph, based on their evaluation of the disclosure controls and procedures required by Rule 30a-3(b) under the 1940 Act and 15d-15(b) under the Securities Exchange Act of 1934.
(b) There were no changes in the registrant’s internal control over financial reporting (as defined in Rule 30a-3(d) under the 1940 Act) that occurred during the registrant’s last fiscal half-year (the registrant’s second fiscal half-year in the case of an annual report) that have materially affected, or are likely to materially affect the registrant’s internal control over financial reporting.
ITEM 12. EXHIBITS.
(a) (1) Not applicable.
Exhibit 99.CODE ETH
(a) (2) Certifications pursuant to section 302 of the Sarbanes-Oxley Act of 2002 attached hereto.
Exhibit 99.CERT
(b) Certifications pursuant to Section 906 of the Sarbanes-Oxley Act of 2002 attached hereto.
Exhibit 99.906CERT
SIGNATURES
Pursuant to the requirements of the Securities Exchange Act of 1934 and the Investment Company Act of 1940, the registrant has duly caused this Report to be signed on its behalf by the undersigned, there unto duly authorized.
Western Asset Mortgage Defined Opportunity Fund Inc. | |
| |
By: | /s/ R. Jay Gerken | |
| (R. Jay Gerken) | |
| Chief Executive Officer of | |
| Western Asset Mortgage Defined Opportunity Fund Inc. | |
| | |
Date: | March 2, 2011 | |
Pursuant to the requirements of the Securities Exchange Act of 1934 and the Investment Company Act of 1940, this report has been signed below by the following persons on behalf of the registrant and in the capacities and on the dates indicated.
By: | /s/ R. Jay Gerken | |
| (R. Jay Gerken) | |
| Chief Executive Officer of | |
| Western Asset Mortgage Defined Opportunity Fund Inc. | |
| | |
Date: | March 2, 2011 | |
| | |
| | |
By: | /s/ Kaprel Ozsolak | |
| (Kaprel Ozsolak) | |
| Chief Financial Officer of | |
| Western Asset Mortgage Defined Opportunity Fund Inc. | |
| | |
Date: | March 2, 2011 | |