EXHIBIT 99.2
January 2022 Eagle Bancorp Montana, Inc. ( NASDAQGM: EBMT ) Private Placement Offering Subordinated Notes CONFIDENTIAL

Notice to Recipients 2 This confidential presentation (this “Presentation”) has been prepared solely for general informational purposes by Eagle Ban cor p Montana, Inc. ("Eagle," the “Company,” the “holding company,” “we” or “our”), a financial holding company under the Bank Holding Company Act, and 100% owner of Opportunity Bank of Montana (the "Bank"), a state - chartered non - member bank, and is being furnished solely for use by prospective investors in considering participation in the proposed private off eri ng (the “Offering”) of the Company’s subordinated notes (the “Securities”). No representation or warranty as to the accuracy, completeness, or fairness of such information is being made by the Company or any other person, and neither the Company, any of its affiliates nor any other person shall have any liability for any information contained herein, or for any omission s f rom this Presentation or any other written or oral information or communications transmitted or made available to the recipient by the Company or its affiliates or any other person in the cou rse of the recipient’s evaluation of the Company or the Offering. The Securities are not a bank deposit or bank account, and are not, and will not be, insured or guaranteed by the Federal Dep osi t Insurance Corporation (the “FDIC”) or any other federal or state government agency. Neither the Securities nor the investment in the Securities has been approved or disapproved by the Sec urities and Exchange Commission (the “SEC”), the FDIC, the Board of Governors of the Federal Reserve System, the Montana Division of Banking and Financial Institutions, or any othe r f ederal or state regulatory authority, nor has any authority passed upon or endorsed the merits of the Offering or the accuracy or adequacy of this Presentation. Any representation to th e c ontrary is a criminal offense. The Securities referenced in this Presentation have not been registered under the Securities Act of 1933, as amended (the “Securities Act”), or any state sec urities laws, and may not be offered or sold absent registration or an exemption from registration under applicable law. The Securities are being offered only to entities that qualify as an institutional “accredited investor,” as defined in Rule 501 (a)(1) - (3), (7) or (9) of Regulation D promulgated under the Securities Act, or a "qualified institutional buyer" as defined in Rule 144A under the Securities Act. This Presentation does no t constitute an offer to sell, or a solicitation of an offer to buy, any securities of the Company by any person in any jurisdiction in which it is unlawful for such person to make such an offering or solicitation. The Company has authorized Performance Trust Capital Partners, LLC, to act as its sole placement agent in the Offering. The information contained herein is intended only as an outline and summary that has been prepared to assist interested parti es in making their own evaluations of the Offering and the Company. It does not purport to be all - inclusive or to contain all of the information that a prospective investor may desire. Ea ch recipient of the information and data contained herein should perform its own independent investigation and analysis of the Offering and the Company. The information and data contained he rei n are not a substitute for a recipient’s independent evaluation and analysis. In making an investment decision, prospective investors must rely on their own examination of the Company, including the meri ts and risks involved. Prospective investors should consult with their own legal, tax, investment and accounting advisers with respect to the consequences of an investment in the Securi tie s. In the event that any portion of this Presentation is inconsistent with or contrary to any of the terms and conditions of the subordinated note purchase agreement (the “NPA”), the NP A shall control. Except as otherwise indicated, this presentation speaks as of the date hereof. The delivery of this presentation shall not, under any circumstances, create any imp lication that there has been no change in the affairs of the Company after the date hereof, and the Company assumes no obligation to update such information except to the extent required by applicable law. You will be given the opportunity to ask questions of and receive answers from Company representatives concerning the Company ’s business and financial condition and the terms and conditions of the Offering, and the Company may provide you with additional relevant information that you may reasonably requ est to the extent the Company possesses such information or can obtain it without unreasonable effort or expense. Except for information provided in response to such requests, the Compa ny has not authorized any other person to give you information that is not found in this Presentation. If such unauthorized information is obtained or provided, the Company cannot and does no t assume responsibility for its accuracy, credibility, or validity. This Presentation may contain statistics and data that in some cases has been obtained or compiled from information made avai lab le by third - party service providers, including references to the Performance Trust PT Score TM developed by Performance Trust Capital Partners, LLC. The Company makes no representation or warranty, express or implied, wi th respect to the accuracy, reasonableness or completeness of such information. The Company is not providing you with any legal, business, investment, tax or other advice regarding an investment in the Sec uri ties. You should consult with your own advisors to assist you in making your investment decision and to advise you whether you are legally permitted to purchase the Securities. The Co mpa ny reserves the right to withdraw or amend this Offering for any reason and to reject any NPA in whole or in part.
Offering Disclaimer This Presentation has been prepared based on information regarding operations of the Company and the Bank, as well as informa tio n from public sources. The information in this Presentation is confidential and may not be reproduced or redistributed, passed on or divulged, directly or indirectly, to any other person. The Company reserves the right to requ est the return of this Presentation at any time. Any purchase and sale of Securities will be governed solely by the NPA, and the information contained herein will be supersed ed in its entirety by such NPA. This Presentation does not contain all of the information you should consider before investing in the Securities and should not be construed as investment, legal, regulatory or tax advice. The Securities wi ll not initially be registered for public sale and will be subject to significant restrictions and limitations on liquidity. Only potential investors who can bear the risk of an unregistered illiquid investment should consider investment i n t he Securities. Investment in the Securities involves a high degree of risk. The following factors, among others, could cause actual results to differ materially from forward - looking statements or the Company's historical performance: (i) the Securities will be unsecured and subordinated to any future senior indebtedness; (ii) the Securities will not be insured or guaranteed b y t he FDIC, any other governmental agency or the Bank; (iii) the Securities will be structurally subordinated to the indebtedness and other liabilities of the Company, which means that creditors of the Company generally will be paid from the Company’s assets before holders of the Securities would have any claims to those assets; (iv) the Securities do not contain any limitations on our ability to incur additional indebtedness, grant or incur a lien on our asset s, sell or otherwise dispose of assets, pay dividends or repurchase our capital stock; (v) payments on the Securities will depend on receipt of dividends and distributions from the Bank; (vi) we may not be able to generate sufficient cash to s erv ice all of our debt, including the Securities; (vii) regulatory guidelines may restrict our ability to pay the principal of, and accrued and unpaid interest on, the Securities, regardless of whether we are the subject of an insolvency proceeding; an d (viii) holders of the Securities will have limited rights, including limited rights of acceleration, if there is an event of default. This Presentation and oral statements made from time to time by the Company’s representatives may contain “forward - looking state ments" within the meaning of the Private Securities Litigation Reform Act of 1995 that are subject to risks and uncertainties. You should not place undue reliance on those statements because they are subject to numerous risks a nd uncertainties relating to the Company’s consolidated operations and business environment, all of which are difficult to predict and may be beyond our control. Forward - looking statements include information concerning the Company an d the Bank’s future results, interest rates and the interest rate environment, loan and deposit growth, loan performance, operations, employees and business strategy. These statements often include words such as "may," "believe," "exp ect ," "anticipate," "intend," “potential,” “opportunity,” “could,” “project,” “seek,” “should,” “will,” “would,” "plan," "estimate" or other similar expressions. Annualized, pro forma, projected and estimated numbers are used for illustra tiv e purpose only, are not forecasts and may not reflect actual results. Forward - looking statements are not a guarantee of future performance or results, are based on information available at the time the statements are made and involv e k nown and unknown risks, uncertainties and other factors that could cause the Company’s actual results to differ materially from the information in the forward - looking statements and can change as a result of many possible events or f actors, not all of which are known to us or in the Company’s control. These factors include but are not limited to: changes in laws or government regulations or policies affecting financial institutions, including changes in regulatory f ees and capital requirements; general economic conditions and political events, either nationally or in the Company’s market areas, that are worse than expected; the duration and impact of the COVID - 19 pandemic, including but not limite d to the efficiency of the vaccine rollout, new variants, steps taken by governmental and other authorities to contain, mitigate and combat the pandemic, adverse effects on the Company’s employees, customers and third - party service providers, the increase in cyberattacks in the current work - from - home environment, the ultimate extent of the impacts on the Company’s business, financial position, results of operations, liquidity and prospects, continue d d eterioration in general business and economic conditions could adversely affect the Company’s revenues and the values of the Company’s assets and liabilities, lead to a tightening of credit and increase stock price volatility, and p ote ntial impairment charges; competition among depository and other financial institutions; loan demand or residential and commercial real estate values in Montana; the concentration of the Company’s business in Montana; the Company ’s ability to continue to increase and manage the Company’s commercial real estate, commercial business and agricultural loans; the costs and effects of legal, compliance and regulatory actions, changes and developments, in cluding the initiation and resolution of legal proceedings (including any securities, bank operations, consumer or employee litigation); inflation and changes in the interest rate environment that reduce the Company’s margins or re duce the fair value of financial instruments; adverse changes in the securities markets; other economic, governmental, competitive, regulatory and technological factors that may affect the Company’s operations; cyber incidents, or th eft or loss of Company or customer data or money; the effect of the Company’s recent acquisitions, including the failure to achieve expected revenue growth and/or expense savings, the failure to effectively integrate their o per ations and the diversion of management time on issues related to the integration. In addition, future factors related to the proposed transaction between Eagle and First Community Bancorp, Inc. (“FCB”), incl ude , among others: the occurrence of any event, change or other circumstances that could give rise to the right of one or both of the parties to terminate the definitive merger agreement between Eagle and FCB; the outcome of any legal pr oce edings that may be instituted against Eagle or FCB; the possibility that the proposed transaction will not close when expected or at all because required regulatory, shareholder or other approvals are not received or other condition s t o the closing are not satisfied on a timely basis or at all, or are obtained subject to conditions that are not anticipated; the risk that any announcements relating to the proposed combination could have adverse effects on the market pr ice of the common stock of Eagle; the possibility that the anticipated benefits of the transaction will not be realized when expected or at all, including as a result of the impact of, or problems arising from, the integration of the tw o c ompanies or as a result of the strength of the economy and competitive factors in the areas where Eagle and FCB do business; the possibility that the transaction may be more expensive to complete than anticipated, including as a resu lt of unexpected factors or events; diversion of management’s attention from ongoing business operations and opportunities; potential adverse reactions or changes to business or employee relationships, including those resulting fr om the announcement or completion of the transaction; Eagle’s and FCB’s success in executing their respective business plans and strategies and managing the risks involved in the foregoing; and other factors that may affect fut ure results of Eagle and FCB; the business, economic and political conditions in the markets in which the parties operate; the risk that the proposed combination and its announcement could have an adverse effect on either or both p art ies’ ability to retain customers and retain or hire key personnel and maintain relationships with customers; the risk that the proposed combination may be more difficult or time - consuming than anticipated, including in areas such as sale s force, cost containment, asset realization, systems integration and other key strategies; revenues following the proposed combination may be lower than expected, including for possible reasons such as unexpected costs, charg es or expenses resulting from the transactions; the unforeseen risks relating to liabilities of Eagle or FCB that may exist; and uncertainty as to the extent of the duration, scope, and impacts of the COVID - 19 pandemic on FCB, Eagle and the proposed combination. All statements in this Presentation, including forward - looking statements, speak only as of the date they are made. Although the Company believes that these forward - looking statements are based on reasonable assumptions, beliefs and expectations, if a change occurs or the Company’s, assumptions, beliefs, or expectations were incorrect, the Company’s bu sin ess, financial condition, liquidity or results of operations may vary materially from those expressed in such forward - looking statements. New risks and uncertainties arise from time to time, and the Company cannot predict these even ts or how they may affect the Company. The Company has no duty to, and does not intend to, update or revise the forward - looking statements after the date on which they are made. In light of these risks and uncertainties, you shou ld keep in mind that any forward - looking statement made in this Presentation or elsewhere might not reflect the Company’s actual results. This presentation includes certain measures that are not calculated under United States generally accepted accounting princip les (“GAAP”). These non - GAAP financial measures should be considered only as supplemental to, and not superior to, financial measures prepared in accordance with GAAP. 3

Table of Contents Executive Summary 5 I EBMT’s Acquisition of First Community Bancorp, Inc. 14 II Experienced Management Team 19 III Assets Highlights 21 IV Liabilities Highlights 30 V Capital Highlights 34 VI Income Statement Highlights 37 VII 4 Appendix 43 VIII

I. Executive Summary 5

Terms of the Offered Securities 6 Issuer: Eagle Bancorp Montana, Inc., the financial holding company of Opportunity Bank of Montana (the "Bank") Market / Ticker Symbol: NASDAQGM: EBMT Security: Fixed - to - Floating Rate Subordinated Debt Principal Amount : $40 million Offering Type: Regulation D Private Placement with Follow - on Registration Rights Credit Rating: Egan - Jones Rated BBB+ Term: [TBD] 10 - year term, 5 - year no - call period Coupon: [TBD] fixed for 5 years; floating thereafter at [TBD] spread to SOFR Optional Redemption: Redeemable at par beginning 5 years prior to maturity Regulatory Capital: Structured to comply with requirements for Tier 2 capital treatment at the holding company Use of Proceeds: Proceeds will be used for general corporate purposes, including, without limitation, supporting strategic growth (including an announced pending acquisition) and refinance existing debt Expected Closing : January 2022 – Follow - on Registration Rights expected in Q1 2022 Sole Placement Agent: Performance Trust Capital Partners, LLC
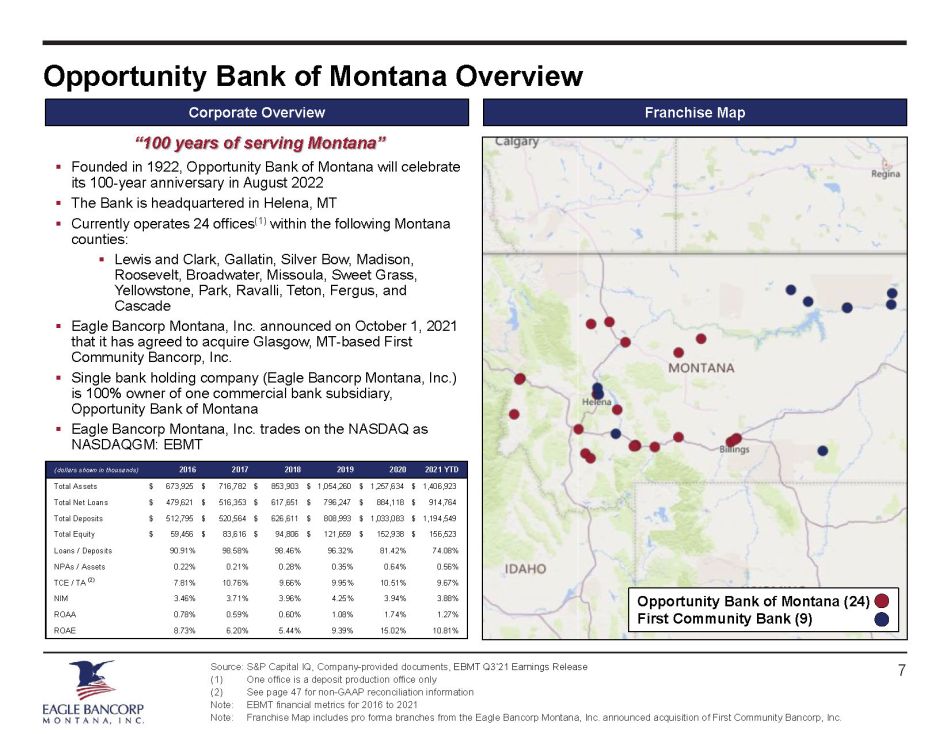
Opportunity Bank of Montana Overview Source: S&P Capital IQ, Company - provided documents, EBMT Q3’21 Earnings Release (1) One office is a deposit production office only (2) See page 47 for non - GAAP reconciliation information Note: EBMT financial metrics for 2016 to 2021 Note: Franchise Map includes pro forma branches from the Eagle Bancorp Montana, Inc. announced acquisition of First Community Ba ncorp, Inc. 7 Franchise Map Corporate Overview ▪ Founded in 1922, Opportunity Bank of Montana will celebrate its 100 - year anniversary in August 2022 ▪ The Bank is headquartered in Helena, MT ▪ Currently operates 24 offices (1) within the following Montana counties: ▪ Lewis and Clark, Gallatin, Silver Bow, Madison, Roosevelt, Broadwater, Missoula, Sweet Grass, Yellowstone, Park, Ravalli, Teton, Fergus, and Cascade ▪ Eagle Bancorp Montana, Inc. announced on October 1, 2021 that it has agreed to acquire Glasgow, MT - based First Community Bancorp, Inc. ▪ Single bank holding company (Eagle Bancorp Montana, Inc.) is 100% owner of one commercial bank subsidiary, Opportunity Bank of Montana ▪ Eagle Bancorp Montana, Inc. trades on the NASDAQ as NASDAQGM: EBMT (dollars shown in thousands) 2016 2017 2018 2019 2020 2021 YTD Total Assets 673,925$ 716,782$ 853,903$ 1,054,260$ 1,257,634$ 1,406,923$ Total Net Loans 479,621$ 516,353$ 617,651$ 796,247$ 884,118$ 914,764$ Total Deposits 512,795$ 520,564$ 626,611$ 808,993$ 1,033,083$ 1,194,549$ Total Equity 59,456$ 83,616$ 94,806$ 121,659$ 152,938$ 156,523$ Loans / Deposits 90.91% 98.58% 98.46% 96.32% 81.42% 74.08% NPAs / Assets 0.22% 0.21% 0.28% 0.35% 0.64% 0.56% TCE / TA (2) 7.81% 10.76% 9.66% 9.95% 10.51% 9.67% NIM 3.46% 3.71% 3.96% 4.25% 3.94% 3.88% ROAA 0.78% 0.59% 0.60% 1.08% 1.74% 1.27% ROAE 8.73% 6.20% 5.44% 9.39% 15.02% 10.81% Opportunity Bank of Montana (24) First Community Bank (9) “100 years of serving Montana”
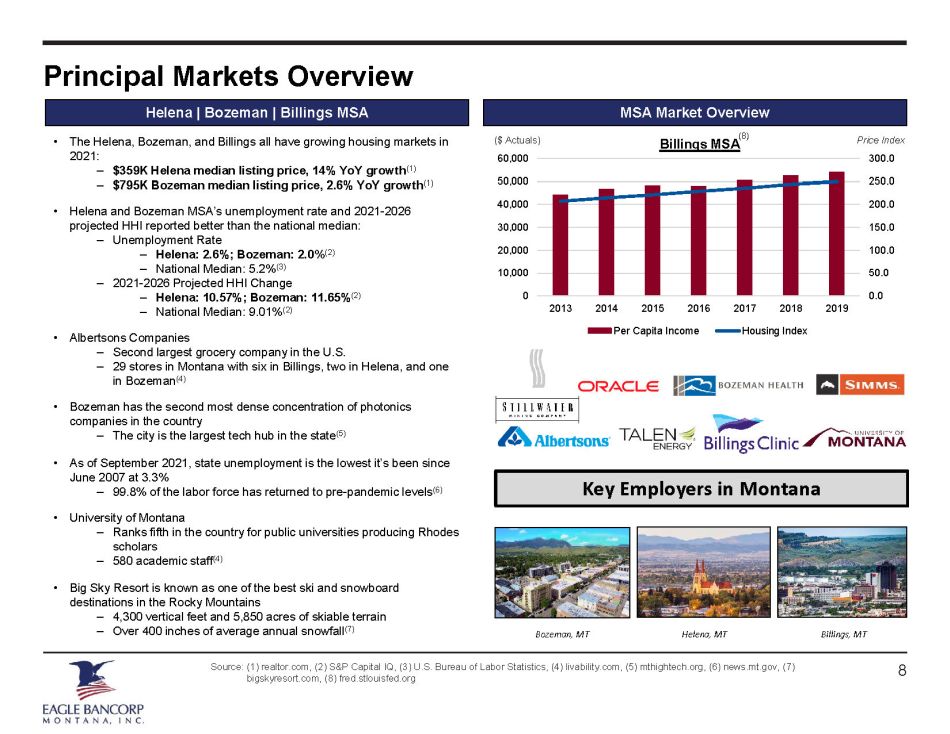
8 Principal Markets Overview Source: (1) realtor.com, (2) S&P Capital IQ, (3) U.S. Bureau of Labor Statistics, (4) livability.com, (5) mthightech.org, (6) ne ws.mt.gov, (7) bigskyresort.com, (8) fred.stlouisfed.org Helena | Bozeman | Billings MSA MSA Market Overview Billings MSA 0.0 50.0 100.0 150.0 200.0 250.0 300.0 0 10,000 20,000 30,000 40,000 50,000 60,000 2013 2014 2015 2016 2017 2018 2019 Per Capita Income Housing Index ($ Actuals) Price Index • The Helena, Bozeman, and Billings all have growing housing markets in 2021: – $359K Helena median listing price, 14% YoY growth (1) – $795K Bozeman median listing price, 2.6% YoY growth (1) • Helena and Bozeman MSA’s unemployment rate and 2021 - 2026 projected HHI reported better than the national median: – Unemployment Rate – Helena: 2.6%; Bozeman: 2.0 % (2) – National Median: 5.2% (3) – 2021 - 2026 Projected HHI Change – Helena: 10.57%; Bozeman: 11.65% (2) – National Median: 9.01% (2) • Albertsons Companies – Second largest grocery company in the U.S. – 29 stores in Montana with six in Billings, two in Helena, and one in Bozeman (4) • Bozeman has the second most dense concentration of photonics companies in the country – The city is the largest tech hub in the state (5) • As of September 2021, state unemployment is the lowest it’s been since June 2007 at 3.3% – 99.8% of the labor force has returned to pre - pandemic levels (6) • University of Montana – Ranks fifth in the country for public universities producing Rhodes scholars – 580 academic staff (4) • Big Sky Resort is known as one of the best ski and snowboard destinations in the Rocky Mountains – 4,300 vertical feet and 5,850 acres of skiable terrain – Over 400 inches of average annual snowfall (7) Bozeman, MT Helena, MT Billings, MT (4) (8) Key Employers in Montana
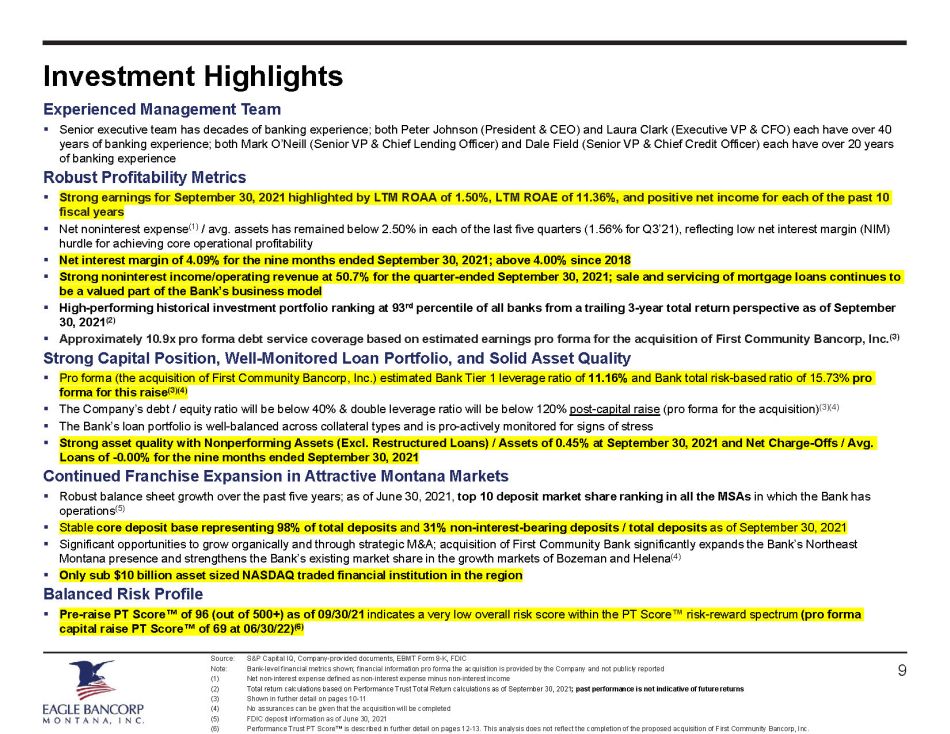
Investment Highlights Source: S&P Capital IQ, Company - provided documents, EBMT Form 8 - K, FDIC Note: Bank - level financial metrics shown; financial information pro forma the acquisition is provided by the Company and not pub licly reported (1) Net non - interest expense defined as non - interest expense minus non - interest income (2) Total return calculations based on Performance Trust Total Return calculations as of September 30, 2021 ; past performance is not indicative of future returns (3) Shown in further detail on pages 10 - 11 (4) No assurances can be given that the acquisition will be completed (5) FDIC deposit information as of June 30, 2021 (6) Performance Trust PT Score Œ is described in further detail on pages 12 - 13. This analysis does not reflect the completion of the proposed acquisition of Fir st Community Bancorp, Inc. 9 Experienced Management Team ▪ Senior executive team has decades of banking experience; both Peter Johnson (President & CEO) and Laura Clark (Executive VP & CF O) each have over 40 years of banking experience; both Mark O’Neill (Senior VP & Chief Lending Officer) and Dale Field (Senior VP & Chief Credit O ffi cer) each have over 20 years of banking experience Robust Profitability Metrics ▪ Strong earnings for September 30, 2021 highlighted by LTM ROAA of 1.50%, LTM ROAE of 11.36%, and positive net income for each of the past 10 fiscal years ▪ Net noninterest expense (1) / avg. assets has remained below 2.50% in each of the last five quarters (1.56% for Q3’21), reflecting low net interest margi n (NIM) hurdle for achieving core operational profitability ▪ Net interest margin of 4.09% for the nine months ended September 30, 2021; above 4.00% since 2018 ▪ Strong noninterest income/operating revenue at 50.7% for the quarter - ended September 30, 2021; sale and servicing of mortgage lo ans continues to be a valued part of the Bank’s business model ▪ High - performing historical investment portfolio ranking at 93 rd percentile of all banks from a trailing 3 - year total return perspective as of September 30, 2021 (2) ▪ Approximately 10.9x pro forma debt service coverage based on estimated earnings pro forma for the acquisition of First Commun ity Bancorp, Inc. (3) Strong Capital Position, Well - Monitored Loan Portfolio, and Solid Asset Quality ▪ Pro forma (the acquisition of First Community Bancorp, Inc.) estimated Bank Tier 1 leverage ratio of 11.16% and Bank total risk - based ratio of 15.73% pro forma for this raise (3)(4) ▪ The Company’s debt / equity ratio will be below 40% & double leverage ratio will be below 120% post - capital raise (pro forma for the acquisition) (3)(4) ▪ The Bank’s loan portfolio is well - balanced across collateral types and is pro - actively monitored for signs of stress ▪ Strong asset quality with Nonperforming Assets (Excl. Restructured Loans) / Assets of 0.45% at September 30, 2021 and Net Cha rge - Offs / Avg. Loans of - 0.00% for the nine months ended September 30, 2021 Continued Franchise Expansion in Attractive Montana Markets ▪ Robust balance sheet growth over the past five years; as of June 30, 2021, top 10 deposit market share ranking in all the MSAs in which the Bank has operations (5) ▪ Stable core deposit base representing 98% of total deposits and 31% non - interest - bearing deposits / total deposits as of September 30, 2021 ▪ Significant opportunities to grow organically and through strategic M&A; acquisition of First Community Bank significantly ex pan ds the Bank’s Northeast Montana presence and strengthens the Bank’s existing market share in the growth markets of Bozeman and Helena (4) ▪ Only sub $10 billion asset sized NASDAQ traded financial institution in the region Balanced Risk Profile ▪ Pre - raise PT Score Œ of 96 (out of 500+) as of 09/30/21 indicates a very low overall risk score within the PT Score Œ risk - reward spectrum (pro forma capital raise PT Score Œ of 69 at 06/30/22) (6)

$157,229 $10,000 $15,000 $5,000 $12,200 $157,229 $15,000 $5,000 $40,000 $12,200 Common Equity Tier 1 Capital Senior Debt Existing Sub Debt Trust Preferred New Sub Debt ALLL Pro Forma Bank Level Pro Forma Regulatory Capital 09/30/21 Common Equity Before Adjustments 218,978$ Less: Goodwill & Intangible Assets Net of DTLs 20,798 Less: Other Intangible Assets Net of DTLs 2,855 Less: DTAs from NOLs and Tax Credits – Less: AOCI - Unrealized Gains/Def Ben Plans 4,458 Common Equity Tier 1 Capital 190,867 Additional Tier 1 Capital – Total Tier 1 Capital 190,867 Tier 2 Capital Instruments -$ ALLL Includable in Tier 2 Capital 12,200 Total Tier 2 Capital 12,200 Total Capital 203,067 Average Total Assets 1,734,105 Less: Deductions from CET1 and Additional T1 23,653 Less: Other Deductions from Leverage Ratio – Total Assets for Leverage Ratio 1,710,452 Total Risk-Weighted Assets 1,290,757 Common Equity Tier 1 Ratio 14.79% Leverage Ratio 11.16% Tier 1 Risk-Based Ratio 14.79% Total Risk-Based Capital Ratio 15.73% Pro Forma Consolidated Pro Forma Regulatory Capital 09/30/21 Common Equity Before Adjustments 185,386$ Less: Goodwill & Intangible Assets Net of DTLs 20,798 Less: Other Intangible Assets Net of DTLs 2,855 Less: DTAs from NOLs and Tax Credits – Less: AOCI - Unrealized Gains/Def Ben Plans 4,504 Common Equity Tier 1 Capital 157,229 Additional Tier 1 Capital 5,000 Total Tier 1 Capital 162,229 Tier 2 Capital Instruments 55,000$ ALLL Includable in Tier 2 Capital 12,200 Total Tier 2 Capital 67,200 Total Capital 229,429 Average Total Consolidated Assets 1,750,678 Less: Deductions from CET1 and Additional T1 23,653 Less: Other Deductions from Leverage Ratio – Total Assets for Leverage Ratio 1,727,025 Total Risk-Weighted Assets 1,293,930 Common Equity Tier 1 Ratio 12.15% Leverage Ratio 9.39% Tier 1 Risk-Based Ratio 12.54% Total Risk-Based Capital Ratio 17.73% Pro Forma Capital Structure & Regulatory Capital Ratios At September 30, 2021 Pro Forma Note: For illustrative purposes, Bank capital ratios assume $10 million of the $40 million will be used to fund the cash portion of the pending acquisition, $10 million will be used to refinance existing senior debt, $15 million will be held at the Company, and the remaining $5 million of proceeds raised will be down - streamed to the Bank as common equity immediately. Existing Holding Company Debt: • Senior Unsecured Notes : Issued in February 2017, principal amount of $10 million with a 5.75% fixed rate due in 2022. • Subordinated Notes : Issued in June 2020, principal amount of $15 million with a 5.5% fixed to floating rate. Starting July 2025, interest will accrue at a floating rate per annum equal to three - month SOFR plus 509.0 bps, payable quarterly. The new subordinated debt raised is ranked equally with this existing subordinated debt. 10 Source: S&P Capital IQ, Company - provided documents, Form S - 4 Note: Capital Structure graph and consolidated and bank level regulatory capital ratios shown pro forma for the acquisition of F irst Community Bank Note: Does not include impact of assumed deal expenses Note: Financial information pro forma the acquisition is provided by the Company and not publicly reported Note: No assurances can be given that the acquisition will be completed
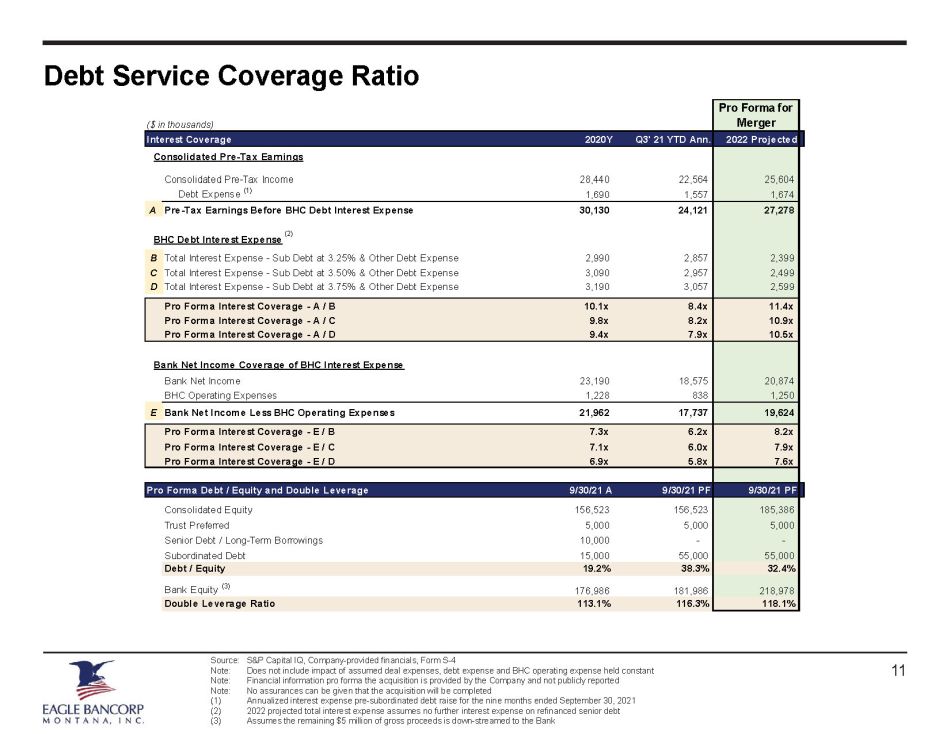
Debt Service Coverage Ratio 11 ($ in thousands) Interest Coverage 2020Y Q3' 21 YTD Ann. 2022 Projected Consolidated Pre-Tax Earnings Consolidated Pre-Tax Income 28,440 22,564 25,604 Debt Expense (1) 1,690 1,557 1,674 A Pre-Tax Earnings Before BHC Debt Interest Expense 30,130 24,121 27,278 BHC Debt Interest Expense B Total Interest Expense - Sub Debt at 3.25% & Other Debt Expense 2,990 2,857 2,399 C Total Interest Expense - Sub Debt at 3.50% & Other Debt Expense 3,090 2,957 2,499 D Total Interest Expense - Sub Debt at 3.75% & Other Debt Expense 3,190 3,057 2,599 Pro Forma Interest Coverage - A / B 10.1x 8.4x 11.4x Pro Forma Interest Coverage - A / C 9.8x 8.2x 10.9x Pro Forma Interest Coverage - A / D 9.4x 7.9x 10.5x Bank Net Income Coverage of BHC Interest Expense Bank Net Income 23,190 18,575 20,874 BHC Operating Expenses 1,228 838 1,250 E Bank Net Income Less BHC Operating Expenses 21,962 17,737 19,624 Pro Forma Interest Coverage - E / B 7.3x 6.2x 8.2x Pro Forma Interest Coverage - E / C 7.1x 6.0x 7.9x Pro Forma Interest Coverage - E / D 6.9x 5.8x 7.6x Pro Forma Debt / Equity and Double Leverage 9/30/21 A 9/30/21 PF 9/30/21 PF Consolidated Equity 156,523 156,523 185,386 Trust Preferred 5,000 5,000 5,000 Senior Debt / Long-Term Borrowings 10,000 - - Subordinated Debt 15,000 55,000 55,000 Debt / Equity 19.2% 38.3% 32.4% Bank Equity (3) 176,986 181,986 218,978 Double Leverage Ratio 113.1% 116.3% 118.1% Pro Forma for Merger (2) Source: S&P Capital IQ, Company - provided financials, Form S - 4 Note: Does not include impact of assumed deal expenses, debt expense and BHC operating expense held constant Note: Financial information pro forma the acquisition is provided by the Company and not publicly reported Note: No assurances can be given that the acquisition will be completed (1) Annualized interest expense pre - subordinated debt raise for the nine months ended September 30, 2021 (2) 2022 projected total interest expense assumes no further interest expense on refinanced senior debt (3) Assumes the remaining $5 million of gross proceeds is down - streamed to the Bank
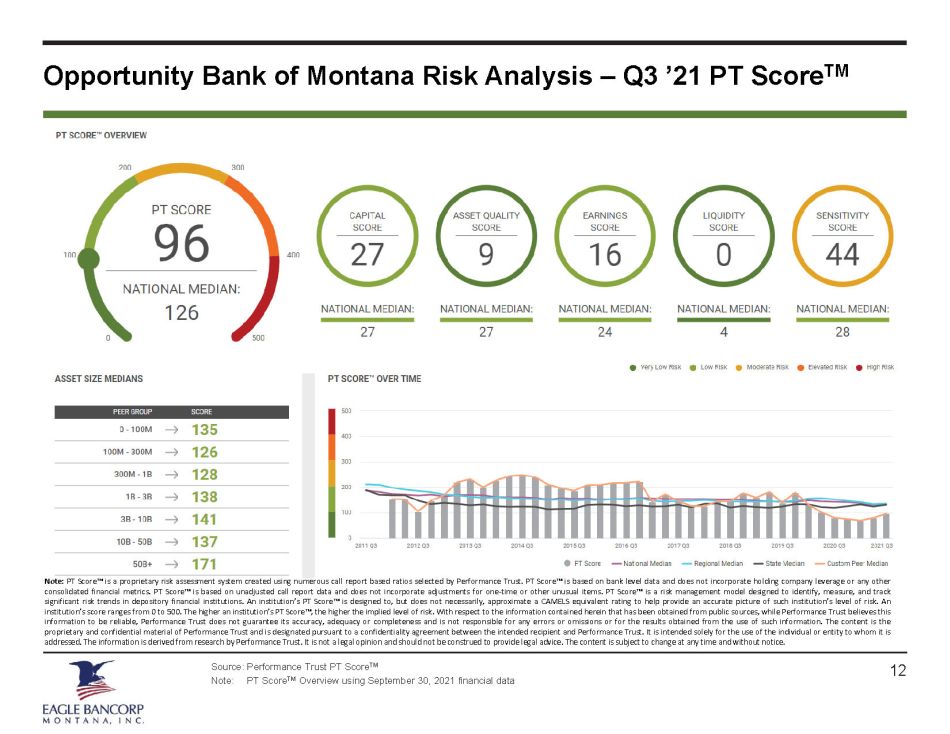
Opportunity Bank of Montana Risk Analysis – Q3 ’21 PT Score TM Source: Performance Trust PT Score TM Note: PT Score TM Overview using September 30, 2021 financial data Note : PT Score Ρ is a proprietary risk assessment system created using numerous call report based ratios selected by Performance Trust . PT Score Ρ is based on bank level data and does not incorporate holding company leverage or any other consolidated financial metrics . PT Score Ρ is based on unadjusted call report data and does not incorporate adjustments for one - time or other unusual items . PT Score Ρ is a risk management model designed to identify, measure, and track significant risk trends in depository financial institutions . An institution’s PT Score Ρ is designed to, but does not necessarily, approximate a CAMELS equivalent rating to help provide an accurate picture of such institution’s level of risk . An institution’s score ranges from 0 to 500 . The higher an institution’s PT Score Ρ , the higher the implied level of risk . With respect to the information contained herein that has been obtained from public sources, while Performance Trust believes this information to be reliable, Performance Trust does not guarantee its accuracy, adequacy or completeness and is not responsible for any errors or omissions or for the results obtained from the use of such information . The content is the proprietary and confidential material of Performance Trust and is designated pursuant to a confidentiality agreement between the intended recipient and Performance Trust . It is intended solely for the use of the individual or entity to whom it is addressed . The information is derived from research by Performance Trust . It is not a legal opinion and should not be construed to provide legal advice . The content is subject to change at any time and without notice . 12
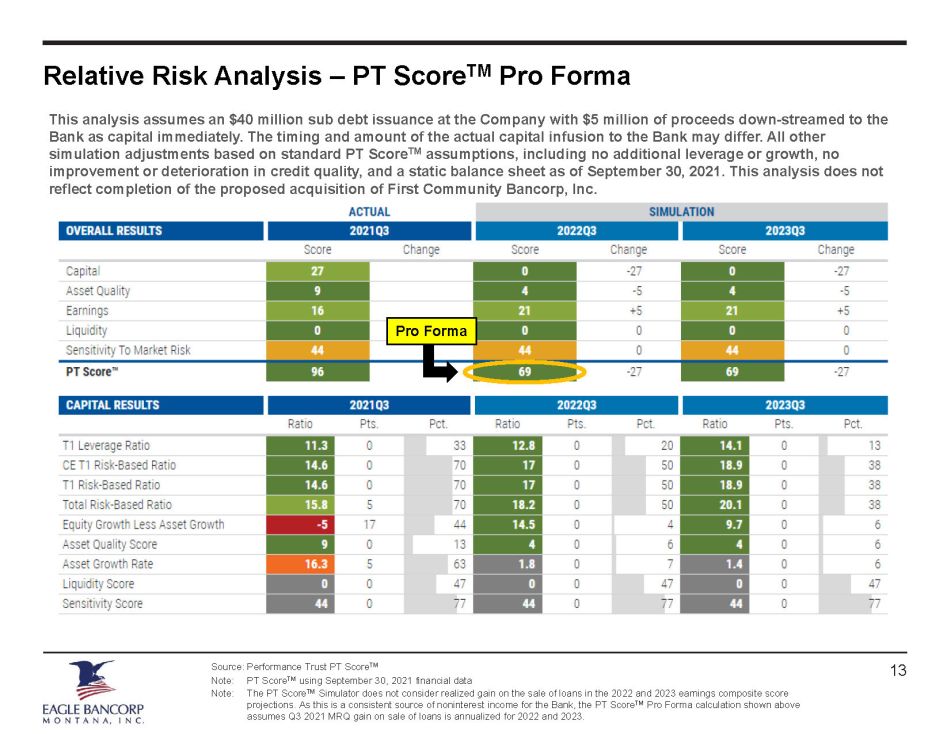
Relative Risk Analysis – PT Score TM Pro Forma Source: Performance Trust PT Score TM Note: PT Score TM using September 30, 2021 financial data Note: The PT Score TM Simulator does not consider realized gain on the sale of loans in the 2022 and 2023 earnings composite score projections. As this is a consistent source of noninterest income for the Bank, the PT Score TM Pro Forma calculation shown above assumes Q3 2021 MRQ gain on sale of loans is annualized for 2022 and 2023. 13 This analysis assumes an $40 million sub debt issuance at the Company with $5 million of proceeds down - streamed to the Bank as capital immediately. The timing and amount of the actual capital infusion to the Bank may differ. All other simulation adjustments based on standard PT Score TM assumptions, including no additional leverage or growth, no improvement or deterioration in credit quality, and a static balance sheet as of September 30, 2021. This analysis does not reflect completion of the proposed acquisition of First Community Bancorp, Inc. Pro Forma
II. EBMT’s Acquisition of First Community Bancorp, Inc. 14

Eagle’s Acquisition of First Community Bancorp, Inc. Source: EBMT Form 8 - K, EBMT Form S - 4, S&P Capital IQ Note: No assurances can be given that the acquisition will be completed (1) Bank - level financial metrics derived from Bank call reports (2) Based on EBMT closing price of $22.25 as of September 30, 2021 15 Financial Highlights – First Community Bank (1) History and Franchise Highlights – First Community Bank ▪ Established by the Lewis Brothers in 1891, First Community Bank is one of the longest standing charters in Montana ▪ Headquartered in Glasgow, Montana, First Community is the largest bank in Northeast Montana with $374 million in total assets, operating nine branches and two mortgage LPOs ▪ Experienced and respected agricultural leader with deep ties to the Northeast Montana agricultural market ▪ Expanded the footprint in the 2000’s into the high growth and less agriculturally focused Montana markets of Helena and Three Forks (Gallatin County) ▪ Established a mortgage banking division in 2007 to take advantage of growth in the Helena and Bozeman real estate markets ▪ Strong management team with decades of experience Franchise Map Transaction Highlights ▪ Eagle Bancorp Montana, Inc., the holding company for Opportunity Bank of Montana has entered into an agreement to acquire First Community Bancorp Inc., the holding company for First Community Bank ▪ Continues Eagle’s focused M&A strategy – announced transaction is Eagle’s fourth in Montana since 2017 and the largest to date ▪ Acquisition provides valuable scale and further solidifies Eagle’s position as the fourth largest bank headquartered in Montana ▪ Pro forma bank will have approximately $1.78 billion in total assets and operate 32 branches ▪ Financially attractive to Eagle Bancorp Montana, Inc.: ▪ Anticipated 11.2% EPS accretion in 2022 ▪ Tangible book value payback of ~3.8 years ▪ Internal rate of return above 20% ▪ Estimated closing in Q1 2022 ▪ Aggregate deal value of $41.3 million (2) EBMT First Community Bank (dollars shown in thousands) 2019 2020 Q3 '21 YTD Total Assets 302,420$ 344,587$ 376,815$ Total Loans 188,671$ 202,930$ 211,605$ Total Deposits 246,393$ 282,434$ 309,587$ Total Equity 35,621$ 39,926$ 41,928$ Loans / Deposits 76.57% 71.85% 68.35% NPAs / Assets 0.70% 0.64% 0.30% TCE / TA 11.51% 11.35% 10.91% Risk Based Capital Ratio 16.80% 16.70% 16.86% NIM 4.04% 3.91% 4.11% ROAA 1.00% 1.30% 1.60% ROAE 8.69% 11.34% 14.29% Efficiency Ratio 74.7% 65.8% 61.9%
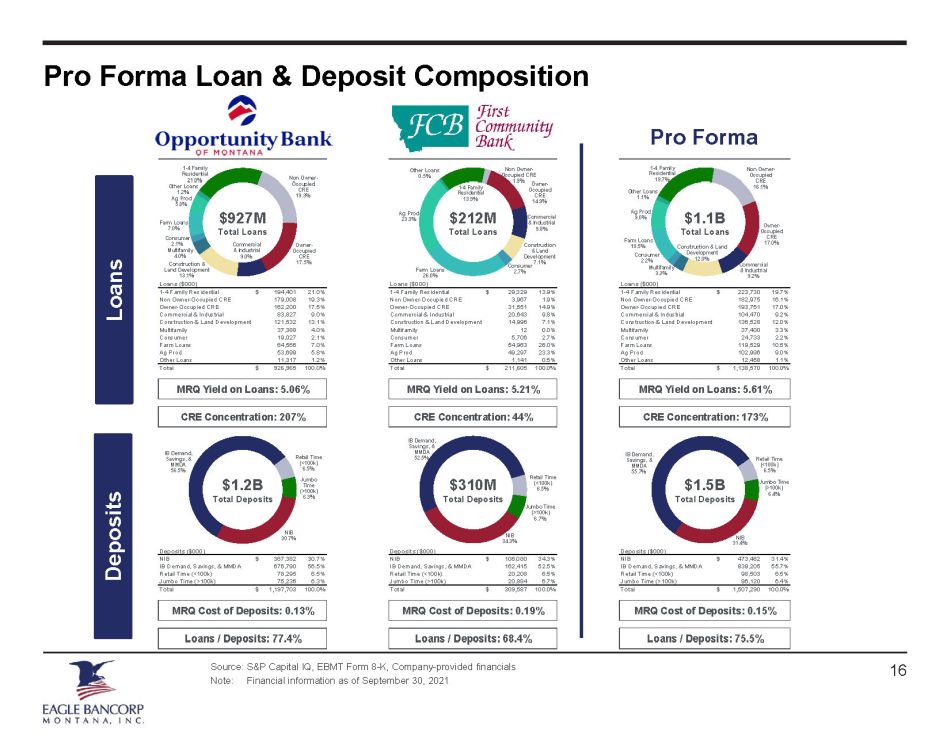
Pro Forma Loan & Deposit Composition Source: S&P Capital IQ, EBMT Form 8 - K, Company - provided financials Note: Financial information as of September 30, 2021 16 Deposits Loans Pro Forma $927M $212M $1.1B Total Loans Total Loans Total Loans Loans ($000) Loans ($000) Loans ($000) 1-4 Family Residential 194,401$ 21.0% 1-4 Family Residential 29,329$ 13.9% 1-4 Family Residential 223,730$ 19.7% Non Owner-Occupied CRE 179,008 19.3% Non Owner-Occupied CRE 3,967 1.9% Non Owner-Occupied CRE 182,975 16.1% Owner-Occupied CRE 162,200 17.5% Owner-Occupied CRE 31,551 14.9% Owner-Occupied CRE 193,751 17.0% Commercial & Industrial 83,827 9.0% Commercial & Industrial 20,643 9.8% Commercial & Industrial 104,470 9.2% Construction & Land Development 121,532 13.1% Construction & Land Development 14,996 7.1% Construction & Land Development 136,528 12.0% Multifamily 37,388 4.0% Multifamily 12 0.0% Multifamily 37,400 3.3% Consumer 19,027 2.1% Consumer 5,706 2.7% Consumer 24,733 2.2% Farm Loans 64,566 7.0% Farm Loans 54,963 26.0% Farm Loans 119,529 10.5% Ag Prod 53,699 5.8% Ag Prod 49,297 23.3% Ag Prod 102,996 9.0% Other Loans 11,317 1.2% Other Loans 1,141 0.5% Other Loans 12,458 1.1% Total 926,965$ 100.0% Total 211,605$ 100.0% Total 1,138,570$ 100.0% MRQ Yield on Loans: 5.06% MRQ Yield on Loans: 5.21% MRQ Yield on Loans: 5.61% CRE Concentration: 207% CRE Concentration: 44% CRE Concentration: 173% $1.2B $310M $1.5B Total Deposits Total Deposits Total Deposits Deposits ($000) Deposits ($000) Deposits ($000) NIB 367,382$ 30.7% NIB 106,080$ 34.3% NIB 473,462$ 31.4% IB Demand, Savings, & MMDA 676,790 56.5% IB Demand, Savings, & MMDA 162,415 52.5% IB Demand, Savings, & MMDA 839,205 55.7% Retail Time (<100k) 78,295 6.5% Retail Time (<100k) 20,208 6.5% Retail Time (<100k) 98,503 6.5% Jumbo Time (>100k) 75,236 6.3% Jumbo Time (>100k) 20,884 6.7% Jumbo Time (>100k) 96,120 6.4% Total 1,197,703$ 100.0% Total 309,587$ 100.0% Total 1,507,290$ 100.0% MRQ Cost of Deposits: 0.13% MRQ Cost of Deposits: 0.19% MRQ Cost of Deposits: 0.15% Loans / Deposits: 77.4% Loans / Deposits: 68.4% Loans / Deposits: 75.5% NIB 34.3% IB Demand, Savings, & MMDA 52.5% Retail Time (<100k) 6.5% Jumbo Time (>100k) 6.7% 1 - 4 Family Residential 21.0% Non Owner - Occupied CRE 19.3% Owner - Occupied CRE 17.5% Commercial & Industrial 9.0% Construction & Land Development 13.1% Multifamily 4.0% Consumer 2.1% Farm Loans 7.0% Ag Prod 5.8% Other Loans 1.2% 1 - 4 Family Residential 19.7% Non Owner - Occupied CRE 16.1% Owner - Occupied CRE 17.0% Commercial & Industrial 9.2% Construction & Land Development 12.0% Multifamily 3.3% Consumer 2.2% Farm Loans 10.5% Ag Prod 9.0% Other Loans 1.1% 1 - 4 Family Residential 13.9% Non Owner - Occupied CRE 1.9% Owner - Occupied CRE 14.9% Commercial & Industrial 9.8% Construction & Land Development 7.1% Consumer 2.7% Farm Loans 26.0% Ag Prod 23.3% Other Loans 0.5% NIB 31.4% IB Demand, Savings, & MMDA 55.7% Retail Time (<100k) 6.5% Jumbo Time (>100k) 6.4% NIB 30.7% IB Demand, Savings, & MMDA 56.5% Retail Time (<100k) 6.5% Jumbo Time (>100k) 6.3% $927M $212M $1.1B Total Loans Total Loans Total Loans Loans ($000) Loans ($000) Loans ($000) 1-4 Family Residential 194,401$ 21.0% 1-4 Family Residential 29,329$ 13.9% 1-4 Family Residential 223,730$ 19.7% Non Owner-Occupied CRE 179,008 19.3% Non Owner-Occupied CRE 3,967 1.9% Non Owner-Occupied CRE 182,975 16.1% Owner-Occupied CRE 162,200 17.5% Owner-Occupied CRE 31,551 14.9% Owner-Occupied CRE 193,751 17.0% Commercial & Industrial 83,827 9.0% Commercial & Industrial 20,643 9.8% Commercial & Industrial 104,470 9.2% Construction & Land Development 121,532 13.1% Construction & Land Development 14,996 7.1% Construction & Land Development 136,528 12.0% Multifamily 37,388 4.0% Multifamily 12 0.0% Multifamily 37,400 3.3% Consumer 19,027 2.1% Consumer 5,706 2.7% Consumer 24,733 2.2% Farm Loans 64,566 7.0% Farm Loans 54,963 26.0% Farm Loans 119,529 10.5% Ag Prod 53,699 5.8% Ag Prod 49,297 23.3% Ag Prod 102,996 9.0% Other Loans 11,317 1.2% Other Loans 1,141 0.5% Other Loans 12,458 1.1% Total 926,965$ 100.0% Total 211,605$ 100.0% Total 1,138,570$ 100.0% MRQ Yield on Loans: 5.06% MRQ Yield on Loans: 5.21% MRQ Yield on Loans: 5.61% CRE Concentration: 207% CRE Concentration: 44% CRE Concentration: 173% $1.2B $310M $1.5B Total Deposits Total Deposits Total Deposits Deposits ($000) Deposits ($000) Deposits ($000) NIB 367,382$ 30.7% NIB 106,080$ 34.3% NIB 473,462$ 31.4% IB Demand, Savings, & MMDA 676,790 56.5% IB Demand, Savings, & MMDA 162,415 52.5% IB Demand, Savings, & MMDA 839,205 55.7% Retail Time (<100k) 78,295 6.5% Retail Time (<100k) 20,208 6.5% Retail Time (<100k) 98,503 6.5% Jumbo Time (>100k) 75,236 6.3% Jumbo Time (>100k) 20,884 6.7% Jumbo Time (>100k) 96,120 6.4% Total 1,197,703$ 100.0% Total 309,587$ 100.0% Total 1,507,290$ 100.0% MRQ Cost of Deposits: 0.13% MRQ Cost of Deposits: 0.19% MRQ Cost of Deposits: 0.15% Loans / Deposits: 77.4% Loans / Deposits: 68.4% Loans / Deposits: 75.5% NIB 34.3% IB Demand, Savings, & MMDA 52.5% Retail Time (<100k) 6.5% Jumbo Time (>100k) 6.7% 1 - 4 Family Residential 21.0% Non Owner - Occupied CRE 19.3% Owner - Occupied CRE 17.5% Commercial & Industrial 9.0% Construction & Land Development 13.1% Multifamily 4.0% Consumer 2.1% Farm Loans 7.0% Ag Prod 5.8% Other Loans 1.2% 1 - 4 Family Residential 19.7% Non Owner - Occupied CRE 16.1% Owner - Occupied CRE 17.0% Commercial & Industrial 9.2% Construction & Land Development 12.0% Multifamily 3.3% Consumer 2.2% Farm Loans 10.5% Ag Prod 9.0% Other Loans 1.1% 1 - 4 Family Residential 13.9% Non Owner - Occupied CRE 1.9% Owner - Occupied CRE 14.9% Commercial & Industrial 9.8% Construction & Land Development 7.1% Consumer 2.7% Farm Loans 26.0% Ag Prod 23.3% Other Loans 0.5% NIB 31.4% IB Demand, Savings, & MMDA 55.7% Retail Time (<100k) 6.5% Jumbo Time (>100k) 6.4% NIB 30.7% IB Demand, Savings, & MMDA 56.5% Retail Time (<100k) 6.5% Jumbo Time (>100k) 6.3% $927M $212M $1.1B Total Loans Total Loans Total Loans Loans ($000) Loans ($000) Loans ($000) 1-4 Family Residential 194,401$ 21.0% 1-4 Family Residential 29,329$ 13.9% 1-4 Family Residential 223,730$ 19.7% Non Owner-Occupied CRE 179,008 19.3% Non Owner-Occupied CRE 3,967 1.9% Non Owner-Occupied CRE 182,975 16.1% Owner-Occupied CRE 162,200 17.5% Owner-Occupied CRE 31,551 14.9% Owner-Occupied CRE 193,751 17.0% Commercial & Industrial 83,827 9.0% Commercial & Industrial 20,643 9.8% Commercial & Industrial 104,470 9.2% Construction & Land Development 121,532 13.1% Construction & Land Development 14,996 7.1% Construction & Land Development 136,528 12.0% Multifamily 37,388 4.0% Multifamily 12 0.0% Multifamily 37,400 3.3% Consumer 19,027 2.1% Consumer 5,706 2.7% Consumer 24,733 2.2% Farm Loans 64,566 7.0% Farm Loans 54,963 26.0% Farm Loans 119,529 10.5% Ag Prod 53,699 5.8% Ag Prod 49,297 23.3% Ag Prod 102,996 9.0% Other Loans 11,317 1.2% Other Loans 1,141 0.5% Other Loans 12,458 1.1% Total 926,965$ 100.0% Total 211,605$ 100.0% Total 1,138,570$ 100.0% MRQ Yield on Loans: 5.06% MRQ Yield on Loans: 5.21% MRQ Yield on Loans: 5.61% CRE Concentration: 207% CRE Concentration: 44% CRE Concentration: 173% $1.2B $310M $1.5B Total Deposits Total Deposits Total Deposits Deposits ($000) Deposits ($000) Deposits ($000) NIB 367,382$ 30.7% NIB 106,080$ 34.3% NIB 473,462$ 31.4% IB Demand, Savings, & MMDA 676,790 56.5% IB Demand, Savings, & MMDA 162,415 52.5% IB Demand, Savings, & MMDA 839,205 55.7% Retail Time (<100k) 78,295 6.5% Retail Time (<100k) 20,208 6.5% Retail Time (<100k) 98,503 6.5% Jumbo Time (>100k) 75,236 6.3% Jumbo Time (>100k) 20,884 6.7% Jumbo Time (>100k) 96,120 6.4% Total 1,197,703$ 100.0% Total 309,587$ 100.0% Total 1,507,290$ 100.0% MRQ Cost of Deposits: 0.13% MRQ Cost of Deposits: 0.19% MRQ Cost of Deposits: 0.15% Loans / Deposits: 77.4% Loans / Deposits: 68.4% Loans / Deposits: 75.5% NIB 34.3% IB Demand, Savings, & MMDA 52.5% Retail Time (<100k) 6.5% Jumbo Time (>100k) 6.7% 1 - 4 Family Residential 21.0% Non Owner - Occupied CRE 19.3% Owner - Occupied CRE 17.5% Commercial & Industrial 9.0% Construction & Land Development 13.1% Multifamily 4.0% Consumer 2.1% Farm Loans 7.0% Ag Prod 5.8% Other Loans 1.2% 1 - 4 Family Residential 19.7% Non Owner - Occupied CRE 16.1% Owner - Occupied CRE 17.0% Commercial & Industrial 9.2% Construction & Land Development 12.0% Multifamily 3.3% Consumer 2.2% Farm Loans 10.5% Ag Prod 9.0% Other Loans 1.1% 1 - 4 Family Residential 13.9% Non Owner - Occupied CRE 1.9% Owner - Occupied CRE 14.9% Commercial & Industrial 9.8% Construction & Land Development 7.1% Consumer 2.7% Farm Loans 26.0% Ag Prod 23.3% Other Loans 0.5% NIB 31.4% IB Demand, Savings, & MMDA 55.7% Retail Time (<100k) 6.5% Jumbo Time (>100k) 6.4% NIB 30.7% IB Demand, Savings, & MMDA 56.5% Retail Time (<100k) 6.5% Jumbo Time (>100k) 6.3%
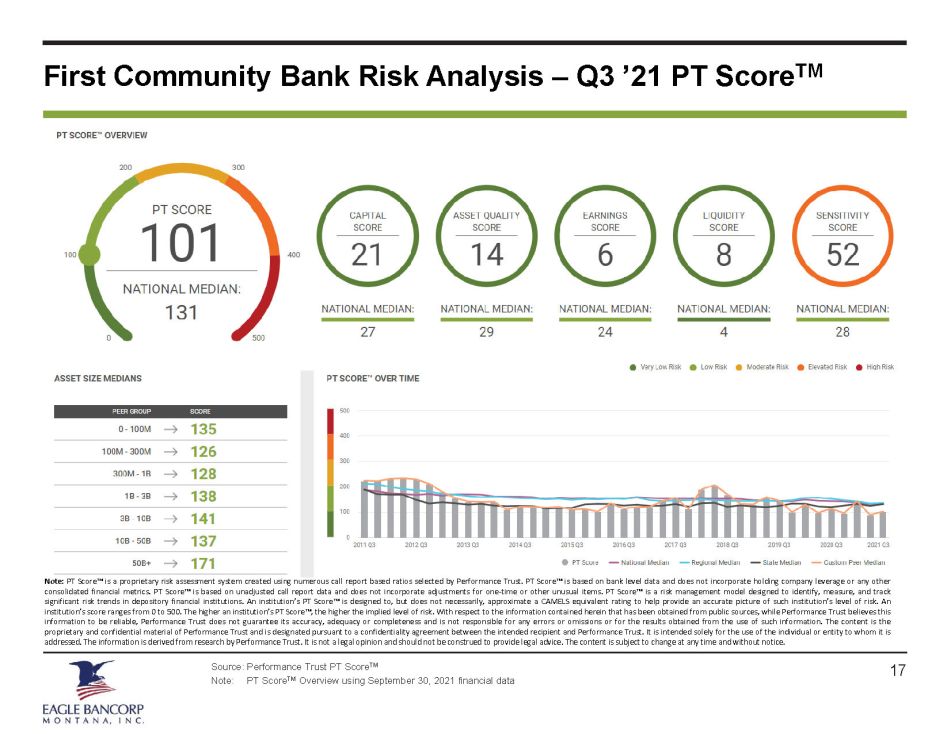
First Community Bank Risk Analysis – Q3 ’21 PT Score TM Source: Performance Trust PT Score TM Note: PT Score TM Overview using September 30, 2021 financial data Note : PT Score Ρ is a proprietary risk assessment system created using numerous call report based ratios selected by Performance Trust . PT Score Ρ is based on bank level data and does not incorporate holding company leverage or any other consolidated financial metrics . PT Score Ρ is based on unadjusted call report data and does not incorporate adjustments for one - time or other unusual items . PT Score Ρ is a risk management model designed to identify, measure, and track significant risk trends in depository financial institutions . An institution’s PT Score Ρ is designed to, but does not necessarily, approximate a CAMELS equivalent rating to help provide an accurate picture of such institution’s level of risk . An institution’s score ranges from 0 to 500 . The higher an institution’s PT Score Ρ , the higher the implied level of risk . With respect to the information contained herein that has been obtained from public sources, while Performance Trust believes this information to be reliable, Performance Trust does not guarantee its accuracy, adequacy or completeness and is not responsible for any errors or omissions or for the results obtained from the use of such information . The content is the proprietary and confidential material of Performance Trust and is designated pursuant to a confidentiality agreement between the intended recipient and Performance Trust . It is intended solely for the use of the individual or entity to whom it is addressed . The information is derived from research by Performance Trust . It is not a legal opinion and should not be construed to provide legal advice . The content is subject to change at any time and without notice . 17
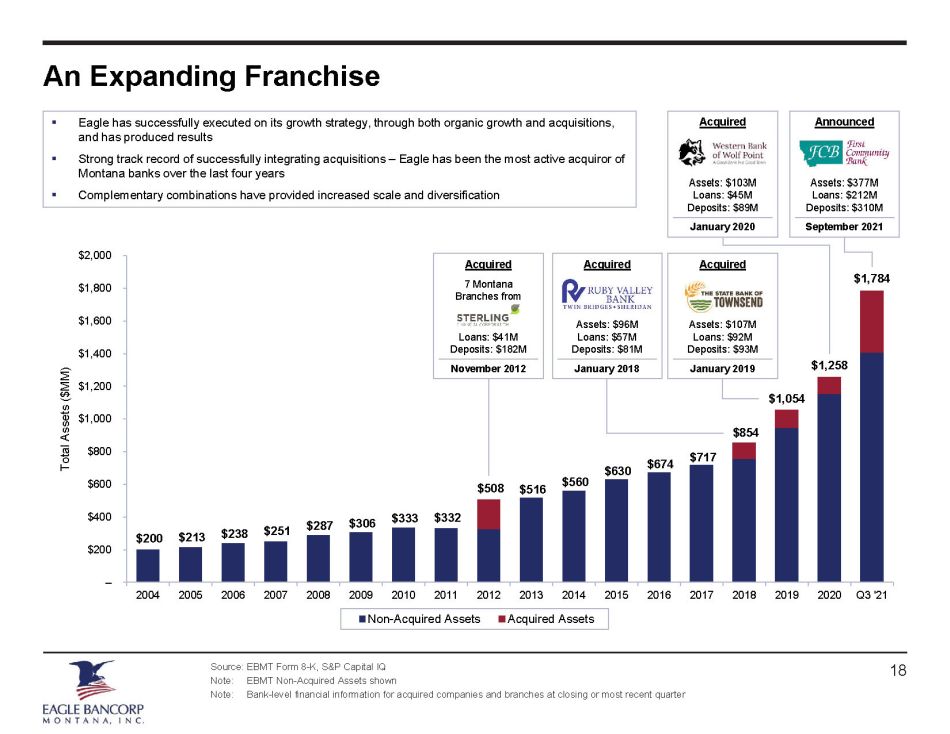
An Expanding Franchise Source: EBMT Form 8 - K, S&P Capital IQ Note: EBMT Non - Acquired Assets shown Note: Bank - level financial information for acquired companies and branches at closing or most recent quarter 18 $200 $213 $238 $251 $287 $306 $333 $332 $516 $560 $630 $674 $717 – $200 $400 $600 $800 $1,000 $1,200 $1,400 $1,600 $1,800 $2,000 2004 2005 2006 2007 2008 2009 2010 2011 2012 2013 2014 2015 2016 2017 2018 2019 2020 Q3 '21 Total Assets ($MM) Non-Acquired Assets Acquired Assets $508 $854 $1,054 $1,258 $1,784 Acquired Assets: $103M Loans: $45M Deposits: $89M January 2020 ▪ Eagle has successfully executed on its growth strategy, through both organic growth and acquisitions, and has produced results ▪ Strong track record of successfully integrating acquisitions – Eagle has been the most active acquiror of Montana banks over the last four years ▪ Complementary combinations have provided increased scale and diversification Acquired 7 Montana Branches from Loans: $41M Deposits: $182M November 2012 Acquired Assets: $96M Loans: $57M Deposits: $81M January 2018 Acquired Assets: $107M Loans: $92M Deposits: $93M January 2019 Announced Assets: $377M Loans: $212M Deposits: $310M September 2021
III. Experienced Management Team 19

Experienced Management Team Source: Company - provided biographies 20 Peter J. Johnson – President, CEO & Director Peter J . Johnson has served as President and CEO of the Company since December 2009 . He has also served as President of the Bank since July 2007 and CEO since November 2007 . Prior to being named President, he had served as the Company’s Executive Vice President and Chief Financial Officer . He joined the Bank in 1981 . He currently serves on the Montana Independent Bankers Association (“MIB”) board of directors and served as a member of the Federal Reserve Board’s Community Depository Institution Advisory Council from 2010 - 2012 . He is a past chairman of the Helena Area Chamber of Commerce, the Diocese of Helena Finance Council, and St . Peter’s Health Foundation Board . He is a member of the Independent Community Bankers of America’s Political Action Committee, St . Peter’s Health Foundation board, and is Montana’s Federal Delegate to the Independent Community Bankers of America . Laura F. Clark – Executive VP, CFO & COO Laura F . Clark joined the organization in March 2014 and serves as the Executive Vice President/Chief Financial Officer/Chief Operating Officer of the Bank and the Company . She was formerly the Senior Vice President and Chief Financial Officer of the Bank of Bozeman from 2005 to 2014 . Her experience spans over 40 years and includes a variety of executive positions with First National Bancorp, Bankers Resource Center, Security Bank, Bank of Montana System and Montana Bancsystem . Ms . Clark holds a Bachelor of Arts degree in Business Administration from Montana State University - Billings . She currently serves as a board member of ExplorationWorks , a local Science Center that provides programs for early childhood education, STEM (science, technology, engineering and math) and healthy living, and is an active member of a local Rotary Club . Mark A. O’Neill – Senior VP & Chief Lending Officer Mark A . O’Neill joined the Company as the Butte Market President in February 2016 . He was formerly with First Citizens Bank and Wells Fargo and served in various lending and management roles . He was promoted to Senior Vice President/Chief Lending Officer in October 2018 . Mr . O’Neill holds a Bachelor of Arts degree in Economics from University of Montana in Missoula, Montana . He is a past board member of the Silver Bow Kiwanis and the Butte Local Development Corporation . Dale F. Field – Senior VP & Chief Credit Officer Dale F . Field joined the Company in 2001 as Vice President/Commercial Lender and was promoted to Vice President/Chief Credit Administration Officer in 2011 . He was promoted to Senior Vice President/Chief Credit Officer in July 2014 . Mr . Field currently serves as a Board Member on the Western Bankers Association - Bankers Benefits Board . He has previously served on the Helena Exchange Club board of directors and recently finished nine years as a school board trustee in Clancy, Montana .

IV. Assets Highlights 21
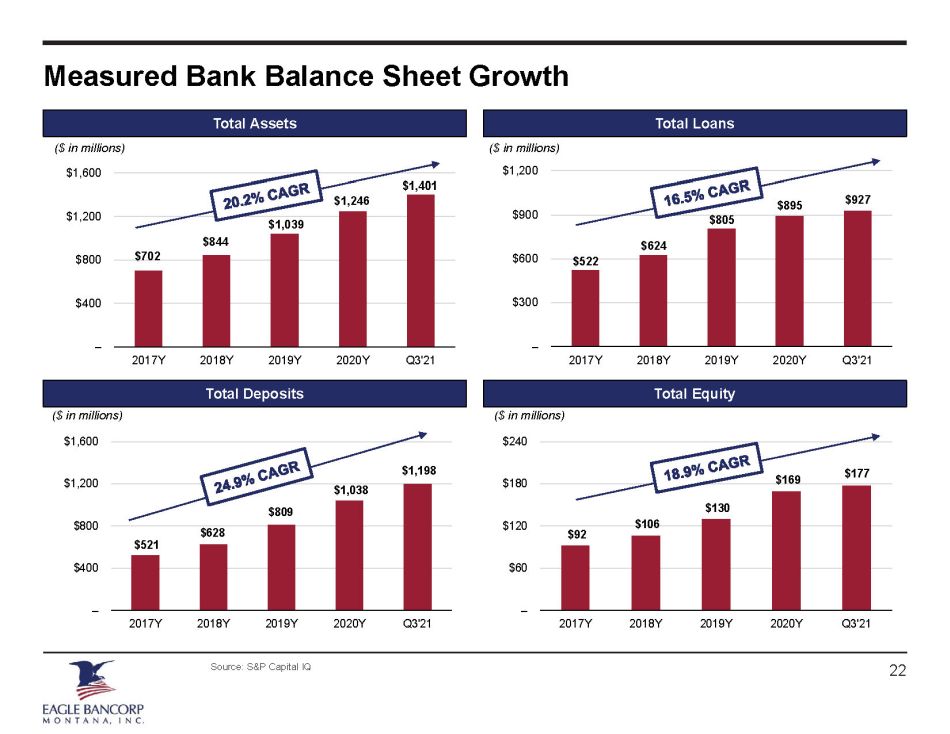
$521 $628 $809 $1,038 $1,198 – $400 $800 $1,200 $1,600 2017Y 2018Y 2019Y 2020Y Q3'21 $522 $624 $805 $895 $927 – $300 $600 $900 $1,200 2017Y 2018Y 2019Y 2020Y Q3'21 $92 $106 $130 $169 $177 – $60 $120 $180 $240 2017Y 2018Y 2019Y 2020Y Q3'21 $702 $844 $1,039 $1,246 $1,401 – $400 $800 $1,200 $1,600 2017Y 2018Y 2019Y 2020Y Q3'21 Measured Bank Balance Sheet Growth Source: S&P Capital IQ Total Loans Total Assets Total Equity Total Deposits ($ in millions) ($ in millions) ($ in millions) ($ in millions) 22 Total Loans Total Assets Total Equity Total Deposits

Investment Portfolio Composition & Performance Portfolio Management Statistics Asset Class Breakdown • The securities portfolio largely consists of state & municipality and residential mortgage - backed securities • Historical investment portfolio total returns (1) : • 1 year: 1.17%, 80 th percentile • 3 year: 4.52%, 93 rd percentile • 5 year: 3.03%, 92 nd percentile • Updated portfolio information (2) : • Book Weighted Average Life: 6.70 years • Weighted Average TEY: 2.11% • Market Value / Book Value: 103.44% 23 Source: S&P Capital IQ, Performance Trust Capital Partners, Company - provided documents Note: Bank - level asset class breakdown shown as of September 30, 2021 (1) Total return calculations based on Performance Trust Total Return calculations as of September 30, 2021. Past performance is not indicative of future returns (2) Other portfolio information based on consolidated securities portfolio as of August 31, 2021 State & Municipality Subdiv Securities 50% RMBS 22% US Treasury Securities 14% CMBS 7% Other Securities 3% ABS 3% Govt Acency & Spons Agency Securities 1%
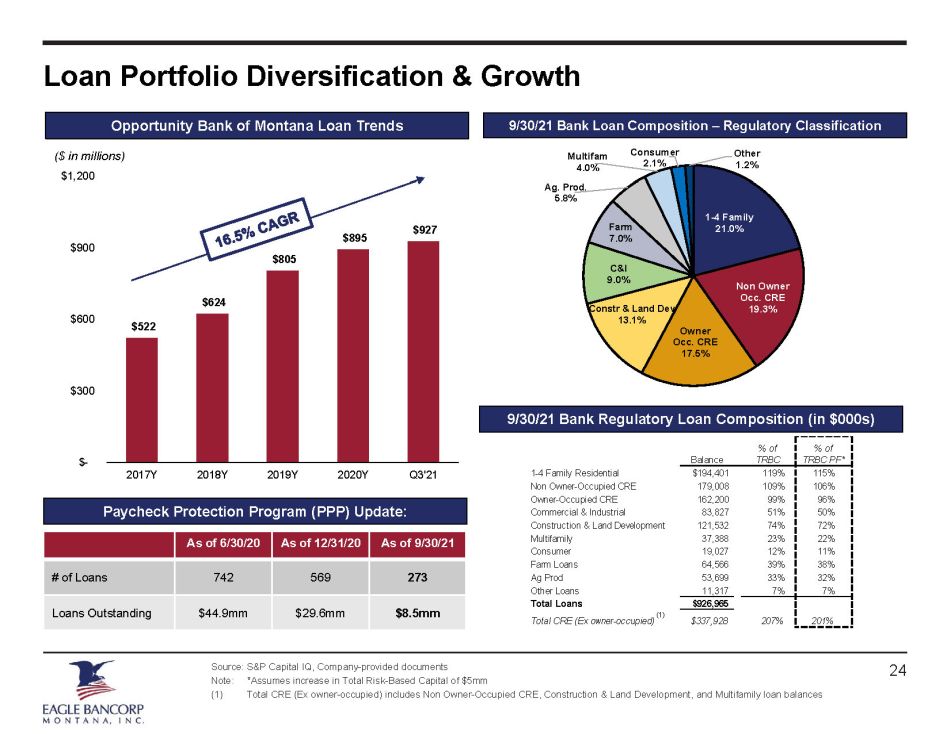
$522 $624 $805 $895 $927 $- $300 $600 $900 $1,200 2017Y 2018Y 2019Y 2020Y Q3'21 Loan Portfolio Diversification & Growth Source: S&P Capital IQ, Company - provided documents Note: *Assumes increase in Total Risk - Based Capital of $5mm (1) Total CRE (Ex owner - occupied) includes Non Owner - Occupied CRE, Construction & Land Development, and Multifamily loan balance s 9/30/21 Bank Loan Composition – Regulatory Classification Opportunity Bank of Montana Loan Trends ($ in millions) 9/30/21 Bank Regulatory Loan Composition (in $000s) Paycheck Protection Program (PPP) Update: 24 1 - 4 Family 21.0% Non Owner Occ. CRE 19.3% Owner Occ. CRE 17.5% Constr & Land Dev 13.1% C&I 9.0% Farm 7.0% Ag. Prod. 5.8% Multifam 4.0% Consumer 2.1% Other 1.2% Balance % of TRBC % of TRBC PF* 1-4 Family Residential $194,401 119% 115% Non Owner-Occupied CRE 179,008 109% 106% Owner-Occupied CRE 162,200 99% 96% Commercial & Industrial 83,827 51% 50% Construction & Land Development 121,532 74% 72% Multifamily 37,388 23% 22% Consumer 19,027 12% 11% Farm Loans 64,566 39% 38% Ag Prod 53,699 33% 32% Other Loans 11,317 7% 7% Total Loans $926,965 Total CRE (Ex owner-occupied) $337,928 207% 201% As of 6/30/20 As of 12/31/20 As of 9/30/21 # of Loans 742 569 273 Loans Outstanding $44.9mm $29.6mm $8.5mm (1)
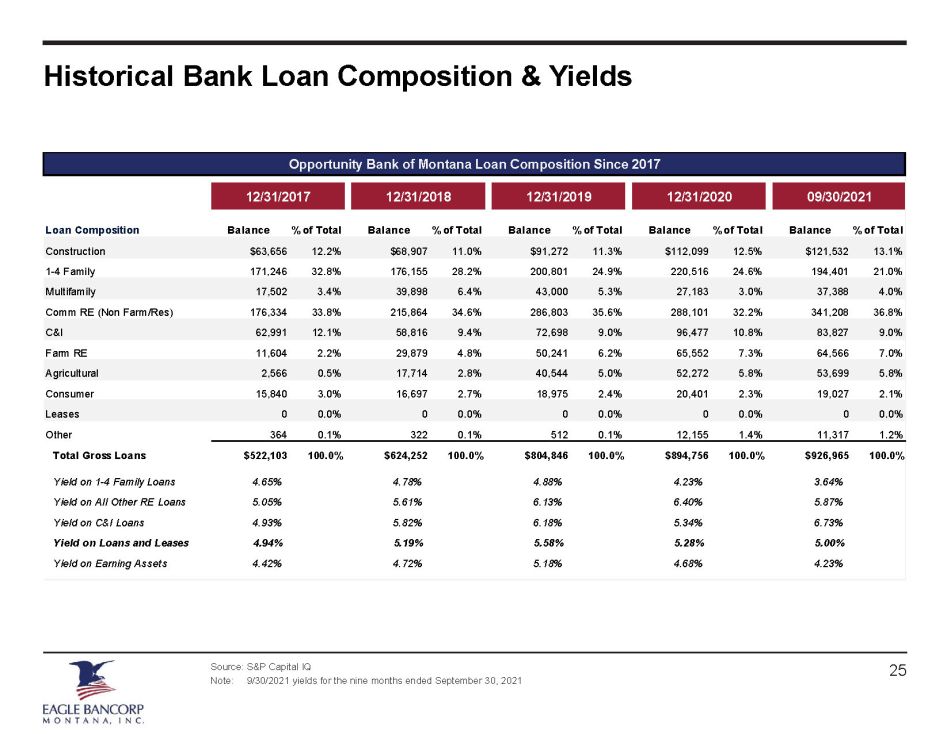
Historical Bank Loan Composition & Yields Source: S&P Capital IQ Note: 9/30/2021 yields for the nine months ended September 30, 2021 Opportunity Bank of Montana Loan Composition Since 2017 12/31/2017 12/31/2018 12/31/2019 12/31/2020 09/30/2021 Loan Composition Balance % of Total Balance % of Total Balance % of Total Balance % of Total Balance % of Total Construction $63,656 12.2% $68,907 11.0% $91,272 11.3% $112,099 12.5% $121,532 13.1% 1-4 Family 171,246 32.8% 176,155 28.2% 200,801 24.9% 220,516 24.6% 194,401 21.0% Multifamily 17,502 3.4% 39,898 6.4% 43,000 5.3% 27,183 3.0% 37,388 4.0% Comm RE (Non Farm/Res) 176,334 33.8% 215,864 34.6% 286,803 35.6% 288,101 32.2% 341,208 36.8% C&I 62,991 12.1% 58,816 9.4% 72,698 9.0% 96,477 10.8% 83,827 9.0% Farm RE 11,604 2.2% 29,879 4.8% 50,241 6.2% 65,552 7.3% 64,566 7.0% Agricultural 2,566 0.5% 17,714 2.8% 40,544 5.0% 52,272 5.8% 53,699 5.8% Consumer 15,840 3.0% 16,697 2.7% 18,975 2.4% 20,401 2.3% 19,027 2.1% Leases 0 0.0% 0 0.0% 0 0.0% 0 0.0% 0 0.0% Other 364 0.1% 322 0.1% 512 0.1% 12,155 1.4% 11,317 1.2% Total Gross Loans $522,103 100.0% $624,252 100.0% $804,846 100.0% $894,756 100.0% $926,965 100.0% Yield on 1-4 Family Loans 4.65% 4.78% 4.88% 4.23% 3.64% Yield on All Other RE Loans 5.05% 5.61% 6.13% 6.40% 5.87% Yield on C&I Loans 4.93% 5.82% 6.18% 5.34% 6.73% Yield on Loans and Leases 4.94% 5.19% 5.58% 5.28% 5.00% Yield on Earning Assets 4.42% 4.72% 5.18% 4.68% 4.23% 25
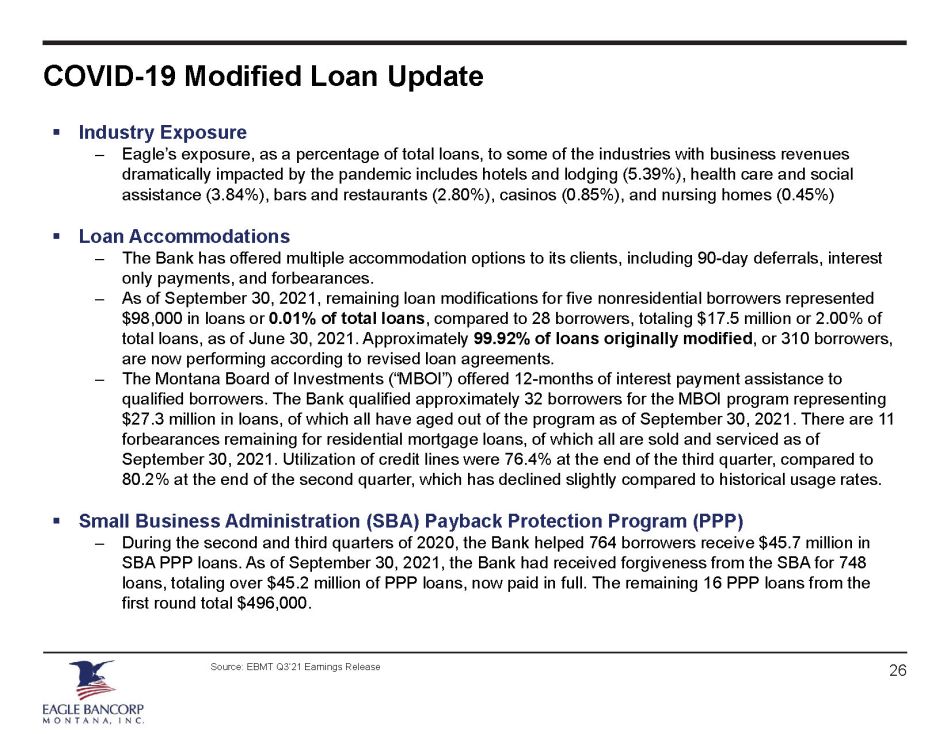
COVID - 19 Modified Loan Update 26 Source: EBMT Q3’21 Earnings Release ▪ Industry Exposure – Eagle’s exposure, as a percentage of total loans, to some of the industries with business revenues dramatically impacted by the pandemic includes hotels and lodging (5.39%), health care and social assistance (3.84%), bars and restaurants (2.80%), casinos (0.85%), and nursing homes (0.45%) ▪ Loan Accommodations – The Bank has offered multiple accommodation options to its clients, including 90 - day deferrals, interest only payments, and forbearances. – As of September 30, 2021, remaining loan modifications for five nonresidential borrowers represented $98,000 in loans or 0.01% of total loans , compared to 28 borrowers, totaling $17.5 million or 2.00% of total loans, as of June 30, 2021. Approximately 99.92% of loans originally modified , or 310 borrowers, are now performing according to revised loan agreements. – The Montana Board of Investments (“MBOI”) offered 12 - months of interest payment assistance to qualified borrowers. The Bank qualified approximately 32 borrowers for the MBOI program representing $27.3 million in loans, of which all have aged out of the program as of September 30, 2021. There are 11 forbearances remaining for residential mortgage loans, of which all are sold and serviced as of September 30, 2021. Utilization of credit lines were 76.4% at the end of the third quarter, compared to 80.2% at the end of the second quarter, which has declined slightly compared to historical usage rates. ▪ Small Business Administration (SBA) Payback Protection Program (PPP) – During the second and third quarters of 2020, the Bank helped 764 borrowers receive $45.7 million in SBA PPP loans. As of September 30, 2021, the Bank had received forgiveness from the SBA for 748 loans, totaling over $45.2 million of PPP loans, now paid in full. The remaining 16 PPP loans from the first round total $496,000.
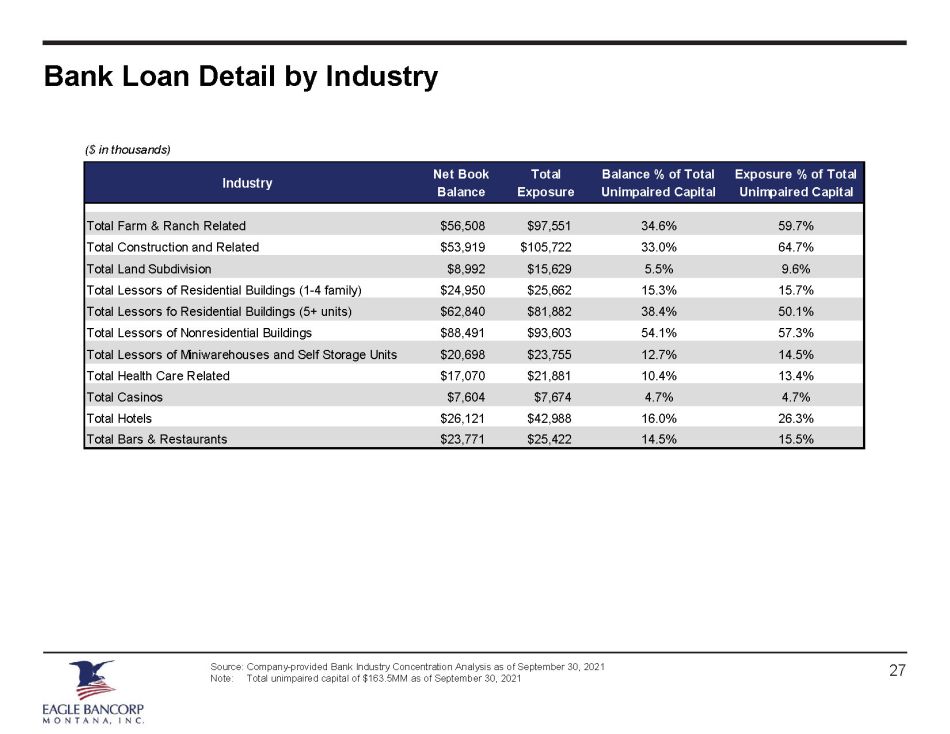
Bank Loan Detail by Industry 27 Source: Company - provided Bank Industry Concentration Analysis as of September 30, 2021 Note: Total unimpaired capital of $163.5MM as of September 30, 2021 Industry Net Book Balance Total Exposure Balance % of Total Unimpaired Capital Exposure % of Total Unimpaired Capital Total Farm & Ranch Related $56,508 $97,551 34.6% 59.7% Total Construction and Related $53,919 $105,722 33.0% 64.7% Total Land Subdivision $8,992 $15,629 5.5% 9.6% Total Lessors of Residential Buildings (1-4 family) $24,950 $25,662 15.3% 15.7% Total Lessors fo Residential Buildings (5+ units) $62,840 $81,882 38.4% 50.1% Total Lessors of Nonresidential Buildings $88,491 $93,603 54.1% 57.3% Total Lessors of Miniwarehouses and Self Storage Units $20,698 $23,755 12.7% 14.5% Total Health Care Related $17,070 $21,881 10.4% 13.4% Total Casinos $7,604 $7,674 4.7% 4.7% Total Hotels $26,121 $42,988 16.0% 26.3% Total Bars & Restaurants $23,771 $25,422 14.5% 15.5% ($ in thousands)

Farm 37% All Other Loans 24% 1 - 4 Family 15% C&I 9% Non - Owner Occ. CRE 8% Constr & Land Dev 5% Consumer 1% Bank Non - performing Assets Details Source: S&P Capital IQ Bank Non - Accrual Loans by Type Bank Commentary Asset Quality Detail as of September 30, 2021: • OREO / Assets of 0.01% • Accruing Loans 90+ days past due to total loans of 0.00% • NPAs (Excl. Restructured Loans) / Assets of 0.45% – $1.6MM in restructured loans (0.18% of total loans) • Texas ratio of 4.75% • Strong reserves comprising of 155% of NPAs • Nonaccrual loans to total loans of 0.66% – $6.2MM in non - accrual loans • Approximately 0 bps of Net Charge - Offs (“NCOs”) / Avg. Loans for the nine months ended September 30, 2021 28

Bank Asset Quality & Reserve Coverage Ratios Source: S&P Capital IQ Note: “2021YTD” for the nine months ended September 30, 2021 (1) Total loans excludes PPP loans Loan Loss Reserves / NPLs NCOs / Avg. Loans Loan Loss Reserves / Total Loans NPAs / Assets 29 0.21% 0.28% 0.35% 0.65% 0.56% 0.00% 0.50% 1.00% 1.50% 2.00% 2017Y 2018Y 2019Y 2020Y Q3'21 0.05% 0.02% 0.08% 0.01% 0.00% -0.10% 0.05% 0.20% 0.35% 0.50% 2017Y 2018Y 2019Y 2020Y 2021YTD 589% 288% 236% 144% 157% 0% 200% 400% 600% 800% 2017Y 2018Y 2019Y 2020Y Q3'21 1.10% 1.06% 1.07% 1.34% 1.33% 0.00% 0.40% 0.80% 1.20% 1.60% 2017Y 2018Y 2019Y 2020Y Q3'21 (1) (1)
V. Liabilities Highlights 30
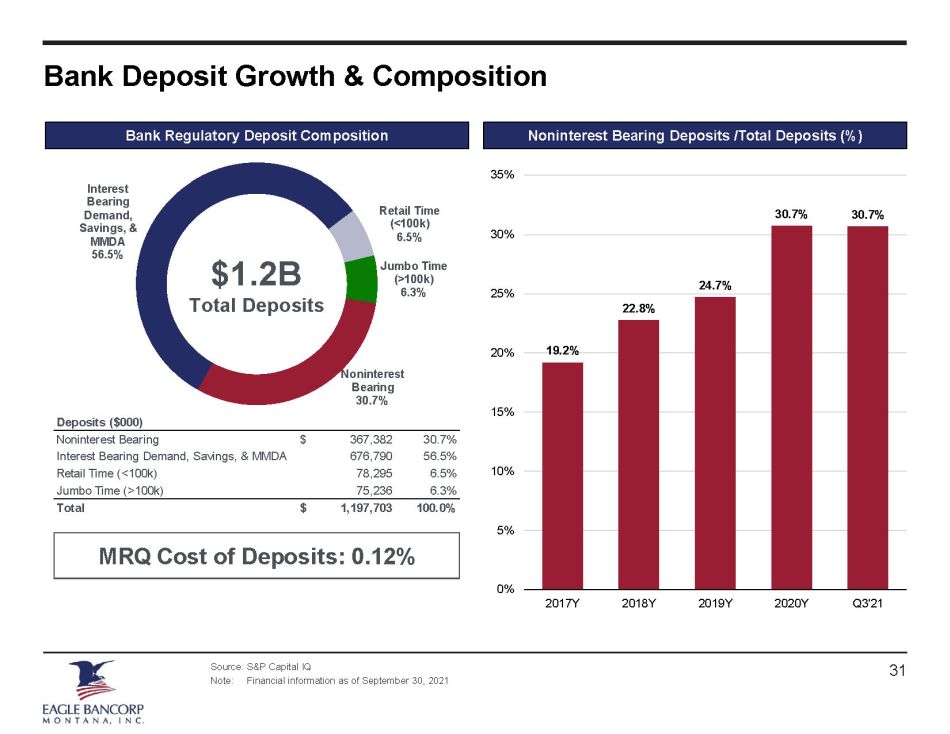
Bank Deposit Growth & Composition Source: S&P Capital IQ Note: Financial information as of September 30, 2021 Noninterest Bearing Deposits /Total Deposits (%) Bank Regulatory Deposit Composition 19.2% 22.8% 24.7% 30.7% 30.7% 0% 5% 10% 15% 20% 25% 30% 35% 2017Y 2018Y 2019Y 2020Y Q3'21 31 $1.2B $1.2B Total Deposits Total Deposits Deposits ($000) Noninterest Bearing 367,382$ 30.7% Interest Bearing Demand, Savings, & MMDA 676,790 56.5% Retail Time (<100k) 78,295 6.5% Jumbo Time (>100k) 75,236 6.3% Total 1,197,703$ 100.0% MRQ Cost of Deposits: 0.12% MRQ Cost of Deposits: 0.12% Noninterest Bearing 30.7% Interest Bearing Demand, Savings, & MMDA 56.5% Retail Time (<100k) 6.5% Jumbo Time (>100k) 6.3%

Regional Deposit Information by MSA Source: S&P Capital IQ, FDIC deposit information as of June 30, 2021 Note: Deposit market share data does not include credit unions Helena, MT 2021 2021 2021 2021 Deposits Market Rank Institution (ST) Branches ($000s) Share (%) 1 Glacier Bancorp Inc. (MT) 6 570,737 26.02% 2 First Interstate BancSystem (MT) 5 427,377 19.48% 3 Wells Fargo & Co. (CA) 3 369,378 16.84% 4 Eagle Bancorp Montana Inc. (MT) 3 252,068 11.49% 5 U.S. Bancorp (MN) 1 182,353 8.31% 6 Stockman Financial Corp. (MT) 2 126,611 5.77% 7 Ascent Bancorp (MT) 2 68,895 3.14% 8 Jackass Creek Land & Livestock (MT) 2 59,173 2.70% 9 Heartland Financial USA Inc. (IA) 1 54,526 2.49% 10 Countricorp (MT) 1 23,740 1.08% Total For Institutions In MarketFor Institutions In Market 32 2,193,662 Butte-Silver Bow, MT 2021 2021 2021 2021 Deposits Market Rank Institution (ST) Branches ($000s) Share (%) 1 Glacier Bancorp Inc. (MT) 3 226,080 25.68% 2 Wells Fargo & Co. (CA) 2 201,617 22.90% 3 U.S. Bancorp (MN) 1 107,080 12.16% 4 Eagle Bancorp Montana Inc. (MT) 1 101,815 11.56% 5 First National Bancorp Inc. (MT) 1 94,807 10.77% 6 Butte Bank Shares Inc. (MT) 2 71,231 8.09% 7 Flint Creek Holding Co. (MT) 1 52,361 5.95% 8 Bridger Co. (MT) 1 25,427 2.89% Total For Institutions In MarketFor Institutions In Market 12 880,418 Bozeman, MT 2021 2021 2021 2021 Deposits Market Rank Institution (ST) Branches ($000s) Share (%) 1 Glacier Bancorp Inc. (MT) 9 1,666,474 36.69% 2 First Interstate BancSystem (MT) 5 653,674 14.39% 3 Stockman Financial Corp. (MT) 4 534,965 11.78% 4 U.S. Bancorp (MN) 2 496,561 10.93% 5 Guaranty Dev. Co. (MT) 3 349,258 7.69% 6 MSB Financial Inc. (MT) 4 224,457 4.94% 7 Eagle Bancorp Montana Inc. (MT) 3 188,331 4.15% 8 Bozeman Bancorp Inc. (MT) 1 98,275 2.16% 9 Heartland Financial USA Inc. (IA) 1 92,085 2.03% 10 Wells Fargo & Co. (CA) 3 87,525 1.93% Total For Institutions In MarketFor Institutions In Market 41 4,541,470 1 3 2 32 Missoula, MT 2021 2021 2021 2021 Deposits Market Rank Institution (ST) Branches ($000s) Share (%) 1 Glacier Bancorp Inc. (MT) 8 961,622 26.76% 2 First Interstate BancSystem (MT) 3 909,453 25.30% 3 U.S. Bancorp (MN) 2 371,655 10.34% 4 Wells Fargo & Co. (CA) 3 367,913 10.24% 5 Bitterroot Holding Co. (MT) 7 304,362 8.47% 6 Stockman Financial Corp. (MT) 4 294,406 8.19% 7 Bancorp of Montana Holding Co. (MT) 1 145,591 4.05% 8 Eagle Bancorp Montana Inc. (MT) 2 63,037 1.75% 9 Farmers State Financial Corp. (MT) 2 62,924 1.75% 10 First National Bancorp Inc. (MT) 2 59,720 1.66% Total For Institutions In MarketFor Institutions In Market 36 3,594,055 4
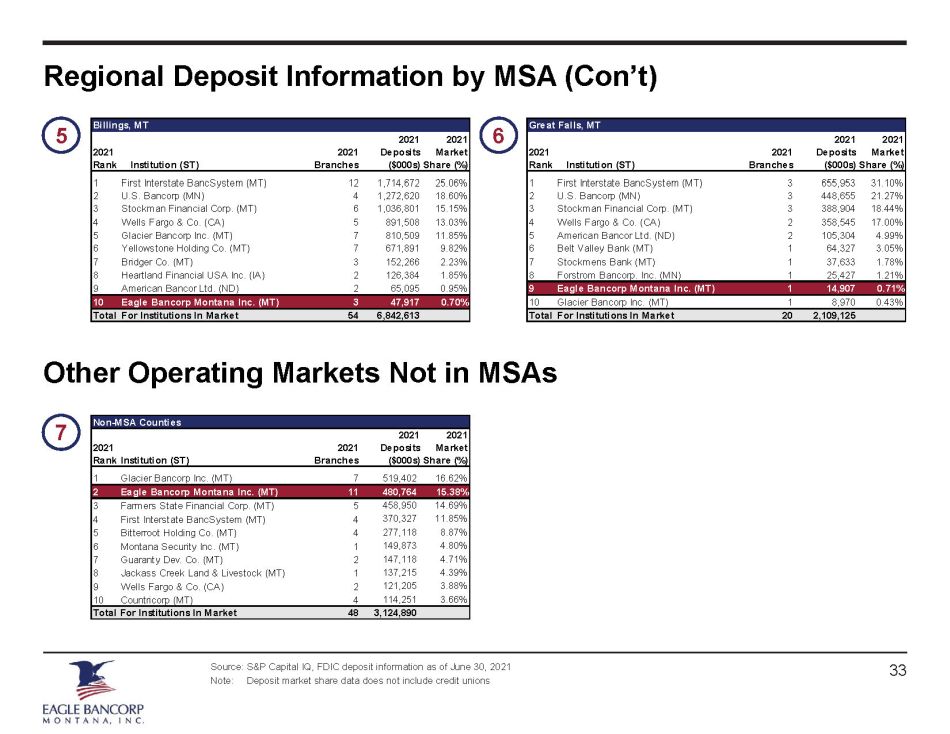
Regional Deposit Information by MSA ( Con’t ) Source: S&P Capital IQ, FDIC deposit information as of June 30, 2021 Note: Deposit market share data does not include credit unions Billings, MT 2021 2021 2021 2021 Deposits Market Rank Institution (ST) Branches ($000s)Share (%) 1 First Interstate BancSystem (MT) 12 1,714,672 25.06% 2 U.S. Bancorp (MN) 4 1,272,620 18.60% 3 Stockman Financial Corp. (MT) 6 1,036,801 15.15% 4 Wells Fargo & Co. (CA) 5 891,508 13.03% 5 Glacier Bancorp Inc. (MT) 7 810,509 11.85% 6 Yellowstone Holding Co. (MT) 7 671,891 9.82% 7 Bridger Co. (MT) 3 152,266 2.23% 8 Heartland Financial USA Inc. (IA) 2 126,384 1.85% 9 American Bancor Ltd. (ND) 2 65,095 0.95% 10 Eagle Bancorp Montana Inc. (MT) 3 47,917 0.70% Total For Institutions In MarketFor Institutions In Market 54 6,842,613 5 33 Great Falls, MT 2021 2021 2021 2021 Deposits Market Rank Institution (ST) Branches ($000s)Share (%) 1 First Interstate BancSystem (MT) 3 655,953 31.10% 2 U.S. Bancorp (MN) 3 448,655 21.27% 3 Stockman Financial Corp. (MT) 3 388,904 18.44% 4 Wells Fargo & Co. (CA) 2 358,545 17.00% 5 American Bancor Ltd. (ND) 2 105,304 4.99% 6 Belt Valley Bank (MT) 1 64,327 3.05% 7 Stockmens Bank (MT) 1 37,633 1.78% 8 Forstrom Bancorp. Inc. (MN) 1 25,427 1.21% 9 Eagle Bancorp Montana Inc. (MT) 1 14,907 0.71% 10 Glacier Bancorp Inc. (MT) 1 8,970 0.43% Total For Institutions In MarketFor Institutions In Market 20 2,109,125 6 Other Operating Markets Not in MSAs Non-MSA Counties 2021 2021 2021 2021 Deposits Market RankInstitution (ST) Branches ($000s)Share (%) 1 Glacier Bancorp Inc. (MT) 7 519,402 16.62% 2 Eagle Bancorp Montana Inc. (MT) 11 480,764 15.38% 3 Farmers State Financial Corp. (MT) 5 458,950 14.69% 4 First Interstate BancSystem (MT) 4 370,327 11.85% 5 Bitterroot Holding Co. (MT) 4 277,118 8.87% 6 Montana Security Inc. (MT) 1 149,873 4.80% 7 Guaranty Dev. Co. (MT) 2 147,118 4.71% 8 Jackass Creek Land & Livestock (MT) 1 137,215 4.39% 9 Wells Fargo & Co. (CA) 2 121,205 3.88% 10 Countricorp (MT) 4 114,251 3.66% Total For Institutions In Market 48 3,124,890 7
VI. Capital Highlights 34
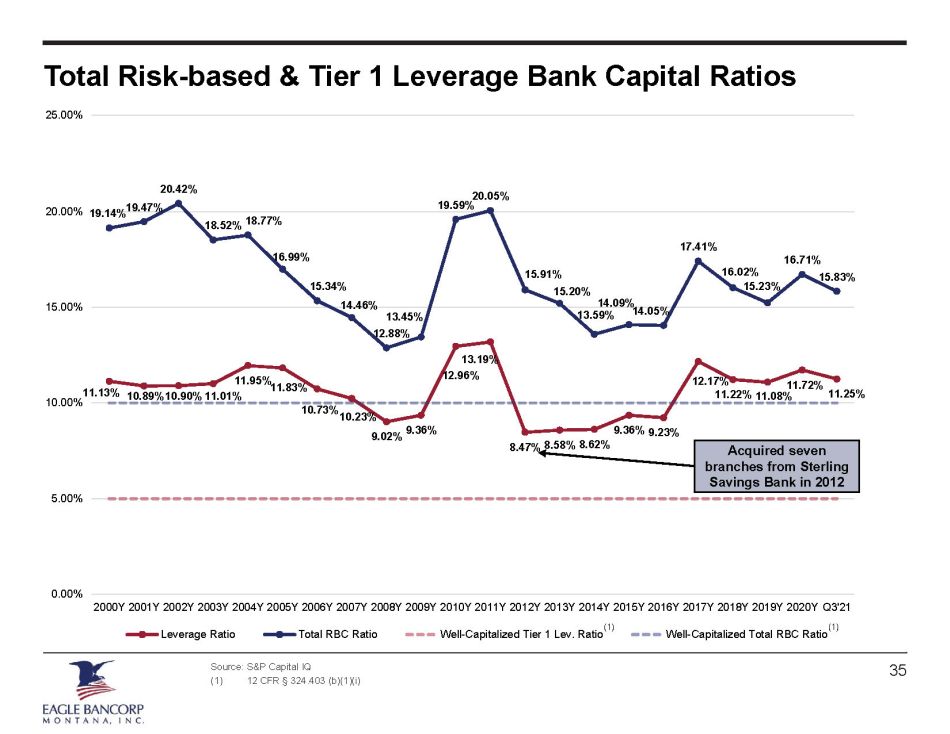
11.13% 10.89% 10.90% 11.01% 11.95% 11.83% 10.73% 10.23% 9.02% 9.36% 12.96% 13.19% 8.47% 8.58% 8.62% 9.36% 9.23% 12.17% 11.22% 11.08% 11.72% 11.25% 19.14% 19.47% 20.42% 18.52% 18.77% 16.99% 15.34% 14.46% 12.88% 13.45% 19.59% 20.05% 15.91% 15.20% 13.59% 14.09% 14.05% 17.41% 16.02% 15.23% 16.71% 15.83% 0.00% 5.00% 10.00% 15.00% 20.00% 25.00% 2000Y 2001Y 2002Y 2003Y 2004Y 2005Y 2006Y 2007Y 2008Y 2009Y 2010Y 2011Y 2012Y 2013Y 2014Y 2015Y 2016Y 2017Y 2018Y 2019Y 2020Y Q3'21 Leverage Ratio Total RBC Ratio Well-Capitalized Tier 1 Lev. Ratio Well-Capitalized Total RBC Ratio Total Risk - based & Tier 1 Leverage Bank Capital Ratios Source: S&P Capital IQ (1) 12 CFR † 324.403 (b)(1)( i ) 35 (1) (1) Acquired seven branches from Sterling Savings Bank in 2012
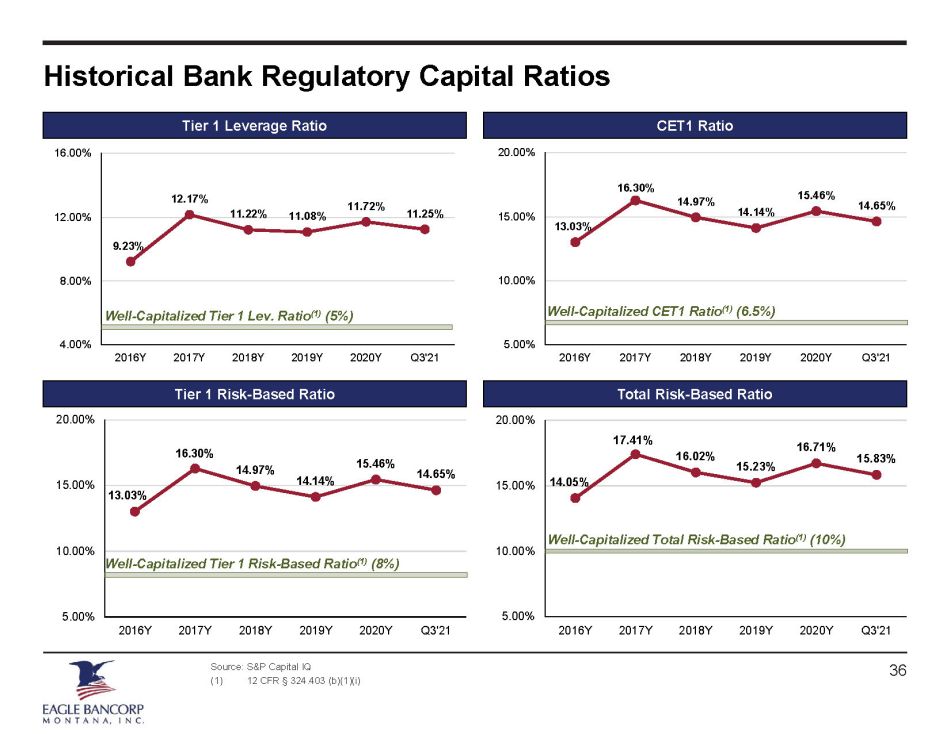
Historical Bank Regulatory Capital Ratios Source: S&P Capital IQ (1) 12 CFR † 324.403 (b)(1)( i ) Tier 1 Risk - Based Ratio CET1 Ratio Total Risk - Based Ratio Tier 1 Leverage Ratio 36 9.23% 12.17% 11.22% 11.08% 11.72% 11.25% 4.00% 8.00% 12.00% 16.00% 2016Y 2017Y 2018Y 2019Y 2020Y Q3'21 Well - Capitalized Tier 1 Lev. Ratio (1) (5%) 13.03% 16.30% 14.97% 14.14% 15.46% 14.65% 5.00% 10.00% 15.00% 20.00% 2016Y 2017Y 2018Y 2019Y 2020Y Q3'21 Well - Capitalized CET1 Ratio (1) (6.5%) 13.03% 16.30% 14.97% 14.14% 15.46% 14.65% 5.00% 10.00% 15.00% 20.00% 2016Y 2017Y 2018Y 2019Y 2020Y Q3'21 Well - Capitalized Tier 1 Risk - Based Ratio (1) (8%) 14.05% 17.41% 16.02% 15.23% 16.71% 15.83% 5.00% 10.00% 15.00% 20.00% 2016Y 2017Y 2018Y 2019Y 2020Y Q3'21 Well - Capitalized Total Risk - Based Ratio (1) (10%)

VII. Income Statement Highlights 37
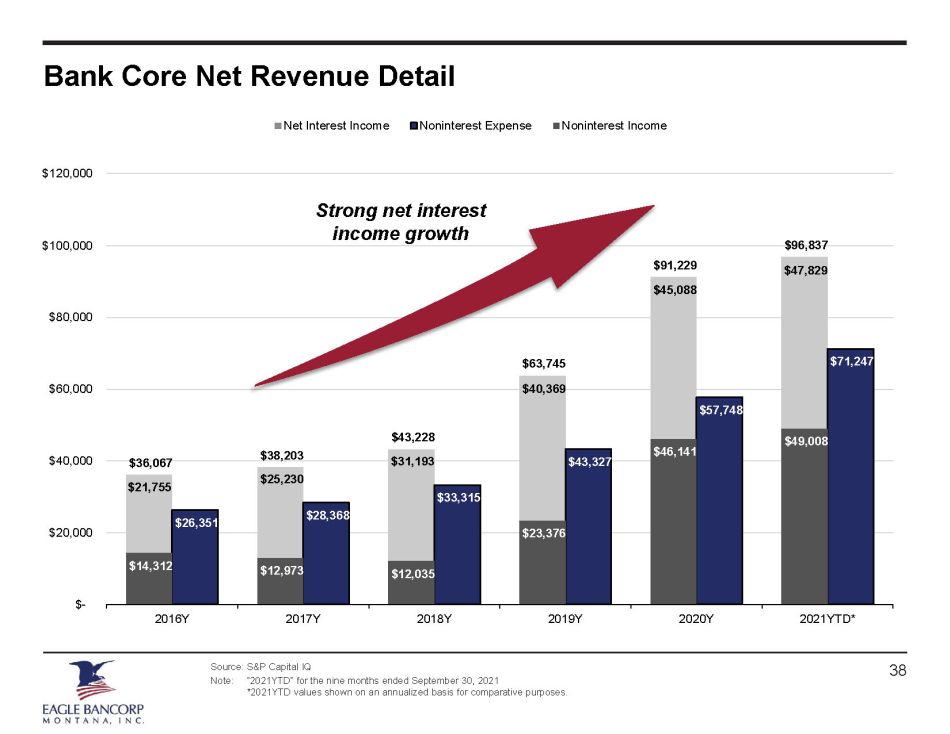
Bank Core Net Revenue Detail Source: S&P Capital IQ Note: “2021YTD” for the nine months ended September 30, 2021 *2021YTD values shown on an annualized basis for comparative purposes. 38 $36,067 $38,203 $43,228 $63,745 $91,229 $96,837 $26,351 $28,368 $33,315 $43,327 $57,748 $71,247 $14,312 $12,973 $12,035 $23,376 $46,141 $49,008 $- $20,000 $40,000 $60,000 $80,000 $100,000 $120,000 2016Y 2017Y 2018Y 2019Y 2020Y 2021YTD* Net Interest Income Noninterest Expense Noninterest Income $21,755 $25,230 $31,193 $40,369 $45,088 $47,829 Strong net interest income growth
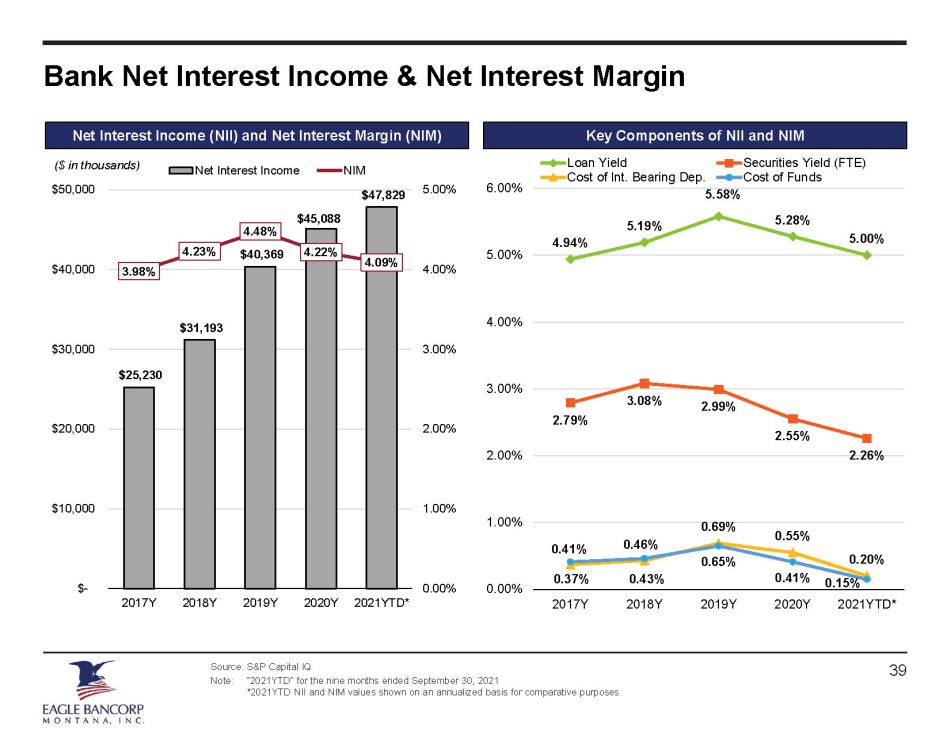
Bank Net Interest Income & Net Interest Margin Source: S&P Capital IQ Note: “2021YTD” for the nine months ended September 30, 2021 *2021YTD NII and NIM values shown on an annualized basis for comparative purposes. $25,230 $31,193 $40,369 $45,088 $47,829 3.98% 4.23% 4.48% 4.22% 4.09% 0.00% 1.00% 2.00% 3.00% 4.00% 5.00% $- $10,000 $20,000 $30,000 $40,000 $50,000 2017Y 2018Y 2019Y 2020Y 2021YTD* Net Interest Income NIM ($ in thousands) Key Components of NII and NIM Net Interest Income (NII) and Net Interest Margin (NIM) 4.94% 5.19% 5.58% 5.28% 5.00% 2.79% 3.08% 2.99% 2.55% 2.26% 0.37% 0.43% 0.69% 0.55% 0.20% 0.41% 0.46% 0.65% 0.41% 0.15% 0.00% 1.00% 2.00% 3.00% 4.00% 5.00% 6.00% 2017Y 2018Y 2019Y 2020Y 2021YTD* Loan Yield Securities Yield (FTE) Cost of Int. Bearing Dep. Cost of Funds 39

Bank Profitability & Expense Controls 73.0% 75.4% 67.1% 61.8% 74.0% 4.12% 4.07% 4.35% 4.83% 5.42% 0.00% 1.00% 2.00% 3.00% 4.00% 5.00% 6.00% 0.0% 15.0% 30.0% 45.0% 60.0% 75.0% 90.0% 2017Y 2018Y 2019Y 2020Y 2021YTD* Noninterest Expense / Avg. Assets Efficiency Ratio Efficiency Ratio Noninterest Expense / Avg. Assets Pre - Tax ROATCE & ROAA Efficiency Ratio Slightly increased noninterest expense base driven by increases in salary, commissions and employee benefits 40 12.6% 10.7% 17.2% 24.7% 16.2% 1.26% 1.07% 1.80% 2.60% 1.88% 0.80% 1.20% 1.60% 2.00% 2.40% 2.80% 0.0% 5.0% 10.0% 15.0% 20.0% 25.0% 2017Y 2018Y 2019Y 2020Y 2021YTD* Pre - Tax ROAA Pre - Tax ROATCE Pre-Tax ROATCE Pre-Tax ROAA Consistently strong profitability metrics driven by net interest income growth complemented by growing fee income Source: S&P Capital IQ, EBMT Q3’21 Earnings Release Note: “2021YTD” for the nine months ended September 30, 2021 *2021YTD values shown on an annualized basis for comparative purposes (1) The large increase in profitability in 2020 was due in large part to a significant increase in gain on sale of mortgage loan s driven by higher mortgage origination volume compared to 2019 (1)

Bank Net Interest Margin vs. Net Noninterest Expense Source: S&P Capital IQ 4.06% 4.13% 4.27% 4.15% 4.01% 4.10% 0.77% 0.39% 1.23% 1.19% 2.31% 1.56% 0.00% 1.00% 2.00% 3.00% 4.00% 5.00% 2020Q2 2020Q3 2020Q4 2021Q1 2021Q2 2021Q3 Net Interest Margin Net Noninterest Expense /Avg. Assets Net NIE / AA = (Noninterest Expense – Noninterest Income) / Avg. Assets 41
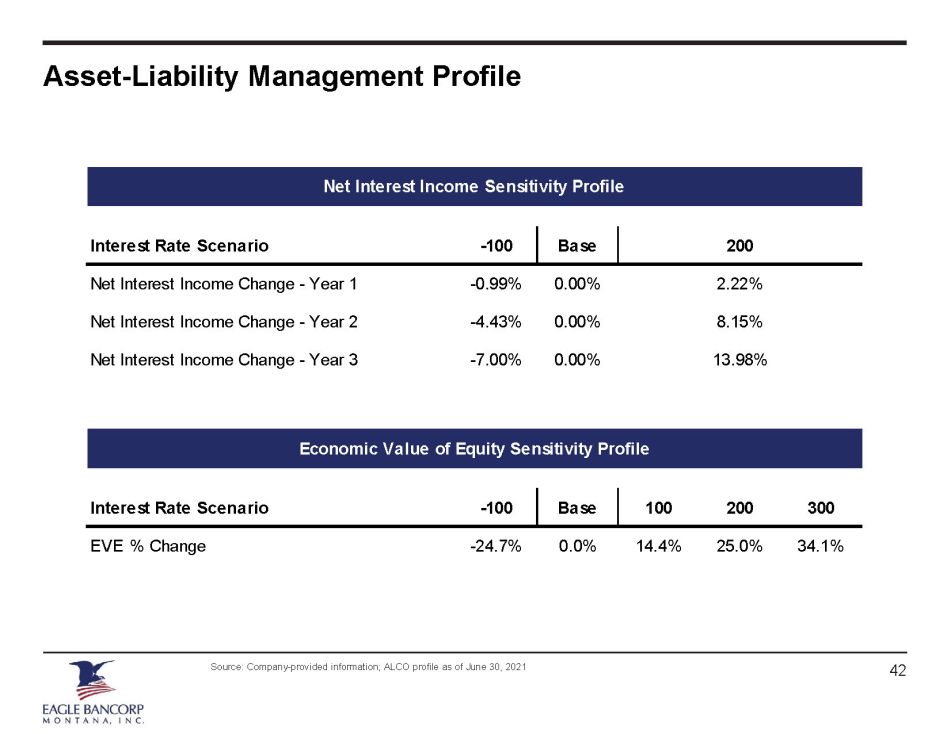
Asset - Liability Management Profile Source: Company - provided information; ALCO profile as of June 30, 2021 42 Net Interest Income Sensitivity Profile Interest Rate Scenario -100 Base 200 Net Interest Income Change - Year 1 -0.99% 0.00% 2.22% Net Interest Income Change - Year 2 -4.43% 0.00% 8.15% Net Interest Income Change - Year 3 -7.00% 0.00% 13.98% Economic Value of Equity Sensitivity Profile Interest Rate Scenario -100 Base 100 200 300 EVE % Change -24.7% 0.0% 14.4% 25.0% 34.1%
VIII. Appendix 43

Bank Regulatory Financial Highlights Source: S&P Capital IQ Note: Bank regulatory metrics shown 12/31/2017 For the Years Ended: For the Quarters Ended: 9/30/2021 12/31/2017 12/31/2018 12/31/2019 12/31/2020 9/30/2020 12/31/2020 3/31/2021 6/30/2021 9/30/2021 CAGR Balance Sheet Total Assets ($000) 701,960 843,686 1,039,105 1,246,129 1,242,961 1,246,129 1,301,623 1,353,067 1,400,879 20.2% Total Loans ($000) 522,103 624,252 804,846 894,756 889,962 894,756 889,949 930,756 926,965 16.5% Total Deposits ($000) 520,601 627,756 809,067 1,037,793 1,001,576 1,037,793 1,096,592 1,148,839 1,197,703 24.9% Tangible Equity ($000) 85,122 92,574 112,133 146,495 139,973 146,495 150,387 151,782 154,662 Loans / Deposits (%) 100.3 99.4 99.5 86.2 88.9 86.2 81.2 81.0 77.4 (Cash + Securities) / Assets (%) 17.9 16.9 13.0 17.3 14.6 17.3 21.2 21.1 23.0 TCE / TA (%) 12.25 11.15 10.98 11.97 11.47 11.97 11.76 11.41 11.22 Tier 1 Leverage Ratio (%) 12.17 11.22 11.08 11.72 11.54 11.72 11.94 11.40 11.25 Total Risk-Based Capital Ratio (%) 17.4 16.0 15.2 16.7 16.2 16.7 17.3 16.2 15.8 Profitability Net Income ($000) 6,238 7,297 13,705 23,190 6,961 5,555 5,652 3,094 5,185 ROAA (%) 0.91 0.89 1.38 1.94 2.27 1.78 1.80 0.94 1.52 ROAE (%) 7.8 7.2 11.0 15.1 17.5 13.4 13.2 7.1 11.8 ROATCE (%) 9.1 8.9 13.2 18.5 20.0 15.7 14.1 8.5 13.8 Net Interest Margin (%) 3.98 4.23 4.48 4.22 4.13 4.27 4.15 4.01 4.10 Efficiency Ratio (%) 71.7 74.6 66.7 61.5 61.1 64.9 69.8 80.9 70.9 Noninterest Inc/ Operating Rev (%) 34.0 27.8 36.7 50.6 56.1 49.1 52.5 48.5 50.7 Noninterest Exp/ AA (%) 4.12 4.07 4.35 4.83 5.13 4.92 5.27 5.67 5.32 Asset Quality (%) NPLs / Loans (%) 0.19 0.37 0.45 0.90 0.83 0.90 0.84 0.78 0.84 NPAs / Assets (%) 0.21 0.28 0.35 0.65 0.60 0.65 0.58 0.54 0.56 Texas Ratio (%) 1.61 3.91 4.53 5.38 4.96 5.38 5.01 5.36 4.75 Reserves / Loans (%) 1.10 1.06 1.07 1.30 1.27 1.30 1.34 1.28 1.32 NCOs / Avg Loans (%) 0.05 0.02 0.08 0.01 0.02 0.04 - 0.01 (0.02) 44
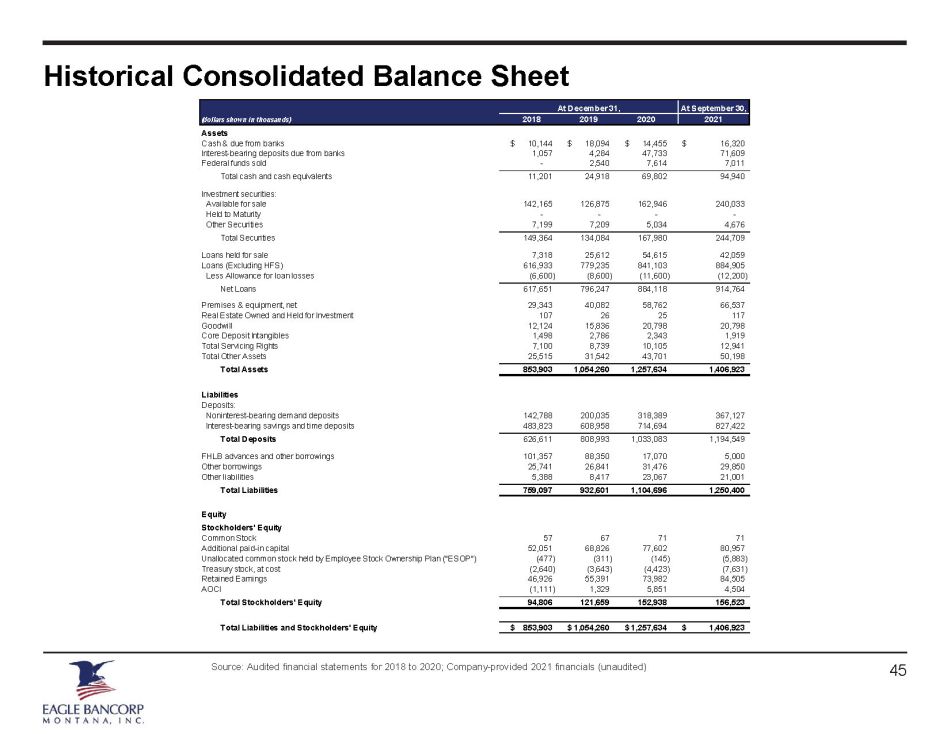
Historical Consolidated Balance Sheet Source: Audited financial statements for 2018 to 2020; Company - provided 2021 financials (unaudited) At December 31, At September 30, (dollars shown in thousands) 2018 2019 2020 2021 Assets Cash & due from banks 10,144$ 18,094$ 14,455$ 16,320$ Interest-bearing deposits due from banks 1,057 4,284 47,733 71,609 Federal funds sold - 2,540 7,614 7,011 Total cash and cash equivalents 11,201 24,918 69,802 94,940 Investment securities: Available for sale 142,165 126,875 162,946 240,033 Held to Maturity - - - - Other Securities 7,199 7,209 5,034 4,676 Total Securities 149,364 134,084 167,980 244,709 Loans held for sale 7,318 25,612 54,615 42,059 Loans (Excluding HFS) 616,933 779,235 841,103 884,905 Less Allowance for loan losses (6,600) (8,600) (11,600) (12,200) Net Loans 617,651 796,247 884,118 914,764 Premises & equipment, net 29,343 40,082 58,762 66,537 Real Estate Owned and Held for Investment 107 26 25 117 Goodwill 12,124 15,836 20,798 20,798 Core Deposit Intangibles 1,498 2,786 2,343 1,919 Total Servicing Rights 7,100 8,739 10,105 12,941 Total Other Assets 25,515 31,542 43,701 50,198 Total Assets 853,903 1,054,260 1,257,634 1,406,923 Liabilities Deposits: Noninterest-bearing demand deposits 142,788 200,035 318,389 367,127 Interest-bearing savings and time deposits 483,823 608,958 714,694 827,422 Total Deposits 626,611 808,993 1,033,083 1,194,549 FHLB advances and other borrowings 101,357 88,350 17,070 5,000 Other borrowings 25,741 26,841 31,476 29,850 Other liabilities 5,388 8,417 23,067 21,001 Total Liabilities 759,097 932,601 1,104,696 1,250,400 Equity Stockholders' Equity Common Stock 57 67 71 71 Additional paid-in capital 52,051 68,826 77,602 80,957 Unallocated common stock held by Employee Stock Ownership Plan ("ESOP") (477) (311) (145) (5,883) Treasury stock, at cost (2,640) (3,643) (4,423) (7,631) Retained Earnings 46,926 55,391 73,982 84,505 AOCI (1,111) 1,329 5,851 4,504 Total Stockholders' Equity 94,806 121,659 152,938 156,523 Total Liabilities and Stockholders' Equity 853,903$ 1,054,260$ 1,257,634$ 1,406,923$ 45

Historical Consolidated Income Statement Source: Audited financial statements for 2018 to 2020; Company - provided 2021 financials (unaudited) 46 For the Nine Months Ended September 30, (dollars shown in thousands) 2018 2019 2020 2021 Total Interest Income 34,843$ 46,511$ 49,654$ 36,933$ Total Interest Expense 5,102 7,726 6,484 2,438 Net Interest Income 29,741 38,785 43,170 34,495 Provision for Loan Losses 980 2,627 3,130 576 Net Interest Income after Provision for Loan Losses 28,761 36,158 40,040 33,919 Total Noninterest Income 12,363 23,790 48,343 38,043 Realized Gains (187) 69 733 11 Noninterest expense: 35,041 46,049 60,676 55,050 Pre-Tax Net Income 5,896$ 13,968$ 28,440$ 16,923$ Income Tax Expense 914 3,096 7,234 4,231 Net Income 4,982$ 10,872$ 21,206$ 12,692$

Non - GAAP Financial Measures 47 At December 31, September 30, Consolidated Tangible Common Equity 2016 2017 2018 2019 2020 2021 Total Common Equity $59,456 $83,616 $94,806 $121,659 $152,938 $156,523 Total Intangible Assets 7,418 7,307 13,622 18,622 23,141 22,717 Tangible Common Equity 52,038 76,309 81,184 103,037 129,797 133,806 Total Assets $673,925 $716,782 $853,903 $1,054,260 $1,257,634 $1,406,923 Total Intangible Assets 7,418 7,307 13,622 18,622 23,141 22,717 Tangible Assets 666,507 709,475 840,281 1,035,638 1,234,493 1,384,206 TCE / TA 7.81% 10.76% 9.66% 9.95% 10.51% 9.67% Source: S&P Capital IQ ($ in thousands)