Exhibit 99.1

D.A. Davidson 24 th Financial Institutions Conference May 4 - 6, 2022
2 Cautionary Notice Regarding Forward - Looking Statements This presentation includes “forward - looking statements” within the meaning of Section 27A of the Securities Act of 1933, as amen ded, and Section 21E of the Securities Exchange Act of 1934, as amended. Forward - looking statements are based on current expectations, estimates and projections about Eagle Bancorp Montana, I nc.’s business, beliefs of its management and assumptions made by its management. Any statement that does not describe historical or current facts is a forward - looking statement, including stat ements related to our projected growth, our anticipated acquisitions, including statements related to the expected timing, completion and other effects our anticipated acquisitions, our anticipated future fin ancial performance, and management’s long - term performance goals, as well as statements relating to the anticipated effects on results of operations and financial condition from expected developments or events, or business and growth strategies, including projections of future amortization and accretion, the impact of the anticipated internal growth and plans to establish or acquire banks. Forward - looki ng statements are typically identified by words such as “believe,” “expect,” “anticipate,” “intend,” “target,” “estimate,” “continue,” “positions,” “prospects” or “potential,” by future conditional verb s s uch as “will,” “would,” “should,” “could,” or “may,” or by variations of such words or by similar expressions. These statements are not guarantees of future performance and involve certain risks, uncertainties and ass umptions which are difficult to predict. Therefore, actual outcomes and results may differ materially from what is expressed or forecasted in such forward - looking statements. Potential risks and uncertainties include the following: ▪ the difficulties and risks inherent with entering new markets; ▪ general economic conditions (both generally and in our markets) may be less favorable than expected, which could result in, a mon g other things, a continued deterioration in credit quality, a further reduction in demand for credit and a further decline in real estate values; ▪ our ability to raise additional capital may be impaired if markets are disrupted or become more volatile; ▪ the ability to achieve the synergies and value creation contemplated by the inherited litigation with FCB; ▪ the ability to promptly and effectively integrate the businesses of Eagle Bancorp Montana, Inc. and FCB, including unexpected tr ansaction costs, including the costs of integrating operations, severance, professional fees, inherited litigation and other expenses; ▪ restrictions or conditions imposed by our regulators on our operations may make it more difficult for us to achieve our goals ; ▪ governmental monetary and fiscal polices as well as legislative or regulatory changes, including changes in accounting standa rds and compliance requirements, may adversely affect us; ▪ competitive pressures among depository and other financial institutions may increase significantly; ▪ changes in the interest rate environment may reduce margins or the volumes or values of the loans we make or have acquired; ▪ other financial institutions have greater financial resources and may be able to develop or acquire products that enable them to compete more successfully than we can; ▪ war or terrorist activities may cause further deterioration in the economy or cause instability in credit markets; ▪ duration and impact of the Covid - 19 pandemic; ▪ potential impairment charges; ▪ cyber incidents, or theft or loss of Company or customer data or money; ▪ economic, governmental or other factors may prevent the projected population, residential and commercial growth in the market s i n which we operate; and ▪ we will or may continue to face the risk factors discussed from time to time in the periodic reports we file with the SEC, in clu ding our Form 10 - K for the fiscal year ended December 31, 2021. For these forward - looking statements, we claim the protection of the safe harbor for forward - looking statements contained in the Private Securities Litigation Reform Act of 1995. You should not place undue reliance on the forward - looking statements, which speak only as of the date of this presentation. All subsequent written a nd oral forward - looking statements attributable to us or any person acting on our behalf are expressly qualified in their entirety by the cautionary statements contained or referred to in this section. W e u ndertake no obligation to publicly update or revise any forward - looking statements, whether as a result of new information, future events or otherwise. See Item 1A, Risk Factors, in our Annual Repo rt on Form 10 - K for the year ended December 31, 2021, and otherwise in our SEC reports and filings, for a description of some of the important factors that may affect actual outcomes.
COMMUNITY FOCUSED INSTITUTION □ Eagle Bancorp Montana, Inc . is the holding company for Opportunity Bank of Montana ; established in 1922 , the Bank is the 4 th largest bank headquartered in Montana with 32 banking offices and has deeply embedded itself as the bank of choice within the community □ Continued execution on commercial bank model following the transition from a thrift ▪ Established commercial bank charter in 2014 ; rebranded as Opportunity Bank of Montana ▪ Improving loan mix with higher yielding CRE credits and increasing commercial loans ▪ Improving deposit mix : non - CDs, at 89 % of total deposits as of March 31 , 2022 ▪ Positioned for NIM expansion and improved profitability ▪ Core lines of business include : retail lending, commercial and agricultural lending, deposit products and services and mortgage origination ▪ Interest rate risk profile showing asset sensitive balance sheet prepared for an increasing rate environment □ Continuation of strong credit culture ; excellent credit quality with NPAs of 44 bps as of March 31 , 2022 □ Track record of execution on strategic initiatives : ▪ Announced Acquisition of First Community Bank in October 2021 , completed April 30 , 2022 ▪ Announced Acquisition of Western Bank of Wolf Point in August 2019 , completed January 2020 ▪ Announced Acquisition of State Bank of Townsend in August 2018 , completed January 2019 ▪ Announced Acquisition of Ruby Valley Bank in September 2017 , completed January 2018 ▪ Successful acquisition and integration of seven branches from Sterling Financial in 2012 3
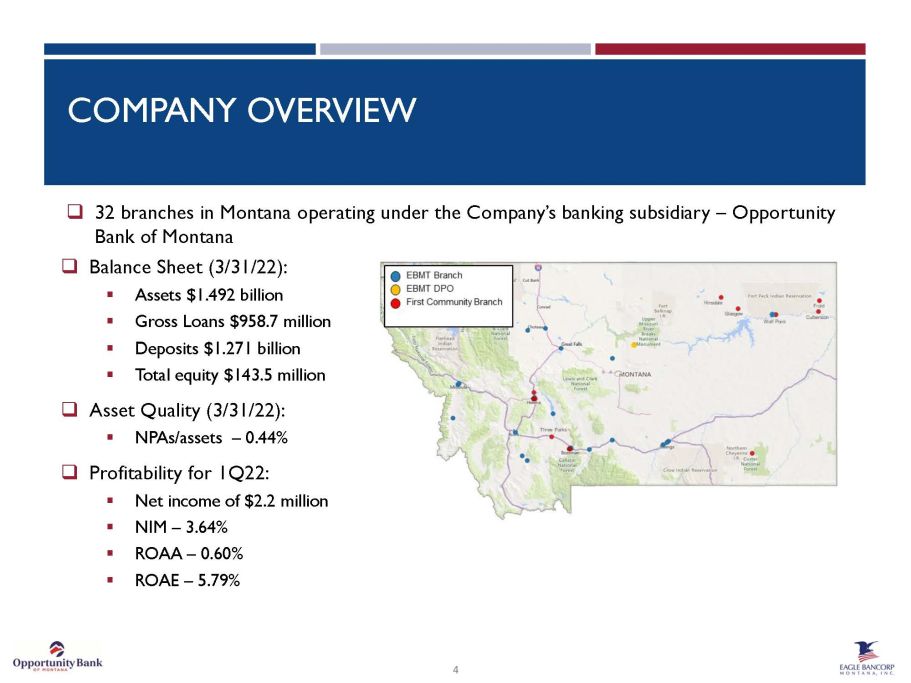
COMPANY OVERVIEW □ 32 branches in Montana operating under the Company’s banking subsidiary – Opportunity Bank of Montana □ Balance Sheet (3/31/22): ▪ Assets $1.492 billion ▪ Gross Loans $958.7 million ▪ Deposits $1.271 billion ▪ Total equity $143.5 million □ Asset Quality (3/31/22): ▪ NPAs/assets – 0.44% □ Profitability for 1Q22: ▪ Net income of $2.2 million ▪ NIM – 3.64% ▪ ROAA – 0.60% ▪ ROAE – 5.79% 4
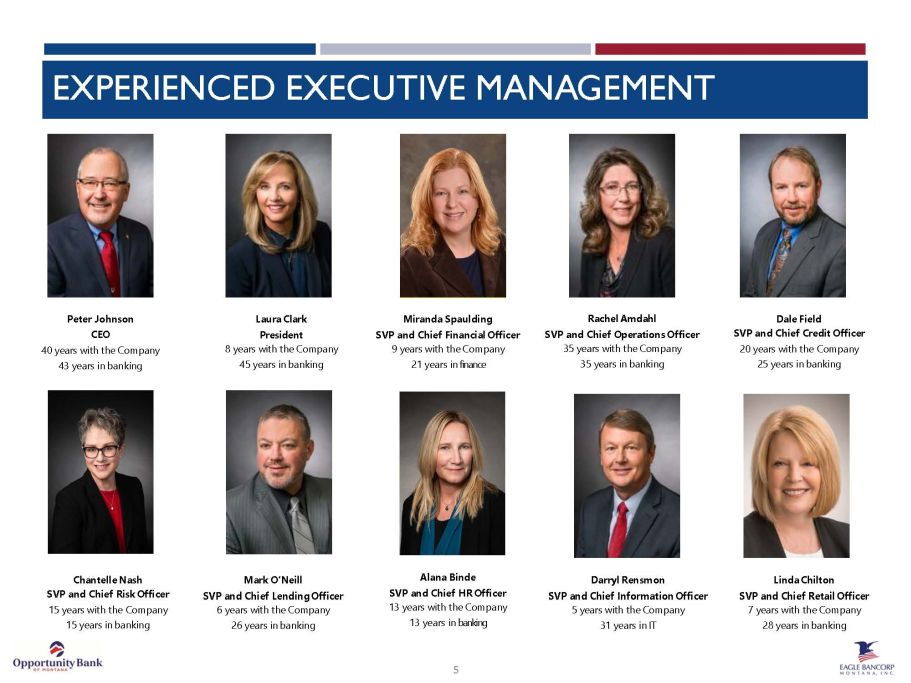
Peter Johnson CEO 40 years with the Company 4 3 years in banking Laura Clark President 8 years with the Company 4 5 years in banking Rachel Amdahl SVP and Chief Operations Officer 3 5 years with the Company 3 5 years in banking Dale Field SVP and Chief Credit Officer 20 years with the Company 2 5 years in banking Chantelle Nash SVP and Chief Risk Officer 1 5 years with the Company 1 5 years in banking Mark O’Neill SVP and Chief Lending Officer 6 years with the Company 2 6 years in banking Darryl Rensmon SVP and Chief Information Officer 5 years with the Company 31 years in IT Linda Chilton SVP and Chief Retail Officer 7 years with the Company 2 8 years in banking EXPERIENCED EXECUTIVE MANAGEMENT 5 Alana Binde SVP and Chief HR Officer 13 years with the Company 13 years in banking Miranda Spaulding SVP and Chief Financial Officer 9 years with the Company 21 years in finance
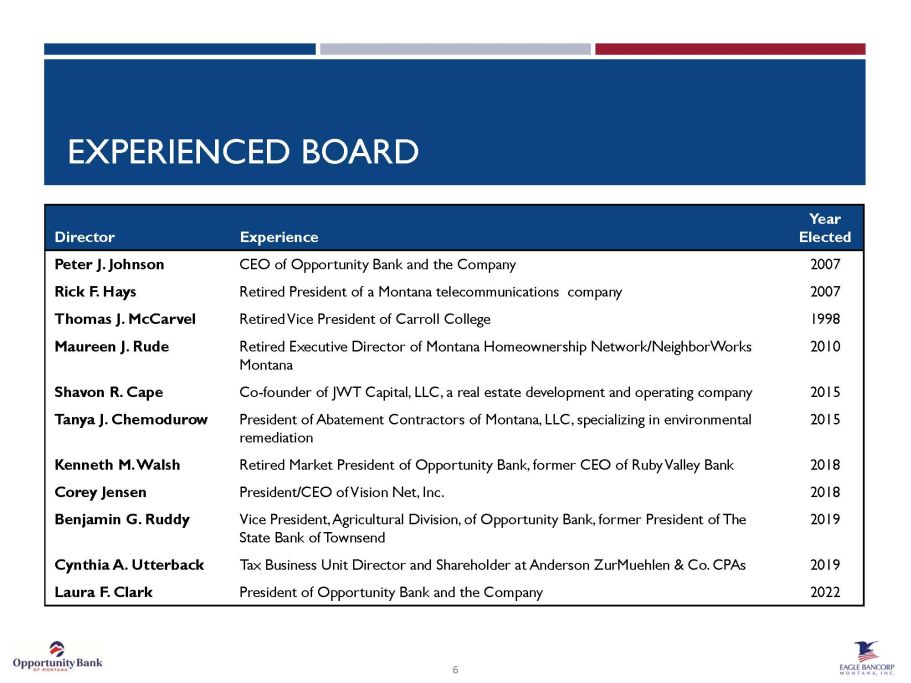
EXPERIENCED BOARD Director Experience Year Elected Peter J. Johnson CEO of Opportunity Bank and the Company 2007 Rick F. Hays Retired President of a Montana telecommunications company 2007 Thomas J. McCarvel Retired Vice President of Carroll College 1998 Maureen J. Rude Retired Executive Director of Montana Homeownership Network/NeighborWorks Montana 2010 Shavon R. Cape Co - founder of JWT Capital, LLC, a real estate development and operating company 2015 Tanya J. Chemodurow President of Abatement Contractors of Montana, LLC, specializing in environmental remediation 2015 Kenneth M. Walsh Retired Market President of Opportunity Bank, former CEO of Ruby Valley Bank 2018 Corey Jensen President/CEO of Vision Net, Inc. 2018 Benjamin G. Ruddy Vice President, Agricultural Division, of Opportunity Bank, former President of The State Bank of Townsend 2019 Cynthia A. Utterback Tax Business Unit Director and Shareholder at Anderson ZurMuehlen & Co. CPAs 2019 Laura F. Clark President of Opportunity Bank and the Company 2022 6

7 □ Continue to diversify our loan portfolio into commercial (C&I), commercial real estate and agriculture □ Attract and retain lower - cost core deposits □ Continue to expand our franchise through selective acquisitions and branch additions □ Maintain high asset quality levels □ Continue to operate as a community oriented financial institution BUSINESS STRATEGY
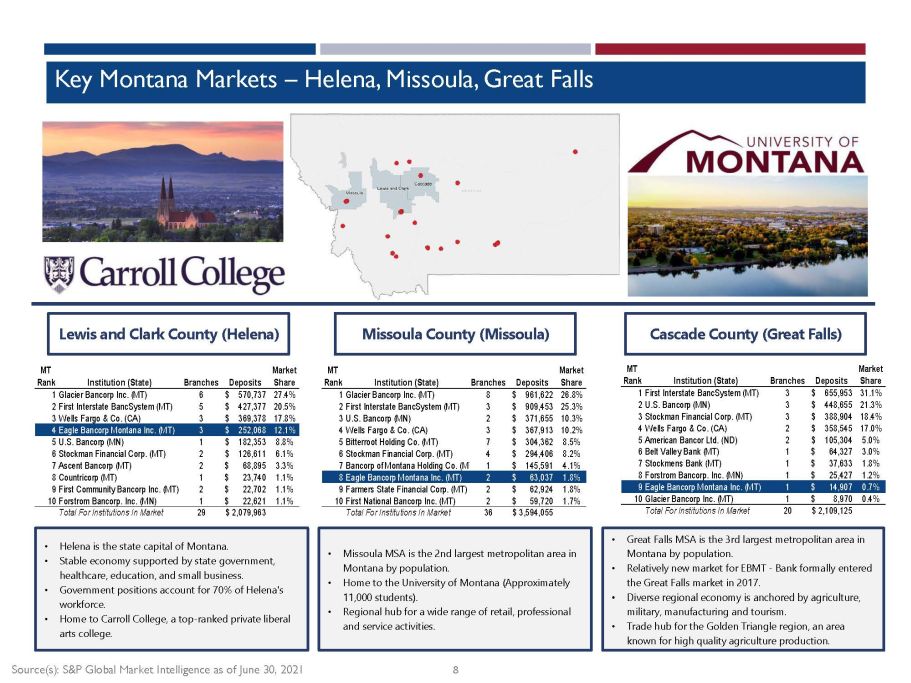
Key Montana Markets – Helena, Missoula, Great Falls Lewis and Clark County (Helena) Cascade County (Great Falls) Missoula County (Missoula) • Helena is the state capital of Montana. • Stable economy supported by state government, healthcare, education, and small business. • Government positions account for 70% of Helena's workforce. • Home to Carroll College, a top - ranked private liberal arts college. • Great Falls MSA is the 3rd largest metropolitan area in Montana by population. • Relatively new market for EBMT - Bank formally entered the Great Falls market in 2017. • Diverse regional economy is anchored by agriculture, military, manufacturing and tourism. • Trade hub for the Golden Triangle region, an area known for high quality agriculture production. • Missoula MSA is the 2nd largest metropolitan area in Montana by population. • Home to the University of Montana (Approximately 11,000 students). • Regional hub for a wide range of retail, professional and service activities. Source(s): S&P Global Market Intelligence as of June 30, 2021 MT Rank Institution (State) Branches Deposits Market Share 1Glacier Bancorp Inc. (MT) 6 570,737$ 27.4% 2First Interstate BancSystem (MT) 5 427,377$ 20.5% 3Wells Fargo & Co. (CA) 3 369,378$ 17.8% 4Eagle Bancorp Montana Inc. (MT) 3 252,068$ 12.1% 5U.S. Bancorp (MN) 1 182,353$ 8.8% 6Stockman Financial Corp. (MT) 2 126,611$ 6.1% 7Ascent Bancorp (MT) 2 68,895$ 3.3% 8Countricorp (MT) 1 23,740$ 1.1% 9First Community Bancorp Inc. (MT) 2 22,702$ 1.1% 10Forstrom Bancorp. Inc. (MN) 1 22,621$ 1.1% Total For Institutions In Market 29 2,079,963$ MT Rank Institution (State) Branches Deposits Market Share 1Glacier Bancorp Inc. (MT) 8 961,622$ 26.8% 2First Interstate BancSystem (MT) 3 909,453$ 25.3% 3U.S. Bancorp (MN) 2 371,655$ 10.3% 4Wells Fargo & Co. (CA) 3 367,913$ 10.2% 5Bitterroot Holding Co. (MT) 7 304,362$ 8.5% 6Stockman Financial Corp. (MT) 4 294,406$ 8.2% 7Bancorp of Montana Holding Co. (MT) 1 145,591$ 4.1% 8Eagle Bancorp Montana Inc. (MT) 2 63,037$ 1.8% 9Farmers State Financial Corp. (MT) 2 62,924$ 1.8% 10First National Bancorp Inc. (MT) 2 59,720$ 1.7% Total For Institutions In Market 36 3,594,055$ MT Rank Institution (State) Branches Deposits Market Share 1First Interstate BancSystem (MT) 3 655,953$ 31.1% 2U.S. Bancorp (MN) 3 448,655$ 21.3% 3Stockman Financial Corp. (MT) 3 388,904$ 18.4% 4Wells Fargo & Co. (CA) 2 358,545$ 17.0% 5American Bancor Ltd. (ND) 2 105,304$ 5.0% 6Belt Valley Bank (MT) 1 64,327$ 3.0% 7Stockmens Bank (MT) 1 37,633$ 1.8% 8Forstrom Bancorp. Inc. (MN) 1 25,427$ 1.2% 9Eagle Bancorp Montana Inc. (MT) 1 14,907$ 0.7% 10Glacier Bancorp Inc. (MT) 1 8,970$ 0.4% Total For Institutions In Market 20 2,109,125$ 8
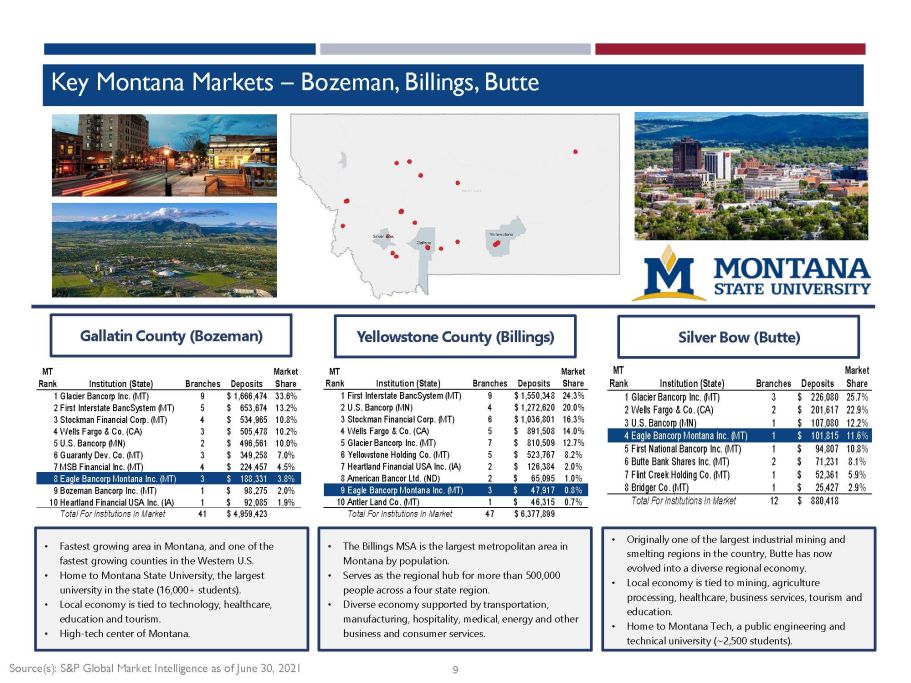
Key Montana Markets – Bozeman, Billings, Butte Gallatin County (Bozeman) Silver Bow (Butte) Yellowstone County (Billings) • Fastest growing area in Montana, and one of the fastest growing counties in the Western U.S. • Home to Montana State University, the largest university in the state (16,000+ students). • Local economy is tied to technology, healthcare, education and tourism. • High - tech center of Montana. • Originally one of the largest industrial mining and smelting regions in the country, Butte has now evolved into a diverse regional economy. • Local economy is tied to mining, agriculture processing, healthcare, business services, tourism and education. • Home to Montana Tech, a public engineering and technical university (~2,500 students). • The Billings MSA is the largest metropolitan area in Montana by population. • Serves as the regional hub for more than 500,000 people across a four state region. • Diverse economy supported by transportation, manufacturing, hospitality, medical, energy and other business and consumer services. Source(s): S&P Global Market Intelligence as of June 30, 2021 MT Rank Institution (State) Branches Deposits Market Share 1Glacier Bancorp Inc. (MT) 9 1,666,474$ 33.6% 2First Interstate BancSystem (MT) 5 653,674$ 13.2% 3Stockman Financial Corp. (MT) 4 534,965$ 10.8% 4Wells Fargo & Co. (CA) 3 505,478$ 10.2% 5U.S. Bancorp (MN) 2 496,561$ 10.0% 6Guaranty Dev. Co. (MT) 3 349,258$ 7.0% 7MSB Financial Inc. (MT) 4 224,457$ 4.5% 8Eagle Bancorp Montana Inc. (MT) 3 188,331$ 3.8% 9Bozeman Bancorp Inc. (MT) 1 98,275$ 2.0% 10Heartland Financial USA Inc. (IA) 1 92,085$ 1.9% Total For Institutions In Market 41 4,959,423$ MT Rank Institution (State) Branches Deposits Market Share 1Glacier Bancorp Inc. (MT) 3 226,080$ 25.7% 2Wells Fargo & Co. (CA) 2 201,617$ 22.9% 3U.S. Bancorp (MN) 1 107,080$ 12.2% 4Eagle Bancorp Montana Inc. (MT) 1 101,815$ 11.6% 5First National Bancorp Inc. (MT) 1 94,807$ 10.8% 6Butte Bank Shares Inc. (MT) 2 71,231$ 8.1% 7Flint Creek Holding Co. (MT) 1 52,361$ 5.9% 8Bridger Co. (MT) 1 25,427$ 2.9% Total For Institutions In Market 12 880,418$ 9 MT Rank Institution (State) Branches Deposits Market Share 1First Interstate BancSystem (MT) 9 1,550,348$ 24.3% 2U.S. Bancorp (MN) 4 1,272,620$ 20.0% 3Stockman Financial Corp. (MT) 6 1,036,801$ 16.3% 4Wells Fargo & Co. (CA) 5 891,508$ 14.0% 5Glacier Bancorp Inc. (MT) 7 810,509$ 12.7% 6Yellowstone Holding Co. (MT) 5 523,767$ 8.2% 7Heartland Financial USA Inc. (IA) 2 126,384$ 2.0% 8American Bancor Ltd. (ND) 2 65,095$ 1.0% 9Eagle Bancorp Montana Inc. (MT) 3 47,917$ 0.8% 10Antler Land Co. (MT) 1 46,315$ 0.7% Total For Institutions In Market 47 6,377,899$
10 □ On April 30, 2022, completed purchase of First Community Bancorp, Inc. and its subsidiary, First Community Bank. □ On January 21, 2022, issued and sold $40 million in aggregate principal amount of its 3.50% fixed - to - floating rate subordinated notes to certain institutional accredited investors and qualified institutional buyers through a private placement offering. □ Awarded 2021 Business of the Year by the Helena Area Chamber of Commerce. □ On June 10, 2020, sold $15 million in subordinated notes to certain qualified institutional accredited investors through a private placement offering. On January 1, 2020, completed purchase of Western Bank of Wolf Point, in Wolf Point, Montana. □ On January 1, 2019, completed purchase of The State Bank of Townsend, in Townsend, Montana. □ On January 31, 2018, completed purchase of Ruby Valley Bank, in Twin Bridges, Montana. □ Mortgage origination team is in the top 4 of market share in Helena, Billings, Bozeman, Butte, Missoula and Great Falls. Added 6 high performing loan originators during the past two years. COMPANY DEVELOPMENTS
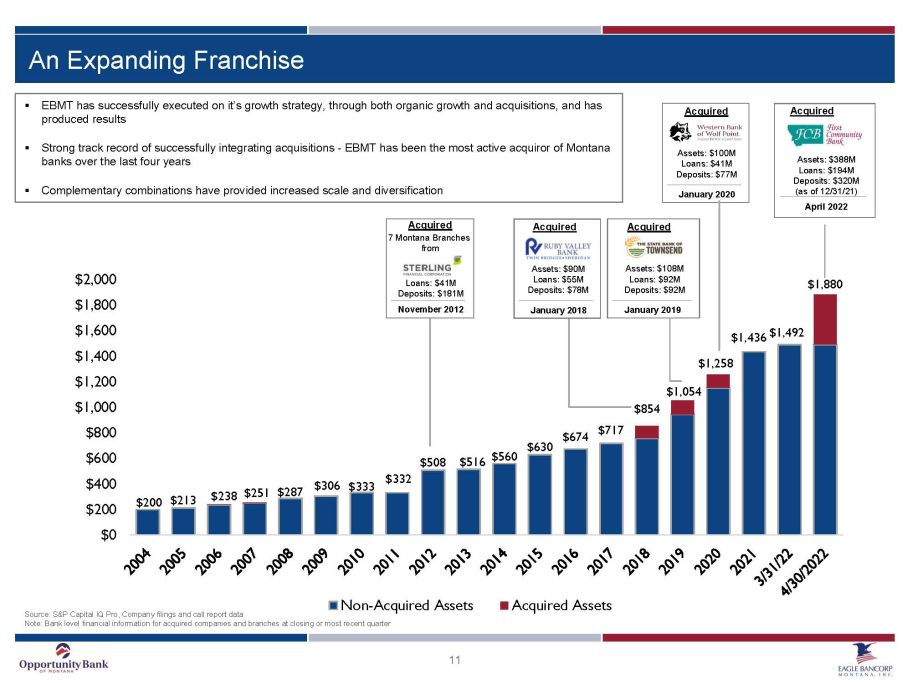
11 $200 $213 $238 $251 $287 $306 $333 $332 $508 $516 $560 $630 $674 $717 $854 $1,054 $1,258 $1,436 $1,492 $1,880 $0 $200 $400 $600 $800 $1,000 $1,200 $1,400 $1,600 $1,800 $2,000 Non-Acquired Assets Acquired Assets April 2022 Assets: $388M Loans: $194M Deposits: $320M (as of 12/31/21) Acquired An Expanding Franchise Source: S&P Capital IQ Pro, Company filings and call report data Note: Bank level financial information for acquired companies and branches at closing or most recent quarter ▪ EBMT has successfully executed on it’s growth strategy, through both organic growth and acquisitions, and has produced results ▪ Strong track record of successfully integrating acquisitions - EBMT has been the most active acquiror of Montana banks over the last four years ▪ Complementary combinations have provided increased scale and diversification November 2012 Loans: $41M Deposits: $181M Acquired 7 Montana Branches from January 2020 Assets: $100M Loans: $41M Deposits: $77M Acquired January 2019 Assets: $108M Loans: $92M Deposits: $92M Acquired January 2018 Assets: $90M Loans: $55M Deposits: $78M Acquired
FINANCIAL HIGHLIGHTS

NET INTEREST INCOME & NET INTEREST MARGIN $ 2 , 0 $ 3 , 0 $ 4 , 0 $ 5 , 0 $ 6 , 0 $ 7 , 0 $ 8 , 0 $ 9 , 0 $ 1 0 , 2 . 8 0 3 . 0 0 3 . 2 0 3 . 4 0 3 . 6 0 3 . 8 0 4 . 0 0 4 . 2 0 4 . 4 0 4 . 6 0 Net Interest Income Net Interest Margin 13 4.31% 4.15% 4.22% 4.04% 3.85% 3.83% 4.03% 3.97% 3.81% 3.87% 3.75% 3.64% 2.00% 2.50% 3.00% 3.50% 4.00% 4.50% $0 $2,000 $4,000 $6,000 $8,000 $10,000 $12,000 $14,000 2Q19 3Q19 4Q19 1Q20 2Q20 3Q20 4Q20 1Q21 2Q21 3Q21 4Q21 1Q22 Net Interest Income Net Interest Margin Net interest income in 000’s
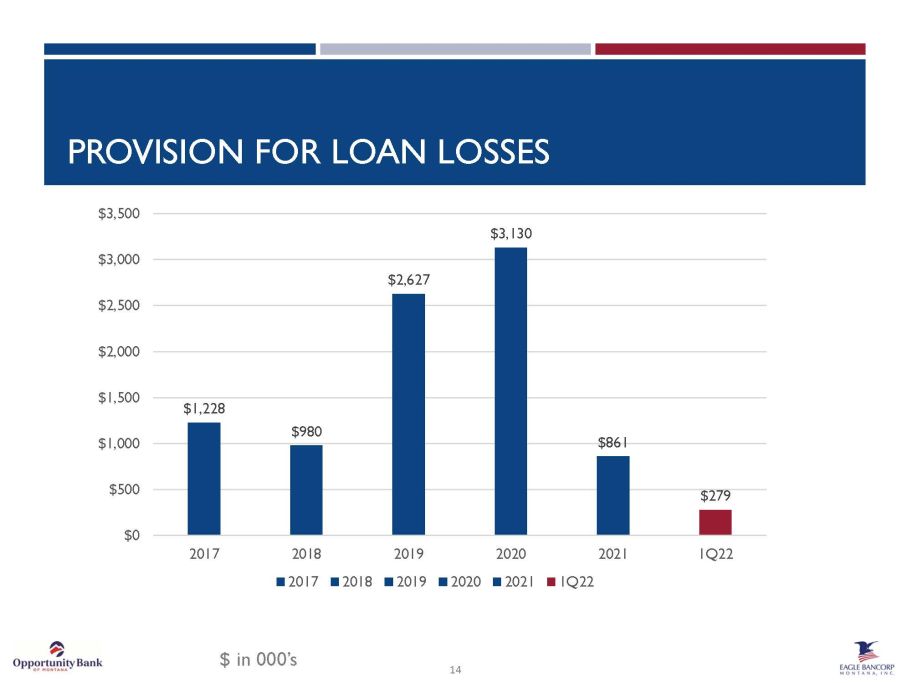
14 PROVISION FOR LOAN LOSSES $1,228 $980 $2,627 $3,130 $861 $279 $0 $500 $1,000 $1,500 $2,000 $2,500 $3,000 $3,500 2017 2018 2019 2020 2021 1Q22 2017 2018 2019 2020 2021 1Q22 $ in 000’s
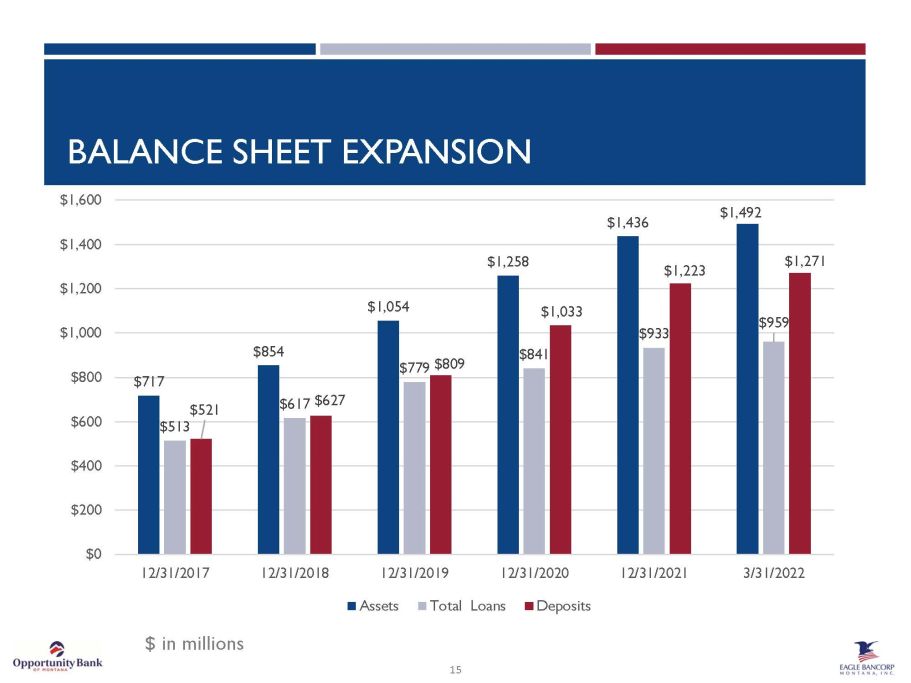
BALANCE SHEET EXPANSION 15 $717 $854 $1,054 $1,258 $1,436 $1,492 $513 $617 $779 $841 $933 $959 $521 $627 $809 $1,033 $1,223 $1,271 $0 $200 $400 $600 $800 $1,000 $1,200 $1,400 $1,600 12/31/2017 12/31/2018 12/31/2019 12/31/2020 12/31/2021 3/31/2022 Assets Total Loans Deposits $ in millions
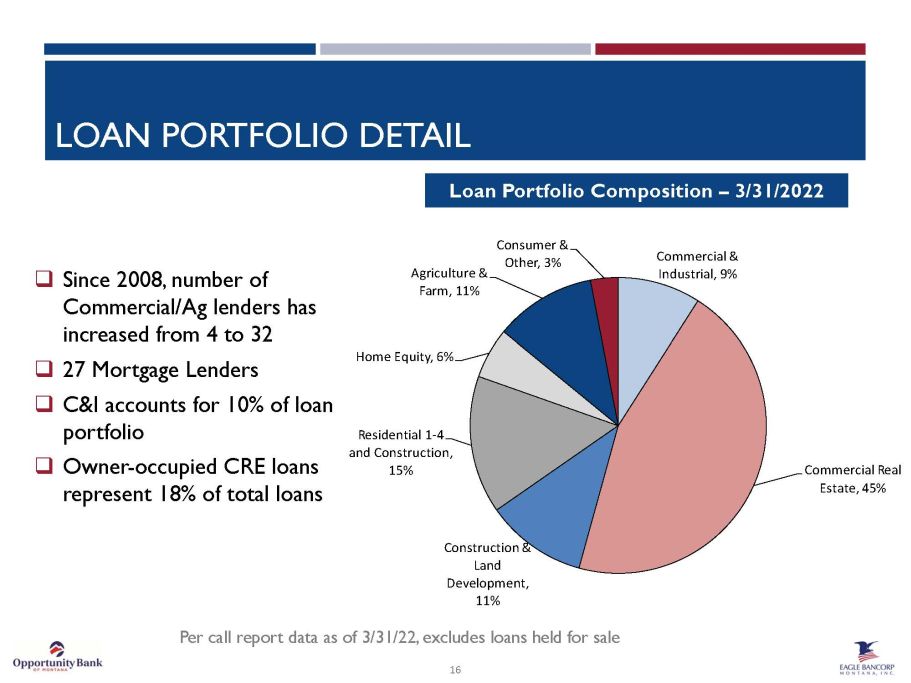
16 Loan Portfolio Composition – 3/31/2022 □ Since 2008, number of Commercial/Ag lenders has increased from 4 to 32 □ 27 Mortgage Lenders □ C&I accounts for 10% of loan portfolio □ Owner - occupied CRE loans represent 18% of total loans Per call report data as of 3/31/22, excludes loans held for sale LOAN PORTFOLIO DETAIL Commercial & Industrial, 9% Commercial Real Estate , 45% Construction & Land Development , 11% Residential 1 - 4 and Construction , 15% Home Equity , 6% Agriculture & Farm , 11% Consumer & Other, 3%
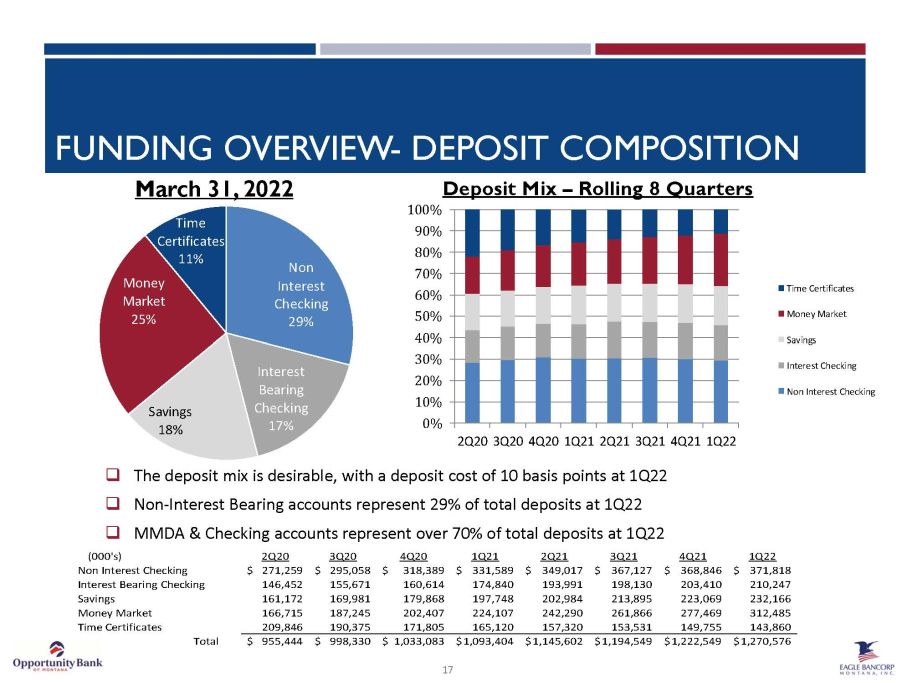
Non Interest Checking 29% Interest Bearing Checking 17% Savings 18% Money Market 25% Time Certificates 11% 0% 10% 20% 30% 40% 50% 60% 70% 80% 90% 100% 2Q20 3Q20 4Q20 1Q21 2Q21 3Q21 4Q21 1Q22 Time Certificates Money Market Savings Interest Checking Non Interest Checking March 31, 2022 Deposit Mix – Rolling 8 Quarters □ The deposit mix is desirable, with a deposit cost of 10 basis points at 1Q22 □ Non - Interest Bearing accounts represent 29% of total deposits at 1Q22 □ MMDA & Checking accounts represent over 70% of total deposits at 1Q22 (000's) 2Q20 3Q20 4Q20 1Q21 2Q21 3Q21 4Q21 1Q22 Non Interest Checking 271,259$ 295,058$ 318,389$ 331,589$ 349,017$ 367,127$ 368,846$ 371,818$ Interest Bearing Checking 146,452 155,671 160,614 174,840 193,991 198,130 203,410 210,247 Savings 161,172 169,981 179,868 197,748 202,984 213,895 223,069 232,166 Money Market 166,715 187,245 202,407 224,107 242,290 261,866 277,469 312,485 Time Certificates 209,846 190,375 171,805 165,120 157,320 153,531 149,755 143,860 Total 955,444$ 998,330$ 1,033,083$ 1,093,404$ 1,145,602$ 1,194,549$ 1,222,549$ 1,270,576$ 17 FUNDING OVERVIEW - DEPOSIT COMPOSITION
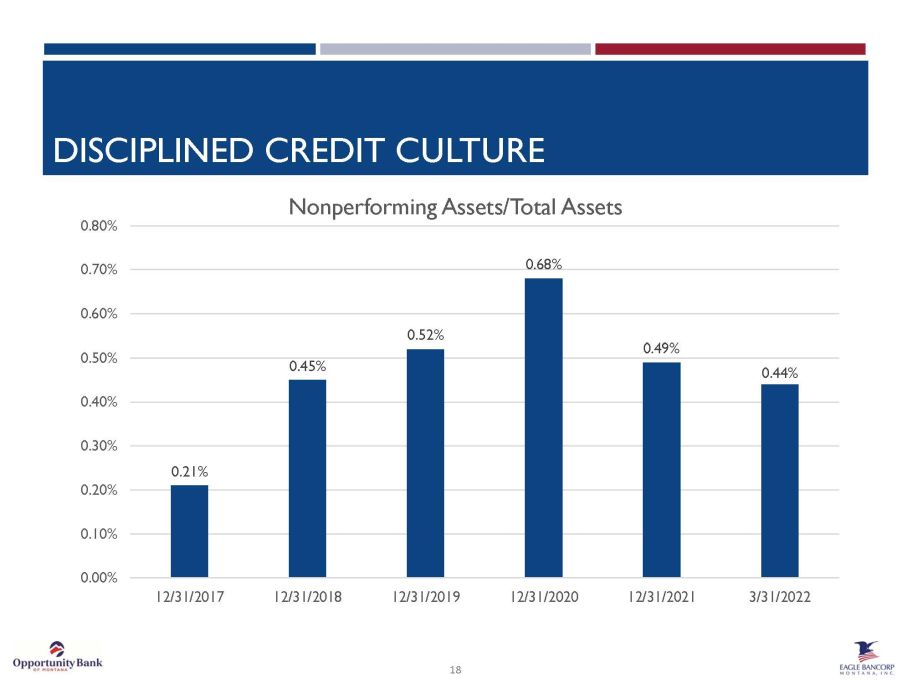
18 DISCIPLINED CREDIT CULTURE 0.21% 0.45% 0.52% 0.68% 0.49% 0.44% 0.00% 0.10% 0.20% 0.30% 0.40% 0.50% 0.60% 0.70% 0.80% 12/31/2017 12/31/2018 12/31/2019 12/31/2020 12/31/2021 3/31/2022 Nonperforming Assets/Total Assets

YIELD AND COST OF FUNDS 0.00% 1.00% 2.00% 3.00% 4.00% 5.00% 6.00% 2017Y 2018Y 2019Y 2020Y 2021Y 1Q22 Yield on Average Earning Assets EBMT Peer Group 4.00% 4.50% 5.00% 5.50% 6.00% 2017Y 2018Y 2019Y 2020Y 2021Y 1Q22 Yield on Loans EBMT Peer Group 0.00% 0.20% 0.40% 0.60% 0.80% 1.00% 1.20% 2017Y 2018Y 2019Y 2020Y 2021Y 1Q22 Cost of Funds EBMT 19 Peer Group data as of 12/31/21 and includes PFLC, RVSB, CSHX, FSBW, TSBK, SFBC, OVLY, CVCY, NRIM, CZBC, SSBI, & FNRN Source: S&P Global Market Intelligence

CAPITAL STRENGTH 20 □ Authorized the repurchase of up to 400,000 shares of its common stock, representing approximately 5.00% of outstanding shares. Total Assets 853,903$ 1,054,260$ 1,257,634$ 1,435,926$ 1,492,053$ Total Common Stockholders' Equity 94,806$ 121,659$ 152,938$ 156,729$ 143,523$ Total Regulatory Capital 104,186$ 126,711$ 156,897$ 164,639$ 204,328$ Tier 1 Leverage Ratio 10.51% 10.52% 10.61% 9.75% 9.40% Tier 1 Risk Based Capital Ratio 13.83% 13.58% 14.17% 12.64% 11.99% Total Risk Based Capital Ratio 16.45% 15.92% 17.04% 15.18% 17.93% Common Equity Tier 1 (CETI) Ratio 13.04% 12.95% 13.62% 12.18% 11.55% Tangible Common Equity Ratio 9.66% 9.95% 10.51% 9.49% 8.24% 3/31/2022($ in 000s) 2019Y 2020Y 2021Y2018Y
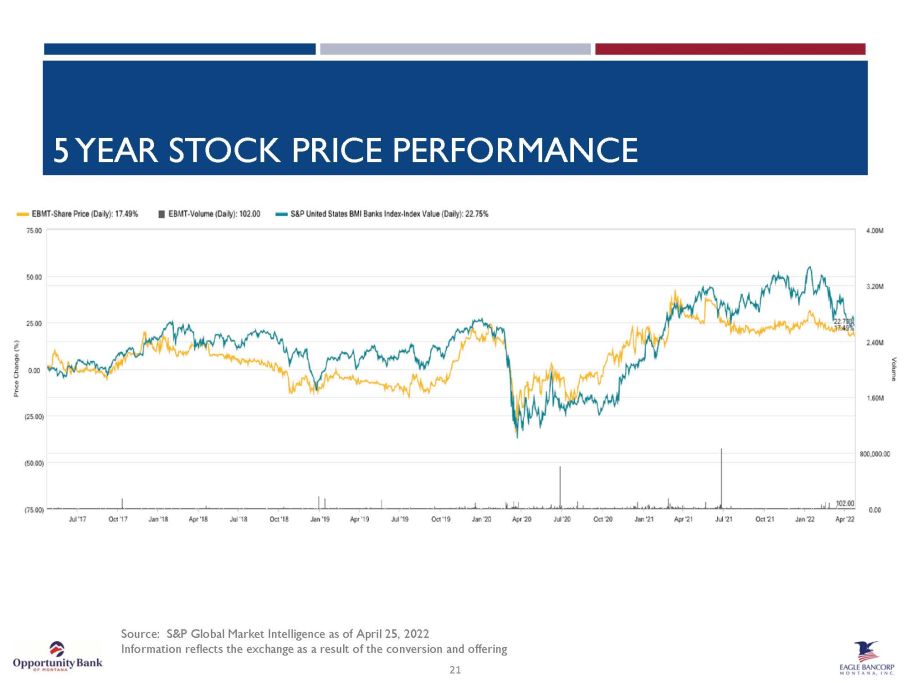
21 Source: S&P Global Market Intelligence as of April 25, 2022 Information reflects the exchange as a result of the conversion and offering 5 YEAR STOCK PRICE PERFORMANCE

Pete Johnson CEO Office: (406) 442 - 3080 Direct: (406) 457 - 4006 pjohnson@oppbank.com Laura Clark President Office: (406) 442 - 3080 Direct: (406) 457 - 4007 lclark@oppbank.com www.opportunitybank.com 1400 Prospect Avenue P.O. Box 4999 Helena, MT 59604 Miranda Spaulding SVP and Chief Financial Officer Office: (406) 442 - 3080 Direct: (406) 441 - 5010 mspaulding@oppbank.com