UNITED STATES
SECURITIES AND EXCHANGE COMMISSION
Washington, D.C. 20549
FORM N-CSR
CERTIFIED SHAREHOLDER REPORT OF REGISTERED
MANAGEMENT INVESTMENT COMPANIES
Investment Company Act file number 811- 22733
John Hancock Exchange-Traded Fund Trust (Exact name of registrant as specified in charter)
200 Berkeley Street, Boston, Massachusetts 02116 (Address of principal executive offices) (Zip code)
Salvatore Schiavone
Treasurer
200 Berkeley Street
Boston, Massachusetts 02116
(Name and address of agent for service)
Registrant's telephone number, including area code: 617-543-9634
Date of fiscal year end: | April 30 |
Date of reporting period: | October 31, 2021 |
ITEM 1. REPORTS TO STOCKHOLDERS
The Registrant prepared two semi-annual reports to shareholders, including seventeen funds, for the period ended October 31, 2021, for series of John Hancock Exchange-Traded Funds Trust with April 30 fiscal year end. The first report applies to fifteen John Hancock Multifactor ETF Funds and the second report applies to two John Hancock Fixed Income ETF funds.
Semiannual report
John Hancock
Multifactor ETFs
ETF
October 31, 2021
A message to shareholders
Dear shareholder,
Equities delivered robust returns during the six months ended October 31, 2021. Although the outlook for economic growth, corporate earnings, and U.S. Federal Reserve policy became less favorable than it had been earlier in the year, investors continued to pour cash into stocks at a time of relatively limited return opportunities in the bond market. World monetary policy was also highly supportive, with most global central banks holding interest rates near zero and maintaining their stimulative quantitative easing programs even as the economy recovered.
As new variants of COVID-19 emerge, the markets get increasingly volatile and economic disruptions may occur. In these uncertain times, your financial professional can assist with positioning your portfolio so that it’s sufficiently diversified to help meet your long-term objectives and to withstand the inevitable bouts of market volatility along the way.
On behalf of everyone at John Hancock Investment Management, I’d like to take this opportunity to welcome new shareholders and thank existing shareholders for the continued trust you’ve placed in us.
Sincerely,
Andrew G. Arnott
President and CEO,
John Hancock Investment Management
Head of Wealth and Asset Management,
United States and Europe
This commentary reflects the CEO’s views as of this report’s period end and are subject to change at any time. Diversification does not guarantee investment returns and does not eliminate risk of loss. All investments entail risks, including the possible loss of principal. For more up-to-date information, you can visit our website at jhinvestments.com.
John Hancock
Multifactor ETFs
| | SEMIANNUAL REPORT | JOHN HANCOCK MULTIFACTOR ETFS | 1 |
Multifactor exchange-traded funds (ETFs) at a glance
Many traditional indexes and index funds are weighted by market capitalization, a bias that can expose investors to certain risks and potentially reduce returns. Strategic beta strategies such as John Hancock Multifactor ETFs offer a different approach. Each ETF seeks to improve on cap-weighted strategies by tracking an index that combines active management insight with the discipline of a rules based approach.
STRATEGIC BETA1: STRIKING A BALANCE BETWEEN ACTIVE AND PASSIVE INVESTING
PHILOSOPHY BACKING INDEX DESIGN
According to Dimensional Fund Advisors, subadvisor for all John Hancock Multifactor ETFs, there are four key factors that drive higher expected returns, and these factors guide Dimensional’s index construction and semiannual reconstitution.
Market
Equity premium—stocks over bonds
Company size
Small-cap premium—small company stocks over large company stocks
Relative price2
Value premium—value stocks over growth stocks
Profitability3
Profitability premium—stocks of highly profitable companies over stocks of less profitable companies
To be considered a true factor, a premium must be sensible, persistent across time periods, pervasive across markets, robust in data, and cost effective.
WHY MULTIFACTOR?
Individual factors can be volatile: there’s no telling which will be the best performing from year to year. Adopting a multifactor approach is one way investors can pursue more consistent—and more attractive—risk-adjusted returns.
1 Strategic beta (also known as smart beta) defines a set of investment strategies that seek to improve on traditional market-capitalization weighted indexes in order to lower risk and achieve better diversification.
2 Relative price as measured by the price-to-book ratio; value stocks are those with lower price-to-book ratios.
3 Profitability is a measure of current profitability, based on information from individual companies’ income statements.
| 2 | JOHN HANCOCK MULTIFACTOR ETFS | SEMIANNUAL REPORT | |
Notes about risk
Each fund is subject to various risks as described in the fund’s prospectus. The novel COVID-19 disease has resulted in significant disruptions to global business activity. A widespread health crisis such as a global pandemic could cause substantial market volatility, exchange trading suspensions and closures, which may lead to less liquidity in certain instruments, industries, sectors or the markets generally, and may ultimately affect fund performance. For more information, please refer to the “Principal risk” section of the prospectus. Current and future portfolio holdings are subject to change and risk. Investing involves risk, including the potential loss of principal. There is no guarantee that a fund’s investment strategy will be successful and there can be no assurance that active trading markets for shares will develop or be maintained by market makers or authorized participants.
A note about the performance shown on the following pages
Net asset value (NAV) performance is based on the NAV calculated each business day. It is calculated in accordance with the standard formula for valuing investment company shares as of the close of regular trading hours on the NYSE (see Note 2 to financial statements). Market price is determined using the bid/ask midpoint at 4 P.M. Eastern time, when the NAV is typically calculated. Your returns may differ if you traded shares at other times during the day.
The past performance shown here reflects reinvested distributions and the beneficial effect of any expense reductions, and does not guarantee future results. Returns for periods shorter than one year are cumulative. Shares will fluctuate in value and, when redeemed, may be worth more or less than their original cost. Current performance may be lower or higher than the performance cited. For the most recent month-end performance, visit jhinvestments.com/etf.
| | SEMIANNUAL REPORT | JOHN HANCOCK MULTIFACTOR ETFS | 3 |
Multifactor Consumer Discretionary ETF
AVERAGE ANNUAL TOTAL RETURNS AS OF 10/31/2021 (%)
| Average annual total returns (%) | Cumulative total returns (%) |
| | 1-Year | 5-Year | Since fund
inception1 | 6-month | 5-year | Since fund
inception1 |
| Net asset value | 47.39 | 18.79 | 15.42 | 7.45 | 136.56 | 139.56 |
| Market price | 47.38 | 18.79 | 15.42 | 7.43 | 136.49 | 139.58 |
| John Hancock Dimensional Consumer Discretionary Index2 | 48.03 | 19.30 | 15.92 | 7.67 | 141.62 | 146.01 |
| Russell 1000 Consumer Discretionary Index3 | 40.03 | 22.97 | 19.59 | 8.22 | 181.16 | 197.39 |
| 1 | From 9-28-15. |
| 2 | The John Hancock Dimensional Consumer Discretionary Index is a rules-based index of U.S. consumer discretionary stocks that have been selected based on sources of expected returns. Securities eligible for inclusion in the index are classified according to their market capitalization, as defined by free-float market cap; relative price, as defined by price/book; and profitability, as defined by operating income over book, and are weighted accordingly in favor of smaller, less expensive, more profitable companies. The index is reconstituted and rebalanced on a semiannual basis. Index performance assumes reinvestment of dividends and, unless otherwise indicated, does not reflect the management fees, operating expenses, transaction costs, and other expenses that apply to an ETF. |
| 3 | The Russell 1000 Consumer Discretionary Index comprises securities of the Russell 1000 Index classified in the consumer discretionary sector. Effective 9-21-20, the underlying components of the Russell 1000 Consumer Discretionary Index reflect a new company classification methodology. Consequently, the custom blended benchmark’s performance consists of 100% of the prior methodology through 9-20-20 and 100% of the current methodology thereafter. |
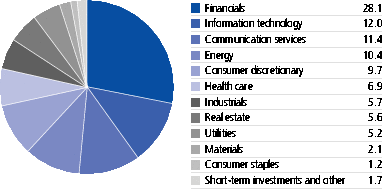
| INDUSTRY COMPOSITION (% of net assets) |
| Specialty retail | 27.8 |
| Hotels, restaurants and leisure | 20.3 |
| Automobiles | 11.9 |
| Textiles, apparel and luxury goods | 9.1 |
| Internet and direct marketing retail | 8.8 |
| Multiline retail | 6.5 |
| Leisure products | 3.0 |
| Household durables | 2.7 |
| Commercial services and supplies | 1.9 |
| Road and rail | 1.7 |
| Other | 6.3 |
| TOTAL | 100.0 |
GROWTH OF $10,000
This chart shows what happened to a hypothetical $10,000 investment in John Hancock Multifactor Consumer Discretionary ETF for the periods indicated, assuming all distributions were reinvested. For comparison, we’ve shown the same investment in two separate indexes.
| TOP TEN HOLDINGS4 (% of net assets) |
| Tesla, Inc. | 8.0 |
| The Home Depot, Inc. | 5.4 |
| Amazon.com, Inc. | 5.3 |
| Target Corp. | 3.2 |
| NIKE, Inc., Class B | 3.0 |
| Lowe’s Companies, Inc. | 2.3 |
| Best Buy Company, Inc. | 2.1 |
| McDonald’s Corp. | 2.0 |
| The TJX Companies, Inc. | 1.8 |
| General Motors Company | 1.8 |
| TOTAL | 34.9 |
The value of a $10,000 investment calculated at market value from inception through period end would be $23,958.
The chart and table above do not reflect the deduction of taxes that a shareholder would pay on fund distributions or the redemption or sale of fund shares.
It is not possible to invest directly in an index. Unlike an index, the fund’s total returns are reduced by operating expenses and management fees.
| 4 | Listed holdings are a portion of the fund’s total and may change at any time. They are not recommendations to buy or sell any security. Data excludes cash and cash equivalents. |
The expense ratios of the fund, both net (including any fee waivers and/or expense limitations) and gross (excluding any fee waivers and/or expense limitations), are set forth according to the most recent publicly available prospectus for the fund and may differ from those disclosed in the Financial highlights table in this report. Net expenses reflect contractual expense limitations in effect until August 31, 2022 and are subject to change. Had the contractual fee waivers and expense limitations not been in place, gross expenses would apply. The expense ratios are as follows:
Please refer to the most recent prospectus and annual or semiannual report for more information on expenses and any expense limitation arrangements for the fund.
| 4 | JOHN HANCOCK MULTIFACTOR ETFS | SEMIANNUAL REPORT | |
Multifactor Consumer Staples ETF
AVERAGE ANNUAL TOTAL RETURNS AS OF 10/31/2021 (%)
| Average annual total returns (%) | Cumulative total returns (%) |
| | 1-Year | 5-Year | Since fund
inception1 | 6-month | 5-year | Since fund
inception1 |
| Net asset value | 18.79 | 8.83 | 8.28 | 1.07 | 52.65 | 56.10 |
| Market price | 18.70 | 8.82 | 8.28 | 1.04 | 52.57 | 56.06 |
| John Hancock Dimensional Consumer Staples Index2 | 19.31 | 9.30 | 8.75 | 1.28 | 55.96 | 59.91 |
| Russell 1000 Consumer Staples Index3 | 19.62 | 7.09 | 6.83 | 2.50 | 40.81 | 44.74 |
| 1 | From 3-28-16. |
| 2 | The John Hancock Dimensional Consumer Staples Index is a rules-based index of U.S. consumer staples stocks that have been selected based on sources of expected returns. Securities eligible for inclusion in the index are classified according to their market capitalization, as defined by free-float market cap; relative price, as defined by price/book; and profitability, as defined by operating income over book, and are weighted accordingly in favor of smaller, less expensive, more profitable companies. The index is reconstituted and rebalanced on a semiannual basis. Index performance assumes reinvestment of dividends and, unless otherwise indicated, does not reflect the management fees, operating expenses, transaction costs, and other expenses that apply to an ETF. |
| 3 | The Russell 1000 Consumer Staples Index comprises securities of the Russell 1000 Index classified in the consumer staples sector. Effective 9-21-20, the underlying components of the Russell 1000 Consumer Staples Index reflect a new company classification methodology. Consequently, the custom blended benchmark’s performance consists of 100% of the prior methodology through 9-20-20 and 100% of the current methodology thereafter. |
| INDUSTRY COMPOSITION (% of net assets) |
| Food products | 28.9 |
| Food and staples retailing | 25.2 |
| Beverages | 20.8 |
| Household products | 14.6 |
| Tobacco | 5.7 |
| Chemicals | 3.5 |
| Household durables | 0.8 |
| Personal products | 0.4 |
| Short-term investments and other | 0.1 |
| TOTAL | 100.0 |
GROWTH OF $10,000
This chart shows what happened to a hypothetical $10,000 investment in John Hancock Multifactor Consumer Staples ETF for the periods indicated, assuming all distributions were reinvested. For comparison, we’ve shown the same investment in two separate indexes.
| TOP TEN HOLDINGS4 (% of net assets) |
| Costco Wholesale Corp. | 6.5 |
| PepsiCo, Inc. | 6.3 |
| Walmart, Inc. | 6.1 |
| The Procter & Gamble Company | 6.1 |
| The Coca-Cola Company | 6.0 |
| Mondelez International, Inc., Class A | 3.7 |
| The Kroger Company | 3.4 |
| Philip Morris International, Inc. | 3.3 |
| Archer-Daniels-Midland Company | 3.1 |
| Constellation Brands, Inc., Class A | 3.0 |
| TOTAL | 47.5 |
The value of a $10,000 investment calculated at market value from inception through period end would be $15,606.
The chart and table above do not reflect the deduction of taxes that a shareholder would pay on fund distributions or the redemption or sale of fund shares.
It is not possible to invest directly in an index. Unlike an index, the fund’s total returns are reduced by operating expenses and management fees.
| 4 | Listed holdings are a portion of the fund’s total and may change at any time. They are not recommendations to buy or sell any security. Data excludes cash and cash equivalents. |
The expense ratios of the fund, both net (including any fee waivers and/or expense limitations) and gross (excluding any fee waivers and/or expense limitations), are set forth according to the most recent publicly available prospectus for the fund and may differ from those disclosed in the Financial highlights table in this report. Net expenses reflect contractual expense limitations in effect until August 31, 2022 and are subject to change. Had the contractual fee waivers and expense limitations not been in place, gross expenses would apply. The expense ratios are as follows:
Please refer to the most recent prospectus and annual or semiannual report for more information on expenses and any expense limitation arrangements for the fund.
| | SEMIANNUAL REPORT | JOHN HANCOCK MULTIFACTOR ETFS | 5 |
Multifactor Developed International ETF
AVERAGE ANNUAL TOTAL RETURNS AS OF 10/31/2021 (%)
| Average annual total returns (%) | Cumulative total returns (%) |
| | 1-Year | Since fund
inception1 | 6-month | Since fund
inception1 |
| Net asset value | 33.91 | 9.04 | 3.68 | 52.56 |
| Market price | 34.04 | 9.15 | 4.56 | 53.29 |
| John Hancock Dimensional Developed International Index2 | 34.91 | 9.83 | 3.98 | 58.00 |
| MSCI EAFE Index3 | 34.18 | 9.60 | 4.14 | 56.41 |
| 1 | From 12-15-16. |
| 2 | The John Hancock Dimensional Developed International Index is a rules-based index of large-cap stocks in developed markets outside of North America that have been selected based on sources of expected returns. Securities eligible for inclusion in the index are classified according to their market capitalization, as defined by free-float market cap; relative price, as defined by price/book; and profitability, as defined by operating income over book, and are weighted accordingly in favor of smaller, less expensive, more profitable companies. The index is reconstituted and rebalanced on a semiannual basis. Index performance assumes reinvestment of dividends and, unless otherwise indicated, does not reflect the management fees, operating expenses, transaction costs, and other expenses that apply to an ETF. |
| 3 | The MSCI Europe, Australasia, and Far East (EAFE) Index tracks the performance of publicly traded large- and mid-cap stocks of companies in those regions. |
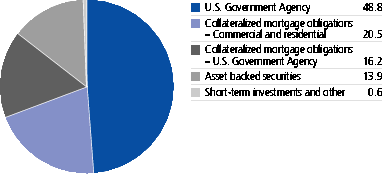
| SECTOR COMPOSITION (% of net assets) |
| Industrials | 17.4 |
| Financials | 16.5 |
| Consumer discretionary | 13.1 |
| Health care | 10.1 |
| Materials | 10.0 |
| Consumer staples | 8.6 |
| Information technology | 7.1 |
| Communication services | 5.9 |
| Utilities | 4.1 |
| Energy | 3.5 |
| Real estate | 2.5 |
| Short-term investments and other | 1.2 |
| TOTAL | 100.0 |
| |
GROWTH OF $10,000
This chart shows what happened to a hypothetical $10,000 investment in John Hancock Multifactor Developed International ETF for the periods indicated, assuming all distributions were reinvested. For comparison, we’ve shown the same investment in two separate indexes.
| TOP TEN HOLDINGS4 (% of net assets) |
| Nestle SA | 1.6 |
| ASML Holding NV | 1.3 |
| Toyota Motor Corp. | 1.2 |
| Roche Holding AG | 1.0 |
| LVMH Moet Hennessy Louis Vuitton SE | 0.8 |
| Novartis AG | 0.8 |
| Novo Nordisk A/S, B Shares | 0.7 |
| Cie Generale des Etablissements Michelin SCA | 0.7 |
| Royal Dutch Shell PLC, B Shares | 0.7 |
| AIA Group, Ltd. | 0.7 |
| TOTAL | 9.5 |
The value of a $10,000 investment calculated at market value from inception through period end would be $15,329.
The chart and table above do not reflect the deduction of taxes that a shareholder would pay on fund distributions or the redemption or sale of fund shares.
It is not possible to invest directly in an index. Unlike an index, the fund’s total returns are reduced by operating expenses and management fees.
| 4 | Listed holdings are a portion of the fund’s total and may change at any time. They are not recommendations to buy or sell any security. Data excludes cash and cash equivalents. |
The expense ratios of the fund, both net (including any fee waivers and/or expense limitations) and gross (excluding any fee waivers and/or expense limitations), are set forth according to the most recent publicly available prospectus for the fund and may differ from those disclosed in the Financial highlights table in this report. Net expenses reflect contractual expense limitations in effect until August 31, 2022 and are subject to change. Had the contractual fee waivers and expense limitations not been in place, gross expenses would apply. The expense ratios are as follows:
Please refer to the most recent prospectus and annual or semiannual report for more information on expenses and any expense limitation arrangements for the fund.
| 6 | JOHN HANCOCK MULTIFACTOR ETFS | SEMIANNUAL REPORT | |
Multifactor Emerging Markets ETF
AVERAGE ANNUAL TOTAL RETURNS AS OF 10/31/2021 (%)
| Average annual total returns (%) | Cumulative total returns (%) |
| | 1-Year | Since fund
inception1 | 6-month | Since fund
inception1 |
| Net asset value | 22.47 | 7.64 | -3.72 | 25.59 |
| Market price | 22.64 | 7.57 | -3.64 | 25.34 |
| John Hancock Dimensional Emerging Markets Index2 | 24.46 | 8.60 | -2.96 | 29.10 |
| MSCI Emerging Markets Index3 | 16.96 | 8.73 | -4.87 | 29.60 |
| 1 | From 9-27-18. |
| 2 | The John Hancock Dimensional Emerging Markets Index is a rules-based index of large-cap stocks in emerging markets, which may include frontier markets (emerging markets in an earlier stage of development) that have been selected based on sources of expected returns. Securities eligible for inclusion in the index are classified according to their market capitalization, as defined by free-float market cap; relative price, as defined by price/book; and profitability, as defined by operating income over book, and are weighted accordingly in favor of smaller, less expensive, more profitable companies. The index is reconstituted and rebalanced on a semiannual basis. Index performance assumes reinvestment of dividends and, unless otherwise indicated, does not reflect the management fees, operating expenses, transaction costs, and other expenses that apply to an ETF. |
| 3 | The MSCI Emerging Markets (EM) Index tracks the performance of publicly traded large- and mid-cap emerging-market stocks. |
| SECTOR COMPOSITION (% of total investments) |
| Financials | 23.5 |
| Information technology | 17.9 |
| Consumer discretionary | 12.6 |
| Materials | 10.7 |
| Communication services | 9.1 |
| Energy | 6.7 |
| Consumer staples | 6.5 |
| Industrials | 4.7 |
| Health care | 3.8 |
| Utilities | 2.7 |
| Real estate | 1.8 |
| TOTAL | 100.0 |
| |
GROWTH OF $10,000
This chart shows what happened to a hypothetical $10,000 investment in John Hancock Multifactor Emerging Markets ETF for the periods indicated, assuming all distributions were reinvested. For comparison, we’ve shown the same investment in two separate indexes.
| TOP TEN HOLDINGS4 (% of total investments) |
| Taiwan Semiconductor Manufacturing Company, Ltd. | 3.9 |
| Samsung Electronics Company, Ltd. | 3.6 |
| Tencent Holdings, Ltd. | 2.9 |
| Alibaba Group Holding, Ltd., ADR | 2.0 |
| Reliance Industries, Ltd. | 1.2 |
| China Construction Bank Corp., H Shares | 1.1 |
| Infosys, Ltd. | 1.0 |
| HDFC Bank, Ltd. | 1.0 |
| Housing Development Finance Corp., Ltd. | 0.9 |
| Ping An Insurance Group Company of China, Ltd., H Shares | 0.9 |
| TOTAL | 18.5 |
The value of a $10,000 investment calculated at market value from inception through period end would be $12,534.
The chart and table above do not reflect the deduction of taxes that a shareholder would pay on fund distributions or the redemption or sale of fund shares.
It is not possible to invest directly in an index. Unlike an index, the fund’s total returns are reduced by operating expenses and management fees.
| 4 | Listed holdings are a portion of the fund’s total and may change at any time. They are not recommendations to buy or sell any security. Data excludes cash and cash equivalents. |
The expense ratios of the fund, both net (including any fee waivers and/or expense limitations) and gross (excluding any fee waivers and/or expense limitations), are set forth according to the most recent publicly available prospectus for the fund and may differ from those disclosed in the Financial highlights table in this report. Net expenses reflect contractual expense limitations in effect until August 31, 2022 and are subject to change. Had the contractual fee waivers and expense limitations not been in place, gross expenses would apply. The expense ratios are as follows:
Please refer to the most recent prospectus and annual or semiannual report for more information on expenses and any expense limitation arrangements for the fund.
| | SEMIANNUAL REPORT | JOHN HANCOCK MULTIFACTOR ETFS | 7 |
AVERAGE ANNUAL TOTAL RETURNS AS OF 10/31/2021 (%)
| Average annual total returns (%) | Cumulative total returns (%) |
| | 1-Year | 5-Year | Since fund
inception1 | 6-month | 5-year | Since fund
inception1 |
| Net asset value | 118.73 | -0.33 | 1.44 | 23.27 | -1.66 | 8.36 |
| Market price | 119.76 | -0.33 | 1.45 | 23.26 | -1.66 | 8.38 |
| John Hancock Dimensional Energy Index2 | 119.75 | 0.06 | 1.85 | 23.54 | 0.28 | 10.81 |
| Russell 1000 Energy Index3 | 109.45 | 1.36 | 2.99 | 21.42 | 6.97 | 17.92 |
| 1 | From 3-28-16. |
| 2 | The John Hancock Dimensional Energy Index is a rules-based index of U.S. energy stocks that have been selected based on sources of expected returns. Securities eligible for inclusion in the index are classified according to their market capitalization, as defined by free-float market cap; relative price, as defined by price/book; and profitability, as defined by operating income over book, and are weighted accordingly in favor of smaller, less expensive, more profitable companies. The index is reconstituted and rebalanced on a semiannual basis. Index performance assumes reinvestment of dividends and, unless otherwise indicated, does not reflect the management fees, operating expenses, transaction costs, and other expenses that apply to an ETF. |
| 3 | The Russell 1000 Energy Index comprises securities of the Russell 1000 Index classified in the energy sector. Effective 9-21-20, the underlying components of the Russell 1000 Energy Index reflect a new company classification methodology. Consequently, the custom blended benchmark’s performance consists of 100% of the prior methodology through 9-20-20 and 100% of the current methodology thereafter. |
| INDUSTRY COMPOSITION (% of net assets) |
| Oil, gas and consumable fuels | 88.1 |
| Energy equipment and services | 11.7 |
| Short-term investments and other | 0.2 |
| TOTAL | 100.0 |
GROWTH OF $10,000
This chart shows what happened to a hypothetical $10,000 investment in John Hancock Multifactor Energy ETF for the periods indicated, assuming all distributions were reinvested. For comparison, we’ve shown the same investment in two separate indexes.
| TOP TEN HOLDINGS4 (% of net assets) |
| EOG Resources, Inc. | 6.7 |
| ConocoPhillips | 6.6 |
| Chevron Corp. | 5.8 |
| Exxon Mobil Corp. | 5.8 |
| Schlumberger NV | 5.6 |
| Marathon Petroleum Corp. | 5.5 |
| The Williams Companies, Inc. | 5.3 |
| Pioneer Natural Resources Company | 4.6 |
| Occidental Petroleum Corp. | 4.3 |
| ONEOK, Inc. | 4.0 |
| TOTAL | 54.2 |
The value of a $10,000 investment calculated at market value from inception through period end would be $10,838.
The chart and table above do not reflect the deduction of taxes that a shareholder would pay on fund distributions or the redemption or sale of fund shares.
It is not possible to invest directly in an index. Unlike an index, the fund’s total returns are reduced by operating expenses and management fees.
| 4 | Listed holdings are a portion of the fund’s total and may change at any time. They are not recommendations to buy or sell any security. Data excludes cash and cash equivalents. |
The expense ratios of the fund, both net (including any fee waivers and/or expense limitations) and gross (excluding any fee waivers and/or expense limitations), are set forth according to the most recent publicly available prospectus for the fund and may differ from those disclosed in the Financial highlights table in this report. Net expenses reflect contractual expense limitations in effect until August 31, 2022 and are subject to change. Had the contractual fee waivers and expense limitations not been in place, gross expenses would apply. The expense ratios are as follows:
Please refer to the most recent prospectus and annual or semiannual report for more information on expenses and any expense limitation arrangements for the fund.
| 8 | JOHN HANCOCK MULTIFACTOR ETFS | SEMIANNUAL REPORT | |
Multifactor Financials ETF
AVERAGE ANNUAL TOTAL RETURNS AS OF 10/31/2021 (%)
| Average annual total returns (%) | Cumulative total returns (%) |
| | 1-Year | 5-Year | Since fund
inception1 | 6-month | 5-year | Since fund
inception1 |
| Net asset value | 62.81 | 17.21 | 15.23 | 8.15 | 121.20 | 137.22 |
| Market price | 62.98 | 17.21 | 15.23 | 8.14 | 121.19 | 137.25 |
| John Hancock Dimensional Financials Index2 | 63.53 | 17.72 | 15.74 | 8.36 | 126.10 | 143.71 |
| Russell 1000 Financials Index3 | 70.87 | 20.01 | 17.80 | 12.41 | 148.95 | 171.31 |
| 1 | From 9-28-15. |
| 2 | The John Hancock Dimensional Financials Index is a rules-based index of U.S. financial stocks that have been selected based on sources of expected returns. Securities eligible for inclusion in the index are classified according to their market capitalization, as defined by free-float market cap; relative price, as defined by price/book; and profitability, as defined by operating income over book, and are weighted accordingly in favor of smaller, less expensive, more profitable companies. The index is reconstituted and rebalanced on a semiannual basis. Index performance assumes reinvestment of dividends and, unless otherwise indicated, does not reflect the management fees, operating expenses, transaction costs, and other expenses that apply to an ETF. |
| 3 | The Russell 1000 Financials Index comprises securities of the Russell 1000 Index classified in the financials sector. Effective 9-21-20, the underlying components of the Russell 1000 Financials Index reflect a new company classification methodology. Consequently, the custom blended benchmark’s performance consists of 100% of the prior methodology through 9-20-20 and 100% of the current methodology thereafter. |
| INDUSTRY COMPOSITION (% of net assets) |
| Banks | 27.2 |
| Capital markets | 23.9 |
| Insurance | 23.6 |
| IT services | 11.8 |
| Consumer finance | 6.5 |
| Diversified financial services | 4.8 |
| Professional services | 1.8 |
| Thrifts and mortgage finance | 0.2 |
| Auto components | 0.1 |
| Short-term investments and other | 0.1 |
| TOTAL | 100.0 |
GROWTH OF $10,000
This chart shows what happened to a hypothetical $10,000 investment in John Hancock Multifactor Financials ETF for the periods indicated, assuming all distributions were reinvested. For comparison, we’ve shown the same investment in two separate indexes.
| TOP TEN HOLDINGS4 (% of net assets) |
| JPMorgan Chase & Co. | 4.0 |
| Berkshire Hathaway, Inc., Class B | 3.9 |
| Bank of America Corp. | 3.2 |
| Visa, Inc., Class A | 3.0 |
| Mastercard, Inc., Class A | 2.7 |
| Wells Fargo & Company | 2.3 |
| PayPal Holdings, Inc. | 2.1 |
| The Goldman Sachs Group, Inc. | 1.9 |
| Citigroup, Inc. | 1.8 |
| The Travelers Companies, Inc. | 1.8 |
| TOTAL | 26.7 |
The value of a $10,000 investment calculated at market value from inception through period end would be $23,725.
The chart and table above do not reflect the deduction of taxes that a shareholder would pay on fund distributions or the redemption or sale of fund shares.
It is not possible to invest directly in an index. Unlike an index, the fund’s total returns are reduced by operating expenses and management fees.
| 4 | Listed holdings are a portion of the fund’s total and may change at any time. They are not recommendations to buy or sell any security. Data excludes cash and cash equivalents. |
The expense ratios of the fund, both net (including any fee waivers and/or expense limitations) and gross (excluding any fee waivers and/or expense limitations), are set forth according to the most recent publicly available prospectus for the fund and may differ from those disclosed in the Financial highlights table in this report. Net expenses reflect contractual expense limitations in effect until August 31, 2022 and are subject to change. Had the contractual fee waivers and expense limitations not been in place, gross expenses would apply. The expense ratios are as follows:
Please refer to the most recent prospectus and annual or semiannual report for more information on expenses and any expense limitation arrangements for the fund.
| | SEMIANNUAL REPORT | JOHN HANCOCK MULTIFACTOR ETFS | 9 |
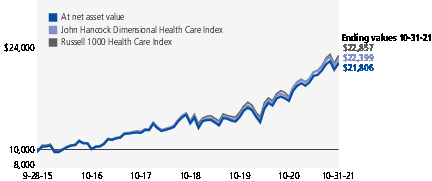
Multifactor Healthcare ETF
AVERAGE ANNUAL TOTAL RETURNS AS OF 10/31/2021 (%)
| Average annual total returns (%) | Cumulative total returns (%) |
| | 1-Year | 5-Year | Since fund
inception1 | 6-month | 5-year | Since fund
inception1 |
| Net asset value | 30.71 | 16.75 | 13.65 | 8.39 | 116.87 | 118.06 |
| Market price | 30.66 | 16.74 | 13.65 | 8.37 | 116.84 | 118.06 |
| John Hancock Dimensional Healthcare Index2 | 31.24 | 17.27 | 14.15 | 8.60 | 121.75 | 123.99 |
| Russell 1000 Health Care Index3 | 32.69 | 17.64 | 14.53 | 10.75 | 125.26 | 128.57 |
| 1 | From 9-28-15. |
| 2 | The John Hancock Dimensional Healthcare Index is a rules-based index of U.S. healthcare stocks that have been selected based on sources of expected returns. Securities eligible for inclusion in the index are classified according to their market capitalization, as defined by free-float market cap; relative price, as defined by price/book; and profitability, as defined by operating income over book, and are weighted accordingly in favor of smaller, less expensive, more profitable companies. The index is reconstituted and rebalanced on a semiannual basis. Index performance assumes reinvestment of dividends and, unless otherwise indicated, does not reflect the management fees, operating expenses, transaction costs, and other expenses that apply to an ETF. |
| 3 | The Russell 1000 Health Care Index comprises securities of the Russell 1000 Index classified in the healthcare sector. Effective 9-21-20, the underlying components of the Russell 1000 Health Care Index reflect a new company classification methodology. Consequently, the custom blended benchmark’s performance consists of 100% of the prior methodology through 9-20-20 and 100% of the current methodology thereafter. |
| INDUSTRY COMPOSITION (% of net assets) |
| Health care equipment and supplies | 25.0 |
| Health care providers and services | 22.4 |
| Pharmaceuticals | 20.1 |
| Biotechnology | 15.6 |
| Life sciences tools and services | 13.6 |
| Health care technology | 2.7 |
| Diversified consumer services | 0.6 |
| TOTAL | 100.0 |
GROWTH OF $10,000
This chart shows what happened to a hypothetical $10,000 investment in John Hancock Multifactor Healthcare ETF for the periods indicated, assuming all distributions were reinvested. For comparison, we’ve shown the same investment in two separate indexes.
| TOP TEN HOLDINGS4 (% of net assets) |
| UnitedHealth Group, Inc. | 5.7 |
| Johnson & Johnson | 5.7 |
| Thermo Fisher Scientific, Inc. | 3.3 |
| Pfizer, Inc. | 3.2 |
| Merck & Company, Inc. | 2.8 |
| Abbott Laboratories | 2.4 |
| Eli Lilly & Company | 2.4 |
| Danaher Corp. | 2.3 |
| AbbVie, Inc. | 2.2 |
| Bristol-Myers Squibb Company | 2.0 |
| TOTAL | 32.0 |
The value of a $10,000 investment calculated at market value from inception through period end would be $21,806.
The chart and table above do not reflect the deduction of taxes that a shareholder would pay on fund distributions or the redemption or sale of fund shares.
It is not possible to invest directly in an index. Unlike an index, the fund’s total returns are reduced by operating expenses and management fees.
| 4 | Listed holdings are a portion of the fund’s total and may change at any time. They are not recommendations to buy or sell any security. Data excludes cash and cash equivalents. |
The expense ratios of the fund, both net (including any fee waivers and/or expense limitations) and gross (excluding any fee waivers and/or expense limitations), are set forth according to the most recent publicly available prospectus for the fund and may differ from those disclosed in the Financial highlights table in this report. Net expenses reflect contractual expense limitations in effect until August 31, 2022 and are subject to change. Had the contractual fee waivers and expense limitations not been in place, gross expenses would apply. The expense ratios are as follows:
Please refer to the most recent prospectus and annual or semiannual report for more information on expenses and any expense limitation arrangements for the fund.
| 10 | JOHN HANCOCK MULTIFACTOR ETFS | SEMIANNUAL REPORT | |
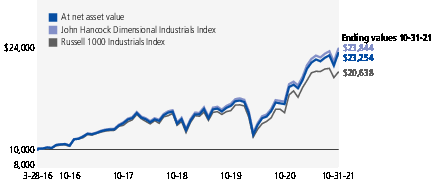
Multifactor Industrials ETF
AVERAGE ANNUAL TOTAL RETURNS AS OF 10/31/2021 (%)
| Average annual total returns (%) | Cumulative total returns (%) |
| | 1-Year | 5-Year | Since fund
inception1 | 6-month | 5-year | Since fund
inception1 |
| Net asset value | 43.17 | 17.15 | 16.27 | 5.98 | 120.64 | 132.54 |
| Market price | 43.06 | 17.14 | 16.27 | 5.95 | 120.55 | 132.51 |
| John Hancock Dimensional Industrials Index2 | 43.77 | 17.67 | 16.79 | 6.19 | 125.60 | 138.44 |
| Russell 1000 Industrials Index3 | 36.99 | 14.56 | 13.82 | 0.52 | 97.32 | 106.38 |
| 1 | From 3-28-16. |
| 2 | The John Hancock Dimensional Industrials Index is a rules-based index of U.S. industrial stocks that have been selected based on sources of expected returns. Securities eligible for inclusion in the index are classified according to their market capitalization, as defined by free-float market cap; relative price, as defined by price/book; and profitability, as defined by operating income over book, and are weighted accordingly in favor of smaller, less expensive, more profitable companies. The index is reconstituted and rebalanced on a semiannual basis. Index performance assumes reinvestment of dividends and, unless otherwise indicated, does not reflect the management fees, operating expenses, transaction costs, and other expenses that apply to an ETF. |
| 3 | The Russell 1000 Industrials Index comprises securities of the Russell 1000 Index classified in the industrials sector. Effective 9-21-20, the underlying components of the Russell 1000 Industrials Index reflect a new company classification methodology. Consequently, the custom blended benchmark’s performance consists of 100% of the prior methodology through 9-20-20 and 100% of the current methodology thereafter. |
| INDUSTRY COMPOSITION (% of net assets) |
| Machinery | 20.8 |
| Road and rail | 10.0 |
| Aerospace and defense | 10.0 |
| IT services | 7.5 |
| Electrical equipment | 7.5 |
| Building products | 5.9 |
| Household durables | 5.0 |
| Air freight and logistics | 4.8 |
| Professional services | 4.8 |
| Commercial services and supplies | 4.7 |
| Other | 19.0 |
| TOTAL | 100.0 |
GROWTH OF $10,000
This chart shows what happened to a hypothetical $10,000 investment in John Hancock Multifactor Industrials ETF for the periods indicated, assuming all distributions were reinvested. For comparison, we’ve shown the same investment in two separate indexes.
| TOP TEN HOLDINGS4 (% of net assets) |
| Accenture PLC, Class A | 2.8 |
| Union Pacific Corp. | 2.2 |
| United Parcel Service, Inc., Class B | 1.9 |
| Honeywell International, Inc. | 1.8 |
| Raytheon Technologies Corp. | 1.7 |
| Caterpillar, Inc. | 1.7 |
| United Rentals, Inc. | 1.7 |
| CSX Corp. | 1.6 |
| 3M Company | 1.5 |
| Norfolk Southern Corp. | 1.5 |
| TOTAL | 18.4 |
The value of a $10,000 investment calculated at market value from inception through period end would be $23,251.
The chart and table above do not reflect the deduction of taxes that a shareholder would pay on fund distributions or the redemption or sale of fund shares.
It is not possible to invest directly in an index. Unlike an index, the fund’s total returns are reduced by operating expenses and management fees.
| 4 | Listed holdings are a portion of the fund’s total and may change at any time. They are not recommendations to buy or sell any security. Data excludes cash and cash equivalents. |
The expense ratios of the fund, both net (including any fee waivers and/or expense limitations) and gross (excluding any fee waivers and/or expense limitations), are set forth according to the most recent publicly available prospectus for the fund and may differ from those disclosed in the Financial highlights table in this report. Net expenses reflect contractual expense limitations in effect until August 31, 2022 and are subject to change. Had the contractual fee waivers and expense limitations not been in place, gross expenses would apply. The expense ratios are as follows:
Please refer to the most recent prospectus and annual or semiannual report for more information on expenses and any expense limitation arrangements for the fund.
| | SEMIANNUAL REPORT | JOHN HANCOCK MULTIFACTOR ETFS | 11 |
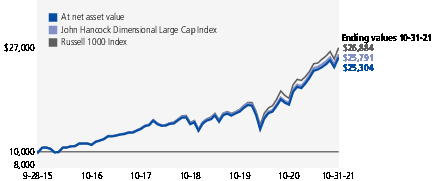
Multifactor Large Cap ETF
AVERAGE ANNUAL TOTAL RETURNS AS OF 10/31/2021 (%)
| Average annual total returns (%) | Cumulative total returns (%) |
| | 1-Year | 5-Year | Since fund
inception1 | 6-month | 5-year | Since fund
inception1 |
| Net asset value | 43.00 | 17.84 | 16.46 | 8.98 | 127.20 | 153.04 |
| Market price | 42.87 | 17.83 | 16.46 | 8.98 | 127.17 | 153.05 |
| John Hancock Dimensional Large Cap Index2 | 43.44 | 18.21 | 16.82 | 9.14 | 130.83 | 157.91 |
| Russell 1000 Index3 | 43.51 | 19.16 | 17.62 | 10.37 | 140.28 | 168.84 |
| 1 | From 9-28-15. |
| 2 | The John Hancock Dimensional Large Cap Index is a rules-based index of large-cap U.S. stocks that have been selected based on sources of expected returns. Securities eligible for inclusion in the index are classified according to their market capitalization, as defined by free-float market cap; relative price, as defined by price/book; and profitability, as defined by operating income over book, and are weighted accordingly in favor of smaller, less expensive, more profitable companies. The index is reconstituted and rebalanced on a semiannual basis. Index performance assumes reinvestment of dividends and, unless otherwise indicated, does not reflect the management fees, operating expenses, transaction costs, and other expenses that apply to an ETF. |
| 3 | The Russell 1000 Index tracks the performance of 1,000 publicly traded large-cap companies in the United States. |
| SECTOR COMPOSITION (% of net assets) |
| Information technology | 24.5 |
| Financials | 13.3 |
| Health care | 12.8 |
| Consumer discretionary | 11.8 |
| Industrials | 11.1 |
| Communication services | 8.0 |
| Consumer staples | 5.2 |
| Materials | 3.8 |
| Utilities | 3.4 |
| Real estate | 3.2 |
| Energy | 2.8 |
| Short-term investments and other | 0.1 |
| TOTAL | 100.0 |
| |
GROWTH OF $10,000
This chart shows what happened to a hypothetical $10,000 investment in John Hancock Multifactor Large Cap ETF for the periods indicated, assuming all distributions were reinvested. For comparison, we’ve shown the same investment in two separate indexes.
| TOP TEN HOLDINGS4 (% of net assets) |
| Microsoft Corp. | 4.3 |
| Apple, Inc. | 3.5 |
| Amazon.com, Inc. | 2.3 |
| Alphabet, Inc., Class A | 2.0 |
| Facebook, Inc., Class A | 1.3 |
| JPMorgan Chase & Co. | 0.9 |
| Tesla, Inc. | 0.9 |
| UnitedHealth Group, Inc. | 0.8 |
| Berkshire Hathaway, Inc., Class B | 0.8 |
| NVIDIA Corp. | 0.8 |
| TOTAL | 17.6 |
The value of a $10,000 investment calculated at market value from inception through period end would be $25,305.
The chart and table above do not reflect the deduction of taxes that a shareholder would pay on fund distributions or the redemption or sale of fund shares.
It is not possible to invest directly in an index. Unlike an index, the fund’s total returns are reduced by operating expenses and management fees.
| 4 | Listed holdings are a portion of the fund’s total and may change at any time. They are not recommendations to buy or sell any security. Data excludes cash and cash equivalents. |
The expense ratios of the fund, both net (including any fee waivers and/or expense limitations) and gross (excluding any fee waivers and/or expense limitations), are set forth according to the most recent publicly available prospectus for the fund and may differ from those disclosed in the Financial highlights table in this report. Net expenses reflect contractual expense limitations in effect until August 31, 2022 and are subject to change. Had the contractual fee waivers and expense limitations not been in place, gross expenses would apply. The expense ratios are as follows:
Please refer to the most recent prospectus and annual or semiannual report for more information on expenses and any expense limitation arrangements for the fund.
| 12 | JOHN HANCOCK MULTIFACTOR ETFS | SEMIANNUAL REPORT | |
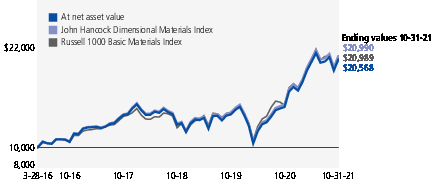
Multifactor Materials ETF
AVERAGE ANNUAL TOTAL RETURNS AS OF 10/31/2021 (%)
| Average annual total returns (%) | Cumulative total returns (%) |
| | 1-Year | 5-Year | Since fund
inception1 | 6-month | 5-year | Since fund
inception1 |
| Net asset value | 38.35 | 13.98 | 13.75 | 1.46 | 92.34 | 105.68 |
| Market price | 38.31 | 13.97 | 13.75 | 1.46 | 92.31 | 105.69 |
| John Hancock Dimensional Materials Index2 | 38.47 | 14.38 | 14.16 | 1.66 | 95.73 | 109.90 |
| Russell 1000 Basic Materials Index3 | 39.26 | 14.60 | 14.16 | 2.78 | 97.64 | 109.89 |
| 1 | From 3-28-16. |
| 2 | The John Hancock Dimensional Materials Index is a rules-based index of U.S. material stocks that have been selected based on sources of expected returns. Securities eligible for inclusion in the index are classified according to their market capitalization, as defined by free-float market cap; relative price, as defined by price/book; and profitability, as defined by operating income over book, and are weighted accordingly in favor of smaller, less expensive, more profitable companies. The index is reconstituted and rebalanced on a semiannual basis. Index performance assumes reinvestment of dividends and, unless otherwise indicated, does not reflect the management fees, operating expenses, transaction costs, and other expenses that apply to an ETF. |
| 3 | The Russell 1000 Basic Materials Index comprises securities of the Russell 1000 Index classified in the material sector. Effective 9-21-20, the underlying components of the Russell 1000 Basic Materials Index reflect a new company classification methodology. Consequently, the custom blended benchmark’s performance consists of 100% of the prior methodology through 9-20-20 and 100% of the current methodology thereafter. |
| INDUSTRY COMPOSITION (% of net assets) |
| Chemicals | 51.5 |
| Containers and packaging | 20.8 |
| Metals and mining | 18.5 |
| Construction materials | 5.9 |
| Building products | 1.9 |
| Multi-utilities | 0.9 |
| Machinery | 0.4 |
| Paper and forest products | 0.1 |
| TOTAL | 100.0 |
GROWTH OF $10,000
This chart shows what happened to a hypothetical $10,000 investment in John Hancock Multifactor Materials ETF for the periods indicated, assuming all distributions were reinvested. For comparison, we’ve shown the same investment in two separate indexes.
| TOP TEN HOLDINGS4 (% of net assets) |
| Linde PLC | 5.5 |
| Nucor Corp. | 4.9 |
| PPG Industries, Inc. | 4.4 |
| LyondellBasell Industries NV, Class A | 4.2 |
| The Sherwin-Williams Company | 4.1 |
| DuPont de Nemours, Inc. | 4.0 |
| International Flavors & Fragrances, Inc. | 3.9 |
| Air Products & Chemicals, Inc. | 3.4 |
| Ball Corp. | 3.3 |
| Dow, Inc. | 3.3 |
| TOTAL | 41.0 |
The value of a $10,000 investment calculated at market value from inception through period end would be $20,569.
The chart and table above do not reflect the deduction of taxes that a shareholder would pay on fund distributions or the redemption or sale of fund shares.
It is not possible to invest directly in an index. Unlike an index, the fund’s total returns are reduced by operating expenses and management fees.
| 4 | Listed holdings are a portion of the fund’s total and may change at any time. They are not recommendations to buy or sell any security. Data excludes cash and cash equivalents. |
The expense ratios of the fund, both net (including any fee waivers and/or expense limitations) and gross (excluding any fee waivers and/or expense limitations), are set forth according to the most recent publicly available prospectus for the fund and may differ from those disclosed in the Financial highlights table in this report. Net expenses reflect contractual expense limitations in effect until August 31, 2022 and are subject to change. Had the contractual fee waivers and expense limitations not been in place, gross expenses would apply. The expense ratios are as follows:
Please refer to the most recent prospectus and annual or semiannual report for more information on expenses and any expense limitation arrangements for the fund.
| | SEMIANNUAL REPORT | JOHN HANCOCK MULTIFACTOR ETFS | 13 |
Multifactor Media and Communications ETF
AVERAGE ANNUAL TOTAL RETURNS AS OF 10/31/2021 (%)
| Average annual total returns (%) | Cumulative total returns (%) |
| | 1-Year | Since fund
inception1 | 6-month | Since fund
inception1 |
| Net asset value | 28.18 | 17.29 | -2.83 | 52.39 |
| Market price | 28.06 | 17.29 | -3.00 | 52.39 |
| John Hancock Dimensional Media and Communications Index2 | 28.70 | 17.70 | -2.65 | 53.78 |
| Russell 1000 Telecommunications Index3 | 18.94 | 5.40 | -3.87 | 14.90 |
| 1 | From 3-12-19. |
| 2 | The John Hancock Dimensional Media and Communications Index is a rules-based index of U.S. media and communication stocks that have been selected based on sources of expected returns. Securities eligible for inclusion in the index are classified according to their market capitalization, as defined by free-float market cap; relative price, as defined by price/book; and profitability, as defined by operating income over book, and are weighted accordingly in favor of smaller, less expensive, more profitable companies. The index is reconstituted and rebalanced on a semiannual basis. Index performance assumes reinvestment of dividends and, unless otherwise indicated, does not reflect the management fees, operating expenses, transaction costs, and other expenses that apply to an ETF. |
| 3 | The Russell 1000 Telecommunications Index comprises securities of the Russell 1000 Index classified in the telecommunications sector. Effective 9-21-20, the underlying components of the Russell 1000 Telecommunications Index reflect a new company classification methodology. Consequently, the custom blended benchmark’s performance consists of 100% of the prior methodology through 9-20-20 and 100% of the current methodology thereafter. |
| INDUSTRY COMPOSITION (% of net assets) |
| Media | 30.7 |
| Entertainment | 27.5 |
| Interactive media and services | 22.0 |
| Diversified telecommunication services | 13.2 |
| Wireless telecommunication services | 4.0 |
| Professional services | 1.7 |
| Software | 0.9 |
| TOTAL | 100.0 |
GROWTH OF $10,000
This chart shows what happened to a hypothetical $10,000 investment in John Hancock Multifactor Media and Communications ETF for the periods indicated, assuming all distributions were reinvested. For comparison, we’ve shown the same investment in two separate indexes.
| TOP TEN HOLDINGS4 (% of net assets) |
| Netflix, Inc. | 7.7 |
| The Walt Disney Company | 5.9 |
| AT&T, Inc. | 5.8 |
| Facebook, Inc., Class A | 5.4 |
| Comcast Corp., Class A | 5.4 |
| Verizon Communications, Inc. | 4.4 |
| T-Mobile US, Inc. | 4.0 |
| Electronic Arts, Inc. | 3.8 |
| Match Group, Inc. | 3.6 |
| Alphabet, Inc., Class A | 3.4 |
| TOTAL | 49.4 |
The value of a $10,000 investment calculated at market value from inception through period end would be $15,239.
The chart and table above do not reflect the deduction of taxes that a shareholder would pay on fund distributions or the redemption or sale of fund shares.
It is not possible to invest directly in an index. Unlike an index, the fund’s total returns are reduced by operating expenses and management fees.
| 4 | Listed holdings are a portion of the fund’s total and may change at any time. They are not recommendations to buy or sell any security. Data excludes cash and cash equivalents. |
The expense ratios of the fund, both net (including any fee waivers and/or expense limitations) and gross (excluding any fee waivers and/or expense limitations), are set forth according to the most recent publicly available prospectus for the fund and may differ from those disclosed in the Financial highlights table in this report. Net expenses reflect contractual expense limitations in effect until August 31, 2022 and are subject to change. Had the contractual fee waivers and expense limitations not been in place, gross expenses would apply. The expense ratios are as follows:
Please refer to the most recent prospectus and annual or semiannual report for more information on expenses and any expense limitation arrangements for the fund.
| 14 | JOHN HANCOCK MULTIFACTOR ETFS | SEMIANNUAL REPORT | |
AVERAGE ANNUAL TOTAL RETURNS AS OF 10/31/2021 (%)
| Average annual total returns (%) | Cumulative total returns (%) |
| | 1-Year | 5-Year | Since fund
inception1 | 6-month | 5-year | Since fund
inception1 |
| Net asset value | 45.29 | 16.47 | 14.91 | 6.48 | 114.35 | 133.21 |
| Market price | 45.20 | 16.46 | 14.91 | 6.50 | 114.19 | 133.25 |
| John Hancock Dimensional Mid Cap Index2 | 45.92 | 16.94 | 15.39 | 6.69 | 118.72 | 139.19 |
| Russell Midcap Index3 | 45.40 | 16.47 | 14.99 | 7.37 | 114.30 | 134.20 |
| 1 | From 9-28-15. |
| 2 | The John Hancock Dimensional Mid Cap Index is a rules-based index of mid-cap U.S. stocks that have been selected based on sources of expected returns. Securities eligible for inclusion in the index are classified according to their market capitalization, as defined by free-float market cap; relative price, as defined by price/book; and profitability, as defined by operating income over book, and are weighted accordingly in favor of smaller, less expensive, more profitable companies. The index is reconstituted and rebalanced on a semiannual basis. Index performance assumes reinvestment of dividends and, unless otherwise indicated, does not reflect the management fees, operating expenses, transaction costs, and other expenses that apply to an ETF. |
| 3 | The Russell Midcap Index tracks the performance of approximately 800 publicly traded mid-cap companies in the United States. |
| SECTOR COMPOSITION (% of net assets) |
| Information technology | 18.5 |
| Industrials | 16.0 |
| Consumer discretionary | 13.6 |
| Financials | 13.5 |
| Health care | 12.3 |
| Materials | 6.4 |
| Real estate | 5.8 |
| Utilities | 4.3 |
| Energy | 3.4 |
| Communication services | 3.1 |
| Consumer staples | 3.1 |
| TOTAL | 100.0 |
| |
GROWTH OF $10,000
This chart shows what happened to a hypothetical $10,000 investment in John Hancock Multifactor Mid Cap ETF for the periods indicated, assuming all distributions were reinvested. For comparison, we’ve shown the same investment in two separate indexes.
| TOP TEN HOLDINGS4 (% of net assets) |
| United Rentals, Inc. | 0.4 |
| Parker-Hannifin Corp. | 0.4 |
| SVB Financial Group | 0.4 |
| Rockwell Automation, Inc. | 0.4 |
| Laboratory Corp. of America Holdings | 0.4 |
| Ameriprise Financial, Inc. | 0.4 |
| Keysight Technologies, Inc. | 0.4 |
| EPAM Systems, Inc. | 0.4 |
| ResMed, Inc. | 0.4 |
| Fifth Third Bancorp | 0.4 |
| TOTAL | 4.0 |
The value of a $10,000 investment calculated at market value from inception through period end would be $23,325.
The chart and table above do not reflect the deduction of taxes that a shareholder would pay on fund distributions or the redemption or sale of fund shares.
It is not possible to invest directly in an index. Unlike an index, the fund’s total returns are reduced by operating expenses and management fees.
| 4 | Listed holdings are a portion of the fund’s total and may change at any time. They are not recommendations to buy or sell any security. Data excludes cash and cash equivalents. |
The expense ratios of the fund, both net (including any fee waivers and/or expense limitations) and gross (excluding any fee waivers and/or expense limitations), are set forth according to the most recent publicly available prospectus for the fund and may differ from those disclosed in the Financial highlights table in this report. Net expenses reflect contractual expense limitations in effect until August 31, 2022 and are subject to change. Had the contractual fee waivers and expense limitations not been in place, gross expenses would apply. The expense ratios are as follows:
Please refer to the most recent prospectus and annual or semiannual report for more information on expenses and any expense limitation arrangements for the fund.
| | SEMIANNUAL REPORT | JOHN HANCOCK MULTIFACTOR ETFS | 15 |
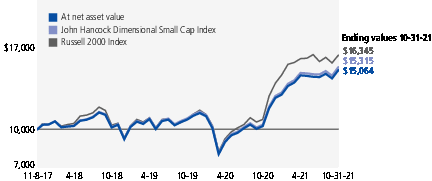
Multifactor Small Cap ETF
AVERAGE ANNUAL TOTAL RETURNS AS OF 10/31/2021 (%)
| Average annual total returns (%) | Cumulative total returns (%) |
| | 1-Year | Since fund
inception1 | 6-month | Since fund
inception1 |
| Net asset value | 46.72 | 10.84 | 3.09 | 50.64 |
| Market price | 46.59 | 10.84 | 3.13 | 50.64 |
| John Hancock Dimensional Small Cap Index2 | 47.40 | 11.30 | 3.32 | 53.15 |
| Russell 2000 Index3 | 50.80 | 13.14 | 1.85 | 63.45 |
| 1 | From 11-8-17. |
| 2 | The John Hancock Dimensional Small Cap Index is a rules-based index of small-cap U.S. stocks that have been selected based on sources of expected returns. Securities eligible for inclusion in the index are classified according to their market capitalization, as defined by free-float market cap; relative price, as defined by price/book; and profitability, as defined by operating income over book, and are weighted accordingly in favor of smaller, less expensive, more profitable companies. The index is reconstituted and rebalanced on a semiannual basis. Index performance assumes reinvestment of dividends and, unless otherwise indicated, does not reflect the management fees, operating expenses, transaction costs, and other expenses that apply to an ETF. |
| 3 | The Russell 2000 Index tracks the performance of approximately 2,000 publicly traded small-cap companies in the United States. |
| SECTOR COMPOSITION (% of net assets) |
| Industrials | 17.7 |
| Financials | 16.6 |
| Consumer discretionary | 14.9 |
| Information technology | 14.5 |
| Health care | 10.2 |
| Real estate | 8.2 |
| Materials | 5.8 |
| Utilities | 3.7 |
| Energy | 3.1 |
| Consumer staples | 3.0 |
| Communication services | 2.2 |
| Short-term investments and other | 0.1 |
| TOTAL | 100.0 |
| |
GROWTH OF $10,000
This chart shows what happened to a hypothetical $10,000 investment in John Hancock Multifactor Small Cap ETF for the periods indicated, assuming all distributions were reinvested. For comparison, we’ve shown the same investment in two separate indexes.
| TOP TEN HOLDINGS4 (% of net assets) |
| Regal Rexnord Corp. | 0.6 |
| Brooks Automation, Inc. | 0.5 |
| TopBuild Corp. | 0.5 |
| Silicon Laboratories, Inc. | 0.5 |
| Saia, Inc. | 0.5 |
| Wyndham Hotels & Resorts, Inc. | 0.5 |
| Acuity Brands, Inc. | 0.5 |
| Mattel, Inc. | 0.5 |
| Cullen/Frost Bankers, Inc. | 0.5 |
| Janus Henderson Group PLC | 0.5 |
| TOTAL | 5.1 |
The value of a $10,000 investment calculated at market value from inception through period end would be $15,064.
The chart and table above do not reflect the deduction of taxes that a shareholder would pay on fund distributions or the redemption or sale of fund shares.
It is not possible to invest directly in an index. Unlike an index, the fund’s total returns are reduced by operating expenses and management fees.
| 4 | Listed holdings are a portion of the fund’s total and may change at any time. They are not recommendations to buy or sell any security. Data excludes cash and cash equivalents. |
The expense ratios of the fund, both net (including any fee waivers and/or expense limitations) and gross (excluding any fee waivers and/or expense limitations), are set forth according to the most recent publicly available prospectus for the fund and may differ from those disclosed in the Financial highlights table in this report. Net expenses reflect contractual expense limitations in effect until August 31, 2022 and are subject to change. Had the contractual fee waivers and expense limitations not been in place, gross expenses would apply. The expense ratios are as follows:
Please refer to the most recent prospectus and annual or semiannual report for more information on expenses and any expense limitation arrangements for the fund.
| 16 | JOHN HANCOCK MULTIFACTOR ETFS | SEMIANNUAL REPORT | |
Multifactor Technology ETF
AVERAGE ANNUAL TOTAL RETURNS AS OF 10/31/2021 (%)
| Average annual total returns (%) | Cumulative total returns (%) |
| | 1-Year | 5-Year | Since fund
inception1 | 6-month | 5-year | Since fund
inception1 |
| Net asset value | 52.61 | 27.86 | 26.37 | 15.81 | 241.67 | 316.28 |
| Market price | 52.56 | 27.85 | 26.38 | 15.87 | 241.59 | 316.35 |
| John Hancock Dimensional Technology Index2 | 53.27 | 28.29 | 26.83 | 16.05 | 247.57 | 325.45 |
| Russell 1000 Technology Index3 | 51.17 | 31.44 | 29.22 | 18.92 | 292.32 | 376.92 |
| 1 | From 9-28-15. |
| 2 | The John Hancock Dimensional Technology Index is a rules-based index of U.S. technology stocks that have been selected based on sources of expected returns. Securities eligible for inclusion in the index are classified according to their market capitalization, as defined by free-float market cap; relative price, as defined by price/book; and profitability, as defined by operating income over book, and are weighted accordingly in favor of smaller, less expensive, more profitable companies. The index is reconstituted and rebalanced on a semiannual basis. Index performance assumes reinvestment of dividends and, unless otherwise indicated, does not reflect the management fees, operating expenses, transaction costs, and other expenses that apply to an ETF. |
| 3 | The Russell 1000 Technology Index comprises securities of the Russell 1000 Index classified in the technology sector. Effective 9-21-20, the underlying components of the Russell 1000 Technology Index reflect a new company classification methodology. Consequently, the custom blended benchmark’s performance consists of 100% of the prior methodology through 9-20-20 and 100% of the current methodology thereafter. |
| INDUSTRY COMPOSITION (% of net assets) |
| Software | 36.5 |
| Semiconductors and semiconductor equipment | 31.1 |
| Technology hardware, storage and peripherals | 9.6 |
| IT services | 8.7 |
| Electronic equipment, instruments and components | 7.8 |
| Communications equipment | 5.1 |
| Electrical equipment | 0.8 |
| Interactive media and services | 0.3 |
| Short-term investments and other | 0.1 |
| TOTAL | 100.0 |
GROWTH OF $10,000
This chart shows what happened to a hypothetical $10,000 investment in John Hancock Multifactor Technology ETF for the periods indicated, assuming all distributions were reinvested. For comparison, we’ve shown the same investment in two separate indexes.
| TOP TEN HOLDINGS4 (% of net assets) |
| Microsoft Corp. | 6.4 |
| Apple, Inc. | 5.7 |
| NVIDIA Corp. | 4.5 |
| Adobe, Inc. | 2.7 |
| salesforce.com, Inc. | 2.7 |
| Broadcom, Inc. | 2.5 |
| Cisco Systems, Inc. | 2.4 |
| Intel Corp. | 2.2 |
| Texas Instruments, Inc. | 2.2 |
| QUALCOMM, Inc. | 1.6 |
| TOTAL | 32.9 |
The value of a $10,000 investment calculated at market value from inception through period end would be $41,635.
The chart and table above do not reflect the deduction of taxes that a shareholder would pay on fund distributions or the redemption or sale of fund shares.
It is not possible to invest directly in an index. Unlike an index, the fund’s total returns are reduced by operating expenses and management fees.
| 4 | Listed holdings are a portion of the fund’s total and may change at any time. They are not recommendations to buy or sell any security. Data excludes cash and cash equivalents. |
The expense ratios of the fund, both net (including any fee waivers and/or expense limitations) and gross (excluding any fee waivers and/or expense limitations), are set forth according to the most recent publicly available prospectus for the fund and may differ from those disclosed in the Financial highlights table in this report. Net expenses reflect contractual expense limitations in effect until August 31, 2022 and are subject to change. Had the contractual fee waivers and expense limitations not been in place, gross expenses would apply. The expense ratios are as follows:
Please refer to the most recent prospectus and annual or semiannual report for more information on expenses and any expense limitation arrangements for the fund.
| | SEMIANNUAL REPORT | JOHN HANCOCK MULTIFACTOR ETFS | 17 |
Multifactor Utilities ETF
AVERAGE ANNUAL TOTAL RETURNS AS OF 10/31/2021 (%)
| Average annual total returns (%) | Cumulative total returns (%) |
| | 1-Year | 5-Year | Since fund
inception1 | 6-month | 5-year | Since fund
inception1 |
| Net asset value | 11.16 | 8.31 | 7.93 | 1.00 | 49.07 | 53.28 |
| Market price | 11.17 | 8.31 | 7.93 | 0.99 | 49.02 | 53.28 |
| John Hancock Dimensional Utilities Index2 | 11.52 | 8.77 | 8.40 | 1.10 | 52.28 | 57.06 |
| Russell 1000 Utilities Index3 | 14.26 | 9.26 | 8.34 | 3.30 | 55.71 | 56.55 |
| 1 | From 3-28-16. |
| 2 | The John Hancock Dimensional Utilities Index is a rules-based index of U.S. utility stocks that have been selected based on sources of expected returns. Securities eligible for inclusion in the index are classified according to their market capitalization, as defined by free-float market cap; relative price, as defined by price/book; and profitability, as defined by operating income over book, and are weighted accordingly in favor of smaller, less expensive, more profitable companies. The index is reconstituted and rebalanced on a semiannual basis. Index performance assumes reinvestment of dividends and, unless otherwise indicated, does not reflect the management fees, operating expenses, transaction costs, and other expenses that apply to an ETF. |
| 3 | The Russell 1000 Utilities Index comprises securities of the Russell 1000 Index classified in the utility sector. Effective 9-21-20, the underlying components of the Russell 1000 Utilities Index reflect a new company classification methodology. Consequently, the custom blended benchmark’s performance consists of 100% of the prior methodology through 9-20-20 and 100% of the current methodology thereafter. |
| INDUSTRY COMPOSITION (% of net assets) |
| Electric utilities | 55.9 |
| Multi-utilities | 32.3 |
| Water utilities | 4.3 |
| Independent power and renewable electricity producers | 4.0 |
| Gas utilities | 3.4 |
| Short-term investments and other | 0.1 |
| TOTAL | 100.0 |
GROWTH OF $10,000
This chart shows what happened to a hypothetical $10,000 investment in John Hancock Multifactor Utilities ETF for the periods indicated, assuming all distributions were reinvested. For comparison, we’ve shown the same investment in two separate indexes.
| TOP TEN HOLDINGS4 (% of net assets) |
| American Electric Power Company, Inc. | 5.8 |
| Duke Energy Corp. | 5.4 |
| Exelon Corp. | 5.3 |
| Xcel Energy, Inc. | 5.0 |
| The Southern Company | 4.7 |
| Sempra Energy | 4.5 |
| Edison International | 4.2 |
| Public Service Enterprise Group, Inc. | 4.0 |
| Eversource Energy | 3.8 |
| Entergy Corp. | 3.8 |
| TOTAL | 46.5 |
The value of a $10,000 investment calculated at market value from inception through period end would be $15,328.
The chart and table above do not reflect the deduction of taxes that a shareholder would pay on fund distributions or the redemption or sale of fund shares.
It is not possible to invest directly in an index. Unlike an index, the fund’s total returns are reduced by operating expenses and management fees.
| 4 | Listed holdings are a portion of the fund’s total and may change at any time. They are not recommendations to buy or sell any security. Data excludes cash and cash equivalents. |
The expense ratios of the fund, both net (including any fee waivers and/or expense limitations) and gross (excluding any fee waivers and/or expense limitations), are set forth according to the most recent publicly available prospectus for the fund and may differ from those disclosed in the Financial highlights table in this report. Net expenses reflect contractual expense limitations in effect until August 31, 2022 and are subject to change. Had the contractual fee waivers and expense limitations not been in place, gross expenses would apply. The expense ratios are as follows:
Please refer to the most recent prospectus and annual or semiannual report for more information on expenses and any expense limitation arrangements for the fund.
| 18 | JOHN HANCOCK MULTIFACTOR ETFS | SEMIANNUAL REPORT | |
These examples are intended to help you understand your ongoing operating expenses of investing in the fund so you can compare these costs with the ongoing costs of investing in other funds.
Understanding fund expenses
As a shareholder of a fund, you incur two types of costs:
■Transaction costs, which may include creation and redemption fees and brokerage charges.
■Ongoing operating expenses, including management fees, and other fund expenses.
We are presenting only your ongoing operating expenses here.
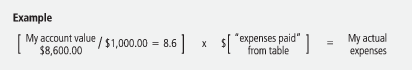
Actual expenses/actual returns
The first line of each fund in the following table is intended to provide information about a fund’s actual ongoing operating expenses, and is based on the fund’s actual NAV return. It assumes an account value of $1,000.00 on May 1, 2021, with the same investment held until October 31, 2021.
Together with the value of your account, you may use this information to estimate the operating expenses that you paid over the period. Simply divide your account value at October 31, 2021, by $1,000.00, then multiply it by the “expenses paid” from the table. For example, for an account value of $8,600.00, the operating expenses should be calculated as follows:
Hypothetical example for comparison purposes
The second line of each fund in the following table allows you to compare a fund’s ongoing operating expenses with those of any other fund. It provides an example of the fund’s hypothetical account values and hypothetical expenses based on the fund’s actual expense ratio and an assumed 5% annualized return before expenses (which is not the fund’s actual return). It assumes an account value of $1,000.00 on May 1, 2021, with the same investment held until October 31, 2021. Look in any other fund shareholder report to find its hypothetical example and you will be able to compare these expenses. Please remember that these hypothetical account values and expenses may not be used to estimate the actual ending account balance or expenses you paid for the period.
Remember, these examples do not include any transaction costs. A fund charges a transaction fee per creation unit to those creating or redeeming creation units, and those buying or selling shares in the secondary market will incur customary brokerage commissions and charges. Therefore, these examples will not help you to determine the relative total costs of owning different funds. If transaction costs were included, your expenses would have been higher. See the prospectus for details regarding transaction costs.
SHAREHOLDER EXPENSE EXAMPLE CHART
| | Account
value on
5-1-2021 | Ending
value on
10-31-2021 | Expenses
paid during
10-31-20211 | Annualized
expense
ratio |
| Multifactor Consumer Discretionary ETF |
| Actual expenses/actual returns | $1,000.00 | $1,074.50 | $2.09 | 0.40% |
| Hypothetical example for comparison purposes | 1,000.00 | 1,023.20 | 2.04 | 0.40% |
| Multifactor Consumer Staples ETF |
| Actual expenses/actual returns | $1,000.00 | $1,010.70 | $2.03 | 0.40% |
| Hypothetical example for comparison purposes | 1,000.00 | 1,023.20 | 2.04 | 0.40% |
| Multifactor Developed International ETF |
| Actual expenses/actual returns | $1,000.00 | $1,036.80 | $2.00 | 0.39% |
| Hypothetical example for comparison purposes | 1,000.00 | 1,023.20 | 1.99 | 0.39% |
| Multifactor Emerging Markets ETF |
| Actual expenses/actual returns | $1,000.00 | $962.80 | $2.42 | 0.49% |
| Hypothetical example for comparison purposes | 1,000.00 | 1,022.70 | 2.50 | 0.49% |
| | SEMIANNUAL | JOHN HANCOCK MULTIFACTOR ETFS | 19 |
SHAREHOLDER EXPENSE EXAMPLE CHART (continued)
| | Account
value on
5-1-2021 | Ending
value on
10-31-2021 | Expenses
paid during
10-31-20211 | Annualized
expense
ratio |
| Multifactor Energy ETF |
| Actual expenses/actual returns | $1,000.00 | $1,232.70 | $2.25 | 0.40% |
| Hypothetical example for comparison purposes | 1,000.00 | 1,023.20 | 2.04 | 0.40% |
| Multifactor Financials ETF |
| Actual expenses/actual returns | $1,000.00 | $1,081.50 | $2.10 | 0.40% |
| Hypothetical example for comparison purposes | 1,000.00 | 1,023.20 | 2.04 | 0.40% |
| Multifactor Healthcare ETF |
| Actual expenses/actual returns | $1,000.00 | $1,083.90 | $2.10 | 0.40% |
| Hypothetical example for comparison purposes | 1,000.00 | 1,023.20 | 2.04 | 0.40% |
| Multifactor Industrials ETF |
| Actual expenses/actual returns | $1,000.00 | $1,059.80 | $2.08 | 0.40% |
| Hypothetical example for comparison purposes | 1,000.00 | 1,023.20 | 2.04 | 0.40% |
| Multifactor Large Cap ETF |
| Actual expenses/actual returns | $1,000.00 | $1,089.80 | $1.53 | 0.29% |
| Hypothetical example for comparison purposes | 1,000.00 | 1,023.70 | 1.48 | 0.29% |
| Multifactor Materials ETF |
| Actual expenses/actual returns | $1,000.00 | $1,014.60 | $2.03 | 0.40% |
| Hypothetical example for comparison purposes | 1,000.00 | 1,023.20 | 2.04 | 0.40% |
| Multifactor Media and Communications ETF |
| Actual expenses/actual returns | $1,000.00 | $971.70 | $1.99 | 0.40% |
| Hypothetical example for comparison purposes | 1,000.00 | 1,023.20 | 2.04 | 0.40% |
| Multifactor Mid Cap ETF |
| Actual expenses/actual returns | $1,000.00 | $1,064.80 | $2.13 | 0.41% |
| Hypothetical example for comparison purposes | 1,000.00 | 1,023.10 | 2.09 | 0.41% |
| Multifactor Small Cap ETF |
| Actual expenses/actual returns | $1,000.00 | $1,030.90 | $2.15 | 0.42% |
| Hypothetical example for comparison purposes | 1,000.00 | 1,023.10 | 2.14 | 0.42% |
| Multifactor Technology ETF |
| Actual expenses/actual returns | $1,000.00 | $1,158.10 | $2.18 | 0.40% |
| Hypothetical example for comparison purposes | 1,000.00 | 1,023.20 | 2.04 | 0.40% |
| Multifactor Utilities ETF |
| Actual expenses/actual returns | $1,000.00 | $1,010.00 | $2.03 | 0.40% |
| Hypothetical example for comparison purposes | 1,000.00 | 1,023.20 | 2.04 | 0.40% |
| | |
| 1 | Expenses are equal to the annualized expense ratio, multiplied by the average account value over the period, multiplied by 184/365 (to reflect the one-half year period). |
| 20 | JOHN HANCOCK MULTIFACTOR ETFS | SEMIANNUAL | |
MULTIFACTOR CONSUMER DISCRETIONARY ETF
As of 10-31-21 (unaudited)
| | Shares or
Principal
Amount | Value |
| COMMON STOCKS – 99.9% | | $26,910,277 |
| (Cost $22,299,590) | | |
| Communication services – 0.5% | 131,412 |
| Entertainment – 0.5% | |
| Roku, Inc. (A) | 431 | 131,412 |
| Consumer discretionary – 92.9% | 25,030,890 |
| Auto components – 0.3% | |
| Fox Factory Holding Corp. (A) | 561 | 90,293 |
| Automobiles – 11.9% | |
| Ford Motor Company (A) | 23,340 | 398,647 |
| General Motors Company (A) | 8,957 | 487,530 |
| Harley-Davidson, Inc. | 2,094 | 76,410 |
| Tesla, Inc. (A) | 1,935 | 2,155,590 |
| Thor Industries, Inc. | 715 | 72,901 |
| Distributors – 1.7% | |
| Genuine Parts Company | 1,946 | 255,140 |
| LKQ Corp. (A) | 3,552 | 195,644 |
| Diversified consumer services – 0.8% | |
| Bright Horizons Family Solutions, Inc. (A) | 807 | 133,962 |
| Chegg, Inc. (A) | 1,271 | 75,548 |
| Hotels, restaurants and leisure – 20.3% | |
| Airbnb, Inc., Class A (A) | 546 | 93,180 |
| Booking Holdings, Inc. (A) | 110 | 266,286 |
| Boyd Gaming Corp. (A) | 1,209 | 77,110 |
| Caesars Entertainment, Inc. (A) | 2,215 | 242,454 |
| Carnival Corp. (A) | 8,803 | 195,074 |
| Chipotle Mexican Grill, Inc. (A) | 134 | 238,390 |
| Choice Hotels International, Inc. | 386 | 54,279 |
| Churchill Downs, Inc. | 437 | 100,510 |
| Darden Restaurants, Inc. | 1,762 | 253,975 |
| Domino’s Pizza, Inc. | 360 | 176,029 |
| DraftKings, Inc., Class A (A)(B) | 3,166 | 147,504 |
| Expedia Group, Inc. (A) | 1,229 | 202,060 |
| Hilton Worldwide Holdings, Inc. (A) | 2,529 | 364,050 |
| Hyatt Hotels Corp., Class A (A) | 494 | 42,089 |
| Las Vegas Sands Corp. (A) | 2,244 | 87,090 |
| Marriott International, Inc., Class A (A) | 2,459 | 393,489 |
| Marriott Vacations Worldwide Corp. | 458 | 72,007 |
| McDonald’s Corp. | 2,220 | 545,121 |
| MGM Resorts International | 4,980 | 234,857 |
| Norwegian Cruise Line Holdings, Ltd. (A) | 3,795 | 97,607 |
| Penn National Gaming, Inc. (A) | 1,909 | 136,684 |
| Planet Fitness, Inc., Class A (A) | 863 | 68,652 |
| Royal Caribbean Cruises, Ltd. (A) | 2,327 | 196,469 |
| Scientific Games Corp. (A) | 531 | 42,507 |
| Starbucks Corp. | 3,547 | 376,230 |
| Texas Roadhouse, Inc. | 889 | 78,952 |
| Vail Resorts, Inc. | 519 | 178,904 |
| Wyndham Hotels & Resorts, Inc. | 1,189 | 100,435 |
| Wynn Resorts, Ltd. (A) | 889 | 79,832 |
MULTIFACTOR CONSUMER DISCRETIONARY ETF (continued)
| | Shares or
Principal
Amount | Value |
| Consumer discretionary (continued) | |
| Hotels, restaurants and leisure (continued) | |
| Yum! Brands, Inc. | 2,700 | $337,338 |
| Household durables – 2.7% | |
| Garmin, Ltd. | 2,002 | 287,487 |
| Helen of Troy, Ltd. (A) | 329 | 74,009 |
| Tempur Sealy International, Inc. | 3,095 | 137,635 |
| Whirlpool Corp. | 1,056 | 222,636 |
| Internet and direct marketing retail – 8.8% | |
| Amazon.com, Inc. (A) | 423 | 1,426,540 |
| Chewy, Inc., Class A (A)(B) | 573 | 43,433 |
| DoorDash, Inc., Class A (A) | 626 | 121,945 |
| eBay, Inc. | 4,435 | 340,253 |
| Etsy, Inc. (A) | 1,288 | 322,889 |
| Wayfair, Inc., Class A (A)(B) | 466 | 116,081 |
| Leisure products – 3.0% | |
| Brunswick Corp. | 1,300 | 121,017 |
| Hasbro, Inc. | 1,593 | 152,546 |
| Mattel, Inc. (A) | 5,535 | 120,718 |
| Peloton Interactive, Inc., Class A (A) | 2,125 | 194,310 |
| Polaris, Inc. | 1,031 | 118,513 |
| YETI Holdings, Inc. (A) | 1,080 | 106,196 |
| Multiline retail – 6.5% | |
| Dollar General Corp. | 1,780 | 394,306 |
| Dollar Tree, Inc. (A) | 3,190 | 343,754 |
| Kohl’s Corp. | 1,842 | 89,392 |
| Macy’s, Inc. | 2,838 | 75,122 |
| Target Corp. | 3,289 | 853,890 |
| Specialty retail – 27.8% | |
| Advance Auto Parts, Inc. | 895 | 201,840 |
| AutoNation, Inc. (A) | 1,102 | 133,474 |
| AutoZone, Inc. (A) | 199 | 355,183 |
| Bath & Body Works, Inc. | 2,129 | 147,093 |
| Best Buy Company, Inc. | 4,549 | 556,070 |
| Burlington Stores, Inc. (A) | 657 | 181,523 |
| CarMax, Inc. (A) | 2,324 | 318,202 |
| Carvana Company (A) | 313 | 94,895 |
| Dick’s Sporting Goods, Inc. | 1,073 | 133,277 |
| Five Below, Inc. (A) | 756 | 149,159 |
| Floor & Decor Holdings, Inc., Class A (A) | 1,316 | 178,871 |
| Foot Locker, Inc. | 922 | 43,952 |
| GameStop Corp., Class A (A) | 418 | 76,707 |
| Lithia Motors, Inc. | 373 | 119,069 |
| Lowe’s Companies, Inc. | 2,635 | 616,116 |
| O’Reilly Automotive, Inc. (A) | 741 | 461,139 |
| Penske Automotive Group, Inc. | 414 | 43,905 |
| RH (A) | 213 | 140,501 |
| Ross Stores, Inc. | 3,562 | 403,218 |
| The Gap, Inc. | 3,628 | 82,319 |
| The Home Depot, Inc. | 3,915 | 1,455,362 |
| The TJX Companies, Inc. | 7,517 | 492,288 |
| SEE NOTES TO FINANCIAL STATEMENTS | SEMIANNUAL REPORT | JOHN HANCOCK MULTIFACTOR ETFS | 21 |
MULTIFACTOR CONSUMER DISCRETIONARY ETF (continued)
| | Shares or
Principal
Amount | Value |
| Consumer discretionary (continued) | |
| Specialty retail (continued) | |
| Tractor Supply Company | 2,117 | $459,749 |
| Ulta Beauty, Inc. (A) | 881 | 323,644 |
| Victoria’s Secret & Company (A) | 1,180 | 59,555 |
| Williams-Sonoma, Inc. | 1,460 | 271,166 |
| Textiles, apparel and luxury goods – 9.1% | |
| Capri Holdings, Ltd. (A) | 1,842 | 98,068 |
| Columbia Sportswear Company | 460 | 47,766 |
| Crocs, Inc. (A) | 550 | 88,798 |
| Deckers Outdoor Corp. (A) | 419 | 165,635 |
| Hanesbrands, Inc. | 7,394 | 125,994 |
| Levi Strauss & Company, Class A | 990 | 25,918 |
| Lululemon Athletica, Inc. (A) | 644 | 300,110 |
| NIKE, Inc., Class B | 4,829 | 807,843 |
| PVH Corp. (A) | 781 | 85,387 |
| Ralph Lauren Corp. | 644 | 81,897 |
| Skechers USA, Inc., Class A (A) | 1,651 | 76,293 |
| Tapestry, Inc. | 3,437 | 133,974 |
| Under Armour, Inc., Class A (A) | 2,200 | 48,312 |
| Under Armour, Inc., Class C (A) | 2,279 | 43,028 |
| VF Corp. | 4,392 | 320,089 |
| Consumer staples – 0.9% | 246,565 |
| Personal products – 0.9% | |
| Coty, Inc., Class A (A) | 2,074 | 17,588 |
| The Estee Lauder Companies, Inc., Class A | 706 | 228,977 |
| Industrials – 5.6% | 1,501,410 |
| Building products – 1.5% | |
| Allegion PLC | 1,540 | 197,582 |
| Fortune Brands Home & Security, Inc. | 1,969 | 199,657 |
| Commercial services and supplies – 1.9% | |
| Copart, Inc. (A) | 2,631 | 408,568 |
| Rollins, Inc. | 2,827 | 99,595 |
| Road and rail – 1.7% | |
| Avis Budget Group, Inc. (A) | 355 | 61,525 |
| Lyft, Inc., Class A (A) | 2,561 | 117,473 |
| Uber Technologies, Inc. (A) | 6,310 | 276,504 |
| Trading companies and distributors – 0.5% | |
| SiteOne Landscape Supply, Inc. (A) | 598 | 140,506 |
|
| SHORT-TERM INVESTMENTS – 0.7% | | $181,656 |
| (Cost $181,659) | | |
| Short-term funds – 0.7% | 181,656 |
| John Hancock Collateral Trust, 0.0370% (C)(D) | 10,654 | 106,602 |
MULTIFACTOR CONSUMER DISCRETIONARY ETF (continued)
| | Shares or
Principal
Amount | Value |
|
| State Street Institutional U.S. Government Money Market Fund, Premier Class, 0.0250% (C) | 75,054 | $75,054 |
| Total investments (Multifactor Consumer Discretionary ETF) (Cost $22,481,249) 100.6% | $27,091,933 |
| Other assets and liabilities, net (0.6%) | | (166,428) |
| Total net assets 100.0% | | $26,925,505 |
| The percentage shown for each investment category is the total value of the category as a percentage of the net assets of the fund. |
| Security Abbreviations and Legend |
| (A) | Non-income producing security. |
| (B) | All or a portion of this security is on loan as of 10-31-21. |
| (C) | The rate shown is the annualized seven-day yield as of 10-31-21. |
| (D) | Investment is an affiliate of the fund, the advisor and/or subadvisor. This security represents the investment of cash collateral received for securities lending. |
MULTIFACTOR CONSUMER STAPLES ETF
As of 10-31-21 (unaudited)
| | Shares or
Principal
Amount | Value |
| COMMON STOCKS – 99.9% | | $21,867,530 |
| (Cost $19,446,763) | | |
| Consumer discretionary – 0.8% | 180,488 |
| Household durables – 0.8% | |
| Newell Brands, Inc. | 7,885 | 180,488 |
| Consumer staples – 95.6% | 20,932,039 |
| Beverages – 20.8% | |
| Brown-Forman Corp., Class A | 576 | 36,881 |
| Brown-Forman Corp., Class B | 5,313 | 360,700 |
| Celsius Holdings, Inc. (A) | 439 | 42,372 |
| Constellation Brands, Inc., Class A | 3,055 | 662,355 |
| Keurig Dr. Pepper, Inc. | 6,797 | 245,304 |
| Molson Coors Beverage Company, Class B | 3,889 | 171,466 |
| Monster Beverage Corp. (A) | 3,220 | 273,700 |
| PepsiCo, Inc. | 8,495 | 1,372,792 |
| The Boston Beer Company, Inc., Class A (A) | 152 | 74,857 |
| The Coca-Cola Company | 23,269 | 1,311,674 |
| Food and staples retailing – 25.2% | |
| Albertsons Companies, Inc., Class A (B) | 3,463 | 107,180 |
| BJ’s Wholesale Club Holdings, Inc. (A) | 2,883 | 168,483 |
| Casey’s General Stores, Inc. | 837 | 160,319 |
| Costco Wholesale Corp. | 2,917 | 1,433,822 |
| Performance Food Group Company (A) | 2,723 | 123,161 |
| Sysco Corp. | 8,331 | 640,654 |
| The Kroger Company | 18,644 | 746,133 |
| U.S. Foods Holding Corp. (A) | 4,311 | 149,462 |
| Walgreens Boots Alliance, Inc. | 14,023 | 659,361 |
| Walmart, Inc. | 8,970 | 1,340,297 |
| Food products – 28.9% | |
| Archer-Daniels-Midland Company | 10,670 | 685,441 |
| Beyond Meat, Inc. (A)(B) | 552 | 54,637 |
| 22 | JOHN HANCOCK MULTIFACTOR ETFS | SEMIANNUAL REPORT | SEE NOTES TO FINANCIAL STATEMENTS |
MULTIFACTOR CONSUMER STAPLES ETF (continued)
| | Shares or
Principal
Amount | Value |
| Consumer staples (continued) | |
| Food products (continued) | |
| Bunge, Ltd. | 2,839 | $263,005 |
| Campbell Soup Company | 5,850 | 233,708 |
| Conagra Brands, Inc. | 9,357 | 301,295 |
| Darling Ingredients, Inc. (A) | 2,924 | 247,136 |
| Freshpet, Inc. (A) | 594 | 92,611 |
| General Mills, Inc. | 7,439 | 459,730 |
| Hormel Foods Corp. | 5,483 | 232,041 |
| Ingredion, Inc. | 1,656 | 157,701 |
| Kellogg Company | 6,925 | 424,503 |
| Lamb Weston Holdings, Inc. | 3,003 | 169,519 |
| McCormick & Company, Inc. | 4,309 | 345,711 |
| Mondelez International, Inc., Class A | 13,173 | 800,128 |
| Pilgrim’s Pride Corp. (A) | 1,301 | 36,636 |
| Post Holdings, Inc. (A) | 1,489 | 151,104 |
| The Hershey Company | 2,808 | 492,383 |
| The J.M. Smucker Company | 2,116 | 259,972 |
| The Kraft Heinz Company | 12,902 | 463,053 |
| Tyson Foods, Inc., Class A | 5,653 | 452,070 |
| Household products – 14.6% | |
| Church & Dwight Company, Inc. | 5,096 | 445,187 |
| Colgate-Palmolive Company | 8,072 | 615,006 |
| Kimberly-Clark Corp. | 2,804 | 363,090 |
| Reynolds Consumer Products, Inc. | 1,695 | 45,731 |
| The Clorox Company | 2,395 | 390,409 |
| The Procter & Gamble Company | 9,331 | 1,334,237 |
| Personal products – 0.4% | |
| Herbalife Nutrition, Ltd. (A) | 1,895 | 87,928 |
| Tobacco – 5.7% | |
| Altria Group, Inc. | 11,812 | 521,027 |
| Philip Morris International, Inc. | 7,680 | 726,067 |
| Materials – 3.5% | 755,003 |
| Chemicals – 3.5% | |
| Corteva, Inc. | 14,005 | 604,316 |
| The Scotts Miracle-Gro Company | 1,015 | 150,687 |
|
| SHORT-TERM INVESTMENTS – 0.9% | | $200,756 |
| (Cost $200,763) | | |
| Short-term funds – 0.9% | 200,756 |
| John Hancock Collateral Trust, 0.0370% (C)(D) | 14,644 | 146,524 |
|
| State Street Institutional U.S. Government Money Market Fund, Premier Class, 0.0250% (C) | 54,232 | 54,232 |
| Total investments (Multifactor Consumer Staples ETF) (Cost $19,647,526) 100.8% | $22,068,286 |
| Other assets and liabilities, net (0.8%) | | (183,521) |
| Total net assets 100.0% | | $21,884,765 |
| The percentage shown for each investment category is the total value of the category as a percentage of the net assets of the fund. |
MULTIFACTOR CONSUMER STAPLES ETF (continued)
| Security Abbreviations and Legend |
| (A) | Non-income producing security. |
| (B) | All or a portion of this security is on loan as of 10-31-21. |
| (C) | The rate shown is the annualized seven-day yield as of 10-31-21. |
| (D) | Investment is an affiliate of the fund, the advisor and/or subadvisor. This security represents the investment of cash collateral received for securities lending. |
MULTIFACTOR DEVELOPED INTERNATIONAL ETF
As of 10-31-21 (unaudited)
| | Shares or
Principal
Amount | Value |
| COMMON STOCKS - 98.1% | $518,809,482 |
| (Cost $439,145,167) | | |
| Australia - 6.8% | 36,166,653 |
| Afterpay, Ltd. (A) | 2,486 | 230,211 |
| Ampol, Ltd. | 3,744 | 85,910 |
| APA Group | 74,410 | 458,293 |
| Aristocrat Leisure, Ltd. | 16,364 | 573,744 |
| ASX, Ltd. | 2,206 | 137,558 |
| Aurizon Holdings, Ltd. | 240,291 | 608,226 |
| Australia & New Zealand Banking Group, Ltd. | 63,135 | 1,334,418 |
| BHP Group PLC | 58,095 | 1,540,912 |
| BHP Group, Ltd. (B) | 73,359 | 2,015,555 |
| BlueScope Steel, Ltd. | 42,691 | 661,184 |
| Brambles, Ltd. | 78,649 | 593,095 |
| CIMIC Group, Ltd. | 2,268 | 33,934 |
| Cochlear, Ltd. | 2,718 | 450,026 |
| Coles Group, Ltd. | 30,876 | 397,493 |
| Commonwealth Bank of Australia | 36,460 | 2,866,672 |
| Computershare, Ltd. | 33,034 | 465,470 |
| Crown Resorts, Ltd. (A) | 24,227 | 181,241 |
| CSL, Ltd. | 10,789 | 2,435,055 |
| Dexus | 25,289 | 206,471 |
| Domino’s Pizza Enterprises, Ltd. | 2,652 | 269,825 |
| Endeavour Group, Ltd. | 64,225 | 328,028 |
| Evolution Mining, Ltd. | 93,764 | 255,647 |
| Fortescue Metals Group, Ltd. | 59,726 | 624,902 |
| Goodman Group | 23,610 | 388,363 |
| Insurance Australia Group, Ltd. | 96,284 | 347,131 |
| Lendlease Corp., Ltd. | 40,930 | 321,567 |
| Macquarie Group, Ltd. | 9,298 | 1,374,677 |
| Magellan Financial Group, Ltd. | 8,386 | 218,377 |
| Medibank Private, Ltd. | 213,709 | 532,916 |
| Mineral Resources, Ltd. | 10,861 | 314,805 |
| Mirvac Group | 93,288 | 197,593 |
| National Australia Bank, Ltd. | 56,351 | 1,215,157 |
| Newcrest Mining, Ltd. | 15,446 | 288,761 |
| Northern Star Resources, Ltd. | 58,670 | 407,179 |
| Oil Search, Ltd. | 110,333 | 355,517 |
| Origin Energy, Ltd. | 114,904 | 435,837 |
| Qantas Airways, Ltd. (A) | 37,315 | 149,946 |
| QBE Insurance Group, Ltd. | 78,256 | 695,345 |
| Ramsay Health Care, Ltd. | 11,095 | 586,842 |
| REA Group, Ltd. | 1,466 | 176,332 |
| SEE NOTES TO FINANCIAL STATEMENTS | SEMIANNUAL REPORT | JOHN HANCOCK MULTIFACTOR ETFS | 23 |
MULTIFACTOR DEVELOPED INTERNATIONAL ETF (continued)
| | Shares or
Principal
Amount | Value |
| Australia (continued) | |
| Reece, Ltd. (B) | 7,448 | $111,268 |
| Rio Tinto, Ltd. | 18,830 | 1,276,990 |
| Santos, Ltd. | 231,857 | 1,215,551 |
| Scentre Group | 102,020 | 231,414 |
| SEEK, Ltd. | 10,164 | 249,638 |
| Sonic Healthcare, Ltd. | 12,696 | 381,725 |
| South32, Ltd. | 254,639 | 682,796 |
| Stockland | 73,279 | 250,431 |
| Suncorp Group, Ltd. | 74,014 | 651,537 |
| Sydney Airport (A) | 36,021 | 221,583 |
| Tabcorp Holdings, Ltd. | 133,941 | 498,991 |
| Telstra Corp., Ltd. | 180,838 | 518,861 |
| The GPT Group | 45,278 | 175,483 |
| TPG Telecom, Ltd. | 8,877 | 45,006 |
| Transurban Group | 27,229 | 274,871 |
| Treasury Wine Estates, Ltd. | 41,228 | 356,732 |
| Vicinity Centres | 85,049 | 110,194 |
| Wesfarmers, Ltd. | 23,065 | 991,806 |
| Westpac Banking Corp. | 81,815 | 1,577,453 |
| WiseTech Global, Ltd. | 3,802 | 145,868 |
| Woodside Petroleum, Ltd. | 24,678 | 431,139 |
| Woolworths Group, Ltd. | 35,211 | 1,007,101 |
| Austria - 0.2% | 861,236 |
| Erste Group Bank AG | 7,186 | 308,523 |
| OMV AG | 3,635 | 220,426 |
| Raiffeisen Bank International AG | 3,608 | 105,637 |
| Telekom Austria AG (A) | 2,680 | 23,199 |
| Verbund AG | 954 | 99,472 |
| voestalpine AG | 2,736 | 103,979 |
| Belgium - 0.9% | 4,830,567 |
| Ackermans & van Haaren NV | 2,129 | 366,365 |
| Ageas SA/NV | 16,070 | 782,934 |
| Anheuser-Busch InBev SA/NV | 22,937 | 1,400,718 |
| D’ieteren Group | 229 | 39,460 |
| Elia Group SA/NV | 2,694 | 314,569 |
| Etablissements Franz Colruyt NV (B) | 3,726 | 182,998 |
| KBC Group NV | 7,527 | 701,727 |
| Proximus SADP | 11,026 | 207,794 |
| Solvay SA | 1,907 | 226,867 |
| UCB SA | 1,317 | 157,134 |
| Umicore SA | 5,478 | 314,308 |
| Warehouses De Pauw CVA | 2,976 | 135,693 |
| Chile - 0.1% | 559,705 |
| Antofagasta PLC | 28,644 | 559,705 |
| Czech Republic - 0.1% | 357,478 |
| Avast PLC (C) | 46,603 | 357,478 |
| Denmark - 2.6% | 13,639,731 |
| A.P. Moller - Maersk A/S, Series A | 89 | 243,948 |
MULTIFACTOR DEVELOPED INTERNATIONAL ETF (continued)
| | Shares or
Principal
Amount | Value |
| Denmark (continued) | |
| A.P. Moller - Maersk A/S, Series B | 105 | $303,729 |
| Carlsberg A/S, Class B | 5,845 | 965,173 |
| Chr. Hansen Holding A/S | 6,988 | 556,575 |
| Coloplast A/S, B Shares | 2,709 | 442,064 |
| Danske Bank A/S | 40,493 | 685,975 |
| Demant A/S (A) | 2,958 | 143,429 |
| DSV A/S | 6,243 | 1,452,380 |
| Genmab A/S (A) | 4,388 | 1,968,622 |
| Novo Nordisk A/S, B Shares | 35,297 | 3,867,194 |
| Novozymes A/S, B Shares | 16,453 | 1,211,129 |
| Orsted A/S (C) | 4,958 | 700,314 |
| Vestas Wind Systems A/S | 25,390 | 1,099,199 |
| Finland - 1.3% | 7,125,025 |
| Elisa OYJ | 9,249 | 558,503 |
| Fortum OYJ | 11,256 | 334,768 |
| Kesko OYJ, A Shares | 7,371 | 225,194 |
| Kesko OYJ, B Shares | 17,100 | 555,872 |
| Kone OYJ, Class B | 10,002 | 682,451 |
| Metso Outotec OYJ | 41,358 | 415,438 |
| Neste OYJ | 11,175 | 623,206 |
| Nokia OYJ (A) | 160,688 | 924,202 |
| Nordea Bank ABP | 65,370 | 799,917 |
| Orion OYJ, Class A | 621 | 26,806 |
| Orion OYJ, Class B | 5,880 | 254,697 |
| Sampo OYJ, A Shares | 5,353 | 284,959 |
| Stora Enso OYJ, R Shares | 50,513 | 840,599 |
| UPM-Kymmene OYJ | 9,812 | 346,552 |
| Wartsila OYJ ABP | 18,144 | 251,861 |
| France - 10.2% | 53,869,303 |
| Air Liquide SA | 11,986 | 2,000,723 |
| Airbus SE (A) | 11,787 | 1,508,639 |
| AXA SA | 48,895 | 1,423,646 |
| BNP Paribas SA | 23,578 | 1,579,838 |
| Capgemini SE | 12,260 | 2,856,020 |
| Cie de Saint-Gobain | 49,252 | 3,394,732 |
| Cie Generale des Etablissements Michelin SCA | 23,891 | 3,751,812 |
| Credit Agricole SA | 85,955 | 1,297,107 |
| Danone SA | 26,601 | 1,734,678 |
| Dassault Systemes SE | 11,314 | 659,631 |
| Electricite de France SA | 55,571 | 818,660 |
| Engie SA | 123,966 | 1,763,979 |
| EssilorLuxottica SA | 5,593 | 1,157,929 |
| Hermes International | 639 | 1,013,461 |
| Kering SA | 1,315 | 986,420 |
| Legrand SA | 19,497 | 2,126,327 |
| L’Oreal SA | 2,949 | 1,347,857 |
| LVMH Moet Hennessy Louis Vuitton SE | 5,458 | 4,277,376 |
| Orange SA | 278,514 | 3,040,996 |
| Pernod Ricard SA | 4,372 | 1,005,322 |
| Safran SA | 16,438 | 2,207,413 |
| 24 | JOHN HANCOCK MULTIFACTOR ETFS | SEMIANNUAL REPORT | SEE NOTES TO FINANCIAL STATEMENTS |
MULTIFACTOR DEVELOPED INTERNATIONAL ETF (continued)
| | Shares or
Principal
Amount | Value |
| France (continued) | |
| Sanofi | 20,591 | $2,059,534 |
| Sartorius Stedim Biotech | 640 | 352,693 |
| Schneider Electric SE | 5,970 | 1,028,717 |
| Societe Generale SA | 48,197 | 1,608,299 |
| Teleperformance | 3,246 | 1,356,447 |
| Thales SA | 7,503 | 691,675 |
| TotalEnergies SE | 56,632 | 2,842,355 |
| Veolia Environnement SA | 17,940 | 586,085 |
| Vinci SA | 20,197 | 2,158,961 |
| Vivendi SE | 53,433 | 688,536 |
| Worldline SA (A)(C) | 9,321 | 543,435 |
| Germany - 8.1% | 42,705,942 |
| adidas AG | 3,684 | 1,207,795 |
| Allianz SE | 9,597 | 2,233,996 |
| BASF SE | 22,718 | 1,637,366 |
| Bayer AG | 44,812 | 2,523,961 |
| Bayerische Motoren Werke AG | 18,052 | 1,822,502 |
| Beiersdorf AG | 4,077 | 433,594 |
| Carl Zeiss Meditec AG, Bearer Shares | 439 | 88,372 |
| Continental AG (A) | 12,110 | 1,422,731 |
| Daimler AG | 34,300 | 3,403,334 |
| Delivery Hero SE (A)(C) | 3,808 | 473,952 |
| Deutsche Bank AG (A) | 121,878 | 1,572,068 |
| Deutsche Boerse AG | 11,158 | 1,854,248 |
| Deutsche Post AG | 22,551 | 1,396,718 |
| Deutsche Telekom AG | 125,686 | 2,338,546 |
| E.ON SE | 114,966 | 1,458,964 |
| Evonik Industries AG | 16,876 | 547,223 |
| Fresenius Medical Care AG & Company KGaA | 24,924 | 1,657,335 |
| Fresenius SE & Company KGaA | 51,002 | 2,317,500 |
| Hannover Rueck SE | 3,692 | 675,065 |
| Hapag-Lloyd AG (C) | 656 | 141,127 |
| HeidelbergCement AG | 12,069 | 909,800 |
| HelloFresh SE (A) | 4,660 | 377,495 |
| Henkel AG & Company KGaA | 1,693 | 141,260 |
| Infineon Technologies AG | 15,165 | 708,920 |
| Knorr-Bremse AG | 3,609 | 380,647 |
| Merck KGaA | 2,148 | 507,595 |
| Muenchener Rueckversicherungs-Gesellschaft AG | 3,837 | 1,137,622 |
| Puma SE | 4,326 | 537,172 |
| RWE AG | 39,270 | 1,511,961 |
| SAP SE | 11,083 | 1,607,329 |
| Siemens AG | 8,787 | 1,426,472 |
| Siemens Energy AG (A) | 21,353 | 613,321 |
| Siemens Healthineers AG (C) | 3,046 | 202,545 |
| Symrise AG | 7,958 | 1,100,983 |
| Volkswagen AG | 1,550 | 503,681 |
| Vonovia SE | 16,574 | 1,006,196 |
| Zalando SE (A)(C) | 8,755 | 826,546 |
MULTIFACTOR DEVELOPED INTERNATIONAL ETF (continued)
| | Shares or
Principal
Amount | Value |
| Hong Kong - 2.8% | $14,769,302 |
| AIA Group, Ltd. | 317,924 | 3,590,364 |
| BOC Hong Kong Holdings, Ltd. | 95,295 | 302,580 |
| Budweiser Brewing Company APAC, Ltd. (C) | 14,300 | 39,431 |
| Chow Tai Fook Jewellery Group, Ltd. | 95,200 | 194,829 |
| CK Asset Holdings, Ltd. | 139,969 | 864,567 |
| CK Hutchison Holdings, Ltd. | 74,273 | 499,829 |
| CK Infrastructure Holdings, Ltd. | 46,929 | 282,936 |
| CLP Holdings, Ltd. | 155,071 | 1,518,008 |
| Galaxy Entertainment Group, Ltd. (A) | 22,641 | 122,532 |
| Hang Lung Properties, Ltd. | 100,000 | 232,162 |
| Hang Seng Bank, Ltd. | 20,289 | 386,008 |
| Henderson Land Development Company, Ltd. | 96,398 | 403,979 |
| Hong Kong & China Gas Company, Ltd. | 119,065 | 185,201 |
| Hong Kong Exchanges & Clearing, Ltd. | 30,125 | 1,823,211 |
| Link REIT | 49,710 | 440,927 |
| MTR Corp., Ltd. | 43,913 | 239,349 |
| New World Development Company, Ltd. | 136,265 | 591,196 |
| Orient Overseas International, Ltd. | 6,500 | 120,073 |
| Power Assets Holdings, Ltd. | 96,073 | 586,018 |
| Sun Hung Kai Properties, Ltd. | 43,662 | 580,921 |
| Swire Properties, Ltd. | 76,401 | 204,776 |
| Techtronic Industries Company, Ltd. | 47,577 | 979,178 |
| Wharf Real Estate Investment Company, Ltd. | 102,993 | 581,227 |
| Ireland - 1.1% | 5,787,634 |
| CRH PLC | 33,967 | 1,630,508 |
| DCC PLC | 5,506 | 460,841 |
| Experian PLC | 24,150 | 1,107,977 |
| Flutter Entertainment PLC (A) | 2,378 | 450,217 |
| James Hardie Industries PLC, CHESS Depositary Interest | 11,490 | 445,747 |
| Kerry Group PLC, Class A | 1,639 | 220,211 |
| Kingspan Group PLC | 9,202 | 1,061,067 |
| Smurfit Kappa Group PLC | 7,843 | 411,066 |
| Israel - 0.4% | 2,416,813 |
| Azrieli Group, Ltd. | 644 | 60,262 |
| Bank Hapoalim BM | 30,367 | 299,163 |
| Bank Leumi Le-Israel BM | 47,362 | 452,638 |
| Check Point Software Technologies, Ltd. (A) | 3,094 | 370,042 |
| CyberArk Software, Ltd. (A) | 118 | 21,253 |
| Elbit Systems, Ltd. | 600 | 94,651 |
| Fiverr International, Ltd. (A) | 63 | 10,732 |
| ICL Group, Ltd. | 26,046 | 223,180 |
| Mizrahi Tefahot Bank, Ltd. | 6,245 | 227,300 |
| Nice, Ltd. (A) | 639 | 180,192 |
| Teva Pharmaceutical Industries, Ltd. (A) | 45,727 | 404,132 |
| Wix.com, Ltd. (A) | 394 | 73,268 |
| Italy - 2.1% | 11,265,356 |
| Amplifon SpA | 7,093 | 360,758 |
| Assicurazioni Generali SpA (B) | 24,267 | 529,364 |
| SEE NOTES TO FINANCIAL STATEMENTS | SEMIANNUAL REPORT | JOHN HANCOCK MULTIFACTOR ETFS | 25 |
MULTIFACTOR DEVELOPED INTERNATIONAL ETF (continued)
| | Shares or
Principal
Amount | Value |
| Italy (continued) | |
| Atlantia SpA (A) | 20,287 | $392,185 |
| Davide Campari-Milano NV | 22,383 | 318,085 |
| DiaSorin SpA | 1,448 | 327,347 |
| Enel SpA | 150,081 | 1,256,757 |
| Eni SpA | 86,703 | 1,244,580 |
| Ferrari NV | 3,050 | 723,570 |
| FinecoBank Banca Fineco SpA (A) | 26,520 | 506,850 |
| Infrastrutture Wireless Italiane SpA (C) | 19,185 | 212,161 |
| Interpump Group SpA | 855 | 63,077 |
| Intesa Sanpaolo SpA | 312,227 | 887,955 |
| Mediobanca Banca di Credito Finanziario SpA (A) | 55,008 | 656,632 |
| Moncler SpA | 9,345 | 671,796 |
| Nexi SpA (A)(C) | 6,276 | 109,125 |
| Poste Italiane SpA (C) | 12,724 | 181,705 |
| PRADA SpA | 21,600 | 135,502 |
| Prysmian SpA | 10,614 | 401,656 |
| Recordati Industria Chimica e Farmaceutica SpA | 6,688 | 418,872 |
| Snam SpA | 52,982 | 300,252 |
| Telecom Italia SpA | 967,815 | 345,073 |
| Terna SpA | 77,691 | 579,186 |
| UniCredit SpA | 40,430 | 534,501 |
| UnipolSai Assicurazioni SpA | 37,397 | 108,367 |
| Japan - 23.5% | 124,003,515 |
| ABC-Mart, Inc. | 1,400 | 66,915 |
| Acom Company, Ltd. | 17,300 | 57,502 |
| Advantest Corp. | 4,900 | 400,938 |
| Aeon Company, Ltd. | 18,200 | 417,870 |
| AGC, Inc. | 17,600 | 875,177 |
| Aisin Corp. | 16,000 | 584,433 |
| Ajinomoto Company, Inc. | 14,500 | 433,124 |
| ANA Holdings, Inc. (A) | 8,100 | 188,461 |
| Asahi Group Holdings, Ltd. | 8,300 | 375,383 |
| Asahi Intecc Company, Ltd. | 9,300 | 244,602 |
| Asahi Kasei Corp. | 58,400 | 612,809 |
| Astellas Pharma, Inc. | 19,700 | 331,198 |
| Azbil Corp. | 1,800 | 76,562 |
| Bandai Namco Holdings, Inc. | 5,001 | 381,001 |
| BayCurrent Consulting, Inc. | 400 | 164,525 |
| Bridgestone Corp. | 15,400 | 677,857 |
| Brother Industries, Ltd. | 13,800 | 266,015 |
| Canon, Inc. | 21,200 | 475,594 |
| Capcom Company, Ltd. | 8,000 | 214,690 |
| Central Japan Railway Company | 4,644 | 688,302 |
| Chubu Electric Power Company, Inc. | 32,200 | 332,943 |
| Chugai Pharmaceutical Company, Ltd. | 12,400 | 461,853 |
| Concordia Financial Group, Ltd. | 76,100 | 302,331 |
| Cosmos Pharmaceutical Corp. | 700 | 106,635 |
| CyberAgent, Inc. | 24,000 | 399,912 |
| Dai Nippon Printing Company, Ltd. | 20,324 | 500,859 |
MULTIFACTOR DEVELOPED INTERNATIONAL ETF (continued)
| | Shares or
Principal
Amount | Value |
| Japan (continued) | |
| Daifuku Company, Ltd. | 4,600 | $421,574 |
| Dai-ichi Life Holdings, Inc. | 27,000 | 568,652 |
| Daiichi Sankyo Company, Ltd. | 19,000 | 477,729 |
| Daikin Industries, Ltd. | 5,547 | 1,210,829 |
| Daito Trust Construction Company, Ltd. | 3,886 | 481,213 |
| Daiwa House Industry Company, Ltd. | 26,200 | 861,883 |
| Daiwa House REIT Investment Corp. | 38 | 108,976 |
| Daiwa Securities Group, Inc. | 86,800 | 486,202 |
| Denso Corp. | 9,200 | 663,465 |
| Dentsu Group, Inc. | 10,700 | 391,309 |
| Disco Corp. | 1,698 | 455,679 |
| East Japan Railway Company | 9,700 | 602,970 |
| Eisai Company, Ltd. | 2,872 | 202,180 |
| ENEOS Holdings, Inc. | 243,800 | 982,683 |
| FANUC Corp. | 1,970 | 385,448 |
| Fast Retailing Company, Ltd. | 1,519 | 1,005,917 |
| Fuji Electric Company, Ltd. | 11,593 | 564,272 |
| FUJIFILM Holdings Corp. | 10,200 | 787,285 |
| Fujitsu, Ltd. | 3,300 | 567,968 |
| GLP J-REIT | 93 | 151,622 |
| GMO Payment Gateway, Inc. | 2,700 | 341,925 |
| Hakuhodo DY Holdings, Inc. | 12,300 | 200,424 |
| Hamamatsu Photonics KK | 3,700 | 218,706 |
| Hankyu Hanshin Holdings, Inc. | 21,300 | 658,474 |
| Hikari Tsushin, Inc. | 541 | 83,267 |
| Hino Motors, Ltd. | 24,700 | 233,082 |
| Hirose Electric Company, Ltd. | 1,005 | 167,375 |
| Hitachi Construction Machinery Company, Ltd. | 9,200 | 292,480 |
| Hitachi Metals, Ltd. (A) | 18,200 | 344,288 |
| Hitachi, Ltd. | 24,400 | 1,402,478 |
| Honda Motor Company, Ltd. | 42,654 | 1,252,780 |
| Hoshizaki Corp. | 2,100 | 176,067 |
| Hoya Corp. | 10,000 | 1,466,784 |
| Hulic Company, Ltd. | 42,400 | 406,430 |
| Ibiden Company, Ltd. | 3,000 | 179,171 |
| Idemitsu Kosan Company, Ltd. | 23,559 | 643,598 |
| Iida Group Holdings Company, Ltd. | 9,600 | 235,990 |
| Inpex Corp. | 56,100 | 468,382 |
| Isuzu Motors, Ltd. | 33,400 | 447,872 |
| ITOCHU Corp. | 51,900 | 1,475,640 |
| Itochu Techno-Solutions Corp. | 5,700 | 179,461 |
| Japan Airlines Company, Ltd. (A) | 13,600 | 292,336 |
| Japan Exchange Group, Inc. | 22,500 | 531,495 |
| Japan Metropolitan Fund Investment Corp. | 151 | 138,386 |
| Japan Post Bank Company, Ltd. | 8,000 | 62,372 |
| Japan Post Holdings Company, Ltd. (A) | 25,500 | 195,681 |
| Japan Post Insurance Company, Ltd. | 10,000 | 162,245 |
| Japan Real Estate Investment Corp. | 37 | 226,494 |
| Japan Tobacco, Inc. | 44,300 | 868,517 |
| JFE Holdings, Inc. | 25,100 | 383,682 |
| JSR Corp. | 8,500 | 306,380 |
| 26 | JOHN HANCOCK MULTIFACTOR ETFS | SEMIANNUAL REPORT | SEE NOTES TO FINANCIAL STATEMENTS |
MULTIFACTOR DEVELOPED INTERNATIONAL ETF (continued)
| | Shares or
Principal
Amount | Value |
| Japan (continued) | |
| Kajima Corp. | 38,600 | $473,931 |
| Kakaku.com, Inc. | 3,900 | 128,774 |
| Kansai Paint Company, Ltd. | 6,400 | 147,785 |
| Kao Corp. | 12,700 | 716,279 |
| KDDI Corp. | 65,000 | 2,011,138 |
| Keio Corp. | 4,470 | 225,019 |
| Keisei Electric Railway Company, Ltd. | 8,800 | 282,078 |
| Keyence Corp. | 1,870 | 1,123,558 |
| Kikkoman Corp. | 1,500 | 122,605 |
| Kintetsu Group Holdings Company, Ltd. (A) | 7,800 | 244,552 |
| Kirin Holdings Company, Ltd. | 8,000 | 138,987 |
| Kobayashi Pharmaceutical Company, Ltd. | 1,400 | 111,853 |
| Kobe Bussan Company, Ltd. (B) | 6,300 | 216,308 |
| Koei Tecmo Holdings Company, Ltd. | 950 | 43,990 |
| Koito Manufacturing Company, Ltd. | 11,600 | 655,155 |
| Komatsu, Ltd. | 24,400 | 634,796 |
| Konami Holdings Corp. | 6,200 | 340,382 |
| Kose Corp. | 1,000 | 115,676 |
| Kubota Corp. | 21,800 | 463,148 |
| Kyocera Corp. | 8,500 | 496,097 |
| Kyowa Kirin Company, Ltd. | 2,600 | 85,280 |
| Lasertec Corp. | 1,900 | 417,075 |
| Lawson, Inc. | 4,300 | 207,788 |
| Lion Corp. (B) | 11,000 | 182,811 |
| Lixil Corp. | 36,700 | 941,116 |
| M3, Inc. | 10,600 | 623,590 |
| Makita Corp. | 2,500 | 115,391 |
| Marubeni Corp. | 95,400 | 804,196 |
| Mazda Motor Corp. (A) | 50,600 | 452,194 |
| Medipal Holdings Corp. | 4,100 | 73,892 |
| MEIJI Holdings Company, Ltd. | 3,500 | 220,697 |
| Mercari, Inc. (A)(B) | 1,900 | 102,478 |
| MINEBEA MITSUMI, Inc. | 35,000 | 882,482 |
| MISUMI Group, Inc. | 14,000 | 584,433 |
| Mitsubishi Chemical Holdings Corp. | 72,900 | 602,700 |
| Mitsubishi Corp. | 35,400 | 1,121,375 |
| Mitsubishi Electric Corp. | 34,900 | 466,762 |
| Mitsubishi Estate Company, Ltd. | 13,600 | 206,102 |
| Mitsubishi HC Capital, Inc. | 73,700 | 368,419 |
| Mitsubishi Heavy Industries, Ltd. | 32,900 | 839,343 |
| Mitsubishi UFJ Financial Group, Inc. | 299,570 | 1,635,451 |
| Mitsui & Company, Ltd. | 40,800 | 927,460 |
| Mitsui Chemicals, Inc. | 22,400 | 663,995 |
| Mitsui Fudosan Company, Ltd. | 17,800 | 405,642 |
| Mitsui O.S.K. Lines, Ltd. | 3,300 | 207,218 |
| Miura Company, Ltd. | 1,300 | 49,765 |
| Mizuho Financial Group, Inc. | 53,400 | 704,819 |
| MonotaRO Company, Ltd. | 7,100 | 160,649 |
| MS&AD Insurance Group Holdings, Inc. | 12,000 | 387,915 |
| Murata Manufacturing Company, Ltd. | 10,800 | 819,578 |
| NEC Corp. | 15,903 | 811,712 |
MULTIFACTOR DEVELOPED INTERNATIONAL ETF (continued)
| | Shares or
Principal
Amount | Value |
| Japan (continued) | |
| Nexon Company, Ltd. | 4,600 | $77,900 |
| NGK Insulators, Ltd. | 16,400 | 272,123 |
| Nidec Corp. | 9,200 | 1,014,199 |
| Nihon M&A Center Holdings, Inc. | 15,000 | 458,452 |
| Nintendo Company, Ltd. | 2,117 | 932,018 |
| Nippon Building Fund, Inc. | 27 | 175,225 |
| Nippon Express Company, Ltd. | 11,300 | 705,600 |
| Nippon Paint Holdings Company, Ltd. | 9,900 | 105,837 |
| Nippon Prologis REIT, Inc. | 49 | 163,512 |
| Nippon Sanso Holdings Corp. | 15,700 | 369,695 |
| Nippon Shinyaku Company, Ltd. | 1,500 | 119,842 |
| Nippon Steel Corp. | 23,700 | 415,490 |
| Nippon Telegraph & Telephone Corp. | 75,366 | 2,107,141 |
| Nippon Yusen KK | 10,500 | 753,256 |
| Nissan Chemical Corp. | 8,300 | 460,767 |
| Nissan Motor Company, Ltd. (A) | 61,600 | 311,930 |
| Nisshin Seifun Group, Inc. | 9,200 | 145,151 |
| Nissin Foods Holdings Company, Ltd. | 2,316 | 176,912 |
| Nitori Holdings Company, Ltd. | 2,201 | 402,560 |
| Nitto Denko Corp. | 16,694 | 1,300,090 |
| Nomura Holdings, Inc. | 74,700 | 360,316 |
| Nomura Real Estate Master Fund, Inc. | 114 | 170,663 |
| Nomura Research Institute, Ltd. | 10,000 | 398,158 |
| NTT Data Corp. | 16,900 | 338,371 |
| Obayashi Corp. | 56,800 | 477,215 |
| Obic Company, Ltd. | 700 | 128,858 |
| Odakyu Electric Railway Company, Ltd. | 14,600 | 315,368 |
| Oji Holdings Corp. | 76,700 | 379,380 |
| Olympus Corp. | 31,600 | 681,884 |
| Omron Corp. | 2,000 | 190,660 |
| Ono Pharmaceutical Company, Ltd. | 4,565 | 95,504 |
| Oracle Corp. Japan | 1,400 | 131,989 |
| Oriental Land Company, Ltd. | 2,200 | 346,135 |
| ORIX Corp. | 43,300 | 856,317 |
| Orix JREIT, Inc. | 45 | 74,549 |
| Osaka Gas Company, Ltd. | 37,000 | 595,764 |
| Otsuka Corp. | 7,300 | 358,518 |
| Otsuka Holdings Company, Ltd. | 7,600 | 299,534 |
| Pan Pacific International Holdings Corp. | 9,900 | 207,160 |
| Panasonic Corp. | 94,504 | 1,154,105 |
| PeptiDream, Inc. (A) | 5,800 | 140,034 |
| Pola Orbis Holdings, Inc. | 3,200 | 68,196 |
| Rakuten Group, Inc. | 10,700 | 117,299 |
| Recruit Holdings Company, Ltd. | 26,200 | 1,739,850 |
| Renesas Electronics Corp. (A) | 20,300 | 249,600 |
| Resona Holdings, Inc. | 138,800 | 520,995 |
| Ricoh Company, Ltd. | 41,300 | 400,595 |
| Rohm Company, Ltd. | 5,000 | 455,163 |
| Ryohin Keikaku Company, Ltd. | 14,000 | 274,782 |
| Santen Pharmaceutical Company, Ltd. | 12,300 | 172,702 |
| SBI Holdings, Inc. | 14,000 | 361,219 |
| SEE NOTES TO FINANCIAL STATEMENTS | SEMIANNUAL REPORT | JOHN HANCOCK MULTIFACTOR ETFS | 27 |
MULTIFACTOR DEVELOPED INTERNATIONAL ETF (continued)
| | Shares or
Principal
Amount | Value |
| Japan (continued) | |
| SCSK Corp. | 8,700 | $175,488 |
| Secom Company, Ltd. | 2,261 | 153,457 |
| Seiko Epson Corp. | 35,900 | 637,872 |
| Sekisui Chemical Company, Ltd. | 34,900 | 570,827 |
| Sekisui House, Ltd. | 30,500 | 631,666 |
| Seven & i Holdings Company, Ltd. | 33,000 | 1,383,960 |
| SG Holdings Company, Ltd. | 11,500 | 287,437 |
| Sharp Corp. | 11,500 | 135,247 |
| Shimadzu Corp. | 16,300 | 659,719 |
| Shimano, Inc. | 1,086 | 300,775 |
| Shimizu Corp. | 51,600 | 376,959 |
| Shin-Etsu Chemical Company, Ltd. | 4,198 | 745,718 |
| Shionogi & Company, Ltd. | 3,171 | 205,986 |
| Shiseido Company, Ltd. | 4,077 | 270,847 |
| SMC Corp. | 645 | 384,313 |
| SoftBank Corp. | 45,600 | 621,664 |
| SoftBank Group Corp. | 28,336 | 1,531,797 |
| Sohgo Security Services Company, Ltd. | 2,100 | 89,507 |
| Sompo Holdings, Inc. | 8,800 | 381,867 |
| Sony Group Corp. | 23,200 | 2,673,519 |
| Square Enix Holdings Company, Ltd. | 3,700 | 202,157 |
| Stanley Electric Company, Ltd. | 9,300 | 233,754 |
| Subaru Corp. | 16,200 | 316,541 |
| SUMCO Corp. | 17,500 | 332,120 |
| Sumitomo Chemical Company, Ltd. | 144,900 | 711,633 |
| Sumitomo Corp. | 32,100 | 455,213 |
| Sumitomo Dainippon Pharma Company, Ltd. | 8,900 | 125,431 |
| Sumitomo Electric Industries, Ltd. | 44,400 | 586,613 |
| Sumitomo Metal Mining Company, Ltd. | 16,800 | 651,668 |
| Sumitomo Mitsui Financial Group, Inc. | 32,500 | 1,060,579 |
| Sumitomo Mitsui Trust Holdings, Inc. | 14,675 | 483,139 |
| Sumitomo Realty & Development Company, Ltd. | 5,700 | 205,455 |
| Suntory Beverage & Food, Ltd. | 4,200 | 162,622 |
| Suzuki Motor Corp. | 10,900 | 485,135 |
| Sysmex Corp. | 3,748 | 462,481 |
| T&D Holdings, Inc. | 37,700 | 483,380 |
| Taisei Corp. | 16,661 | 521,638 |
| Taisho Pharmaceutical Holdings Company, Ltd. | 2,729 | 145,993 |
| Taiyo Yuden Company, Ltd. | 5,300 | 267,266 |
| Takeda Pharmaceutical Company, Ltd. | 28,247 | 793,468 |
| TDK Corp. | 15,300 | 554,168 |
| Terumo Corp. | 12,200 | 536,896 |
| The Chiba Bank, Ltd. | 59,700 | 369,640 |
| The Kansai Electric Power Company, Inc. | 33,700 | 309,736 |
| The Shizuoka Bank, Ltd. | 39,500 | 317,663 |
| TIS, Inc. | 6,500 | 176,431 |
| Tobu Railway Company, Ltd. | 18,800 | 466,764 |
| Toho Company, Ltd. | 4,200 | 197,062 |
| Toho Gas Company, Ltd. | 2,700 | 79,798 |
| Tokio Marine Holdings, Inc. | 17,100 | 899,503 |
MULTIFACTOR DEVELOPED INTERNATIONAL ETF (continued)
| | Shares or
Principal
Amount | Value |
| Japan (continued) | |
| Tokyo Century Corp. | 5,000 | $285,025 |
| Tokyo Electron, Ltd. | 3,057 | 1,416,904 |
| Tokyo Gas Company, Ltd. | 16,900 | 293,314 |
| Tokyu Corp. | 23,100 | 324,545 |
| TOPPAN, Inc. | 22,600 | 363,305 |
| Toray Industries, Inc. | 138,300 | 859,819 |
| Toshiba Corp. | 9,100 | 391,853 |
| Tosoh Corp. | 23,000 | 387,082 |
| TOTO, Ltd. | 7,700 | 371,410 |
| Toyo Suisan Kaisha, Ltd. | 1,600 | 68,897 |
| Toyota Industries Corp. | 4,000 | 338,873 |
| Toyota Motor Corp. | 347,540 | 6,115,668 |
| Toyota Tsusho Corp. | 8,000 | 345,889 |
| Trend Micro, Inc. | 9,200 | 518,799 |
| Tsuruha Holdings, Inc. | 2,200 | 271,081 |
| Unicharm Corp. | 10,300 | 414,800 |
| USS Company, Ltd. | 16,500 | 264,810 |
| Welcia Holdings Company, Ltd. | 4,700 | 175,387 |
| West Japan Railway Company | 10,581 | 497,662 |
| Yakult Honsha Company, Ltd. | 3,000 | 151,020 |
| Yamaha Corp. | 4,766 | 300,109 |
| Yamaha Motor Company, Ltd. | 33,100 | 918,759 |
| Yamato Holdings Company, Ltd. | 30,300 | 743,250 |
| Yaskawa Electric Corp. | 10,400 | 448,744 |
| Z Holdings Corp. | 38,900 | 240,854 |
| ZOZO, Inc. | 10,400 | 332,453 |
| Jordan - 0.0% | 198,755 |
| Hikma Pharmaceuticals PLC | 6,024 | 198,755 |
| Luxembourg - 0.4% | 2,116,413 |
| ArcelorMittal SA | 32,629 | 1,107,309 |
| Eurofins Scientific SE | 6,307 | 744,037 |
| Tenaris SA | 23,785 | 265,067 |
| Macau - 0.0% | 132,566 |
| Sands China, Ltd. (A) | 58,000 | 132,566 |
| Mexico - 0.0% | 115,909 |
| Fresnillo PLC | 9,796 | 115,909 |
| Netherlands - 5.8% | 30,538,281 |
| Adyen NV (A)(C) | 339 | 1,024,119 |
| Akzo Nobel NV | 15,368 | 1,768,146 |
| Argenx SE (A) | 479 | 143,514 |
| ASML Holding NV | 8,157 | 6,612,498 |
| Heineken Holding NV | 9,128 | 847,182 |
| Heineken NV | 4,953 | 549,226 |
| ING Groep NV | 81,105 | 1,231,426 |
| Just Eat Takeaway.com NV (A)(C) | 1,976 | 142,051 |
| Koninklijke Ahold Delhaize NV | 82,394 | 2,682,207 |
| Koninklijke DSM NV | 11,897 | 2,602,802 |
| Koninklijke Philips NV | 24,321 | 1,146,224 |
| 28 | JOHN HANCOCK MULTIFACTOR ETFS | SEMIANNUAL REPORT | SEE NOTES TO FINANCIAL STATEMENTS |
MULTIFACTOR DEVELOPED INTERNATIONAL ETF (continued)
| | Shares or
Principal
Amount | Value |
| Netherlands (continued) | |
| Prosus NV (A) | 6,930 | $611,184 |
| Royal Dutch Shell PLC, B Shares | 161,498 | 3,730,140 |
| Stellantis NV | 115,667 | 2,309,008 |
| Universal Music Group NV | 1,035 | 30,082 |
| Universal Music Group NV (Euronext Paris Exchange) | 52,398 | 1,522,912 |
| Wolters Kluwer NV | 34,183 | 3,585,560 |
| New Zealand - 0.2% | 974,978 |
| Auckland International Airport, Ltd. (A) | 23,144 | 132,338 |
| Fisher & Paykel Healthcare Corp., Ltd. | 10,158 | 226,883 |
| Mainfreight, Ltd. | 871 | 56,037 |
| Meridian Energy, Ltd. | 33,605 | 120,007 |
| Ryman Healthcare, Ltd. | 4,467 | 46,194 |
| Spark New Zealand, Ltd. | 72,538 | 236,977 |
| Xero, Ltd. (A) | 1,394 | 156,542 |
| Norway - 0.6% | 3,156,101 |
| Adevinta ASA (A) | 1,973 | 32,431 |
| Aker BP ASA | 2,620 | 100,318 |
| DNB Bank ASA (B) | 22,132 | 525,351 |
| Equinor ASA | 43,405 | 1,096,760 |
| Gjensidige Forsikring ASA | 2,982 | 74,063 |
| Mowi ASA | 7,680 | 222,067 |
| Norsk Hydro ASA | 34,838 | 254,841 |
| Orkla ASA | 7,902 | 76,747 |
| Salmar ASA | 619 | 47,051 |
| Schibsted ASA, A Shares | 857 | 44,140 |
| Schibsted ASA, B Shares | 1,405 | 63,346 |
| Telenor ASA | 16,601 | 261,693 |
| TOMRA Systems ASA | 1,958 | 126,193 |
| Yara International ASA | 4,435 | 231,100 |
| Portugal - 0.2% | 872,155 |
| EDP - Energias de Portugal SA | 68,083 | 384,806 |
| Galp Energia SGPS SA | 23,310 | 242,564 |
| Jeronimo Martins SGPS SA | 10,792 | 244,785 |
| Singapore - 1.8% | 9,434,617 |
| Ascendas Real Estate Investment Trust | 69,992 | 160,382 |
| CapitaLand Integrated Commercial Trust | 105,259 | 167,821 |
| Capitaland Investment, Ltd. (A) | 109,000 | 278,057 |
| DBS Group Holdings, Ltd. | 69,212 | 1,618,283 |
| Genting Singapore, Ltd. | 511,900 | 296,093 |
| Great Eastern Holdings, Ltd. | 5,400 | 86,176 |
| Jardine Cycle & Carriage, Ltd. | 7,700 | 128,476 |
| Keppel Corp., Ltd. | 117,700 | 469,578 |
| Mapletree Logistics Trust | 46,000 | 68,906 |
| Oversea-Chinese Banking Corp., Ltd. | 143,568 | 1,256,287 |
| Sea, Ltd., ADR (A) | 2,556 | 878,165 |
| Singapore Airlines, Ltd. (A) | 164,200 | 633,178 |
| Singapore Exchange, Ltd. | 61,400 | 440,750 |
| Singapore Technologies Engineering, Ltd. | 81,400 | 231,192 |
MULTIFACTOR DEVELOPED INTERNATIONAL ETF (continued)
| | Shares or
Principal
Amount | Value |
| Singapore (continued) | |
| Singapore Telecommunications, Ltd. | 620,200 | $1,149,796 |
| United Overseas Bank, Ltd. | 64,524 | 1,279,953 |
| Wilmar International, Ltd. | 91,000 | 291,524 |
| Spain - 2.3% | 12,196,526 |
| Aena SME SA (A)(C) | 2,979 | 488,331 |
| Amadeus IT Group SA (A) | 5,603 | 375,039 |
| Banco Bilbao Vizcaya Argentaria SA | 167,414 | 1,174,450 |
| Banco Santander SA (B) | 403,166 | 1,528,696 |
| CaixaBank SA | 237,394 | 682,689 |
| Cellnex Telecom SA (A)(C) | 6,231 | 383,471 |
| EDP Renovaveis SA | 1,901 | 53,018 |
| Endesa SA | 8,446 | 194,945 |
| Ferrovial SA | 18,820 | 593,707 |
| Grifols SA | 16,300 | 373,396 |
| Iberdrola SA | 228,554 | 2,701,806 |
| Industria de Diseno Textil SA (B) | 29,728 | 1,074,741 |
| Repsol SA | 130,384 | 1,668,204 |
| Siemens Gamesa Renewable Energy SA (A) | 5,110 | 138,554 |
| Telefonica SA | 175,711 | 765,479 |
| Sweden - 3.5% | 18,706,346 |
| Alfa Laval AB | 3,226 | 138,115 |
| Assa Abloy AB, B Shares | 10,686 | 312,922 |
| Atlas Copco AB, A Shares (B) | 16,397 | 1,053,486 |
| Atlas Copco AB, B Shares | 9,417 | 509,309 |
| Beijer Ref AB (B) | 6,065 | 124,570 |
| Boliden AB | 31,774 | 1,120,608 |
| Castellum AB | 14,525 | 386,274 |
| Electrolux AB, B Shares (B) | 33,400 | 757,951 |
| Epiroc AB, A Shares | 16,619 | 413,516 |
| Epiroc AB, B Shares | 10,328 | 219,463 |
| EQT AB | 2,183 | 115,041 |
| Essity AB, A Shares | 412 | 13,336 |
| Essity AB, B Shares | 10,786 | 348,879 |
| Evolution AB (C) | 1,786 | 288,888 |
| Fabege AB | 12,401 | 209,655 |
| Fastighets AB Balder, B Shares (A) | 4,170 | 302,099 |
| Getinge AB, B Shares | 10,850 | 485,493 |
| Hennes & Mauritz AB, B Shares (B) | 18,987 | 355,974 |
| Hexagon AB, B Shares | 21,311 | 342,425 |
| Holmen AB, B Shares | 4,783 | 212,070 |
| Husqvarna AB, A Shares | 39 | 559 |
| Husqvarna AB, B Shares (B) | 42,578 | 605,566 |
| ICA Gruppen AB (B) | 7,846 | 405,615 |
| Industrivarden AB, A Shares (B) | 604 | 19,915 |
| Indutrade AB | 14,480 | 421,325 |
| Lifco AB, B Shares | 5,290 | 154,047 |
| Lundin Energy AB | 3,762 | 148,579 |
| Nibe Industrier AB, B Shares | 16,921 | 251,889 |
| Sagax AB, B Shares | 845 | 33,058 |
| Samhallsbyggnadsbolaget i Norden AB | 28,358 | 190,187 |
| SEE NOTES TO FINANCIAL STATEMENTS | SEMIANNUAL REPORT | JOHN HANCOCK MULTIFACTOR ETFS | 29 |
MULTIFACTOR DEVELOPED INTERNATIONAL ETF (continued)
| | Shares or
Principal
Amount | Value |
| Sweden (continued) | |
| Samhallsbyggnadsbolaget i Norden AB, Class D | 4,865 | $17,696 |
| Sandvik AB | 28,743 | 727,904 |
| Securitas AB, B Shares | 19,665 | 325,136 |
| Sinch AB (A)(C) | 6,531 | 123,837 |
| Skandinaviska Enskilda Banken AB, A Shares | 30,356 | 474,506 |
| Skandinaviska Enskilda Banken AB, C Shares | 301 | 4,822 |
| Skanska AB, B Shares | 34,685 | 880,402 |
| SKF AB, B Shares | 34,151 | 791,296 |
| Svenska Cellulosa AB SCA, B Shares | 16,572 | 258,368 |
| Svenska Handelsbanken AB, A Shares (B) | 37,756 | 432,314 |
| Svenska Handelsbanken AB, B Shares (B) | 1,501 | 18,962 |
| Sweco AB, B Shares | 7,527 | 119,804 |
| Swedbank AB, A Shares (B) | 23,574 | 511,198 |
| Swedish Match AB | 20,859 | 183,562 |
| Swedish Orphan Biovitrum AB (A) | 12,194 | 330,815 |
| Tele2 AB, B Shares | 40,818 | 575,782 |
| Telefonaktiebolaget LM Ericsson, B Shares | 46,484 | 508,761 |
| Telia Company AB (B) | 56,629 | 222,830 |
| Trelleborg AB, B Shares | 15,026 | 343,174 |
| Vitrolife AB | 767 | 49,922 |
| Volvo AB, A Shares | 12,689 | 299,625 |
| Volvo AB, B Shares | 67,224 | 1,564,816 |
| Switzerland - 10.0% | 52,834,652 |
| ABB, Ltd. | 44,016 | 1,459,091 |
| Alcon, Inc. | 30,782 | 2,548,800 |
| Chocoladefabriken Lindt & Spruengli AG | 3 | 360,821 |
| Cie Financiere Richemont SA, A Shares | 12,321 | 1,525,040 |
| Coca-Cola HBC AG (A) | 16,796 | 583,175 |
| Credit Suisse Group AG | 180,676 | 1,884,765 |
| Geberit AG | 1,643 | 1,285,271 |
| Givaudan SA | 426 | 2,008,902 |
| Glencore PLC (A) | 325,594 | 1,630,139 |
| Holcim, Ltd. (A) | 34,741 | 1,737,905 |
| Kuehne + Nagel International AG | 2,991 | 943,699 |
| Lonza Group AG | 823 | 676,053 |
| Nestle SA | 65,117 | 8,610,041 |
| Novartis AG | 49,694 | 4,113,657 |
| Partners Group Holding AG | 1,370 | 2,395,157 |
| Roche Holding AG | 13,714 | 5,313,753 |
| Roche Holding AG, Bearer Shares | 1,112 | 478,266 |
| Schindler Holding AG | 1,003 | 257,734 |
| Schindler Holding AG, Participation Certificates | 2,133 | 556,039 |
| Sika AG | 8,671 | 2,941,735 |
| STMicroelectronics NV | 52,733 | 2,496,847 |
| Straumann Holding AG | 299 | 622,378 |
| Swiss Re AG | 22,567 | 2,189,153 |
| Swisscom AG | 3,626 | 1,977,782 |
| UBS Group AG | 143,058 | 2,605,965 |
| Zurich Insurance Group AG | 3,675 | 1,632,484 |
MULTIFACTOR DEVELOPED INTERNATIONAL ETF (continued)
| | Shares or
Principal
Amount | Value |
| United Arab Emirates - 0.0% | $986 |
| NMC Health PLC (A) | 5,181 | 986 |
| United Kingdom - 13.1% | 69,115,389 |
| 3i Group PLC | 89,140 | 1,666,652 |
| abrdn PLC | 206,444 | 718,777 |
| Admiral Group PLC | 18,025 | 709,113 |
| Anglo American PLC | 40,846 | 1,557,911 |
| Ashtead Group PLC | 12,124 | 1,017,745 |
| Associated British Foods PLC | 9,701 | 237,762 |
| AstraZeneca PLC | 28,103 | 3,503,206 |
| Auto Trader Group PLC (C) | 57,660 | 478,651 |
| AVEVA Group PLC | 5,905 | 287,994 |
| Aviva PLC | 103,598 | 560,501 |
| B&M European Value Retail SA | 49,394 | 428,719 |
| BAE Systems PLC | 117,139 | 886,015 |
| Barclays PLC | 407,669 | 1,130,197 |
| Barratt Developments PLC | 71,988 | 654,232 |
| Berkeley Group Holdings PLC | 6,899 | 411,844 |
| BP PLC | 459,519 | 2,205,859 |
| British American Tobacco PLC | 41,669 | 1,454,504 |
| BT Group PLC (A) | 249,984 | 475,962 |
| Bunzl PLC | 23,263 | 861,607 |
| Burberry Group PLC | 30,564 | 808,166 |
| CNH Industrial NV | 26,723 | 461,713 |
| Coca-Cola Europacific Partners PLC | 13,010 | 689,255 |
| Compass Group PLC (A) | 19,557 | 415,520 |
| Croda International PLC | 5,917 | 767,112 |
| Dechra Pharmaceuticals PLC | 1,571 | 110,256 |
| Diageo PLC | 51,559 | 2,566,897 |
| DS Smith PLC | 63,855 | 335,587 |
| Entain PLC (A) | 24,676 | 692,728 |
| Ferguson PLC | 6,011 | 905,941 |
| GlaxoSmithKline PLC | 97,818 | 2,022,791 |
| Halma PLC | 15,951 | 647,636 |
| Hargreaves Lansdown PLC | 21,534 | 453,687 |
| Howden Joinery Group PLC | 16,788 | 211,666 |
| HSBC Holdings PLC (A) | 454,635 | 2,751,387 |
| Imperial Brands PLC | 51,746 | 1,093,753 |
| Informa PLC (A) | 84,971 | 604,966 |
| InterContinental Hotels Group PLC (A) | 6,138 | 430,611 |
| Intermediate Capital Group PLC | 10,192 | 306,098 |
| Intertek Group PLC | 10,462 | 701,981 |
| J Sainsbury PLC | 153,326 | 629,253 |
| JD Sports Fashion PLC | 30,413 | 453,572 |
| Johnson Matthey PLC | 11,944 | 447,453 |
| Kingfisher PLC | 118,371 | 543,561 |
| Land Securities Group PLC | 22,941 | 216,036 |
| Legal & General Group PLC | 150,682 | 596,715 |
| Lloyds Banking Group PLC | 1,558,366 | 1,072,764 |
| London Stock Exchange Group PLC | 4,868 | 473,769 |
| M&G PLC | 130,869 | 358,418 |
| 30 | JOHN HANCOCK MULTIFACTOR ETFS | SEMIANNUAL REPORT | SEE NOTES TO FINANCIAL STATEMENTS |
MULTIFACTOR DEVELOPED INTERNATIONAL ETF (continued)
| | Shares or
Principal
Amount | Value |
| United Kingdom (continued) | |
| Meggitt PLC (A) | 23,650 | $243,137 |
| Melrose Industries PLC | 224,681 | 485,995 |
| Mondi PLC | 44,838 | 1,121,675 |
| National Grid PLC | 94,959 | 1,217,563 |
| NatWest Group PLC | 92,572 | 280,560 |
| Next PLC | 11,481 | 1,253,655 |
| Ocado Group PLC (A) | 6,120 | 151,253 |
| Pearson PLC | 35,325 | 291,692 |
| Persimmon PLC | 20,094 | 749,468 |
| Phoenix Group Holdings PLC | 31,908 | 287,183 |
| Prudential PLC | 28,171 | 577,107 |
| Reckitt Benckiser Group PLC | 11,622 | 943,903 |
| RELX PLC | 52,641 | 1,633,648 |
| Rentokil Initial PLC | 120,056 | 968,310 |
| Rightmove PLC | 50,491 | 478,521 |
| Rio Tinto PLC | 37,143 | 2,321,921 |
| Rolls-Royce Holdings PLC (A) | 297,017 | 536,768 |
| Schroders PLC | 7,869 | 390,469 |
| Schroders PLC, Non-Voting Shares | 2,675 | 90,569 |
| Segro PLC | 29,908 | 529,878 |
| Severn Trent PLC | 14,628 | 549,005 |
| Smith & Nephew PLC | 10,742 | 184,794 |
| Smiths Group PLC | 23,989 | 445,728 |
| Spirax-Sarco Engineering PLC | 4,495 | 961,505 |
| SSE PLC | 29,825 | 671,906 |
| St. James’s Place PLC | 26,579 | 575,462 |
| Standard Chartered PLC | 167,561 | 1,136,707 |
| Taylor Wimpey PLC | 226,220 | 479,246 |
| Tesco PLC | 210,965 | 780,497 |
| The Sage Group PLC | 57,017 | 555,533 |
| The Weir Group PLC | 3,948 | 93,893 |
| THG PLC (A) | 17,384 | 51,614 |
| Unilever PLC | 56,366 | 3,022,554 |
| United Utilities Group PLC | 65,055 | 926,073 |
| Vodafone Group PLC | 920,983 | 1,363,937 |
| Whitbread PLC (A) | 14,173 | 635,284 |
| WPP PLC | 76,810 | 1,111,833 |
| United States - 0.0% | 57,548 |
|
| Carnival PLC (A) | 2,856 | 57,548 |
|
| PREFERRED SECURITIES - 0.7% | $3,629,003 |
| (Cost $2,793,312) | | |
| Germany - 0.7% | 3,629,003 |
| Bayerische Motoren Werke AG | 5,100 | 434,385 |
| Henkel AG & Company KGaA | 2,912 | 260,764 |
| Porsche Automobil Holding SE | 9,003 | 935,809 |
| Sartorius AG | 902 | 584,967 |
| Volkswagen AG | 6,300 | 1,413,078 |
MULTIFACTOR DEVELOPED INTERNATIONAL ETF (continued)
| | Shares or
Principal
Amount | Value |
|
| SHORT-TERM INVESTMENTS - 1.3% | $6,759,770 |
| (Cost $6,759,947) | | |
| Short-term funds - 1.3% | 6,759,770 |
| John Hancock Collateral Trust, 0.0370% (D)(E) | 390,317 | 3,905,353 |
|
| State Street Institutional U.S. Government Money Market Fund, Premier Class, 0.0250% (D) | 2,854,417 | 2,854,417 |
| Total investments (Multifactor Developed International ETF) (Cost $448,698,426) - 100.1% | $529,198,255 |
| Other assets and liabilities, net - (0.1%) | (692,255) |
| Total net assets - 100.0% | $528,506,000 |
| The percentage shown for each investment category is the total value of the category as a percentage of the net assets of the fund. |
| Security Abbreviations and Legend |
| ADR | American Depositary Receipt |
| (A) | Non-income producing security. |
| (B) | All or a portion of this security is on loan as of 10-31-21. |
| (C) | These securities are exempt from registration under Rule 144A of the Securities Act of 1933. Such securities may be resold, normally to qualified institutional buyers, in transactions exempt from registration. |
| (D) | The rate shown is the annualized seven-day yield as of 10-31-21. |
| (E) | Investment is an affiliate of the fund, the advisor and/or subadvisor. This security represents the investment of cash collateral received for securities lending. |
MULTIFACTOR EMERGING MARKETS ETF
As of 10-31-21 (unaudited)
| | Shares or
Principal
Amount | Value |
| COMMON STOCKS - 99.0% | $701,933,416 |
| (Cost $580,683,684) | | |
| Brazil - 3.7% | 25,872,615 |
| Ambev SA | 286,100 | 862,310 |
| Americanas SA (A) | 39,718 | 209,265 |
| Atacadao SA | 36,100 | 106,564 |
| B3 SA - Brasil Bolsa Balcao | 417,800 | 882,739 |
| Banco Bradesco SA | 148,023 | 446,406 |
| Banco BTG Pactual SA | 68,648 | 274,616 |
| Banco do Brasil SA | 99,400 | 502,555 |
| Banco Inter SA | 43,034 | 88,404 |
| BB Seguridade Participacoes SA | 102,100 | 400,104 |
| CCR SA | 176,300 | 357,479 |
| Centrais Eletricas Brasileiras SA | 53,820 | 322,996 |
| Cia de Saneamento Basico do Estado de Sao Paulo | 62,700 | 391,527 |
| Cia Energetica de Minas Gerais | 21,000 | 61,916 |
| Cia Siderurgica Nacional SA | 95,400 | 385,526 |
| Cosan SA | 51,000 | 179,047 |
| CPFL Energia SA | 34,000 | 158,691 |
| Energisa SA | 23,700 | 166,577 |
| Engie Brasil Energia SA | 43,425 | 299,746 |
| Equatorial Energia SA | 149,900 | 608,429 |
| Hapvida Participacoes e Investimentos SA (B) | 98,194 | 201,022 |
| SEE NOTES TO FINANCIAL STATEMENTS | SEMIANNUAL REPORT | JOHN HANCOCK MULTIFACTOR ETFS | 31 |
MULTIFACTOR EMERGING MARKETS ETF (continued)
| | Shares or
Principal
Amount | Value |
| Brazil (continued) | |
| Hypera SA | 40,200 | $200,109 |
| JBS SA | 195,300 | 1,352,930 |
| Klabin SA (A) | 85,700 | 348,760 |
| Localiza Rent a Car SA | 71,185 | 572,056 |
| Lojas Renner SA | 92,531 | 529,053 |
| Magazine Luiza SA | 175,728 | 336,991 |
| Natura & Company Holding SA (A) | 65,900 | 454,765 |
| Neoenergia SA | 43,300 | 119,062 |
| Notre Dame Intermedica Participacoes SA | 51,400 | 585,214 |
| Pagseguro Digital, Ltd., Class A (A) | 13,678 | 495,144 |
| Petroleo Brasileiro SA | 572,900 | 2,812,159 |
| Raia Drogasil SA | 175,900 | 725,506 |
| Rede D’Or Sao Luiz SA (B) | 27,036 | 282,974 |
| Rumo SA (A) | 144,690 | 410,430 |
| Sendas Distribuidora SA | 37,700 | 102,259 |
| StoneCo, Ltd., Class A (A) | 11,491 | 389,085 |
| Suzano SA (A) | 83,265 | 727,184 |
| Telefonica Brasil SA | 60,000 | 484,513 |
| TIM SA | 220,200 | 438,291 |
| TOTVS SA | 13,900 | 80,781 |
| Vale SA | 469,500 | 5,964,324 |
| Vibra Energia SA | 62,900 | 234,104 |
| WEG SA | 125,800 | 825,723 |
| XP, Inc. (A) | 8,848 | 290,381 |
| XP, Inc., Class A (A) | 6,245 | 204,898 |
| Chile - 0.3% | 2,456,904 |
| Banco de Chile | 3,340,369 | 290,676 |
| Banco de Credito e Inversiones SA | 6,163 | 208,093 |
| Banco Santander Chile | 5,985,811 | 262,654 |
| Cencosud SA | 216,807 | 318,003 |
| Colbun SA | 1,318,027 | 91,138 |
| Empresas CMPC SA | 181,884 | 336,500 |
| Empresas COPEC SA | 40,447 | 319,063 |
| Enel Americas SA | 3,314,744 | 377,922 |
| Enel Chile SA | 2,920,085 | 119,961 |
| Falabella SA | 47,928 | 132,894 |
| China - 26.1% | 184,947,905 |
| Agricultural Bank of China, Ltd., H Shares | 5,053,000 | 1,721,348 |
| Aier Eye Hospital Group Company, Ltd., A Shares | 44,931 | 340,741 |
| Airtac International Group | 16,743 | 499,728 |
| Alibaba Group Holding, Ltd., ADR (A) | 84,797 | 13,986,417 |
| Aluminum Corp. of China, Ltd., H Shares (A) | 384,000 | 229,540 |
| Anhui Conch Cement Company, Ltd., H Shares | 276,500 | 1,375,560 |
| Anhui Gujing Distillery Company, Ltd., A Shares | 2,600 | 92,493 |
| ANTA Sports Products, Ltd. | 156,000 | 2,438,550 |
| Asymchem Laboratories Tianjin Company, Ltd., Class A | 800 | 49,782 |
| Avary Holding Shenzhen Company, Ltd., A Shares | 13,600 | 74,362 |
MULTIFACTOR EMERGING MARKETS ETF (continued)
| | Shares or
Principal
Amount | Value |
| China (continued) | |
| Baidu, Inc., ADR (A) | 34,763 | $5,639,949 |
| Bank of Beijing Company, Ltd., Class A | 66,200 | 45,828 |
| Bank of China, Ltd., H Shares | 9,507,000 | 3,360,854 |
| Bank of Communications Company, Ltd., H Shares | 3,729,000 | 2,219,457 |
| Bank of Hangzhou Company, Ltd., A Shares | 32,600 | 72,747 |
| Bank of Jiangsu Company, Ltd., Class A | 86,800 | 85,317 |
| Bank of Nanjing Company, Ltd., Class A | 58,700 | 88,977 |
| Bank of Ningbo Company, Ltd., A Shares | 71,841 | 428,848 |
| Bank of Shanghai Company, Ltd., A Shares | 118,800 | 135,335 |
| Baoshan Iron & Steel Company, Ltd., A Shares | 187,300 | 208,687 |
| BeiGene, Ltd., ADR (A) | 2,744 | 981,584 |
| Bilibili, Inc., Class Z (A) | 6,460 | 488,711 |
| BOE Technology Group Company, Ltd., A Shares | 435,800 | 334,377 |
| BYD Company, Ltd., H Shares | 84,000 | 3,202,756 |
| CanSino Biologics, Inc., H Shares (A)(B)(C) | 3,000 | 77,285 |
| Changchun High & New Technology Industry Group, Inc., A Shares | 3,400 | 144,920 |
| China CITIC Bank Corp., Ltd., H Shares | 1,872,000 | 823,011 |
| China Coal Energy Company, Ltd., H Shares | 190,000 | 115,772 |
| China Construction Bank Corp., H Shares | 11,201,000 | 7,617,034 |
| China Everbright Bank Company, Ltd., H Shares | 529,000 | 186,329 |
| China Feihe, Ltd. (B) | 334,000 | 556,448 |
| China Hongqiao Group, Ltd. | 183,000 | 203,489 |
| China International Capital Corp., Ltd., H Shares (B) | 240,800 | 599,288 |
| China Life Insurance Company, Ltd., H Shares | 877,000 | 1,528,737 |
| China Longyuan Power Group Corp., H Shares | 303,000 | 708,125 |
| China Merchants Bank Company, Ltd., H Shares | 614,000 | 5,173,858 |
| China Merchants Securities Company, Ltd., H Shares (B) | 157,740 | 249,414 |
| China Merchants Shekou Industrial Zone Holdings Company, Ltd., A Shares | 30,400 | 49,548 |
| China Minsheng Banking Corp., Ltd., H Shares (C) | 1,015,500 | 403,378 |
| China Molybdenum Company, Ltd., H Shares | 447,000 | 277,542 |
| China Northern Rare Earth Group High-Tech Company, Ltd., Class A | 13,400 | 105,955 |
| China Pacific Insurance Group Company, Ltd., H Shares | 549,800 | 1,696,248 |
| China Petroleum & Chemical Corp., H Shares | 4,050,000 | 1,988,803 |
| China Shenhua Energy Company, Ltd., H Shares | 742,000 | 1,598,643 |
| China Southern Airlines Company, Ltd., H Shares (A) | 66,000 | 40,216 |
| China Tourism Group Duty Free Corp., Ltd., A Shares | 10,500 | 440,490 |
| China Vanke Company, Ltd., H Shares | 427,572 | 1,001,454 |
| Chongqing Zhifei Biological Products Company, Ltd., A Shares | 12,200 | 286,350 |
| CITIC Securities Company, Ltd., H Shares | 337,000 | 858,632 |
| 32 | JOHN HANCOCK MULTIFACTOR ETFS | SEMIANNUAL REPORT | SEE NOTES TO FINANCIAL STATEMENTS |
MULTIFACTOR EMERGING MARKETS ETF (continued)
| | Shares or
Principal
Amount | Value |
| China (continued) | |
| Contemporary Amperex Technology Company, Ltd., A Shares | 10,500 | $1,048,835 |
| COSCO SHIPPING Holdings Company, Ltd., H Shares (A)(C) | 629,199 | 977,076 |
| Country Garden Holdings Company, Ltd. | 1,852,222 | 1,740,539 |
| Country Garden Services Holdings Company, Ltd. | 192,000 | 1,493,241 |
| CSC Financial Company, Ltd., H Shares (B) | 131,500 | 139,461 |
| CSPC Pharmaceutical Group, Ltd. | 1,317,840 | 1,378,988 |
| East Money Information Company, Ltd., A Shares | 54,960 | 282,560 |
| Ecovacs Robotics Company, Ltd., Class A | 1,200 | 32,160 |
| ENN Energy Holdings, Ltd. | 127,900 | 2,214,683 |
| Eve Energy Company, Ltd., A Shares | 12,900 | 228,698 |
| Flat Glass Group Company, Ltd., H Shares (C) | 21,000 | 113,381 |
| Focus Media Information Technology Company, Ltd., A Shares | 106,900 | 122,948 |
| Fuyao Glass Industry Group Company, Ltd. , H Shares (B) | 92,400 | 533,325 |
| Ganfeng Lithium Company, Ltd., H Shares (B) | 12,400 | 232,568 |
| GF Securities Company, Ltd., H Shares | 225,000 | 382,373 |
| Gigadevice Semiconductor Beijing, Inc., Class A | 1,300 | 34,435 |
| GoerTek, Inc., A Shares | 36,500 | 248,341 |
| Great Wall Motor Company, Ltd., H Shares | 573,500 | 2,587,700 |
| Guangdong Haid Group Company, Ltd., A Shares | 10,500 | 107,719 |
| Guangzhou Automobile Group Company, Ltd., H Shares | 136,000 | 128,674 |
| Guangzhou Tinci Materials Technology Company, Ltd., Class A | 3,300 | 85,051 |
| Guotai Junan Securities Company, Ltd., H Shares (B) | 161,400 | 220,759 |
| Haier Smart Home Company, Ltd., H Shares | 215,600 | 806,520 |
| Haitong Securities Company, Ltd., H Shares | 433,600 | 386,274 |
| Hangzhou First Applied Material Company, Ltd., Class A | 3,400 | 76,136 |
| Hangzhou Tigermed Consulting Company, Ltd., A Shares | 3,800 | 101,186 |
| Hansoh Pharmaceutical Group Company, Ltd. (B) | 114,000 | 254,699 |
| Henan Shuanghui Investment & Development Company, Ltd., A Shares | 16,200 | 74,680 |
| Hengli Petrochemical Company, Ltd., A Shares | 65,100 | 224,213 |
| Huatai Securities Company, Ltd., H Shares (B) | 221,400 | 330,148 |
| Huaxia Bank Company, Ltd., Class A | 67,309 | 59,217 |
| Huazhu Group, Ltd., ADR (A) | 9,417 | 436,572 |
| Iflytek Company, Ltd., A Shares | 15,900 | 140,184 |
| Industrial & Commercial Bank of China, Ltd., H Shares | 9,222,000 | 5,050,195 |
| Industrial Bank Company, Ltd., A Shares | 197,500 | 574,973 |
| Inner Mongolia BaoTou Steel Union Company, Ltd., Class A (A) | 149,700 | 65,735 |
| Inner Mongolia Yili Industrial Group Company, Ltd., A Shares | 40,800 | 274,155 |
MULTIFACTOR EMERGING MARKETS ETF (continued)
| | Shares or
Principal
Amount | Value |
| China (continued) | |
| Innovent Biologics, Inc. (A)(B) | 49,000 | $439,668 |
| JA Solar Technology Company, Ltd., Class A | 3,600 | 51,334 |
| JD.com, Inc., ADR (A) | 54,072 | 4,232,756 |
| Jiangsu Hengli Hydraulic Company, Ltd., A Shares | 6,600 | 84,675 |
| Jiangsu Hengrui Medicine Company, Ltd., A Shares | 32,551 | 250,467 |
| Jiangsu Yanghe Brewery Joint-Stock Company, Ltd., A Shares | 9,490 | 276,100 |
| KE Holdings, Inc., ADR (A) | 10,806 | 196,885 |
| Kweichow Moutai Company, Ltd., A Shares | 5,600 | 1,597,995 |
| LB Group Company, Ltd., Class A | 8,200 | 36,379 |
| Lenovo Group, Ltd. | 1,170,000 | 1,272,418 |
| Lens Technology Company, Ltd., A Shares | 59,600 | 198,099 |
| Li Auto, Inc., ADR (A) | 18,618 | 607,505 |
| Li Ning Company, Ltd. | 197,000 | 2,190,563 |
| Longfor Group Holdings, Ltd. (B) | 324,000 | 1,574,382 |
| LONGi Green Energy Technology Company, Ltd., A Shares | 40,640 | 620,399 |
| Luxshare Precision Industry Company, Ltd., A Shares | 47,700 | 288,020 |
| Luzhou Laojiao Company, Ltd., A Shares | 10,300 | 368,507 |
| Mango Excellent Media Company, Ltd., A Shares | 11,415 | 70,085 |
| Meituan, Class B (A)(B) | 172,900 | 5,992,228 |
| Metallurgical Corp. of China, Ltd., H Shares | 272,000 | 75,526 |
| Midea Group Company, Ltd., A Shares | 50,700 | 544,847 |
| Muyuan Foods Company, Ltd., A Shares | 34,360 | 306,643 |
| NARI Technology Company, Ltd., A Shares | 40,100 | 243,947 |
| NAURA Technology Group Company, Ltd., Class A | 1,800 | 104,425 |
| NetEase, Inc., ADR | 56,902 | 5,553,066 |
| New China Life Insurance Company, Ltd., H Shares | 164,300 | 476,275 |
| NIO, Inc., ADR (A) | 102,098 | 4,023,682 |
| Oppein Home Group, Inc., Class A | 1,000 | 19,891 |
| Orient Securities Company, Ltd., H Shares (B) | 36,000 | 29,572 |
| Pharmaron Beijing Company, Ltd., H Shares (B) | 14,600 | 318,124 |
| PICC Property & Casualty Company, Ltd., H Shares | 1,232,000 | 1,152,963 |
| Pinduoduo, Inc., ADR (A) | 21,940 | 1,950,905 |
| Ping An Bank Company, Ltd., A Shares | 204,500 | 623,154 |
| Ping An Insurance Group Company of China, Ltd., H Shares | 872,000 | 6,266,164 |
| Poly Developments and Holdings Group Company, Ltd., A Shares | 142,500 | 279,687 |
| Postal Savings Bank of China Company, Ltd., H Shares (B) | 1,405,000 | 1,022,271 |
| Rongsheng Petrochemical Company, Ltd., A Shares | 56,250 | 151,540 |
| Sanan Optoelectronics Company, Ltd., A Shares | 28,000 | 147,016 |
| Sangfor Technologies, Inc., A Shares | 1,500 | 47,539 |
| SEE NOTES TO FINANCIAL STATEMENTS | SEMIANNUAL REPORT | JOHN HANCOCK MULTIFACTOR ETFS | 33 |
MULTIFACTOR EMERGING MARKETS ETF (continued)
| | Shares or
Principal
Amount | Value |
| China (continued) | |
| Sany Heavy Industry Company, Ltd., A Shares | 67,900 | $243,618 |
| Seazen Holdings Company, Ltd., A Shares | 21,800 | 116,643 |
| SF Holding Company, Ltd., A Shares | 25,000 | 252,489 |
| Shaanxi Coal Industry Company, Ltd., A Shares | 78,300 | 153,069 |
| Shandong Gold Mining Company, Ltd., H Shares (B) | 68,470 | 124,458 |
| Shanghai Baosight Software Company, Ltd., Class A | 3,300 | 36,098 |
| Shanghai Fosun Pharmaceutical Group Company, Ltd., H Shares (C) | 51,000 | 240,608 |
| Shanghai International Airport Company, Ltd., A Shares (A) | 17,300 | 142,741 |
| Shanghai Pudong Development Bank Company, Ltd., Class A | 172,800 | 241,406 |
| Shanghai Putailai New Energy Technology Company, Ltd., Class A | 2,200 | 61,122 |
| Shanxi Xinghuacun Fen Wine Factory Company, Ltd., A Shares | 7,845 | 369,613 |
| Shenwan Hongyuan Group Company, Ltd., H Shares (B) | 173,600 | 43,963 |
| Shenzhen Inovance Technology Company, Ltd., A Shares | 16,750 | 170,738 |
| Shenzhen Kangtai Biological Products Company, Ltd., A Shares | 3,000 | 53,561 |
| Shenzhen Mindray Bio-Medical Electronics Company, Ltd., A Shares | 6,800 | 399,639 |
| Shenzhou International Group Holdings, Ltd. | 122,100 | 2,633,789 |
| Silergy Corp. | 5,000 | 823,489 |
| Smoore International Holdings, Ltd. (B) | 190,000 | 911,037 |
| Sunac China Holdings, Ltd. | 569,000 | 1,225,913 |
| Sungrow Power Supply Company, Ltd., A Shares | 11,300 | 289,771 |
| Sunny Optical Technology Group Company, Ltd. | 93,100 | 2,515,683 |
| TBEA Company, Ltd., Class A | 17,600 | 74,286 |
| TCL Technology Group Corp., A Shares | 120,600 | 114,206 |
| Tencent Holdings, Ltd. | 332,800 | 20,577,937 |
| Tencent Music Entertainment Group, ADR (A) | 30,553 | 240,147 |
| The People’s Insurance Company Group of China, Ltd., H Shares | 1,043,000 | 325,810 |
| Tianjin Zhonghuan Semiconductor Company, Ltd., Class A | 11,100 | 90,822 |
| Tongwei Company, Ltd., A Shares | 36,500 | 326,426 |
| Trip.com Group, Ltd., ADR (A) | 55,513 | 1,585,451 |
| Tsingtao Brewery Company, Ltd., H Shares | 24,000 | 208,714 |
| Unigroup Guoxin Microelectronics Company, Ltd., Class A | 2,100 | 66,502 |
| Walvax Biotechnology Company, Ltd., Class A | 5,200 | 44,692 |
| Wanhua Chemical Group Company, Ltd., A Shares | 33,400 | 550,482 |
| Weichai Power Company, Ltd., H Shares | 554,000 | 995,613 |
| Will Semiconductor Company, Ltd., A Shares | 6,200 | 257,716 |
| Wingtech Technology Company, Ltd., A Shares | 6,300 | 108,057 |
| Wuliangye Yibin Company, Ltd., A Shares | 21,100 | 713,884 |
MULTIFACTOR EMERGING MARKETS ETF (continued)
| | Shares or
Principal
Amount | Value |
| China (continued) | |
| WuXi AppTec Company, Ltd., H Shares (B) | 38,180 | $816,209 |
| WuXi Biologics Cayman, Inc. (A)(B) | 230,000 | 3,500,685 |
| Wuxi Lead Intelligent Equipment Company, Ltd., Class A | 5,700 | 72,362 |
| Xinyi Solar Holdings, Ltd. | 626,006 | 1,310,106 |
| XPeng, Inc., ADR (A) | 13,647 | 636,360 |
| Yanzhou Coal Mining Company, Ltd., H Shares (C) | 140,000 | 207,686 |
| Yonyou Network Technology Company, Ltd., A Shares | 13,800 | 68,576 |
| Yum China Holdings, Inc. | 61,610 | 3,516,699 |
| Yunnan Baiyao Group Company, Ltd., A Shares | 7,000 | 98,011 |
| Yunnan Energy New Material Company, Ltd., A Shares | 5,000 | 227,947 |
| Zai Lab, Ltd. (A) | 2,850 | 297,675 |
| Zhangzhou Pientzehuang Pharmaceutical Company, Ltd., A Shares | 4,800 | 309,724 |
| Zhejiang Chint Electrics Company, Ltd., Class A | 7,100 | 66,836 |
| Zhejiang Huayou Cobalt Company, Ltd., A Shares | 7,900 | 137,092 |
| Zhejiang Jingsheng Mechanical & Electrical Company, Ltd., Class A | 4,500 | 53,732 |
| Zhejiang NHU Company, Ltd., A Shares | 24,240 | 102,804 |
| Zhejiang Sanhua Intelligent Controls Company, Ltd., Class A | 9,900 | 36,696 |
| Zhongsheng Group Holdings, Ltd. | 28,500 | 257,740 |
| Zijin Mining Group Company, Ltd., H Shares | 1,040,000 | 1,449,226 |
| ZTO Express Cayman, Inc., ADR | 93,574 | 2,744,525 |
| Hong Kong - 2.0% | 14,355,991 |
| Alibaba Health Information Technology, Ltd. (A) | 366,000 | 462,496 |
| China Gas Holdings, Ltd. | 468,400 | 1,171,745 |
| China Mengniu Dairy Company, Ltd. (A) | 453,000 | 2,885,462 |
| China Resources Beer Holdings Company, Ltd. | 244,000 | 2,023,126 |
| China Resources Gas Group, Ltd. | 86,000 | 462,113 |
| China Resources Land, Ltd. | 676,000 | 2,633,072 |
| Futu Holdings, Ltd., ADR (A)(C) | 4,331 | 231,795 |
| Geely Automobile Holdings, Ltd. | 911,000 | 3,167,810 |
| Sino Biopharmaceutical, Ltd. | 1,780,500 | 1,318,372 |
| India - 17.1% | 121,237,937 |
| ABB India, Ltd. | 2,802 | 78,401 |
| ACC, Ltd. | 15,876 | 495,269 |
| Adani Enterprises, Ltd. | 19,718 | 374,973 |
| Adani Green Energy, Ltd. (A) | 24,145 | 372,423 |
| Adani Ports & Special Economic Zone, Ltd. | 75,912 | 704,567 |
| Adani Total Gas, Ltd. | 25,179 | 487,902 |
| Adani Transmission, Ltd. (A) | 25,731 | 615,121 |
| Alkem Laboratories, Ltd. | 3,337 | 160,385 |
| Ambuja Cements, Ltd. | 119,096 | 642,548 |
| Apollo Hospitals Enterprise, Ltd. | 9,840 | 563,103 |
| Ashok Leyland, Ltd. | 149,349 | 284,612 |
| 34 | JOHN HANCOCK MULTIFACTOR ETFS | SEMIANNUAL REPORT | SEE NOTES TO FINANCIAL STATEMENTS |
MULTIFACTOR EMERGING MARKETS ETF (continued)
| | Shares or
Principal
Amount | Value |
| India (continued) | |
| Asian Paints, Ltd. | 42,471 | $1,762,789 |
| Astral, Ltd. | 4,673 | 136,294 |
| AU Small Finance Bank, Ltd. (A)(B) | 13,269 | 216,539 |
| Aurobindo Pharma, Ltd. | 61,776 | 571,262 |
| Avenue Supermarts, Ltd. (A)(B) | 9,248 | 570,827 |
| Axis Bank, Ltd. (A) | 242,439 | 2,412,046 |
| Bajaj Auto, Ltd. | 7,399 | 367,068 |
| Bajaj Finance, Ltd. | 16,917 | 1,676,072 |
| Bajaj Finserv, Ltd. | 2,611 | 622,752 |
| Bajaj Holdings & Investment, Ltd. | 4,497 | 288,805 |
| Balkrishna Industries, Ltd. | 4,230 | 138,795 |
| Bandhan Bank, Ltd. (B) | 128,735 | 500,714 |
| Bank of Baroda (A) | 111,586 | 145,441 |
| Berger Paints India, Ltd. | 32,259 | 319,612 |
| Bharat Electronics, Ltd. | 211,071 | 585,453 |
| Bharat Petroleum Corp., Ltd. | 210,131 | 1,176,635 |
| Bharti Airtel, Ltd. (A) | 277,247 | 2,539,167 |
| Biocon, Ltd. (A) | 32,513 | 152,619 |
| Bosch, Ltd. | 840 | 190,365 |
| Britannia Industries, Ltd. | 13,359 | 654,737 |
| Cadila Healthcare, Ltd. | 49,931 | 336,002 |
| Cholamandalam Investment and Finance Company, Ltd. | 57,045 | 475,367 |
| Cipla, Ltd. | 101,894 | 1,238,274 |
| Coal India, Ltd. | 274,780 | 604,374 |
| Colgate-Palmolive India, Ltd. | 15,523 | 319,037 |
| Container Corp. of India, Ltd. | 27,745 | 243,580 |
| Dabur India, Ltd. | 91,041 | 715,380 |
| Dalmia Bharat, Ltd. | 4,465 | 119,971 |
| Divi’s Laboratories, Ltd. | 14,646 | 1,010,807 |
| DLF, Ltd. | 73,991 | 394,750 |
| Dr. Reddy’s Laboratories, Ltd. | 11,296 | 699,321 |
| Eicher Motors, Ltd. | 13,240 | 439,911 |
| GAIL India, Ltd. | 235,546 | 467,121 |
| Godrej Consumer Products, Ltd. (A) | 64,757 | 830,204 |
| Godrej Properties, Ltd. (A) | 8,115 | 242,752 |
| Grasim Industries, Ltd. | 44,624 | 1,029,112 |
| Gujarat Gas, Ltd. | 18,437 | 153,885 |
| Havells India, Ltd. | 33,037 | 559,343 |
| HCL Technologies, Ltd. | 131,199 | 2,006,148 |
| HDFC Asset Management Company, Ltd. (B) | 5,376 | 190,153 |
| HDFC Bank, Ltd. | 339,389 | 7,196,939 |
| HDFC Life Insurance Company, Ltd. (B) | 50,786 | 462,987 |
| Hero MotoCorp, Ltd. | 24,583 | 873,260 |
| Hindalco Industries, Ltd. | 245,736 | 1,522,369 |
| Hindustan Aeronautics, Ltd. | 17,095 | 300,436 |
| Hindustan Petroleum Corp., Ltd. | 162,516 | 675,837 |
| Hindustan Unilever, Ltd. | 88,399 | 2,820,268 |
| Honeywell Automation India, Ltd. | 230 | 129,505 |
| Housing Development Finance Corp., Ltd. | 166,322 | 6,311,379 |
| ICICI Bank, Ltd. | 428,589 | 4,616,069 |
MULTIFACTOR EMERGING MARKETS ETF (continued)
| | Shares or
Principal
Amount | Value |
| India (continued) | |
| ICICI Lombard General Insurance Company, Ltd. (B) | 21,804 | $433,802 |
| ICICI Prudential Life Insurance Company, Ltd. (B) | 24,942 | 206,181 |
| Indian Oil Corp., Ltd. | 477,432 | 816,109 |
| Indian Railway Catering | 13,740 | 154,646 |
| Indraprastha Gas, Ltd. | 23,948 | 152,167 |
| Indus Towers, Ltd. | 190,386 | 691,562 |
| Info Edge India, Ltd. | 4,675 | 380,836 |
| Infosys, Ltd. | 326,334 | 7,282,252 |
| InterGlobe Aviation, Ltd. (A)(B) | 6,179 | 178,898 |
| ITC, Ltd. | 421,602 | 1,258,085 |
| Jindal Steel & Power, Ltd. (A) | 59,397 | 330,771 |
| JSW Energy, Ltd. | 23,114 | 106,061 |
| JSW Steel, Ltd. | 271,215 | 2,435,751 |
| Jubilant Foodworks, Ltd. | 6,446 | 318,163 |
| Kansai Nerolac Paints, Ltd. | 13,183 | 95,913 |
| Kotak Mahindra Bank, Ltd. | 69,992 | 1,908,671 |
| L&T Technology Services, Ltd. (B) | 1,252 | 79,051 |
| Larsen & Toubro Infotech, Ltd. (B) | 4,788 | 429,685 |
| Larsen & Toubro, Ltd. | 74,733 | 1,772,484 |
| Lupin, Ltd. | 28,389 | 351,444 |
| Mahindra & Mahindra, Ltd. | 119,088 | 1,407,467 |
| Marico, Ltd. | 74,788 | 566,793 |
| Maruti Suzuki India, Ltd. | 9,824 | 978,192 |
| Max Financial Services, Ltd. (A) | 11,798 | 153,026 |
| Max Healthcare Institute, Ltd. (A) | 5,968 | 26,393 |
| Mindtree, Ltd. | 2,145 | 129,334 |
| Motherson Sumi Systems, Ltd. | 183,923 | 550,802 |
| Mphasis, Ltd. | 4,327 | 186,934 |
| MRF, Ltd. | 202 | 208,795 |
| Muthoot Finance, Ltd. | 22,691 | 446,616 |
| Nestle India, Ltd. | 3,813 | 965,710 |
| NMDC, Ltd. | 127,401 | 243,211 |
| NTPC, Ltd. | 949,926 | 1,688,475 |
| Oil & Natural Gas Corp., Ltd. | 466,416 | 934,311 |
| Oracle Financial Services Software, Ltd. | 1,019 | 59,944 |
| Petronet LNG, Ltd. | 165,751 | 509,109 |
| PI Industries, Ltd. | 4,708 | 188,619 |
| Pidilite Industries, Ltd. | 17,913 | 555,693 |
| Piramal Enterprises, Ltd. | 14,861 | 516,991 |
| Power Finance Corp., Ltd. | 209,403 | 371,930 |
| Power Grid Corp. of India, Ltd. | 719,377 | 1,784,002 |
| Procter & Gamble Hygiene & Health Care, Ltd. | 1,321 | 255,004 |
| Punjab National Bank (A) | 234,640 | 132,233 |
| Reliance Industries, Ltd. | 260,244 | 8,827,574 |
| SBI Cards & Payment Services, Ltd. (A) | 4,953 | 70,424 |
| SBI Life Insurance Company, Ltd. (B) | 24,556 | 375,483 |
| Shree Cement, Ltd. | 1,174 | 448,395 |
| Shriram Transport Finance Company, Ltd. | 20,548 | 397,603 |
| Siemens, Ltd. | 8,498 | 249,488 |
| SEE NOTES TO FINANCIAL STATEMENTS | SEMIANNUAL REPORT | JOHN HANCOCK MULTIFACTOR ETFS | 35 |
MULTIFACTOR EMERGING MARKETS ETF (continued)
| | Shares or
Principal
Amount | Value |
| India (continued) | |
| SRF, Ltd. | 7,735 | $219,299 |
| State Bank of India | 211,616 | 1,424,315 |
| Steel Authority of India, Ltd. | 143,796 | 221,989 |
| Sun Pharmaceutical Industries, Ltd. | 128,780 | 1,368,953 |
| Tata Communications, Ltd. | 5,982 | 104,571 |
| Tata Consultancy Services, Ltd. | 88,817 | 4,037,500 |
| Tata Consumer Products, Ltd. | 59,570 | 645,967 |
| Tata Motors, Ltd. (A) | 322,055 | 2,083,560 |
| Tata Power Company, Ltd. | 88,154 | 254,463 |
| Tata Steel, Ltd. | 123,649 | 2,175,793 |
| Tech Mahindra, Ltd. | 112,159 | 2,216,781 |
| Titan Company, Ltd. | 39,733 | 1,270,819 |
| Torrent Pharmaceuticals, Ltd. | 5,523 | 211,682 |
| UltraTech Cement, Ltd. | 9,509 | 971,075 |
| United Breweries, Ltd. | 6,772 | 149,627 |
| United Spirits, Ltd. (A) | 28,088 | 356,739 |
| UPL, Ltd. | 116,537 | 1,160,215 |
| Varun Beverages, Ltd. | 6,857 | 77,744 |
| Vedanta, Ltd. | 354,040 | 1,436,845 |
| Wipro, Ltd. | 167,350 | 1,447,080 |
| Indonesia - 2.0% | 14,339,895 |
| Aneka Tambang Tbk | 529,600 | 87,472 |
| Astra International Tbk PT | 2,372,000 | 1,008,738 |
| Bank Central Asia Tbk PT | 4,546,000 | 2,398,542 |
| Bank Jago Tbk PT (A) | 98,500 | 107,764 |
| Bank Mandiri Persero Tbk PT | 2,199,400 | 1,113,866 |
| Bank Negara Indonesia Persero Tbk PT | 1,282,700 | 633,767 |
| Bank Rakyat Indonesia Persero Tbk PT | 9,263,850 | 2,778,992 |
| Bank Syariah Indonesia Tbk PT (A) | 1,064,400 | 158,524 |
| Barito Pacific Tbk PT | 2,853,600 | 188,327 |
| Charoen Pokphand Indonesia Tbk PT | 1,199,200 | 524,795 |
| Elang Mahkota Teknologi Tbk PT (A) | 1,896,300 | 257,659 |
| Gudang Garam Tbk PT | 83,000 | 196,259 |
| Indah Kiat Pulp & Paper Tbk PT | 266,600 | 159,480 |
| Indocement Tunggal Prakarsa Tbk PT | 219,300 | 183,040 |
| Indofood CBP Sukses Makmur Tbk PT | 337,600 | 209,697 |
| Indofood Sukses Makmur Tbk PT | 747,800 | 335,171 |
| Kalbe Farma Tbk PT | 2,864,800 | 323,535 |
| Mayora Indah Tbk PT | 661,000 | 109,642 |
| Merdeka Copper Gold Tbk PT (A) | 1,077,300 | 240,287 |
| Sarana Menara Nusantara Tbk PT | 2,725,300 | 223,141 |
| Semen Indonesia Persero Tbk PT | 492,700 | 316,469 |
| Telkom Indonesia Persero Tbk PT | 7,380,500 | 1,979,594 |
| Tower Bersama Infrastructure Tbk PT | 466,600 | 96,828 |
| United Tractors Tbk PT | 368,900 | 613,206 |
| Vale Indonesia Tbk PT | 277,800 | 95,100 |
| Malaysia - 1.9% | 13,201,741 |
| Axiata Group BHD | 332,795 | 317,445 |
| CIMB Group Holdings BHD | 632,748 | 797,620 |
| Dialog Group BHD | 423,000 | 289,082 |
MULTIFACTOR EMERGING MARKETS ETF (continued)
| | Shares or
Principal
Amount | Value |
| Malaysia (continued) | |
| DiGi.Com BHD | 339,800 | $347,103 |
| Fraser & Neave Holdings BHD | 11,300 | 73,842 |
| Genting BHD | 363,300 | 454,454 |
| Genting Malaysia BHD | 426,400 | 326,416 |
| HAP Seng Consolidated BHD | 67,100 | 127,038 |
| Hartalega Holdings BHD | 236,300 | 334,392 |
| Hong Leong Bank BHD | 72,200 | 328,134 |
| Hong Leong Financial Group BHD | 44,000 | 194,871 |
| IHH Healthcare BHD | 208,000 | 328,500 |
| IOI Corp. BHD | 212,800 | 201,957 |
| Kuala Lumpur Kepong BHD | 44,175 | 230,636 |
| Malayan Banking BHD | 630,016 | 1,224,735 |
| Maxis BHD | 226,300 | 255,209 |
| MISC BHD | 162,000 | 276,585 |
| Nestle Malaysia BHD | 5,700 | 185,136 |
| Petronas Chemicals Group BHD | 167,500 | 351,503 |
| Petronas Dagangan BHD | 51,400 | 252,718 |
| Petronas Gas BHD | 66,300 | 268,018 |
| PPB Group BHD | 93,400 | 410,049 |
| Press Metal Aluminium Holdings BHD | 393,000 | 527,670 |
| Public Bank BHD | 1,992,100 | 2,006,051 |
| RHB Bank BHD | 305,196 | 411,252 |
| Sime Darby BHD | 463,300 | 253,970 |
| Sime Darby Plantation BHD | 226,238 | 219,081 |
| Telekom Malaysia BHD | 212,200 | 296,701 |
| Tenaga Nasional BHD | 586,600 | 1,368,403 |
| Top Glove Corp. BHD | 556,600 | 365,601 |
| Westports Holdings BHD | 164,500 | 177,569 |
| Mexico - 2.4% | 16,946,730 |
| America Movil SAB de CV, Series L | 2,723,188 | 2,429,832 |
| Arca Continental SAB de CV | 61,564 | 375,534 |
| Cemex SAB de CV (A) | 2,353,288 | 1,521,280 |
| Coca-Cola Femsa SAB de CV | 65,152 | 350,989 |
| El Puerto de Liverpool SAB de CV, Series C1 | 21,656 | 96,394 |
| Fibra Uno Administracion SA de CV | 277,740 | 276,888 |
| Fomento Economico Mexicano SAB de CV | 153,548 | 1,267,446 |
| Grupo Aeroportuario del Pacifico SAB de CV, Series B (A) | 35,728 | 452,187 |
| Grupo Aeroportuario del Sureste SAB de CV, Series B | 19,499 | 394,754 |
| Grupo Bimbo SAB de CV, Series A | 254,500 | 758,185 |
| Grupo Carso SAB de CV, Series A1 | 55,404 | 187,413 |
| Grupo Elektra SAB de CV | 4,121 | 316,954 |
| Grupo Financiero Banorte SAB de CV, Series O | 298,104 | 1,888,490 |
| Grupo Financiero Inbursa SAB de CV, Series O (A) | 383,240 | 384,676 |
| Grupo Mexico SAB de CV, Series B | 501,608 | 2,202,944 |
| Grupo Televisa SAB | 445,352 | 903,148 |
| Industrias Penoles SAB de CV (A) | 15,843 | 202,690 |
| Kimberly-Clark de Mexico SAB de CV, Class A | 175,400 | 277,833 |
| Orbia Advance Corp. SAB de CV | 197,200 | 516,446 |
| 36 | JOHN HANCOCK MULTIFACTOR ETFS | SEMIANNUAL REPORT | SEE NOTES TO FINANCIAL STATEMENTS |
MULTIFACTOR EMERGING MARKETS ETF (continued)
| | Shares or
Principal
Amount | Value |
| Mexico (continued) | |
| Wal-Mart de Mexico SAB de CV | 613,640 | $2,142,647 |
| Philippines - 1.1% | 7,448,805 |
| Aboitiz Equity Ventures, Inc. | 278,210 | 267,117 |
| Aboitiz Power Corp. | 444,800 | 283,680 |
| AC Energy Corp. | 248,000 | 60,315 |
| Ayala Corp. | 30,120 | 515,643 |
| Ayala Land, Inc. | 721,200 | 502,165 |
| Bank of the Philippine Islands | 394,900 | 681,146 |
| BDO Unibank, Inc. | 263,260 | 648,097 |
| Globe Telecom, Inc. | 5,265 | 312,913 |
| International Container Terminal Services, Inc. | 103,230 | 368,605 |
| JG Summit Holdings, Inc. | 368,233 | 439,747 |
| Jollibee Foods Corp. | 42,570 | 198,621 |
| Manila Electric Company | 46,760 | 266,219 |
| Metropolitan Bank & Trust Company | 339,252 | 321,014 |
| PLDT, Inc. | 18,715 | 609,602 |
| San Miguel Corp. | 81,599 | 189,227 |
| SM Investments Corp. | 32,035 | 613,247 |
| SM Prime Holdings, Inc. | 1,147,100 | 753,204 |
| Universal Robina Corp. | 152,780 | 418,243 |
| Poland - 1.0% | 7,248,873 |
| Allegro.eu SA (A)(B) | 23,045 | 260,818 |
| Bank Polska Kasa Opieki SA | 20,462 | 676,224 |
| CD Projekt SA | 5,439 | 237,225 |
| Cyfrowy Polsat SA | 35,507 | 317,783 |
| Dino Polska SA (A)(B) | 5,650 | 505,101 |
| ING Bank Slaski SA (A) | 3,316 | 226,243 |
| KGHM Polska Miedz SA | 17,676 | 680,145 |
| LPP SA | 181 | 650,604 |
| mBank SA (A) | 554 | 78,445 |
| PGE Polska Grupa Energetyczna SA (A) | 119,642 | 294,345 |
| Polski Koncern Naftowy ORLEN SA | 54,755 | 1,181,999 |
| Polskie Gornictwo Naftowe i Gazownictwo SA | 253,934 | 383,196 |
| Powszechna Kasa Oszczednosci Bank Polski SA (A) | 86,542 | 1,059,348 |
| Powszechny Zaklad Ubezpieczen SA | 37,404 | 374,354 |
| Santander Bank Polska SA | 3,476 | 323,043 |
| Romania - 0.0% | 136,576 |
| NEPI Rockcastle PLC | 20,273 | 136,576 |
| Russia - 3.3% | 23,540,129 |
| Gazprom PJSC, ADR | 545,582 | 5,349,977 |
| Lukoil PJSC, ADR | 56,432 | 5,756,064 |
| MMC Norilsk Nickel PJSC, ADR | 93,194 | 2,916,040 |
| Novatek PJSC, GDR | 5,898 | 1,495,143 |
| Novolipetsk Steel OJSC, GDR | 6,243 | 197,154 |
| Polyus PJSC, GDR | 6,556 | 649,700 |
| Polyus PJSC, GDR (London Stock Exchange) | 150 | 14,865 |
| Rosneft Oil Company PJSC, GDR | 218,862 | 1,950,060 |
| Sberbank of Russia PJSC, ADR | 260,296 | 5,211,126 |
MULTIFACTOR EMERGING MARKETS ETF (continued)
| | Shares or
Principal
Amount | Value |
| Saudi Arabia - 2.9% | $20,527,720 |
| Advanced Petrochemical Company | 5,766 | 114,370 |
| Al Rajhi Bank | 99,556 | 3,678,707 |
| Alinma Bank | 96,657 | 648,091 |
| Almarai Company JSC | 24,921 | 351,468 |
| Bank AlBilad (A) | 25,974 | 292,224 |
| Bank Al-Jazira | 21,999 | 112,608 |
| Banque Saudi Fransi | 53,521 | 602,859 |
| Bupa Arabia for Cooperative Insurance Company | 2,565 | 98,883 |
| Dr Sulaiman Al Habib Medical Services Group Company | 9,242 | 408,522 |
| Etihad Etisalat Company | 68,287 | 550,716 |
| Jarir Marketing Company | 6,830 | 369,278 |
| Mouwasat Medical Services Company | 2,537 | 121,612 |
| National Petrochemical Company | 10,295 | 132,019 |
| Riyad Bank | 115,598 | 910,694 |
| SABIC Agri-Nutrients Company | 27,045 | 1,182,484 |
| Sahara International Petrochemical Company | 34,842 | 407,786 |
| Saudi Arabian Mining Company (A) | 36,570 | 795,572 |
| Saudi Basic Industries Corp. | 72,177 | 2,482,293 |
| Saudi Electricity Company | 93,058 | 707,071 |
| Saudi Industrial Investment Group | 12,070 | 121,797 |
| Saudi Kayan Petrochemical Company (A) | 111,249 | 603,863 |
| Saudi Telecom Company | 49,269 | 1,536,824 |
| The Saudi British Bank | 22,838 | 201,839 |
| The Saudi National Bank | 191,935 | 3,372,128 |
| The Savola Group | 21,366 | 208,482 |
| Yanbu National Petrochemical Company | 25,410 | 515,530 |
| South Africa - 4.2% | 30,008,878 |
| Absa Group, Ltd. | 141,252 | 1,301,005 |
| African Rainbow Minerals, Ltd. | 13,892 | 186,016 |
| Anglo American Platinum, Ltd. | 6,432 | 653,102 |
| AngloGold Ashanti, Ltd. | 65,734 | 1,233,723 |
| Aspen Pharmacare Holdings, Ltd. | 40,219 | 643,636 |
| Bid Corp., Ltd. | 33,704 | 726,942 |
| Capitec Bank Holdings, Ltd. | 11,108 | 1,247,297 |
| Clicks Group, Ltd. | 31,381 | 575,676 |
| Discovery, Ltd. (A) | 83,140 | 765,380 |
| Exxaro Resources, Ltd. | 32,930 | 362,338 |
| FirstRand, Ltd. | 725,797 | 2,769,966 |
| Gold Fields, Ltd. | 175,445 | 1,654,146 |
| Impala Platinum Holdings, Ltd. | 118,527 | 1,543,892 |
| Investec, Ltd. | 14,893 | 68,586 |
| Kumba Iron Ore, Ltd. | 6,597 | 201,469 |
| MTN Group, Ltd. (A) | 330,495 | 2,978,369 |
| Naspers, Ltd., N Shares | 22,466 | 3,828,295 |
| Nedbank Group, Ltd. | 69,705 | 797,526 |
| Northam Platinum Holdings, Ltd. (A) | 38,508 | 579,520 |
| Old Mutual, Ltd. (C) | 624,238 | 620,364 |
| Pepkor Holdings, Ltd. (A)(B) | 33,223 | 52,523 |
| Sanlam, Ltd. | 419,095 | 1,730,145 |
| SEE NOTES TO FINANCIAL STATEMENTS | SEMIANNUAL REPORT | JOHN HANCOCK MULTIFACTOR ETFS | 37 |
MULTIFACTOR EMERGING MARKETS ETF (continued)
| | Shares or
Principal
Amount | Value |
| South Africa (continued) | |
| Sasol, Ltd. (A) | 67,494 | $1,139,450 |
| Shoprite Holdings, Ltd. | 70,296 | 839,343 |
| Sibanye Stillwater, Ltd. | 289,029 | 1,014,264 |
| Standard Bank Group, Ltd. | 157,135 | 1,400,052 |
| The Bidvest Group, Ltd. | 9,631 | 121,268 |
| Vodacom Group, Ltd. | 86,826 | 774,465 |
| Woolworths Holdings, Ltd. | 56,424 | 200,120 |
| South Korea - 13.0% | 92,187,558 |
| Alteogen, Inc. (A) | 1,630 | 97,642 |
| Amorepacific Corp. | 2,600 | 403,834 |
| AMOREPACIFIC Group | 3,824 | 162,313 |
| Celltrion Healthcare Company, Ltd. (A) | 6,156 | 426,187 |
| Celltrion Pharm, Inc. (A) | 998 | 96,764 |
| Celltrion, Inc. (A) | 9,074 | 1,556,918 |
| CJ CheilJedang Corp. | 1,759 | 572,008 |
| CJ Logistics Corp. (A) | 626 | 76,070 |
| Coway Company, Ltd. | 9,764 | 663,439 |
| Doosan Heavy Industries and Construction Company, Ltd. (A) | 8,157 | 170,323 |
| Ecopro BM Company, Ltd. | 319 | 111,898 |
| E-MART, Inc. | 3,374 | 485,073 |
| GS Holdings Corp. | 8,552 | 309,205 |
| Hana Financial Group, Inc. | 47,613 | 1,833,542 |
| Hanjin Kal Corp. (A) | 1,420 | 66,592 |
| Hankook Tire & Technology Company, Ltd. | 14,333 | 507,184 |
| Hanmi Pharm Company, Ltd. | 573 | 129,453 |
| Hanmi Science Company, Ltd. | 996 | 48,583 |
| Hanon Systems | 22,433 | 276,441 |
| Hanwha Solutions Corp. (A) | 17,201 | 601,310 |
| HLB, Inc. (A) | 3,294 | 118,675 |
| HMM Company, Ltd. (A)(C) | 32,107 | 732,234 |
| HYBE Company, Ltd. (A) | 431 | 123,559 |
| Hyundai Engineering & Construction Company, Ltd. | 12,331 | 530,785 |
| Hyundai Glovis Company, Ltd. | 4,028 | 577,374 |
| Hyundai Heavy Industries Holdings Company, Ltd. | 7,410 | 400,763 |
| Hyundai Mobis Company, Ltd. | 7,255 | 1,564,554 |
| Hyundai Motor Company | 15,320 | 2,726,935 |
| Hyundai Steel Company | 12,382 | 470,994 |
| Industrial Bank of Korea | 50,192 | 474,624 |
| Kakao Corp. | 18,762 | 2,015,002 |
| Kakao Games Corp. (A) | 1,188 | 81,128 |
| Kangwon Land, Inc. (A) | 9,954 | 236,807 |
| KB Financial Group, Inc. | 52,154 | 2,526,136 |
| Kia Corp. | 31,141 | 2,267,853 |
| Korea Electric Power Corp. | 40,002 | 773,647 |
| Korea Investment Holdings Company, Ltd. | 7,236 | 538,729 |
| Korea Shipbuilding & Offshore Engineering Company, Ltd. (A) | 6,692 | 589,856 |
| Korea Zinc Company, Ltd. | 1,651 | 758,707 |
MULTIFACTOR EMERGING MARKETS ETF (continued)
| | Shares or
Principal
Amount | Value |
| South Korea (continued) | |
| Korean Air Lines Company, Ltd. (A) | 14,493 | $377,658 |
| KT&G Corp. | 12,971 | 900,217 |
| Kumho Petrochemical Company, Ltd. | 2,268 | 333,829 |
| LG Chem, Ltd. | 3,454 | 2,471,049 |
| LG Corp. | 20,670 | 1,613,199 |
| LG Display Company, Ltd. (A)(C) | 42,732 | 720,397 |
| LG Electronics, Inc. | 19,944 | 2,056,610 |
| LG Household & Health Care, Ltd. | 1,174 | 1,176,461 |
| LG Innotek Company, Ltd. | 1,477 | 264,800 |
| LG Uplus Corp. | 64,643 | 793,827 |
| Lotte Chemical Corp. | 2,865 | 550,419 |
| Lotte Corp. | 6,898 | 193,029 |
| Macquarie Korea Infrastructure Fund | 15,627 | 183,210 |
| Mirae Asset Securities Company, Ltd. | 56,726 | 421,361 |
| NAVER Corp. | 8,115 | 2,826,413 |
| NCSoft Corp. | 1,697 | 910,546 |
| Netmarble Corp. (B) | 2,678 | 283,029 |
| Orion Corp. | 2,961 | 299,001 |
| Pearl Abyss Corp. (A) | 1,074 | 95,493 |
| POSCO | 8,665 | 2,194,891 |
| POSCO Chemical Company, Ltd. | 2,057 | 256,124 |
| S-1 Corp. | 2,534 | 180,636 |
| Samsung Biologics Company, Ltd. (A)(B) | 907 | 676,049 |
| Samsung C&T Corp. | 10,806 | 1,054,199 |
| Samsung Card Company, Ltd. | 4,158 | 121,870 |
| Samsung Electro-Mechanics Company, Ltd. | 6,929 | 942,802 |
| Samsung Electronics Company, Ltd. | 424,689 | 25,367,586 |
| Samsung Fire & Marine Insurance Company, Ltd. | 5,737 | 1,134,095 |
| Samsung Heavy Industries Company, Ltd. (A)(C) | 102,588 | 560,106 |
| Samsung Life Insurance Company, Ltd. | 13,026 | 750,203 |
| Samsung SDI Company, Ltd. | 3,674 | 2,307,746 |
| Samsung SDS Company, Ltd. | 3,503 | 458,653 |
| Seegene, Inc. | 4,062 | 184,929 |
| Shin Poong Pharmaceutical Company, Ltd. | 1,053 | 46,678 |
| Shinhan Financial Group Company, Ltd. | 63,643 | 2,083,218 |
| SK Biopharmaceuticals Company, Ltd. (A) | 1,331 | 107,751 |
| SK Bioscience Company, Ltd. (A) | 908 | 178,717 |
| SK Hynix, Inc. | 63,074 | 5,559,558 |
| SK IE Technology Company, Ltd. (A)(B) | 1,363 | 194,206 |
| SK Innovation Company, Ltd. (A) | 6,300 | 1,307,390 |
| SK Telecom Company, Ltd. | 4,787 | 1,249,372 |
| SK, Inc. | 4,748 | 987,347 |
| SKC Company, Ltd. | 618 | 94,137 |
| S-Oil Corp. | 6,912 | 606,290 |
| Woori Financial Group, Inc. | 74,733 | 847,385 |
| Yuhan Corp. | 3,159 | 161,931 |
| Taiwan - 15.7% | 111,266,168 |
| Accton Technology Corp. | 60,000 | 525,379 |
| Advantech Company, Ltd. | 42,989 | 561,160 |
| 38 | JOHN HANCOCK MULTIFACTOR ETFS | SEMIANNUAL REPORT | SEE NOTES TO FINANCIAL STATEMENTS |
MULTIFACTOR EMERGING MARKETS ETF (continued)
| | Shares or
Principal
Amount | Value |
| Taiwan (continued) | |
| ASE Technology Holding Company, Ltd. | 501,000 | $1,798,004 |
| Asia Cement Corp. | 425,000 | 677,041 |
| ASMedia Technology, Inc. | 3,000 | 175,306 |
| Asustek Computer, Inc. | 109,000 | 1,383,642 |
| AU Optronics Corp. | 1,493,000 | 1,030,822 |
| Catcher Technology Company, Ltd. | 123,000 | 712,120 |
| Cathay Financial Holding Company, Ltd. | 1,050,359 | 2,194,504 |
| Chailease Holding Company, Ltd. | 251,806 | 2,408,630 |
| Chang Hwa Commercial Bank, Ltd. | 1,082,712 | 638,527 |
| Cheng Shin Rubber Industry Company, Ltd. | 395,000 | 484,366 |
| China Development Financial Holding Corp. | 2,622,000 | 1,338,886 |
| China Life Insurance Company, Ltd. | 390,449 | 407,178 |
| China Steel Corp. | 1,539,000 | 1,859,518 |
| Chunghwa Telecom Company, Ltd. | 354,000 | 1,406,656 |
| Compal Electronics, Inc. | 720,000 | 633,044 |
| CTBC Financial Holding Company, Ltd. | 2,470,000 | 2,060,665 |
| Delta Electronics, Inc. | 134,000 | 1,180,574 |
| E.Sun Financial Holding Company, Ltd. | 1,761,510 | 1,681,791 |
| Eclat Textile Company, Ltd. | 24,000 | 523,869 |
| eMemory Technology, Inc. | 3,000 | 248,126 |
| Evergreen Marine Corp. Taiwan, Ltd. | 360,000 | 1,288,095 |
| Far Eastern New Century Corp. | 701,000 | 733,556 |
| Far EasTone Telecommunications Company, Ltd. | 317,000 | 697,643 |
| Feng TAY Enterprise Company, Ltd. | 97,680 | 758,721 |
| First Financial Holding Company, Ltd. | 1,835,354 | 1,511,394 |
| Formosa Chemicals & Fibre Corp. | 489,000 | 1,415,556 |
| Formosa Petrochemical Corp. | 204,000 | 733,589 |
| Formosa Plastics Corp. | 518,000 | 2,002,445 |
| Fubon Financial Holding Company, Ltd. | 1,160,883 | 3,072,477 |
| Giant Manufacturing Company, Ltd. | 16,000 | 185,555 |
| Globalwafers Company, Ltd. | 38,000 | 1,038,531 |
| Hiwin Technologies Corp. | 26,962 | 299,594 |
| Hon Hai Precision Industry Company, Ltd. | 1,166,800 | 4,489,548 |
| Hotai Motor Company, Ltd. | 42,000 | 924,322 |
| Hua Nan Financial Holdings Company, Ltd. | 1,777,067 | 1,300,441 |
| Innolux Corp. | 1,563,000 | 938,637 |
| Inventec Corp. | 453,000 | 432,499 |
| Largan Precision Company, Ltd. | 11,000 | 818,814 |
| Lite-On Technology Corp. | 398,000 | 877,336 |
| MediaTek, Inc. | 147,000 | 4,826,258 |
| Mega Financial Holding Company, Ltd. | 1,376,000 | 1,652,675 |
| Micro-Star International Company, Ltd. | 70,000 | 352,410 |
| momo.com, Inc. | 5,600 | 360,465 |
| Nan Ya Plastics Corp. | 688,000 | 2,105,428 |
| Nan Ya Printed Circuit Board Corp. | 22,000 | 388,047 |
| Nanya Technology Corp. | 199,000 | 475,880 |
| Nien Made Enterprise Company, Ltd. | 6,000 | 82,421 |
| Novatek Microelectronics Corp. | 81,000 | 1,210,259 |
| Oneness Biotech Company, Ltd. (A) | 14,000 | 131,902 |
| Pegatron Corp. | 389,000 | 951,220 |
MULTIFACTOR EMERGING MARKETS ETF (continued)
| | Shares or
Principal
Amount | Value |
| Taiwan (continued) | |
| Pou Chen Corp. | 465,000 | $570,203 |
| President Chain Store Corp. | 93,000 | 939,749 |
| Quanta Computer, Inc. | 402,000 | 1,127,569 |
| Realtek Semiconductor Corp. | 58,000 | 1,040,761 |
| Shin Kong Financial Holding Company, Ltd. | 2,326,140 | 820,592 |
| Sino-American Silicon Products, Inc. | 52,000 | 354,352 |
| SinoPac Financial Holdings Company, Ltd. | 2,013,000 | 1,024,289 |
| Taishin Financial Holding Company, Ltd. | 2,251,390 | 1,477,529 |
| Taiwan Cement Corp. | 819,164 | 1,421,316 |
| Taiwan Cooperative Financial Holding Company, Ltd. | 1,676,159 | 1,362,216 |
| Taiwan High Speed Rail Corp. | 327,000 | 341,599 |
| Taiwan Mobile Company, Ltd. | 215,000 | 758,455 |
| Taiwan Semiconductor Manufacturing Company, Ltd. | 1,322,000 | 28,048,258 |
| The Shanghai Commercial & Savings Bank, Ltd. | 246,000 | 389,234 |
| Unimicron Technology Corp. | 140,000 | 956,542 |
| Uni-President Enterprises Corp. | 798,000 | 1,911,171 |
| United Microelectronics Corp. | 1,126,000 | 2,348,491 |
| Vanguard International Semiconductor Corp. | 141,000 | 732,672 |
| Walsin Technology Corp. (A) | 42,000 | 228,060 |
| Wan Hai Lines, Ltd. | 51,000 | 293,435 |
| Win Semiconductors Corp. | 45,000 | 578,510 |
| Winbond Electronics Corp. | 312,000 | 295,075 |
| Wiwynn Corp. | 16,000 | 511,498 |
| Yageo Corp. | 64,000 | 998,831 |
| Yang Ming Marine Transport Corp. (A) | 129,000 | 447,651 |
| Yuanta Financial Holding Company, Ltd. | 2,215,360 | 1,967,722 |
| Zhen Ding Technology Holding, Ltd. | 97,000 | 334,862 |
| Thailand - 2.0% | 13,812,921 |
| Advanced Info Service PCL, NVDR | 128,000 | 729,059 |
| Airports of Thailand PCL, NVDR | 281,400 | 546,984 |
| Asset World Corp. PCL, NVDR (A) | 430,000 | 59,091 |
| B Grimm Power PCL, NVDR | 72,300 | 92,602 |
| Bangkok Bank PCL, NVDR | 66,600 | 245,868 |
| Bangkok Dusit Medical Services PCL, NVDR | 267,900 | 189,728 |
| Bangkok Expressway & Metro PCL, NVDR | 744,200 | 201,847 |
| Bank of Ayudhya PCL, NVDR | 121,200 | 118,707 |
| Berli Jucker PCL, NVDR | 179,900 | 182,977 |
| BTS Group Holdings PCL, NVDR | 887,700 | 255,482 |
| Bumrungrad Hospital PCL, NVDR | 39,500 | 173,201 |
| Carabao Group PCL, NVDR | 36,300 | 135,650 |
| Central Pattana PCL, NVDR | 157,200 | 280,693 |
| Central Retail Corp. PCL, NVDR | 333,300 | 349,045 |
| Charoen Pokphand Foods PCL, NVDR | 742,700 | 565,153 |
| CP ALL PCL, NVDR | 519,600 | 1,002,167 |
| Delta Electronics Thailand PCL, NVDR | 29,900 | 374,848 |
| Electricity Generating PCL, NVDR | 36,500 | 196,346 |
| Energy Absolute PCL, NVDR | 223,200 | 440,582 |
| Global Power Synergy PCL, NVDR | 85,586 | 201,182 |
| SEE NOTES TO FINANCIAL STATEMENTS | SEMIANNUAL REPORT | JOHN HANCOCK MULTIFACTOR ETFS | 39 |
MULTIFACTOR EMERGING MARKETS ETF (continued)
| | Shares or
Principal
Amount | Value |
| Thailand (continued) | |
| Gulf Energy Development PCL, NVDR | 332,040 | $432,780 |
| Home Product Center PCL, NVDR | 473,300 | 208,248 |
| Indorama Ventures PCL, NVDR | 274,100 | 346,936 |
| Intouch Holdings PCL, NVDR | 95,000 | 215,437 |
| Kasikornbank PCL, NVDR | 79,900 | 339,513 |
| Krung Thai Bank PCL, NVDR | 546,200 | 189,296 |
| Krungthai Card PCL, NVDR | 101,100 | 175,952 |
| Land & Houses PCL, NVDR | 481,300 | 122,564 |
| Minor International PCL, NVDR (A) | 316,429 | 312,305 |
| Muangthai Capital PCL, NVDR | 80,700 | 147,136 |
| Osotspa PCL, NVDR | 98,200 | 96,920 |
| PTT Exploration & Production PCL, NVDR | 306,700 | 1,086,032 |
| PTT Global Chemical PCL, NVDR | 207,500 | 392,394 |
| PTT Oil & Retail Business PCL, NVDR | 112,200 | 92,986 |
| PTT PCL, NVDR | 1,133,400 | 1,297,949 |
| SCG Packaging PCL, NVDR | 39,200 | 75,901 |
| Thai Beverage PCL | 1,014,900 | 534,356 |
| Thai Oil PCL, NVDR | 142,900 | 240,087 |
| The Siam Cement PCL, NVDR | 36,400 | 433,301 |
| The Siam Commercial Bank PCL, NVDR | 103,300 | 392,249 |
| TMBThanachart Bank PCL, NVDR | 2,250,689 | 78,680 |
| True Corp. PCL, NVDR | 2,130,600 | 260,687 |
| Turkey - 0.3% | 2,139,314 |
| Akbank T.A.S. | 357,852 | 218,095 |
| Aselsan Elektronik Sanayi Ve Ticaret AS | 42,052 | 71,857 |
| BIM Birlesik Magazalar AS | 55,726 | 360,199 |
| Enka Insaat ve Sanayi AS | 153,763 | 175,909 |
| Eregli Demir ve Celik Fabrikalari TAS | 129,243 | 264,665 |
| Ford Otomotiv Sanayi AS | 8,660 | 167,163 |
| KOC Holding AS | 87,193 | 213,830 |
| Turkcell Iletisim Hizmetleri AS | 123,962 | 197,124 |
| Turkiye Garanti Bankasi AS | 251,491 | 257,634 |
| Turkiye Is Bankasi AS, Class C | 174,255 | 102,032 |
| Turkiye Petrol Rafinerileri AS (A) | 7,621 | 110,806 |
| United States - 0.0% | 256,756 |
|
| Parade Technologies, Ltd. | 4,000 | 256,756 |
|
| PREFERRED SECURITIES - 1.3% | $9,056,143 |
| (Cost $13,370,258) | | |
| Brazil - 1.2% | 8,464,647 |
| Alpargatas SA | 4,700 | 32,209 |
| Banco Bradesco SA | 457,598 | 1,615,434 |
| Banco Inter SA (B) | 61,766 | 134,007 |
| Banco Pan SA | 6,100 | 14,382 |
| Braskem SA, A Shares (A) | 25,600 | 247,326 |
| Centrais Eletricas Brasileiras SA, B Shares | 30,660 | 184,058 |
| Cia Energetica de Minas Gerais | 111,700 | 255,224 |
| Gerdau SA | 180,800 | 862,785 |
| Itau Unibanco Holding SA | 383,250 | 1,584,807 |
| Petroleo Brasileiro SA | 709,500 | 3,429,816 |
MULTIFACTOR EMERGING MARKETS ETF (continued)
| | Shares or
Principal
Amount | Value |
| Brazil (continued) | |
| Usinas Siderurgicas de Minas Gerais SA, A Shares | 44,500 | $104,599 |
| Chile - 0.1% | 564,097 |
| Sociedad Quimica y Minera de Chile SA, B Shares | 10,359 | 564,097 |
| South Korea - 0.0% | 27,399 |
|
| Hyundai Engineering & Construction Company, Ltd. | 202 | 27,399 |
|
| RIGHTS - 0.0% | $39,880 |
| (Cost $0) | | |
| Bharti Airtel, Ltd. (Strike Price: INR 133.75) (A)(D) | 19,803 | 39,880 |
|
| WARRANTS - 0.0% | $9,701 |
| (Cost $0) | | |
| BTS Group Holdings PCL (Expiration Date: 11-20-26; Strike Price: THB 14.90) (A) | 174,660 | 4,901 |
| BTS Group Holdings PCL (Expiration Date: 11-7-24; Strike Price: THB 11.90) (A) | 87,330 | 2,918 |
| BTS Group Holdings PCL (Expiration Date: 9-5-22; Strike Price: THB 1.34) (A) | 43,665 | 1,882 |
|
| SHORT-TERM INVESTMENTS - 0.0% | $6,720 |
| (Cost $6,720) | | |
| Short-term funds - 0.0% | 6,720 |
| State Street Institutional U.S. Government Money Market Fund, Premier Class, 0.0250% (E) | 6,720 | 6,720 |
| Total investments (Multifactor Emerging Markets ETF) (Cost $594,060,662) - 100.3% | $711,045,860 |
| Other assets and liabilities, net - (0.3%) | (1,832,948) |
| Total net assets - 100.0% | $709,212,912 |
| The percentage shown for each investment category is the total value of the category as a percentage of the net assets of the fund. |
| Currency Abbreviations |
| INR | Indian Rupee |
| THB | Thai Bhat |
| Security Abbreviations and Legend |
| ADR | American Depositary Receipt |
| GDR | Global Depositary Receipt |
| NVDR | Non-Voting Depositary Receipt |
| (A) | Non-income producing security. |
| (B) | These securities are exempt from registration under Rule 144A of the Securities Act of 1933. Such securities may be resold, normally to qualified institutional buyers, in transactions exempt from registration. |
| (C) | All or a portion of this security is on loan as of 10-31-21. |
| (D) | Strike price and/or expiration date not available. |
| (E) | The rate shown is the annualized seven-day yield as of 10-31-21. |
| 40 | JOHN HANCOCK MULTIFACTOR ETFS | SEMIANNUAL REPORT | SEE NOTES TO FINANCIAL STATEMENTS |
MULTIFACTOR ENERGY ETF
As of 10-31-21 (unaudited)
| | Shares or
Principal
Amount | Value |
| COMMON STOCKS – 99.8% | | $21,826,322 |
| (Cost $20,619,890) | | |
| Energy – 99.8% | 21,826,322 |
| Energy equipment and services – 11.7% | |
| Baker Hughes Company | 20,827 | 522,341 |
| Halliburton Company | 32,108 | 802,379 |
| Schlumberger NV | 38,378 | 1,238,074 |
| Oil, gas and consumable fuels – 88.1% | |
| APA Corp. | 9,107 | 238,694 |
| Cheniere Energy, Inc. (A) | 7,185 | 742,929 |
| Chevron Corp. | 11,120 | 1,273,129 |
| ConocoPhillips | 19,380 | 1,443,616 |
| Continental Resources, Inc. | 3,493 | 170,493 |
| Coterra Energy, Inc. | 30,147 | 642,734 |
| Devon Energy Corp. | 16,158 | 647,613 |
| Diamondback Energy, Inc. | 6,958 | 745,828 |
| EOG Resources, Inc. | 15,940 | 1,473,816 |
| EQT Corp. (A) | 11,679 | 232,529 |
| Exxon Mobil Corp. | 19,738 | 1,272,509 |
| Hess Corp. | 10,434 | 861,535 |
| HollyFrontier Corp. | 6,078 | 205,436 |
| Kinder Morgan, Inc. | 49,597 | 830,750 |
| Marathon Oil Corp. | 44,224 | 721,736 |
| Marathon Petroleum Corp. | 18,156 | 1,197,025 |
| New Fortress Energy, Inc. (B) | 1,536 | 46,080 |
| Occidental Petroleum Corp. | 27,916 | 936,023 |
| ONEOK, Inc. | 13,660 | 869,049 |
| Ovintiv, Inc. | 12,795 | 480,068 |
| Phillips 66 | 10,087 | 754,306 |
| Pioneer Natural Resources Company | 5,391 | 1,008,009 |
| Targa Resources Corp. | 8,647 | 472,731 |
| The Williams Companies, Inc. | 41,305 | 1,160,257 |
| Valero Energy Corp. | 10,819 | 836,633 |
|
| SHORT-TERM INVESTMENTS – 0.3% | | $72,764 |
| (Cost $72,764) | | |
| Short-term funds – 0.3% | 72,764 |
| State Street Institutional U.S. Government Money Market Fund, Premier Class, 0.0250% (C) | 72,764 | 72,764 |
| Total investments (Multifactor Energy ETF) (Cost $20,692,654) 100.1% | $21,899,086 |
| Other assets and liabilities, net (0.1%) | | (28,417) |
| Total net assets 100.0% | | $21,870,669 |
| The percentage shown for each investment category is the total value of the category as a percentage of the net assets of the fund. |
| Security Abbreviations and Legend |
| (A) | Non-income producing security. |
| (B) | All or a portion of this security is on loan as of 10-31-21. |
| (C) | The rate shown is the annualized seven-day yield as of 10-31-21. |
MULTIFACTOR FINANCIALS ETF
As of 10-31-21 (unaudited)
| | Shares or
Principal
Amount | Value |
| COMMON STOCKS – 99.9% | | $41,093,717 |
| (Cost $31,786,748) | | |
| Consumer discretionary – 0.1% | 26,712 |
| Auto components – 0.1% | |
| QuantumScape Corp. (A)(B) | 923 | 26,712 |
| Financials – 86.2% | 35,454,894 |
| Banks – 27.2% | |
| Bank of America Corp. | 27,168 | 1,298,087 |
| Bank OZK | 940 | 41,990 |
| BOK Financial Corp. | 379 | 38,343 |
| Citigroup, Inc. | 10,932 | 756,057 |
| Citizens Financial Group, Inc. | 6,383 | 302,427 |
| Comerica, Inc. | 2,097 | 178,434 |
| Commerce Bancshares, Inc. | 1,572 | 110,842 |
| Cullen/Frost Bankers, Inc. | 767 | 99,327 |
| East West Bancorp, Inc. | 2,017 | 160,311 |
| Fifth Third Bancorp | 11,270 | 490,583 |
| First Citizens BancShares, Inc., Class A | 72 | 58,601 |
| First Financial Bankshares, Inc. | 1,643 | 83,333 |
| First Horizon Corp. | 8,374 | 142,107 |
| First Republic Bank | 1,891 | 409,080 |
| Huntington Bancshares, Inc. | 18,247 | 287,208 |
| JPMorgan Chase & Co. | 9,765 | 1,658,976 |
| KeyCorp | 15,508 | 360,871 |
| M&T Bank Corp. | 1,760 | 258,931 |
| People’s United Financial, Inc. | 5,344 | 91,596 |
| Pinnacle Financial Partners, Inc. | 817 | 78,898 |
| Popular, Inc. | 1,130 | 92,027 |
| Prosperity Bancshares, Inc. | 1,168 | 87,962 |
| Regions Financial Corp. | 15,165 | 359,107 |
| Signature Bank | 746 | 222,174 |
| SVB Financial Group (A) | 710 | 509,354 |
| Synovus Financial Corp. | 1,929 | 89,872 |
| The PNC Financial Services Group, Inc. | 2,659 | 561,129 |
| Truist Financial Corp. | 8,695 | 551,872 |
| U.S. Bancorp | 8,485 | 512,239 |
| Wells Fargo & Company | 18,404 | 941,549 |
| Western Alliance Bancorp | 1,393 | 161,713 |
| Zions Bancorp NA | 2,666 | 167,931 |
| Capital markets – 23.9% | |
| Affiliated Managers Group, Inc. | 447 | 75,042 |
| Ameriprise Financial, Inc. | 1,406 | 424,795 |
| Apollo Global Management, Inc. | 2,531 | 194,760 |
| Ares Management Corp., Class A | 1,431 | 121,263 |
| BlackRock, Inc. | 564 | 532,111 |
| Cboe Global Markets, Inc. | 1,339 | 176,668 |
| CME Group, Inc. | 1,722 | 379,787 |
| FactSet Research Systems, Inc. | 515 | 228,603 |
| Franklin Resources, Inc. | 4,219 | 132,856 |
| Houlihan Lokey, Inc. | 440 | 49,315 |
| SEE NOTES TO FINANCIAL STATEMENTS | SEMIANNUAL REPORT | JOHN HANCOCK MULTIFACTOR ETFS | 41 |
MULTIFACTOR FINANCIALS ETF (continued)
| | Shares or
Principal
Amount | Value |
| Financials (continued) | |
| Capital markets (continued) | |
| Interactive Brokers Group, Inc., Class A | 938 | $66,457 |
| Intercontinental Exchange, Inc. | 2,990 | 413,995 |
| Invesco, Ltd. | 5,999 | 152,435 |
| Janus Henderson Group PLC | 2,114 | 98,301 |
| Jefferies Financial Group, Inc. | 3,221 | 138,503 |
| KKR & Company, Inc. | 3,724 | 296,691 |
| LPL Financial Holdings, Inc. | 1,174 | 192,559 |
| MarketAxess Holdings, Inc. | 435 | 177,771 |
| Moody’s Corp. | 1,037 | 419,104 |
| Morgan Stanley | 6,638 | 682,254 |
| Morningstar, Inc. | 303 | 95,975 |
| MSCI, Inc. | 433 | 287,893 |
| Nasdaq, Inc. | 1,464 | 307,250 |
| Northern Trust Corp. | 2,859 | 351,771 |
| Raymond James Financial, Inc. | 2,628 | 259,095 |
| S&P Global, Inc. | 1,009 | 478,427 |
| SEI Investments Company | 2,007 | 126,521 |
| State Street Corp. | 4,540 | 447,417 |
| Stifel Financial Corp. | 1,163 | 84,748 |
| T. Rowe Price Group, Inc. | 1,628 | 353,081 |
| The Bank of New York Mellon Corp. | 6,362 | 376,630 |
| The Blackstone Group, Inc. | 2,734 | 378,440 |
| The Charles Schwab Corp. | 6,136 | 503,336 |
| The Goldman Sachs Group, Inc. | 1,863 | 770,071 |
| Tradeweb Markets, Inc., Class A | 761 | 67,805 |
| Consumer finance – 6.5% | |
| Ally Financial, Inc. | 7,247 | 345,972 |
| American Express Company | 2,818 | 489,712 |
| Capital One Financial Corp. | 3,985 | 601,855 |
| Credit Acceptance Corp. (A) | 161 | 96,312 |
| Discover Financial Services | 4,209 | 476,964 |
| OneMain Holdings, Inc. | 1,446 | 76,363 |
| SLM Corp. | 4,421 | 81,125 |
| Synchrony Financial | 9,079 | 421,720 |
| Upstart Holdings, Inc. (A) | 221 | 71,171 |
| Diversified financial services – 4.8% | |
| Berkshire Hathaway, Inc., Class B (A) | 5,531 | 1,587,452 |
| Equitable Holdings, Inc. | 7,608 | 254,868 |
| Voya Financial, Inc. | 2,105 | 146,866 |
| Insurance – 23.6% | |
| Aflac, Inc. | 8,315 | 446,265 |
| Alleghany Corp. (A) | 184 | 119,854 |
| American Financial Group, Inc. | 1,084 | 147,467 |
| American International Group, Inc. | 6,839 | 404,117 |
| Aon PLC, Class A | 1,517 | 485,319 |
| Arch Capital Group, Ltd. (A) | 5,228 | 218,635 |
| Arthur J. Gallagher & Company | 2,379 | 398,887 |
| Assurant, Inc. | 786 | 126,790 |
| Athene Holding, Ltd., Class A (A) | 2,448 | 213,000 |
MULTIFACTOR FINANCIALS ETF (continued)
| | Shares or
Principal
Amount | Value |
| Financials (continued) | |
| Insurance (continued) | |
| Brown & Brown, Inc. | 3,213 | $202,772 |
| Chubb, Ltd. | 2,477 | 483,956 |
| Cincinnati Financial Corp. | 1,757 | 213,370 |
| CNA Financial Corp. | 446 | 20,008 |
| Erie Indemnity Company, Class A | 372 | 76,561 |
| Everest Re Group, Ltd. | 550 | 143,825 |
| Fidelity National Financial, Inc. | 4,898 | 234,663 |
| First American Financial Corp. | 1,779 | 130,116 |
| Globe Life, Inc. | 1,459 | 129,880 |
| Lincoln National Corp. | 2,682 | 193,506 |
| Loews Corp. | 3,385 | 189,797 |
| Markel Corp. (A) | 156 | 204,848 |
| Marsh & McLennan Companies, Inc. | 3,379 | 563,617 |
| MetLife, Inc. | 4,585 | 287,938 |
| Old Republic International Corp. | 4,956 | 128,013 |
| Primerica, Inc. | 588 | 98,925 |
| Principal Financial Group, Inc. | 3,873 | 259,840 |
| Prudential Financial, Inc. | 5,192 | 571,380 |
| Reinsurance Group of America, Inc. | 924 | 109,106 |
| RenaissanceRe Holdings, Ltd. | 556 | 78,841 |
| The Allstate Corp. | 5,175 | 639,992 |
| The Hartford Financial Services Group, Inc. | 6,578 | 479,734 |
| The Progressive Corp. | 3,913 | 371,265 |
| The Travelers Companies, Inc. | 4,513 | 726,051 |
| Unum Group | 3,157 | 80,409 |
| W.R. Berkley Corp. | 1,879 | 149,568 |
| Willis Towers Watson PLC | 1,542 | 373,596 |
| Thrifts and mortgage finance – 0.2% | |
| New York Community Bancorp, Inc. | 6,271 | 77,949 |
| Rocket Companies, Inc., Class A (B) | 546 | 8,998 |
| TFS Financial Corp. | 565 | 10,995 |
| Industrials – 1.8% | 733,027 |
| Professional services – 1.8% | |
| Dun & Bradstreet Holdings, Inc. (A) | 1,601 | 30,163 |
| Equifax, Inc. | 1,522 | 422,248 |
| TransUnion | 2,434 | 280,616 |
| Information technology – 11.8% | 4,879,084 |
| IT services – 11.8% | |
| Affirm Holdings, Inc. (A) | 618 | 100,425 |
| Euronet Worldwide, Inc. (A) | 584 | 65,519 |
| Fidelity National Information Services, Inc. | 1,998 | 221,259 |
| Fiserv, Inc. (A) | 1,897 | 186,836 |
| FleetCor Technologies, Inc. (A) | 1,133 | 280,316 |
| Global Payments, Inc. | 1,499 | 214,342 |
| Jack Henry & Associates, Inc. | 918 | 152,829 |
| Mastercard, Inc., Class A | 3,258 | 1,093,124 |
| PayPal Holdings, Inc. (A) | 3,769 | 876,632 |
| Shift4 Payments, Inc., Class A (A) | 254 | 16,035 |
| 42 | JOHN HANCOCK MULTIFACTOR ETFS | SEMIANNUAL REPORT | SEE NOTES TO FINANCIAL STATEMENTS |
MULTIFACTOR FINANCIALS ETF (continued)
| | Shares or
Principal
Amount | Value |
| Information technology (continued) | |
| IT services (continued) | |
| Square, Inc., Class A (A) | 991 | $252,210 |
| The Western Union Company | 4,842 | 88,221 |
| Visa, Inc., Class A | 5,917 | 1,253,043 |
| WEX, Inc. (A) | 523 | 78,293 |
|
| SHORT-TERM INVESTMENTS – 0.2% | | $74,947 |
| (Cost $74,947) | | |
| Short-term funds – 0.2% | 74,947 |
| John Hancock Collateral Trust, 0.0370% (C)(D) | 797 | 7,979 |
|
| State Street Institutional U.S. Government Money Market Fund, Premier Class, 0.0250% (C) | 66,968 | 66,968 |
| Total investments (Multifactor Financials ETF) (Cost $31,861,695) 100.1% | $41,168,664 |
| Other assets and liabilities, net (0.1%) | | (35,693) |
| Total net assets 100.0% | | $41,132,971 |
| The percentage shown for each investment category is the total value of the category as a percentage of the net assets of the fund. |
| Security Abbreviations and Legend |
| (A) | Non-income producing security. |
| (B) | All or a portion of this security is on loan as of 10-31-21. |
| (C) | The rate shown is the annualized seven-day yield as of 10-31-21. |
| (D) | Investment is an affiliate of the fund, the advisor and/or subadvisor. This security represents the investment of cash collateral received for securities lending. |
MULTIFACTOR HEALTHCARE ETF
As of 10-31-21 (unaudited)
| | Shares or
Principal
Amount | Value |
| COMMON STOCKS – 100.0% | | $52,099,033 |
| (Cost $41,983,752) | | |
| Consumer discretionary – 0.6% | 305,671 |
| Diversified consumer services – 0.6% | |
| Service Corp. International | 4,463 | 305,671 |
| Health care – 99.4% | 51,793,362 |
| Biotechnology – 15.6% | |
| AbbVie, Inc. | 10,047 | 1,152,089 |
| Acceleron Pharma, Inc. (A) | 606 | 105,553 |
| Alnylam Pharmaceuticals, Inc. (A) | 1,371 | 218,757 |
| Amgen, Inc. | 3,654 | 756,268 |
| Arrowhead Pharmaceuticals, Inc. (A) | 1,087 | 69,372 |
| Beam Therapeutics, Inc. (A) | 442 | 39,236 |
| Biogen, Inc. (A) | 1,741 | 464,290 |
| Biohaven Pharmaceutical Holding Company, Ltd. (A) | 466 | 66,321 |
| BioMarin Pharmaceutical, Inc. (A) | 3,114 | 246,722 |
| Blueprint Medicines Corp. (A) | 861 | 96,854 |
| Bridgebio Pharma, Inc. (A) | 1,249 | 61,676 |
| CRISPR Therapeutics AG (A) | 1,026 | 93,705 |
MULTIFACTOR HEALTHCARE ETF (continued)
| | Shares or
Principal
Amount | Value |
| Health care (continued) | |
| Biotechnology (continued) | |
| Denali Therapeutics, Inc. (A) | 1,012 | $48,930 |
| Exact Sciences Corp. (A) | 1,729 | 164,635 |
| Exelixis, Inc. (A) | 6,576 | 141,450 |
| Fate Therapeutics, Inc. (A) | 862 | 46,376 |
| Gilead Sciences, Inc. | 11,513 | 746,963 |
| Halozyme Therapeutics, Inc. (A) | 2,255 | 85,848 |
| Horizon Therapeutics PLC (A) | 3,668 | 439,830 |
| Incyte Corp. (A) | 2,512 | 168,254 |
| Intellia Therapeutics, Inc. (A) | 537 | 71,410 |
| Invitae Corp. (A)(B) | 1,516 | 40,174 |
| Ionis Pharmaceuticals, Inc. (A) | 1,675 | 53,382 |
| Mirati Therapeutics, Inc. (A) | 401 | 75,797 |
| Moderna, Inc. (A) | 1,959 | 676,266 |
| Natera, Inc. (A) | 801 | 91,771 |
| Neurocrine Biosciences, Inc. (A) | 1,132 | 119,324 |
| Novavax, Inc. (A) | 681 | 101,353 |
| Regeneron Pharmaceuticals, Inc. (A) | 1,147 | 734,011 |
| Sarepta Therapeutics, Inc. (A) | 820 | 64,887 |
| Seagen, Inc. (A) | 1,636 | 288,476 |
| Twist Bioscience Corp. (A) | 352 | 41,818 |
| Ultragenyx Pharmaceutical, Inc. (A) | 626 | 52,534 |
| United Therapeutics Corp. (A) | 1,011 | 192,858 |
| Vertex Pharmaceuticals, Inc. (A) | 1,561 | 288,676 |
| Vir Biotechnology, Inc. (A) | 833 | 31,429 |
| Health care equipment and supplies – 25.0% | |
| Abbott Laboratories | 9,814 | 1,264,926 |
| ABIOMED, Inc. (A) | 589 | 195,572 |
| Align Technology, Inc. (A) | 495 | 309,063 |
| Baxter International, Inc. | 5,039 | 397,879 |
| Becton, Dickinson and Company | 2,771 | 663,904 |
| Boston Scientific Corp. (A) | 12,120 | 522,736 |
| Danaher Corp. | 3,828 | 1,193,456 |
| Dentsply Sirona, Inc. | 4,444 | 254,241 |
| DexCom, Inc. (A) | 564 | 351,490 |
| Edwards Lifesciences Corp. (A) | 4,943 | 592,270 |
| Envista Holdings Corp. (A) | 2,730 | 106,743 |
| Globus Medical, Inc., Class A (A) | 1,384 | 106,803 |
| Hill-Rom Holdings, Inc. | 1,580 | 244,742 |
| Hologic, Inc. (A) | 6,776 | 496,749 |
| IDEXX Laboratories, Inc. (A) | 786 | 523,586 |
| Insulet Corp. (A) | 779 | 241,506 |
| Integra LifeSciences Holdings Corp. (A) | 1,224 | 81,347 |
| Intuitive Surgical, Inc. (A) | 1,516 | 547,473 |
| Masimo Corp. (A) | 825 | 233,921 |
| Medtronic PLC | 7,799 | 934,788 |
| Novocure, Ltd. (A) | 812 | 83,287 |
| Penumbra, Inc. (A) | 387 | 107,025 |
| Quidel Corp. (A) | 734 | 97,453 |
| ResMed, Inc. | 2,652 | 697,237 |
| SEE NOTES TO FINANCIAL STATEMENTS | SEMIANNUAL REPORT | JOHN HANCOCK MULTIFACTOR ETFS | 43 |
MULTIFACTOR HEALTHCARE ETF (continued)
| | Shares or
Principal
Amount | Value |
| Health care (continued) | |
| Health care equipment and supplies (continued) | |
| Shockwave Medical, Inc. (A) | 269 | $57,485 |
| STAAR Surgical Company (A) | 378 | 44,778 |
| STERIS PLC | 1,713 | 400,397 |
| Stryker Corp. | 1,652 | 439,548 |
| Tandem Diabetes Care, Inc. (A) | 558 | 76,072 |
| Teleflex, Inc. | 847 | 302,328 |
| The Cooper Companies, Inc. | 967 | 403,162 |
| West Pharmaceutical Services, Inc. | 1,204 | 517,576 |
| Zimmer Biomet Holdings, Inc. | 3,703 | 529,973 |
| Health care providers and services – 22.4% | |
| Acadia Healthcare Company, Inc. (A) | 1,290 | 79,980 |
| agilon health, Inc. (A) | 505 | 12,373 |
| Amedisys, Inc. (A) | 525 | 88,904 |
| AmerisourceBergen Corp. | 2,572 | 313,835 |
| Anthem, Inc. | 1,830 | 796,288 |
| Cardinal Health, Inc. | 6,129 | 293,027 |
| Centene Corp. (A) | 8,508 | 606,110 |
| Chemed Corp. | 310 | 149,498 |
| Cigna Corp. | 3,521 | 752,121 |
| CVS Health Corp. | 9,750 | 870,480 |
| DaVita, Inc. (A) | 1,771 | 182,838 |
| Encompass Health Corp. | 2,513 | 159,726 |
| Guardant Health, Inc. (A) | 1,055 | 123,213 |
| HCA Healthcare, Inc. | 1,912 | 478,880 |
| HealthEquity, Inc. (A) | 1,030 | 68,165 |
| Henry Schein, Inc. (A) | 3,352 | 255,925 |
| Humana, Inc. | 1,617 | 748,930 |
| Laboratory Corp. of America Holdings (A) | 2,590 | 743,382 |
| LHC Group, Inc. (A) | 441 | 59,354 |
| McKesson Corp. | 2,311 | 480,411 |
| Molina Healthcare, Inc. (A) | 1,404 | 415,191 |
| Oak Street Health, Inc. (A)(B) | 202 | 9,540 |
| Quest Diagnostics, Inc. | 3,732 | 547,783 |
| R1 RCM, Inc. (A) | 3,120 | 67,704 |
| Signify Health, Inc., Class A (A) | 324 | 5,207 |
| Tenet Healthcare Corp. (A) | 1,697 | 121,607 |
| UnitedHealth Group, Inc. | 6,483 | 2,985,227 |
| Universal Health Services, Inc., Class B | 2,094 | 259,865 |
| Health care technology – 2.7% | |
| Cerner Corp. | 7,034 | 522,556 |
| Change Healthcare, Inc. (A) | 4,124 | 88,790 |
| Doximity, Inc., Class A (A) | 378 | 26,263 |
| Inovalon Holdings, Inc., Class A (A) | 867 | 35,365 |
| Inspire Medical Systems, Inc. (A) | 245 | 66,047 |
| Omnicell, Inc. (A) | 551 | 98,161 |
| Teladoc Health, Inc. (A) | 1,925 | 287,961 |
| Veeva Systems, Inc., Class A (A) | 907 | 287,528 |
| Life sciences tools and services – 13.6% | |
| 10X Genomics, Inc., Class A (A) | 754 | 121,598 |
MULTIFACTOR HEALTHCARE ETF (continued)
| | Shares or
Principal
Amount | Value |
| Health care (continued) | |
| Life sciences tools and services (continued) | |
| Agilent Technologies, Inc. | 2,747 | $432,625 |
| Avantor, Inc. (A) | 10,258 | 414,218 |
| Bio-Rad Laboratories, Inc., Class A (A) | 428 | 340,123 |
| Bio-Techne Corp. | 635 | 332,518 |
| Bruker Corp. | 2,291 | 183,967 |
| Charles River Laboratories International, Inc. (A) | 807 | 362,085 |
| Illumina, Inc. (A) | 1,017 | 422,116 |
| IQVIA Holdings, Inc. (A) | 1,940 | 507,155 |
| Maravai LifeSciences Holdings, Inc., Class A (A) | 1,298 | 54,892 |
| Medpace Holdings, Inc. (A) | 400 | 90,620 |
| Mettler-Toledo International, Inc. (A) | 414 | 613,084 |
| NeoGenomics, Inc. (A) | 1,695 | 77,970 |
| Pacific Biosciences of California, Inc. (A) | 1,741 | 46,102 |
| PerkinElmer, Inc. | 2,675 | 473,181 |
| PPD, Inc. (A) | 1,789 | 84,387 |
| Repligen Corp. (A) | 627 | 182,144 |
| Sotera Health Company (A) | 1,801 | 44,485 |
| Syneos Health, Inc. (A) | 1,743 | 162,692 |
| Thermo Fisher Scientific, Inc. | 2,729 | 1,727,648 |
| Waters Corp. (A) | 1,042 | 382,987 |
| Pharmaceuticals – 20.1% | |
| Bristol-Myers Squibb Company | 17,594 | 1,027,490 |
| Catalent, Inc. (A) | 3,159 | 435,500 |
| Elanco Animal Health, Inc. (A) | 7,494 | 246,403 |
| Eli Lilly & Company | 4,897 | 1,247,560 |
| Jazz Pharmaceuticals PLC (A) | 1,350 | 179,604 |
| Johnson & Johnson | 18,183 | 2,961,643 |
| Merck & Company, Inc. | 16,524 | 1,454,938 |
| Organon & Company | 3,326 | 122,231 |
| Perrigo Company PLC | 2,480 | 111,972 |
| Pfizer, Inc. | 38,160 | 1,669,118 |
| Royalty Pharma PLC, Class A | 4,204 | 166,184 |
| Viatris, Inc. | 16,596 | 221,557 |
| Zoetis, Inc. | 2,995 | 647,519 |
|
| SHORT-TERM INVESTMENTS – 0.1% | | $74,352 |
| (Cost $74,352) | | |
| Short-term funds – 0.1% | 74,352 |
| John Hancock Collateral Trust, 0.0370% (C)(D) | 669 | 6,693 |
|
| State Street Institutional U.S. Government Money Market Fund, Premier Class, 0.0250% (C) | 67,659 | 67,659 |
| Total investments (Multifactor Healthcare ETF) (Cost $42,058,104) 100.1% | $52,173,385 |
| Other assets and liabilities, net (0.1%) | | (50,380) |
| Total net assets 100.0% | | $52,123,005 |
| The percentage shown for each investment category is the total value of the category as a percentage of the net assets of the fund. |
| 44 | JOHN HANCOCK MULTIFACTOR ETFS | SEMIANNUAL REPORT | SEE NOTES TO FINANCIAL STATEMENTS |
MULTIFACTOR HEALTHCARE ETF (continued)
| Security Abbreviations and Legend |
| (A) | Non-income producing security. |
| (B) | All or a portion of this security is on loan as of 10-31-21. |
| (C) | The rate shown is the annualized seven-day yield as of 10-31-21. |
| (D) | Investment is an affiliate of the fund, the advisor and/or subadvisor. This security represents the investment of cash collateral received for securities lending. |
MULTIFACTOR INDUSTRIALS ETF
As of 10-31-21 (unaudited)
| | Shares or
Principal
Amount | Value |
| COMMON STOCKS – 99.9% | | $16,812,023 |
| (Cost $15,726,128) | | |
| Consumer discretionary – 9.0% | 1,513,398 |
| Auto components – 2.9% | |
| Aptiv PLC (A) | 1,316 | 227,523 |
| Autoliv, Inc. | 529 | 51,234 |
| BorgWarner, Inc. | 1,660 | 74,816 |
| Gentex Corp. | 1,595 | 56,447 |
| Lear Corp. | 414 | 71,146 |
| Distributors – 0.7% | |
| Pool Corp. | 236 | 121,578 |
| Hotels, restaurants and leisure – 0.4% | |
| Aramark | 1,711 | 62,417 |
| Household durables – 5.0% | |
| D.R. Horton, Inc. | 2,447 | 218,444 |
| Leggett & Platt, Inc. | 1,263 | 59,172 |
| Lennar Corp., A Shares | 1,867 | 186,569 |
| Lennar Corp., B Shares | 87 | 7,141 |
| Mohawk Industries, Inc. (A) | 345 | 61,137 |
| NVR, Inc. (A) | 26 | 127,265 |
| PulteGroup, Inc. | 1,889 | 90,823 |
| Toll Brothers, Inc. | 748 | 45,007 |
| TopBuild Corp. (A) | 205 | 52,679 |
| Industrials – 79.8% | 13,431,313 |
| Aerospace and defense – 10.0% | |
| Axon Enterprise, Inc. (A) | 259 | 46,610 |
| BWX Technologies, Inc. | 571 | 32,399 |
| General Dynamics Corp. | 794 | 160,984 |
| HEICO Corp. | 200 | 27,878 |
| HEICO Corp., Class A | 353 | 44,365 |
| Howmet Aerospace, Inc. | 1,951 | 57,925 |
| Huntington Ingalls Industries, Inc. | 320 | 64,874 |
| L3Harris Technologies, Inc. | 561 | 129,333 |
| Lockheed Martin Corp. | 503 | 167,157 |
| Northrop Grumman Corp. | 538 | 192,184 |
| Raytheon Technologies Corp. | 3,239 | 287,818 |
| Textron, Inc. | 1,578 | 116,535 |
| The Boeing Company (A) | 908 | 187,983 |
| TransDigm Group, Inc. (A) | 247 | 154,084 |
| Virgin Galactic Holdings, Inc. (A) | 480 | 9,000 |
| Air freight and logistics – 4.8% | |
| C.H. Robinson Worldwide, Inc. | 873 | 84,672 |
MULTIFACTOR INDUSTRIALS ETF (continued)
| | Shares or
Principal
Amount | Value |
| Industrials (continued) | |
| Air freight and logistics (continued) | |
| Expeditors International of Washington, Inc. | 1,114 | $137,312 |
| FedEx Corp. | 876 | 206,324 |
| GXO Logistics, Inc. (A) | 719 | 63,847 |
| United Parcel Service, Inc., Class B | 1,483 | 316,576 |
| Airlines – 0.8% | |
| Alaska Air Group, Inc. (A) | 273 | 14,414 |
| American Airlines Group, Inc. (A) | 867 | 16,646 |
| Delta Air Lines, Inc. (A) | 805 | 31,500 |
| Southwest Airlines Company (A) | 1,040 | 49,171 |
| United Airlines Holdings, Inc. (A) | 708 | 32,667 |
| Building products – 5.9% | |
| A.O. Smith Corp. | 863 | 63,059 |
| Advanced Drainage Systems, Inc. | 277 | 31,246 |
| Builders FirstSource, Inc. (A) | 1,259 | 73,362 |
| Carlisle Companies, Inc. | 385 | 85,824 |
| Carrier Global Corp. | 3,586 | 187,297 |
| Johnson Controls International PLC | 2,392 | 175,501 |
| Lennox International, Inc. | 185 | 55,367 |
| Masco Corp. | 1,442 | 94,523 |
| Trane Technologies PLC | 758 | 137,145 |
| Trex Company, Inc. (A) | 614 | 65,330 |
| Zurn Water Solutions Corp. | 704 | 25,541 |
| Commercial services and supplies – 4.7% | |
| ADT, Inc. | 1,480 | 12,358 |
| Cintas Corp. | 410 | 177,571 |
| IAA, Inc. (A) | 762 | 45,453 |
| MSA Safety, Inc. | 196 | 29,994 |
| Republic Services, Inc. | 1,463 | 196,920 |
| Stericycle, Inc. (A) | 548 | 36,672 |
| Tetra Tech, Inc. | 302 | 53,049 |
| Waste Management, Inc. | 1,449 | 232,173 |
| Construction and engineering – 1.9% | |
| AECOM (A) | 1,027 | 70,216 |
| EMCOR Group, Inc. | 463 | 56,250 |
| MasTec, Inc. (A) | 411 | 36,632 |
| Quanta Services, Inc. | 1,000 | 121,280 |
| WillScot Mobile Mini Holdings Corp. (A) | 1,204 | 41,839 |
| Electrical equipment – 7.5% | |
| Acuity Brands, Inc. | 146 | 29,993 |
| AMETEK, Inc. | 1,577 | 208,795 |
| Eaton Corp. PLC | 1,224 | 201,666 |
| Emerson Electric Company | 2,105 | 204,206 |
| Generac Holdings, Inc. (A) | 333 | 166,020 |
| Hubbell, Inc. | 399 | 79,549 |
| nVent Electric PLC | 595 | 21,093 |
| Regal Rexnord Corp. | 395 | 60,170 |
| Rockwell Automation, Inc. | 680 | 217,192 |
| Shoals Technologies Group, Inc., Class A (A) | 317 | 9,824 |
| Sunrun, Inc. (A) | 1,003 | 57,853 |
| SEE NOTES TO FINANCIAL STATEMENTS | SEMIANNUAL REPORT | JOHN HANCOCK MULTIFACTOR ETFS | 45 |
MULTIFACTOR INDUSTRIALS ETF (continued)
| | Shares or
Principal
Amount | Value |
| Industrials (continued) | |
| Industrial conglomerates – 4.6% | |
| 3M Company | 1,451 | $259,265 |
| General Electric Company | 2,061 | 216,137 |
| Honeywell International, Inc. | 1,379 | 301,477 |
| Machinery – 20.8% | |
| AGCO Corp. | 460 | 56,217 |
| Caterpillar, Inc. | 1,378 | 281,126 |
| Chart Industries, Inc. (A) | 110 | 19,527 |
| Colfax Corp. (A) | 731 | 37,734 |
| Crane Company | 188 | 19,417 |
| Cummins, Inc. | 1,045 | 250,633 |
| Deere & Company | 683 | 233,798 |
| Donaldson Company, Inc. | 886 | 53,169 |
| Dover Corp. | 947 | 160,119 |
| Fortive Corp. | 1,960 | 148,392 |
| Graco, Inc. | 1,127 | 84,728 |
| IDEX Corp. | 475 | 105,721 |
| Illinois Tool Works, Inc. | 913 | 208,045 |
| Ingersoll Rand, Inc. (A) | 2,295 | 123,379 |
| ITT, Inc. | 714 | 67,166 |
| Lincoln Electric Holdings, Inc. | 458 | 65,219 |
| Nordson Corp. | 323 | 82,110 |
| Oshkosh Corp. | 560 | 59,920 |
| Otis Worldwide Corp. | 2,004 | 160,941 |
| PACCAR, Inc. | 2,504 | 224,408 |
| Parker-Hannifin Corp. | 841 | 249,432 |
| Pentair PLC | 1,138 | 84,178 |
| Snap-on, Inc. | 406 | 82,511 |
| Stanley Black & Decker, Inc. | 1,039 | 186,739 |
| The Middleby Corp. (A) | 421 | 76,807 |
| The Timken Company | 462 | 32,779 |
| The Toro Company | 676 | 64,538 |
| Wabtec Corp. | 1,072 | 97,263 |
| Watts Water Technologies, Inc., Class A | 104 | 19,762 |
| Woodward, Inc. | 368 | 41,566 |
| Xylem, Inc. | 998 | 130,329 |
| Professional services – 4.8% | |
| ASGN, Inc. (A) | 194 | 23,214 |
| CACI International, Inc., Class A (A) | 170 | 48,899 |
| Clarivate PLC (A) | 1,461 | 34,260 |
| Exponent, Inc. | 199 | 22,845 |
| IHS Markit, Ltd. | 1,007 | 131,635 |
| Jacobs Engineering Group, Inc. | 847 | 118,936 |
| Leidos Holdings, Inc. | 907 | 90,682 |
| ManpowerGroup, Inc. | 420 | 40,593 |
| Robert Half International, Inc. | 843 | 95,318 |
| TriNet Group, Inc. (A) | 384 | 38,880 |
| Verisk Analytics, Inc. | 745 | 156,651 |
| Road and rail – 10.0% | |
| AMERCO | 75 | 55,274 |
MULTIFACTOR INDUSTRIALS ETF (continued)
| | Shares or
Principal
Amount | Value |
| Industrials (continued) | |
| Road and rail (continued) | |
| CSX Corp. | 7,486 | $270,769 |
| J.B. Hunt Transport Services, Inc. | 707 | 139,413 |
| Kansas City Southern | 489 | 151,712 |
| Knight-Swift Transportation Holdings, Inc. | 1,024 | 58,051 |
| Landstar System, Inc. | 302 | 53,095 |
| Norfolk Southern Corp. | 869 | 254,660 |
| Old Dominion Freight Line, Inc. | 644 | 219,829 |
| Saia, Inc. (A) | 145 | 45,333 |
| TuSimple Holdings, Inc., Class A (A) | 76 | 2,973 |
| Union Pacific Corp. | 1,517 | 366,204 |
| XPO Logistics, Inc. (A) | 787 | 67,525 |
| Trading companies and distributors – 4.0% | |
| Fastenal Company | 3,081 | 175,863 |
| United Rentals, Inc. (A) | 738 | 279,783 |
| W.W. Grainger, Inc. | 281 | 130,134 |
| Watsco, Inc. | 184 | 53,283 |
| WESCO International, Inc. (A) | 214 | 27,726 |
| Information technology – 10.9% | 1,835,608 |
| Electronic equipment, instruments and components – 2.3% | |
| Arrow Electronics, Inc. (A) | 552 | 63,894 |
| CDW Corp. | 844 | 157,533 |
| SYNNEX Corp. | 230 | 24,150 |
| Teledyne Technologies, Inc. (A) | 256 | 115,000 |
| Vontier Corp. | 1,124 | 38,025 |
| IT services – 7.5% | |
| Accenture PLC, Class A | 1,324 | 475,035 |
| Automatic Data Processing, Inc. | 940 | 211,021 |
| Broadridge Financial Solutions, Inc. | 693 | 123,638 |
| Gartner, Inc. (A) | 286 | 94,926 |
| Genpact, Ltd. | 1,193 | 58,875 |
| Globant SA (A) | 95 | 30,323 |
| MAXIMUS, Inc. | 382 | 32,306 |
| Paychex, Inc. | 1,884 | 232,260 |
| Semiconductors and semiconductor equipment – 0.8% | |
| Enphase Energy, Inc. (A) | 562 | 130,176 |
| Software – 0.3% | |
| Black Knight, Inc. (A) | 691 | 48,446 |
| Materials – 0.2% | 31,704 |
| Paper and forest products – 0.2% | |
| Louisiana-Pacific Corp. | 538 | 31,704 |
| 46 | JOHN HANCOCK MULTIFACTOR ETFS | SEMIANNUAL REPORT | SEE NOTES TO FINANCIAL STATEMENTS |
MULTIFACTOR INDUSTRIALS ETF (continued)
| | Shares or
Principal
Amount | Value |
|
| SHORT-TERM INVESTMENTS – 0.4% | | $71,383 |
| (Cost $71,383) | | |
| Short-term funds – 0.4% | 71,383 |
| State Street Institutional U.S. Government Money Market Fund, Premier Class, 0.0250% (B) | 71,383 | $71,383 |
| Total investments (Multifactor Industrials ETF) (Cost $15,797,511) 100.3% | $16,883,406 |
| Other assets and liabilities, net (0.3%) | | (54,526) |
| Total net assets 100.0% | | $16,828,880 |
| The percentage shown for each investment category is the total value of the category as a percentage of the net assets of the fund. |
| Security Abbreviations and Legend |
| (A) | Non-income producing security. |
| (B) | The rate shown is the annualized seven-day yield as of 10-31-21. |
MULTIFACTOR LARGE CAP ETF
As of 10-31-21 (unaudited)
| | Shares or
Principal
Amount | Value |
| COMMON STOCKS – 99.9% | | $781,809,017 |
| (Cost $579,868,072) | | |
| Communication services – 8.0% | 62,459,418 |
| Diversified telecommunication services – 0.9% | |
| AT&T, Inc. | 109,011 | 2,753,618 |
| Lumen Technologies, Inc. | 58,194 | 690,181 |
| Verizon Communications, Inc. | 68,843 | 3,647,991 |
| Entertainment – 1.5% | |
| Activision Blizzard, Inc. | 14,647 | 1,145,249 |
| Electronic Arts, Inc. | 7,309 | 1,025,087 |
| Liberty Media Corp.-Liberty Formula One, Series A (A) | 826 | 43,076 |
| Liberty Media Corp.-Liberty Formula One, Series C (A) | 6,806 | 379,775 |
| Live Nation Entertainment, Inc. (A) | 4,195 | 424,324 |
| Netflix, Inc. (A) | 4,587 | 3,166,452 |
| Playtika Holding Corp. (A) | 915 | 25,876 |
| Roku, Inc. (A) | 1,574 | 479,913 |
| Spotify Technology SA (A) | 997 | 288,532 |
| Take-Two Interactive Software, Inc. (A) | 3,224 | 583,544 |
| The Walt Disney Company (A) | 22,042 | 3,726,641 |
| Warner Music Group Corp., Class A | 1,859 | 92,002 |
| Zynga, Inc., Class A (A) | 18,543 | 136,847 |
| Interactive media and services – 4.0% | |
| Alphabet, Inc., Class A (A) | 5,227 | 15,476,729 |
| Alphabet, Inc., Class C (A) | 968 | 2,870,517 |
| Bumble, Inc., Class A (A) | 335 | 17,594 |
| Facebook, Inc., Class A (A) | 31,558 | 10,211,222 |
| Match Group, Inc. (A) | 5,515 | 831,552 |
| Pinterest, Inc., Class A (A) | 6,273 | 280,027 |
| Snap, Inc., Class A (A) | 9,883 | 519,648 |
MULTIFACTOR LARGE CAP ETF (continued)
| | Shares or
Principal
Amount | Value |
| Communication services (continued) | |
| Interactive media and services (continued) | |
| Twitter, Inc. (A) | 11,367 | $608,589 |
| Zillow Group, Inc., Class A (A) | 783 | 82,779 |
| Zillow Group, Inc., Class C (A) | 2,068 | 214,307 |
| ZoomInfo Technologies, Inc., Class A (A) | 1,583 | 106,409 |
| Media – 1.5% | |
| Altice USA, Inc., Class A (A) | 8,602 | 140,213 |
| Cable One, Inc. | 171 | 292,617 |
| Charter Communications, Inc., Class A (A) | 2,039 | 1,376,101 |
| Comcast Corp., Class A | 75,313 | 3,873,348 |
| Discovery, Inc., Series A (A)(B) | 10,774 | 252,543 |
| Discovery, Inc., Series C (A) | 9,690 | 218,606 |
| DISH Network Corp., Class A (A) | 9,742 | 400,104 |
| Fox Corp., Class A | 11,817 | 469,608 |
| Fox Corp., Class B | 4,539 | 167,761 |
| Liberty Broadband Corp., Series A (A) | 451 | 72,507 |
| Liberty Broadband Corp., Series C (A) | 6,321 | 1,026,846 |
| Liberty Media Corp.-Liberty SiriusXM, Series A (A) | 4,618 | 229,884 |
| Liberty Media Corp.-Liberty SiriusXM, Series C (A) | 3,502 | 172,719 |
| News Corp., Class A | 13,622 | 311,944 |
| News Corp., Class B | 3,927 | 88,593 |
| Omnicom Group, Inc. | 11,710 | 797,217 |
| Sirius XM Holdings, Inc. (B) | 33,361 | 203,168 |
| The Interpublic Group of Companies, Inc. | 21,144 | 773,236 |
| The New York Times Company, Class A | 2,814 | 153,616 |
| ViacomCBS, Inc., Class A | 239 | 9,304 |
| ViacomCBS, Inc., Class B | 15,505 | 561,591 |
| Wireless telecommunication services – 0.1% | |
| T-Mobile US, Inc. (A) | 9,036 | 1,039,411 |
| Consumer discretionary – 11.8% | 92,417,416 |
| Auto components – 0.4% | |
| Aptiv PLC (A) | 6,795 | 1,174,788 |
| Autoliv, Inc. | 3,614 | 350,016 |
| BorgWarner, Inc. | 9,198 | 414,554 |
| Gentex Corp. | 9,581 | 339,072 |
| Lear Corp. | 3,229 | 554,904 |
| QuantumScape Corp. (A)(B) | 721 | 20,866 |
| Automobiles – 1.2% | |
| Ford Motor Company (A) | 72,262 | 1,234,235 |
| General Motors Company (A) | 25,740 | 1,401,028 |
| Tesla, Inc. (A) | 6,138 | 6,837,732 |
| Distributors – 0.3% | |
| Genuine Parts Company | 6,332 | 830,189 |
| LKQ Corp. (A) | 10,468 | 576,577 |
| Pool Corp. | 1,291 | 665,072 |
| Diversified consumer services – 0.1% | |
| Bright Horizons Family Solutions, Inc. (A) | 1,708 | 283,528 |
| SEE NOTES TO FINANCIAL STATEMENTS | SEMIANNUAL REPORT | JOHN HANCOCK MULTIFACTOR ETFS | 47 |
MULTIFACTOR LARGE CAP ETF (continued)
| | Shares or
Principal
Amount | Value |
| Consumer discretionary (continued) | |
| Diversified consumer services (continued) | |
| Chegg, Inc. (A) | 1,931 | $114,779 |
| Service Corp. International | 8,498 | 582,028 |
| Hotels, restaurants and leisure – 2.0% | |
| Airbnb, Inc., Class A (A) | 641 | 109,393 |
| Aramark | 9,889 | 360,751 |
| Booking Holdings, Inc. (A) | 470 | 1,137,767 |
| Caesars Entertainment, Inc. (A) | 4,327 | 473,633 |
| Carnival Corp. (A) | 18,329 | 406,171 |
| Chipotle Mexican Grill, Inc. (A) | 570 | 1,014,047 |
| Churchill Downs, Inc. | 555 | 127,650 |
| Darden Restaurants, Inc. | 5,120 | 737,997 |
| Domino’s Pizza, Inc. | 1,191 | 582,363 |
| DraftKings, Inc., Class A (A) | 5,313 | 247,533 |
| Expedia Group, Inc. (A) | 4,305 | 707,785 |
| Hilton Worldwide Holdings, Inc. (A) | 7,692 | 1,107,263 |
| Hyatt Hotels Corp., Class A (A) | 1,289 | 109,823 |
| Las Vegas Sands Corp. (A) | 8,577 | 332,873 |
| Marriott International, Inc., Class A (A) | 6,065 | 970,521 |
| McDonald’s Corp. | 9,412 | 2,311,117 |
| MGM Resorts International | 17,840 | 841,334 |
| Norwegian Cruise Line Holdings, Ltd. (A) | 6,139 | 157,895 |
| Penn National Gaming, Inc. (A) | 3,623 | 259,407 |
| Royal Caribbean Cruises, Ltd. (A) | 6,442 | 543,898 |
| Starbucks Corp. | 15,737 | 1,669,224 |
| Vail Resorts, Inc. | 1,518 | 523,270 |
| Wynn Resorts, Ltd. (A) | 3,011 | 270,388 |
| Yum! Brands, Inc. | 7,475 | 933,927 |
| Household durables – 0.8% | |
| D.R. Horton, Inc. | 13,768 | 1,229,069 |
| Garmin, Ltd. | 5,481 | 787,072 |
| Lennar Corp., A Shares | 9,644 | 963,725 |
| Lennar Corp., B Shares | 470 | 38,578 |
| Mohawk Industries, Inc. (A) | 2,539 | 449,936 |
| Newell Brands, Inc. | 13,962 | 319,590 |
| NVR, Inc. (A) | 186 | 910,433 |
| PulteGroup, Inc. | 10,828 | 520,610 |
| Tempur Sealy International, Inc. | 2,215 | 98,501 |
| Whirlpool Corp. | 3,359 | 708,178 |
| Internet and direct marketing retail – 2.7% | |
| Amazon.com, Inc. (A) | 5,375 | 18,126,811 |
| Chewy, Inc., Class A (A)(B) | 1,207 | 91,491 |
| DoorDash, Inc., Class A (A) | 732 | 142,594 |
| eBay, Inc. | 19,388 | 1,487,447 |
| Etsy, Inc. (A) | 2,877 | 721,235 |
| Wayfair, Inc., Class A (A)(B) | 1,109 | 276,252 |
| Leisure products – 0.1% | |
| Hasbro, Inc. | 5,609 | 537,118 |
| Peloton Interactive, Inc., Class A (A) | 3,551 | 324,703 |
| YETI Holdings, Inc. (A) | 949 | 93,315 |
MULTIFACTOR LARGE CAP ETF (continued)
| | Shares or
Principal
Amount | Value |
| Consumer discretionary (continued) | |
| Multiline retail – 0.8% | |
| Dollar General Corp. | 6,486 | $1,436,779 |
| Dollar Tree, Inc. (A) | 9,516 | 1,025,444 |
| Kohl’s Corp. | 2,790 | 135,399 |
| Target Corp. | 13,159 | 3,416,340 |
| Specialty retail – 2.7% | |
| Advance Auto Parts, Inc. | 2,672 | 602,589 |
| AutoZone, Inc. (A) | 722 | 1,288,654 |
| Bath & Body Works, Inc. | 5,006 | 345,865 |
| Best Buy Company, Inc. | 13,813 | 1,688,501 |
| Burlington Stores, Inc. (A) | 2,025 | 559,487 |
| CarMax, Inc. (A) | 7,442 | 1,018,959 |
| Carvana Company (A) | 688 | 208,588 |
| Dick’s Sporting Goods, Inc. | 990 | 122,968 |
| Five Below, Inc. (A) | 1,464 | 288,847 |
| Floor & Decor Holdings, Inc., Class A (A) | 2,751 | 373,916 |
| Lithia Motors, Inc. | 713 | 227,604 |
| Lowe’s Companies, Inc. | 11,695 | 2,734,525 |
| O’Reilly Automotive, Inc. (A) | 2,142 | 1,333,009 |
| RH (A) | 433 | 285,620 |
| Ross Stores, Inc. | 10,409 | 1,178,299 |
| The Gap, Inc. | 11,640 | 264,112 |
| The Home Depot, Inc. | 12,092 | 4,495,080 |
| The TJX Companies, Inc. | 22,144 | 1,450,211 |
| Tractor Supply Company | 6,479 | 1,407,044 |
| Ulta Beauty, Inc. (A) | 2,521 | 926,115 |
| Williams-Sonoma, Inc. | 2,846 | 528,588 |
| Textiles, apparel and luxury goods – 0.7% | |
| Capri Holdings, Ltd. (A) | 1,448 | 77,092 |
| Crocs, Inc. (A) | 687 | 110,916 |
| Deckers Outdoor Corp. (A) | 763 | 301,622 |
| Levi Strauss & Company, Class A | 1,752 | 45,867 |
| Lululemon Athletica, Inc. (A) | 2,510 | 1,169,685 |
| NIKE, Inc., Class B | 18,261 | 3,054,883 |
| Ralph Lauren Corp. | 705 | 89,655 |
| Tapestry, Inc. | 5,050 | 196,849 |
| Under Armour, Inc., Class A (A) | 2,976 | 65,353 |
| Under Armour, Inc., Class C (A) | 2,998 | 56,602 |
| VF Corp. | 10,487 | 764,293 |
| Consumer staples – 5.2% | 40,387,947 |
| Beverages – 1.1% | |
| Brown-Forman Corp., Class A | 2,041 | 130,685 |
| Brown-Forman Corp., Class B | 6,250 | 424,313 |
| Constellation Brands, Inc., Class A | 4,124 | 894,124 |
| Keurig Dr. Pepper, Inc. | 9,606 | 346,681 |
| Molson Coors Beverage Company, Class B | 7,018 | 309,424 |
| Monster Beverage Corp. (A) | 7,627 | 648,295 |
| PepsiCo, Inc. | 19,138 | 3,092,701 |
| The Coca-Cola Company | 49,062 | 2,765,625 |
| 48 | JOHN HANCOCK MULTIFACTOR ETFS | SEMIANNUAL REPORT | SEE NOTES TO FINANCIAL STATEMENTS |
MULTIFACTOR LARGE CAP ETF (continued)
| | Shares or
Principal
Amount | Value |
| Consumer staples (continued) | |
| Food and staples retailing – 1.3% | |
| Albertsons Companies, Inc., Class A (B) | 2,740 | $84,803 |
| Casey’s General Stores, Inc. | 990 | 189,625 |
| Costco Wholesale Corp. | 6,245 | 3,069,667 |
| Sysco Corp. | 12,229 | 940,410 |
| The Kroger Company | 41,373 | 1,655,747 |
| U.S. Foods Holding Corp. (A) | 7,794 | 270,218 |
| Walgreens Boots Alliance, Inc. | 15,182 | 713,858 |
| Walmart, Inc. | 22,635 | 3,382,122 |
| Food products – 1.3% | |
| Archer-Daniels-Midland Company | 18,842 | 1,210,410 |
| Beyond Meat, Inc. (A)(B) | 591 | 58,497 |
| Bunge, Ltd. | 6,088 | 563,992 |
| Campbell Soup Company | 8,578 | 342,691 |
| Conagra Brands, Inc. | 17,873 | 575,511 |
| Darling Ingredients, Inc. (A) | 2,599 | 219,667 |
| General Mills, Inc. | 16,689 | 1,031,380 |
| Hormel Foods Corp. | 9,556 | 404,410 |
| Kellogg Company | 9,913 | 607,667 |
| Lamb Weston Holdings, Inc. | 5,189 | 292,919 |
| McCormick & Company, Inc. | 9,890 | 793,475 |
| Mondelez International, Inc., Class A | 22,938 | 1,393,254 |
| The Hershey Company | 4,598 | 806,259 |
| The J.M. Smucker Company | 4,009 | 492,546 |
| The Kraft Heinz Company | 12,206 | 438,073 |
| Tyson Foods, Inc., Class A | 8,928 | 713,972 |
| Household products – 1.0% | |
| Church & Dwight Company, Inc. | 8,291 | 724,302 |
| Colgate-Palmolive Company | 12,039 | 917,251 |
| Kimberly-Clark Corp. | 5,797 | 750,654 |
| The Clorox Company | 5,307 | 865,094 |
| The Procter & Gamble Company | 32,185 | 4,602,133 |
| Personal products – 0.1% | |
| The Estee Lauder Companies, Inc., Class A | 2,977 | 965,530 |
| Tobacco – 0.4% | |
| Altria Group, Inc. | 26,120 | 1,152,153 |
| Philip Morris International, Inc. | 16,372 | 1,547,809 |
| Energy – 2.8% | 22,314,953 |
| Energy equipment and services – 0.2% | |
| Baker Hughes Company | 13,679 | 343,069 |
| Halliburton Company | 23,522 | 587,815 |
| Schlumberger NV | 31,000 | 1,000,060 |
| Oil, gas and consumable fuels – 2.6% | |
| Cheniere Energy, Inc. (A) | 5,895 | 609,543 |
| Chevron Corp. | 27,283 | 3,123,631 |
| ConocoPhillips | 24,077 | 1,793,496 |
| Continental Resources, Inc. | 3,196 | 155,997 |
| Devon Energy Corp. | 8,036 | 322,083 |
| Diamondback Energy, Inc. | 5,291 | 567,142 |
MULTIFACTOR LARGE CAP ETF (continued)
| | Shares or
Principal
Amount | Value |
| Energy (continued) | |
| Oil, gas and consumable fuels (continued) | |
| EOG Resources, Inc. | 15,037 | $1,390,321 |
| Exxon Mobil Corp. | 56,565 | 3,646,746 |
| Hess Corp. | 9,623 | 794,571 |
| Kinder Morgan, Inc. | 46,950 | 786,413 |
| Marathon Oil Corp. | 20,400 | 332,928 |
| Marathon Petroleum Corp. | 19,548 | 1,288,800 |
| Occidental Petroleum Corp. | 23,095 | 774,375 |
| ONEOK, Inc. | 13,953 | 887,690 |
| Phillips 66 | 8,848 | 661,653 |
| Pioneer Natural Resources Company | 4,642 | 867,961 |
| Targa Resources Corp. | 2,172 | 118,743 |
| Texas Pacific Land Corp. | 107 | 136,283 |
| The Williams Companies, Inc. | 34,659 | 973,571 |
| Valero Energy Corp. | 14,898 | 1,152,062 |
| Financials – 13.3% | 103,938,387 |
| Banks – 4.3% | |
| Bank of America Corp. | 93,977 | 4,490,221 |
| Citigroup, Inc. | 34,862 | 2,411,056 |
| Citizens Financial Group, Inc. | 17,831 | 844,833 |
| Comerica, Inc. | 6,717 | 571,550 |
| Commerce Bancshares, Inc. | 3,820 | 269,348 |
| East West Bancorp, Inc. | 5,201 | 413,375 |
| Fifth Third Bancorp | 35,712 | 1,554,543 |
| First Citizens BancShares, Inc., Class A | 46 | 37,439 |
| First Horizon Corp. | 12,481 | 211,803 |
| First Republic Bank | 5,420 | 1,172,509 |
| Huntington Bancshares, Inc. | 42,212 | 664,417 |
| JPMorgan Chase & Co. | 42,402 | 7,203,676 |
| KeyCorp | 41,228 | 959,376 |
| M&T Bank Corp. | 5,186 | 762,964 |
| Regions Financial Corp. | 50,984 | 1,207,301 |
| Signature Bank | 1,862 | 554,541 |
| SVB Financial Group (A) | 1,944 | 1,394,626 |
| The PNC Financial Services Group, Inc. | 8,052 | 1,699,214 |
| Truist Financial Corp. | 27,756 | 1,761,673 |
| U.S. Bancorp | 25,451 | 1,536,477 |
| Wells Fargo & Company | 64,234 | 3,286,211 |
| Western Alliance Bancorp | 1,617 | 187,718 |
| Zions Bancorp NA | 7,585 | 477,779 |
| Capital markets – 3.8% | |
| Ameriprise Financial, Inc. | 5,455 | 1,648,119 |
| Apollo Global Management, Inc. | 4,027 | 309,878 |
| Ares Management Corp., Class A | 2,619 | 221,934 |
| BlackRock, Inc. | 1,590 | 1,500,101 |
| Cboe Global Markets, Inc. | 3,422 | 451,499 |
| CME Group, Inc. | 4,414 | 973,508 |
| FactSet Research Systems, Inc. | 1,446 | 641,865 |
| Franklin Resources, Inc. | 11,982 | 377,313 |
| Intercontinental Exchange, Inc. | 9,746 | 1,349,431 |
| SEE NOTES TO FINANCIAL STATEMENTS | SEMIANNUAL REPORT | JOHN HANCOCK MULTIFACTOR ETFS | 49 |
MULTIFACTOR LARGE CAP ETF (continued)
| | Shares or
Principal
Amount | Value |
| Financials (continued) | |
| Capital markets (continued) | |
| Invesco, Ltd. | 8,214 | $208,718 |
| Jefferies Financial Group, Inc. | 1,715 | 73,745 |
| KKR & Company, Inc. | 9,216 | 734,239 |
| LPL Financial Holdings, Inc. | 2,970 | 487,139 |
| MarketAxess Holdings, Inc. | 1,217 | 497,351 |
| Moody’s Corp. | 3,545 | 1,432,712 |
| Morgan Stanley | 25,414 | 2,612,051 |
| Morningstar, Inc. | 675 | 213,806 |
| MSCI, Inc. | 1,603 | 1,065,803 |
| Nasdaq, Inc. | 4,253 | 892,577 |
| Northern Trust Corp. | 8,548 | 1,051,746 |
| Raymond James Financial, Inc. | 7,437 | 733,214 |
| S&P Global, Inc. | 4,138 | 1,962,074 |
| SEI Investments Company | 6,249 | 393,937 |
| State Street Corp. | 12,274 | 1,209,603 |
| T. Rowe Price Group, Inc. | 6,140 | 1,331,643 |
| The Bank of New York Mellon Corp. | 24,416 | 1,445,427 |
| The Blackstone Group, Inc. | 7,312 | 1,012,127 |
| The Charles Schwab Corp. | 24,244 | 1,988,735 |
| The Goldman Sachs Group, Inc. | 5,437 | 2,247,384 |
| Tradeweb Markets, Inc., Class A | 1,611 | 143,540 |
| Consumer finance – 1.0% | |
| Ally Financial, Inc. | 22,924 | 1,094,392 |
| American Express Company | 11,127 | 1,933,650 |
| Capital One Financial Corp. | 13,207 | 1,994,653 |
| Credit Acceptance Corp. (A) | 74 | 44,268 |
| Discover Financial Services | 13,463 | 1,525,627 |
| Synchrony Financial | 24,928 | 1,157,906 |
| Upstart Holdings, Inc. (A) | 252 | 81,154 |
| Diversified financial services – 0.9% | |
| Berkshire Hathaway, Inc., Class B (A) | 22,010 | 6,317,090 |
| Equitable Holdings, Inc. | 14,996 | 502,366 |
| Voya Financial, Inc. | 5,705 | 398,038 |
| Insurance – 3.3% | |
| Aflac, Inc. | 21,992 | 1,180,311 |
| Alleghany Corp. (A) | 535 | 348,488 |
| American Financial Group, Inc. | 3,081 | 419,139 |
| American International Group, Inc. | 20,587 | 1,216,486 |
| Aon PLC, Class A | 5,721 | 1,830,262 |
| Arch Capital Group, Ltd. (A) | 14,068 | 588,324 |
| Arthur J. Gallagher & Company | 6,754 | 1,132,443 |
| Assurant, Inc. | 1,626 | 262,290 |
| Athene Holding, Ltd., Class A (A) | 5,563 | 484,037 |
| Brown & Brown, Inc. | 8,567 | 540,663 |
| Chubb, Ltd. | 6,054 | 1,182,831 |
| Cincinnati Financial Corp. | 5,817 | 706,416 |
| CNA Financial Corp. | 1,402 | 62,894 |
| Erie Indemnity Company, Class A | 878 | 180,701 |
| Everest Re Group, Ltd. | 1,707 | 446,381 |
MULTIFACTOR LARGE CAP ETF (continued)
| | Shares or
Principal
Amount | Value |
| Financials (continued) | |
| Insurance (continued) | |
| Fidelity National Financial, Inc. | 12,121 | $580,717 |
| Globe Life, Inc. | 4,600 | 409,492 |
| Lincoln National Corp. | 9,096 | 656,276 |
| Loews Corp. | 11,335 | 635,553 |
| Markel Corp. (A) | 437 | 573,838 |
| Marsh & McLennan Companies, Inc. | 9,545 | 1,592,106 |
| MetLife, Inc. | 14,478 | 909,218 |
| Principal Financial Group, Inc. | 12,892 | 864,924 |
| Prudential Financial, Inc. | 11,888 | 1,308,274 |
| Reinsurance Group of America, Inc. | 2,851 | 336,646 |
| RenaissanceRe Holdings, Ltd. | 1,009 | 143,076 |
| The Allstate Corp. | 11,917 | 1,473,775 |
| The Hartford Financial Services Group, Inc. | 19,033 | 1,388,077 |
| The Progressive Corp. | 13,660 | 1,296,061 |
| The Travelers Companies, Inc. | 10,716 | 1,723,990 |
| W.R. Berkley Corp. | 6,242 | 496,863 |
| Willis Towers Watson PLC | 4,205 | 1,018,787 |
| Thrifts and mortgage finance – 0.0% | |
| Rocket Companies, Inc., Class A | 973 | 16,035 |
| Health care – 12.8% | 100,450,237 |
| Biotechnology – 1.7% | |
| AbbVie, Inc. | 21,660 | 2,483,752 |
| Acceleron Pharma, Inc. (A) | 617 | 107,469 |
| Alnylam Pharmaceuticals, Inc. (A) | 2,144 | 342,097 |
| Amgen, Inc. | 9,232 | 1,910,747 |
| Biogen, Inc. (A) | 4,022 | 1,072,587 |
| Biohaven Pharmaceutical Holding Company, Ltd. (A) | 352 | 50,097 |
| BioMarin Pharmaceutical, Inc. (A) | 4,929 | 390,525 |
| Bridgebio Pharma, Inc. (A) | 557 | 27,505 |
| CRISPR Therapeutics AG (A) | 1,094 | 99,915 |
| Exact Sciences Corp. (A) | 2,676 | 254,809 |
| Gilead Sciences, Inc. | 21,970 | 1,425,414 |
| Horizon Therapeutics PLC (A) | 5,373 | 644,276 |
| Incyte Corp. (A) | 4,074 | 272,877 |
| Intellia Therapeutics, Inc. (A) | 389 | 51,729 |
| Mirati Therapeutics, Inc. (A) | 487 | 92,053 |
| Moderna, Inc. (A) | 3,464 | 1,195,807 |
| Natera, Inc. (A) | 732 | 83,865 |
| Neurocrine Biosciences, Inc. (A) | 1,740 | 183,413 |
| Novavax, Inc. (A) | 914 | 136,031 |
| Regeneron Pharmaceuticals, Inc. (A) | 1,567 | 1,002,786 |
| Seagen, Inc. (A) | 2,679 | 472,388 |
| United Therapeutics Corp. (A) | 360 | 68,674 |
| Vertex Pharmaceuticals, Inc. (A) | 3,510 | 649,104 |
| Health care equipment and supplies – 3.3% | |
| Abbott Laboratories | 24,393 | 3,144,014 |
| ABIOMED, Inc. (A) | 1,062 | 352,626 |
| Align Technology, Inc. (A) | 1,039 | 648,720 |
| 50 | JOHN HANCOCK MULTIFACTOR ETFS | SEMIANNUAL REPORT | SEE NOTES TO FINANCIAL STATEMENTS |
MULTIFACTOR LARGE CAP ETF (continued)
| | Shares or
Principal
Amount | Value |
| Health care (continued) | |
| Health care equipment and supplies (continued) | |
| Baxter International, Inc. | 10,109 | $798,207 |
| Becton, Dickinson and Company | 4,345 | 1,041,019 |
| Boston Scientific Corp. (A) | 22,235 | 958,996 |
| Danaher Corp. | 8,659 | 2,699,616 |
| Dentsply Sirona, Inc. | 8,006 | 458,023 |
| DexCom, Inc. (A) | 1,377 | 858,160 |
| Edwards Lifesciences Corp. (A) | 11,149 | 1,335,873 |
| Globus Medical, Inc., Class A (A) | 393 | 30,328 |
| Hill-Rom Holdings, Inc. | 2,348 | 363,705 |
| Hologic, Inc. (A) | 12,421 | 910,584 |
| IDEXX Laboratories, Inc. (A) | 2,172 | 1,446,856 |
| Insulet Corp. (A) | 1,199 | 371,714 |
| Intuitive Surgical, Inc. (A) | 4,042 | 1,459,687 |
| Masimo Corp. (A) | 1,242 | 352,157 |
| Medtronic PLC | 16,832 | 2,017,484 |
| Novocure, Ltd. (A) | 1,248 | 128,007 |
| Penumbra, Inc. (A) | 512 | 141,594 |
| ResMed, Inc. | 5,218 | 1,371,864 |
| STERIS PLC | 3,152 | 736,748 |
| Stryker Corp. | 4,521 | 1,202,902 |
| Teleflex, Inc. | 1,433 | 511,495 |
| The Cooper Companies, Inc. | 1,715 | 715,018 |
| West Pharmaceutical Services, Inc. | 2,246 | 965,510 |
| Zimmer Biomet Holdings, Inc. | 7,127 | 1,020,016 |
| Health care providers and services – 3.1% | |
| agilon health, Inc. (A) | 475 | 11,638 |
| AmerisourceBergen Corp. | 5,911 | 721,260 |
| Anthem, Inc. | 5,015 | 2,182,177 |
| Cardinal Health, Inc. | 11,844 | 566,262 |
| Centene Corp. (A) | 15,109 | 1,076,365 |
| Cigna Corp. | 8,073 | 1,724,474 |
| CVS Health Corp. | 22,535 | 2,011,925 |
| DaVita, Inc. (A) | 4,061 | 419,258 |
| Encompass Health Corp. | 3,262 | 207,333 |
| Guardant Health, Inc. (A) | 1,554 | 181,492 |
| HCA Healthcare, Inc. | 4,552 | 1,140,094 |
| Henry Schein, Inc. (A) | 7,248 | 553,385 |
| Humana, Inc. | 3,395 | 1,572,428 |
| Laboratory Corp. of America Holdings (A) | 5,187 | 1,488,773 |
| McKesson Corp. | 6,198 | 1,288,440 |
| Molina Healthcare, Inc. (A) | 2,486 | 735,160 |
| Oak Street Health, Inc. (A)(B) | 257 | 12,138 |
| Quest Diagnostics, Inc. | 8,659 | 1,270,968 |
| UnitedHealth Group, Inc. | 14,399 | 6,630,308 |
| Universal Health Services, Inc., Class B | 4,914 | 609,827 |
| Health care technology – 0.2% | |
| Cerner Corp. | 12,557 | 932,860 |
| Doximity, Inc., Class A (A) | 166 | 11,534 |
| Teladoc Health, Inc. (A) | 2,036 | 304,565 |
MULTIFACTOR LARGE CAP ETF (continued)
| | Shares or
Principal
Amount | Value |
| Health care (continued) | |
| Health care technology (continued) | |
| Veeva Systems, Inc., Class A (A) | 2,021 | $640,677 |
| Life sciences tools and services – 1.7% | |
| 10X Genomics, Inc., Class A (A) | 940 | 151,594 |
| Agilent Technologies, Inc. | 7,264 | 1,144,007 |
| Avantor, Inc. (A) | 14,015 | 565,926 |
| Bio-Rad Laboratories, Inc., Class A (A) | 705 | 560,249 |
| Bio-Techne Corp. | 969 | 507,417 |
| Bruker Corp. | 3,123 | 250,777 |
| Charles River Laboratories International, Inc. (A) | 1,573 | 705,774 |
| Illumina, Inc. (A) | 2,545 | 1,056,328 |
| IQVIA Holdings, Inc. (A) | 5,154 | 1,347,359 |
| Maravai LifeSciences Holdings, Inc., Class A (A) | 651 | 27,531 |
| Mettler-Toledo International, Inc. (A) | 1,019 | 1,509,017 |
| PerkinElmer, Inc. | 4,481 | 792,644 |
| PPD, Inc. (A) | 2,181 | 102,878 |
| Repligen Corp. (A) | 764 | 221,942 |
| Syneos Health, Inc. (A) | 2,268 | 211,695 |
| Thermo Fisher Scientific, Inc. | 5,557 | 3,517,970 |
| Waters Corp. (A) | 2,492 | 915,935 |
| Pharmaceuticals – 2.8% | |
| Bristol-Myers Squibb Company | 30,567 | 1,785,113 |
| Catalent, Inc. (A) | 5,240 | 722,386 |
| Elanco Animal Health, Inc. (A) | 13,018 | 428,032 |
| Eli Lilly & Company | 11,212 | 2,856,369 |
| Jazz Pharmaceuticals PLC (A) | 2,198 | 292,422 |
| Johnson & Johnson | 36,815 | 5,996,427 |
| Merck & Company, Inc. | 36,893 | 3,248,429 |
| Organon & Company | 4,301 | 158,062 |
| Pfizer, Inc. | 84,777 | 3,708,146 |
| Royalty Pharma PLC, Class A | 4,146 | 163,891 |
| Viatris, Inc. | 29,252 | 390,514 |
| Zoetis, Inc. | 8,137 | 1,759,219 |
| Industrials – 11.1% | 86,756,466 |
| Aerospace and defense – 1.4% | |
| Axon Enterprise, Inc. (A) | 629 | 113,195 |
| General Dynamics Corp. | 4,592 | 931,028 |
| HEICO Corp. | 1,058 | 147,475 |
| HEICO Corp., Class A | 1,927 | 242,185 |
| Howmet Aerospace, Inc. | 14,979 | 444,727 |
| Huntington Ingalls Industries, Inc. | 1,758 | 356,399 |
| L3Harris Technologies, Inc. | 3,969 | 915,013 |
| Lockheed Martin Corp. | 3,532 | 1,173,754 |
| Northrop Grumman Corp. | 2,945 | 1,052,013 |
| Raytheon Technologies Corp. | 25,898 | 2,301,296 |
| Textron, Inc. | 10,589 | 781,998 |
| The Boeing Company (A) | 6,359 | 1,316,504 |
| TransDigm Group, Inc. (A) | 1,315 | 820,323 |
| SEE NOTES TO FINANCIAL STATEMENTS | SEMIANNUAL REPORT | JOHN HANCOCK MULTIFACTOR ETFS | 51 |
MULTIFACTOR LARGE CAP ETF (continued)
| | Shares or
Principal
Amount | Value |
| Industrials (continued) | |
| Air freight and logistics – 0.6% | |
| C.H. Robinson Worldwide, Inc. | 5,944 | $576,509 |
| Expeditors International of Washington, Inc. | 6,973 | 859,492 |
| FedEx Corp. | 4,934 | 1,162,105 |
| GXO Logistics, Inc. (A) | 3,843 | 341,258 |
| United Parcel Service, Inc., Class B | 8,682 | 1,853,347 |
| Airlines – 0.1% | |
| American Airlines Group, Inc. (A) | 5,451 | 104,659 |
| Delta Air Lines, Inc. (A) | 4,643 | 181,681 |
| Southwest Airlines Company (A) | 6,914 | 326,894 |
| United Airlines Holdings, Inc. (A) | 4,082 | 188,343 |
| Building products – 1.0% | |
| A.O. Smith Corp. | 4,610 | 336,853 |
| Advanced Drainage Systems, Inc. | 486 | 54,821 |
| Allegion PLC | 4,714 | 604,806 |
| Builders FirstSource, Inc. (A) | 3,703 | 215,774 |
| Carlisle Companies, Inc. | 2,580 | 575,134 |
| Carrier Global Corp. | 25,625 | 1,338,394 |
| Fortune Brands Home & Security, Inc. | 5,666 | 574,532 |
| Johnson Controls International PLC | 18,315 | 1,343,772 |
| Lennox International, Inc. | 1,279 | 382,779 |
| Masco Corp. | 9,675 | 634,196 |
| Owens Corning | 4,950 | 462,380 |
| Trane Technologies PLC | 5,699 | 1,031,120 |
| Trex Company, Inc. (A) | 2,539 | 270,150 |
| Commercial services and supplies – 0.7% | |
| Cintas Corp. | 2,135 | 924,669 |
| Copart, Inc. (A) | 8,225 | 1,277,260 |
| Republic Services, Inc. | 11,500 | 1,547,900 |
| Rollins, Inc. | 7,635 | 268,981 |
| Waste Management, Inc. | 10,902 | 1,746,827 |
| Construction and engineering – 0.1% | |
| AECOM (A) | 4,081 | 279,018 |
| Quanta Services, Inc. | 4,376 | 530,721 |
| Electrical equipment – 0.9% | |
| AMETEK, Inc. | 8,706 | 1,152,674 |
| Eaton Corp. PLC | 9,117 | 1,502,117 |
| Emerson Electric Company | 13,107 | 1,271,510 |
| Generac Holdings, Inc. (A) | 1,275 | 635,664 |
| Hubbell, Inc. | 2,059 | 410,503 |
| Plug Power, Inc. (A) | 7,605 | 291,043 |
| Rockwell Automation, Inc. | 5,108 | 1,631,495 |
| Sensata Technologies Holding PLC (A) | 6,277 | 345,863 |
| Sunrun, Inc. (A) | 2,634 | 151,929 |
| Industrial conglomerates – 0.8% | |
| 3M Company | 8,620 | 1,540,222 |
| General Electric Company | 12,510 | 1,311,924 |
| Honeywell International, Inc. | 10,221 | 2,234,515 |
| Roper Technologies, Inc. | 2,201 | 1,073,802 |
MULTIFACTOR LARGE CAP ETF (continued)
| | Shares or
Principal
Amount | Value |
| Industrials (continued) | |
| Machinery – 2.5% | |
| AGCO Corp. | 1,144 | $139,808 |
| Caterpillar, Inc. | 9,634 | 1,965,432 |
| Cummins, Inc. | 5,884 | 1,411,219 |
| Deere & Company | 5,177 | 1,772,139 |
| Donaldson Company, Inc. | 4,980 | 298,850 |
| Dover Corp. | 6,893 | 1,165,468 |
| Fortive Corp. | 10,186 | 771,182 |
| Graco, Inc. | 5,213 | 391,913 |
| IDEX Corp. | 2,722 | 605,836 |
| Illinois Tool Works, Inc. | 6,655 | 1,516,475 |
| Ingersoll Rand, Inc. (A) | 11,397 | 612,703 |
| ITT, Inc. | 732 | 68,859 |
| Lincoln Electric Holdings, Inc. | 2,195 | 312,568 |
| Nordson Corp. | 1,680 | 427,073 |
| Otis Worldwide Corp. | 10,024 | 805,027 |
| PACCAR, Inc. | 16,140 | 1,446,467 |
| Parker-Hannifin Corp. | 5,748 | 1,704,799 |
| Pentair PLC | 6,321 | 467,564 |
| Snap-on, Inc. | 2,322 | 471,900 |
| Stanley Black & Decker, Inc. | 6,446 | 1,158,540 |
| The Middleby Corp. (A) | 1,045 | 190,650 |
| The Toro Company | 3,612 | 344,838 |
| Wabtec Corp. | 5,575 | 505,820 |
| Woodward, Inc. | 1,086 | 122,664 |
| Xylem, Inc. | 5,950 | 777,011 |
| Professional services – 1.0% | |
| Booz Allen Hamilton Holding Corp. | 4,549 | 395,126 |
| Clarivate PLC (A) | 3,345 | 78,440 |
| CoStar Group, Inc. (A) | 9,610 | 826,941 |
| Dun & Bradstreet Holdings, Inc. (A) | 2,501 | 47,119 |
| Equifax, Inc. | 4,439 | 1,231,512 |
| IHS Markit, Ltd. | 8,034 | 1,050,204 |
| Jacobs Engineering Group, Inc. | 4,687 | 658,149 |
| Leidos Holdings, Inc. | 5,315 | 531,394 |
| Nielsen Holdings PLC | 12,073 | 244,478 |
| Robert Half International, Inc. | 4,970 | 561,958 |
| TransUnion | 6,646 | 766,217 |
| Verisk Analytics, Inc. | 5,499 | 1,156,275 |
| Road and rail – 1.5% | |
| AMERCO | 374 | 275,634 |
| CSX Corp. | 46,520 | 1,682,628 |
| J.B. Hunt Transport Services, Inc. | 4,712 | 929,159 |
| Kansas City Southern | 3,631 | 1,126,518 |
| Knight-Swift Transportation Holdings, Inc. | 3,734 | 211,680 |
| Lyft, Inc., Class A (A) | 4,228 | 193,938 |
| Norfolk Southern Corp. | 6,788 | 1,989,223 |
| Old Dominion Freight Line, Inc. | 3,585 | 1,223,740 |
| TuSimple Holdings, Inc., Class A (A) | 362 | 14,161 |
| Uber Technologies, Inc. (A) | 14,777 | 647,528 |
| 52 | JOHN HANCOCK MULTIFACTOR ETFS | SEMIANNUAL REPORT | SEE NOTES TO FINANCIAL STATEMENTS |
MULTIFACTOR LARGE CAP ETF (continued)
| | Shares or
Principal
Amount | Value |
| Industrials (continued) | |
| Road and rail (continued) | |
| Union Pacific Corp. | 11,598 | $2,799,757 |
| XPO Logistics, Inc. (A) | 4,140 | 355,212 |
| Trading companies and distributors – 0.5% | |
| Fastenal Company | 21,209 | 1,210,610 |
| SiteOne Landscape Supply, Inc. (A) | 435 | 102,208 |
| United Rentals, Inc. (A) | 4,153 | 1,574,444 |
| W.W. Grainger, Inc. | 2,126 | 984,572 |
| Watsco, Inc. | 999 | 289,290 |
| Information technology – 24.5% | 191,798,247 |
| Communications equipment – 0.9% | |
| Arista Networks, Inc. (A) | 1,704 | 698,112 |
| Ciena Corp. (A) | 4,440 | 241,048 |
| Cisco Systems, Inc. | 65,462 | 3,663,908 |
| F5 Networks, Inc. (A) | 2,512 | 530,409 |
| Juniper Networks, Inc. | 15,411 | 454,933 |
| Motorola Solutions, Inc. | 5,490 | 1,364,759 |
| Ubiquiti, Inc. | 285 | 87,076 |
| Electronic equipment, instruments and components – 1.3% | |
| Amphenol Corp., Class A | 21,692 | 1,665,295 |
| Arrow Electronics, Inc. (A) | 4,404 | 509,763 |
| CDW Corp. | 5,208 | 972,073 |
| Cognex Corp. | 4,707 | 412,286 |
| Corning, Inc. | 33,779 | 1,201,519 |
| Flex, Ltd. (A) | 29,586 | 500,003 |
| IPG Photonics Corp. (A) | 1,117 | 177,614 |
| Jabil, Inc. | 1,776 | 106,489 |
| Keysight Technologies, Inc. (A) | 7,251 | 1,305,325 |
| TE Connectivity, Ltd. | 8,547 | 1,247,862 |
| Teledyne Technologies, Inc. (A) | 1,171 | 526,037 |
| Trimble, Inc. (A) | 8,658 | 756,449 |
| Zebra Technologies Corp., Class A (A) | 1,858 | 992,079 |
| IT services – 4.5% | |
| Accenture PLC, Class A | 9,433 | 3,384,466 |
| Affirm Holdings, Inc. (A) | 789 | 128,213 |
| Akamai Technologies, Inc. (A) | 6,683 | 704,789 |
| Amdocs, Ltd. | 6,531 | 508,373 |
| Automatic Data Processing, Inc. | 6,593 | 1,480,063 |
| Broadridge Financial Solutions, Inc. | 4,262 | 760,383 |
| Cloudflare, Inc., Class A (A) | 3,181 | 619,404 |
| Cognizant Technology Solutions Corp., Class A | 16,902 | 1,319,877 |
| Concentrix Corp. | 507 | 90,084 |
| DXC Technology Company (A) | 2,022 | 65,857 |
| EPAM Systems, Inc. (A) | 1,480 | 996,395 |
| Fidelity National Information Services, Inc. | 8,308 | 920,028 |
| Fiserv, Inc. (A) | 7,561 | 744,683 |
| FleetCor Technologies, Inc. (A) | 3,160 | 781,816 |
| Gartner, Inc. (A) | 3,472 | 1,152,392 |
| Genpact, Ltd. | 6,331 | 312,435 |
MULTIFACTOR LARGE CAP ETF (continued)
| | Shares or
Principal
Amount | Value |
| Information technology (continued) | |
| IT services (continued) | |
| Global Payments, Inc. | 5,851 | $836,634 |
| Globant SA (A) | 316 | 100,864 |
| GoDaddy, Inc., Class A (A) | 3,829 | 264,852 |
| IBM Corp. | 15,708 | 1,965,071 |
| Jack Henry & Associates, Inc. | 2,871 | 477,964 |
| Mastercard, Inc., Class A | 11,884 | 3,987,320 |
| MongoDB, Inc. (A) | 869 | 453,001 |
| Okta, Inc. (A) | 2,156 | 532,920 |
| Paychex, Inc. | 11,616 | 1,432,020 |
| PayPal Holdings, Inc. (A) | 13,138 | 3,055,767 |
| Snowflake, Inc., Class A (A) | 686 | 242,734 |
| Square, Inc., Class A (A) | 3,119 | 793,786 |
| The Western Union Company | 17,175 | 312,929 |
| Twilio, Inc., Class A (A) | 2,612 | 761,032 |
| VeriSign, Inc. (A) | 3,320 | 739,264 |
| Visa, Inc., Class A | 22,466 | 4,757,625 |
| WEX, Inc. (A) | 1,199 | 179,490 |
| Semiconductors and semiconductor equipment – 5.0% | |
| Advanced Micro Devices, Inc. (A) | 13,839 | 1,663,863 |
| Analog Devices, Inc. | 9,211 | 1,598,016 |
| Applied Materials, Inc. | 16,771 | 2,291,757 |
| Broadcom, Inc. | 5,744 | 3,053,912 |
| Enphase Energy, Inc. (A) | 2,343 | 542,709 |
| Entegris, Inc. | 4,242 | 597,189 |
| First Solar, Inc. (A) | 2,483 | 296,942 |
| Intel Corp. | 68,835 | 3,372,915 |
| KLA Corp. | 4,938 | 1,840,689 |
| Lam Research Corp. | 3,179 | 1,791,589 |
| Lattice Semiconductor Corp. (A) | 1,064 | 73,884 |
| Marvell Technology, Inc. | 21,155 | 1,449,118 |
| Microchip Technology, Inc. | 17,775 | 1,316,950 |
| Micron Technology, Inc. | 19,284 | 1,332,524 |
| MKS Instruments, Inc. | 1,278 | 191,764 |
| Monolithic Power Systems, Inc. | 1,090 | 572,751 |
| NVIDIA Corp. | 23,965 | 6,127,132 |
| NXP Semiconductors NV | 1,128 | 226,570 |
| ON Semiconductor Corp. (A) | 15,890 | 763,832 |
| Qorvo, Inc. (A) | 4,374 | 735,838 |
| QUALCOMM, Inc. | 18,264 | 2,429,843 |
| Skyworks Solutions, Inc. | 7,285 | 1,217,542 |
| SolarEdge Technologies, Inc. (A) | 999 | 354,325 |
| Teradyne, Inc. | 7,029 | 971,689 |
| Texas Instruments, Inc. | 14,808 | 2,776,204 |
| Universal Display Corp. | 1,032 | 189,062 |
| Wolfspeed, Inc. (A) | 2,589 | 310,965 |
| Xilinx, Inc. | 8,031 | 1,445,580 |
| Software – 8.6% | |
| Adobe, Inc. (A) | 5,050 | 3,284,318 |
| Anaplan, Inc. (A) | 1,888 | 123,116 |
| SEE NOTES TO FINANCIAL STATEMENTS | SEMIANNUAL REPORT | JOHN HANCOCK MULTIFACTOR ETFS | 53 |
MULTIFACTOR LARGE CAP ETF (continued)
| | Shares or
Principal
Amount | Value |
| Information technology (continued) | |
| Software (continued) | |
| ANSYS, Inc. (A) | 2,848 | $1,081,044 |
| Appian Corp. (A)(B) | 199 | 19,783 |
| Asana, Inc., Class A (A) | 405 | 54,999 |
| Aspen Technology, Inc. (A) | 2,208 | 345,972 |
| Atlassian Corp. PLC, Class A (A) | 1,579 | 723,387 |
| Autodesk, Inc. (A) | 3,423 | 1,087,179 |
| Avalara, Inc. (A) | 1,804 | 324,071 |
| Bentley Systems, Inc., Class B | 1,123 | 66,425 |
| Bill.com Holdings, Inc. (A) | 1,174 | 345,520 |
| Black Knight, Inc. (A) | 4,314 | 302,455 |
| Cadence Design Systems, Inc. (A) | 7,145 | 1,236,871 |
| Ceridian HCM Holding, Inc. (A) | 3,444 | 431,361 |
| Citrix Systems, Inc. | 5,141 | 487,007 |
| Coupa Software, Inc. (A) | 1,067 | 242,956 |
| Crowdstrike Holdings, Inc., Class A (A) | 1,585 | 446,653 |
| Datadog, Inc., Class A (A) | 2,621 | 437,838 |
| DocuSign, Inc. (A) | 1,708 | 475,319 |
| Dolby Laboratories, Inc., Class A | 2,118 | 187,125 |
| Dropbox, Inc., Class A (A) | 7,551 | 230,230 |
| Dynatrace, Inc. (A) | 2,637 | 197,775 |
| Elastic NV (A) | 1,097 | 190,340 |
| Fair Isaac Corp. (A) | 853 | 339,665 |
| Five9, Inc. (A) | 858 | 135,573 |
| Fortinet, Inc. (A) | 3,185 | 1,071,243 |
| Guidewire Software, Inc. (A) | 2,596 | 326,395 |
| HubSpot, Inc. (A) | 824 | 667,630 |
| Intuit, Inc. | 3,911 | 2,448,247 |
| Manhattan Associates, Inc. (A) | 1,280 | 232,371 |
| McAfee Corp., Class A | 693 | 14,809 |
| Microsoft Corp. | 100,132 | 33,205,762 |
| NortonLifeLock, Inc. | 22,132 | 563,259 |
| Nuance Communications, Inc. (A) | 7,131 | 392,562 |
| Oracle Corp. | 27,531 | 2,641,324 |
| Palantir Technologies, Inc., Class A (A) | 5,099 | 131,962 |
| Palo Alto Networks, Inc. (A) | 1,890 | 962,180 |
| Paycom Software, Inc. (A) | 1,341 | 734,667 |
| Paylocity Holding Corp. (A) | 791 | 241,366 |
| Pegasystems, Inc. | 832 | 98,775 |
| PTC, Inc. (A) | 3,052 | 388,672 |
| Qualtrics International, Inc., Class A (A) | 976 | 45,208 |
| RingCentral, Inc., Class A (A) | 1,288 | 313,989 |
| salesforce.com, Inc. (A) | 9,922 | 2,973,524 |
| SentinelOne, Inc., Class A (A) | 246 | 16,334 |
| ServiceNow, Inc. (A) | 1,885 | 1,315,278 |
| Smartsheet, Inc., Class A (A) | 2,637 | 181,979 |
| Splunk, Inc. (A) | 3,400 | 560,388 |
| SS&C Technologies Holdings, Inc. | 8,319 | 661,111 |
| Synopsys, Inc. (A) | 3,908 | 1,302,067 |
| The Trade Desk, Inc., Class A (A) | 7,905 | 592,164 |
| Tyler Technologies, Inc. (A) | 1,234 | 670,333 |
MULTIFACTOR LARGE CAP ETF (continued)
| | Shares or
Principal
Amount | Value |
| Information technology (continued) | |
| Software (continued) | |
| Unity Software, Inc. (A) | 1,198 | $181,269 |
| VMware, Inc., Class A (A)(B) | 1,409 | 213,745 |
| Workday, Inc., Class A (A) | 2,361 | 684,643 |
| Zendesk, Inc. (A) | 2,157 | 219,583 |
| Zoom Video Communications, Inc., Class A (A) | 1,040 | 285,636 |
| Zscaler, Inc. (A) | 1,108 | 353,297 |
| Technology hardware, storage and peripherals – 4.2% | |
| Apple, Inc. | 183,753 | 27,526,199 |
| Dell Technologies, Inc., Class C (A) | 3,950 | 434,461 |
| Hewlett Packard Enterprise Company | 44,802 | 656,349 |
| HP, Inc. | 33,835 | 1,026,216 |
| NetApp, Inc. | 11,252 | 1,004,804 |
| Seagate Technology Holdings PLC | 12,866 | 1,145,975 |
| Western Digital Corp. (A) | 13,478 | 704,765 |
| Materials – 3.8% | 29,686,541 |
| Chemicals – 2.2% | |
| Air Products & Chemicals, Inc. | 4,311 | 1,292,481 |
| Albemarle Corp. | 4,005 | 1,003,132 |
| Celanese Corp. | 5,592 | 903,164 |
| CF Industries Holdings, Inc. | 10,891 | 618,609 |
| Corteva, Inc. | 22,664 | 977,952 |
| Dow, Inc. | 15,583 | 872,181 |
| DuPont de Nemours, Inc. | 12,516 | 871,114 |
| Eastman Chemical Company | 6,968 | 724,881 |
| Ecolab, Inc. | 4,912 | 1,091,545 |
| FMC Corp. | 5,072 | 461,603 |
| International Flavors & Fragrances, Inc. | 6,102 | 899,740 |
| Linde PLC | 5,975 | 1,907,220 |
| LyondellBasell Industries NV, Class A | 9,645 | 895,249 |
| PPG Industries, Inc. | 8,811 | 1,414,782 |
| RPM International, Inc. | 5,283 | 460,678 |
| The Mosaic Company | 12,638 | 525,362 |
| The Scotts Miracle-Gro Company | 1,031 | 153,062 |
| The Sherwin-Williams Company | 5,561 | 1,760,668 |
| Westlake Chemical Corp. | 1,418 | 138,028 |
| Construction materials – 0.2% | |
| Martin Marietta Materials, Inc. | 2,246 | 882,319 |
| Vulcan Materials Company | 4,557 | 866,377 |
| Containers and packaging – 0.8% | |
| Amcor PLC | 51,753 | 624,659 |
| AptarGroup, Inc. | 2,242 | 270,789 |
| Avery Dennison Corp. | 3,120 | 679,286 |
| Ball Corp. | 13,070 | 1,195,644 |
| Berry Global Group, Inc. (A) | 5,564 | 364,665 |
| Crown Holdings, Inc. | 5,430 | 564,666 |
| International Paper Company | 20,308 | 1,008,698 |
| Packaging Corp. of America | 4,344 | 596,735 |
| Sealed Air Corp. | 1,199 | 71,125 |
| 54 | JOHN HANCOCK MULTIFACTOR ETFS | SEMIANNUAL REPORT | SEE NOTES TO FINANCIAL STATEMENTS |
MULTIFACTOR LARGE CAP ETF (continued)
| | Shares or
Principal
Amount | Value |
| Materials (continued) | |
| Containers and packaging (continued) | |
| Westrock Company | 10,123 | $486,916 |
| Metals and mining – 0.6% | |
| Alcoa Corp. | 2,151 | 98,838 |
| Cleveland-Cliffs, Inc. (A) | 5,298 | 127,735 |
| Freeport-McMoRan, Inc. | 30,030 | 1,132,732 |
| Newmont Corp. | 17,803 | 961,362 |
| Nucor Corp. | 13,624 | 1,521,120 |
| Reliance Steel & Aluminum Company | 3,004 | 439,065 |
| Southern Copper Corp. | 2,233 | 133,958 |
| Steel Dynamics, Inc. | 9,634 | 636,615 |
| Paper and forest products – 0.0% | |
| Sylvamo Corp. (A) | 1,839 | 51,786 |
| Real estate – 3.2% | 25,363,694 |
| Equity real estate investment trusts – 2.9% | |
| Alexandria Real Estate Equities, Inc. | 3,211 | 655,494 |
| American Homes 4 Rent, Class A | 6,505 | 264,103 |
| American Tower Corp. | 5,137 | 1,448,480 |
| Americold Realty Trust | 3,514 | 103,558 |
| AvalonBay Communities, Inc. | 3,555 | 841,397 |
| Boston Properties, Inc. | 4,074 | 462,969 |
| Camden Property Trust | 2,457 | 400,737 |
| Crown Castle International Corp. | 5,460 | 984,438 |
| CubeSmart | 3,968 | 218,280 |
| CyrusOne, Inc. | 2,205 | 180,854 |
| Digital Realty Trust, Inc. | 4,993 | 787,945 |
| Duke Realty Corp. | 9,605 | 540,185 |
| Equinix, Inc. | 1,147 | 960,119 |
| Equity LifeStyle Properties, Inc. | 4,289 | 362,463 |
| Equity Residential | 8,301 | 717,206 |
| Essex Property Trust, Inc. | 1,724 | 586,039 |
| Extra Space Storage, Inc. | 3,255 | 642,439 |
| Federal Realty Investment Trust | 1,932 | 232,516 |
| Gaming and Leisure Properties, Inc. | 5,341 | 258,985 |
| Healthpeak Properties, Inc. | 12,598 | 447,355 |
| Host Hotels & Resorts, Inc. (A) | 18,875 | 317,666 |
| Invitation Homes, Inc. | 12,657 | 522,101 |
| Iron Mountain, Inc. | 7,352 | 335,545 |
| Kilroy Realty Corp. | 2,686 | 180,983 |
| Kimco Realty Corp. | 6,091 | 137,657 |
| Lamar Advertising Company, Class A | 2,132 | 241,342 |
| Life Storage, Inc. | 454 | 60,750 |
| Medical Properties Trust, Inc. | 11,758 | 250,798 |
| MGM Growth Properties LLC, Class A | 3,035 | 119,518 |
| Mid-America Apartment Communities, Inc. | 2,891 | 590,371 |
| National Retail Properties, Inc. | 4,162 | 188,788 |
| Omega Healthcare Investors, Inc. | 5,237 | 153,758 |
| Prologis, Inc. | 9,307 | 1,349,143 |
| Public Storage | 1,992 | 661,703 |
| Realty Income Corp. | 8,239 | 588,512 |
MULTIFACTOR LARGE CAP ETF (continued)
| | Shares or
Principal
Amount | Value |
| Real estate (continued) | |
| Equity real estate investment trusts (continued) | |
| Regency Centers Corp. | 3,976 | $279,950 |
| Rexford Industrial Realty, Inc. | 1,041 | 69,955 |
| SBA Communications Corp. | 2,298 | 793,568 |
| Simon Property Group, Inc. | 5,976 | 875,962 |
| STORE Capital Corp. | 4,831 | 165,848 |
| Sun Communities, Inc. | 2,482 | 486,422 |
| UDR, Inc. | 7,295 | 405,091 |
| Ventas, Inc. | 9,263 | 494,366 |
| VEREIT, Inc. | 5,404 | 271,821 |
| VICI Properties, Inc. | 11,820 | 346,917 |
| Vornado Realty Trust | 4,655 | 198,443 |
| Welltower, Inc. | 9,249 | 743,620 |
| Weyerhaeuser Company | 25,402 | 907,359 |
| WP Carey, Inc. | 4,058 | 312,912 |
| Real estate management and development – 0.3% | |
| CBRE Group, Inc., Class A (A) | 15,726 | 1,636,762 |
| Jones Lang LaSalle, Inc. (A) | 2,248 | 580,501 |
| Utilities – 3.4% | 26,235,711 |
| Electric utilities – 1.9% | |
| Alliant Energy Corp. | 9,092 | 514,334 |
| American Electric Power Company, Inc. | 13,538 | 1,146,804 |
| Avangrid, Inc. | 1,835 | 96,705 |
| Duke Energy Corp. | 13,675 | 1,394,987 |
| Edison International | 16,213 | 1,020,284 |
| Entergy Corp. | 10,164 | 1,047,095 |
| Evergy, Inc. | 10,100 | 643,875 |
| Eversource Energy | 11,962 | 1,015,574 |
| Exelon Corp. | 27,616 | 1,468,895 |
| FirstEnergy Corp. | 19,258 | 742,011 |
| NextEra Energy, Inc. | 19,475 | 1,661,802 |
| NRG Energy, Inc. | 8,365 | 333,680 |
| Pinnacle West Capital Corp. | 5,263 | 339,411 |
| PPL Corp. | 35,751 | 1,029,629 |
| The Southern Company | 20,268 | 1,263,102 |
| Xcel Energy, Inc. | 14,833 | 958,063 |
| Gas utilities – 0.1% | |
| Atmos Energy Corp. | 4,119 | 379,442 |
| UGI Corp. | 9,364 | 406,491 |
| Independent power and renewable electricity producers –0.1% | |
| Brookfield Renewable Corp., Class A | 2,106 | 87,209 |
| The AES Corp. | 30,336 | 762,344 |
| Vistra Corp. | 13,271 | 259,979 |
| Multi-utilities – 1.1% | |
| Ameren Corp. | 11,627 | 980,040 |
| CenterPoint Energy, Inc. | 23,070 | 600,743 |
| CMS Energy Corp. | 10,932 | 659,746 |
| Consolidated Edison, Inc. | 14,266 | 1,075,656 |
| SEE NOTES TO FINANCIAL STATEMENTS | SEMIANNUAL REPORT | JOHN HANCOCK MULTIFACTOR ETFS | 55 |
MULTIFACTOR LARGE CAP ETF (continued)
| | Shares or
Principal
Amount | Value |
| Utilities (continued) | |
| Multi-utilities (continued) | |
| Dominion Energy, Inc. | 9,875 | $749,809 |
| DTE Energy Company | 8,506 | 964,155 |
| NiSource, Inc. | 18,314 | 451,806 |
| Public Service Enterprise Group, Inc. | 19,834 | 1,265,409 |
| Sempra Energy | 5,857 | 747,529 |
| WEC Energy Group, Inc. | 10,182 | 916,991 |
| Water utilities – 0.2% | |
| American Water Works Company, Inc. | 5,705 | 993,697 |
| Essential Utilities, Inc. | 5,490 | 258,414 |
|
| SHORT-TERM INVESTMENTS – 0.2% | | $1,081,714 |
| (Cost $1,081,741) | | |
| Short-term funds – 0.2% | 1,081,714 |
| John Hancock Collateral Trust, 0.0370% (C)(D) | 72,878 | 729,191 |
|
| State Street Institutional U.S. Government Money Market Fund, Premier Class, 0.0250% (C) | 352,523 | 352,523 |
| Total investments (Multifactor Large Cap ETF) (Cost $580,949,813) 100.1% | $782,890,731 |
| Other assets and liabilities, net (0.1%) | | (521,845) |
| Total net assets 100.0% | | $782,368,886 |
| The percentage shown for each investment category is the total value of the category as a percentage of the net assets of the fund. |
| Security Abbreviations and Legend |
| (A) | Non-income producing security. |
| (B) | All or a portion of this security is on loan as of 10-31-21. |
| (C) | The rate shown is the annualized seven-day yield as of 10-31-21. |
| (D) | Investment is an affiliate of the fund, the advisor and/or subadvisor. This security represents the investment of cash collateral received for securities lending. |
MULTIFACTOR MATERIALS ETF
As of 10-31-21 (unaudited)
| | Shares or
Principal
Amount | Value |
| COMMON STOCKS – 100.0% | | $19,363,076 |
| (Cost $16,216,850) | | |
| Industrials – 2.3% | 448,914 |
| Building products – 1.9% | |
| Owens Corning | 3,348 | 312,737 |
| The AZEK Company, Inc. (A) | 1,582 | 58,044 |
| Machinery – 0.4% | |
| RBC Bearings, Inc. (A) | 334 | 78,133 |
| Materials – 96.8% | 18,741,920 |
| Chemicals – 51.5% | |
| Air Products & Chemicals, Inc. | 2,186 | 655,385 |
| Albemarle Corp. | 1,696 | 424,797 |
| Ashland Global Holdings, Inc. | 1,471 | 141,231 |
| Axalta Coating Systems, Ltd. (A) | 6,019 | 187,733 |
| Celanese Corp. | 2,541 | 410,397 |
MULTIFACTOR MATERIALS ETF (continued)
| | Shares or
Principal
Amount | Value |
| Materials (continued) | |
| Chemicals (continued) | |
| CF Industries Holdings, Inc. | 5,953 | $338,130 |
| Dow, Inc. | 11,299 | 632,405 |
| DuPont de Nemours, Inc. | 11,109 | 773,186 |
| Eastman Chemical Company | 2,978 | 309,801 |
| Ecolab, Inc. | 2,136 | 474,662 |
| FMC Corp. | 2,833 | 257,831 |
| Huntsman Corp. | 5,775 | 188,150 |
| International Flavors & Fragrances, Inc. | 5,152 | 759,662 |
| Linde PLC | 3,337 | 1,065,170 |
| LyondellBasell Industries NV, Class A | 8,718 | 809,205 |
| Olin Corp. | 4,162 | 237,151 |
| PPG Industries, Inc. | 5,263 | 845,080 |
| RPM International, Inc. | 2,780 | 242,416 |
| The Mosaic Company | 7,767 | 322,874 |
| The Sherwin-Williams Company | 2,527 | 800,073 |
| Westlake Chemical Corp. | 968 | 94,225 |
| Construction materials – 5.9% | |
| Eagle Materials, Inc. | 902 | 133,821 |
| Martin Marietta Materials, Inc. | 1,253 | 492,229 |
| Vulcan Materials Company | 2,672 | 508,001 |
| Containers and packaging – 20.8% | |
| Amcor PLC | 41,197 | 497,248 |
| AptarGroup, Inc. | 1,416 | 171,024 |
| Ardagh Metal Packaging SA (A) | 797 | 7,850 |
| Avery Dennison Corp. | 1,796 | 391,025 |
| Ball Corp. | 6,940 | 634,871 |
| Berry Global Group, Inc. (A) | 4,741 | 310,725 |
| Crown Holdings, Inc. | 2,854 | 296,787 |
| Graphic Packaging Holding Company | 10,012 | 199,539 |
| International Paper Company | 10,389 | 516,022 |
| Packaging Corp. of America | 2,547 | 349,881 |
| Sealed Air Corp. | 3,412 | 202,400 |
| Sonoco Products Company | 2,822 | 163,535 |
| Westrock Company | 5,832 | 280,519 |
| Metals and mining – 18.5% | |
| Alcoa Corp. | 5,351 | 245,878 |
| Cleveland-Cliffs, Inc. (A)(B) | 13,097 | 315,769 |
| Freeport-McMoRan, Inc. | 14,580 | 549,958 |
| Newmont Corp. | 9,757 | 526,878 |
| Nucor Corp. | 8,596 | 959,743 |
| Reliance Steel & Aluminum Company | 1,567 | 229,033 |
| Royal Gold, Inc. | 1,253 | 124,072 |
| Southern Copper Corp. | 1,197 | 71,808 |
| Steel Dynamics, Inc. | 6,626 | 437,846 |
| U.S. Steel Corp. | 4,900 | 129,311 |
| Paper and forest products – 0.1% | |
| Sylvamo Corp. (A) | 944 | 26,583 |
| 56 | JOHN HANCOCK MULTIFACTOR ETFS | SEMIANNUAL REPORT | SEE NOTES TO FINANCIAL STATEMENTS |
MULTIFACTOR MATERIALS ETF (continued)
| | Shares or
Principal
Amount | Value |
| Utilities – 0.9% | $172,242 |
| Multi-utilities – 0.9% | |
| MDU Resources Group, Inc. | 5,605 | 172,242 |
|
| SHORT-TERM INVESTMENTS – 0.3% | | $63,880 |
| (Cost $63,880) | | |
| Short-term funds – 0.3% | 63,880 |
| State Street Institutional U.S. Government Money Market Fund, Premier Class, 0.0250% (C) | 63,880 | 63,880 |
| Total investments (Multifactor Materials ETF) (Cost $16,280,730) 100.3% | $19,426,956 |
| Other assets and liabilities, net (0.3%) | | (51,514) |
| Total net assets 100.0% | | $19,375,442 |
| The percentage shown for each investment category is the total value of the category as a percentage of the net assets of the fund. |
| Security Abbreviations and Legend |
| (A) | Non-income producing security. |
| (B) | All or a portion of this security is on loan as of 10-31-21. |
| (C) | The rate shown is the annualized seven-day yield as of 10-31-21. |
MULTIFACTOR MEDIA AND COMMUNICATIONS ETF
As of 10-31-21 (unaudited)
| | Shares or
Principal
Amount | Value |
| COMMON STOCKS – 100.0% | | $19,794,965 |
| (Cost $17,707,981) | | |
| Communication services – 97.4% | 19,287,747 |
| Diversified telecommunication services – 13.2% | |
| AT&T, Inc. | 45,724 | 1,154,988 |
| Iridium Communications, Inc. (A) | 3,369 | 136,613 |
| Lumen Technologies, Inc. | 37,950 | 450,087 |
| Verizon Communications, Inc. | 16,381 | 868,029 |
| Entertainment – 27.5% | |
| Activision Blizzard, Inc. | 7,327 | 572,898 |
| Electronic Arts, Inc. | 5,346 | 749,777 |
| Liberty Media Corp.-Liberty Formula One, Series A (A) | 747 | 38,956 |
| Liberty Media Corp.-Liberty Formula One, Series C (A) | 4,290 | 239,382 |
| Live Nation Entertainment, Inc. (A) | 2,432 | 245,997 |
| Netflix, Inc. (A) | 2,203 | 1,520,751 |
| Playtika Holding Corp. (A) | 3,539 | 100,083 |
| Spotify Technology SA (A) | 834 | 241,360 |
| Take-Two Interactive Software, Inc. (A) | 1,718 | 310,958 |
| The Walt Disney Company (A) | 6,916 | 1,169,288 |
| Warner Music Group Corp., Class A | 2,376 | 117,588 |
| Zynga, Inc., Class A (A) | 19,550 | 144,279 |
| Interactive media and services – 22.0% | |
| Alphabet, Inc., Class A (A) | 225 | 666,207 |
| Alphabet, Inc., Class C (A) | 207 | 613,840 |
| Angi, Inc. (A) | 1,609 | 20,161 |
MULTIFACTOR MEDIA AND COMMUNICATIONS ETF (continued)
| | Shares or
Principal
Amount | Value |
| Communication services (continued) | |
| Interactive media and services (continued) | |
| Bumble, Inc., Class A (A) | 1,384 | $72,688 |
| Facebook, Inc., Class A (A) | 3,305 | 1,069,399 |
| Match Group, Inc. (A) | 4,697 | 708,214 |
| Pinterest, Inc., Class A (A) | 7,269 | 324,488 |
| Snap, Inc., Class A (A) | 4,645 | 244,234 |
| Twitter, Inc. (A) | 7,863 | 420,985 |
| Vimeo, Inc. (A) | 2,182 | 73,599 |
| Zillow Group, Inc., Class A (A) | 313 | 33,090 |
| Zillow Group, Inc., Class C (A) | 969 | 100,417 |
| Media – 30.7% | |
| Altice USA, Inc., Class A (A) | 4,202 | 68,493 |
| Cable One, Inc. | 214 | 366,199 |
| Charter Communications, Inc., Class A (A) | 843 | 568,932 |
| Comcast Corp., Class A | 20,661 | 1,062,595 |
| Discovery, Inc., Series A (A)(B) | 3,713 | 87,033 |
| Discovery, Inc., Series C (A) | 6,880 | 155,213 |
| DISH Network Corp., Class A (A) | 6,405 | 263,053 |
| Fox Corp., Class A | 6,909 | 274,564 |
| Fox Corp., Class B | 3,396 | 125,516 |
| Liberty Broadband Corp., Series A (A) | 553 | 88,906 |
| Liberty Broadband Corp., Series C (A) | 3,039 | 493,686 |
| Liberty Media Corp.-Liberty SiriusXM, Series A (A) | 1,769 | 88,061 |
| Liberty Media Corp.-Liberty SiriusXM, Series C (A) | 3,567 | 175,924 |
| News Corp., Class A | 8,460 | 193,734 |
| News Corp., Class B | 2,967 | 66,936 |
| Nexstar Media Group, Inc., Class A | 1,636 | 245,285 |
| Omnicom Group, Inc. | 7,314 | 497,937 |
| Sirius XM Holdings, Inc. | 16,675 | 101,551 |
| The Interpublic Group of Companies, Inc. | 13,418 | 490,696 |
| The New York Times Company, Class A | 3,171 | 173,105 |
| ViacomCBS, Inc., Class A | 185 | 7,202 |
| ViacomCBS, Inc., Class B | 13,580 | 491,868 |
| Wireless telecommunication services – 4.0% | |
| T-Mobile US, Inc. (A) | 6,893 | 792,902 |
| Industrials – 1.7% | 322,943 |
| Professional services – 1.7% | |
| Nielsen Holdings PLC | 12,732 | 257,823 |
| Upwork, Inc. (A) | 1,382 | 65,120 |
| Information technology – 0.9% | 184,275 |
| Software – 0.9% | |
| Dynatrace, Inc. (A) | 2,457 | 184,275 |
| SEE NOTES TO FINANCIAL STATEMENTS | SEMIANNUAL REPORT | JOHN HANCOCK MULTIFACTOR ETFS | 57 |
MULTIFACTOR MEDIA AND COMMUNICATIONS ETF (continued)
| | Shares or
Principal
Amount | Value |
|
| SHORT-TERM INVESTMENTS – 0.1% | | $30,964 |
| (Cost $30,964) | | |
| Short-term funds – 0.1% | 30,964 |
| State Street Institutional U.S. Government Money Market Fund, Premier Class, 0.0250% (C) | 30,964 | $30,964 |
| Total investments (Multifactor Media and Communications ETF) (Cost $17,738,945) 100.1% | $19,825,929 |
| Other assets and liabilities, net (0.1%) | | (24,309) |
| Total net assets 100.0% | | $19,801,620 |
| The percentage shown for each investment category is the total value of the category as a percentage of the net assets of the fund. |
| Security Abbreviations and Legend |
| (A) | Non-income producing security. |
| (B) | All or a portion of this security is on loan as of 10-31-21. |
| (C) | The rate shown is the annualized seven-day yield as of 10-31-21. |
MULTIFACTOR MID CAP ETF
As of 10-31-21 (unaudited)
| | Shares or
Principal
Amount | Value |
| COMMON STOCKS – 100.0% | | $2,482,663,564 |
| (Cost $1,844,754,130) | | |
| Communication services – 3.1% | 77,983,736 |
| Diversified telecommunication services – 0.3% | |
| Lumen Technologies, Inc. | 610,470 | 7,240,171 |
| Entertainment – 0.6% | |
| Liberty Media Corp.-Liberty Formula One, Series A (A) | 8,023 | 418,399 |
| Liberty Media Corp.-Liberty Formula One, Series C (A) | 81,553 | 4,550,657 |
| Live Nation Entertainment, Inc. (A) | 25,188 | 2,547,766 |
| Playtika Holding Corp. (A) | 22,429 | 634,292 |
| Take-Two Interactive Software, Inc. (A) | 25,383 | 4,594,323 |
| Warner Music Group Corp., Class A | 17,978 | 889,731 |
| Zynga, Inc., Class A (A) | 255,735 | 1,887,324 |
| Interactive media and services – 0.2% | |
| Bumble, Inc., Class A (A) | 5,159 | 270,951 |
| Vimeo, Inc. (A) | 33,260 | 1,121,860 |
| Ziff Davis, Inc. (A) | 12,822 | 1,644,678 |
| ZoomInfo Technologies, Inc., Class A (A) | 18,669 | 1,254,930 |
| Media – 2.0% | |
| Altice USA, Inc., Class A (A) | 60,023 | 978,375 |
| Cable One, Inc. | 2,020 | 3,456,644 |
| Discovery, Inc., Series A (A)(B) | 42,269 | 990,785 |
| Discovery, Inc., Series C (A) | 92,611 | 2,089,304 |
| DISH Network Corp., Class A (A) | 78,303 | 3,215,904 |
| Fox Corp., Class A | 84,762 | 3,368,442 |
| Fox Corp., Class B | 39,205 | 1,449,017 |
| Liberty Broadband Corp., Series A (A) | 5,554 | 892,917 |
MULTIFACTOR MID CAP ETF (continued)
| | Shares or
Principal
Amount | Value |
| Communication services (continued) | |
| Media (continued) | |
| Liberty Broadband Corp., Series C (A) | 35,246 | $5,725,713 |
| Liberty Media Corp.-Liberty SiriusXM, Series A (A) | 26,817 | 1,334,950 |
| Liberty Media Corp.-Liberty SiriusXM, Series C (A) | 39,582 | 1,952,184 |
| News Corp., Class A | 163,405 | 3,741,975 |
| News Corp., Class B | 49,792 | 1,123,308 |
| Nexstar Media Group, Inc., Class A | 23,060 | 3,457,386 |
| Omnicom Group, Inc. | 71,904 | 4,895,224 |
| Sirius XM Holdings, Inc. (B) | 125,566 | 764,697 |
| The Interpublic Group of Companies, Inc. | 170,796 | 6,246,010 |
| The New York Times Company, Class A | 44,785 | 2,444,813 |
| ViacomCBS, Inc., Class A | 817 | 31,806 |
| ViacomCBS, Inc., Class B | 76,455 | 2,769,200 |
| Consumer discretionary – 13.6% | 338,912,005 |
| Auto components – 0.8% | |
| Autoliv, Inc. | 42,309 | 4,097,627 |
| BorgWarner, Inc. | 108,740 | 4,900,912 |
| Fox Factory Holding Corp. (A) | 11,400 | 1,834,830 |
| Gentex Corp. | 109,643 | 3,880,266 |
| Lear Corp. | 29,564 | 5,080,573 |
| QuantumScape Corp. (A)(B) | 16,442 | 475,831 |
| Automobiles – 0.2% | |
| Harley-Davidson, Inc. | 77,963 | 2,844,870 |
| Thor Industries, Inc. | 25,448 | 2,594,678 |
| Distributors – 0.8% | |
| Genuine Parts Company | 41,611 | 5,455,618 |
| LKQ Corp. (A) | 130,173 | 7,169,929 |
| Pool Corp. | 12,401 | 6,388,499 |
| Diversified consumer services – 0.5% | |
| Bright Horizons Family Solutions, Inc. (A) | 18,566 | 3,081,956 |
| Chegg, Inc. (A) | 30,190 | 1,794,494 |
| Service Corp. International | 95,472 | 6,538,877 |
| Hotels, restaurants and leisure – 2.6% | |
| Aramark | 104,329 | 3,805,922 |
| Boyd Gaming Corp. (A) | 29,470 | 1,879,597 |
| Caesars Entertainment, Inc. (A) | 38,707 | 4,236,868 |
| Carnival Corp. (A) | 88,484 | 1,960,805 |
| Choice Hotels International, Inc. | 11,287 | 1,587,178 |
| Churchill Downs, Inc. | 10,639 | 2,446,970 |
| Darden Restaurants, Inc. | 36,439 | 5,252,317 |
| Domino’s Pizza, Inc. | 9,092 | 4,445,715 |
| DraftKings, Inc., Class A (A) | 36,158 | 1,684,601 |
| Expedia Group, Inc. (A) | 24,327 | 3,999,602 |
| Hyatt Hotels Corp., Class A (A) | 15,135 | 1,289,502 |
| Marriott Vacations Worldwide Corp. | 15,929 | 2,504,357 |
| MGM Resorts International | 110,135 | 5,193,967 |
| Norwegian Cruise Line Holdings, Ltd. (A) | 111,456 | 2,866,648 |
| Penn National Gaming, Inc. (A) | 42,738 | 3,060,041 |
| 58 | JOHN HANCOCK MULTIFACTOR ETFS | SEMIANNUAL REPORT | SEE NOTES TO FINANCIAL STATEMENTS |
MULTIFACTOR MID CAP ETF (continued)
| | Shares or
Principal
Amount | Value |
| Consumer discretionary (continued) | |
| Hotels, restaurants and leisure (continued) | |
| Planet Fitness, Inc., Class A (A) | 22,929 | $1,824,002 |
| Royal Caribbean Cruises, Ltd. (A) | 37,479 | 3,164,352 |
| Scientific Games Corp. (A) | 12,275 | 982,614 |
| Texas Roadhouse, Inc. | 24,281 | 2,156,396 |
| Vail Resorts, Inc. | 16,329 | 5,628,770 |
| Wyndham Hotels & Resorts, Inc. | 33,466 | 2,826,873 |
| Wynn Resorts, Ltd. (A) | 22,794 | 2,046,901 |
| Household durables – 2.5% | |
| D.R. Horton, Inc. | 90,955 | 8,119,553 |
| Garmin, Ltd. | 38,009 | 5,458,092 |
| Helen of Troy, Ltd. (A) | 7,945 | 1,787,228 |
| Leggett & Platt, Inc. | 57,424 | 2,690,314 |
| Lennar Corp., A Shares | 67,642 | 6,759,465 |
| Lennar Corp., B Shares | 4,113 | 337,595 |
| Mohawk Industries, Inc. (A) | 21,774 | 3,858,571 |
| Newell Brands, Inc. | 155,930 | 3,569,238 |
| NVR, Inc. (A) | 1,170 | 5,726,916 |
| PulteGroup, Inc. | 120,218 | 5,780,081 |
| Tempur Sealy International, Inc. | 67,270 | 2,991,497 |
| Toll Brothers, Inc. | 54,946 | 3,306,101 |
| TopBuild Corp. (A) | 12,020 | 3,088,779 |
| Whirlpool Corp. | 37,653 | 7,938,382 |
| Internet and direct marketing retail – 0.3% | |
| Etsy, Inc. (A) | 28,441 | 7,129,874 |
| Wayfair, Inc., Class A (A)(B) | 6,826 | 1,700,357 |
| Leisure products – 0.7% | |
| Brunswick Corp. | 41,990 | 3,908,849 |
| Hasbro, Inc. | 49,589 | 4,748,643 |
| Mattel, Inc. (A) | 116,062 | 2,531,312 |
| Peloton Interactive, Inc., Class A (A) | 19,393 | 1,773,296 |
| Polaris, Inc. | 26,526 | 3,049,164 |
| YETI Holdings, Inc. (A) | 27,057 | 2,660,515 |
| Multiline retail – 0.5% | |
| Dollar Tree, Inc. (A) | 67,583 | 7,282,744 |
| Kohl’s Corp. | 61,092 | 2,964,795 |
| Macy’s, Inc. | 65,085 | 1,722,800 |
| Specialty retail – 3.5% | |
| Advance Auto Parts, Inc. | 32,048 | 7,227,465 |
| AutoNation, Inc. (A) | 37,541 | 4,546,966 |
| AutoZone, Inc. (A) | 3,190 | 5,693,640 |
| Bath & Body Works, Inc. | 55,649 | 3,844,789 |
| Best Buy Company, Inc. | 74,480 | 9,104,435 |
| Burlington Stores, Inc. (A) | 12,846 | 3,549,221 |
| CarMax, Inc. (A) | 53,487 | 7,323,440 |
| Dick’s Sporting Goods, Inc. | 32,739 | 4,066,511 |
| Five Below, Inc. (A) | 19,349 | 3,817,558 |
| Floor & Decor Holdings, Inc., Class A (A) | 34,845 | 4,736,132 |
| GameStop Corp., Class A (A) | 7,139 | 1,310,078 |
| Lithia Motors, Inc. | 11,920 | 3,805,102 |
MULTIFACTOR MID CAP ETF (continued)
| | Shares or
Principal
Amount | Value |
| Consumer discretionary (continued) | |
| Specialty retail (continued) | |
| Penske Automotive Group, Inc. | 7,602 | $806,192 |
| RH (A) | 5,615 | 3,703,822 |
| The Gap, Inc. | 112,189 | 2,545,568 |
| Tractor Supply Company | 37,384 | 8,118,683 |
| Ulta Beauty, Inc. (A) | 14,934 | 5,486,154 |
| Victoria’s Secret & Company (A) | 18,939 | 955,851 |
| Williams-Sonoma, Inc. | 38,207 | 7,096,186 |
| Textiles, apparel and luxury goods – 1.2% | |
| Capri Holdings, Ltd. (A) | 62,285 | 3,316,053 |
| Columbia Sportswear Company | 13,773 | 1,430,188 |
| Crocs, Inc. (A) | 10,460 | 1,688,767 |
| Deckers Outdoor Corp. (A) | 12,040 | 4,759,532 |
| Hanesbrands, Inc. | 166,104 | 2,830,412 |
| Levi Strauss & Company, Class A | 26,848 | 702,881 |
| PVH Corp. (A) | 28,468 | 3,112,406 |
| Ralph Lauren Corp. | 17,842 | 2,268,967 |
| Skechers USA, Inc., Class A (A) | 56,144 | 2,594,414 |
| Tapestry, Inc. | 105,505 | 4,112,585 |
| Under Armour, Inc., Class A (A) | 59,096 | 1,297,748 |
| Under Armour, Inc., Class C (A) | 63,196 | 1,193,140 |
| Consumer staples – 3.1% | 75,600,659 |
| Beverages – 0.2% | |
| Molson Coors Beverage Company, Class B | 51,616 | 2,275,749 |
| The Boston Beer Company, Inc., Class A (A) | 2,593 | 1,277,001 |
| Food and staples retailing – 0.7% | |
| Albertsons Companies, Inc., Class A (B) | 37,361 | 1,156,323 |
| BJ’s Wholesale Club Holdings, Inc. (A) | 40,417 | 2,361,969 |
| Casey’s General Stores, Inc. | 15,815 | 3,029,205 |
| Performance Food Group Company (A) | 46,567 | 2,106,225 |
| The Kroger Company | 120,387 | 4,817,888 |
| U.S. Foods Holding Corp. (A) | 91,016 | 3,155,525 |
| Food products – 1.7% | |
| Beyond Meat, Inc. (A)(B) | 8,637 | 854,890 |
| Bunge, Ltd. | 64,392 | 5,965,275 |
| Campbell Soup Company | 46,490 | 1,857,276 |
| Conagra Brands, Inc. | 115,591 | 3,722,030 |
| Darling Ingredients, Inc. (A) | 65,136 | 5,505,295 |
| Hormel Foods Corp. | 38,575 | 1,632,494 |
| Ingredion, Inc. | 30,725 | 2,925,942 |
| Lamb Weston Holdings, Inc. | 49,957 | 2,820,073 |
| McCormick & Company, Inc. | 51,672 | 4,145,645 |
| Pilgrim’s Pride Corp. (A) | 22,476 | 632,924 |
| Post Holdings, Inc. (A) | 29,309 | 2,974,277 |
| The J.M. Smucker Company | 36,082 | 4,433,035 |
| Tyson Foods, Inc., Class A | 68,126 | 5,448,036 |
| Household products – 0.4% | |
| Church & Dwight Company, Inc. | 54,956 | 4,800,956 |
| Reynolds Consumer Products, Inc. | 15,386 | 415,114 |
| SEE NOTES TO FINANCIAL STATEMENTS | SEMIANNUAL REPORT | JOHN HANCOCK MULTIFACTOR ETFS | 59 |
MULTIFACTOR MID CAP ETF (continued)
| | Shares or
Principal
Amount | Value |
| Consumer staples (continued) | |
| Household products (continued) | |
| The Clorox Company | 29,095 | $4,742,776 |
| Personal products – 0.1% | |
| Coty, Inc., Class A (A) | 83,517 | 708,224 |
| Herbalife Nutrition, Ltd. (A) | 39,580 | 1,836,512 |
| Energy – 3.4% | 84,133,198 |
| Energy equipment and services – 0.3% | |
| Baker Hughes Company | 144,416 | 3,621,953 |
| Halliburton Company | 165,802 | 4,143,392 |
| Oil, gas and consumable fuels – 3.1% | |
| APA Corp. | 97,011 | 2,542,658 |
| Cheniere Energy, Inc. (A) | 45,344 | 4,688,570 |
| Continental Resources, Inc. | 26,905 | 1,313,233 |
| Coterra Energy, Inc. | 219,175 | 4,672,811 |
| Devon Energy Corp. | 113,891 | 4,564,751 |
| Diamondback Energy, Inc. | 58,567 | 6,277,797 |
| EQT Corp. (A) | 65,348 | 1,301,079 |
| Hess Corp. | 56,337 | 4,651,746 |
| Marathon Oil Corp. | 342,973 | 5,597,319 |
| New Fortress Energy, Inc. (B) | 11,459 | 343,770 |
| Occidental Petroleum Corp. | 216,254 | 7,250,997 |
| ONEOK, Inc. | 92,356 | 5,875,689 |
| Ovintiv, Inc. | 112,140 | 4,207,493 |
| Phillips 66 | 40,535 | 3,031,207 |
| Pioneer Natural Resources Company | 29,095 | 5,440,183 |
| Targa Resources Corp. | 77,968 | 4,262,511 |
| Texas Pacific Land Corp. | 2,110 | 2,687,444 |
| The Williams Companies, Inc. | 135,667 | 3,810,886 |
| Valero Energy Corp. | 49,757 | 3,847,709 |
| Financials – 13.5% | 335,650,906 |
| Banks – 4.4% | |
| BOK Financial Corp. | 10,974 | 1,110,240 |
| Citizens Financial Group, Inc. | 134,816 | 6,387,582 |
| Comerica, Inc. | 49,553 | 4,216,465 |
| Commerce Bancshares, Inc. | 44,775 | 3,157,085 |
| Cullen/Frost Bankers, Inc. | 21,555 | 2,791,373 |
| East West Bancorp, Inc. | 63,123 | 5,017,016 |
| Fifth Third Bancorp | 222,274 | 9,675,587 |
| First Citizens BancShares, Inc., Class A | 1,935 | 1,574,897 |
| First Financial Bankshares, Inc. | 42,892 | 2,175,482 |
| First Horizon Corp. | 234,171 | 3,973,882 |
| First Republic Bank | 39,930 | 8,638,057 |
| Huntington Bancshares, Inc. | 412,781 | 6,497,173 |
| KeyCorp | 281,960 | 6,561,209 |
| M&T Bank Corp. | 30,152 | 4,435,962 |
| People’s United Financial, Inc. | 169,076 | 2,897,963 |
| Pinnacle Financial Partners, Inc. | 17,079 | 1,649,319 |
| Prosperity Bancshares, Inc. | 34,623 | 2,607,458 |
| Regions Financial Corp. | 303,992 | 7,198,531 |
MULTIFACTOR MID CAP ETF (continued)
| | Shares or
Principal
Amount | Value |
| Financials (continued) | |
| Banks (continued) | |
| Signature Bank | 22,287 | $6,637,514 |
| SVB Financial Group (A) | 14,515 | 10,413,061 |
| Synovus Financial Corp. | 48,629 | 2,265,625 |
| Western Alliance Bancorp | 29,626 | 3,439,282 |
| Zions Bancorp NA | 75,835 | 4,776,847 |
| Capital markets – 3.4% | |
| Affiliated Managers Group, Inc. | 11,779 | 1,977,459 |
| Ameriprise Financial, Inc. | 32,921 | 9,946,422 |
| Apollo Global Management, Inc. | 35,026 | 2,695,251 |
| Ares Management Corp., Class A | 28,406 | 2,407,124 |
| Cboe Global Markets, Inc. | 37,722 | 4,977,041 |
| FactSet Research Systems, Inc. | 12,583 | 5,585,468 |
| Franklin Resources, Inc. | 87,125 | 2,743,566 |
| Interactive Brokers Group, Inc., Class A | 21,651 | 1,533,973 |
| Invesco, Ltd. | 158,409 | 4,025,173 |
| Janus Henderson Group PLC | 27,326 | 1,270,659 |
| Jefferies Financial Group, Inc. | 95,122 | 4,090,246 |
| LPL Financial Holdings, Inc. | 27,832 | 4,565,005 |
| MarketAxess Holdings, Inc. | 11,405 | 4,660,881 |
| Morningstar, Inc. | 7,815 | 2,475,401 |
| Nasdaq, Inc. | 33,690 | 7,070,520 |
| Northern Trust Corp. | 51,069 | 6,283,530 |
| Raymond James Financial, Inc. | 54,853 | 5,407,957 |
| SEI Investments Company | 52,746 | 3,325,108 |
| State Street Corp. | 61,838 | 6,094,135 |
| Stifel Financial Corp. | 37,145 | 2,706,756 |
| Tradeweb Markets, Inc., Class A | 13,010 | 1,159,191 |
| Consumer finance – 0.8% | |
| Ally Financial, Inc. | 154,173 | 7,360,219 |
| Credit Acceptance Corp. (A) | 4,097 | 2,450,866 |
| OneMain Holdings, Inc. | 40,133 | 2,119,424 |
| Synchrony Financial | 156,543 | 7,271,422 |
| Upstart Holdings, Inc. (A) | 2,815 | 906,543 |
| Diversified financial services – 0.4% | |
| Equitable Holdings, Inc. | 187,760 | 6,289,960 |
| Voya Financial, Inc. | 65,441 | 4,565,819 |
| Insurance – 4.4% | |
| Alleghany Corp. (A) | 4,692 | 3,056,275 |
| American Financial Group, Inc. | 33,169 | 4,512,311 |
| Arch Capital Group, Ltd. (A) | 90,021 | 3,764,678 |
| Arthur J. Gallagher & Company | 49,234 | 8,255,065 |
| Assurant, Inc. | 24,084 | 3,884,990 |
| Athene Holding, Ltd., Class A (A) | 71,309 | 6,204,596 |
| Brown & Brown, Inc. | 79,344 | 5,007,400 |
| Cincinnati Financial Corp. | 38,418 | 4,665,482 |
| CNA Financial Corp. | 9,227 | 413,923 |
| Erie Indemnity Company, Class A | 8,626 | 1,775,317 |
| Everest Re Group, Ltd. | 14,977 | 3,916,486 |
| Fidelity National Financial, Inc. | 122,146 | 5,852,015 |
| 60 | JOHN HANCOCK MULTIFACTOR ETFS | SEMIANNUAL REPORT | SEE NOTES TO FINANCIAL STATEMENTS |
MULTIFACTOR MID CAP ETF (continued)
| | Shares or
Principal
Amount | Value |
| Financials (continued) | |
| Insurance (continued) | |
| First American Financial Corp. | 52,778 | $3,860,183 |
| Globe Life, Inc. | 41,302 | 3,676,704 |
| Lincoln National Corp. | 62,790 | 4,530,299 |
| Loews Corp. | 83,730 | 4,694,741 |
| Markel Corp. (A) | 3,229 | 4,240,097 |
| Old Republic International Corp. | 129,384 | 3,341,989 |
| Primerica, Inc. | 16,580 | 2,789,419 |
| Principal Financial Group, Inc. | 79,864 | 5,358,076 |
| Reinsurance Group of America, Inc. | 31,233 | 3,687,993 |
| RenaissanceRe Holdings, Ltd. | 17,246 | 2,445,483 |
| The Hartford Financial Services Group, Inc. | 120,323 | 8,775,156 |
| W.R. Berkley Corp. | 49,781 | 3,962,568 |
| Willis Towers Watson PLC | 27,142 | 6,575,964 |
| Thrifts and mortgage finance – 0.1% | |
| New York Community Bancorp, Inc. | 188,332 | 2,340,967 |
| Health care – 12.3% | 304,817,670 |
| Biotechnology – 2.2% | |
| Acceleron Pharma, Inc. (A) | 14,939 | 2,602,075 |
| Alnylam Pharmaceuticals, Inc. (A) | 20,994 | 3,349,803 |
| Arrowhead Pharmaceuticals, Inc. (A) | 21,207 | 1,353,431 |
| Beam Therapeutics, Inc. (A) | 4,647 | 412,514 |
| Biohaven Pharmaceutical Holding Company, Ltd. (A) | 5,541 | 788,595 |
| BioMarin Pharmaceutical, Inc. (A) | 53,072 | 4,204,895 |
| Bridgebio Pharma, Inc. (A) | 19,935 | 984,390 |
| CRISPR Therapeutics AG (A) | 17,985 | 1,642,570 |
| Denali Therapeutics, Inc. (A) | 20,030 | 968,451 |
| Exact Sciences Corp. (A) | 31,039 | 2,955,534 |
| Exelixis, Inc. (A) | 147,965 | 3,182,727 |
| Fate Therapeutics, Inc. (A) | 14,643 | 787,793 |
| Halozyme Therapeutics, Inc. (A) | 29,735 | 1,132,011 |
| Horizon Therapeutics PLC (A) | 73,744 | 8,842,643 |
| Incyte Corp. (A) | 27,608 | 1,849,184 |
| Intellia Therapeutics, Inc. (A) | 6,309 | 838,971 |
| Invitae Corp. (A)(B) | 32,723 | 867,160 |
| Mirati Therapeutics, Inc. (A) | 8,037 | 1,519,154 |
| Natera, Inc. (A) | 15,410 | 1,765,524 |
| Neurocrine Biosciences, Inc. (A) | 31,202 | 3,289,003 |
| Novavax, Inc. (A) | 8,556 | 1,273,389 |
| Sarepta Therapeutics, Inc. (A) | 12,580 | 995,455 |
| Seagen, Inc. (A) | 17,421 | 3,071,845 |
| Ultragenyx Pharmaceutical, Inc. (A) | 15,006 | 1,259,304 |
| United Therapeutics Corp. (A) | 20,421 | 3,895,510 |
| Vir Biotechnology, Inc. (A) | 15,594 | 588,362 |
| Health care equipment and supplies – 3.3% | |
| ABIOMED, Inc. (A) | 10,020 | 3,327,041 |
| Dentsply Sirona, Inc. | 98,701 | 5,646,684 |
| Envista Holdings Corp. (A) | 57,008 | 2,229,013 |
| Globus Medical, Inc., Class A (A) | 33,229 | 2,564,282 |
MULTIFACTOR MID CAP ETF (continued)
| | Shares or
Principal
Amount | Value |
| Health care (continued) | |
| Health care equipment and supplies (continued) | |
| Hill-Rom Holdings, Inc. | 39,028 | $6,045,437 |
| Hologic, Inc. (A) | 93,774 | 6,874,572 |
| Insulet Corp. (A) | 12,138 | 3,763,023 |
| Integra LifeSciences Holdings Corp. (A) | 28,762 | 1,911,523 |
| Masimo Corp. (A) | 18,576 | 5,267,039 |
| Novocure, Ltd. (A) | 18,005 | 1,846,773 |
| Penumbra, Inc. (A) | 9,321 | 2,577,723 |
| ResMed, Inc. | 37,738 | 9,921,698 |
| Shockwave Medical, Inc. (A) | 3,165 | 676,361 |
| STAAR Surgical Company (A) | 5,431 | 643,356 |
| STERIS PLC | 28,457 | 6,651,539 |
| Tandem Diabetes Care, Inc. (A) | 13,189 | 1,798,056 |
| Teleflex, Inc. | 13,089 | 4,671,988 |
| The Cooper Companies, Inc. | 14,682 | 6,121,219 |
| West Pharmaceutical Services, Inc. | 19,325 | 8,307,431 |
| Health care providers and services – 2.6% | |
| agilon health, Inc. (A) | 5,612 | 137,494 |
| Amedisys, Inc. (A) | 11,893 | 2,013,961 |
| AmerisourceBergen Corp. | 36,565 | 4,461,661 |
| Cardinal Health, Inc. | 117,502 | 5,617,771 |
| Chemed Corp. | 6,438 | 3,104,726 |
| DaVita, Inc. (A) | 41,917 | 4,327,511 |
| Encompass Health Corp. | 54,567 | 3,468,279 |
| Guardant Health, Inc. (A) | 18,167 | 2,121,724 |
| Henry Schein, Inc. (A) | 69,362 | 5,295,789 |
| Laboratory Corp. of America Holdings (A) | 35,097 | 10,073,541 |
| LHC Group, Inc. (A) | 9,191 | 1,237,017 |
| Molina Healthcare, Inc. (A) | 32,411 | 9,584,581 |
| Oak Street Health, Inc. (A)(B) | 3,798 | 179,380 |
| Quest Diagnostics, Inc. | 51,735 | 7,593,663 |
| Tenet Healthcare Corp. (A) | 18,281 | 1,310,016 |
| Universal Health Services, Inc., Class B | 41,273 | 5,121,979 |
| Health care technology – 0.6% | |
| Cerner Corp. | 93,508 | 6,946,709 |
| Change Healthcare, Inc. (A) | 110,188 | 2,372,348 |
| Doximity, Inc., Class A (A) | 3,105 | 215,735 |
| Inovalon Holdings, Inc., Class A (A) | 16,148 | 658,677 |
| Inspire Medical Systems, Inc. (A) | 3,677 | 991,246 |
| Omnicell, Inc. (A) | 8,073 | 1,438,205 |
| Teladoc Health, Inc. (A) | 17,018 | 2,545,723 |
| Life sciences tools and services – 2.8% | |
| 10X Genomics, Inc., Class A (A) | 8,863 | 1,429,336 |
| Avantor, Inc. (A) | 122,360 | 4,940,897 |
| Bio-Rad Laboratories, Inc., Class A (A) | 7,435 | 5,908,446 |
| Bio-Techne Corp. | 12,117 | 6,345,067 |
| Bruker Corp. | 48,406 | 3,887,002 |
| Charles River Laboratories International, Inc. (A) | 16,769 | 7,523,915 |
| SEE NOTES TO FINANCIAL STATEMENTS | SEMIANNUAL REPORT | JOHN HANCOCK MULTIFACTOR ETFS | 61 |
MULTIFACTOR MID CAP ETF (continued)
| | Shares or
Principal
Amount | Value |
| Health care (continued) | |
| Life sciences tools and services (continued) | |
| Maravai LifeSciences Holdings, Inc., Class A (A) | 15,527 | $656,637 |
| Medpace Holdings, Inc. (A) | 12,007 | 2,720,186 |
| Mettler-Toledo International, Inc. (A) | 6,432 | 9,525,020 |
| NeoGenomics, Inc. (A) | 33,083 | 1,521,818 |
| Pacific Biosciences of California, Inc. (A) | 25,694 | 680,377 |
| PerkinElmer, Inc. | 41,525 | 7,345,357 |
| PPD, Inc. (A) | 24,924 | 1,175,665 |
| Repligen Corp. (A) | 15,253 | 4,430,997 |
| Sotera Health Company (A) | 25,694 | 634,642 |
| Syneos Health, Inc. (A) | 44,201 | 4,125,721 |
| Waters Corp. (A) | 15,243 | 5,602,565 |
| Pharmaceuticals – 0.8% | |
| Catalent, Inc. (A) | 62,190 | 8,573,513 |
| Elanco Animal Health, Inc. (A) | 114,318 | 3,758,776 |
| Jazz Pharmaceuticals PLC (A) | 29,600 | 3,937,984 |
| Organon & Company | 34,303 | 1,260,635 |
| Viatris, Inc. | 206,017 | 2,750,327 |
| Industrials – 16.0% | 398,342,166 |
| Aerospace and defense – 0.8% | |
| Axon Enterprise, Inc. (A) | 12,489 | 2,247,520 |
| HEICO Corp. | 9,056 | 1,262,316 |
| HEICO Corp., Class A | 14,494 | 1,821,606 |
| Howmet Aerospace, Inc. | 136,310 | 4,047,044 |
| Huntington Ingalls Industries, Inc. | 17,132 | 3,473,170 |
| Textron, Inc. | 85,475 | 6,312,329 |
| Virgin Galactic Holdings, Inc. (A) | 27,565 | 516,844 |
| Air freight and logistics – 0.6% | |
| C.H. Robinson Worldwide, Inc. | 48,673 | 4,720,794 |
| Expeditors International of Washington, Inc. | 53,143 | 6,550,406 |
| GXO Logistics, Inc. (A) | 44,562 | 3,957,106 |
| Airlines – 0.1% | |
| Alaska Air Group, Inc. (A) | 16,663 | 879,806 |
| American Airlines Group, Inc. (A) | 42,649 | 818,861 |
| Delta Air Lines, Inc. (A) | 9,205 | 360,192 |
| Southwest Airlines Company (A) | 13,687 | 647,121 |
| United Airlines Holdings, Inc. (A) | 25,337 | 1,169,049 |
| Building products – 1.8% | |
| A.O. Smith Corp. | 51,789 | 3,784,222 |
| Advanced Drainage Systems, Inc. | 14,708 | 1,659,062 |
| Allegion PLC | 36,155 | 4,638,687 |
| Builders FirstSource, Inc. (A) | 75,165 | 4,379,865 |
| Carlisle Companies, Inc. | 25,462 | 5,675,989 |
| Fortune Brands Home & Security, Inc. | 66,196 | 6,712,274 |
| Lennox International, Inc. | 10,196 | 3,051,459 |
| Masco Corp. | 80,666 | 5,287,656 |
| Owens Corning | 53,612 | 5,007,897 |
| The AZEK Company, Inc. (A) | 18,695 | 685,920 |
MULTIFACTOR MID CAP ETF (continued)
| | Shares or
Principal
Amount | Value |
| Industrials (continued) | |
| Building products (continued) | |
| Trex Company, Inc. (A) | 36,143 | $3,845,615 |
| Zurn Water Solutions Corp. | 22,153 | 803,711 |
| Commercial services and supplies – 1.2% | |
| ADT, Inc. | 82,345 | 687,581 |
| Copart, Inc. (A) | 56,542 | 8,780,407 |
| IAA, Inc. (A) | 45,074 | 2,688,664 |
| MSA Safety, Inc. | 11,327 | 1,733,371 |
| Republic Services, Inc. | 67,340 | 9,063,964 |
| Rollins, Inc. | 60,714 | 2,138,954 |
| Stericycle, Inc. (A) | 31,667 | 2,119,156 |
| Tetra Tech, Inc. | 15,723 | 2,761,902 |
| Construction and engineering – 0.8% | |
| AECOM (A) | 55,102 | 3,767,324 |
| EMCOR Group, Inc. | 23,009 | 2,795,363 |
| MasTec, Inc. (A) | 23,080 | 2,057,120 |
| Quanta Services, Inc. | 71,128 | 8,626,404 |
| WillScot Mobile Mini Holdings Corp. (A) | 59,065 | 2,052,509 |
| Electrical equipment – 1.9% | |
| Acuity Brands, Inc. | 6,689 | 1,374,121 |
| AMETEK, Inc. | 62,796 | 8,314,190 |
| Generac Holdings, Inc. (A) | 16,170 | 8,061,715 |
| Hubbell, Inc. | 27,809 | 5,544,280 |
| Plug Power, Inc. (A) | 132,025 | 5,052,597 |
| Regal Rexnord Corp. | 9,745 | 1,484,456 |
| Rockwell Automation, Inc. | 32,098 | 10,252,101 |
| Sensata Technologies Holding PLC (A) | 88,400 | 4,870,840 |
| Sunrun, Inc. (A) | 47,145 | 2,719,324 |
| Machinery – 4.0% | |
| AGCO Corp. | 32,376 | 3,956,671 |
| Chart Industries, Inc. (A) | 4,894 | 868,783 |
| Colfax Corp. (A) | 24,412 | 1,260,147 |
| Donaldson Company, Inc. | 57,467 | 3,448,595 |
| Dover Corp. | 46,544 | 7,869,660 |
| Fortive Corp. | 53,907 | 4,081,299 |
| Graco, Inc. | 61,325 | 4,610,414 |
| IDEX Corp. | 19,130 | 4,257,764 |
| Ingersoll Rand, Inc. (A) | 80,073 | 4,304,724 |
| ITT, Inc. | 35,834 | 3,370,904 |
| Lincoln Electric Holdings, Inc. | 24,289 | 3,458,754 |
| Nordson Corp. | 19,940 | 5,068,947 |
| Oshkosh Corp. | 32,918 | 3,522,226 |
| Parker-Hannifin Corp. | 35,293 | 10,467,551 |
| Pentair PLC | 63,367 | 4,687,257 |
| Snap-on, Inc. | 23,987 | 4,874,878 |
| Stanley Black & Decker, Inc. | 39,690 | 7,133,484 |
| The Middleby Corp. (A) | 23,702 | 4,324,193 |
| The Toro Company | 41,995 | 4,009,263 |
| Wabtec Corp. | 54,938 | 4,984,525 |
| Woodward, Inc. | 22,447 | 2,535,389 |
| 62 | JOHN HANCOCK MULTIFACTOR ETFS | SEMIANNUAL REPORT | SEE NOTES TO FINANCIAL STATEMENTS |
MULTIFACTOR MID CAP ETF (continued)
| | Shares or
Principal
Amount | Value |
| Industrials (continued) | |
| Machinery (continued) | |
| Xylem, Inc. | 42,637 | $5,567,966 |
| Professional services – 2.0% | |
| Booz Allen Hamilton Holding Corp. | 42,935 | 3,729,334 |
| CACI International, Inc., Class A (A) | 9,057 | 2,605,155 |
| Clarivate PLC (A) | 42,108 | 987,433 |
| Dun & Bradstreet Holdings, Inc. (A) | 44,852 | 845,012 |
| Equifax, Inc. | 24,718 | 6,857,515 |
| Jacobs Engineering Group, Inc. | 37,815 | 5,309,982 |
| Leidos Holdings, Inc. | 51,947 | 5,193,661 |
| ManpowerGroup, Inc. | 11,108 | 1,073,588 |
| Nielsen Holdings PLC | 169,252 | 3,427,353 |
| Robert Half International, Inc. | 52,865 | 5,977,446 |
| TransUnion | 40,164 | 4,630,508 |
| TriNet Group, Inc. (A) | 15,474 | 1,566,743 |
| Verisk Analytics, Inc. | 33,374 | 7,017,551 |
| Road and rail – 1.5% | |
| AMERCO | 4,611 | 3,398,261 |
| J.B. Hunt Transport Services, Inc. | 26,530 | 5,231,451 |
| Kansas City Southern | 20,087 | 6,231,992 |
| Knight-Swift Transportation Holdings, Inc. | 57,558 | 3,262,963 |
| Landstar System, Inc. | 15,423 | 2,711,518 |
| Lyft, Inc., Class A (A) | 31,773 | 1,457,428 |
| Old Dominion Freight Line, Inc. | 26,865 | 9,170,368 |
| Saia, Inc. (A) | 5,683 | 1,776,733 |
| TuSimple Holdings, Inc., Class A (A) | 4,316 | 168,842 |
| XPO Logistics, Inc. (A) | 47,014 | 4,033,801 |
| Trading companies and distributors – 1.3% | |
| Fastenal Company | 141,637 | 8,084,640 |
| SiteOne Landscape Supply, Inc. (A) | 14,398 | 3,382,954 |
| United Rentals, Inc. (A) | 28,403 | 10,767,861 |
| W.W. Grainger, Inc. | 13,887 | 6,431,209 |
| Watsco, Inc. | 10,652 | 3,084,606 |
| Information technology – 18.5% | 458,474,457 |
| Communications equipment – 1.3% | |
| Arista Networks, Inc. (A) | 16,347 | 6,697,202 |
| Ciena Corp. (A) | 82,084 | 4,456,340 |
| F5 Networks, Inc. (A) | 29,271 | 6,180,572 |
| Juniper Networks, Inc. | 143,196 | 4,227,146 |
| Lumentum Holdings, Inc. (A) | 34,730 | 2,868,003 |
| Motorola Solutions, Inc. | 34,400 | 8,551,496 |
| Ubiquiti, Inc. | 1,664 | 508,402 |
| Electronic equipment, instruments and components – 3.1% | |
| Arrow Electronics, Inc. (A) | 43,186 | 4,998,780 |
| CDW Corp. | 41,159 | 7,682,327 |
| Cognex Corp. | 59,712 | 5,230,174 |
| Coherent, Inc. (A) | 6,284 | 1,598,650 |
| Corning, Inc. | 123,011 | 4,375,501 |
| Flex, Ltd. (A) | 304,544 | 5,146,794 |
MULTIFACTOR MID CAP ETF (continued)
| | Shares or
Principal
Amount | Value |
| Information technology (continued) | |
| Electronic equipment, instruments andcomponents (continued) | |
| II-VI, Inc. (A) | 50,593 | $3,061,382 |
| IPG Photonics Corp. (A) | 13,862 | 2,204,197 |
| Jabil, Inc. | 93,720 | 5,619,451 |
| Keysight Technologies, Inc. (A) | 55,234 | 9,943,225 |
| Littelfuse, Inc. | 11,551 | 3,402,347 |
| SYNNEX Corp. | 10,182 | 1,069,110 |
| Teledyne Technologies, Inc. (A) | 13,051 | 5,862,770 |
| Trimble, Inc. (A) | 81,743 | 7,141,886 |
| Zebra Technologies Corp., Class A (A) | 15,871 | 8,474,320 |
| IT services – 3.5% | |
| Affirm Holdings, Inc. (A) | 7,258 | 1,179,425 |
| Akamai Technologies, Inc. (A) | 60,640 | 6,395,094 |
| Amdocs, Ltd. | 67,072 | 5,220,884 |
| Broadridge Financial Solutions, Inc. | 35,176 | 6,275,750 |
| Cloudflare, Inc., Class A (A) | 28,132 | 5,477,863 |
| Concentrix Corp. | 25,881 | 4,598,536 |
| DigitalOcean Holdings, Inc. (A) | 2,337 | 228,068 |
| DXC Technology Company (A) | 96,306 | 3,136,686 |
| EPAM Systems, Inc. (A) | 14,741 | 9,924,231 |
| Euronet Worldwide, Inc. (A) | 17,855 | 2,003,152 |
| FleetCor Technologies, Inc. (A) | 19,201 | 4,750,519 |
| Gartner, Inc. (A) | 23,749 | 7,882,531 |
| Genpact, Ltd. | 80,015 | 3,948,740 |
| Globant SA (A) | 5,400 | 1,723,626 |
| GoDaddy, Inc., Class A (A) | 44,103 | 3,050,605 |
| Jack Henry & Associates, Inc. | 23,483 | 3,909,450 |
| MongoDB, Inc. (A) | 7,623 | 3,973,794 |
| Okta, Inc. (A) | 12,816 | 3,167,859 |
| Shift4 Payments, Inc., Class A (A) | 7,025 | 443,488 |
| The Western Union Company | 142,197 | 2,590,829 |
| VeriSign, Inc. (A) | 21,119 | 4,702,568 |
| WEX, Inc. (A) | 15,571 | 2,330,979 |
| Semiconductors and semiconductor equipment – 3.7% | |
| Amkor Technology, Inc. | 46,336 | 1,015,685 |
| Brooks Automation, Inc. | 24,885 | 2,897,858 |
| Enphase Energy, Inc. (A) | 29,670 | 6,872,462 |
| Entegris, Inc. | 53,425 | 7,521,172 |
| First Solar, Inc. (A) | 42,531 | 5,086,282 |
| Lattice Semiconductor Corp. (A) | 37,700 | 2,617,888 |
| MKS Instruments, Inc. | 29,006 | 4,352,350 |
| Monolithic Power Systems, Inc. | 12,245 | 6,434,258 |
| ON Semiconductor Corp. (A) | 171,093 | 8,224,441 |
| Power Integrations, Inc. | 12,506 | 1,290,744 |
| Qorvo, Inc. (A) | 46,481 | 7,819,499 |
| Silicon Laboratories, Inc. (A) | 15,945 | 3,009,778 |
| Skyworks Solutions, Inc. | 54,113 | 9,043,906 |
| SolarEdge Technologies, Inc. (A) | 15,584 | 5,527,333 |
| Synaptics, Inc. (A) | 9,434 | 1,835,573 |
| SEE NOTES TO FINANCIAL STATEMENTS | SEMIANNUAL REPORT | JOHN HANCOCK MULTIFACTOR ETFS | 63 |
MULTIFACTOR MID CAP ETF (continued)
| | Shares or
Principal
Amount | Value |
| Information technology (continued) | |
| Semiconductors and semiconductor equipment (continued) | |
| Teradyne, Inc. | 69,147 | $9,558,881 |
| Universal Display Corp. | 16,882 | 3,092,782 |
| Wolfspeed, Inc. (A) | 42,768 | 5,136,864 |
| Software – 5.9% | |
| Anaplan, Inc. (A) | 24,112 | 1,572,344 |
| ANSYS, Inc. (A) | 24,798 | 9,412,825 |
| Appian Corp. (A)(B) | 8,015 | 796,771 |
| Asana, Inc., Class A (A) | 6,630 | 900,354 |
| Aspen Technology, Inc. (A) | 28,150 | 4,410,824 |
| Avalara, Inc. (A) | 22,832 | 4,101,540 |
| Bentley Systems, Inc., Class B | 19,013 | 1,124,619 |
| Bill.com Holdings, Inc. (A) | 17,114 | 5,036,821 |
| Black Knight, Inc. (A) | 40,293 | 2,824,942 |
| Blackline, Inc. (A) | 12,912 | 1,638,145 |
| Ceridian HCM Holding, Inc. (A) | 42,277 | 5,295,194 |
| Citrix Systems, Inc. | 30,271 | 2,867,572 |
| Consensus Cloud Solutions, Inc. (A) | 4,273 | 270,609 |
| Coupa Software, Inc. (A) | 10,725 | 2,442,083 |
| Dolby Laboratories, Inc., Class A | 30,967 | 2,735,934 |
| Dropbox, Inc., Class A (A) | 120,078 | 3,661,178 |
| Duck Creek Technologies, Inc. (A) | 6,290 | 198,135 |
| Dynatrace, Inc. (A) | 26,507 | 1,988,025 |
| Elastic NV (A) | 13,837 | 2,400,858 |
| Everbridge, Inc. (A) | 5,698 | 907,748 |
| Fair Isaac Corp. (A) | 9,696 | 3,860,947 |
| Five9, Inc. (A) | 14,621 | 2,310,264 |
| Guidewire Software, Inc. (A) | 31,272 | 3,931,829 |
| HubSpot, Inc. (A) | 8,651 | 7,009,300 |
| Manhattan Associates, Inc. (A) | 21,988 | 3,991,702 |
| McAfee Corp., Class A | 10,309 | 220,303 |
| MicroStrategy, Inc., Class A (A)(B) | 1,750 | 1,251,355 |
| NCino, Inc. (A) | 9,880 | 717,881 |
| NortonLifeLock, Inc. | 145,023 | 3,690,835 |
| Nuance Communications, Inc. (A) | 92,761 | 5,106,493 |
| Nutanix, Inc., Class A (A) | 37,420 | 1,283,880 |
| Palo Alto Networks, Inc. (A) | 13,391 | 6,817,224 |
| Paycom Software, Inc. (A) | 12,560 | 6,880,996 |
| Paylocity Holding Corp. (A) | 13,551 | 4,134,952 |
| Pegasystems, Inc. | 9,404 | 1,116,443 |
| PTC, Inc. (A) | 38,556 | 4,910,107 |
| Qualtrics International, Inc., Class A (A) | 9,478 | 439,021 |
| Rapid7, Inc. (A) | 5,147 | 662,676 |
| RingCentral, Inc., Class A (A) | 10,666 | 2,600,157 |
| SentinelOne, Inc., Class A (A) | 2,220 | 147,408 |
| Smartsheet, Inc., Class A (A) | 27,210 | 1,877,762 |
| Splunk, Inc. (A) | 17,556 | 2,893,580 |
| Sprout Social, Inc., Class A (A) | 3,287 | 419,684 |
| SS&C Technologies Holdings, Inc. | 75,107 | 5,968,753 |
| The Trade Desk, Inc., Class A (A) | 70,860 | 5,308,123 |
MULTIFACTOR MID CAP ETF (continued)
| | Shares or
Principal
Amount | Value |
| Information technology (continued) | |
| Software (continued) | |
| Tyler Technologies, Inc. (A) | 11,597 | $6,299,722 |
| Varonis Systems, Inc. (A) | 18,946 | 1,226,564 |
| Workiva, Inc. (A) | 3,673 | 549,297 |
| Zendesk, Inc. (A) | 21,936 | 2,233,085 |
| Zscaler, Inc. (A) | 11,124 | 3,546,999 |
| Technology hardware, storage and peripherals – 1.0% | |
| Hewlett Packard Enterprise Company | 354,408 | 5,192,077 |
| NetApp, Inc. | 77,970 | 6,962,721 |
| Pure Storage, Inc., Class A (A) | 69,347 | 1,862,660 |
| Seagate Technology Holdings PLC | 66,382 | 5,912,645 |
| Western Digital Corp. (A) | 95,582 | 4,997,983 |
| Materials – 6.4% | 159,063,671 |
| Chemicals – 2.4% | |
| Albemarle Corp. | 24,810 | 6,214,161 |
| Axalta Coating Systems, Ltd. (A) | 90,958 | 2,836,980 |
| Celanese Corp. | 33,971 | 5,486,656 |
| CF Industries Holdings, Inc. | 94,452 | 5,364,874 |
| Corteva, Inc. | 111,098 | 4,793,879 |
| Eastman Chemical Company | 47,026 | 4,892,115 |
| FMC Corp. | 43,440 | 3,953,474 |
| Huntsman Corp. | 98,160 | 3,198,053 |
| International Flavors & Fragrances, Inc. | 20,245 | 2,985,125 |
| LyondellBasell Industries NV, Class A | 52,721 | 4,893,563 |
| Olin Corp. | 36,137 | 2,059,086 |
| RPM International, Inc. | 52,800 | 4,604,160 |
| The Mosaic Company | 120,572 | 5,012,178 |
| The Scotts Miracle-Gro Company | 13,565 | 2,013,860 |
| Westlake Chemical Corp. | 15,164 | 1,476,064 |
| Construction materials – 0.5% | |
| Eagle Materials, Inc. | 6,612 | 980,956 |
| Martin Marietta Materials, Inc. | 15,692 | 6,164,445 |
| Vulcan Materials Company | 33,298 | 6,330,616 |
| Containers and packaging – 2.3% | |
| Amcor PLC | 388,139 | 4,684,838 |
| AptarGroup, Inc. | 27,696 | 3,345,123 |
| Ardagh Metal Packaging SA (A) | 9,227 | 90,886 |
| Avery Dennison Corp. | 26,274 | 5,720,375 |
| Ball Corp. | 80,433 | 7,358,011 |
| Berry Global Group, Inc. (A) | 73,135 | 4,793,268 |
| Crown Holdings, Inc. | 48,792 | 5,073,880 |
| Graphic Packaging Holding Company | 83,994 | 1,674,000 |
| International Paper Company | 114,026 | 5,663,671 |
| Packaging Corp. of America | 42,216 | 5,799,212 |
| Sealed Air Corp. | 62,674 | 3,717,822 |
| Sonoco Products Company | 57,040 | 3,305,468 |
| Westrock Company | 104,698 | 5,035,974 |
| Metals and mining – 1.2% | |
| Alcoa Corp. | 45,184 | 2,076,205 |
| 64 | JOHN HANCOCK MULTIFACTOR ETFS | SEMIANNUAL REPORT | SEE NOTES TO FINANCIAL STATEMENTS |
MULTIFACTOR MID CAP ETF (continued)
| | Shares or
Principal
Amount | Value |
| Materials (continued) | |
| Metals and mining (continued) | |
| Cleveland-Cliffs, Inc. (A)(B) | 154,092 | $3,715,158 |
| Nucor Corp. | 83,977 | 9,376,032 |
| Reliance Steel & Aluminum Company | 31,757 | 4,641,603 |
| Royal Gold, Inc. | 18,347 | 1,816,720 |
| Steel Dynamics, Inc. | 98,962 | 6,539,409 |
| U.S. Steel Corp. | 41,131 | 1,085,447 |
| Paper and forest products – 0.0% | |
| Sylvamo Corp. (A) | 10,310 | 290,324 |
| Real estate – 5.8% | 143,566,368 |
| Equity real estate investment trusts – 5.2% | |
| Alexandria Real Estate Equities, Inc. | 21,346 | 4,357,572 |
| American Campus Communities, Inc. | 35,752 | 1,920,597 |
| American Homes 4 Rent, Class A | 71,298 | 2,894,699 |
| Americold Realty Trust | 49,408 | 1,456,054 |
| Apartment Income REIT Corp. | 38,685 | 2,073,903 |
| Boston Properties, Inc. | 13,485 | 1,532,435 |
| Brixmor Property Group, Inc. | 64,853 | 1,520,154 |
| Camden Property Trust | 25,414 | 4,145,023 |
| CoreSite Realty Corp. | 10,814 | 1,540,562 |
| CubeSmart | 51,676 | 2,842,697 |
| CyrusOne, Inc. | 29,669 | 2,433,451 |
| Douglas Emmett, Inc. | 43,066 | 1,407,397 |
| Duke Realty Corp. | 83,235 | 4,681,136 |
| EastGroup Properties, Inc. | 9,769 | 1,932,113 |
| Equity LifeStyle Properties, Inc. | 41,030 | 3,467,445 |
| Essex Property Trust, Inc. | 10,370 | 3,525,074 |
| Extra Space Storage, Inc. | 26,478 | 5,225,963 |
| Federal Realty Investment Trust | 19,796 | 2,382,449 |
| First Industrial Realty Trust, Inc. | 31,664 | 1,843,795 |
| Gaming and Leisure Properties, Inc. | 57,537 | 2,789,969 |
| Healthcare Trust of America, Inc., Class A | 56,252 | 1,878,254 |
| Healthpeak Properties, Inc. | 82,875 | 2,942,891 |
| Host Hotels & Resorts, Inc. (A) | 172,208 | 2,898,261 |
| Invitation Homes, Inc. | 88,284 | 3,641,715 |
| Iron Mountain, Inc. | 74,355 | 3,393,562 |
| Kilroy Realty Corp. | 29,546 | 1,990,809 |
| Kimco Realty Corp. | 131,226 | 2,965,708 |
| Lamar Advertising Company, Class A | 26,857 | 3,040,212 |
| Life Storage, Inc. | 19,394 | 2,595,111 |
| Medical Properties Trust, Inc. | 147,108 | 3,137,814 |
| MGM Growth Properties LLC, Class A | 37,045 | 1,458,832 |
| Mid-America Apartment Communities, Inc. | 19,285 | 3,938,190 |
| National Retail Properties, Inc. | 45,018 | 2,042,016 |
| National Storage Affiliates Trust | 10,416 | 650,583 |
| Omega Healthcare Investors, Inc. | 60,772 | 1,784,266 |
| Realty Income Corp. | 58,092 | 4,149,512 |
| Regency Centers Corp. | 42,313 | 2,979,258 |
| Rexford Industrial Realty, Inc. | 32,476 | 2,182,387 |
| STAG Industrial, Inc. | 20,641 | 898,503 |
MULTIFACTOR MID CAP ETF (continued)
| | Shares or
Principal
Amount | Value |
| Real estate (continued) | |
| Equity real estate investment trusts (continued) | |
| STORE Capital Corp. | 61,554 | $2,113,149 |
| Sun Communities, Inc. | 18,692 | 3,663,258 |
| UDR, Inc. | 60,349 | 3,351,180 |
| Ventas, Inc. | 49,586 | 2,646,405 |
| VEREIT, Inc. | 58,534 | 2,944,260 |
| VICI Properties, Inc. | 83,220 | 2,442,507 |
| Vornado Realty Trust | 36,290 | 1,547,043 |
| Weyerhaeuser Company | 137,695 | 4,918,465 |
| WP Carey, Inc. | 37,645 | 2,902,806 |
| Real estate management and development – 0.6% | |
| CBRE Group, Inc., Class A (A) | 80,198 | 8,347,008 |
| eXp World Holdings, Inc. | 16,578 | 855,425 |
| Jones Lang LaSalle, Inc. (A) | 20,503 | 5,294,490 |
| Utilities – 4.3% | 106,118,728 |
| Electric utilities – 1.8% | |
| Alliant Energy Corp. | 70,613 | 3,994,577 |
| Avangrid, Inc. | 12,141 | 639,831 |
| Edison International | 74,055 | 4,660,281 |
| Entergy Corp. | 53,603 | 5,522,181 |
| Evergy, Inc. | 90,974 | 5,799,593 |
| Eversource Energy | 66,942 | 5,683,376 |
| FirstEnergy Corp. | 134,158 | 5,169,108 |
| NRG Energy, Inc. | 84,685 | 3,378,085 |
| OGE Energy Corp. | 86,762 | 2,955,981 |
| Pinnacle West Capital Corp. | 43,540 | 2,807,895 |
| PPL Corp. | 149,782 | 4,313,722 |
| Gas utilities – 0.3% | |
| Atmos Energy Corp. | 35,436 | 3,264,364 |
| UGI Corp. | 91,162 | 3,957,342 |
| Independent power and renewable electricity producers –0.4% | |
| Brookfield Renewable Corp., Class A | 32,774 | 1,357,171 |
| Clearway Energy, Inc., Class A | 5,806 | 191,540 |
| Clearway Energy, Inc., Class C | 14,803 | 525,210 |
| The AES Corp. | 220,898 | 5,551,167 |
| Vistra Corp. | 138,992 | 2,722,853 |
| Multi-utilities – 1.4% | |
| Ameren Corp. | 69,858 | 5,888,331 |
| CenterPoint Energy, Inc. | 238,185 | 6,202,337 |
| CMS Energy Corp. | 78,077 | 4,711,947 |
| DTE Energy Company | 48,514 | 5,499,062 |
| MDU Resources Group, Inc. | 91,927 | 2,824,917 |
| NiSource, Inc. | 141,249 | 3,484,613 |
| WEC Energy Group, Inc. | 56,795 | 5,114,958 |
| Water utilities – 0.4% | |
| American Water Works Company, Inc. | 41,543 | 7,235,960 |
| Essential Utilities, Inc. | 56,561 | 2,662,326 |
| SEE NOTES TO FINANCIAL STATEMENTS | SEMIANNUAL REPORT | JOHN HANCOCK MULTIFACTOR ETFS | 65 |
MULTIFACTOR MID CAP ETF (continued)
| | Shares or
Principal
Amount | Value |
|
| SHORT-TERM INVESTMENTS – 0.3% | | $7,987,330 |
| (Cost $7,987,467) | | |
| Short-term funds – 0.3% | 7,987,330 |
| John Hancock Collateral Trust, 0.0370% (C)(D) | 596,573 | $5,969,075 |
|
| State Street Institutional U.S. Government Money Market Fund, Premier Class, 0.0250% (C) | 2,018,255 | 2,018,255 |
| Total investments (Multifactor Mid Cap ETF) (Cost $1,852,741,597) 100.3% | $2,490,650,894 |
| Other assets and liabilities, net (0.3%) | | (6,294,072) |
| Total net assets 100.0% | | $2,484,356,822 |
| The percentage shown for each investment category is the total value of the category as a percentage of the net assets of the fund. |
| Security Abbreviations and Legend |
| (A) | Non-income producing security. |
| (B) | All or a portion of this security is on loan as of 10-31-21. |
| (C) | The rate shown is the annualized seven-day yield as of 10-31-21. |
| (D) | Investment is an affiliate of the fund, the advisor and/or subadvisor. This security represents the investment of cash collateral received for securities lending. |
MULTIFACTOR SMALL CAP ETF
As of 10-31-21 (unaudited)
| | Shares or
Principal
Amount | Value |
| COMMON STOCKS – 99.9% | | $443,448,315 |
| (Cost $360,204,995) | | |
| Communication services – 2.2% | 9,691,270 |
| Diversified telecommunication services – 0.3% | |
| Iridium Communications, Inc. (A) | 32,853 | 1,332,189 |
| Entertainment – 0.4% | |
| Madison Square Garden Sports Corp. (A) | 5,595 | 1,060,308 |
| World Wrestling Entertainment, Inc., Class A | 13,734 | 839,010 |
| Interactive media and services – 0.9% | |
| Angi, Inc. (A) | 10,453 | 130,976 |
| FuboTV, Inc. (A)(B) | 15,774 | 470,223 |
| TripAdvisor, Inc. (A) | 26,592 | 876,738 |
| Vimeo, Inc. (A) | 18,328 | 618,203 |
| Ziff Davis, Inc. (A) | 12,807 | 1,642,754 |
| Media – 0.6% | |
| iHeartMedia, Inc., Class A (A) | 14,287 | 276,882 |
| Nexstar Media Group, Inc., Class A | 11,179 | 1,676,067 |
| TEGNA, Inc. | 39,060 | 767,920 |
| Consumer discretionary – 14.9% | 66,227,493 |
| Auto components – 0.9% | |
| Adient PLC (A) | 16,705 | 695,262 |
| Fox Factory Holding Corp. (A) | 11,697 | 1,882,632 |
| The Goodyear Tire & Rubber Company (A) | 46,553 | 890,093 |
| Veoneer, Inc. (A)(B) | 13,858 | 487,802 |
| Automobiles – 0.6% | |
| Harley-Davidson, Inc. | 43,251 | 1,578,229 |
MULTIFACTOR SMALL CAP ETF (continued)
| | Shares or
Principal
Amount | Value |
| Consumer discretionary (continued) | |
| Automobiles (continued) | |
| Thor Industries, Inc. | 12,591 | $1,283,778 |
| Diversified consumer services – 0.9% | |
| Coursera, Inc. (A) | 8,422 | 294,012 |
| frontdoor, Inc. (A) | 23,472 | 875,036 |
| Grand Canyon Education, Inc. (A) | 13,572 | 1,081,688 |
| H&R Block, Inc. | 31,055 | 716,439 |
| Terminix Global Holdings, Inc. (A) | 21,777 | 881,533 |
| Hotels, restaurants and leisure – 4.0% | |
| Boyd Gaming Corp. (A) | 22,458 | 1,432,371 |
| Choice Hotels International, Inc. | 8,462 | 1,189,926 |
| Hilton Grand Vacations, Inc. (A) | 15,594 | 784,066 |
| International Game Technology PLC (A) | 18,396 | 542,498 |
| Marriott Vacations Worldwide Corp. | 9,726 | 1,529,122 |
| Papa John’s International, Inc. | 4,288 | 532,055 |
| Planet Fitness, Inc., Class A (A) | 12,636 | 1,005,194 |
| Red Rock Resorts, Inc., Class A (A) | 11,098 | 603,842 |
| Scientific Games Corp. (A) | 16,124 | 1,290,726 |
| SeaWorld Entertainment, Inc. (A) | 8,915 | 566,103 |
| Shake Shack, Inc., Class A (A) | 6,630 | 458,597 |
| Six Flags Entertainment Corp. (A) | 13,090 | 538,392 |
| Texas Roadhouse, Inc. | 17,702 | 1,572,115 |
| The Wendy’s Company | 55,650 | 1,240,995 |
| Travel + Leisure Company | 14,935 | 811,568 |
| Wingstop, Inc. | 8,513 | 1,468,237 |
| Wyndham Hotels & Resorts, Inc. | 25,447 | 2,149,508 |
| Household durables – 2.0% | |
| Helen of Troy, Ltd. (A) | 6,407 | 1,441,255 |
| Installed Building Products, Inc. | 3,140 | 398,937 |
| KB Home | 24,231 | 972,875 |
| Leggett & Platt, Inc. | 34,001 | 1,592,947 |
| LGI Homes, Inc. (A) | 2,859 | 426,849 |
| MDC Holdings, Inc. | 9,728 | 476,477 |
| Sonos, Inc. (A) | 21,393 | 697,840 |
| Toll Brothers, Inc. | 13,426 | 807,842 |
| TopBuild Corp. (A) | 8,790 | 2,258,766 |
| Internet and direct marketing retail – 0.6% | |
| ContextLogic, Inc., Class A (A)(B) | 54,898 | 279,980 |
| Magnite, Inc. (A) | 20,963 | 566,630 |
| Qurate Retail, Inc., Series A | 115,770 | 1,208,639 |
| Revolve Group, Inc. (A) | 4,738 | 355,540 |
| Shutterstock, Inc. | 3,149 | 381,501 |
| Leisure products – 1.2% | |
| Acushnet Holdings Corp. | 4,622 | 235,445 |
| Brunswick Corp. | 20,091 | 1,870,271 |
| Hayward Holdings, Inc. (A) | 6,111 | 141,714 |
| Mattel, Inc. (A) | 93,237 | 2,033,499 |
| Polaris, Inc. | 7,752 | 891,092 |
| Multiline retail – 0.6% | |
| Dillard’s, Inc., Class A | 660 | 152,552 |
| 66 | JOHN HANCOCK MULTIFACTOR ETFS | SEMIANNUAL REPORT | SEE NOTES TO FINANCIAL STATEMENTS |
MULTIFACTOR SMALL CAP ETF (continued)
| | Shares or
Principal
Amount | Value |
| Consumer discretionary (continued) | |
| Multiline retail (continued) | |
| Macy’s, Inc. | 55,243 | $1,462,282 |
| Nordstrom, Inc. (A) | 19,839 | 569,974 |
| Ollie’s Bargain Outlet Holdings, Inc. (A) | 6,629 | 448,518 |
| Specialty retail – 2.6% | |
| Academy Sports & Outdoors, Inc. (A) | 9,596 | 410,517 |
| American Eagle Outfitters, Inc. | 29,593 | 702,538 |
| Asbury Automotive Group, Inc. (A) | 2,638 | 516,283 |
| AutoNation, Inc. (A) | 16,405 | 1,986,974 |
| Camping World Holdings, Inc., Class A | 5,480 | 204,130 |
| Foot Locker, Inc. | 28,278 | 1,348,012 |
| Leslie’s, Inc. (A) | 15,669 | 324,035 |
| Murphy USA, Inc. | 7,476 | 1,218,214 |
| National Vision Holdings, Inc. (A) | 23,385 | 1,441,451 |
| Penske Automotive Group, Inc. | 9,372 | 993,901 |
| Petco Health & Wellness Company, Inc. (A) | 10,402 | 257,241 |
| Rent-A-Center, Inc. | 10,341 | 550,762 |
| Signet Jewelers, Ltd. | 6,331 | 564,599 |
| Victoria’s Secret & Company (A) | 12,664 | 639,152 |
| Vroom, Inc. (A) | 16,318 | 312,163 |
| Textiles, apparel and luxury goods – 1.5% | |
| Carter’s, Inc. | 12,201 | 1,202,043 |
| Columbia Sportswear Company | 4,810 | 499,470 |
| Hanesbrands, Inc. | 88,028 | 1,499,997 |
| PVH Corp. (A) | 16,451 | 1,798,588 |
| Skechers USA, Inc., Class A (A) | 36,879 | 1,704,179 |
| Consumer staples – 3.0% | 13,496,944 |
| Beverages – 0.3% | |
| Celsius Holdings, Inc. (A) | 6,131 | 591,764 |
| Coca-Cola Consolidated, Inc. | 625 | 250,875 |
| National Beverage Corp. | 6,647 | 374,891 |
| Food and staples retailing – 0.6% | |
| BJ’s Wholesale Club Holdings, Inc. (A) | 16,260 | 950,234 |
| Performance Food Group Company (A) | 36,330 | 1,643,206 |
| Food products – 1.8% | |
| Flowers Foods, Inc. | 43,424 | 1,074,744 |
| Freshpet, Inc. (A) | 11,631 | 1,813,389 |
| Ingredion, Inc. | 11,527 | 1,097,716 |
| Lancaster Colony Corp. | 5,761 | 979,370 |
| Pilgrim’s Pride Corp. (A) | 7,987 | 224,914 |
| Post Holdings, Inc. (A) | 10,335 | 1,048,796 |
| Sanderson Farms, Inc. | 3,556 | 673,684 |
| Seaboard Corp. | 79 | 304,152 |
| The Hain Celestial Group, Inc. (A) | 22,987 | 1,031,427 |
| Household products – 0.0% | |
| Reynolds Consumer Products, Inc. | 7,201 | 194,283 |
| Personal products – 0.3% | |
| BellRing Brands, Inc., Class A (A) | 5,262 | 141,127 |
| Coty, Inc., Class A (A) | 34,636 | 293,713 |
MULTIFACTOR SMALL CAP ETF (continued)
| | Shares or
Principal
Amount | Value |
| Consumer staples (continued) | |
| Personal products (continued) | |
| Herbalife Nutrition, Ltd. (A) | 17,428 | $808,659 |
| Energy – 3.1% | 13,960,814 |
| Energy equipment and services – 0.4% | |
| ChampionX Corp. (A) | 35,050 | 919,362 |
| NOV, Inc. (A) | 66,878 | 937,630 |
| Oil, gas and consumable fuels – 2.7% | |
| Antero Midstream Corp. | 92,745 | 986,807 |
| Antero Resources Corp. (A) | 33,233 | 660,340 |
| APA Corp. | 9,931 | 260,292 |
| Chesapeake Energy Corp. | 12,645 | 805,992 |
| Coterra Energy, Inc. | 72,886 | 1,553,930 |
| DT Midstream, Inc. | 12,967 | 621,897 |
| EQT Corp. (A) | 76,987 | 1,532,811 |
| Equitrans Midstream Corp. | 118,938 | 1,226,251 |
| HollyFrontier Corp. | 27,134 | 917,129 |
| Magnolia Oil & Gas Corp., Class A | 18,999 | 396,699 |
| Ovintiv, Inc. | 42,719 | 1,602,817 |
| PDC Energy, Inc. | 16,471 | 861,598 |
| Range Resources Corp. (A) | 29,042 | 677,259 |
| Financials – 16.6% | 73,825,566 |
| Banks – 7.1% | |
| Bank OZK | 32,621 | 1,457,180 |
| BankUnited, Inc. | 16,121 | 653,868 |
| BOK Financial Corp. | 8,649 | 875,019 |
| CIT Group, Inc. | 17,142 | 849,043 |
| Community Bank System, Inc. | 14,664 | 1,050,969 |
| Cullen/Frost Bankers, Inc. | 15,689 | 2,031,726 |
| Eastern Bankshares, Inc. | 23,344 | 484,855 |
| First Financial Bankshares, Inc. | 37,743 | 1,914,325 |
| First Hawaiian, Inc. | 22,928 | 632,584 |
| FNB Corp. | 56,146 | 654,101 |
| Glacier Bancorp, Inc. | 25,082 | 1,386,784 |
| Hancock Whitney Corp. | 11,572 | 572,583 |
| Home BancShares, Inc. | 26,590 | 631,778 |
| Pacific Premier Bancorp, Inc. | 16,387 | 688,090 |
| PacWest Bancorp | 20,387 | 967,771 |
| People’s United Financial, Inc. | 62,410 | 1,069,707 |
| Pinnacle Financial Partners, Inc. | 20,178 | 1,948,589 |
| Popular, Inc. | 22,483 | 1,831,016 |
| Prosperity Bancshares, Inc. | 13,298 | 1,001,472 |
| ServisFirst Bancshares, Inc. | 6,458 | 518,642 |
| SouthState Corp. | 19,200 | 1,499,328 |
| Sterling Bancorp | 33,995 | 865,173 |
| Synovus Financial Corp. | 36,965 | 1,722,199 |
| UMB Financial Corp. | 7,900 | 780,678 |
| Umpqua Holdings Corp. | 38,147 | 780,106 |
| United Bankshares, Inc. | 35,697 | 1,320,432 |
| Valley National Bancorp | 106,170 | 1,407,814 |
| SEE NOTES TO FINANCIAL STATEMENTS | SEMIANNUAL REPORT | JOHN HANCOCK MULTIFACTOR ETFS | 67 |
MULTIFACTOR SMALL CAP ETF (continued)
| | Shares or
Principal
Amount | Value |
| Financials (continued) | |
| Banks (continued) | |
| Webster Financial Corp. | 15,958 | $893,010 |
| Wintrust Financial Corp. | 10,216 | 904,116 |
| Capital markets – 3.6% | |
| Affiliated Managers Group, Inc. | 10,952 | 1,838,622 |
| Artisan Partners Asset Management, Inc., Class A | 19,278 | 955,032 |
| Cohen & Steers, Inc. | 6,718 | 637,471 |
| Evercore, Inc., Class A | 6,170 | 936,853 |
| Hamilton Lane, Inc., Class A | 8,801 | 919,793 |
| Houlihan Lokey, Inc. | 14,625 | 1,639,170 |
| Interactive Brokers Group, Inc., Class A | 21,035 | 1,490,330 |
| Janus Henderson Group PLC | 43,632 | 2,028,888 |
| Lazard, Ltd., Class A | 30,147 | 1,476,902 |
| Moelis & Company, Class A | 10,286 | 748,204 |
| Open Lending Corp., Class A (A) | 12,793 | 403,235 |
| StepStone Group, Inc., Class A | 5,197 | 244,155 |
| Stifel Financial Corp. | 26,783 | 1,951,677 |
| Virtu Financial, Inc., Class A | 23,219 | 577,689 |
| Consumer finance – 0.7% | |
| Navient Corp. | 22,092 | 435,212 |
| OneMain Holdings, Inc. | 18,577 | 981,051 |
| SLM Corp. | 87,293 | 1,601,827 |
| Insurance – 3.5% | |
| Assured Guaranty, Ltd. | 9,578 | 532,345 |
| Axis Capital Holdings, Ltd. | 23,645 | 1,231,195 |
| Brighthouse Financial, Inc. (A) | 14,677 | 737,226 |
| BRP Group, Inc., Class A (A) | 5,447 | 198,816 |
| Enstar Group, Ltd. (A) | 3,070 | 708,495 |
| First American Financial Corp. | 13,267 | 970,348 |
| Goosehead Insurance, Inc., Class A | 2,354 | 339,682 |
| Kemper Corp. | 15,321 | 972,577 |
| Kinsale Capital Group, Inc. | 6,604 | 1,235,939 |
| Old Republic International Corp. | 77,250 | 1,995,368 |
| Primerica, Inc. | 11,083 | 1,864,604 |
| RLI Corp. | 11,601 | 1,256,504 |
| Selective Insurance Group, Inc. | 16,125 | 1,263,716 |
| The Hanover Insurance Group, Inc. | 9,851 | 1,241,226 |
| Unum Group | 49,195 | 1,252,997 |
| Mortgage real estate investment trusts – 0.3% | |
| Hannon Armstrong Sustainable Infrastructure Capital, Inc. | 23,186 | 1,400,434 |
| Thrifts and mortgage finance – 1.4% | |
| Essent Group, Ltd. | 30,282 | 1,453,536 |
| MGIC Investment Corp. | 93,238 | 1,506,726 |
| New York Community Bancorp, Inc. | 128,027 | 1,591,376 |
| PennyMac Financial Services, Inc. | 4,291 | 266,299 |
| Radian Group, Inc. | 51,827 | 1,237,110 |
| TFS Financial Corp. | 15,929 | 309,978 |
MULTIFACTOR SMALL CAP ETF (continued)
| | Shares or
Principal
Amount | Value |
| Health care – 10.2% | $45,163,458 |
| Biotechnology – 2.7% | |
| Alkermes PLC (A) | 22,100 | 669,409 |
| Allakos, Inc. (A) | 8,520 | 856,942 |
| Apellis Pharmaceuticals, Inc. (A) | 10,143 | 311,796 |
| Arrowhead Pharmaceuticals, Inc. (A) | 13,677 | 872,866 |
| Beam Therapeutics, Inc. (A) | 5,102 | 452,905 |
| Blueprint Medicines Corp. (A) | 15,894 | 1,787,916 |
| CareDx, Inc. (A) | 6,549 | 333,999 |
| Denali Therapeutics, Inc. (A) | 10,069 | 486,836 |
| Editas Medicine, Inc. (A) | 7,954 | 292,071 |
| Exelixis, Inc. (A) | 33,778 | 726,565 |
| Fate Therapeutics, Inc. (A) | 10,609 | 570,764 |
| Halozyme Therapeutics, Inc. (A) | 39,167 | 1,491,088 |
| ImmunityBio, Inc. (A) | 10,218 | 80,007 |
| Iovance Biotherapeutics, Inc. (A) | 41,339 | 1,004,951 |
| Kodiak Sciences, Inc. (A) | 5,320 | 622,919 |
| Sana Biotechnology, Inc. (A) | 3,463 | 71,823 |
| SpringWorks Therapeutics, Inc. (A) | 4,090 | 274,275 |
| Turning Point Therapeutics, Inc. (A) | 4,241 | 176,341 |
| Ultragenyx Pharmaceutical, Inc. (A) | 8,288 | 695,529 |
| Vir Biotechnology, Inc. (A) | 10,616 | 400,542 |
| Health care equipment and supplies – 2.5% | |
| CONMED Corp. | 5,098 | 745,735 |
| Envista Holdings Corp. (A) | 42,609 | 1,666,012 |
| ICU Medical, Inc. (A) | 6,081 | 1,423,745 |
| Inari Medical, Inc. (A) | 5,386 | 487,541 |
| Integra LifeSciences Holdings Corp. (A) | 20,806 | 1,382,767 |
| LivaNova PLC (A) | 8,604 | 660,099 |
| Merit Medical Systems, Inc. (A) | 7,147 | 480,707 |
| Neogen Corp. (A) | 31,660 | 1,339,535 |
| Ortho Clinical Diagnostics Holdings PLC (A) | 11,730 | 231,902 |
| Shockwave Medical, Inc. (A) | 227 | 48,510 |
| STAAR Surgical Company (A) | 8,533 | 1,010,819 |
| Tandem Diabetes Care, Inc. (A) | 11,125 | 1,516,671 |
| Health care providers and services – 2.5% | |
| Acadia Healthcare Company, Inc. (A) | 15,147 | 939,114 |
| AMN Healthcare Services, Inc. (A) | 8,136 | 803,023 |
| Apollo Medical Holdings, Inc. (A)(B) | 4,791 | 328,806 |
| Chemed Corp. | 499 | 240,643 |
| HealthEquity, Inc. (A) | 21,098 | 1,396,266 |
| LHC Group, Inc. (A) | 3,753 | 505,116 |
| Option Care Health, Inc. (A) | 17,359 | 474,421 |
| Premier, Inc., Class A | 36,582 | 1,424,869 |
| Progyny, Inc. (A) | 8,758 | 538,004 |
| R1 RCM, Inc. (A) | 18,193 | 394,788 |
| Select Medical Holdings Corp. | 18,103 | 601,382 |
| Signify Health, Inc., Class A (A)(B) | 3,321 | 53,368 |
| Surgery Partners, Inc. (A) | 4,013 | 165,095 |
| Tenet Healthcare Corp. (A) | 26,848 | 1,923,928 |
| The Ensign Group, Inc. | 15,983 | 1,246,834 |
| 68 | JOHN HANCOCK MULTIFACTOR ETFS | SEMIANNUAL REPORT | SEE NOTES TO FINANCIAL STATEMENTS |
MULTIFACTOR SMALL CAP ETF (continued)
| | Shares or
Principal
Amount | Value |
| Health care (continued) | |
| Health care technology – 1.2% | |
| Certara, Inc. (A) | 8,236 | $340,229 |
| Change Healthcare, Inc. (A) | 68,989 | 1,485,333 |
| Inovalon Holdings, Inc., Class A (A) | 19,721 | 804,420 |
| Inspire Medical Systems, Inc. (A) | 4,619 | 1,245,190 |
| Omnicell, Inc. (A) | 7,485 | 1,333,453 |
| Life sciences tools and services – 1.0% | |
| Medpace Holdings, Inc. (A) | 7,959 | 1,803,111 |
| NeoGenomics, Inc. (A) | 32,040 | 1,473,840 |
| Pacific Biosciences of California, Inc. (A) | 33,646 | 890,946 |
| Sotera Health Company (A) | 13,229 | 326,756 |
| Pharmaceuticals – 0.3% | |
| Arvinas, Inc. (A) | 5,204 | 450,562 |
| Perrigo Company PLC | 17,727 | 800,374 |
| Industrials – 17.7% | 78,347,354 |
| Aerospace and defense – 1.1% | |
| BWX Technologies, Inc. | 17,240 | 978,198 |
| Curtiss-Wright Corp. | 11,996 | 1,531,649 |
| Hexcel Corp. (A) | 14,372 | 815,467 |
| Parsons Corp. (A) | 6,120 | 211,997 |
| Spirit AeroSystems Holdings, Inc., Class A | 17,624 | 727,695 |
| Virgin Galactic Holdings, Inc. (A) | 22,583 | 423,431 |
| Airlines – 0.1% | |
| Alaska Air Group, Inc. (A) | 4,379 | 231,211 |
| JetBlue Airways Corp. (A) | 24,806 | 348,028 |
| Building products – 1.5% | |
| Armstrong World Industries, Inc. | 14,097 | 1,489,348 |
| Resideo Technologies, Inc. (A) | 24,129 | 595,021 |
| Simpson Manufacturing Company, Inc. | 12,271 | 1,301,830 |
| The AZEK Company, Inc. (A) | 18,903 | 693,551 |
| UFP Industries, Inc. | 17,299 | 1,415,577 |
| Zurn Water Solutions Corp. | 30,373 | 1,101,932 |
| Commercial services and supplies – 1.8% | |
| ADT, Inc. | 24,642 | 205,761 |
| Casella Waste Systems, Inc., Class A (A) | 6,517 | 565,154 |
| Clean Harbors, Inc. (A) | 14,390 | 1,619,451 |
| Driven Brands Holdings, Inc. (A) | 5,437 | 176,539 |
| IAA, Inc. (A) | 19,296 | 1,151,006 |
| MSA Safety, Inc. | 10,360 | 1,585,391 |
| Stericycle, Inc. (A) | 16,080 | 1,076,074 |
| Tetra Tech, Inc. | 1,028 | 180,578 |
| The Brink’s Company | 8,454 | 582,312 |
| UniFirst Corp. | 4,153 | 822,128 |
| Construction and engineering – 1.5% | |
| API Group Corp. (A) | 26,647 | 580,372 |
| EMCOR Group, Inc. | 14,555 | 1,768,287 |
| MasTec, Inc. (A) | 15,265 | 1,360,569 |
| Valmont Industries, Inc. | 3,757 | 897,773 |
| WillScot Mobile Mini Holdings Corp. (A) | 55,166 | 1,917,019 |
MULTIFACTOR SMALL CAP ETF (continued)
| | Shares or
Principal
Amount | Value |
| Industrials (continued) | |
| Electrical equipment – 2.3% | |
| Acuity Brands, Inc. | 10,014 | $2,057,176 |
| Atkore, Inc. (A) | 6,145 | 580,887 |
| Bloom Energy Corp., Class A (A) | 23,285 | 727,889 |
| EnerSys | 12,336 | 987,373 |
| nVent Electric PLC | 47,477 | 1,683,060 |
| Regal Rexnord Corp. | 18,133 | 2,762,189 |
| Shoals Technologies Group, Inc., Class A (A) | 17,107 | 530,146 |
| Vicor Corp. (A) | 6,552 | 993,218 |
| Machinery – 3.6% | |
| Allison Transmission Holdings, Inc. | 31,417 | 1,048,071 |
| Altra Industrial Motion Corp. | 11,051 | 576,310 |
| Chart Industries, Inc. (A) | 6,213 | 1,102,932 |
| Colfax Corp. (A) | 26,169 | 1,350,844 |
| Crane Company | 14,010 | 1,446,953 |
| Evoqua Water Technologies Corp. (A) | 15,796 | 660,747 |
| Flowserve Corp. | 37,179 | 1,249,958 |
| Franklin Electric Company, Inc. | 7,242 | 625,564 |
| Gates Industrial Corp. PLC (A) | 12,620 | 207,473 |
| John Bean Technologies Corp. | 8,919 | 1,317,782 |
| Oshkosh Corp. | 16,673 | 1,784,011 |
| RBC Bearings, Inc. (A) | 7,067 | 1,653,183 |
| The Timken Company | 18,536 | 1,315,129 |
| Watts Water Technologies, Inc., Class A | 7,731 | 1,469,045 |
| Marine – 0.1% | |
| ZIM Integrated Shipping Services, Ltd. | 9,116 | 466,922 |
| Professional services – 2.8% | |
| ASGN, Inc. (A) | 14,230 | 1,702,762 |
| CACI International, Inc., Class A (A) | 3,274 | 941,733 |
| Exponent, Inc. | 14,405 | 1,653,694 |
| FTI Consulting, Inc. (A) | 9,781 | 1,407,682 |
| Insperity, Inc. | 4,663 | 582,875 |
| KBR, Inc. | 39,303 | 1,668,019 |
| Korn Ferry | 7,200 | 555,912 |
| ManpowerGroup, Inc. | 14,602 | 1,411,283 |
| Science Applications International Corp. | 16,200 | 1,454,436 |
| TriNet Group, Inc. (A) | 11,957 | 1,210,646 |
| Road and rail – 1.5% | |
| Avis Budget Group, Inc. (A) | 8,020 | 1,389,946 |
| Landstar System, Inc. | 10,316 | 1,813,656 |
| Ryder System, Inc. | 8,860 | 752,657 |
| Saia, Inc. (A) | 7,132 | 2,229,748 |
| Schneider National, Inc., Class B | 16,411 | 409,290 |
| Trading companies and distributors – 1.4% | |
| Air Lease Corp. | 28,790 | 1,153,040 |
| Beacon Roofing Supply, Inc. (A) | 7,296 | 385,740 |
| Herc Holdings, Inc. | 3,417 | 622,031 |
| MSC Industrial Direct Company, Inc., Class A | 11,151 | 937,465 |
| Triton International, Ltd. | 11,551 | 718,357 |
| Univar Solutions, Inc. (A) | 48,981 | 1,252,934 |
| SEE NOTES TO FINANCIAL STATEMENTS | SEMIANNUAL REPORT | JOHN HANCOCK MULTIFACTOR ETFS | 69 |
MULTIFACTOR SMALL CAP ETF (continued)
| | Shares or
Principal
Amount | Value |
| Industrials (continued) | |
| Trading companies and distributors (continued) | |
| WESCO International, Inc. (A) | 8,824 | $1,143,237 |
| Information technology – 14.5% | 64,271,343 |
| Communications equipment – 0.6% | |
| Lumentum Holdings, Inc. (A) | 12,996 | 1,073,210 |
| ViaSat, Inc. (A) | 12,065 | 720,160 |
| Viavi Solutions, Inc. (A) | 68,015 | 1,047,431 |
| Electronic equipment, instruments and components – 2.5% | |
| Avnet, Inc. | 17,697 | 674,433 |
| Coherent, Inc. (A) | 4,320 | 1,099,008 |
| Fabrinet (A) | 4,779 | 458,784 |
| II-VI, Inc. (A) | 15,340 | 928,223 |
| Itron, Inc. (A) | 7,805 | 606,995 |
| Littelfuse, Inc. | 6,619 | 1,949,626 |
| National Instruments Corp. | 35,622 | 1,512,866 |
| Novanta, Inc. (A) | 9,952 | 1,717,317 |
| Rogers Corp. (A) | 2,514 | 505,616 |
| SYNNEX Corp. | 7,204 | 756,420 |
| Vontier Corp. | 29,350 | 992,911 |
| IT services – 1.4% | |
| Alliance Data Systems Corp. | 8,724 | 743,721 |
| DigitalOcean Holdings, Inc. (A) | 1,600 | 156,144 |
| Euronet Worldwide, Inc. (A) | 7,272 | 815,846 |
| ExlService Holdings, Inc. (A) | 4,322 | 530,007 |
| MAXIMUS, Inc. | 17,420 | 1,473,209 |
| Perficient, Inc. (A) | 4,351 | 537,784 |
| Sabre Corp. (A) | 43,082 | 447,191 |
| Shift4 Payments, Inc., Class A (A) | 7,698 | 485,975 |
| Switch, Inc., Class A | 24,024 | 607,327 |
| TTEC Holdings, Inc. | 3,053 | 288,173 |
| Semiconductors and semiconductor equipment – 4.0% | |
| Allegro MicroSystems, Inc. (A) | 8,191 | 273,252 |
| Ambarella, Inc. (A) | 4,811 | 894,028 |
| Amkor Technology, Inc. | 24,136 | 529,061 |
| Brooks Automation, Inc. | 20,255 | 2,358,695 |
| Cirrus Logic, Inc. (A) | 17,111 | 1,382,740 |
| CMC Materials, Inc. | 8,359 | 1,073,045 |
| Diodes, Inc. (A) | 7,503 | 720,963 |
| Kulicke & Soffa Industries, Inc. | 7,797 | 444,429 |
| MACOM Technology Solutions Holdings, Inc. (A) | 8,027 | 560,445 |
| MaxLinear, Inc. (A) | 9,082 | 572,166 |
| Onto Innovation, Inc. (A) | 6,273 | 496,884 |
| Power Integrations, Inc. | 16,031 | 1,654,560 |
| Semtech Corp. (A) | 17,507 | 1,488,620 |
| Silicon Laboratories, Inc. (A) | 11,945 | 2,254,738 |
| SiTime Corp. (A) | 1,545 | 409,255 |
| SunPower Corp. (A) | 14,522 | 488,811 |
| Synaptics, Inc. (A) | 10,237 | 1,991,813 |
MULTIFACTOR SMALL CAP ETF (continued)
| | Shares or
Principal
Amount | Value |
| Information technology (continued) | |
| Software – 5.3% | |
| ACI Worldwide, Inc. (A) | 32,516 | $997,591 |
| Alarm.com Holdings, Inc. (A) | 14,107 | 1,188,656 |
| Altair Engineering, Inc., Class A (A) | 12,782 | 994,312 |
| Appfolio, Inc., Class A (A) | 2,199 | 289,586 |
| Blackline, Inc. (A) | 14,199 | 1,801,427 |
| Box, Inc., Class A (A) | 20,188 | 521,456 |
| CDK Global, Inc. | 21,753 | 946,691 |
| Cerence, Inc. (A) | 6,674 | 701,638 |
| Consensus Cloud Solutions, Inc. (A) | 4,285 | 271,369 |
| Datto Holding Corp. (A) | 6,356 | 151,908 |
| DoubleVerify Holdings, Inc. (A) | 1,912 | 75,581 |
| Duck Creek Technologies, Inc. (A) | 11,002 | 346,563 |
| Envestnet, Inc. (A) | 13,886 | 1,159,481 |
| Everbridge, Inc. (A) | 6,850 | 1,091,274 |
| Jamf Holding Corp. (A) | 9,052 | 431,328 |
| JFrog, Ltd. (A) | 6,688 | 218,631 |
| Mandiant, Inc. (A) | 67,306 | 1,173,817 |
| Mimecast, Ltd. (A) | 8,207 | 619,136 |
| NCino, Inc. (A) | 5,674 | 412,273 |
| NCR Corp. (A) | 22,894 | 905,229 |
| Nutanix, Inc., Class A (A) | 23,912 | 820,421 |
| Q2 Holdings, Inc. (A) | 13,889 | 1,089,731 |
| Qualys, Inc. (A) | 9,841 | 1,225,008 |
| Rapid7, Inc. (A) | 7,364 | 948,115 |
| Sprout Social, Inc., Class A (A) | 4,516 | 576,603 |
| SPS Commerce, Inc. (A) | 6,304 | 962,810 |
| Teradata Corp. (A) | 18,160 | 1,027,130 |
| Varonis Systems, Inc. (A) | 27,338 | 1,769,862 |
| Workiva, Inc. (A) | 4,947 | 739,824 |
| Technology hardware, storage and peripherals – 0.7% | |
| 3D Systems Corp. (A) | 15,076 | 424,540 |
| Pure Storage, Inc., Class A (A) | 71,298 | 1,915,064 |
| Xerox Holdings Corp. | 42,270 | 752,406 |
| Materials – 5.8% | 25,599,702 |
| Chemicals – 3.4% | |
| Amyris, Inc. (A) | 24,885 | 368,796 |
| Ashland Global Holdings, Inc. | 16,626 | 1,596,262 |
| Avient Corp. | 16,270 | 876,628 |
| Axalta Coating Systems, Ltd. (A) | 38,587 | 1,203,529 |
| Balchem Corp. | 8,788 | 1,345,355 |
| Diversey Holdings, Ltd. (A) | 5,715 | 99,441 |
| Element Solutions, Inc. | 37,608 | 854,078 |
| Huntsman Corp. | 55,711 | 1,815,064 |
| Livent Corp. (A) | 20,827 | 587,738 |
| NewMarket Corp. | 2,432 | 826,904 |
| Olin Corp. | 17,259 | 983,418 |
| Quaker Chemical Corp. | 4,157 | 1,021,957 |
| Sensient Technologies Corp. | 5,530 | 528,668 |
| The Chemours Company | 45,636 | 1,278,721 |
| 70 | JOHN HANCOCK MULTIFACTOR ETFS | SEMIANNUAL REPORT | SEE NOTES TO FINANCIAL STATEMENTS |
MULTIFACTOR SMALL CAP ETF (continued)
| | Shares or
Principal
Amount | Value |
| Materials (continued) | |
| Chemicals (continued) | |
| Valvoline, Inc. | 51,449 | $1,747,208 |
| Construction materials – 0.5% | |
| Eagle Materials, Inc. | 11,416 | 1,693,678 |
| Summit Materials, Inc., Class A (A) | 15,860 | 565,409 |
| Containers and packaging – 0.8% | |
| Ardagh Metal Packaging SA (A) | 13,798 | 135,910 |
| Graphic Packaging Holding Company | 73,310 | 1,461,068 |
| Silgan Holdings, Inc. | 21,801 | 876,400 |
| Sonoco Products Company | 17,553 | 1,017,196 |
| Metals and mining – 0.7% | |
| Arconic Corp. (A) | 13,031 | 383,372 |
| Commercial Metals Company | 16,185 | 520,833 |
| Royal Gold, Inc. | 11,701 | 1,158,633 |
| U.S. Steel Corp. | 40,994 | 1,081,832 |
| Paper and forest products – 0.4% | |
| Louisiana-Pacific Corp. | 26,669 | 1,571,604 |
| Real estate – 8.2% | 36,377,949 |
| Equity real estate investment trusts – 7.8% | |
| Agree Realty Corp. | 15,687 | 1,114,718 |
| American Campus Communities, Inc. | 36,687 | 1,970,826 |
| Apartment Income REIT Corp. | 17,249 | 924,719 |
| Brixmor Property Group, Inc. | 79,678 | 1,867,652 |
| Broadstone Net Lease, Inc. | 20,337 | 540,761 |
| CoreSite Realty Corp. | 5,358 | 763,301 |
| Cousins Properties, Inc. | 41,577 | 1,646,865 |
| Douglas Emmett, Inc. | 47,549 | 1,553,901 |
| EastGroup Properties, Inc. | 8,851 | 1,750,551 |
| EPR Properties | 9,845 | 494,317 |
| Essential Properties Realty Trust, Inc. | 15,682 | 467,167 |
| First Industrial Realty Trust, Inc. | 30,337 | 1,766,524 |
| Healthcare Realty Trust, Inc. | 37,035 | 1,224,377 |
| Healthcare Trust of America, Inc., Class A | 38,178 | 1,274,763 |
| Highwoods Properties, Inc. | 27,828 | 1,247,808 |
| Hudson Pacific Properties, Inc. | 42,634 | 1,097,826 |
| JBG SMITH Properties | 33,932 | 979,278 |
| Lexington Realty Trust | 35,359 | 515,181 |
| National Storage Affiliates Trust | 16,360 | 1,021,846 |
| Outfront Media, Inc. | 19,325 | 480,999 |
| Park Hotels & Resorts, Inc. (A) | 40,091 | 742,886 |
| Physicians Realty Trust | 56,182 | 1,068,020 |
| PS Business Parks, Inc. | 5,529 | 982,503 |
| Rayonier, Inc. | 37,493 | 1,399,614 |
| Ryman Hospitality Properties, Inc. (A) | 8,853 | 757,286 |
| Safehold, Inc. | 3,057 | 228,358 |
| SL Green Realty Corp. | 19,839 | 1,390,119 |
| Spirit Realty Capital, Inc. | 29,564 | 1,446,567 |
| STAG Industrial, Inc. | 41,411 | 1,802,621 |
| Terreno Realty Corp. | 18,947 | 1,385,594 |
MULTIFACTOR SMALL CAP ETF (continued)
| | Shares or
Principal
Amount | Value |
| Real estate (continued) | |
| Equity real estate investment trusts (continued) | |
| The Macerich Company | 26,867 | $486,024 |
| Real estate management and development – 0.4% | |
| Cushman & Wakefield PLC (A) | 21,692 | 398,916 |
| eXp World Holdings, Inc. | 8,133 | 419,663 |
| Newmark Group, Inc., Class A | 21,407 | 318,536 |
| The Howard Hughes Corp. (A) | 9,731 | 847,862 |
| Utilities – 3.7% | 16,486,422 |
| Electric utilities – 1.4% | |
| Hawaiian Electric Industries, Inc. | 29,275 | 1,187,394 |
| IDACORP, Inc. | 14,387 | 1,500,852 |
| OGE Energy Corp. | 29,573 | 1,007,552 |
| PNM Resources, Inc. | 23,013 | 1,144,897 |
| Portland General Electric Company | 24,407 | 1,203,509 |
| Gas utilities – 0.9% | |
| National Fuel Gas Company | 24,164 | 1,387,739 |
| New Jersey Resources Corp. | 26,304 | 994,554 |
| ONE Gas, Inc. | 13,479 | 907,137 |
| Southwest Gas Holdings, Inc. | 13,031 | 902,397 |
| Independent power and renewable electricity producers –0.8% | |
| Atlantica Sustainable Infrastructure PLC | 18,951 | 745,722 |
| Clearway Energy, Inc., Class A | 10,727 | 353,884 |
| Clearway Energy, Inc., Class C | 23,990 | 851,165 |
| Ormat Technologies, Inc. | 12,680 | 917,144 |
| Sunnova Energy International, Inc. (A) | 14,485 | 645,452 |
| Multi-utilities – 0.6% | |
| Black Hills Corp. | 16,813 | 1,116,047 |
| MDU Resources Group, Inc. | 52,749 | 1,620,977 |
|
| SHORT-TERM INVESTMENTS – 0.2% | | $665,369 |
| (Cost $665,374) | | |
| Short-term funds – 0.2% | 665,369 |
| John Hancock Collateral Trust, 0.0370% (C)(D) | 27,217 | 272,324 |
|
| State Street Institutional U.S. Government Money Market Fund, Premier Class, 0.0250% (C) | 393,045 | 393,045 |
| Total investments (Multifactor Small Cap ETF) (Cost $360,870,369) 100.1% | $444,113,684 |
| Other assets and liabilities, net (0.1%) | | (414,544) |
| Total net assets 100.0% | | $443,699,140 |
| The percentage shown for each investment category is the total value of the category as a percentage of the net assets of the fund. |
| Security Abbreviations and Legend |
| (A) | Non-income producing security. |
| (B) | All or a portion of this security is on loan as of 10-31-21. |
| (C) | The rate shown is the annualized seven-day yield as of 10-31-21. |
| (D) | Investment is an affiliate of the fund, the advisor and/or subadvisor. This security represents the investment of cash collateral received for securities lending. |
| SEE NOTES TO FINANCIAL STATEMENTS | SEMIANNUAL REPORT | JOHN HANCOCK MULTIFACTOR ETFS | 71 |
MULTIFACTOR TECHNOLOGY ETF
As of 10-31-21 (unaudited)
| | Shares or
Principal
Amount | Value |
| COMMON STOCKS – 99.9% | | $72,460,402 |
| (Cost $47,486,609) | | |
| Communication services – 0.3% | 249,350 |
| Interactive media and services – 0.3% | |
| Ziff Davis, Inc. (A) | 1,019 | 130,707 |
| ZoomInfo Technologies, Inc., Class A (A) | 1,765 | 118,643 |
| Industrials – 0.8% | 597,952 |
| Electrical equipment – 0.8% | |
| Plug Power, Inc. (A) | 10,080 | 385,762 |
| Sensata Technologies Holding PLC (A) | 3,851 | 212,190 |
| Information technology – 98.8% | 71,613,100 |
| Communications equipment – 5.1% | |
| Arista Networks, Inc. (A) | 1,121 | 459,262 |
| Ciena Corp. (A) | 3,550 | 192,730 |
| Cisco Systems, Inc. | 31,203 | 1,746,432 |
| F5 Networks, Inc. (A) | 1,314 | 277,451 |
| Juniper Networks, Inc. | 7,032 | 207,585 |
| Lumentum Holdings, Inc. (A) | 1,509 | 124,613 |
| Motorola Solutions, Inc. | 2,714 | 674,673 |
| Ubiquiti, Inc. | 149 | 45,524 |
| Electronic equipment, instruments and components – 7.8% | |
| Amphenol Corp., Class A | 13,788 | 1,058,505 |
| Cognex Corp. | 3,048 | 266,974 |
| Coherent, Inc. (A) | 448 | 113,971 |
| Corning, Inc. | 15,860 | 564,140 |
| Flex, Ltd. (A) | 12,219 | 206,501 |
| II-VI, Inc. (A) | 2,319 | 140,323 |
| IPG Photonics Corp. (A) | 684 | 108,763 |
| Jabil, Inc. | 5,332 | 319,707 |
| Keysight Technologies, Inc. (A) | 4,548 | 818,731 |
| Littelfuse, Inc. | 636 | 187,334 |
| National Instruments Corp. | 2,869 | 121,846 |
| TE Connectivity, Ltd. | 3,844 | 561,224 |
| Trimble, Inc. (A) | 5,653 | 493,903 |
| Zebra Technologies Corp., Class A (A) | 1,231 | 657,292 |
| IT services – 8.7% | |
| Akamai Technologies, Inc. (A) | 3,949 | 416,462 |
| Amdocs, Ltd. | 2,759 | 214,761 |
| Cloudflare, Inc., Class A (A) | 2,709 | 527,496 |
| Cognizant Technology Solutions Corp., Class A | 11,247 | 878,278 |
| Concentrix Corp. | 997 | 177,147 |
| DigitalOcean Holdings, Inc. (A) | 270 | 26,349 |
| DXC Technology Company (A) | 5,074 | 165,260 |
| EPAM Systems, Inc. (A) | 947 | 637,558 |
| GoDaddy, Inc., Class A (A) | 2,650 | 183,301 |
| IBM Corp. | 9,283 | 1,161,303 |
| MongoDB, Inc. (A) | 645 | 336,232 |
| Okta, Inc. (A) | 1,350 | 333,693 |
| Snowflake, Inc., Class A (A) | 1,109 | 392,409 |
MULTIFACTOR TECHNOLOGY ETF (continued)
| | Shares or
Principal
Amount | Value |
| Information technology (continued) | |
| IT services (continued) | |
| Switch, Inc., Class A | 1,588 | $40,145 |
| Twilio, Inc., Class A (A) | 1,428 | 416,062 |
| VeriSign, Inc. (A) | 1,759 | 391,677 |
| Semiconductors and semiconductor equipment – 31.1% | |
| Advanced Micro Devices, Inc. (A) | 7,328 | 881,045 |
| Amkor Technology, Inc. | 2,131 | 46,712 |
| Analog Devices, Inc. | 3,934 | 682,510 |
| Applied Materials, Inc. | 7,260 | 992,079 |
| Broadcom, Inc. | 3,351 | 1,781,626 |
| Brooks Automation, Inc. | 1,364 | 158,838 |
| Entegris, Inc. | 3,124 | 439,797 |
| First Solar, Inc. (A) | 1,802 | 215,501 |
| Intel Corp. | 33,117 | 1,622,733 |
| KLA Corp. | 2,127 | 792,861 |
| Lam Research Corp. | 1,846 | 1,040,350 |
| Lattice Semiconductor Corp. (A) | 2,121 | 147,282 |
| Marvell Technology, Inc. | 9,195 | 629,858 |
| Microchip Technology, Inc. | 11,598 | 859,296 |
| Micron Technology, Inc. | 10,704 | 739,646 |
| MKS Instruments, Inc. | 1,260 | 189,063 |
| Monolithic Power Systems, Inc. | 774 | 406,706 |
| NVIDIA Corp. | 12,822 | 3,278,201 |
| NXP Semiconductors NV | 2,515 | 505,163 |
| ON Semiconductor Corp. (A) | 9,986 | 480,027 |
| Power Integrations, Inc. | 1,089 | 112,396 |
| Qorvo, Inc. (A) | 2,685 | 451,698 |
| QUALCOMM, Inc. | 8,954 | 1,191,240 |
| Silicon Laboratories, Inc. (A) | 871 | 164,410 |
| Skyworks Solutions, Inc. | 4,151 | 693,757 |
| SolarEdge Technologies, Inc. (A) | 881 | 312,473 |
| Synaptics, Inc. (A) | 723 | 140,674 |
| Teradyne, Inc. | 4,463 | 616,965 |
| Texas Instruments, Inc. | 8,474 | 1,588,706 |
| Universal Display Corp. | 789 | 144,545 |
| Wolfspeed, Inc. (A) | 2,319 | 278,535 |
| Xilinx, Inc. | 5,280 | 950,400 |
| Software – 36.5% | |
| Adobe, Inc. (A) | 2,991 | 1,945,226 |
| Anaplan, Inc. (A) | 1,615 | 105,314 |
| ANSYS, Inc. (A) | 1,692 | 642,249 |
| Appian Corp. (A)(B) | 584 | 58,055 |
| Asana, Inc., Class A (A) | 599 | 81,344 |
| Aspen Technology, Inc. (A) | 1,661 | 260,262 |
| Atlassian Corp. PLC, Class A (A) | 907 | 415,524 |
| Autodesk, Inc. (A) | 1,983 | 629,821 |
| Avalara, Inc. (A) | 1,408 | 252,933 |
| Bentley Systems, Inc., Class B | 2,184 | 129,184 |
| Bill.com Holdings, Inc. (A) | 1,094 | 321,975 |
| Blackline, Inc. (A) | 792 | 100,481 |
| 72 | JOHN HANCOCK MULTIFACTOR ETFS | SEMIANNUAL REPORT | SEE NOTES TO FINANCIAL STATEMENTS |
MULTIFACTOR TECHNOLOGY ETF (continued)
| | Shares or
Principal
Amount | Value |
| Information technology (continued) | |
| Software (continued) | |
| Cadence Design Systems, Inc. (A) | 4,616 | $799,076 |
| Ceridian HCM Holding, Inc. (A) | 2,608 | 326,652 |
| Citrix Systems, Inc. | 2,320 | 219,774 |
| Consensus Cloud Solutions, Inc. (A) | 339 | 21,469 |
| Coupa Software, Inc. (A) | 796 | 181,249 |
| Crowdstrike Holdings, Inc., Class A (A) | 1,300 | 366,340 |
| Datadog, Inc., Class A (A) | 2,348 | 392,233 |
| Digital Turbine, Inc. (A) | 957 | 82,359 |
| DocuSign, Inc. (A) | 1,236 | 343,966 |
| Dolby Laboratories, Inc., Class A | 1,291 | 114,060 |
| DoubleVerify Holdings, Inc. (A)(B) | 208 | 8,222 |
| Dropbox, Inc., Class A (A) | 5,206 | 158,731 |
| Duck Creek Technologies, Inc. (A) | 355 | 11,183 |
| Elastic NV (A) | 866 | 150,260 |
| Everbridge, Inc. (A) | 628 | 100,047 |
| Fair Isaac Corp. (A) | 583 | 232,151 |
| Five9, Inc. (A) | 732 | 115,663 |
| Fortinet, Inc. (A) | 1,433 | 481,975 |
| Guidewire Software, Inc. (A) | 1,703 | 214,118 |
| HubSpot, Inc. (A) | 587 | 475,605 |
| Intuit, Inc. | 1,851 | 1,158,707 |
| Manhattan Associates, Inc. (A) | 1,287 | 233,642 |
| McAfee Corp., Class A | 785 | 16,775 |
| Microsoft Corp. | 14,003 | 4,643,674 |
| MicroStrategy, Inc., Class A (A)(B) | 97 | 69,361 |
| NCino, Inc. (A) | 589 | 42,797 |
| NortonLifeLock, Inc. | 11,062 | 281,528 |
| Nuance Communications, Inc. (A) | 6,022 | 331,511 |
| Nutanix, Inc., Class A (A) | 2,179 | 74,761 |
| Oracle Corp. | 11,557 | 1,108,779 |
| Palantir Technologies, Inc., Class A (A) | 8,614 | 222,930 |
| Palo Alto Networks, Inc. (A) | 1,187 | 604,290 |
| Paycom Software, Inc. (A) | 841 | 460,742 |
| Paylocity Holding Corp. (A) | 657 | 200,477 |
| Pegasystems, Inc. | 661 | 78,474 |
| PTC, Inc. (A) | 2,037 | 259,412 |
| Qualtrics International, Inc., Class A (A) | 964 | 44,652 |
| Rapid7, Inc. (A) | 462 | 59,483 |
| RingCentral, Inc., Class A (A) | 886 | 215,989 |
| salesforce.com, Inc. (A) | 6,439 | 1,929,704 |
| SentinelOne, Inc., Class A (A) | 335 | 22,244 |
| ServiceNow, Inc. (A) | 858 | 598,678 |
| Smartsheet, Inc., Class A (A) | 2,042 | 140,918 |
| Splunk, Inc. (A) | 1,499 | 247,065 |
| Sprout Social, Inc., Class A (A) | 295 | 37,666 |
| SS&C Technologies Holdings, Inc. | 5,464 | 434,224 |
| Synopsys, Inc. (A) | 1,699 | 566,073 |
| Teradata Corp. (A) | 2,377 | 134,443 |
| The Trade Desk, Inc., Class A (A) | 5,602 | 419,646 |
| Tyler Technologies, Inc. (A) | 790 | 429,144 |
MULTIFACTOR TECHNOLOGY ETF (continued)
| | Shares or
Principal
Amount | Value |
| Information technology (continued) | |
| Software (continued) | |
| Unity Software, Inc. (A) | 1,947 | $294,601 |
| Varonis Systems, Inc. (A) | 1,660 | 107,468 |
| VMware, Inc., Class A (A)(B) | 745 | 113,017 |
| Workday, Inc., Class A (A) | 1,426 | 413,511 |
| Workiva, Inc. (A) | 333 | 49,800 |
| Zendesk, Inc. (A) | 1,538 | 156,568 |
| Zoom Video Communications, Inc., Class A (A) | 860 | 236,199 |
| Zscaler, Inc. (A) | 847 | 270,074 |
| Technology hardware, storage and peripherals – 9.6% | |
| Apple, Inc. | 27,844 | 4,171,031 |
| Dell Technologies, Inc., Class C (A) | 3,055 | 336,019 |
| Hewlett Packard Enterprise Company | 28,155 | 412,471 |
| HP, Inc. | 20,650 | 626,315 |
| NetApp, Inc. | 5,074 | 453,108 |
| Pure Storage, Inc., Class A (A) | 4,845 | 130,137 |
| Seagate Technology Holdings PLC | 5,697 | 507,432 |
| Western Digital Corp. (A) | 6,681 | 349,349 |
|
| SHORT-TERM INVESTMENTS – 0.4% | | $255,254 |
| (Cost $255,263) | | |
| Short-term funds – 0.4% | 255,254 |
| John Hancock Collateral Trust, 0.0370% (C)(D) | 14,260 | 142,682 |
|
| State Street Institutional U.S. Government Money Market Fund, Premier Class, 0.0250% (C) | 112,572 | 112,572 |
| Total investments (Multifactor Technology ETF) (Cost $47,741,872) 100.3% | $72,715,656 |
| Other assets and liabilities, net (0.3%) | | (215,401) |
| Total net assets 100.0% | | $72,500,255 |
| The percentage shown for each investment category is the total value of the category as a percentage of the net assets of the fund. |
| Security Abbreviations and Legend |
| (A) | Non-income producing security. |
| (B) | All or a portion of this security is on loan as of 10-31-21. |
| (C) | The rate shown is the annualized seven-day yield as of 10-31-21. |
| (D) | Investment is an affiliate of the fund, the advisor and/or subadvisor. This security represents the investment of cash collateral received for securities lending. |
MULTIFACTOR UTILITIES ETF
As of 10-31-21 (unaudited)
| | Shares or
Principal
Amount | Value |
| COMMON STOCKS – 99.9% | | $17,287,858 |
| (Cost $17,287,796) | | |
| Utilities – 99.9% | 17,287,858 |
| Electric utilities – 55.9% | |
| Alliant Energy Corp. | 4,910 | 277,759 |
| American Electric Power Company, Inc. | 11,884 | 1,006,694 |
| Avangrid, Inc. | 1,426 | 75,150 |
| Duke Energy Corp. | 9,145 | 932,881 |
| SEE NOTES TO FINANCIAL STATEMENTS | SEMIANNUAL REPORT | JOHN HANCOCK MULTIFACTOR ETFS | 73 |
MULTIFACTOR UTILITIES ETF (continued)
| | Shares or
Principal
Amount | Value |
| Utilities (continued) | |
| Electric utilities (continued) | |
| Edison International | 11,584 | $728,981 |
| Entergy Corp. | 6,366 | 655,825 |
| Evergy, Inc. | 6,407 | 408,446 |
| Eversource Energy | 7,746 | 657,635 |
| Exelon Corp. | 17,372 | 924,017 |
| FirstEnergy Corp. | 12,906 | 497,268 |
| NextEra Energy, Inc. | 7,644 | 652,263 |
| NRG Energy, Inc. | 6,023 | 240,257 |
| OGE Energy Corp. | 4,920 | 167,624 |
| Pinnacle West Capital Corp. | 3,776 | 243,514 |
| PPL Corp. | 18,291 | 526,781 |
| The Southern Company | 13,011 | 810,846 |
| Xcel Energy, Inc. | 13,283 | 857,949 |
| Gas utilities – 3.4% | |
| Atmos Energy Corp. | 3,298 | 303,812 |
| UGI Corp. | 6,563 | 284,900 |
| Independent power and renewable electricity producers –4.0% | |
| Brookfield Renewable Corp., Class A | 2,016 | 83,483 |
| Clearway Energy, Inc., Class A | 701 | 23,126 |
| Clearway Energy, Inc., Class C | 1,556 | 55,207 |
| The AES Corp. | 13,346 | 335,385 |
| Vistra Corp. | 10,395 | 203,638 |
| Multi-utilities – 32.3% | |
| Ameren Corp. | 6,427 | 541,732 |
| CenterPoint Energy, Inc. | 16,658 | 433,774 |
| CMS Energy Corp. | 6,956 | 419,795 |
| Consolidated Edison, Inc. | 8,616 | 649,646 |
| Dominion Energy, Inc. | 7,172 | 544,570 |
| DTE Energy Company | 5,662 | 641,788 |
| NiSource, Inc. | 13,985 | 345,010 |
| Public Service Enterprise Group, Inc. | 10,891 | 694,846 |
| Sempra Energy | 6,129 | 782,244 |
| WEC Energy Group, Inc. | 5,878 | 529,373 |
| Water utilities – 4.3% | |
| American Water Works Company, Inc. | 3,233 | 563,124 |
| Essential Utilities, Inc. | 4,005 | 188,515 |
|
| SHORT-TERM INVESTMENTS – 0.4% | | $59,522 |
| (Cost $59,522) | | |
| Short-term funds – 0.4% | 59,522 |
| State Street Institutional U.S. Government Money Market Fund, Premier Class, 0.0250% (A) | 59,522 | 59,522 |
| Total investments (Multifactor Utilities ETF) (Cost $17,347,318) 100.3% | $17,347,380 |
| Other assets and liabilities, net (0.3%) | | (47,913) |
| Total net assets 100.0% | | $17,299,467 |
| The percentage shown for each investment category is the total value of the category as a percentage of the net assets of the fund. |
MULTIFACTOR UTILITIES ETF (continued)
| Security Abbreviations and Legend |
| (A) | The rate shown is the annualized seven-day yield as of 10-31-21. |
| 74 | JOHN HANCOCK MULTIFACTOR ETFS | SEMIANNUAL REPORT | SEE NOTES TO FINANCIAL STATEMENTS |
STATEMENTS OF ASSETS AND LIABILITIES 10-31-21 (unaudited)
| | Multifactor Consumer Discretionary ETF | Multifactor Consumer Staples ETF | Multifactor Developed International ETF | Multifactor Emerging Markets ETF |
| Assets | | | | |
| Unaffiliated investments, at value | $26,985,331 | $21,921,762 | $525,292,902 | $711,045,860 |
| Affiliated investments, at value | 106,602 | 146,524 | 3,905,353 | — |
| Total investments, at value | 27,091,933 | 22,068,286 | 529,198,255 | 711,045,860 |
| Foreign currency, at value | — | — | 773,946 | 3,355,332 |
| Dividends and interest receivable | 6,555 | 27,753 | 1,805,780 | 534,193 |
| Receivable for investments sold | — | — | 949,310 | — |
| Receivable for securities lending income | 42 | 49 | 5,079 | 9,810 |
| Receivable from affiliates | 2,360 | 3,603 | — | — |
| Other assets | 4,649 | 4,218 | 14,316 | 19,751 |
| Total assets | 27,105,539 | 22,103,909 | 532,746,686 | 714,964,946 |
| Liabilities | | | | |
| Foreign capital gains tax payable | — | — | — | 5,041,532 |
| Payable for investments purchased | — | — | 42 | — |
| Payable upon return of securities loaned | 106,607 | 146,533 | 3,900,187 | — |
| Payable to affiliates | | | | |
| Investment management fees | — | — | 138,563 | 227,188 |
| Accounting and legal services fees | 1,768 | 1,295 | 30,281 | 41,933 |
| Trustees’ fees | 32 | 23 | — | — |
| Other liabilities and accrued expenses | 71,627 | 71,293 | 171,613 | 441,381 |
| Total liabilities | 180,034 | 219,144 | 4,240,686 | 5,752,034 |
| Net assets | $26,925,505 | $21,884,765 | $528,506,000 | $709,212,912 |
| Net assets consist of | | | | |
| Paid-in capital | $18,028,960 | $20,305,454 | $455,317,486 | $611,196,448 |
| Total distributable earnings (loss) | 8,896,545 | 1,579,311 | 73,188,514 | 98,016,464 |
| Net assets | $26,925,505 | $21,884,765 | $528,506,000 | $709,212,912 |
| Unaffiliated investments, at cost | $22,374,644 | $19,500,995 | $444,792,896 | $594,060,662 |
| Affiliated investments, at cost | $106,605 | $146,531 | $3,905,530 | — |
| Foreign currency, at cost | — | — | $763,682 | $3,254,865 |
| Securities loaned, at value | $251,235 | $145,534 | $9,579,577 | $4,065,336 |
| Net asset value per share | | | | |
| Based on net asset values and shares outstanding-the fund has an unlimited number of shares authorized with no par value. | | | | |
| Net assets | $26,925,505 | $21,884,765 | $528,506,000 | $709,212,912 |
| Shares outstanding | 480,000 | 630,000 | 15,500,000 | 23,800,000 |
| Net asset value per share | $56.09 | $34.74 | $34.10 | $29.80 |
| SEE NOTES TO FINANCIAL STATEMENTS | SEMIANNUAL | JOHN HANCOCK MULTIFACTOR ETFS | 75 |
STATEMENTS OF ASSETS AND LIABILITIES 10-31-21 (unaudited)
Continued
| | Multifactor Energy ETF | Multifactor Financials ETF | Multifactor Healthcare ETF | Multifactor Industrials ETF |
| Assets | | | | |
| Unaffiliated investments, at value | $21,899,086 | $41,160,685 | $52,166,692 | $16,883,406 |
| Affiliated investments, at value | — | 7,979 | 6,693 | — |
| Total investments, at value | 21,899,086 | 41,168,664 | 52,173,385 | 16,883,406 |
| Dividends and interest receivable | 36,495 | 44,806 | 33,347 | 8,018 |
| Receivable for securities lending income | 6 | 12 | 31 | — |
| Receivable from affiliates | 3,751 | — | — | 5,635 |
| Other assets | 4,090 | 4,448 | 4,804 | 4,528 |
| Total assets | 21,943,428 | 41,217,930 | 52,211,567 | 16,901,587 |
| Liabilities | | | | |
| Payable upon return of securities loaned | — | 7,979 | 6,695 | — |
| Payable to affiliates | | | | |
| Investment management fees | — | 2,429 | 5,986 | — |
| Accounting and legal services fees | 1,317 | 2,321 | 3,059 | 1,177 |
| Trustees’ fees | 28 | 4 | 6 | 46 |
| Other liabilities and accrued expenses | 71,414 | 72,226 | 72,816 | 71,484 |
| Total liabilities | 72,759 | 84,959 | 88,562 | 72,707 |
| Net assets | $21,870,669 | $41,132,971 | $52,123,005 | $16,828,880 |
| Net assets consist of | | | | |
| Paid-in capital | $27,195,324 | $33,463,818 | $41,708,755 | $7,560,885 |
| Total distributable earnings (loss) | (5,324,655) | 7,669,153 | 10,414,250 | 9,267,995 |
| Net assets | $21,870,669 | $41,132,971 | $52,123,005 | $16,828,880 |
| Unaffiliated investments, at cost | $20,692,654 | $31,853,716 | $42,051,411 | $15,797,511 |
| Affiliated investments, at cost | — | $7,979 | $6,693 | — |
| Securities loaned, at value | $28,830 | $32,112 | $44,621 | — |
| Net asset value per share | | | | |
| Based on net asset values and shares outstanding-the fund has an unlimited number of shares authorized with no par value. | | | | |
| Net assets | $21,870,669 | $41,132,971 | $52,123,005 | $16,828,880 |
| Shares outstanding | 940,000 | 760,000 | 1,040,000 | 310,000 |
| Net asset value per share | $23.27 | $54.12 | $50.12 | $54.29 |
| 76 | JOHN HANCOCK MULTIFACTOR ETFS | SEMIANNUAL | SEE NOTES TO FINANCIAL STATEMENTS |
STATEMENTS OF ASSETS AND LIABILITIES 10-31-21 (unaudited)
Continued
| | Multifactor Large Cap ETF | Multifactor Materials ETF | Multifactor Media and Communications ETF | Multifactor Mid Cap ETF |
| Assets | | | | |
| Unaffiliated investments, at value | $782,161,540 | $19,426,956 | $19,825,929 | $2,484,681,819 |
| Affiliated investments, at value | 729,191 | — | — | 5,969,075 |
| Total investments, at value | 782,890,731 | 19,426,956 | 19,825,929 | 2,490,650,894 |
| Dividends and interest receivable | 556,847 | 11,526 | 34,202 | 916,229 |
| Receivable for fund shares sold | — | — | — | 4,108,046 |
| Receivable for securities lending income | 1,571 | 41 | 38 | 2,571 |
| Receivable from affiliates | — | 4,429 | 4,654 | — |
| Other assets | 23,564 | 4,245 | 2,836 | 44,194 |
| Total assets | 783,472,713 | 19,447,197 | 19,867,659 | 2,495,721,934 |
| Liabilities | | | | |
| Payable for investments purchased | — | — | — | 4,115,086 |
| Payable upon return of securities loaned | 732,504 | — | — | 5,974,109 |
| Payable to affiliates | | | | |
| Investment management fees | 147,592 | — | — | 742,818 |
| Accounting and legal services fees | 38,086 | 1,284 | 1,459 | 137,152 |
| Trustees’ fees | — | 32 | 39 | — |
| Other liabilities and accrued expenses | 185,645 | 70,439 | 64,541 | 395,947 |
| Total liabilities | 1,103,827 | 71,755 | 66,039 | 11,365,112 |
| Net assets | $782,368,886 | $19,375,442 | $19,801,620 | $2,484,356,822 |
| Net assets consist of | | | | |
| Paid-in capital | $595,203,315 | $13,976,980 | $15,563,111 | $1,857,067,416 |
| Total distributable earnings (loss) | 187,165,571 | 5,398,462 | 4,238,509 | 627,289,406 |
| Net assets | $782,368,886 | $19,375,442 | $19,801,620 | $2,484,356,822 |
| Unaffiliated investments, at cost | $580,220,595 | $16,280,730 | $17,738,945 | $1,846,772,385 |
| Affiliated investments, at cost | $729,218 | — | — | $5,969,212 |
| Securities loaned, at value | $896,353 | $95,235 | $11,064 | $8,693,771 |
| Net asset value per share | | | | |
| Based on net asset values and shares outstanding-the fund has an unlimited number of shares authorized with no par value. | | | | |
| Net assets | $782,368,886 | $19,375,442 | $19,801,620 | $2,484,356,822 |
| Shares outstanding | 13,525,000 | 410,000 | 530,000 | 45,400,000 |
| Net asset value per share | $57.85 | $47.26 | $37.36 | $54.72 |
| SEE NOTES TO FINANCIAL STATEMENTS | SEMIANNUAL | JOHN HANCOCK MULTIFACTOR ETFS | 77 |
STATEMENTS OF ASSETS AND LIABILITIES 10-31-21 (unaudited)
Continued
| | Multifactor Small Cap ETF | Multifactor Technology ETF | Multifactor Utilities ETF |
| Assets | | | |
| Unaffiliated investments, at value | $443,841,360 | $72,572,974 | $17,347,380 |
| Affiliated investments, at value | 272,324 | 142,682 | — |
| Total investments, at value | 444,113,684 | 72,715,656 | 17,347,380 |
| Dividends and interest receivable | 124,510 | 10,246 | 14,674 |
| Receivable for investments sold | 1,808,067 | — | — |
| Receivable for securities lending income | 498 | 666 | — |
| Receivable from affiliates | — | — | 5,092 |
| Other assets | 11,952 | 4,904 | 4,153 |
| Total assets | 446,058,711 | 72,731,472 | 17,371,299 |
| Liabilities | | | |
| Payable for fund shares repurchased | 1,811,017 | — | — |
| Payable upon return of securities loaned | 272,410 | 142,705 | — |
| Payable to affiliates | | | |
| Investment management fees | 130,352 | 11,434 | — |
| Accounting and legal services fees | 23,959 | 3,849 | 994 |
| Trustees’ fees | — | — | 24 |
| Other liabilities and accrued expenses | 121,833 | 73,229 | 70,814 |
| Total liabilities | 2,359,571 | 231,217 | 71,832 |
| Net assets | $443,699,140 | $72,500,255 | $17,299,467 |
| Net assets consist of | | | |
| Paid-in capital | $402,449,861 | $47,568,457 | $19,058,743 |
| Total distributable earnings (loss) | 41,249,279 | 24,931,798 | (1,759,276) |
| Net assets | $443,699,140 | $72,500,255 | $17,299,467 |
| Unaffiliated investments, at cost | $360,598,040 | $47,599,181 | $17,347,318 |
| Affiliated investments, at cost | $272,329 | $142,691 | — |
| Securities loaned, at value | $1,266,879 | $146,492 | — |
| Net asset value per share | | | |
| Based on net asset values and shares outstanding-the fund has an unlimited number of shares authorized with no par value. | | | |
| Net assets | $443,699,140 | $72,500,255 | $17,299,467 |
| Shares outstanding | 12,250,000 | 740,000 | 520,000 |
| Net asset value per share | $36.22 | $97.97 | $33.27 |
| 78 | JOHN HANCOCK MULTIFACTOR ETFS | SEMIANNUAL | SEE NOTES TO FINANCIAL STATEMENTS |
STATEMENTS OF OPERATIONS For the six months ended 10-31-21 (unaudited)
| | Multifactor Consumer Discretionary ETF | Multifactor Consumer Staples ETF | Multifactor Developed International ETF | Multifactor Emerging Markets ETF |
| Investment income | | | | |
| Dividends from unaffiliated investments | $141,819 | $253,574 | $7,230,515 | $13,938,373 |
| Securities lending | 911 | 223 | 132,891 | 45,343 |
| Interest | 10 | 7 | 194 | 57 |
| Non-cash dividends | — | — | 2,251,124 | — |
| Less foreign taxes withheld | — | — | (818,720) | (1,706,016) |
| Total investment income | 142,740 | 253,804 | 8,796,004 | 12,277,757 |
| Expenses | | | | |
| Investment management fees | 66,927 | 41,940 | 889,147 | 1,604,916 |
| Accounting and legal services fees | 2,711 | 1,763 | 40,369 | 58,197 |
| Transfer agent fees | 5,042 | 5,042 | 5,042 | 5,042 |
| Trustees’ fees | 376 | 243 | 4,036 | 6,063 |
| Custodian fees | 31,337 | 31,423 | 76,671 | 246,255 |
| Printing and postage | 7,071 | 7,112 | 12,037 | 12,008 |
| Professional fees | 9,034 | 8,445 | 29,239 | 36,497 |
| Stock exchange listing fees | 4,278 | 4,293 | 3,928 | 4,883 |
| Other | 6,791 | 5,822 | 13,844 | 16,359 |
| Total expenses | 133,567 | 106,083 | 1,074,313 | 1,990,220 |
| Less expense reductions | (63,117) | (61,935) | (82,829) | (201,469) |
| Net expenses | 70,450 | 44,148 | 991,484 | 1,788,751 |
| Net investment income | 72,290 | 209,656 | 7,804,520 | 10,489,006 |
| Realized and unrealized gain (loss) | | | | |
| Net realized gain (loss) on | | | | |
| Unaffiliated investments and foreign currency transactions | (166,117) | (96,557) | (2,565,226) | (3,824,871) |
| Affiliated investments | 29 | (11) | (146) | (10) |
| Futures contracts | (24) | (284) | (83,972) | (101,128) |
| Redemptions in kind | 9,599,457 | 363,854 | 14,957,471 | 5,392,834 |
| | 9,433,345 | 267,002 | 12,308,127 | 1,466,825 |
| Change in net unrealized appreciation (depreciation) of | | | | |
| Unaffiliated investments and translation of assets and liabilities in foreign currencies | (7,574,377) | (246,388) | (2,111,335) | (38,578,017)1 |
| Affiliated investments | (1) | 1 | 37 | 29 |
| | (7,574,378) | (246,387) | (2,111,298) | (38,577,988) |
| Net realized and unrealized gain (loss) | 1,858,967 | 20,615 | 10,196,829 | (37,111,163) |
| Increase (decrease) in net assets from operations | $1,931,257 | $230,271 | $18,001,349 | $(26,622,157) |
| | |
| 1 | Net of $(2,085,972) increase in deferred India withholding taxes. |
| SEE NOTES TO FINANCIAL STATEMENTS | SEMIANNUAL | JOHN HANCOCK MULTIFACTOR ETFS | 79 |
STATEMENTS OF OPERATIONS For the six months ended 10-31-21 (unaudited)
Continued
| | Multifactor Energy ETF | Multifactor Financials ETF | Multifactor Healthcare ETF | Multifactor Industrials ETF |
| Investment income | | | | |
| Dividends from unaffiliated investments | $382,974 | $365,427 | $391,140 | $203,161 |
| Securities lending | 18 | 227 | 259 | 128 |
| Interest | 6 | 9 | 10 | 9 |
| Less foreign taxes withheld | — | (64) | — | — |
| Total investment income | 382,998 | 365,599 | 391,409 | 203,298 |
| Expenses | | | | |
| Investment management fees | 40,729 | 74,607 | 99,414 | 57,784 |
| Accounting and legal services fees | 1,693 | 3,092 | 4,156 | 2,333 |
| Transfer agent fees | 5,042 | 5,042 | 5,042 | 5,042 |
| Trustees’ fees | 178 | 309 | 407 | 388 |
| Custodian fees | 31,735 | 31,703 | 31,444 | 31,532 |
| Printing and postage | 6,977 | 7,421 | 8,043 | 7,209 |
| Professional fees | 8,525 | 8,880 | 9,199 | 9,111 |
| Stock exchange listing fees | 4,293 | 4,278 | 4,278 | 4,293 |
| Other | 5,443 | 5,732 | 5,873 | 6,015 |
| Total expenses | 104,615 | 141,064 | 167,856 | 123,707 |
| Less expense reductions | (61,742) | (62,530) | (63,210) | (62,881) |
| Net expenses | 42,873 | 78,534 | 104,646 | 60,826 |
| Net investment income | 340,125 | 287,065 | 286,763 | 142,472 |
| Realized and unrealized gain (loss) | | | | |
| Net realized gain (loss) on | | | | |
| Unaffiliated investments and foreign currency transactions | (495,302) | (106,824) | (101,935) | (39,284) |
| Affiliated investments | (2) | 2 | (2) | (1) |
| Futures contracts | (337) | (259) | 755 | 1,028 |
| Redemptions in kind | 2,390,415 | 1,074,138 | 4,253,438 | 11,250,864 |
| | 1,894,774 | 967,057 | 4,152,256 | 11,212,607 |
| Change in net unrealized appreciation (depreciation) of | | | | |
| Unaffiliated investments and translation of assets and liabilities in foreign currencies | 2,019,840 | 1,846,761 | (446,289) | (9,775,588) |
| Net realized and unrealized gain | 3,914,614 | 2,813,818 | 3,705,967 | 1,437,019 |
| Increase in net assets from operations | $4,254,739 | $3,100,883 | $3,992,730 | $1,579,491 |
| 80 | JOHN HANCOCK MULTIFACTOR ETFS | SEMIANNUAL | SEE NOTES TO FINANCIAL STATEMENTS |
STATEMENTS OF OPERATIONS For the six months ended 10-31-21 (unaudited)
Continued
| | Multifactor Large Cap ETF | Multifactor Materials ETF | Multifactor Media and Communications ETF | Multifactor Mid Cap ETF |
| Investment income | | | | |
| Dividends from unaffiliated investments | $5,420,620 | $233,121 | $151,657 | $17,227,663 |
| Securities lending | 4,363 | 166 | 1,523 | 28,855 |
| Interest | 60 | 8 | 15 | 226 |
| Less foreign taxes withheld | (152) | (79) | — | (3,512) |
| Total investment income | 5,424,891 | 233,216 | 153,195 | 17,253,232 |
| Expenses | | | | |
| Investment management fees | 957,648 | 47,201 | 50,012 | 4,294,636 |
| Accounting and legal services fees | 60,967 | 1,946 | 2,045 | 185,026 |
| Transfer agent fees | 5,158 | 5,042 | 5,042 | 5,042 |
| Trustees’ fees | 7,184 | 262 | 289 | 17,370 |
| Custodian fees | 72,044 | 31,579 | 28,287 | 155,753 |
| Printing and postage | 24,279 | 6,522 | 6,741 | 56,544 |
| Professional fees | 33,058 | 8,657 | 8,718 | 75,620 |
| Stock exchange listing fees | 4,278 | 4,293 | 5,367 | 5,174 |
| Other | 17,846 | 5,558 | 5,294 | 28,650 |
| Total expenses | 1,182,462 | 111,060 | 111,795 | 4,823,815 |
| Less expense reductions | (114,316) | (61,374) | (59,151) | (105,897) |
| Net expenses | 1,068,146 | 49,686 | 52,644 | 4,717,918 |
| Net investment income | 4,356,745 | 183,530 | 100,551 | 12,535,314 |
| Realized and unrealized gain (loss) | | | | |
| Net realized gain (loss) on | | | | |
| Unaffiliated investments and foreign currency transactions | (1,331,093) | (191,242) | (535,970) | 409,091 |
| Affiliated investments | 35 | — | (5) | 502 |
| Futures contracts | (6,247) | (284) | — | 7,903 |
| Redemptions in kind | 17,199,752 | 4,410,409 | 3,814,669 | 43,623,027 |
| | 15,862,447 | 4,218,883 | 3,278,694 | 44,040,523 |
| Change in net unrealized appreciation (depreciation) of | | | | |
| Unaffiliated investments and translation of assets and liabilities in foreign currencies | 43,069,329 | (4,180,633) | (3,971,740) | 92,402,987 |
| Affiliated investments | (23) | — | — | (81) |
| | 43,069,306 | (4,180,633) | (3,971,740) | 92,402,906 |
| Net realized and unrealized gain (loss) | 58,931,753 | 38,250 | (693,046) | 136,443,429 |
| Increase (decrease) in net assets from operations | $63,288,498 | $221,780 | $(592,495) | $148,978,743 |
| SEE NOTES TO FINANCIAL STATEMENTS | SEMIANNUAL | JOHN HANCOCK MULTIFACTOR ETFS | 81 |
STATEMENTS OF OPERATIONS For the six months ended 10-31-21 (unaudited)
Continued
| | Multifactor Small Cap ETF | Multifactor Technology ETF | Multifactor Utilities ETF |
| Investment income | | | |
| Dividends from unaffiliated investments | $3,103,317 | $263,479 | $285,689 |
| Securities lending | 2,525 | 1,258 | — |
| Interest | 50 | 13 | 5 |
| Less foreign taxes withheld | (3,407) | — | (178) |
| Total investment income | 3,102,485 | 264,750 | 285,516 |
| Expenses | | | |
| Investment management fees | 846,968 | 122,173 | 32,974 |
| Accounting and legal services fees | 35,301 | 5,131 | 1,398 |
| Transfer agent fees | 5,042 | 5,042 | 5,042 |
| Trustees’ fees | 4,229 | 486 | 210 |
| Custodian fees | 45,068 | 31,453 | 31,611 |
| Printing and postage | 14,084 | 8,190 | 6,878 |
| Professional fees | 25,385 | 9,531 | 8,303 |
| Stock exchange listing fees | 5,952 | 4,278 | 4,293 |
| Other | 11,453 | 5,951 | 5,811 |
| Total expenses | 993,482 | 192,235 | 96,520 |
| Less expense reductions | (81,362) | (63,631) | (61,811) |
| Net expenses | 912,120 | 128,604 | 34,709 |
| Net investment income | 2,190,365 | 136,146 | 250,807 |
| Realized and unrealized gain (loss) | | | |
| Net realized gain (loss) on | | | |
| Unaffiliated investments and foreign currency transactions | (898,133) | (94,158) | (129,198) |
| Affiliated investments | (89) | 6 | — |
| Futures contracts | (5,485) | (690) | (284) |
| Redemptions in kind | 18,324,474 | 2,505,742 | 177,751 |
| | 17,420,767 | 2,410,900 | 48,269 |
| Change in net unrealized appreciation (depreciation) of | | | |
| Unaffiliated investments and translation of assets and liabilities in foreign currencies | (6,303,556) | 7,342,819 | (140,355) |
| Affiliated investments | (1) | (8) | — |
| | (6,303,557) | 7,342,811 | (140,355) |
| Net realized and unrealized gain (loss) | 11,117,210 | 9,753,711 | (92,086) |
| Increase in net assets from operations | $13,307,575 | $9,889,857 | $158,721 |
| 82 | JOHN HANCOCK MULTIFACTOR ETFS | SEMIANNUAL | SEE NOTES TO FINANCIAL STATEMENTS |
STATEMENTS OF CHANGES IN NET ASSETS
| | Multifactor Consumer
Discretionary ETF | Multifactor Consumer
Staples ETF | Multifactor Developed
International ETF |
| | Six months ended
10-31-21
(unaudited) | Year ended
4-30-21 | Six months ended
10-31-21
(unaudited) | Year ended
4-30-21 | Six months ended
10-31-21
(unaudited) | Year ended
4-30-21 |
| Increase (decrease) in net assets | | | | | | |
| From operations | | | | | | |
| Net investment income | $72,290 | $164,837 | $209,656 | $513,045 | $7,804,520 | $11,281,728 |
| Net realized gain | 9,433,345 | 7,030,879 | 267,002 | 1,412,404 | 12,308,127 | 30,563,800 |
| Change in net unrealized appreciation (depreciation) | (7,574,378) | 14,748,233 | (246,387) | 3,480,570 | (2,111,298) | 115,721,656 |
| Increase in net assets resulting from operations | 1,931,257 | 21,943,949 | 230,271 | 5,406,019 | 18,001,349 | 157,567,184 |
| Distributions to shareholders | | | | | | |
| From earnings | (74,518) | (247,807) | (198,891) | (558,496) | (8,073,126) | (9,397,948) |
| From fund share transactions | | | | | | |
| Shares issued | 2,113,114 | 20,031,773 | 1,044,709 | 5,503,576 | 81,966,902 | 54,554,414 |
| Shares repurchased | (26,732,503) | (23,211,076) | (1,043,388) | (7,710,219) | (48,159,429) | (150,990,640) |
| Total from fund share transactions | (24,619,389) | (3,179,303) | 1,321 | (2,206,643) | 33,807,473 | (96,436,226) |
| Total increase (decrease) | (22,762,650) | 18,516,839 | 32,701 | 2,640,880 | 43,735,696 | 51,733,010 |
| Net assets | | | | | | |
| Beginning of period | 49,688,155 | 31,171,316 | 21,852,064 | 19,211,184 | 484,770,304 | 433,037,294 |
| End of period | $26,925,505 | $49,688,155 | $21,884,765 | $21,852,064 | $528,506,000 | $484,770,304 |
| Share activity | | | | | | |
| Shares outstanding | | | | | | |
| Beginning of period | 950,000 | 1,040,000 | 630,000 | 690,000 | 14,500,000 | 17,800,000 |
| Shares issued | 40,000 | 450,000 | 30,000 | 180,000 | 2,400,000 | 1,800,000 |
| Shares repurchased | (510,000) | (540,000) | (30,000) | (240,000) | (1,400,000) | (5,100,000) |
| End of period | 480,000 | 950,000 | 630,000 | 630,000 | 15,500,000 | 14,500,000 |
| SEE NOTES TO FINANCIAL STATEMENTS | SEMIANNUAL | JOHN HANCOCK MULTIFACTOR ETFS | 83 |
STATEMENTS OF CHANGES IN NET ASSETS
Continued
| | Multifactor Emerging Markets ETF | Multifactor Energy ETF | Multifactor Financials ETF |
| | Six months ended
10-31-21
(unaudited) | Year ended
4-30-21 | Six months ended
10-31-21
(unaudited) | Year ended
4-30-21 | Six months ended
10-31-21
(unaudited) | Year ended
4-30-21 |
| Increase (decrease) in net assets | | | | | | |
| From operations | | | | | | |
| Net investment income | $10,489,006 | $13,343,232 | $340,125 | $450,012 | $287,065 | $533,810 |
| Net realized gain (loss) | 1,466,825 | 22,118,632 | 1,894,774 | (3,941,842) | 967,057 | 514,851 |
| Change in net unrealized appreciation (depreciation) | (38,577,988) | 237,608,075 | 2,019,840 | 8,268,496 | 1,846,761 | 13,276,539 |
| Increase (decrease) in net assets resulting from operations | (26,622,157) | 273,069,939 | 4,254,739 | 4,776,666 | 3,100,883 | 14,325,200 |
| Distributions to shareholders | | | | | | |
| From earnings | (5,717,088) | (13,029,002) | (233,863) | (500,319) | (253,358) | (551,255) |
| From fund share transactions | | | | | | |
| Shares issued | 24,200,144 | 54,036,551 | 7,334,635 | 5,745,399 | 3,582,219 | 5,840,995 |
| Shares repurchased | (18,621,503) | (263,216,902) | (10,044,886) | (4,477,954) | (2,574,686) | (12,694,923) |
| Total from fund share transactions | 5,578,641 | (209,180,351) | (2,710,251) | 1,267,445 | 1,007,533 | (6,853,928) |
| Total increase (decrease) | (26,760,604) | 50,860,586 | 1,310,625 | 5,543,792 | 3,855,058 | 6,920,017 |
| Net assets | | | | | | |
| Beginning of period | 735,973,516 | 685,112,930 | 20,560,044 | 15,016,252 | 37,277,913 | 30,357,896 |
| End of period | $709,212,912 | $735,973,516 | $21,870,669 | $20,560,044 | $41,132,971 | $37,277,913 |
| Share activity | | | | | | |
| Shares outstanding | | | | | | |
| Beginning of period | 23,600,000 | 31,700,000 | 1,080,000 | 1,080,000 | 740,000 | 970,000 |
| Shares issued | 800,000 | 1,900,000 | 350,000 | 360,000 | 70,000 | 140,000 |
| Shares repurchased | (600,000) | (10,000,000) | (490,000) | (360,000) | (50,000) | (370,000) |
| End of period | 23,800,000 | 23,600,000 | 940,000 | 1,080,000 | 760,000 | 740,000 |
| 84 | JOHN HANCOCK MULTIFACTOR ETFS | SEMIANNUAL | SEE NOTES TO FINANCIAL STATEMENTS |
STATEMENTS OF CHANGES IN NET ASSETS
Continued
| | Multifactor Healthcare ETF | Multifactor Industrials ETF | Multifactor Large Cap ETF |
| | Six months ended
10-31-21
(unaudited) | Year ended
4-30-21 | Six months ended
10-31-21
(unaudited) | Year ended
4-30-21 | Six months ended
10-31-21
(unaudited) | Year ended
4-30-21 |
| Increase (decrease) in net assets | | | | | | |
| From operations | | | | | | |
| Net investment income | $286,763 | $854,524 | $142,472 | $374,804 | $4,356,745 | $12,991,730 |
| Net realized gain | 4,152,256 | 3,974,327 | 11,212,607 | 3,278,792 | 15,862,447 | 195,388,330 |
| Change in net unrealized appreciation (depreciation) | (446,289) | 7,034,279 | (9,775,588) | 13,959,322 | 43,069,306 | 146,531,945 |
| Increase in net assets resulting from operations | 3,992,730 | 11,863,130 | 1,579,491 | 17,612,918 | 63,288,498 | 354,912,005 |
| Distributions to shareholders | | | | | | |
| From earnings | (170,605) | (1,198,927) | (193,416) | (366,029) | (3,857,831) | (15,992,156) |
| From fund share transactions | | | | | | |
| Shares issued | 7,867,354 | 12,813,470 | 5,757,772 | 25,764,261 | 59,551,585 | 208,314,848 |
| Shares repurchased | (11,533,931) | (14,717,132) | (41,274,362) | (14,299,595) | (42,374,847) | (630,687,338) |
| Total from fund share transactions | (3,666,577) | (1,903,662) | (35,516,590) | 11,464,666 | 17,176,738 | (422,372,490) |
| Total increase (decrease) | 155,548 | 8,760,541 | (34,130,515) | 28,711,555 | 76,607,405 | (83,452,641) |
| Net assets | | | | | | |
| Beginning of period | 51,967,457 | 43,206,916 | 50,959,395 | 22,247,840 | 705,761,481 | 789,214,122 |
| End of period | $52,123,005 | $51,967,457 | $16,828,880 | $50,959,395 | $782,368,886 | $705,761,481 |
| Share activity | | | | | | |
| Shares outstanding | | | | | | |
| Beginning of period | 1,120,000 | 1,170,000 | 990,000 | 700,000 | 13,225,000 | 21,825,000 |
| Shares issued | 160,000 | 300,000 | 110,000 | 610,000 | 1,075,000 | 4,675,000 |
| Shares repurchased | (240,000) | (350,000) | (790,000) | (320,000) | (775,000) | (13,275,000) |
| End of period | 1,040,000 | 1,120,000 | 310,000 | 990,000 | 13,525,000 | 13,225,000 |
| SEE NOTES TO FINANCIAL STATEMENTS | SEMIANNUAL | JOHN HANCOCK MULTIFACTOR ETFS | 85 |
STATEMENTS OF CHANGES IN NET ASSETS
Continued
| | Multifactor Materials ETF | Multifactor Media and Communications ETF | Multifactor Mid Cap ETF |
| | Six months ended
10-31-21
(unaudited) | Year ended
4-30-21 | Six months ended
10-31-21
(unaudited) | Year ended
4-30-21 | Six months ended
10-31-21
(unaudited) | Year ended
4-30-21 |
| Increase (decrease) in net assets | | | | | | |
| From operations | | | | | | |
| Net investment income | $183,530 | $398,633 | $100,551 | $259,294 | $12,535,314 | $16,266,095 |
| Net realized gain | 4,218,883 | 2,161,603 | 3,278,694 | 5,560,156 | 44,040,523 | 135,910,077 |
| Change in net unrealized appreciation (depreciation) | (4,180,633) | 9,578,099 | (3,971,740) | 6,775,861 | 92,402,906 | 664,505,714 |
| Increase (decrease) in net assets resulting from operations | 221,780 | 12,138,335 | (592,495) | 12,595,311 | 148,978,743 | 816,681,886 |
| Distributions to shareholders | | | | | | |
| From earnings | (192,949) | (388,841) | (117,725) | (245,994) | (6,534,210) | (19,552,628) |
| From fund share transactions | | | | | | |
| Shares issued | 5,283,120 | 3,964,212 | 1,955,360 | 11,325,278 | 266,519,726 | 447,810,930 |
| Shares repurchased | (13,136,891) | (5,678,762) | (12,702,487) | (14,768,131) | (88,060,439) | (412,696,585) |
| Total from fund share transactions | (7,853,771) | (1,714,550) | (10,747,127) | (3,442,853) | 178,459,287 | 35,114,345 |
| Total increase (decrease) | (7,824,940) | 10,034,944 | (11,457,347) | 8,906,464 | 320,903,820 | 832,243,603 |
| Net assets | | | | | | |
| Beginning of period | 27,200,382 | 17,165,438 | 31,258,967 | 22,352,503 | 2,163,453,002 | 1,331,209,399 |
| End of period | $19,375,442 | $27,200,382 | $19,801,620 | $31,258,967 | $2,484,356,822 | $2,163,453,002 |
| Share activity | | | | | | |
| Shares outstanding | | | | | | |
| Beginning of period | 580,000 | 610,000 | 810,000 | 890,000 | 41,975,000 | 41,100,000 |
| Shares issued | 110,000 | 100,000 | 50,000 | 350,000 | 5,075,000 | 10,175,000 |
| Shares repurchased | (280,000) | (130,000) | (330,000) | (430,000) | (1,650,000) | (9,300,000) |
| End of period | 410,000 | 580,000 | 530,000 | 810,000 | 45,400,000 | 41,975,000 |
| 86 | JOHN HANCOCK MULTIFACTOR ETFS | SEMIANNUAL | SEE NOTES TO FINANCIAL STATEMENTS |
STATEMENTS OF CHANGES IN NET ASSETS
Continued
| | Multifactor Small Cap ETF | Multifactor Technology ETF | Multifactor Utilities ETF |
| | Six months ended
10-31-21
(unaudited) | Year ended
4-30-21 | Six months ended
10-31-21
(unaudited) | Year ended
4-30-21 | Six months ended
10-31-21
(unaudited) | Year ended
4-30-21 |
| Increase (decrease) in net assets | | | | | | |
| From operations | | | | | | |
| Net investment income | $2,190,365 | $6,411,675 | $136,146 | $355,175 | $250,807 | $646,585 |
| Net realized gain (loss) | 17,420,767 | 104,173,049 | 2,410,900 | 6,240,602 | 48,269 | (1,094,964) |
| Change in net unrealized appreciation (depreciation) | (6,303,557) | 143,292,343 | 7,342,811 | 14,622,167 | (140,355) | 3,861,303 |
| Increase in net assets resulting from operations | 13,307,575 | 253,877,067 | 9,889,857 | 21,217,944 | 158,721 | 3,412,924 |
| Distributions to shareholders | | | | | | |
| From earnings | (2,086,941) | (6,392,741) | (157,407) | (476,955) | (215,462) | (763,275) |
| From fund share transactions | | | | | | |
| Shares issued | 54,428,324 | 86,845,386 | 10,641,182 | 14,150,067 | 1,014,993 | — |
| Shares repurchased | (48,248,133) | (371,277,175) | (4,698,612) | (14,332,508) | (1,008,729) | (10,753,405) |
| Total from fund share transactions | 6,180,191 | (284,431,789) | 5,942,570 | (182,441) | 6,264 | (10,753,405) |
| Total increase (decrease) | 17,400,825 | (36,947,463) | 15,675,020 | 20,558,548 | (50,477) | (8,103,756) |
| Net assets | | | | | | |
| Beginning of period | 426,298,315 | 463,245,778 | 56,825,235 | 36,266,687 | 17,349,944 | 25,453,700 |
| End of period | $443,699,140 | $426,298,315 | $72,500,255 | $56,825,235 | $17,299,467 | $17,349,944 |
| Share activity | | | | | | |
| Shares outstanding | | | | | | |
| Beginning of period | 12,075,000 | 21,275,000 | 670,000 | 680,000 | 520,000 | 870,000 |
| Shares issued | 1,550,000 | 2,950,000 | 120,000 | 190,000 | 30,000 | — |
| Shares repurchased | (1,375,000) | (12,150,000) | (50,000) | (200,000) | (30,000) | (350,000) |
| End of period | 12,250,000 | 12,075,000 | 740,000 | 670,000 | 520,000 | 520,000 |
| SEE NOTES TO FINANCIAL STATEMENTS | SEMIANNUAL | JOHN HANCOCK MULTIFACTOR ETFS | 87 |
MULTIFACTOR CONSUMER DISCRETIONARY ETF
| Period ended | 10-31-211 | 4-30-21 | 4-30-20 | 4-30-19 | 4-30-18 | 4-30-17 |
| Per share operating performance | | | | | | |
| Net asset value, beginning of period | $52.30 | $29.97 | $33.73 | $30.65 | $28.04 | $25.56 |
| Net investment income2 | 0.11 | 0.17 | 0.41 | 0.37 | 0.32 | 0.51 |
| Net realized and unrealized gain (loss) on investments | 3.78 | 22.41 | (3.76) | 3.11 | 2.58 | 2.45 |
| Total from investment operations | 3.89 | 22.58 | (3.35) | 3.48 | 2.90 | 2.96 |
| Less distributions | | | | | | |
| From net investment income | (0.10) | (0.25) | (0.41) | (0.40) | (0.29) | (0.48) |
| Net asset value, end of period | $56.09 | $52.30 | $29.97 | $33.73 | $30.65 | $28.04 |
| Total return (%)3 | 7.454 | 75.70 | (10.08) | 11.57 | 10.37 | 11.78 |
| Ratios and supplemental data | | | | | | |
| Net assets, end of period (in millions) | $27 | $50 | $31 | $42 | $47 | $31 |
| Ratios (as a percentage of average net assets): | | | | | | |
| Expenses before reductions | 0.765 | 0.71 | 0.73 | 0.73 | 0.85 | 1.07 |
| Expenses including reductions | 0.405 | 0.40 | 0.40 | 0.47 | 0.50 | 0.50 |
| Net investment income | 0.415 | 0.41 | 1.23 | 1.17 | 1.08 | 1.93 |
| Portfolio turnover (%)6 | 4 | 17 | 20 | 42 | 9 | 16 |
| | |
| 1 | Six months ended 10-31-21. Unaudited. |
| 2 | Based on average daily shares outstanding. |
| 3 | Total returns would have been lower had certain expenses not been reduced during the applicable periods. |
| 4 | Not annualized. |
| 5 | Annualized. |
| 6 | Portfolio turnover rate excludes securities received or delivered from in-kind transactions. |
MULTIFACTOR CONSUMER STAPLES ETF
| Period ended | 10-31-211 | 4-30-21 | 4-30-20 | 4-30-19 | 4-30-18 | 4-30-17 |
| Per share operating performance | | | | | | |
| Net asset value, beginning of period | $34.69 | $27.84 | $28.02 | $25.35 | $26.48 | $25.14 |
| Net investment income2 | 0.33 | 0.70 | 0.65 | 0.75 | 0.55 | 0.48 |
| Net realized and unrealized gain (loss) on investments | 0.04 | 6.89 | (0.17) | 2.66 | (1.24) | 1.21 |
| Total from investment operations | 0.37 | 7.59 | 0.48 | 3.41 | (0.69) | 1.69 |
| Less distributions | | | | | | |
| From net investment income | (0.32) | (0.74) | (0.66) | (0.74) | (0.44) | (0.35) |
| Net asset value, end of period | $34.74 | $34.69 | $27.84 | $28.02 | $25.35 | $26.48 |
| Total return (%)3 | 1.074 | 27.69 | 1.62 | 13.89 | (2.67) | 6.75 |
| Ratios and supplemental data | | | | | | |
| Net assets, end of period (in millions) | $22 | $22 | $19 | $29 | $22 | $17 |
| Ratios (as a percentage of average net assets): | | | | | | |
| Expenses before reductions | 0.96 | 0.94 | 0.83 | 0.91 | 1.07 | 1.18 |
| Expenses including reductions | 0.405 | 0.40 | 0.40 | 0.47 | 0.50 | 0.50 |
| Net investment income | 1.905 | 2.25 | 2.27 | 2.87 | 2.05 | 1.86 |
| Portfolio turnover (%)6 | 6 | 10 | 12 | 14 | 14 | 11 |
| | |
| 1 | Six months ended 10-31-21. Unaudited. |
| 2 | Based on average daily shares outstanding. |
| 3 | Total returns would have been lower had certain expenses not been reduced during the applicable periods. |
| 4 | Not annualized. |
| 5 | Annualized. |
| 6 | Portfolio turnover rate excludes securities received or delivered from in-kind transactions. |
| 88 | JOHN HANCOCK MULTIFACTOR ETFS | SEMIANNUAL | SEE NOTES TO FINANCIAL STATEMENTS |
MULTIFACTOR DEVELOPED INTERNATIONAL ETF
| Period ended | 10-31-211 | 4-30-21 | 4-30-20 | 4-30-19 | 4-30-18 | 4-30-172 |
| Per share operating performance | | | | | | |
| Net asset value, beginning of period | $33.43 | $24.33 | $28.75 | $30.68 | $27.17 | $24.54 |
| Net investment income3 | 0.53 | 0.70 | 0.73 | 0.91 | 0.77 | 0.31 |
| Net realized and unrealized gain (loss) on investments | 0.71 | 8.99 | (4.21) | (2.31) | 3.43 | 2.32 |
| Total from investment operations | 1.24 | 9.69 | (3.48) | (1.40) | 4.20 | 2.63 |
| Less distributions | | | | | | |
| From net investment income | (0.57) | (0.59) | (0.94) | (0.53) | (0.69) | — |
| Net asset value, end of period | $34.10 | $33.43 | $24.33 | $28.75 | $30.68 | $27.17 |
| Total return (%)4 | 3.685 | 40.26 | (12.57) | (4.54) | 15.64 | 10.735 |
| Ratios and supplemental data | | | | | | |
| Net assets, end of period (in millions) | $529 | $485 | $433 | $512 | $68 | $33 |
| Ratios (as a percentage of average net assets): | | | | | | |
| Expenses before reductions | 0.426 | 0.43 | 0.52 | 0.55 | 0.80 | 0.996 |
| Expenses including reductions | 0.396 | 0.39 | 0.45 | 0.45 | 0.45 | 0.456 |
| Net investment income | 3.076 | 2.43 | 2.46 | 3.28 | 2.60 | 3.026 |
| Portfolio turnover (%)7 | 5 | 8 | 10 | 17 | 15 | 8 |
| | |
| 1 | Six months ended 10-31-21. Unaudited. |
| 2 | Period from 12-15-16 (commencement of operations) to 4-30-17. |
| 3 | Based on average daily shares outstanding. |
| 4 | Total returns would have been lower had certain expenses not been reduced during the applicable periods. |
| 5 | Not annualized. |
| 6 | Annualized. |
| 7 | Portfolio turnover rate excludes securities received or delivered from in-kind transactions. |
MULTIFACTOR EMERGING MARKETS ETF
| Period ended | 10-31-211 | 4-30-21 | 4-30-20 | 4-30-192 |
| Per share operating performance | | | | |
| Net asset value, beginning of period | $31.19 | $21.61 | $25.87 | $25.00 |
| Net investment income3 | 0.44 | 0.50 | 0.66 | 0.14 |
| Net realized and unrealized gain (loss) on investments | (1.59) | 9.57 | (4.29) | 0.78 |
| Total from investment operations | (1.15) | 10.07 | (3.63) | 0.92 |
| Less distributions | | | | |
| From net investment income | (0.24) | (0.49) | (0.63) | (0.05) |
| Net asset value, end of period | $29.80 | $31.19 | $21.61 | $25.87 |
| Total return (%)4 | (3.72)5 | 46.99 | (14.44) | 3.715 |
| Ratios and supplemental data | | | | |
| Net assets, end of period (in millions) | $709 | $736 | $685 | $818 |
| Ratios (as a percentage of average net assets): | | | | |
| Expenses before reductions | 0.556 | 0.55 | 0.67 | 0.716 |
| Expenses including reductions | 0.496 | 0.49 | 0.55 | 0.556 |
| Net investment income | 2.886 | 1.89 | 2.69 | 0.976 |
| Portfolio turnover (%)7 | 6 | 25 | 22 | 3 |
| | |
| 1 | Six months ended 10-31-21. Unaudited. |
| 2 | Period from 9-27-18 (commencement of operations) to 4-30-19. |
| 3 | Based on average daily shares outstanding. |
| 4 | Total returns would have been lower had certain expenses not been reduced during the applicable periods. |
| 5 | Not annualized. |
| 6 | Annualized. |
| 7 | Portfolio turnover rate excludes securities received or delivered from in-kind transactions. |
| SEE NOTES TO FINANCIAL STATEMENTS | SEMIANNUAL | JOHN HANCOCK MULTIFACTOR ETFS | 89 |
MULTIFACTOR ENERGY ETF
| Period ended | 10-31-211 | 4-30-21 | 4-30-20 | 4-30-19 | 4-30-18 | 4-30-17 |
| Per share operating performance | | | | | | |
| Net asset value, beginning of period | $19.04 | $13.90 | $26.78 | $31.39 | $27.42 | $27.23 |
| Net investment income2 | 0.33 | 0.43 | 1.353 | 0.51 | 0.664 | 0.42 |
| Net realized and unrealized gain (loss) on investments | 4.09 | 5.20 | (12.80) | (4.59) | 3.85 | 0.06 |
| Total from investment operations | 4.42 | 5.63 | (11.45) | (4.08) | 4.51 | 0.48 |
| Less distributions | | | | | | |
| From net investment income | (0.19) | (0.49) | (1.43) | (0.53) | (0.54) | (0.29) |
| Net asset value, end of period | $23.27 | $19.04 | $13.90 | $26.78 | $31.39 | $27.42 |
| Total return (%)5 | 23.276 | 41.67 | (44.93) | (12.84) | 16.69 | 1.73 |
| Ratios and supplemental data | | | | | | |
| Net assets, end of period (in millions) | $22 | $21 | $15 | $26 | $37 | $16 |
| Ratios (as a percentage of average net assets): | | | | | | |
| Expenses before reductions | 0.987 | 1.18 | 1.05 | 0.86 | 1.07 | 1.15 |
| Expenses including reductions | 0.407 | 0.40 | 0.40 | 0.48 | 0.50 | 0.50 |
| Net investment income | 3.177 | 2.91 | 6.383 | 1.72 | 2.354 | 1.46 |
| Portfolio turnover (%)8 | 6 | 37 | 22 | 25 | 16 | 30 |
| | |
| 1 | Six months ended 10-31-21. Unaudited. |
| 2 | Based on average daily shares outstanding. |
| 3 | Net investment income (loss) per share and ratio of net investment income (loss) to average net assets reflect a special dividend received by the fund, which amounted to $0.82 and 3.84%, respectively. |
| 4 | Net investment income (loss) per share and ratio of net investment income (loss) to average net assets reflect a special dividend received by the fund, which amounted to $0.16 and 0.58%, respectively. |
| 5 | Total returns would have been lower had certain expenses not been reduced during the applicable periods. |
| 6 | Not annualized. |
| 7 | Annualized. |
| 8 | Portfolio turnover rate excludes securities received or delivered from in-kind transactions. |
MULTIFACTOR FINANCIALS ETF
| Period ended | 10-31-211 | 4-30-21 | 4-30-20 | 4-30-19 | 4-30-18 | 4-30-17 |
| Per share operating performance | | | | | | |
| Net asset value, beginning of period | $50.38 | $31.30 | $38.10 | $36.86 | $31.48 | $25.35 |
| Net investment income2 | 0.38 | 0.69 | 0.70 | 0.57 | 0.45 | 0.38 |
| Net realized and unrealized gain (loss) on investments | 3.70 | 19.11 | (6.64) | 1.21 | 5.30 | 6.10 |
| Total from investment operations | 4.08 | 19.80 | (5.94) | 1.78 | 5.75 | 6.48 |
| Less distributions | | | | | | |
| From net investment income | (0.34) | (0.72) | (0.86) | (0.54) | (0.37) | (0.35) |
| Net asset value, end of period | $54.12 | $50.38 | $31.30 | $38.10 | $36.86 | $31.48 |
| Total return (%)3 | 8.154 | 64.14 | (16.06) | 5.15 | 18.33 | 25.78 |
| Ratios and supplemental data | | | | | | |
| Net assets, end of period (in millions) | $41 | $37 | $30 | $48 | $69 | $43 |
| Ratios (as a percentage of average net assets): | | | | | | |
| Expenses before reductions | 0.725 | 0.81 | 0.72 | 0.66 | 0.75 | 0.99 |
| Expenses including reductions | 0.405 | 0.40 | 0.40 | 0.47 | 0.50 | 0.50 |
| Net investment income | 1.465 | 1.82 | 1.86 | 1.57 | 1.26 | 1.32 |
| Portfolio turnover (%)6 | 4 | 11 | 10 | 9 | 8 | 7 |
| | |
| 1 | Six months ended 10-31-21. Unaudited. |
| 2 | Based on average daily shares outstanding. |
| 3 | Total returns would have been lower had certain expenses not been reduced during the applicable periods. |
| 4 | Not annualized. |
| 5 | Annualized. |
| 6 | Portfolio turnover rate excludes securities received or delivered from in-kind transactions. |
| 90 | JOHN HANCOCK MULTIFACTOR ETFS | SEMIANNUAL | SEE NOTES TO FINANCIAL STATEMENTS |
MULTIFACTOR HEALTHCARE ETF
| Period ended | 10-31-211 | 4-30-21 | 4-30-20 | 4-30-19 | 4-30-18 | 4-30-17 |
| Per share operating performance | | | | | | |
| Net asset value, beginning of period | $46.40 | $36.93 | $33.33 | $31.14 | $28.59 | $25.77 |
| Net investment income2 | 0.27 | 0.75 | 0.60 | 0.73 | 0.24 | 0.30 |
| Net realized and unrealized gain (loss) on investments | 3.62 | 9.81 | 3.91 | 1.71 | 2.62 | 2.72 |
| Total from investment operations | 3.89 | 10.56 | 4.51 | 2.44 | 2.86 | 3.02 |
| Less distributions | | | | | | |
| From net investment income | (0.17) | (1.09) | (0.91) | (0.25) | (0.31) | (0.20) |
| Net asset value, end of period | $50.12 | $46.40 | $36.93 | $33.33 | $31.14 | $28.59 |
| Total return (%)3 | 8.394 | 29.08 | 13.70 | 7.89 | 10.04 | 11.78 |
| Ratios and supplemental data | | | | | | |
| Net assets, end of period (in millions) | $52 | $52 | $43 | $54 | $41 | $33 |
| Ratios (as a percentage of average net assets): | | | | | | |
| Expenses before reductions | 0.645 | 0.67 | 0.68 | 0.66 | 0.86 | 1.06 |
| Expenses including reductions | 0.405 | 0.40 | 0.40 | 0.46 | 0.50 | 0.50 |
| Net investment income | 1.105 | 1.82 | 1.72 | 2.18 | 0.79 | 1.12 |
| Portfolio turnover (%)6 | 39 | 11 | 10 | 21 | 11 | 14 |
| | |
| 1 | Six months ended 10-31-21. Unaudited. |
| 2 | Based on average daily shares outstanding. |
| 3 | Total returns would have been lower had certain expenses not been reduced during the applicable periods. |
| 4 | Not annualized. |
| 5 | Annualized. |
| 6 | Portfolio turnover rate excludes securities received or delivered from in-kind transactions. |
MULTIFACTOR INDUSTRIALS ETF
| Period ended | 10-31-211 | 4-30-21 | 4-30-20 | 4-30-19 | 4-30-18 | 4-30-17 |
| Per share operating performance | | | | | | |
| Net asset value, beginning of period | $51.47 | $31.78 | $37.41 | $33.75 | $30.40 | $25.37 |
| Net investment income2 | 0.25 | 0.42 | 0.52 | 0.59 | 0.33 | 0.35 |
| Net realized and unrealized gain (loss) on investments | 2.82 | 19.70 | (5.64) | 3.69 | 3.33 | 4.94 |
| Total from investment operations | 3.07 | 20.12 | (5.12) | 4.28 | 3.66 | 5.29 |
| Less distributions | | | | | | |
| From net investment income | (0.25) | (0.43) | (0.51) | (0.62) | (0.31) | (0.26) |
| Net asset value, end of period | $54.29 | $51.47 | $31.78 | $37.41 | $33.75 | $30.40 |
| Total return (%)3 | 5.984 | 63.78 | (13.92) | 13.16 | 12.04 | 20.95 |
| Ratios and supplemental data | | | | | | |
| Net assets, end of period (in millions) | $17 | $51 | $22 | $32 | $32 | $21 |
| Ratios (as a percentage of average net assets): | | | | | | |
| Expenses before reductions | 0.815 | 0.73 | 0.86 | 0.90 | 0.98 | 1.12 |
| Expenses including reductions | 0.405 | 0.40 | 0.40 | 0.47 | 0.50 | 0.50 |
| Net investment income | 0.945 | 1.01 | 1.42 | 1.70 | 0.98 | 1.24 |
| Portfolio turnover (%)6 | 3 | 13 | 21 | 49 | 3 | 8 |
| | |
| 1 | Six months ended 10-31-21. Unaudited. |
| 2 | Based on average daily shares outstanding. |
| 3 | Total returns would have been lower had certain expenses not been reduced during the applicable periods. |
| 4 | Not annualized. |
| 5 | Annualized. |
| 6 | Portfolio turnover rate excludes securities received or delivered from in-kind transactions. |
| SEE NOTES TO FINANCIAL STATEMENTS | SEMIANNUAL | JOHN HANCOCK MULTIFACTOR ETFS | 91 |
MULTIFACTOR LARGE CAP ETF
| Period ended | 10-31-211 | 4-30-21 | 4-30-20 | 4-30-19 | 4-30-18 | 4-30-17 |
| Per share operating performance | | | | | | |
| Net asset value, beginning of period | $53.37 | $36.16 | $37.97 | $34.52 | $31.09 | $26.69 |
| Net investment income2 | 0.33 | 0.66 | 0.73 | 0.70 | 0.51 | 0.49 |
| Net realized and unrealized gain (loss) on investments | 4.44 | 17.30 | (1.83) | 3.25 | 3.42 | 4.31 |
| Total from investment operations | 4.77 | 17.96 | (1.10) | 3.95 | 3.93 | 4.80 |
| Less distributions | | | | | | |
| From net investment income | (0.29) | (0.75) | (0.71) | (0.50) | (0.50) | (0.40) |
| Net asset value, end of period | $57.85 | $53.37 | $36.16 | $37.97 | $34.52 | $31.09 |
| Total return (%)3 | 8.984 | 50.22 | (3.04) | 11.74 | 12.69 | 18.13 |
| Ratios and supplemental data | | | | | | |
| Net assets, end of period (in millions) | $782 | $706 | $789 | $922 | $401 | $342 |
| Ratios (as a percentage of average net assets): | | | | | | |
| Expenses before reductions | 0.325 | 0.31 | 0.34 | 0.35 | 0.40 | 0.45 |
| Expenses including reductions | 0.295 | 0.29 | 0.33 | 0.34 | 0.35 | 0.35 |
| Net investment income | 1.185 | 1.50 | 1.92 | 1.96 | 1.53 | 1.67 |
| Portfolio turnover (%)6 | 2 | 7 | 6 | 6 | 5 | 12 |
| | |
| 1 | Six months ended 10-31-21. Unaudited. |
| 2 | Based on average daily shares outstanding. |
| 3 | Total returns would have been lower had certain expenses not been reduced during the applicable periods. |
| 4 | Not annualized. |
| 5 | Annualized. |
| 6 | Portfolio turnover rate excludes securities received or delivered from in-kind transactions. |
MULTIFACTOR MATERIALS ETF
| Period ended | 10-31-211 | 4-30-21 | 4-30-20 | 4-30-19 | 4-30-18 | 4-30-17 |
| Per share operating performance | | | | | | |
| Net asset value, beginning of period | $46.90 | $28.14 | $32.51 | $34.00 | $30.85 | $26.76 |
| Net investment income2 | 0.35 | 0.63 | 0.58 | 0.55 | 0.44 | 0.44 |
| Net realized and unrealized gain (loss) on investments | 0.33 | 18.74 | (4.31) | (1.54) | 3.13 | 3.97 |
| Total from investment operations | 0.68 | 19.37 | (3.73) | (0.99) | 3.57 | 4.41 |
| Less distributions | | | | | | |
| From net investment income | (0.32) | (0.61) | (0.64) | (0.50) | (0.42) | (0.32) |
| Net asset value, end of period | $47.26 | $46.90 | $28.14 | $32.51 | $34.00 | $30.85 |
| Total return (%)3 | 1.464 | 69.61 | (11.77) | (2.76) | 11.62 | 16.58 |
| Ratios and supplemental data | | | | | | |
| Net assets, end of period (in millions) | $19 | $27 | $17 | $23 | $23 | $20 |
| Ratios (as a percentage of average net assets): | | | | | | |
| Expenses before reductions | 0.895 | 0.92 | 1.01 | 1.01 | 1.05 | 1.15 |
| Expenses including reductions | 0.405 | 0.40 | 0.40 | 0.47 | 0.50 | 0.50 |
| Net investment income | 1.485 | 1.71 | 1.82 | 1.68 | 1.32 | 1.51 |
| Portfolio turnover (%)6 | 7 | 16 | 20 | 46 | 10 | 17 |
| | |
| 1 | Six months ended 10-31-21. Unaudited. |
| 2 | Based on average daily shares outstanding. |
| 3 | Total returns would have been lower had certain expenses not been reduced during the applicable periods. |
| 4 | Not annualized. |
| 5 | Annualized. |
| 6 | Portfolio turnover rate excludes securities received or delivered from in-kind transactions. |
| 92 | JOHN HANCOCK MULTIFACTOR ETFS | SEMIANNUAL | SEE NOTES TO FINANCIAL STATEMENTS |
MULTIFACTOR MEDIA AND COMMUNICATIONS ETF
| Period ended | 10-31-211 | 4-30-21 | 4-30-20 | 4-30-192 |
| Per share operating performance | | | | |
| Net asset value, beginning of period | $38.59 | $25.12 | $26.51 | $25.00 |
| Net investment income3 | 0.15 | 0.29 | 0.29 | 0.04 |
| Net realized and unrealized gain (loss) on investments | (1.23) | 13.45 | (1.48) | 1.47 |
| Total from investment operations | (1.08) | 13.74 | (1.19) | 1.51 |
| Less distributions | | | | |
| From net investment income | (0.15) | (0.27) | (0.20) | — |
| Net asset value, end of period | $37.36 | $38.59 | $25.12 | $26.51 |
| Total return (%)4 | (2.83)5 | 55.00 | (4.60) | 6.055 |
| Ratios and supplemental data | | | | |
| Net assets, end of period (in millions) | $20 | $31 | $22 | $24 |
| Ratios (as a percentage of average net assets): | | | | |
| Expenses before reductions | 0.856 | 0.77 | 1.02 | 2.986 |
| Expenses including reductions | 0.406 | 0.40 | 0.40 | 0.406 |
| Net investment income | 0.766 | 0.91 | 1.07 | 1.296 |
| Portfolio turnover (%)7 | 8 | 20 | 19 | 0 |
| | |
| 1 | Six months ended 10-31-21. Unaudited. |
| 2 | Period from 3-12-19 (commencement of operations) to 4-30-19. |
| 3 | Based on average daily shares outstanding. |
| 4 | Total returns would have been lower had certain expenses not been reduced during the applicable periods. |
| 5 | Not annualized. |
| 6 | Annualized. |
| 7 | Portfolio turnover rate excludes securities received or delivered from in-kind transactions. |
MULTIFACTOR MID CAP ETF
| Period ended | 10-31-211 | 4-30-21 | 4-30-20 | 4-30-19 | 4-30-18 | 4-30-17 |
| Per share operating performance | | | | | | |
| Net asset value, beginning of period | $51.54 | $32.39 | $36.60 | $34.04 | $30.65 | $26.07 |
| Net investment income2 | 0.29 | 0.39 | 0.48 | 0.53 | 0.34 | 0.33 |
| Net realized and unrealized gain (loss) on investments | 3.04 | 19.23 | (4.29) | 2.44 | 3.36 | 4.58 |
| Total from investment operations | 3.33 | 19.62 | (3.81) | 2.97 | 3.70 | 4.91 |
| Less distributions | | | | | | |
| From net investment income | (0.15) | (0.47) | (0.40) | (0.41) | (0.31) | (0.33) |
| Net asset value, end of period | $54.72 | $51.54 | $32.39 | $36.60 | $34.04 | $30.65 |
| Total return (%)3 | 6.484 | 61.03 | (10.56) | 8.98 | 12.11 | 18.96 |
| Ratios and supplemental data | | | | | | |
| Net assets, end of period (in millions) | $2,484 | $2,163 | $1,331 | $1,030 | $332 | $170 |
| Ratios (as a percentage of average net assets): | | | | | | |
| Expenses before reductions | 0.425 | 0.42 | 0.43 | 0.45 | 0.52 | 0.61 |
| Expenses including reductions | 0.415 | 0.41 | 0.42 | 0.44 | 0.45 | 0.45 |
| Net investment income | 1.085 | 0.96 | 1.33 | 1.53 | 1.03 | 1.16 |
| Portfolio turnover (%)6 | 6 | 20 | 11 | 13 | 11 | 14 |
| | |
| 1 | Six months ended 10-31-21. Unaudited. |
| 2 | Based on average daily shares outstanding. |
| 3 | Total returns would have been lower had certain expenses not been reduced during the applicable periods. |
| 4 | Not annualized. |
| 5 | Annualized. |
| 6 | Portfolio turnover rate excludes securities received or delivered from in-kind transactions. |
| SEE NOTES TO FINANCIAL STATEMENTS | SEMIANNUAL | JOHN HANCOCK MULTIFACTOR ETFS | 93 |
MULTIFACTOR SMALL CAP ETF
| Period ended | 10-31-211 | 4-30-21 | 4-30-20 | 4-30-19 | 4-30-182 |
| Per share operating performance | | | | | |
| Net asset value, beginning of period | $35.30 | $21.77 | $26.89 | $25.69 | $25.00 |
| Net investment income3 | 0.18 | 0.36 | 0.33 | 0.29 | 0.13 |
| Net realized and unrealized gain (loss) on investments | 0.91 | 13.51 | (5.13) | 1.16 | 0.56 |
| Total from investment operations | 1.09 | 13.87 | (4.80) | 1.45 | 0.69 |
| Less distributions | | | | | |
| From net investment income | (0.17) | (0.34) | (0.32) | (0.25) | — |
| Net asset value, end of period | $36.22 | $35.30 | $21.77 | $26.89 | $25.69 |
| Total return (%)4 | 3.095 | 64.17 | (18.07) | 5.71 | 2.775 |
| Ratios and supplemental data | | | | | |
| Net assets, end of period (in millions) | $444 | $426 | $463 | $439 | $39 |
| Ratios (as a percentage of average net assets): | | | | | |
| Expenses before reductions | 0.466 | 0.45 | 0.55 | 0.60 | 0.906,7 |
| Expenses including reductions | 0.426 | 0.42 | 0.49 | 0.50 | 0.516,7 |
| Net investment income | 1.016 | 1.31 | 1.30 | 1.13 | 1.056 |
| Portfolio turnover (%)8 | 20 | 56 | 36 | 33 | 17 |
| | |
| 1 | Six months ended 10-31-21. Unaudited. |
| 2 | Period from 11-8-17 (commencement of operations) to 4-30-18. |
| 3 | Based on average daily shares outstanding. |
| 4 | Total returns would have been lower had certain expenses not been reduced during the applicable periods. |
| 5 | Not annualized. |
| 6 | Annualized. |
| 7 | Certain expenses are presented unannualized due to the short reporting period. |
| 8 | Portfolio turnover rate excludes securities received or delivered from in-kind transactions. |
MULTIFACTOR TECHNOLOGY ETF
| Period ended | 10-31-211 | 4-30-21 | 4-30-20 | 4-30-19 | 4-30-18 | 4-30-17 |
| Per share operating performance | | | | | | |
| Net asset value, beginning of period | $84.81 | $53.33 | $50.65 | $42.87 | $35.10 | $25.86 |
| Net investment income2 | 0.19 | 0.54 | 0.69 | 0.43 | 0.28 | 0.34 |
| Net realized and unrealized gain (loss) on investments | 13.19 | 31.66 | 2.66 | 7.72 | 7.77 | 9.30 |
| Total from investment operations | 13.38 | 32.20 | 3.35 | 8.15 | 8.05 | 9.64 |
| Less distributions | | | | | | |
| From net investment income | (0.22) | (0.72) | (0.67) | (0.37) | (0.28) | (0.40) |
| Net asset value, end of period | $97.97 | $84.81 | $53.33 | $50.65 | $42.87 | $35.10 |
| Total return (%)3 | 15.814 | 60.79 | 6.65 | 19.25 | 23.02 | 37.66 |
| Ratios and supplemental data | | | | | | |
| Net assets, end of period (in millions) | $73 | $57 | $36 | $62 | $63 | $42 |
| Ratios (as a percentage of average net assets): | | | | | | |
| Expenses before reductions | 0.605 | 0.67 | 0.66 | 0.64 | 0.74 | 1.00 |
| Expenses including reductions | 0.405 | 0.40 | 0.40 | 0.47 | 0.50 | 0.50 |
| Net investment income | 0.425 | 0.76 | 1.35 | 0.96 | 0.70 | 1.11 |
| Portfolio turnover (%)6 | 6 | 12 | 21 | 27 | 7 | 18 |
| | |
| 1 | Six months ended 10-31-21. Unaudited. |
| 2 | Based on average daily shares outstanding. |
| 3 | Total returns would have been lower had certain expenses not been reduced during the applicable periods. |
| 4 | Not annualized. |
| 5 | Annualized. |
| 6 | Portfolio turnover rate excludes securities received or delivered from in-kind transactions. |
| 94 | JOHN HANCOCK MULTIFACTOR ETFS | SEMIANNUAL | SEE NOTES TO FINANCIAL STATEMENTS |
MULTIFACTOR UTILITIES ETF
| Period ended | 10-31-211 | 4-30-21 | 4-30-20 | 4-30-19 | 4-30-18 | 4-30-17 |
| Per share operating performance | | | | | | |
| Net asset value, beginning of period | $33.37 | $29.26 | $31.68 | $27.45 | $27.02 | $24.86 |
| Net investment income2 | 0.48 | 0.88 | 0.87 | 0.84 | 0.77 | 0.71 |
| Net realized and unrealized gain (loss) on investments | (0.17) | 4.23 | (2.40) | 4.05 | 0.34 | 1.94 |
| Total from investment operations | 0.31 | 5.11 | (1.53) | 4.89 | 1.11 | 2.65 |
| Less distributions | | | | | | |
| From net investment income | (0.41) | (1.00) | (0.89) | (0.66) | (0.68) | (0.49) |
| Net asset value, end of period | $33.27 | $33.37 | $29.26 | $31.68 | $27.45 | $27.02 |
| Total return (%)3 | 1.004 | 18.01 | (5.16) | 18.21 | 4.14 | 10.79 |
| Ratios and supplemental data | | | | | | |
| Net assets, end of period (in millions) | $17 | $17 | $25 | $29 | $18 | $18 |
| Ratios (as a percentage of average net assets): | | | | | | |
| Expenses before reductions | 1.115 | 0.94 | 0.77 | 0.87 | 1.16 | 1.18 |
| Expenses including reductions | 0.405 | 0.40 | 0.40 | 0.46 | 0.50 | 0.50 |
| Net investment income | 2.895 | 2.89 | 2.66 | 2.86 | 2.78 | 2.77 |
| Portfolio turnover (%)6 | 6 | 17 | 11 | 19 | 12 | 16 |
| | |
| 1 | Six months ended 10-31-21. Unaudited. |
| 2 | Based on average daily shares outstanding. |
| 3 | Total returns would have been lower had certain expenses not been reduced during the applicable periods. |
| 4 | Not annualized. |
| 5 | Annualized. |
| 6 | Portfolio turnover rate excludes securities received or delivered from in-kind transactions. |
| SEE NOTES TO FINANCIAL STATEMENTS | SEMIANNUAL | JOHN HANCOCK MULTIFACTOR ETFS | 95 |
Notes to financial statements (unaudited)
Note 1—Organization
John Hancock Exchange-Traded Fund Trust (the Trust) is an open-end management investment company organized as a Massachusetts business trust. The Trust is registered under the Investment Company Act of 1940, as amended (the 1940 Act). It is a series company with multiple investment series, fifteen of which are presented in this report (the funds).
The investment objective of each fund is to seek to provide investment results that closely correspond, before fees and expenses, to the performance of their respective Index as listed below:
| Fund | Index |
| Multifactor Consumer Discretionary ETF | John Hancock Dimensional Consumer Discretionary Index |
| Multifactor Consumer Staples ETF | John Hancock Dimensional Consumer Staples Index |
| Multifactor Developed International ETF | John Hancock Dimensional Developed International Index |
| Multifactor Emerging Markets ETF | John Hancock Dimensional Emerging Markets Index |
| Multifactor Energy ETF | John Hancock Dimensional Energy Index |
| Multifactor Financials ETF | John Hancock Dimensional Financials Index |
| Multifactor Healthcare ETF | John Hancock Dimensional Healthcare Index |
| Multifactor Industrials ETF | John Hancock Dimensional Industrials Index |
| Multifactor Large Cap ETF | John Hancock Dimensional Large Cap Index |
| Multifactor Materials ETF | John Hancock Dimensional Materials Index |
| Multifactor Media and Communications ETF | John Hancock Dimensional Media and Communications Index |
| Multifactor Mid Cap ETF | John Hancock Dimensional Mid Cap Index |
| Multifactor Small Cap ETF | John Hancock Dimensional Small Cap Index |
| Multifactor Technology ETF | John Hancock Dimensional Technology Index |
| Multifactor Utilities ETF | John Hancock Dimensional Utilities Index |
Note 2—Significant accounting policies
The financial statements have been prepared in conformity with accounting principles generally accepted in the United States of America (US GAAP), which require management to make certain estimates and assumptions as of the date of the financial statements. Actual results could differ from those estimates and those differences could be significant. The funds qualify as investment companies under Topic 946 of Accounting Standards Codification of US GAAP.
Events or transactions occurring after the end of the fiscal period through the date that the financial statements were issued have been evaluated in the preparation of the financial statements. The following summarizes the significant accounting policies of the funds:
Security valuation. Investments are stated at value as of the scheduled close of regular trading on the New York Stock Exchange (NYSE), normally at 4:00 P.M., Eastern Time. In case of emergency or other disruption resulting in the NYSE not opening for trading or the NYSE closing at a time other than the regularly scheduled close, the net asset value (NAV) may be determined as of the regularly scheduled close of the NYSE pursuant to the funds’ Valuation Policies and Procedures.
In order to value the securities, the funds use the following valuation techniques: Equity securities, including exchange-traded funds and closed-end funds, held by the funds are typically valued at the last sale price or official closing price on the exchange or principal market where the security trades. In the event there were no sales during the day or closing prices are not available, the securities are valued using the last available bid price. Investments in open-end mutual funds, including John Hancock Collateral Trust (JHCT), are valued at their respective NAVs each business day. Foreign securities and currencies are valued in U.S. dollars based on foreign currency exchange rates supplied by an independent pricing vendor valued at London close.
In certain instances, the Pricing Committee may determine to value equity securities using prices obtained from another exchange or market if trading on the exchange or market on which prices are typically obtained did not open for trading as scheduled, or if trading closed earlier than scheduled, and trading occurred as normal on another exchange or market.
Other portfolio securities and assets, for which reliable market quotations are not readily available, are valued at fair value as determined in good faith by the funds’ Pricing Committee following procedures established by the Board of Trustees. The frequency with which these fair valuation procedures are used cannot be predicted and fair value of securities may differ significantly from the value that would have been used had a ready market for such securities existed. Trading in foreign securities may be completed before the scheduled daily close of trading on the NYSE. Significant events at the issuer or market level may affect the values of securities between the time when the valuation of the securities is generally determined and the close of the NYSE. If a significant event occurs, these securities may be fair valued, as determined in good faith by the funds’ Pricing Committee, following procedures established by the Board of Trustees. The funds may use fair value adjustment factors provided by an independent pricing vendor to value certain foreign securities in order to adjust for events that may occur between the close of foreign exchanges or markets and the close of the NYSE.
The funds use a three-tier hierarchy to prioritize the pricing assumptions, referred to as inputs, used in valuation techniques to measure fair value. Level 1 includes securities valued using quoted prices in active markets for identical securities, including registered investment companies. Level 2 includes securities valued using other significant observable inputs. Observable inputs may include quoted prices for similar securities, interest rates, prepayment speeds and credit risk. Prices for securities valued using these inputs are received from independent pricing vendors and brokers and are based on an evaluation of the inputs described. Level 3 includes securities valued using significant unobservable inputs when market prices are not readily available or reliable, including the funds’ own assumptions in determining
| 96 | JOHN HANCOCK MULTIFACTOR ETFS | SEMIANNUAL REPORT | |
the fair value of investments. Factors used in determining value may include market or issuer specific events or trends, changes in interest rates and credit quality. The inputs or methodology used for valuing securities are not necessarily an indication of the risks associated with investing in those securities. Changes in valuation techniques and related inputs may result in transfers into or out of an assigned level within the disclosure hierarchy.
The following is a summary of the values by input classification of the funds’ investments as of October 31, 2021, by major security category or type:
| | Total
value at
10-31-21 | Level 1
quoted
price | Level 2
significant
observable
inputs | Level 3
significant
unobservable
inputs |
| Multifactor Consumer Discretionary ETF | | | | |
| Investments in securities: | | | | |
| Assets | | | | |
| Common stocks | $26,910,277 | $26,910,277 | — | — |
| Short-term investments | 181,656 | 181,656 | — | — |
| Total investments in securities | $27,091,933 | $27,091,933 | — | — |
| |
| Multifactor Consumer Staples ETF | | | | |
| Investments in securities: | | | | |
| Assets | | | | |
| Common stocks | $21,867,530 | $21,867,530 | — | — |
| Short-term investments | 200,756 | 200,756 | — | — |
| Total investments in securities | $22,068,286 | $22,068,286 | — | — |
| |
| Multifactor Developed International ETF | | | | |
| Investments in securities: | | | | |
| Assets | | | | |
| Common stocks | | | | |
| Australia | $36,166,653 | $34,791,976 | $1,374,677 | — |
| Austria | 861,236 | 861,236 | — | — |
| Belgium | 4,830,567 | 4,830,567 | — | — |
| Chile | 559,705 | 559,705 | — | — |
| Czech Republic | 357,478 | 357,478 | — | — |
| Denmark | 13,639,731 | 13,639,731 | — | — |
| Finland | 7,125,025 | 7,125,025 | — | — |
| France | 53,869,303 | 53,869,303 | — | — |
| Germany | 42,705,942 | 42,705,942 | — | — |
| Hong Kong | 14,769,302 | 14,769,302 | — | — |
| Ireland | 5,787,634 | 5,787,634 | — | — |
| Israel | 2,416,813 | 2,416,813 | — | — |
| Italy | 11,265,356 | 11,265,356 | — | — |
| Japan | 124,003,515 | 124,003,515 | — | — |
| Jordan | 198,755 | 198,755 | — | — |
| Luxembourg | 2,116,413 | 2,116,413 | — | — |
| Macau | 132,566 | 132,566 | — | — |
| Mexico | 115,909 | 115,909 | — | — |
| Netherlands | 30,538,281 | 30,538,281 | — | — |
| New Zealand | 974,978 | 974,978 | — | — |
| Norway | 3,156,101 | 3,156,101 | — | — |
| Portugal | 872,155 | 872,155 | — | — |
| Singapore | 9,434,617 | 9,434,617 | — | — |
| Spain | 12,196,526 | 12,196,526 | — | — |
| Sweden | 18,706,346 | 18,706,346 | — | — |
| Switzerland | 52,834,652 | 52,834,652 | — | — |
| United Arab Emirates | 986 | — | 986 | — |
| United Kingdom | 69,115,389 | 69,115,389 | — | — |
| United States | 57,548 | 57,548 | — | — |
| | SEMIANNUAL REPORT | JOHN HANCOCK MULTIFACTOR ETFS | 97 |
| | Total
value at
10-31-21 | Level 1
quoted
price | Level 2
significant
observable
inputs | Level 3
significant
unobservable
inputs |
| Multifactor Developed International ETF (continued) | | | | |
| Preferred securities | $3,629,003 | $3,629,003 | — | — |
| Short-term investments | 6,759,770 | 6,759,770 | — | — |
| Total investments in securities | $529,198,255 | $527,822,592 | $1,375,663 | — |
| |
| Multifactor Emerging Markets ETF | | | | |
| Investments in securities: | | | | |
| Assets | | | | |
| Common stocks | | | | |
| Brazil | $25,872,615 | $25,872,615 | — | — |
| Chile | 2,456,904 | 2,456,904 | — | — |
| China | 184,947,905 | 184,947,905 | — | — |
| Hong Kong | 14,355,991 | 14,355,991 | — | — |
| India | 121,237,937 | 121,237,937 | — | — |
| Indonesia | 14,339,895 | 14,339,895 | — | — |
| Malaysia | 13,201,741 | 13,201,741 | — | — |
| Mexico | 16,946,730 | 16,946,730 | — | — |
| Philippines | 7,448,805 | 7,448,805 | — | — |
| Poland | 7,248,873 | 7,248,873 | — | — |
| Romania | 136,576 | 136,576 | — | — |
| Russia | 23,540,129 | 23,540,129 | — | — |
| Saudi Arabia | 20,527,720 | 20,527,720 | — | — |
| South Africa | 30,008,878 | 30,008,878 | — | — |
| South Korea | 92,187,558 | 90,938,186 | $1,249,372 | — |
| Taiwan | 111,266,168 | 111,266,168 | — | — |
| Thailand | 13,812,921 | 13,812,921 | — | — |
| Turkey | 2,139,314 | 2,139,314 | — | — |
| United States | 256,756 | 256,756 | — | — |
| Preferred securities | 9,056,143 | 9,056,143 | — | — |
| Rights | 39,880 | 39,880 | — | — |
| Warrants | 9,701 | 1,882 | 7,819 | — |
| Short-term investments | 6,720 | 6,720 | — | — |
| Total investments in securities | $711,045,860 | $709,788,669 | $1,257,191 | — |
| |
| Multifactor Energy ETF | | | | |
| Investments in securities: | | | | |
| Assets | | | | |
| Common stocks | $21,826,322 | $21,826,322 | — | — |
| Short-term investments | 72,764 | 72,764 | — | — |
| Total investments in securities | $21,899,086 | $21,899,086 | — | — |
| |
| Multifactor Financials ETF | | | | |
| Investments in securities: | | | | |
| Assets | | | | |
| Common stocks | $41,093,717 | $41,093,717 | — | — |
| Short-term investments | 74,947 | 74,947 | — | — |
| Total investments in securities | $41,168,664 | $41,168,664 | — | — |
| |
| Multifactor Healthcare ETF | | | | |
| Investments in securities: | | | | |
| Assets | | | | |
| Common stocks | $52,099,033 | $52,099,033 | — | — |
| Short-term investments | 74,352 | 74,352 | — | — |
| Total investments in securities | $52,173,385 | $52,173,385 | — | — |
| |
| 98 | JOHN HANCOCK MULTIFACTOR ETFS | SEMIANNUAL REPORT | |
| | Total
value at
10-31-21 | Level 1
quoted
price | Level 2
significant
observable
inputs | Level 3
significant
unobservable
inputs |
| Multifactor Industrials ETF | | | | |
| Investments in securities: | | | | |
| Assets | | | | |
| Common stocks | $16,812,023 | $16,812,023 | — | — |
| Short-term investments | 71,383 | 71,383 | — | — |
| Total investments in securities | $16,883,406 | $16,883,406 | — | — |
| |
| Multifactor Large Cap ETF | | | | |
| Investments in securities: | | | | |
| Assets | | | | |
| Common stocks | $781,809,017 | $781,809,017 | — | — |
| Short-term investments | 1,081,714 | 1,081,714 | — | — |
| Total investments in securities | $782,890,731 | $782,890,731 | — | — |
| |
| Multifactor Materials ETF | | | | |
| Investments in securities: | | | | |
| Assets | | | | |
| Common stocks | $19,363,076 | $19,363,076 | — | — |
| Short-term investments | 63,880 | 63,880 | — | — |
| Total investments in securities | $19,426,956 | $19,426,956 | — | — |
| |
| Multifactor Media and Communications ETF | | | | |
| Investments in securities: | | | | |
| Assets | | | | |
| Common stocks | $19,794,965 | $19,794,965 | — | — |
| Short-term investments | 30,964 | 30,964 | — | — |
| Total investments in securities | $19,825,929 | $19,825,929 | — | — |
| |
| Multifactor Mid Cap ETF | | | | |
| Investments in securities: | | | | |
| Assets | | | | |
| Common stocks | $2,482,663,564 | $2,482,663,564 | — | — |
| Short-term investments | 7,987,330 | 7,987,330 | — | — |
| Total investments in securities | $2,490,650,894 | $2,490,650,894 | — | — |
| |
| Multifactor Small Cap ETF | | | | |
| Investments in securities: | | | | |
| Assets | | | | |
| Common stocks | $443,448,315 | $443,448,315 | — | — |
| Short-term investments | 665,369 | 665,369 | — | — |
| Total investments in securities | $444,113,684 | $444,113,684 | — | — |
| |
| Multifactor Technology ETF | | | | |
| Investments in securities: | | | | |
| Assets | | | | |
| Common stocks | $72,460,402 | $72,460,402 | — | — |
| Short-term investments | 255,254 | 255,254 | — | — |
| Total investments in securities | $72,715,656 | $72,715,656 | — | — |
| |
| Multifactor Utilities ETF | | | | |
| Investments in securities: | | | | |
| Assets | | | | |
| Common stocks | $17,287,858 | $17,287,858 | — | — |
| | SEMIANNUAL REPORT | JOHN HANCOCK MULTIFACTOR ETFS | 99 |
| | Total
value at
10-31-21 | Level 1
quoted
price | Level 2
significant
observable
inputs | Level 3
significant
unobservable
inputs |
| Multifactor Utilities ETF (continued) | | | | |
| Short-term investments | $59,522 | $59,522 | — | — |
| Total investments in securities | $17,347,380 | $17,347,380 | — | — |
Security transactions and related investment income. Investment security transactions are accounted for on a trade date plus one basis for daily NAV calculations. However, for financial reporting purposes, investment transactions are reported on trade date. Interest income is accrued as earned. Dividend income is recorded on ex-date, except for dividends of certain foreign securities where the dividend may not be known until after the ex-date. In those cases, dividend income, net of withholding taxes, is recorded when the fund becomes aware of the dividends. Non-cash dividends, if any, are recorded at the fair market value of the securities received. Gains and losses on securities sold are determined on the basis of identified cost and may include proceeds from litigation.
Real estate investment trusts. The funds may invest in real estate investment trusts (REITs). Distributions from REITs may be recorded as income and subsequently characterized by the REIT at the end of their fiscal year as a reduction of cost of investments and/or as a realized gain. As a result, the funds will estimate the components of distributions from these securities. Such estimates are revised when the actual components of the distributions are known.
Securities lending. The funds may lend their securities to earn additional income. The funds receive collateral from the borrower in an amount not less than the market value of the loaned securities. The funds may invest their cash collateral in JHCT, an affiliate of the funds, which has a floating NAV and is registered with the Securities and Exchange Commission (SEC) as an investment company. JHCT invests in short-term money market investments. Each fund will receive the benefit of any gains and bear any losses generated by JHCT with respect to the cash collateral.
The funds have the right to recall loaned securities on demand. If a borrower fails to return loaned securities when due, then the lending agent is responsible and indemnifies the funds for the lent securities. The lending agent uses the collateral received from the borrower to purchase replacement securities of the same issue, type, class and series of the loaned securities. If the value of the collateral is less than the purchase cost of replacement securities, the lending agent is responsible for satisfying the shortfall but only to the extent that the shortfall is not due to any decrease in the value of JHCT.
Although the risk of loss on securities lent is mitigated by receiving collateral from the borrower and through lending agent indemnification, the funds could experience a delay in recovering securities or could experience a lower than expected return if the borrower fails to return the securities on a timely basis. During the existence of the loan, the funds will receive from the borrower amounts equivalent to any dividends, interest or other distributions on the loaned securities, as well as interest on such amounts. The funds receive compensation for lending their securities by retaining a portion of the return on the investment of the collateral and compensation from fees earned from borrowers of the securities. Securities lending income received by the funds is net of fees retained by the securities lending agent. Net income received from JHCT is a component of securities lending income as recorded on the Statements of operations.
Obligations to repay collateral received by the funds are shown on the Statements of assets and liabilities as Payable upon return of securities loaned and are secured by the loaned securities. The following table summarizes the values of securities loaned by the funds and the corresponding cash collateral received at October 31, 2021. In addition, non-cash collateral in the form of U.S. Treasuries was pledged, as indicated below. This non-cash collateral cannot be sold or repledged by the funds, and accordingly, is not reflected in the funds’ net assets.
| Fund | Market value of securities on loan | Cash collateral received | Non-cash collateral |
| Multifactor Consumer Discretionary ETF | $251,235 | $106,607 | $153,739 |
| Multifactor Consumer Staples ETF | 145,534 | 146,533 | — |
| Multifactor Developed International ETF | 9,579,577 | 3,900,187 | 6,283,939 |
| Multifactor Emerging Markets ETF | 4,065,336 | — | 4,437,236 |
| Multifactor Energy ETF | 28,830 | — | 30,184 |
| Multifactor Financials ETF | 32,112 | 7,979 | 21,780 |
| Multifactor Healthcare ETF | 44,621 | 6,695 | 40,526 |
| Multifactor Large Cap ETF | 896,353 | 732,504 | 189,995 |
| Multifactor Materials ETF | 95,235 | — | 99,118 |
| Multifactor Media and Communications ETF | 11,064 | — | 11,854 |
| Multifactor Mid Cap ETF | 8,693,771 | 5,974,109 | 2,979,477 |
| Multifactor Small Cap ETF | 1,266,879 | 272,410 | 1,050,826 |
| Multifactor Technology ETF | 146,492 | 142,705 | 6,218 |
Foreign investing. Assets, including investments, and liabilities denominated in foreign currencies are translated into U.S. dollar values each day at the prevailing exchange rate. Purchases and sales of securities, income and expenses are translated into U.S. dollars at the prevailing exchange rate on the date of the transaction. The effect of changes in foreign currency exchange rates on the value of securities is reflected as a component of the realized and unrealized gains (losses) on investments. Foreign investments are subject to a decline in the value of a foreign currency versus the U.S. dollar, which reduces the dollar value of securities denominated in that currency.
Funds that invest internationally generally carry more risk than funds that invest strictly in U.S. securities. These risks are heightened for investments in emerging markets. Risks can result from differences in economic and political conditions, regulations, market practices (including higher transaction costs), accounting standards
| 100 | JOHN HANCOCK MULTIFACTOR ETFS | SEMIANNUAL REPORT | |
and other factors.
There may be unexpected restrictions on investments or on exposures to investments in companies located in certain foreign countries, such as China. For example, on November 12, 2020, the President of the United States signed an Executive Order prohibiting U.S. persons from purchasing or investing in publicly-traded securities or their derivatives of companies identified by the U.S. government as “Communist Chinese military companies.” As a result of forced sales of a security, or inability to participate in an investment the manager otherwise believes is attractive, a fund may incur losses.
Trading in certain Chinese securities through Hong Kong Stock Connect or Bond Connect, mutual market access programs that enable foreign investment in the People’s Republic of China, is subject to certain restrictions and risks. Securities offered through these programs may lose purchase eligibility and any changes in laws, regulations and policies impacting these programs may affect security prices, which could adversely affect the fund’s performance.
Foreign taxes. The funds may be subject to withholding tax on income, capital gains or repatriations imposed by certain countries, a portion of which may be recoverable. Foreign taxes are accrued based upon the funds’ understanding of the tax rules and rates that exist in the foreign markets in which it invests. Taxes are accrued based on gains realized by the funds as a result of certain foreign security sales. In certain circumstances, estimated taxes are accrued based on unrealized appreciation of such securities. Investment income is recorded net of foreign withholding taxes.
Overdraft. The funds may have the ability to borrow from banks for temporary or emergency purposes, including meeting redemption requests that otherwise might require the untimely sale of securities. Pursuant to the funds’ custodian agreement, the custodian may loan money to the funds to make properly authorized payments. The funds are obligated to repay the custodian for any overdraft, including any related costs or expenses. The custodian may have a lien, security interest or security entitlement in any fund property that is not otherwise segregated or pledged, to the extent of any overdraft, and to the maximum extent permitted by law.
Line of credit. The funds and other affiliated funds have entered into a syndicated line of credit agreement with Citibank, N.A. as the administrative agent that enables them to participate in a $1 billion unsecured committed line of credit. Excluding commitments designated for a certain fund and subject to the needs of all other affiliated funds, a fund can borrow up to an aggregate commitment amount of $750 million, subject to asset coverage and other limitations as specified in the agreement. Prior to June 24, 2021, a fund could borrow up to an aggregate commitment amount of $850 million.
A commitment fee payable at the end of each calendar quarter, based on the average daily unused portion of each line of credit, is charged to each participating fund based on a combination of fixed and asset-based allocations and is reflected in Other expenses on the Statements of operations. For the six months ended October 31, 2021, the funds had no borrowings under the line of credit.
Commitment fees for the six months ended October 31, 2021 were as follows:
| Fund | Commitment fee |
| Multifactor Consumer Discretionary ETF | $2,349 |
| Multifactor Consumer Staples ETF | 2,307 |
| Multifactor Developed International ETF | 3,179 |
| Multifactor Emerging Markets ETF | 3,636 |
| Multifactor Energy ETF | 2,299 |
| Multifactor Financials ETF | 2,328 |
| Multifactor Healthcare ETF | 2,356 |
| Multifactor Industrials ETF | 2,353 |
| Multifactor Large Cap ETF | 3,753 |
| Multifactor Materials ETF | 2,315 |
| Multifactor Media and Communications ETF | 2,319 |
| Multifactor Mid Cap ETF | 5,912 |
| Multifactor Small Cap ETF | 3,134 |
| Multifactor Technology ETF | 2,361 |
| Multifactor Utilities ETF | 2,302 |
Expenses. Within the John Hancock group of funds complex, expenses that are directly attributable to an individual fund are allocated to such fund. Expenses that are not readily attributable to a specific fund are allocated among all funds in an equitable manner, taking into consideration, among other things, the nature and type of expense and the fund’s relative net assets. Expense estimates are accrued in the period to which they relate and adjustments are made when actual amounts are known.
Federal income taxes. Each fund intends to continue to qualify as a regulated investment company by complying with the applicable provisions of the Internal Revenue Code and will not be subject to federal income tax on taxable income that is distributed to shareholders. Therefore, no federal income tax provision is required.
For federal income tax purposes, as of April 30, 2021, certain funds have short-term and long-term capital loss carryforwards available to offset future net realized capital gains. These carryforwards do not expire. The following table details the capital loss carryforwards available as of April 30, 2021:
| | No Expiration Date |
| Fund | Short Term | Long Term |
| Multifactor Consumer Discretionary ETF | $2,109,941 | $3,053,191 |
| Multifactor Consumer Staples ETF | 950,177 | 298,552 |
| | SEMIANNUAL REPORT | JOHN HANCOCK MULTIFACTOR ETFS | 101 |
| | No Expiration Date |
| Fund | Short Term | Long Term |
| Multifactor Developed International ETF | $8,422,763 | $15,307,607 |
| Multifactor Emerging Markets ETF | 11,265,446 | 10,606,393 |
| Multifactor Energy ETF | 3,758,771 | 4,729,145 |
| Multifactor Financials ETF | 1,935,386 | 846,270 |
| Multifactor Healthcare ETF | 1,882,988 | 2,174,328 |
| Multifactor Industrials ETF | 1,316,979 | 1,740,836 |
| Multifactor Large Cap ETF | 12,297,454 | 21,075,305 |
| Multifactor Materials ETF | 1,036,832 | 997,782 |
| Multifactor Media and Communications ETF | 940,175 | 262,550 |
| Multifactor Mid Cap ETF | 45,557,354 | 15,505,463 |
| Multifactor Small Cap ETF | 34,880,742 | 26,025,952 |
| Multifactor Technology ETF | 1,762,179 | 772,726 |
| Multifactor Utilities ETF | 1,469,128 | 467,160 |
Due to certain Internal Revenue Code rules, utilization of the capital loss carryforwards may be limited in future years.
As of April 30, 2021, the funds had no uncertain tax positions that would require financial statement recognition, derecognition or disclosure. The funds’ federal tax returns are subject to examination by the Internal Revenue Service for a period of three years.
For federal income tax purposes, the costs of investments owned on October 31, 2021, including short-term investments, were as follows:
| Fund | Aggregate
cost | Unrealized
appreciation | Unrealized
(depreciation) | Net unrealized
appreciation/
(depreciation) |
| Multifactor Consumer Discretionary ETF | $22,489,042 | $5,384,497 | $(781,606) | $4,602,891 |
| Multifactor Consumer Staples ETF | 19,653,650 | 3,017,643 | (603,007) | 2,414,636 |
| Multifactor Developed International ETF | 450,171,209 | 99,053,110 | (20,026,064) | 79,027,046 |
| Multifactor Emerging Markets ETF | 596,178,119 | 166,354,684 | (51,486,943) | 114,867,741 |
| Multifactor Energy ETF | 20,859,121 | 2,012,120 | (972,155) | 1,039,965 |
| Multifactor Financials ETF | 31,878,120 | 9,683,914 | (393,370) | 9,290,544 |
| Multifactor Healthcare ETF | 42,074,572 | 10,877,015 | (778,202) | 10,098,813 |
| Multifactor Industrials ETF | 15,813,121 | 1,611,733 | (541,448) | 1,070,285 |
| Multifactor Large Cap ETF | 581,148,554 | 220,487,108 | (18,744,931) | 201,742,177 |
| Multifactor Materials ETF | 16,300,774 | 3,292,034 | (165,852) | 3,126,182 |
| Multifactor Media and Communications ETF | 17,740,912 | 3,035,340 | (950,323) | 2,085,017 |
| Multifactor Mid Cap ETF | 1,855,206,119 | 664,731,064 | (29,286,289) | 635,444,775 |
| Multifactor Small Cap ETF | 360,885,908 | 93,577,683 | (10,349,907) | 83,227,776 |
| Multifactor Technology ETF | 47,744,200 | 25,381,938 | (410,482) | 24,971,456 |
| Multifactor Utilities ETF | 17,359,226 | 841,183 | (853,029) | (11,846) |
Distribution of income and gains. Distributions to shareholders from net investment income and net realized gains, if any, are recorded on the ex-date. The funds generally declare and pay dividends at least semiannually from net investment income, if any. Capital gain distributions, if any, are typically distributed annually.
Such distributions, on a tax basis, are determined in conformity with income tax regulations, which may differ from US GAAP. Distributions in excess of tax basis earnings and profits, if any, are reported in the funds’ financial statements as a return of capital. The final determination of tax characteristics of the funds’ distribution will occur at the end of the year and will subsequently be reported to shareholders.
Capital accounts within the financial statements are adjusted for permanent book-tax differences. These adjustments have no impact on net assets or the results of operations. Temporary book-tax differences, if any, will reverse in a subsequent period. Book-tax differences are primarily attributable to wash sale loss deferrals, redemptions-in-kind and investments in passive foreign investment companies.
Note 3—Derivative instruments
The funds may invest in derivatives in order to meet their investment objective. Derivatives include a variety of different instruments that may be traded in the over-the-counter (OTC) market, on a regulated exchange or through a clearing facility. The risks in using derivatives vary depending upon the structure of the instruments, including the use of leverage, optionality, the liquidity or lack of liquidity of the contract, the creditworthiness of the counterparty or clearing organization and the volatility of the position. Some derivatives involve risks that are potentially greater than the risks associated with investing directly in the referenced securities or other referenced underlying instrument. Specifically, the funds are exposed to the risk that the counterparty to an OTC derivatives contract will be unable or unwilling to make timely settlement payments or otherwise honor its obligations. OTC derivatives transactions typically can only be closed out with the other party to the transaction.
| 102 | JOHN HANCOCK MULTIFACTOR ETFS | SEMIANNUAL REPORT | |
Certain derivatives are traded or cleared on an exchange or central clearinghouse. Exchange-traded or centrally-cleared transactions generally present less counterparty risk to a fund than OTC transactions. The exchange or clearinghouse stands between the funds and the broker to the contract and therefore, credit risk is generally limited to the failure of the exchange or clearinghouse and the clearing member.
Futures. A futures contract is a contractual agreement to buy or sell a particular currency or financial instrument at a pre-determined price in the future. Futures are traded on an exchange and cleared through a central clearinghouse. Risks related to the use of futures contracts include possible illiquidity of the futures markets and contract prices that can be highly volatile and imperfectly correlated to movements in the underlying financial instrument and potential losses in excess of the amounts recognized on the Statements of assets and liabilities. Use of long futures contracts subjects the funds to the risk of loss up to the notional value of the futures contracts. Use of short futures contracts subjects the funds to unlimited risk of loss.
Upon entering into a futures contract, the fund is required to deposit initial margin with the broker in the form of cash or securities. The amount of required margin is set by the broker and is generally based on a percentage of the contract value. The margin deposit must then be maintained at the established level over the life of the contract. Cash that has been pledged by a fund, if any, is detailed in the Statements of assets and liabilities as Collateral held at broker for futures contracts. Securities pledged by the funds, if any, are identified in the Funds’ investments. Subsequent payments, referred to as variation margin, are made or received by a fund periodically and are based on changes in the market value of open futures contracts. Futures contracts are marked-to-market daily and unrealized gain or loss is recorded by the fund. Receivable/Payable for futures variation margin is included in the Statements of assets and liabilities. When the contract is closed, a fund records a realized gain or loss equal to the difference between the value of the contract at the time it was opened and the value at the time it was closed.
The following table details how the funds used futures contracts during the six months ended October 31, 2021. In addition, the table summarizes the range of notional contract amounts held by the funds, as measured at each quarter end:
| Fund | Reason | USD Notional range |
| Multifactor Consumer Discretionary ETF | The fund used futures contracts to gain exposure to certain securities markets and manage against changes in certain securities markets. As of October 31, 2021, there were no open futures contracts. | Up to $22,000, as measured during the period |
| Multifactor Consumer Staples ETF | The fund used futures contracts to gain exposure to certain securities markets and manage against changes in certain securities markets. As of October 31, 2021, there were no open futures contracts. | Up to $23,000, as measured during the period |
| Multifactor Developed International ETF | The fund used futures contracts to gain exposure to certain securities markets and manage against changes in certain securities markets. As of October 31, 2021, there were no open futures contracts. | Up to $27.4 million, as measured during the period |
| Multifactor Emerging Markets ETF | The fund used futures contracts to gain exposure to certain securities markets and manage against changes in certain securities markets. As of October 31, 2021, there were no open futures contracts. | Up to $8.3 million, as measured during the period |
| Multifactor Energy ETF | The fund used futures contracts to gain exposure to certain securities markets and manage against changes in certain securities markets. As of October 31, 2021, there were no open futures contracts. | Up to $49,000, as measured during the period |
| Multifactor Financials ETF | The fund used futures contracts to gain exposure to certain securities markets and manage against changes in certain securities markets. As of October 31, 2021, there were no open futures contracts. | Up to $27,000, as measured during the period |
| Multifactor Healthcare ETF | The fund used futures contracts to gain exposure to certain securities markets and manage against changes in certain securities markets. As of October 31, 2021, there were no open futures contracts. | Up to $109,000, as measured during the period |
| Multifactor Industrials ETF | The fund used futures contracts to gain exposure to certain securities markets and manage against changes in certain securities markets. As of October 31, 2021, there were no open futures contracts. | Up to $126,000, as measured during the period |
| Multifactor Large Cap ETF | The fund used futures contracts to gain exposure to certain securities markets and manage against changes in certain securities markets. As of October 31, 2021, there were no open futures contracts. | Up to $679,000, as measured during the period |
| Multifactor Materials ETF | The fund used futures contracts to gain exposure to certain securities markets and manage against changes in certain securities markets. As of October 31, 2021, there were no open futures contracts. | Up to $23,000, as measured during the period |
| Multifactor Mid Cap ETF | The fund used futures contracts to gain exposure to certain securities markets and manage against changes in certain securities markets. As of October 31, 2021, there were no open futures contracts. | Up to $6.4 million, as measured during the period |
| Multifactor Small Cap ETF | The fund used futures contracts to gain exposure to certain securities markets and manage against changes in certain securities markets. As of October 31, 2021, there were no open futures contracts. | Up to $821,000, as measured during the period |
| Multifactor Technology ETF | The fund used futures contracts to gain exposure to certain securities markets and manage against changes in certain securities markets. As of October 31, 2021, there were no open futures contracts. | Up to $333,000, as measured during the period |
| | SEMIANNUAL REPORT | JOHN HANCOCK MULTIFACTOR ETFS | 103 |
| Fund | Reason | USD Notional range |
| Multifactor Utilities ETF | The fund used futures contracts to gain exposure to certain securities markets and manage against changes in certain securities markets. As of October 31, 2021, there were no open futures contracts. | Up to $23,000, as measured during the period |
Effect of derivative instruments on the Statements of operations
The table below summarizes the net realized gain (loss) included in the net increase (decrease) in net assets from operations, classified by derivative instrument and risk category, for the six months ended October 31, 2021:
| | | Statements of operations location - Net realized gain (loss) on: |
| Fund | Risk | Futures contracts |
| Multifactor Consumer Discretionary ETF | Equity | $(24) |
| Multifactor Consumer Staples ETF | Equity | $(284) |
| Multifactor Developed International ETF | Equity | $(83,972) |
| Multifactor Emerging Markets ETF | Equity | $(101,128) |
| Multifactor Energy ETF | Equity | $(337) |
| Multifactor Financials ETF | Equity | $(259) |
| Multifactor Healthcare ETF | Equity | $755 |
| Multifactor Industrials ETF | Equity | $1,028 |
| Multifactor Large Cap ETF | Equity | $(6,247) |
| Multifactor Materials ETF | Equity | $(284) |
| Multifactor Mid Cap ETF | Equity | $7,903 |
| Multifactor Small Cap ETF | Equity | $(5,485) |
| Multifactor Technology ETF | Equity | $(690) |
| Multifactor Utilities ETF | Equity | $(284) |
Note 4—Guarantees and indemnifications
Under the Trust’s organizational documents, its Officers and Trustees are indemnified against certain liabilities arising out of the performance of their duties to the Trust, including the funds. Additionally, in the normal course of business, the Trust enters into contracts with service providers that contain general indemnification clauses. The Trust’s maximum exposure under these arrangements is unknown, as this would involve future claims that may be made against the Trust that have not yet occurred. The risk of material loss from such claims is considered remote.
Note 5—Fees and transactions with affiliates
John Hancock Investment Management LLC (the Advisor) serves as investment advisor for the funds. The Advisor is an indirect principally owned subsidiary of John Hancock Life Insurance Company (U.S.A), which in turn is a subsidiary of Manulife Financial Corporation (MFC).
Management fee. The funds have an investment management agreement with the Advisor under which each fund pays a monthly management fee to the Advisor equivalent on an annual basis as detailed below. The Advisor has a subadvisory agreement with Dimensional Fund Advisors LP. The funds are not responsible for payment of the subadvisory fees.
The management fee structure is as follows:
| Fund | Average daily
net assets |
| Multifactor Consumer Discretionary ETF | 0.38% |
| Multifactor Consumer Staples ETF | 0.38% |
| Multifactor Developed International ETF | 0.35% |
| Multifactor Emerging Markets ETF | 0.44% |
| Multifactor Energy ETF | 0.38% |
| Multifactor Financials ETF | 0.38% |
| Multifactor Healthcare ETF | 0.38% |
| Multifactor Industrials ETF | 0.38% |
| Fund | Average daily
net assets |
| Multifactor Large Cap ETF | 0.26% |
| Multifactor Materials ETF | 0.38% |
| Multifactor Media and Communications ETF | 0.38% |
| Multifactor Mid Cap ETF | 0.37% |
| Multifactor Small Cap ETF | 0.39% |
| Multifactor Technology ETF | 0.38% |
| Multifactor Utilities ETF | 0.38% |
| 104 | JOHN HANCOCK MULTIFACTOR ETFS | SEMIANNUAL REPORT | |
The Advisor has contractually agreed to waive a portion of its management fee and/or reimburse expenses for certain funds of the John Hancock group of funds complex, including the funds (the participating portfolios). This waiver is based upon aggregate net assets of all the participating portfolios. The amount of the reimbursement is calculated daily and allocated among all the participating portfolios in proportion to the daily net assets of the funds. During the six months ended October 31, 2021, this waiver amounted to 0.01% of the funds’ average daily net assets, on an annualized basis. This arrangement expires on July 31, 2023, unless renewed by mutual agreement of the fund and the Advisor based upon a determination that this is appropriate under the circumstances at that time.
The Advisor has contractually agreed to reduce its management fee or, if necessary, make a payment to each fund, in an amount equal to the amount by which expenses of the fund exceed the following:
| Fund | Expense
limitation as a
percentage of
average net
assets |
| Multifactor Consumer Discretionary ETF | 0.40% |
| Multifactor Consumer Staples ETF | 0.40% |
| Multifactor Developed International ETF | 0.39% |
| Multifactor Emerging Markets ETF | 0.49% |
| Multifactor Energy ETF | 0.40% |
| Multifactor Financials ETF | 0.40% |
| Multifactor Healthcare ETF | 0.40% |
| Multifactor Industrials ETF | 0.40% |
| Fund | Expense
limitation as a
percentage of
average net
assets |
| Multifactor Large Cap ETF | 0.29% |
| Multifactor Materials ETF | 0.40% |
| Multifactor Media and Communications ETF | 0.40% |
| Multifactor Mid Cap ETF | 0.42% |
| Multifactor Small Cap ETF | 0.42% |
| Multifactor Technology ETF | 0.40% |
| Multifactor Utilities ETF | 0.40% |
Expenses means all the expenses of the funds, excluding taxes, brokerage commissions, interest expense, litigation and indemnification expenses and other extraordinary expenses not incurred in the ordinary course of the funds’ business, borrowing costs, prime brokerage fees, acquired fund fees and expenses paid indirectly, and short dividend expense. The funds’ expense limitation agreement expires on August 31, 2022, unless renewed by mutual agreement of the funds and the Advisor based upon a determination that this is appropriate under the circumstances at that time.
The expense reductions described above amount to the following for the six months ended October 31, 2021.
| Fund | Expense reimbursement |
| Multifactor Consumer Discretionary ETF | $63,117 |
| Multifactor Consumer Staples ETF | 61,935 |
| Multifactor Developed International ETF | 82,829 |
| Multifactor Emerging Markets ETF | 201,469 |
| Multifactor Energy ETF | 61,742 |
| Multifactor Financials ETF | 62,530 |
| Multifactor Healthcare ETF | 63,210 |
| Multifactor Industrials ETF | 62,881 |
| Fund | Expense reimbursement |
| Multifactor Large Cap ETF | $114,316 |
| Multifactor Materials ETF | 61,374 |
| Multifactor Media and Communications ETF | 59,151 |
| Multifactor Mid Cap ETF | 105,897 |
| Multifactor Small Cap ETF | 81,362 |
| Multifactor Technology ETF | 63,631 |
| Multifactor Utilities ETF | 61,811 |
Expenses waived or reimbursed in the current fiscal period are not subject to recapture in future fiscal periods.
The investment management fees, including the impact of the waivers and reimbursements as described above, incurred for the six months ended October 31, 2021, were equivalent to a net annual effective rate of the funds’ average daily net assets:
| Fund | Net Annual Effective Rate |
| Multifactor Consumer Discretionary ETF | 0.02% |
| Multifactor Consumer Staples ETF | 0.00% |
| Multifactor Developed International ETF | 0.32% |
| Multifactor Emerging Markets ETF | 0.38% |
| Multifactor Energy ETF | 0.00% |
| Multifactor Financials ETF | 0.06% |
| Multifactor Healthcare ETF | 0.14% |
| Multifactor Industrials ETF | 0.00% |
| Fund | Net Annual Effective Rate |
| Multifactor Large Cap ETF | 0.23% |
| Multifactor Materials ETF | 0.00% |
| Multifactor Media and Communications ETF | 0.00% |
| Multifactor Mid Cap ETF | 0.36% |
| Multifactor Small Cap ETF | 0.35% |
| Multifactor Technology ETF | 0.18% |
| Multifactor Utilities ETF | 0.00% |
Accounting and legal services. Pursuant to a service agreement, the funds reimburse the Advisor for all expenses associated with providing the administrative, financial, legal, compliance, accounting and recordkeeping services to the funds, including the preparation of all tax returns, periodic reports to shareholders and regulatory reports, among other services. These accounting and legal services fees incurred, for the six months ended October 31, 2021, amounted to an annual rate of 0.02% of the funds’ average daily net assets.
Trustee expenses. The funds compensate each Trustee who is not an employee of the Advisor or its affiliates. The costs of paying Trustee compensation and expenses are allocated to each fund based on their net assets relative to other funds within the John Hancock group of funds complex.
| | SEMIANNUAL REPORT | JOHN HANCOCK MULTIFACTOR ETFS | 105 |
Note 6—Capital share transactions
Each fund will issue and redeem shares only in a large number of specified shares, each called a “creation unit,” or multiples thereof. Multifactor Large Cap ETF, Multifactor Mid Cap ETF, and Multifactor Small Cap ETF issue and redeem shares at NAV in creation units of 25,000 shares. Multifactor Consumer Discretionary ETF, Multifactor Consumer Staples ETF, Multifactor Energy ETF, Multifactor Financials ETF, Multifactor Healthcare ETF, Multifactor Industrials ETF, Multifactor Materials ETF, Multifactor Media and Communications ETF, Multifactor Technology ETF, and Multifactor Utilities ETF issue and redeem shares at NAV in creation units of 10,000 shares. Multifactor Developed International ETF and Multifactor Emerging Markets ETF issue and redeem shares at NAV in creation units of 100,000 shares.
Only authorized participants may engage in creation or redemption transactions directly with the funds. Such transactions generally take place when an authorized participant deposits into a fund a designated portfolio of securities (including any portion of such securities for which cash may be substituted) and a specified amount of cash approximating the holdings of the fund in exchange for a specified number of creation units. Similarly, shares can be redeemed only in creation units, generally for a designated portfolio of securities (including any portion of such securities for which cash may be substituted) held by a fund and a specified amount of cash. For purposes of US GAAP, in-kind redemption transactions are treated as a sale of securities and any resulting gains and losses are recognized based on the market value of the securities on the date of the transfer. Authorized participants pay a transaction fee to the custodian when purchasing and redeeming creation units of the funds. The transaction fee is used to defray the costs associated with the issuance and redemption of creation units. Individual shares of the funds may only be purchased and sold in secondary market transactions through brokers. Secondary market transactions may be subject to brokerage commissions. Shares of the funds are listed and traded on the NYSE Arca, Inc., trade at market prices rather than NAV, and may trade at a price greater than or less than NAV.
Authorized participants transacting in creation or redemption of units for cash may also pay an additional variable charge to compensate the relevant fund for the costs associated with purchasing or selling the applicable securities. For the six months ended October 31, 2021, such variable charges were $9,334 and $31,518 for Multifactor Developed International ETF and Multifactor Emerging Markets ETF, respectively. These charges are included in shares issued or repurchased on the Statements of Changes in Net Assets.
Affiliates of the funds or the Advisor, excluding affiliated funds, owned the following percentage of shares outstanding on October 31, 2021:
| Fund | % by Fund |
| Multifactor Consumer Discretionary ETF | 23% |
| Multifactor Consumer Staples ETF | 62% |
| Multifactor Energy ETF | 43% |
| Multifactor Materials ETF | 68% |
| Multifactor Media and Communications ETF | 74% |
| Multifactor Utilities ETF | 70% |
Such concentration of shareholders’ capital could have a material effect on a fund if such shareholders redeem from the fund.
Note 7—Purchase and sale of securities
Purchases and sales of securities, other than short-term investments, are aggregated below for the six months ended October 31, 2021. In addition, purchases and sales of in-kind transactions are aggregated below for the six months ended October 31, 2021:
| | Purchases | Sales and maturities |
| Fund | In-kind transactions | Non in-kind transactions | In-kind transactions | Non in-kind transactions |
| Multifactor Consumer Discretionary ETF | $2,123,482 | $1,502,272 | $26,810,008 | $1,447,805 |
| Multifactor Consumer Staples ETF | 1,043,354 | 1,402,158 | 1,023,419 | 1,412,132 |
| Multifactor Developed International ETF | 52,149,265 | 52,261,447 | 47,513,316 | 22,875,266 |
| Multifactor Emerging Markets ETF | 2,734,143 | 62,084,333 | 14,485,457 | 41,681,688 |
| Multifactor Energy ETF | 7,353,559 | 1,345,355 | 10,073,772 | 1,250,299 |
| Multifactor Financials ETF | 3,582,855 | 1,479,733 | 2,553,514 | 1,466,474 |
| Multifactor Healthcare ETF | 7,865,583 | 20,365,529 | 11,521,401 | 20,257,830 |
| Multifactor Industrials ETF | 5,766,074 | 897,306 | 41,319,709 | 902,391 |
| Multifactor Large Cap ETF | 59,322,847 | 18,161,147 | 42,151,518 | 17,733,561 |
| Multifactor Materials ETF | 5,284,249 | 1,793,804 | 13,107,360 | 1,833,027 |
| Multifactor Media and Communications ETF | 1,943,198 | 2,255,650 | 12,538,971 | 2,419,541 |
| Multifactor Mid Cap ETF | 265,436,384 | 141,608,870 | 86,902,763 | 135,918,155 |
| Multifactor Small Cap ETF | 54,355,035 | 86,151,240 | 47,006,064 | 87,283,185 |
| Multifactor Technology ETF | 10,630,690 | 4,003,493 | 4,660,373 | 4,062,298 |
| Multifactor Utilities ETF | 1,014,046 | 1,129,903 | 999,200 | 1,079,321 |
Note 8—Industry or sector risk
Certain funds generally invest a large percentage of their assets in one or more particular industries or sectors of the economy. If a large percentage of a fund’s assets are economically tied to a single or small number of industries or sectors of the economy, the fund will be less diversified than a more broadly diversified fund, and it may cause the fund to underperform if that industry or sector underperforms. In addition, focusing on a particular industry or sector may make the fund’s NAV more volatile. Further, a fund that invests in particular industries or sectors is particularly susceptible to the impact of market, economic, regulatory and other factors affecting those industries or sectors. Financial services companies can be hurt by economic declines, changes in interest rates, and regulatory and market impacts.
| 106 | JOHN HANCOCK MULTIFACTOR ETFS | SEMIANNUAL REPORT | |
Note 9—Investment by affiliated funds
Certain investors in the funds are affiliated funds that are managed by the Advisor and its affiliates. The affiliated funds do not invest in the funds for the purpose of exercising management or control; however, this investment may represent a significant portion of the funds’ net assets. At October 31, 2021, funds within the John Hancock group of funds complex had the following affiliate ownership as a percentage of the funds’ net assets (funds with an affiliate ownership of 5% or more are disclosed separately):
| Fund | Affiliated fund | Affiliated Concentration |
| Multifactor Developed International ETF | John Hancock Variable Insurance Trust Managed Volatility Growth Portfolio | 43.21% |
| | John Hancock Variable Insurance Trust Managed Volatility Balanced Portfolio | 19.56% |
| | Other affiliated funds | 2.97% |
| | Total | 65.74% |
| Multifactor Emerging Markets ETF | John Hancock Funds II Multimanager Lifestyle Growth Portfolio | 28.25% |
| | John Hancock Variable Insurance Trust Managed Volatility Growth Portfolio | 20.52% |
| | John Hancock Funds II Multimanager Lifestyle Balanced Portfolio | 17.03% |
| | John Hancock Funds II Multimanager Lifestyle Aggressive Portfolio | 10.55% |
| | John Hancock Variable Insurance Trust Managed Volatility Balanced Portfolio | 10.11% |
| | Other affiliated funds | 5.80% |
| | Total | 92.26% |
| Multifactor Mid Cap ETF | John Hancock Variable Insurance Trust Managed Volatility Growth Portfolio | 6.83% |
| | Other affiliated funds | 4.86% |
| | Total | 11.69% |
| Multifactor Small Cap ETF | John Hancock Variable Insurance Trust Managed Volatility Growth Portfolio | 35.71% |
| | John Hancock Variable Insurance Trust Managed Volatility Balanced Portfolio | 16.95% |
| | Other affiliated funds | 4.30% |
| | Total | 56.96% |
Note 10—Investment in affiliated underlying funds
The funds may invest in affiliated underlying funds that are managed by the Advisor and its affiliates. Information regarding the funds’ fiscal year to date purchases and sales of the affiliated underlying funds as well as income and capital gains earned by the funds, if any, is as follows:
| | | | | | | | Dividends and distributions |
| Affiliate | Ending
share
amount | Beginning
value | Cost of
purchases | Proceeds
from shares
sold | Realized
gain
(loss) | Change in
unrealized
appreciation
(depreciation) | Income
distributions
received | Capital gain
distributions
received | Ending
value |
| Multifactor Consumer Discretionary ETF |
| John Hancock Collateral Trust* | 10,654 | $67,404 | $930,631 | $(891,461) | $29 | $(1) | $911 | — | $106,602 |
| Multifactor Consumer Staples ETF |
| John Hancock Collateral Trust* | 14,644 | $133,358 | $456,847 | $(443,671) | $(11) | $1 | $223 | — | $146,524 |
| Multifactor Developed International ETF |
| John Hancock Collateral Trust* | 390,317 | $9,839,807 | $27,701,215 | $(33,635,560) | $(146) | $37 | $132,891 | — | $3,905,353 |
| Multifactor Emerging Markets ETF |
| John Hancock Collateral Trust* | — | $1,165,140 | $3,430,540 | $(4,595,699) | $(10) | $29 | $45,343 | — | — |
| | SEMIANNUAL REPORT | JOHN HANCOCK MULTIFACTOR ETFS | 107 |
| | | | | | | | Dividends and distributions |
| Affiliate | Ending
share
amount | Beginning
value | Cost of
purchases | Proceeds
from shares
sold | Realized
gain
(loss) | Change in
unrealized
appreciation
(depreciation) | Income
distributions
received | Capital gain
distributions
received | Ending
value |
| Multifactor Energy ETF |
| John Hancock Collateral Trust* | — | — | $165,009 | $(165,007) | $(2) | — | $18 | — | — |
| Multifactor Financials ETF |
| John Hancock Collateral Trust* | 797 | $17,009 | $206,623 | $(215,655) | $2 | — | $227 | — | $7,979 |
| Multifactor Healthcare ETF |
| John Hancock Collateral Trust* | 669 | — | $124,177 | $(117,482) | $(2) | — | $259 | — | $6,693 |
| Multifactor Industrials ETF |
| John Hancock Collateral Trust* | — | $2,898 | $110,557 | $(113,454) | $(1) | — | $128 | — | — |
| Multifactor Large Cap ETF |
| John Hancock Collateral Trust* | 72,878 | $375,359 | $2,466,830 | $(2,113,010) | $35 | $(23) | $4,363 | — | $729,191 |
| Multifactor Materials ETF |
| John Hancock Collateral Trust* | — | — | $31,219 | $(31,219) | — | — | $166 | — | — |
| Multifactor Media and Communications ETF |
| John Hancock Collateral Trust* | — | — | $323,534 | $(323,529) | $(5) | — | $1,523 | — | — |
| Multifactor Mid Cap ETF |
| John Hancock Collateral Trust* | 596,573 | $3,521,824 | $31,420,592 | $(28,973,762) | $502 | $(81) | $28,855 | — | $5,969,075 |
| Multifactor Small Cap ETF |
| John Hancock Collateral Trust* | 27,217 | $920,269 | $7,275,845 | $(7,923,700) | $(89) | $(1) | $2,525 | — | $272,324 |
| Multifactor Technology ETF |
| John Hancock Collateral Trust* | 14,260 | $60,831 | $602,676 | $(520,823) | $6 | $(8) | $1,258 | — | $142,682 |
| * | Refer to the Securities lending note within Note 2 for details regarding this investment. |
Note 11—Coronavirus (COVID-19) pandemic
The novel COVID-19 disease has resulted in significant disruptions to global business activity. A widespread health crisis such as a global pandemic could cause substantial market volatility, exchange trading suspensions and closures, which may lead to less liquidity in certain instruments, industries, sectors or the markets generally, and may ultimately affect fund performance.
| 108 | JOHN HANCOCK MULTIFACTOR ETFS | SEMIANNUAL REPORT | |
EVALUATION OF ADVISORY AND SUBADVISORY AGREEMENTS BY THE BOARD OF TRUSTEES
This section describes the evaluation by the Board of Trustees (the Board) of John Hancock Exchange-Traded Fund Trust (the Trust) of the Advisory Agreement (the Advisory Agreement) with John Hancock Investment Management LLC (the Advisor) and the Subadvisory Agreement (the Subadvisory Agreement) with Dimensional Fund Advisors LP (the Subadvisor) with respect to each of the portfolios of the Trust included in this report (the Funds). The Advisory Agreement and Subadvisory Agreement are collectively referred to as the Agreements. Prior to the June 22-24, 2021 videoconference1 meeting at which the Agreements were approved, the Board also discussed and considered information regarding the proposed continuation of the Agreements at a videoconference meeting held on May 25-26, 2021. The Trustees who are not “interested persons” of the Trust as defined by the Investment Company Act of 1940, as amended (the “1940 Act”) (the “Independent Trustees”) also met separately to evaluate and discuss the information presented, including with counsel to the Independent Trustees and a third-party consulting firm.
Approval of Advisory and Subadvisory Agreements
At a videoconference meeting held on June 22-24, 2021, the Board, including the Trustees who are not parties to any Agreement or considered to be interested persons of the Trust under the 1940 Act, reapproved for an annual period the continuation of the Advisory Agreement between the Trust and the Advisor and the Subadvisory Agreement between the Advisor and the Subadvisor with respect to each of the Funds identified in Appendix A.
In considering the Advisory Agreement and the Subadvisory Agreement with respect to each Fund, the Board received in advance of the meetings a variety of materials relating to each Fund, the Advisor and the Subadvisor, including comparative performance, fee and expense information for peer groups of similar funds prepared by an independent third-party provider of fund data; performance information for the Funds’ benchmark indices; and, with respect to the Subadvisor, comparative performance information for comparably managed accounts, as applicable; and other information provided by the Advisor and the Subadvisor regarding the nature, extent and quality of services provided by the Advisor and the Subadvisor under their respective Agreements, as well as information regarding the Advisor’s revenues and costs of providing services to the Funds and any compensation paid to affiliates of the Advisor. At the meetings at which the renewal of the Advisory Agreement and Subadvisory Agreement are considered, particular focus is given to information concerning Fund performance, comparability of fees and total expenses, and profitability. However, the Board noted that the evaluation process with respect to the Advisor and the Subadvisor is an ongoing one. In this regard, the Board also took into account discussions with management and information provided to the Board (including its various committees) at prior meetings with respect to the services provided by the Advisor and the Subadvisor to the Funds, including quarterly performance reports prepared by management containing reviews of investment results and prior presentations from the Subadvisor with respect to the Funds they manage. The information received and considered by the Board in connection with the May and June meetings and throughout the year was both written and oral. The Board also considered the nature, quality, and extent of the non-advisory services, if any, to be provided to the Funds by the Advisor and/or its affiliates, including administrative services. The Board considered the Advisory Agreement and the Subadvisory Agreement separately in the course of its review. In doing so, the Board noted the respective roles of the Advisor and Subadvisor in providing services to the Funds. In addition, although the Board approved the renewal of the Agreements for all the Funds at the June meeting, the Board considered each Fund separately.
Throughout the process, the Board asked questions of and requested additional information from management. The Board is assisted by counsel for the Trust and the Independent Trustees are also separately assisted by independent legal counsel throughout the process. The Independent Trustees also received a memorandum from their independent legal counsel discussing the legal standards for their consideration of the proposed continuation of the Agreements and discussed the proposed continuation of the Agreements in private sessions with their independent legal counsel at which no representatives of management were present.
Approval of Advisory Agreement
In approving the Advisory Agreement with respect to each Fund, the Board, including the Independent Trustees, considered a variety of factors, including those discussed below. The Board also considered other factors (including conditions and trends prevailing generally in the economy, the securities markets and the industry) and did not treat any single factor as determinative, and each Trustee may have attributed different weights to different factors. The Board’s conclusions may be based in part on its consideration of the advisory and subadvisory arrangements in prior years and on the Board’s ongoing regular review of Fund performance and operations throughout the year.
Nature, extent and quality of services. Among the information received by the Board from the Advisor relating to the nature, extent, and quality of services provided to the Funds, the Board reviewed information provided by the Advisor relating to its operations and personnel, descriptions of its organizational and management structure, and information regarding the Advisor’s compliance and regulatory history, including its Form ADV. The Board also noted that on a regular basis it receives and reviews information from the Trust’s Chief Compliance Officer (CCO) regarding the Funds’ compliance policies and procedures established pursuant to Rule 38a-1 under the 1940 Act. The Board observed that the scope of services provided by the Advisor, and of the undertakings required of the Advisor in connection with those services, including maintaining and monitoring its own and the fund’s compliance programs, risk management programs, liquidity management programs and cybersecurity programs, had expanded over time as a result of regulatory, market and other developments. The Board considered that the Advisor is responsible for the management of the day-to-day operations of the Funds, including, but not limited to, general supervision of and coordination of the services provided by the Subadvisor, and is also responsible for monitoring and reviewing the activities of the Subadvisor and other third-party service providers, including the Funds’ distributor. The Board also considered the significant risks assumed by the Advisor in connection with the services provided to the Funds including entrepreneurial risk in sponsoring new Funds and ongoing risks including investment, operational, enterprise, litigation, regulatory and compliance risks with respect to all Funds.
1On June 19, 2020, as a result of health and safety measures put in place to combat the global COVID-19 pandemic, the Securities and Exchange Commission issued an exemptive order (the “Order”) pursuant to Sections 6(c) and 38(a) of the Investment Company Act of 1940, as amended (the “1940 Act”), that temporarily exempts registered investment management companies from the in-person voting requirements under the 1940 Act, subject to certain requirements, including that votes taken pursuant to the Order are ratified at the next in-person meeting. The Board determined that reliance on the Order was necessary or appropriate due to the circumstances related to current or potential effects of COVID-19 and therefore, the Board’s May and June meetings were held via videoconference in reliance on the Order. This exemptive order supersedes, in part, a similar, earlier exemptive order issued by the SEC.
| | SEMIANNUAL REPORT | JOHN HANCOCK MULTIFACTOR ETFS | 109 |
In considering the nature, extent, and quality of the services provided by the Advisor, the Trustees also took into account their knowledge of the Advisor’s management and the quality of the performance of the Advisor’s duties, through Board meetings, discussions and reports during the preceding year and through each Trustee’s experience as a Trustee of the Trust and of the other trusts in the John Hancock group of funds complex (the John Hancock Fund Complex).
In the course of their deliberations regarding the Advisory Agreement, the Board considered, among other things:
(a)the skills and competency with which the Advisor has in the past managed the Trust’s affairs and its subadvisory relationships, the Advisor’s oversight and monitoring of the Subadvisor’s investment performance and compliance programs, such as the Subadvisor’s compliance with fund policies and objectives, review of brokerage matters, including with respect to trade allocation and best execution, and the Advisor’s timeliness in responding to performance issues;
(b)the background, qualifications and skills of the Advisor’s personnel;
(c)the Advisor’s compliance policies and procedures and its responsiveness to regulatory changes and fund industry developments;
(d)the Advisor’s administrative capabilities, including its ability to supervise the other service providers for the Funds, as well as the Advisor’s oversight of any securities lending activity, its monitoring of class action litigation and collection of class action settlements on behalf of the Funds, and bringing loss recovery actions on behalf of the Funds;
(e)the financial condition of the Advisor and whether it has the financial wherewithal to provide a high level and quality of services to the Funds;
(f)the Advisor’s initiatives intended to improve various aspects of the Trust’s operations and investor experience with the Funds; and
(g)the Advisor’s reputation and experience in serving as an investment adviser to the Trust and the benefit to shareholders of investing in funds that are part of a family of funds offering a variety of investments.
The Board concluded that the Advisor may reasonably be expected to continue to provide a high quality of services under the Advisory Agreement with respect to the Funds.
Investment performance. In considering each Fund’s performance, the Board noted that it reviews at its regularly scheduled meetings information about the Funds’ performance results. In connection with the consideration of the Advisory Agreement, the Board:
(a)reviewed information prepared by management regarding the Funds’ performance;
(b)considered the comparative performance of each Fund’s respective benchmark index;
(c)considered the performance of comparable funds, if any, as included in the report prepared by an independent third-party provider of fund data; and
(d)took into account the Advisor’s analysis of each Fund’s performance and its plans and recommendations regarding the Trust’s subadvisory arrangements generally and with respect to particular Funds.
The Board noted that while it found the data provided by the independent third-party generally useful it recognized its limitations, including in particular that the data may vary depending on the end date selected and the results of the performance comparisons may vary depending on the selection of the peer group. The Board reviewed Fund performance against each Fund’s respective benchmark and concluded that the performance of certain Funds has generally been in line with or generally outperformed the historical performance of comparable funds based on the median percentile and/or each Fund’s respective benchmark with certain exceptions noted in Appendix A. In such cases, the Board concluded that such performance is being monitored and reasonably addressed, where appropriate.
Fees and expenses. The Board reviewed comparative information prepared by an independent third-party provider of fund data, including, among other data, each Fund’s contractual and net management fees (and subadvisory fees, to the extent available) and total expenses as compared to similarly situated investment companies deemed to be comparable to the Fund in light of the nature, extent and quality of the management and advisory and subadvisory services provided by the Advisor and the Subadvisor. The Board considered each Fund’s ranking within a smaller group of peer funds chosen by the independent third-party provider, as well as the Fund’s ranking within broader groups of funds. In comparing each Fund’s contractual and net management fees to that of comparable funds, the Board noted that such fees include both advisory and administrative costs.
The Board took into account management’s discussion of the Funds’ expenses, including previous actions taken to reduce management fees for certain of the Funds. The Board also took into account management’s discussion with respect to the overall management fee and the fees of the Subadvisor, including the amount of the advisory fee retained by the Advisor after payment of the subadvisory fee, in each case in light of the services rendered for those amounts and the risks undertaken by the Advisor. The Board also noted that the Advisor pays the subadvisory fees of the Funds, and that such fees are negotiated at arm’s length with respect to the Subadvisor. The Board also took into account that management had agreed to implement an overall fee waiver across the complex, including each of the Funds, which is discussed further below. The Board also noted management’s discussion of the Funds’ expenses, as well as any actions taken over the past several years to reduce the Funds’ operating expenses. The Board also noted that, in addition, the Advisor is currently waiving fees and/or reimbursing expenses with respect to each Fund. The Board also took into account that management has approved the implementation of breakpoints in each Fund’s subadvisory fee schedule. The Board reviewed information provided by the Advisor concerning the investment advisory fees charged by the Advisor or one of its advisory affiliates to other clients (including other funds in the John Hancock Fund Complex) having similar investment mandates, if any. The Board considered any differences between the Advisor’s and Subadvisor’s services to a Fund and the services they provide to other comparable clients or funds. The Board concluded that the advisory fee paid with respect to each of the Funds is reasonable in light of the nature, extent and quality of the services provided to the Funds under the Advisory Agreement.
| 110 | JOHN HANCOCK MULTIFACTOR ETFS | SEMIANNUAL REPORT | |
Profitability/Fall out benefits. In considering the costs of the services to be provided and the profits to be realized by the Advisor and its affiliates from the Advisor’s relationship with the Trust, the Board:
(a)reviewed financial information of the Advisor;
(b)reviewed and considered information presented by the Advisor regarding the net profitability to the Advisor and its affiliates, of each Fund;
(c)received and reviewed profitability information with respect to the John Hancock Fund Complex as a whole and with respect to each Fund;
(d)received information with respect to the Advisor’s allocation methodologies used in preparing the profitability data and considered that the Advisor hired an independent third-party consultant to provide an analysis of the Advisor’s allocation methodologies;
(e)considered that the John Hancock insurance companies that are affiliates of the Advisor, as shareholders of the Trust directly or through their separate accounts, receive certain tax credits or deductions relating to foreign taxes paid and dividends received by certain Funds of the Trust and noted that these tax benefits, which are not available to participants in qualified retirement plans under applicable income tax law, are reflected in the profitability analysis reviewed by the Board;
(f)considered that the Advisor also provides administrative services to the Funds on a cost basis pursuant to an administrative services agreement;
(g)noted that the Advisor also derives reputational and other indirect benefits from providing advisory services to the Funds;
(h)noted that the subadvisory fee for the Funds are paid by the Advisor and are negotiated at arm’s length;
(i)noted that the Advisor also pays the Subadvisor a license fee in connection with each Fund’s use of its Underlying Index;
(j)considered the Advisor’s ongoing costs and expenditures necessary to improve services, meet new regulatory and compliance requirements, and adapt to other challenges impacting the fund industry; and
(k)considered that the Advisor should be entitled to earn a reasonable level of profits in exchange for the level of services it provides to each Fund and the risks that it assumes as Advisor, including entrepreneurial, operational, reputational, litigation and regulatory risk.
Based upon its review, the Board concluded that the level of profitability, if any, of the Advisor and its affiliates from their relationship with each Fund was reasonable and not excessive.
Economies of scale. In considering the extent to which a Fund may realize any economies of scale and whether fee levels reflect these economies of scale for the benefit of Fund shareholders, the Board:
(a)considered that the Advisor has contractually agreed to waive a portion of its management fee for certain funds of the John Hancock Fund Complex, including the Funds (the participating portfolios) or otherwise reimburse the expenses of the participating portfolios (the reimbursement). This waiver is based upon aggregate net assets of all the participating portfolios. The amount of the reimbursement is calculated daily and allocated among all the participating portfolios in proportion to the daily net assets of each Fund;
(b)the Board also took into account management’s discussion of each Fund’s advisory fee structure; and
(c)considered the effect of the Funds’ growth in size on their performance and fees. The Board also noted that if the Funds’ assets increase over time, the Funds may realize other economies of scale.
Approval of Subadvisory Agreement
In making its determination with respect to approval of the Subadvisory Agreement, the Board reviewed:
(1)information relating to the Subadvisor’s business, including current subadvisory services to the Trust (and other funds in the John Hancock Fund Complex);
(2)the historical and current performance of each Fund and comparative performance information relating to the Fund’s benchmark and comparable funds;
(3)the subadvisory fee for each Fund, including the approved breakpoints for each of the Funds and to the extent available, comparable fee information prepared by an independent third-party provider of fund data; and
(4)information relating to the nature and scope of any material relationships and their significance to the Trust’s Advisor and Subadvisor.
Nature, extent, and quality of services. With respect to the services provided by the Subadvisor with respect to each Fund, the Board received information provided to the Board by the Subadvisor, including the Subadvisor’s Form ADV, as well as took into account information presented throughout the past year. The Board considered the Subadvisor’s current level of staffing and its overall resources, as well as received information relating to the Subadvisor’s compensation program. The Board reviewed the Subadvisor’s history and investment experience, as well as information regarding the qualifications, background, and responsibilities of the Subadvisor’s investment and compliance personnel who provide services to the Funds. The Board also considered, among other things, the Subadvisor’s compliance program and any disciplinary history. The Board also considered the Subadvisor’s risk assessment and monitoring process. The Board reviewed the Subadvisor’s regulatory history, including whether it was involved in any regulatory actions or investigations as well as material litigation, and any settlements and amelioratory actions undertaken, as appropriate. The Board noted that the Advisor conducts regular, periodic reviews of the Subadvisor and its operations, including regarding investment processes and organizational and staffing matters. The Board also noted that the Trust’s CCO and his staff conduct regular, periodic compliance reviews with the Subadvisor and present reports to the Independent Trustees regarding the same, which includes evaluating the regulatory compliance systems of the Subadvisor and procedures reasonably designed to assure compliance with the federal securities laws. The Board also took into account the financial condition of the Subadvisor.
| | SEMIANNUAL REPORT | JOHN HANCOCK MULTIFACTOR ETFS | 111 |
The Board considered the Subadvisor’s investment process and philosophy. The Board took into account that the Subadvisor’s responsibilities include the development and maintenance of an investment program for each Fund that is consistent with the Fund’s investment objective, the selection of investment securities and the placement of orders for the purchase and sale of such securities, as well as the implementation of compliance controls related to performance of these services. The Board also received information with respect to the Subadvisor’s brokerage policies and practices, including with respect to best execution and soft dollars.
Subadvisor compensation. In considering the cost of services to be provided by the Subadvisor and the profitability to the Subadvisor of its relationship with each Fund, the Board noted that the fees under the Subadvisory Agreement are paid by the Advisor and not the Funds.
The Board also relied on the ability of the Advisor to negotiate the Subadvisory Agreement with the Subadvisor, which is not affiliated with the Advisor, and the fees thereunder at arm’s length. As a result, the costs of the services to be provided and the profits to be realized by the Subadvisor from its relationship with the Trust were not a material factor in the Board’s consideration of the Subadvisory Agreement.
The Board also received information regarding the nature and scope (including their significance to the Advisor and its affiliates and to the Subadvisor) of any material relationships with respect to the Subadvisor, which include arrangements in which the Subadvisor or its affiliates provide advisory, distribution, or management services in connection with financial products sponsored by the Advisor or its affiliates, and may include other registered investment companies, a 529 education savings plan, managed separate accounts and exempt group annuity contracts sold to qualified plans. The Board also received information and took into account any other potential conflicts of interest the Advisor might have in connection with the Subadvisory Agreement.
In addition, the Board considered other potential indirect benefits that the Subadvisor and its affiliates may receive from the Subadvisor’s relationship with the Funds, such as the opportunity to provide advisory services to additional funds in the John Hancock Fund Complex and reputational benefits.
Subadvisory fees. The Board considered that the Fund pays an advisory fee to the Advisor and that, in turn, the Advisor pays subadvisory fees to the Subadvisor. As noted above, the Board also considered each Fund’s subadvisory fees as compared to similarly situated investment companies deemed to be comparable to the Funds as included in the report prepared by the independent third-party provider of fund data, to the extent available. The Board noted that the limited size of the Lipper peer groups were not sufficient for comparative purposes. The Board also took into account the subadvisory fees paid by the Advisor to the Subadvisor with respect to the Funds to fees charged by each Fund’s Subadvisor to manage other subadvised portfolios and portfolios not subject to regulation under the 1940 Act, as applicable.
Subadvisor performance. As noted above, the Board considered each Fund’s performance as compared to the Fund’s respective peer group median and the benchmark index and noted that the Board reviews information about the Fund’s performance results at its regularly scheduled meetings. The Board noted the Advisor’s expertise and resources in monitoring the performance, investment style, and risk-adjusted performance of the Subadvisor. The Board was mindful of the Advisor’s focus on the Subadvisor’s performance. The Board also noted the Subadvisor’s long-term performance record for similar accounts, as applicable.
The Board’s decision to approve the Subadvisory Agreement with respect to each Fund was based on a number of determinations, including the following:
(1)the Subadvisor has extensive experience and demonstrated skills as a manager;
(2)although not without variation, the performance of certain Funds have generally been in line with or generally outperformed the historical performance of comparable funds, based on the median percentile, and/or each Fund’s respective benchmark, with certain exceptions noted in Appendix A (with respect to such exceptions, the Board concluded that the Fund’s performance is being monitored and reasonably addressed, where appropriate);
(3)the subadvisory fees are reasonable in relation to the level and quality of services being provided under the Subadvisory Agreement; and
(4)that the subadvisory fees are paid by the Advisor and not the Funds and the Board has approved the implementation of breakpoints to each of the Fund’s subadvisory fee schedule.
Additional information relating to each Fund’s fees and expenses and performance that the Board considered in approving the Advisory Agreement and Subadvisory Agreement for a particular Fund is set forth in Appendix A.
***
Based on the Board’s evaluation of all factors that the Board deemed to be material, including those factors described above, and assisted by the advice of independent legal counsel, the Board, including the Independent Trustees, concluded that renewal of the Advisory Agreement and the Subadvisory Agreement with respect to each Fund would be in the best interest of each of the respective Funds and its shareholders. Accordingly, the Board, and the Independent Trustees voting separately, approved the Advisory Agreement and Subadvisory Agreement with respect to each Fund for an additional one-year period.
| 112 | JOHN HANCOCK MULTIFACTOR ETFS | SEMIANNUAL REPORT | |
APPENDIX A
| Portfolio (subadvisor) | Performance of fund,
as of 12.31.2020 | Fees and expenses | Comments |
| Multifactor Consumer Discretionary ETF(Dimensional Fund Advisors LP) | Benchmark Index – The fund underperformed for the one-, three- and five-year periods and for the period since September 30, 2015.Morningstar Category – The fund outperformed the peer group median for the three- and five-year periods and for the period since September 30, 2015 and underperformed for the one-year period. | Subadvisor fee comparative data not provided due to limited size of Lipper peer group for this purpose.Net management fees for this fund are lower than the peer group median.Net total expenses for this fund are lower than the peer group median. | The Board took into account management’s discussion of the fund’s performance, including the favorable performance relative to the peer group median for the three- and five-year periods and for the period since September 30, 2015.The Board took into account management’s discussion of the factors that contributed to the fund’s performance relative to the benchmark index for the one-, three- and five-year periods and for the period since September 30, 2015 and relative to the peer group median for the one-year period, including the impact of past and current market conditions on the fund’s strategy and management’s outlook for the fund. |
| Multifactor Consumer Staples ETF(Dimensional Fund Advisors LP) | Benchmark Index – The fund outperformed for the one- and three-year periods and for the period since March 31, 2016.Morningstar Category – The fund outperformed the peer group median for the three-year period, performed in-line with the peer group median for the one-year period and underperformed for the period since March 31, 2016. | Subadvisor fee comparative data not provided due to limited size of Lipper peer group for this purpose.Net management fees for this fund are lower than the peer group median.Net total expenses for this fund are lower than the peer group median. | The Board took into account management’s discussion of the fund’s performance, including the favorable performance relative to the benchmark index for the one- and three-year periods and for the period since March 31, 2016 and to the peer group median for the three-year period. |
| Multifactor Developed International ETF(Dimensional Fund Advisors LP) | Benchmark Index – The fund underperformed for the one- and three-year periods and for the period since December 31, 2016.Morningstar Category – The fund underperformed the peer group median for the one- and three-year periods and for the period since December 31, 2016. | Subadvisor fee comparative data not provided due to limited size of Lipper peer group for this purpose.Net management fees for this fund are higher than the peer group median.Net total expenses for this fund are higher than the peer group median. | The Board took into account management’s discussion of the factors that contributed to the Fund’s performance relative to the benchmark index and peer group median for the one- and three-year periods and the period since December 31, 2016, including the impact of past and current market conditions on the fund’s strategy and management’s plans for the fund.The Board took into account management’s discussion of the fund’s expenses. |
| | SEMIANNUAL REPORT | JOHN HANCOCK MULTIFACTOR ETFS | 113 |
| Portfolio (subadvisor) | Performance of fund,
as of 12.31.2020 | Fees and expenses | Comments |
| Multifactor Emerging Markets ETF(Dimensional Fund Advisors LP) | Benchmark Index - The fund underperformed, for the one-year period and for the period since September 30, 2018.Morningstar Category - The fund outperformed the peer group median for the one-year period and for the period since September 30, 2018. | Subadvisor fee comparative data not provided due to limited size of Lipper peer group for this purpose.Net management fees for this fund are higher than the peer group median.Net total expenses for this fund are higher than the peer group median. | The Board took into account management’s discussion of the fund’s performance, including the favorable performance relative to the peer group median for the one-year period and for the period since September 30, 2018.The Board took into account management’s discussion of the fund’s expenses. |
| Multifactor Energy ETF(Dimensional Fund Advisors LP) | Benchmark Index – The fund underperformed for the one-and three periods and for the period since March 31, 2016.Morningstar Category – The fund outperformed the peer group median for the period since March 31, 2016 and underperformed for the one- and three- year periods. | Subadvisor fee comparative data not provided due to limited size of Lipper peer group for this purpose.Net management fees for this fund are lower than the peer group median.Net total expenses for this fund are lower than the peer group median. | The Board took into account management’s discussion of the fund’s performance, including the favorable performance relative to the peer group median for the period since March 31, 2016.The Board took into account management’s discussion of the factors that contributed to the fund’s performance relative to the benchmark index for the one- and three-year periods and for the period since March 31, 2016 and relative to the peer group median for the one- and three-year periods, including the impact of past and current market conditions on the fund’s strategy and management’s outlook for the fund. |
| Multifactor Financials ETF(Dimensional Fund Advisors LP) | Benchmark Index – The fund underperformed for the one-, three- and five year periods and for the period since September 30, 2015.Morningstar Category – The fund outperformed the peer group median for the one-, three- and five year periods and for the period since September 30, 2015. | Subadvisor fee comparative data not provided due to limited size of Lipper peer group for this purpose.Net management fees for this fund are lower than the peer group median.Net total expenses for this fund are lower than the peer group median. | The Board took into account management’s discussion of the fund’s performance, including the favorable performance relative to the peer group median for the one-, three- and five-year periods and for the period since September 30, 2015. |
| 114 | JOHN HANCOCK MULTIFACTOR ETFS | SEMIANNUAL REPORT | |
| Portfolio (subadvisor) | Performance of fund,
as of 12.31.2020 | Fees and expenses | Comments |
| Multifactor Healthcare ETF(Dimensional Fund Advisors LP) | Benchmark Index – The fund outperformed for the one-year period and underperformed for the three- and five-year periods and for the period since September 30, 2015.Morningstar Category – The fund outperformed the peer group median for the five-year period, underperformed the peer group median for the one- and three-year periods and performed in-line with the peer group median for the period since September 30, 2015. | Subadvisor fee comparative data not provided due to limited size of Lipper peer group for this purpose.Net management fees for this fund are lower than the peer group median.Net total expenses for this fund are lower than the peer group median. | The Board took into account management’s discussion of the fund’s performance, including the favorable performance relative to the benchmark index for the one-year period and the peer group median for the five-year period.The Board took into account management’s discussion of the factors that contributed to the fund’s performance relative to the benchmark index for the three- and five-year periods and for the period since September 30, 2015 and relative to the peer group median for the one- and three-year periods, including the impact of past and current market conditions on the fund’s strategy and management’s outlook for the fund. |
| Multifactor Industrials ETF(Dimensional Fund Advisors LP) | Benchmark Index – The fund outperformed for the one- and three-year periods and for the period since March 31, 2016.Morningstar Category – The fund outperformed the peer group median for the three-year period and for the period since March 31, 2016 and performed in-line with the peer group median the one-year period. | Subadvisor fee comparative data not provided due to limited size of Lipper peer group for this purpose.Net management fees for this fund are lower than the peer group median.Net total expenses for this fund are lower than the peer group median. | The Board took into account management’s discussion of the fund’s performance, including the favorable performance relative to the benchmark index for the one- and three-year periods and for the period since March 31, 2016 and peer group median for the three-year period and for the period since March 31, 2016. |
| Multifactor Large Cap ETF(Dimensional Fund Advisors LP) | Benchmark Index – The fund underperformed for the one-, three- and five-year periods and for the period since September 30, 2015.Morningstar Category – The fund underperformed the peer group median for the one-, three- and five-year periods and for the period since September 30, 2015. | Subadvisor fee comparative data not provided due to limited size of Lipper peer group for this purpose.Net management fees for this fund are higher than the peer group median.Net total expenses for this fund are higher than the peer group median. | The Board took into account management’s discussion of the factors that contributed to the Fund’s performance relative to the benchmark index and peer group median for the one-, three- and five-year periods and for the period since September 30, 2015, including the impact of past and current market conditions on the Fund’s strategy and management’s plans for the Fund.The Board took into account management’s discussion of the fund’s expenses. |
| | SEMIANNUAL REPORT | JOHN HANCOCK MULTIFACTOR ETFS | 115 |
| Portfolio (subadvisor) | Performance of fund,
as of 12.31.2020 | Fees and expenses | Comments |
| Multifactor Materials ETF(Dimensional Fund Advisors LP) | Benchmark Index – The fund underperformed for the one- and three-year periods and for the period since March 31, 2016.Morningstar Category – The fund outperformed the peer group median for the three-year period and underperformed for the one-year period and for the period since March 31, 2016. | Subadvisor fee comparative data not provided due to limited size of Lipper peer group for this purpose.Net management fees for this fund are lower than the peer group median.Net total expenses for this fund are lower than the peer group median. | The Board took into account management’s discussion of the fund’s performance, including the favorable performance relative to the peer group median for the three-year period.The Board took into account management’s discussion of the factors that contributed to the fund’s performance relative to the benchmark index for the one- and three-year periods and for the period since March 31, 2016 and relative to the peer group median for the one-year period and for the period since March 31, 2016, including the impact of past and current market conditions on the fund’s strategy and management’s outlook for the fund. |
| Multifactor Media and Communications ETF(Dimensional Fund Advisors LP) | Benchmark Index - The fund outperformed for the one-year period and for the period since March 31, 2019.Morningstar Category - The fund outperformed the peer group median for the one-year period and for the period since March 31, 2019. | Subadvisor fee comparative data not provided due to limited size of Lipper peer group for this purpose.Net management fees for this fund are lower than the peer group median.Net total expenses for this fund are equal to the peer group median. | The Board took into account management’s discussion of the fund’s performance, including the favorable performance relative to the benchmark index and peer group median for the one-year period and for the period since March 31, 2019. |
| Multifactor Mid Cap ETF(Dimensional Fund Advisors LP) | Benchmark Index – The fund underperformed for the one-, three- and five-year periods and for the period since September 30, 2015.Morningstar Category – The fund outperformed the peer group median for the one-, three- and five-year periods and for the period since September 30, 2015. | Subadvisor fee comparative data not provided due to limited size of Lipper peer group for this purpose.Net management fees for this fund are higher than the peer group median.Net total expenses for this fund are equal to the peer group median. | The Board took into account management’s discussion of the fund’s performance, including the favorable performance relative the peer group median for the one-, three- and five-year periods and for the period since September 30, 2015.The Board took into account management’s discussion of the factors that contributed to the fund’s performance relative to the benchmark index for the one-, three- and five-year periods and for the period since September 30, 2015, including the impact of past and current market conditions on the fund’s strategy and management’s outlook for the fund.The Board took into account management’s discussion of the fund’s expenses. |
| 116 | JOHN HANCOCK MULTIFACTOR ETFS | SEMIANNUAL REPORT | |
| Portfolio (subadvisor) | Performance of fund,
as of 12.31.2020 | Fees and expenses | Comments |
| Multifactor Small Cap ETF(Dimensional Fund Advisors LP) | Benchmark Index – The fund underperformed for the one- and three-year periods and for the period since November 30, 2017.Morningstar Category – The fund outperformed the peer group median for the one-year period and for the period since November 30, 2017 and underperformed for the three-year period. | Subadvisor fee comparative data not provided due to limited size of Lipper peer group for this purpose.Net management fees for this fund are higher than the peer group median.Net total expenses for this fund are higher than the peer group median. | The Board took into account management’s discussion of the fund’s performance, including the favorable performance relative to the peer group median for the one-year period and for the period since November 30, 2017.The Board took into account management’s discussion of the factors that contributed to the fund’s performance relative to the benchmark index for the one- and three-year periods and for the period since November 30, 2017 and relative to the peer group median for the three-year period, including the impact of past and current market conditions on the fund’s strategy and management’s outlook for the fund.The Board took into account management’s discussion of the fund’s expenses. |
| Multifactor Technology ETF(Dimensional Fund Advisors LP) | Benchmark Index – The fund underperformed for the one-, three- and five-year periods and for the period since September 30, 2015.Morningstar Category – The fund underperformed the peer group median for the one-, three- and five-year periods and for the period since September 30, 2015. | Subadvisor fee comparative data not provided due to limited size of Lipper peer group for this purpose.Net management fees for this fund are lower than the peer group median.Net total expenses for this fund are lower than the peer group median. | The Board took into account management’s discussion of the factors that contributed to the Fund’s performance relative to the benchmark index and peer group median for the one-, three- and five-year periods and the period since September 30, 2015, including the impact of past and current market conditions on the Fund’s strategy and management’s outlook for the Fund. |
| Multifactor Utilities ETF(Dimensional Fund Advisors LP) | Benchmark Index – The fund underperformed for the one- and three-year periods and for the period since March 31, 2016.Morningstar Category – The fund underperformed the peer group median for the one- and three-year periods and for the period since March 31, 2016. | Subadvisor fee comparative data not provided due to limited size of Lipper peer group for this purpose.Net management fees for this fund are lower than the peer group median.Net total expenses for this fund are lower than the peer group median. | The Board took into account management’s discussion of the factors that contributed to the fund’s performance relative to the benchmark index and peer group median for the one-and three-year periods and for the period since March 31, 2016, including the impact of past and current market conditions on the fund’s strategy and management’s outlook for the fund. |
| | SEMIANNUAL REPORT | JOHN HANCOCK MULTIFACTOR ETFS | 117 |
Trustees
Hassell H. McClellan, Chairperson
Steven R. Pruchansky, Vice Chairperson
Andrew G. Arnott†
Charles L. Bardelis*
James R. Boyle
Peter S. Burgess*
William H. Cunningham
Grace K. Fey
Marianne Harrison†
Deborah C. Jackson
Frances G. Rathke*
Gregory A. Russo
Officers
Andrew G. Arnott
President
Charles A. Rizzo
Chief Financial Officer
Salvatore Schiavone
Treasurer
Christopher (Kit) Sechler
Secretary and Chief Legal Officer
Trevor Swanberg
Chief Compliance Officer
* Member of the Audit Committee
† Non-Independent Trustee
Investment advisor
John Hancock Investment Management LLC
Subadvisor
Dimensional Fund Advisors LP
Portfolio Managers
Joseph F. Hohn
Joel P. Schneider
Andres Torres
Principal distributor
Foreside Fund Services, LLC
Custodian
State Street Bank and Trust Company
Transfer agent
State Street Bank and Trust Company
Legal counsel
Dechert LLP
The funds’ proxy voting policies and procedures, as well as the funds’ proxy voting record for the most recent twelve-month period ended June 30, are available free of charge on the Securities and Exchange Commission (SEC) website at sec.gov or on our website.
All of the funds’ holdings as of the end of the third month of every fiscal quarter are filed with the SEC on Form N-PORT within 60 days of the end of the fiscal quarter. The funds’ Form N-PORT filings are available on our website and the SEC’s website, sec.gov.
We make this information on your funds’, as well as monthly portfolio holdings, and other funds’ details available on our website at jhinvestments.com/etf or by calling 800-225-6020.
| You can also contact us: | |
| 800-225-6020 | Regular mail: |
| jhinvestments.com/etf | John Hancock Investment Management
200 Berkeley Street
Boston, MA 02116 |
| 118 | JOHN HANCOCK MULTIFACTOR ETFS | SEMIANNUAL REPORT | |
John Hancock family of funds
U.S. EQUITY FUNDS
Blue Chip Growth
Classic Value
Disciplined Value
Disciplined Value Mid Cap
Equity Income
Financial Industries
Fundamental All Cap Core
Fundamental Large Cap Core
Mid Cap Growth
New Opportunities
Regional Bank
Small Cap Core
Small Cap Growth
Small Cap Value
U.S. Global Leaders Growth
U.S. Growth
INTERNATIONAL EQUITY FUNDS
Disciplined Value International
Emerging Markets
Emerging Markets Equity
Fundamental Global Franchise
Global Environmental Opportunities
Global Equity
Global Shareholder Yield
Global Thematic Opportunities
International Dynamic Growth
International Growth
International Small Company
FIXED-INCOME FUNDS
Bond
California Tax-Free Income
Emerging Markets Debt
Floating Rate Income
Government Income
High Yield
High Yield Municipal Bond
Income
Investment Grade Bond
Money Market
Opportunistic Fixed Income
Short Duration Bond
Short Duration Credit Opportunities
Strategic Income Opportunities
Tax-Free Bond
ALTERNATIVE FUNDS
Absolute Return Currency
Alternative Asset Allocation
Diversified Macro
Infrastructure
Multi-Asset Absolute Return
Real Estate Securities
Seaport Long/Short
A fund’s investment objectives, risks, charges, and expenses should be considered carefully before investing. The prospectus contains this and other important information about the fund. To obtain a prospectus, contact your financial professional, call John Hancock Investments at 800-225-5291, or visit our website at jhinvestments.com. Please read the prospectus carefully before investing or sending money.
EXCHANGE-TRADED FUNDS
John Hancock Corporate Bond ETF
John Hancock Mortgage-Backed Securities ETF
John Hancock Multifactor Consumer Discretionary ETF
John Hancock Multifactor Consumer Staples ETF
John Hancock Multifactor Developed International ETF
John Hancock Multifactor Emerging Markets ETF
John Hancock Multifactor Energy ETF
John Hancock Multifactor Financials ETF
John Hancock Multifactor Healthcare ETF
John Hancock Multifactor Industrials ETF
John Hancock Multifactor Large Cap ETF
John Hancock Multifactor Materials ETF
John Hancock Multifactor Media and
Communications ETF
John Hancock Multifactor Mid Cap ETF
John Hancock Multifactor Small Cap ETF
John Hancock Multifactor Technology ETF
John Hancock Multifactor Utilities ETF
ENVIRONMENTAL, SOCIAL, AND
GOVERNANCE FUNDS
ESG Core Bond
ESG International Equity
ESG Large Cap Core
ASSET ALLOCATION/TARGET DATE FUNDS
Balanced
Multi-Asset High Income
Multi-Index Lifetime Portfolios
Multi-Index Preservation Portfolios
Multimanager Lifestyle Portfolios
Multimanager Lifetime Portfolios
Retirement Income 2040
CLOSED-END FUNDS
Financial Opportunities
Hedged Equity & Income
Income Securities Trust
Investors Trust
Preferred Income
Preferred Income II
Preferred Income III
Premium Dividend
Tax-Advantaged Dividend Income
Tax-Advantaged Global Shareholder Yield
John Hancock ETF shares are bought and sold at market price (not NAV), and are not individually redeemed from the fund. Brokerage commissions will reduce returns.
John Hancock ETFs are distributed by Foreside Fund Services, LLC, and are subadvised by Manulife Investment Management (US) LLC or Dimensional Fund Advisors LP. Foreside is not affiliated with John Hancock Investment Management Distributors LLC, Manulife Investment Management (US) LLC or Dimensional Fund Advisors LP.
Dimensional Fund Advisors LP receives compensation from John Hancock in connection with licensing rights to the John Hancock Dimensional indexes. Dimensional Fund Advisors LP does not sponsor, endorse, or sell, and makes no representation as to the advisability of investing in, John Hancock Multifactor ETFs.
A trusted brand
John Hancock Investment Management is a premier asset manager
with a heritage of financial stewardship dating back to 1862. Helping
our shareholders pursue their financial goals is at the core of everything
we do. It’s why we support the role of professional financial advice
and operate with the highest standards of conduct and integrity.
A better way to invest
We serve investors globally through a unique multimanager approach:
We search the world to find proven portfolio teams with specialized
expertise for every strategy we offer, then we apply robust investment
oversight to ensure they continue to meet our uncompromising
standards and serve the best interests of our shareholders.
Results for investors
Our unique approach to asset management enables us to provide
a diverse set of investments backed by some of the world’s best
managers, along with strong risk-adjusted returns across asset classes.
“A trusted brand” is based on a survey of 6,651 respondents conducted by Medallia between 3/18/20 and 5/13/20.
John Hancock Investment Management LLC, 200 Berkeley Street, Boston, MA 02116, 800-225-6020, jhinvestments.com/etf
Manulife Investment Management, the Stylized M Design, and Manulife Investment Management & Stylized M Design are trademarks of The Manufacturers Life Insurance Company and are used by its affiliates under license.
NOT FDIC INSURED. MAY LOSE VALUE. NO BANK GUARANTEE. NOT INSURED BY ANY GOVERNMENT AGENCY.
This report is for the information of the shareholders of John Hancock Multifactor ETFs. It is not authorized for distribution to prospective investors unless preceded or accompanied by a prospectus.
| JHAN-20180615-0136 | ETFSA 10/2021 |
12/2021
Semiannual report
John Hancock
Fixed Income ETFs
ETF
October 31, 2021
A message to shareholders
Dear shareholder,
Equities delivered robust returns during the six months ended October 31, 2021, while bond market performance was much more muted. Bonds generated unimpressive returns, reflecting investors’ growing anticipation that rising inflation will compel the U.S. Federal Reserve to begin tapering its quantitative easing policy and possibly start raising interest rates in 2022. In a continuation of a longstanding trend, the credit-oriented segments of the market outperformed those with the highest interest-rate sensitivity.
As new variants of COVID-19 emerge, the markets get increasingly volatile and economic disruptions may occur. In these uncertain times, your financial professional can assist with positioning your portfolio so that it’s sufficiently diversified to help meet your long-term objectives and to withstand the inevitable bouts of market volatility along the way.
On behalf of everyone at John Hancock Investment Management, I’d like to take this opportunity to welcome new shareholders and thank existing shareholders for the continued trust you’ve placed in us.
Sincerely,
Andrew G. Arnott
President and CEO,
John Hancock Investment Management
Head of Wealth and Asset Management,
United States and Europe
This commentary reflects the CEO’s views as of this report’s period end and are subject to change at any time. Diversification does not guarantee investment returns and does not eliminate risk of loss. All investments entail risks, including the possible loss of principal. For more up-to-date information, you can visit our website at jhinvestments.com.
John Hancock
Fixed Income ETFs
| | SEMIANNUAL REPORT | JOHN HANCOCK FIXED INCOME ETFS | 1 |
John Hancock Corporate Bond ETF
SECTOR COMPOSITION AS OF 10/31/2021 (% of net assets)
QUALITY COMPOSITION AS OF 10/31/2021 (% of net assets)
Ratings are from Moody’s Investors Service, Inc. If not available, we have used Standard & Poor’s Ratings Services. In the absence of ratings from these agencies, we have used Fitch Ratings, Inc. “Not rated” securities are those with no ratings available from these agencies. All ratings are as of 10-31-21 and do not reflect subsequent downgrades or upgrades, if any.
| COUNTRY COMPOSITION AS OF 10/31/2021 (% of net assets) |
| United States | 89.2 |
| United Kingdom | 4.3 |
| Canada | 2.8 |
| Norway | 1.6 |
| France | 1.3 |
| Other countries | 0.8 |
| TOTAL | 100.0 |
| 2 | JOHN HANCOCK FIXED INCOME ETFS | SEMIANNUAL REPORT | |
John Hancock Mortgage-Backed Securities ETF
PORTFOLIO COMPOSITION AS OF 10/31/2021 (% of net assets)
QUALITY COMPOSITION AS OF 10/31/2021 (% of net assets)
Ratings are from Moody’s Investors Service, Inc. If not available, we have used Standard & Poor’s Ratings Services. In the absence of ratings from these agencies, we have used Fitch Ratings, Inc. “Not rated” securities are those with no ratings available from these agencies. All ratings are as of 10-31-21 and do not reflect subsequent downgrades or upgrades, if any.
| | SEMIANNUAL REPORT | JOHN HANCOCK FIXED INCOME ETFS | 3 |
Notes about risk
Each fund is subject to various risks as described in the fund’s prospectus. The novel COVID-19 disease has resulted in significant disruptions to global business activity. A widespread health crisis such as a global pandemic could cause substantial market volatility, exchange trading suspensions and closures, which may lead to less liquidity in certain instruments, industries, sectors or the markets generally, and may ultimately affect fund performance. For more information, please refer to the “Principal risk” section of the prospectus. Current and future portfolio holdings are subject to change and risk. Investing involves risk, including the potential loss of principal. There is no guarantee that a fund’s investment strategy will be successful and there can be no assurance that active trading markets for shares will develop or be maintained by market makers or authorized participants.
A note about the performance shown on the following pages
Net asset value (NAV) performance is based on the NAV calculated each business day. It is calculated in accordance with the standard formula for valuing investment company shares as of the close of regular trading hours on the NYSE (see Note 2 to financial statements). Market price is determined using the bid/ask midpoint at 4 P.M. Eastern time, when the NAV is typically calculated. Your returns may differ if you traded shares at other times during the day.
The past performance shown here reflects reinvested distributions and the beneficial effect of any expense reductions, and does not guarantee future results. Returns for periods shorter than one year are cumulative. Shares will fluctuate in value and, when redeemed, may be worth more or less than their original cost. Current performance may be lower or higher than the performance cited. For the most recent month-end performance, visit jhinvestments.com/etf.
| 4 | JOHN HANCOCK FIXED INCOME ETFS | SEMIANNUAL REPORT | |
TOTAL RETURNS AS OF 10/31/2021 (%)
| | Cumulative total returns (%) |
| | 6-month | Since fund
inception1 |
| At Net asset value | 2.52 | 3.64 |
| At Market price | 2.42 | 3.98 |
| Bloomberg U.S. Corporate Bond Index | 2.66 | 3.95 |
The Bloomberg U.S. Corporate Bond Index tracks the investment grade, fixed-rate, taxable corporate bond market.
This chart shows what happened to a hypothetical $10,000 investment in John Hancock Corporate Bond ETF for the periods indicated, assuming all distributions were reinvested. For comparison, we’ve shown the same investment in the Bloomberg U.S. Corporate Bond Index.
The value of a $10,000 investment calculated at market value from inception through period end would be $10,398.
The chart and table above do not reflect the deduction of taxes that a shareholder would pay on fund distributions or the redemption or sale of fund shares.
It is not possible to invest directly in an index. Unlike an index, the fund’s total returns are reduced by operating expenses and management fees.
The expense ratios of the fund, both net (including any fee waivers and/or expense limitations) and gross (excluding any fee waivers and/or expense limitations), are set forth according to the most recent publicly available prospectus for the fund and may differ from those disclosed in the Financial highlights table in this report. Net expenses reflect contractual expense limitations in effect until August 31, 2022 and are subject to change. Had the contractual fee waivers and expense limitations not been in place, gross expenses would apply. The expense ratios are as follows:
Please refer to the most recent prospectus and annual or semiannual report for more information on expenses and any expense limitation arrangements for the fund.
| | SEMIANNUAL REPORT | JOHN HANCOCK FIXED INCOME ETFS | 5 |
These examples are intended to help you understand your ongoing operating expenses of investing in the fund so you can compare these costs with the ongoing costs of investing in other funds.
Understanding fund expenses
As a shareholder of a fund, you incur two types of costs:
■Transaction costs, which may include creation and redemption fees and brokerage charges.
■Ongoing operating expenses, including management fees, and other fund expenses.
We are presenting only your ongoing operating expenses here.
Actual expenses/actual returns
The first line of each fund in the following table is intended to provide information about a fund’s actual ongoing operating expenses, and is based on the fund’s actual NAV return. It assumes an account value of $1,000.00 on May 1, 2021, with the same investment held until October 31, 2021.
Together with the value of your account, you may use this information to estimate the operating expenses that you paid over the period. Simply divide your account value at October 31, 2021, by $1,000.00, then multiply it by the “expenses paid” from the table. For example, for an account value of $8,600.00, the operating expenses should be calculated as follows:
Hypothetical example for comparison purposes
The second line of each fund in the following table allows you to compare a fund’s ongoing operating expenses with those of any other fund. It provides an example of the fund’s hypothetical account values and hypothetical expenses based on the fund’s actual expense ratio and an assumed 5% annualized return before expenses (which is not the fund’s actual return). It assumes an account value of $1,000.00 on May 1, 2021, with the same investment held until October 31, 2021. Look in any other fund shareholder report to find its hypothetical example and you will be able to compare these expenses. Please remember that these hypothetical account values and expenses may not be used to estimate the actual ending account balance or expenses you paid for the period.
Remember, these examples do not include any transaction costs. A fund charges a transaction fee per creation unit to those creating or redeeming creation units, and those buying or selling shares in the secondary market will incur customary brokerage commissions and charges. Therefore, these examples will not help you to determine the relative total costs of owning different funds. If transaction costs were included, your expenses would have been higher. See the prospectus for details regarding transaction costs.
SHAREHOLDER EXPENSE EXAMPLE CHART
| | Account
value on
5-1-2021 | Ending
value on
10-31-2021 | Expenses
paid during
10-31-20211 | Annualized
expense
ratio |
| Corporate Bond ETF |
| Actual expenses/actual returns | $1,000.00 | $1,025.20 | $1.48 | 0.29% |
| Hypothetical example for comparison purposes | 1,000.00 | 1,023.70 | 1.48 | 0.29% |
| Mortgage-Backed Securities ETF |
| Actual expenses/actual returns2 | $1,000.00 | $995.10 | $0.80 | 0.39% |
| Hypothetical example for comparison purposes | 1,000.00 | 1,009.50 | 0.81 | 0.39% |
| 6 | JOHN HANCOCK FIXED INCOME ETFS | SEMIANNUAL | |
SHAREHOLDER EXPENSE EXAMPLE CHART (continued)
| | |
| 1 | Expenses are equal to the annualized expense ratio, multiplied by the average account value over the period, multiplied by 184/365 (to reflect the one-half year period). |
| 2 | The inception date for the fund is 08-18-21. Actual Expenses are equal to the fund’s annualized expense ratio, multiplied by the average account value over the period, multiplied by 75/ 365 (to reflect the period). |
| | SEMIANNUAL | JOHN HANCOCK FIXED INCOME ETFS | 7 |
CORPORATE BOND ETF
As of 10-31-21 (unaudited)
| | Rate (%) | Maturity date | | Par value^ | Value |
| Corporate bonds 98.3% | | | $20,046,665 |
| (Cost $19,633,736) | | | | | |
| Communication services 11.4% | | | 2,317,128 |
| Diversified telecommunication services 4.2% | | | |
| AT&T, Inc. | 3.100 | 02-01-43 | | 210,000 | 202,797 |
| AT&T, Inc. | 3.500 | 06-01-41 | | 120,000 | 123,791 |
| Level 3 Financing, Inc. (A) | 3.400 | 03-01-27 | | 200,000 | 208,498 |
| Verizon Communications, Inc. | 2.650 | 11-20-40 | | 330,000 | 311,800 |
| Entertainment 1.0% | | | |
| The Walt Disney Company | 1.750 | 01-13-26 | | 200,000 | 202,902 |
| Media 4.2% | | | |
| Charter Communications Operating LLC | 3.500 | 06-01-41 | | 420,000 | 412,322 |
| Comcast Corp. | 3.750 | 04-01-40 | | 400,000 | 448,149 |
| Wireless telecommunication services 2.0% | | | |
| T-Mobile USA, Inc. | 2.550 | 02-15-31 | | 410,000 | 406,869 |
| Consumer discretionary 9.7% | | | 1,983,669 |
| Automobiles 2.4% | | | |
| General Motors Financial Company, Inc. | 2.700 | 08-20-27 | | 290,000 | 296,049 |
| Hyundai Capital America (A) | 2.375 | 10-15-27 | | 200,000 | 200,771 |
| Hotels, restaurants and leisure 4.1% | | | |
| Booking Holdings, Inc. | 4.625 | 04-13-30 | | 200,000 | 235,840 |
| Expedia Group, Inc. | 3.250 | 02-15-30 | | 300,000 | 308,430 |
| Marriott International, Inc. | 4.625 | 06-15-30 | | 260,000 | 296,076 |
| Internet and direct marketing retail 2.1% | | | |
| Amazon.com, Inc. | 2.500 | 06-03-50 | | 440,000 | 421,347 |
| Multiline retail 1.1% | | | |
| Dollar Tree, Inc. | 4.200 | 05-15-28 | | 200,000 | 225,156 |
| Consumer staples 1.2% | | | 247,092 |
| Beverages 1.2% | | | |
| Anheuser-Busch InBev Worldwide, Inc. | 4.600 | 04-15-48 | | 200,000 | 247,092 |
| Energy 10.4% | | | 2,117,592 |
| Oil, gas and consumable fuels 10.4% | | | |
| Aker BP ASA (A) | 3.750 | 01-15-30 | | 300,000 | 320,498 |
| Cenovus Energy, Inc. | 5.400 | 06-15-47 | | 200,000 | 250,114 |
| Enbridge, Inc. (5.750% to 4-15-30, then 5 Year CMT + 5.314%) | 5.750 | 07-15-80 | | 280,000 | 314,720 |
| Energy Transfer LP | 5.250 | 04-15-29 | | 200,000 | 232,303 |
| Kinder Morgan, Inc. | 3.600 | 02-15-51 | | 200,000 | 203,212 |
| MPLX LP | 4.000 | 03-15-28 | | 270,000 | 296,971 |
| Sabine Pass Liquefaction LLC | 4.200 | 03-15-28 | | 270,000 | 299,377 |
| The Williams Companies, Inc. | 2.600 | 03-15-31 | | 200,000 | 200,397 |
| Financials 28.1% | | | 5,741,381 |
| Banks 18.4% | | | |
| Bank of America Corp. (2.592% to 4-29-30, then SOFR + 2.150%) | 2.592 | 04-29-31 | | 490,000 | 495,651 |
| Barclays PLC | 4.375 | 01-12-26 | | 400,000 | 440,547 |
| Citigroup, Inc. (2.976% to 11-5-29, then SOFR + 1.422%) | 2.976 | 11-05-30 | | 400,000 | 417,293 |
| Citizens Financial Group, Inc. | 3.250 | 04-30-30 | | 400,000 | 426,353 |
| Credit Agricole SA (A) | 3.250 | 01-14-30 | | 250,000 | 260,090 |
| JPMorgan Chase & Co. (2.739% to 10-15-29, then SOFR + 1.510%) | 2.739 | 10-15-30 | | 400,000 | 409,948 |
| Lloyds Banking Group PLC | 4.450 | 05-08-25 | | 400,000 | 440,133 |
| Santander Holdings USA, Inc. | 4.400 | 07-13-27 | | 400,000 | 445,012 |
| Wells Fargo & Company (2.879% to 10-30-29, then SOFR + 1.432%) | 2.879 | 10-30-30 | | 400,000 | 414,460 |
| 8 | JOHN HANCOCK FIXED INCOME ETFS | SEMIANNUAL REPORT | SEE NOTES TO FINANCIAL STATEMENTS |
| | Rate (%) | Maturity date | | Par value^ | Value |
| Financials (continued) | | | |
| Capital markets 5.4% | | | |
| Ares Capital Corp. | 3.875 | 01-15-26 | | 200,000 | $212,144 |
| Morgan Stanley (3.772% to 1-24-28, then 3 month LIBOR + 1.140%) | 3.772 | 01-24-29 | | 450,000 | 494,254 |
| The Goldman Sachs Group, Inc. (1.431% to 3-9-26, then SOFR + 0.798%) | 1.431 | 03-09-27 | | 400,000 | 393,848 |
| Diversified financial services 1.1% | | | |
| Jefferies Group LLC | 4.150 | 01-23-30 | | 200,000 | 223,471 |
| Insurance 3.2% | | | |
| Brighthouse Financial, Inc. | 3.700 | 06-22-27 | | 200,000 | 216,818 |
| Prudential Financial, Inc. (3.700% to 7-1-30, then 5 Year CMT + 3.035%) | 3.700 | 10-01-50 | | 200,000 | 206,260 |
| Teachers Insurance & Annuity Association of America (A) | 4.270 | 05-15-47 | | 200,000 | 245,099 |
| Health care 6.9% | | | 1,397,549 |
| Biotechnology 1.1% | | | |
| AbbVie, Inc. | 3.200 | 11-21-29 | | 200,000 | 213,726 |
| Health care providers and services 3.8% | | | |
| AmerisourceBergen Corp. | 3.450 | 12-15-27 | | 200,000 | 215,963 |
| CVS Health Corp. | 4.300 | 03-25-28 | | 121,000 | 136,991 |
| HCA, Inc. | 4.125 | 06-15-29 | | 200,000 | 221,516 |
| Universal Health Services, Inc. (A) | 2.650 | 10-15-30 | | 200,000 | 198,482 |
| Pharmaceuticals 2.0% | | | |
| Royalty Pharma PLC | 1.750 | 09-02-27 | | 200,000 | 196,179 |
| Viatris, Inc. | 4.000 | 06-22-50 | | 200,000 | 214,692 |
| Industrials 5.7% | | | 1,167,634 |
| Aerospace and defense 1.1% | | | |
| The Boeing Company | 3.750 | 02-01-50 | | 210,000 | 220,956 |
| Airlines 1.1% | | | |
| Delta Air Lines, Inc. (A) | 4.750 | 10-20-28 | | 200,000 | 222,086 |
| Industrial conglomerates 1.7% | | | |
| General Electric Company | 4.250 | 05-01-40 | | 300,000 | 358,871 |
| Trading companies and distributors 1.8% | | | |
| AerCap Ireland Capital DAC | 3.650 | 07-21-27 | | 150,000 | 158,990 |
| Air Lease Corp. | 2.875 | 01-15-26 | | 200,000 | 206,731 |
| Information technology 12.0% | | | 2,443,824 |
| Communications equipment 0.6% | | | |
| Motorola Solutions, Inc. | 2.300 | 11-15-30 | | 125,000 | 122,031 |
| IT services 1.0% | | | |
| Visa, Inc. | 2.700 | 04-15-40 | | 200,000 | 205,031 |
| Semiconductors and semiconductor equipment 3.7% | | | |
| Broadcom, Inc. (A) | 2.450 | 02-15-31 | | 210,000 | 203,157 |
| Micron Technology, Inc. | 4.185 | 02-15-27 | | 200,000 | 220,472 |
| NVIDIA Corp. | 2.850 | 04-01-30 | | 300,000 | 318,713 |
| Software 3.6% | | | |
| Microsoft Corp. | 2.525 | 06-01-50 | | 430,000 | 422,940 |
| Oracle Corp. | 2.300 | 03-25-28 | | 310,000 | 314,665 |
| Technology hardware, storage and peripherals 3.1% | | | |
| Apple, Inc. | 1.200 | 02-08-28 | | 400,000 | 387,549 |
| Dell International LLC | 8.350 | 07-15-46 | | 150,000 | 249,266 |
| Materials 2.1% | | | 424,211 |
| Construction materials 1.1% | | | |
| Vulcan Materials Company | 3.500 | 06-01-30 | | 200,000 | 218,175 |
| Metals and mining 1.0% | | | |
| Newmont Corp. | 2.800 | 10-01-29 | | 200,000 | 206,036 |
| SEE NOTES TO FINANCIAL STATEMENTS | SEMIANNUAL REPORT | JOHN HANCOCK FIXED INCOME ETFS | 9 |
| | Rate (%) | Maturity date | | Par value^ | Value |
| Real estate 5.6% | | | $1,144,540 |
| Equity real estate investment trusts 5.6% | | | |
| American Tower Corp. | 3.800 | 08-15-29 | | 200,000 | 219,726 |
| CyrusOne LP | 2.150 | 11-01-30 | | 210,000 | 198,151 |
| Equinix, Inc. | 1.550 | 03-15-28 | | 200,000 | 193,861 |
| GLP Capital LP | 5.375 | 04-15-26 | | 200,000 | 225,538 |
| Host Hotels & Resorts LP | 3.375 | 12-15-29 | | 300,000 | 307,264 |
| Utilities 5.2% | | | 1,062,045 |
| Electric utilities 4.0% | | | |
| NextEra Energy Capital Holdings, Inc. | 2.750 | 11-01-29 | | 250,000 | 259,397 |
| NRG Energy, Inc. (A) | 4.450 | 06-15-29 | | 270,000 | 295,953 |
| Vistra Operations Company LLC (A) | 4.300 | 07-15-29 | | 250,000 | 267,560 |
| Multi-utilities 1.2% | | | |
| CenterPoint Energy Resources Corp. | 1.750 | 10-01-30 | | 250,000 | 239,135 |
|
| | | Yield (%) | | Shares | Value |
| Short-term investments 0.8% | | | | | $174,300 |
| (Cost $174,300) | | | | | |
| Short-term funds 0.8% | | | | | 174,300 |
| State Street Institutional U.S. Government Money Market Fund, Premier Class | 0.0250(B) | | 174,300 | 174,300 |
| Total investments (Cost $19,808,036) 99.1% | | | $20,220,965 |
| Other assets and liabilities, net 0.9% | | | | 176,939 |
| Total net assets 100.0% | | | | | $20,397,904 |
| The percentage shown for each investment category is the total value of the category as a percentage of the net assets of the fund. |
| ^All par values are denominated in U.S. dollars unless otherwise indicated. |
| Security Abbreviations and Legend |
| CMT | Constant Maturity Treasury |
| LIBOR | London Interbank Offered Rate |
| SOFR | Secured Overnight Financing Rate |
| (A) | These securities are exempt from registration under Rule 144A of the Securities Act of 1933. Such securities may be resold, normally to qualified institutional buyers, in transactions exempt from registration. Rule 144A securities amounted to $2,422,194 or 11.9% of the fund’s net assets as of 10-31-21. |
| (B) | The rate shown is the annualized seven-day yield as of 10-31-21. |
MORTGAGE-BACKED SECURITIES ETF
As of 10-31-21 (unaudited)
| | Rate (%) | Maturity date | | Par value^ | Value |
| U.S. Government and Agency obligations 48.8% | | | | $9,667,060 |
| (Cost $9,731,680) | | | | | |
| U.S. Government Agency 48.8% | | | | 9,667,060 |
| Federal Home Loan Mortgage Corp. | | | | | |
| 30 Yr Pass Thru | 3.000 | 06-01-51 | | 290,384 | 305,919 |
| 30 Yr Pass Thru | 3.500 | 09-01-47 | | 495,398 | 525,281 |
| 30 Yr Pass Thru | 4.000 | 04-01-47 | | 168,795 | 182,524 |
| Federal National Mortgage Association | | | | | |
| 30 Yr Pass Thru | 2.000 | 07-01-51 | | 322,654 | 324,320 |
| 30 Yr Pass Thru | 2.000 | 08-01-51 | | 595,233 | 598,400 |
| 30 Yr Pass Thru | 2.000 | 09-01-51 | | 617,968 | 619,961 |
| 30 Yr Pass Thru | 2.500 | 04-01-51 | | 290,103 | 299,016 |
| 30 Yr Pass Thru | 2.500 | 07-01-51 | | 340,196 | 352,349 |
| 30 Yr Pass Thru | 2.500 | 08-01-51 | | 589,125 | 607,685 |
| 30 Yr Pass Thru | 2.500 | 08-01-51 | | 639,227 | 660,965 |
| 30 Yr Pass Thru | 2.500 | 08-01-51 | | 346,160 | 358,201 |
| 30 Yr Pass Thru | 2.500 | 08-01-51 | | 495,729 | 511,393 |
| 30 Yr Pass Thru | 3.000 | 11-01-46 | | 449,287 | 477,325 |
| 30 Yr Pass Thru | 3.000 | 11-01-46 | | 270,836 | 287,737 |
| 30 Yr Pass Thru | 3.000 | 04-01-47 | | 270,122 | 286,979 |
| 30 Yr Pass Thru | 3.000 | 05-01-50 | | 285,973 | 302,032 |
| 10 | JOHN HANCOCK FIXED INCOME ETFS | SEMIANNUAL REPORT | SEE NOTES TO FINANCIAL STATEMENTS |
| | Rate (%) | Maturity date | | Par value^ | Value |
| U.S. Government Agency (continued) | | | | |
| 30 Yr Pass Thru | 3.000 | 07-01-51 | | 289,328 | $304,987 |
| 30 Yr Pass Thru | 3.000 | 08-01-51 | | 567,788 | 601,358 |
| 30 Yr Pass Thru | 3.500 | 12-01-46 | | 215,717 | 232,167 |
| 30 Yr Pass Thru | 3.500 | 02-01-47 | | 266,006 | 284,379 |
| 30 Yr Pass Thru | 3.500 | 05-01-47 | | 254,457 | 272,033 |
| 30 Yr Pass Thru | 3.500 | 02-01-48 | | 344,408 | 367,766 |
| 30 Yr Pass Thru | 4.000 | 04-01-47 | | 168,602 | 182,316 |
| 30 Yr Pass Thru | 4.000 | 07-01-47 | | 169,186 | 181,954 |
| 30 Yr Pass Thru | 4.000 | 06-01-49 | | 164,057 | 176,965 |
| 30 Yr Pass Thru | 4.000 | 06-01-49 | | 167,147 | 180,659 |
|
| 30 Yr Pass Thru | 4.000 | 06-01-49 | | 167,990 | 182,389 |
| Collateralized mortgage obligations 36.7% | | | | $7,276,470 |
| (Cost $7,340,648) | | | | | |
| Commercial and residential 20.5% | | | 4,068,900 |
| Angel Oak Mortgage Trust LLC | | |
| Series 2020-3, Class A2 (A)(B) | 2.410 | 04-25-65 | | 138,504 | 139,627 |
| BANK | | |
| Series 2018-BN11, Class A2 | 3.784 | 03-15-61 | | 400,000 | 437,802 |
| Bellemeade Re, Ltd. | | |
| Series 2021-3A, Class M2 (SOFR + 3.150%) (A)(C) | 3.199 | 09-25-31 | | 200,000 | 198,501 |
| BRAVO Residential Funding Trust | | |
| Series 2021-NQM1, Class M1 (A)(B) | 2.316 | 02-25-49 | | 100,000 | 99,758 |
| Bunker Hill Loan Depositary Trust | | |
| Series 2019-3, Class M1 (A) | 3.269 | 11-25-59 | | 100,000 | 101,022 |
| BX Commercial Mortgage Trust | | |
| Series 2021-VOLT, Class F (1 month LIBOR + 2.400%) (A)(C) | 2.490 | 09-15-36 | | 200,000 | 199,760 |
| COLT Mortgage Loan Trust | | |
| Series 2021-4, Class B1 (A)(B) | 3.764 | 10-25-66 | | 200,000 | 198,987 |
| Series 2021-HX1, Class B1 (A)(B) | 3.110 | 10-25-66 | | 100,000 | 99,467 |
| Commercial Mortgage Trust (Cantor Fitzgerald/Deutsche Bank AG) | | |
| Series 2014-CR21, Class A3 | 3.528 | 12-10-47 | | 365,457 | 382,984 |
| Eagle Re, Ltd. | | |
| Series 2021-2, Class M1B (SOFR + 2.050%) (A)(C) | 2.099 | 04-25-34 | | 200,000 | 200,000 |
| FREMF Mortgage Trust | | |
| Series 2016-K56, Class B (A)(B) | 3.941 | 06-25-49 | | 200,000 | 217,034 |
| Series 2018-K730, Class B (A)(B) | 3.796 | 02-25-50 | | 200,000 | 212,062 |
| Imperial Fund Mortgage Trust | | |
| Series 2021-NQM2, Class M1 (A)(B) | 2.489 | 09-25-56 | | 200,000 | 198,472 |
| MFA Trust | | |
| Series 2020-NQM3, Class M1 (A)(B) | 2.654 | 01-26-65 | | 100,000 | 100,157 |
| Oaktown Re VII, Ltd. | | |
| Series 2021-2, Class M1B (SOFR + 2.900%) (A)(C) | 2.950 | 04-25-34 | | 200,000 | 200,000 |
| PKHL Commercial Mortgage Trust | | |
| Series 2021-MF, Class F (1 month LIBOR + 3.350%) (A)(C) | 3.441 | 07-15-38 | | 200,000 | 200,432 |
| Ready Capital Mortgage Trust | | |
| Series 2019-5, Class E (A)(B) | 5.502 | 02-25-52 | | 250,000 | 256,871 |
| Triangle Re, Ltd. | | |
| Series 2021-3, Class M1B (SOFR + 2.900%) (A)(C) | 2.949 | 02-25-34 | | 200,000 | 199,001 |
| Verus Securitization Trust | | |
| Series 2020-INV1, Class A2 (A)(B) | 3.035 | 03-25-60 | | 170,000 | 173,860 |
| Series 2021-3, Class A3 (A)(B) | 1.437 | 06-25-66 | | 133,210 | 132,565 |
| Visio Trust | | |
| Series 2019-2, Class A1 (A)(B) | 2.722 | 11-25-54 | | 118,681 | 120,538 |
| U.S. Government Agency 16.2% | | | 3,207,570 |
| Federal Home Loan Mortgage Corp. | | |
| Series 2019-HQA2, Class B1 (1 month LIBOR + 4.100%) (A)(C) | 4.189 | 04-25-49 | | 200,000 | 205,923 |
| Series 2021-DNA3, Class B1 (SOFR + 3.500%) (A)(C) | 3.549 | 10-25-33 | | 200,000 | 207,982 |
| Series 2021-HQA1, Class M2 (SOFR + 2.250%) (A)(C) | 2.299 | 08-25-33 | | 500,000 | 505,640 |
| Series 2021-HQA2, Class M2 (SOFR + 2.050%) (A)(C) | 2.099 | 12-25-33 | | 300,000 | 302,257 |
| Series 5150, Class IS IO | 1.500 | 08-25-51 | | 1,741,000 | 247,670 |
| Series K109, Class X1 IO | 1.582 | 04-25-30 | | 1,996,293 | 228,634 |
| SEE NOTES TO FINANCIAL STATEMENTS | SEMIANNUAL REPORT | JOHN HANCOCK FIXED INCOME ETFS | 11 |
| | Rate (%) | Maturity date | | Par value^ | Value |
| U.S. Government Agency (continued) | | | |
| Series K116, Class X1 IO | 1.427 | 07-25-30 | | 2,745,749 | $288,483 |
| Federal National Mortgage Association | | |
| Series 2019-R01, Class 2B1 (1 month LIBOR + 4.350%) (A)(C) | 4.439 | 07-25-31 | | 200,000 | 205,196 |
| Series 2021-R01, Class 1B1 (SOFR + 3.100%) (A)(C) | 3.150 | 10-25-41 | | 200,000 | 200,891 |
| Government National Mortgage Association | | |
| Series 2014-103, Class DA (B) | 3.250 | 09-16-54 | | 152,421 | 156,452 |
| Series 2014-50, Class C | 3.400 | 02-16-47 | | 300,000 | 308,462 |
| Series 2017-159, Class IO | 0.475 | 06-16-59 | | 4,606,596 | 211,971 |
|
| Series 2018-23, Class IO | 0.592 | 11-16-59 | | 2,494,468 | 138,009 |
| Asset backed securities 13.9% | | | | | $2,753,352 |
| (Cost $2,785,108) | | | | | |
| Asset backed securities 13.9% | | | | | 2,753,352 |
| AMMC CLO, Ltd. | | | | | |
| Series 2020-23A, Class C (3 month LIBOR + 2.650%) (A)(C) | 2.772 | 10-17-31 | | 200,000 | 200,000 |
| AMSR Trust | | | | | |
| Series 2020-SFR1, Class C (A) | 2.419 | 04-17-37 | | 150,000 | 150,763 |
| Series 2020-SFR4, Class D (A) | 2.006 | 11-17-37 | | 314,000 | 308,075 |
| Atrium XII | | | | | |
| Series 12A, Class DR (3 month LIBOR + 2.800%) (A)(C) | 2.928 | 04-22-27 | | 250,000 | 249,268 |
| Barings CLO, Ltd. | | | | | |
| Series 2013-IA, Class DR (3 month LIBOR + 2.550%) (A)(C) | 2.682 | 01-20-28 | | 250,000 | 248,555 |
| CLI Funding VIII LLC | | | | | |
| Series 2021-1A, Class A (A) | 1.640 | 02-18-46 | | 163,371 | 160,076 |
| Elara HGV Timeshare Issuer LLC | | | | | |
| Series 2021-A, Class D (A) | 3.320 | 08-27-35 | | 200,000 | 198,894 |
| LCM XV LP | | | | | |
| Series 15A, Class DR (3 month LIBOR + 3.700%) (A)(C) | 3.832 | 07-20-30 | | 250,000 | 247,552 |
| Progress Residential Trust | | | | | |
| Series 2020-SFR1, Class C (A) | 2.183 | 04-17-37 | | 300,000 | 300,687 |
| Series 2021-SFR4, Class E1 (A) | 2.409 | 05-17-38 | | 150,000 | 149,075 |
| Store Master Funding I-VII & XIV | | | | | |
| Series 2019-1, Class A2 (A) | 3.650 | 11-20-49 | | 192,110 | 205,161 |
| Taco Bell Funding LLC | | | | | |
| Series 2021-1A, Class A2I (A) | 1.946 | 08-25-51 | | 200,000 | 198,107 |
| TIF Funding II LLC | | | | | |
| Series 2021-1A, Class A (A) | 1.650 | 02-20-46 | | 141,281 | 137,139 |
|
| | | Yield (%) | | Shares | Value |
| Short-term investments 1.3% | | | | | $263,297 |
| (Cost $263,297) | | | | | |
| Short-term funds 1.3% | | | | | 263,297 |
| State Street Institutional U.S. Government Money Market Fund, Premier Class | 0.0250(D) | | 263,297 | 263,297 |
| Total investments (Cost $20,120,733) 100.7% | | | $19,960,179 |
| Other assets and liabilities, net (0.7%) | | | | (134,893) |
| Total net assets 100.0% | | | | | $19,825,286 |
| The percentage shown for each investment category is the total value of the category as a percentage of the net assets of the fund. |
| ^All par values are denominated in U.S. dollars unless otherwise indicated. |
| Security Abbreviations and Legend |
| IO | Interest-Only Security - (Interest Tranche of Stripped Mortgage Pool). Rate shown is the annualized yield at the end of the period. |
| LIBOR | London Interbank Offered Rate |
| SOFR | Secured Overnight Financing Rate |
| (A) | These securities are exempt from registration under Rule 144A of the Securities Act of 1933. Such securities may be resold, normally to qualified institutional buyers, in transactions exempt from registration. Rule 144A securities amounted to $7,629,355 or 38.5% of the fund’s net assets as of 10-31-21. |
| (B) | Variable or floating rate security, the interest rate of which adjusts periodically based on a weighted average of interest rates and prepayments on the underlying pool of assets. The interest rate shown is the current rate as of period end. |
| (C) | Variable rate obligation. The coupon rate shown represents the rate at period end. |
| (D) | The rate shown is the annualized seven-day yield as of 10-31-21. |
| 12 | JOHN HANCOCK FIXED INCOME ETFS | SEMIANNUAL REPORT | SEE NOTES TO FINANCIAL STATEMENTS |
STATEMENTS OF ASSETS AND LIABILITIES 10-31-21 (unaudited)
| | Corporate Bond ETF | Mortgage-Backed Securities ETF |
| Assets | | |
| Unaffiliated investments, at value | $20,220,965 | $19,960,179 |
| Dividends and interest receivable | 174,924 | 47,989 |
| Receivable from affiliates | 6,615 | 1,868 |
| Other assets | 21,648 | 25,436 |
| Total assets | 20,424,152 | 20,035,472 |
| Liabilities | | |
| Payable for investments purchased | — | 200,000 |
| Payable to affiliates | | |
| Accounting and legal services fees | 1,193 | 699 |
| Transfer agent fees | 2,152 | — |
| Other liabilities and accrued expenses | 22,903 | 9,487 |
| Total liabilities | 26,248 | 210,186 |
| Net assets | $20,397,904 | $19,825,286 |
| Net assets consist of | | |
| Paid-in capital | $19,999,684 | $20,020,000 |
| Total distributable earnings (loss) | 398,220 | (194,714) |
| Net assets | $20,397,904 | $19,825,286 |
| Unaffiliated investments, at cost | $19,808,036 | $20,120,733 |
| Net asset value per share | | |
| Based on net asset values and shares outstanding-the fund has an unlimited number of shares authorized with no par value. | | |
| Net assets | $20,397,904 | $19,825,286 |
| Shares outstanding | 800,000 | 800,000 |
| Net asset value per share | $25.50 | $24.78 |
| SEE NOTES TO FINANCIAL STATEMENTS | SEMIANNUAL | JOHN HANCOCK FIXED INCOME ETFS | 13 |
STATEMENTS OF OPERATIONS For the six months ended 10-31-21 (unaudited)
| | Corporate Bond ETF | Mortgage-Backed Securities ETF1 |
| Investment income | | |
| Interest | $265,366 | $101,316 |
| Total investment income | 265,366 | 101,316 |
| Expenses | | |
| Investment management fees | 24,865 | 13,588 |
| Accounting and legal services fees | 1,651 | 699 |
| Transfer agent fees | 2,152 | — |
| Trustees’ fees | 84 | — |
| Custodian fees | 4,530 | 1,905 |
| Printing and postage | 6,846 | 2,586 |
| Professional fees | 37,763 | 12,744 |
| Stock exchange listing fees | 3,532 | — |
| Other | 3,290 | 2,004 |
| Total expenses | 84,713 | 33,526 |
| Less expense reductions | (54,620) | (17,940) |
| Net expenses | 30,093 | 15,586 |
| Net investment income | 235,273 | 85,730 |
| Realized and unrealized gain (loss) | | |
| Net realized gain (loss) on | | |
| Unaffiliated investments | 41,718 | (43,322) |
| Change in net unrealized appreciation (depreciation) of | | |
| Unaffiliated investments | 232,369 | (160,554) |
| Net realized and unrealized gain (loss) | 274,087 | (203,876) |
| Increase (decrease) in net assets from operations | $509,360 | $(118,146) |
| | |
| 1 | Period from 8-18-21 (commencement of operations) to 10-31-21. |
| 14 | JOHN HANCOCK FIXED INCOME ETFS | SEMIANNUAL | SEE NOTES TO FINANCIAL STATEMENTS |
STATEMENTS OF CHANGES IN NET ASSETS
| | Corporate
Bond ETF | Mortgage-Backed
Securities ETF |
| | Six months ended
10-31-21
(unaudited) | Period ended
4-30-21 | Period ended
10-31-211
(unaudited) |
| Increase (decrease) in net assets | | | |
| From operations | | | |
| Net investment income | $235,273 | $39,016 | $85,730 |
| Net realized gain (loss) | 41,718 | — | (43,322) |
| Change in net unrealized appreciation (depreciation) | 232,369 | 180,560 | (160,554) |
| Increase (decrease) in net assets resulting from operations | 509,360 | 219,576 | (118,146) |
| Distributions to shareholders | | | |
| From earnings | (297,744) | (33,288) | (76,568) |
| From fund share transactions | | | |
| Shares issued | — | 20,000,000 | 20,020,000 |
| Total increase | 211,616 | 20,186,288 | 19,825,286 |
| Net assets | | | |
| Beginning of period | 20,186,288 | — | — |
| End of period | $20,397,904 | $20,186,288 | $19,825,286 |
| Share activity | | | |
| Shares outstanding | | | |
| Beginning of period | 800,000 | — | — |
| Shares issued | — | 800,000 | 800,000 |
| End of period | 800,000 | 800,000 | 800,000 |
| | |
| 1 | Period from 8-18-21 (commencement of operations) to 10-31-21. |
| SEE NOTES TO FINANCIAL STATEMENTS | SEMIANNUAL | JOHN HANCOCK FIXED INCOME ETFS | 15 |
CORPORATE BOND ETF
| Period ended | 10-31-211 | 4-30-212 |
| Per share operating performance | | |
| Net asset value, beginning of period | $25.23 | $25.00 |
| Net investment income3 | 0.29 | 0.05 |
| Net realized and unrealized gain (loss) on investments | 0.35 | 0.22 |
| Total from investment operations | 0.64 | 0.27 |
| Less distributions | | |
| From net investment income | (0.37) | (0.04) |
| Net asset value, end of period | $25.50 | $25.23 |
| Total return (%)4 | 2.525 | 1.105 |
| Ratios and supplemental data | | |
| Net assets, end of period (in millions) | $20 | $20 |
| Ratios (as a percentage of average net assets): | | |
| Expenses before reductions | 0.826 | 0.727 |
| Expenses including reductions | 0.296 | 0.297 |
| Net investment income | 2.276 | 2.276 |
| Portfolio turnover (%) | 19 | 08 |
| | |
| 1 | Six months ended 10-31-21. Unaudited. |
| 2 | Period from 3-30-21 (commencement of operations) to 4-30-21. |
| 3 | Based on average daily shares outstanding. |
| 4 | Total returns would have been lower had certain expenses not been reduced during the period. |
| 5 | Not annualized. |
| 6 | Annualized. |
| 7 | Annualized. Certain expenses are presented unannualized. |
| 8 | Portfolio turnover for the period is 0% due to no sales activity. |
MORTGAGE-BACKED SECURITIES ETF
| Period ended | 10-31-211 |
| Per share operating performance | |
| Net asset value, beginning of period | $25.00 |
| Net investment income2 | 0.11 |
| Net realized and unrealized gain (loss) on investments | (0.23) |
| Total from investment operations | (0.12) |
| Less distributions | |
| From net investment income | (0.10) |
| Net asset value, end of period | $24.78 |
| Total return (%)3 | (0.49)4 |
| Ratios and supplemental data | |
| Net assets, end of period (in millions) | $20 |
| Ratios (as a percentage of average net assets): | |
| Expenses before reductions | 0.845 |
| Expenses including reductions | 0.395 |
| Net investment income | 2.085 |
| Portfolio turnover (%) | 21 |
| | |
| 1 | Period from 8-18-21 (commencement of operations) to 10-31-21. Unaudited. |
| 2 | Based on average daily shares outstanding. |
| 3 | Total returns would have been lower had certain expenses not been reduced during the period. |
| 4 | Not annualized. |
| 5 | Annualized. |
| 16 | JOHN HANCOCK FIXED INCOME ETFS | SEMIANNUAL | SEE NOTES TO FINANCIAL STATEMENTS |
Notes to financial statements (unaudited)
Note 1—Organization
John Hancock Exchange-Traded Fund Trust (the Trust) is an open-end management investment company organized as a Massachusetts business trust. The Trust is registered under the Investment Company Act of 1940, as amended (the 1940 Act). It is a series company with multiple investment series, two of which are presented in this report (the funds).
The investment objective of Corporate Bond ETF is to seek a high level of current income consistent with prudent investment risk.
The investment objective of Mortgage-Backed Securities ETF is to seek a high level of current income while seeking to outperform the benchmark over a market cycle.
Mortgage-Backed Securities ETF commenced operations on August 18, 2021.
Note 2—Significant accounting policies
The financial statements have been prepared in conformity with accounting principles generally accepted in the United States of America (US GAAP), which require management to make certain estimates and assumptions as of the date of the financial statements. Actual results could differ from those estimates and those differences could be significant. The funds qualify as investment companies under Topic 946 of Accounting Standards Codification of US GAAP.
Events or transactions occurring after the end of the fiscal period through the date that the financial statements were issued have been evaluated in the preparation of the financial statements. The following summarizes the significant accounting policies of the funds:
Security valuation. Investments are stated at value as of the scheduled close of regular trading on the New York Stock Exchange (NYSE), normally at 4:00 P.M., Eastern Time. In case of emergency or other disruption resulting in the NYSE not opening for trading or the NYSE closing at a time other than the regularly scheduled close, the net asset value (NAV) may be determined as of the regularly scheduled close of the NYSE pursuant to the funds’ Valuation Policies and Procedures.
In order to value the securities, the funds use the following valuation techniques: Debt obligations typically are valued based on evaluated prices provided by an independent pricing vendor. Independent pricing vendors utilize matrix pricing, which takes into account factors such as institutional-size trading in similar groups of securities, yield, quality, coupon rate, maturity, type of issue, trading characteristics and other market data, as well as broker supplied prices. Investments by the funds in open-end mutual funds are valued at their respective NAVs each business day.
Other portfolio securities and assets, for which reliable market quotations are not readily available, are valued at fair value as determined in good faith by the funds’ Pricing Committee following procedures established by the Board of Trustees. The frequency with which these fair valuation procedures are used cannot be predicted and fair value of securities may differ significantly from the value that would have been used had a ready market for such securities existed.
The funds use a three-tier hierarchy to prioritize the pricing assumptions, referred to as inputs, used in valuation techniques to measure fair value. Level 1 includes securities valued using quoted prices in active markets for identical securities, including registered investment companies. Level 2 includes securities valued using other significant observable inputs. Observable inputs may include quoted prices for similar securities, interest rates, prepayment speeds and credit risk. Prices for securities valued using these inputs are received from independent pricing vendors and brokers and are based on an evaluation of the inputs described. Level 3 includes securities valued using significant unobservable inputs when market prices are not readily available or reliable, including the funds’ own assumptions in determining the fair value of investments. Factors used in determining value may include market or issuer specific events or trends, changes in interest rates and credit quality. The inputs or methodology used for valuing securities are not necessarily an indication of the risks associated with investing in those securities. Changes in valuation techniques and related inputs may result in transfers into or out of an assigned level within the disclosure hierarchy.
The following is a summary of the values by input classification of the funds’ investments as of October 31, 2021, by major security category or type:
| | Total
value at
10-31-21 | Level 1
quoted
price | Level 2
significant
observable
inputs | Level 3
significant
unobservable
inputs |
| Corporate Bond ETF | | | | |
| Investments in securities: | | | | |
| Assets | | | | |
| Corporate bonds | $20,046,665 | — | $20,046,665 | — |
| Short-term investments | 174,300 | $174,300 | — | — |
| Total investments in securities | $20,220,965 | $174,300 | $20,046,665 | — |
| |
| Mortgage-Backed Securities ETF | | | | |
| Investments in securities: | | | | |
| Assets | | | | |
| U.S. Government and Agency obligations | $9,667,060 | — | $9,667,060 | — |
| Collateralized mortgage obligations | 7,276,470 | — | 7,276,470 | — |
| Asset backed securities | 2,753,352 | — | 2,753,352 | — |
| Short-term investments | 263,297 | $263,297 | — | — |
| Total investments in securities | $19,960,179 | $263,297 | $19,696,882 | — |
| | SEMIANNUAL REPORT | JOHN HANCOCK FIXED INCOME ETFS | 17 |
Mortgage and asset backed securities. The funds may invest in mortgage-related securities, such as mortgage-backed securities, and other asset-backed securities, which are debt obligations that represent interests in pools of mortgages or other income-bearing assets, such as consumer loans or receivables. Such securities often involve risks that are different from the risks associated with investing in other types of debt securities. Mortgage-backed and other asset-backed securities are subject to changes in the payment patterns of borrowers of the underlying debt. When interest rates fall, borrowers are more likely to refinance or prepay their debt before its stated maturity. This may result in the funds having to reinvest the proceeds in lower yielding securities, effectively reducing the funds’ income. Conversely, if interest rates rise and borrowers repay their debt more slowly than expected, the time in which the mortgage-backed and other asset-backed securities are paid off could be extended, reducing the funds’ cash available for reinvestment in higher yielding securities. The timely payment of principal and interest of certain mortgage-related securities is guaranteed with the full faith and credit of the U.S. Government. Pools created and guaranteed by non-governmental issuers, including government-sponsored corporations (e.g. FNMA), may be supported by various forms of insurance or guarantees, but there can be no assurance that private insurers or guarantors can meet their obligations under the insurance policies or guarantee arrangements. The funds are also subject to risks associated with securities with contractual cash flows including asset-backed and mortgage related securities such as collateralized mortgage obligations, mortgage pass-through securities and commercial mortgage-backed securities. The value, liquidity and related income of these securities are sensitive to changes in economic conditions, including real estate value, pre-payments, delinquencies and/or defaults, and may be adversely affected by shifts in the market’s perception of the issuers and changes in interest rates.
Security transactions and related investment income. Investment security transactions are accounted for on a trade date plus one basis for daily NAV calculations. However, for financial reporting purposes, investment transactions are reported on trade date. Interest income is accrued as earned. Interest income includes coupon interest and amortization/accretion of premiums/discounts on debt securities. Debt obligations may be placed in a non-accrual status and related interest income may be reduced by stopping current accruals and writing off interest receivable when the collection of all or a portion of interest has become doubtful. Gains and losses on securities sold are determined on the basis of identified cost and may include proceeds from litigation.
Overdraft. The funds may have the ability to borrow from banks for temporary or emergency purposes, including meeting redemption requests that otherwise might require the untimely sale of securities. Pursuant to the funds’ custodian agreement, the custodian may loan money to the funds to make properly authorized payments. The funds are obligated to repay the custodian for any overdraft, including any related costs or expenses. The custodian may have a lien, security interest or security entitlement in any fund property that is not otherwise segregated or pledged, to the extent of any overdraft, and to the maximum extent permitted by law.
Line of credit. The funds and other affiliated funds have entered into a syndicated line of credit agreement with Citibank, N.A. as the administrative agent that enables them to participate in a $1 billion unsecured committed line of credit. Excluding commitments designated for a certain fund and subject to the needs of all other affiliated funds, a fund can borrow up to an aggregate commitment amount of $750 million, subject to asset coverage and other limitations as specified in the agreement. Prior to June 24, 2021, a fund could borrow up to an aggregate commitment amount of $850 million.
A commitment fee payable at the end of each calendar quarter, based on the average daily unused portion of each line of credit, is charged to each participating fund based on a combination of fixed and asset-based allocations and is reflected in Other expenses on the Statements of operations. For the period ended October 31, 2021, the funds had no borrowings under the line of credit.
Commitment fees for the period ended October 31, 2021 were as follows:
| Fund | Commitment fee |
| Corporate Bond ETF | $882 |
| Mortgage-Backed Securities ETF | 1 |
Expenses. Within the John Hancock group of funds complex, expenses that are directly attributable to an individual fund are allocated to such fund. Expenses that are not readily attributable to a specific fund are allocated among all funds in an equitable manner, taking into consideration, among other things, the nature and type of expense and the fund’s relative net assets. Expense estimates are accrued in the period to which they relate and adjustments are made when actual amounts are known.
Federal income taxes. Each fund intends to continue to qualify as a regulated investment company by complying with the applicable provisions of the Internal Revenue Code and will not be subject to federal income tax on taxable income that is distributed to shareholders. Therefore, no federal income tax provision is required.
As of April 30, 2021, the Corporate Bond ETF had no uncertain tax positions that would require financial statement recognition, derecognition or disclosure. The funds’ federal tax returns are subject to examination by the Internal Revenue Service for a period of three years.
For federal income tax purposes, the costs of investments owned on October 31, 2021, including short-term investments, were as follows:
| Fund | Aggregate
cost | Unrealized
appreciation | Unrealized
(depreciation) | Net unrealized
appreciation/
(depreciation) |
| Corporate Bond ETF | $19,873,511 | $397,514 | $(50,060) | $347,454 |
| Mortgage-Backed Securities ETF | 20,124,204 | 3,245 | (167,270) | (164,025) |
Distribution of income and gains. Distributions to shareholders from net investment income and net realized gains, if any, are recorded on the ex-date. The funds generally declare and pay dividends monthly. Capital gain distributions, if any, are typically distributed annually.
Such distributions, on a tax basis, are determined in conformity with income tax regulations, which may differ from US GAAP. Distributions in excess of tax basis earnings and profits, if any, are reported in the funds’ financial statements as a return of capital. The final determination of tax characteristics of the distribution will occur at the end of the year and will subsequently be reported to shareholders.
| 18 | JOHN HANCOCK FIXED INCOME ETFS | SEMIANNUAL REPORT | |
Capital accounts within the financial statements are adjusted for permanent book-tax differences. These adjustments have no impact on net assets or the results of operations. Temporary book-tax differences, if any, will reverse in a subsequent period. The Corporate Bond ETF had no material book-tax differences at April 30, 2021.
Note 3—Guarantees and indemnifications
Under the Trust’s organizational documents, its Officers and Trustees are indemnified against certain liabilities arising out of the performance of their duties to the Trust, including the funds. Additionally, in the normal course of business, the Trust enters into contracts with service providers that contain general indemnification clauses. The Trust’s maximum exposure under these arrangements is unknown, as this would involve future claims that may be made against the Trust that have not yet occurred. The risk of material loss from such claims is considered remote.
Note 4—Fees and transactions with affiliates
John Hancock Investment Management LLC (the Advisor) serves as investment advisor for the funds. The Advisor is an indirect, principally owned subsidiary of John Hancock Life Insurance Company (U.S.A.), which in turn is a subsidiary of Manulife Financial Corporation.
Management fee. The funds have an investment management agreement with the Advisor under which Corporate Bond ETF and Mortgage-Backed Securities ETF pays a monthly management fee to the Advisor equivalent on an annual basis to 0.24% and 0.34%, respectively, of average daily net assets. The Advisor has a subadvisory agreement with Manulife Investment Management (US) LLC, an indirectly owned subsidiary of Manulife Financial Corporation and an affiliate of the Advisor. The funds are not responsible for payment of the subadvisory fees.
The Advisor has contractually agreed to waive a portion of its management fee and/or reimburse expenses for certain funds of the John Hancock group of funds complex, including the funds (the participating portfolios). This waiver is based upon aggregate net assets of all the participating portfolios. The amount of the reimbursement is calculated daily and allocated among all the participating portfolios in proportion to the daily net assets of the funds. During the period ended October 31, 2021, this waiver amounted to 0.01% of the funds’ average daily net assets, on an annualized basis. This arrangement expires on July 31, 2023, unless renewed by mutual agreement of the fund and the Advisor based upon a determination that this is appropriate under the circumstances at that time.
The Advisor contractually agrees to reduce its management fee or, if necessary, make payment to Corporate Bond ETF and Mortgage-Backed Securities ETF, in an amount equal to the amount by which expenses of the funds exceed 0.29% and 0.39%, respectively, of average daily net assets. Expenses means all the expenses of the funds, excluding (a) taxes, (b) brokerage commissions, (c) interest expense, (d) litigation and indemnification expenses and other extraordinary expenses not incurred in the ordinary course of the fund’s business, (e) borrowing costs, (f) prime brokerage fees, (g) acquired fund fees and expenses paid indirectly, and (h) short dividend expense. This agreement expires on August 31, 2022, unless renewed by mutual agreement of the funds and the Advisor based upon a determination that this is appropriate under the circumstances at that time.
The expense reductions described above amount to the following for the period ended October 31, 2021.
| Fund | Expense reimbursement |
| Corporate Bond ETF | $54,620 |
| Fund | Expense reimbursement |
| Mortgage-Backed Securities ETF | $17,940 |
Expenses waived or reimbursed in the current fiscal period are not subject to recapture in future fiscal periods.
The investment management fees, including the impact of the waivers and reimbursements as described above, incurred for the period ended October 31, 2021, were equivalent to a net annual effective rate of the funds’ average daily net assets:
| Fund | Net Annual Effective Rate |
| Corporate Bond ETF | 0.00% |
| Fund | Net Annual Effective Rate |
| Mortgage-Backed Securities ETF | 0.00% |
Accounting and legal services. Pursuant to a service agreement, the funds reimburse the Advisor for all expenses associated with providing the administrative, financial, legal, compliance, accounting and recordkeeping services to the funds, including the preparation of all tax returns, periodic reports to shareholders and regulatory reports, among other services. These accounting and legal services fees incurred, for the period ended October 31, 2021, amounted to an annual rate of 0.02% of the funds’ average daily net assets.
Trustee expenses. The funds compensate each Trustee who is not an employee of the Advisor or its affiliates. The costs of paying Trustee compensation and expenses are allocated to each fund based on their net assets relative to other funds within the John Hancock group of funds complex.
Note 5—Capital share transactions
The funds will issue and redeem shares only in a large number of specified shares, each called a “creation unit,” or multiples thereof. The funds issue and redeem shares at NAV in creation units of 50,000 and 25,000 shares for Corporate Bond ETF and Mortgage-backed Securities, respectively.
Only authorized participants may engage in creation or redemption transactions directly with the funds. Such transactions generally take place when an authorized participant deposits into a fund a designated portfolio of securities and/or cash in exchange for a specified number of creation units. Similarly, shares can be redeemed only in creation units, generally for a designated portfolio of securities and/or cash. For purposes of US GAAP, in-kind redemption transactions are treated as a sale of securities and any resulting gains and losses are recognized based on the market value of the securities on the date of the transfer. Authorized participants pay a transaction fee to the custodian when purchasing and redeeming creation units of the funds. The transaction fee is used to defray the costs associated with the
| | SEMIANNUAL REPORT | JOHN HANCOCK FIXED INCOME ETFS | 19 |
issuance and redemption of creation units. Individual shares of the funds may only be purchased and sold in secondary market transactions through brokers. Secondary market transactions may be subject to brokerage commissions. Shares of the funds are listed and traded on the NYSE Arca, Inc., trade at market prices rather than NAV, and may trade at a price greater than or less than NAV.
Authorized participants transacting in creation or redemption of units for cash may also pay an additional variable charge to compensate the relevant fund for the costs associated with purchasing or selling the applicable securities. For the period ended October 31, 2021, such variable charges were $20,000 for Mortgage-Backed Securities ETF. These charges are included in shares sold or repurchased on the Statements of Changes in Net Assets.
Affiliates of Corporate Bond ETF and Mortgage-Backed Securities ETF owned 98% and 99%, respectively, of shares of the fund on October 31, 2021. Such concentration of shareholders’ capital could have a material effect on the fund if such shareholders redeem from the fund.
Note 6—Purchase and sale of securities
Purchases and sales of securities, other than short-term investments, amounted to the following for the six months ended October 31, 2021:
| | | |
| Fund | Purchases | Sales |
| Corporate Bond ETF | $3,835,960 | $3,911,845 |
| Mortgage-Backed Securities ETF | 24,043,117 | 4,105,760 |
Note 7—Industry or sector risk
The funds may invest a large percentage of their assets in one or more particular industries or sectors of the economy. If a large percentage of a fund’s assets are economically tied to a single or small number of industries or sectors of the economy, the funds will be less diversified than a more broadly diversified fund, and it may cause the fund to underperform if that industry or sector underperforms. In addition, focusing on a particular industry or sector may make the fund’s NAV more volatile. Further, a fund that invests in particular industries or sectors is particularly susceptible to the impact of market, economic, regulatory and other factors affecting those industries or sectors.
Note 8—Coronavirus (COVID-19) pandemic
The novel COVID-19 disease has resulted in significant disruptions to global business activity. A widespread health crisis such as a global pandemic could cause substantial market volatility, exchange trading suspensions and closures, which may lead to less liquidity in certain instruments, industries, sectors or the markets generally, and may ultimately affect fund performance.
Note 9—LIBOR discontinuation risk
LIBOR (London Interbank Offered Rate) is a measure of the average interest rate at which major global banks can borrow from one another. Following allegations of rate manipulation and concerns regarding its thin liquidity, in July 2017, the U.K. Financial Conduct Authority, which regulates LIBOR, announced that it will stop encouraging banks to provide the quotations needed to sustain LIBOR. As market participants transition away from LIBOR, LIBOR’s usefulness may deteriorate. The transition process may lead to increased volatility and illiquidity in markets that currently rely on LIBOR to determine interest rates. LIBOR’s deterioration may adversely affect the liquidity and/or market value of securities that use LIBOR as a benchmark interest rate.
The ICE Benchmark Administration Limited, the administrator of LIBOR, is expected to cease publishing most LIBOR maturities, including some US LIBOR maturities, on December 31, 2021, and the remaining and most liquid US LIBOR maturities on June 30, 2023. It is expected that market participants will transition to the use of alternative reference or benchmark rates prior to the applicable LIBOR publication cessation date. However, although regulators have encouraged the development and adoption of alternative rates such as the Secured Overnight Financing Rate ("SOFR"), the future utilization of LIBOR or of any particular replacement rate remains uncertain.
The impact on the transition away from LIBOR referenced financial instruments remains uncertain. It is expected that market participants will amend such financial instruments to include fallback provisions and other measures that contemplate the discontinuation of LIBOR. To facilitate the transition of legacy derivatives contracts referencing LIBOR, the International Swaps and Derivatives Association, Inc. launched a protocol to incorporate fallback provisions. There are obstacles to converting certain longer term securities to a new benchmark or benchmarks and the effectiveness of one versus multiple alternative reference rates has not been determined. Certain proposed replacement rates, such as SOFR, are materially different from LIBOR, and will require changes to the applicable spreads. Furthermore, the risks associated with the conversion from LIBOR may be exacerbated if an orderly transition is not completed in a timely manner.
Note 10—New accounting pronouncement
In March 2020, the Financial Accounting Standards Board (FASB) issued an Accounting Standards Update (ASU), ASU 2020-04, which provides optional, temporary relief with respect to the financial reporting of contracts subject to certain types of modifications due to the planned discontinuation of the LIBOR and other IBOR-based reference rates as of the end of 2021. The temporary relief provided by ASU 2020-04 is effective for certain reference rate-related contract modifications that occur during the period March 12, 2020 through December 31, 2022. Management is currently evaluating the potential impact of ASU 2020-04 to the financial statements.
| 20 | JOHN HANCOCK FIXED INCOME ETFS | SEMIANNUAL REPORT | |
EVALUATION OF ADVISORY AND SUBADVISORY AGREEMENTS BY THE BOARD OF TRUSTEES
Approval of Advisory and Subadvisory Agreements
At a videoconference1 meeting held on June 22-24, 2021, the Board of Trustees (the Board) of John Hancock Exchange-Traded Fund Trust (the Trust), including all of the Trustees who are not parties to any Agreement or considered to be interested persons of the Trust under the Investment Company Act of 1940, as amended (the 1940 Act) (the Independent Trustees), approved the establishment of John Hancock Mortgage-Backed Securities ETF (the New Fund). The Trustees who are not “interested persons” of the Trust as defined by the Investment Company Act of 1940, as amended (the “1940 Act”) (the “Independent Trustees”) also met separately to evaluate and discuss the information presented, including with counsel to the Independent Trustees.
This section describes the evaluation by the Board of:
(a)an amendment to the advisory agreement between the Trust and John Hancock Investment Management LLC (the Advisor) (the Advisory Agreement); and
(b)an amendment to the subadvisory agreement between the Advisor and Manulife Investment Management (US) LLC (the Subadvisor) with respect to the New Fund (the Subadvisory Agreement).
In considering the amendments to the Advisory Agreement and the Subadvisory Agreement with respect to the New Fund, the Board received in advance of the meeting a variety of materials relating to the New Fund, the Advisor and the Subadvisor, including comparative fee and expense information for a group of comparable exchange-traded funds, and other information regarding the nature, extent, and quality of services to be provided by the Advisor and the Subadvisor under their respective Agreements, as well as information regarding the Advisor’s anticipated revenues and costs of providing services in connection with its proposed relationship to the New Fund and any compensation paid to affiliates of the Advisor. The Board also took into account discussions with management and information provided to the Board (including its various committees) at prior meetings with respect to the services provided by the Advisor and the Subadvisor to other John Hancock Funds, including the services provided by the Advisor to other funds (the Funds), including quarterly performance reports prepared by management containing reviews of investment results, and periodic presentations from the Subadvisor with respect to the other Funds that it manages. The information received and considered by the Board in connection with the June meeting and throughout the year (with respect to other Funds) was both written and oral. The Board noted the affiliation of the Subadvisor with the Advisor, noting any potential conflicts of interest. The Board also considered the nature, quality, and extent of the non-advisory services, if any, to be provided to the New Fund by the Advisor and/or its affiliates, including administrative services. The Board also took into account information with respect to the New Fund presented at the March 23-25, 2021 meeting. The Board considered the Advisory Agreement and the Subadvisory Agreement separately in the course of its review. In doing so, the Board noted the respective roles of the Advisor and Subadvisor in providing services to the New Fund.
Throughout the process, the Board asked questions of and were afforded the opportunity to request additional information from management. The Board is assisted by counsel for the Trust, and the Independent Trustees are also separately assisted by independent legal counsel throughout the process. The Independent Trustees also received a memorandum from their independent legal counsel discussing the legal standards for their consideration of the proposed Advisory Agreement and Subadvisory Agreement and discussed the proposed Advisory Agreement and Subadvisory Agreement in private sessions with their independent legal counsel at which no representatives of management were present.
Approval of Advisory Agreement
In approving the Advisory Agreement with respect to the New Fund, the Board, including the Independent Trustees, considered a variety of factors, including those discussed below. The Board also considered other factors (including conditions and trends prevailing generally in the economy, the securities markets and the industry) and did not treat any single factor as determinative, and each Trustee may have attributed different weights to different factors. The Board’s conclusions may have been based in part on its consideration of the advisory and subadvisory arrangements for other Funds in prior years.
Nature, extent, and quality of services. Among the information received by the Board from the Advisor relating to the nature, extent, and quality of services to be provided to the New Fund, the Board reviewed information provided by the Advisor relating to its operations and personnel, descriptions of its organizational and management structure, and information regarding the Advisor’s compliance and regulatory history, including its Form ADV. The Board also noted that on a regular basis it receives and reviews information from the Trust’s Chief Compliance Officer (CCO) regarding the Funds’ compliance policies and procedures established pursuant to Rule 38a-1 under the 1940 Act. The Board considered the investment strategy proposed for the New Fund. The Board observed that the scope of services provided by the Advisor, and of the undertakings required of the Advisor in connection with those services, including maintaining and monitoring its own and the New Fund’s compliance programs, risk management programs, liquidity management programs and cybersecurity programs, had expanded over time as a result of regulatory, market and other developments. The Board considered that the Advisor would be responsible for the management of the day-to-day operations of the New Fund, including, but not limited to, general supervision and coordination of the services to be provided by the Subadvisor, and also would be responsible for monitoring and reviewing the activities of the Subadvisor and third-party service providers, including the New Fund’s distributor. The Board also considered the significant risks assumed by the Advisor in connection with the services to be provided to the New Fund including entrepreneurial risk in sponsoring new funds and ongoing risks including investment, operational, enterprise, litigation, regulatory and compliance risks with respect to all funds.
1 On June 19, 2020, as a result of health and safety measures put in place to combat the global COVID-19 pandemic, the Securities and Exchange Commission (the “SEC”) issued an exemptive order (the “Order”) pursuant to Sections 6(c) and 38(a) of the Investment Company Act of 1940, as amended (the “1940 Act”), which has been extended indefinitely until such time as public notice may be issued sunsetting the order, that temporarily exempts registered investment management companies from the in-person voting requirements under the 1940 Act, subject to certain requirements, including that votes taken pursuant to the Order are ratified at the next in-person meeting. The Board determined that reliance on the Order was necessary or appropriate due to the circumstances related to current or potential effects of COVID-19 and therefore, the Board’s June 22-24, 2021 meeting was held via videoconference in reliance on the Order. This exemptive order supersedes, in part, a similar, earlier exemptive order issued by the SEC.
| | SEMIANNUAL REPORT | JOHN HANCOCK FIXED INCOME ETFS | 21 |
In considering the nature, extent, and quality of the services to be provided by the Advisor, the Trustees also took into account their knowledge of the Advisor’s management of other Funds and the quality of the performance of the Advisor’s duties with respect to other Funds, through Board meetings, discussions and reports during the preceding year and through each Trustee’s experience as a Trustee of the Trust and of the other trusts in the John Hancock group of funds complex (the John Hancock Fund Complex).
In the course of their deliberations regarding the Advisory Agreement, the Board considered, among other things:
(a)the skills and competency with which the Advisor has in the past managed the Trust’s affairs and its subadvisory relationships, including those with the Subadvisor, the Advisor’s oversight and monitoring of the Subadvisor’s investment performance and compliance programs, such as the Subadvisor’s compliance with fund policies and objectives, review of brokerage matters, including with respect to trade allocation and best execution and the Advisor’s timeliness in responding to performance issues;
(b)the background, qualifications and skills of the Advisor’s personnel;
(c)the Advisor’s compliance policies and procedures and its responsiveness to regulatory changes and fund industry developments;
(d)the Advisor’s administrative capabilities, including its ability to supervise the other service providers for the New Fund, as well as the Advisor’s oversight of any securities lending activity, its monitoring of class action litigation and collection of class action settlements on behalf of the New Fund, and bringing loss recovery actions on behalf of the New Fund;
(e)the financial condition of the Advisor and whether it has the financial wherewithal to provide a high level and quality of services to the New Fund;
(f)the Advisor’s initiatives intended to improve various aspects of the Trust’s operations and investor experience with the New Fund; and
(g)the Advisor’s reputation and experience in serving as an investment advisor to the Trust, and the benefit to shareholders of investing in funds that are part of a family of funds offering a variety of investments.
The Board concluded that the Advisor may reasonably be expected to continue to provide a high quality of services under the Advisory Agreement with respect to the fund.
Investment performance. In connection with its consideration of the Advisory Agreement, the Board considered the New Fund’s investment strategy and processes. The Board also considered the experience of the portfolio management team that would be responsible for managing the New Fund’s assets.
Fees and expenses. The Board reviewed comparative information including, among other data, the New Fund’s anticipated total net expenses as compared to similarly situated exchange-traded funds deemed to be comparable to the New Fund in light of the nature, extent and quality of the management and advisory and subadvisory services provided by the Advisor and the Subadvisor. The Board noted that the New Fund’s anticipated net expense ratio would be lower than the median and average of the peer group.
The Board took into account management’s discussion of the New Fund’s anticipated expenses. The Board also took into account management’s discussion with respect to the proposed management fee and the fees of the Subadvisor, including the amount of the advisory fee to be retained by the Advisor after payment of the subadvisory fee, in each case in light of the services rendered for those amounts and the risks undertaken by the Advisor. The Board also noted that the Advisor, and not the New Fund, would be responsible for paying the subadvisory fees. The Board also took into account that management has agreed to implement an overall fee waiver across a number of funds in the complex, including the New Fund, which is discussed further below. The Board also noted that the Advisor has contractually agreed to waive fees and/or reimburse expenses with respect to the New Fund for a specified period. The Board reviewed information provided by the Advisor concerning the investment advisory fee charged by the Advisor or one of its advisory affiliates to other clients (including other funds in the John Hancock Fund Complex) having similar investment mandates, if any. The Board considered any differences between the Advisor’s and Subadvisor’s services to the fund and the services they provide to other comparable clients or funds. The Board concluded that the advisory fees to be paid by the New Fund are reasonable in light of the nature, extent and quality of the services expected to be provided to the New Fund under the Advisory Agreement.
Profitability/Fall out benefits. In considering the costs of the services to be provided and the profits to be realized by the Advisor and its affiliates from the Advisor’s relationship with the New Fund, the Board:
(a)noted that because the New Fund was not yet in existence, no actual revenue, cost or profitability data was available for the Board to review, although the Board received information from the Adviser on its projected profitability with respect to the New Fund;
(b)reviewed and considered information presented by the Advisor regarding the advisory fees and advisory spreads prior to distribution, operations and overhead for the New Fund;
(c)noted that the Advisor will derive reputational and other indirect benefits from providing advisory services to the New Fund;
(d)noted that the subadvisory fee for the New Fund will be paid by Advisor;
(e)noted that the New Fund’s Subadvisor is an affiliate of the Advisor;
(f)considered the Advisor’s ongoing costs and expenditures necessary to improve services, meet new regulatory and compliance requirements, and adapt to other challenges impacting the fund industry; and
(g)considered that the Advisor should be entitled to earn a reasonable level of profits in exchange for the level of services it will provide to the New Fund and the risks that it assumes as Advisor, including entrepreneurial, operational, reputational, litigation and regulatory risk.
| 22 | JOHN HANCOCK FIXED INCOME ETFS | SEMIANNUAL REPORT | |
Based upon its review, the Board concluded that the anticipated level of profitability, if any, of the Advisor and its affiliates from their relationship with the New Fund is reasonable and not excessive.
Economies of scale. In considering the extent to which economies of scale would be realized if the New Fund grows and whether fee levels reflect these economies of scale for the benefit of fund shareholders, the Board:
(a)considered that the Advisor has contractually agreed to waive a portion of its management fee for certain funds of the John Hancock Fund Complex, including the New Fund (the participating portfolios) or otherwise reimburse the expenses of the participating portfolios (the reimbursement). This waiver is based upon aggregate net assets of all the participating portfolios. The amount of the reimbursement is calculated daily and allocated among all the participating portfolios in proportion to the daily net assets of each fund;
(b)took into account management’s discussion of the New Fund’s advisory fee structure; and
(c)the Board also noted that if the New Fund’s assets increase over time, the New Fund may realize other economies of scale.
Approval of Subadvisory Agreement
In making its determination with respect to approval of the Subadvisory Agreement, the Board reviewed:
(a)information relating to the Subadvisor’s business, including current subadvisory services to the Trust (and other funds in the John Hancock Fund Complex); and
(b)the proposed subadvisory fee for the New Fund, including any breakpoints.
Nature, extent, and quality of services. With respect to the services to be provided by the Subadvisor, the Board received and reviewed information provided to the Board by the Subadvisor with respect to the New Fund and took into account information presented throughout the past year with respect to Funds in the complex managed by the Advisor and subadvised by the Subadvisor. In this regard, the Board considered the Subadvisor’s current level of staffing and its overall resources, as well as considered information relating to the Subadvisor’s compensation program. The Board reviewed the Subadvisor’s history and investment experience, as well as information regarding the qualifications, background, and responsibilities of the Subadvisor’s investment and compliance personnel who will provide services to the New Fund. The Board also considered the Subadvisor’s risk assessment and monitoring processes. The Board reviewed the Subadvisor’s regulatory history, including whether it was involved in any regulatory actions or investigations as well as material litigation, and any settlements and amelioratory actions undertaken, as appropriate. The Board noted that the Advisor conducts regular periodic reviews of the Subadvisor and its operations in regard to the Funds, including regarding investment processes and organizational and staffing matters. The Board also noted that the Trust’s CCO and his staff conduct regular, periodic compliance reviews with the Subadvisor and present reports to the Independent Trustees regarding the same, which includes evaluating the regulatory compliance systems of the Subadvisor and procedures reasonably designed to assure compliance with the federal securities laws. The Board also took into account the financial condition of the Subadvisor.
The Board considered the Subadvisor’s investment process and philosophy. The Board also considered the experience of the portfolio management team that would be responsible for managing the New Fund’s assets.
Subadvisor compensation. In considering the cost of services to be provided by the Subadvisor and the profitability to the Subadvisor of its relationship with the New Fund, the Board noted that the fees under the Subadvisory Agreement will be paid by the Advisor and not the New Fund. The Board also received information and took into account any other potential conflicts of interest the Advisor might have in connection with the Subadvisory Agreement.
In addition, the Board considered other potential indirect benefits that the Subadvisor and its affiliates may receive from the Subadvisor’s relationship with the New Fund, such as the opportunity to provide advisory services to additional funds in the John Hancock Fund Complex and reputational benefits.
Subadvisory fees. The Board considered that the New Fund will pay an advisory fee to the Advisor and that, in turn, the Advisor will pay a subadvisory fee to the Subadvisor.
Subadvisor performance. As noted above, the Board considered the New Fund’s investment strategy and processes. The Board noted the Advisor’s expertise and resources in monitoring the performance, investment style and risk-adjusted performance of the Subadvisor. The Board was mindful of the Advisor’s focus on the Subadvisor’s performance.
The Board’s decision to approve the Subadvisory Agreement was based on a number of determinations, including the following:
(1)Subadvisor has extensive experience and demonstrated skills as a manager, and currently subadvises other Funds in the complex and the Board is generally satisfied with the Subadvisor’s management of these Funds, and may reasonably be expected to provide a high quality of investment management services to the New Fund;
(2)the proposed subadvisory fees are reasonable in relation to the level and quality of services to be provided under the Subadvisory Agreement; and
(3)that the subadvisory fees will be paid by the Advisor not the New Fund.
***
| | SEMIANNUAL REPORT | JOHN HANCOCK FIXED INCOME ETFS | 23 |
Based on the Board’s evaluation of all factors that it deemed to be material, including those factors described above, and assisted by the advice of independent legal counsel, the Board, including the Independent Trustees, concluded that approval of the Advisory Agreement and the Subadvisory Agreement would be in the best interest of the New Fund and its shareholders. Accordingly, the Board, and the Independent Trustees voting separately, approved the amendments to the Advisory Agreement and Subadvisory Agreement.
| 24 | JOHN HANCOCK FIXED INCOME ETFS | SEMIANNUAL REPORT | |
Trustees
Hassell H. McClellan, Chairperson
Steven R. Pruchansky, Vice Chairperson
Andrew G. Arnott†
Charles L. Bardelis*
James R. Boyle
Peter S. Burgess*
William H. Cunningham
Grace K. Fey
Marianne Harrison†
Deborah C. Jackson
Frances G. Rathke*
Gregory A. Russo
Officers
Andrew G. Arnott
President
Charles A. Rizzo
Chief Financial Officer
Salvatore Schiavone
Treasurer
Christopher (Kit) Sechler
Secretary and Chief Legal Officer
Trevor Swanberg
Chief Compliance Officer
* Member of the Audit Committee
† Non-Independent Trustee
Investment advisor
John Hancock Investment Management LLC
Subadvisor
Manulife Investment Management (US) LLC
Portfolio Managers
The Investment Team at Manulife IM (US)
Principal distributor
Foreside Fund Services, LLC
Custodian
State Street Bank and Trust Company
Transfer agent
State Street Bank and Trust Company
Legal counsel
Dechert LLP
The funds’ proxy voting policies and procedures, as well as the funds’ proxy voting record for the most recent twelve-month period ended June 30, are available free of charge on the Securities and Exchange Commission (SEC) website at sec.gov or on our website.
All of the funds’ holdings as of the end of the third month of every fiscal quarter are filed with the SEC on Form N-PORT within 60 days of the end of the fiscal quarter. The funds’ Form N-PORT filings are available on our website and the SEC’s website, sec.gov.
We make this information on your funds’, as well as monthly portfolio holdings, and other funds’ details available on our website at jhinvestments.com/etf or by calling 800-225-6020.
| You can also contact us: | |
| 800-225-6020 | Regular mail: |
| jhinvestments.com/etf | John Hancock Investment Management
200 Berkeley Street
Boston, MA 02116 |
| | SEMIANNUAL REPORT | JOHN HANCOCK FIXED INCOME ETFS | 25 |
John Hancock family of funds
U.S. EQUITY FUNDS
Blue Chip Growth
Classic Value
Disciplined Value
Disciplined Value Mid Cap
Equity Income
Financial Industries
Fundamental All Cap Core
Fundamental Large Cap Core
Mid Cap Growth
New Opportunities
Regional Bank
Small Cap Core
Small Cap Growth
Small Cap Value
U.S. Global Leaders Growth
U.S. Growth
INTERNATIONAL EQUITY FUNDS
Disciplined Value International
Emerging Markets
Emerging Markets Equity
Fundamental Global Franchise
Global Environmental Opportunities
Global Equity
Global Shareholder Yield
Global Thematic Opportunities
International Dynamic Growth
International Growth
International Small Company
FIXED-INCOME FUNDS
Bond
California Tax-Free Income
Emerging Markets Debt
Floating Rate Income
Government Income
High Yield
High Yield Municipal Bond
Income
Investment Grade Bond
Money Market
Opportunistic Fixed Income
Short Duration Bond
Short Duration Credit Opportunities
Strategic Income Opportunities
Tax-Free Bond
ALTERNATIVE FUNDS
Absolute Return Currency
Alternative Asset Allocation
Diversified Macro
Infrastructure
Multi-Asset Absolute Return
Real Estate Securities
Seaport Long/Short
A fund’s investment objectives, risks, charges, and expenses should be considered carefully before investing. The prospectus contains this and other important information about the fund. To obtain a prospectus, contact your financial professional, call John Hancock Investments at 800-225-5291, or visit our website at jhinvestments.com. Please read the prospectus carefully before investing or sending money.
EXCHANGE-TRADED FUNDS
John Hancock Corporate Bond ETF
John Hancock Mortgage-Backed Securities ETF
John Hancock Multifactor Consumer Discretionary ETF
John Hancock Multifactor Consumer Staples ETF
John Hancock Multifactor Developed International ETF
John Hancock Multifactor Emerging Markets ETF
John Hancock Multifactor Energy ETF
John Hancock Multifactor Financials ETF
John Hancock Multifactor Healthcare ETF
John Hancock Multifactor Industrials ETF
John Hancock Multifactor Large Cap ETF
John Hancock Multifactor Materials ETF
John Hancock Multifactor Media and
Communications ETF
John Hancock Multifactor Mid Cap ETF
John Hancock Multifactor Small Cap ETF
John Hancock Multifactor Technology ETF
John Hancock Multifactor Utilities ETF
ENVIRONMENTAL, SOCIAL, AND
GOVERNANCE FUNDS
ESG Core Bond
ESG International Equity
ESG Large Cap Core
ASSET ALLOCATION/TARGET DATE FUNDS
Balanced
Multi-Asset High Income
Multi-Index Lifetime Portfolios
Multi-Index Preservation Portfolios
Multimanager Lifestyle Portfolios
Multimanager Lifetime Portfolios
Retirement Income 2040
CLOSED-END FUNDS
Financial Opportunities
Hedged Equity & Income
Income Securities Trust
Investors Trust
Preferred Income
Preferred Income II
Preferred Income III
Premium Dividend
Tax-Advantaged Dividend Income
Tax-Advantaged Global Shareholder Yield
John Hancock ETF shares are bought and sold at market price (not NAV), and are not individually redeemed from the fund. Brokerage commissions will reduce returns.
John Hancock ETFs are distributed by Foreside Fund Services, LLC, and are subadvised by Manulife Investment Management (US) LLC or Dimensional Fund Advisors LP. Foreside is not affiliated with John Hancock Investment Management Distributors LLC, Manulife Investment Management (US) LLC or Dimensional Fund Advisors LP.
Dimensional Fund Advisors LP receives compensation from John Hancock in connection with licensing rights to the John Hancock Dimensional indexes. Dimensional Fund Advisors LP does not sponsor, endorse, or sell, and makes no representation as to the advisability of investing in, John Hancock Multifactor ETFs.
A trusted brand
John Hancock Investment Management is a premier asset manager
with a heritage of financial stewardship dating back to 1862. Helping
our shareholders pursue their financial goals is at the core of everything
we do. It’s why we support the role of professional financial advice
and operate with the highest standards of conduct and integrity.
A better way to invest
We serve investors globally through a unique multimanager approach:
We search the world to find proven portfolio teams with specialized
expertise for every strategy we offer, then we apply robust investment
oversight to ensure they continue to meet our uncompromising
standards and serve the best interests of our shareholders.
Results for investors
Our unique approach to asset management enables us to provide
a diverse set of investments backed by some of the world’s best
managers, along with strong risk-adjusted returns across asset classes.
“A trusted brand” is based on a survey of 6,651 respondents conducted by Medallia between 3/18/20 and 5/13/20.
John Hancock Investment Management LLC, 200 Berkeley Street, Boston, MA 02116, 800-225-6020, jhinvestments.com/etf
Manulife Investment Management, the Stylized M Design, and Manulife Investment Management & Stylized M Design are trademarks of The Manufacturers Life Insurance Company and are used by its affiliates under license.
NOT FDIC INSURED. MAY LOSE VALUE. NO BANK GUARANTEE. NOT INSURED BY ANY GOVERNMENT AGENCY.
This report is for the information of the shareholders of John Hancock Fixed Income ETFs. It is not authorized for distribution to prospective investors unless preceded or accompanied by a prospectus.
| JHAN-20180615-0136 | ETF2SA 10/2021 |
12/2021
ITEM 2. CODE OF ETHICS.
(a)Not Applicable
(b)Not Applicable
(c)Not Applicable
(d)Not Applicable
(e)Not Applicable
(f)Not Applicable
ITEM 3. AUDIT COMMITTEE FINANCIAL EXPERT.
Not Applicable
ITEM 4. PRINCIPAL ACCOUNTANT FEES AND SERVICES.
(a)Not Applicable
(b)Not Applicable
(c)Not Applicable
(d)Not Applicable
(e)Not Applicable
(f)Not Applicable
(g)Not Applicable
(h)Not Applicable
ITEM 5. AUDIT COMMITTEE OF LISTED REGISTRANTS.
Not applicable at this time.
ITEM 6. SCHEDULE OF INVESTMENTS.
(a)Not applicable.
(b)Not applicable.
ITEM 7. DISCLOSURE OF PROXY VOTING POLICIES AND PROCEDURES FOR CLOSED- END MANAGEMENT INVESTMENT COMPANIES.
Not applicable.
ITEM 8. PORTFOLIO MANAGERS OF CLOSED-END MANAGEMENT INVESTMENT COMPANIES.
Not applicable.
ITEM 9. PURCHASES OF EQUITY SECURITIES BY CLOSED-END MANAGEMENT INVESTMENT COMPANY AND AFFILIATED PURCHASERS.
Not applicable.
ITEM 10. SUBMISSION OF MATTERS TO A VOTE OF SECURITY HOLDERS.
The registrant has adopted procedures by which shareholders may recommend nominees to the registrant's Board of Trustees. A copy of the procedures is filed as an exhibit to this Form N-CSR. See attached "John Hancock Funds – Nominating and Governance Committee Charter."
ITEM 11. CONTROLS AND PROCEDURES.
(a)Based upon their evaluation of the registrant's disclosure controls and procedures as
conducted within 90 days of the filing date of this Form N-CSR, the registrant's principal executive
officer and principal financial officer have concluded that those disclosure controls and procedures provide reasonable assurance that the material information required to be disclosed by the registrant on this report is recorded, processed, summarized and reported within the time periods specified in the Securities and Exchange Commission's rules and forms.
(b)There were no changes in the registrant's internal control over financial reporting that occurred during the period covered by this report that have materially affected, or are reasonably likely to materially affect, the registrant's internal control over financial reporting.
ITEM 12. DISCLOSURE OF SECURITIES LENDING ACTIVITIES FOR CLOSED-END MANAGEMENT INVESTMENT COMPANIES.
Not applicable.
ITEM 13. EXHIBITS.
(a)(1) Separate certifications for the registrant's principal executive officer and principal financial officer, as required by Section 302 of the Sarbanes-Oxley Act of 2002 and Rule 30a-2(a) under the Investment Company Act of 1940, are attached.
(b) Separate certifications for the registrant's principal executive officer and principal financial officer, as required by 18 U.S.C. Section 1350, as adopted pursuant to Section 906 of the Sarbanes-Oxley Act of 2002, and Rule 30a-2(b) under the Investment Company Act of 1940, are attached. The certifications furnished pursuant to this paragraph are not deemed to be "filed" for purposes of Section 18 of the Securities Exchange Act of 1934, or otherwise subject to the liability of that section. Such certifications are not deemed to be incorporated by reference into any filing under the Securities Act of 1933 or the Securities Exchange Act of 1934, except to the extent that the Registrant specifically incorporates them by reference.
(c)(1) Submission of Matters to a Vote of Security Holders is attached. See attached "John Hancock Funds – Nominating and Governance Committee Charter."
SIGNATURES
Pursuant to the requirements of the Securities Exchange Act of 1934 and the Investment Company Act of 1940, the registrant has duly caused this report to be signed on its behalf by the undersigned, thereunto duly authorized.
John Hancock Exchange-Traded Fund Trust
By: | /s/ Andrew Arnott |
| ------------------------------ |
| Andrew Arnott |
| President |
Date: | December 6, 2021 |
Pursuant to the requirements of the Securities Exchange Act of 1934 and the Investment Company Act of 1940, this report has been signed below by the following persons on behalf of the registrant and in the capacities and on the dates indicated.
By: | /s/ Andrew Arnott |
| ------------------------------ |
| Andrew Arnott |
| President |
Date: | December 6, 2021 |
By: | /s/ Charles A. Rizzo |
| ----------------------- |
| Charles A. Rizzo |
| Chief Financial Officer |
Date: | December 6, 2021 |