UNITED STATES
SECURITIES AND EXCHANGE COMMISSION
Washington, D.C. 20549
FORM N-CSR
CERTIFIED SHAREHOLDER REPORT OF
REGISTERED MANAGEMENT INVESTMENT COMPANIES
Investment Company Act file number 811-22391
Nuveen Build America Bond Fund
(Exact name of registrant as specified in charter)
Nuveen Investments
333 West Wacker Drive
Chicago, IL 60606
(Address of principal executive offices) (Zip code)
Kevin J. McCarthy
Nuveen Investments
333 West Wacker Drive
Chicago, IL 60606
(Name and address of agent for service)
Registrant's telephone number, including area code: (312) 917-7700
Date of fiscal year end: March 31
Date of reporting period: March 31, 2011
Form N-CSR is to be used by management investment companies to file reports with the Commission not later than 10 days after the transmission to stockholders of any report that is required to be transmitted to stockholders under Rule 30e-1 under the Investment Company Act of 1940 (17 CFR 270.30e-1). The Commission may use the information provided on Form N-CSR in its regulatory, disclosure review, inspection, and policymaking roles.
A registrant is required to disclose the information specified by Form N-CSR, and the Commission will make this information public. A registrant is not required to respond to the collection of information contained in Form N-CSR unless the Form displays a currently valid Office of Management and Budget ("OMB") control number. Please direct comments concerning the accuracy of the information collection burden estimate and any suggestions for reducing the burden to Secretary, Securities and Exchange Commission, 450 Fifth Street, NW, Washington, DC 20549-0609. The OMB has reviewed this collection of information under the clearance requirements of 44 U.S.C. ss. 3507.
ITEM 1. REPORTS TO STOCKHOLDERS.
INVESTMENT ADVISER NAME CHANGE
Effective January 1, 2011, Nuveen Asset Management, the Funds’ investment adviser, changed its name to Nuveen Fund Advisors, Inc. (“Nuveen Fund Advisors”). Concurrently, Nuveen Fund Advisors formed a wholly-owned subsidiary, Nuveen Asset Management, LLC, to house its portfolio management capabilities.
NUVEEN INVESTMENTS COMPLETES STRATEGIC COMBINATION WITH FAF ADVISORS
On December 31, 2010, Nuveen Investments completed the strategic combination between Nuveen Asset Management, LLC, the largest investment affiliate of Nuveen Investments, and FAF Advisors. As part of this transaction, U.S. Bancorp – the parent of FAF Advisors – received cash consideration and a 9.5% stake in Nuveen Investments in exchange for the long term investment business of FAF Advisors, including investment management responsibilities for the non-money market mutual funds of the First American Funds family.
The approximately $27 billion of mutual fund and institutional assets managed by FAF Advisors, along with the investment professionals managing these assets and other key personnel, have become part of Nuveen Asset Management, LLC. With these additions to Nuveen Asset Management, LLC, this affiliate now manages more than $100 billion of assets across a broad range of strategies from municipal and taxable fixed income to traditional and specialized equity investments.
This combination does not affect the investment objectives or strategies of the Funds in this report. Over time, Nuveen Investments expects that the combination will provide even more ways to meet the needs of investors who work with financial advisors and consultants by enhancing the multi-boutique model of Nuveen Investments, which also includes highly respected investment teams at HydePark, NWQ Investment Management, Santa Barbara Asset Management, Symphony Asset Management, Tradewinds Global Investors and Winslow Capital. Nuveen Investments managed approximately $206 billion of assets as of March 31, 2011.
Table of Contents
| | |
| Chairman’s Letter to Shareholders | 4 |
| Portfolio Manager’s Comments | 5 |
| Dividend and Share Price Information | 10 |
| Performance Overviews | 11 |
| Report of Independent Registered Public Accounting Firm | 13 |
| Portfolios of Investments | 14 |
| Statement of Assets and Liabilities | 25 |
| Statement of Operations | 26 |
| Statement of Changes in Net Assets | 27 |
| Statement of Cash Flows | 28 |
| Financial Highlights | 29 |
| Notes to Financial Statements | 32 |
| Board Members & Officers | 41 |
| Annual Investment Management Agreement Approval Process | 46 |
| Board Approval of Sub-Advisory Arrangements | 58 |
| Reinvest Automatically, Easily and Conveniently | 59 |
| Glossary of Terms Used in this Report | 61 |
| Other Useful Information | 63 |
Chairman’s
Letter to Shareholders
Dear Shareholders,
In 2010, the global economy recorded another year of recovery from the financial and economic crises of 2008, but many of the factors that caused the downturn still weigh on the prospects for continued improvement. In the U.S., ongoing weakness in housing values has put pressure on homeowners and mortgage lenders. Similarly, the strong earnings recovery for corporations and banks is only slowly being translated into increased hiring or more active lending. Globally, deleveraging by private and public borrowers has inhibited economic growth and that process is far from complete.
Encouragingly, constructive actions are being taken by governments around the world to deal with economic issues. In the U.S., the recent passage of a stimulatory tax bill relieved some of the pressure on the Federal Reserve to promote economic expansion through quantitative easing and offers the promise of sustained economic growth. A number of European governments are undertaking programs that could significantly reduce their budget deficits. Governments across the emerging markets are implementing various steps to deal with global capital flows without undermining international trade and investment.
The success of these government actions could determine whether 2011 brings further economic recovery and financial market progress. One risk associated with the extraordinary efforts to strengthen U.S. economic growth is that the debt of the U.S. government will continue to grow to unprecedented levels. Another risk is that over time there could be inflationary pressures on asset values in the U.S. and abroad, because what happens in the U.S. impacts the rest of the world economy. Also, these various actions are being taken in a setting of heightened global economic uncertainty, primarily about the supplies of energy and other critical commodities. In this challenging environment, your Nuveen investment team continues to seek sustainable investment opportunities and to remain alert to potential risks in a recovery still facing many headwinds. On your behalf, we monitor their activities to assure they maintain their investment disciplines.
As you will note elsewhere in this report, on December 31, 2010, Nuveen Investments completed a strategic combination with FAF Advisors, Inc., the manager of the First American Funds. The combination adds highly respected and distinct investment teams to meet the needs of investors and their advisors and is designed to benefit all fund shareholders by creating a fund organization with the potential for further economies of scale and the ability to draw from even greater talent and expertise to meet those investor needs.
As of the end of April, 2011, Nuveen Investments had completed the refinancing of all of the Auction Rate Preferred Securities issued by its taxable closed-end funds and 89% of the MuniPreferred shares issued by its tax-exempt closed-end funds. Please consult the Nuveen Investments web site, www.Nuveen.com, for the current status of this important refinancing program.
As always, I encourage you to contact your financial consultant if you have any questions about your investment in a Nuveen Fund. On behalf of the other members of your Fund Board, we look forward to continuing to earn your trust in the months and years ahead.
Sincerely,
Robert P. Bremner
Chairman of the Board
May 19, 2011
4 Nuveen Investments
Portfolio Manager’s Comments
Nuveen Build America Bond Fund (NBB)
Nuveen Build America Bond Opportunity Fund (NBD)
Portfolio manager Daniel Close discusses U.S. economic and municipal market conditions, key investment strategies and the performance of the Nuveen Build America Bond Fund (NBB) and the Nuveen Build America Bond Opportunity Fund (NBD). Dan, who joined Nuveen in 2000, has managed NBB since its inception in April 2010 and NBD since its inception in November 2010.
What factors affected the U.S. economy and municipal market during the reporting period ended March 31, 2011?
During this period, the U.S. economy demonstrated some signs of improvement, supported by the efforts of both the Federal Reserve (Fed) and the federal government. For its part, the Fed continued to hold the benchmark fed funds rate in a target range of zero to 0.25% since cutting it to this record low level in December 2008. At its April 2011 meeting (following the end of this reporting period), the central bank renewed its commitment to keeping the fed funds rate at “exceptionally low levels” for an “extended period.” The Fed also left unchanged its second round of quantitative easing, which calls for purchasing $600 billion in longer-term U.S. Treasury bonds by June 30, 2011. The goal of this plan is to lower long-term interest rates and thereby stimulate economic activity and create jobs. The federal government continued to focus on implementing the economic stimulus package passed in early 2009 aimed at providing job creation, tax relief, fiscal assistance to state and local governments and expansion of unemployment benefits and other federal social welfare programs.
In the first quarter of 2011, the U.S. economy, as measured by the U.S. gross domestic product (GDP), grew at an annualized rate of 1.8%, marking the seventh consecutive quarter of positive growth. The employment picture continued to improve gradually, with the national jobless rate registering 8.8% in March 2011, its lowest level since March 2009 and down from 9.7% a year earlier. While the Fed’s longer-term inflation expectations remained stable, inflation posted its largest twelve month gain since December 2009, as the Consumer Price Index (CPI) rose 2.7% year-over-year as of March 2011, driven mainly by increased prices for energy. The core CPI (which excludes food and energy) increased 1.2% over this period, staying within the Fed’s unofficial objective of 2.0% or lower for this measure. The housing market continued to be a weak spot in the economy. For the twelve months ended February 2011 (most recent data available at the time this report was prepared), the average home price in the Standard & Poor’s (S&P) Case-Shiller index of 20 major metropolitan areas lost 3.3%, with 10 of the 20 metropolitan areas hitting their lowest levels since housing prices peaked in 2006.
Certain statements in this report are forward-looking statements. Discussions of specific investments are for illustration only and are not intended as recommendations of individual investments. The forward-looking statements and other views expressed herein are those of the portfolio manager as of the date of this report. Actual future results or occurrences may differ significantly from those anticipated in any forward-looking statements and the views expressed herein are subject to change at any time, due to numerous market and other factors. The Funds disclaim any obligation to update publicly or revise any forward-looking statements or views expressed herein.
Any reference to credit ratings for portfolio holdings denotes the highest rating assigned by a Nationally Recognized Statistical Rating Organization (NRSRO) such as Standard & Poor’s (S&P), Moody’s or Fitch. AAA, AA, A and BBB ratings are investment grade; BB, B, CCC, CC, C and D ratings are below investment grade. Holdings and ratings may change over time.
Nuveen Investments 5
Looking at the overall municipal market, bond prices generally rose during this period, as the combination of strong demand and tight supply of new tax-exempt issuance created favorable market conditions. After rallying strongly over most of the period, the municipal market suffered a reversal in mid-November 2010, due largely to investor concerns about inflation, the federal deficit and the deficit’s impact on demand for U.S. Treasuries. Adding to this situation was media coverage of the strained finances of many state and local governments, which often failed to differentiate between gaps in these governments’ operating budgets and their ability to meet their debt service obligation. Toward the end of this period, we saw the environment in the municipal market improve, as crossover buyers—including hedge funds and life insurance companies—were attracted by municipal bond prices and tax-exempt yields, resulting in decreased outflows, declining yields and rising valuations.
What key strategies were used to manage NBB and NBD during this period?
The inception date for NBB was April 27, 2010, and for NBD it was November 23, 2010. Both NBB and NBD are designed to invest primarily in Build America Bonds (BABs) and other taxable municipal bonds. Bonds issued under the Build America Bond program, which ended December 31, 2010, offered municipal issuers a federal subsidy equal to 35% of a bond’s interest payments, often providing issuers with a lower-cost alternative to traditional tax-exempt debt.
The primary investment objective of these two Funds is to provide current income through investments in taxable municipal securities. Their secondary objective is to seek enhanced portfolio value and total return. The Funds offer strategic portfolio diversification opportunities for traditional municipal bond investors, while broadening participation to investors that have not traditionally purchased municipal bonds, including public and corporate retirement plans, endowments, life insurance companies, and sovereign wealth funds. For these investors, these Funds can offer investment-grade municipal credit, current income, and strong call protection.
Both NBB and NBD completed their initial investment process during this reporting period. Between April 2010, when NBB was introduced, and the end of the BAB program in December 2010, BAB issuance totaled $90.5 billion. Issuance was particularly heavy during the fourth quarter of 2010, as issuers uncertain about the extension of the BAB program sought to take advantage of the program’s terms before it expired. During this period, $44.1 billion in BABs were issued, accounting for 33% of new bonds issued in the municipal market. Within the 21 months between the first BAB issue in April 2009 and the last BAB issue in December 2010, $181.4 billion of Build America Bonds were issued. The secondary market for BABs continues to be active.
The ample supply of BAB issuance during the invest-up enabled us to purchase a good balance of BABs in both the primary (new issue) and secondary markets. Under the provisions of the Build America Bond program, only governmental entities could issue BABs. Issuance was heaviest in the general purpose/public improvement, education, transportation, and utilities sectors. Nonprofit 501(c)(3) organizations such as hospitals generally did not qualify as BABs issuers, limiting the availability of these bonds. Bonds with proceeds
6 Nuveen Investments
earmarked for refundings, working capital and private activities also were not covered by the BAB program. By the end of the program, all states except Montana and Rhode Island had issued BABs, with California, New York, Texas, Illinois and Ohio at the forefront in terms of issuance, followed by New Jersey, Washington, Pennsylvania, Florida and Georgia. This enabled us to add geographic diversity to the Funds. The majority of our purchases were at the long end of the yield curve.
During NBB’s invest-up period, we purchased a good mix of benchmark and non-benchmark BAB issues. Benchmark BAB issues are bonds whose cusip is over $250 million in size and therefore eligible for inclusion in the Barclays Capital Build America Bond (BAB) Index. Non-benchmark BAB issues are smaller, generally lower-profile issuers that can offer the same credit quality as benchmark issues, but may require a more detailed credit review before purchase. As part of its investment strategies, NBB uses an integrated leverage and hedging strategy to seek to enhance current income and total return, while working to maintain a level of interest rate risk similar to that of the Barclays Capital BAB Index. To implement leverage, NBB uses both bank borrowings and inverse floating rate securities. Duration shortening hedges, which can include shorting U.S. Treasury futures or long LIBOR swaps, were used to reduce the leverage-adjusted portfolio duration to a level close to that of the index. NBB’s integrated leverage strategy is discussed further on page nine.
After the completion of NBB’s invest-up period, we focused primarily on improving the Fund’s liquidity profile by purchasing additional benchmark, or index-eligible, BAB issues. These bonds, which were in good supply in the primary market during the fourth quarter of 2010, are currently in greater demand than non-benchmark issues and should be more liquid on a going-forward basis. Purchases were funded with the proceeds from sales of non-benchmark issues. Following the end of new issue BABs, we continued to sell non-benchmark and other non-BAB bonds and purchase BABs in the secondary market, focusing on adding benchmark issues where we had favorable credit opinions while these bonds were still readily available in the market.
During the last half of this period, we also shifted more of NBB’s leverage from bank borrowings to inverse floating rate securities. In our opinion, these securities currently offer a less expensive form of financing. NBB’s leverage, originally implemented as approximately 65% through borrowings and 35% through inverse floaters1, was approximately 80% funded by inverse floaters as of the end of this period.
In NBD, the heavy supply of new BABs during the last part of 2010 enabled us to complete the invest-up of this Fund primarily with purchases of BABs, with an emphasis on benchmark issues, and also to diversify NBD in terms of sector and credit. Shortly after the invest-up period began, we bought a number of long U.S. Treasury bonds to help bring NBD’s duration profile in line with that of the Fund’s benchmark, the Barclays Capital BAB Index. Toward the end of this period, we sold most of these non-BAB holdings and reinvested the proceeds in BABs. NBD uses a leverage strategy similar to that used in NBB using inverse floating rate securities only. Following the end of the new issue calendar, we continued to make small trades in the secondary market and worked to increase NBD’s liquidity. In early 2011, following a decline in the tax-exempt municipal market, both NBB and NBD purchased tax-exempt municipal bonds at attractive prices.
| 1 | Inverse floating rate securities, also known as inverse floaters, are created by depositing a municipal bond, typically with a fixed interest rate, into a special purpose trust created by a broker-dealer. This trust, in turn, (a) issues floating rate certificates typically paying short-term tax-exempt interest rates to third parties in amounts equal to some fraction of the deposited bond’s par amount or market value, and (b) issues an inverse floating rate certificate (sometimes referred to as an “inverse floater”) to an investor (such as a Fund) interested in gaining investment exposure to a long-term municipal bond. The income received by the holder of the inverse floater varies inversely with the short-term rate paid to the floating rate certificates’ holders, and in most circumstances the holder of the inverse floater bears substantially all of the underlying bond’s downside investment risk. The holder of the inverse floater typically also benefits disproportionately from any potential appreciation of the underlying bond’s value. Hence, an inverse floater essentially represents an investment in the underlying bond on a leveraged basis. |
Nuveen Investments 7
As the valuations on these bonds approached more appropriate levels near the end of this period, we sold these non-BABs at higher prices, thus benefiting the Funds.
During the period, the Funds also entered into interest rate and forward interest rate swap contracts to reduce the duration of each Fund’s portfolio, as well as to partially fix its interest cost of leverage.
Because the BAB program was not renewed at the end of December 2010, shareholders should note that both NBB and NBD have contingent term provisions stating that if there are no new issuances of BABs or similarly U.S. Treasury-subsidized taxable municipal bonds for any 24-month period ending on or before December 31, 2014, NBB and NBD will terminate on or around June 30, 2020, and December 31, 2020, respectively.
How did these Funds perform over this period?
Results for NBB and NBD, as well as relevant index information, are presented in the accompanying table.
| | | |
| Cumulative Total Returns on Net Asset Value | | |
| For periods ended 3/31/11 | | |
| | | |
| Since Inception | 4/27/10 | 11/23/10 |
| NBB* | 4.90% | N/A |
| NBD** | N/A | 3.73% |
Barclays Capital Build America Bond (BAB) Index2 | 2.88%* | 1.27%** |
For the period between their respective inceptions and March 31, 2011, the cumulative returns on net asset value (NAV) for NBB and NBD exceeded the returns for the Barclays Capital Build America Bond (BAB) Index, which reflect the same time periods.
Key management factors that influenced the Funds’ returns during this period included duration and yield curve positioning, credit exposure and sector allocation. In addition, individual security selection was positive for both NBB and NBD, as heavy issuance of BABs during the fourth quarter of 2010 gave us access to a robust array of bonds with attractive features from which to choose. The Funds’ use of leverage was an important factor affecting the Funds’ performance for this period. The impact of leverage is discussed in more detail on page nine.
During this period, bonds with intermediate and longer maturities generally performed well. Overall, duration was a positive contributor to NBB’s performance and a negative factor in NBD. This difference can be attributed to NBB’s overweighting of an intermediate segment of the yield curve that performed particularly well during this period.
Both NBB and NBD were similarly weighted among the credit quality sectors, with their largest allocation in bonds rated AA, followed by A, AAA, BBB and non-rated bonds. On the whole, this credit rating exposure was negative for performance during this period.
The overall impact of sector exposure was positive in both NBB and NBD. The Funds’ sector allocations were well diversified, with the heaviest weightings in limited and general tax obligation bonds, utilities, transportation and water and sewer credits.
| * | The returns shown for NBB and the index represent the period from April 27, 2010 (NBB’s inception date), through March 31, 2011. |
| | |
| ** | The returns shown for NBD and the index represent the period from November 23, 2010 (NBD’s inception date), through March 31, 2011. |
| | |
| | Past performance is not predictive of future results. Current performance may be higher or lower than the data shown. Returns do not reflect the deduction of taxes that shareholders may have to pay on Fund distributions or upon the sale of Fund shares. |
| | |
| | For additional information, see the Performance Overview pages for NBB and NBD in this report. |
| | |
| 2 | The Barclays Capital Build America Bond (BAB) Index is an unleveraged index that comprises all direct pay Build America Bonds that are SEC-regulated, taxable, dollar-denominated, and have at least one year to final maturity, at least $250 million par amount outstanding, and are determined to be investment grade by Barclays Capital. This index does not reflect any initial or ongoing expenses and is not available for direct investment. |
IMPACT OF THE FUNDS’ LEVERAGE STRATEGIES ON PERFORMANCE
One important factor impacting the returns of these Funds relative to the comparative index was the Funds’ use of leverage. These Funds use leverage because their managers believe that, over time, leveraging provides opportunities for additional income and total return for shareholders. However, use of leverage also can expose shareholders to additional volatility. For example, as the prices of securities held by a Fund decline, the negative impact of these valuation changes on net asset value and total return is magnified by the use of leverage. Conversely, leverage may enhance returns during periods when the prices of securities held by the Funds’ generally are rising. Leverage made a positive contribution to the Funds’ performance over the reporting period.
Nuveen Investments 9
Dividend and Share Price Information
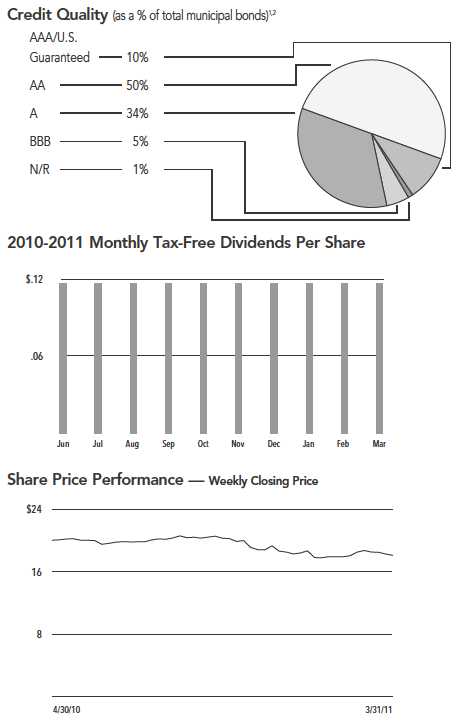
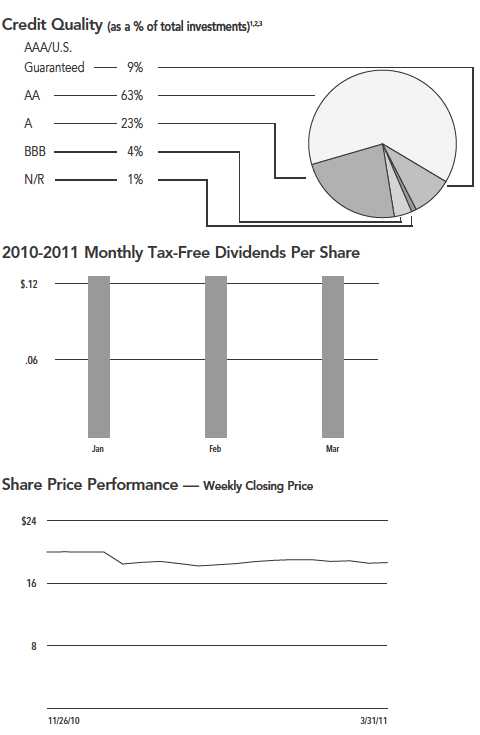
Introduced in April 2010, NBB declared its initial monthly distribution in June 2010 and maintained a stable monthly dividend throughout the remainder of the reporting period ended March 31, 2011. NBD, which was introduced in November 2010, declared its initial monthly dividend distribution in January 2011 and maintained a stable monthly dividend over the remainder of the period.
NBB and NBD seek to pay stable dividends at rates that reflect the Funds’ past results and projected future performance. During certain periods, the Funds may pay dividends at a rate that may be more or less than the amount of net investment income actually earned by the Funds during the period. If a Fund has cumulatively earned more than it has paid in dividends, it holds the excess in reserve as undistributed net investment income (UNII) as part of the Fund’s NAV. Conversely, if a Fund has cumulatively paid dividends in excess of its earnings, the excess constitutes negative UNII that is likewise reflected in the Fund’s NAV. The Funds will, over time, pay all of their net investment income as dividends to shareholders. As of March 31, 2011, both NBB and NBD had positive UNII balances for both tax and financial reporting purposes.
SHARE REPURCHASES AND PRICE INFORMATION
Since the inception of NBB’s repurchase program, NBB has not repurchased any of its outstanding shares. As of March 31, 2011, NBD is not authorized to repurchase its outstanding shares.
As of March 31, 2011, and during the reporting period, the Funds’ share prices were trading at (+) premiums/(-) discounts to their NAVs as shown in the accompanying table.
| | | Average |
| | 3/31/11 | (+) Premium/(-) Discount |
| Fund | (-) Discount | Since Inception |
| NBB | (-)4.24% | (+)0.29% |
| NBD | (-)4.12% | (-)0.50% |
10 Nuveen Investments
| | |
| NBB | Nuveen Build America Bond |
| Performance | Fund |
| OVERVIEW | |
| | as of March 31, 2011 |
| | | |
| Fund Snapshot | | |
| Share Price | | $18.06 |
| Net Asset Value (NAV) | | $18.86 |
| Premium/(Discount) to NAV | | -4.24% |
| Market Yield | | 7.77% |
| Net Assets ($000) | | $499,020 |
| Cumulative Total Return | | |
| (Inception 4/27/10) | | |
| | On Share Price | On NAV |
| Since Inception | -3.99% | 4.90% |
States2 | | |
| (as a % of total municipal bonds) | | |
| California | | 18.5% |
| New York | | 10.7% |
| Illinois | | 10.4% |
| Texas | | 5.6% |
| Ohio | | 4.8% |
| Georgia | | 4.3% |
| Washington | | 4.2% |
| Louisiana | | 3.6% |
| Michigan | | 3.4% |
| Indiana | | 3.2% |
| Florida | | 3.1% |
| Tennessee | | 2.9% |
| Oregon | | 2.7% |
| Virgin Islands | | 2.4% |
| Arizona | | 2.3% |
| New Jersey | | 2.3% |
| Virginia | | 2.2% |
| Other | | 13.4% |
Portfolio Composition2,3 | | |
| (as a % of total investments) | | |
| Tax Obligation/Limited | | 24.0% |
| Tax Obligation/General | | 23.0% |
| Utilities | | 21.0% |
| Transportation | | 13.1% |
| Water and Sewer | | 12.7% |
| Education and Civic Organizations | | 4.9% |
| Short-Term Investments | | 0.1% |
| Other | | 1.2% |
Build America Bond Allocation2 | |
| (as a % of total municipal bonds) | | |
| Build America Bonds | | 93.7% |
| Non-Build America Bonds | | 6.3% |
| | Refer to the Glossary of Terms Used in this Report for further definition of the terms used within this Fund’s Performance Overview page. |
| 1 | Ratings shown are the highest of Standard & Poor’s Group, Moody’s Investor Service, Inc. or Fitch, Inc. AAA includes bonds with an implied AAA rating since they are backed by U.S. Government or agency securities. AAA, AA, A and BBB ratings are investment grade; BB, B, CCC, CC, C and D ratings are below-investment grade. Holdings designated N/R are not rated by any of these national rating agencies. |
| 2 | Holdings are subject to change. |
| 3 | Excluding investments in derivatives. |
Nuveen Investments 11
| | |
| NBD | Nuveen Build |
| | America Bond |
| Performance | Opportunity Fund |
| OVERVIEW | |
| | as of March 31, 2011 |
| | | |
| Fund Snapshot | | |
| Share Price | | $18.63 |
| Net Asset Value (NAV) | | $19.43 |
| Premium/(Discount) to NAV | | -4.12% |
| Market Yield | | 8.12% |
| Net Assets ($000) | | $139,972 |
| Cumulative Total Return | | |
| (Inception 11/23/10) | | |
| | On Share Price | On NAV |
| Since Inception | -4.96% | 3.73% |
States2,3 | | |
| (as a % of total investments) | | |
| Illinois | | 12.7% |
| California | | 12.5% |
| New York | | 9.9% |
| Texas | | 7.6% |
| South Carolina | | 6.9% |
| New Jersey | | 5.4% |
| Michigan | | 5.2% |
| Colorado | | 4.3% |
| Pennsylvania | | 4.0% |
| Ohio | | 3.9% |
| Georgia | | 3.3% |
| Missouri | | 2.7% |
| Nevada | | 2.7% |
| District of Columbia | | 2.7% |
| Kentucky | | 2.1% |
| Other | | 14.1% |
Portfolio Composition2,3 | | |
| (as a % of total investments) | | |
| Tax Obligation/Limited | | 31.1% |
| Utilities | | 17.7% |
| Tax Obligation/General | | 16.3% |
| Water and Sewer | | 13.2% |
| Transportation | | 10.8% |
| Education and Civic Organizations | | 6.4% |
| Other | | 4.5% |
Build America Bond Allocation2,3 | |
| (as a % of total investments) | | |
| Build America Bonds | | 96.5% |
| Non-Build America Bonds | | 3.5% |
| | Refer to the Glossary of Terms Used in this Report for further definition of the terms used within this Fund’s Performance Overview page. |
| 1 | Ratings shown are the highest of Standard & Poor’s Group, Moody’s Investor Service, Inc. or Fitch, Inc. AAA includes bonds with an implied AAA rating since they are backed by U.S. Government or agency securities. AAA, AA, A and BBB ratings are investment grade; BB, B, CCC, CC, C and D ratings are below-investment grade. Holdings designated N/R are not rated by any of these national rating agencies. |
| 2 | Holdings are subject to change. |
| 3 | Excluding investments in derivatives. |
12 Nuveen Investments
Report of Independent
Registered Public Accounting Firm
The Board of Trustees and Shareholders
Nuveen Build America Bond Fund
Nuveen Build America Bond Opportunity Fund
We have audited the accompanying statements of assets and liabilities, including the portfolios of investments, of Nuveen Build America Bond Fund and Nuveen Build America Bond Opportunity Fund (the “Funds”) as of March 31, 2011, and the related statements of operations, changes in net assets, cash flows (Nuveen Build America Bond Fund only), and the financial highlights for the periods indicated therein. These financial statements and financial highlights are the responsibility of the Funds’ management. Our responsibility is to express an opinion on these financial statements and financial highlights based on our audits.
We conducted our audits in accordance with the standards of the Public Company Accounting Oversight Board (United States). Those standards require that we plan and perform the audits to obtain reasonable assurance about whether the financial statements and financial highlights are free of material misstatement. We were not engaged to perform an audit of the Funds’ internal control over financial reporting. Our audits included consideration of internal control over financial reporting as a basis for designing audit procedures that are appropriate in the circumstances, but not for the purpose of expressing an opinion on the effectiveness of the Funds’ internal control over financial reporting. Accordingly, we express no such opinion. An audit also includes examining, on a test basis, evidence supporting the amounts and disclosures in the financial statements and financial highlights, assessing the accounting principles used and significant estimates made by management, and evaluating the overall financial statement presentation. Our procedures included confirmation of securities owned as of March 31, 2011, by correspondence with the custodian and brokers or by other appropriate auditing procedures where replies from brokers were not received. We believe that our audits provide a reasonable basis for our opinion.
In our opinion, the financial statements and financial highlights referred to above present fairly, in all material respects, the financial positions of Nuveen Build America Bond Fund and Nuveen Build America Bond Opportunity Fund at March 31, 2011, and the results of their operations, changes in their net assets, their cash flows (Nuveen Build American Bond Fund only), and the financial highlights for the periods indicated therein in conformity with U.S. generally accepted accounting principles.
Chicago, Illinois
May 25, 2011
Nuveen Investments 13
| | |
| | Nuveen Build America Bond Fund |
| NBB | Portfolio of Investments |
| | March 31, 2011 |
| | | | | | |
| Principal | | | Optional Call | | |
| Amount (000) | | Description (1) | Provisions (2) | Ratings (3) | Value |
| | | Municipal Bonds | | | |
| | | Arizona – 2.5% (2.3% of Total Investments) | | | |
| $ 3,000 | | Arizona Board of Regents, University of Arizona, System Revenue Bonds, Build America Taxable | 8/20 at 100.00 | AA– | $ 3,006,540 |
| | | Bonds, Series 2010A, 6.423%, 8/01/35 | | | |
| 10,000 | | Mesa, Arizona, Utility System Revenue Bonds, Series 2010, 6.100%, 7/01/34 | No Opt. Call | Aa2 | 9,580,200 |
| 13,000 | | Total Arizona | | | 12,586,740 |
| | | California – 20.3% (18.5% of Total Investments) | | | |
| 500 | | California Infrastructure Economic Development Bond Bank, Revenue Bonds, University of | No Opt. Call | Aa2 | 498,620 |
| | | California San Francisco Neurosciences Building, Build America Taxable Bond Series 2010B, | | | |
| | | 6.486%, 5/15/49 | | | |
| 3,000 | | California State Public Works Board, Lease Revenue Bonds, Various Capital Projects, Build | No Opt. Call | A2 | 3,184,410 |
| | | America Taxable Bond Series 2009G-2, 8.361%, 10/01/34 | | | |
| 4,000 | | California State Public Works Board, Lease Revenue Bonds, Various Capital Projects, Build | 3/20 at 100.00 | A2 | 3,975,560 |
| | | America Taxable Bond Series 2010A-2, 8.000%, 3/01/35 | | | |
| 7,000 | | California State University, Systemwide Revenue Bonds, Build America Taxable Bond Series | No Opt. Call | Aa2 | 6,920,550 |
| | | 2010B, 6.484%, 11/01/41 | | | |
| 4,500 | | California State, General Obligation Bonds, Various Purpose Build America Taxable Bond Series | 3/20 at 100.00 | A1 | 4,845,735 |
| | | 2010, 7.950%, 3/01/36 | | | |
| 5,500 | | City and County of San Francisco Redevelopment Financing Authority, California, Taxable Tax | No Opt. Call | A1 | 5,663,680 |
| | | Allocation Revenue Bonds, San Francisco Redevelopment Projects, Series 2009F, 8.406%, 8/01/39 | | | |
| 5,000 | | Hayward Unified School District, Alameda County, California, General Obligation Bonds, Build | 8/20 at 100.00 | AA+ | 5,046,250 |
| | | America Taxable Bonds, Series 2010B, 7.350%, 8/01/43 – AGM Insured | | | |
| 950 | | Los Alamitos Unified School District, Orange County, California, General Obligation Bonds, | No Opt. Call | Aa2 | 900,268 |
| | | School Facilities Improvement, Build America Taxable Bond Series 2010C, 6.210%, 8/01/35 | | | |
| 15,000 | | Los Angeles Community College District, California, General Obligation Bonds, Build America | No Opt. Call | Aa1 | 15,716,250 |
| | | Taxable Bonds, Series 2010, 6.600%, 8/01/42 | | | |
| 10,000 | | Los Angeles Community College District, Los Angeles County, California, General Obligation | No Opt. Call | Aa1 | 10,477,500 |
| | | Bonds, Series 2010, 6.600%, 8/01/42 (UB) (4) | | | |
| 11,000 | | Los Angeles County Public Works Financing Authority, California, Lease Revenue Bonds, Multiple | No Opt. Call | A+ | 10,843,580 |
| | | Capital Projects I, Build America Taxable Bond Series 2010B, 7.618%, 8/01/40 | | | |
| 2,000 | | Los Angeles Department of Water and Power, California, Water System Revenue Bonds, Tender | No Opt. Call | Aa1 | 2,513,100 |
| | | Option Bond Trust T0003, 29.995%, 7/01/42 (IF) (4) | | | |
| 9,520 | | Napa Valley Unified School District, Napa County, California, General Obligation Bonds, Build | No Opt. Call | Aa2 | 9,558,651 |
| | | America Taxable Bond Series 2010B, 6.507%, 8/01/43 | | | |
| 3,000 | | Oakland Redevelopment Agency, California, Subordinated Housing Set Aside Revenue Bonds, | No Opt. Call | A | 2,946,720 |
| | | Federally Taxable Series 2011A-T, 7.500%, 9/01/19 | | | |
| 5,000 | | Orange County Sanitation District, California, Wastewater Revenue Bonds, Build America Taxable | No Opt. Call | AAA | 4,719,700 |
| | | Bond Series 2010A, 5.580%, 2/01/40 | | | |
| 2,355 | | San Bernardino Community College District, California, General Obligation Bonds, Election of | No Opt. Call | AA– | 2,491,307 |
| | | 2008, Build America Taxable Bond Series 2009C, 7.630%, 8/01/44 | | | |
| 4,000 | | San Francisco City and County, California, Certificates of Participation, 525 Golden Gate | No Opt. Call | AA– | 2,783,000 |
| | | Avenue, San Francisco Public Utilities Commission Office Project, Tender Option Bond Trust | | | |
| | | B001, 29.243%, 11/01/30 (IF) | | | |
| 1,000 | | Santa Barbara County, California, Certificates of Participation, Recovery Zone Economic | No Opt. Call | AA+ | 973,600 |
| | | Development Taxable Bonds, Series 2010A-2, 6.250%, 12/01/40 | | | |
| | | Stanton Redevelopment Agency, California, Consolidated Project Tax Allocation Bonds, | | | |
| | | Series 2011A: | | | |
| 275 | | 6.500%, 12/01/17 | No Opt. Call | A– | 272,440 |
| 295 | | 6.750%, 12/01/18 | No Opt. Call | A– | 289,873 |
| 2,500 | | Walnut Energy Center Authority, California, Electric Revenue Bonds, Turlock Irrigation | No Opt. Call | A+ | 2,465,425 |
| | | District, Build America Taxable Bonds, Series 2010B, 6.230%, 1/01/29 | | | |
| 4,000 | | West Kern Water District, California, Certificates of Participation, Land Acquisition Project, | No Opt. Call | AA– | 4,044,680 |
| | | Build America Bonds, Series 10B, 6.720%, 6/01/40 | | | |
| 100,395 | | Total California | | | 101,130,899 |
14 Nuveen Investments
| | | | | | |
| Principal | | | Optional Call | | |
| Amount (000) | | Description (1) | Provisions (2) | Ratings (3) | Value |
| | | Colorado – 1.9% (1.8% of Total Investments) | | | |
| $ 1,000 | | East Cherry Creek Valley Water and Sanitation District, Arapahoe County, Colorado, Water | 11/20 at 100.00 | A+ | $ 897,330 |
| | | Revenue Bonds, Build America Taxable Bond Series 2010B, 5.820%, 11/15/40 | | | |
| 3,000 | | Mesa State College, Colorado, Auxiliary Facilities Enterprise Revenue Bonds, Build America | No Opt. Call | Aa2 | 3,052,080 |
| | | Taxable Bond Series 2010B, 6.746%, 5/15/42 | | | |
| 1,000 | | Metropolitan State College of Denver, Colorado, Institutional Enterprise Revenue Bonds, | No Opt. Call | Aa2 | 952,130 |
| | | Federally Taxable Build America Bonds, Recovery Zone Economic Development Project, Series 2010, | | | |
| | | 6.000%, 12/01/40 | | | |
| 5,000 | | St. Vrain Valley School District RE-1J, Boulder, Larimer and Weld Counties, Colorado, General | 12/20 at 100.00 | Aa2 | 4,776,050 |
| | | Obligation Bonds, Build America Taxable Bond Series 2010B, 5.790%, 12/15/33 | | | |
| 10,000 | | Total Colorado | | | 9,677,590 |
| | | Connecticut – 1.3% (1.2% of Total Investments) | | | |
| 6,000 | | Harbor Point Infrastructure Improvement District, Connecticut, Special Obligation Revenue | 4/20 at 100.00 | N/R | 6,417,720 |
| | | Bonds, Harbor Point Project, Federally Taxable – Issuer Subsidy – Recovery Zone Economic | | | |
| | | Development Bond Series 2010B, 12.500%, 4/01/39 | | | |
| | | Florida – 3.4% (3.1% of Total Investments) | | | |
| 5,000 | | Florida Governmental Utilities Authority, North Fort Myers Utility Revenue Bonds, Federally | 10/20 at 100.00 | A2 | 5,091,200 |
| | | Taxable Build America Bonds, Series 2010B, 7.084%, 10/01/40 | | | |
| 6,195 | | Florida State Board of Education, Public Education Capital Outlay Bonds, Build America Taxable | 6/19 at 100.00 | AAA | 6,114,837 |
| | | Bonds, Series 2010G, 5.750%, 6/01/35 | | | |
| 500 | | Lake City, Florida, Utility System Revenue Bonds, Build America Taxable Bonds Series 2010B, | 7/20 at 100.00 | AA+ | 497,765 |
| | | 6.175%, 7/01/35 – AGC Insured | | | |
| 4,975 | | Orlando Community Redevelopment Agency, Florida, Tax Increment Revenue Bonds, Downtown | 9/20 at 100.00 | A1 | 5,295,639 |
| | | District, Direct Subsidy Build America Table Bond Series 2010B, 7.784%, 9/01/40 | | | |
| 16,670 | | Total Florida | | | 16,999,441 |
| | | Georgia – 4.7% (4.3% of Total Investments) | | | |
| 10,000 | | Georgia Municipal Electric Authority, Plant Vogtle Units 3 & 4 Project J Bonds, Taxable Build | No Opt. Call | A+ | 9,549,300 |
| | | America Bonds Series 2010A, 6.637%, 4/01/57 | | | |
| 15,000 | | Georgia Municipal Electric Authority, Plant Vogtle Units 3 & 4 Project P Bonds, Refunding | No Opt. Call | A– | 14,032,800 |
| | | Taxable Build America Bonds Series 2010A, 7.055%, 4/01/57 | | | |
| 25,000 | | Total Georgia | | | 23,582,100 |
| | | Illinois – 11.4% (10.4% of Total Investments) | | | |
| 5,000 | | Chicago Transit Authority, Illinois, Sales and Transfer Tax Receipts Revenue Bonds, Pension | No Opt. Call | AA | 4,938,400 |
| | | Funding Taxable Series 2008A, 6.899%, 12/01/40 | | | |
| 10,000 | | Chicago, Illinois, General Airport Revenue Bonds, O’Hare International Airport, Third Lien, | 1/20 at 100.00 | A1 | 9,859,800 |
| | | Build America Taxable Bond Series 2010B, 6.845%, 1/01/38 | | | |
| 10,000 | | Chicago, Illinois, Wastewater Transmission Revenue Bonds, Build America Taxable Bond Series | No Opt. Call | Aa3 | 10,278,100 |
| | | 2010B, 6.900%, 1/01/40 | | | |
| 10,000 | | Chicago, Illinois, Water Revenue Bonds, Taxable Second Lien Series 2010B, 6.742%, 11/01/40 | No Opt. Call | AA– | 10,262,100 |
| 5,610 | | Cook County, Illinois, General Obligation Bonds, Build America Taxable Bonds, Series 2010D, | No Opt. Call | AA | 5,394,520 |
| | | 6.229%, 11/15/34 | | | |
| 500 | | Illinois Finance Authority, Revenue Bonds, Illinois Institute of Technology, Refunding Series | 4/11 at 100.00 | Baa3 | 436,985 |
| | | 2006A, 6.100%, 4/01/15 | | | |
| 13,875 | | Illinois State, General Obligation Bonds, Taxable Build America Bonds, Series 2010-3, | No Opt. Call | A+ | 13,325,689 |
| | | 6.725%, 4/01/35 | | | |
| 2,680 | | Illinois Toll Highway Authority, Toll Highway Revenue Bonds, Build America Taxable Bonds, | No Opt. Call | AA– | 2,601,449 |
| | | Senior Lien Series 2009A, 6.184%, 1/01/34 | | | |
| 57,665 | | Total Illinois | | | 57,097,043 |
| | | Indiana – 3.5% (3.2% of Total Investments) | | | |
| | | Evansville Redevelopment Authority, Indiana, Lease Rental Revenue Bonds, Build America Taxable | | | |
| | | Bond Series 2010B: | | | |
| 1,250 | | 6.960%, 2/01/34 | 8/20 at 100.00 | Aa3 | 1,262,638 |
| 9,440 | | 7.210%, 2/01/39 | 8/20 at 100.00 | Aa3 | 9,585,848 |
Nuveen Investments 15
| | |
| | Nuveen Build America Bond Fund (continued) |
| NBB | Portfolio of Investments March 31, 2011 |
| | | | | | |
| Principal | | | Optional Call | | |
| Amount (000) | | Description (1) | Provisions (2) | Ratings (3) | Value |
| | | Indiana (continued) | | | |
| $ 5,000 | | Indiana University, Consolidated Revenue Bonds, Build America Taxable Bonds, Series 2010B, | 6/20 at 100.00 | Aaa | $ 4,893,700 |
| | | 5.636%, 6/01/35 | | | |
| 1,725 | | Speedway Redevelopment Authority, Indiana, Lease Rental Revenue Bonds, Federally Taxable Build | No Opt. Call | A+ | 1,695,917 |
| | | America Bonds, Series 2010A, 6.512%, 2/01/35 | | | |
| 17,415 | | Total Indiana | | | 17,438,103 |
| | | Kentucky – 1.0% (0.9% of Total Investments) | | | |
| 5,000 | | Kentucky Municipal Power Agency, Power Supply System Revenue Bonds, Prairie State Project, | 9/20 at 100.00 | AA+ | 5,208,250 |
| | | Tender Option Bond Trust B002, 28.928%, 9/01/37 – AGM Insured (IF) | | | |
| | | Louisiana – 4.0% (3.6% of Total Investments) | | | |
| 20,000 | | East Baton Rouge Sewage Commission, Louisiana, Revenue Bonds, Build America Taxable Bonds, | 2/20 at 100.00 | Aa2 | 19,961,000 |
| | | Series 2010B, 6.087%, 2/01/45 | | | |
| | | Massachusetts – 0.5% (0.4% of Total Investments) | | | |
| 2,000 | | Massachusetts, Transportation Fund Revenue Bonds, Accelerated Bridge Program, Tender Option | No Opt. Call | AAA | 2,318,000 |
| | | Bond Trust T0004, 25.436%, 6/01/40 (IF) (4) | | | |
| | | Michigan – 3.8% (3.4% of Total Investments) | | | |
| 14,650 | | Detroit City School District, Wayne County, Michigan, General Obligation Bonds, Build America | No Opt. Call | Aa2 | 15,335,620 |
| | | Taxable Bond Series 2009B, 7.747%, 5/01/39 | | | |
| 1,720 | | Jackson Public Schools, Jackson County, Michigan, General Obligation Bonds, Qualified School | 5/20 at 100.00 | Aa2 | 1,722,219 |
| | | Construction Bonds – Taxable Direct Payment, Series 2010B, 6.450%, 5/01/27 | | | |
| 1,000 | | Michigan Tobacco Settlement Finance Authority, Tobacco Settlement Asset-Backed Revenue Bonds, | 6/22 at 100.00 | Baa3 | 748,140 |
| | | Taxable Turbo Series 2006A, 7.309%, 6/01/34 | | | |
| 950 | | Monroe, Michigan, Limited Tax General Obligation Bonds, Taxable Recovery Zone Economic | 5/20 at 100.00 | A+ | 971,347 |
| | | Development Bonds, Series 2010, 6.650%, 5/01/27 | | | |
| 18,320 | | Total Michigan | | | 18,777,326 |
| | | Missouri – 0.4% (0.3% of Total Investments) | | | |
| 1,900 | | Missouri Joint Municipal Electric Utility Commission, Prairie State Power Project Revenue | 1/19 at 100.00 | A3 | 1,866,636 |
| | | Bond, Federally Taxable Build America Bonds – Direct Pay, Series 2009A, 6.890%, 1/01/42 | | | |
| | | Nebraska – 0.3% (0.3% of Total Investments) | | | |
| 1,670 | | District Energy Corporation, Nebraska, Facility Revenue Bonds, Build America Taxable Bonds, | 7/20 at 100.00 | Aa1 | 1,631,690 |
| | | Series 2010B, 5.901%, 7/01/32 | | | |
| | | Nevada – 2.3% (2.1% of Total Investments) | | | |
| 6,000 | | Clark County, Nevada, Airport Revenue Bonds, Senior Lien Series 2009B, 6.881%, 7/01/42 | 7/19 at 100.00 | Aa2 | 5,999,880 |
| 1,315 | | Las Vegas, Nevada, Certificates of Participation, City Hall Project, Build America Federally | 9/19 at 100.00 | AA– | 1,388,298 |
| | | Taxable Bonds, Series 2009B, 7.800%, 9/01/39 | | | |
| 4,000 | | North Las Vegas, Nevada, General Obligation Water and Wastewater Improvement Bonds, Build | No Opt. Call | Aa2 | 3,991,800 |
| | | America Taxable Bonds, Series 2010A, 6.572%, 6/01/40 | | | |
| 11,315 | | Total Nevada | | | 11,379,978 |
| | | New Jersey – 2.5% (2.3% of Total Investments) | | | |
| 11,500 | | New Jersey Turnpike Authority, Revenue Bonds, Build America Taxable Bonds, Series 2010A, | No Opt. Call | A+ | 12,501,190 |
| | | 7.102%, 1/01/41 | | | |
| | | New York – 11.8% (10.7% of Total Investments) | | | |
| 15,000 | | Dormitory Authority of the State of New York, State Personal Income Tax Revenue Bonds, Build | No Opt. Call | AAA | 14,160,450 |
| | | America Taxable Bonds, Series 2010D, 5.600%, 3/15/40 | | | |
| 10,000 | | Dormitory Authority of the State of New York, State Personal Income Tax Revenue Bonds, | No Opt. Call | AAA | 9,440,300 |
| | | Series 2010D, 5.600%, 3/15/40 (UB) | | | |
| 10,000 | | Long Island Power Authority, New York, Electric System Revenue Bonds, Build America Taxable | No Opt. Call | A– | 9,130,600 |
| | | Bond Series 2010B, 5.850%, 5/01/41 | | | |
| 4,750 | | Metropolitan Transportation Authority, New York, Transportation Revenue Bonds, Build America | No Opt. Call | A | 4,450,560 |
| | | Taxable Bonds, Series 2009A-1, 5.871%, 11/15/39 | | | |
16 Nuveen Investments
| | | | | | |
| Principal | | | Optional Call | | |
| Amount (000) | | Description (1) | Provisions (2) | Ratings (3) | Value |
| | | New York (continued) | | | |
| | | New York City Municipal Water Finance Authority, New York, Water and Sewer System Revenue | | | |
| | | Bonds, Second Generation Resolution, Build America Taxable Bonds, Series 2010DD: | | | |
| $ 2,025 | | 5.952%, 6/15/42 (UB) | No Opt. Call | AA+ | $ 2,080,809 |
| 2,595 | | 5.952%, 6/15/42 | No Opt. Call | AA+ | 2,666,518 |
| 1,595 | | New York City Municipal Water Finance Authority, New York, Water and Sewer System Revenue | No Opt. Call | AA+ | 1,654,733 |
| | | Bonds, Second Generation Resolution, Taxable Tender Option Bonds Trust T30001-2, | | | |
| | | 26.399%, 6/15/44 (IF) | | | |
| 5,500 | | New York City Transitional Finance Authority, New York, Building Aid Revenue Bonds, Build | No Opt. Call | AA– | 5,883,790 |
| | | America Taxable Bond Fiscal 2011 Series 2010S-1B, 6.828%, 7/15/40 | | | |
| 10,000 | | New York City Transitional Finance Authority, New York, Future Tax Secured Bonds, Build | No Opt. Call | AAA | 9,374,500 |
| | | America Taxable Bonds, Series 2010G-1, 5.467%, 5/01/40 | | | |
| 61,465 | | Total New York | | | 58,842,260 |
| | | Ohio – 5.3% (4.8% of Total Investments) | | | |
| 500 | | American Municipal Power Inc., Ohio, Combined Hydroelectric Projects Revenue Bonds, Federally | No Opt. Call | A | 506,400 |
| | | Taxable Build America Bonds, Series 2009B, 6.424%, 2/15/32 | | | |
| 10,000 | | American Municipal Power Inc., Ohio, Combined Hydroelectric Projects Revenue Bonds, Federally | No Opt. Call | A | 11,219,500 |
| | | Taxable Build America Bonds, Series 2010B, 7.834%, 2/15/41 | | | |
| 3,000 | | Circleville City School District, Pickaway County, Ohio, General Obligation School Facilities | 5/20 at 100.00 | Aa2 | 3,072,660 |
| | | Construction and Improvement Bonds, Build America Taxable Series 2010C, 6.300%, 11/01/40 | | | |
| | | Franklin County Convention Facilities Authority, Ohio, Lease Revenue Anticipation Bonds, | | | |
| | | Federally Taxable Direct Payment Build America Bonds, Series 2010: | | | |
| 570 | | 6.540%, 12/01/36 | No Opt. Call | AA | 547,388 |
| 4,490 | | 6.640%, 12/01/42 | No Opt. Call | AA | 4,361,317 |
| 5,000 | | Lucas County, Ohio, General Obligation Bonds, Taxable Arena improvement Series 2010, | 10/20 at 100.00 | Aa2 | 4,822,300 |
| | | 6.150%, 10/01/40 | | | |
| 1,760 | | Madison Local School District, Lake & Geauga Counties, Ohio, General Obligation Bonds, Build | 9/20 at 100.00 | Aa2 | 1,659,381 |
| | | America Taxable Bond Series 2010C, 6.050%, 4/01/42 | | | |
| 25,320 | | Total Ohio | | | 26,188,946 |
| | | Oregon – 2.9% (2.7% of Total Investments) | | | |
| 4,000 | | Oregon Department of Administrative Services, Certificates of Participation, Federally Taxable | 5/20 at 100.00 | Aa2 | 3,776,400 |
| | | Build America Bonds, Tender Option Bond Trust TN-011, 27.474%, 5/01/35 (IF) (4) | | | |
| 9,950 | | Warm Springs Reservation Confederated Tribes, Oregon, Tribal Economic Development | No Opt. Call | A3 | 10,804,904 |
| | | Bonds, Hydroelectric Revenue Bonds, Pelton Round Butte Project, Refunding Series 2009A, | | | |
| | | 8.250%, 11/01/19 | | | |
| 13,950 | | Total Oregon | | | 14,581,304 |
| | | Pennsylvania – 1.4% (1.3% of Total Investments) | | | |
| 3,000 | | Haverford Township School District, Delaware County, Pennsylvania, General Obligation Bonds, | 3/20 at 100.00 | AA+ | 2,937,960 |
| | | Federally Taxable Build America Bonds, Series 2010, 6.004%, 3/01/35 – AGC Insured | | | |
| 1,500 | | New Castle Sanitation Authority, Lawrence County, Pennsylvania, Sewer Revenue Bonds, Build | 6/20 at 100.00 | AA+ | 1,506,600 |
| | | America Taxable Bonds, Series 2010A, 6.506%, 6/01/41 – AGM Insured | | | |
| 2,800 | | Uniontown Area School District, Fayette County, Pennsylvania, General Obligation Bonds, | 10/20 at 100.00 | Aa3 | 2,781,968 |
| | | Federally Taxable Build America Bonds, Series 2010, 6.261%, 10/01/39 | | | |
| 7,300 | | Total Pennsylvania | | | 7,226,528 |
| | | South Carolina – 2.0% (1.8% of Total Investments) | | | |
| 205 | | South Carolina Public Service Authority, Electric System Revenue Bonds, Santee Cooper, | No Opt. Call | Aa2 | 281,106 |
| | | Federally Taxable Build America Tender Option Bond Trust T30002, 29.430%, 1/01/50 (IF) | | | |
| 8,985 | | South Carolina Public Service Authority, Electric System Revenue Bonds, Santee Cooper, | No Opt. Call | Aa2 | 9,652,316 |
| | | Series 2010A, 6.454%, 1/01/50 (UB) | | | |
| 9,190 | | Total South Carolina | | | 9,933,422 |
| | | Tennessee – 3.2% (2.9% of Total Investments) | | | |
| 15,000 | | Metropolitan Government Nashville & Davidson County Convention Center Authority, Tennessee, | No Opt. Call | A1 | 15,856,800 |
| | | Tourism Tax Revenue Bonds, Build America Taxable Bonds, Series 2010A-2, 7.431%, 7/01/43 | | | |
Nuveen Investments 17
| | |
| | Nuveen Build America Bond Fund (continued) |
| NBB | Portfolio of Investments March 31, 2011 |
| | | | | | |
| Principal | | | Optional Call | | |
| Amount (000) | | Description (1) | Provisions (2) | Ratings (3) | Value |
| | | Texas – 6.1% (5.6% of Total Investments) | | | |
| $ 10,000 | | North Texas Tollway Authority, System Revenue Bonds, Subordinate Lien Taxable Revenue Bonds, | 2/20 at 100.00 | Baa3 | $ 10,387,300 |
| | | Federally Taxable Build America Bonds, Series 2010-B2, 8.910%, 2/01/30 | | | |
| 15,000 | | North Texas Tollway Authority, System Revenue Bonds, Taxable Build America Bond Series 2009B, | No Opt. Call | A2 | 14,957,100 |
| | | 6.718%, 1/01/49 | | | |
| 5,000 | | San Antonio, Texas, General Obligation Bonds, Build America Taxable Bonds, Series 2010B, | 8/20 at 100.00 | AAA | 5,109,650 |
| | | 6.038%, 8/01/40 | | | |
| 30,000 | | Total Texas | | | 30,454,050 |
| | | Utah – 2.1% (1.9% of Total Investments) | | | |
| 5,000 | | Central Utah Water Conservancy District, Utah, Revenue Bonds, Federally Taxable Build America | 4/20 at 100.00 | AA+ | 4,587,750 |
| | | Bonds, Series 2010A, 5.700%, 10/01/40 | | | |
| 5,415 | | Midvale Redevelopment Agency, Utah, Tax Increment and Sales Tax Revenue Bonds, Federally | 5/20 at 100.00 | AA+ | 5,210,205 |
| | | Taxable Build America Bonds, Series 2010, 6.250%, 5/01/34 – AGM Insured | | | |
| 775 | | North Salt Lake, Utah, Sales Tax Revenue Bonds, Build America Taxable Bond Series 2010, | 12/19 at 100.00 | AA– | 741,900 |
| | | 5.800%, 6/15/30 | | | |
| 11,190 | | Total Utah | | | 10,539,855 |
| | | Vermont – 1.0% (0.9% of Total Investments) | | | |
| 5,000 | | University of Vermont and State Agricultural College, Revenue Bonds, Build America Bonds | No Opt. Call | Aa3 | 4,904,350 |
| | | Series 2010, 6.428%, 10/01/44 | | | |
| | | Virgin Islands – 2.6% (2.4% of Total Investments) | | | |
| 12,500 | | Virgin Islands Water and Power Authority, Electric System Revenue Bonds, Build America Taxable | No Opt. Call | AA+ | 12,946,250 |
| | | Bonds Series 2010C, 6.850%, 7/01/35 – AGM Insured | | | |
| | | Virginia – 2.4% (2.2% of Total Investments) | | | |
| 1,135 | | Metropolitan Washington DC Airports Authority, Virginia, Dulles Toll Road Revenue Bonds, | No Opt. Call | BBB+ | 1,114,888 |
| | | Series 2009D, 7.462%, 10/01/46 – AGC Insured | | | |
| 10,000 | | Metropolitan Washington DC Airports Authority, Virginia, Dulles Toll Road Revenue Bonds, | No Opt. Call | BBB | 9,682,700 |
| | | Dulles Metrorail Capital Improvement Project, Build America Taxable Bonds, Series 2010D, | | | |
| | | 8.000%, 10/01/47 | | | |
| 1,705 | | Tobacco Settlement Financing Corporation of Virginia, Tobacco Settlement Asset Backed Bonds, | 6/12 at 100.00 | Baa3 | 1,049,155 |
| | | Refunding Senior Lien Series 2007A1, 6.706%, 6/01/46 | | | |
| 12,840 | | Total Virginia | | | 11,846,743 |
| | | Washington – 4.6% (4.2% of Total Investments) | | | |
| 2,465 | | Auburn, Washington, Limited Tax General Obligation Bonds, Taxable Build America Bonds, Series | 6/20 at 100.00 | AA | 2,484,054 |
| | | 2010B, 6.243%, 12/01/39 | | | |
| 5,000 | | Grays Harbor County Public Utility District 1, Washington, Electric System Revenue Bonds, | No Opt. Call | A1 | 5,214,800 |
| | | Taxable Build America Bonds – Direct Payment, Series 2010A, 6.707%, 7/01/40 | | | |
| 5,000 | | King County Public Hospital District 1, Washington, Hospital Facilities Revenue Bonds, Valley | 6/20 at 100.00 | BBB+ | 5,090,150 |
| | | Medical Center, Build America Taxable Bonds, Series 2010B, 8.000%, 6/15/40 | | | |
| 5,000 | | Mason County Public Utility District 3, Washington, Electric Revenue Bonds, Build America | 6/20 at 100.00 | Aa3 | 4,823,100 |
| | | Taxable Bonds, Series 2010B, 6.347%, 12/01/40 | | | |
| 2,505 | | Okanogan County Public Utility District 1, Washington, Electric System Revenue Bonds, Build | No Opt. Call | A1 | 2,374,840 |
| | | America Taxable Bonds – Direct Payment, Series 2010B, 6.046%, 12/01/40 | | | |
| 4,000 | | Seattle, Washington, Municipal Light and Power Revenue Bonds, Federally Taxable Build America | No Opt. Call | Aa2 | 2,903,800 |
| | | Bonds, Tender Option Bond Trust T0001, 24.589%, 2/01/40 (IF) (4) | | | |
| 23,970 | | Total Washington | | | 22,890,744 |
18 Nuveen Investments
| | | | | | |
| Principal | | | Optional Call | | |
| Amount (000) | | Description (1) | Provisions (2) | Ratings (3) | Value |
| | | Wyoming – 0.4% (0.4% of Total Investments) | | | |
| $ 2,000 | | University of Wyoming, Facilities Improvement Revenue Bonds, Build America Taxable Bond Series | 6/20 at 100.00 | Aa2 | $ 1,949,937 |
| | | 2010C, 5.800%, 6/01/30 | | | |
| $ 547,575 | | Total Municipal Bonds (cost $560,917,578) – 109.6% | | | 546,734,895 |
Principal | | | | | |
| Amount (000) | | Description (1) | Coupon | Maturity | Value |
| | | Short-Term Investments – 0.1% (0.1% of Total Investments) | | | |
| $ 545 | | Repurchase Agreement with State Street Bank, dated 3/31/11, repurchase price $545,330, | 0.010% | 4/01/11 | 545,330 |
| | | collateralized by $555,000 U.S. Treasury Notes, 1.000%, due 4/30/12, value $561,196 | | | |
| | | Total Short-Term Investments (cost $545,330) | | | 545,330 |
| | | Total Investments (cost $561,462,908) – 109.7% | | | 547,280,225 |
| | | Borrowings – (8.8)% (5) | | | (44,000,000) |
| | | Floating Rate Obligations – (5.0)% | | | (24,810,000) |
| | | Other Assets Less Liabilities – 4.1% (6) | | | 20,549,743 |
| | | Net Assets – 100% | | | $ 499,019,968 |
| | | | | | | | | | | | |
| Investments in Derivatives | | | | | | | | | |
| | | | | | | | | | |
Swaps outstanding at March 31, 2011: | | | | | | | | | | |
| | | Fund | | | | Fixed Rate | | | | Unrealized | |
| | Notional | Pay/Receive | Floating Rate | Fixed Rate | | Payment | Effective | Termination | | Appreciation | |
| Counterparty | Amount | Floating Rate | Index | (Annualized) | | Frequency | Date (7) | Date | | (Depreciation) | |
| Barclays Bank PLC | $ | 94,000,000 | Receive | 3-Month USD-LIBOR | 3.778 | % | Semi-Annually | 2/17/12 | 2/17/40 | | $ | 10,738,776 | |
| JPMorgan | | 19,200,000 | Receive | 1-Month USD-LIBOR | 0.360 | | Monthly | 3/21/11 | 3/21/12 | | | 2,508 | |
| JPMorgan | | 19,200,000 | Receive | 1-Month USD-LIBOR | 1.193 | | Monthly | 3/21/11 | 3/21/14 | | | 129,393 | |
| Morgan Stanley | | 19,200,000 | Receive | 1-Month USD-LIBOR | 2.064 | | Monthly | 3/21/11 | 3/21/16 | | | 248,022 | |
| Morgan Stanley | | 26,000,000 | Receive | 3-Month USD-LIBOR | 4.435 | | Semi-Annually | 2/24/12 | 2/24/40 | | | 238,354 | |
| | | | | | | | | | | | $ | 11,357,053 | |
| | |
| (1) | All percentages shown in the Portfolio of Investments are based on net assets unless otherwise noted. |
| (2) | Optional Call Provisions (not covered by the report of independent registered public accounting firm): Dates (month and year) and prices of the earliest |
| | optional call or redemption. There may be other call provisions at varying prices at later dates. Certain mortgage-backed securities may be subject to peri- |
| | odic principal paydowns. |
| (3) | Ratings (not covered by the report of independent registered public accounting firm): Using the highest of Standard & Poor’s Group (“Standard & Poor’s”), |
| | Moody’s Investor Service, Inc. (“Moody’s”) or Fitch, Inc. (“Fitch”) rating. Ratings below BBB by Standard & Poor’s, Baa by Moody’s or BBB by Fitch are |
| | considered to be below investment grade. Holdings designated N/R are not rated by any of these national rating agencies. |
| (4) | Investment, or portion of investment, has been pledged to collateralize the net payment obligations for investments in derivatives and/or inverse floating |
| | rate transactions. |
| (5) | Borrowings as a percentage of Total Investments is 8.0%. |
| (6) | Other Assets Less Liabilities includes the Value and/or the Net Unrealized Appreciation (Depreciation) of derivative instruments as listed within Investments |
| | in Derivatives. |
| (7) | Effective date represents the date on which both the Fund and Counterparty commence interest payment accruals on each swap contract. |
| N/R | Not rated. |
| (IF) | Inverse floating rate investment. |
| (UB) | Underlying bond of an inverse floating rate trust reflected as a financing transaction. See Notes to Financial Statements, Footnote 1 – General Information |
| | and Significant Accounting Policies, Inverse Floating Rate Securities for more information. |
| USD-LIBOR | United States Dollar-London Inter-Bank Offered Rate. |
See accompanying notes to financial statements.
Nuveen Investments 19
| | | | | | |
| | | Nuveen Build America Bond Opportunity Fund | | |
| NBD | | Portfolio of Investments | | |
| | | March 31, 2011 |
| | | | | | |
| Principal | | | Optional Call | | |
| Amount (000) | | Description (1) | Provisions (2) | Ratings (3) | Value |
| | | California – 12.9% (12.5% of Total Investments) | | | |
| $ 1,030 | | Bay Area Toll Authority, California, Revenue Bonds, San Francisco Bay Area Toll Bridge, | No Opt. Call | A+ | $ 1,065,535 |
| | | Subordinate Lien, Build America Federally Taxable Bond Series 2010S-1, 7.043%, 4/01/50 | | | |
| 1,500 | | California State Public Works Board, Lease Revenue Bonds, Various Capital Projects, Build | No Opt. Call | A2 | 1,592,205 |
| | | America Taxable Bond Series 2009G-2, 8.361%, 10/01/34 | | | |
| 2,000 | | Hayward Unified School District, Alameda County, California, General Obligation Bonds, Build | 8/20 at 100.00 | AA+ | 2,018,500 |
| | | America Taxable Bonds, Series 2010B, 7.350%, 8/01/43 – AGM Insured | | | |
| 2,000 | | Los Angeles Community College District, Los Angeles County, California, General Obligation | No Opt. Call | Aa1 | 2,668,200 |
| | | Bonds, Tender Option Bond Trust TN027, 29.966%, 8/01/49 (IF) (4) | | | |
| 1,000 | | Los Angeles County Public Works Financing Authority, California, Lease Revenue Bonds, Multiple | No Opt. Call | A+ | 985,780 |
| | | Capital Projects I, Build America Taxable Bond Series 2010B, 7.618%, 8/01/40 | | | |
| 2,000 | | Los Angeles Department of Water and Power, California, Water System Revenue Bonds, Tender | No Opt. Call | AA | 2,513,100 |
| | | Option Bond Trust T0003, 29.995%, 7/01/42 (IF) | | | |
| 1,000 | | Oakland Redevelopment Agency, California, Subordinated Housing Set Aside Revenue Bonds, | No Opt. Call | A | 982,240 |
| | | Federally Taxable Series 2011A-T, 7.500%, 9/01/19 | | | |
| 1,500 | | San Diego County Regional Transportation Commission, California, Sales Tax Revenue Bonds, | No Opt. Call | AAA | 1,486,410 |
| | | Build America Taxable Bonds Series 2010A, 5.911%, 4/01/48 | | | |
| 2,000 | | San Francisco City and County, California, Certificates of Participation, 525 Golden Gate | No Opt. Call | AA– | 1,391,500 |
| | | Avenue, San Francisco Public Utilities Commission Office Project, Tender Option Bond Trust | | | |
| | | B001, 29.243%, 11/01/30 (IF) | | | |
| 315 | | Stanton Redevelopment Agency, California, Consolidated Project Tax Allocation Bonds, Series | No Opt. Call | A– | 308,177 |
| | | 2011A, 7.000%, 12/01/19 | | | |
| 3,000 | | The Regents of the University of California, Medical Center Pooled Revenue Bonds, Build | No Opt. Call | Aa2 | 2,976,540 |
| | | America Taxable Bonds, Series 2010H, 6.548%, 5/15/48 | | | |
| 17,345 | | Total California | | | 17,988,187 |
| | | Colorado – 4.4% (4.3% of Total Investments) | | | |
| 4,000 | | Colorado State Bridge Enterprise Revenue Bonds, Federally Taxable Build America Series 2010A, | No Opt. Call | AA | 4,173,640 |
| | | 6.078%, 12/01/40 | | | |
| 2,000 | | Regional Transportation District, Colorado, Sales Tax Revenue Bonds, FasTracks Project, Build | No Opt. Call | AA+ | 1,958,800 |
| | | America Series 2010B, 5.844%, 11/01/50 | | | |
| 6,000 | | Total Colorado | | | 6,132,440 |
| | | Connecticut – 1.1% (1.1% of Total Investments) | | | |
| 1,500 | | Harbor Point Infrastructure Improvement District, Connecticut, Special Obligation Revenue | 4/20 at 100.00 | N/R | 1,604,430 |
| | | Bonds, Harbor Point Project, Federally Taxable – Issuer Subsidy – Recovery Zone Economic | | | |
| | | Development Bond Series 2010B, 12.500%, 4/01/39 | | | |
| | | District of Columbia – 2.7% (2.7% of Total Investments) | | | |
| 800 | | District of Columbia, Income Tax Secured Revenue Bonds, Build America Taxable Bonds, Series | No Opt. Call | AAA | 808,024 |
| | | 2009E, 5.591%, 12/01/34 | | | |
| 3,000 | | District of Columbia, Income Tax Secured Revenue Bonds, Build America Taxable Bonds, Series | No Opt. Call | AAA | 3,012,570 |
| | | 2010F, 5.582%, 12/01/35 | | | |
| 3,800 | | Total District of Columbia | | | 3,820,594 |
| | | Georgia – 3.4% (3.3% of Total Investments) | | | |
| 2,000 | | Georgia Municipal Electric Authority, Plant Vogtle Units 3 & 4 Project J Bonds, Taxable Build | No Opt. Call | A+ | 1,909,860 |
| | | America Bonds Series 2010A, 6.637%, 4/01/57 | | | |
| 3,000 | | Georgia Municipal Electric Authority, Plant Vogtle Units 3 & 4 Project P Bonds, Refunding | No Opt. Call | A– | 2,806,560 |
| | | Taxable Build America Bonds Series 2010A, 7.055%, 4/01/57 | | | |
| 5,000 | | Total Georgia | | | 4,716,420 |
20 Nuveen Investments
| | | | | | |
| Principal | | | Optional Call | | |
| Amount (000) | | Description (1) | Provisions (2) | Ratings (3) | Value |
| | | Illinois – 13.1% (12.7% of Total Investments) | | | |
| $ 3,375 | | Chicago Transit Authority, Illinois, Sales Tax Receipts Revenue Bonds, Federally Taxable Build | No Opt. Call | AA | $ 3,007,598 |
| | | America Bonds, Series 2010B, 6.200%, 12/01/40 | | | |
| 4,350 | | Chicago, Illinois, Wastewater Transmission Revenue Bonds, Build America Taxable Bond Series | No Opt. Call | Aa3 | 4,470,974 |
| | | 2010B, 6.900%, 1/01/40 | | | |
| 500 | | Cook County, Illinois, General Obligation Bonds, Build America Taxable Bonds, Series 2010D, | No Opt. Call | AA | 480,795 |
| | | 6.229%, 11/15/34 | | | |
| 500 | | Illinois Finance Authority, Revenue Bonds, Illinois Institute of Technology, Refunding Series | 4/11 at 100.00 | Baa3 | 436,985 |
| | | 2006A, 6.100%, 4/01/15 | | | |
| 2,000 | | Illinois State, General Obligation Bonds, Build America Taxable Bonds, Series 2010-5, | No Opt. Call | A+ | 2,064,200 |
| | | 7.350%, 7/01/35 | | | |
| 3,000 | | Illinois Toll Highway Authority, Toll Highway Revenue Bonds, Build America Taxable Bonds, | No Opt. Call | AA– | 2,912,070 |
| | | Senior Lien Series 2009A, 6.184%, 1/01/34 | | | |
| 2,500 | | Northern Illinois Municipal Power Agency, Power Project Revenue Bonds, Prairie State Project, | No Opt. Call | A2 | 2,776,725 |
| | | Build America Taxable Bond Series 2010A, 7.820%, 1/01/40 | | | |
| 2,000 | | The Board of Trustee of Northern Illinois University, Auxiliary Facilities System Revenue | 4/20 at 100.00 | Aa3 | 2,148,920 |
| | | Bonds Federally Taxable Build America Series 2010, 7.947%, 4/01/35 – AGM Insured | | | |
| 18,225 | | Total Illinois | | | 18,298,267 |
| | | Indiana – 1.8% (1.8% of Total Investments) | | | |
| 2,500 | | Indianapolis Local Public Improvement Bond Bank, Indiana, Build America Taxable Bonds, Series | No Opt. Call | AA+ | 2,563,225 |
| | | 2010B-2, 6.116%, 1/15/40 | | | |
| | | Kentucky – 2.2% (2.1% of Total Investments) | | | |
| 3,000 | | Louisville and Jefferson County Metropolitan Sewer District, Kentucky, Sewer and Drainage | No Opt. Call | AA– | 3,079,980 |
| | | System Revenue Bonds, Build America Taxable Bonds Series 2010A, 6.250%, 5/15/43 | | | |
| | | Massachusetts – 1.7% (1.6% of Total Investments) | | | |
| 2,000 | | Massachusetts, Transportation Fund Revenue Bonds, Accelerated Bridge Program, Tender Option | No Opt. Call | AAA | 2,318,000 |
| | | Bond Trust T0004, 25.436%, 6/01/40 (IF) | | | |
| | | Michigan – 5.4% (5.2% of Total Investments) | | | |
| 3,000 | | Detroit City School District, Wayne County, Michigan, General Obligation Bonds, Build America | 5/20 at 100.00 | Aa2 | 2,870,730 |
| | | Taxable Bond Series 2010B, 6.845%, 5/01/40 | | | |
| 1,000 | | Grand Rapids, Michigan, Sanitary Sewer System Revenue Bonds, Build America Taxable Bond Series | No Opt. Call | AA+ | 1,023,330 |
| | | 2010A, 6.720%, 1/01/41 | | | |
| 2,000 | | Michigan Tobacco Settlement Finance Authority, Tobacco Settlement Asset-Backed Revenue Bonds, | 6/22 at 100.00 | Baa3 | 1,496,280 |
| | | Taxable Turbo Series 2006A, 7.309%, 6/01/34 | | | |
| 2,000 | | Wayne County Building Authority, Michigan, General Obligation Bonds, Jail Facilities, | 12/20 at 100.00 | A– | 2,097,900 |
| | | Federally Taxable Recovery Zone Economic Development Series 2010, 10.000%, 12/01/40 | | | |
| 8,000 | | Total Michigan | | | 7,488,240 |
| | | Minnesota – 1.9% (1.8% of Total Investments) | | | |
| 2,500 | | Western Minnesota Municipal Power Agency, Power Supply Revenue Bonds, Build America Taxable | No Opt. Call | A1 | 2,609,675 |
| | | Bond Series 2010C, 6.770%, 1/01/46 | | | |
| | | Mississippi – 1.7% (1.7% of Total Investments) | | | |
| 2,500 | | Mississippi State, General Obligation Bonds, Build America Taxable Bond Series 2010F, | No Opt. Call | AA | 2,425,850 |
| | | 5.245%, 11/01/34 | | | |
| | | Missouri – 2.8% (2.7% of Total Investments) | | | |
| 1,150 | | Curators of the University of Missouri, System Facilities Revenue Bonds, Build America Taxable | No Opt. Call | AA+ | 1,202,877 |
| | | Bonds, Series 2010, 5.792%, 11/01/41 | | | |
| 2,500 | | Missouri Joint Municipal Electric Utility Commission, Prairie State Power Project Revenue | No Opt. Call | A3 | 2,750,400 |
| | | Bond, Federally Taxable Build America Bonds – Direct Pay, Series 2010A, 7.897%, 1/01/42 | | | |
| 3,650 | | Total Missouri | | | 3,953,277 |
Nuveen Investments 21
| | |
| | Nuveen Build America Bond Opportunity Fund (continued) |
| NBD | Portfolio of Investments March 31, 2011 |
| | | | | | |
| Principal | | | Optional Call | | |
| Amount (000) | | Description (1) | Provisions (2) | Ratings (3) | Value |
| | | Nevada – 2.8% (2.7% of Total Investments) | | | |
| $ 1,615 | | Clark County, Nevada, Airport Revenue Bonds, Senior Lien Series 2009B, 6.881%, 7/01/42 | 7/19 at 100.00 | Aa2 | $ 1,614,968 |
| 2,000 | | Washoe County, Nevada, Highway Revenue, Motor Vehicle Fuel Tax Bonds, Federally Taxable Direct | No Opt. Call | A+ | 2,235,240 |
| | | Pay Build America Bonds, Series 2010E, 7.969%, 2/01/40 | | | |
| 3,615 | | Total Nevada | | | 3,850,208 |
| | | New Jersey – 5.5% (5.4% of Total Investments) | | | |
| 3,000 | | New Jersey Transportation Trust Fund Authority, Transportation System Bonds, Build America | No Opt. Call | Aa3 | 2,929,470 |
| | | Bonds Issuer Subsidy Program, Series 2010C, 5.754%, 12/15/28 | | | |
| 2,500 | | New Jersey Turnpike Authority, Revenue Bonds, Build America Taxable Bonds, Series 2010A, | No Opt. Call | A+ | 2,717,650 |
| | | 7.102%, 1/01/41 | | | |
| 2,050 | | Rutgers State University, New Jersey, Revenue Bonds, Build America Taxable Bond Series 2010H, | No Opt. Call | AA | 2,057,175 |
| | | 5.665%, 5/01/40 | | | |
| 7,550 | | Total New Jersey | | | 7,704,295 |
| | | New York – 10.1% (9.9% of Total Investments) | | | |
| 2,000 | | Dormitory Authority of the State of New York, State Personal Income Tax Revenue Bonds, Tender | No Opt. Call | AAA | 1,440,300 |
| | | Option Bond Trust B004, 24.523%, 3/15/40 (IF) | | | |
| 2,000 | | Metropolitan Transportation Authority, New York, Transportation Revenue Bonds, Federally | No Opt. Call | A | 2,051,120 |
| | | Taxable Issuer Subsidy Build America Bonds, Series 2010A, 6.668%, 11/15/39 | | | |
| 3,000 | | New York City Municipal Water Finance Authority, New York, Water and Sewer System Revenue | No Opt. Call | AA+ | 2,859,810 |
| | | Bonds, Second Generation Resolution, Build America Taxable Bonds, Fiscal 2011 Series 2010AA, | | | |
| | | 5.440%, 6/15/43 | | | |
| 2,000 | | New York City Municipal Water Finance Authority, New York, Water and Sewer System Revenue | No Opt. Call | AA+ | 2,074,900 |
| | | Bonds, Second Generation Resolution, Taxable Tender Option Bonds Trust T30001-2, | | | |
| | | 26.399%, 6/15/44 (IF) | | | |
| 2,955 | | New York City Transitional Finance Authority, New York, Building Aid Revenue Bonds, Build | No Opt. Call | AA– | 3,161,200 |
| | | America Taxable Bond Fiscal 2011 Series 2010S-1B, 6.828%, 7/15/40 | | | |
| 2,500 | | New York City, New York, General Obligation Bonds, Federally Taxable Build America Bonds, | 12/20 at 100.00 | AA | 2,596,450 |
| | | Series 2010-F1, 6.646%, 12/01/31 | | | |
| 14,455 | | Total New York | | | 14,183,780 |
| | | North Carolina – 1.0% (1.0% of Total Investments) | | | |
| 1,400 | | North Carolina Turnpike Authority, Triangle Expressway System State Annual Appropriation | 1/19 at 100.00 | AA | 1,446,732 |
| | | Revenue Bonds, Federally Taxable Issuer Subsidy Build America Bonds, Series 2009B, | | | |
| | | 6.700%, 1/01/39 | | | |
| | | Ohio – 4.0% (3.9% of Total Investments) | | | |
| 2,500 | | American Municipal Power Inc., Ohio, Meldahl Hydroelectric Projects Revenue Bonds, Federally | No Opt. Call | A | 2,603,600 |
| | | Taxable Build America Bonds, Series 2010B, 7.499%, 2/15/50 | | | |
| 3,000 | | Northeast Ohio Regional Sewer District, Wastewater Improvement Revenue Bonds, Build America | 11/20 at 100.00 | AA+ | 2,958,210 |
| | | Taxable Bonds, Series 2010, 6.038%, 11/15/40 | | | |
| 5,500 | | Total Ohio | | | 5,561,810 |
| | | Pennsylvania – 4.1% (4.0% of Total Investments) | | | |
| 1,000 | | Kiski Area School District, Westmoreland County, Pennsylvania, General Obligation Bonds, Build | 9/20 at 100.00 | Aa3 | 1,030,690 |
| | | America Taxable Bond Series 2010, 6.626%, 9/01/35 – AGM Insured | | | |
| 2,500 | | Pennsylvania State, General Obligation Bonds, Build America Taxable Bonds, Third Series 2010B, | 7/20 at 100.00 | Aa1 | 2,515,950 |
| | | 5.850%, 7/15/30 | | | |
| 2,500 | | Pennsylvania Turnpike Commission, Turnpike Revenue Bonds, Build America Taxable Bonds, Series | No Opt. Call | Aa3 | 2,210,425 |
| | | 2010B, 5.511%, 12/01/45 | | | |
| 6,000 | | Total Pennsylvania | | | 5,757,065 |
22 Nuveen Investments
| | | | | | |
| Principal | | | Optional Call | | |
| Amount (000) | | Description (1) | Provisions (2) | Ratings (3) | Value |
| | | South Carolina – 7.1% (6.9% of Total Investments) | | | |
| $ 205 | | South Carolina Public Service Authority, Electric System Revenue Bonds, Santee Cooper, | No Opt. Call | Aa2 | $ 281,106 |
| | | Federally Taxable Build America Tender Option Bond Trust T30002, 29.430%, 1/01/50 (IF) | | | |
| 8,985 | | South Carolina Public Service Authority, Electric System Revenue Bonds, Santee Cooper, | No Opt. Call | Aa2 | 9,652,316 |
| | | Series 2010A, 6.454%, 1/01/50 (UB) | | | |
| 9,190 | | Total South Carolina | | | 9,933,422 |
| | | Tennessee – 2.1% (2.1% of Total Investments) | | | |
| 3,000 | | Metropolitan Government Nashville & Davidson County Convention Center Authority, Tennessee, | No Opt. Call | Aa2 | 2,947,650 |
| | | Tourism Tax Revenue Bonds, Build America Taxable Bonds, Subordinate Lien Series 2010B, | | | |
| | | 6.731%, 7/01/43 | | | |
| | | Texas – 7.8% (7.6% of Total Investments) | | | |
| 1,810 | | Board of Regents, University of Texas System, Financing System Revenue Bonds, Build America | 8/19 at 100.00 | AAA | 1,866,345 |
| | | Taxable Bonds, Series 2009B, 6.276%, 8/15/41 | | | |
| 2,705 | | Dallas Area Rapid Transit, Texas, Senior Lien Sales Tax Revenue Bonds, Build America Taxable | No Opt. Call | AA+ | 2,800,811 |
| | | Bonds, Series 2009B, 5.999%, 12/01/44 | | | |
| 2,000 | | Dallas Convention Center Hotel Development Corporation, Texas, Hotel Revenue Bonds, Build | No Opt. Call | A+ | 2,015,980 |
| | | America Taxable Bonds, Series 09B, 7.088%, 1/01/42 | | | |
| 2,500 | | Dallas Independent School District, Dallas County, Texas, General Obligation Bonds, School | 2/21 at 100.00 | AAA | 2,676,900 |
| | | Building, Build America Taxable Bond Series 2010C, 6.450%, 2/15/35 | | | |
| 1,500 | | North Texas Tollway Authority, System Revenue Bonds, Subordinate Lien Taxable Revenue Bonds, | 2/20 at 100.00 | Baa3 | 1,558,095 |
| | | Federally Taxable Build America Bonds, Series 2010-B2, 8.910%, 2/01/30 | | | |
| 10,515 | | Total Texas | | | 10,918,131 |
| | | Virginia – 1.3% (1.3% of Total Investments) | | | |
| 3,000 | | Tobacco Settlement Financing Corporation of Virginia, Tobacco Settlement Asset Backed Bonds, | 6/12 at 100.00 | Baa3 | 1,846,020 |
| | | Refunding Senior Lien Series 2007A1, 6.706%, 6/01/46 | | | |
| | | Washington – 1.7% (1.7% of Total Investments) | | | |
| 1,000 | | Washington State Convention Center Public Facilities District, Lodging Tax Revenue Bonds, | No Opt. Call | Aa3 | 981,180 |
| | | Build America Taxable Bond Series 2010B, 6.790%, 7/01/40 | | | |
| 1,500 | | Washington State Economic Development Finance Authority, Biomedical Research Properties Lease | No Opt. Call | AA+ | 1,466,159 |
| | | Revenue Bonds, Build America Series 2010, 6.516%, 7/01/42 | | | |
| 2,500 | | Total Washington | | | 2,447,339 |
| $ 142,745 | | Total Investments (cost $140,941,211) – 102.6% | | | 143,595,037 |
| | | Floating Rate Obligations – (5.1)% | | | (7,190,000) |
| | | Other Assets Less Liabilities – 2.5% (5) | | | 3,567,299 |
| | | Net Assets – 100% | | | $ 139,972,336 |
Nuveen Investments 23
| | |
| | Nuveen Build America Bond Opportunity Fund (continued) |
| NBD | Portfolio of Investments March 31, 2011 |
| | | | | | | | | | | | |
| Investments in Derivatives | | | | | | | | | |
| | | | | | | | | | |
| Swaps outstanding at March 31, 2011: | | | | | | | | | | |
| | | Fund | | | | Fixed Rate | | | | Unrealized | |
| | Notional | Pay/Receive | Floating Rate | Fixed Rate | | Payment | Effective | Termination | | Appreciation | |
| Counterparty | Amount | Floating Rate | Index | (Annualized) | | Frequency | Date (6) | Date | | (Depreciation) | |
| Barclays Bank PLC | $ | 11,200,000 | Receive | 1-Month USD-LIBOR | 2.240 | % | Monthly | 12/17/10 | 12/17/15 | | $ | (6,786 | ) |
| Morgan Stanley | | 11,200,000 | Receive | 1-Month USD-LIBOR | 0.496 | | Monthly | 12/17/10 | 12/17/11 | | | (15,271 | ) |
| Morgan Stanley | | 11,200,000 | Receive | 1-Month USD-LIBOR | 1.295 | | Monthly | 12/17/10 | 12/17/13 | | | (4,663 | ) |
| Morgan Stanley | | 20,000,000 | Receive | 3-Month USD-LIBOR | 4.334 | | Semi-Annually | 1/12/12 | 1/12/40 | | | 417,800 | |
| Morgan Stanley | | 12,000,000 | Receive | 3-Month USD-LIBOR | 4.435 | | Semi-Annually | 2/24/12 | 2/24/40 | | | 110,009 | |
| Morgan Stanley | | 17,000,000 | Receive | 3-Month USD-LIBOR | 4.600 | | Semi-Annually | 1/27/12 | 1/27/40 | | | (348,172 | ) |
| | | | | | | | | | | | $ | 152,917 | |
| | |
| (1) | All percentages shown in the Portfolio of Investments are based on net assets unless otherwise noted. |
| (2) | Optional Call Provisions (not covered by the report of independent registered public accounting firm): Dates (month and year) and prices of the earliest |
| | optional call or redemption. There may be other call provisions at varying prices at later dates. Certain mortgage-backed securities may be subject to peri- |
| | odic principal paydowns. |
| (3) | Ratings (not covered by the report of independent registered public accounting firm): Using the highest of Standard & Poor’s Group (“Standard & Poor’s”), |
| | Moody’s Investor Service, Inc. (“Moody’s”) or Fitch, Inc. (“Fitch”) rating. Ratings below BBB by Standard & Poor’s, Baa by Moody’s or BBB by Fitch are |
| | considered to be below investment grade. Holdings designated N/R are not rated by any of these national rating agencies. |
| (4) | Investment, or portion of investment, has been pledged to collateralize the net payment obligations for investments in inverse floating rate transactions. |
| (5) | Other Assets Less Liabilities includes the Value and/or the Net Unrealized Appreciation (Depreciation) of derivative instruments as listed within Investments |
| | in Derivatives. |
| (6) | Effective date represents the date on which both the Fund and Counterparty commence interest payment accruals on each swap contract. |
| N/R | Not rated. |
| (IF) | Inverse floating rate investment. |
| (UB) | Underlying bond of an inverse floating rate trust reflected as a financing transaction. See Notes to Financial Statements, Footnote 1 – General Information |
| | and Significant Accounting Policies, Inverse Floating Rate Securities for more information. |
| USD-LIBOR | United States Dollar-London Inter-Bank Offered Rate. |
See accompanying notes to financial statements.
24 Nuveen Investments
| | | |
| Statement of | | |
| Assets & Liabilities | | |
| | March 31, 2011 | |
| | Build America | | | Build America | |
| | Bond | | | Bond Opportunity | |
| | (NBB) | | | (NBD) | |
| Assets | | | | | |
| Investments, at value (cost $561,462,908 and $140,941,211, respectively) | $ | 547,280,225 | | | $ | 143,595,037 | |
| Cash | | — | | | | 513,632 | |
| Unrealized appreciation on swaps | | 11,357,053 | | | | 159,703 | |
| Receivables: | | | | | | | |
| From Adviser | | — | | | | 154,853 | |
| Interest | | 12,437,254 | | | | 3,592,050 | |
| Other assets | | 32,783 | | | | — | |
| Total assets | | 571,107,315 | | | | 148,015,275 | |
| Liabilities | | | | | | | |
| Borrowings | | 44,000,000 | | | | — | |
| Floating rate obligations | | 24,810,000 | | | | 7,190,000 | |
| Unrealized depreciation on swaps | | — | | | | 6,786 | |
| Dividends payable | | 2,722,509 | | | | 677,393 | |
| Accrued expenses: | | | | | | | |
| Interest on borrowings | | 46,172 | | | | — | |
| Management fees | | 341,352 | | | | 104,262 | |
| Other | | 167,314 | | | | 64,498 | |
| Total liabilities | | 72,087,347 | | | | 8,042,939 | |
| Net assets | $ | 499,019,968 | | | $ | 139,972,336 | |
| Shares outstanding | | 26,461,985 | | | | 7,205,250 | |
| Net asset value per share outstanding | $ | 18.86 | | | $ | 19.43 | |
| Net assets consist of: | | | | | | | |
| Shares, $.01 par value per share | $ | 264,620 | | | $ | 72,053 | |
| Paid-in surplus | | 504,161,092 | | | | 137,260,222 | |
| Undistributed (Over-distribution of) net investment income | | 547,329 | | | | 545,608 | |
| Accumulated net realized gain (loss) | | (3,127,443 | ) | | | (712,290 | ) |
| Net unrealized appreciation (depreciation) | | (2,825,630 | ) | | | 2,806,743 | |
| Net assets | $ | 499,019,968 | | | $ | 139,972,336 | |
| Authorized shares | Unlimited | | | Unlimited | |
See accompanying notes to financial statements.
Nuveen Investments 25
| | | | | | | |
| Statement of | | | | | | |
| Operations | | | | | | |
| | | Build America | | | Build America | |
| | | Bond | | | Bond Opportunity | |
| | | (NBB) | * | | (NBD) | ** |
| Investment Income | | $ | 36,463,304 | | | $ | 3,785,559 | |
| Expenses | | | | | | | | |
| Management fees | | | 3,669,718 | | | | 332,078 | |
| Shareholders’ servicing agent fees and expenses | | | 239 | | | | 319 | |
| Interest expense | | | 1,166,818 | | | | 14,723 | |
| Custodian’s fees and expenses | | | 91,419 | | | | 8,395 | |
| Trustees’ fees and expenses | | | 14,871 | | | | 7,444 | |
| Professional fees | | | 83,090 | | | | 32,759 | |
| Shareholders’ reports – printing and mailing expenses | | | 90,806 | | | | 19,745 | |
| Investor relations expense | | | 36,708 | | | | 5,348 | |
| Other expenses | | | 16,877 | | | | 4,993 | |
| Total expenses before custodian fee credit | | | 5,170,546 | | | | 425,804 | |
| Custodian fee credit | | | (24,258 | ) | | | (39 | ) |
| Net expenses | | | 5,146,288 | | | | 425,765 | |
| Net investment income (loss) | | | 31,317,016 | | | | 3,359,794 | |
| Realized and Unrealized Gain (Loss) | | | | | | | | |
| Net realized gain (loss) from: | | | | | | | | |
| Investments | | | 8,023,380 | | | | (712,015 | ) |
| Swaps | | | (11,126,000 | ) | | | (90,877 | ) |
| Net unrealized appreciation (depreciation) of: | | | | | | | | |
| Investments | | | (14,182,683 | ) | | | 2,653,826 | |
| Swaps | | | 11,357,053 | | | | 152,917 | |
| Net realized and unrealized gain (loss) | | | (5,928,250 | ) | | | 2,003,851 | |
| Net increase (decrease) in net assets from operations | | $ | 25,388,766 | | | $ | 5,363,645 | |
| * | For the period April 27, 2010 (commencement of operations) through March 31, 2011. |
| ** | For the period November 23, 2010 (commencement of operations) through March 31, 2011. |
See accompanying notes to financial statements.
26 Nuveen Investments
| | | | | |
| Statement of | | | | |
| Changes in Net Assets | | | | |
| | Build America | | Build America | |
| | Bond | | Bond Opportunity | |
| | (NBB) | * | (NBD) | ** |
| Operations | | | | |
| Net investment income | $ | 31,317,016 | | $ | 3,359,794 | |
| Net realized gain (loss) from: | | | | | | |
| Investments | | 8,023,380 | | | (712,015 | ) |
| Swaps | | (11,126,000 | ) | | (90,877 | ) |
| Net unrealized appreciation (depreciation) of: | | | | | | |
| Investments | | (14,182,683 | ) | | 2,653,826 | |
| Swaps | | 11,357,053 | | | 152,917 | |
| Net increase (decrease) in net assets from operations | | 25,388,766 | | | 5,363,645 | |
| Distributions to Shareholders | | | | | | |
| From net investment income | | (30,794,510 | ) | | (2,723,584 | ) |
| Decrease in net assets from distributions to shareholders | | (30,794,510 | ) | | (2,723,584 | ) |
| Capital Share Transactions | | | | | | |
| Proceeds from sale of shares, net of offering costs | | 502,469,250 | | | 137,232,000 | |
| Net proceeds from shares issued to shareholders due to reinvestment of distributions | | 1,856,187 | | | — | |
| Net increase (decrease) in net assets applicable to shares from capital share transactions | | 504,325,437 | | | 137,232,000 | |
| Net increase (decrease) in net assets | | 498,919,693 | | | 139,872,061 | |
| Net assets at the beginning of period | | 100,275 | | | 100,275 | |
| Net assets at the end of period | $ | 499,019,968 | | $ | 139,972,336 | |
| Undistributed (Over-distribution of) net investment income at the end of period | $ | 547,329 | | $ | 545,608 | |
| * | For the period April 27, 2010 (commencement of operations) through March 31, 2011. |
| ** | For the period November 23, 2010 (commencement of operations) through March 31, 2011. |
See accompanying notes to financial statements.
Nuveen Investments 27
| | | |
| Statement of | | |
| Cash Flows | | |
| | Build America | |
| | Bond | |
| | (NBB)* | |
| Cash Flows from Operating Activities: | | |
| Net Increase (Decrease) in Net Assets from Operations | $ | 25,388,766 | |
| Adjustments to reconcile the net increase (decrease) in net assets from operations to net cash | | | |
| provided by (used in) operating activities: | | | |
| Purchases of investments | | (1,120,458,403 | ) |
| Proceeds from sales and maturities of investments | | 567,409,551 | |
| Proceeds from (Purchases of) short-term investments, net | | (545,330 | ) |
| Proceeds from terminated swap contracts | | (11,126,000 | ) |
| Amortization (Accretion) of premiums and discounts, net | | 154,654 | |
| (Increase) Decrease in: | | | |
| Receivable for interest | | (12,437,254 | ) |
| Other assets | | (32,783 | ) |
| Increase (Decrease) in: | | | |
| Accrued interest on borrowings | | 46,172 | |
| Accrued management fees | | 341,352 | |
| Accrued other expenses | | 167,314 | |
| Net realized (gain) loss from: | | | |
| Investments | | (8,023,380 | ) |
| Swaps | | 11,126,000 | |
| Net unrealized (appreciation) depreciation of: | | | |
| Investments | | 14,182,683 | |
| Swaps | | (11,357,053 | ) |
| Net cash provided by (used in) operating activities | | (545,163,711 | ) |
| Cash Flows from Financing Activities: | | | |
| Increase (Decrease) in: | | | |
| Borrowings | | 44,000,000 | |
| Floating rate obligations | | 24,810,000 | |
| Cash distributions paid to shareholders | | (26,215,814 | ) |
| Proceeds for sale of shares, net of offering costs | | 502,469,250 | |
| Net cash provided by (used in) financing activities | | 545,063,436 | |
| Net Increase (Decrease) in Cash | | (100,275 | ) |
| Cash at the beginning of period | | 100,275 | |
| Cash at the End of Period | $ | — | |
* For the period April 27, 2010 (commencement of operations) through March 31, 2011
Supplemental Disclosure of Cash Flow Information
Cash paid for interest was $800,983.
Non-cash financing activities not included herein consists of reinvestments of distributions of $1,856,186.
See accompanying notes to financial statements.
28 Nuveen Investments
Financial
Highlights
Nuveen Investments 29
| |
| Financial |
| Highlights |
| |
| |
| Selected data for a share outstanding throughout each period: |
| | | | | | | | | | | | | | | | | | | | | | | | | | | | | | | |
| | | | | Investment Operations | | | | | | Less Distributions | | | | | | | | | | | |
| | | | | | Net | | | Net | | | | | | | | | | | | | | | | | | | | | | |
| | | Beginning | | | Investment | | | Realized/ | | | | | | Net | | | | | | | | | | | | Ending | | | Ending | |
| | | Net Asset | | | Income | | | Unrealized | | | | | | Investment | | | Capital | | | | | | Offering | | | Net Asset | | | Market | |
| | | Value | | | (Loss)(a) | | | Gain (Loss) | | | Total | | | Income | | | Gains | | | Total | | | Costs | | | Value | | | Value | |
| Build America Bond (NBB) | | | | | | | | | | | | | | | | | | | | | | | | | | | | |
| Year Ended 3/31: | | | | | | | | | | | | | | | | | | | | | | | | | | | | |
| 2011(f) | | $ | 19.10 | | | $ | 1.19 | | | $ | (.22 | ) | | $ | .97 | | | $ | (1.17 | ) | | $ | — | | | $ | (1.17 | ) | | $ | (0.04 | ) | | $ | 18.86 | | | $ | 18.06 | |
| Build America Bond Opportunity (NBD) | | | | | | | | | | | | | | | | | | | | | | | | | | | | | | | | | |
| Year Ended 3/31: | | | | | | | | | | | | | | | | | | | | | | | | | | | | | | | | | | | | | |
| 2011(g) | | | 19.10 | | | | .47 | | | | .28 | | | | .75 | | | | (.38 | ) | | | — | | | | (.38 | ) | | | (0.04 | ) | | | 19.43 | | | | 18.63 | |
| | Borrowings at End of Period | |
| | Aggregate | | | | |
| | | Amount | | | Asset | |
| | Outstanding | | | Coverage | |
| | | | (000 | ) | | Per $1,000 | |
| Build America Bond (NBB) | | | | | | | |
| Year Ended 3/31: | | | | | | | |
| 2011(f) | | $ | 44,000 | | | $ | 12,341 | |
| Build America Bond Opportunity (NBD) | | | | | |
| Year Ended 3/31: | | | | | | | | |
| 2011(g) | | | — | | | | — | |
30 Nuveen Investments
| | | | | | | | | | | | | | | | | | | | |
| | | | | | | Ratios/Supplemental Data | | | | |
| | | | | | | | | | | | | Ratios to Average | | | | | | | |
| Total Returns | | | | | | | | | Net Assets(c) | | | | | | | |
| | | | | | | | | | Expenses | | | Expenses | | | | | | | |
| Based on | | | Based on | | | Ending | | | Including | | | Excluding | | | Net | | | Portfolio | |
| Market | | | Net Asset | | | Net Assets | | | Costs of | | | Costs of | | | Investment | | | Turnover | |
| Value(b) | | | Value(b) | | | | (000) | | | Leverage(d)(e) | | | Leverage | | | Income(d) | | | Rate | |
| | | | | | | | | | | | | | | | | | | | | |
| | | | | | | | | | | | | | | | | | | | | |
| | (3.99 | )% | | | 4.90 | % | | $ | 499,020 | | | | 1.11 | %* | | | .86 | %* | | | 6.70 | %* | | | 100 | % |
| | | | | | | | | | | | | | | | | | | | | | | | | | | |
| | | | | | | | | | | | | | | | | | | | | | | | | | | |
| | (4.96 | ) | | | 3.73 | | | | 139,972 | | | | .87 | * | | | .84 | * | | | 6.90 | * | | | 77 | |
| (a) | Per share Net Investment Income (Loss) is calculated using the average daily shares method. |
| (b) | Total Return Based on Market Value is the combination of changes in the market price per share and the effect of reinvested dividend income and reinvested capital gains distributions, if any, at the average price paid per share at the time of reinvestment. The last dividend declared in the period, which is typically paid on the first business day of the following month, is assumed to be reinvested at the ending market price. The actual reinvestment for the last dividend declared in the period may take place over several days, and in some instances may not be based on the market price, so the actual reinvestment price may be different from the price used in the calculation. |
| | Total returns are not annualized. |
| | |
| | Total Return Based on Net Asset Value is the combination of changes in net asset value, reinvested dividend income at net asset value and reinvested capital gains distributions at net asset value, if any. The last dividend declared in the period, which is typically paid on the first business day of the following month, is assumed to be reinvested at the ending net asset value. The actual reinvest price for the last dividend declared in the period may often be based on the Fund’s market price (and not its net asset value), and therefore may be different from the price used in the calculation. Total returns are not annualized. |
| (c) | Ratios do not reflect the effect of custodian fee credits earned on the Fund’s net cash on deposit with the custodian bank, where applicable. |
| (d) | Each ratio includes the effect of the interest expense and fees paid on borrowings, where applicable, as described in Footnote 8 – Borrowing Arrangements, as follows: |
| | Ratios of Borrowings Interest Expense and Fees to |
| | Average Net Assets |
| Build America Bond (NBB) | |
| Year Ended 3/31: | |
| 2011(f) | .24%* |
| (e) | The expense ratios reflect, among other things, interest expense deemed to have been paid by the Fund on the floating rate certificates issued by the special purpose trusts for the self-deposited inverse floaters held by the Fund, where applicable, as described in Footnote 1 – General Information and Significant Accounting Policies Inverse Floating Rate Securities. |
| (f) | For the period April 27, 2010 (commencement of operations) through March 31, 2011. |
| (g) | For the period November 23, 2010 (commencement of operations) through March 31, 2011. |
| * | Annualized. |
See accompanying notes to financial statements.
Nuveen Investments 31
Notes to
Financial Statements
1. General Information and Significant Accounting Policies
General Information
The funds covered in this report and their corresponding New York Stock Exchange (“NYSE”) symbols are Nuveen Build America Bond Fund (NBB) and Nuveen Build America Bond Opportunity Fund (NBD) (collectively, the “Funds”). The Funds are registered under the Investment Company Act of 1940, as amended, as closed-end, registered investment companies.
Effective January 1, 2011, the Funds’ adviser, Nuveen Asset Management, a wholly-owned subsidiary of Nuveen Investments, Inc. (“Nuveen”), changed its name to Nuveen Fund Advisors, Inc. (the “Adviser”). Concurrently, the Adviser formed a wholly-owned subsidiary, Nuveen Asset Management, LLC (the “Sub-Adviser”), to house its portfolio management capabilities and to serve as the Funds’ sub-adviser, and the Funds’ portfolio manager became an employee of the Sub-Adviser. This allocation of responsibilities between the Adviser and the Sub-Adviser affects both of the Funds. The Adviser will compensate the Sub-Adviser for the portfolio management services it provides to the Funds from each Fund’s management fee.
Prior to the commencement of operations, the Funds had no operations other than those related to organizational matters, the initial capital contribution of $100,275 to each Fund by the Adviser, and the recording of the organization expense ($11,000 per Fund) and their reimbursement by the Adviser.
Each Fund’s primary investment objective is to provide current income through investments in taxable municipal securities. Each Fund’s secondary investment objective is to seek enhanced portfolio value and total return. The Funds seek to achieve their investment objectives by investing primarily in a diversified portfolio of taxable municipal securities known as Build America Bonds (or “BABs”), which make up 80% of their managed assets (as defined in Footnote 7 – Management Fees and Other Transactions with Affiliates). BABs are taxable municipal securities that include bonds issued by state and local governments to finance capital projects such as public schools, roads, transportation infrastructure, bridges, ports and public buildings, among others, pursuant to the American Recovery and Reinvestment Act of 2009, which offer municipal issuers a federal subsidy equal to 35% of a bond’s interest payments. Under normal circumstances, the Funds may invest 20% of their managed assets in securities other than BABs, including taxable and tax-exempt municipal securities, U.S. Treasury and other U.S. government agency securities. At least 80% of each Fund’s managed assets will be invested in securities that are investment grade quality at the time of purchase, as rated by at least one independent rating agency or judged to be of comparable quality by the Sub-Adviser. In addition, each Fund will use an integrated leverage and hedging strategy that the Fund has the potential to enhance income and risk-adjusted total return over time. Each Fund may employ leverage instruments such as borrowings, including loans from certain financial institutions, and portfolio investments that have the economic effect of leverage, including investments in inverse floating rate securities. Each Fund’s overall goal is to outperform over time the Barclays Capital Build America Bond Index, an unleveraged index representing the BABs market, while maintaining a comparable overall level of interest rate risk.
The BAB program expired on December 31, 2010, and was not renewed. Build America Bond (NBB) and Build American Bond Opportunity (NBD) each have contingent term provisions stating that if there are no new issuances of BABs or similarly U.S. Treasury-subsidized taxable municipal bonds for any twenty-four month period ending on or before December 31, 2014, Build America Bond (NBB) and Build American Bond Opportunity (NBD) will terminate on or around June 30, 2020, and December 31, 2020, respectively.
Significant Accounting Policies
The following is a summary of significant accounting policies followed by the Funds in the preparation of their financial statements in accordance with U.S. generally accepted accounting principles (“U.S. GAAP”).
Investment Valuation
Prices of municipal bonds and swap contracts are provided by a pricing service approved by the Funds’ Board of Trustees. These securities are generally classified as Level 2 for fair value measurement purposes. When price quotes are not readily available (which is usually the case for municipal bonds) the pricing service establishes a security’s fair value using methods that may include consideration of the following: yields or prices of investments of comparable quality, type of issue, coupon, maturity and rating, market quotes or indications of value from security dealers, evaluations of anticipated cash flows or collateral, general market conditions and other information and analysis, including the obligor’s credit characteristics considered relevant. In pricing certain securities, particularly less liquid and lower quality securities, the pricing service may consider information about a security, its issuer, or market activity provided by the Adviser. These securities are generally classified as Level 2 or Level 3 depending on the priority of the significant inputs.
32 Nuveen Investments
Repurchase agreements are valued at contract amount plus accrued interest, which approximates market value. These securities are generally classified as Level 2.
Certain securities may not be able to be priced by the pre-established pricing methods as described above. Such securities may be valued by the Funds’ Board of Trustees or its designee at fair value. These securities generally include, but are not limited to, restricted securities (securities which may not be publicly sold without registration under the Securities Act of 1933, as amended) for which a pricing service is unable to provide a market price; securities whose trading has been formally suspended; debt securities that have gone into default and for which there is no current market quotation; a security whose market price is not available from a pre-established pricing source; a security with respect to which an event has occurred that is likely to materially affect the value of the security after the market has closed but before the calculation of a Fund’s net asset value (as may be the case in non-U.S. markets on which the security is primarily traded) or make it difficult or impossible to obtain a reliable market quotation; and a security whose price, as provided by the pricing service, is not deemed to reflect the security’s fair value. As a general principle, the fair value of a security would appear to be the amount that the owner might reasonably expect to receive for it in a current sale. A variety of factors may be considered in determining the fair value of such securities, which may include consideration of the following: yields or prices of investments of comparable quality, type of issue, coupon, maturity and rating, market quotes or indications of value from security dealers, evaluations of anticipated cash flows or collateral, general market conditions and other information and analysis, including the obligor’s credit characteristics considered relevant. These securities are generally classified as Level 2 or Level 3 depending on the priority of the significant inputs. Regardless of the method employed to value a particular security, all valuations are subject to review by the Funds’ Board of Trustees or its designee.
Refer to Footnote 2 – Fair Value Measurements for further details on the leveling of securities held by the Funds as of the end of the reporting period.
Investment Transactions
Investment transactions are recorded on a trade date basis. Realized gains and losses from transactions are determined on the specific identification method, which is the same basis used for federal income tax purposes. Investments purchased on a when-issued/delayed delivery basis may have extended settlement periods. Any investments so purchased are subject to market fluctuation during this period. The Funds have instructed the custodian to segregate assets with a current value at least equal to the amount of the when-issued/delayed delivery purchase commitments. At March 31, 2011, the Funds had no such outstanding purchase commitments.
Investment Income
Investment income, which reflects the amortization of premiums and includes accretion of discounts for financial reporting purposes, is recorded on an accrual basis. Investment income also reflects paydown gains and losses, if any.
Income Taxes
Each Fund is a separate taxpayer for federal income tax purposes. Each Fund intends to distribute substantially all of its net investment income and net capital gains to shareholders and to otherwise comply with the requirements of Subchapter M of the Internal Revenue Code applicable to regulated investment companies. Therefore, no federal income tax provision is required.
For all open tax years and all major taxing jurisdictions, management of the Funds has concluded that there are no significant uncertain tax positions that would require recognition in the financial statements. Open tax years are those that are open for examination by taxing authorities (i.e., generally the last four tax year ends and the interim tax period since then). Furthermore, management of the Funds is also not aware of any tax positions for which it is reasonably possible that the total amounts of unrecognized tax benefits will significantly change in the next twelve months.
Dividends and Distributions to Shareholders
Dividends to shareholders are declared monthly. Net realized capital gains from investment transactions, if any, are distributed to shareholders at least annually. Furthermore, capital gains are distributed only to the extent they exceed available capital loss carryforwards.
Distributions to shareholders are recorded on the ex-dividend date. The amount and timing of distributions are determined in accordance with federal income tax regulations, which may differ from U.S. GAAP.
Inverse Floating Rate Securities
Each Fund is authorized to invest in inverse floating rate securities. An inverse floating rate security is created by depositing a municipal bond, typically with a fixed interest rate, into a special purpose trust created by a broker-dealer. In turn, this trust (a) issues floating rate certificates, in face amounts equal to some fraction of the deposited bond’s par amount or market value, that typically pay short-term tax-exempt interest rates to third parties, and (b) issues to a long-term investor (such as one of the Funds) an inverse floating rate certificate (sometimes referred to as an “inverse floater”) that represents all remaining or residual interest in the trust. The income received by the inverse floater holder varies inversely with the short-term rate paid to the floating rate certificates’ holders, and in most circumstances the inverse floater holder bears substantially all of the underlying bond’s downside investment risk and also benefits disproportionately from any potential appreciation of the underlying bond’s value. The price of an inverse floating rate security will be more volatile than that of the underlying bond because the interest rate is dependent on not only the fixed coupon rate of the underlying bond but also on the short-term interest paid on the floating rate certificates, and because the inverse floating rate security essentially bears the risk of loss of the greater face value of the underlying bond.
Nuveen Investments 33
Notes to
Financial Statements (continued)
A Fund may purchase an inverse floating rate security in a secondary market transaction without first owning the underlying bond (referred to as an “externally-deposited inverse floater”), or instead by first selling a fixed-rate bond to a broker-dealer for deposit into the special purpose trust and receiving in turn the residual interest in the trust (referred to as a “self-deposited inverse floater”). The inverse floater held by a Fund gives the Fund the right (a) to cause the holders of the floating rate certificates to tender their notes at par, and (b) to have the broker transfer the fixed-rate bond held by the trust to the Fund, thereby collapsing the trust. An investment in an externally-deposited inverse floater is identified in the Portfolio of Investments as “(IF) – Inverse floating rate investment.” An investment in a self-deposited inverse floater is accounted for as a financing transaction. In such instances, a fixed-rate bond deposited into a special purpose trust is identified in the Portfolio of Investments as “(UB) – Underlying bond of an inverse floating rate trust reflected as a financing transaction,” with the Fund accounting for the short-term floating rate certificates issued by the trust as “Floating rate obligations” on the Statement of Assets and Liabilities. In addition, the Fund reflects in “Investment Income” the entire earnings of the underlying bond and the related interest paid to the holders of the short-term floating rate certificates as a component of “Interest expense” on the Statement of Operations.
During the period from each Fund’s commencement of operations through March 31, 2011, each Fund invested in externally-deposited inverse floaters and/or self-deposited inverse floaters.
Each Fund may also enter into shortfall and forbearance agreements (sometimes referred to as a “recourse trust” or “credit recovery swap”) (such agreements referred to herein as “Recourse Trusts”) with a broker-dealer by which a Fund agrees to reimburse the broker-dealer, in certain circumstances, for the difference between the liquidation value of the fixed-rate bond held by the trust and the liquidation value of the floating rate certificates issued by the trust plus any shortfalls in interest cash flows. Under these agreements, a Fund’s potential exposure to losses related to or on inverse floaters may increase beyond the value of a Fund’s inverse floater investments as a Fund may potentially be liable to fulfill all amounts owed to holders of the floating rate certificates. At period end, any such shortfall is recognized as “Unrealized depreciation on Recourse Trusts” on the Statement of Assets and Liabilities.
| | | |
| At March 31, 2011, each Fund’s maximum exposure to externally-deposited Recourse Trusts, was as follows: | | |
| | Build | Build America |
| | America | Bond |
| | Bond | Opportunity |
| | (NBB) | (NBD) |
| Maximum exposure to Recourse Trusts | $91,190,000 | $40,810,000 |
The average floating rate obligations outstanding and average annual interest rate and fees related to self-deposited inverse floaters for the Funds during the period from each Fund’s commencement of operations through March 31, 2011, were as follows:
| | | | | | | |
| | | Build | | | Build America | |
| | | America | | | Bond | |
| | | Bond | | | Opportunity | |
| | | (NBB) | * | | (NBD) | ** |
| Average floating rate obligations outstanding | | $ | 7,444,521 | | | $ | 1,989,562 | |
| Average annual interest rate and fees | | | 0.75 | % | | | 0.74 | % |
| * | For the period April 27, 2010 (commencement of operations) through March 31, 2011. |
| ** | For the period November 23, 2010 (commencement of operations) through March 31, 2011. |
Swap Contracts
Each Fund is authorized to enter into interest rate swap and forward interest rate swap contracts consistent with their investment objectives and policies to reduce, increase or otherwise alter its risk profile or to alter its portfolio characteristics (i.e. duration, yield curve positioning and credit quality), and is subject to interest rate risk in the normal course of pursuing its investment objectives. Each Fund’s use of interest rate swap and forward interest rate swap transactions is intended to help the Fund manage its overall interest rate sensitivity, either shorter or longer, generally to more closely align the Fund’s interest rate sensitivity with that of the broader market.
Interest rate swap contracts involve each Fund’s agreement with the counterparty to pay or receive a fixed rate payment in exchange for the counterparty receiving or paying a variable rate payment. Forward interest rate swap transactions involve a Fund’s agreement with a counterparty to pay, in the future, a fixed or variable rate payment in exchange for the counterparty paying a Fund a variable or fixed rate payment, the accruals for which would begin at a specified date in the future (the “effective date”). The amount of the payment obligation on a swap contract is based on the notional amount and the termination date of the swap (which is akin to a bond’s maturity). The value of a Fund’s swap commitment will increase or decrease based primarily on the extent to which long-term interest rates for bonds having a maturity of the swap’s termination date increase or decrease. Interest rate swap and forward interest rate swap contracts are valued daily. Upon entering into an interest rate swap (and beginning on the effective date for a forward interest rate swap), each Fund accrues the fixed rate payment expected to be paid or received and the variable rate payment expected to be received or paid on a daily basis, and recognizes the daily change in the market value of the Fund’s contractual rights and obligations under the contracts. The net amount recorded on these transactions, for each counterparty is recognized on the Statement of Assets and
34 Nuveen Investments
Liabilities as a component of “Unrealized appreciation or depreciation on swaps” with the change during the fiscal period recognized on the Statement of Operations as a component of “Net unrealized appreciation (depreciation) of swaps.”
When an interest rate swap or forward interest rate swap contract is terminated, it ordinarily does not involve the delivery of securities or other underlying assets or principal, but rather is settled in cash on a net basis. Once periodic payments are settled in cash, they are combined with the net realized gain or loss recorded upon the termination of the swap contracts. For tax purposes, periodic payments are treated as ordinary income or expense. Net realized gains and losses on swap contracts during the fiscal period are recognized on the Statement of Operations as a component of “Net realized gain (loss) from swaps.”
The Funds entered into interest rate and forward interest rate swap transactions to reduce the duration of each Fund’s portfolio as well as to fix its interest cost of leverage. The average notional amount of swap contracts outstanding during the period from each Fund’s commencement of operations through March 31, 2011, was as follows:
| | | | | |
| | Build | | Build America | |
| | America | | Bond | |
| | Bond | | Opportunity | |
| | (NBB) | * | (NBD) | ** |
| Average notional amount of swap contracts outstanding*** | $128,150,000 | | $82,600,000 | |
| * | For the period April 27, 2010 (commencement of operations) through March 31, 2011. |
| ** | For the period November 23, 2010 (commencement of operations) through March 31, 2011. |
| *** | Includes both interest rate and forward interest rate swaps. The average notional amount is calculated based on the outstanding notional at the beginning of the fiscal year and at the end of each fiscal quarter within the current fiscal year. |
Refer to Footnote 3 – Derivative instruments and Hedging Activities for further details on swap contract activity.
Market and Counterparty Credit Risk
In the normal course of business each Fund may invest in financial instruments and enter into financial transactions where risk of potential loss exists due to changes in the market (market risk) or failure of the other party to the transaction to perform (counterparty credit risk). The potential loss could exceed the value of the financial assets recorded on the financial statements. Financial assets, which potentially expose each Fund to counterparty credit risk, consist principally of cash due from counterparties on forward, option and swap transactions, when applicable. The extent of each Fund’s exposure to counterparty credit risk in respect to these financial assets approximates their carrying value as recorded on the Statement of Assets and Liabilities. Futures contracts, when applicable, expose a Fund to minimal counterparty credit risk as they are exchange traded and the exchange’s clearinghouse, which is counterparty to all exchange traded futures, guarantees the futures contracts against default.
Each Fund helps manage counterparty credit risk by entering into agreements only with counterparties the Adviser believes have the financial resources to honor their obligations and by having the Adviser monitor the financial stability of the counterparties. Additionally, counterparties may be required to pledge collateral daily (based on the daily valuation of the financial asset) on behalf of each Fund with a value approximately equal to the amount of any unrealized gain above a pre-determined threshold. Reciprocally, when each Fund has an unrealized loss, the Funds have instructed the custodian to pledge assets of the Funds as collateral with a value approximately equal to the amount of the unrealized loss above a pre-determined threshold. Collateral pledges are monitored and subsequently adjusted if and when the valuations fluctuate, either up or down, by at least the predetermined threshold amount.
Zero Coupon Securities
Each Fund is authorized to invest in zero coupon securities. A zero coupon security does not pay a regular interest coupon to its holders during the life of the security. Tax-exempt income to the holder of the security comes from accretion of the difference between the original purchase price of the security at issuance and the par value of the security at maturity and is effectively paid at maturity. The market prices of zero coupon securities generally are more volatile than the market prices of securities that pay interest periodically.
Repurchase Agreements
In connection with transactions in repurchase agreements, it is each Fund’s policy that its custodian take possession of the underlying collateral securities, the fair value of which exceeds the principal amount of the repurchase transaction, including accrued interest, at all times. If the counterparty defaults, and the fair value of the collateral declines, realization of the collateral may be delayed or limited.
Organization Expenses and Offering Costs
The Adviser has agreed to reimburse all organization expenses ($11,000 for each Fund) and pay all offering costs (other than the sales load) that exceed $.04 per share for each Fund. The Funds’ share of offering costs ($1,054,500 and $288,000, for Build America Bond (NBB) and Build America Bond Opportunity (NBD), respectively) were recorded as a reduction of the proceeds from the sale of shares.
Nuveen Investments 35
Notes to
Financial Statements (continued)
Custodian Fee Credit
Each Fund has an arrangement with the custodian bank whereby certain custodian fees and expenses are reduced by net credits earned on each Fund’s cash on deposit with the bank. Such deposit arrangements are an alternative to overnight investments. Credits for cash balances may be offset by charges for any days on which a Fund overdraws its account at the custodian bank.
Indemnifications
Under the Funds’ organizational documents, their officers and trustees are indemnified against certain liabilities arising out of the performance of their duties to the Funds. In addition, in the normal course of business, the Funds enter into contracts that provide general indemnifications to other parties. The Funds’ maximum exposure under these arrangements is unknown as this would involve future claims that may be made against the Funds that have not yet occurred. However, the Funds have not had prior claims or losses pursuant to these contracts and expect the risk of loss to be remote.
Use of Estimates
The preparation of financial statements in conformity with U.S. GAAP requires management to make estimates and assumptions that affect the reported amounts of assets and liabilities at the date of the financial statements and the reported amounts of increases and decreases in net assets from operations during the reporting period. Actual results may differ from those estimates.
2. Fair Value Measurements
Fair value is defined as the price that the Funds would receive upon selling an investment or transferring a liability in an orderly transaction to an independent buyer in the principal or most advantageous market of the investment. A three-tier hierarchy is used to maximize the use of observable market data and minimize the use of unobservable inputs and to establish classification of fair value measurements for disclosure purposes. Observable inputs reflect the assumptions market participants would use in pricing the asset or liability. Observable inputs are based on market data obtained from sources independent of the reporting entity. Unobservable inputs reflect the reporting entity’s own assumptions about the assumptions market participants would use in pricing the asset or liability. Unobservable inputs are based on the best information available in the circumstances. The three-tier hierarchy of inputs is summarized in the three broad levels listed below:
Level 1 – Quoted prices in active markets for identical securities.
Level 2 – Other significant observable inputs (including quoted prices for similar securities, interest rates, prepayment speeds, credit risk, etc.).
Level 3 – Significant unobservable inputs (including management’s assumptions in determining the fair value of investments).
The inputs or methodologies used for valuing securities are not an indication of the risk associated with investing in those securities. The following is a summary of each Fund’s fair value measurements as of March 31, 2011:
| | | | | | | | | | | | | |
| Build America Bond (NBB) | | Level 1 | | | Level 2 | | | Level 3 | | | Total | |
| Investments: | | | | | | | | | | | | |
| Municipal Bonds | | $ | — | | | $ | 546,734,895 | | | $ | — | | | $ | 546,734,895 | |
| Short-Term Investments | | | — | | | | 545,330 | | | | — | | | | 545,330 | |
| Derivatives: | | | | | | | | | | | | | | | | |
| Swaps* | | | — | | | | 11,357,053 | | | | — | | | | 11,357,053 | |
| Total | | $ | — | | | $ | 558,637,278 | | | $ | — | | | $ | 558,637,278 | |
| Build America Bond Opportunity (NBD) | | Level 1 | | | Level 2 | | | Level 3 | | | Total | |
| Investments: | | | | | | | | | | | | | | | | |
| Municipal Bonds | | $ | — | | | $ | 143,595,037 | | | $ | — | | | $ | 143,595,037 | |
| Derivatives: | | | | | | | | | | | | | | | | |
| Swaps* | | | — | | | | 152,917 | | | | — | | | | 152,917 | |
| Total | | $ | — | | | $ | 143,747,954 | | | $ | — | | | $ | 143,747,954 | |
* Represents net unrealized appreciation (depreciation).
During the period from each Fund’s commencement of operations through March 31, 2011, the Funds recognized no significant transfers to/from Level 1, Level 2 or Level 3.
3. Derivative Instruments and Hedging Activities
The Funds record derivative instruments at fair value, with changes in fair value recognized on the Statement of Operations, when applicable. Even though the Funds’ investments in derivatives may represent economic hedges, they are not considered to be hedge transactions for financial reporting purposes. For additional information on the derivative instruments in which each Fund was invested during and at the end of the reporting period, refer to the Portfolios of Investments, Financial Statements and Footnote 1 – General Information and Significant Accounting Policies.
36 Nuveen Investments
The following tables present the fair value of all derivative instruments held by the Funds as of March 31, 2011, the location of these instruments on the Statement of Assets and Liabilities, and the primary underlying risk exposure.
| | | | | | | | | | |
| Build America Bond (NBB) | | Location on the Statement of Assets and Liabilities | | |
| | | Asset Derivatives | | | | Liability Derivatives | | | |
| Underlying | Derivative | | | | | | | | |
| Risk Exposure | Instrument | Location | | Value | | Location | | Value | |
| Interest Rate | Swaps | Unrealized appreciation on swaps* | | $ | 11,357,053 | | Unrealized depreciation on swaps* | | $ | — | |
| Build America Bond Opportunity (NBD) | Location on the Statement of Assets and Liabilities | | | |
| | | Asset Derivatives | | | | | Liability Derivatives | | | | |
| Underlying | Derivative | | | | | | | | | | |
| Risk Exposure | Instrument | Location | | Value | | Location | | Value | |
| Interest Rate | Swaps | Unrealized appreciation on swaps* | | $ | 527,809 | | Unrealized depreciation on swaps* | | $ | 374,892 | |
* Represents cumulative gross unrealized appreciation (depreciation) of swap contracts as reported in the Portfolios of Investments. | | | | | | |
The following tables present the amount of net realized gain (loss) and net unrealized appreciation (deprecation) recognized for the period from each Fund’s commencement of operations through March 31, 2011, on derivative instruments, as well as the primary risk exposure associated with each.
| | | | | |
| | Build | | Build America | |
| | America | | Bond | |
| | Bond | | Opportunity | |
| Net Realized Gain (Loss) from Swaps | (NBB) | * | (NBD) | ** |
| Risk Exposure | | | | |
| Interest Rate | $(11,126,000) | | $(90,877) | |
| | Build | | Build America | |
| | America | | Bond | |
| | Bond | | Opportunity | |
| Net Unrealized Appreciation (Depreciation) of Swaps | (NBB) | * | (NBD) | ** |
| Risk Exposure | | | | |
| Interest Rate | $11,357,053 | | $152,917 | |
| * | For the period April 27, 2010 (commencement of operations) through March 31, 2011. | | |
| ** | For the period November 23, 2010 (commencement of operations) through March 31, 2011. | | |
4. Fund Shares
Since the inception of Build America Bond’s (NBB) repurchase program, the Fund has not repurchased any of its outstanding shares. As of March 31, 2011, Build America Bond Opportunity (NBD) is not authorized to repurchase its outstanding shares.
| | | | | |
| Transactions in shares were as follows: | | | | |
| | Build | | Build America | |
| | America | | Bond | |
| | Bond | | Opportunity | |
| | (NBB) | * | (NBD) | ** |
| Shares sold | 26,362,500 | | 7,200,000 | |
| Shares issued to shareholders | | | | |
| due to reinvestment of distributions | 94,235 | | — | |
| * | For the period April 27, 2010 (commencement of operations) through March 31, 2011. | | |
| ** | For the period November 23, 2010 (commencement of operations) through March 31, 2011. | | |
5. Investment Transactions
Purchases and sales (including maturities but excluding short-term investments and derivative transactions, when applicable) during the period from each Fund’s commencement of operations through March 31, 2011, were as follows:
| | | | | |
| | Build | | Build America | |
| | America | | Bond | |
| | Bond | | Opportunity | |
| | (NBB) | * | (NBD) | ** |
| Purchases | $1,120,458,403 | | $249,936,782 | |
| Sales and maturities | 567,409,551 | | 108,305,215 | |
| * | For the period April 27, 2010 (commencement of operations) through March 31, 2011. |
| ** | For the period November 23, 2010 (commencement of operations) through March 31, 2011. |
Nuveen Investments 37
Notes to
Financial Statements (continued)
6. Income Tax Information
The following information is presented on an income tax basis. Differences between amounts for financial statement and federal income tax purposes are primarily due to timing differences in recognizing certain gains and losses on investment transactions and the treatment of investments in inverse floating rate securities reflected as financing transactions, if any. To the extent that differences arise that are permanent in nature, such amounts are reclassified within the capital accounts as detailed below. Temporary differences do not require reclassification. Temporary and permanent differences do not impact the net asset values of the Funds.
At March 31, 2011, the cost and unrealized appreciation (depreciation) of investments (excluding investments in derivatives), as determined on a federal income tax basis, were as follows:
| | | | | | | |
| | | Build | | | Build America | |
| | | America | | | Bond | |
| | | Bond | | | Opportunity | |
| | | (NBB) | | | (NBD) | |
| Cost of investments | | $ | 537,222,377 | | | $ | 133,754,456 | |
| Gross unrealized: | | | | | | | | |
| Appreciation | | | 4,479,345 | | | | 4,431,347 | |
| Depreciation | | | (19,232,419 | ) | | | (1,781,688 | ) |
| Net unrealized appreciation (depreciation) of investments | | $ | (14,753,074 | ) | | $ | 2,649,659 | |
Permanent differences, primarily due to federal taxes paid and notional principal contracts reclassifications, resulted in reclassifications among the Funds’ components of net assets at March 31, 2011, the Funds’ tax year end, as follows:
| | | | | | | |
| | | Build | | | Build America | |
| | | America | | | Bond | |
| | | Bond | | | Opportunity | |
| | | (NBB) | | | (NBD) | |
| Paid-in surplus | | $ | — | | | $ | — | |
| Undistributed (Over-distribution of) net investment income | | | 24,823 | | | | (90,602 | ) |
| Accumulated net realized gain (loss) | | | (24,823 | ) | | | 90,602 | |
The tax components of undistributed net ordinary income and net long-term capital gains at March 31, 2011, the Funds’ tax year end, were as follows:
| | | | | | | |
| | | Build | | | Build America | |
| | | America | | | Bond | |
| | | Bond | | | Opportunity | |
| | | (NBB) | | | (NBD) | |
| Undistributed net ordinary income* | | $ | 3,801,173 | | | $ | 1,443,627 | |
| Undistributed net long-term capital gains | | | — | | | | — | |
| * | Net ordinary income consists of net taxable income derived from dividends, interest and net short-term capital gains, if any. Undistributed net ordinary income (on a tax basis) has not been reduced for the dividend declared on March 1, 2011, and paid on April 1, 2011. |
The tax character of distributions paid during the period from each Fund’s commencement of operations through March 31, 2011, was designated for purposes of the dividends paid deduction as follows:
| | | | | | | |
| | | Build | | | Build America | |
| | | America | | | Bond | |
| | | Bond | | | Opportunity | |
| | | (NBB) | ** | | (NBD) | *** |
| Distributions from net ordinary income* | | $ | 27,698,457 | | | $ | 1,815,723 | |
| Distributions from net long-term capital gains | | | — | | | | — | |
| * | Net ordinary income consists of net taxable income derived from dividends, interest, and net short-term capital gains, if any. |
| ** | For the period April 27, 2010 (commencement of operations) through March 31, 2011. |
| *** | For the period November 23, 2010 (commencement of operations) through March 31, 2011. |
At March 31, 2011, the Funds’ tax year end, the following Fund had unused capital loss carryforwards available for federal income tax purposes to be applied against future capital gains, if any. If not applied, the carryforwards will expire as follows:
| | |
| | Build |
| | America |
| | Bond |
| | (NBB) |
| Expiration: | |
| March 31, 2019 | $ 294,209 |
The Funds have elected to defer net realized losses from investments incurred from November 1, 2010 through March 31, 2011, the Funds’ tax year end, (“post-October losses”) in accordance with federal income tax regulations. Post-October losses are treated as having arisen on the first day of the following fiscal year. The Funds have elected to defer post-October losses as follows:
| | | |
| | Build | Build America |
| | America | Bond |
| | Bond | Opportunity |
| | (NBB) | (NBD) |
| Post-October capital losses | $2,435,461 | $712,290 |
7. Management Fees and Other Transactions with Affiliates
Each Fund’s management fee consists of two components – a fund-level fee, based only on the amount of assets within the Fund, and a complex-level fee, based on the aggregate amount of all eligible fund assets managed by the Adviser. This pricing structure enables Fund shareholders to benefit from growth in the assets within their Fund as well as from growth in the amount of complex-wide assets managed by the Adviser.
| | |
| The annual fund-level fee for each Fund, payable monthly, is calculated according to the following schedule: | |
| | |
| Average Daily Managed Assets* | Fund-Level Fee Rate |
| For the first $125 million | .4500% |
| For the next $125 million | .4375 |
| For the next $250 million | .4250 |
| For the next $500 million | .4125 |
| For the next $1 billion | .4000 |
| For managed assets over $2 billion | .3875 |
| The annual complex-level fee for each Fund, payable monthly, is calculated according to the following schedule: | |
| Complex-Level Managed Asset Breakpoint Level* | Effective Rate at Breakpoint Level |
| $55 billion | .2000% |
| $56 billion | .1996 |
| $57 billion | .1989 |
| $60 billion | .1961 |
| $63 billion | .1931 |
| $66 billion | .1900 |
| $71 billion | .1851 |
| $76 billion | .1806 |
| $80 billion | .1773 |
| $91 billion | .1691 |
| $125 billion | .1599 |
| $200 billion | .1505 |
| $250 billion | .1469 |
| $300 billion | .1445 |
| * | For the fund-level and complex-level fees, managed assets include closed-end fund assets managed by the Adviser that are attributable to financial leverage. For these purposes, financial leverage includes the funds’ use of preferred stock and borrowings and certain investments in the residual interest certificates (also called inverse floating rate securities) in tender option bond (TOB) trusts, including the portion of assets held by a TOB trust that has been effectively financed by the trust’s issuance of floating rate securities, subject to an agreement by the Adviser as to certain funds to limit the amount of such assets for determining managed assets in certain circumstances. The complex-level fee is calculated based upon the aggregate daily managed assets of all Nuveen funds that constitute “eligible assets.” Eligible assets do not include assets attributable to investments in other Nuveen funds or assets in excess of $2 billion added to the Nuveen fund complex in connection with the Adviser’s assumption of the management of the former First American Funds effective January 1, 2011. As of March 31, 2011, the complex-level fee rate for these Funds was .1800%. |
Nuveen Investments 39
Notes to
Financial Statements (continued)
The management fee compensates the Adviser for overall investment advisory and administrative services and general office facilities. The Adviser has entered into Sub-Advisory Agreements with the Sub-Adviser under which the Sub-Adviser manages the investment portfolios of the Funds. The Sub-Adviser is compensated for its services to the Funds from the management fees paid to the Adviser.
The Funds pay no compensation directly to those of its trustees who are affiliated with the Adviser or to its officers, all of whom receive remuneration for their services to the Funds from the Adviser or its affiliates. The Board of Trustees has adopted a deferred compensation plan for independent trustees that enables trustees to elect to defer receipt of all or a portion of the annual compensation they are entitled to receive from certain Nuveen-advised funds. Under the plan, deferred amounts are treated as though equal dollar amounts had been invested in shares of select Nuveen-advised funds.
8. Borrowing Arrangements
As part of its investment strategies, Build America Bond (NBB) uses borrowings to employ leverage. On May 26, 2010, the Fund entered into a $125 million (maximum commitment amount) committed 364-day secured line of credit (“Committed Secured Line”) with its custodian bank. Interest charged on the borrowed amount of the Committed Secured Line is calculated at a rate per annum equal to the higher of the overnight Federal Funds rate or the overnight London Inter-bank Offered Rate (LIBOR) plus 1.00%. In addition, the Fund accrues a commitment fee of .15% per annum on the maximum commitment amount, and paid a .15% one-time closing fee on the maximum commitment amount of the Committed Secured Line which was expensed during the current reporting period.
On June 2, 2010, Build America Bond (NBB) began to draw on the Committed Secured Line. As of March 31, 2011, the Fund’s outstanding balance on the Committed Secured Line was $44,000,000, which is recognized as “Borrowings” on the Statement of Assets and Liabilities. Interest expense and commitment and closing fees incurred on the Committed Secured Line are recognized as a component of “Interest expense” on the Statement of Operations.
During the period from June 2, 2010 through March 31, 2011, the Fund’s average daily balance outstanding and average annualized interest rate on the Committed Secured Line were $73,445,446 and 1.24%, respectively.
During May 2011, the Fund entered into a new $125 million committed 364-day secured line of credit. Interest charged on this facility will be calculated based on LIBOR plus .80%. The Fund will pay a one-time closing fee of .10% on the maximum commitment amount and will accrue a commitment fee of .15% on the maximum commitment amount.
9. New Accounting Pronouncement
Financial Accounting Standards Board (“FASB”) Transfers and Servicing (Topic 860): Reconsideration of Effective Control for Repurchase Agreements.
On April 15, 2011, the FASB issued Accounting Standards Update No. 2011-03, (the “ASU”). The guidance in the ASU is intended to improve the accounting for repurchase and other similar agreements. Specifically, the ASU modifies the criteria for determining when these agreements would be accounted for as financing transactions (secured borrowings/lending agreements) as opposed to sale (purchase) transactions with commitments to repurchase (resell). At this time, management is evaluating the implications of this guidance and the impact it will have to the financial statement amounts or footnote disclosures, if any.
40 Nuveen Investments
| |
Board Members & Officers(Unaudited) |
The management of the Funds, including general supervision of the duties performed for the Funds by the Adviser, is the responsibility of the Board Members of the Funds. The number of board members of the Fund is currently set at ten. None of the board members who are not “interested” persons of the Funds (referred to herein as “independent board members”) has ever been a director or employee of, or consultant to, Nuveen or its affiliates. The names and business addresses of the board members and officers of the Funds, their principal occupations and other affiliations during the past five years, the number of portfolios each oversees and other directorships they hold are set forth below.
| | | | | |
| Name, | Position(s) Held | Year First | Principal | Number |
| Birthdate | with the Funds | Elected or | Occupation(s) | of Portfolios |
| & Address | | Appointed | Including other | in Fund Complex |
| | | and Term(1) | Directorships | Overseen by |
| | | | During Past 5 Years | Board Member |
| | | | |
Independent Board Members: | | | |
■ ROBERT P. BREMNER(2) | | | Private Investor and Management Consultant; Treasurer and Director, | |
| 8/22/40 | Chairman of | | Humanities Council of Washington, D.C.; Board Member, | |
333 W. Wacker Drive | the Board | 1996 | Independent Directors Council affiliated with the Investment | 246 |
| Chicago, IL 60606 | and Board Member | | Company Institute. | |
| | | | | |
■ JACK B. EVANS | | | President, The Hall-Perrine Foundation, a private philanthropic | |
| 10/22/48 | | | corporation (since 1996); Director and Chairman, United Fire | |
333 W. Wacker Drive | Board Member | 1999 | Group, a publicly held company; President Pro Tem of the Board of | 246 |
| Chicago, IL 60606 | | | Regents for the State of Iowa University System; Director, Source Media | |
| | | | Group; Life Trustee of Coe College and the Iowa College Foundation; | |
| | | | formerly, Director, Alliant Energy; formerly, Director, Federal | |
| | | | Reserve Bank of Chicago; formerly, President and Chief Operating | |
| | | | Officer, SCI Financial Group, Inc., a regional financial services firm. | |
| | | | | |
■ WILLIAM C. HUNTER | | | Dean, Tippie College of Business, University of Iowa (since | |
| 3/6/48 | | | 2006); Director (since 2004) of Xerox Corporation; Director | |
333 W. Wacker Drive | Board Member | 2004 | (since 2005), Beta Gamma Sigma International Honor Society; | 246 |
| Chicago, IL 60606 | | | Director of Wellmark, Inc. (since 2009); formerly, Dean and | |
| | | | Distinguished Professor of Finance, School of Business at the | |
| | | | University of Connecticut (2003-2006); previously, Senior Vice | |
| | | | President and Director of Research at the Federal Reserve Bank | |
| | | | of Chicago (1995-2003); formerly, Director (1997-2007), Credit | |
| | | | Research Center at Georgetown University. | |
| | | | | |
■ DAVID J. KUNDERT(2) | | | Director, Northwestern Mutual Wealth Management | |
| 10/28/42 | | | Company; retired (since 2004) as Chairman, JPMorgan | |
333 W. Wacker Drive | Board Member | 2005 | Fleming Asset Management, President and CEO, Banc One | 246 |
| Chicago, IL 60606 | | | Investment Advisors Corporation, and President, One Group | |
| | | | Mutual Funds; prior thereto, Executive Vice President, Banc One | |
| | | | Corporation and Chairman and CEO, Banc One Investment | |
| | | | Management Group; Member, Board of Regents, Luther College; | |
| | | | member of the Wisconsin Bar Association; member of Board of | |
| | | | Directors, Friends of Boerner Botanical Gardens; member of Board | |
| | | | of Directors and Chair of Investment Committee, Greater | |
| | | | Milwaukee Foundation. | |
| | | | |
■ WILLIAM J. SCHNEIDER(2) | | Chairman of Miller-Valentine Partners Ltd., a real estate investment | |
| 9/24/44 | | | company; formerly, Senior Partner and Chief Operating Officer | |
333 W. Wacker Drive | Board Member | 1997 | (retired 2004) of Miller-Valentine Group; member, University of | 246 |
| Chicago, IL 60606 | | | Dayton Business School Advisory Council;member, Mid-America | |
| | | | Health System Board; formerly, member and chair, Dayton Philharmonic | |
| | | | Orchestra Association; formerly, member, Business Advisory Council, | |
| | | | Cleveland Federal Reserve Bank. | |
Nuveen Investments 41
Board Members & Officers (Unaudited) (continued)
| | | | | |
| Name, | Position(s) Held | Year First | Principal | Number |
| Birthdate | with the Funds | Elected or | Occupation(s) | of Portfolios |
| & Address | | Appointed | Including other | in Fund Complex |
| | | and Term(1) | Directorships | Overseen by |
| | | | During Past 5 Years | Board Member |
| | | | |
Independent Board Members: | | | |
■ JUDITH M. STOCKDALE | | | Executive Director, Gaylord and Dorothy Donnelley | |
| 12/29/47 | | | Foundation (since 1994); prior thereto, Executive Director, | |
| 333 W. Wacker Drive | Board Member | 1997 | Great Lakes Protection Fund (1990-1994). | 246 |
| Chicago, IL 60606 | | | | |
| | | | | |
■ CAROLE E. STONE(2) | | | Director, Chicago Board Options Exchange (since 2006); Director, | |
| 6/28/47 | | | C2 Options Exchange, Incorporated (since 2009); formerly, | |
333 W. Wacker Drive | Board Member | 2007 | Commissioner, New York State Commission on Public Authority | 246 |
| Chicago, IL 60606 | | | Reform (2005-2010); formerly, Chair, New York Racing Association | |
| | | | Oversight Board (2005-2007). | |
| | | | | |
■ VIRGINIA L. STRINGER | | | Board Member, Mutual Fund Directors Forum; Member, Governing | |
| 8/16/44 | | | Board, Investment Company Institute’s Independent Directors | |
333 W. Wacker Drive | Board Member | 2011 | Council; governance consultant and non-profit board member; | 246 |
| Chicago, IL 60606 | | | former Owner and President, Strategic Management Resources, Inc. | |
| | | | a management consulting firm; previously, held several executive | |
| | | | positions in general management, marketing and human resources at | |
| | | | IBM and The Pillsbury Company; Independent Director, First American | |
| | | | Fund Complex (1987-2010) and Chair (1997-2010). | |
■ TERENCE J. TOTH(2) | | | | |
| 9/29/59 | | | Director, Legal & General Investment Management America, Inc. | |
333 W. Wacker Drive | Board Member | 2008 | (since 2008); Managing Partner, Promus Capital (since 2008); | 246 |
| Chicago, IL 60606 | | | formerly, CEO and President, Northern Trust Global Investments | |
| | | | (2004-2007); Executive Vice President, Quantitative Management | |
| | | | & Securities Lending (2000-2004); prior thereto, various positions | |
| | | | with Northern Trust Company (since 1994); member: Goodman | |
| | | | Theatre Board (since 2004), Chicago Fellowship Board (since | |
| | | | 2005), and Catalyst Schools of Chicago Board (since 2008); formerly, | |
| | | | member: Northern Trust Mutual Funds Board (2005-2007), | |
| | | | Northern Trust Global Investments Board (2004-2007), Northern | |
| | | | Trust Japan Board (2004-2007), Northern Trust Securities Inc. | |
| | | | Board (2003-2007) and Northern Trust Hong Kong Board | |
| | | | (1997-2004). | |
Interested Board Member: | | | |
■ JOHN P. AMBOIAN(3) | | | Chief Executive Officer and Chairman (since 2007), and Director (since | |
| 6/14/61 | | | 1999) of Nuveen Investments, Inc., formerly, President (1999-2007); | |
333 W. Wacker Drive | Board Member | 2008 | Chief Executive Officer (since 2007) of Nuveen Investments Advisors, | 246 |
| Chicago, IL 60606 | | | Inc.; Director (since 1998) formerly, Chief Executive Officer (2007-2010) | |
| | | | of Nuveen Fund Advisors, Inc. | |
42 Nuveen Investments
| | | | | |
| Name, | Position(s) Held | Year First | Principal | Number |
| Birthdate | with the Funds | Elected or | Occupation(s) | of Portfolios |
| and Address | | Appointed(4) | During Past 5 Years | in Fund Complex |
| | | | | Overseen |
| | | | | by Officer |
| | | | | |
Officers of the Funds: | | | | |
■ GIFFORD R. ZIMMERMAN | | Managing Director (since 2002), Assistant Secretary and Associate | |
| 9/9/56 | Chief | | General Counsel of Nuveen Securities, LLC; Managing Director | |
333 W. Wacker Drive | Administrative | 1988 | (since 2004) and Assistant Secretary (since 1994) of Nuveen | 246 |
| Chicago, IL 60606 | Officer | | Investments, Inc.; Managing Director (since 2002), Assistant | |
| | | | Secretary (since 1997) and Co-General Counsel (since 2011) of Nuveen | |
| | | | Fund Advisors, Inc.; Managing Director, Assistant Secretary and Associate | |
| | | | General Counsel of Nuveen Asset Management, LLC (since 2011); | |
| | | | Managing Director, Associate General Counsel and Assistant Secretary | |
| | | | of Symphony Asset Management LLC (since 2003); Vice President and | |
| | | | Assistant Secretary of NWQ Investment Management Company, LLC | |
| | | | (since 2002), Nuveen Investments Advisers Inc. (since 2002), Tradewinds | |
| | | | Global Investors LLC, and Santa Barbara Asset Management, LLC | |
| | | | (since 2006), Nuveen HydePark Group LLC and Nuveen Investment | |
| | | | Solutions, Inc. (since 2007) and of Winslow Capital Management Inc. | |
| | | | (since 2010); Chief Administrative Officer and Chief Compliance Officer | |
| | | | (since 2010) of Nuveen Commodities Asset Management, LLC; | |
| | | | Chartered Financial Analyst. | |
| | | | | |
■ WILLIAM ADAMS IV | | | Senior Executive Vice President, Global Structured Products (since 2010), | |
| 6/9/55 | | | formerly, Executive Vice President (1999-2010) of Nuveen Securities, | |
333 W. Wacker Drive | Vice President | 2007 | LLC; Co-President of Nuveen Fund Advisors, Inc. (since 2011); Managing | 132 |
| Chicago, IL 60606 | | | Director (since 2010) of Nuveen Commodities Asset Management, LLC. | |
| | | | |
■ CEDRIC H. ANTOSIEWICZ | | Managing Director of Nuveen Securities, LLC. | |
| 1/11/62 | | | | |
| 333 W. Wacker Drive | Vice President | 2007 | | 132 |
| Chicago, IL 60606 | | | | |
| | | | | |
■ MARGO L. COOK | | | Executive Vice President (since 2008) of Nuveen Investments, Inc. | |
| 4/11/64 | | | and of Nuveen Fund Advisors, Inc. (since 2011); previously, Head of | |
333 W. Wacker Drive | Vice President | 2009 | Institutional Asset Management (2007-2008) of Bear Stearns Asset | 246 |
| Chicago, IL 60606 | | | Management; Head of Institutional Asset Management (1986-2007) of | |
| | | | Bank of NY Mellon; Chartered Financial Analyst. | |
| | | | | |
■ LORNA C. FERGUSON | | | Managing Director (since 2004) of Nuveen Securities, LLC and | |
| 10/24/45 | | | Managing Director (since 2005) of Nuveen Fund Advisors, Inc. | |
| 333 W. Wacker Drive | Vice President | 1998 | | 246 |
| Chicago, IL 60606 | | | | |
| | | | | |
■ STEPHEN D. FOY | | | Senior Vice President (since 2010), formerly, Vice President (1993- | |
| 5/31/54 | Vice President | | 2010) and Funds Controller (since 1998) of Nuveen Securities, | |
333 W. Wacker Drive | and Controller | 1998 | LLC; Senior Vice President (since 2010), formerly, Vice President | 246 |
| Chicago, IL 60606 | | | (2005-2010) of Nuveen Fund Advisors, Inc.; Certified Public Accountant. | |
Nuveen Investments 43
Board Members & Officers (Unaudited) (continued)
| | | | | |
| Name, | Position(s) Held | Year First | Principal | Number |
| Birthdate | with the Funds | Elected or | Occupation(s) | of Portfolios |
| and Address | | Appointed(4) | During Past 5 Years | in Fund Complex |
| | | | | Overseen |
| | | | | by Officer |
| | | | | |
Officers of the Funds: | | | | |
■ SCOTT S. GRACE | | | Managing Director, Corporate Finance & Development, Treasurer | |
| 8/20/70 | Vice President | | (since 2009) of Nuveen Securities, LLC; Managing Director and Treasurer | |
333 W. Wacker Drive | and Treasurer | 2009 | (since 2009) of Nuveen Fund Advisors, Inc., Nuveen Investment | 246 |
| Chicago, IL 60606 | | | Solutions, Inc., Nuveen Investments Advisers, Inc., Nuveen Investments | |
| | | | Holdings Inc. and (since (2011) Nuveen Asset Management, LLC; Vice | |
| | | | President and Treasurer of NWQ Investment Management Company, LLC, | |
| | | | Tradewinds Global Investors, LLC, Symphony Asset Management LLC and | |
| | | | Winslow Capital Management, Inc.; Vice President of Santa Barbara Asset | |
| | | | Management, LLC; formerly, Treasurer (2006-2009), Senior Vice President | |
| | | | (2008-2009), previously, Vice President (2006-2008) of Janus Capital | |
| | | | Group, Inc.; formerly, Senior Associate in Morgan Stanley’s Global Financial | |
| | | | Services Group (2000-2003); Chartered Accountant Designation. | |
| | | | | |
■ WALTER M. KELLY | | | Senior Vice President (since 2008), Vice President (2006-2008) | |
| 2/24/70 | Chief Compliance | | of Nuveen Securities, LLC; Senior Vice President (since 2008) | |
333 W. Wacker Drive | Officer and | 2003 | and Assistant Secretary (since 2008) of Nuveen Fund Advisors, Inc. | 246 |
| Chicago, IL 60606 | Vice President | | | |
| | | | | |
■ TINA M. LAZAR | | | Senior Vice President (since 2009), formerly, Vice President of Nuveen | |
| 8/27/61 | | | Securities, LLC (1999-2009); Senior Vice President (since 2010), | |
333 W. Wacker Drive | Vice President | 2002 | formerly, Vice President (2005-2010) of Nuveen Fund Advisors, Inc. | 246 |
| Chicago, IL 60606 | | | | |
| | | | | |
■ LARRY W. MARTIN | | | Senior Vice President (since 2010), formerly, Vice President | |
| 7/27/51 | Vice President and | | (1993-2010), Assistant Secretary and Assistant General Counsel | |
333 W. Wacker Drive | Assistant Secretary | 1997 | of Nuveen Securities, LLC; Senior Vice President (since 2011) of | 246 |
| Chicago, IL 60606 | | | Nuveen Asset Management, LLC: Senior Vice President (since 2010), | |
| | | | formerly, Vice President (2005-2010), and Assistant Secretary of | |
| | | | Nuveen Investments, Inc.; Senior Vice President (since 2010), formerly | |
| | | | Vice President (2005-2010), and Assistant Secretary (since 1997) of | |
| | | | Nuveen Fund Advisors, Inc.; Vice President and Assistant Secretary of Nuveen | |
| | | | Investments Advisers, Inc. (since 2002), NWQ Investment Management | |
| | | | Company, LLC, Symphony Asset Management LLC (since 2003), | |
| | | | Tradewinds Global Investors, LLC, Santa Barbara Asset Management, | |
| | | | LLC (since 2006), Nuveen HydePark Group, LLC and Nuveen Investment | |
| | | | Solutions, Inc. (since 2007); and of Winslow Capital Management, Inc. | |
| | | | (since 2010); Vice President and Assistant Secretary of Nuveen Commodities | |
| | | | Asset Management, LLC (since 2010). | |
| | | | | |
■ KEVIN J. MCCARTHY | | | Managing Director (since 2008), formerly, Vice President (2007-2008), | |
| 3/26/66 | Vice President | | Nuveen Securities, LLC; Managing Director (since 2008), Assistant | |
333 W. Wacker Drive | and Secretary | 2007 | Secretary (since 2007) and Co-General Counsel (since 2011) | 246 |
| Chicago, IL 60606 | | | of Nuveen Fund Advisors, Inc.; Managing Director, Assistant Secretary | |
| | | | and Associate General Counsel (since 2011) of Nuveen Asset | |
| | | | Management, LLC; Managing Director (since 2008), and Assistant | |
| | | | Secretary, Nuveen Investment Holdings, Inc.; Vice President | |
| | | | (since 2007) and Assistant Secretary of Nuveen Investments Advisers | |
| | | | Inc., NWQ Investment Management Company, LLC, Tradewinds | |
| | | | Global Investors LLC, NWQ Holdings, LLC, Symphony Asset Management | |
| | | | LLC, Santa Barbara Asset Management, LLC, Nuveen HydePark | |
| | | | Group, LLC, Nuveen Investment Solutions, Inc. (since 2007) and | |
| | | | of Winslow Capital Management, Inc. (since 2010); Vice President | |
| | | | and Secretary (since 2010) of Nuveen Commodities Asset Management, | |
| | | | LLC; prior thereto, Partner, Bell, Boyd & Lloyd LLP (1997-2007). | |
44 Nuveen Investments
| | | | | |
| Name, | Position(s) Held | Year First | Principal | Number |
| Birthdate | with the Funds | Elected or | Occupation(s) | of Portfolios |
| and Address | | Appointed(4) | During Past 5 Years | in Fund Complex |
| | | | | Overseen |
| | | | | by Officer |
| | | | | |
Officers of the Funds: | | | | |
■ KATHLEEN L. PRUDHOMME | | Managing Director, Assistant Secretary and Co-General Counsel (since 2011) | |
| 3/30/53 | Vice President and | | of Nuveen Fund Advisors, Inc.; Managing Director, Assistant Secretary and | |
| 800 Nicollet Mall | Assistant Secretary | 2011 | Associate General Counsel (since 2011) of Nuveen Asset Management, LLC; | 246 |
| Minneapolis, MN 55402 | | | Managing Director and Assistant Secretary (since 2011) of Nuveen | |
| | | | Securities, LLC; formerly, Secretary of FASF (2004-2010); Deputy General | |
| | | | Counsel, FAF Advisors, Inc. (2004-2010). | |
| (1) | Board Members serve three year terms. The Board of Trustees is divided into three classes, Class I, Class II, and Class III, with each being elected to serve until the third succeeding annual shareholders’ meeting subsequent to its election or thereafter in each case when its respective successors are duly elected or appointed. The first year elected or appointed represents the year in which the board member was first elected or appointed to any fund in the Nuveen Complex. |
| (2) | Also serves as a trustee of the Nuveen Diversified Commodity Fund, an exchange-traded commodity pool managed by Nuveen Commodities Asset Management, LLC, an affiliate of the Adviser. |
| (3) | Mr. Amboian is an interested trustee because of his position with Nuveen Investments, Inc. and certain of its subsidiaries, which are affiliates of the Nuveen Funds. |
| (4) | Officers serve one year terms through August of each year. The year first elected or appointed represents the year in which the Officer was first elected or appointed to any fund in the Nuveen Complex. |
Nuveen Investments 45
Annual Investment Management
Agreement Approval Process (Unaudited)
The Boards of Trustees (each, a “Board,” and each Trustee, a “Board Member”) of the Nuveen Build America Bond Fund (the “Build America Bond Fund”) and the Nuveen Build America Bond Opportunity Fund (the “Build America Bond Opportunity Fund” and, together with the Build America Bond Fund, the “Funds”) are responsible for approving advisory arrangements for the respective Fund. At a meeting held on February 26-28, 2010 (the “February Meeting”), the Board of the Build America Bond Fund was asked to approve the advisory arrangement for that Fund and, at a meeting held on September 15, 2010 (the “September Meeting”; the February Meeting and the September Meeting are each a “Meeting”), the Board of the Build America Bond Opportunity Fund was asked to approve the advisory arrangement for that Fund. At the respective Meeting, the Board Members, including the Board Members who are not parties to the advisory agreement or “interested persons” of any such parties (the “Independent Board Members”), considered and approved the investment management agreement (each, an “Advisory Agreement”) between the respective Fund and Nuveen Asset Management (the “Adviser”).
To assist the Board in its evaluation of the applicable Advisory Agreement at the respective Meeting, the Independent Board Members had received, in adequate time in advance of the Meeting or at prior meetings, materials which outlined, among other things:
| · | the nature, extent and quality of services expected to be provided by the Adviser; |
| · | the organization of the Adviser, including the responsibilities of various depart- ments and key personnel; |
| · | the expertise and background of the Adviser with respect to the Fund’s invest- ment strategy; |
| · | the profitability of Nuveen Investments, Inc. (“Nuveen”) (which incorporated Nuveen’s wholly-owned affiliated sub-advisers); |
| · | the proposed management fees of the Adviser, including comparisons of such fees with the management fees of comparable funds; |
| · | the expected expenses of the Fund, including comparisons of the Fund’s expected expense ratio with the expense ratios of comparable funds; and |
| · | the soft dollar practices of the Adviser, if any. |
46 Nuveen Investments
At each Meeting, the Adviser made a presentation to and responded to questions from the Board. During each Meeting, the Independent Board Members also met privately with their legal counsel to review the Board’s duties under the Investment Company Act of 1940 (the “1940 Act”), the general principles of state law in reviewing and approving advisory contracts, the standards used by courts in determining whether investment company boards of directors have fulfilled their duties, factors to be considered in voting on advisory contracts and an adviser’s fiduciary duty with respect to advisory agreements and compensation. It is with this background that the Independent Board Members considered the Advisory Agreements. As outlined in more detail below (set forth in Section I for the Build America Bond Fund and in Section II for the Build America Bond Opportunity Fund), the Independent Board Members considered all factors they believed relevant with respect to the respective Fund including the following: (a) the nature, extent and quality of the services to be provided by the Adviser; (b) investment performance, as described below; (c) the profitability of Nuveen and its affiliates; (d) the extent to which economies of scale would be realized; and (e) whether fee levels reflect these economies of scale for the benefit of Fund investors.
I. NUVEEN BUILD AMERICA BOND FUND
A. Nature, Extent and Quality of Services
With respect to the Build America Bond Fund (for purposes of this Section I, such Fund is the “Fund” and the Advisory Agreement for such Fund is the “Advisory Agreement”), the Independent Board Members considered the nature, extent and quality of the Adviser’s services, including advisory services and administrative services. As the Adviser already serves as adviser to other Nuveen funds overseen by the Board Members, the Board has a good understanding of the Adviser’s organization, operations and personnel. As the Independent Board Members meet regularly throughout the year to oversee the Nuveen funds, including funds currently advised by the Adviser, the Independent Board Members have relied upon their knowledge from their meetings and any other interactions throughout the year of the Adviser and its services in evaluating the Advisory Agreement.
At the February Meeting and at prior meetings, the Independent Board Members reviewed materials outlining, among other things, the Adviser’s organization and business; the types of services that the Adviser or its affiliates provide to the Nuveen funds and are expected to provide to the Fund; and the experience of the Adviser with applicable investment strategies. Further, the Independent Board Members have evaluated the background, experience and track record of the Adviser’s investment personnel.
In addition to advisory services, the Independent Board Members considered the quality of any administrative or non-advisory services to be provided. In this regard, the Adviser is expected to provide the Fund with such administrative and other services (exclusive of, and in addition to, any such services provided by others for the Fund) and officers and other personnel as are necessary for the operations of the Fund. In addition to investment management services, the Adviser and its affiliates will provide the Fund with
Nuveen Investments 47
Annual Investment Management Agreement
Approval Process (Unaudited) (continued)
a wide range of services, including, among other things, product management, fund administration, oversight of service providers, shareholder services, administration of Board relations, regulatory and portfolio compliance and legal support.
In addition to the foregoing services, the Independent Board Members also noted the additional services that the Adviser or its affiliates provide to closed-end funds, including, in particular, Nuveen’s continued commitment to supporting the secondary market for the common shares of its closed-end funds through a variety of programs designed to raise investor and analyst awareness and understanding of closed-end funds. These efforts include maintaining an investor relations program to provide timely information and education to financial advisers and investors; providing advertising and marketing for the closed-end funds; maintaining websites; and providing educational seminars.
Based on their review, the Independent Board Members found that, overall, the nature, extent and quality of services expected to be provided to the Fund under the Advisory Agreement were satisfactory.
B. Investment Performance
At the time of the February Meeting, the Fund was new and therefore did not have its own performance history. However, the Independent Board Members were familiar with the Adviser’s performance record on other Nuveen funds.
C. Fees, Expenses and Profitability
1. Fees and Expenses
In evaluating the management fees and expenses that the Fund was expected to bear, the Independent Board Members considered, among other things, the Fund’s proposed management fee structure and its expected expense ratios in absolute terms as well as compared with the fees and expense ratios of comparable funds. In this regard, the Board reviewed, among other things, the management fees of leveraged municipal closed-end funds given that the Fund’s portfolio was expected to be similar in many respects to that of a tax-exempt bond fund. In addition, the Board reviewed the management fees of various general taxable bond funds.
In addition, the Independent Board Members noted that the Fund may make investments in certain instruments that have the economic effect of leverage, including inverse floating rate securities. The Independent Board Members recognized that assets attributable to the Fund’s use of effective leverage would be included in the amount of assets upon which the advisory fee is calculated. In this regard, the Independent Board Members noted that the advisory fee is based on a percentage of average daily “Managed Assets.” “Managed Assets” generally means the total assets of the Fund minus the sum of its accrued liabilities (other than Fund liabilities incurred for the express purpose of creating effective leverage). “Total assets” for this purpose includes assets attributable to the Fund’s use of effective leverage (whether or not those assets are reflected in the Fund’s financial statements for purposes of generally accepted accounting principles), such as, but not limited to,
48 Nuveen Investments
the portion of assets in special purpose trusts of which the Fund owns the inverse floater certificates that has been effectively financed by the trust’s issuance of floating rate certificates. The Board Members recognized that because a decision to increase the Fund’s leverage would have the effect, all other things being equal, of increasing Managed Assets, and, therefore, the Adviser’s management fee, the Adviser may have an incentive to increase the Fund’s use of leverage. Notwithstanding the foregoing, the Independent Board Members considered that the Adviser would seek to manage that incentive by only increasing the Fund’s use of leverage when it determines that such increase is consistent with the Fund’s investment objectives, and by periodically reviewing the Fund’s performance and use of leverage with the Board.
The Independent Board Members also considered the fund-level breakpoint schedule and the complex-wide breakpoint schedule (described in further detail below) and any applicable fee waivers and expense reimbursements expected to be provided. Based on their review of the fee and expense information provided, the Independent Board Members determined that the Fund’s management fees were reasonable in light of the nature, extent and quality of services to be provided to the Fund.
2. Comparisons with the Fees of Other Clients
Due to their experience with other Nuveen funds, the Board Members were familiar with the fees the Adviser assesses to other clients. Such other clients include separately managed accounts (both retail and institutional accounts) and funds that are not offered by Nuveen but are sub-advised by one of Nuveen’s investment management teams. In evaluating the comparisons of fees, the Independent Board Members have noted, at the February Meeting or at prior meetings, that the fee rates charged to a fund (such as the Fund) and charged to other clients vary, among other things, because of the different services involved and the additional regulatory and compliance requirements associated with registered investment companies, such as the Fund. Accordingly, the Independent Board Members have considered the differences in the product types, including, but not limited to, the services to be provided, the structure and operations, product distribution and costs thereof, portfolio investment policies, investor profiles, account sizes and regulatory requirements. The Independent Board Members have noted, in particular, that the range of services as described above to be provided to a fund (such as the Fund) is much more extensive than that provided to separately managed accounts. Given the inherent differences in the products, particularly the extensive services to be provided to the Fund, the Independent Board Members believe such facts justify the different levels of fees.
3. Profitability of Nuveen
In conjunction with its review of fees at prior meetings, the Independent Board Members have considered the profitability of Nuveen for its advisory activities (which incorporated Nuveen’s wholly-owned affiliated sub-advisers) and its financial
Nuveen Investments 49
Annual Investment Management Agreement
Approval Process (Unaudited) (continued)
condition. At the February Meeting or prior meetings, the Independent Board Members reviewed the revenues and expenses of Nuveen’s advisory activities, the allocation methodology used in preparing the profitability data and an analysis of the key drivers behind the changes in revenues and expenses that impacted profitability. They also reviewed the Form 8-K filed by Nuveen on January 12, 2010 and the Form 10-Q filed by Nuveen on November 12, 2009 (for the period ending September 30, 2009). The Independent Board Members have also considered, at the February Meeting or at prior meetings, Nuveen’s revenues for advisory activities, expenses, and profit margin compared to that of various unaffiliated management firms with similar amounts of assets under management and relatively comparable asset composition prepared by Nuveen.
In reviewing profitability, the Independent Board Members have recognized the subjective nature of determining profitability, which may be affected by numerous factors, including the allocation of expenses. Further, the Independent Board Members have recognized the difficulties in making comparisons as the profitability of other advisers generally is not publicly available and the profitability information that is available for certain advisers or management firms may not be representative of the industry and may be affected by, among other things, the adviser’s particular business mix, capital costs, types of funds managed and expense allocations. Notwithstanding the foregoing, the Independent Board Members reviewed Nuveen’s methodology and assumptions for allocating expenses across product lines to determine profitability. In reviewing profitability, the Independent Board Members recognized Nuveen’s investment in its fund business. Based on their review, the Independent Board Members concluded that Nuveen’s level of profitability for its advisory activities was reasonable in light of the services to be provided.
In evaluating the reasonableness of the compensation, the Independent Board Members also considered any other amounts expected to be paid to the Adviser as well as any indirect benefits (such as soft dollar arrangements, if any) the Adviser and its affiliates are expected to receive that are directly attributable to their management of the Fund, if any. See Section E below for additional information on indirect benefits the Adviser may receive as a result of its relationship with the Fund. Based on their review of the overall fee arrangements of the Fund, the Independent Board Members determined that the advisory fees and expected expenses of the Fund were reasonable.
D. Economies of Scale and Whether Fee Levels Reflect These Economies of Scale
With respect to economies of scale, the Independent Board Members have recognized the potential benefits resulting from the costs of a fund being spread over a larger asset base, although economies of scale are difficult to measure and predict with precision, particularly on a fund-by-fund basis. The Independent Board Members therefore considered whether the Fund could be expected to benefit from any economies of scale. One
method to help ensure that shareholders share in these benefits is to include breakpoints in the advisory fee schedule. Generally, management fees for funds in the Nuveen complex are comprised of a fund-level component and a complex-level component. Accordingly, the Independent Board Members received and reviewed the schedule of proposed advisory fees for the Fund, including fund-level breakpoints thereto. In this regard, however, given that the Fund is a closed-end fund, the Independent Board Members recognized that although the Fund may from time to time make additional share offerings, the growth in its assets will occur primarily through appreciation of its investment portfolio.
In addition to fund-level advisory fee breakpoints, the Board also considered the Fund’s complex-wide fee arrangement. Pursuant to the complex-wide fee arrangement, the fees of the funds in the Nuveen complex, including the Fund, are generally reduced as the assets in the fund complex reach certain levels. In evaluating the complex-wide fee arrangement, the Independent Board Members have considered that the complex-wide fee arrangement seeks to provide the benefits of economies of scale to fund shareholders when total fund complex assets increase, even if assets of a particular fund are unchanged or have decreased. The approach reflects the notion that some of Nuveen’s costs are attributable to services provided to all its funds in the complex and therefore all funds benefit if these costs are spread over a larger asset base. Based on their review, the Independent Board Members concluded that the breakpoint schedules and complex-wide fee arrangement were acceptable and reflect economies of scale to be shared with the Fund’s shareholders.
E. Indirect Benefits
In evaluating fees, the Independent Board Members also considered information regarding potential “fall out” or ancillary benefits that the Adviser or its affiliates may receive as a result of its relationship with the Fund. In this regard, the Independent Board Members considered any revenues received by affiliates of the Adviser for serving as agent at Nuveen’s trading desk.
In addition to the above, the Independent Board Members considered whether the Adviser will receive any benefits from soft dollar arrangements whereby a portion of the commissions paid by the Fund for brokerage may be used to acquire research that may be useful to the Adviser in managing the assets of the Fund and other clients. The Independent Board Members noted that the Adviser does not currently have any soft dollar arrangements; however, to the extent certain bona fide agency transactions that occur on markets that traditionally trade on a principal basis and riskless principal transactions are considered as generating “commissions,” the Adviser intends to comply with the applicable safe harbor provisions.
Based on their review, the Independent Board Members concluded that any indirect benefits received by the Adviser as a result of its relationship with the Fund were reasonable and within acceptable parameters.
Nuveen Investments 51
Annual Investment Management Agreement
Approval Process (Unaudited) (continued)
F. Approval
The Independent Board Members did not identify any single factor discussed previously as all-important or controlling. The Board Members, including a majority of the Independent Board Members, concluded that the terms of the Advisory Agreement were fair and reasonable, that the Adviser’s fees are reasonable in light of the services to be provided to the Fund and that the Advisory Agreement should be and was approved on behalf of the Fund.
II. NUVEEN BUILD AMERICA BOND OPPORTUNITY FUND
A. Nature, Extent and Quality of Services
With respect to the Build America Bond Opportunity Fund (for purposes of this Section II, such Fund is the “Fund” and the Advisory Agreement for such Fund is the “Advisory Agreement”), the Independent Board Members considered the nature, extent and quality of the Adviser’s services, including advisory services and administrative services. As the Adviser already serves as adviser to other Nuveen funds overseen by the Board Members, the Board has a good understanding of the Adviser’s organization, operations and personnel. As the Independent Board Members meet regularly throughout the year to oversee the Nuveen funds, including funds currently advised by the Adviser, the Independent Board Members have relied upon their knowledge from their meetings and any other interactions throughout the year of the Adviser and its services in evaluating the Advisory Agreement.
At the September Meeting and at prior meetings, the Independent Board Members reviewed materials outlining, among other things, the Adviser’s organization and business; the types of services that the Adviser or its affiliates provide to the Nuveen funds and are expected to provide to the Fund; and the experience of the Adviser with applicable investment strategies. Further, the Independent Board Members have evaluated the background, experience and track record of the Adviser’s investment personnel.
In addition to advisory services, the Independent Board Members considered the quality of any administrative or non-advisory services to be provided. In this regard, the Adviser is expected to provide the Fund with such administrative and other services (exclusive of, and in addition to, any such services provided by others for the Fund) and officers and other personnel as are necessary for the operations of the Fund. In addition to investment management services, the Adviser and its affiliates will provide the Fund with a wide range of services, including, among other things, product management, fund administration, oversight of service providers, shareholder services, administration of Board relations, regulatory and portfolio compliance and legal support.
In addition to the foregoing services, the Independent Board Members also noted the additional services that the Adviser or its affiliates provide to closed-end funds, including, in particular, Nuveen’s continued commitment to supporting the secondary market for the common shares of its closed-end funds through a variety of programs designed to raise investor and analyst awareness and understanding of closed-end funds. These
52 Nuveen Investments
efforts include maintaining an investor relations program to provide timely information and education to financial advisers and investors; providing advertising and marketing for the closed-end funds; maintaining websites; and providing educational seminars.
Based on their review, the Independent Board Members found that, overall, the nature, extent and quality of services expected to be provided to the Fund under the Advisory Agreement were satisfactory.
B. Investment Performance
At the time of the September Meeting, the Fund was new and therefore did not have its own performance history. The Independent Board Members, however, were familiar with the Adviser’s performance record on other Nuveen funds. Although the Adviser acts as adviser to another similar fund (the Build America Bond Fund), such fund had been trading for less than six months and, therefore, did not have an extensive performance history.
C. Fees, Expenses and Profitability
1. Fees and Expenses
In evaluating the management fees and expenses that the Fund was expected to bear, the Independent Board Members considered, among other things, the Fund’s proposed management fee structure and its expected expense ratios in absolute terms as well as compared with the fees and expense ratios of comparable funds. In this regard, the Board reviewed the management fees of various general taxable bond funds, recognizing that the Build America Bond Fund (which, as indicated above, is similar to the Fund) is classified in that category. The Board noted the Adviser’s proposal that the management fees for the Fund be the same as the fee schedule which applies to the Build America Bond Fund and Nuveen’s tax-exempt leveraged municipal closed-end funds.
In addition, the Independent Board Members noted that the Fund may make investments in certain instruments that have the economic effect of leverage, including, but not limited to, investments in inverse floating rate securities. The Independent Board Members recognized that assets attributable to the Fund’s use of financial leverage would be included in the amount of assets upon which the advisory fee is calculated. In this regard, the Independent Board Members noted that the advisory fee is based on the sum of a fund-level fee and a complex-level fee. The fund-level fee portion is based on a percentage of the Fund’s average daily “Managed Assets.” For the Fund, “Managed Assets” generally means the total assets of the Fund, minus the sum of its accrued liabilities (other than Fund liabilities incurred for the express purpose of creating financial leverage). “Total assets” for this purpose includes assets attributable to the Fund’s use of financial leverage (whether or not those assets are reflected in the Fund’s financial statements for purposes of generally accepted accounting principles), such as, but not limited to, the portion of assets in tender option bond trusts of which the Fund owns the residual interest certificates
Nuveen Investments 53
Annual Investment Management Agreement
Approval Process (Unaudited) (continued)
that have been effectively financed by the trust’s issuance of floating rate certificates. The complex-level fee is based on the managed assets of certain funds in the Nuveen complex which generally includes assets attributable to any preferred shares that may be outstanding and any borrowings (including the issuance of commercial paper or notes) for purposes of financial leverage. The Board Members recognized that because a decision to increase the Fund’s leverage would have the effect, all other things being equal, of increasing Managed Assets, and, therefore, the Adviser’s management fee, the Adviser may have an incentive to increase the Fund’s use of leverage. Notwithstanding the foregoing, the Independent Board Members considered that the Adviser would seek to manage that incentive by only increasing the Fund’s use of leverage when it determines that such increase is consistent with the Fund’s investment objectives, and by periodically reviewing the Fund’s performance and use of leverage with the Board.
The Independent Board Members also considered the fund-level breakpoint schedule and the complex-wide breakpoint schedule (described in further detail below) and any applicable fee waivers and expense reimbursements expected to be provided. Based on their review of the fee and expense information provided, the Independent Board Members determined that the Fund’s management fees were reasonable in light of the nature, extent and quality of services to be provided to the Fund.
2. Comparisons with the Fees of Other Clients
Due to their experience with other Nuveen funds, the Board Members were familiar with the fees the Adviser assesses to other clients. Such other clients include separately managed accounts (both retail and institutional accounts) and funds that are not offered by Nuveen but are sub-advised by one of Nuveen’s investment management teams. In evaluating the comparisons of fees, the Independent Board Members have noted, at the September Meeting or at prior meetings, that the fee rates charged to a fund (such as the Fund) and charged to other clients vary, among other things, because of the different services involved and the additional regulatory and compliance requirements associated with registered investment companies, such as the Fund. Accordingly, the Independent Board Members have considered the differences in the product types, including, but not limited to, the services to be provided, the structure and operations, product distribution and costs thereof, portfolio investment policies, investor profiles, account sizes and regulatory requirements. The Independent Board Members have noted, in particular, that the range of services as described above to be provided to a fund (such as the Fund) is much more extensive than that provided to separately managed accounts. Given the inherent differences in the products, particularly the extensive services to be provided to the Fund, the Independent Board Members believe such facts justify the different levels of fees.
54 Nuveen Investments
3. Profitability of Nuveen
In conjunction with its review of fees at prior meetings, the Independent Board Members have considered the profitability of Nuveen for its advisory activities (which incorporated Nuveen’s wholly-owned affiliated sub-advisers) and its financial condition. At the September Meeting or prior meetings, the Independent Board Members reviewed the revenues and expenses of Nuveen’s advisory activities, the allocation methodology used in preparing the profitability data and an analysis of the key drivers behind the changes in revenues and expenses that impacted profitability. In addition, they reviewed the Form 8-K filed by Nuveen on August 13, 2010 and the Form 10-K filed by Nuveen on March 31, 2010 (for the period ending December 31, 2009). The Independent Board Members have also considered, at the September Meeting or at prior meetings, Nuveen’s revenues for advisory activities, expenses, and profit margin compared to that of various unaffiliated management firms with similar amounts of assets under management and relatively comparable asset composition prepared by Nuveen.
In reviewing profitability, the Independent Board Members have recognized the subjective nature of determining profitability, which may be affected by numerous factors, including the allocation of expenses. Further, the Independent Board Members have recognized the difficulties in making comparisons as the profitability of other advisers generally is not publicly available and the profitability information that is available for certain advisers or management firms may not be representative of the industry and may be affected by, among other things, the adviser’s particular business mix, capital costs, types of funds managed and expense allocations. Notwithstanding the foregoing, the Independent Board Members reviewed Nuveen’s methodology and assumptions for allocating expenses across product lines to determine profitability. In reviewing profitability, the Independent Board Members recognized Nuveen’s investment in its fund business. Based on their review, the Independent Board Members concluded that Nuveen’s level of profitability for its advisory activities was reasonable in light of the services to be provided.
In evaluating the reasonableness of the compensation, the Independent Board Members also considered any other amounts expected to be paid to the Adviser as well as any indirect benefits (such as soft dollar arrangements, if any) the Adviser and its affiliates are expected to receive that are directly attributable to their management of the Fund, if any. See Section E below for additional information on indirect benefits the Adviser may receive as a result of its relationship with the Fund. Based on their review of the overall fee arrangements of the Fund, the Independent Board Members determined that the advisory fees and expected expenses of the Fund were reasonable.
Nuveen Investments 55
Annual Investment Management Agreement
Approval Process (Unaudited) (continued)
D. Economies of Scale and Whether Fee Levels Reflect These Economies of Scale
With respect to economies of scale, the Independent Board Members have recognized the potential benefits resulting from the costs of a fund being spread over a larger asset base, although economies of scale are difficult to measure and predict with precision, particularly on a fund-by-fund basis. The Independent Board Members therefore considered whether the Fund could be expected to benefit from any economies of scale. One method to help ensure that shareholders share in these benefits is to include breakpoints in the advisory fee schedule. Generally, management fees for funds in the Nuveen complex are comprised of a fund-level component and a complex-level component. Accordingly, the Independent Board Members received and reviewed the schedule of proposed advisory fees for the Fund, including fund-level breakpoints thereto. In this regard, however, given that the Fund is a closed-end fund, the Independent Board Members recognized that although the Fund may from time to time make additional share offerings, the growth in its assets will occur primarily through appreciation of its investment portfolio.
In addition to fund-level advisory fee breakpoints, the Board also considered the Fund’s complex-wide fee arrangement. Pursuant to the complex-wide fee arrangement, the fees of the funds in the Nuveen complex, including the Fund, are generally reduced as the assets in the fund complex reach certain levels. In evaluating the complex-wide fee arrangement, the Independent Board Members have considered that the complex-wide fee arrangement seeks to provide the benefits of economies of scale to fund shareholders when total fund complex assets increase, even if assets of a particular fund are unchanged or have decreased. The approach reflects the notion that some of Nuveen’s costs are attributable to services provided to all its funds in the complex and therefore all funds benefit if these costs are spread over a larger asset base. Based on their review, the Independent Board Members concluded that the breakpoint schedules and complex-wide fee arrangement were acceptable and reflect economies of scale to be shared with the Fund’s shareholders.
E. Indirect Benefits
In evaluating fees, the Independent Board Members also considered information regarding potential “fall out” or ancillary benefits that the Adviser or its affiliates may receive as a result of its relationship with the Fund. In this regard, the Independent Board Members considered any revenues received by affiliates of the Adviser for serving as agent at Nuveen’s trading desk.
In addition to the above, the Independent Board Members considered whether the Adviser will receive any benefits from soft dollar arrangements whereby a portion of the commissions paid by the Fund for brokerage may be used to acquire research that may be useful to the Adviser in managing the assets of the Fund and other clients. The Independent Board Members noted that the Adviser does not currently have any soft dollar arrangements; however, to the extent certain bona fide agency transactions that
56 Nuveen Investments
occur on markets that traditionally trade on a principal basis and riskless principal transactions are considered as generating “commissions,” the Adviser intends to comply with the applicable safe harbor provisions.
Based on their review, the Independent Board Members concluded that any indirect benefits received by the Adviser as a result of its relationship with the Fund were reasonable and within acceptable parameters.
F. Approval
The Independent Board Members did not identify any single factor discussed previously as all-important or controlling. The Board Members, including a majority of the Independent Board Members, concluded that the terms of the Advisory Agreement were fair and reasonable, that the Adviser’s fees are reasonable in light of the services to be provided to the Fund and that the Advisory Agreement should be and was approved on behalf of the Fund.
Nuveen Investments 57
Board Approval of Sub-Advisory
Arrangements (Unaudited)
Since the Meetings, Nuveen has engaged in an internal restructuring (the “Restructuring”) pursuant to which the portfolio management services provided by the Adviser to the Funds were transferred to Nuveen Asset Management, LLC (“NAM LLC”), a newly-organized wholly-owned subsidiary of the Adviser and the Adviser changed its name to Nuveen Fund Advisors, Inc. (“NFA”). The Adviser, under its new name NFA, continues to serve as investment adviser to the Funds and, in that capacity, will continue to provide various oversight, administrative, compliance and other services. To effectuate the foregoing, NFA entered into sub-advisory agreements with NAM LLC on behalf of the Funds (each, a “Sub-Advisory Agreement”). Under each Sub-Advisory Agreement, NAM LLC, subject to the oversight of NFA and the Board, will furnish an investment program, make investment decisions for, and place all orders for the purchase and sale of securities for the portion of the respective Fund’s investment portfolio allocated to it by NFA. There have been no changes to the advisory fees paid by the Funds; rather, NFA will pay a portion of the investment advisory fee it receives to NAM LLC for its sub-advisory services. The Independent Board Members reviewed the allocation of fees between NFA and NAM LLC. NFA and NAM LLC do not anticipate any reduction in the nature or level of services provided to the Funds following the Restructuring. The personnel of NFA who engaged in portfolio management activities prior to the spinoff of NAM LLC are not expected to materially change as a result of the spinoff. In light of the foregoing, at a meeting held on November 16-18, 2010, the Board Members, including a majority of the Independent Board Members, approved the Sub-Advisory Agreements on behalf of the Funds. Given that the Restructuring was not expected to reduce the level or nature of services provided and the advisory fees paid by the Funds were the same, the factors considered and determinations made at the applicable Meeting in approving the respective Advisory Agreements were equally applicable to the approval of the Sub-Advisory Agreements.
58 Nuveen Investments
Reinvest Automatically,
Easily and Conveniently
Nuveen makes reinvesting easy. A phone call is all it takes to set up your reinvestment account.
Nuveen Closed-End Funds Automatic Reinvestment Plan
Your Nuveen Closed-End Fund allows you to conveniently reinvest distributions in additional Fund shares.
By choosing to reinvest, you’ll be able to invest money regularly and automatically, and watch your investment grow through the power of compounding. Just like distributions in cash, there may be times when income or capital gains taxes may be payable on distributions that are reinvested.
It is important to note that an automatic reinvestment plan does not ensure a profit, nor does it protect you against loss in a declining market.
Easy and convenient
To make recordkeeping easy and convenient, each month you’ll receive a statement showing your total distributions, the date of investment, the shares acquired and the price per share, and the total number of shares you own.
How shares are purchased
The shares you acquire by reinvesting will either be purchased on the open market or newly issued by the Fund. If the shares are trading at or above net asset value at the time of valuation, the Fund will issue new shares at the greater of the net asset value or 95% of the then-current market price. If the shares are trading at less than net asset value, shares for your account will be purchased on the open market. If the Plan Agent begins purchasing Fund shares on the open market while shares are trading below net asset value, but the Fund’s shares subsequently trade at or above their net asset value before the Plan Agent is able to complete its purchases, the Plan Agent may cease open-market purchases and may invest the uninvested portion of the distribution in newly-issued Fund shares at a price equal to the greater of the shares’ net asset value or 95% of the shares’ market value on the last business day immediately prior to the purchase date. Distributions received to purchase shares in the open market will normally be invested shortly after the distribution payment date. No interest will be paid on distributions awaiting reinvestment. Because the market price of the shares may increase before purchases are completed, the average purchase price per share may
Nuveen Investments 59
Reinvest Automatically,
Easily and Conveniently (continued)
exceed the market price at the time of valuation, resulting in the acquisition of fewer shares than if the distribution had been paid in shares issued by the Fund. A pro rata portion of any applicable brokerage commissions on open market purchases will be paid by Plan participants. These commissions usually will be lower than those charged on individual transactions.
Flexible
You may change your distribution option or withdraw from the Plan at any time, should your needs or situation change.
You can reinvest whether your shares are registered in your name, or in the name of a brokerage firm, bank, or other nominee. Ask your investment advisor if his or her firm will participate on your behalf. Participants whose shares are registered in the name of one firm may not be able to transfer the shares to another firm and continue to participate in the Plan.
The Fund reserves the right to amend or terminate the Plan at any time. Although the Fund reserves the right to amend the Plan to include a service charge payable by the participants, there is no direct service charge to participants in the Plan at this time.
Call today to start reinvesting distributions
For more information on the Nuveen Automatic Reinvestment Plan or to enroll in or withdraw from the Plan, speak with your financial advisor or call us at (800) 257-8787.
60 Nuveen Investments
Glossary of Terms
Used in this Report
| ■ | Auction Rate Bond: An auction rate bond is a security whose interest payments are adjusted periodically through an auction process, which process typically also serves as a means for buying and selling the bond. Auctions that fail to attract enough buyers for all the shares offered for sale are deemed to have “failed,” with current holders receiving a formula-based interest rate until the next scheduled auction. |
| ■ | Average Annual Total Return: This is a commonly used method to express an investment’s performance over a particular, usually multi-year time period. It expresses the return that would have been necessary each year to equal the invest- ment’s actual cumulative performance (including change in NAV or market price and reinvested dividends and capital gains distributions, if any) over the time period being considered. |
| ■ | Average Effective Maturity: The market-value-weighted average of the effective maturity dates of the individual securities including cash. In the case of a bond that has been advance-refunded to a call date, the effective maturity is the date on which the bond is scheduled to be redeemed using the proceeds of an escrow account. In most other cases the effective maturity is the stated maturity date of the security. |
| ■ | Effective Leverage: Effective leverage is a Fund’s effective economic leverage, and includes both structural leverage and the leverage effects of certain derivative invest- ments in the Fund’s portfolio. Currently, the leverage effects of Tender Option Bond (TOB) inverse floater holdings are included in effective leverage values, in addition to any structural leverage. |
| ■ | Inverse Floaters: Inverse floating rate securities, also known as inverse floaters, are created by depositing a municipal bond, typically with a fixed interest rate, into a special purpose trust created by a broker-dealer. This trust, in turn, (a) issues floating rate certificates typically paying short-term tax-exempt interest rates to third parties in amounts equal to some fraction of the deposited bond’s par amount or market value, and (b) issues an inverse floating rate certificate (sometimes referred to as an “inverse floater”) to an investor (such as a Fund) interested in gaining investment exposure to a long-term municipal bond. The income received by the holder of the inverse floater varies inversely with the short-term rate paid to the floating rate certificates’ holders, and in most circumstances the holder of the inverse floater bears substantially all of the underlying bond’s downside investment risk. The holder of the inverse floater typi- cally also benefits disproportionately from any potential appreciation of the underlying bond’s value. Hence, an inverse floater essentially represents an investment in the underlying bond on a leveraged basis. |
| ■ | Leverage: Using borrowed money to invest in securities or other assets. |
Nuveen Investments 61
Glossary of Terms
Used in this Report (continued)
| ■ | Leverage-Adjusted Duration: Duration is a measure of the expected period over which a bond’s principal and interest will be paid, and consequently is a measure of the sensitivity of a bond’s or bond Fund’s value to changes when market interest rates change. Generally, the longer a bond’s or Fund’s duration, the more the price of the bond or Fund will change as interest rates change. Leverage-adjusted duration takes into account the leveraging process for a Fund and therefore is longer than the duration of the Fund’s portfolio of bonds. |
| ■ | Market Yield (also known as Dividend Yield or Current Yield): An investment’s current annualized dividend divided by its current market price. |
| ■ | Net Asset Value (NAV): A Fund’s NAV per common share is calculated by subtracting the liabilities of the Fund from its total assets and then dividing the remainder by the number of common shares outstanding. Fund NAVs are calculated at the end of each business day. |
| ■ | Pre-Refunding: Pre-Refunding, also known as advanced refundings or refinancings, is a procedure used by state and local governments to refinance municipal bonds to lower interest expenses. The issuer sells new bonds with a lower yield and uses the proceeds to buy U.S. Treasury securities, the interest from which is used to make payments on the higher-yielding bonds. Because of this collateral, pre-refunding generally raises a bond’s credit rating and thus its value. |
| ■ | Structural Leverage: Structural Leverage consists of preferred shares or debt issued by the fund. Both of these are part of a fund’s capital structure. Structural leverage is sometimes referred to as “’40 Act Leverage” and is subject to asset coverage limits set in the Investment Company Act of 1940. |
| ■ | Taxable-Equivalent Yield: The yield necessary from a fully taxable investment to equal, on an after-tax basis, the yield of a municipal bond investment. |
| ■ | Zero Coupon Bond: A zero coupon bond does not pay a regular interest coupon to its holders during the life of the bond. Tax-exempt income to the holder of the bond comes from accretion of the difference between the original purchase price of the bond at issuance and the par value of the bond at maturity and is effectively paid at maturity. The market prices of zero coupon bonds generally are more volatile than the market prices of bonds that pay interest periodically. |
Other Useful Information
Board of Trustees
John P. Amboian
Robert P. Bremner
Jack B. Evans
William C. Hunter
David J. Kundert
William J. Schneider
Judith M. Stockdale
Carole E. Stone
Virginia L. Stringer
Terence J. Toth
Fund Manager
Nuveen Fund Advisors, Inc.
333 West Wacker Drive
Chicago, IL 60606
Custodian
State Street Bank
& Trust Company
Boston, MA
Transfer Agent and Shareholder Services
State Street Bank
& Trust Company
Nuveen Funds
P.O. Box 43071
Providence, RI 02940-3071
(800) 257-8787
Legal Counsel
Chapman and Cutler LLP
Chicago, IL
Independent Registered Public Accounting Firm
Ernst & Young LLP
Chicago, IL
Nuveen Funds’ Quarterly Portfolio of Investments and Proxy Voting Information
You may obtain (i) each Fund’s quarterly portfolio of investments, (ii) information regarding how the Funds voted proxies relating to portfolio securities held during the most recent twelve-month period ended June 30, and (iii) a description of the policies and procedures that the Funds used to determine how to vote proxies relating to portfolio securities without charge, upon request, by calling Nuveen Investments toll-free at (800) 257-8787 or on Nuveen’s website at www.nuveen.com.
You may also obtain this and other Fund information directly from the Securities and Exchange Commission (SEC). The SEC may charge a copying fee for this information. Visit the SEC on-line at http://www.sec.gov or in person at the SEC’s Public Reference Room in Washington, D.C. Call the SEC at (202) 942-8090 for room hours and operation. You may also request Fund information by sending an e-mail request to publicinfo@sec.gov or by writing to the SEC’s Public References Section at 100 F Street NE, Washington, D.C. 20549.
CEO Certification Disclosure
Each Fund’s Chief Executive Officer has submitted to the New York Stock Exchange (NYSE) the annual CEO certification as required by Section 303A.12(a) of the NYSE Listed Company Manual.
Each Fund has filed with the SEC the certification of its Chief Executive Officer and Chief Financial Officer required by Section 302 of the Sarbanes-Oxley Act.
Distribution Information
The following federal income tax information is provided with respect to the Funds’ distributions paid during the taxable period ended March 31, 2011, Nuveen Build America Bond Fund (NBB) and Nuveen Build America Bond Opportunity Fund (NBD) each hereby designate approximately 100% (or the maximum amount eligible) of ordinary income distributions as Interest-Related Dividends as defined in Internal Revenue Code Section 871(k) for the taxable period ended March 31, 2011.
Share Information
Each Fund intends to repurchase shares of its own common stock in the future at such times and in such amounts as is deemed advisable. During the period covered by this report, the Funds did not repurchase any of their common shares.
Any future repurchases will be reported to shareholders in the next annual or semi-annual report.
Nuveen Investments 63
Nuveen Investments:
Serving Investors for Generations
Since 1898, financial advisors and their clients have relied on Nuveen Investments to provide dependable investment solutions through continued adherence to proven, long-term investing principles. Today, we offer a range of high quality equity and fixed-income solutions designed to be integral components of a well-diversified core portfolio.
Focused on meeting investor needs.
Nuveen Investments is a global investment management firm that seeks to help secure the long-term goals of institutions and high net worth investors as well as the consultants and financial advisors who serve them. We market our growing range of specialized investment solutions under the high-quality brands of HydePark, NWQ, Nuveen Asset Management, Santa Barbara, Symphony, Tradewinds and Winslow Capital. In total, Nuveen Investments managed approximately $206 billion of assets as of March 31, 2011.
Find out how we can help you.
To learn more about how the products and services of Nuveen Investments may be able to help you meet your financial goals, talk to your financial advisor, or call us at (800) 257-8787. Please read the information provided carefully before you invest. Investors should consider the investment objective and policies, risk considerations, charges and expenses of any investment carefully. Where applicable, be sure to obtain a prospectus, which contains this and other relevant information. To obtain a prospectus, please contact your securities representative or Nuveen Investments, 333 W. Wacker Dr., Chicago, IL 60606. Please read the prospectus carefully before you invest or send money.
Learn more about Nuveen Funds at: www.nuveen.com/cef
| Nuveen makes things e-simple. It only takes a minute to sign up for e-Reports. Once enrolled, you’ll receive an e-mail as soon as your Nuveen Fund information is ready - no more waiting for delivery by regular mail. Just click on the link within the e-mail to see the report and save it on your computer if you wish. Free e-Reports right to your e-mail! www.investordelivery.com If you receive your Nuveen Fund distributions and statements from your financial advisor or brokerage account. OR www.nuveen.com/accountaccess If you receive your Nuveen Fund distributions and statements directly from Nuveen. |
| |
| Distributed by |
| Nuveen Securities, LLC |
| 333 West Wacker Drive |
| Chicago, IL 60606 |
| www.nuveen.com |
EAN-C-0311D
ITEM 2. CODE OF ETHICS.
As of the end of the period covered by this report, the registrant has adopted a code of ethics that applies to the registrant's principal executive officer, principal financial officer, principal accounting officer or controller, or persons performing similar functions. There were no amendments to or waivers from the Code during the period covered by this report. The registrant has posted the code of ethics on its website at www.nuveen.com/CEF/Info/Shareholder. (To view the code, click on Fund Governance and then click on Code of Conduct.)
ITEM 3. AUDIT COMMITTEE FINANCIAL EXPERT.
The registrant's Board of Directors or Trustees ("Board") determined that the registrant has at least one "audit committee financial expert" (as defined in Item 3 of Form N-CSR) serving on its Audit Committee. The registrant's audit committee financial expert is Carole E. Stone, who is "independent" for purposes of Item 3 of Form N-CSR.
Ms. Stone served for five years as Director of the New York State Division of the Budget. As part of her role as Director, Ms. Stone was actively involved in overseeing the development of the State's operating, local assistance and capital budgets, its financial plan and related documents; overseeing the development of the State's bond-related disclosure documents and certifying that they fairly presented the State's financial position; reviewing audits of various State and local agencies and programs; and coordinating the State's system of internal audit and control. Prior to serving as Director, Ms Stone worked as a budget analyst/examiner with increasing levels of responsibility over a 30 year period, including approximately five years as Deputy Budget Director. Ms. Stone has also served as Chair of the New York State Racing Association Oversight Board, as Chair of the Public Authorities Control Board, as a Commissioner on the New York State Commission on Public Authority Reform and as a member of the Boards of Directors of several New York State public authorities. These positions have involved overseeing operations and finances of certain entities and assessing the adequacy of project/entity financing and financial reporting. Currently, Ms. Stone is on the Board of Directors of CBOE Holdings, Inc., of the Chicago Board Options Exchange, and of C2 Options Exchange. Ms. Stone's position on the boards of these entities and as a member of both CBOE Holdings' Audit Committee and its Finance Committee has involved, among other things, the oversight of audits, audit plans and preparation of financial statements.
ITEM 4. PRINCIPAL ACCOUNTANT FEES AND SERVICES.
Nuveen Build America Bond Fund
The following tables show the amount of fees that Ernst & Young LLP, the Fund's auditor, billed to the Fund during the Fund's last two full fiscal years. For engagements with Ernst & Young LLP the Audit Committee approved in advance all audit services and non-audit services that Ernst & Young LLP provided to the Fund, except for those non-audit services that were subject to the pre-approval exception under Rule 2-01 of Regulation S-X (the "pre-approval exception"). The pre-approval exception for services provided directly to the Fund waives the pre-approval requirement for services other than audit, review or attest services if: (A) the aggregate amount of all such services provided constitutes no more than 5% of the total amount of revenues paid by the Fund to its accountant during the fiscal year in which the services are provided; (B) the Fund did not recognize the services as non-audit services at the time of the engagement; and (C) the services are promptly brought to the Audit Committee's attention, and the Committee (or its delegate) approves the services before the audit is completed.
The Audit Committee has delegated certain pre-approval responsibilities to its Chairman (or, in his absence, any other member of the Audit Committee).
SERVICES THAT THE FUND'S AUDITOR BILLED TO THE FUND
| | Audit Fees Billed | | | Audit-Related Fees | | | Tax Fees | | | All Other Fees | |
| Fiscal Year Ended | to Fund 1 | | | Billed to Fund 2 | | | Billed to Fund 3 | | | Billed to Fund 4 | |
March 31, 2011 5 | $ | 18,200 | | | $ | 6,000 | | | $ | 0 | | | $ | 0 | |
| | | | | | | | | | | | | | | | |
| Percentage approved | | 0 | % | | | 0 | % | | | 0 | % | | | 0 | % |
| pursuant to | | | | | | | | | | | | | | | |
| pre-approval | | | | | | | | | | | | | | | |
| exception | | | | | | | | | | | | | | | |
| | | | | | | | | | | | | | | | |
| March 31, 2010 | | N/A | | | | N/A | | | | N/A | | | | N/A | |
| | | | | | | | | | | | | | | | |
| Percentage approved | | 0 | % | | | 0 | % | | | 0 | % | | | 0 | % |
| pursuant to | | | | | | | | | | | | | | | |
| pre-approval | | | | | | | | | | | | | | | |
| exception | | | | | | | | | | | | | | | |
| | | | | | | | | | | | | | | | |
1 "Audit Fees" are the aggregate fees billed for professional services for the audit of the Fund's annual financial statements and services | |
| provided in connection with statutory and regulatory filings or engagements. | | | | | | | | | |
| | | | | | | | | | | | | | | | |
2 "Audit Related Fees" are the aggregate fees billed for assurance and related services reasonably related to the performance of the | |
| audit or review of financial statements and are not reported under "Audit Fees". | | | | | | | | | |
| | | | | | | | | | | | | | | | |
3 "Tax Fees" are the aggregate fees billed for professional services for tax advice, tax compliance, and tax planning. | | | | | |
| | | | | | | | | | | | | | | | |
4 "All Other Fees" are the aggregate fees billed for products and services for agreed upon procedures engagements performed for leveraged funds. | |
| | | | | | | | | | | | | | | | |
5 The fund commenced operations on April 27, 2010. | | | | | | | | | | | | | |
SERVICES THAT THE FUND'S AUDITOR BILLED TO THE ADVISER AND AFFILIATED FUND SERVICE PROVIDERS
The following tables show the amount of fees billed by Ernst & Young LLP to Nuveen Fund Advisors, Inc. (formerly Nuveen Asset Management) (the “Adviser” or “NFA”), and any entity controlling, controlled by or under common control with the Adviser that provides ongoing services to the Fund (“Affiliated Fund Service Provider”), for engagements directly related to the Fund's operations and financial reporting, during the Fund's last two full fiscal years.
The tables also show the percentage of fees subject to the pre-approval exception. The pre-approval exception for services provided to the Adviser and any Affiliated Fund Service Provider (other than audit, review or attest services) waives the pre-approval requirement if: (A) the aggregate amount of all such services provided constitutes no more than 5% of the total amount of revenues paid to Ernst & Young LLP by the Fund, the Adviser and Affiliated Fund Service Providers during the fiscal year in which the services are provided that would have to be pre-approved by the Audit Committee; (B) the Fund did not recognize the services as non-audit services at the time of the engagement; and (C) the services are promptly brought to the Audit Committee's attention, and the Committee (or its delegate) approves the services before the Fund's audit is completed.
| Fiscal Year Ended | Audit-Related Fees | | | Tax Fees Billed to | | | All Other Fees | |
| | Billed to Adviser and | | | Adviser and | | | Billed to Adviser | |
| | Affiliated Fund | | | Affiliated Fund | | | and Affiliated Fund | |
| | Service Providers | | | Service Providers | | | Service Providers | |
March 31, 2011 1 | $ | 0 | | | $ | 0 | | | $ | 0 | |
| | | | | | | | | | | | |
| Percentage approved | | 0 | % | | | 0 | % | | | 0 | % |
| pursuant to | | | | | | | | | | | |
| pre-approval | | | | | | | | | | | |
| exception | | | | | | | | | | | |
| March 31, 2010 | | N/A | | | | N/A | | | | N/A | |
| | | | | | | | | | | | |
| Percentage approved | | 0 | % | | | 0 | % | | | 0 | % |
| pursuant to | | | | | | | | | | | |
| pre-approval | | | | | | | | | | | |
| exception | | | | | | | | | | | |
| | | | | | | | | | | | |
1 The fund commenced operations on April 27, 2010. | | | | | | | | | |
NON-AUDIT SERVICES
The following table shows the amount of fees that Ernst & Young LLP billed during the Fund's last two full fiscal years for non-audit services. The Audit Committee is required to pre-approve non-audit services that Ernst & Young LLP provides to the Adviser and any Affiliated Fund Services Provider, if the engagement related directly to the Fund's operations and financial reporting (except for those subject to the pre-approval exception described above). The Audit Committee requested and received information from Ernst & Young LLP about any non-audit services that Ernst & Young LLP rendered during the Fund's last fiscal year to the Adviser and any Affiliated Fund Service Provider. The Committee considered this information in evaluating Ernst & Young LLP's independence.
| Fiscal Year Ended | | | | Total Non-Audit Fees | | | | | | | |
| | | | | billed to Adviser and | | | | | | | |
| | | | | Affiliated Fund Service | | | Total Non-Audit Fees | | | | |
| | | | | Providers (engagements | | | billed to Adviser and | | | | |
| | | | | related directly to the | | | Affiliated Fund Service | | | | |
| | Total Non-Audit Fees | | | operations and financial | | | Providers (all other | | | | |
| | Billed to Fund | | | reporting of the Fund) | | | engagements) | | | Total | |
March 31, 2011 1 | $ | 0 | | | $ | 0 | | | $ | 0 | | | $ | 0 | |
| March 31, 2010 | | N/A | | | | N/A | | | | N/A | | | | N/A | |
| | | | | | | | | | | | | | | | |
| "Non-Audit Fees billed to Fund" for both fiscal year ends represent "Tax Fees" and "All Other Fees" billed to Fund in their respective | |
| amounts from the previous table. | | | | | | | | | | | | | | | |
| | | | | | | | | | | | | | | | |
1 The fund commenced operations on April 27, 2010. | | | | | | | | | | | | | |
| | | | | | | | | | | | | | | | |
Audit Committee Pre-Approval Policies and Procedures. Generally, the Audit Committee must approve (i) all non-audit services to be performed for the Fund by the Fund's independent accountants and (ii) all audit and non-audit services to be performed by the Fund's independent accountants for the Affiliated Fund Service Providers with respect to operations and financial reporting of the Fund. Regarding tax and research projects conducted by the independent accountants for the Fund and Affiliated Fund Service Providers (with respect to operations and financial reports of the Fund) such engagements will be (i) pre-approved by the Audit Committee if they are expected to be for amounts greater than $10,000; (ii) reported to the Audit Committee chairman for his verbal approval prior to engagement if they are expected to be for amounts under $10,000 but greater than $5,000; and (iii) reported to the Audit Committee at the next Audit Committee meeting if they are expected to be for an amount under $5,000.
ITEM 5. AUDIT COMMITTEE OF LISTED REGISTRANTS.
The registrant's Board has a separately designated Audit Committee established in accordance with Section 3(a)(58)(A) of the Securities Exchange Act of 1934, as amended (15 U.S.C. 78c(a)(58)(A)). The members of the audit committee are Robert P. Bremner, Terence J. Toth, William J. Schneider, Carole E. Stone and David J. Kundert.
ITEM 6. SCHEDULE OF INVESTMENTS.
a) See Portfolio of Investments in Item 1.
b) Not applicable.
ITEM 7. DISCLOSURE OF PROXY VOTING POLICIES AND PROCEDURES FOR CLOSED-END MANAGEMENT INVESTMENT COMPANIES.
Nuveen Fund Advisors, Inc. is the registrant’s investment adviser. NFA is responsible for the on-going monitoring of the Fund’s investment portfolio, managing the Fund’s business affairs and providing certain clerical, bookkeeping and administrative services. The Adviser has engaged Nuveen Asset Management, LLC (“Sub-Adviser”) as Sub-Adviser to provide discretionary investment advisory services. As part of these services, the Adviser has delegated to the Sub-Adviser the full responsibility for proxy voting on securities held in the registrant’s portfolio and related duties in accordance with the Sub-Adviser's policy and procedures. The Adviser periodically monitors the Sub-Adviser's voting to ensure that it is carrying out its duties. The Sub-Adviser’s proxy voting policies and procedures are attached to this filing as an exhibit and incorporated herein by reference.
ITEM 8. PORTFOLIO MANAGERS OF CLOSED-END MANAGEMENT INVESTMENT COMPANIES.
Nuveen Fund Advisors, Inc. is the registrant's investment adviser (also referred to as the "Adviser"). The Adviser is responsible for the selection and on-going monitoring of the Fund's investment portfolio, managing the Fund's business affairs and providing certain clerical, bookkeeping and administrative services. The Adviser has engaged Nuveen Asset Management, LLC (“NAM” or “Sub-Adviser”) as Sub-Adviser to provide discretionary investment advisory services. The following section provides information on the portfolio managers at the Sub-Adviser:
The Portfolio Managers
The following individuals have primary responsibility for the day-to-day implementation of the registrant’s investment strategies:
| Name | Fund |
| Daniel J. Close | Nuveen Build America Bond Fund |
| John V. Miller | Nuveen Build America Bond Fund |
Other Accounts Managed. In addition to managing the registrant, the portfolio manager is also primarily responsible for the day-to-day portfolio management of the following accounts:
| Portfolio Manager | Type of Account Managed | Number of Accounts | Assets |
| Daniel J. Close | Registered Investment Company | 26 | $ 4.41 billion |
| | Other Pooled Investment Vehicles | 0 | $0 |
| | Other Accounts | 7 | $63.5 million |
| John V. Miller | Registered Investment Company | 8 | $ 6.39 billion |
| | Other Pooled Investment Vehicles | 4 | $314 million |
| | Other Accounts | 14 | $2.4 million |
| * | Assets are as of March 31, 2011. None of the assets in these accounts are subject to an advisory fee based on performance. |
Compensation. Each portfolio manager’s compensation consists of three basic elements—base salary, cash bonus and long-term incentive compensation. The compensation strategy is to annually compare overall compensation to the market in order to create a compensation structure that is competitive and consistent with similar financial services companies. As discussed below, several factors are considered in determining each portfolio manager’s total compensation. In any year these factors may include, among others, the effectiveness of the investment strategies recommended by the portfolio manager’s investment team, the investment performance of the accounts managed by the portfolio manager, and the overall performance of Nuveen Investments, Inc. (the parent company of NAM). Although investment performance is a factor in determining the portfolio manager’s compensation, it is not necessarily a decisive factor. The portfolio manager’s performance is evaluated in part by comparing manager’s performance against a specified investment benchmark. This fund-specific benchmark is a customized subset (limited to bonds in each Fund’s specific state and with certain maturity parameters) of the S&P/Investortools Municipal Bond index, an index comprised of bonds held by managed municipal bond fund customers of Standard & Poor’s Securities Pricing, Inc. that are priced daily and whose fund holdings aggregate at least $2 million. As of December 31, 2010, the S&P/Investortools Municipal Bond index was comprised of 57,308 securities with an aggregate current market value of $1,226 billion.
Base salary. Each portfolio manager is paid a base salary that is set at a level determined by NAM in accordance with its overall compensation strategy discussed above. NAM is not under any current contractual obligation to increase a portfolio manager’s base salary.
Cash bonus. Each portfolio manager is also eligible to receive an annual cash bonus. The level of this bonus is based upon evaluations and determinations made by each portfolio manager’s supervisors, along with reviews submitted by his peers. These reviews and evaluations often take into account a number of factors, including the effectiveness of the investment strategies recommended to the NAM’s investment team, the performance of the accounts for which he serves as portfolio manager relative to any benchmarks established for those accounts, his effectiveness in communicating investment performance to stockholders and their representatives, and his contribution to the NAM’s investment process and to the execution of investment strategies. The cash bonus component is also impacted by the overall performance of Nuveen Investments, Inc. in achieving its business objectives.
Long-term incentive compensation. In connection with the acquisition of Nuveen Investments, Inc., by a group of investors lead by Madison Dearborn Partners in November 2007, certain employees, including portfolio managers, received profit interests in Nuveen’s parent. These profit interests entitle the holders to participate in the appreciation in the value of Nuveen beyond the issue date and vest over five to seven years, or earlier in the case of a liquidity event. In addition, in July 2009, Nuveen Investments created and funded a trust, as part of a newly-established incentive program, which purchased shares of certain Nuveen Mutual Funds and awarded such shares, subject to vesting, to certain employees, including portfolio managers.
Material Conflicts of Interest. Each portfolio manager’s simultaneous management of the registrant and the other accounts noted above may present actual or apparent conflicts of interest with respect to the allocation and aggregation of securities orders placed on behalf of the Registrant and the other account. NAM, however, believes that such potential conflicts are mitigated by the fact that the NAM has adopted several policies that address potential conflicts of interest, including best execution and trade allocation policies that are designed to ensure (1) that portfolio management is seeking the best price for portfolio securities under the circumstances, (2) fair and equitable allocation of investment opportunities among accounts over time and (3) compliance with applicable regulatory requirements. All accounts are to be treated in a non-preferential manner, such that allocations are not based upon account performance, fee structure or preference of the portfolio manager. In addition, NAM has adopted a Code of Conduct that sets forth policies regarding conflicts of interest.
Beneficial Ownership of Securities. As of the March 31, 2011, the portfolio manager beneficially owned the following dollar range of equity securities issued by the Fund and other Nuveen Funds managed by NAM’s municipal investment team.
| Name of Portfolio Manager | Fund | Dollar range of equity securities beneficially owned in Fund | Dollar range of equity securities beneficially owned in the remainder of Nuveen funds managed by NAM’s municipal investment team |
| Daniel J. Close | Nuveen Build America Bond Fund | $0 | $0 |
| John V. Miller | Nuveen Build America Bond Fund | $0 | $100,001-$500,000 |
PORTFOLIO MANAGER BIO:
Daniel J. Close, CFA, is a Senior Vice President of Nuveen Investments. He joined Nuveen Investments in 2000 as a member of Nuveen’s product management and development team. He then served as a research analyst for Nuveen’s municipal investing team, covering corporate-backed, energy, transportation and utility credits. He received his BS in Business from Miami University and his MBA from Northwestern University’s Kellogg School of Management. Mr. Close has earned the Chartered Financial Analyst designation. Mr. Close also serves as a portfolio manager for various Nuveen Build America Bond strategies.
John V. Miller, CFA, joined Nuveen's investment management team as a credit analyst in 1996, with three prior years of experience in the municipal market with C.W. Henderson & Assoc., a municipal bond manager for private accounts. He has a BA in Economics and Political Science from Duke University, and an MA in Economics from Northwestern University and an MBA with honors in Finance from the University of Chicago. He has been responsible for analysis of high yield credits in the utility, solid waste and energy related sectors. He is a Managing Director and Co-Head of Fixed Income of Nuveen Asset Management. He manages investments for 10 Nuveen-sponsored investment companies.
ITEM 9. PURCHASES OF EQUITY SECURITIES BY CLOSED-END MANAGEMENT INVESTMENT COMPANY AND AFFILIATED PURCHASERS.
Not applicable.
ITEM 10. SUBMISSION OF MATTERS TO A VOTE OF SECURITY HOLDERS.
There have been no material changes to the procedures by which shareholders may recommend nominees to the registrant's Board implemented after the registrant last provided disclosure in response to this item.
ITEM 11. CONTROLS AND PROCEDURES.
| (a) | The registrant's principal executive and principal financial officers, or persons performing similar functions, have concluded that the registrant's disclosure controls and procedures (as defined in Rule 30a-3(c) under the Investment Company Act of 1940, as amended (the "1940 Act") (17 CFR 270.30a-3(c))) are effective, as of a date within 90 days of the filing date of this report that includes the disclosure required by this paragraph, based on their evaluation of the controls and procedures required by Rule 30a-3(b) under the 1940 Act (17 CFR 270.30a-3(b)) and Rules 13a-15(b) or 15d-15(b) under the Securities Exchange Act of 1934, as amended (the "Exchange Act") (17 CFR 240.13a-15(b) or 240.15d-15(b)). |
| (b) | There were no changes in the registrant's internal control over financial reporting (as defined in Rule 30a-3(d) under the 1940 Act (17 CFR 270.30a-3(d)) that occurred during the second fiscal quarter of the period covered by this report that has materially affected, or is reasonably likely to materially affect, the registrant's internal control over financial reporting. |
ITEM 12. EXHIBITS.
File the exhibits listed below as part of this Form. Letter or number the exhibits in the sequence indicated.
| (a)(1) | Any code of ethics, or amendment thereto, that is the subject of the disclosure required by Item 2, to the extent that the registrant intends to satisfy the Item 2 requirements through filing of an exhibit: Not applicable because the code is posted on registrant's website at www.nuveen.com/CEF/Info/ Shareholder and there were no amendments during the period covered by this report. (To view the code, click on Fund Governance and then Code of Conduct.) |
| (a)(2) | A separate certification for each principal executive officer and principal financial officer of the registrant as required by Rule 30a-2(a) under the 1940 Act (17 CFR 270.30a-2(a)) in the exact form set forth below: Ex-99.CERT Attached hereto. |
| (a)(3) | Any written solicitation to purchase securities under Rule 23c-1 under the 1940 Act (17 CFR 270.23c-1) sent or given during the period covered by the report by or on behalf of the registrant to 10 or more persons. Not applicable. |
| (b) | If the report is filed under Section 13(a) or 15(d) of the Exchange Act, provide the certifications required by Rule 30a-2(b) under the 1940 Act (17 CFR 270.30a-2(b)); Rule 13a-14(b) or Rule 15d-14(b) under the Exchange Act (17 CFR 240.13a-14(b) or 240.15d-14(b)), and Section 1350 of Chapter 63 of Title 18 of the United States Code (18 U.S.C. 1350) as an exhibit. A certification furnished pursuant to this paragraph will not be deemed "filed" for purposes of Section 18 of the Exchange Act (15 U.S.C. 78r), or otherwise subject to the liability of that section. Such certification will not be deemed to be incorporated by reference into any filing under the Securities Act of 1933 or the Exchange Act, except to the extent that the registrant specifically incorporates it by reference. Ex-99.906 CERT attached hereto. |
SIGNATURES
Pursuant to the requirements of the Securities Exchange Act of 1934 and the Investment Company Act of 1940, the registrant has duly caused this report to be signed on its behalf by the undersigned, thereunto duly authorized.
(Registrant) Nuveen Build America Bond Fund
By (Signature and Title) /s/ Kevin J. McCarthy
Kevin J. McCarthy
Vice President and Secretary
Date: June 6, 2011
Pursuant to the requirements of the Securities Exchange Act of 1934 and the Investment Company Act of 1940, this report has been signed below by the following persons on behalf of the registrant and in the capacities and on the dates indicated.
By (Signature and Title) /s/ Gifford R. Zimmerman
Gifford R. Zimmerman
Chief Administrative Officer
(principal executive officer)
Date: June 6, 2011
By (Signature and Title) /s/ Stephen D. Foy
Stephen D. Foy
Vice President and Controller
(principal financial officer)
Date: June 6, 2011