UNITED STATES
SECURITIES AND EXCHANGE COMMISSION
Washington, D.C. 20549
FORM N-CSR
CERTIFIED SHAREHOLDER REPORT OF REGISTERED
MANAGEMENT INVESTMENT COMPANIES
| | |
| Investment Company Act file number | | 811‑22391 |
Nuveen Taxable Municipal Income Fund
(Exact name of registrant as specified in charter)
Nuveen Investments
333 West Wacker Drive
Chicago, IL 60606
(Address of principal executive offices) (Zip code)
Mark L. Winget
Nuveen Investments
333 West Wacker Drive
Chicago, IL 60606
(Name and address of agent for service)
| | |
| Registrant’s telephone number, including area code: | | (312) 917‑7700 |
| | |
| Date of fiscal year end: | | March 31 |
| | |
| Date of reporting period: | | March 31, 2023 |
Form N‑CSR is to be used by management investment companies to file reports with the Commission not later than 10 days after the transmission to stockholders of any report that is required to be transmitted to stockholders under Rule 30e‑1 under the Investment Company Act of 1940 (17 CFR 270.30e‑1). The Commission may use the information provided on Form N‑CSR in its regulatory, disclosure review, inspection, and policymaking roles.
A registrant is required to disclose the information specified by Form N‑CSR, and the Commission will make this information public. A registrant is not required to respond to the collection of information contained in Form N‑CSR unless the Form displays a currently valid Office of Management and Budget (“OMB”) control number. Please direct comments concerning the accuracy of the information collection burden estimate and any suggestions for reducing the burden to Secretary, Securities and Exchange Commission, 450 Fifth Street, NW, Washington, DC 20549-0609. The OMB has reviewed this collection of information under the clearance requirements of 44 U.S.C. ss. 3507.
| ITEM 1. | REPORTS TO STOCKHOLDERS. |
| | | | | | |
| | | |
 | | Closed‑End Funds | | | | March 31, 2023 |
Nuveen Municipal
Closed‑End Funds
| | |
| | |
| Nuveen Taxable Municipal Income Fund | | NBB |
Annual
Report
Table
of Contents
| | | | |
| | | 3 | |
| |
| | | 4 | |
| |
| | | 5 | |
| |
| | | 7 | |
| |
| | | 8 | |
| |
| | | 10 | |
| |
| | | 11 | |
| |
| | | 13 | |
| |
| | | 14 | |
| |
| | | 24 | |
| |
| | | 25 | |
| |
| | | 26 | |
| |
| | | 27 | |
| |
| | | 28 | |
| |
| | | 30 | |
| |
| | | 41 | |
| |
| | | 58 | |
| |
| | | 59 | |
| |
| | | 60 | |
| |
| | | 61 | |
2
Chair’s Letter
to Shareholders
| | |
 | | Dear Shareholders, |
| | The significant measures taken by the U.S. Federal Reserve (Fed) and other global central banks over the past year to contain inflation have begun to take effect. From March 2022 to May 2023, the Fed raised the target fed funds rate by 5.00% to a range of 5.00% to 5.25%, marking the fastest interest rate hiking cycle in its history. Across most of the world, inflation rates have fallen from their post-pandemic highs but currently remain well above the levels that central banks consider supportive of their economies’ long-term growth. |
| | At the same time, the U.S. and other large economies have remained surprisingly resilient, even as financial conditions have tightened. Despite contracting in the first half of 2022, U.S. gross domestic product grew 2.1% in the year overall compared to 2021 and expanded at a more moderate pace of 1.1% in the first quarter of 2023. A relatively strong jobs market has helped support consumer sentiment and spending despite historically high inflation. Markets are concerned that these conditions could keep upward pressure on prices and wages, although the recent collapse of three regional U.S. banks (Silicon Valley Bank, Signature Bank and First Republic Bank) and major European bank Credit Suisse is likely to add further downward pressure to the economy as the banking system slows lending in response. |
| | Fed officials are closely monitoring inflation data and other economic measures to modify their rate setting policy based upon these factors on a meeting‑by‑meeting basis. While uncertainty has increased given the unpredictable outcome of tighter credit conditions on the economy, the Fed remains committed to acting until it sees sustainable progress toward its inflation goals. In the meantime, markets are likely to continue reacting in the short term to news about inflation data, economic indicators and central bank policy. We encourage investors to keep a long-term perspective amid the short-term noise. Your financial professional can help you review how well your portfolio is aligned with your time horizon, risk tolerance and investment goals. |
| | On behalf of the other members of the Nuveen Fund Board, we look forward to continuing to earn your trust in the months and years ahead. |
| | |
| |
| | Terence J. Toth |
| |
| | Chair of the Board |
| |
| | May 22, 2023 |
3
Important Notices
For Shareholders of
Nuveen Taxable Municipal Income Fund (NBB)
Portfolio Manager Updates
Effective April 10, 2023, John V. Miller announced that he will retire from Nuveen on June 1, 2023 and will continue to serve as a portfolio manager of the Fund until that time. In conjunction with this announcement Kristen DeJong has been named a portfolio manager of the Fund. Daniel J. Close will continue to serve as portfolio manager of the Fund. The day‑to‑day operation of the Fund and the execution of its specific investment strategies is the primary responsibility of each of the Fund’s portfolio managers.
4
Portfolio Managers’
Comments
Nuveen Taxable Municipal Income Fund (NBB)
The Fund features portfolio management by Nuveen Asset Management, LLC (NAM), an affiliate of Nuveen Fund Advisors, LLC, the Fund’s investment adviser. Here, portfolio managers John V. Miller, CFA, Daniel J. Close, CFA, and Kristen M. DeJong, CFA, discuss U.S. economic and market conditions, key investment strategies and the Fund’s performance for the twelve-month reporting period ended March 31, 2023.
Portfolio Manager Update
Effective April 10, 2023 (subsequent to the close of this reporting period), Kristen M. DeJong, CFA, was added as a portfolio manager of the Nuveen Taxable Municipal Income Fund (NBB). John V. Miller, CFA, will retire from Nuveen on June 1, 2023, and will continue to serve as a portfolio manager until that time. There were no other changes to the Fund’s portfolio management team.
For more information on the Fund’s investment objectives and policies, please refer to the Shareholder Update section at the end of the report.
What factors affected the U.S. economy and municipal markets during the twelve-month reporting period ended March 31, 2023?
U.S. economic growth continued to moderate amid high inflation and tightening financial conditions during the twelve-month period ended March 31, 2023. In the first quarter of 2023, the economy expanded at an annualized rate of 1.1%, according to the preliminary estimate from the U.S. Bureau of Economic Analysis, slowing from 2.1% in 2022 overall. Inflation remained persistently high through the majority of the reporting period as China’s Zero-COVID restrictions (lifted in December 2022) and the Russia-Ukraine war worsened existing pandemic-related supply chain disruptions and drove food and energy prices higher. While the U.S. Federal Reserve (Fed) and other global central banks took aggressive measures to ease inflation, and supply chains and energy prices began to normalize toward the end of the reporting period, inflation levels remained much higher than central banks’ target levels.
Beginning in March 2022, the Fed raised its target fed funds rate nine times during the reporting period, bringing it from near zero at the start of 2022 to a range of 4.75% to 5.00% as of March 2023. One of the Fed’s rate increases occurred in March 2023, a decision that was closely watched because of the failure of Silicon Valley Bank and Signature Bank during the same month and uncertainty around the economic impact of these failures. Additionally, in March 2023, Swiss bank UBS agreed to buy Credit Suisse, which had been troubled for some time and was considered to be vulnerable in the current environment. For much of the reporting period, the Fed’s activity led to significant volatility in bond and stock markets. In addition, it contributed to an increase in the U.S. dollar’s value relative to major world currencies, which acts as a headwind to the profits of international companies and U.S. domestic companies with overseas earnings. Global currency and bond markets were further roiled in September 2022 by an unpopular fiscal spending proposal in the U.K. but recovered after the plans were abandoned.
During the reporting period, elevated inflation and higher borrowing costs weighed on some segments of the economy, including the real estate market. Consumer spending, however, has remained more resilient than expected, in part because of a still-strong labor market, another key gauge of the economy’s health. By July 2022, the economy had recovered the 22 million jobs lost since the beginning of the pandemic. As of March 2023, the unemployment rate remained near its pre‑pandemic low of 3.5%, although monthly job growth appeared to be slowing. The strong labor market and wage gains helped provide a measure of resilience to the U.S. economy in 2022 and early 2023, even as the Fed sought to soften job growth to help curb inflation pressures.
The broad municipal bond market was impacted by interest rate volatility and economic uncertainty during the reporting period. Municipal yields rose across the maturity spectrum, but the move was uneven. The greatest increase in yields was at the shorter end of the curve as markets priced in a more aggressive pace of monetary tightening to combat persistently high inflation. Yields at the long end of the municipal curve also rose significantly, but intermediate and intermediate-long maturities saw relatively smaller yield increases. Overall, shorter maturities generally outperformed longer maturities during the reporting period. In response to the rising interest rate environment and heightened market volatility, dealers reduced their inventories and investors increased redemptions from traditional municipal bond mutual funds. For much of the reporting period, credit spreads were generally stable given relatively strong municipal fundamentals, although there was some widening as the market sell‑off continued.
5
Portfolio Managers’ Comments (continued)
What key strategies were used to manage the Fund during the twelve-month reporting period ended March 31, 2023?
The Fund’s primary investment objective is to provide current income through investments in taxable municipal securities. The Fund’s secondary investment objective is to seek enhanced portfolio value and total return. In addition, the Fund will use an integrated leverage and hedging strategy, so that the Fund has the potential to enhance income and risk-adjusted total return over time. The Fund may employ leverage instruments such as bank borrowings, including loans from certain financial institutions, and portfolio investments that have the economic effect of leverage, including inverse floating rate securities. Inverse floating rate securities, sometimes referred to as “inverse floaters,” are the residual interest in a tender option bond (TOB) trust. These securities can be used for a variety of reasons, including duration management, income and total return enhancement.
During the reporting period, the Fund’s trading activity remained focused on pursuing its investment objectives. The Fund engaged in opportunistic trades to support the Fund’s income by reinvesting premiums received as part of the Fund’s hedging program as well as bond calls and maturities across a variety of sectors. The Fund also took advantage of opportunities late in the reporting period to selectively sell bonds across a range of coupon, call and maturity structures to help offset the hedging program costs.
How did the Fund perform during the twelve-month reporting period ended March 31, 2023?
For the twelve months ended March 31, 2023, NBB underperformed the Bloomberg Taxable Municipal Long Bond Index. For the purposes of this Performance Commentary, references to relative performance are in comparison to the Bloomberg Taxable Municipal Long Bond Index.
The Fund’s use of leverage through inverse floating rate securities and reverse repurchase agreements detracted significantly from relative performance during the reporting period. However, the Fund’s use of leverage was accretive to overall common share income. Leverage is discussed in more detail in the Fund Leverage section of this report.
Also detracting from relative performance were the Fund’s overweight allocations to below investment grade and non‑rated bonds, which the benchmark does not include. While these credits underperformed, the portfolio management team believed they offered an attractive relative value opportunity.
These detractors were partially offset by positive contributions from the Fund’s duration-shortening hedge strategy. The Fund managed the duration of its portfolio by shorting interest rate futures contracts, which was beneficial as interest rates rose during the reporting period.
The Fund’s underperformance was also partially offset by overweight exposure to the shorter end of the yield curve, specifically the two to eight-year segment, which outperformed. The Fund held a corresponding underweight to the 12‑year and longer segment, which was also beneficial to relative performance because these bonds underperformed.
This material is not intended to be a recommendation or investment advice, does not constitute a solicitation to buy, sell or hold a security or an investment strategy, and is not provided in a fiduciary capacity. The information provided does not take into account the specific objectives or circumstances of any particular investor, or suggest any specific course of action. Investment decisions should be made based on an investor’s objectives and circumstances and in consultation with his or her advisors.
Certain statements in this report are forward-looking statements. Discussions of specific investments are for illustration only and are not intended as recommendations of individual investments. The forward-looking statements and other views expressed herein are those of the portfolio manager as of the date of this report. Actual future results or occurrences may differ significantly from those anticipated in any forward-looking statements, and the views expressed herein are subject to change at any time, due to numerous market and other factors. The Fund disclaims any obligation to update publicly or revise any forward-looking statements or views expressed herein.
For financial reporting purposes, the ratings disclosed are the highest rating given by one of the following national rating agencies: Standard & Poor’s Group (S&P), Moody’s Investors Service, Inc. (Moody’s) or Fitch, Inc. (Fitch). This treatment of split-rated securities may differ from that used for other purposes, such as for Fund investment policies. Credit ratings are subject to change. AAA, AA, A and BBB are investment grade ratings, while BB, B, CCC, CC, C and D are below investment grade ratings. Holdings designated N/R are not rated by these national rating agencies.
Bond insurance guarantees only the payment of principal and interest on the bond when due, and not the value of the bonds themselves, which will fluctuate with the bond market and the financial success of the issuer and the insurer. Insurance relates specifically to the bonds in the portfolio and not to the share prices of a Fund. No representation is made as to the insurers’ ability to meet their commitments.
Refer to the Glossary of Terms Used in this Report for further definition of the terms used within this section.
6
Fund Leverage
IMPACT OF THE FUND’S LEVERAGE STRATEGY ON PERFORMANCE
One important factor impacting the returns of the Fund’s common shares relative to its comparative benchmark was the Fund’s use of leverage through reverse repurchase agreements and investments in inverse floating rate securities, which represent leveraged investments in underlying bonds. The Fund uses leverage because our research has shown that, over time, leveraging provides opportunities for additional income. The opportunity arises when short-term rates that a Fund pays on its leveraging instruments are lower than the interest the Fund earns on its portfolio securities that it has bought with the proceeds of that leverage.
However, use of leverage can expose Fund common shares to additional price volatility. When the Fund uses leverage, the Fund’s common shares will experience a greater increase in their net asset value if the securities acquired through the use of leverage increase in value, but will also experience a correspondingly larger decline in their net asset value if the securities acquired through leverage decline in value. All this will make the shares’ total return performance more variable over time.
In addition, common share income in levered funds will typically decrease in comparison to unlevered funds when short-term interest rates increase and increase when short-term interest rates decrease. In recent quarters, fund leverage expenses have generally tracked the overall movement of short-term interest rates. While fund leverage expenses are higher than their prior year lows, leverage nevertheless continues to provide the opportunity for incremental common share income, particularly over longer-term periods.
The Fund’s use of leverage significantly detracted from relative performance during the reporting period. However, the Fund’s use of leverage was accretive to overall common share income.
As of March 31, 2023, the Fund’s percentages of leverage are as shown in the accompanying table.
| | | | |
| | | NBB | |
| | |
Effective Leverage* | | | 39.50% | |
Regulatory Leverage* | | | 0.00% | |
| | |
* Effective leverage is a Fund’s effective economic leverage, and includes both regulatory leverage and the leverage effects of reverse repurchase agreements, certain derivatives and other investments in a Fund’s portfolio that increase the Fund’s investment exposure. Currently, the leverage effects of Tender Option Bond (TOB) inverse floater holdings are included in effective leverage values, in addition to any regulatory leverage. Regulatory leverage consists of preferred shares issued or borrowings of a Fund. Both of these are part of a Fund’s capital structure. A Fund, however, may from time to time borrow on a typically transient basis in connection with its day‑to‑day operations, primarily in connection with the need to settle portfolio trades. Such incidental borrowings are excluded from the calculation of a Fund’s effective leverage ratio. Regulatory leverage is subject to asset coverage limits set forth in the Investment Company Act of 1940.
THE FUNDS’ LEVERAGE
Reverse Repurchase Agreements
As noted previously, the Fund used reverse repurchase agreements, in which the Fund sells to a counterparty a security that it holds with a contemporaneous agreement to repurchase the same security at an agreed-upon price and date. The Fund’s transactions in reverse repurchase agreements are as shown in the accompanying table.
| | | | | | | | | | | | | | | | | | | | | | | | | | | | | | | | |
| | | Current Reporting Period | | | Subsequent to the Close of the Reporting Period | |
| | | | | | | | |
| Fund | | Outstanding
Balance as of
April 1, 2022 | | | Sales | | | Purchases | | | Outstanding
Balance as of
March 31, 2023 | | | Average
Balance
Outstanding | | | Sales | | | Purchases | | | Outstanding
Balance as of
May 22, 2023 | |
| | |
| NBB | | | $257,150,000 | | | | $1,358,660,275 | | | | $(1,428,860,275) | | | | $186,950,000 | | | | $206,994,809 | | | | $186,950,000 | | | | $(186,950,000) | | | | $186,950,000 | |
| | |
Refer to Notes to Financial Statements for further details on reverse repurchase agreements for the Fund.
7
Common Share Information
COMMON SHARE DISTRIBUTION INFORMATION
The following information regarding the Fund’s distributions is current as of March 31, 2023. The Fund’s distribution levels may vary over time based on the Fund’s investment activity and portfolio investments value changes.
During the current reporting period, the Fund’s distributions to common shareholders were as shown in the accompanying table.
| | | | |
| | | Per Common
Share
Amounts | |
| Monthly Distributions (Ex‑Dividend Date) | | NBB | |
| | |
| April | | | $0.1085 | |
| May | | | 0.1085 | |
| June | | | 0.1085 | |
| July | | | 0.1085 | |
| August | | | 0.1085 | |
| September | | | 0.1085 | |
| October | | | 0.0925 | |
| November | | | 0.0925 | |
| December | | | 0.0925 | |
| January | | | 0.0720 | |
| February | | | 0.0720 | |
| March | | | 0.0720 | |
| | |
| Total Distributions from Net Investment Income | | | $1.1445 | |
| | |
| |
| Yields | | NBB | |
| | |
Market Yield* | | | 5.36% | |
| | |
| * | Market Yield is based on the Fund’s current annualized monthly distribution divided by the Fund’s current market price as of the end of the reporting period. |
The Fund seeks to pay regular monthly dividends out of its net investment income at a rate that reflects its past and projected net income performance. To permit the Fund to maintain a more stable monthly dividend, the Fund may pay dividends at a rate that may be more or less than the amount of net income actually earned by the Fund during the period. Distributions to common shareholders are determined on a tax basis, which may differ from amounts recorded in the accounting records. In instances where the monthly dividend exceeds the earned net investment income, the Fund would report a negative undistributed net ordinary income. Refer to the Notes to Financial Statements for additional information regarding the amounts of undistributed net ordinary income and undistributed net long-term capital gains and the character of the actual distributions paid by the Fund during the period.
All monthly dividends paid by the Fund during the current reporting period were paid from net investment income. If a portion of the Fund’s monthly distributions is sourced from or comprised of elements other than net investment income, including capital gains and/or a return of capital, shareholders will be notified of those sources. For financial reporting purposes, per share amounts of the Fund’s distributions for the reporting period are presented in this report’s Financial Highlights. For income tax purposes, distribution information for the Fund as of its most recent tax year end is presented in the Notes to Financial Statements of this report.
NUVEEN CLOSED‑END FUND DISTRIBUTION AMOUNTS
The Nuveen Closed‑End Funds’ monthly and quarterly periodic distributions to shareholders are posted on www.nuveen.com and can be found on Nuveen’s enhanced closed‑end fund resource page, which is at https://www.nuveen.com/resource‑center‑closed‑end‑funds, along with other Nuveen closed‑end fund product updates. To ensure timely access to the latest information, shareholders may use a subscribe function, which can be activated at this web page (https://www.nuveen.com/subscriptions).
COMMON SHARE EQUITY SHELF PROGRAMS
During the current reporting period, the Fund was authorized by the Securities and Exchange Commission to issue additional common shares through an equity shelf program (Shelf Offering). Under these programs, the Fund, subject to market conditions, may raise additional capital from time to time in varying amounts and offering methods at a net price at or above the Fund’s NAV per common share. The maximum aggregate offering under these Shelf Offerings are as shown in the accompanying table.
8
| | | | |
| | | NBB | |
| | |
| Maximum aggregate offering | | $ | 162,000,000 | |
| | |
During the current reporting period, the Fund sold common shares through their Shelf Offerings at a weighted average premium to their NAV per common share as shown in the accompanying table.
| | | | |
| | | NBB | |
| | |
| Common shares sold through shelf offering | | | 772,413 | |
| Weighted average premium to NAV per common share sold | | | 1.65% | |
Refer to Notes to Financial Statements, for further details of Shelf Offerings and the Fund’s transactions.
COMMON SHARE REPURCHASES
During August 2022, the Fund’s Board of Trustees reauthorized an open-market share repurchase program, allowing the Fund to repurchase an aggregate of up to approximately 10% of its outstanding common shares.
During the current reporting period, the Fund did not repurchase any of its outstanding common shares. As of March 31, 2023, (and since the inception of the Fund’s repurchase programs), the Fund has cumulatively repurchased and retired its outstanding common shares as shown in the accompanying table.
| | | | |
| | | NBB | |
| | |
| Common shares cumulatively repurchased and retired | | | 0 | |
| Common shares authorized for repurchase | | | 2,905,000 | |
| | |
OTHER COMMON SHARE INFORMATION
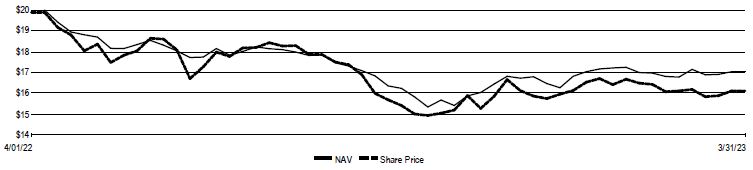
As of March 31, 2023, the Fund’s common share prices were trading at a premium/(discount) to its common share NAV, and trading at an average premium/(discount) to NAV during the current reporting period, as follows:
| | | | |
| | | NBB | |
| | |
| Common share NAV | | | $17.04 | |
| Common share price | | | $16.12 | |
| Premium/(Discount) to NAV | | | (5.40)% | |
| Average premium/(discount) to NAV | | | (2.38)% | |
| | |
9
About the Fund’s Benchmark
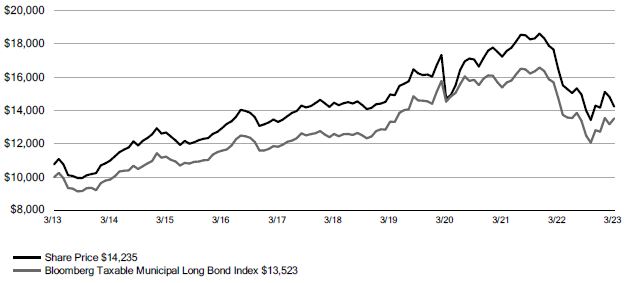
Bloomberg Taxable Municipal Long Bond Index: A rules-based index engineered for the long-term taxable municipal bond market. Bonds in the index have effective maturities of 10+ years. Index returns assume reinvestment of distributions, but do not reflect any applicable sales charges or management fees.
10
| | |
| NBB | | Nuveen Taxable Municipal Income Fund Performance Overview and Holding Summaries March 31, 2023 |
Refer to the Glossary of Terms Used in this Report for further definition of the terms used within this section.
Fund Performance*
| | | | | | | | | | | | |
| | | | | | Total Returns as of
March 31, 2023 |
| | | | | | Average Annual |
| | | Inception Date | | | 1‑Year | | | 5‑Year | | 10‑Year |
| NBB at Common Share NAV | | | 4/27/10 | | | | (8.98 | )% | | 0.64% | | 3.11% |
| NBB at Common Share Price | | | 4/27/10 | | | | (13.68 | )% | | 0.77% | | 3.59% |
| Bloomberg Taxable Municipal Long Bond Index | | | – | | | | (8.44 | )% | | 1.43% | | 3.06% |
*For purposes of Fund performance, relative results are measured against the Bloomberg Taxable Municipal Long Bond Index.
Performance data shown represents past performance and does not predict or guarantee future results. Current per‑formance may be higher or lower than the data shown. Returns do not reflect the deduction of taxes that shareholders may have to pay on Fund distributions or upon the sale of Fund shares. Returns at NAV are net of Fund expenses, and assume reinvestment of distributions. Comparative index return information is provided for the Fund’s shares at NAV only. Indexes are not available for direct investment.
Daily Common Share NAV and Share Price
Growth of an Assumed $10,000 Investment as of March 31, 2023 - Common Share Price
11
Performance Overview and Holdings Summaries March 31, 2023 (continued)
Holdings Summaries as of March 31, 2023
This data relates to the securities held in the Fund’s portfolio of investments as of the end of the reporting period. It should not be construed as a measure of performance for the Fund itself. Holdings are subject to change.
For financial reporting purposes, the ratings disclosed are the highest rating given by one of the following national rating agencies: Standard & Poor’s Group, Moody’s Investors Service, Inc. or Fitch, Inc. This treatment of split-rated securities may differ from that used for other purposes, such as for Fund investment policies. Credit ratings are subject to change. AAA, AA, A and BBB are investment grade ratings; BB, B, CCC, CC, C and D are below-investment grade ratings. Holdings designated N/R are not rated by these national rating agencies.
| | |
Fund Allocation (% of net assets) |
| Municipal Bonds | | 141.0% |
| Repurchase Agreements | | 1.1% |
| Other Assets & Liabilities, Net | | 3.0% |
| Reverse Repurchase Agreements, including accrued interest | | (37.7)% |
| Floating Rate Obligations | | (7.4)% |
| Net Assets | | 100% |
|
Portfolio Credit Quality (% of total investment exposure) |
| AAA | | 5.8% |
| AA | | 45.9% |
| A | | 24.6% |
| BBB | | 12.6% |
| BB or Lower | | 4.1% |
| N/R (not rated) | | 6.3% |
| N/A (not applicable) | | 0.7% |
| Total | | 100% |
| | |
Portfolio Composition1 (% of total investments) | | |
| Tax Obligation/Limited | | 30.6% |
| Transportation | | 20.5% |
| Utilities | | 15.8% |
| Tax Obligation/General | | 9.2% |
| Health Care | | 7.8% |
| Education and Civic Organizations | | 5.5% |
| Other | | 9.8% |
| Repurchase Agreements | | 0.8% |
| Total | | 100% |
| | |
States and Territories2 (% of total municipal bonds) | | |
| California | | 21.8% |
| New York | | 19.1% |
| Illinois | | 8.1% |
| Texas | | 7.1% |
| Washington | | 5.3% |
| Georgia | | 4.8% |
| Ohio | | 4.6% |
| Tennessee | | 3.0% |
| New Jersey | | 3.0% |
| District of Columbia | | 2.8% |
| Virginia | | 2.5% |
| South Carolina | | 2.5% |
| Oklahoma | | 2.2% |
| West Virginia | | 2.2% |
| Maryland | | 1.9% |
| Other | | 9.1% |
| Total | | 100% |
| 1 | “Other” sectors include four sectors that individually constitute less than 5.5% as a percentage of total investments. |
| 2 | See the Portfolio of Investments for the remaining states comprising “Other” and not listed in the table above. |
12
Report of Independent Registered
Public Accounting Firm
To the Shareholders and Board of Trustees
Nuveen Taxable Municipal Income Fund:
Opinion on the Financial Statements
We have audited the accompanying statement of assets and liabilities of Nuveen Taxable Municipal Income Fund (the Fund), including the portfolio of investments, as of March 31, 2023, the related statements of operations and cash flows for the year then ended, the statements of changes in net assets for each of the years in the two year period then ended, and the related notes (collectively, the financial statements) and the financial highlights for each of the years in the five year period then ended. In our opinion, the financial statements and financial highlights present fairly, in all material respects, the financial position of the Fund as of March 31, 2023, the results of its operations and its cash flows for the year then ended, the changes in its net assets for each of the years in the two year period then ended, and the financial highlights for each of the years in the five year period then ended, in conformity with U.S. generally accepted accounting principles.
Basis for Opinion
These financial statements and financial highlights are the responsibility of the Fund’s management. Our responsibility is to express an opinion on these financial statements and financial highlights based on our audits. We are a public accounting firm registered with the Public Company Accounting Oversight Board (United States) (PCAOB) and are required to be independent with respect to the Fund in accordance with the U.S. federal securities laws and the applicable rules and regulations of the Securities and Exchange Commission and the PCAOB.
We conducted our audits in accordance with the standards of the PCAOB. Those standards require that we plan and perform the audit to obtain reasonable assurance about whether the financial statements and financial highlights are free of material misstatement, whether due to error or fraud. Our audits included performing procedures to assess the risks of material misstatement of the financial statements and financial highlights, whether due to error or fraud, and performing procedures that respond to those risks. Such procedures included examining, on a test basis, evidence regarding the amounts and disclosures in the financial statements and financial highlights. Such procedures also included confirmation of securities owned as of March 31, 2023, by correspondence with custodians and brokers; when replies were not received from brokers, we performed other auditing procedures. Our audits also included evaluating the accounting principles used and significant estimates made by management, as well as evaluating the overall presentation of the financial statements and financial highlights. We believe that our audits provide a reasonable basis for our opinion.
/s/ KPMG LLP
We have served as the auditor of one or more Nuveen investment companies since 2014.
Chicago, Illinois
May 26, 2023
13
| | |
| NBB | | Nuveen Taxable Municipal Income Fund Portfolio of Investments March 31, 2023 |
| | | | | | | | | | | | | | |
Principal Amount (000) | | Description (1) | | Optional Call
Provisions (2) | | Ratings (3) | | | Value |
| | | |
| | | | |
| | | | LONG-TERM INVESTMENTS - 141.0% (99.2% of Total Investments) | | | | | | | | | | |
| | | | |
| | | | MUNICIPAL BONDS - 141.0% (99.2% of Total Investments) | | | | | | | | | | |
| | | | |
| | | | Alaska - 0.6% (0.4% of Total Investments) | | | | | | | | | | |
| | | | |
| $ | 3,025 | | | Port Lions, Alaska, Revenue Bonds, Kodiak Area Native Association Project, Taxable Series 2022, 7.500%, 10/01/52 | | 10/32 at 100.00 | | | A+ | | | $ | 3,199,724 | |
| | | |
| | | | Total Alaska | | | | | | | | | 3,199,724 | |
| | | | | |
| | | | |
| | | | California - 30.8% (21.7% of Total Investments) | | | | | | | | | | |
| | | | |
| | | | ABAG Finance Authority for Non‑Profit Corporations, California, Special Tax Bonds, Community Facilities District 2004‑1 Seismic Safety Improvements 690 & 942 Market Street Project, Taxable Refunding Series 2018: | | | | | | | | | | |
| | 1,950 | | | 5.100%, 9/01/28 | | No Opt. Call | | | N/R | | | | 1,882,159 | |
| | 6,125 | | | 5.500%, 9/01/38 | | 9/28 at 100.00 | | | N/R | | | | 5,645,474 | |
| | | | |
| | 2,520 | | | Alameda Corridor Transportation Authority, California, Revenue Bonds, Refunding Taxable Subordinate Lien Series 2004B, 0.000%, 10/01/31 - AMBAC Insured | | No Opt. Call | | | BBB+ | | | | 1,617,941 | |
| | | | |
| | 55 | | | Bay Area Toll Authority, California, Revenue Bonds, San Francisco Bay Area Toll Bridge, Subordinate Lien, Build America Federally Taxable Bond Series 2010S‑1, 6.793%, 4/01/30 | | No Opt. Call | | | AA- | | | | 58,670 | |
| | | | |
| | | | California Infrastructure and Economic Development Bank, Revenue Bonds, J. David Gladstone Institutes Project, Taxable Series 2019: | | | | | | | | | | |
| | 2,480 | | | 4.000%, 10/01/39 | | 10/29 at 100.00 | | | A | | | | 2,025,962 | |
| | 8,260 | | | 4.658%, 10/01/59 | | 10/29 at 100.00 | | | A | | | | 6,507,806 | |
| | | | |
| | 1,000 | | | California Infrastructure and Economic Development Bank, Revenue Bonds, University of California San Francisco Neurosciences Building, Build America Taxable Bond Series 2010B, 6.486%, 5/15/49 | | No Opt. Call | | | AA | | | | 1,141,560 | |
| | | | |
| | 8,010 | | | California Municipal Finance Authority, Mobile Home Park Revenue Bonds, Windsor Mobile Country Club, Taxable Refunding Series 20202B, 6.375%, 11/15/48, 144A | | 11/30 at 100.00 | | | N/R | | | | 7,005,306 | |
| | | | |
| | 4,530 | | | California State Public Works Board, Lease Revenue Bonds, Various Capital Projects, Build America Taxable Bond Series 2009G‑2, 8.361%, 10/01/34 (4) | | No Opt. Call | | | Aa3 | | | | 5,747,392 | |
| | | | |
| | 7,010 | | | California State University, Systemwide Revenue Bonds, Build America Taxable Bond Series 2010B, 6.484%, 11/01/41 | | No Opt. Call | | | Aa2 | | | | 7,965,813 | |
| | | | |
| | 2,000 | | | California State, General Obligation Bonds, Build America Federally Taxable Series 2009, 7.550%, 4/01/39 | | No Opt. Call | | | Aa2 | | | | 2,594,420 | |
| | | | |
| | 4,110 | | | California State, General Obligation Bonds, Various Purpose, Build America Taxable Bond Series 2010, 7.600%, 11/01/40 (4) | | No Opt. Call | | | Aa2 | | | | 5,422,241 | |
| | | | |
| | 2,720 | | | California Statewide Communities Development Authority, California, Revenue Bonds, Loma Linda University Medical Center, Series 2014B, 6.000%, 12/01/24 | | No Opt. Call | | | BB+ | | | | 2,760,582 | |
| | | | |
| | 1,300 | | | California Statewide Community Development Authority, Health Revenue Bonds, Enloe Medical Center, Refunding Series 2022B, 7.140%, 8/15/47 - AGM Insured | | 8/32 at 100.00 | | | AA | | | | 1,419,080 | |
| | | | |
| | 2,025 | | | Chino Public Financing Authority, California, Local Agency Bonds, Refunding Series 2021A, 4.001%, 9/01/38 | | 9/31 at 100.00 | | | AA | | | | 1,814,886 | |
| | | | |
| | 3,800 | | | Golden State Tobacco Securitization Corporation, California, Enhanced Tobacco Settlement Asset-Backed Revenue Bonds, Taxable Series 2021A, 3.115%, 6/01/38 | | 6/31 at 100.00 | | | Aa3 | | | | 3,046,346 | |
14
| | | | | | | | | | | | | | |
Principal Amount (000) | | Description (1) | | Optional Call
Provisions (2) | | Ratings (3) | | | Value |
| | | |
| | | | |
| | | | California (continued) | | | | | | | | | | |
| | | | |
| $ | 5,000 | | | Golden State Tobacco Securitization Corporation, California, Enhanced Tobacco Settlement Asset-Backed Revenue Bonds, Taxable Series 2021B, 3.293%, 6/01/42 | | 6/31 at 100.00 | | | Aa3 | | | $ | 3,987,300 | |
| | | | |
| | | | Golden State Tobacco Securitization Corporation, California, Tobacco Settlement Asset-Backed Bonds, Taxable Senior Series 2021A‑1: | | | | | | | | | | |
| | 3,500 | | | 2.587%, 6/01/29 | | No Opt. Call | | | A | | | | 3,031,840 | |
| | 2,000 | | | 3.714%, 6/01/41 | | 12/31 at 100.00 | | | A- | | | | 1,569,840 | |
| | | | |
| | | | Los Angeles Community College District, California, General Obligation Bonds, Build America Taxable Bonds, Series 2010: | | | | | | | | | | |
| | 10,000 | | | 6.600%, 8/01/42, (UB) (5) | | No Opt. Call | | | Aaa | | | | 12,475,500 | |
| | 7,500 | | | 6.600%, 8/01/42 (4),(5) | | No Opt. Call | | | Aaa | | | | 9,356,625 | |
| | | | |
| | | | Los Angeles Community College District, Los Angeles County, California, General Obligation Bonds, Tender Option Bond Trust 2016-XTG002: | | | | | | | | | | |
| | 2,000 | | | 11.519%, 8/01/49, 144A, (IF) (5) | | No Opt. Call | | | Aaa | | | | 4,904,340 | |
| | | | |
| | | | Los Angeles County Public Works Financing Authority, California, Lease Revenue Bonds, Mulitple Capital Projects I, Build America Taxable Bond Series 2010B: | | | | | | | | | | |
| | 2,050 | | | 7.488%, 8/01/33 (4) | | No Opt. Call | | | AA+ | | | | 2,384,560 | |
| | 11,380 | | | 7.618%, 8/01/40 (4) | | No Opt. Call | | | AA+ | | | | 14,672,234 | |
| | | | |
| | 3,255 | | | Los Angeles Department of Airports, California, Revenue Bonds, Los Angeles International Airport, Build America Taxable Bonds, Series 2009C, 6.582%, 5/15/39 | | No Opt. Call | | | AA- | | | | 3,652,436 | |
| | | | |
| | 80 | | | Los Angeles Department of Water and Power, California, Power System Revenue Bonds, Federally Taxable - Direct Payment - Build America Bonds, Series 2010A, 5.716%, 7/01/39 | | No Opt. Call | | | Aa2 | | | | 86,959 | |
| | | | |
| | 1,785 | | | Los Angeles Department of Water and Power, California, Power System Revenue Bonds, Federally Taxable - Direct Payment - Build America Bonds, Series 2010D, 6.574%, 7/01/45 (4) | | No Opt. Call | | | Aa2 | | | | 2,128,345 | |
| | | | |
| | 4,000 | | | Los Angeles Department of Water and Power, California, Water System Revenue Bonds, Tender Option Bond Trust 2016-XFT906, 10.085%, 7/01/50, 144A, (IF) (5) | | No Opt. Call | | | AA+ | | | | 9,152,520 | |
| | | | |
| | 4,250 | | | Sacramento Public Financing Authority, California, Lease Revenue Bonds, Golden 1 Center, Series 2015, 5.637%, 4/01/50 (4) | | No Opt. Call | | | AA- | | | | 4,408,695 | |
| | | | |
| | 2,200 | | | San Diego County Regional Transportation Commission, California, Sales Tax Revenue Bonds, Build America Taxable Bonds Series 2010A, 5.911%, 4/01/48 | | No Opt. Call | | | AAA | | | | 2,491,610 | |
| | | | |
| | 1,500 | | | San Francisco City and County Public Utilities Commission, California, Water Revenue Bonds, Taxable Build America Bond Series 2010G, 6.950%, 11/01/50 | | No Opt. Call | | | Aa2 | | | | 1,844,370 | |
| | | | |
| | 1,000 | | | San Francisco City and County Redevelopment Financing Authority, California, Tax Allocation Revenue Bonds, San Francisco Redevelopment Projects, Taxable Series 2009E, 8.406%, 8/01/39 | | No Opt. Call | | | AA | | | | 1,283,940 | |
| | | | |
| | | | San Francisco City and County, California, Certificates of Participation, 525 Golden Gate Avenue, San Francisco Public Utilities Commission Office Project, Tender Option Bond 2016-XFT901: | | | | | | | | | | |
| | 4,000 | | | 10.040%, 11/01/41, 144A, (IF) (5) | | No Opt. Call | | | AA+ | | | | 6,466,240 | |
| | 2,000 | | | 10.040%, 11/01/41, 144A, (IF) (5) | | No Opt. Call | | | AA+ | | | | 3,233,120 | |
| | | | |
| | 2,000 | | | University of California Regents, Medical Center Pooled Revenue Bonds, Taxable Build America Bond Series 2010H, 6.548%, 5/15/48 (4) | | No Opt. Call | | | AA- | | | | 2,351,440 | |
15
| | |
| NBB | | Nuveen Taxable Municipal Income Fund (continued) Portfolio of Investments March 31, 2023 |
| | | | | | | | | | | | | | | | |
Principal
Amount (000) | | Description (1) | | Optional Call
Provisions (2) | | | Ratings (3) | | | Value | |
| | | |
| | | | |
| | | | California (continued) | | | | | | | | | | | | |
| | | | |
| $ | 2,505 | | | University of California, General Revenue Bonds, Limited Project, Build America Taxable Bond Series 2010F, 5.946%, 5/15/45 | | | No Opt. Call | | | | AA‑ | | | $ | 2,777,995 | |
| | | | |
| | 4,545 | | | Vernon, California, Electric System Revenue Bonds, Series 2008A, 8.590%, 7/01/38 | | | No Opt. Call | | | | BBB+ | | | | 5,481,270 | |
| | | |
| | | | Total California | | | | | | | | | | | 154,396,817 | |
| | | | | |
| | | | |
| | | | Colorado - 1.9% (1.3% of Total Investments) | | | | | | | | | | | | |
| | | | |
| | 4,335 | | | Colorado Bridge Enterprise, Revenue Bonds, Federally Taxable Build America Series 2010A, 6.078%, 12/01/40 (4) | | | No Opt. Call | | | | AA | | | | 4,766,983 | |
| | | | |
| | 3,100 | | | Denver School District 1, Colorado, General Obligation Bonds, Build America Taxable Bonds, Series 2009C, 5.664%, 12/01/33 (4) | | | No Opt. Call | | | | AA+ | | | | 3,351,007 | |
| | | | |
| | 1,230 | | | Regional Transportation District, Colorado, Sales Tax Revenue Bonds, Fastracks Project, Build America Series 2010B, 5.844%, 11/01/50 (4) | | | No Opt. Call | | | | AA+ | | | | 1,431,744 | |
| | | |
| | | | Total Colorado | | | | | | | | | | | 9,549,734 | |
| | | | | |
| | | | |
| | | | District of Columbia - 4.0% (2.8% of Total Investments) | | | | | | | | | | | | |
| | | | |
| | | | Metropolitan Washington Airports Authority, District of Columbia, Dulles Toll Road Revenue Bonds, Dulles Metrorail & Capital improvement Projects, Second Senior Lien, Build America Bond Series 2009D: | | | | | | | | | | | | |
| | 1,000 | | | 7.462%, 10/01/46 - AGM Insured | | | No Opt. Call | | | | AA | | | | 1,316,440 | |
| | 14,365 | | | 7.462%, 10/01/46 (4) | | | No Opt. Call | | | | A- | | | | 18,721,330 | |
| | | |
| | | | Total District of Columbia | | | | | | | | | | | 20,037,770 | |
| | | | | |
| | | | |
| | | | Florida - 2.0% (1.4% of Total Investments) | | | | | | | | | | | | |
| | | | |
| | 10,000 | | | Charlotte County Industrial Development Authority, Florida, Utility System Revenue Bonds, Town & Country Utilities Project, Taxable Series 2021B, 5.000%, 10/01/36, 144A | | | 10/31 at 100.00 | | | | N/R | | | | 8,706,000 | |
| | | | |
| | 1,400 | | | Miami, Florida, Special Obligation Revenue Bonds, Street & Sidewalk Improvement Program, Taxable Refunding Series 2018B, 4.808%, 1/01/39 - AGM Insured, 144A | | | 1/28 at 100.00 | | | | AA | | | | 1,301,930 | |
| | | |
| | | | Total Florida | | | | | | | | | | | 10,007,930 | |
| | | | | |
| | | | |
| | | | Georgia - 6.8% (4.8% of Total Investments) | | | | | | | | | | | | |
| | | | |
| | 2,293 | | | Georgia Municipal Electric Authority, Plant Vogtle Units 3 & 4 Project M Bonds, Taxable Build America Bonds Series 2010A, 6.655%, 4/01/57 | | | No Opt. Call | | | | A | | | | 2,542,432 | |
| | | | |
| | | | Georgia Municipal Electric Authority, Plant Vogtle Units 3 & 4 Project P Bonds, Refunding Taxable Build America Bonds Series 2010A: | | | | | | | | | | | | |
| | 5,737 | | | 7.055%, 4/01/57 - AGM Insured | | | No Opt. Call | | | | AA | | | | 6,531,632 | |
| | 18,654 | | | 7.055%, 4/01/57 (4) | | | No Opt. Call | | | | BBB+ | | | | 19,364,158 | |
| | | | |
| | 5,077 | | | Municipal Electric Authority of Georgia, Plant Vogtle Units 3 & 4 Project J Bonds, Taxable Build America Bonds Series 2010A, 6.637%, 4/01/57 | | | No Opt. Call | | | | A | | | | 5,577,643 | |
| | | |
| | | | Total Georgia | | | | | | | | | | | 34,015,865 | |
| | | | | |
| | | | |
| | | | Illinois - 11.5% (8.1% of Total Investments) | | | | | | | | | | | | |
| | | | |
| | 4,030 | | | Chicago Board of Education, Illinois, General Obligation Bonds, Dedicated Revenues, Series 2010C, 6.319%, 11/01/29 - BAM Insured (4) | | | No Opt. Call | | | | AA | | | | 4,228,598 | |
| | | | |
| | 8,680 | | | Chicago Transit Authority, Illinois, Sales Tax Receipts Revenue Bonds, Federally Taxable Build America Bonds, Series 2010B, 6.200%, 12/01/40 (4) | | | No Opt. Call | | | | AA | | | | 9,744,255 | |
| | | | |
| | 1,000 | | | Chicago Transit Authority, Illinois, Sales Tax Receipts Revenue Bonds, Taxable Refunding Series 2020B, 3.912%, 12/01/40 | | | No Opt. Call | | | | AA | | | | 876,760 | |
16
| | | | | | | | | | | | | | | | |
Principal
Amount (000) | | Description (1) | | Optional Call
Provisions (2) | | | Ratings (3) | | | Value | |
| | | |
| | | | |
| | | | Illinois (continued) | | | | | | | | | | | | |
| | | | |
| $ | 355 | | | Chicago, Illinois, General Airport Revenue Bonds, O’Hare International Airport, Third Lien, Taxable Build America Bond Series 2010B, 6.395%, 1/01/40 | | | No Opt. Call | | | | A+ | | | $ | 421,900 | |
| | | | |
| | 1,015 | | | Chicago, Illinois, Wastewater Transmission Revenue Bonds, Build America Taxable Bond Series 2010B, 6.900%, 1/01/40 | | | No Opt. Call | | | | A | | | | 1,165,728 | |
| | | | |
| | 3,495 | | | Chicago, Illinois, Water Revenue Bonds, Taxable Second Lien Series 2010B, 6.742%, 11/01/40 | | | No Opt. Call | | | | A | | | | 3,990,556 | |
| | | | |
| | 1,000 | | | Cook County, Illinois, General Obligation Bonds, Build America Taxable Bonds, Series 2010D, 6.229%, 11/15/34 | | | No Opt. Call | | | | A+ | | | | 1,102,750 | |
| | | | |
| | 3,180 | | | Illinois International Port District, Revenue Bonds, Taxable Refunding Series 2020, 5.000%, 1/01/35, 144A | | | 1/26 at 101.00 | | | | N/R | | | | 2,839,867 | |
| | | | |
| | 1,857 | | | Illinois State, General Obligation Bonds, Build America Taxable Bonds, Series 2010‑5, 7.350%, 7/01/35 | | | No Opt. Call | | | | A- | | | | 2,040,554 | |
| | | | |
| | 14,035 | | | Illinois State, General Obligation Bonds, Taxable Build America Bonds, Series 2010‑3, 6.725%, 4/01/35 (4) | | | No Opt. Call | | | | A- | | | | 14,981,099 | |
| | | | |
| | 10,312 | | | Illinois Toll Highway Authority, Toll Highway Revenue Bonds, Taxable Build America Bond Senior Lien Series 2009A, 6.184%, 1/01/34 (4) | | | No Opt. Call | | | | AA- | | | | 11,519,020 | |
| | | | |
| | 2,420 | | | Illinois Toll Highway Authority, Toll Highway Revenue Bonds, Taxable Build America Bond Senior Lien Series 2009B, 5.851%, 12/01/34 (4) | | | No Opt. Call | | | | AA- | | | | 2,655,176 | |
| | | | |
| | 400 | | | Northern Illinois Municipal Power Agency, Power Project Revenue Bonds, Prairie State Project, Build America Bond Series 2009C, 6.859%, 1/01/39 | | | No Opt. Call | | | | A2 | | | | 450,280 | |
| | | | |
| | 1,375 | | | Northern Illinois Municipal Power Agency, Power Project Revenue Bonds, Prairie State Project, Build America Taxable Bond Series 2010A, 7.820%, 1/01/40 | | | No Opt. Call | | | | A2 | | | | 1,712,810 | |
| | | |
| | | | Total Illinois | | | | | | | | | | | 57,729,353 | |
| | | | | |
| | | | |
| | | | Indiana - 1.2% (0.8% of Total Investments) | | | | | | | | | | | | |
| | | | |
| | 1,000 | | | Indianapolis Local Public Improvement Bond Bank, Indiana, Build America Taxable Bonds, Series 2010B‑2, 6.116%, 1/15/40 | | | No Opt. Call | | | | AA+ | | | | 1,108,080 | |
| | | | |
| | 5,000 | | | Knox County, Indiana, Economic Development Revenue Bonds, Good Samaritan Hospital Project, Taxable Series 2012B, 5.900%, 4/01/34 | | | No Opt. Call | | | | Baa3 | | | | 4,812,550 | |
| | | |
| | | | Total Indiana | | | | | | | | | | | 5,920,630 | |
| | | | | |
| | | | |
| | | | Kentucky - 1.7% (1.2% of Total Investments) | | | | | | | | | | | | |
| | | | |
| | 5 | | | Kentucky Municipal Power Agency, Power System Revenue Bonds, Prairie State Project, Build America Bond Series 2010B, 6.490%, 9/01/37 - AGM Insured | | | 4/23 at 100.00 | | | | AA | | | | 5,009 | |
| | | | |
| | 5,450 | | | Louisville and Jefferson County Metropolitan Sewer District, Kentucky, Sewer and Drainage System Revenue Bonds, Build America Taxable Bonds Series 2010A, 6.250%, 5/15/43 (4) | | | No Opt. Call | | | | AA | | | | 6,400,698 | |
| | | | |
| | 2,350 | | | Newport, Kentucky, Industrial Building Revenue Bonds, South Beach 1, LLC Project, Taxable Refunding Series 2022, 4.125%, 3/01/33 | | | No Opt. Call | | | | N/R | | | | 2,115,493 | |
| | | |
| | | | Total Kentucky | | | | | | | | | | | 8,521,200 | |
| | | | | |
| | | | |
| | | | Maryland - 2.7% (1.9% of Total Investments) | | | | | | | | | | | | |
| | | | |
| | 2,000 | | | Maryland Economic Development Corporation, Economic Development Revenue Bonds, Terminal Project, Refunding Series 2017B, 4.550%, 6/01/35 | | | No Opt. Call | | | | Baa2 | | | | 1,768,280 | |
| | | | |
| | | | Maryland Economic Development Corporation, Parking Facilities Revenue Bonds Baltimore City Project, Senior Parking Facilities Revenue, Series 2018B: | | | | | | | | | | | | |
| | 1,500 | | | 4.580%, 6/01/33 | | | 6/28 at 100.00 | | | | BBB- | | | | 1,354,320 | |
| | 2,945 | | | 4.790%, 6/01/38 | | | 6/28 at 100.00 | | | | A1 | | | | 2,518,417 | |
17
| | |
| NBB | | Nuveen Taxable Municipal Income Fund (continued) Portfolio of Investments March 31, 2023 |
| | | | | | | | | | | | | | | | |
Principal Amount (000) | | Description (1) | | Optional Call
Provisions (2) | | | Ratings (3) | | | Value | |
| | | |
| | | | |
| | | | Maryland (continued) | | | | | | | | | | | | |
| | | | |
| $ | 4,285 | | | 5.050%, 6/01/43 | | | 6/28 at 100.00 | | | | BBB‑ | | | $ | 3,564,948 | |
| | 5,350 | | | 5.320%, 6/01/51 | | | 6/28 at 100.00 | | | | BBB- | | | | 4,425,306 | |
| | | |
| | | | Total Maryland | | | | | | | | | | | 13,631,271 | |
| | | | | |
| | | | |
| | | | Massachusetts - 1.2% (0.8% of Total Investments) | | | | | | | | | | | | |
| | | | |
| | 4,000 | | | Massachusetts, Transporation Fund Revenue Bonds, Accelerated Bridge Program, Tender Option Bond Trust 2016-XFT907, 6.056%, 6/01/40, 144A, (IF) (5) | | | No Opt. Call | | | | AA+ | | | | 5,819,880 | |
| | | |
| | | | Total Massachusetts | | | | | | | | | | | 5,819,880 | |
| | | | | |
| | | | |
| | | | Mississippi - 0.4% (0.3% of Total Investments) | | | | | | | | | | | | |
| | | | |
| | 2,085 | | | Mississippi State, General Obligation Bonds, Taxable Build America Bond Series 2010F, 5.245%, 11/01/34 | | | No Opt. Call | | | | AA | | | | 2,185,080 | |
| | | |
| | | | Total Mississippi | | | | | | | | | | | 2,185,080 | |
| | | | | |
| | | | |
| | | | New Jersey - 4.2% (2.9% of Total Investments) | | | | | | | | | | | | |
| | | | |
| | 3,320 | | | New Jersey Educational Facilities Authority, Revenue Bonds, Seton Hall University, Taxable Series 2020D, 3.958%, 7/01/48 - AGM Insured | | | 7/30 at 100.00 | | | | AA | | | | 2,558,060 | |
| | | | |
| | 3,000 | | | New Jersey Turnpike Authority, Revenue Bonds, Build America Taxable Bonds, Series 2009F, 7.414%, 1/01/40 | | | No Opt. Call | | | | AA- | | | | 3,812,430 | |
| | | | |
| | 8,805 | | | New Jersey Turnpike Authority, Revenue Bonds, Build America Taxable Bonds, Series 2010A, 7.102%, 1/01/41 | | | No Opt. Call | | | | AA- | | | | 10,877,961 | |
| | | | |
| | 2,000 | | | Rutgers State University, New Jersey, Revenue Bonds, Taxable Build America Bond Series 2010H, 5.665%, 5/01/40 | | | No Opt. Call | | | | Aa3 | | | | 2,141,580 | |
| | | | |
| | 870 | | | South Jersey Port Corporation, New Jersey, Marine Terminal Revenue Bonds, Taxable Build America Bond Series 2009P‑3, 7.365%, 1/01/40 | | | No Opt. Call | | | | Baa1 | | | | 973,765 | |
| | | | |
| | 530 | | | South Jersey Transportation Authority, New Jersey, Transportation System Revenue Bonds, Build America Bond Series 2009A‑5, 7.000%, 11/01/38 | | | No Opt. Call | | | | BBB+ | | | | 587,643 | |
| | | |
| | | | Total New Jersey | | | | | | | | | | | 20,951,439 | |
| | | | | |
| | | | |
| | | | New York - 27.1% (19.0% of Total Investments) | | | | | | | | | | | | |
| | | | |
| | | | Dormitory Authority of the State of New York, Revenue Bonds, Montefiore Obligated Group, Taxable Series 2018B: | | | | | | | | | | | | |
| | 5,000 | | | 5.096%, 8/01/34 | | | No Opt. Call | | | | BBB- | | | | 4,687,300 | |
| | 1,415 | | | 4.946%, 8/01/48 - AGM Insured | | | 8/28 at 100.00 | | | | AA | | | | 1,319,657 | |
| | | | |
| | 25,000 | | | Dormitory Authority of the State of New York, State Personal Income Tax Revenue Bonds, Build America Taxable Bonds, Series 2010D, 5.600%, 3/15/40, (UB) (5) | | | No Opt. Call | | | | AA+ | | | | 26,573,250 | |
| | | | |
| | | | Dormitory Authority of the State of New York, State Personal Income Tax Revenue Bonds, Tender Option Bond Trust 30020: | | | | | | | | | | | | |
| | 2,000 | | | 5.746%, 3/15/40, 144A, (IF) (5) | | | No Opt. Call | | | | AA+ | | | | 2,629,360 | |
| | | | |
| | 5,100 | | | Long Island Power Authority, New York, Electric System Revenue Bonds, Build America Taxable Bond Series 2010B, 5.850%, 5/01/41 (4) | | | No Opt. Call | | | | A | | | | 5,423,595 | |
| | | | |
| | 680 | | | Metropolitan Transportation Authority, New York, Dedicated Tax Fund Bonds, Build America Taxable Bonds, Series 2010C, 7.336%, 11/15/39 | | | No Opt. Call | | | | AA | | | | 864,783 | |
| | | | |
| | 7,000 | | | Metropolitan Transportation Authority, New York, Transportation Revenue Bonds, Build America Taxable Bonds, Series 2009A‑1, 5.871%, 11/15/39 | | | No Opt. Call | | | | A3 | | | | 7,032,830 | |
| | | | |
| | 2,090 | | | Metropolitan Transportation Authority, New York, Transportation Revenue Bonds, Build America Taxable Bonds, Series 2010B‑1, 6.548%, 11/15/31 | | | No Opt. Call | | | | A3 | | | | 2,233,311 | |
18
| | | | | | | | | | | | | | | | |
Principal
Amount (000) | | Description (1) | | Optional Call
Provisions (2) | | | Ratings (3) | | | Value | |
| | | |
| | | | |
| | | | New York (continued) | | | | | | | | | | | | |
| | | | |
| $ | 10,925 | | | Metropolitan Transportation Authority, New York, Transportation Revenue Bonds, Federally Taxable Build America Bonds, Series 2010E, 6.814%, 11/15/40 (4) | | | No Opt. Call | | | | A3 | | | $ | 11,924,637 | |
| | | | |
| | 11,390 | | | Metropolitan Transportation Authority, New York, Transportation Revenue Bonds, Federally Taxable Issuer Subsidy Build America Bonds, Series 2010A, 6.668%, 11/15/39 (4) | | | No Opt. Call | | | | A3 | | | | 12,300,175 | |
| | | | |
| | 5,610 | | | Metropolitan Transportation Authority, New York, Transportation Revenue Bonds, Taxable Green Climate Certified Series 2020C‑2, 5.175%, 11/15/49 | | | No Opt. Call | | | | A3 | | | | 5,117,723 | |
| | | | |
| | 3,675 | | | Monroe County Industrial Development Corporation, New York, Revenue Bonds, Rochester Regional Health Project, Taxable Series 2020B, 4.600%, 12/01/46 | | | No Opt. Call | | | | BBB+ | | | | 3,037,020 | |
| | | | |
| | | | New York City Industrial Development Agency, New York, Installment Purchase and Lease Revenue Bonds, Queens Baseball Stadium Project, Series 2006: | | | | | | | | | | | | |
| | 2,000 | | | 6.027%, 1/01/46 - AGM Insured | | | No Opt. Call | | | | A1 | | | | 2,070,780 | |
| | 905 | | | 6.027%, 1/01/46 - AMBAC Insured, 144A | | | No Opt. Call | | | | AA | | | | 937,028 | |
| | | | |
| | 1,500 | | | New York City Municipal Water Finance Authority, New York, Water and Sewer System Revenue Bonds, Second Generation Resolution, Build America Taxable Bonds, Fiscal 2011 Series AA, 5.440%, 6/15/43 (4) | | | No Opt. Call | | | | AA+ | | | | 1,628,565 | |
| | | | |
| | 2,595 | | | New York City Municipal Water Finance Authority, New York, Water and Sewer System Revenue Bonds, Second Generation Resolution, Build America Taxable Bonds, Series 2010DD, 5.952%, 6/15/42 | | | No Opt. Call | | | | AA+ | | | | 2,978,956 | |
| | | | |
| | 2,025 | | | New York City Municipal Water Finance Authority, New York, Water and Sewer System Revenue Bonds, Second Generation Resolution, Build America Taxable Bonds, Series 2010DD, 5.952%, 6/15/42, (UB) | | | No Opt. Call | | | | AA+ | | | | 2,324,619 | |
| | | | |
| | | | New York City Municipal Water Finance Authority, New York, Water and Sewer System Revenue Bonds, Second Generation Resolution, Taxable Tender Option Bonds Trust T30001‑2: | | | | | | | | | | | | |
| | 3,595 | | | 7.662%, 6/15/44, 144A, (IF) | | | No Opt. Call | | | | AA+ | | | | 6,136,234 | |
| | | | |
| | 10,905 | | | New York City Transitional Finance Authority, New York, Building Aid Revenue Bonds, Fiscal 2011 Taxable Build America Bond Series 2010S‑1B, 6.828%, 7/15/40 (4) | | | No Opt. Call | | | | AA | | | | 12,587,096 | |
| | | | |
| | 10,000 | | | New York City Transitional Finance Authority, New York, Future Tax Secured Bonds, Build America Taxable Bonds, Series 2010G‑1, 5.467%, 5/01/40 (4) | | | No Opt. Call | | | | AAA | | | | 10,279,300 | |
| | | | |
| | | | Westchester County Health Care Corporation, New York, Senior Lien Revenue Bonds, Refunding Series 2010A: | | | | | | | | | | | | |
| | 5,495 | | | 8.572%, 11/01/40 | | | No Opt. Call | | | | BBB- | | | | 5,859,703 | |
| | 3,450 | | | 8.572%, 11/01/40 | | | No Opt. Call | | | | BBB- | | | | 3,678,494 | |
| | | | |
| | 2,970 | | | Westchester County Health Care Corporation, New York, Senior Lien Revenue Bonds, Series 2010‑C1, 8.572%, 11/01/40 - AGM Insured | | | No Opt. Call | | | | AA | | | | 3,820,252 | |
| | | |
| | | | Total New York | | | | | | | | | | | 135,444,668 | |
| | | | | |
| | | | |
| | | | Ohio - 6.5% (4.6% of Total Investments) | | | | | | | | | | | | |
| | | | |
| | | | American Municipal Power Inc., Ohio, Combined Hydroelectric Projects Revenue Bonds, Build America Bond Series 2010B: | | | | | | | | | | | | |
| | 6,350 | | | 7.834%, 2/15/41 (4) | | | No Opt. Call | | | | A1 | | | | 8,191,817 | |
| | 1,000 | | | 8.084%, 2/15/50 | | | No Opt. Call | | | | A1 | | | | 1,385,500 | |
| | | | |
| | 1,500 | | | American Municipal Power Inc., Ohio, Meldahl Hydroelectric Projects Revenue Bonds, Build America Bond Series 2010B, 7.499%, 2/15/50 | | | No Opt. Call | | | | A | | | | 1,905,270 | |
19
| | |
| NBB | | Nuveen Taxable Municipal Income Fund (continued) Portfolio of Investments March 31, 2023 |
| | | | | | | | | | | | | | | | |
Principal
Amount (000) | | Description (1) | | Optional Call
Provisions (2) | | | Ratings (3) | | | Value | |
| | | |
| | | | |
| | | | Ohio (continued) | | | | | | | | | | | | |
| | | | |
| $ | 7,040 | | | American Municipal Power Ohio Inc., Prairie State Energy Campus Project Revenue Bonds, Build America Bond Series 2009C, 6.053%, 2/15/43 (4) | | | No Opt. Call | | | | A1 | | | $ | 7,779,059 | |
| | | | |
| | 1,700 | | | Cincinnati City School District, Ohio, Certificates of Participation, School Energy Conservation Improvement Project, Taxable Series 2012, 5.150%, 6/15/32 | | | No Opt. Call | | | | Aa3 | | | | 1,761,812 | |
| | | | |
| | 2,300 | | | Columbus Regional Airport Authority, Ohio, Customer Facility Charge Revenue Bonds, Taxable Series 2019, 4.199%, 12/15/48 | | | 12/29 at 100.00 | | | | A3 | | | | 1,880,940 | |
| | | | |
| | 10,575 | | | Port of Greater Cincinnati Development Authority, Ohio, Special Obligation Tax Increment Financing Revenue Bonds, Cooperative Township Public Parking Project, Kenwood Collection Redevelopment, Refunding Senior Lien Series 2016A, 6.600%, 1/01/39 | | | 1/26 at 100.00 | | | | N/R | | | | 9,593,852 | |
| | | |
| | | | Total Ohio | | | | | | | | | | | 32,498,250 | |
| | | | | |
| | | | |
| | | | Oklahoma - 3.1% (2.2% of Total Investments) | | | | | | | | | | | | |
| | | | |
| | 18,200 | | | Oklahoma Development Finance Authority, Health System Revenue Bonds, OU Medicine Project, Taxable Series 2018D, 5.450%, 8/15/28 | | | No Opt. Call | | | | BB- | | | | 15,376,816 | |
| | | |
| | | | Total Oklahoma | | | | | | | | | | | 15,376,816 | |
| | | | | |
| | | | |
| | | | Oregon - 0.4% (0.3% of Total Investments) | | | | | | | | | | | | |
| | | | |
| | 2,450 | | | Port of Portland, Oregon, Portland International Airport Customer Facility Charge Revenue Bonds, Taxable Series 2019, 4.237%, 7/01/49 | | | 7/29 at 100.00 | | | | A | | | | 2,013,925 | |
| | | |
| | | | Total Oregon | | | | | | | | | | | 2,013,925 | |
| | | | | |
| | | | |
| | | | Pennsylvania - 1.4% (1.0% of Total Investments) | | | | | | | | | | | | |
| | | | |
| | 1,915 | | | Commonwealth Financing Authority, Pennsylvania, State Appropriation Lease Bonds, Build America Taxable Bonds, Series 2009D, 6.218%, 6/01/39 | | | No Opt. Call | | | | A1 | | | | 2,095,431 | |
| | | | |
| | 1,640 | | | Pennsylvania Turnpike Commission, Turnpike Revenue Bonds, Build America Taxable Bonds, Series 2009A, 6.105%, 12/01/39 | | | No Opt. Call | | | | AA- | | | | 1,883,212 | |
| | | | |
| | 2,715 | | | Pennsylvania Turnpike Commission, Turnpike Revenue Bonds, Build America Taxable Bonds, Series 2010B, 5.511%, 12/01/45 (4) | | | No Opt. Call | | | | AA- | | | | 2,985,143 | |
| | | |
| | | | Total Pennsylvania | | | | | | | | | | | 6,963,786 | |
| | | | | |
| | | | |
| | | | South Carolina - 3.5% (2.4% of Total Investments) | | | | | | | | | | | | |
| | | | |
| | | | South Carolina Public Service Authority, Electric System Revenue Bonds, Santee Cooper, Federally Taxable Build America Series 2010C: | | | | | | | | | | | | |
| | 2,000 | | | 6.454%, 1/01/50 - AGM Insured | | | No Opt. Call | | | | AA | | | | 2,343,340 | |
| | 1,550 | | | 6.454%, 1/01/50 | | | No Opt. Call | | | | A- | | | | 1,755,701 | |
| | 8,985 | | | 6.454%, 1/01/50, (UB) | | | No Opt. Call | | | | A- | | | | 10,177,399 | |
| | | | |
| | 205 | | | South Carolina Public Service Authority, Electric System Revenue Bonds, Santee Cooper, Federally Taxable Build America Tender Option Bond Trust T30002, 9.520%, 1/01/50, 144A, (IF) (5) | | | No Opt. Call | | | | A | | | | 341,030 | |
| | | | |
| | 2,585 | | | South Carolina Public Service Authority, Santee Cooper Revenue Obligations, Refunding Series 2013C, 5.784%, 12/01/41 - AGM Insured | | | No Opt. Call | | | | AA | | | | 2,707,425 | |
| | | |
| | | | Total South Carolina | | | | | | | | | | | 17,324,895 | |
| | | | | |
| | | | |
| | | | Tennessee - 4.2% (3.0% of Total Investments) | | | | | | | | | | | | |
| | | | |
| | 1,500 | | | Jackson, Tennessee, Hospital Revenue Bonds, Jackson-Madison County General Hospital Project, Series 2018B, 5.308%, 4/01/48 | | | No Opt. Call | | | | A2 | | | | 1,392,960 | |
20
| | | | | | | | | | | | | | | | |
Principal Amount (000) | | Description (1) | | Optional Call
Provisions (2) | | | Ratings (3) | | | Value | |
| | | |
| | | | |
| | | | Tennessee (continued) | | | | | | | | | | | | |
| | | | |
| | | | Memphis/Shelby County Economic Development Growth Engine Industrial Development Board, Tennessee, Tax Increment Revenue Bonds, Graceland Project, Senior Taxable Series 2017B: | | | | | | | | | | | | |
| $ | 4,750 | | | 5.200%, 7/01/37 | | | 7/27 at 100.00 | | | | BB | | | $ | 3,796,247 | |
| | 1,515 | | | 5.450%, 7/01/45 | | | 7/27 at 100.00 | | | | BB | | | | 1,136,826 | |
| | | | |
| | 5,010 | | | Metropolitan Government Nashville & Davidson County Convention Center Authority, Tennessee, Tourism Tax Revenue Bonds, Build America Taxable Bonds, Series 2010A‑2, 7.431%, 7/01/43 (4) | | | No Opt. Call | | | | A+ | | | | 6,096,168 | |
| | | | |
| | 7,350 | | | Metropolitan Government Nashville & Davidson County Convention Center Authority, Tennessee, Tourism Tax Revenue Bonds, Build America Taxable Bonds, Subordinate Lien Series 2010B, 6.731%, 7/01/43 (4) | | | No Opt. Call | | | | AA | | | | 8,574,069 | |
| | | |
| | | | Total Tennessee | | | | | | | | | | | 20,996,270 | |
| | | | | |
| | | | |
| | | | Texas - 10.0% (7.1% of Total Investments) | | | | | | | | | | | | |
| | | | |
| | 2,520 | | | Dallas Area Rapid Transit, Texas, Sales Tax Revenue Bonds, Taxable Build America Bonds, Series 2009B, 5.999%, 12/01/44 | | | No Opt. Call | | | | AA+ | | | | 2,868,743 | |
| | | | |
| | 15,410 | | | Dallas Convention Center Hotel Development Corporation, Texas, Hotel Revenue Bonds, Build America Taxable Bonds, Series 09B, 7.088%, 1/01/42 (4) | | | No Opt. Call | | | | A | | | | 17,835,842 | |
| | | | |
| | 1,000 | | | Fort Worth, Tarrant, Denton, Parker, Johnson, and Wise Counties, Texas, Special Tax Revenue Bonds, Taxable Series 2017B, 4.238%, 3/01/47 | | | 9/24 at 100.00 | | | | AA | | | | 872,770 | |
| | | | |
| | 2,315 | | | Houston, Texas, Airport System Special Facilities Revenue Bonds, Consolidated Rental Car Facility Project, Taxable Series 2001, 6.880%, 1/01/28 - NPFG Insured | | | No Opt. Call | | | | A | | | | 2,445,404 | |
| | | | |
| | 10,285 | | | North Texas Tollway Authority, System Revenue Bonds, Taxble Build America Bond Series 2009B, 6.718%, 1/01/49 (4) | | | No Opt. Call | | | | AA- | | | | 12,936,679 | |
| | | | |
| | | | San Antonio, Texas, Customer Facility Charge Revenue Bonds, Rental Car Special Facilities Project, Series 2015: | | | | | | | | | | | | |
| | 7,545 | | | 5.671%, 7/01/35 | | | 7/25 at 100.00 | | | | A | | | | 7,555,412 | |
| | 2,000 | | | 5.871%, 7/01/45 | | | 7/25 at 100.00 | | | | A | | | | 1,954,420 | |
| | | | |
| | 1,000 | | | San Antonio, Texas, Electric and Gas System Revenue Bonds, Junior Lien, Build America Taxable Bond Series 2010A, 5.808%, 2/01/41 | | | No Opt. Call | | | | Aa3 | | | | 1,105,280 | |
| | | | |
| | 10 | | | San Antonio, Texas, Electric and Gas System Revenue Bonds, Series 2012, 4.427%, 2/01/42 | | | No Opt. Call | | | | Aa2 | | | | 9,520 | |
| | | | |
| | | | Tarrant County Cultural Education Facilities Finance Corporation, Texas, Hospital Revenue Bonds, Hendrick Medical Center, Taxable Series 2021: | | | | | | | | | | | | |
| | 1,000 | | | 3.292%, 9/01/40 - AGM Insured | | | 9/30 at 100.00 | | | | AA | | | | 790,790 | |
| | 1,400 | | | 3.422%, 9/01/50 - AGM Insured | | | 9/30 at 100.00 | | | | AA | | | | 1,013,922 | |
| | | | |
| | 1,000 | | | Texas Private Activity Bond Surface Transporation Corporation, Revenue Bonds, NTE Mobility Partners LLC North Tarrant Express Managed Lanes Project, Taxable Refunding Senior Lien Series 2019B, 3.922%, 12/31/49 | | | No Opt. Call | | | | Baa2 | | | | 824,070 | |
| | | |
| | | | Total Texas | | | | | | | | | | | 50,212,852 | |
| | | | | |
| | | | |
| | | | Utah - 1.5% (1.1% of Total Investments) | | | | | | | | | | | | |
| | | | |
| | 8,500 | | | Salt Lake County, Utah, Convention Hotel Revenue Bonds, Taxable Series 2019, 5.750%, 10/01/47, 144A | | | 10/29 at
100.00 |
| | | N/R | | | | 7,482,380 | |
| | | |
| | | | Total Utah | | | | | | | | | | | 7,482,380 | |
| | | | | |
21
| | |
| NBB | | Nuveen Taxable Municipal Income Fund (continued) Portfolio of Investments March 31, 2023 |
| | | | | | | | | | | | | | | | | | | | |
Principal
Amount (000) | | Description (1) | | | | | Optional Call Provisions (2) | | | Ratings (3) | | | Value | |
| | | |
| | | | | |
| | | | Virginia - 3.5% (2.5% of Total Investments) | | | | | | | | | | | | | | | | |
| | | | |
| $ | 1,840 | | | Fredericksburg Economic Development Authority, Virginia, Revenue Bonds, Fredericksburg Stadium Project, Taxable Series 2019A, 5.500%, 9/01/49, 144A | | | | 9/29 at 100.00 | | | | AA | | | $ | 1,780,127 | |
| | | | |
| | 10,810 | | | Tobacco Settlement Financing Corporation of Virginia, Tobacco Settlement Asset Backed Bonds, Refunding Senior Lien Series 2007A, 6.706%, 6/01/46 | | | | 6/25 at 100.00 | | | | B- | | | | 10,030,599 | |
| | | | |
| | 5,635 | | | Virginia Small Business Finance Authority, Tourism Development Financing Program Revenue Bonds, Downtown Norfolk and Virginia Beach Oceanfront Hotel Projects, Series 2018B, 12.000%, 4/01/48, 144A | | | | 4/28 at 117.16 | | | | N/R | | | | 5,704,423 | |
| | | |
| | | | Total Virginia | | | | | | | | | | | | | | | 17,515,149 | |
| | | | | |
| | | | | |
| | | | Washington - 7.4% (5.2% of Total Investments) | | | | | | | | | | | | | | | | |
| | | | |
| | 4,000 | | | Seattle, Washington, Municipal Light and Power Revenue Bonds, Federally Taxable Build America Bonds, Tender Option Bond Trust 2016-XFT905, 4.975%, 2/01/40, 144A, (IF) (5) | | | | No Opt. Call | | | | AA | | | | 4,971,840 | |
| | | | |
| | 28,915 | | | Washington State Convention Center Public Facilities District, Lodging Tax Revenue Bonds, Build America Taxable Bond Series 2010B, 6.790%, 7/01/40 | | | | No Opt. Call | | | | Baa1 | | | | 32,143,938 | |
| | | |
| | | | Total Washington | | | | | | | | | | | | | | | 37,115,778 | |
| | | | | |
| | | | | |
| | | | West Virginia - 3.0% (2.1% of Total Investments) | | | | | | | | | | | | | | | | |
| | | | |
| | | | Tobacco Settlement Finance Authority, West Virginia, Tobacco Settlement Asset-Backed Bonds, Taxable Refunding Class 1 Senior Series 2020A: | | | | | | | | | | | | | |
| | 8,500 | | | 4.006%, 6/01/40 | | | | | | | 12/30 at 100.00 | | | | A- | | | | 6,839,355 | |
| | 10,800 | | | 4.306%, 6/01/49 | | | | | | | 12/30 at 100.00 | | | | BBB+ | | | | 8,356,392 | |
| | | |
| | | | Total West Virginia | | | | | | | | | | | | | | | 15,195,747 | |
| | | | | |
| | | | | |
| | | | Wisconsin - 0.4% (0.3% of Total Investments) | | | | | | | | | | | | | | | | |
| | | | |
| | 2,000 | | | Wisconsin Center District, Dedicated Tax Revenue Bonds, Supported by State Moral Obligation Taxable Senior Series 2020A, 4.473%, 12/15/47 - AGM Insured | | | | 12/30 at 100.00 | | | | AA | | | | 1,788,860 | |
| | | |
| | | | Total Wisconsin | | | | | | | | | | | | | | | 1,788,860 | |
| | | | | |
| | | | Total Long-Term Investments (cost $709,386,994) | | | | | | | | | | | | | | | 705,896,069 | |
| | | | | |
| | | | | |
Principal
Amount (000) | | Description (1) | | Coupon | | | Maturity | | | | | | Value | |
| | | |
| | | | |
| | | | SHORT-TERM INVESTMENTS - 1.1% (0.8% of Total Investments) | | | | | | | | | | | | | |
| | | | |
| | | | REPURCHASE AGREEMENTS - 1.1% (0.8% of Total Investments) | | | | | | | | | | | | | |
| | | | | |
| $ | 5,653 | | | Repurchase Agreement with Fixed Income Clearing Corporation, dated 3/31/23, repurchase price $5,653,221, collateralized by $5,972,700, U.S. Treasury Note, 2.250%, due 11/15/25, value $5,765,615 | | | 1.440% | | | | 4/03/23 | | | | | | | $ | 5,652,543 | |
| | | |
| | | | Total Repurchase Agreements (cost $5,652,543) | | | | | | | | | | | | | | | 5,652,543 | |
| | | | | |
| | | | | |
| | | | Total Short-Term Investments (cost $5,652,543) | | | | | | | | | | | | | | | 5,652,543 | |
| | | | | |
| | | | | |
| | | | Total Investments (cost $715,039,537) - 142.1% | | | | | | | | | | | | | | | 711,548,612 | |
| | | | | |
| | | | | |
| | | | Floating Rate Obligations - (7.4)% | | | | | | | | | | | | | | | (36,810,000 | ) |
| | | | | |
| | | |
| | | | Reverse Repurchase Agreements, including accrued interest - (37.7)%(6) | | | | | | | | (188,747,848 | ) |
| | | | | |
| | | | | |
| | | | Other Assets & Liabilities, Net - 3.0%(7) | | | | | | | | | | | | | | | 14,786,636 | |
| | | | | |
| | | | | |
| | | | Net Assets Applicable to Common Shares - 100% | | | | | | | | | | | | | | $ | 500,777,400 | |
| | | | | |
22
Investments in Derivatives
Futures Contracts - Short
| | | | | | | | | | | | | | | | | | | | |
| Description | | Number of Contracts | | | Expiration Date | | | Notional Amount | | | Value | | | Unrealized Appreciation (Depreciation) | |
| | |
| U.S. Treasury Ultra Bond | | | (1,353 | ) | | | 6/23 | | | $ | (182,687,950 | ) | | $ | (190,942,125 | ) | | $ | (8,254,175 | ) |
| | |
| (1) | All percentages shown in the Portfolio of Investments are based on net assets applicable to common shares unless otherwise noted. |
| (2) | Optional Call Provisions: Dates (month and year) and prices of the earliest optional call or redemption. There may be other call provisions at varying prices at later dates. Certain mortgage-backed securities may be subject to periodic principal paydowns. Optional Call Provisions are not covered by the report of independent registered public accounting firm. |
| (3) | For financial reporting purposes, the ratings disclosed are the highest of Standard & Poor’s Group (“Standard & Poor’s”), Moody’s Investors Service, Inc. (“Moody’s”) or Fitch, Inc. (“Fitch”) rating. This treatment of split-rated securities may differ from that used for other purposes, such as for Fund investment policies. Ratings below BBB by Standard & Poor’s, Baa by Moody’s or BBB by Fitch are considered to be below investment grade. Holdings designated N/R are not rated by any of these national rating agencies. Ratings are not covered by the report of independent registered public accounting firm. |
| (4) | Investment, or portion of investment, has been pledged to collateralize the net payment obligations for investments in reverse repurchase agreements. As of the end of the reporting period, investments with a value of $236,760,673 have been pledged as collateral for reverse repurchase agreements. |
| (5) | Investment, or portion of investment, has been pledged to collateralize the net payment obligations for investments in inverse floating rate transactions. |
| (6) | Reverse Repurchase Agreements, including accrued interest as a percentage of Total investments is 26.5%. |
| (7) | Other assets less liabilities includes the unrealized appreciation (depreciation) of certain over‑the‑counter (“OTC”) derivatives as presented on the Statement of Assets and Liabilities, when applicable. The unrealized appreciation (depreciation) of OTC cleared and exchange-traded derivatives is recognized as part of the cash collateral at brokers and/or the receivable or payable for variation margin as presented on the Statement of Assets and Liabilities, when applicable. |
| 144A | Investment is exempt from registration under Rule 144A of the Securities Act of 1933, as amended. These investments may only be resold in transactions exempt from registration, which are normally those transactions with qualified institutional buyers. |
| IF | Inverse floating rate security issued by a tender option bond (“TOB”) trust, the interest rate on which varies inversely with the Securities Industry Financial Markets Association (SIFMA) short-term rate, which resets weekly, or a similar short-term rate, and is reduced by the expenses related to the TOB trust. |
| UB | Underlying bond of an inverse floating rate trust reflected as a financing transaction. |
See Notes to Financial Statements
23
Statement of Assets and Liabilities
March 31, 2023
| | | | |
| | | NBB | |
| ASSETS | | | | |
| |
Long-term investments, at value† | | $ | 705,896,069 | |
| |
Short-term investments, at valueà | | | 5,652,543 | |
| |
Cash collateral at brokers for investments in futures contracts(1) | | | 9,673,990 | |
| |
| Receivables: | | | | |
| |
| Interest | | | 12,951,095 | |
| |
| Investments sold | | | 1,037,849 | |
| |
| Deferred offering costs | | | 307,738 | |
| |
| Other assets | | | 71,215 | |
| |
| Total assets | | | 735,590,499 | |
| |
| LIABILITIES | | | | |
| |
| Cash overdraft | | | 115,550 | |
| |
| Reverse repurchase agreements, including accrued interest | | | 188,747,848 | |
| |
| Floating rate obligations | | | 36,810,000 | |
| |
| Payables: | | | | |
| |
| Dividends | | | 2,068,589 | |
| |
| Interest | | | 159,840 | |
| |
| Investments purchased - regular settlement | | | 4,362,043 | |
| |
| Variation margin on futures contracts | | | 1,818,094 | |
| |
| Accrued expenses: | | | | |
| |
| Custodian fees | | | 79,192 | |
| |
| Investor relations | | | 11,599 | |
| |
| Management fees | | | 407,461 | |
| |
| Trustees fees | | | 69,817 | |
| |
| Professional fees | | | 27,350 | |
| |
| Shareholder reporting expenses | | | 37,584 | |
| |
| Shareholder servicing agent fees | | | 14 | |
| |
| Shelf offering costs | | | 88,975 | |
| |
| Other | | | 9,143 | |
| |
| Total liabilities | | | 234,813,099 | |
| |
Commitments and contingencies(2) | | | | |
| |
| Net assets applicable to common shares | | $ | 500,777,400 | |
| |
| Common shares outstanding | | | 29,394,752 | |
| |
| Net asset value (“NAV”) per common share outstanding | | $ | 17.04 | |
| |
| NET ASSETS APPLICABLE TO COMMON SHARES CONSIST OF: | | | | |
| |
| Common shares, $0.01 par value per share | | $ | 293,948 | |
| |
| Paid‑in capital | | | 540,236,911 | |
| |
| Total distributable earnings (loss) | | | (39,753,459 | ) |
| |
| Net assets applicable to common shares | | $ | 500,777,400 | |
| |
| Authorized shares: | | | | |
| |
| Common | | | Unlimited | |
| |
† Long-term investments, cost | | $ | 709,386,994 | |
| |
à Short-term investments, cost | | $ | 5,652,543 | |
| (1) | Cash pledged to collateralize the net payment obligations for investments in derivatives. |
| (2) | As disclosed in Notes to Financial Statements. |
See Notes to Financial Statements.
24
Statement of Operations
Year Ended March 31, 2023
| | | | |
| | | NBB | |
| |
| INVESTMENT INCOME | | | | |
| |
| Interest | | $ | 40,872,965 | |
| |
| Total investment income | | | 40,872,965 | |
| |
| EXPENSES | | | | |
| |
| Management fees | | | 4,971,359 | |
| |
| Shareholder servicing agent fees | | | 180 | |
| |
| Interest expense | | | 7,951,915 | |
| |
| Trustees fees | | | 19,145 | |
| |
| Custodian expenses, net | | | 96,429 | |
| |
| Investor relations expenses | | | 34,152 | |
| |
| Professional fees | | | 95,667 | |
| |
| Shareholder reporting expenses | | | 83,091 | |
| |
| Stock exchange listing fees | | | 7,961 | |
| |
| Other | | | 19,596 | |
| |
| Total expenses | | | 13,279,495 | |
| |
| Net investment income (loss) | | | 27,593,470 | |
| |
| REALIZED AND UNREALIZED GAIN (LOSS) | | | | |
| |
| Realized gain (loss): | | | | |
| |
| Investments | | | (9,682,912 | ) |
| |
| Futures contracts | | | 60,913,892 | |
| |
| Net realized gain (loss) | | | 51,230,980 | |
| |
| Change in unrealized appreciation (depreciation) on: | | | | |
| |
| Investments | | | (113,718,081 | ) |
| |
| Futures contracts | | | (17,359,815 | ) |
| |
| Change in net unrealized appreciation (depreciation) | | | (131,077,896 | ) |
| |
| Net realized and unrealized gain (loss) | | | (79,846,916 | ) |
| |
| Net increase (decrease) in net assets applicable to common shares from operations | | $ | (52,253,446 | ) |
See Notes to Financial Statements.
25
Statement of Changes in Net Assets
| | | | | | | | | | | | | | | | |
| | | | | | NBB | |
| | | | |
| | | | | | Year Ended 3/31/23 | | | | | | Year Ended 3/31/22 | |
| | | | |
| OPERATIONS | | | | | | | | | | | | | | | | |
| | | | |
| Net investment income (loss) | | | $ | | | | 27,593,470 | | | $ | | | | | 34,793,695 | |
| | | | |
| Net realized gain (loss) | | | | | | | 51,230,980 | | | | | | | | 1,747,609 | |
| | | | |
| Change in net unrealized appreciation (depreciation) | | | | | | | (131,077,896 | ) | | | | | | | (61,559,196 | ) |
| | | | |
| Net increase (decrease) in net assets applicable to common shares from operations | | | | | | | (52,253,446 | ) | | | | | | | (25,017,892 | ) |
| | | | |
| DISTRIBUTIONS TOCOMMON SHAREHOLDERS | | | | | | | | | | | | | | | | |
| | | | |
| Dividends | | | | | | | (33,333,983 | ) | | | | | | | (36,176,376 | ) |
| | | | |
| Decrease in net assets applicable to common shares from distributions to common shareholders | | | | | | | (33,333,983 | ) | | | | | | | (36,176,376 | ) |
| CAPITAL SHARE TRANSACTIONS | | | | | | | | | | | | | | | | |
| | | | |
| Common shares: | | | | | | | | | | | | | | | | |
| | | | |
| Proceeds from shelf offering, net of offering costs | | | | | | | 14,065,606 | | | | | | | | 19,282,125 | |
| | | | |
| Net proceeds from shares issued to shareholders due to reinvestment of distributions | | | | | | | 212,304 | | | | | | | | 834,999 | |
| | | | |
| Net increase (decrease) in net assets applicable to common shares from capital share transactions | | | | | | | 14,277,910 | | | | | | | | 20,117,124 | |
| | | | |
| Net increase (decrease) in net assets applicable to common shares | | | | | | | (71,309,519 | ) | | | | | | | (41,077,144 | ) |
| | | | |
| Net assets applicable to common shares at the beginning of the period | | | | | | | 572,086,919 | | | | | | | | 613,164,063 | |
| | | | |
| Net assets applicable to common shares at the end of the period | | | $ | | | | 500,777,400 | | | $ | | | | | 572,086,919 | |
See Notes to Financial Statements
26
Statement of Cash Flows
Year Ended March 31, 2023
| | | | |
| | | NBB |
| | |
| |
| CASH FLOWS FROM OPERATING ACTIVITIES | | | | |
| Net Increase (Decrease) in Net Assets Applicable to Common Shares from Operations | | $ | (52,253,446) | |
| Adjustments to reconcile the net increase (decrease) in net assets applicable to common shares from operations to net cash provided by (used in) operating activities: | | | | |
| Purchases of investments | | | (38,837,510) | |
| Proceeds from sale and maturities of investments | | | 58,622,907 | |
| Proceeds from (Purchase of) short-term investments, net | | | (5,652,543) | |
| Amortization (Accretion) of premiums and discounts, net | | | 2,316,134 | |
| (Increase) Decrease in: | | | | |
| |
| Receivable for interest | | | 1,181,310 | |
| |
| Receivable for investments sold | | | (461,747) | |
| |
| Other assets | | | (195) | |
| Increase (Decrease) in: | | | | |
| |
| Payable for interest | | | 1,750,347 | |
| |
| Payable for investments purchased - regular settlement | | | 4,362,043 | |
| |
| Payable for variation margin on futures contracts | | | 568,594 | |
| |
| Accrued custodian fees | | | (1,718) | |
| |
| Accrued investor relations fees | | | 2,106 | |
| |
| Accrued management fees | | | (78,885) | |
| |
| Accrued Trustees fees | | | (4,689) | |
| |
| Accrued professional fees | | | 24,094 | |
| |
| Accrued shareholder reporting expenses | | | (6,378) | |
| |
| Accrued shareholder servicing agent fees | | | (14) | |
| |
| Accrued shelf offering costs | | | 51,569 | |
| |
| Accrued other expenses | | | (3,604) | |
| Net realized (gain) loss from investments | | | 9,682,912 | |
| Change in net unrealized (appreciation) depreciation of investments | | | 113,718,081 | |
| | |
| |
| Net cash provided by operating activities | | | 94,979,368 | |
| | |
| CASH FLOWS FROM FINANCING ACTIVITIES | | | | |
| Proceeds from reverse repurchase agreements | | | 1,358,660,275 | |
| (Repayments of) reverse repurchase agreements | | | (1,428,860,275) | |
| Proceeds from shelf offering | | | 13,983,473 | |
| Increase (Decrease) in cash overdraft | | | (2,982,106) | |
| Cash distributions paid to common shareholders | | | (34,088,739) | |
| | |
| |
| Net cash provided by (used in) financing activities | | | (93,287,372) | |
| | |
| Net increase (decrease) in cash and cash collateral at brokers | | | 1,691,996 | |
| Cash and Cash Collateral at Brokers at the beginning of period | | | 7,981,994 | |
| |
| Cash at the end of period | | $ | 9,673,990 | |
| | |
| |
| SUPPLEMENTAL DISCLOSURE OF CASH FLOW INFORMATION | | | NBB | |
| | |
| Cash paid for interest | | $ | 6,085,661 | |
| |
| Non‑cash financing activities not included herein consists of reinvestments of common share distributions | | | 212,304 | |
| | |
| The following table provides a reconciliation of cash and cash collateral at brokers to the Statement of Assets and Liabilities: | | | | |
| |
| | | NBB |
| | |
| |
| Cash | | $ | 1,119,931 | |
| Cash collateral at brokers for investments in futures contracts | | | 9,673,990 | |
| | |
| Total cash collateral at brokers | | $ | 10,793,921 | |
| | |
See accompanying notes to financial statements.
27
Financial Highlights
The following data is for a common share outstanding for each fiscal year end unless otherwise noted:
| | | | | | | | | | | | | | | | | | | | | | | | | | | | | | | | | | | | | | | | | | | | | | | | | | | | | | | | | | | | | | | | | | | | | | | | | | | | | | | | | | | | | | | | | | | | | | |
| | | | | | | | | | | | | | | | | | | | | | | | | | | | | Less Distributions to | | | | | | | | | | | | | | | | | | | | | | | | | |
| | | | | | | | Investment Operations | | | | | | Common Shareholders | | | | | | Common Share | |
| | | | | | | | | | | | | | | | | | | | | | | | | | | | | | | | | | | | | | | | | | | | | | | | | | | | | | | | | | | | | | | | | | | | | | | | |
| | | | | | | | | | | | | | |
| | | Beginning Common Share NAV | | | Net Investment Income (NII) (Loss)(a) | | | Net Realized/ Unrealized Gain (Loss) | | | | | | Total | | | | | | From NII | | | From Accumulated Net
Realized Gains | | | Return of Capital | | | Total | | | Shelf Offering Costs | | | Premium per Share Sold through Shelf Offering | | | Ending NAV | | | Ending Share Price | |
| NBB | | | | | | | | | | | | | | | | | | | | | | | | | | | | | | | | | | | | | | | | | | | | | | | | | | | | | | | | | | | | | | | | | | | | | | | |
| 3/31/23 | | | | $ | 20.00 | | | | | | | $ | 0.95 | | | | | | | $ | (2.78 | ) | | | | | | $ | (1.83 | ) | | | | | | $ | (1.14 | ) | | | | | | | $— | | | | | | | | $— | | | | | | | $ | (1.14 | ) | | | | | | | $— | | | | | | | $ | 0.01 | | | | | | | $ | 17.04 | | | | | | | $ | 16.12 | |
| 3/31/22 | | | | | 22.11 | | | | | | | | 1.23 | | | | | | | | (2.07 | ) | | | | | | | (0.84 | ) | | | | | | | (1.28 | ) | | | | | | | — | | | | | | | | — | | | | | | | | (1.28 | ) | | | | | | | —(e) | | | | | | | | 0.01 | | | | | | | | 20.00 | | | | | | | | 19.99 | |
| 3/31/21 | | | | | 19.89 | | | | | | | | 1.18 | | | | | | | | 2.16 | | | | | | | | 3.34 | | | | | | | | (1.13 | ) | | | | | | | — | | | | | | | | — | | | | | | | | (1.13 | ) | | | | | | | —(e) | | | | | | | | 0.01 | | | | | | | | 22.11 | | | | | | | | 22.59 | |
| 3/31/20 | | | | | 21.35 | | | | | | | | 1.11 | | | | | | | | (1.39 | ) | | | | | | | (0.28 | ) | | | | | | | (1.17 | ) | | | | | | | — | | | | | | | | (0.01 | ) | | | | | | | (1.18 | ) | | | | | | | — | | | | | | | | — | | | | | | | | 19.89 | | | | | | | | 19.15 | |
| 3/31/19 | | | | | 21.96 | | | | | | | | 1.08 | | | | | | | | (0.45 | ) | | | | | | | 0.63 | | | | | | | | (1.24 | ) | | | | | | | — | | | | | | | | — | | | | | | | | (1.24 | ) | | | | | | | — | | | | | | | | — | | | | | | | | 21.35 | | | | | | | | 20.52 | |
| | |
| (a) | Based on average shares outstanding. |
| (b) | Total Return Based on Common Share NAV is the combination of changes in common share NAV, reinvested dividend income at NAV and reinvested capital gains distributions at NAV, if any. The last dividend declared in the period, which is typically paid on the first business day of the following month, is assumed to be reinvested at the ending NAV. The actual reinvest price for the last dividend declared in the period may often be based on the Fund’s market price (and not its NAV), and therefore may be different from the price used in the calculation. Total returns are not annualized. |
Total Return Based on Common Share Price is the combination of changes in the market price per share and the effect of reinvested dividend income and reinvested capital gains distributions, if any, at the average price paid per share at the time of reinvestment. The last dividend declared in the period, which is typically paid on the first business day of the following month, is assumed to be reinvested at the ending market price. The actual reinvestment for the last dividend declared in the period may take place over several days, and in some instances may not be based on the market price, so the actual reinvestment price may be different from the price used in the calculation. Total returns are not annualized.
28
| | | | | | | | | | | | | | | | | | | | |
| | | | | | | | | Common Share Supplemental Data/ | | | |
| | | | | | | | | Ratios Applicable to Common Shares | | | |
| Common Share | | | | | | Ratios to Average | | | |
| Total Returns | | | | | | Net Assets | | | |
| | | | | |
Based on NAV(b) | | Based on Share Price(b) | | | Ending Net Assets (000) | | | Expenses(c) | | | Net Investment Income (Loss)(c) | | | Portfolio Turnover Rate(d) |
| | |
| | | | | | | | | | | | | | | | | | | | |
| | |
| (8.98)% | | | (13.68 | )% | | $ | 500,777 | | | | 2.63 | % | | | 5.46% | | | | 5% | |
| (4.26) | | | (6.31 | ) | | | 572,087 | | | | 1.31 | | | | 5.46 | | | | 1 | |
| 16.99 | | | 24.16 | | | | 613,164 | | | | 1.37 | | | | 5.36 | | | | 9 | |
| (1.74) | | | (1.44 | ) | | | 544,173 | | | | 1.83 | | | | 5.05 | | | | 16 | |
| 3.06 | | | 4.97 | | | | 584,098 | | | | 1.64 | | | | 5.12 | | | | 4 | |
| | |
| (c) | • Net Investment Income (Loss) ratios reflect income earned and expenses incurred on assets attributable to borrowings and/or reverse repurchase agreements (as described in Notes to Financial Statements), where applicable. |
| | • | The expense ratios reflect, among other things, all interest expense and other costs related to borrowings and/or reverse repurchase agreements (as described in Notes to Financial Statements) and/or the interest expense deemed to have been paid by the Fund on the floating rate certificates issued by the special purpose trusts for the self-deposited inverse floaters held by the Fund (as described in Notes to Financial Statements), where applicable, as follows: |
| | | | |
| | | | | Ratios of Interest Expense to Average Net Assets Applicable to Common Shares |
| | |
| | | | NBB |
| | |
| | 3/31/23 | | 1.57% |
| | 3/31/22 | | 0.32 |
| | 3/31/21 | | 0.39 |
| | 3/31/20 | | 0.85 |
| | 3/31/19 | | 0.63 |
| | |
| (d) | Portfolio Turnover Rate is calculated based on the lesser of long-term purchases or sales (as disclosed in Notes to Financial Statements) divided by the average long-term market value during the period. |
| (e) | Value rounded to zero. |
See Notes to Financial Statements.
29
Notes to Financial Statements
Fund Information
The fund covered in this report and its corresponding New York Stock Exchange (“NYSE”) symbol is Nuveen Taxable Municipal Income Fund (NBB) (the “Fund”).The Fund is registered under the Investment Company Act of 1940 (the “1940 Act”), as amended, as a diversified, closed‑end management investment company. The Fund was organized as a Massachusetts business trust on December 4, 2009.
Current Fiscal Period
The end of the reporting period for the Fund is March 31, 2023, and the period covered by these Notes to Financial Statements is the fiscal year ended March 31, 2023 (the “current fiscal period”).
Investment Adviser and Sub‑Adviser
The Fund’s investment adviser is Nuveen Fund Advisors, LLC (the “Adviser”), a subsidiary of Nuveen, LLC (“Nuveen”). Nuveen is the investment management arm of Teachers Insurance and Annuity Association of America (TIAA). The Adviser has overall responsibility for management of the Fund, oversees the management of the Fund’s portfolio, manages the Fund’s business affairs and provides certain clerical, bookkeeping and other administrative services, and, if necessary, asset allocation decisions. The Adviser has entered into a sub‑advisory agreement with Nuveen Asset Management, LLC, (the “Sub‑Adviser”), a subsidiary of the Adviser, under which the Sub‑Adviser manages the investment portfolio of the Fund.
Developments Regarding the Fund’s Control Share By‑Law
On October 5, 2020, the Fund and certain other closed‑end funds in the Nuveen fund complex amended their by‑laws. Among other things, the amended by‑laws included provisions pursuant to which, in summary, a shareholder who obtains beneficial ownership of common shares in a Control Share Acquisition (as defined in the by‑laws) shall have the same voting rights as other common shareholders only to the extent authorized by the other disinterested shareholders (the “Control Share By‑Law”). On January 14, 2021, a shareholder of certain Nuveen closed‑end funds filed a civil complaint in the U.S. District Court for the Southern District of New York (the “District Court”) against certain Nuveen funds and their trustees, seeking a declaration that such funds’ Control Share By‑Laws violate the 1940 Act, rescission of such fund’s Control Share By‑Laws and a permanent injunction against such funds applying the Control Share By‑Laws. On February 18, 2022, the District Court granted judgment in favor of the plaintiff’s claim for rescission of such funds’ Control Share By‑Laws and the plaintiff’s declaratory judgment claim, and declared that such funds’ Control Share By‑Laws violate Section 18(i) of the 1940 Act. Following review of the judgment of the District Court, on February 22, 2022, the Fund’s Board of Trustees (the “Board”) amended the Fund’s bylaws to provide that the Fund’s Control Share By‑Law shall be of no force and effect for so long as the judgment of the District Court is effective and that if the judgment of the District Court is reversed, overturned, vacated, stayed, or otherwise nullified, the Fund’s Control Share By‑Law will be automatically reinstated and apply to any beneficial owner of common shares acquired in a Control Share Acquisition, regardless of whether such Control Share Acquisition occurs before or after such reinstatement, for the duration of the stay or upon issuance of the mandate reversing, overturning, vacating or otherwise nullifying the judgment of the District Court. On February 25, 2022, the Board and the Fund appealed the District Court’s decision to the U.S. Court of Appeals for the Second Circuit.
| 2. | Significant Accounting Policies |
The accompanying financial statements were prepared in accordance with accounting principles generally accepted in the United States of America (“U.S. GAAP”), which may require the use of estimates made by management and the evaluation of subsequent events. Actual results may differ from those estimates. The Fund is an investment company and follows accounting guidance in the Financial Accounting Standards Board (“FASB”) Accounting Standards Codification 946, Financial Services – Investment Companies. The net asset value (“NAV”) for financial reporting purposes may differ from the NAV for processing security and shareholder transactions. The NAV for financial reporting purposes includes security and shareholder transactions through the date of the report. Total return is computed based on the NAV used for processing security and shareholder transactions. The following is a summary of the significant accounting policies consistently followed by the Fund.
Compensation
The Fund pays no compensation directly to those of its trustees or to its officers, all of whom receive remuneration for their services to the Fund from the Adviser or its affiliates. The Board has adopted a deferred compensation plan for independent trustees that enables trustees to elect to defer receipt of all or a portion of the annual compensation they are entitled to receive from certain Nuveen-advised funds. Under the plan, deferred amounts are treated as though equal dollar amounts had been invested in shares of select Nuveen-advised funds.
Distributions to Common Shareholders
Distributions to common shareholders are recorded on the ex‑dividend date. The amount, character and timing of distributions are determined in accordance with federal income tax regulations, which may differ from U.S. GAAP.
30
Indemnifications
Under the Fund’s organizational documents, its officers and trustees are indemnified against certain liabilities arising out of the performance of their duties to the Fund. In addition, in the normal course of business, the Fund enters into contracts that provide general indemnifications to other parties. The Fund’s maximum exposure under these arrangements is unknown as this would involve future claims that may be made against the Fund that have not yet occurred. However, the Fund has not had prior claims or losses pursuant to these contracts and expects the risk of loss to be remote.
Investments and Investment Income
Securities transactions are accounted for as of the trade date for financial reporting purposes. Realized gains and losses on securities transactions are based upon the specific identification method. Investment income is comprised of interest income, which is recorded on an accrual basis and includes accretion of discounts and amortization of premiums for financial reporting purposes. Investment income also reflects payment‑in‑kind (“PIK”) interest and paydown gains and losses, if any. PIK interest represents income received in the form of securities in lieu of cash.
Netting Agreements
In the ordinary course of business, the Fund may enter into transactions subject to enforceable master repurchase agreements, International Swaps and Derivatives Association, Inc. (ISDA) master agreements or other similar arrangements (“netting agreements”). Generally, the right to offset in netting agreements allows the Fund to offset certain securities and derivatives with a specific counterparty, when applicable, as well as any collateral received or delivered to that counterparty based on the terms of the agreements. Generally, the Fund manages its cash collateral and securities collateral on a counterparty basis. With respect to certain counterparties, in accordance with the terms of the netting agreements, collateral posted to the Fund is held in a segregated account by the Fund’s custodian and/or with respect to those amounts which can be sold or repledged, are presented in the Fund’s Portfolio of Investments or Statements of Assets and Liabilities.
The Fund’s investments subject to netting agreements as of the end of the reporting period, if any, are further described in Note 4 - Portfolio Securities and Investments in Derivatives.
New Accounting Pronouncements and Rule Issuances
Reference Rate Reform
In March 2020, FASB issued Accounting Standards Update (“ASU”) 2020‑04, Reference Rate Reform: Facilitation of the Effects of Reference Rate Reform on Financial Reporting. The main objective of the new guidance is to provide relief to companies that will be impacted by the expected change in benchmark interest rates, when participating banks will no longer be required to submit London Interbank Offered Rate (LIBOR) quotes by the UK Financial Conduct Authority (FCA). The new guidance allows companies to, provided the only change to existing contracts are a change to an approved benchmark interest rate, account for modifications as a continuance of the existing contract without additional analysis. For new and existing contracts, the Fund may elect to apply the amendments as of March 12, 2020 through December 31, 2022. In December 2022, FASB deferred ASU 2022‑04 and issued ASU 2022‑06, Reference Rate Reform: Deferral of the Sunset Date of Topic 848, which extends the application of the amendments through December 31, 2024. Management has not yet elected to apply the amendments, is continuously evaluating the potential effect a discontinuation of LIBOR could have on the Fund’s investments and has currently determined that it is unlikely the ASU’s adoption will have a significant impact on the Fund’s financial statements and various filings.
New Rules to Modernize Fund Valuation Framework Take Effect
A new rule adopted by the Securities and Exchange Commission (the “SEC”) governing fund valuation practices, Rule 2a‑5 under the 1940 Act, has established requirements for determining fair value in good faith for purposes of the 1940 Act. Rule 2a‑5 permits fund boards to designate certain parties to perform fair value determinations, subject to board oversight and certain other conditions. Rule 2a‑5 also defines when market quotations are “readily available” for purposes of Section 2(a)(41) of the 1940 Act, which requires a fund to fair value a security when market quotations are not readily available. Separately, new SEC Rule 31a‑4 under the 1940 Act sets forth the recordkeeping requirements associated with fair value determinations. The Fund adopted a valuation policy conforming to the new rules, effective September 1, 2022, and there was no material impact to the Fund.
| 3. | Investment Valuation and Fair Value Measurements |
The Fund’s investments in securities are recorded at their estimated fair value utilizing valuation methods approved by the Adviser, subject to oversight of the Board. Fair value is defined as the price that would be received upon selling an investment or transferring a liability in an orderly transaction to an independent buyer in the principal or most advantageous market for the investment. U.S. GAAP establishes the three-tier hierarchy which is used to maximize the use of observable market data and minimize the use of unobservable inputs and to establish classification of fair value measurements for disclosure purposes. Observable inputs reflect the assumptions market participants would use in pricing the asset or liability. Observable inputs are based on market data obtained from sources independent of the reporting entity. Unobservable inputs reflect management’s assumptions about the assumptions market participants would use in pricing the asset or liability. Unobservable inputs are based on the best information available in the circumstances. The following is a summary of the three-tiered hierarchy of valuation input levels.
|
| Level 1 – Inputs are unadjusted and prices are determined using quoted prices in active markets for identical securities. |
|
| Level 2 – Prices are determined using other significant observable inputs (including quoted prices for similar securities, interest rates, credit spreads, etc.). |
31
Notes to Financial Statements (continued)
|
| Level 3 – Prices are determined using significant unobservable inputs (including management’s assumptions in determining the fair value of investments). |
A description of the valuation techniques applied to the Fund’s major classifications of assets and liabilities measured at fair value follows:
Prices of fixed-income securities are generally provided by pricing services approved by the Adviser, which is subject to review by the Adviser and oversight of the Board. Pricing services establish a security’s fair value using methods that may include consideration of the following: yields or prices of investments of comparable quality, type of issue, coupon, maturity and rating, market quotes or indications of value from security dealers, evaluations of anticipated cash flows or collateral, general market conditions and other information and analysis, including the obligor’s credit characteristics considered relevant. In pricing certain securities, particularly less liquid and lower quality securities, pricing services may consider information about a security, its issuer or market activity provided by the Adviser. These securities are generally classified as Level 2.
Repurchase agreements are valued at contract amount plus accrued interest, which approximates market value. These securities are generally classified as Level 2.
Futures contracts are valued using the closing settlement price or, in the absence of such a price, the last traded price and are generally classified as Level 1.
For any portfolio security or derivative for which market quotations are not readily available or for which the Adviser deems the valuations derived using the valuation procedures described above not to reflect fair value, the Adviser will determine a fair value in good faith using alternative procedures approved by the Adviser, subject to the oversight of the Board. As a general principle, the fair value of a security is the amount that the owner might reasonably expect to receive for it in a current sale. A variety of factors may be considered in determining the fair value of such securities, which may include consideration of the following: yields or prices of investments of comparable quality, type of issue, coupon, maturity and rating, market quotes or indications of value from security dealers, evaluations of anticipated cash flows or collateral, general market conditions and other information and analysis, including the obligor’s credit characteristics considered relevant. To the extent the inputs are observable and timely, the values would be classified as Level 2; otherwise they would be classified as Level 3.
The following table summarizes the market value of the Fund’s investments as of the end of the reporting period, based on the inputs used to value them:
| | | | | | | | | | | | | | | | |
| NBB | | Level 1 | | | Level 2 | | | Level 3 | | | Total | |
| | |
| Long-Term Investments*: | | | | | | | | | | | | | | | | |
| Municipal Bonds | | $ | – | | | $ | 705,896,069 | | | $ | – | | | $ | 705,896,069 | |
| Short-Term Investments: | | | | | | | | | | | | | | | | |
| Repurchase Agreements | | | – | | | | 5,652,543 | | | | – | | | | 5,652,543 | |
| Investments in Derivatives: | | | | | | | | | | | | | | | | |
| Futures Contracts** | | | (8,254,175) | | | | – | | | | – | | | | (8,254,175) | |
| | |
| Total | | $ | (8,254,175) | | | $ | 711,548,612 | | | $ | – | | | $ | 703,294,437 | |
| | |
| * | Refer to the Fund’s Portfolio of Investments for state classifications. |
| ** | Represents net unrealized appreciation (depreciation). |
The Fund holds liabilities in floating rate obligations, which are not reflected in the table above. The fair values of the Fund’s liabilities for floating rate obligations approximate their liquidation values. Floating rate obligations are generally classified as Level 2 and further described in Note 4 – Portfolio Securities and Investments in Derivatives.
| 4. | Portfolio Securities and Investments in Derivatives |
Portfolio Securities
Inverse Floating Rate Securities
The Fund is authorized to invest in inverse floating rate securities. An inverse floating rate security is created by depositing a municipal bond (referred to as an “Underlying Bond”), typically with a fixed interest rate, into a special purpose tender option bond (“TOB”) trust (referred to as the “TOB Trust”) created by or at the direction of one or more Funds. In turn, the TOB Trust issues (a) floating rate certificates (referred to as “Floaters”), in face amounts equal to some fraction of the Underlying Bond’s par amount or market value, and (b) an inverse floating rate certificate (referred to as an “Inverse Floater”) that represents all remaining or residual interest in the TOB Trust. Floaters typically pay short-term tax‑exempt interest rates to third parties who are also provided a right to tender their certificate and receive its par value, which may be paid from the proceeds of a remarketing of the Floaters, by a loan to the TOB Trust from a third party liquidity provider (“Liquidity Provider”), or by the sale of assets from the TOB Trust. The Inverse Floater is issued to a long term investor, such as the Fund. The income received by the Inverse Floater holder varies inversely with the short-term rate paid to holders of the Floaters, and in most circumstances the Inverse Floater holder bears substantially all of the Underlying Bond’s downside investment risk and also benefits disproportionately from any potential appreciation of the Underlying Bond’s value. The value of
32
an Inverse Floater will be more volatile than that of the Underlying Bond because the interest rate is dependent on not only the fixed coupon rate of the Underlying Bond but also on the short-term interest paid on the Floaters, and because the Inverse Floater essentially bears the risk of loss (and possible gain) of the greater face value of the Underlying Bond.
The Inverse Floater held by the Fund gives the Fund the right to (a) cause the holders of the Floaters to tender their certificates at par (or slightly more than par in certain circumstances), and (b) have the trustee of the TOB Trust (the “Trustee”) transfer the Underlying Bond held by the TOB Trust to the Fund, thereby collapsing the TOB Trust.
The Fund may acquire an Inverse Floater in a transaction where it (a) transfers an Underlying Bond that it owns to a TOB Trust created by a third party or (b) transfers an Underlying Bond that it owns, or that it has purchased in a secondary market transaction for the purpose of creating an Inverse Floater, to a TOB Trust created at its direction, and in return receives the Inverse Floater of the TOB Trust (referred to as a “self-deposited Inverse Floater”). The Fund may also purchase an Inverse Floater in a secondary market transaction from a third party creator of the TOB Trust without first owning the Underlying Bond (referred to as an “externally-deposited Inverse Floater”).
An investment in a self-deposited Inverse Floater is accounted for as a “financing” transaction (i.e., a secured borrowing). For a self-deposited Inverse Floater, the Underlying Bond deposited into the TOB Trust is identified in the Fund’s Portfolio of Investments as “(UB) – Underlying bond of an inverse floating rate trust reflected as a financing transaction,” with the Fund recognizing as liabilities, labeled “Floating rate obligations” on the Statement of Assets and Liabilities, (a) the liquidation value of Floaters issued by the TOB Trust, and (b) the amount of any borrowings by the TOB Trust from a Liquidity Provider to enable the TOB Trust to purchase outstanding Floaters in lieu of a remarketing. In addition, the Fund recognizes in “Investment Income” the entire earnings of the Underlying Bond, and recognizes (a) the interest paid to the holders of the Floaters or on the TOB Trust’s borrowings, and (b) other expenses related to remarketing, administration, trustee, liquidity and other services to a TOB Trust, as a component of “Interest expense” on the Statement of Operations. Earnings due from the Underlying Bond and interest due to the holders of the Floaters as of the end of the reporting period are recognized as components of “Receivable for interest” and “Payable for interest” on the Statement of Assets and Liabilities, respectively.
In contrast, an investment in an externally-deposited Inverse Floater is accounted for as a purchase of the Inverse Floater and is identified in the Fund’s Portfolio of Investments as “(IF) – Inverse floating rate investment.” For an externally-deposited Inverse Floater, a Fund’s Statement of Assets and Liabilities recognizes the Inverse Floater and not the Underlying Bond as an asset, and the Fund does not recognize the Floaters, or any related borrowings from a Liquidity Provider, as a liability. Additionally, the Fund reflects in “Investment Income” only the net amount of earnings on the Inverse Floater (net of the interest paid to the holders of the Floaters or the Liquidity Provider as lender, and the expenses of the Trust), and does not show the amount of that interest paid or the expenses of the TOB Trust as described above as interest expense on the Statement of Operations.
Fees paid upon the creation of a TOB Trust for self-deposited Inverse Floaters and externally-deposited Inverse Floaters are recognized as part of the cost basis of the Inverse Floater and are capitalized over the term of the TOB Trust.
As of the end of the reporting period, the aggregate value of Floaters issued by the Fund’s TOB Trust for self-deposited Inverse Floaters and externally-deposited Inverse Floaters was as follows:
| | | | | | | | | | | | |
| Fund | | Floating Rate Obligations: Self- Deposited Inverse Floaters | | | Floating Rate Obligations: Externally‑Deposited Inverse Floaters | | | Total | |
| | |
NBB | | $ | 36,810,000 | | | $ | 103,190,000 | | | $ | 140,000,000 | |
| | |
During the current fiscal period, the average amount of Floaters (including any borrowings from a Liquidity Provider) outstanding, and the average annual interest rates and fees related to self-deposited Inverse Floaters, were as follows:
| | | | | | | | |
| Fund | | Average Floating Rate Obligations Outstanding | | | Average Annual Interest Rate And Fees | |
| | |
NBB | | $ | 36,810,000 | | | | 2.33% | |
| | |
TOB Trusts are supported by a liquidity facility provided by a Liquidity Provider pursuant to which the Liquidity Provider agrees, in the event that Floaters are (a) tendered to the Trustee for remarketing and the remarketing does not occur, or (b) subject to mandatory tender pursuant to the terms of the TOB Trust agreement, to either purchase Floaters or to provide the Trustee with an advance from a loan facility to fund the purchase of Floaters by the TOB Trust. In certain circumstances, the Liquidity Provider may otherwise elect to have the Trustee sell the Underlying Bond to retire the Floaters that were tendered and not remarketed prior to providing such a loan. In these circumstances, the Liquidity Provider remains obligated to provide a loan to the extent that the proceeds of the sale of the Underlying Bond are not sufficient to pay the purchase price of the Floaters.
The size of the commitment under the loan facility for a given TOB Trust is at least equal to the balance of that TOB Trust’s outstanding Floaters plus any accrued interest. In consideration of the loan facility, fee schedules are in place and are charged by the Liquidity Provider(s). Any loans made by the Liquidity Provider will be secured by the purchased Floaters held by the TOB Trust. Interest paid on any outstanding loan balances will be effectively borne by the Fund that owns the Inverse Floaters of the TOB Trust that has incurred the borrowing and may be at a rate that is greater than the rate that would have been paid had the Floaters been successfully remarketed.
33
Notes to Financial Statements (continued)
As described above, any amounts outstanding under a liquidity facility are recognized as a component of “Floating rate obligations” on the Statement of Assets and Liabilities by the Fund holding the corresponding Inverse Floaters issued by the borrowing TOB Trust. As of the end of the reporting period, there were no loans outstanding under such facilities.
The Fund may also enter into shortfall and forbearance agreements (sometimes referred to as a “recourse arrangement”) (TOB Trusts involving such agreements are referred to herein as “Recourse Trusts”), under which a Fund agrees to reimburse the Liquidity Provider for the Trust’s Floaters, in certain circumstances, for the amount (if any) by which the liquidation value of the Underlying Bond held by the TOB Trust may fall short of the sum of the liquidation value of the Floaters issued by the TOB Trust plus any amounts borrowed by the TOB Trust from the Liquidity Provider, plus any shortfalls in interest cash flows. Under these agreements, a Fund’s potential exposure to losses related to or on an Inverse Floater may increase beyond the value of the Inverse Floater as a Fund may potentially be liable to fulfill all amounts owed to holders of the Floaters or the Liquidity Provider. Any such shortfall amount in the aggregate is recognized as “Unrealized depreciation on Recourse Trusts” on the Statement of Assets and Liabilities.
As of the end of the reporting period, the Fund’s maximum exposure to the Floaters issued by Recourse Trusts for self-deposited Inverse Floaters and externally-deposited Inverse Floaters was as follows:
| | | | | | | | | | | | |
| Fund | | Maximum Exposure to Recourse Trusts: Self‑Deposited Inverse Floaters | | | Maximum Exposure to Recourse Trusts: Externally‑Deposited Inverse Floaters | | | Total | |
| | |
NBB | | $ | 36,810,000 | | | $ | 103,190,000 | | | $ | 140,000,000 | |
| | |
Repurchase Agreements
In connection with transactions in repurchase agreements, it is the Fund’s policy that its custodian take possession of the underlying collateral securities, the fair value of which exceeds the principal amount of the repurchase transaction, including accrued interest, at all times. If the counterparty defaults, and the fair value of the collateral declines, realization of the collateral may be delayed or limited.
The following table presents the repurchase agreements for the Fund that are subject to netting agreements as of the end of the reporting period, and the collateral delivered related to those repurchase agreements.
| | | | | | | | | | |
| Fund | | Counterparty | | Short‑term Investments, at Value | | | Collateral Pledged (From) Counterparty | |
| | |
| NBB | | Fixed Income Clearing Corporation | | | $ 5,652,543 | | | | $ (5,765,615) | |
| | |
Zero Coupon Securities
A zero coupon security does not pay a regular interest coupon to its holders during the life of the security. Income to the holder of the security comes from accretion of the difference between the original purchase price of the security at issuance and the par value of the security at maturity and is effectively paid at maturity. The market prices of zero coupon securities generally are more volatile than the market prices of securities that pay interest periodically.
Investment Transactions
Long-term purchases and sales (including maturities but excluding derivative transactions) during the current fiscal period were as follows:
| | | | | | | | |
| Fund | | Purchases | | | Sales and Maturities | |
| | |
| NBB | | $ | 38,837,510 | | | $ | 58,622,907 | |
| | |
The Fund may purchase securities on a when-issued or delayed-delivery basis. Securities purchased on a when-issued or delayed-delivery basis may have extended settlement periods; interest income is not accrued until settlement date. Any securities so purchased are subject to market fluctuation during this period. The Fund has earmarked securities in its portfolio with a current value at least equal to the amount of the when-issued/delayed delivery purchase commitments. If the Fund has outstanding when-issued/delayed-delivery purchases commitments as of the end of the reporting period, such amounts are recognized on the Statement of Assets and Liabilities.
Investments in Derivatives
In addition to the inverse floating rate securities in which the Fund may invest, which are considered portfolio securities for financial reporting purposes, the Fund is authorized to invest in certain other derivative instruments. The Fund records derivative instruments at fair value, with changes in fair value recognized on the Statement of Operations, where applicable. Even though the Fund’s investments in derivatives may represent economic hedges, they are not considered to be hedge transactions for financial reporting purposes.
34
Futures Contracts
Upon execution of a futures contract, a Fund is obligated to deposit cash or eligible securities, also known as “initial margin,” into an account at its clearing broker equal to a specified percentage of the contract amount. Cash held by the broker to cover initial margin requirements on open futures contracts, if any, is recognized as “Cash collateral at brokers for investments in futures contracts” on the Statement of Assets and Liabilities. Investments in futures contracts obligate a Fund and the clearing broker to settle monies on a daily basis representing changes in the prior days “mark‑to‑market” of the open contracts. If a Fund has unrealized appreciation the clearing broker would credit the Fund’s account with an amount equal to appreciation and conversely if a Fund has unrealized depreciation the clearing broker would debit the Fund’s account with an amount equal to depreciation. These daily cash settlements are also known as “variation margin.” Variation margin is recognized as a receivable and/or payable for “Variation margin on futures contracts” on the Statement of Assets and Liabilities.
During the period the futures contract is open, changes in the value of the contract are recognized as an unrealized gain or loss by “marking‑to‑market” on a daily basis to reflect the changes in market value of the contract, which is recognized as a component of “Change in net unrealized appreciation (depreciation) of futures contracts” on the Statement of Operations. When the contract is closed or expired, a Fund records a realized gain or loss equal to the difference between the value of the contract on the closing date and value of the contract when originally entered into, which is recognized as a component of “Net realized gain (loss) from futures contracts” on the Statement of Operations.
Risks of investments in futures contracts include the possible adverse movement in the price of the securities or indices underlying the contracts, the possibility that there may not be a liquid secondary market for the contracts and/or that a change in the value of the contract may not correlate with a change in the value of the underlying securities or indices.
During the current fiscal period, the Fund managed the duration of its portfolio by shorting interest rate futures contracts.
The average notional amount of futures contracts outstanding during the current fiscal period was as follows:
| | | | |
| Fund | | Average notional amount of futures contracts outstanding* | |
| | |
| NBB | | | $193,648,179 | |
| | |
| * | The average notional amount is calculated based on the absolute aggregate notional amount of contracts at the beginning of the current fiscal period and at the end of each fiscal quarter within the current fiscal period. |
The following table presents the fair value of all futures contracts held by the Fund as of the end of the reporting period, the location of these instruments of the Statement of Assets and Liabilities and the primary underlying risk exposure.
| | | | | | | | | | | | | | | | |
| | | Location on the Statement of Assets and Liabilities | |
| | | | |
| Underlying | | Derivative | | | Asset Derivatives | | | | | (Liability) Derivatives | | | |
| | | | | | | |
| Risk Exposure | | Instrument | | | Location | | Value | | | Location | | Value | |
| | |
| NBB | | | | | | | | | | | | | | | | |
| | |
| Interest rate | | | Futures contracts | | | - | | $ | - | | | Payable for variation
margin on futures
contracts* | | $ | (8,254,175) | |
| | |
* Value represents the cumulative unrealized appreciation (depreciation) of futures contracts as reported in the Fund’s Portfolio of Investments and not the asset and/or liability derivatives location as described in the table above.
The following table presents the amount of net realized gain (loss) and change in net unrealized appreciation (depreciation) recognized on futures contracts on the Statement of Operations during the current fiscal period, and the primary underlying risk exposure.
| | | | | | | | | | | | |
| Fund | | Underlying Risk Exposure | | Derivative Instrument | | Net Realized Gain (Loss) from Futures Contracts | | | Change in Net Unrealized Appreciation (Depreciation) of Futures Contracts | |
| | |
| NBB | | Interest rate | | Future contracts | | | $60,913,892 | | | | $(17,359,815) | |
| | |
Market and Counterparty Credit Risk
In the normal course of business the Fund may invest in financial instruments and enter into financial transactions where risk of potential loss exists due to changes in the market (market risk) or failure of the other party to the transaction to perform (counterparty credit risk). The potential loss could exceed the value of the financial assets recorded on the financial statements. Financial assets, which potentially expose the Fund to counterparty credit risk, consist principally of cash due from counterparties on forward, option and swap transactions, when applicable. The extent of the Fund’s exposure to counterparty credit risk in respect to these financial assets approximates their carrying value as recorded on the Statement of Assets and Liabilities.
The Fund helps manage counterparty credit risk by entering into agreements only with counterparties the Adviser believes have the financial resources to honor their obligations and by having the Adviser monitor the financial stability of the counterparties. Additionally, counterparties may be required to pledge collateral daily (based on the daily valuation of the financial asset) on behalf of the Fund with a value approximately equal to the amount of any unrealized gain above a pre‑determined threshold. Reciprocally, when the Fund has an unrealized loss, the Fund has
35
Notes to Financial Statements (continued)
instructed the custodian to pledge assets of the Fund as collateral with a value approximately equal to the amount of the unrealized loss above a pre‑determined threshold. Collateral pledges are monitored and subsequently adjusted if and when the valuations fluctuate, either up or down, by at least the predetermined threshold amount.
Common Shares
Common Shares Equity Shelf Programs and Offering Costs
The Fund has filed a registration statement with the SEC authorizing the Fund to issue additional common shares through one or more equity shelf programs (“Shelf Offering”), which became effective with the SEC during prior fiscal periods.
Under this Shelf Offering, the Fund, subject to market conditions, may raise additional equity capital by issuing additional common shares from time to time in varying amounts and by different offering methods at a net price at or above the Fund’s NAV per common share. In the event the Fund’s Shelf Offering registration statement is no longer current, the Fund may not issue additional common shares until a post-effective amendment to the registration statement has been filed with the SEC.
Maximum aggregate offering, common shares sold and offering proceeds, net of offering costs under the Fund’s Shelf Offering during the Fund’s current fiscal period were as follows:
| | | | | | | | |
| | | NBB | |
| | | Year Ended
3/31/23 | | | Year Ended
3/31/22 | |
| | |
| Maximum aggregate offering | | | $162,000,000 | | | | $162,000,000 | |
| Common shares sold | | | 772,413 | | | | 847,169 | |
| Offering proceeds, net of offering costs | | | $14,065,606 | | | | $19,282,125 | |
| | |
Costs incurred by the Fund in connection with its initial shelf registration are recorded as a prepaid expense and recognized as “Deferred offering costs” on the Statement of Assets and Liabilities. These costs are amortized pro rata as common shares are sold and are recognized as a component of “Proceeds from shelf offering, net of offering costs” on the Statement of Changes in Net Assets. Any deferred offering costs remaining one year after effectiveness of the initial shelf registration will be expensed. Costs incurred by the Fund to keep the shelf registration current are expensed as incurred and recognized as a component of “Other expenses” on the Statement of Operations.
Common Shares Transactions
Transactions in common shares during the Fund’s current and prior fiscal period, where applicable were as follows:
| | | | | | | | |
| | | NBB | |
| | | Year Ended
3/31/23 | | | Year Ended
3/31/22 | |
| | |
| Common Shares: | | | | | | | | |
| Sold through shelf offering | | | 772,413 | | | | 847,169 | |
| Issued to shareholders due to reinvestment of distributions | | | 11,822 | | | | 36,456 | |
| | |
| Total | | | 784,235 | | | | 883,625 | |
| | |
| Weighted average common share: | | | | | | | | |
| Premium to NAV per shelf offering sold | | | 1.65% | | | | 1.26% | |
| | |
The Fund intends to distribute substantially all of its net investment income and net capital gains to shareholders and otherwise comply with the requirements of Subchapter M of the Internal Revenue Code applicable to regulated investment companies. Therefore, no federal income tax provision is required.
The Fund files income tax returns in U.S. federal and applicable state and local jurisdictions. A Fund’s federal income tax returns are generally subject to examination for a period of three fiscal years after being filed. State and local tax returns may be subject to examination for an additional period of time depending on the jurisdiction. Management has analyzed the Fund’s tax positions taken for all open tax years and has concluded that no provision for income tax is required in the Fund’s financial statements.
Differences between amounts for financial statement and federal income tax purposes are primarily due to timing differences in recognizing gains and losses on investment transactions. Temporary differences do not require reclassification. As of year end, permanent differences that resulted in reclassifications among the components of net assets relate primarily to bond premium amortization adjustments. Temporary and permanent differences have no impact on a Fund’s net assets.
36
As of year end, the aggregate cost and the net unrealized appreciation/(depreciation) of all investments for federal income tax purposes were as follows:
| | | | | | | | | | | | | | | | |
| Fund | | Tax Cost | | | Gross Unrealized
Appreciation | | | Gross Unrealized
(Depreciation) | | | Net Unrealized
Appreciation
(Depreciation) | |
| | | | |
| NBB | | $ | 679,554,672 | | | $ | 52,823,918 | | | $ | (65,895,264) | | | $ | (13,071,346) | |
For purposes of this disclosure, tax cost generally includes the cost of portfolio investments as well as up‑front fees or premiums exchanged on derivatives and any amounts unrealized for income statement reporting but realized income and/or capital gains for tax reporting, if applicable.
As of year end, the components of accumulated earnings on a tax basis were as follows:
| | | | | | | | | | | | | | | | | | | | | | | | | | | | |
| Fund | | Undistributed
Ordinary
Income | | | Undistributed
Long-Term
Capital Gains | | | Unrealized
Appreciation
(Depreciation) | | | Capital Loss
Carryforwards | | | Late‑Year Loss
Deferrals | | | Other
Book‑to‑Tax
Differences | | | Total | |
| | | | | | | |
| NBB | | $ | 753,731 | | | $ | — | | | $ | (13,071,346) | | | $ | (24,309,292) | | | $ | — | | | $ | (3,126,552) | | | $ | (39,753,459) | |
The tax character of distributions paid was as follows:
| | | | | | | | | | | | | | | | |
| | | 3/31/23 | | | 3/31/22 | |
| Fund | | Ordinary Income | | | Long‑Term
Capital Gains | | | Ordinary Income | | | Long‑Term
Capital Gains | |
| | | | |
| NBB | | $ | 33,333,983 | | | $ | — | | | $ | 36,176,376 | | | $ | — | |
As of year end, the Fund had capital loss carryforwards, which will not expire:
| | | | | | | | | | | | |
| Fund | | Short‑Term | | | Long-Term | | | Total | |
| | | |
NBB1 | | $ | — | | | $ | 24,309,292 | | | $ | 24,309,292 | |
| 1 | A portion of NBB’s capital loss carryforwards is subject to limitation under the Internal Revenue Code and related regulations. |
| | | | |
| Fund | | Utilized | |
| |
| NBB | | $ | 33,039,661 | |
| 7. | Management Fees and Other Transactions with Affiliates |
Management Fees
The Fund’s management fee compensates the Adviser for the overall investment advisory and administrative services and general office facilities. The Sub‑Adviser is compensated for its services to the Fund from the management fees paid to the Adviser.
The Fund’s management fee consists of two components – a fund-level fee, based only on the amount of assets within the Fund, and a complex-level fee, based on the aggregate amount of all eligible fund assets managed by the Adviser. This pricing structure enables the Fund’s shareholders to benefit from growth in the assets within the Fund as well as from growth in the amount of complex-wide assets managed by the Adviser.
The annual fund-level fee, payable monthly, is calculated according to the following schedule:
| | | | |
| Average Daily Managed Assets* | | Fund‑Level Fee Rate | |
| For the first $125 million | | | 0.4500 | % |
| For the next $125 million | | | 0.4375 | |
| For the next $250 million | | | 0.4250 | |
| For the next $500 million | | | 0.4125 | |
| For the next $1 billion | | | 0.4000 | |
| For the next $3 billion | | | 0.3750 | |
| For managed assets over $5 billion | | | 0.3625 | |
37
Notes to Financial Statements (continued)
The annual complex-level fee, payable monthly, is calculated by multiplying the current complex-wide fee rate, determined according to the following schedule by the Fund’s daily managed assets:
| | | | |
| Complex-Level Eligible Asset Breakpoint Level* | | Effective Complex‑Level Fee Rate at Breakpoint Level | |
| $55 billion | | | 0.2000 | % |
| $56 billion | | | 0.1996 | |
| $57 billion | | | 0.1989 | |
| $60 billion | | | 0.1961 | |
| $63 billion | | | 0.1931 | |
| $66 billion | | | 0.1900 | |
| $71 billion | | | 0.1851 | |
| $76 billion | | | 0.1806 | |
| $80 billion | | | 0.1773 | |
| $91 billion | | | 0.1691 | |
| $125 billion | | | 0.1599 | |
| $200 billion | | | 0.1505 | |
| $250 billion | | | 0.1469 | |
| $300 billion | | | 0.1445 | |
| * | For the complex-level fees, managed assets include closed‑end fund assets managed by the Adviser that are attributable to certain types of leverage. For these purposes, leverage includes the funds’ use of preferred stock and borrowings and certain investments in the residual interest certificates (also called inverse floating rate securities) in tender option bond (TOB) trusts, including the portion of assets held by a TOB trust that has been effectively financed by the trust’s issuance of floating rate securities, subject to an agreement by the Adviser as to certain funds to limit the amount of such assets for determining managed assets in certain circumstances. The complex-level fee is calculated based upon the aggregate daily managed assets of all Nuveen open‑end and closed‑end funds that constitute ‘’eligible assets.” Eligible assets do not include assets attributable to investments in other Nuveen funds or assets in excess of a determined amount (originally $2 billion) added to the Nuveen fund complex in connection with the Adviser’s assumption of the management of the former First American Funds effective January 1, 2011, but do not include certain assets of certain Nuveen funds that were reorganized into funds advised by an affiliate of the Adviser during the 2019 calendar year. As of March 31, 2023, the complex-level fee for the Fund was as follows: |
| | | | |
| Fund | | Complex‑Level Fee | |
| | |
| NBB | | | 0.1591% | |
| | |
Other Transactions with Affiliates
The Fund is permitted to purchase or sell securities from or to certain other funds or accounts managed by the Sub‑Adviser (“Affiliated Entity”) under specified conditions outlined in procedures adopted by the Board (“cross-trade”). These procedures have been designed to ensure that any cross-trade of securities by the Fund from or to an Affiliated Entity by virtue of having a common investment adviser (or affiliated investment adviser), common officer and/or common trustee complies with Rule 17a‑7 under the 1940 Act. These transactions are effected at the current market price (as provided by an independent pricing service) without incurring broker commissions.
During the current fiscal period, the Fund did not engage in cross-trades pursuant to these procedures.
| 8. | Commitments and Contingencies |
In the normal course of business, the Fund enters into a variety of agreements that may expose the Fund to some risk of loss. These could include recourse arrangements for certain TOB Trusts, which are described elsewhere in these Notes to Financial Statements. The risk of future loss arising from such agreements, while not quantifiable, is expected to be remote. As of the end of the reporting period, the Fund did not have any unfunded commitments.
From time to time, the Fund may be a party to certain legal proceedings in the ordinary course of business, including proceedings relating to the enforcement of the Fund’s rights under contracts. As of the end of the reporting period, the Fund is not subject to any material legal proceedings.
Reverse Repurchase Agreements
During the current fiscal period, the Fund utilized reverse repurchase agreements as a means of leverage.
The Fund may enter into a reverse repurchase agreement with brokers, dealers, banks or other financial institutions that have been determined by the Adviser to be creditworthy. In a reverse repurchase agreement, the Fund sells to the counterparty a security that it holds with a contemporaneous agreement to repurchase the same security at an agreed-upon price and date, reflecting the interest rate effective for the term of the agreement. It may also be viewed as the borrowing of money by the Fund. Cash received in exchange for securities delivered, plus accrued interest payments to be made by the Fund to a counterparty, are reflected as a liability on the Statement of Assets and Liabilities. Interest payments made by the Fund to counterparties are recognized as a component of “Interest expense” on the Statement of Operations.
38
In a reverse repurchase agreement, the Fund retains the risk of loss associated with the sold security. Reverse repurchase agreements also involve the risk that the purchaser fails to return the securities as agreed upon, files for bankruptcy or becomes insolvent. Upon a bankruptcy or insolvency of a counterparty, the Fund is considered to be an unsecured creditor with respect to excess collateral and as such the return of excess collateral may be delayed.
As of the end of the reporting period, the Fund’s outstanding balances on its reverse repurchase agreements were as follows:
| | | | | | | | | | | | | | | | | | | | | | |
| Fund | | Counterparty | | Rate | | | Principal
Amount | | | Maturity | | | Value | | | Value and Accrued
Interest | |
| | |
| NBB | | RBC Capital Markets, LLC | | | 5.26% | | | | $(123,000,000) | | | | 4/27/23 | | | | $(123,000,000) | | | | $(124,120,500) | |
| NBB | | TD Securities (USA), LLC | | | 5.54% | | | | (43,000,000) | | | | 4/24/23 | | | | (43,000,000) | | | | (43,443,354) | |
| NBB | | Wells Fargo Securities, LLC | | | 5.16% | | | | (20,950,000) | | | | 4/13/23 | | | | (20,950,000) | | | | (21,183,994) | |
| | |
| Total | | | | | | | | | $(186,950,000) | | | | | | | | $(186,950,000) | | | | $(188,747,848) | |
| | |
During the current fiscal period, the average daily balance outstanding (which was for the entire current reporting period) and average interest rate on the Fund’s reverse repurchase agreements were as follows:
| | | | | | | | | | | | |
| Fund | | Utilization
Period (Days
Outstanding) | | | Average
Daily Balance
Outstanding | | | Average Annual
Interest Rate | |
| | |
| NBB | | | 365 | | | $ | 206,994,809 | | | | 3.43% | |
| | |
The following table presents the reverse repurchase agreements subject to netting agreements and the collateral delivered related to those reverse repurchase agreements.
| | | | | | | | | | |
| Fund | | Counterparty | | Reverse Repurchase
Agreements* | | | Collateral Pledged to
Counterparty | |
| | |
| NBB | | RBC Capital Markets, LLC | | $ | (124,120,500 | ) | | $ | 149,331,971 | |
| NBB | | TD Securities (USA), LLC | | | (43,443,354 | ) | | | 58,340,157 | |
| NBB | | Wells Fargo Securities, LLC | | | (21,183,994 | ) | | | 29,088,545 | |
| | |
| Total | | | | | (188,747,848 | ) | | | 236,760,673 | |
| | |
* Represents gross value and accrued interest for the counterparty as reported in the preceding table.
Inter-Fund Borrowing and Lending
The SEC has granted an exemptive order permitting registered open‑end and closed‑end Nuveen funds to participate in an inter-fund lending facility whereby the Nuveen funds may directly lend to and borrow money from each other for temporary purposes (e.g., to satisfy redemption requests or when a sale of securities “fails,” resulting in an unanticipated cash shortfall) (the “Inter-Fund Program”). The closed‑end Nuveen funds, including the Fund covered by this shareholder report, will participate only as lenders, and not as borrowers, in the Inter-Fund Program because such closed‑end funds rarely, if ever, need to borrow cash to meet redemptions. The Inter-Fund Program is subject to a number of conditions, including, among other things, the requirements that (1) no fund may borrow or lend money through the Inter-Fund Program unless it receives a more favorable interest rate than is typically available from a bank or other financial institution for a comparable transaction; (2) no fund may borrow on an unsecured basis through the Inter- Fund Program unless the fund’s outstanding borrowings from all sources immediately after the inter-fund borrowing total 10% or less of its total assets; provided that if the borrowing fund has a secured borrowing outstanding from any other lender, including but not limited to another fund, the inter-fund loan must be secured on at least an equal priority basis with at least an equivalent percentage of collateral to loan value; (3) if a fund’s total outstanding borrowings immediately after an inter-fund borrowing would be greater than 10% of its total assets, the fund may borrow through the inter-fund loan on a secured basis only; (4) no fund may lend money if the loan would cause its aggregate outstanding loans through the Inter-Fund Program to exceed 15% of its net assets at the time of the loan; (5) a fund’s inter-fund loans to any one fund shall not exceed 5% of the lending fund’s net assets; (6) the duration of inter-fund loans will be limited to the time required to receive payment for securities sold, but in no event more than seven days; and (7) each inter-fund loan may be called on one business day’s notice by a lending fund and may be repaid on any day by a borrowing fund. In addition, a Nuveen fund may participate in the Inter-Fund Program only if and to the extent that such participation is consistent with the fund’s investment objective and investment policies. The Board is responsible for overseeing the Inter-Fund Program.
The limitations detailed above and the other conditions of the SEC exemptive order permitting the Inter-Fund Program are designed to minimize the risks associated with Inter-Fund Program for both the lending fund and the borrowing fund. However, no borrowing or lending activity is without risk. When a fund borrows money from another fund, there is a risk that the loan could be called on one day’s notice or not renewed, in which case the fund may have to borrow from a bank at a higher rate or take other actions to payoff such loan if an inter-fund loan is not available from another fund. Any delay in repayment to a lending fund could result in a lost investment opportunity or additional borrowing costs.
During the current reporting period, the Fund did not enter into any inter-fund loan activity.
39
[This page intentionally left blank.]
40
Shareholder Update(Unaudited)
CURRENT INVESTMENT OBJECTIVES, INVESTMENT POLICIES AND PRINCIPAL RISKS OF THE FUND
NUVEEN TAXABLE MUNICIPAL INCOME FUND (NBB)
Investment Objectives
The Fund’s primary investment objective is to provide current income through investments in taxable municipal securities. As a secondary objective, the Fund seeks to enhance portfolio value and total return.
Investment Policies
Under normal circumstances, the Fund will invest at least 80% of its Assets (as defined below) in taxable municipal securities. The Fund may invest up to 20% of its Assets in securities other than taxable municipal securities, including municipal securities the interest income from which is exempt from regular federal income tax (sometimes referred to as “tax‑exempt municipal securities”), U.S. Treasury securities and obligations of the U.S. Government, its agencies and instrumentalities.
The Fund will generally invest in securities with intermediate-or long-term maturities. The Fund anticipates having a weighted average maturity of 15 to 35 years. The weighted average maturity of securities held by the Fund may be shortened or lengthened, depending on market conditions and on an assessment by the Fund’s portfolio manager of which segments of the securities market offer the most favorable relative investment values and opportunities for income and total return.
“Assets” mean the net assets of the Fund plus the amount of any borrowings for investment purposes. “Managed Assets” mean the total assets of the Fund, minus the sum of its accrued liabilities (other than Fund liabilities incurred for the express purpose of creating leverage). Total assets for this purpose shall include assets attributable to the Fund’s use of leverage (whether or not those assets are reflected in the Fund’s financial statements for purposes of generally accepted accounting principles), and derivatives will be valued at their market value.
Under normal circumstances:
| | • | | The Fund will invest at least 80% of its Managed Assets in municipal securities that, at the time of investment, are rated within the four highest grades (Baa or BBB or better) by at least one nationally recognized statistical rating organization (an “NRSRO”) or are unrated but judged to be of comparable quality by the Fund’s sub‑adviser. |
| | • | | The Fund may invest up to 20% of its Managed Assets in municipal securities that at the time of investment are rated below investment grade or are unrated but judged to be of comparable quality by the Fund’s sub‑adviser. |
| | • | | The Fund will not invest more than 25% of its Managed Assets in municipal securities in any one industry or in any one state of origin. |
| | • | | The Fund may invest up to 20% of its total assets in certain derivative instruments to enhance returns. Such derivatives include financial futures contracts, swap contracts (including interest rate and credit default swaps), options on financial futures, options on swap contracts, or similar instruments. This limit will apply to the investment exposure created by those derivative instruments. Inverse floating rate securities are not regarded as derivatives for this purpose. The Fund’s sub‑adviser may also use derivative instruments to hedge some of the risk of the Fund’s investments in municipal securities, and such derivatives are not subject to this policy. |
| | • | | The Fund may invest up to 10% of its Managed Assets in securities of other open-or closed‑end investment companies (including exchange-traded funds (“ETFs”)) that invest primarily in municipal securities of the types in which the Fund may invest directly. |
The foregoing policies apply only at the time of any new investment.
Approving Changes in Investment Policies
The Board of Trustees of the Fund may change the policies described above without a shareholder vote. However, the Fund’s investment objectives may not be changed without the approval of the holders of a majority of the outstanding common shares and preferred shares voting together
as a single class, and the approval of the holders of a majority of the outstanding preferred shares, voting separately as a single class. A “majority of the outstanding” shares means (i) 67% or more of the shares present at a meeting, if the holders of more than 50% of the shares are present or represented by proxy or (ii) more than 50% of the shares, whichever is less.
Additionally, with respect to the Fund’s policy of investing at least 80% of its Assets in taxable municipal securities, such policy may not be changed without 60 days’ prior notice to shareholders.
Portfolio Contents
The Fund generally invests in taxable municipal securities (including Build America Bonds (“BABs”)) and tax‑exempt municipal securities, including municipal bonds, notes, securities issued to finance and refinance public projects, certificates of participation, variable rate demand obligations, lease obligations, municipal notes, pre‑refunded municipal bonds, private activity bonds, securities issued by tender option bond trusts (“TOB trusts”), including inverse floating rate securities, and other forms of municipal bonds and securities, and other related instruments that create exposure to municipal bonds, notes and securities.
41
Shareholder Update (Unaudited) (continued)
Municipal securities are debt obligations generally issued by states, cities and local authorities and certain possessions and territories of the United States (such as Puerto Rico and Guam) to finance or refinance public purpose projects such as roads, schools, and water supply systems.
BABs are taxable municipal obligations issued pursuant to the American Recovery and Reinvestment Act of 2009 that are subject to federal subsidies of up to 35% of the interest payable on the bonds in the form of direct subsidies to the bond issuer or refundable tax credits to the bond holder. Build America Bonds are not guaranteed by the U.S. government or its agencies or instrumentalities.
The Fund may invest in municipal securities that represent lease obligations and certificates of participation in such leases. A municipal lease is an obligation in the form of a lease or installment purchase that is issued by a state or local government to acquire equipment and facilities. Income from such obligations generally is exempt from state and local taxes in the state of issuance. A certificate of participation represents an undivided interest in an unmanaged pool of municipal leases, an installment purchase agreement or other instruments. The certificates typically are issued by a municipal agency, a trust or other entity that has received an assignment of the payments to be made by the state or political subdivision under such leases or installment purchase agreements. Such certificates provide the Fund with the right to a pro rata undivided interest in the underlying municipal securities. In addition, such participations generally provide the Fund with the right to demand payment, on not more than seven days’ notice, of all or any part of the Fund’s participation interest in the underlying municipal securities, plus accrued interest.
The Fund may invest in municipal notes. Municipal securities in the form of notes generally are used to provide for short-term capital needs, in anticipation of an issuer’s receipt of other revenues or financing, and typically have maturities of up to three years. Such instruments may include tax anticipation notes, revenue anticipation notes, bond anticipation notes, tax and revenue anticipation notes and construction loan notes. Tax anticipation notes are issued to finance the working capital needs of governments. Generally, they are issued in anticipation of various tax revenues, such as income, sales, property, use and business taxes, and are payable from these specific future taxes. Revenue anticipation notes are issued in expectation of receipt of other kinds of revenue, such as federal revenues available under federal revenue sharing programs. Bond anticipation notes are issued to provide interim financing until long-term bond financing can be arranged. In most cases, the long-term bonds then provide the funds needed for repayment of the bond anticipation notes. Tax and revenue anticipation notes combine the funding sources of both tax anticipation notes and revenue anticipation notes. Construction loan notes are sold to provide construction financing. Mortgage notes insured by the Federal Housing Authority secure these notes; however, the proceeds from the insurance may be less than the economic equivalent of the payment of principal and interest on the mortgage note if there has been a default. The anticipated revenues from taxes, grants or bond financing generally secure the obligations of an issuer of municipal notes.
The Fund may invest in pre‑refunded municipal securities. The principal of and interest on pre‑refunded municipal securities are no longer paid from the original revenue source for the securities. Instead, the source of such payments is typically an escrow fund consisting of U.S. government securities. The assets in the escrow fund are derived from the proceeds of refunding bonds issued by the same issuer as the pre‑refunded municipal securities. Issuers of municipal securities use this advance refunding technique to obtain more favorable terms with respect to securities that are not yet subject to call or redemption by the issuer. For example, advance refunding enables an issuer to refinance debt at lower market interest rates, restructure debt to improve cash flow or eliminate restrictive covenants in the indenture or other governing instrument for the pre‑refunded municipal securities. However, except for a change in the revenue source from which principal and interest payments are made, the pre‑refunded municipal securities remain outstanding on their original terms until they mature or are redeemed by the issuer.
The Fund may invest in private activity bonds. Private activity bonds are issued by or on behalf of public authorities to obtain funds to provide privately operated housing facilities, airport, mass transit or port facilities, sewage disposal, solid waste disposal or hazardous waste treatment or disposal facilities and certain local facilities for water supply, gas or electricity. Other types of private activity bonds, the proceeds of which are used for the construction, equipment, repair or improvement of privately operated industrial or commercial facilities, may constitute municipal securities, although the current federal tax laws place substantial limitations on the size of such issues.
The Fund may invest in inverse floating rate securities issued by a TOB trust, the interest rate on which varies inversely with the Securities Industry Financial Markets Association short-term rate, which resets weekly, or a similar short-term rate, and is reduced by the expenses related to the TOB trust. Typically, inverse floating rate securities represent beneficial interests in a special purpose trust (sometimes called a TOB trust) formed by a third party sponsor for the purpose of holding municipal bonds. Inverse floating rate securities may increase or decrease in value at a greater rate than the underlying interest rate on the municipal bond held by the TOB trust, which effectively leverages the Fund’s investment.
The Fund may invest in floating rate securities issued by special purpose trusts. Floating rate securities may take the form of short-term floating rate securities or the option period may be substantially longer. Generally, the interest rate earned will be based upon the market rates for municipal securities with maturities or remarketing provisions that are comparable in duration to the periodic interval of the tender option, which may vary from weekly, to monthly, to extended periods of one year or multiple years. Since the option feature has a shorter term than the final maturity or first call date of the underlying bond deposited in the trust, the Fund as the holder of the floating rate security relies upon the terms of the agreement with the financial institution furnishing the option as well as the credit strength of that institution. As further assurance of liquidity, the terms of the trust provide for a liquidation of the municipal security deposited in the trust and the application of the proceeds to pay off the floating rate security. The trusts that are organized to issue both short-term floating rate securities and inverse floaters generally include liquidation triggers to protect the investor in the floating rate security.
The Fund may invest in municipal securities issued by special taxing districts. Special taxing districts are organized to plan and finance infrastructure developments to induce residential, commercial and industrial growth and redevelopment. The bond financing methods such as tax increment finance, tax assessment, special services district and Mello-Roos bonds, are generally payable solely from taxes or other revenues attributable to the specific projects financed by the bonds without recourse to the credit or taxing power of related or overlapping municipalities.
The Fund may invest in zero coupon bonds. A zero coupon bond is a bond that typically does not pay interest for the entire life of the obligation or for an initial period after the issuance of the obligation.
42
The Fund may buy and sell securities on a when-issued or delayed delivery basis, making payment or taking delivery at a later date, normally within 15 to 45 days of the trade date.
The Fund may utilize structured notes and similar instruments for investment purposes and also for hedging purposes. Structured notes are privately negotiated debt obligations where the principal and/or interest is determined by reference to the performance of a benchmark asset, market or interest rate (an “embedded index”), such as selected securities, an index of securities or specified interest rates, or the differential performance of two assets or markets.
The Fund may invest in illiquid securities (i.e., securities that are not readily marketable), including, but not limited to, restricted securities (securities the disposition of which is restricted under the federal securities laws), securities that may be resold only pursuant to Rule 144A under the Securities Act of 1933, as amended (the “1933 Act”), and repurchase agreements with maturities in excess of seven days.
The Fund may enter into certain derivative instruments in pursuit of its investment objectives, including to seek to enhance return, to hedge certain risks of its investments in municipal securities or as a substitute for a position in the underlying asset. Such instruments include financial futures contracts, swap contracts (including interest rate swaps, credit default swaps and municipal market data rate locks (“MMD Rate Locks”)), options on financial futures, options on swap contracts or other derivative instruments.
The Fund may also invest in securities of other open- or closed‑end investment companies (including ETFs) that invest primarily in municipal securities of the types in which the Fund may invest directly, to the extent permitted by the Investment Company Act of 1940, as amended (the “1940 Act”), the rules and regulations issued thereunder and applicable exemptive orders issued by the Securities and Exchange Commission (“SEC”).
Use of Leverage
The Fund uses leverage to pursue its investment objectives. The Fund may use leverage to the extent permitted by the 1940 Act. The Fund may source leverage through a number of methods, including borrowings (including loans from financial institutions), issuances of debt securities and issuances of preferred shares of beneficial interest. The Fund may also use other forms of leverage including, but not limited to, reverse repurchase agreements and portfolio investments that have the economic effect of leverage, including, but not limited to, investments in inverse floating rate securities of tender option bond trusts.
Integrated Leverage and Hedging Strategy
The Fund employs an integrated leverage and hedging strategy to seek to enhance its potential current income and longer-term risk-adjusted total return, while seeking to maintain a level of interest rate risk comparable to that of the Bloomberg Barclays Taxable Municipal Long Bond Index (the “Index”). The Fund uses leverage instruments that will have a funding cost based on short- to intermediate-term market interest rates. Because such interest rates are expected to be generally lower than the yields on the long-term bonds in which the Fund invests, the Fund’s sub‑adviser believes that the use of leverage will generally increase common share net income.
The Fund’s leverage and hedging techniques are referred to as integrated because the Fund’s use of hedging strategies is expected to be directly calibrated to any increased interest rate risk, relative to the Fund’s benchmark, due to the use of leverage.
The Fund’s use of derivatives such as bond futures or interest rate swaps in hedging interest rate risk will generate costs that will effectively reduce the Fund’s net asset value (“NAV”). These capital costs may be offset over time by capital appreciation of the Fund’s portfolio. The potential to achieve such capital appreciation will depend largely on the sub‑adviser’s investment capabilities in executing the Fund’s investment strategy as well as the performance of taxable municipal securities relative to the securities underlying the Fund’s hedging instruments. If and to the extent that such capital appreciation does not occur or is less than these hedging costs, however, the Fund’s total returns can be expected to be less than its net earnings (and, over time, distributions).
Temporary Defensive Periods
During temporary defensive periods (e.g., times when, in the Fund’s investment adviser’s and/or the Fund’s sub‑adviser’s opinion, temporary imbalances of supply and demand or other temporary dislocations in the taxable bond market adversely affect the price at which long-term or intermediate-term municipal securities are available), the Fund may invest up to 100% of its Managed Assets in short-term investments, including high quality, short-term securities that may be either tax‑exempt or taxable, or may invest in short-, intermediate-, or long-term U.S. Treasury Bonds.
PRINCIPAL RISKS OF THE FUND
The factors that are most likely to have a material effect on the Fund’s portfolio as a whole are called “principal risks.” The Fund is subject to the principal risks indicated below, whether through direct investment or derivative positions. The Fund may be subject to additional risks other than those identified and described below because the types of investments made by the Fund can change over time.
43
Shareholder Update (Unaudited) (continued)
|
| Risks of Nuveen Taxable Municipal Income Fund (NBB) |
|
| Portfolio Level Risks |
|
| Below Investment Grade Risk |
|
| Build America Bonds (“BABs”) Risk |
|
| Call Risk |
|
| Credit Risk |
|
| Credit Spread Risk |
|
| Deflation Risk |
|
| Defaulted and Distressed Securities Risk |
|
| Derivatives Risk |
|
| Duration Risk |
|
| Economic Sector Risk |
|
| Financial Futures and Options Risk |
|
| Hedging Risk |
|
| Illiquid Investments Risk |
|
| Income Risk |
|
| Inflation Risk |
|
| Insurance Risk |
|
| Interest Rate Risk |
|
| Inverse Floating Rate Securities Risk |
|
| Municipal Securities Market Liquidity Risk |
|
| Municipal Securities Market Risk |
|
| Other Investment Companies Risk |
|
| Reinvestment Risk |
|
| Special Risks Related to Certain Municipal Obligations |
|
| Swap Transactions Risk |
|
| Unrated Securities Risk |
|
| Valuation Risk |
|
| Zero Coupon Bonds Risk |
|
| Fund Level and Other Risks |
|
| Anti-Takeover Provisions |
|
| Counterparty Risk |
|
| Cybersecurity Risk |
|
| Economic and Political Events Risk |
|
| Fund Tax Risk |
|
| Global Economic Risk |
|
| Investment and Market Risk |
|
| Legislation and Regulatory Risk |
|
| Leverage Risk |
|
| Market Discount from Net Asset Value |
|
| Recent Market Conditions |
|
| Reverse Repurchase Agreement Risk |
44
Portfolio Level Risks:
Below Investment Grade Risk. Municipal securities of below investment grade quality are regarded as having speculative characteristics with respect to the issuer’s capacity to pay interest and repay principal, and may be subject to higher price volatility and default risk than investment grade municipal securities of comparable terms and duration. Issuers of lower grade municipal securities may be highly leveraged and may not have available to them more traditional methods of financing. The prices of these lower grade securities are typically more sensitive to negative developments, such as a decline in the issuer’s revenues or a general economic downturn. The secondary market for lower rated municipal securities may not be as liquid as the secondary market for more highly rated municipal securities, a factor which may have an adverse effect on the Fund’s ability to dispose of a particular municipal security. If a below investment grade municipal security goes into default, or its issuer enters bankruptcy, it might be difficult to sell that security in a timely manner at a reasonable price.
Build America Bonds (“BABs”) Risk. BABs are taxable municipal obligations issued pursuant to the American Recovery and Reinvestment Act of 2009 that are subject to federal subsidies of up to 35% of the interest payable on the bonds in the form of direct subsidies to the bond issuer or refundable tax credits to the bond holder. BABs are not guaranteed by the U.S. government or its agencies or instrumentalities. While the federal subsidy continues for the life of the bonds, provided that the issuer continues to meet all applicable program eligibility requirements, there is no assurance that the federal subsidy will be continued at original levels. Under the sequestration process under the Budget Control Act of 2011, automatic spending cuts that became effective on March 1, 2013 reduced the federal subsidy for BABs and other subsidized taxable municipal bonds. The reduced federal subsidy has been extended through 2024. The subsidy payments were reduced by 6.6% in 2018 and 6.2% in 2019. Further decreases in the level of the subsidy may impair the ability of issuers to make interest payments when due.
BABs were an alternative form of financing to state and local governments whose primary means for accessing the capital markets had been through issuance of tax free municipal bonds. Pursuant to the terms of the American Recovery and Reinvestment Act of 2009, the issuance of BABs ceased on December 31, 2010. As a result, the availability of such bonds is limited and there can be no assurance that BABs will be actively traded. The market for the bonds and/or their liquidity may be negatively affected. Changes to the U.S. federal income tax laws may affect the demand for and supply of taxable municipal bonds, including BABs.
BABs involve similar risks as traditional municipal bonds, including credit and market risk. Because certain states, including California, New York, Illinois, Texas and Ohio, were heavy issuers of BABs, the Fund may have a greater exposure to the economic or other factors affecting such states than a more diversified national municipal bond fund. In addition, should a BAB’s issuer fail to continue to meet the applicable requirements, it is possible that such issuer may not receive federal cash subsidy payments, impairing the issuer’s ability to make scheduled interest payments. BABs may be subject to greater reinvestment risk, which is the risk that the Fund is unable to invest in bonds with similar yields, as BABs with attractive above-market purchase yields mature or are called.
Call Risk. The Fund may invest in municipal securities that are subject to call risk. Such municipal securities may be redeemed at the option of the issuer, or “called,” before their stated maturity or redemption date. In general, an issuer will call its instruments if they can be refinanced by issuing new instruments that bear a lower interest rate. The Fund is subject to the possibility that during periods of falling interest rates, an issuer will call its high yielding municipal securities. The Fund would then be forced to invest the unanticipated proceeds at lower interest rates, resulting in a decline in the Fund’s income.
Credit Risk. Issuers of municipal securities in which the Fund may invest may default on their obligations to pay principal or interest when due. This non‑payment would result in a reduction of income to the Fund, a reduction in the value of a municipal security experiencing non‑payment and potentially a decrease in the net asset value (“NAV”) of the Fund. To the extent that the credit rating assigned to a municipal security in the Fund’s portfolio is downgraded, the market price and liquidity of such security may be adversely affected.
Credit Spread Risk. Credit spread risk is the risk that credit spreads (i.e., the difference in yield between securities that is due to differences in their credit quality) may increase when the market believes that municipal securities generally have a greater risk of default. Increasing credit spreads may reduce the market values of the Fund’s securities. Credit spreads often increase more for lower rated and unrated securities than for investment grade securities. In addition, when credit spreads increase, reductions in market value will generally be greater for longer-maturity securities.
Deflation Risk. Deflation risk is the risk that prices throughout the economy decline over time. Deflation may have an adverse effect on the creditworthiness of issuers and may make issuer default more likely, which may result in a decline in the value of the Fund’s portfolio.
Defaulted and Distressed Securities Risk. The Fund may hold investments that at the time of purchase are in default or involved in bankruptcy or insolvency proceedings, or may later become so. Moreover, the Fund may invest in low‑rated securities that, although not in default, may be “distressed,” meaning that the issuer is experiencing financial difficulties or distress at the time of acquisition. Such securities would present a substantial risk of future default which may cause the Fund to incur losses, including additional expenses, to the extent it is required to seek recovery upon a default in the payment of principal or interest on those securities. In any reorganization or liquidation proceeding relating to a portfolio security, the Fund may lose its entire investment or may be required to accept cash or securities with a value less than its original investment. Defaulted or distressed securities may be subject to restrictions on resale.
Derivatives Risk. The use of derivatives involves additional risks and transaction costs which could leave the Fund in a worse position than if it had not used these instruments. Derivative instruments can be used to acquire or to transfer the risk and returns of a municipal security or other asset without buying or selling the municipal security or asset. These instruments may entail investment exposures that are greater than their cost would suggest. As a result, a small investment in derivatives can result in losses that greatly exceed the original investment. Derivatives can be highly volatile, illiquid and difficult to value. An over‑the‑counter derivative transaction between the Fund and a counterparty that is not cleared through a central counterparty also involves the risk that a loss may be sustained as a result of the failure of the counterparty to the contract to make
45
Shareholder Update (Unaudited) (continued)
required payments. The payment obligation for a cleared derivative transaction is guaranteed by a central counterparty, which exposes the Fund to the creditworthiness of the central counterparty. The use of certain derivatives involves leverage, which can cause the Fund’s portfolio to be more volatile than if the portfolio had not been leveraged. Leverage can significantly magnify the effect of price movements of the reference asset, disproportionately increasing the Fund’s losses and reducing the Fund’s opportunities for gains when the reference asset changes in unexpected ways. In some instances, such leverage could result in losses that exceed the original amount invested.
It is possible that regulatory or other developments in the derivatives market, including changes in government regulation, could adversely impact the Fund’s ability to invest in certain derivatives or successfully use derivative instruments.
Duration Risk. Duration is the sensitivity, expressed in years, of the price of a fixed-income security to changes in the general level of interest rates (or yields). Securities with longer durations tend to be more sensitive to interest rate (or yield) changes, which typically corresponds to increased volatility and risk, than securities with shorter durations. For example, if a security or portfolio has a duration of three years and interest rates increase by 1%, then the security or portfolio would decline in value by approximately 3%. Duration differs from maturity in that it considers potential changes to interest rates, and a security’s coupon payments, yield, price and par value and call features, in addition to the amount of time until the security matures. The duration of a security will be expected to change over time with changes in market factors and time to maturity.
Economic Sector Risk. The Fund may invest a significant amount of its total assets in municipal securities in the same economic sector. This may make the Fund more susceptible to adverse economic, political or regulatory occurrences affecting an economic sector, making the Fund more vulnerable to unfavorable developments in that sector than funds that invest more broadly. As the percentage of the Fund’s Managed Assets invested in a particular sector increases, so does the potential for fluctuation in the value of the Fund’s assets. In addition, the Fund may invest a significant portion of its assets in certain sectors of the municipal securities market, such as health care facilities, private educational facilities, special taxing districts and start‑up utility districts, and private activity bonds including industrial development bonds on behalf of transportation companies, whose credit quality and performance may be more susceptible to economic, business, political, regulatory and other developments than other sectors of municipal issuers. If the Fund invests a significant portion of its assets in one or more particular sectors, the Fund’s performance may be subject to additional risk and variability.
Financial Futures and Options Transactions Risk. The Fund may use certain transactions for hedging the portfolio’s exposure to credit risk and the risk of increases in interest rates, which could result in poorer overall performance for the Fund. There may be an imperfect correlation between price movements of the futures and options and price movements of the portfolio securities being hedged.
If the Fund engages in futures transactions or in the writing of options on futures, it will be required to maintain initial margin and maintenance margin and may be required to make daily variation margin payments in accordance with applicable rules of the exchanges and the Commodity Futures Trading Commission (“CFTC”). If the Fund purchases a financial futures contract or a call option or writes a put option in order to hedge the anticipated purchase of municipal securities, and if the Fund fails to complete the anticipated purchase transaction, the Fund may have a loss or a gain on the futures or options transaction that will not be offset by price movements in the municipal securities that were the subject of the anticipatory hedge. There can be no assurance that a liquid market will exist at a time when the Fund seeks to close out a derivatives or futures or a futures option position, and the Fund would remain obligated to meet margin requirements until the position is closed.
Hedging Risk. The Fund’s use of derivatives or other transactions to reduce risk involves costs and will be subject to the investment adviser’s and/or the sub‑adviser’s ability to predict correctly changes in the relationships of such hedge instruments to the Fund’s portfolio holdings or other factors. No assurance can be given that the investment adviser’s and/or the sub‑adviser’s judgment in this respect will be correct, and no assurance can be given that the Fund will enter into hedging or other transactions at times or under circumstances in which it may be advisable to do so. Hedging activities may reduce the Fund’s opportunities for gain by offsetting the positive effects of favorable price movements and may result in net losses.
Illiquid Investments Risk. Illiquid investments are investments that are not readily marketable. These investments may include restricted investments, including Rule 144A securities, which cannot be resold to the public without an effective registration statement under the 1933 Act, or if they are unregistered may be sold only in a privately negotiated transaction or pursuant to an available exemption from registration. The Fund may not be able to readily dispose of such investments at prices that approximate those at which the Fund could sell such investments if they were more widely traded and, as a result of such illiquidity, the Fund may have to sell other investments or engage in borrowing transactions if necessary to raise cash to meet its obligations. Limited liquidity can also affect the market price of investments, thereby adversely affecting the Fund’s NAV and ability to make dividend distributions. The financial markets in general have in recent years experienced periods of extreme secondary market supply and demand imbalance, resulting in a loss of liquidity during which market prices were suddenly and substantially below traditional measures of intrinsic value. During such periods, some investments could be sold only at arbitrary prices and with substantial losses. Periods of such market dislocation may occur again at any time.
Income Risk. The Fund’s income could decline due to falling market interest rates. This is because, in a falling interest rate environment, the Fund generally will have to invest the proceeds from maturing portfolio securities in lower-yielding securities.
Inflation Risk. Inflation risk is the risk that the value of assets or income from investments will be worth less in the future as inflation decreases the value of money. As inflation increases, the real value of the common shares and distributions can decline. Currently, inflation rates are elevated relative to normal market conditions and could continue to increase.
Insurance Risk. The Fund may purchase municipal securities that are secured by insurance, bank credit agreements or escrow accounts. The credit quality of the companies that provide such credit enhancements will affect the value of those securities. Certain significant providers of insurance for municipal securities have incurred significant losses as a result of exposure to sub‑prime mortgages and other lower credit quality investments. As a result, such losses reduced the insurers’ capital and called into question their continued ability to perform their obligations under such insurance if they are called upon to do so in the future. While an insured municipal security will typically be deemed to have the rating of its insurer, if the insurer of a municipal security suffers a downgrade in its credit rating or the market discounts the value of the insurance provided by the insurer,
46
the value of the municipal security would more closely, if not entirely, reflect such rating. In such a case, the value of insurance associated with a municipal security may not add any value. The insurance feature of a municipal security does not guarantee the full payment of principal and interest through the life of an insured obligation, the market value of the insured obligation or the NAV of the common shares represented by such insured obligation.
Interest Rate Risk. Interest rate risk is the risk that municipal securities in the Fund’s portfolio will decline in value because of changes in market interest rates. Generally, when market interest rates rise, the market value of such securities will fall, and vice versa. As interest rates decline, issuers of municipal securities may prepay principal earlier than scheduled, forcing the Fund to reinvest in lower-yielding securities and potentially reducing the Fund’s income. As interest rates increase, slower than expected principal payments may extend the average life of municipal securities, potentially locking in a below-market interest rate and reducing the Fund’s value. In typical market interest rate environments, the prices of longer-term municipal securities generally fluctuate more than prices of shorter-term municipal securities as interest rates change.
Inverse Floating Rate Securities Risk. The Fund may invest in inverse floating rate securities. In general, income on inverse floating rate securities will decrease when short-term interest rates increase and increase when short-term interest rates decrease. Investments in inverse floating rate securities may subject the Fund to the risks of reduced or eliminated interest payments and losses of principal. In addition, inverse floating rate securities may increase or decrease in value at a greater rate than the underlying interest rate, which effectively leverages the Fund’s investment. As a result, the market value of such securities generally will be more volatile than that of fixed rate securities.
The Fund may invest in inverse floating rate securities issued by special purpose trusts that have recourse to the Fund. In such instances, the Fund may be at risk of loss that exceeds its investment in the inverse floating rate securities.
The Fund may be required to sell its inverse floating rate securities at less than favorable prices, or liquidate other Fund portfolio holdings in certain circumstances, including, but not limited to, the following:
| | • | | If the Fund has a need for cash and the securities in a special purpose trust are not actively trading due to adverse market conditions; |
| | • | | If special purpose trust sponsors (as a collective group or individually) experience financial hardship and consequently seek to terminate their respective outstanding special purpose trusts; and |
| | • | | If the value of an underlying security declines significantly and if additional collateral has not been posted by the Fund. |
Municipal Securities Market Liquidity Risk. Inventories of municipal securities held by brokers and dealers have decreased in recent years, lessening their ability to make a market in these securities. This reduction in market making capacity has the potential to decrease the Fund’s ability to buy or sell municipal securities at attractive prices, and increase municipal security price volatility and trading costs, particularly during periods of economic or market stress. In addition, recent federal banking regulations may cause certain dealers to reduce their inventories of municipal securities, which may further decrease the Fund’s ability to buy or sell municipal securities. As a result, the Fund may be forced to accept a lower price to sell a security, to sell other securities to raise cash, or to give up an investment opportunity, any of which could have a negative effect on performance. If the Fund needed to sell large blocks of municipal securities to raise cash to meet its obligations, those sales could further reduce the municipal securities’ prices and hurt performance.
Municipal Securities Market Risk. The amount of public information available about the municipal securities in the Fund’s portfolio is generally less than that for corporate equities or bonds, and the investment performance of the Fund may therefore be more dependent on the analytical abilities of the sub‑adviser than if the Fund were a stock fund or taxable bond fund. The secondary market for municipal securities, particularly below investment grade municipal securities, also tends to be less well-developed or liquid than many other securities markets, which may adversely affect the Fund’s ability to sell its municipal securities at attractive prices.
Other Investment Companies Risk. The Fund may invest in the securities of other investment companies, including ETFs. Investing in an investment company exposes the Fund to all of the risks of that investment company’s investments. The Fund, as a holder of the securities of other investment companies, will bear its pro rata portion of the other investment companies’ expenses, including advisory fees. These expenses are in addition to the direct expenses of the Fund’s own operations. As a result, the cost of investing in investment company shares may exceed the costs of investing directly in its underlying investments. In addition, securities of other investment companies may be leveraged. As a result, the Fund may be indirectly exposed to leverage through an investment in such securities and therefore magnify the Fund’s leverage risk.
With respect to ETF’s, an ETF that is based on a specific index may not be able to replicate and maintain exactly the composition and relative weighting of securities in the index. The value of an ETF based on a specific index is subject to change as the values of its respective component assets fluctuate according to market volatility. ETFs typically rely on a limited pool of authorized participants to create and redeem shares, and an active trading market for ETF shares may not develop or be maintained. The market value of shares of ETFs and closed‑end funds may differ from their NAV.
Reinvestment Risk. Reinvestment risk is the risk that income from the Fund’s portfolio will decline if and when the Fund invests the proceeds from matured, traded or called municipal securities at market interest rates that are below the portfolio’s current earnings rate. A decline in income could affect the common shares’ market price, NAV and/or a common shareholder’s overall returns.
Special Risks Related to Certain Municipal Obligations. Municipal leases and certificates of participation involve special risks not normally associated with general obligations or revenue bonds. Leases and installment purchase or conditional sale contracts (which normally provide for title to the leased asset to pass eventually to the governmental issuer) have evolved as a means for governmental issuers to acquire property and equipment without meeting the constitutional and statutory requirements for the issuance of debt. The debt issuance limitations are deemed to be inapplicable because of the inclusion in many leases or contracts of “non‑appropriation” clauses that relieve the governmental issuer of any obligation to make future payments under the lease or contract unless money is appropriated for such purpose by the appropriate legislative body. In addition, such
47
Shareholder Update (Unaudited) (continued)
leases or contracts may be subject to the temporary abatement of payments in the event that the governmental issuer is prevented from maintaining occupancy of the leased premises or utilizing the leased equipment. Although the obligations may be secured by the leased equipment or facilities, the disposition of the property in the event of non‑appropriation or foreclosure might prove difficult, time consuming and costly, and may result in a delay in recovering or the failure to fully recover the Fund’s original investment. In the event of non‑appropriation, the issuer would be in default and taking ownership of the assets may be a remedy available to the Fund, although the Fund does not anticipate that such a remedy would normally be pursued.
Certificates of participation involve the same risks as the underlying municipal leases. In addition, the Fund may be dependent upon the municipal authority issuing the certificates of participation to exercise remedies with respect to the underlying securities. Certificates of participation also entail a risk of default or bankruptcy, both of the issuer of the municipal lease and also the municipal agency issuing the certificate of participation.
Swap Transactions Risk. The Fund may enter into debt-related derivative instruments such as credit default swap contracts and interest rate swaps. Like most derivative instruments, the use of swaps is a highly specialized activity that involves investment techniques and risks different from those associated with ordinary portfolio securities transactions. In addition, the use of swaps requires an understanding by the adviser and/or the sub‑adviser of not only the referenced asset, rate or index, but also of the swap itself. If the investment adviser and/or the sub‑adviser is incorrect in its forecasts of default risks, market spreads or other applicable factors or events, the investment performance of the Fund would diminish compared with what it would have been if these techniques were not used.
Unrated Securities Risk. The Fund may purchase securities that are not rated by any rating organization. Unrated securities determined by the Fund’s investment adviser to be of comparable quality to rated investments which the Fund may purchase may pay a higher dividend or interest rate than such rated investments and be subject to a greater risk of illiquidity or price changes. Less public information is typically available about unrated investments or issuers than rated investments or issuers. Some unrated securities may not have an active trading market or may be difficult to value, which means the Fund might have difficulty selling them promptly at an acceptable price. To the extent that the Fund invests in unrated securities, the Fund’s ability to achieve its investment objectives will be more dependent on the investment adviser’s credit analysis than would be the case when the Fund invests in rated securities.
Valuation Risk. The municipal securities in which the Fund invests typically are valued by a pricing service utilizing a range of market-based inputs and assumptions, including readily available market quotations obtained from broker-dealers making markets in such instruments, cash flows and transactions for comparable instruments. There is no assurance that the Fund will be able to sell a portfolio security at the price established by the pricing service, which could result in a loss to the Fund. Pricing services generally price municipal securities assuming orderly transactions of an institutional “round lot” size, but some trades may occur in smaller, “odd lot” sizes, often at lower prices than institutional round lot trades. Different pricing services may incorporate different assumptions and inputs into their valuation methodologies, potentially resulting in different values for the same securities. As a result, if the Fund were to change pricing services, or if the Fund’s pricing service were to change its valuation methodology, there could be a material impact, either positive or negative, on the Fund’s NAV.
Zero Coupon Bonds Risk. Because interest on zero coupon bonds is not paid on a current basis, the values of zero coupon bonds will be more volatile in response to interest rate changes than the values of bonds that distribute income regularly. Although zero coupon bonds generate income for accounting purposes, they do not produce cash flow, and thus the Fund could be forced to liquidate securities at an inopportune time in order to generate cash to distribute to shareholders as required by tax laws.
Fund Level and Other Risks:
Anti-Takeover Provisions. The Fund’s organizational documents include provisions that could limit the ability of other entities or persons to acquire control of the Fund or convert the Fund to open‑end status, which are commonly known as “Control Share Acquisition” provisions. Although the application of the “Control Share Acquisition” provisions has currently been suspended, these provisions could have the effect of depriving the common shareholders of opportunities to sell their common shares at a premium over the then-current market price of the common shares.
Counterparty Risk. Changes in the credit quality of the companies that serve as the Fund’s counterparties with respect to derivatives or other transactions supported by another party’s credit will affect the value of those instruments. Certain entities that have served as counterparties in the markets for these transactions have incurred or may incur in the future significant financial hardships including bankruptcy and losses as a result of exposure to sub‑prime mortgages and other lower-quality credit investments. As a result, such hardships have reduced these entities’ capital and called into question their continued ability to perform their obligations under such transactions. By using such derivatives or other transactions, the Fund assumes the risk that its counterparties could experience similar financial hardships. In the event of the insolvency of a counterparty, the Fund may sustain losses or be unable to liquidate a derivatives position.
Cybersecurity Risk. The Fund and its service providers are susceptible to operational and information security risk resulting from cyber incidents. Cyber incidents refer to both intentional attacks and unintentional events including: processing errors, human errors, technical errors including computer glitches and system malfunctions, inadequate or failed internal or external processes, market-wide technical-related disruptions, unauthorized access to digital systems (through “hacking” or malicious software coding), computer viruses, and cyber-attacks which shut down, disable, slow or otherwise disrupt operations, business processes or website access or functionality (including denial of service attacks). Cyber incidents could adversely impact the Fund and cause the Fund to incur financial loss and expense, as well as face exposure to regulatory penalties, reputational damage, and additional compliance costs associated with corrective measures. In addition, substantial costs may be incurred in order to prevent any cyber incidents in the future. Furthermore, the Fund cannot control the cybersecurity plans and systems put in place by its service providers or any other third parties whose operations may affect the Fund.
48
Economic and Political Events Risk. The Fund may be more sensitive to adverse economic, business or political developments if it invests a substantial portion of its assets in the municipal securities of similar projects (such as those relating to the education, health care, housing, transportation, or utilities industries), industrial development bonds, or in particular types of municipal securities (such as general obligation bonds, private activity bonds or moral obligation bonds). Such developments may adversely affect a specific industry or local political and economic conditions, and thus may lead to declines in the creditworthiness and value of such municipal securities.
Fund Tax Risk. The Fund has elected to be treated and intends to qualify each year as a Regulated Investment Company (“RIC”) under the Internal Revenue Code of 1986, as amended (the “Code”). As a RIC, the Fund is not expected to be subject to U.S. federal income tax to the extent that it distributes its investment company taxable income and net capital gains. To qualify for the special tax treatment available to a RIC, the Fund must comply with certain investment, distribution, and diversification requirements. Under certain circumstances, the Fund may be forced to sell certain assets when it is not advantageous in order to meet these requirements, which may reduce the Fund’s overall return. If the Fund fails to meet any of these requirements, subject to the opportunity to cure such failures under applicable provisions of the Code, the Fund’s income would be subject to a double level of U.S. federal income tax. The Fund’s income, including its net capital gain, would first be subject to U.S. federal income tax at regular corporate rates, even if such income were distributed to shareholders and, second, all distributions by the Fund from earnings and profits, including distributions of net capital gain (if any), would be taxable to shareholders as dividends.
Global Economic Risk. National and regional economies and financial markets are becoming increasingly interconnected, which increases the possibilities that conditions in one country, region or market might adversely impact issuers in a different country, region or market. Changes in legal, political, regulatory, tax and economic conditions may cause fluctuations in markets and investments prices around the world, which could negatively impact the value of the Fund’s investments. Major economic or political disruptions, particularly in large economies like China’s, may have global negative economic and market repercussions. Additionally, instability in various countries, such as Afghanistan and Syria, and natural and environmental disasters and the spread of infectious illnesses or other public health emergencies , possible terrorist attacks in the United States and around the world, continued tensions between North Korea and the United States and the international community generally, growing social and political discord in the United States, the European debt crisis, the response of the international community—through economic sanctions and otherwise—further downgrade of U.S. government securities, the change in the U.S. president and the new administration and other similar events may adversely affect the global economy and the markets and issuers in which the Fund invests. Recent examples of such events include the outbreak of a novel coronavirus known as COVID‑19 that was first detected in China in December 2019 and heightened concerns regarding North Korea’s nuclear weapons and long-range ballistic missile programs. In addition, Russia’s recent invasion of Ukraine in February 2022 has resulted in sanctions imposed by several nations, such as the United States, United Kingdom, European Union and Canada. The current sanctions and potential further sanctions may negatively impact certain sectors of Russia’s economy, but also may negatively impact the value of the Fund’s investments that do not have direct exposure to Russia. These events could reduce consumer demand or economic output, result in market closure, travel restrictions or quarantines, and generally have a significant impact on the economy. These events could also impair the information technology and other operational systems upon which the Fund’s service providers, including the Fund’s sub‑adviser, rely, and could otherwise disrupt the ability of employees of the Fund’s service providers to perform essential tasks on behalf of the Fund.
The Fund does not know and cannot predict how long the securities markets may be affected by these events and the effects of these and similar events in the future on the U.S. economy and securities markets. The Fund may be adversely affected by abrogation of international agreements and national laws which have created the market instruments in which the Fund may invest, failure of the designated national and international authorities to enforce compliance with the same laws and agreements, failure of local, national and international organizations to carry out the duties prescribed to them under the relevant agreements, revisions of these laws and agreements which dilute their effectiveness or conflicting interpretation of provisions of the same laws and agreements.
Governmental and quasi-governmental authorities and regulators throughout the world have in the past responded to major economic disruptions with a variety of significant fiscal and monetary policy changes, including but not limited to, direct capital infusions into companies, new monetary programs and dramatically lower interest rates. An unexpected or quick reversal of these policies, or the ineffectiveness of these policies, could increase volatility in securities markets, which could adversely affect the Fund’s investments.
Investment and Market Risk. An investment in common shares is subject to investment risk, including the possible loss of the entire principal amount that you invest. Common shares frequently trade at a discount to their NAV. An investment in common shares represents an indirect investment in the securities owned by the Fund. Common shares at any point in time may be worth less than your original investment, even after taking into account the reinvestment of Fund dividends and distributions.
Legislation and Regulatory Risk. At any time after the date of this report, legislation or additional regulations may be enacted that could negatively affect the assets of the Fund, securities held by the Fund or the issuers of such securities. Fund shareholders may incur increased costs resulting from such legislation or additional regulation. There can be no assurance that future legislation, regulation or deregulation will not have a material adverse effect on the Fund or will not impair the ability of the Fund to achieve its investment objectives.
Leverage Risk. The use of leverage creates special risks for common shareholders, including potential interest rate risks and the likelihood of greater volatility of NAV and market price of, and distributions on, the common shares. The use of leverage in a declining market will likely cause a greater decline in the Fund’s NAV, which may result at a greater decline of the common share price, than if the Fund were not to have used leverage.
The Fund will pay (and common shareholders will bear) any costs and expenses relating to the Fund’s use of leverage, which will result in a reduction in the Fund’s NAV. The investment adviser may, based on its assessment of market conditions and composition of the Fund’s holdings, increase or decrease the amount of leverage. Such changes may impact the Fund’s distributions and the price of the common shares in the secondary market.
49
Shareholder Update (Unaudited) (continued)
The Fund may seek to refinance its leverage over time, in the ordinary course, as current forms of leverage mature or it is otherwise desirable to refinance; however, the form that such leverage will take cannot be predicted at this time. If the Fund is unable to replace existing leverage on comparable terms, its costs of leverage will increase. Accordingly, there is no assurance that the use of leverage may result in a higher yield or return to common shareholders.
The amount of fees paid to the investment adviser and the sub‑adviser for investment advisory services will be higher if the Fund uses leverage because the fees will be calculated based on the Fund’s Managed Assets - this may create an incentive for the investment adviser and the sub‑adviser to leverage the Fund or increase the Fund’s leverage.
Market Discount from Net Asset Value. Shares of closed‑end investment companies like the Fund frequently trade at prices lower than their NAV. This characteristic is a risk separate and distinct from the risk that the Fund’s NAV could decrease as a result of investment activities. Whether investors will realize gains or losses upon the sale of the common shares will depend not upon the Fund’s NAV but entirely upon whether the market price of the common shares at the time of sale is above or below the investor’s purchase price for the common shares. Furthermore, management may have difficulty meeting the Fund’s investment objectives and managing its portfolio when the underlying securities are redeemed or sold during periods of market turmoil and as investors’ perceptions regarding closed‑end funds or their underlying investments change. Because the market price of the common shares will be determined by factors such as relative supply of and demand for the common shares in the market, general market and economic circumstances, and other factors beyond the control of the Fund, the Fund cannot predict whether the common shares will trade at, below or above NAV. The common shares are designed primarily for long-term investors, and you should not view the Fund as a vehicle for short-term trading purposes.
Recent Market Conditions. Periods of unusually high financial market volatility and restrictive credit conditions, at times limited to a particular sector or geographic area, have occurred in the past and may be expected to recur in the future. Some countries, including the United States, have adopted or have signaled protectionist trade measures, relaxation of the financial industry regulations that followed the financial crisis, and/or reductions to corporate taxes. The scope of these policy changes is still developing, but the equity and debt markets may react strongly to expectations of change, which could increase volatility, particularly if a resulting policy runs counter to the market’s expectations. The outcome of such changes cannot be foreseen at the present time. In addition, geopolitical and other risks, including environmental and public health risks, may add to instability in the world economy and markets generally. As a result of increasingly interconnected global economies and financial markets, the value and liquidity of the Fund’s investments may be negatively affected by events impacting a country or region, regardless of whether the Fund invests in issuers located in or with significant exposure to such country or region.
Ukraine has experienced ongoing military conflict, most recently in February 2022 when Russia invaded Ukraine; this conflict may expand and military attacks could occur elsewhere in Europe. Europe has also been struggling with mass migration from the Middle East and Africa. The ultimate effects of these events and other socio-political or geographical issues are not known but could profoundly affect global economies and markets.
The ongoing trade war between China and the United States, including the imposition of tariffs by each country on the other country’s products, has created a tense political environment. These actions may trigger a significant reduction in international trade, the oversupply of certain manufactured goods, substantial price reductions of goods and possible failure of individual companies and/or large segments of China’s export industry, which could have a negative impact on the Fund’s performance. U.S. companies that source material and goods from China and those that make large amounts of sales in China would be particularly vulnerable to an escalation of trade tensions. Uncertainty regarding the outcome of the trade tensions and the potential for a trade war could cause the U.S. dollar to decline against safe haven currencies, such as the Japanese yen and the euro. Events such as these and their consequences are difficult to predict and it is unclear whether further tariffs may be imposed or other escalating actions may be taken in the future.
Recently the U.S. Federal Reserve (the “Fed”) has sharply raised interest rates and has signaled an intention to continue to do so until current inflation levels re‑align with the Fed’s long-term inflation target. Changing interest rate environments impact the various sectors of the economy in different ways. For example, in March 2023, the Federal Deposit Insurance Corporation (“FDIC”) was appointed receiver for each of Silicon Valley Bank and Signature Bank, the second- and third-largest bank failures in U.S. history, which failures may be attributable, in part, to rising interest rates. Bank failures may have a destabilizing impact on the broader banking industry or markets generally.
The impact of these developments in the near- and long-term is unknown and could have additional adverse effects on economies, financial markets and asset valuations around the world.
Reverse Repurchase Agreement Risk. A reverse repurchase agreement, in economic essence, constitutes a securitized borrowing by the Fund from the security purchaser. The Fund may enter into reverse repurchase agreements for the purpose of creating a leveraged investment exposure and, as such, their usage involves essentially the same risks associated with a leveraging strategy generally since the proceeds from these agreements may be invested in additional portfolio securities. Reverse repurchase agreements tend to be short-term in tenor, and there can be no assurances that the purchaser (lender) will commit to extend or “roll” a given agreement upon its agreed-upon repurchase date or an alternative purchaser can be identified on similar terms. Reverse repurchase agreements also involve the risk that the purchaser fails to return the securities as agreed upon, files for bankruptcy or becomes insolvent. The Fund may be restricted from taking normal portfolio actions during such time, could be subject to loss to the extent that the proceeds of the agreement are less than the value of securities subject to the agreement and may experience adverse tax consequences.
50
EFFECTS OF LEVERAGE
The following table is furnished in response to requirements of the SEC. It is designed to illustrate the effects of leverage through the use of senior securities, as that term is defined under Section 18 of the 1940 Act, as well as certain other forms of leverage, such as reverse repurchase agreements and investments in inverse floating rate securities, on common share total return, assuming investment portfolio total returns (consisting of income and changes in the value of investments held in the Fund’s portfolio) of ‑10%, ‑5%, 0%, 5% and 10%. The table below reflects each Fund’s (i) continued use of leverage as of March 31, 2023 as a percentage of Managed Assets (including assets attributable to such leverage), (ii) the estimated annual effective interest expense rate payable by the Fund on such instruments (based on actual leverage costs incurred during the fiscal year ended March 31, 2023) as set forth in the table, and (iii) the annual return that the Fund’s portfolio must experience (net of expenses) in order to cover such costs of leverage based on such estimated annual effective interest expense rate. The information below does not reflect any Fund’s use of certain other forms of economic leverage achieved through the use of certain derivative instruments.
The numbers are merely estimates, used for illustration. The costs of leverage may vary frequently and may be significantly higher or lower than the estimated rate. The assumed investment portfolio returns in the table below are hypothetical figures and are not necessarily indicative of the investment portfolio returns experienced or expected to be experienced by the Fund. Your actual returns may be greater or less than those appearing below.
| | |
| Risk | | Nuveen Taxable
Municipal Income
Fund (NBB) |
| Estimated Leverage as a Percentage of Managed Assets (Including Assets Attributable to Leverage) | | 39.50% |
| |
| Estimated Annual Effective Leverage Expense Rate Payable by Fund on Leverage | | 3.26% |
| |
| Annual Return Fund Portfolio Must Experience (net of expenses) to Cover Estimated Annual Effective Interest Expense Rate on Leverage | | 1.29% |
| |
| Common Share Total Return for (10.00)% Assumed Portfolio Total Return | | -18.66% |
| |
| Common Share Total Return for (5.00)% Assumed Portfolio Total Return | | -10.39% |
| |
| Common Share Total Return for 0.00% Assumed Portfolio Total Return | | -2.13% |
| |
| Common Share Total Return for 5.00% Assumed Portfolio Total Return | | 6.14% |
| |
| Common Share Total Return for 10.00% Assumed Portfolio Total Return | | 14.40% |
Common Share total return is composed of two elements — the distributions paid by the Fund to holders of common shares (the amount of which is largely determined by the net investment income of the Fund after paying dividend payments on any preferred shares issued by the Fund and expenses on any forms of leverage outstanding) and gains or losses on the value of the securities and other instruments the Fund owns. As required by SEC rules, the table assumes that the Fund is more likely to suffer capital losses than to enjoy capital appreciation. For example, to assume a total return of 0%, the Fund must assume that the income it receives on its investments is entirely offset by losses in the value of those investments. This table reflects hypothetical performance of the Fund’s portfolio and not the actual performance of the Fund’s common shares, the value of which is determined by market forces and other factors. Should the Fund elect to add additional leverage to its portfolio, any benefits of such additional leverage cannot be fully achieved until the proceeds resulting from the use of such leverage have been received by the Fund and invested in accordance with the Fund’s investment objectives and policies. As noted above, the Fund’s willingness to use additional leverage, and the extent to which leverage is used at any time, will depend on many factors.
51
Shareholder Update (Unaudited) (continued)
DIVIDEND REINVESTMENT PLAN
Nuveen Closed‑End Funds Automatic Reinvestment Plan
Your Nuveen Closed‑End Fund allows you to conveniently reinvest distributions in additional Fund shares. By choosing to reinvest, you’ll be able to invest money regularly and automatically, and watch your investment grow through the power of compounding. Just like distributions in cash, there may be times when income or capital gains taxes may be payable on distributions that are reinvested. It is important to note that an automatic reinvestment plan does not ensure a profit, nor does it protect you against loss in a declining market.
Easy and convenient
To make recordkeeping easy and convenient, each month you’ll receive a statement showing your total distributions, the date of investment, the shares acquired and the price per share, and the total number of shares you own.
How shares are purchased
The shares you acquire by reinvesting will either be purchased on the open market or newly issued by the Fund. If the shares are trading at or above NAV at the time of valuation, the Fund will issue new shares at the greater of the NAV or 95% of the then-current market price. If the shares are trading at less than NAV, shares for your account will be purchased on the open market. If Computershare Trust Company, N.A. (the “Plan Agent”) begins purchasing Fund shares on the open market while shares are trading below NAV, but the Fund’s shares subsequently trade at or above their NAV before the Plan Agent is able to complete its purchases, the Plan Agent may cease open-market purchases and may invest the uninvested portion of the distribution in newly-issued Fund shares at a price equal to the greater of the shares’ NAV or 95% of the shares’ market value on the last business day immediately prior to the purchase date. Distributions received to purchase shares in the open market will normally be invested shortly after the distribution payment date. No interest will be paid on distributions awaiting reinvestment. Because the market price of the shares may increase before purchases are completed, the average purchase price per share may exceed the market price at the time of valuation, resulting in the acquisition of fewer shares than if the distribution had been paid in shares issued by the Fund. A pro rata portion of any applicable brokerage commissions on open market purchases will be paid by Dividend Reinvestment Plan (the “Plan”) participants. These commissions usually will be lower than those charged on individual transactions.
Flexible
You may change your distribution option or withdraw from the Plan at any time, should your needs or situation change. You can reinvest whether your shares are registered in your name, or in the name of a brokerage firm, bank, or other nominee. Ask your investment advisor if his or her firm will participate on your behalf. Participants whose shares are registered in the name of one firm may not be able to transfer the shares to another firm and continue to participate in the Plan. The Fund reserves the right to amend or terminate the Plan at any time. Although the Fund reserves the right to amend the Plan to include a service charge payable by the participants, there is no direct service charge to participants in the Plan at this time.
Call today to start reinvesting distributions
For more information on the Nuveen Automatic Reinvestment Plan or to enroll in or withdraw from the Plan, speak with your financial professional or call us at (800) 257‑8787.
52
CHANGES OCCURRING DURING THE FISCAL YEAR
The following information in this annual report is a summary of certain changes during the most recent fiscal year. This information may not reflect all of the changes that have occurred since you purchased shares of the Fund.
During the most recent fiscal year, there have been no changes to: (i) the Fund’s investment objectives and principal investment policies that have not been approved by shareholders, (ii) the principal risks of the Fund, (iii) the portfolio managers of the Fund; (iv) the Fund’s charter or by‑laws that would delay or prevent a change of control of the Fund that have not been approved by shareholders except as follows:
Principal Risks
The following risk factor was added as principal risk of the Fund:
Economic Sector Risk. The Fund may invest a significant amount of its total assets in municipal securities in the same economic sector. This may make the Fund more susceptible to adverse economic, political or regulatory occurrences affecting an economic sector making the Fund more vulnerable to unfavorable developments in that sector than funds that invest more broadly. As the percentage of the Fund’s Managed Assets invested in a particular sector increases, so does the potential for fluctuation in the value of the Fund’s assets. In addition, the Fund may invest a significant portion of its assets in certain sectors of the municipal securities market, such as health care facilities, private educational facilities, special taxing districts and start‑up utility districts, and private activity bonds including industrial development bonds on behalf of transportation companies, whose credit quality and performance may be more susceptible to economic, business, political, regulatory and other developments than other sectors of municipal issuers. If the Fund invests a significant portion of its assets in one or more particular sectors, the Fund’s performance may be subject to additional risk and variability.
The following principal risk was consolidated into the newly added risk factor entitled, “Economic Sector Risk,” and is therefore no longer included as stand-alone principal risk:
Sector and Industry Risk. Subject to the concentration limits of the Fund’s investment policies and guidelines, the Fund may invest a significant portion of its net assets in certain sectors of the municipal securities market, such as hospitals and other health care facilities, charter schools and other private educational facilities, special taxing districts and start‑up utility districts, and private activity bonds including industrial development bonds on behalf of transportation companies such as airline companies, whose credit quality and performance may be more susceptible to economic, business, political, regulatory and other developments than other sectors of municipal issuers. If the Fund invests a significant portion of its net assets in the sectors noted above, the Fund’s performance may be subject to additional risk and variability.
The principal risk entitled “Tax Risk” was renamed as “Fund Tax Risk.”
Portfolio Managers
Effective April 10, 2023, Kristen M. DeJong was added as portfolio manager of the Fund. John V. Miller will retire from Nuveen on June 1, 2023 and will continue to serve as a portfolio manager until that time. Daniel J. Close will continue to serve as portfolio manager of the Fund. Kristen M. DeJong’s description is presented below:
Kristen M. DeJong, CFA, is Managing Director and Portfolio Manager at Nuveen Asset Management. She began her career in the financial services industry in 2005 and joined Nuveen Asset Management in 2008. She served as a research associate at Nuveen in the wealth management services area and then as a senior research analyst for Nuveen Asset Management’s municipal fixed income team before assuming portfolio management responsibilities in 2021.
Developments Regarding the Funds’ Control Share By‑Law
On October 5, 2020, the Fund and certain other closed‑end funds in the Nuveen fund complex amended their by‑laws. Among other things, the amended by‑laws included provisions pursuant to which, in summary, a shareholder who obtains beneficial ownership of common shares in a Control Share Acquisition (as defined in the by‑laws) shall have the same voting rights as other common shareholders only to the extent authorized by the other disinterested shareholders (the “Control Share By‑Law”). On January 14, 2021, a shareholder of certain Nuveen closed‑end funds filed a civil complaint in the U.S. District Court for the Southern District of New York (the “District Court”) against certain Nuveen funds and their trustees, seeking a declaration that such funds’ Control Share By‑Laws violate the 1940 Act, rescission of such fund’s Control Share By‑Laws and a permanent injunction against such funds applying the Control Share By‑Laws. On February 18, 2022, the District Court granted judgment in favor of the plaintiff’s claim for rescission of such funds’ Control Share By‑Laws and the plaintiff’s declaratory judgment claim, and declared that such funds’ Control Share By‑Laws violate Section 18(i) of the 1940 Act. Following review of the judgment of the District Court, on February 22, 2022, the Board amended the Funds’ bylaws to provide that the Funds’ Control Share By‑Law shall be of no force and effect for so long as the judgment of the District Court is effective and that if the judgment of the District Court is reversed, overturned, vacated, stayed, or otherwise nullified, the Funds’ Control Share By‑Law will be automatically reinstated and apply to any beneficial owner of common shares acquired in a Control Share Acquisition, regardless of whether such Control Share Acquisition occurs before or after such reinstatement, for the duration of the stay or upon issuance of the mandate reversing, overturning, vacating or otherwise nullifying the judgment of the District Court. On February 25, 2022, the Board and the Funds appealed the District Court’s decision to the U.S. Court of Appeals for the Second Circuit.
53
Shareholder Update (Unaudited) (continued)
UPDATED DISCLOSURES FOR THE FUND’S EFFECTIVE SHELF OFFERING REGISTRATION STATEMENT
The following includes additional disclosures for the Fund in this annual report with an effective shelf offering registration statement as of the fiscal year ended March 31, 2023.
SUMMARY OF FUND EXPENSES
The purpose of the tables and the examples below are to help you understand all fees and expenses that you, as a common shareholder, would bear directly or indirectly. The tables show the expenses of the Fund as a percentage of the average net assets applicable to Common Shares and not as a percentage of total assets or managed assets.
| | | | |
| Shareholder Transaction Expenses | | | |
| | |
| Maximum Sales Charge (as a percentage of offering price | | | 4.00%(1) | |
| |
Dividend Reinvestment Plan Fees(2) | | | $2.50 | |
| | |
| (1) | A maximum sales charge of 4.00% applies only to offerings pursuant to a syndicated underwriting. The maximum sales charge for offerings made at‑the‑market is 1.00%. There is no sales charge for offerings pursuant to a private transaction. |
| (2) | You will be charged a $2.50 service charge and pay brokerage charges if you direct Computershare Inc. and Computershare Trust Company, N.A., as agent for the common shareholders, to sell your Common Shares held in a dividend reinvestment account. |
| | | | |
| Annual Expenses | | As a Percentage of Net Assets
Attributable
to Common Shares (1) | |
| | |
| Management Fees | | | 0.98% | |
| |
Interest and Other Related Expenses(2) | | | 1.57% | |
| |
Other Expenses(3) | | | 0.08% | |
| | |
| Total Annual Expenses | | | 2.63% | |
| | |
| (1) | Stated as percentages of average net assets attributable to Common Shares for the fiscal year ended March 31, 2023. |
| (2) | Interest and Other Related Expenses reflect actual expenses and fees for leverage incurred by a Fund for the fiscal year ended March 31, 2023. The types of leverage used by each Fund during the fiscal year ended March 31, 2023 are described in the Fund Leverage and the Notes to Financial Statements (Note 4 – Portfolio Securities and Investments in Derivatives, Inverse Floating Rate Securities, Note 5 – Fund Shares, Preferred Shares and Note 9 – Borrowing Arrangements) sections of this annual report. Actual Interest and Other Related Expenses incurred in the future may be higher or lower. If short-term market interest rates rise in the future, and if a Fund continues to maintain leverage, the cost of which is tied to short-term interest rates, a Fund’s interest expenses on its short-term borrowings can be expected to rise in tandem. A Fund’s use of leverage will increase the amount of management fees paid to the Fund’s adviser and sub‑advisor(s). |
| (3) | Other Expenses are based on estimated amounts for the current fiscal year. Expenses attributable to the Fund’s investments, if any, in other investment companies are currently estimated not to exceed 0.01%. |
54
Examples
The following examples illustrate the expenses, including the applicable transaction fees (referred to as the “Maximum Sales Charge” in the Shareholder Transaction Expenses table above), if any, that a common shareholder would pay on a $1,000 investment that is held for the time periods provided in the table. Each example assumes that all dividends and other distributions are reinvested in the Fund and that the Fund’s Annual Expenses, as provided above, remain the same. The examples also assume a 5% annual return. Actual expenses may be greater or less than those assumed. Moreover, the Fund’s actual rate of return may be greater or less than the hypothetical 5% return shown in the examples.
Example # 1 (At‑the‑Market Transaction)
The following example assumes a transaction fee of 1.00%, as a percentage of the offering price.
| | | | | | | | | | | | | | |
| 1 Year | | | 3 Years | | | 5 Years | | | 10 Years | |
| | | |
| | $36 | | | | $91 | | | | $148 | | | | $303 | |
| | | |
Example # 2 (Underwriting Syndicate Transaction)
The following example assumes a transaction fee of 4.00%, as a percentage of the offering price.
| | | | | | | | | | | | | | |
| 1 Year | | | 3 Years | | | 5 Years | | | 10 Years | |
| | | |
| | $66 | | | | $118 | | | | $174 | | | | $325 | |
| | | |
Example # 3 (Privately Negotiated Transaction)
The following example assumes there is no transaction fee.
| | | | | | | | | | | | | | |
| 1 Year | | | 3 Years | | | 5 Years | | | 10 Years | |
| | | |
| | $27 | | | | $82 | | | | $140 | | | | $296 | |
| | | |
The examples should not be considered a representation of future expenses. Actual expenses may be greater or less than those shown above.
55
Shareholder Update (Unaudited) (continued)
TRADING AND NET ASSET VALUE INFORMATION
The following table shows for the periods indicated: (i) the high and low sales prices for the Common Shares reported as of the end of the day on the NYSE, (ii) the high and low net asset value (NAV) of the Common Shares, and (iii) the high and low of the premium/(discount) to NAV (expressed as a percentage) of shares of the Common Shares.
| | | | | | | | | | | | | | | | | | | | | | | | |
| | | Market Price | | | NAV | | | Premium/(Discount) to NAV | |
| | | | | | | | | | | | |
| | | | | | |
Fiscal Quarter End | | High | | | Low | | | High | | | Low | | | High | | | Low | |
| | |
| | | | | | |
| March 2023 | | | $17.01 | | | | $15.76 | | | | $17.39 | | | | $16.27 | | | | (0.77)% | | | | (6.36)% | |
| | | | | | |
| December 2022 | | | $16.66 | | | | $14.72 | | | | $16.93 | | | | $15.30 | | | | 0.06% | | | | (6.15)% | |
| | | | | | |
| September 2022 | | | $18.72 | | | | $15.37 | | | | $18.44 | | | | $16.24 | | | | 3.69% | | | | (6.22)% | |
| | | | | | |
| June 2022 | | | $19.88 | | | | $16.35 | | | | $19.99 | | | | $17.34 | | | | 2.89% | | | | (7.84)% | |
| | | | | | |
| March 2022 | | | $22.70 | | | | $18.92 | | | | $22.58 | | | | $19.82 | | | | 1.40% | | | | (7.88)% | |
| | | | | | |
| December 2021 | | | $23.12 | | | | $22.02 | | | | $23.12 | | | | $22.47 | | | | 1.63% | | | | (3.13)% | |
| | | | | | |
| September 2021 | | | $23.69 | | | | $22.79 | | | | $23.51 | | | | $22.75 | | | | 1.95% | | | | (1.66)% | |
| | | | | | |
| June 2021 | | | $23.40 | | | | $22.42 | | | | $23.05 | | | | $22.20 | | | | 1.83% | | | | (0.09)% | |
| | |
The following table shows, as of March 31, 2023 the Fund’s: (i) NAV per Common Share, (ii) market price, (iii) percentage of premium/(discount) to NAV per Common Share and, (iv) net assets attributable to Common Shares.
| | | | |
| March 31, 2023 | | | |
| | |
| |
| NAV per Common Share | | | $ 17.04 | |
| |
| Market Price | | | $ 16.12 | |
| |
| Percentage of Premium/(Discount) to NAV per Common Share | | | (5.40)% | |
| |
| Net Assets Attributable to Common Shares | | | $ 500,777,400 | |
| | |
Shares of closed‑end investment companies, including the Fund, may frequently trade at prices lower than NAV, the Fund’s Board of Trustees (Board) has currently determined that, at least annually, it will consider action that might be taken to reduce or eliminate any material discount from NAV in respect of Common Shares, which may include the repurchase of such shares in the open market or in private transactions, the making of a tender offer for such shares at NAV, or the conversion of the Fund to an open‑end investment company. The Fund cannot assure you that its Board will decide to take any of these actions, or that share repurchases or tender offers will actually reduce market discount.
SENIOR SECURITIES
The following table sets forth information regarding the Fund’s outstanding senior securities as of the end of the Fund’s last ten fiscal periods, as applicable. The Fund’s senior securities during this time period are comprised of borrowings that constitute “senior securities” as defined in the Investment Company Act of 1940, as amended (1940 Act). The information in this table as of and for the fiscal years ended 2023 through 2015 has been audited by KPMG LLP, independent registered public accounting firm. The information with respect to the fiscal years ended prior to 2015, where applicable, has been audited by other auditors. The Funds’ audited financial statements, including the report of KPMG LLP thereon, and accompanying notes thereto, are included in this Annual Report.
56
| | | | | | | | |
| | | Borrowings Outstanding at the End of Period | |
| | |
| Year Ended 3/31: | | Aggregate Amount Outstanding (000)(1) | | | Asset Coverage Per $1,000(2) | |
| | |
| | |
| 2023 | | | $ 0 | | | | $ 0 | |
| | |
| 2022 | | | 0 | | | | 0 | |
| | |
| 2021 | | | 0 | | | | 0 | |
| | |
| 2020 | | | 0 | | | | 0 | |
| | |
| 2019 | | | 0 | | | | 0 | |
| | |
| 2018 | | | 90,175 | | | | 7,445 | |
| | |
| 2017 | | | 90,175 | | | | 7,281 | |
| | |
| 2016 | | | 89,500 | | | | 7,532 | |
| | |
| 2015 | | | 89,500 | | | | 7,839 | |
| | |
| 2014 | | | 89,000 | | | | 7,379 | |
| | |
| (1) | Aggregate Amount Outstanding: Aggregate amount outstanding represents the liquidation preference as of the end of the relevant fiscal year and does not include any preferred shares noticed for redemption as noted on the Statement of Assets and Liabilities where applicable. |
| (2) | Asset Coverage Per $1,000: Asset coverage per $1,000 is calculated by subtracting the Fund’s liabilities and indebtedness not represented by senior securities from the Fund’s total assets, dividing the result by the aggregate amount of the Fund’s senior securities representing indebtedness then outstanding (if applicable,) plus the aggregate of the involuntary liquidation preference of the outstanding preferred shares, if applicable, and multiplying the result by 1,000. |
UNRESOLVED STAFF COMMENTS
The Fund believes that there are no material unresolved written comments, received 180 days or more before March 31, 2023, from the Staff of the Securities and Exchange Commission (SEC) regarding any of its periodic or current reports under the Securities Exchange Act or the Investment Company Act of 1940, or its registration statement.
57
Important Tax Information
(Unaudited)
As required by the Internal Revenue Code and Treasury Regulations, certain tax information, as detailed below, must be provided to shareholders. Shareholders are advised to consult their tax advisor with respect to the tax implications of their investment. The amounts listed below may differ from the actual amounts reported on Form 1099‑DIV, which will be sent to shareholders shortly after calendar year end.
Long-Term Capital Gains
As of year end, the Fund designates the following distribution amounts, or maximum amount allowable, as being from net long-term capital gains pursuant to Section 852(b)(3) of the Internal Revenue Code:
| | | | |
| Fund | | Net Long‑Term Capital Gains | |
| | |
| NBB | | | $– | |
| | |
Qualified Interest Income (QII)
The Fund listed below had the following percentage, or maximum amount allowable, of ordinary income distributions treated as qualified interest income and/or short-term capital gain dividends pursuant to Section 871(k) of the Internal Revenue Code:
| | | | | | | | |
| Fund | | Prior Year End to 12/31 Percentage | | | 1/1 to Current Year End Percentage | |
| | |
| NBB | | | 100.0% | | | | 100.0% | |
| | |
163(j)
The Fund listed below had the following percentage, or maximum amount allowable, of ordinary dividends treated as Section 163(j) interest dividends pursuant to Section 163(j) of the Internal Revenue Code:
| | | | |
| Fund | | Percentage | |
| | |
| NBB | | | 90.7% | |
| | |
58
Additional Fund Information
(Unaudited)
| | | | | | | | | | |
| Board of Trustees | | | | | | | | | | |
| | | | | |
| Jack B. Evans | | William C. Hunter | | Amy B.R. Lancellotta | | Joanne T. Medero | | Albin F. Moschner | | John K. Nelson |
| | | | | |
| Matthew Thornton III | | Terence J. Toth | | Margaret L. Wolff | | Robert L. Young | | | | |
| | | | | | | | |
| Investment Adviser | | Custodian | | Legal Counsel | | Independent Registered | | Transfer Agent and |
| | | | |
| Nuveen Fund Advisors, LLC | | State Street Bank | | Chapman and Cutler | | Public Accounting Firm | | Shareholder Services |
| | | | |
| 333 West Wacker Drive | | & Trust Company | | LLP | | KPMG LLP | | Computershare Trust Company, |
| | | | |
| Chicago, IL 60606 | | One Congress Street | | Chicago, IL 60603 | | 200 East Randolph Street | | N.A. |
| | | | |
| | Suite 1 | | | | Chicago, IL 60601 | | 150 Royall Street |
| | | | |
| | Boston, MA 02114-2016 | | | | | | Canton, MA 02021 |
| | | | |
| | | | | | | | (800) 257‑8787 |
Portfolio of Investments Information The Fund is required to file its complete schedule of portfolio holdings with the Securities and Exchange Commission (SEC) for the first and third quarters of each fiscal year as an exhibit to its report on Form N‑PORT. You may obtain this information on the SEC’s website at http://www.sec.gov.
Nuveen Funds’ Proxy Voting Information You may obtain (i) information regarding how each fund voted proxies relating to portfolio securities held during the most recent twelve-month period ended June 30, without charge, upon request, by calling Nuveen toll-free at (800) 257‑8787 or on Nuveen’s website at www.nuveen.com and (ii) a description of the policies and procedures that each fund used to determine how to vote proxies relating to portfolio securities without charge, upon request, by calling Nuveen toll-free at (800) 257‑8787. You may also obtain this information directly from the SEC. Visit the SEC on‑line at http://www.sec.gov.
CEO Certification Disclosure The Fund’s Chief Executive Officer (CEO) has submitted to the New York Stock Exchange (NYSE) the annual CEO certification as required by Section 303A.12(a) of the NYSE Listed Company Manual. The Fund has filed with the SEC the certification of its CEO and Chief Financial Officer required by Section 302 of the Sarbanes-Oxley Act.
Common Share Repurchases The Fund intends to repurchase, through its open-market share repurchase program, shares of its own common stock at such times and in such amounts as is deemed advisable. During the period covered by this report, the Fund repurchased shares of its common stock as shown in the accompanying table. Any future repurchases will be reported to shareholders in the next annual or semi-annual report.
| | | | |
| | | NBB | |
| | |
| Common shares repurchased | | | 0 | |
| | |
FINRA BrokerCheck: The Financial Industry Regulatory Authority (FINRA) provides information regarding the disciplinary history of FINRA member firms and associated investment professionals. This information as well as an investor brochure describing FINRA BrokerCheck is available to the public by calling the FINRA BrokerCheck Hotline number at (800) 289‑9999 or by visiting www.FINRA.org.
59
Glossary of Terms Used in this Report
(Unaudited)
Average Annual Total Return: This is a commonly used method to express an investment’s performance over a particular, usually multi-year time period. It expresses the return that would have been necessary each year to equal the investment’s actual cumulative performance (including change in NAV or offer price and reinvested dividends and capital gains distributions, if any) over the time period being considered.
Effective Leverage: Effective leverage is a fund’s effective economic leverage, and includes both regulatory leverage (see leverage) and the leverage effects of certain derivative investments in a fund’s portfolio. Currently, the leverage effects of Tender Option Bond (TOB) inverse floater holdings are included in effective leverage values, in addition to any regulatory leverage.
Gross Domestic Product (GDP): The total market value of all final goods and services produced in a country/region in a given year, equal to total consumer, investment and government spending, plus the value of exports, minus the value of imports.
Inverse Floating Rate Securities: Inverse floating rate securities are the residual interest in a tender option bond (TOB) trust, sometimes referred to as “inverse floaters”, are created by depositing a municipal bond, typically with a fixed interest rate, into a special purpose trust. This trust, in turn, (a)issues floating rate certificates typically paying short-term tax‑exempt interest rates to third parties in amounts equal to some fraction of the deposited bond’s par amount or market value, and (b) issues an inverse floating rate certificate (sometimes referred to as an “inverse floater”) to an investor (such as a fund) interested in gaining investment exposure to a long-term municipal bond. The income received by the holder of the inverse floater varies inversely with the short-term rate paid to the floating rate certificates’ holders, and in most circumstances the holder of the inverse floater bears substantially all of the underlying bond’s downside investment risk. The holder of the inverse floater typically also benefits disproportionately from any potential appreciation of the underlying bond’s value. Hence, an inverse floater essentially represents an investment in the underlying bond on a leveraged basis.
Leverage: Leverage is created whenever a fund has investment exposure (both reward and/or risk) equivalent to more than 100% of the investment capital.
Net Asset Value (NAV) Per Share: A fund’s Net Assets is equal to its total assets (securities, cash, accrued earnings and receivables) less its total liabilities. NAV per share is equal to the fund’s Net Assets divided by its number of shares outstanding.
Pre‑Refunded Bond/Pre‑Refunding: Pre‑Refunded Bond/Pre‑Refunding, also known as advanced refundings or refinancings, is a procedure used by state and local governments to refinance municipal bonds to lower interest expenses. The issuer sells new bonds with a lower yield and uses the proceeds to buy U.S. Treasury securities, the interest from which is used to make payments on the higher-yielding bonds. Because of this collateral, pre‑refunding generally raises a bond’s credit rating and thus its value.
Regulatory Leverage: Regulatory leverage consists of preferred shares issued by or borrowings of a fund. Both of these are part of a fund’s capital structure. Regulatory leverage is subject to asset coverage limits set in the Investment Company Act of 1940.
Tax Obligation/General Bonds: Bonds backed by the general revenues of an issuer, including taxes, where the issuer has the ability to increase taxes by an unlimited amount to pay the bonds back.
Tax Obligation/Limited Bonds: Bonds backed by the general revenues of an issuer, including taxes, where the issuer doesn’t have the ability to increase taxes by an unlimited amount to pay the bonds back.
Total Investment Exposure: Total investment exposure is a fund’s assets managed by the Adviser that are attributable to financial leverage. For these purposes, financial leverage includes a fund’s use of preferred stock and borrowings and investments in the residual interest certificates (also called inverse floating rate securities) in tender option bond (TOB) trusts, including the portion of assets held by a TOB trust that has been effectively financed by the trust’s issuance of floating rate securities.
60
Board Members & Officers
(Unaudited)
The management of the Funds, including general supervision of the duties performed for the Funds by the Adviser, is the responsibility of the Board of Trustees of the Funds. None of the trustees who are not “interested” persons of the Funds (referred to herein as “independent board members”) has ever been a director or employee of, or consultant to, Nuveen or its affiliates. The names and business addresses of the trustees and officers of the Funds, their principal occupations and other affiliations during the past five years, the number of portfolios each Trustee oversees and other directorships they hold are set forth below.
| | | | | | | | |
Name, Year of Birth & Address | | Position(s) Held with the Funds | | Year First Elected or Appointed and Term(1) | | Principal Occupation(s) Including other Directorships During Past 5 Years | | Number of Portfolios in Fund Complex Overseen By Board Member |
|
| Independent Trustees: |
| | | | |
Terence J. Toth 1959 333 W. Wacker Drive Chicago, IL 60606 | | Chair and Board Member | | 2008 Class II | | Formerly, a Co‑Founding Partner, Promus Capital (investment advisory firm) (2008-2017); formerly, Director, Quality Control Corporation (manufacturing) (2012-2021); Chair of the Board of the Kehrein Center for the Arts (philanthropy) (since 2021); member: Catalyst Schools of Chicago Board (since 2008) and Mather Foundation Board (philanthropy) (since 2012), formerly, Chair of its Investment Committee (2017-2022); formerly, Member, Chicago Fellowship Board (philanthropy) (2005-2016); formerly, Director, Fulcrum IT Services LLC (information technology services firm to government entities) (2010-2019); formerly, Director, LogicMark LLC (health services) (2012-2016); formerly, Director, Legal & General Investment Management America, Inc. (asset management) (2008-2013); formerly, CEO and President, Northern Trust Global Investments (financial services) (2004-2007); Executive Vice President, Quantitative Management & Securities Lending (2000-2004); prior thereto, various positions with Northern Trust Company (financial services) (since 1994); formerly, Member, Northern Trust Mutual Funds Board (2005-2007), Northern Trust Global Investments Board (2004-2007), Northern Trust Japan Board (2004-2007), Northern Trust Securities Inc. Board (2003- 2007) and Northern Trust Hong Kong Board (1997-2004). | | 139 |
| | | | |
Jack B. Evans 1948 333 W. Wacker Drive Chicago, IL 60606 | | Board Member | | 1999 Class III | | Chairman (since 2019), formerly, President (1996-2019), The Hall-Perrine Foundation, (private philanthropic corporation); Life Trustee of Coe College and the Iowa College Foundation; formerly, Member and President Pro‑Tem of the Board of Regents for the State of Iowa University System (2007- 2013); Director and Chairman (2009-2021), United Fire Group, a publicly held company; Director, Public Member, American Board of Orthopaedic Surgery (2015-2020); Director (2000-2004), Alliant Energy; Director (1996-2015), The Gazette Company (media and publishing); Director (1997- 2003), Federal Reserve Bank of Chicago; President and Chief Operating Officer (1972-1995), SCI Financial Group, Inc., (regional financial services firm). | | 139 |
| | | | |
William C. Hunter 1948 333 W. Wacker Drive Chicago, IL 60606 | | Board Member | | 2003 Class I | | Dean Emeritus, formerly, Dean, Tippie College of Business, University of Iowa (2006-2012); Director of Wellmark, Inc. (since 2009); past Director (2005-2015), and past President (2010- 2014) Beta Gamma Sigma, Inc., The International Business Honor Society; formerly, Director (2004-2018) of Xerox Corporation; formerly, Dean and Distinguished Professor of Finance, School of Business at the University of Connecticut (2003-2006); previously, Senior Vice President and Director of Research at the Federal Reserve Bank of Chicago (1995-2003); formerly, Director (1997-2007), Credit Research Center at Georgetown University. | | 139 |
61
Board Members & Officers (Unaudited) (continued)
| | | | | | | | |
Name, Year of Birth & Address | | Position(s) Held with the Funds | | Year First Elected or Appointed and Term(1) | | Principal Occupation(s) Including other Directorships During Past 5 Years | | Number of Portfolios in Fund Complex Overseen By Board Member |
| | | | |
Amy B. R. Lancellotta 1959 333 W. Wacker Drive Chicago, IL 60606 | | Board Member | | 2021 Class II | | Formerly, Managing Director, Independent Directors Council (IDC) (supports the fund independent director community and is part of the Investment Company Institute (ICI), which represents regulated investment companies) (2006-2019); formerly, various positions with ICI (1989-2006); Member of the Board of Directors, Jewish Coalition Against Domestic Abuse (JCADA) (since 2020). | | 139 |
| | | | |
Joanne T. Medero 1954 333 W. Wacker Drive Chicago, IL 60606 | | Board Member | | 2021 Class III | | Formerly, Managing Director, Government Relations and Public Policy (2009-2020) and Senior Advisor to the Vice Chairman (2018-2020), BlackRock, Inc. (global investment management firm); formerly, Managing Director, Global Head of Government Relations and Public Policy, Barclays Group (IBIM) (investment banking, investment management and wealth management businesses) (2006-2009); formerly, Managing Director, Global General Counsel and Corporate Secretary, Barclays Global Investors (global investment management firm) (1996-2006); formerly, Partner, Orrick, Herrington & Sutcliffe LLP (law firm) (1993-1995); formerly, General Counsel, Commodity Futures Trading Commission (government agency overseeing U.S. derivatives markets) (1989-1993); formerly, Deputy Associate Director/Associate Director for Legal and Financial Affairs, Office of Presidential Personnel, The White House (1986-1989); Member of the Board of Directors, Baltic-American Freedom Foundation (seeks to provide opportunities for citizens of the Baltic states to gain education and professional development through exchanges in the U.S.) (since 2019). | | 139 |
| | | | |
Albin F. Moschner 1952 333 W. Wacker Drive Chicago, IL 60606 | | Board Member | | 2016 Class III | | Founder and Chief Executive Officer, Northcroft Partners, LLC, (management consulting) (since 2012); formerly, Chairman (2019), and Director (2012-2019), USA Technologies, Inc., (provider of solutions and services to facilitate electronic payment transactions); formerly, Director, Wintrust Financial Corporation (1996-2016); previously, held positions at Leap Wireless International, Inc. (consumer wireless services), including Consultant (2011-2012), Chief Operating Officer (2008-2011), and Chief Marketing Officer (2004-2008); formerly, President, Verizon Card Services division of Verizon Communications, Inc. (2000-2003); formerly, President, One Point Services at One Point Communications (telecommunication services) (1999-2000); formerly, Vice Chairman of the Board, Diba, Incorporated (internet technology provider) (1996-1997); formerly, various executive positions (1991-1996) including Chief Executive Officer (1995-1996) of Zenith Electronics Corporation (consumer electronics). | | 139 |
| | | | |
John K. Nelson 1962 333 W. Wacker Drive Chicago, IL 60606 | | Board Member | | 2013 Class II | | Member of Board of Directors of Core12 LLC. (private firm which develops branding, marketing and communications strategies for clients) (since 2008); served The President’s Council of Fordham University (2010-2019) and previously a Director of the Curran Center for Catholic American Studies (2009-2018); formerly, senior external advisor to the Financial Services practice of Deloitte Consulting LLP. (2012-2014); former Chair of the Board of Trustees of Marian University (2010-2014 as trustee, 2011-2014 as Chair); formerly Chief Executive Officer of ABN AMRO Bank N.V., North America, and Global Head of the Financial Markets Division (2007-2008), with various executive leadership roles in ABN AMRO Bank N.V. between 1996 and 2007. | | 139 |
62
| | | | | | | | |
Name, Year of Birth & Address | | Position(s) Held
with the Funds | | Year First
Elected or
Appointed
and Term(1) | | Principal Occupation(s) Including other Directorships During Past 5 Years | | Number of Portfolios in Fund Complex Overseen By Board Member |
| | | | |
Matthew Thornton III 1958 333 W. Wacker Drive Chicago, IL 60606 | | Board Member | | 2020 Class III | | Formerly, Executive Vice President and Chief Operating Officer (2018-2019), FedEx Freight Corporation, a subsidiary of FedEx Corporation (FedEx) (provider of transportation, e‑commerce and business services through its portfolio of companies); formerly, Senior Vice President, U.S. Operations (2006-2018), Federal Express Corporation, a subsidiary of FedEx; formerly Member of the Board of Directors (2012-2018), Safe Kids Worldwide® (a non‑profit organization dedicated to preventing childhood injuries). Member of the Board of Directors (since 2014), The Sherwin-Williams Company (develops, manufactures, distributes and sells paints, coatings and related products); Director (since 2020), Crown Castle International (provider of communications infrastructure). | | 139 |
| | | | |
Margaret L. Wolff 1955 333 W. Wacker Drive Chicago, IL 60606 | | Board Member | | 2016 Class I | | Formerly, member of the Board of Directors (2013-2017) of Travelers Insurance Company of Canada and The Dominion of Canada General Insurance Company (each, a part of Travelers Canada, the Canadian operation of The Travelers Companies, Inc.); formerly, Of Counsel, Skadden, Arps, Slate, Meagher & Flom LLP (Mergers & Acquisitions Group) (legal services) (2005- 2014); Member of the Board of Trustees of New York-Presbyterian Hospital (since 2005); Member (since 2004) formerly, Chair (2015- 2022) of the Board of Trustees of The John A. Hartford Foundation (a philanthropy dedicated to improving the care of older adults); formerly, Member (2005-2015) and Vice Chair (2011-2015) of the Board of Trustees of Mt. Holyoke College. | | 139 |
| | | | |
Robert L. Young 1963 333 W. Wacker Drive Chicago, IL 60606 | | Board Member | | 2017 Class II | | Formerly, Chief Operating Officer and Director, J.P. Morgan Investment Management Inc. (financial services) (2010-2016); formerly, President and Principal Executive Officer (2013-2016), and Senior Vice President and Chief Operating Officer (2005-2010), of J.P. Morgan Funds; formerly, Director and various officer positions for J.P. Morgan Investment Management Inc. (formerly, JPMorgan Funds Management, Inc. and formerly, One Group Administrative Services) and JPMorgan Distribution Services, Inc. (financial services) (formerly, One Group Dealer Services, Inc.) (1999-2017). | | 139 |
| | | | |
Name, Year of Birth & Address | | Position(s) Held
with the Funds | | Year First
Elected or
Appointed(2) | | Principal Occupation(s) Including other Directorships During Past 5 Years | | |
|
| Officers of the Funds: |
| | | |
David J. Lamb 1963 333 W. Wacker Drive Chicago, IL 60606 | | Chief Administrative Officer | | 2015 | | Managing Director of Nuveen Fund Advisors, LLC (since 2019); Senior Managing Director (since 2021), formerly, Managing Director (2020-2021) of Nuveen Securities, LLC; Senior Managing Director (since 2021), formerly, Managing Director (2017-2021), Senior Vice President of Nuveen (2006-2017). |
| | | |
Brett E. Black 1972 333 W. Wacker Drive Chicago, IL 60606 | | Vice President and Chief Compliance Officer | | 2022 | | Managing Director of Nuveen (since 2022); formerly, Vice President (2014-2022), Chief Compliance Officer (2017-2022); Deputy Chief Compliance Officer (2014- 2017) of BMO Funds, Inc. |
| | | |
Mark J. Czarniecki 1979 901 Marquette Avenue Minneapolis, MN 55402 | | Vice President and Assistant Secretary | | 2013 | | Managing Director (since 2022), formerly, Vice President (2016-2022), and Assistant Secretary (since 2016) of Nuveen Securities, LLC; Managing Director (since 2022), formerly, Vice President (2017-2022) and Assistant Secretary (since 2017) of Nuveen Fund Advisors, LLC; Managing Director and Associate General Counsel (since January 2022), formerly, Vice President and Associate General Counsel of Nuveen (2013-2021); Managing Director (since 2022), formerly, Vice President (2018-2022), Assistant Secretary and Associate General Counsel (since 2018) of Nuveen Asset Management, LLC. |
63
Board Members & Officers (Unaudited) (continued)
| | | | | | |
Name, Year of Birth & Address | | Position(s) Held with the Funds | | Year First Elected or Appointed(2) | | Principal Occupation(s) Including other Directorships During Past 5 Years |
| | | |
Diana R. Gonzalez 1978 8500 Andrew Carnegie Blvd. Charlotte, NC 28262 | | Vice President and Assistant Secretary | | 2017 | | Vice President and Assistant Secretary of Nuveen Fund Advisors, LLC (since 2017); Vice President and Associate General Counsel and Assistant Secretary of Nuveen Asset Management, LLC (since 2022); Vice President and Associate General Counsel of Nuveen (since 2017); formerly, Associate General Counsel of Jackson National Asset Management (2012-2017). |
| | | |
Nathaniel T. Jones 1979 333 W. Wacker Drive Chicago, IL 60606 | | Vice President and Treasurer | | 2016 | | Senior Managing Director (since 2021), formerly, Managing Director (2017-2021), Senior Vice President (2016-2017) of Nuveen; Managing Director (since 2015) of Nuveen Fund Advisors, LLC; Chartered Financial Analyst. |
| | | |
Tina M. Lazar 1961 333 W. Wacker Drive Chicago, IL 60606 | | Vice President | | 2002 | | Managing Director (since 2017), formerly, Senior Vice President (2014-2017) of Nuveen Securities, LLC. |
| | | |
Brian J. Lockhart 1974 333 W. Wacker Drive Chicago, IL 60606 | | Vice President | | 2019 | | Managing Director (since 2019) of Nuveen Fund Advisors, LLC; Senior Managing Director (since 2021), formerly, Managing Director (2017-2021), Vice President (2010-2017) of Nuveen; Head of Investment Oversight (since 2017), formerly, Team Leader of Manager Oversight (2015-2017); Chartered Financial Analyst and Certified Financial Risk Manager. |
| | | |
John M. McCann 1975 8500 Andrew Carnegie Blvd. Charlotte, NC 28262 | | Vice President and Assistant Secretary | | 2022 | | Managing Director (since 2021), General Counsel and Secretary (since 2023), formerly, Assistant Secretary (2021-2023), of Nuveen Fund Advisors, LLC; Managing Director, Associate General Counsel and Assistant Secretary of Nuveen Asset Management, LLC (since 2021); Managing Director (since 2021) and Assistant Secretary (since 2016) of TIAA SMA Strategies LLC; Managing Director (since 2019, formerly, Vice President and Director), Associate General Counsel and Assistant Secretary of College Retirement Equities Fund, TIAA Separate Account VA‑1, TIAA-CREF Funds and TIAA-CREF Life Funds; Managing Director (since 2018), formerly, Vice President and Director, Associate General Counsel and Assistant Secretary of Teachers Insurance and Annuity Association of America, Teacher Advisors LLC and TIAA-CREF Investment Management, LLC; Vice President (since 2017), Associate General Counsel and Assistant Secretary (since 2011) of Nuveen Alternative Advisors LLC; General Counsel and Assistant Secretary of Covariance Capital Management, Inc. (2014-2017). |
| | | |
Kevin J. McCarthy 1966 333 W. Wacker Drive Chicago, IL 60606 | | Vice President and Assistant Secretary | | 2007 | | Senior Managing Director (since 2017) and Secretary and General Counsel (since 2016) of Nuveen Investments, Inc., formerly, Executive Vice President (2016- 2017); Executive Vice President (since 2023) and Assistant Secretary (since 2008) of Nuveen Securities, LLC, formerly Senior Managing Director (2017-2023); Executive Vice President and Assistant Secretary (since 2023) of Nuveen Fund Advisors, LLC, formerly, Senior Managing Director (2017-2023), Secretary (2016- 2023) and Co‑General Counsel (2011-2020); Executive Vice President (since 2023) and Secretary (since 2016) of Nuveen Asset Management, LLC, formerly, Senior Managing Director (2017-2023) and Associate General Counsel (2011- 2020); formerly, Vice President (2007-2021) and Secretary (2016-2021), of NWQ Investment Management Company, LLC and Santa Barbara Asset Management, LLC; Vice President and Secretary of Winslow Capital Management, LLC (since 2010); Senior Managing Director (since 2017) and Secretary (since 2016) of Nuveen Alternative Investments, LLC. |
| | | |
Jon Scott Meissner 1973 8500 Andrew Carnegie Blvd. Charlotte, NC 28262 | | Vice President and Assistant Secretary | | 2019 | | Managing Director, Mutual Fund Tax and Expense Administration (since 2022), formerly, Managing Director of Mutual Fund Tax and Financial Reporting groups (2017-2022), at Nuveen; Managing Director of Nuveen Fund Advisors, LLC (since 2019); Managing Director (since 2021), formerly, Senior Director (2016-2021), of Teachers Advisors, LLC and TIAA-CREF Investment Management, LLC; Managing Director, Mutual Fund Tax and Expense Administration (since 2022), formerly, Senior Director Mutual Fund Taxation (2015-2022), to the TIAA-CREF Funds, the TIAA-CREF Life Funds, the TIAA Separate Account VA‑1 and the CREF Accounts; has held various positions with TIAA since 2004. |
| | | |
William A. Siffermann 1975 333 W. Wacker Drive Chicago, IL 60606 | | Vice President | | 2017 | | Managing Director (since 2017), formerly Senior Vice President (2016-2017) of Nuveen. |
64
| | | | | | |
Name, Year of Birth & Address | | Position(s) Held with the Funds | | Year First Elected or Appointed(2) | | Principal Occupation(s) Including other Directorships During Past 5 Years |
| | | |
Trey S. Stenersen 1965 8500 Andrew Carnegie Blvd. Charlotte, NC 28262 | | Vice President | | 2022 | | Senior Managing Director of Teacher Advisors LLC and TIAA-CREF Investment Management, LLC (since 2018); Senior Managing Director (since 2019) and Chief Risk Officer (since 2022), formerly Head of Investment Risk Management (2017- 2022) of Nuveen; Senior Managing Director (since 2018) of Nuveen Alternative Advisors LLC. |
| | | |
E. Scott Wickerham 1973 8500 Andrew Carnegie Blvd. Charlotte, NC 28262 | | Vice President and Controller | | 2019 | | Senior Managing Director, Head of Public Investment Finance at Nuveen (since 2019), formerly, Managing Director; Senior Managing Director (since 2019) of Nuveen Fund Advisors, LLC; Senior Managing Director (since 2022) of Nuveen Asset Management, LLC; Principal Financial Officer, Principal Accounting Officer and Treasurer (since 2017) of the TIAA-CREF Funds, the TIAA-CREF Life Funds, the TIAA Separate Account VA‑1 and Principal Financial Officer, Principal Accounting Officer (since 2020) and Treasurer (since 2017) of the CREF Accounts; has held various positions with TIAA since 2006. |
| | | |
Mark L. Winget 1968 333 W. Wacker Drive Chicago, IL 60606 | | Vice President and Secretary | | 2008 | | Vice President and Assistant Secretary of Nuveen Securities, LLC (since 2008), and Nuveen Fund Advisors, LLC (since 2019); Vice President, Associate General Counsel and Assistant Secretary of Nuveen Asset Management, LLC (since 2020); Vice President (since 2010) and Associate General Counsel (since 2019) of Nuveen. |
| | | |
Rachael Zufall 1973 8500 Andrew Carnegie Blvd. Charlotte, NC 28262 | | Vice President and Assistant Secretary | | 2022 | | Managing Director and Assistant Secretary (since 2023) of Nuveen Fund Advisors, LLC; Managing Director (since 2017), Associate General Counsel and Assistant Secretary (since 2014) of the CREF Accounts, TIAA Separate Account VA‑1, TIAA- CREF Funds and TIAA-CREF Life Funds; Managing Director (since 2017), Associate General Counsel and Assistant Secretary (since 2011) of Teacher Advisors, LLC and TIAA-CREF Investment Management, LLC; Managing Director of Nuveen, LLC and of TIAA (since 2017). |
| (1) | The Board of Trustees is divided into three classes, Class I, Class II, and Class III, with each being elected to serve until the third succeeding annual shareholders’ meeting subsequent to its election or thereafter in each case when its respective successors are duly elected or appointed, except two board members are elected by the holders of Preferred Shares, when applicable, to serve until the next annual shareholders’ meeting subsequent to its election or thereafter in each case when its respective successors are duly elected or appointed. The year first elected or appointed represents the year in which the board member was first elected or appointed to any fund in the Nuveen complex. |
| (2) | Officers serve indefinite terms until their successor has been duly elected and qualified, their death or their resignation or removal. The year first elected or appointed represents the year in which the Officer was first elected or appointed to any fund in the Nuveen Complex. |
65
[This page intentionally left blank.]
[This page intentionally left blank.]
| | |
| | Nuveen: |
| |
| | Serving Investors for Generations |
| |
| | Since 1898, financial advisors and their clients have relied on Nuveen to provide dependable investment solutions through continued adherence to proven, long-term investing principles. Today, we offer a range of high quality solutions designed to be integral components of a well-diversified core portfolio. |
| |
| | Focused on meeting investor needs. |
| |
| | Nuveen is the investment manager of TIAA. We have grown into one of the world’s premier global asset managers, with specialist knowledge across all major asset classes and particular strength in solutions that provide income for investors and that draw on our expertise in alternatives and responsible investing. Nuveen is driven not only by the independent investment processes across the firm, but also the insights, risk management, analytics and other tools and resources that a truly world-class platform provides. As a global asset manager, our mission is to work in partnership with our clients to create solutions which help them secure their financial future. |
| |
| | Find out how we can help you. |
| |
| | To learn more about how the products and services of Nuveen may be able to help you meet your financial goals, talk to your financial advisor, or call us at (800) 257‑8787. Please read the information provided carefully before you invest. Investors should consider the investment objective and policies, risk considerations, charges and expenses of any investment carefully. Where applicable, be sure to obtain a prospectus, which contains this and other relevant information. To obtain a prospectus, please contact your securities representative or Nuveen, 333 W. Wacker Dr., Chicago, IL 60606. Please read the prospectus carefully before you invest or send money. Learn more about Nuveen Funds at: www.nuveen.com/closed‑end‑funds |
| |
| | NOT FDIC INSURED MAY LOSE VALUE NO BANK GUARANTEE |
| | | | | | | | | | | | |
| Nuveen Securities, LLC, member FINRA and SIPC | | 333 West Wacker Drive | | Chicago, IL 60606 | | www.nuveen.com | | | | EAN‑B‑0323P | | 2849696‑INV‑Y‑05/24 |