 Company Overview October 2010 Company Overview October 2010 Exhibit 99.1 |
 2 Disclaimers and Reporting Definitions Disclaimers and Reporting Definitions Forward-Looking Statements This presentation contains forward-looking statements that are based on current expectations, forecasts and assumptions that involve risks and uncertainties that could cause actual outcomes and results to differ materially. These risks include, without limitation: adverse economic or real estate developments in the retail industry or the markets in which Excel Trust operates; defaults on or non-renewal of leases by tenants; increased interest rates and operating costs; decreased rental rates or increased vacancy rates; Excel Trust's failure to obtain necessary outside financing on favorable terms or at all; changes in the availability of additional acquisition opportunities; Excel Trust's inability to successfully complete real estate acquisitions or successfully operate acquired properties and Excel Trust's failure to qualify or maintain its status as a real estate investment trust, or REIT. For a further list and description of such risks and uncertainties that could impact Excel Trust's future results, performance or transactions, see the reports filed by Excel Trust with the Securities and Exchange Commission, including its final prospectus relating to its initial public offering and quarterly reports on Form 10-Q. Excel Trust disclaims any intention or obligation to update or revise any forward-looking statements, whether as a result of new information, future events or otherwise. These forward-looking statements speak only as of the date of this presentation. We undertake no obligation to update any forward-looking statements to reflect the events or circumstances arising after the date as ofwhich they are made. As a result of these risks and uncertainties, recipients of this presentation are cautioned not to place undue reliance on the forward-looking statements included in this presentation or that may be made elsewhere from time to time by, or on behalf of, us. Reporting Definitions “Annualized Base Rents” or “ABR” as used throughout this presentation means the annualized fixed base rental amount in effect under existing leases as of June 30, 2010. In the case of triple-net leases, annualized base rent does not include real estate taxes and insurance, common area and other operating expenses, substantially all of which are borne by the tenants. Does not reflect amounts attributable to percentage rent increases,where applicable. “Funds from Operations” or “FFO” Excel Trust computes FFO in accordance with standards established by the Board of Governors of NAREIT in its March 1995 White Paper (as amended in November 1999 and April 2002). As defined by NAREIT, FFO represents net income (computed in accordance with generally accepted accounting principles, or GAAP), excluding gains (or losses) from sales of property, plus real estate related depreciation and amortization (excluding amortization of loan origination costs) and after adjustments for unconsolidated partnerships and joint ventures. Excel Trust’s computation may differ from the methodology for calculating FFO utilized by other equity REITs and, accordingly, may not be comparable to such other REITs. Further, FFO does not represent amounts available for management’s discretionary use because of needed capital replacement or expansion, debt service obligations, or other commitments and uncertainties. FFO should not be considered as an alternative to net income (loss) (computed in accordance with GAAP) as an indicator of Excel Trust’s financial performance or to cash flow from operating activities (computed in accordance with GAAP) as an indicator of Excel Trust’s liquidity, nor is it indicative of funds available to fund cash needs, including Excel Trust’s ability to pay dividends or make distributions. Excel Trust presents funds from operations (“FFO”) because is it deemed an important supplemental measure of the company’s operating performance and because it is frequently used by securities analysts, investors and other interested parties in the evaluation of REITs, many of which present FFO when reporting their results. FFO is intended to exclude GAAP historical cost depreciation and amortization of real estate and related assets, which assumes that the value of real estate assets diminishes ratably over time. Historically, however, real estate values have risen or fallen with market conditions. Because FFO excludes depreciation and amortization unique to real estate, gains and losses from property dispositions and extraordinary items, it provides a performance measure that, when compared year-over-year, reflects the impact to operations from trends in occupancy rates, rental rates, operating costs, development activities and interest costs, providing perspective not immediately apparent from net income. |
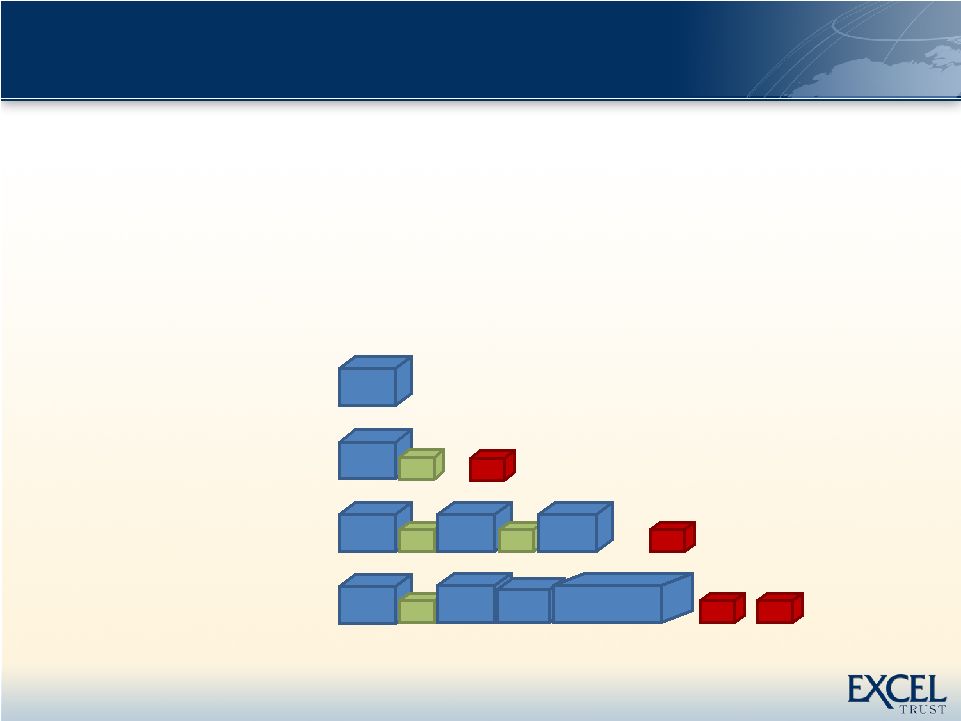 About Excel Trust About Excel Trust Mission Statement We strive to be the premier owner of open air, “box and pad” retail real estate. We will provide stability and growth for our investors through the judicious acquisition, management, development and disposition of a diversified portfolio of high quality properties. 3 Single Tenant NNN Neighborhood Center Community Center Power Center Box Box Shops Box Shops Box Box Big Box Pads Pads Pads Box Shops Box Shops Box Pads Our Business |
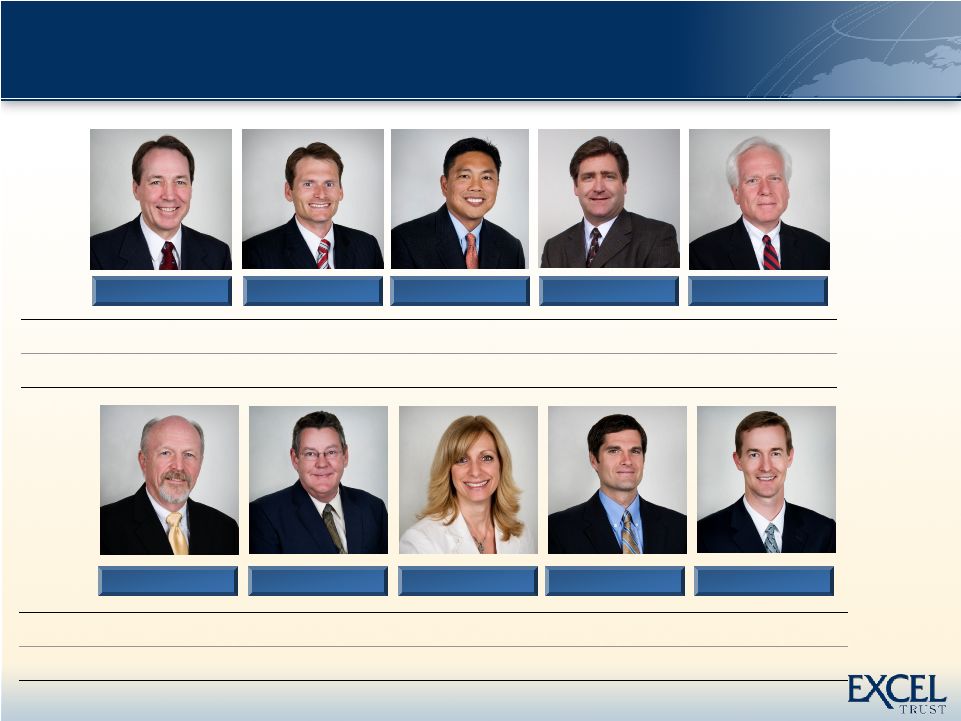 4 Cohesive and Tenured Senior Management Excel has a team of 25 seasoned real estate professionals Cohesive and Tenured Senior Management Excel has a team of 25 seasoned real estate professionals Position Chairman and CEO President, COO and Director CFO and Treasurer CIO, SVP Acquisitions and Director SVP, General Counsel and Secretary Years Together Founder 13 15 26 15 Gary Sabin Spencer Plumb Jim Nakagawa Mark Burton Eric Ottesen Position SVP Asset Management / Development Vice President Development Accounting Manager SVP Capital Markets VP Capital Markets & Communications Years Together 11 10 20 5 4 Bill Stone Kathy Clegg Geoff Sherman Matt Romney Greg Davis |
 5 Three Decades of Real Estate Experience Three Decades of Real Estate Experience 3/1998 Excel Legacy Corp. spun-off from Excel Realty Trust with $96.5M of total assets (2) 12/2004 Price Legacy sold to a Kimco affiliate 8/1993 Excel Realty Trust lists on the NYSE, raising $118.5M 9/2001 Merger creates Price Legacy Corp., $1.2B tot. assets, 55 properties in 13 states (3) 9/1998 Merger creates New Plan Excel Realty Trust - $2.9B tot. assets, 355 properties in 31 states (1) 10/2003 Sabin and mgmt resign from Price Legacy to form Excel Realty Holdings 1978 Sabin establishes his 1 retail RE company 1978 1989 1993 1998 1999 2001 2002 2003 2009 2010 2000 1990 1991 1992 1989 – 1993 Sabin and mgmt form Excel Realty Trust, a public, non-traded REIT 4/28/2010 Excel Trust completes IPO, raising $210M of proceeds (EXL: NYSE) Excel Realty Trust Highlights Total returns to initial investors of 125.3% (4) #1 retail REIT in U.S. in ’95 & ‘97 based on total shareholder return (5) st Notes: (1) As reported in the Annual Report of New Plan Excel Realty Trust for the year ended December 31, 1998 (2) As reported in the 8-K filed on March 26, 1998, prior to the spin-off of Excel Legacy Corporation from Excel Realty Trust (3) As reported in the Annual Report of Price Legacy Corporation for the year ended December 31, 2001 (4) 125.3% Shareholder total returns depicts the returns generated in respect of one share of Excel Realty Trust assuming the share was purchased on August 5, 1993 for $19.75 per share and sold on September 28, 1998 and assumes the reinvestment of all cash dividends paid by Excel Realty Trust on its common stock through such period in additional shares of common stock on the ex-dividend date and takes into account (i) a six for five stock split on September 28, 1998, and (ii) the receipt of one share of common stock of Excel Legacy Corporation in connection with the spin-off of Excel Legacy Corporation from Excel Realty Trust. (5) Wall Street Journal, 1995 and 1997 |
 6 Portfolio Overview Portfolio Overview Plaza at Rockwall |
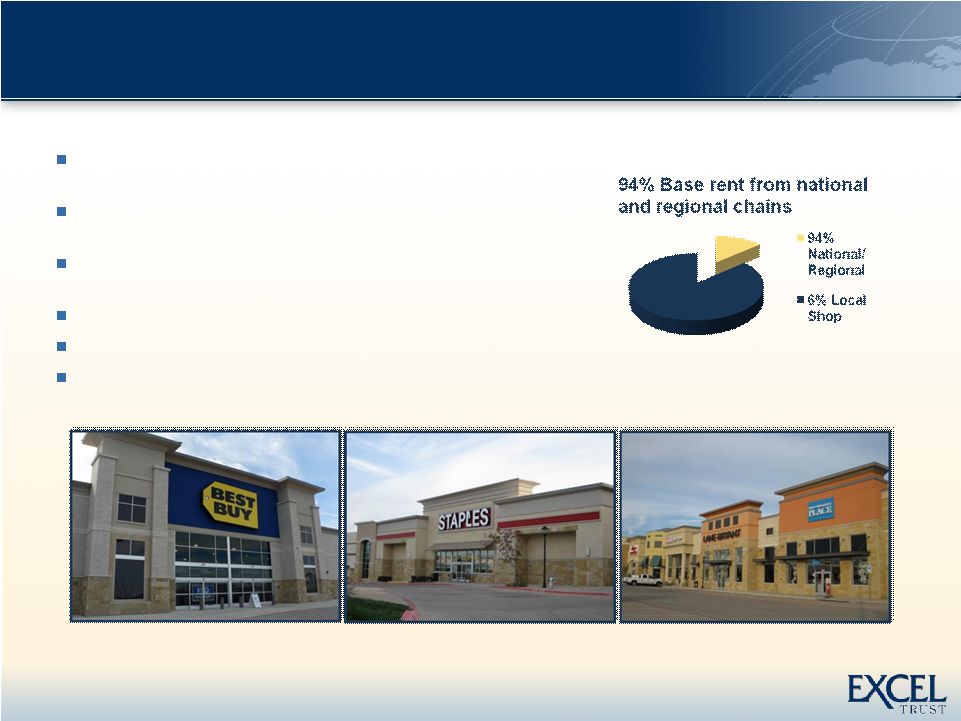
 7 Portfolio Overview Portfolio Overview Notes: (1) Does not include Red Rock Commons or Rockwall Phase II which are land parcels to be developed. (2) Does not include single tenant properties. Operating Portfolio Statistics # of Properties closed since IPO 20 Gross Asset Value-Properties $303M Approx. Total GLA (SF) 1.9M Approx. Percent Leased 93% Approx. portfolio price/sq. ft. (1) $150 5 Mile Ave. HH Income (weighted by GLA) (2) $84K 5 Mile Ave. Population (weighted by GLA) (2) 102K Strong Tenant Base Properties anchored by tenants that offer necessity and value oriented items High credit quality anchor tenants provide stability to revenues |
 8 8 Portfolio Overview |
 9 96% leased Class “A” power center, anchored by JC Penney, Belk, Dick’s Sporting Goods, Staples and Best Buy in Rockwall, TX Off market transaction closed for ~ $41M on 6-29-10 (including Phase II) Phase II nearly 60% leased – construction starting soon (current cost projections better than previously forecast) Located in Dallas suburb, ranked 2 nd wealthiest county in TX (1) Ave. HH inc. of $95K within a 3-mile radius (2) Located on strategic stretch of I-30 at Hwy 205 with highest traffic counts in Rockwall County (98,000 and 23,080, respectively) (3) Plaza at Rockwall – Rockwall, TX Notes: (1) Source: 2000 Census based on median income (2) Source: Claritas, 2010 (3) Source Texas DOT, 2009 |
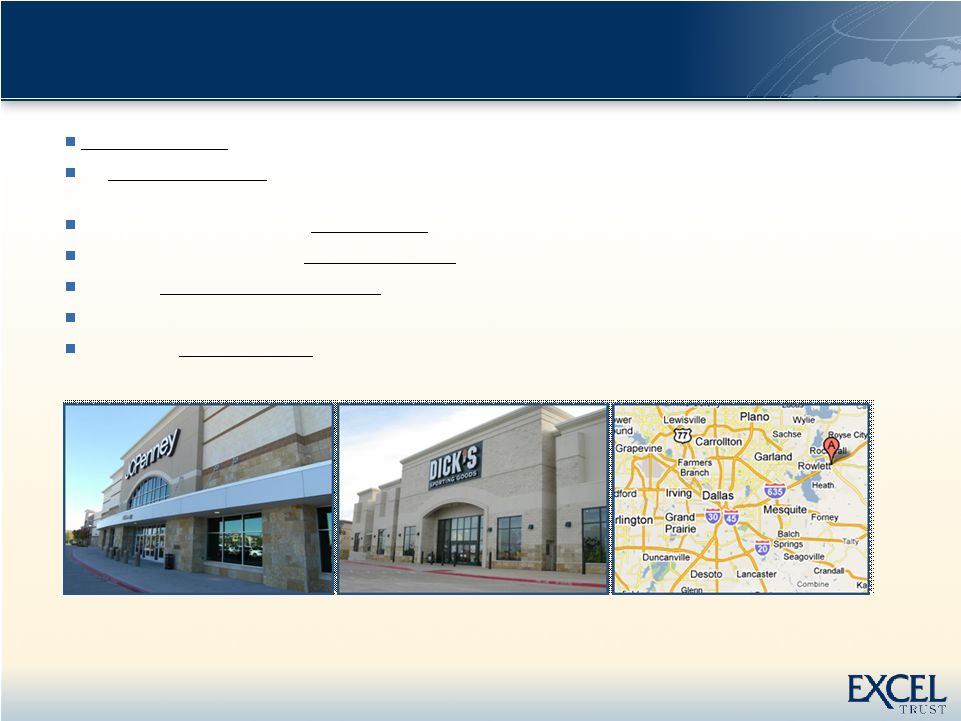 10 2 nd wealthiest county in TX (1) 3rd fastest growing county in US by population since 2000 (2) ; the population is predicted to further increase by 24% over the next 5 years (3) CNN Money’s list of the nation’s Top 25 Counties (4) Family Circle Magazine’s list of Top Ten Best Towns for Families (5) One of the highest ranking school systems in TX (6) Located along I-30, providing convenient access to the Dallas Metro area Situated near Lake Ray Hubbard featuring boardwalk access to fountains, parks, restaurants and lodging Plaza at Rockwall – Rockwall, TX Regional Highlights Notes: (1) Source: 2000 census median income (2) Source: US Census Bureau ,2010 (3) Source: Claritas, 2010 (4) http://money.cnn.com/galleries/2007/moneymag/0707/gallery.BPTL_job_growth.moneymag/22.html://newsroom.longrealtyblogs.com/?p=1132 (5) Source Family Circle, July 2009 (6) Source: top 88th percentile: http://www.schooldigger.com/go/TX/city/Rockwall/search.aspx |
 11 Plaza at Rockwall - Rockwall, TX Aerial |
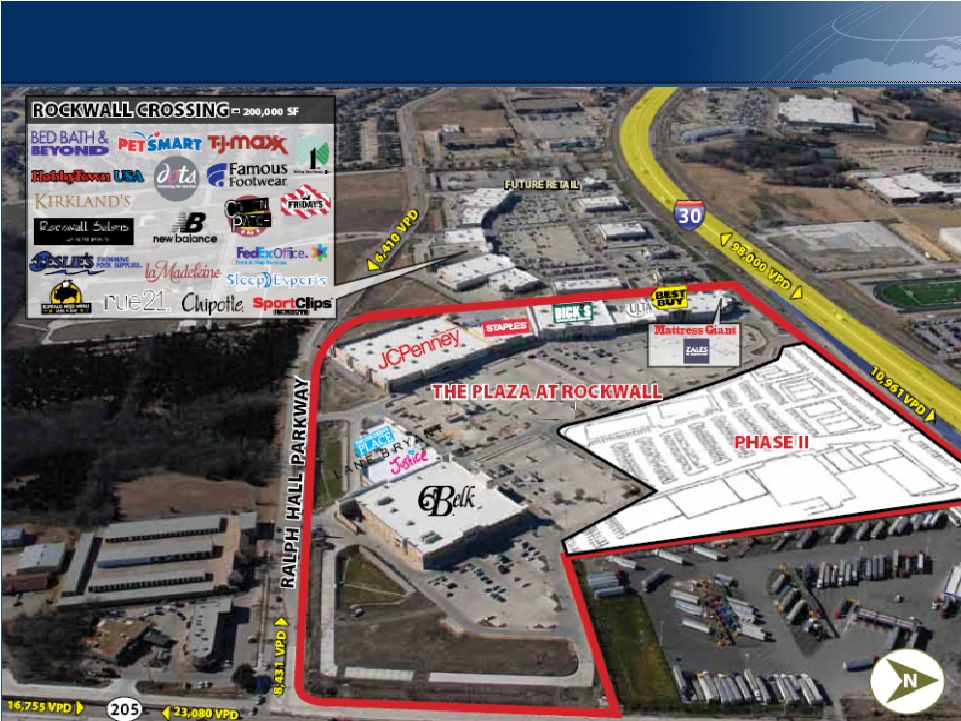
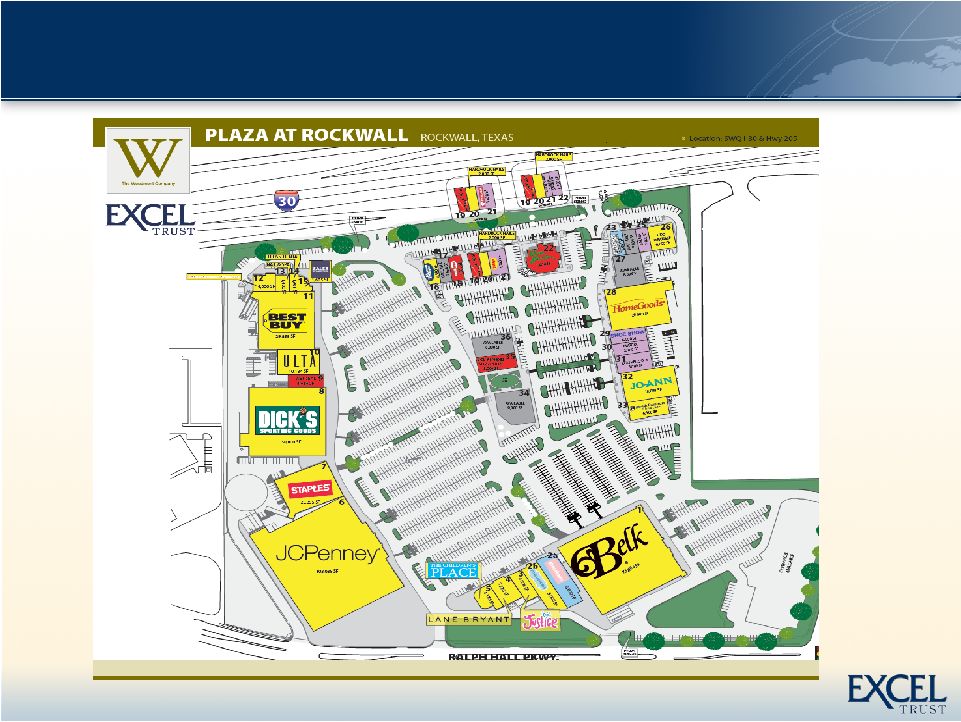 12 Plaza at Rockwall – Rockwall, TX Site Plan including Phase II |
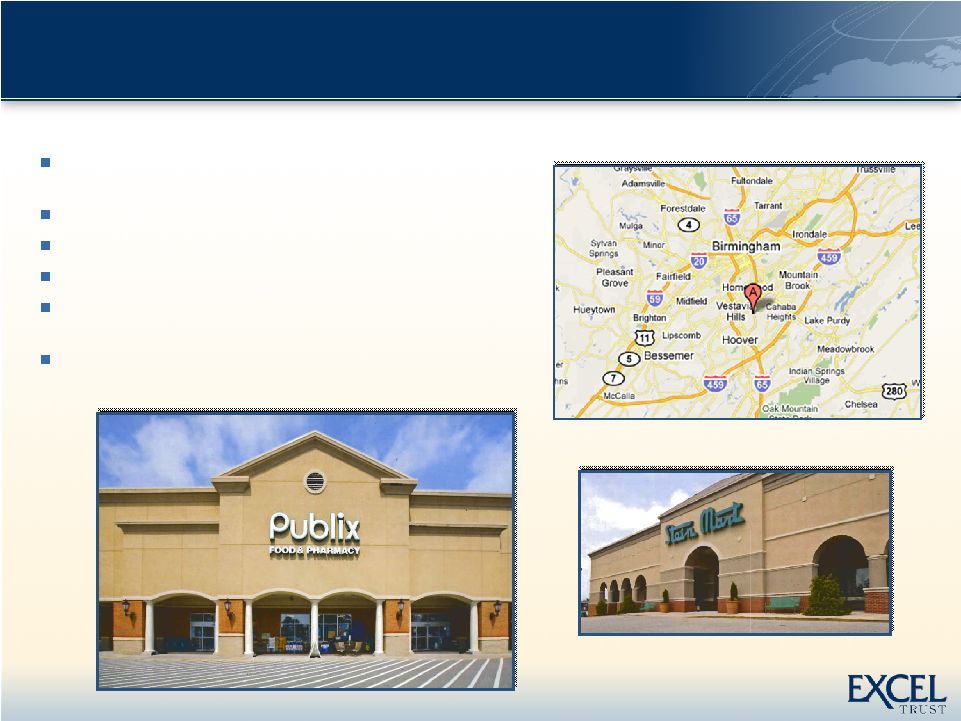    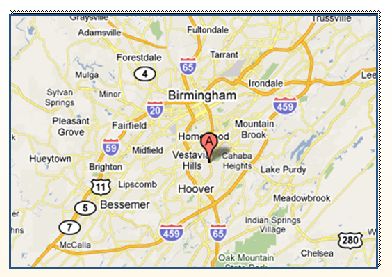 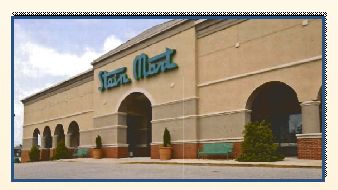  13 13 375K sq. ft. anchored by Publix, Rite-Aid, Stein Mart, Dollar Tree, and Rave Movie Theaters # 1 performing Publix in AL Off market transaction closed for ~ $33.5M on 8/30/10 Significant discount from bank note & equity invested Sourced from relationship of 15+ years (acquired over $200M over history) Strong demographics: 5 mile ave. HH income of $80K / Population of 163K (1) Vestavia Hills City Center – Birmingham, AL Vestavia Hills City Center – Birmingham, AL Notes: (1) Source: Claritas, 2010 |
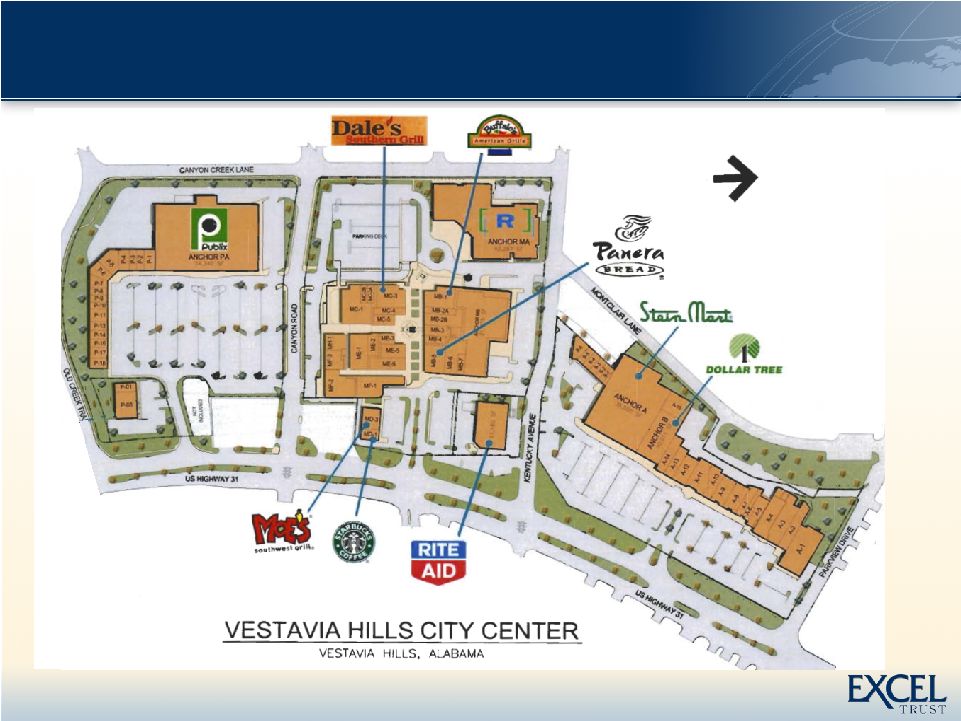 14 Vestavia Hills City Center Site Plan Vestavia Hills City Center Site Plan |
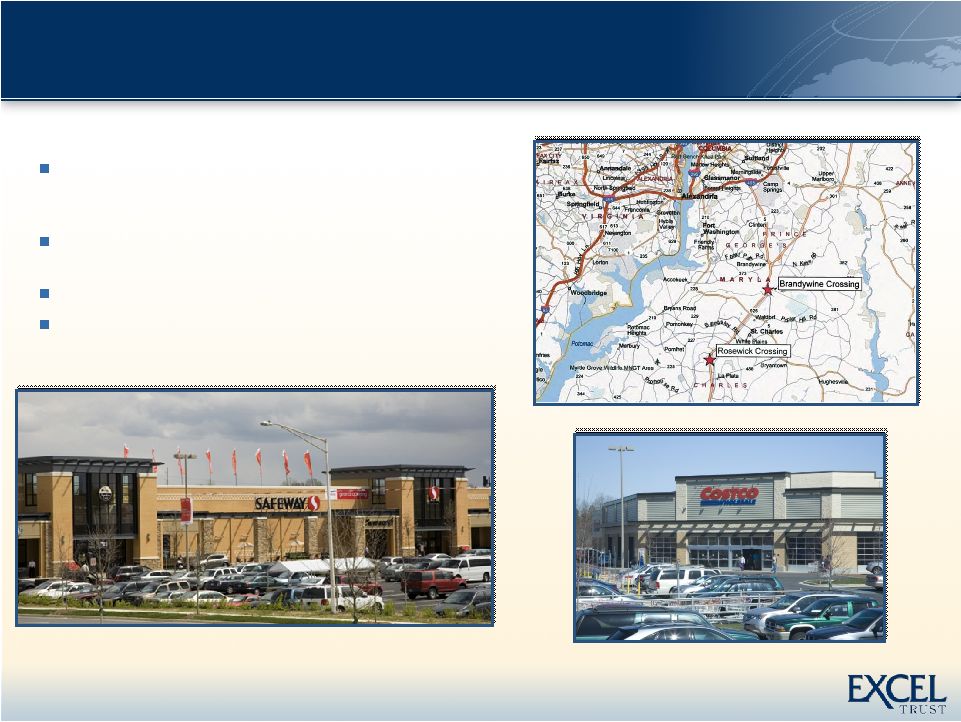 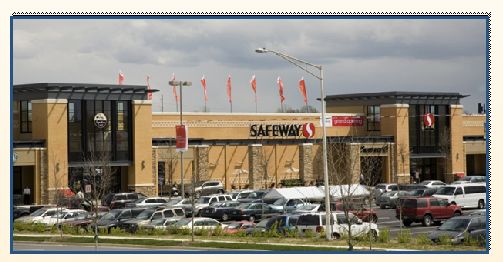  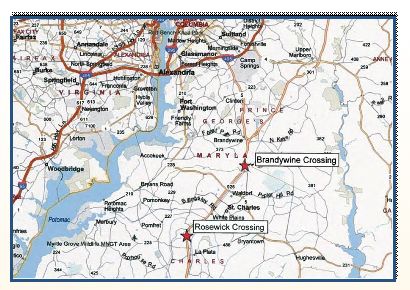  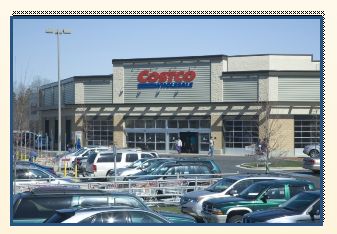  Brandywine Crossing – Brandywine, MD: 198K sq. ft. anchored by Safeway, Jo-Ann, Marshall's, Costco (non- owned) and Target (non-owned) Rosewick Crossing – La Plata, MD: 116K sq. ft. anchored by Giant Food and Lowe's (non-owned) Off market transaction closed for ~ $70 million on 10/1/10 Approx. $100K ave. HH income in 3 mi radius (1) 15 Brandywine Crossing & Rosewick Crossing Washington D.C. Metro Notes: (1) Source: AGS, 2008 Not Owned |
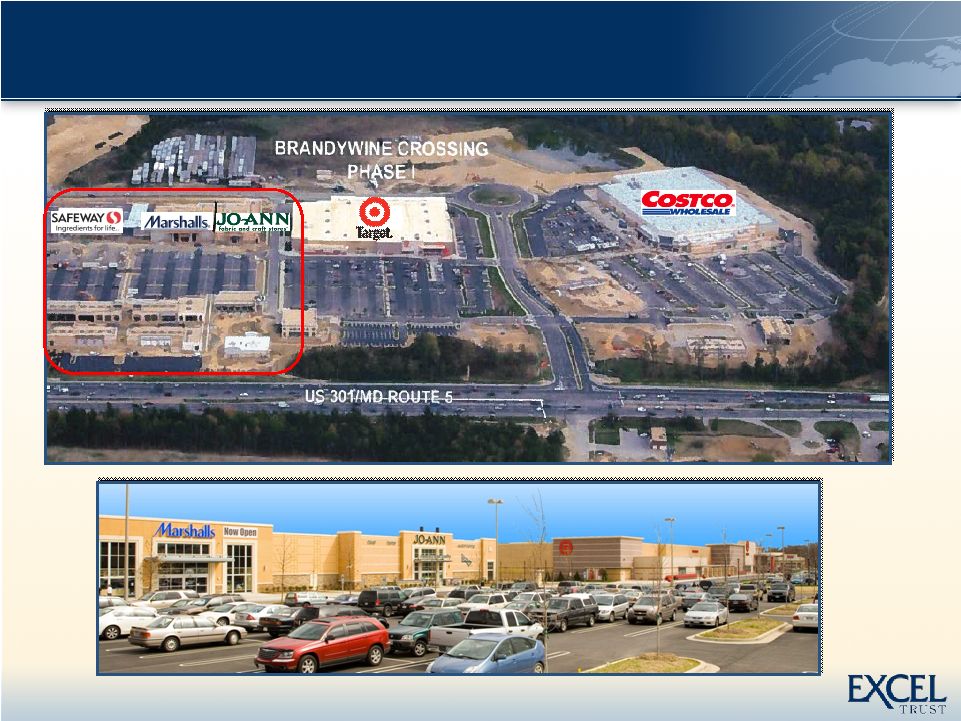  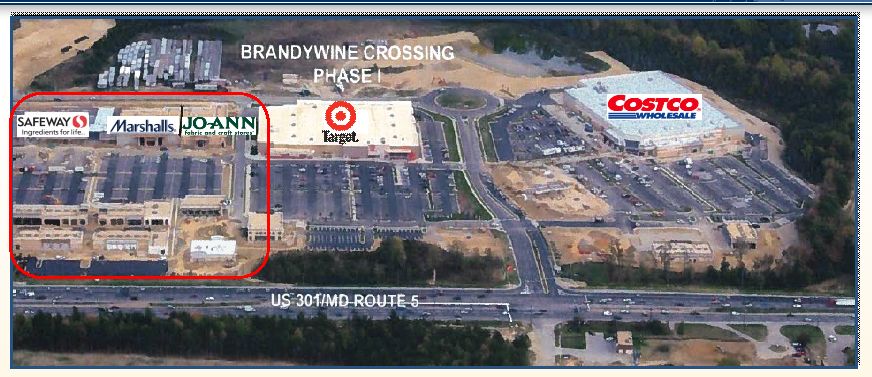  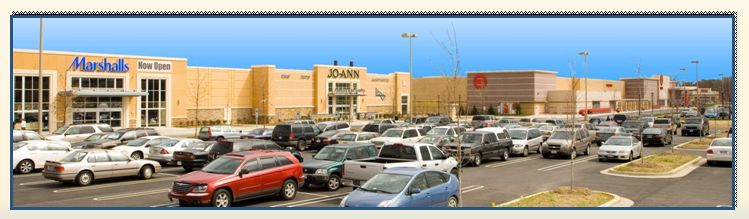 16 Brandywine Crossing – Washington D.C. Metro Aerial Portion Owned |
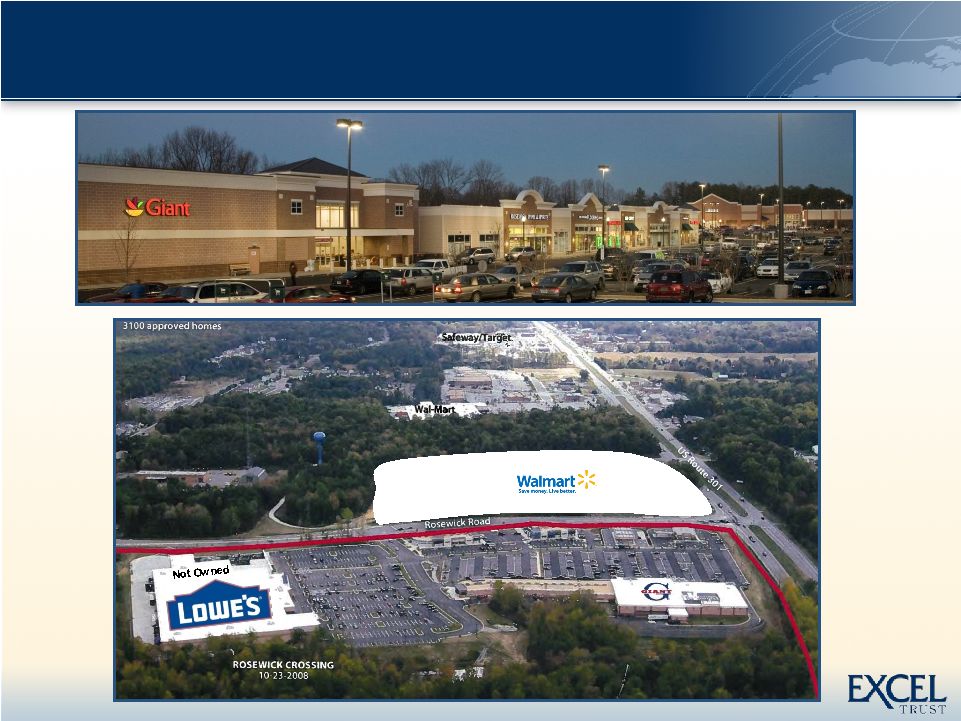 17 Rosewick Crossing – Washington D.C. Metro Aerial Proposed Not Owned |
   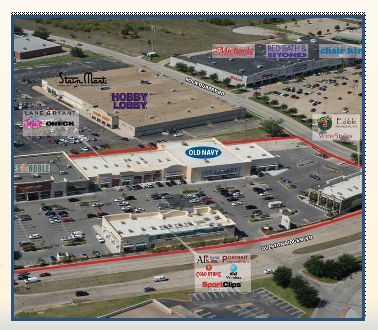  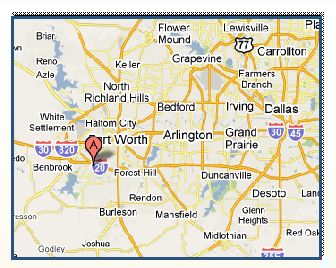  5000 South Hulen – Fort Worth, TX 5000 South Hulen – Fort Worth, TX Approx. 92% leased Off market transaction closed for ~ $22M on 5/12/10 Community shopping center in major retail corridor adjacent to regional mall Located in affluent southeast Ft. Worth suburb less than 3 miles from TCU (8,800 students) Assumed $14.2 million of debt at a 5.6% rate 18 |
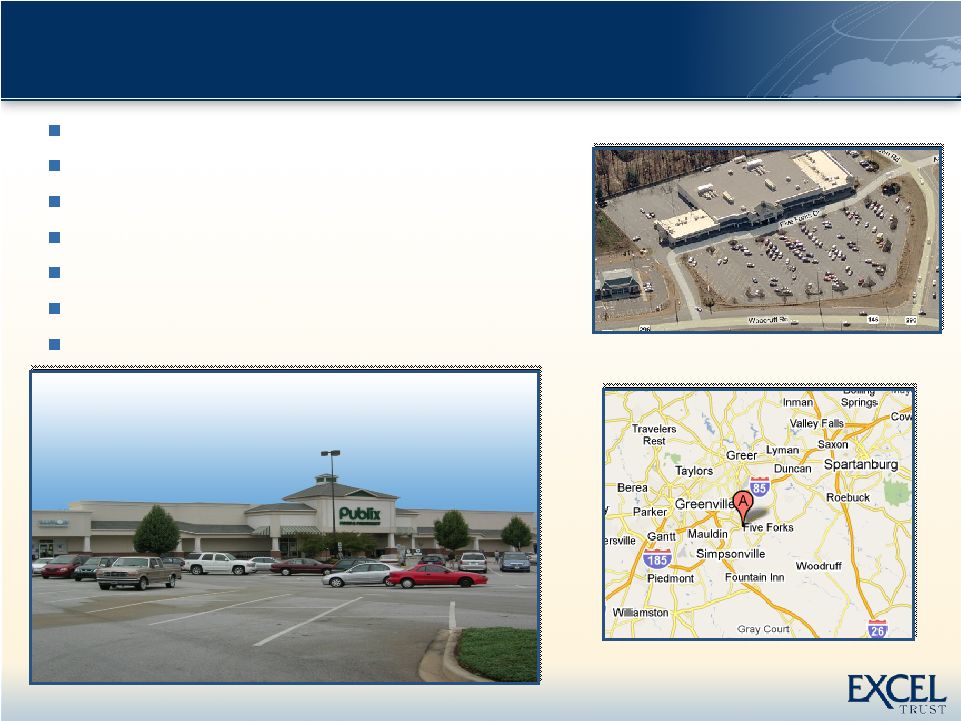  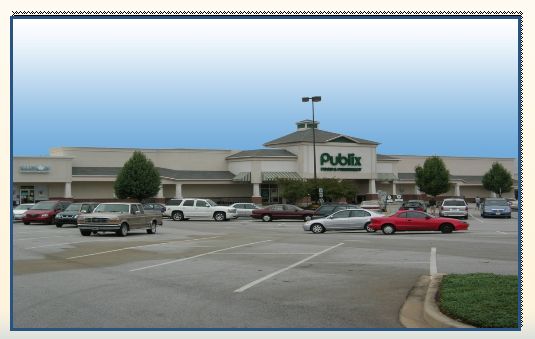 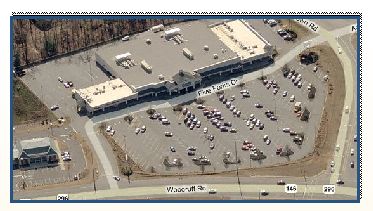  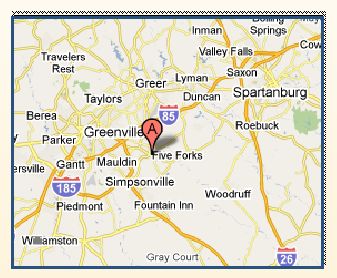  Five Forks Shopping Center – Greenville, SC Five Forks Shopping Center – Greenville, SC Closed for approx. $7.8M Approx. 97% leased, Publix anchored center Sales per sq. ft increased at Publix through recession BMW continues to expand in the area Average HH income of $110K within a 3-mile radius (1) 60% population growth between 2000 – 2010 (2) Assumed $5.3 million of debt at a 5.5% rate 19 Notes: (1) Source: Claritas, 2010 |
 20 Acquisition Pipeline Acquisition Pipeline Property B Park West Place |
 21 Selected Pipeline Properties ($ in Thousands Except SF Amounts) Property State Approx. GLA Approx. Price ($) Status Comments Park West Place CA 739,234 92,000 Signed Purchase Agreement Power center with high quality tenants Shops at Foxwood FL 78,660 14,500 Signed Purchase Agreement Existing Publix with strong sales moving to this location (expansion needed) Settler’s Market VA 47,000 (300,000 Entitled) 13,500 Signed Purchase Agreement Discounted note purchase; leasing upside in high barrier to entry market Walgreens WV 14,550 4,000 Signed Purchase Agreement A+ credit tenant at attractive price Property A TX 124,927 20,000 PSA in negotiations Power center with high quality tenants Property B CA 473,640 68,000 PSA in negotiations Power center with high quality tenants Property C CA 100,551 23,000 In negotiations NNN single tenant property; unit deal at $14 Property D FL 80,000 15,000 In negotiations Retail center anchored by a non-owned Target and Lowe’s Property E FL 413,283 28,000 In negotiations Negotiating with bank; discount on note Acquisition Pipeline Summary In active negotiations on additional properties with an aggregate purchase price in excess of $500 million |
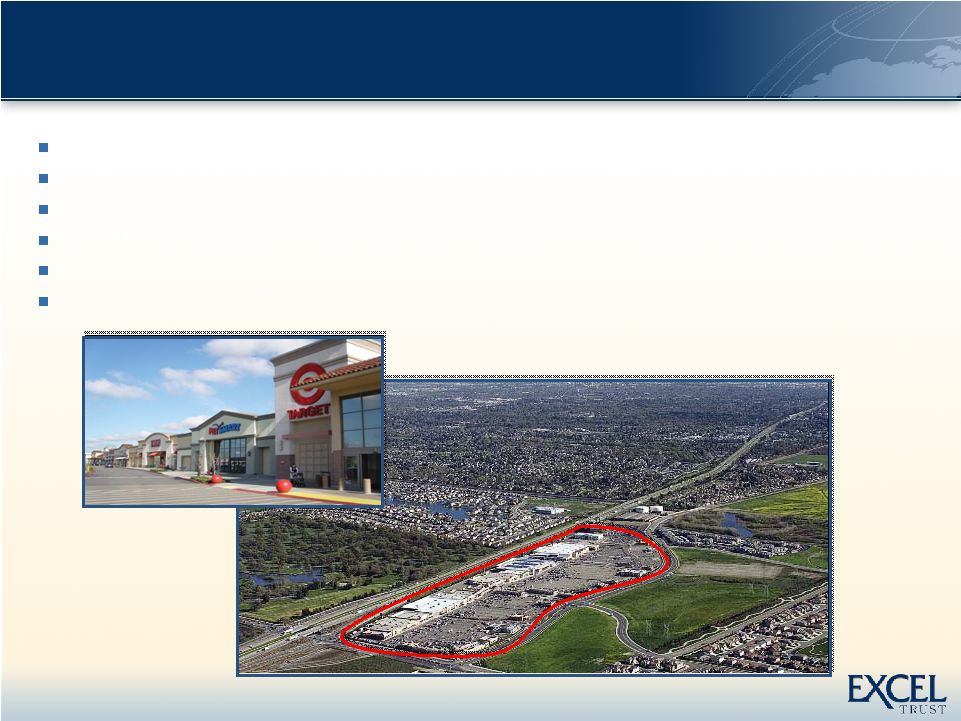 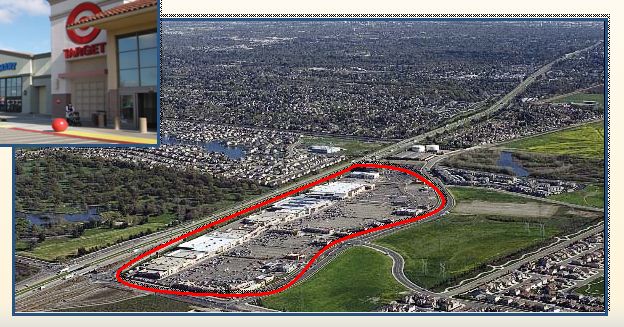  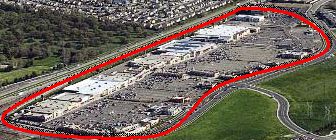  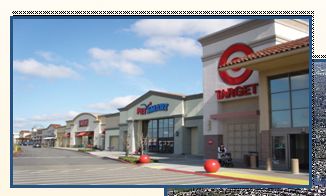  22 22 ~ 740K sq. ft. power center (~598K to be owned) with frontage on the I-5 freeway Off market transaction, currently under purchase agreement 99% leased, below market rents Anchored by Target (non-owned), Lowe’s, Kohl’s, Sports Authority, Jo-Ann, Ross Dress for Less, PetSmart, etc. Strong Demographics: In 3 / 5 mile radius the ave. HH income is $84K / $71K - population 52K /121K (1) Regional trade area draw Park West Place – Stockton, California 22 Notes: (1) Source: Claritas 2010 |
 23 23 23 Park West Place – Stockton, California Site Plan |
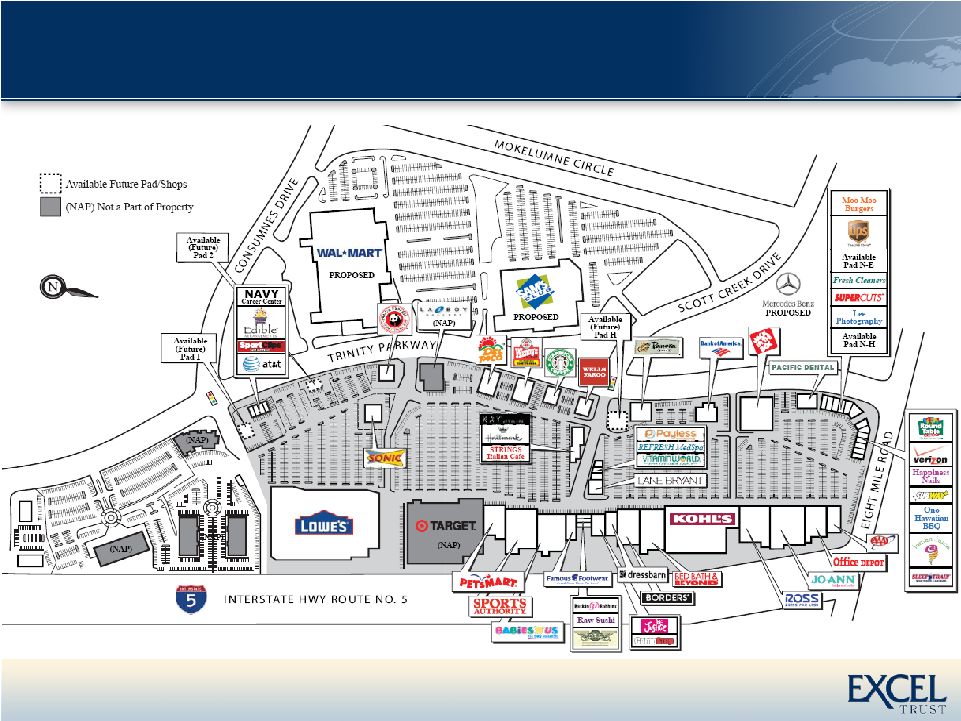
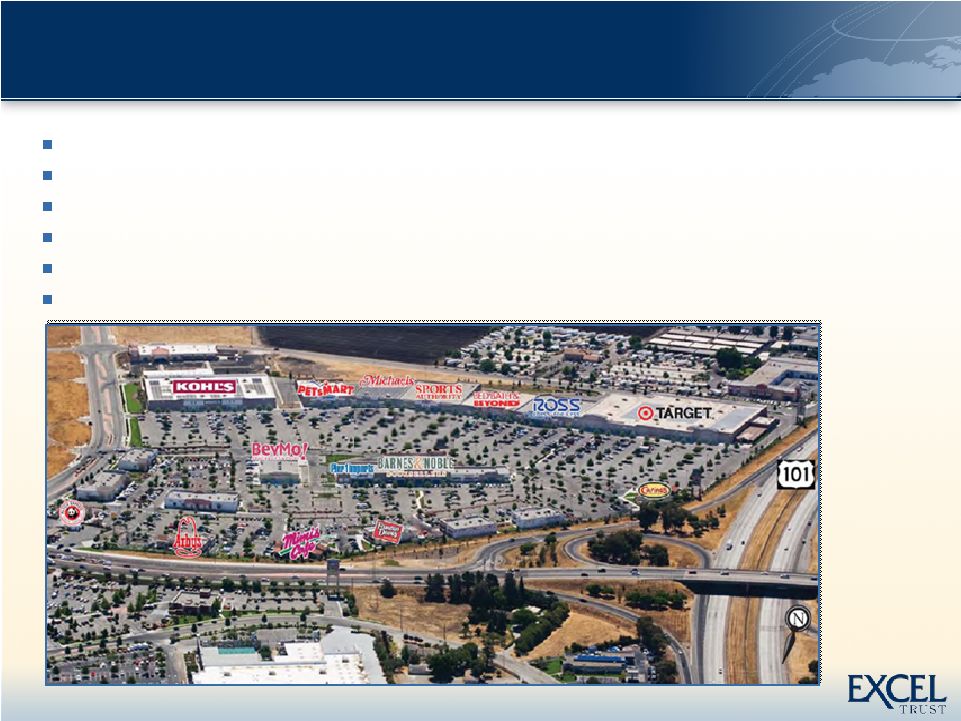  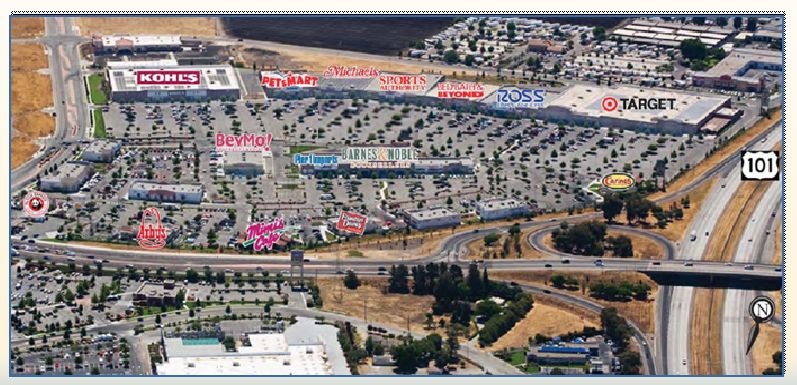 24 24 ~470K sq. ft. power center (~325K to be owned) 30 miles S. of San Jose with frontage on the 101 Freeway Relationship driven transaction 99% leased Tenants include Target (non-owned), Kohl’s, Sports Authority, Ross Dress For Less, Bed Bath & Beyond, Michaels, PetSmart Strong Demographics: In a 5 mile radius the ave. HH Income is $94K / Population is 59K (1) Regional trade area draw Power Center (Property B), California 24 Notes: (1) Source: Claritas, 2010 |
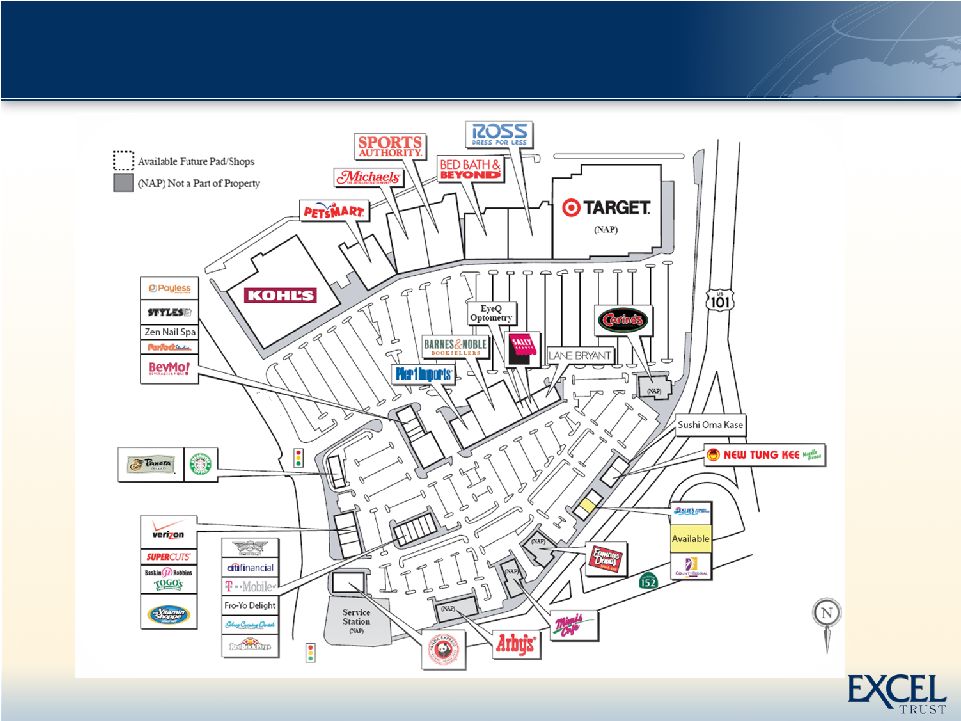 25 Power Center (Property B), California Site Plan |
 26 Financial Considerations Financial Considerations Brandywine Crossing |
 27 Growth Opportunities / Summary Growth Opportunities / Summary Notes: (1) I ncludes purchase contract properties Opportunities for Growth Debt: Expand credit facility: $125M facility with an accordion feature to $400M Assume attractive CMBS debt Obtain low interest rate secured debt on select properties OP Units: UPREIT structure provides opportunity to use units as acquisition currency Recycle Capital: Sell assets and redeploy capital where appropriate Joint Ventures: Selectively partner with firms that share our investment philosophy Preferred Stock: Capitalize on current market appetite for yield by issuing preferred shares Common Stock: Pursue a follow on offering when appropriate Company owns approx. $303M in property; additional $124M under purchase contract Pipeline of ~$500M (1) in various stages of due diligence/negotiation Declared Q3 dividend of $.08 a share Solid financial position to execute acquisition strategy Company Summary |