Exhibit 99.1
Company Presentation
January 2011
Disclaimers and Reporting Definitions
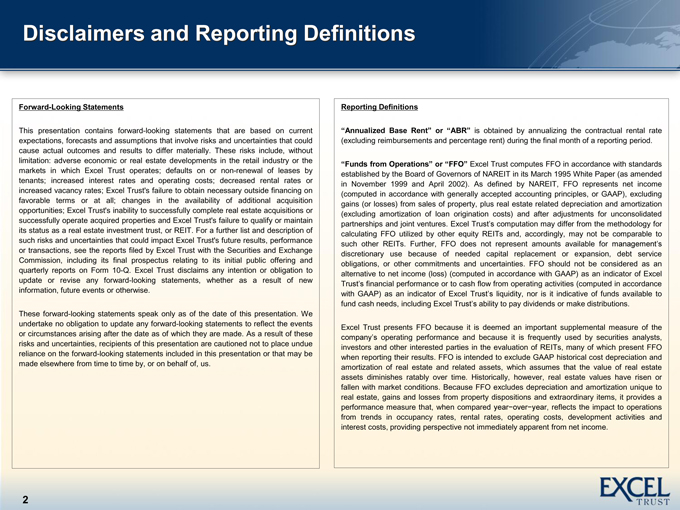
Forward-Looking Statements
This presentation contains forward-looking statements that are based on current expectations, forecasts and assumptions that involve risks and uncertainties that could cause actual outcomes and results to differ materially. These risks include, without limitation: adverse economic or real estate developments in the retail industry or the markets in which Excel Trust operates; defaults on or non-renewal of leases by tenants; increased interest rates and operating costs; decreased rental rates or increased vacancy rates; Excel Trust's failure to obtain necessary outside financing on favorable terms or at all; changes in the availability of additional acquisition opportunities; Excel Trust's inability to successfully complete real estate acquisitions or successfully operate acquired properties and Excel Trust's failure to qualify or maintain its status as a real estate investment trust, or REIT. For a further list and description of such risks and uncertainties that could impact Excel Trust's future results, performance or transactions, see the reports filed by Excel Trust with the Securities and Exchange Commission, including its final prospectus relating to its initial public offering and quarterly reports on Form 10-Q. Excel Trust disclaims any intention or obligation to update or revise any forward-looking statements, whether as a result of new information, future events or otherwise.
These forward-looking statements speak only as of the date of this presentation. We undertake no obligation to update any forward-looking statements to reflect the events or circumstances arising after the date as of which they are made. As a result of these risks and uncertainties, recipients of this presentation are cautioned not to place undue reliance on the forward-looking statements included in this presentation or that may be made elsewhere from time to time by, or on behalf of, us.
Reporting Definitions
“Annualized Base Rent” or “ABR” is obtained by annualizing the contractual rental rate (excluding reimbursements and percentage rent) during the final month of a reporting period.
“Funds from Operations” or “FFO” Excel Trust computes FFO in accordance with standards established by the Board of Governors of NAREIT in its March 1995 White Paper (as amended in November 1999 and April 2002). As defined by NAREIT, FFO represents net income (computed in accordance with generally accepted accounting principles, or GAAP), excluding gains (or losses) from sales of property, plus real estate related depreciation and amortization (excluding amortization of loan origination costs) and after adjustments for unconsolidated partnerships and joint ventures. Excel Trust’s computation may differ from the methodology for calculating FFO utilized by other equity REITs and, accordingly, may not be comparable to such other REITs. Further, FFO does not represent amounts available for management’s discretionary use because of needed capital replacement or expansion, debt service obligations, or other commitments and uncertainties. FFO should not be considered as an alternative to net income (loss) (computed in accordance with GAAP) as an indicator of Excel Trust’s financial performance or to cash flow from operating activities (computed in accordance with GAAP) as an indicator of Excel Trust’s liquidity, nor is it indicative of funds available to fund cash needs, including Excel Trust’s ability to pay dividends or make distributions.
Excel Trust presents FFO because it is deemed an important supplemental measure of the company’s operating performance and because it is frequently used by securities analysts, investors and other interested parties in the evaluation of REITs, many of which present FFO when reporting their results. FFO is intended to exclude GAAP historical cost depreciation and amortization of real estate and related assets, which assumes that the value of real estate assets diminishes ratably over time. Historically, however, real estate values have risen or fallen with market conditions. Because FFO excludes depreciation and amortization unique to real estate, gains and losses from property dispositions and extraordinary items, it provides a performance measure that, when compared year-over -year, reflects the impact to operations from trends in occupancy rates, rental rates, operating costs, development activities and interest costs, providing perspective not immediately apparent from net income.
About Excel Trust
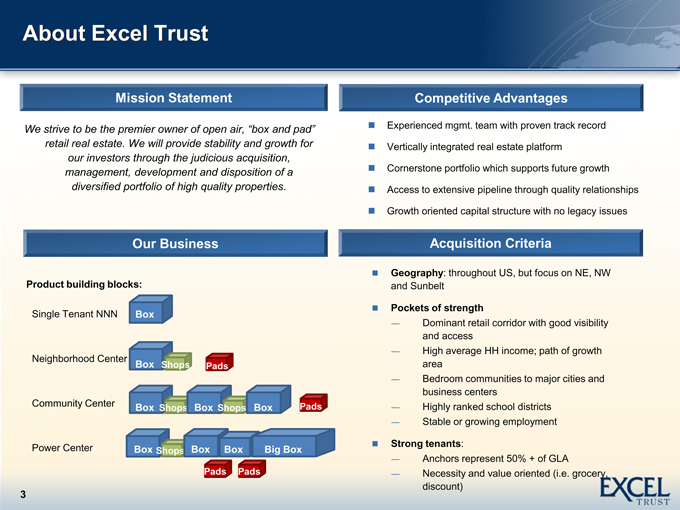
Mission Statement
We strive to be the premier owner retail real estate. We will provide stability and growth for our investors through the judicious acquisition, management, development and disposition of a diversified portfolio of high quality properties.
Competitive Advantages
of open air, “box and pad” Experienced mgmt. team with proven track record Vertically integrated real estate platform
Cornerstone portfolio which supports future growth Access to extensive pipeline through quality relationships Growth oriented capital structure with no legacy issues
Our Business
Product building blocks:
Single Tenant NNN Box
Neighborhood Center
Box Shops Pads
Community Center Box Box Box Pads Shops Shops
Power Center Box Shops Box Box Big Box Pads Pads
Acquisition Criteria
Geography: throughout US, but focus on NE, NW and Sunbelt
Pockets of strength
—
Dominant retail corridor with good visibility and access
—
High average HH income; path of growth area
—
Bedroom communities to major cities and business centers
—
Highly ranked school districts
—
Stable or growing employment
Strong tenants:
—
Anchors represent 50% + of GLA
—
Necessity and value oriented (i.e. grocery, discount)
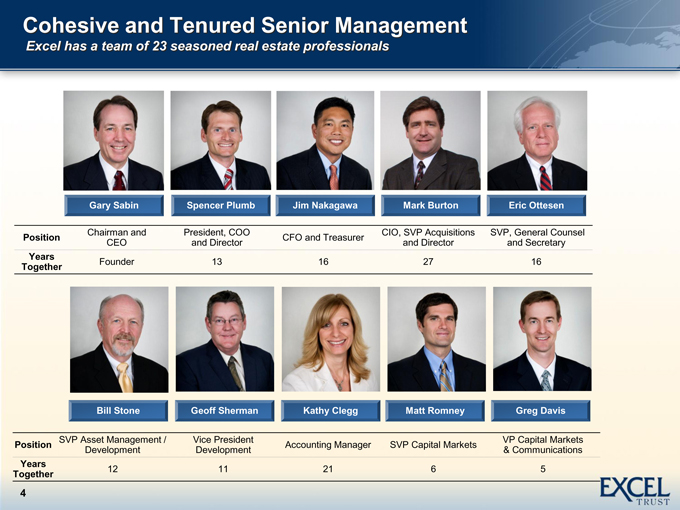
Cohesive and Tenured Senior Management
Excel has a team of 23 seasoned real estate professionals
Gary Sabin Spencer Plumb Jim Nakagawa Mark Burton Eric Ottesen
Chairman and President, COO CIO, SVP Acquisitions SVP, General Counsel Position CFO and Treasurer CEO and Director and Director and Secretary
Years
Founder 13 16 27 16
Together
Bill Stone Geoff Sherman Kathy Clegg Matt Romney Greg Davis
SVP Asset Management / Vice President VP Capital Markets Position Accounting Manager SVP Capital Markets Development Development & Communications
Years
12 11 21 6 5
Together 4
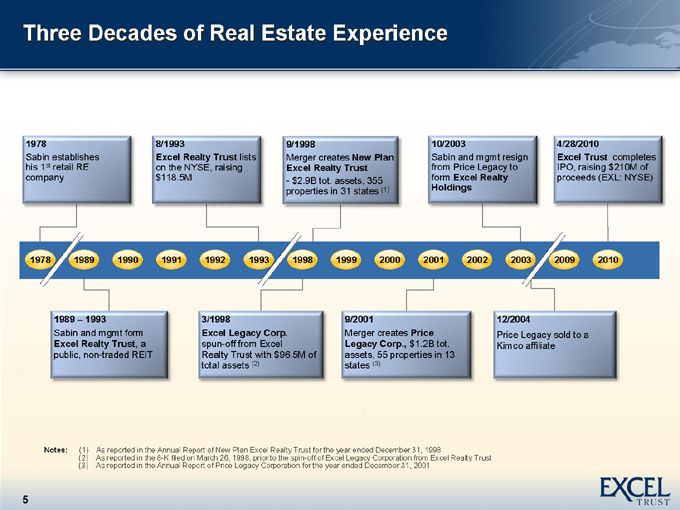
Three Decades of Real Estate Experience
1978
Sabin establishes his 1st retail RE company
8/1993
Excel Realty Trust lists on the NYSE, raising $118.5M
9/1998
Merger creates New Plan Excel Realty Trust
- $2.9B tot. assets, 355 properties in 31 states (1)
10/2003
Sabin and mgmt resign from Price Legacy to form Excel Realty Holdings
4/28/2010
Excel Trust completes IPO, raising $210M of proceeds (EXL: NYSE)
1978
1989 1990 1991 1992 1993
1998 1999 2000 2001 2002 2003
2009 2010
1989 – 1993
Sabin and mgmt form
Excel Realty Trust, a public, non-traded REIT
3/1998
Excel Legacy Corp. spun-off from Excel Realty Trust with $96.5M of total assets (2)
9/2001
Merger creates Price Legacy Corp., $1.2B tot. assets, 55 properties in 13 states (3)
12/2004
Price Legacy sold to a Kimco affiliate
Notes:
(1) As reported in the Annual Report of New Plan Excel Realty Trust for the year ended December 31, 1998 (2) As reported in the 8-K filed on March 26, 1998, prior to the spin-off of Excel Legacy Corporation from Excel Realty Trust (3) As reported in the Annual Report of Price Legacy Corporation for the year ended December 31, 2001

Portfolio Overview
Plaza at Rockwall

Portfolio Overview
as of December 31, 2010
Operating Portfolio Statistics
# of Properties closed since IPO 23 Gross asset value—properties $414M Approx. total GLA (SF) 2.6M Approx. percent leased 95% Approx. portfolio price/sq. ft. (1) $153 3 / 5 mile weighted average HH income (2) $84K / $79K 3 / 5 mile weighted average population (2) 40K / 105K Weighted average age in years (3) 5
Strong Tenant Base
Properties anchored by tenants that offer necessity and value oriented items
High credit quality anchor tenants provide stability to revenues
Notes: (1) Does not include Red Rock Commons or Rockwall Phase II which are land parcels to be developed.
(2) Source: Claritas, 2010. Weighted by GLA; does not include single tenant properties or properties for development. (3) Weighted by GLA; based on year built or year of last major renovation if applicable.
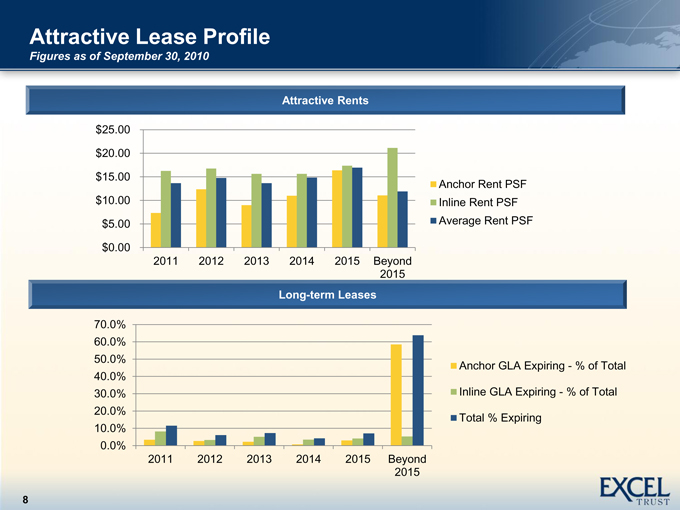
Attractive Lease Profile
Figures as of September 30, 2010
Attractive Rents
$25.00 $20.00 $15.00 $10.00 $5.00 $0.00
2011 2012 2013 2014 2015 Beyond 2015
Anchor Rent PSF Inline Rent PSF Average Rent PSF
Long-term Leases
70.0% 60.0% 50.0% 40.0% 30.0% 20.0% 10.0% 0.0%
2011 2012 2013 2014 2015 Beyond 2015
Anchor GLA Expiring—% of Total Inline GLA Expiring—% of Total Total % Expiring
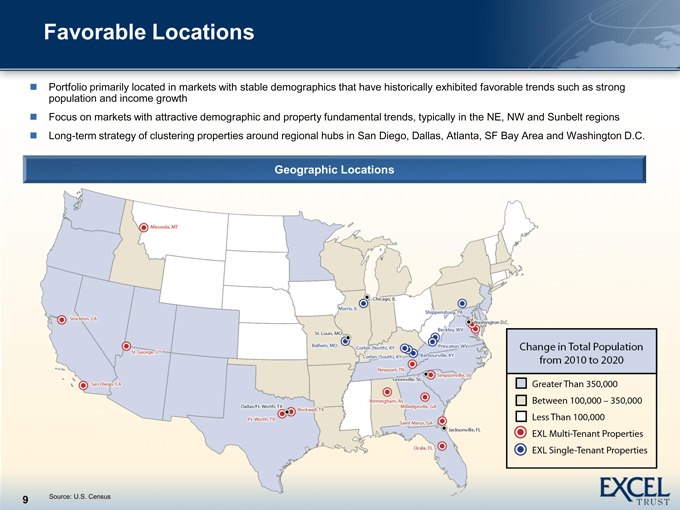
Favorable Locations
Portfolio primarily located in markets with stable demographics that have historically exhibited favorable trends such as strong population and income growth Focus on markets with attractive demographic and property fundamental trends, typically in the NE, NW and Sunbelt regions Long-term strategy of clustering properties around regional hubs in San Diego, Dallas, Atlanta, SF Bay Area and Washington D.C.
Geographic Locations
Source: U.S. Census
9
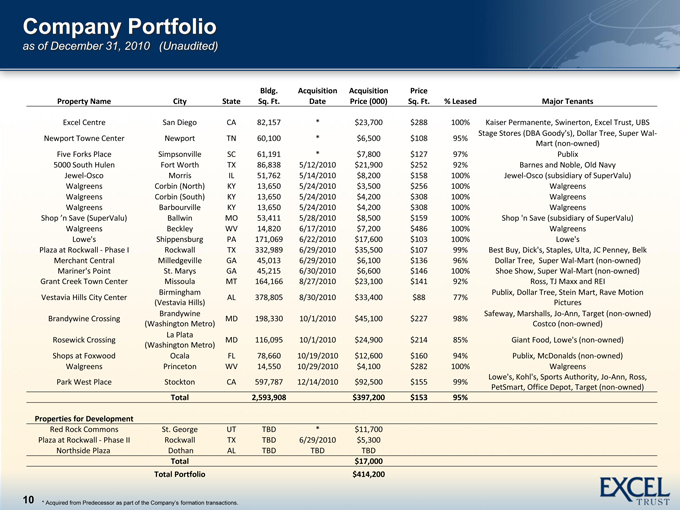
Company Portfolio
as of December 31, 2010 (Unaudited)
Bldg. Acquisition Acquisition Price
Property Name City State Sq. Ft. Date Price (000) Sq. Ft. % Leased Major Tenants
Excel Centre San Diego CA 82,157 * $23,700 $288 100% Kaiser Permanente, Swinerton, Excel Trust, UBS
Stage Stores (DBA Goody's), Dollar Tree, Super Wal-
Newport Towne Center Newport TN 60,100 * $6,500 $108 95%
Mart (non-owned)
Five Forks Place Simpsonville SC 61,191 * $7,800 $127 97% Publix
5000 South Hulen Fort Worth TX 86,838 5/12/2010 $21,900 $252 92% Barnes and Noble, Old Navy
Jewel-Osco Morris IL 51,762 5/14/2010 $8,200 $158 100% Jewel-Osco (subsidiary of SuperValu)
Walgreens Corbin (North) KY 13,650 5/24/2010 $3,500 $256 100% Walgreens
Walgreens Corbin (South) KY 13,650 5/24/2010 $4,200 $308 100% Walgreens
Walgreens Barbourville KY 13,650 5/24/2010 $4,200 $308 100% Walgreens
Shop ’n Save (SuperValu)Ballwin MO 53,411 5/28/2010 $8,500 $159 100% Shop 'n Save (subsidiary of SuperValu)
Walgreens Beckley WV 14,820 6/17/2010 $7,200 $486 100% Walgreens
Lowe's Shippensburg PA 171,069 6/22/2010 $17,600 $103 100% Lowe's
Plaza at Rockwall—Phase I Rockwall TX 332,989 6/29/2010 $35,500 $107 99% Best Buy, Dick's, Staples, Ulta, JC Penney, Belk
Merchant Central Milledgeville GA 45,013 6/29/2010 $6,100 $136 96% Dollar Tree, Super Wal-Mart (non-owned)
Mariner's Point St. Marys GA 45,215 6/30/2010 $6,600 $146 100% Shoe Show, Super Wal-Mart (non-owned)
Grant Creek Town Center Missoula MT 164,166 8/27/2010 $23,100 $141 92% Ross, TJ Maxx and REI
Birmingham Publix, Dollar Tree, Stein Mart, Rave Motion
Vestavia Hills City Center AL 378,805 8/30/2010 $33,400 $88 77%
(Vestavia Hills) Pictures
Brandywine Safeway, Marshalls, Jo-Ann, Target (non-owned)
Brandywine Crossing MD 198,330 10/1/2010 $45,100 $227 98%
(Washington Metro) Costco (non-owned)
La Plata
Rosewick Crossing MD 116,095 10/1/2010 $24,900 $214 85% Giant Food, Lowe's (non-owned)
(Washington Metro)
Shops at Foxwood Ocala FL 78,660 10/19/2010 $12,600 $160 94% Publix, McDonalds (non-owned)
Walgreens Princeton WV 14,550 10/29/2010 $4,100 $282 100% Walgreens
Lowe's, Kohl's, Sports Authority, Jo-Ann, Ross,
Park West Place Stockton CA 597,787 12/14/2010 $92,500 $155 99%
PetSmart, Office Depot, Target (non-owned)
Total 2,593,908 $397,200 $153 95%
Properties for Development
Red Rock Commons St. George UT TBD * $11,700
Plaza at Rockwall—Phase II Rockwall TX TBD 6/29/2010 $5,300
Northside Plaza Dothan AL TBD TBD TBD
Total $17,000
Total Portfolio $414,200
10 * Acquired from Predecessor as part. of the Company’s formation transactions
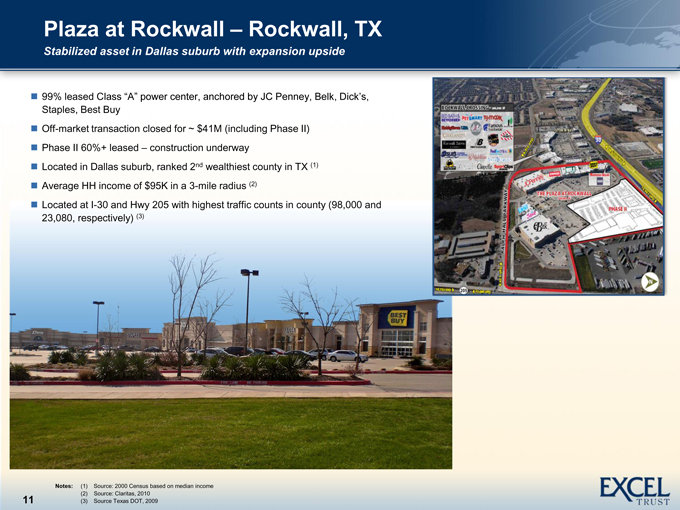
Plaza at Rockwall – Rockwall, TX
Stabilized asset in Dallas suburb with expansion upside
99% leased Class
—
A power center, anchored by JC Penney, Belk, Dick’s, by Jc Penney, Belk, Dick’s,
Staples, Best Buy
Off-market transaction closed for ~ $41M (including Phase II) Phase II 60%+ leased – construction underway Located in Dallas suburb, ranked 2nd wealthiest county in TX (1) Average HH income of $95K in a 3-mile radius (2)
Located at I-30 and Hwy 205 with highest traffic counts in county (98,000 and 23,080, respectively) (3)
Notes: (1) Source: 2000 Census based on median income (2) Source: Claritas, 2010 (3) Source Texas DOT, 2009
11
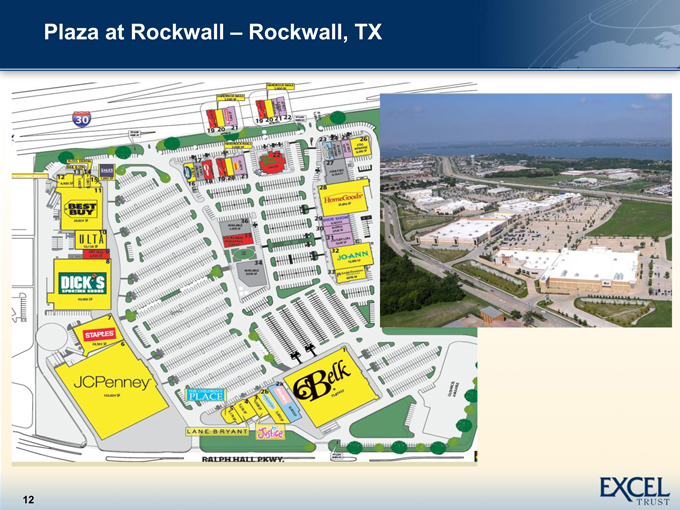
Plaza at Rockwall – Rockwall, TX
12
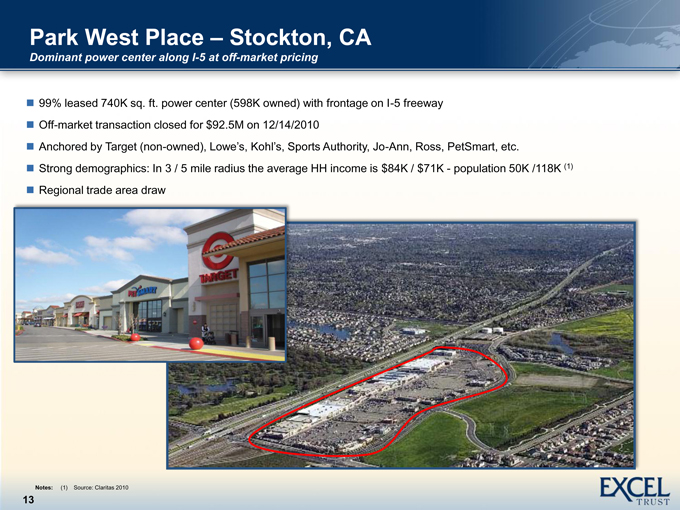
Park West Place – Stockton, CA
Dominant power center along I-5 at off-market pricing
99% leased 740K sq. ft. power center (598K owned) with frontage on I-5 freeway Off-market transaction closed for $92.5M on 12/14/2010
Anchored by Target (non-owned), Lowe’s, Kohl’s, Jo-Ann, Ross, PetSmart, etc.Sports Authority, Strong demographics: In 3 / 5 mile radius the average HH income is $84K / $71K—population 50K /118K (1) Regional trade area draw
Notes: (1) Source: Claritas 2010
13
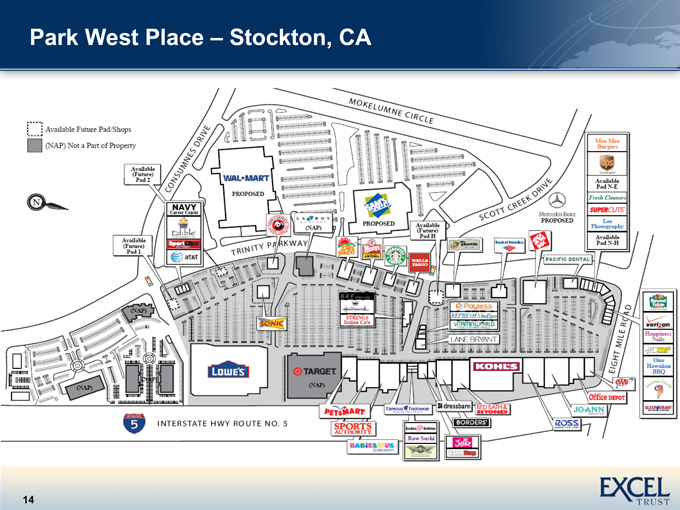
Park West Place – Stockton, CA
14
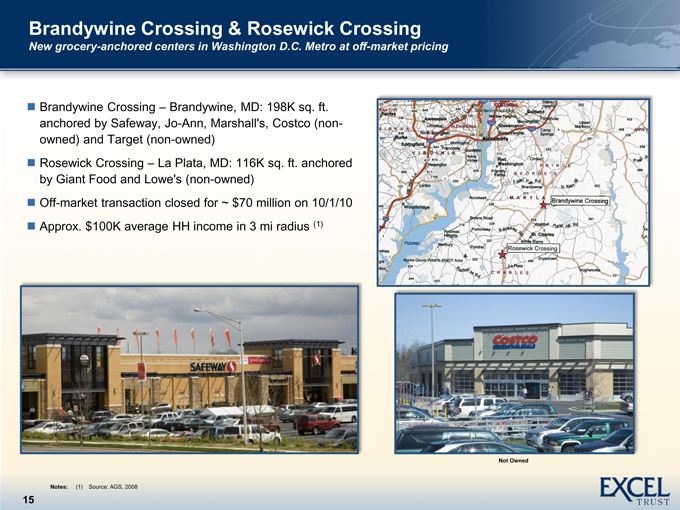
Brandywine Crossing & Rosewick Crossing
New grocery-anchored centers in Washington D.C. Metro at off-market pricing
Brandywine Crossing – Brandywine, MD: 198K sq. ft. anchored by Safeway, Jo-Ann, Marshall's, Costco (non-owned) and Target (non-owned) Rosewick Crossing – La Plata, MD: 116K sq. ft. anchored by Giant Food and Lowe's (non-owned) Off-market transaction closed for ~ $70 million on 10/1/10 Approx. $100K average HH income in 3 mi radius (1)
Notes: (1) Source: AGS, 2008
15
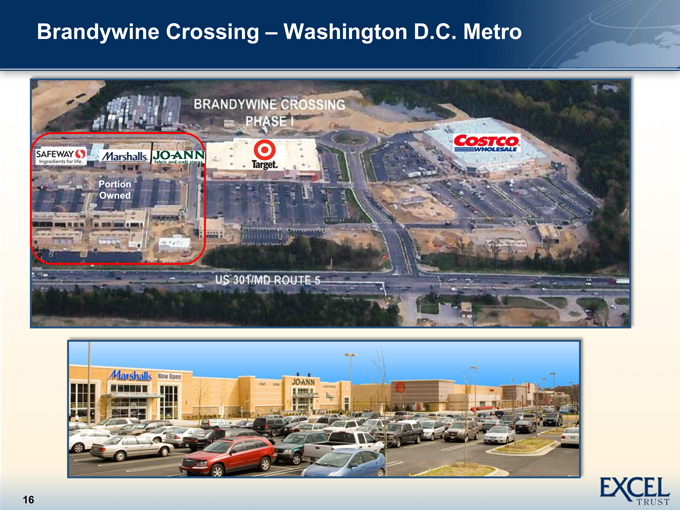
Brandywine Crossing – Washington D.C. Metro
16
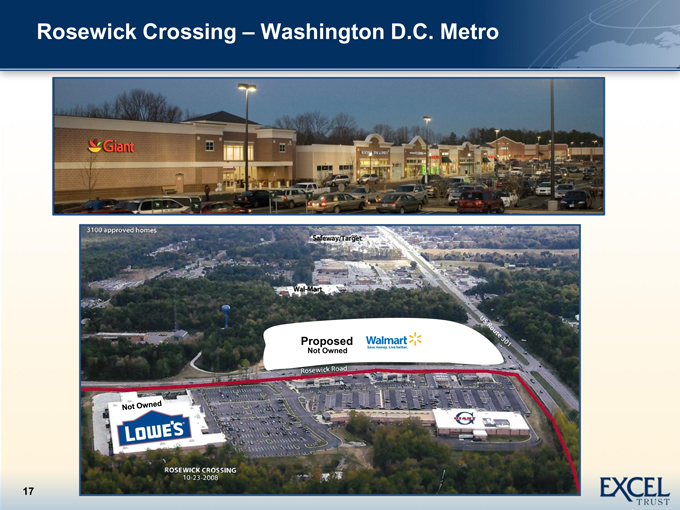
Rosewick Crossing – Washington D.C. Metro
17
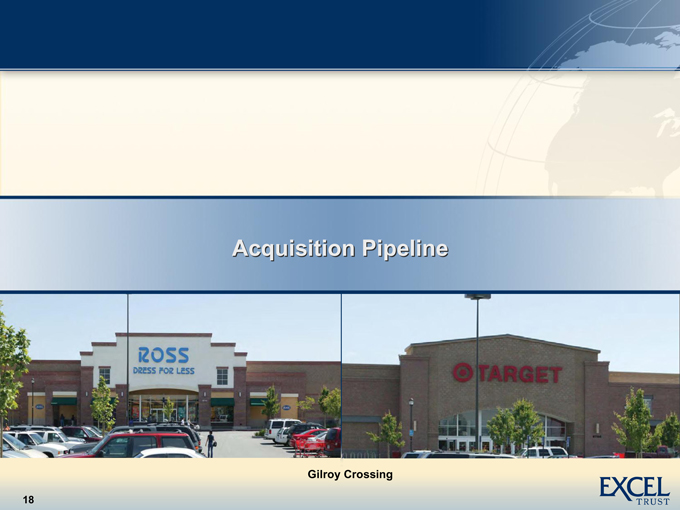
Acquisition Pipeline
Gilroy Crossing
18
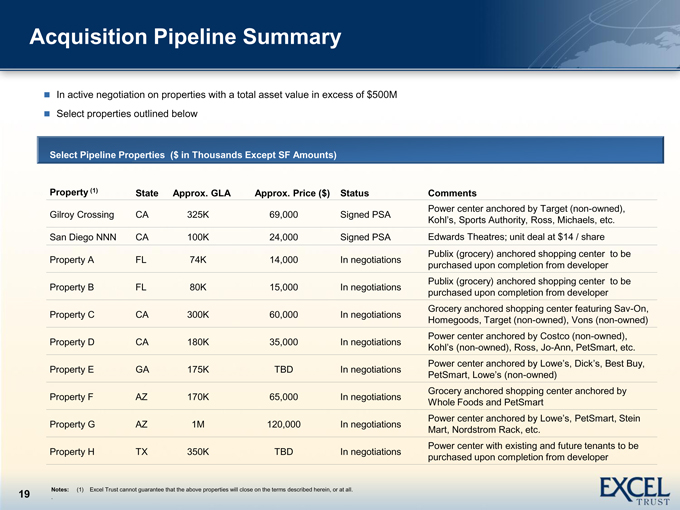
Acquisition Pipeline Summary
In active negotiation on properties with a total asset value in excess of $500M Select properties outlined below
Select Pipeline Properties ($ in Thousands Except SF Amounts)
Property (1) State Approx. GLA Approx. Price ($) Status Comments
Power center anchored by Target (non-owned),
Gilroy Crossing CA 325K 69,000 Signed PSA Kohl’s, Sports Authority, Ross, Michaels, etc.
San Diego NNN CA 100K 24,000 Signed PSA Edwards Theatres; unit deal at $14 / share
Publix (grocery) anchored shopping center to be
Property A FL 74K 14,000 In negotiations purchased upon completion from developer
Publix (grocery) anchored shopping center to be
Property B FL 80K 15,000 In negotiations purchased upon completion from developer
Grocery anchored shopping center featuring Sav-On,
Property C CA 300K 60,000 In negotiations Homegoods, Target (non-owned), Vons (non-owned)
Power center anchored by Costco (non-owned), lowe’s Dick’s, Best buy,
Property D CA 180K 35,000 In negotiations Kohl’s-owned),(nonRoss, Jo-Ann, PetSmart, etc.
Power center anchored by
Property E GA 175K TBD In negotiations PetSmart, Lowe’s-owned)(non
Grocery anchored shopping center anchored by
Property F AZ 170K 65,000 In negotiations Whole Foods and PetSmart
Power center anchoredPetSmart, Steinby
Property G AZ 1M 120,000 In negotiations Mart, Nordstrom Rack, etc.
Power center with existing and future tenants to be
Property H TX 350K TBD In negotiations purchased upon completion from developer
19 Notes: (1) Excel Trust cannot guarantee that the above properties will close on the terms described herein, or at all. .
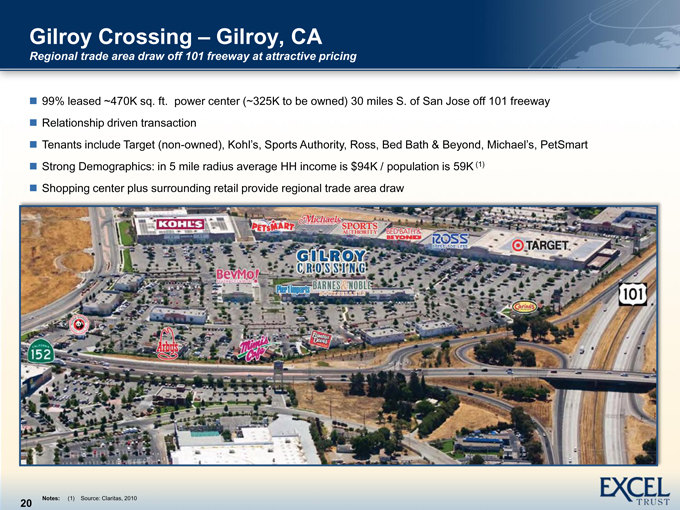
Gilroy Crossing – Gilroy, CA
Regional trade area draw off 101 freeway at attractive pricing
99% leased ~470K sq. ft. power center (~325K to be owned) 30 miles S. of San Jose off 101 freeway Relationship driven transaction
Tenants include Target (non-owned), Kohl’s, Sports Authority, PetSmartRoss, Bed Bath & beyond, Michaels,
Strong Demographics: in 5 mile radius average HH income is $94K / population is 59K (1) Shopping center plus surrounding retail provide regional trade area draw
Notes: (1) Source: Claritas, 2010
20
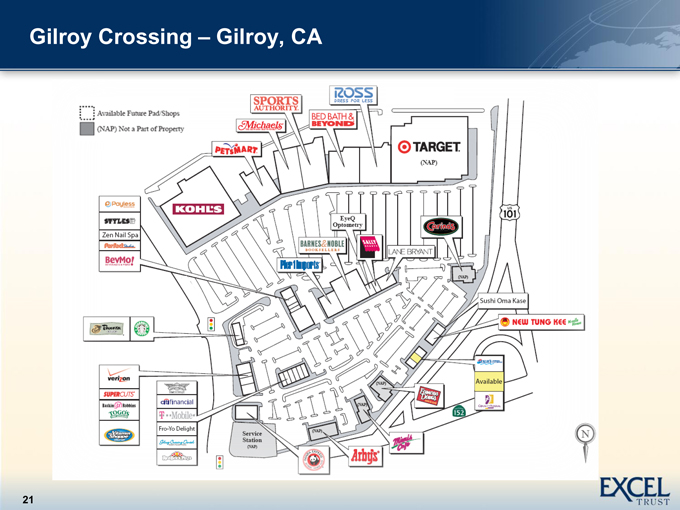
Gilroy Crossing – Gilroy, CA
Appendix
Plaza at Rockwall
22
|
Company Portfolio – Detailed List as of December 31, 2010 (Unaudited) Company Portfolio – Detailed List as of December 31, 2010 (Unaudited) 23 Property Name City State Year Built (1) Total GLA (2) Acquisition Date Acquisition Price ($ in 000's) Price Sq. Ft. % Leased # of Tenants Major Tenants (3) Major Lease Expiration Date Annualized Base Rent (4) ($ in 000's) % Annualized Base Rent Related to Anchor (5) Excel Centre San Diego CA 1999 82,157 ** $23,700 $288 100% 13 Kaiser Permanente*, Swinerton, Excel Trust, UBS 2019 $2,909 78.3 Newport Towne Center Newport TN 2006 60,100 ** $6,500 $108 95% 15 Stage Stores (DBA Goody's), Dollar Tree*, Super Wal-Mart (non-owned) 2011 $465 17.2 Five Forks Place Simpsonville SC 2002 61,191 ** $7,800 $127 97% 11 Publix* 2022 $737 63.7 5000 South Hulen Fort Worth TX 2005 86,838 5/12/2010 $21,900 $252 92% 18 Barnes and Noble*, Old Navy 2015 $1,877 36.5 Jewel-Osco Morris IL 1999 (9) 51,762 5/14/2010 $8,200 $158 100% 1 Jewel-Osco (subsidiary of SuperValu)* 2024 $660 100 Walgreens Corbin (North) KY 2009 13,650 5/24/2010 $3,500 $256 100% 1 Walgreens* 2034 (10) $282 100 Walgreens Corbin (South) KY 2009 13,650 5/24/2010 $4,200 $308 100% 1 Walgreens* 2034 (10) $335 100 Walgreens Barbourville KY 2008 13,650 5/24/2010 $4,200 $308 100% 1 Walgreens* 2033 (10) $337 100 Shop ’n Save (SuperValu) Ballwin MO 2007 53,411 5/28/2010 $8,500 $159 100% 1 Shop 'n Save (subsidiary of SuperValu)* 2027 $737 (8) 97.8 Walgreens Beckley WV 2008 14,820 6/17/2010 $7,200 $486 100% 1 Walgreens* 2033 (10) $575 100 Lowe's Shippensburg PA 2008 171,069 6/22/2010 $17,600 $103 100% 1 Lowe's* 2031 $1,475 100 Plaza at Rockwall - Phase I Rockwall TX 2007 332,989 (6) 6/29/2010 $35,500 $107 99% 15 Best Buy, Dick's*, Staples, Ulta, JC Penney, Belk 2018 $2,977 (7) 80.1 Merchant Central Milledgeville GA 2004 45,013 6/29/2010 $6,100 $136 96% 17 Dollar Tree (12) , Super Wal-Mart (non- owned) 2014 $581 — (12) Mariner's Point St. Marys GA 2001 45,215 6/30/2010 $6,600 $146 100% 18 Shoe Show (11) , Super Wal-Mart (non- owned) 2011 $663 — (11) Grant Creek Town Center Missoula MT 1998 164,166 8/27/2010 $23,100 $141 92% 28 Ross, TJ Maxx and REI* 2020 $1,941 52.7 Vestavia Hills City Center Birmingham (Vestavia Hills) AL 2002 378,805 8/30/2010 $33,400 $88 77% 55 Publix, Dollar Tree, Stein Mart, Rave Motion Pictures* 2022 $4,058 47.9 Brandywine Crossing Brandywine (Washington Metro) MD 2009 198,330 (14) 10/1/2010 $45,100 $227 98% 31 Safeway*, Marshalls, Jo-Ann, Target (non-owned) Costco (non-owned) 2028 $3,608 36 Rosewick Crossing La Plata (Washington Metro) MD 2008 116,095 (15) 10/1/2010 $24,900 $215 85% 15 Giant Food*, Lowe's (non-owned) 2028 $1,838 38.7 Shops at Foxwood Ocala FL 2010 78,660 10/19/2010 $12,600 $160 94% 13 Publix*, McDonalds (non-owned) 2030 $845 69.1 Walgreens Princeton WV 2008 14,550 10/29/2010 $4,100 $282 100% 1 Walgreens* 2033 (10) $323 100 Park West Place Stockton CA 2005 597,787 (13) 12/14/2010 $92,500 $155 99% 53 Lowe's*, Kohl's, Sports Authority, Jo- Ann, Ross, PetSmart, Office Depot, Target (non-owned) 2026 $7,203 56.3 Total 2,593,908 $397,200 $153 95% $34,426 58.8 Properties for Development Red Rock Commons St. George UT TBD TBD * $11,700 Plaza at Rockwall - Phase II Rockwall TX TBD TBD 6/29/2010 $5,300 Northside Plaza Dothan AL TBD TBD TBD TBD Total $17,000 Total Portfolio $414,200 Note: See footnotes on following page. |
Company Portfolio – Detailed List
Footnotes
Footnotes
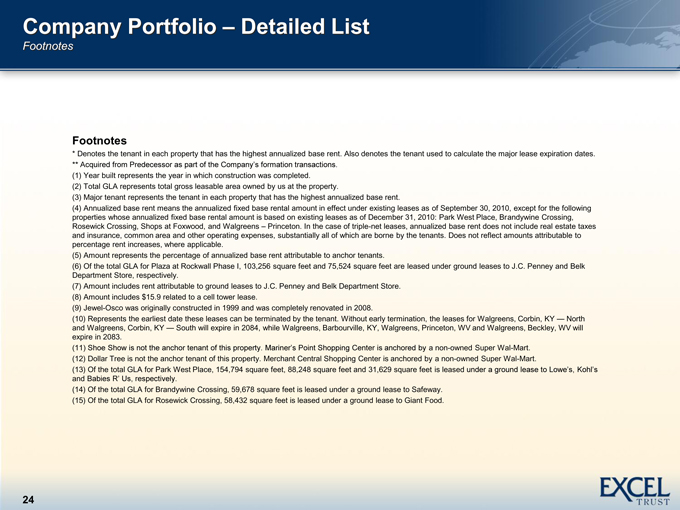
* Denotes the tenant in each property that has the highest annualized base rent. Also denotes the tenant used to calculate the major lease expiration dates.
** Acquired from Predecessor as part of the Company’s formation transactions (1) Year built represents the year in which construction was completed.
(2) | | Total GLA represents total gross leasable area owned by us at the property. |
(3) | | Major tenant represents the tenant in each property that has the highest annualized base rent. |
(4) Annualized base rent means the annualized fixed base rental amount in effect under existing leases as of September 30, 2010, except for the following properties whose annualized fixed base rental amount is based on existing leases as of December 31, 2010: Park West Place, Brandywine Crossing, Rosewick Crossing, Shops at Foxwood, and Walgreens – Princeton. In the case of triple-net leases, annualized base rent does not include real estate taxes and insurance, common area and other operating expenses, substantially all of which are borne by the tenants. Does not reflect amounts attributable to percentage rent increases, where applicable.
(5) | | Amount represents the percentage of annualized base rent attributable to anchor tenants. |
(6) Of the total GLA for Plaza at Rockwall Phase I, 103,256 square feet and 75,524 square feet are leased under ground leases to J.C. Penney and Belk Department Store, respectively.
(7) Amount includes rent attributable to ground leases to J.C. Penney and Belk Department Store. (8) Amount includes $15.9 related to a cell tower lease. (9) Jewel-Osco was originally constructed in 1999 and was completely renovated in 2008.
(10) Represents the earliest date these leases can be terminated by the tenant. Without early termination, the leases for Walgreens, Corbin, KY — North and Walgreens, Corbin, KY — South will
expire in 2084, while Walgreens, Barbourville, KY, Walgreens, Princeton, WV and Walgreens, Beckley, WV will expire in 2083.
(11) | | Shoe Show is not the anchor tenant of thisa non-owned SuperpropertyWal. -Mart.Mariner’s Point shopping center is anchored by a non -owned super wal-mart. |
(12) Dollar Tree is not the anchor tenant of this property. Merchant Central Shopping Center is anchored by a non-owned Super Wal-Mart.
(13) Of the total GLA for Park West Place, 154,794 square feet, 88,248 square feet and 31,629 square feet is leased under a ground lease to Lowe’s, Kohl’s and Babies R’ Us, respectively.
(14) Of the total GLA for Brandywine Crossing, 59,678 square feet is leased under a ground lease to Safeway. (15) Of the total GLA for Rosewick Crossing, 58,432 square feet is leased under a ground lease to Giant Food.
24
Property Disclosures
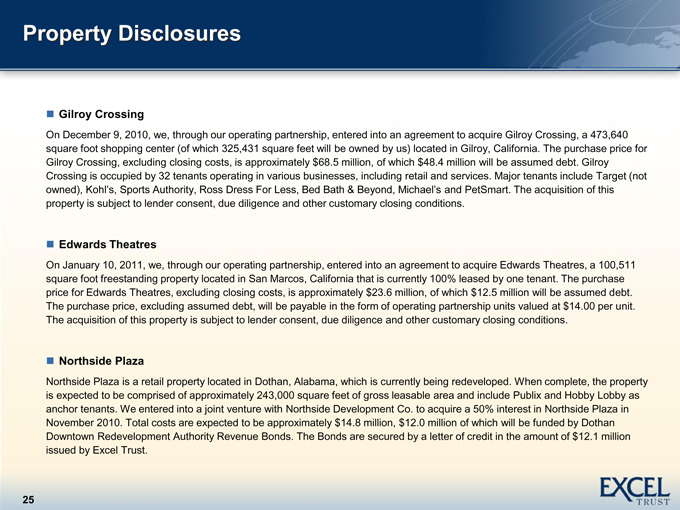
Gilroy Crossing
On December 9, 2010, we, through our operating partnership, entered into an agreement to acquire Gilroy Crossing, a 473,640 square foot shopping center (of which 325,431 square feet will be owned by us) located in Gilroy, California. The purchase price for Gilroy Crossing, excluding closing costs, is approximately $68.5 million, of which $48.4 million will be assumed debt. Gilroy Crossing is occupied by 32 tenants operating in various businesses, including retail and services. Major tenants include Target (not owned), Kohl’s, Sports Authority, Ross Dress PetSmart. The acquisition of this For Less, Bed bath & beyond, michael’s and property is subject to lender consent, due diligence and other customary closing conditions.
Edwards Theatres
On January 10, 2011, we, through our operating partnership, entered into an agreement to acquire Edwards Theatres, a 100,511 square foot freestanding property located in San Marcos, California that is currently 100% leased by one tenant. The purchase price for Edwards Theatres, excluding closing costs, is approximately $23.6 million, of which $12.5 million will be assumed debt. The purchase price, excluding assumed debt, will be payable in the form of operating partnership units valued at $14.00 per unit. The acquisition of this property is subject to lender consent, due diligence and other customary closing conditions.
Northside Plaza
Northside Plaza is a retail property located in Dothan, Alabama, which is currently being redeveloped. When complete, the property is expected to be comprised of approximately 243,000 square feet of gross leasable area and include Publix and Hobby Lobby as anchor tenants. We entered into a joint venture with Northside Development Co. to acquire a 50% interest in Northside Plaza in November 2010. Total costs are expected to be approximately $14.8 million, $12.0 million of which will be funded by Dothan Downtown Redevelopment Authority Revenue Bonds. The Bonds are secured by a letter of credit in the amount of $12.1 million issued by Excel Trust.
25
nagendra.bendre
nagendra.bendre
2011-01-20T11:25:00Z
2011-01-20T11:25:00Z
Normal
25
3800
23520
Microsoft Office Word
0
196
54
false
Title
false
27266
false
false
12.0000