Table of Contents
UNITED STATES
SECURITIES AND EXCHANGE COMMISSION
Washington, D.C. 20549
FORM N-CSR
CERTIFIED SHAREHOLDER REPORT OF REGISTERED MANAGEMENT
INVESTMENT COMPANIES
Investment Company Act file number: 811-22376
PIMCO Equity Series VIT
(Exact name of registrant as specified in charter)
840 Newport Center Drive, Newport Beach, CA 92660
(Address of principal executive offices)
John P. Hardaway
Treasurer and Principal Financial Officer
PIMCO Equity Series VIT
840 Newport Center Drive
Newport Beach, CA 92660
(Name and address of agent for service)
Copies to:
Brendan C. Fox
Dechert LLP
1775 I Street, N.W.
Washington, D.C. 20006
Registrant’s telephone number, including area code: (800) 927-4648
Date of fiscal year end: December 31
Date of reporting period: December 31, 2010
Form N-CSR is to be used by management investment companies to file reports with the Commission not later than 10 days after the transmission to stockholders of any report that is required to be transmitted to stockholders under Rule 30e-1 under the Investment Company Act of 1940 (17 CFR 270.30e-1). The Commission may use the information provided on Form N-CSR in its regulatory, disclosure review, inspection, and policymaking roles.
A registrant is required to disclose the information specified by Form N-CSR, and the Commission will make this information public. A registrant is not required to respond to the collection of information contained in Form N-CSR unless the Form displays a currently valid Office of Management and Budget (“OMB”) control number. Please direct comments concerning the accuracy of the information collection burden estimate and any suggestions for reducing the burden to Secretary, Securities and Exchange Commission, 450 Fifth Street, NW, Washington, DC 20549-0609. The OMB has reviewed this collection of information under the clearance requirements of 44 U.S.C. § 3507.
Table of Contents
Item 1. Reports to Stockholders.
The following is a copy of the report transmitted to stockholders pursuant to Rule 30e-1 under the Investment Company Act of 1940, as amended (the “1940 Act”) (17 CFR 270.30e-1).
| • | PIMCO Equity Series VIT—Institutional Class |
| • | PIMCO Equity Series VIT—Advisor Class |
Table of Contents
| Share Class | Institutional |
Annual Report December 31, 2010

PIMCO Equity Series VIT
PIMCO EqS Pathfinder Portfolio™


Table of Contents
| Page | ||||||||
| 1 | ||||||||
| 2 | ||||||||
| 5 | ||||||||
| 7 | ||||||||
| 8 | ||||||||
| 9 | ||||||||
| 10 | ||||||||
| 11 | ||||||||
| 12 | ||||||||
| 17 | ||||||||
| 23 | ||||||||
| 24 | ||||||||
| 25 | ||||||||
| 26 | ||||||||
This material is authorized for use only when preceded or accompanied by the current PIMCO Equity Series VIT (the “Trust”) prospectus for the Portfolio. Investors should consider the investment objectives, risks, charges and expenses of this Portfolio carefully before investing. Ask your financial professional to explain all charges that may apply. This and other information is contained in the Portfolio’s prospectus. The variable product prospectus may be obtained by contacting your Investment Consultant. Please read the Portfolio and variable product prospectuses carefully before you invest or send money.
Table of Contents
Dear Shareholder,
Please find enclosed the Annual Report for the PIMCO Equity Series VIT covering the reporting period from the inception of the PIMCO EqS Pathfinder Portfolio™ on April 14, 2010 through December 31, 2010.
On the following pages are specific details about the investment performance of the Portfolio and a discussion of the factors that affected performance during the reporting period. In addition, the letter from the portfolio managers provides a further review of the factors that influenced Portfolio performance as well as an overview of the Portfolio’s investment strategy.
General highlights of the financial markets during our reporting period include:
| n | Equity markets worldwide were volatile but staged an impressive rally in the last quarter of the reporting period, making up losses posted over the spring and summer months of 2010. Early in the reporting period, investor concerns over rising U.S. unemployment, the potential for a double-dip recession, and the ongoing sovereign debt crisis in Europe helped move equity returns lower. However, renewed investor enthusiasm for riskier assets during the latter part of the reporting period helped move equities higher, due in part to the announcement of expanded quantitative easing programs, and the passage of the Obama administration’s package of tax cuts and extension of unemployment benefits. U.S. equities, as measured by the S&P 500 Index, returned 5.40% and international equities, as represented by the MSCI World Index, returned 4.81%. |
| n | Although yields on U.S. Treasury securities generally ended the period lower than at the beginning of the reporting period on April 14, 2010, an improved economic outlook and market reaction to expanded fiscal policy and monetary stimulus helped drive yields higher toward the latter part of the calendar year. The Federal Reserve again kept short-term yields anchored at low levels, causing a steepening of the U.S. Treasury yield curve. |
Thank you again for the trust you have placed in us. We value your commitment and will continue to work diligently to meet your broad investment needs.
Sincerely,

Brent R. Harris
Chairman of the Board, PIMCO Equity Series VIT
January 20, 2011
| Annual Report | December 31, 2010 | 1 |
Table of Contents
Insights from the Portfolio Managers
Dear Shareholders:
2010 was a milestone for PIMCO with the launch of the first actively managed equity mutual fund, the PIMCO EqS Pathfinder Portfolio™. We would like to thank you for your investment in the Portfolio and participating in its success. It’s a pleasure to give you our first full annual update since the launch of the Portfolio on April 14, 2010, including an update on the implementation of our time-tested style at PIMCO, our views on performance over the reporting period since inception of the Portfolio and our investment outlook.
Review of the Last Period
Since our last letter at the end of June 2010, our progress since the launch of the Portfolio has continued with a very real momentum. The analytical team we’ve assembled is outstanding, the internal resources available to us are ample and high quality, and we continue to be able to identify investment opportunities that fit with our core deep-value philosophy.
While the Portfolio’s performance over the reporting period lagged the returns of the Portfolio’s benchmark index, the MSCI World Index, the Portfolio produced its return with only a little more than half of the risk seen in the market. This risk profile is consistent with the Portfolio Managers’ history in both up and down markets. Our long-term effort to generate attractive returns while managing with intent to limit downside risk has continued to produce what it is intended to do.
Given that our goal is to produce attractive risk adjusted returns relative to the equity market and absolute returns over the course of a market cycle with a focus on capital preservation, we thought it would be helpful to discuss some of our investment successes, some of our investment detractors from performance, as well as some of the reasons that the Portfolio slightly lagged the total return generated by its benchmark index during the reporting period. We also will discuss our assessment of the portfolio’s positioning.
At the forefront of the equity rally seen in the second half of 2010 was QE2, the second iteration of quantitative easing. This well advertised policy response by the Federal Reserve caused a striking move upwards in equity markets with investors forgetting many of the reasons to be prudent, in our opinion. Many of the lowest quality stocks in the market had the most aggressive displays of upward momentum. As we’ve said on several occasions, market timing and speculation is a risky game and it is one that we choose not to play with our investors’ money. Excessive optimism in the markets often ends badly and we don’t have to strain our memories much to think back to a
time in the recent past when it did. To be clear, we aren’t purporting that a crash tantamount to 2008 is imminent, we are simply reiterating what we always have: our approach eschews chasing returns attributable to broad market factors. Instead our focus rests upon investing in individual securities where we believe the odds are substantially tilted in our investors favor to win. And trying to partake in the QE2 rally of 2010 clearly does not meet our criteria for sound fundamental value investing.
That said, our ability to find stocks that generate attractive returns has continued to be robust. Performance over the reporting period contained a number of securities, some long-time positions and some newer to the portfolio, that did substantially better than relevant peers. We’ll discuss the specifics of these stocks in the following segment but as we review the portfolio, we’re happy with the positions we currently own. We have also identified a number of investments we intend to make as and when they reach the appropriate price level. The price we pay for an investment, as it always has been, is an imperative and we won’t compromise this discipline just to proclaim that we’re fully invested at all times. And just as we are cautious about deploying capital and didn’t load up on marginally attractive securities to chase the equity rally, this explains a large part of why we slightly lagged over the reporting period. Our efforts to protect our shareholders’ capital requires this discipline and we are adamant about it as we believe its benefits may become very clear when the market is less buoyant than it has been recently.
Among the stocks that contributed to performance were the Portfolio’s holdings in AIA, Seadrill and CSM.
AIA, a Hong Kong based life insurer, was an initial public offering (“IPO”) that made a substantial contribution to the Portfolio’s performance over the reporting period. With a majority of the equity being floated from parent firm AIG, AIA came to market in October 2010 with many attractive attributes. First, we believe it is a relatively unique company as it is the largest life insurance company that reaches across much of Asia, both developed and developing. With supportive demographics and under penetrated insurance markets in many of their operating regions, AIA is poised to take advantage of structural growth, in our opinion. Second, we believe the value of the brand in Asia is very strong, as the company was founded 92 years ago as a small insurance agency in Shanghai. The company expanded over the decades to many countries and is well known in the region. Third, because of the structure of the company, there may exist a substantial opportunity to restructure the company, offer a more sophisticated suite of products, and enhance their distribution platform. The PIMCO
| 2 | PIMCO Equity Series VIT |
Table of Contents
(Unaudited)
EqS Pathfinder Portfolio™ participated in the IPO and the Portfolio continues to hold AIA stock given our view that there is significant upside potential.
Seadrill is one of the world’s largest offshore drilling rig operators and the company’s stock appreciated nicely in the second half of 2010 as the outlook improved for the premium segments of jack-ups and ultra deep water (“UDW”) rigs. The number of tenders for UDW rigs has increased by close to 200% since the end of the summer and rates have held up remarkably well at between $400,000 and $500,000 per day. Brazil and Western Africa continue to register successes in exploration and we believe Angola is showing signs of becoming a promising market as well. After the Macondo oil spill in 2010, oil companies are reconsidering their safety norms and favor modern and reliable equipment. We believe that Seadrill’s management shares this optimistic outlook and in less than two months, the company acquired one premium jack-up, Petrojack IV, ordered six new vessels for $2.0 billion from various Asian shipyards, and acquired an option on an additional eight rigs. In addition, Seadrill’s management rewarded its shareholders and increased its quarterly dividend by over 6% to $0.65 as of November 30, 2010.
CSM, a Dutch based company, is the leading manufacturer of bakery supplies and lactic acid. After having successfully restructured its bakery supply operations, we believe CSM is now able to leverage its size to supply large customers such as Walmart and Starbucks. CSM holds a 66% market share in lactic acid, a natural preservative used in the food, medical and electronic industries (per company reports). Although these are highly cash generative businesses, CSM trades at a relatively modest multiple at approximately 12 times 2011 estimated earnings (according to Bloomberg estimates), due to concerns about the current, particularly challenging environment for raw material costs. We also think that CSM owns a hidden gem in its leading technology to produce Poly Lactic Acid (“PLA”), which is a key ingredient used in the manufacture of the most advanced form of bio-degradable and renewable plastic. As the quality of PLA packaging has improved by becoming more durable and more heat resistant, we believe several leading manufacturers are about to adapt this type of packaging to enhance their environmental image. In addition, CSM’s PLA technology may reach break-even in 2012, according to industry research reports.
We also owned positions which detracted from Portfolio performance, including holdings in Bank of America, BankNordik, and Nintendo.
The Portfolio’s holding of Bank of America stock, one of the largest bank holding companies in the U.S. by assets, detracted from performance over the period. While the company’s stock trades at a meaningful discount to many other U.S. banks, in our opinion, and is a proxy for both economic and consumer recovery, the stock underperformed in the second half of 2011 due to ongoing issues regarding the weak U.S. economic recovery, high unemployment and mortgage put-backs to both government-sponsored enterprises (“GSEs”) and Private Label issuers.
BankNordik is the largest bank in the Faroe Islands but is generally under analyzed and largely not followed by the broader investment community. Nevertheless, we continue to find substantial value in this company due to what we view as its exceedingly low valuation, wide margins that it earns, and excess capital that will be returned to shareholders. It underperformed during the period due to the illiquid nature of the stock as well as a delay in the return of capital to shareholders. As is our style, we are often inclined to wait for a stock’s hidden value to materialize over the long term and we believe BankNordik fits this profile.
Nintendo, a Japanese gaming company, remains one of the world’s largest producers of entertainment hardware (representing approximately 53% of sales) and software (representing approximately 46% of sales) according to company reports and as of September 30, 2010. During the reporting period, the Portfolio’s holding of Nintendo stock detracted from performance as the stock price suffered from a combination of factors. The company’s sales flattened as consumers waited for the next generation product, the Japanese yen strengthened versus the U.S. dollar, and the Japanese equity market performed poorly during the year. Given the short term and frequently emotional nature of equity markets, we believe this market sentiment had an impact on Nintendo’s stock price, despite the fact that the company is truly multinational with approximately only 19% of sales derived in Japan (per company reports and as of September 30, 2010). Nevertheless, we think the stock remains a high-quality holding and is attractively valued with cash balances accounting for over 30% of market capitalization. Also, the prospect of new product cycles is a strong probability, in our view, which should have a positive impact on the company’s financial performance. We still believe Nintendo’s intrinsic value is substantially above what “The Market” is pricing it and we expect the discount to the stock’s value to begin closing in 2011.
| Annual Report | December 31, 2010 | 3 |
Table of Contents
Insights from the Portfolio Managers (Cont.)
Looking Ahead
As we look to 2011 and beyond, aside from the aforementioned rally in the equity markets, we note a number of interesting items. First, merger activity has picked up as we expected it to do. We think this trend will continue and expect opportunities to come to us in the area of merger arbitrage. Oddly enough, as markets have marched higher it is plausible that we could see capital in the broader market drawn away from the merger arbitrage strategy and devoted to chasing directional stock returns. This would be an opportunity for us as we would expect to see wider spreads and higher returns available in announced deals. Second, the volatility that is seen in equity markets is at times uncomfortable for an investor and unfortunately we expect it to continue. Fortunately, for those like us who seek opportunities from volatility and misunderstanding, it should be something to celebrate. We believe Europe is a prime example of this over the past year as concerns over sovereign debt and the banking system caused many equities to be sold for the wrong reason. Thankfully, we avoided those that were sold for the right reason (such as Greek, Irish, Spanish, and Portuguese equities, for example, where the Portfolio had no exposure) and focused our efforts elsewhere on names, such as BP and Lloyds, that were either guilty only by association or were sold off for completely stock-specific reasons.
Finally, while forecasting the economy isn’t something that will drive our investments, it is something to be aware of as an input into our investment process. Being at PIMCO gives us access to these views, many of them at their genesis, and while we are experiencing a cyclical uplift at this moment, the history of financial crises shows that the secular outlook may be a cloudy one in developed markets. This cloudy economic environment may have its casualties as companies may misstep or suffer because of it, but it also may produce its own unique set of opportunities. Aggressive Gross Domestic Product (“GDP”) growth doesn’t necessarily lead to attractive risk adjusted returns in equities and we believe our approach of ferreting out idiosyncratic opportunities with a focus on capital preservation should continue to yield returns for our investors.
Again, thank you for your investment in the Portfolio.
Sincerely,

Anne Gudefin, CFA |
Charles Lahr, CFA | |

PIMCO EqS Pathfinder Portfolio™, Co-Portfolio Managers
Top 10 Holdings1
| SPDR Gold Trust | 4.2% | |||||||
| Imperial Tobacco Group PLC | 3.3% | |||||||
| Danone | 3.0% | |||||||
| British American Tobacco PLC | 3.0% | |||||||
| Carlsberg A/S | 2.1% | |||||||
| AIA Group Ltd. | 2.1% | |||||||
| Koninklijke KPN NV | 2.0% | |||||||
| Pernod-Ricard S.A. | 2.0% | |||||||
| CSM | 1.9% | |||||||
| BP PLC | 1.9% |
| 1 | % of Total Investments as of 12/31/2010. Top Ten Holdings solely reflect long positions. Securities sold short, derivatives, and short-term instruments are not taken into consideration. |
Geographic Breakdown2
| United States | 24.4% | |||||||
| United Kingdom | 12.3% | |||||||
| France | 10.7% | |||||||
| Netherlands | 6.4% | |||||||
| Switzerland | 5.7% | |||||||
| Bermuda | 4.5% | |||||||
| Germany | 3.8% | |||||||
| Hong Kong | 3.2% | |||||||
| Denmark | 2.6% | |||||||
| Norway | 1.9% | |||||||
| Faeroe Islands | 1.4% | |||||||
| Singapore | 1.4% | |||||||
| Guernsey, Channel Islands | 1.4% | |||||||
| Japan | 1.1% | |||||||
| Sweden | 0.7% | |||||||
| Italy | 0.4% | |||||||
| Short-Term Instruments | 18.4% |
| 2 | % of Total Investments as of 12/31/2010. |
| 4 | PIMCO Equity Series VIT |
Table of Contents
Important Information About the Portfolio
(Unaudited)
PIMCO Equity Series VIT (the “Trust”) is an open-end management investment company currently consisting of one investment portfolio, the PIMCO EqS Pathfinder PortfolioTM (the “Portfolio”). The Portfolio is only available as a funding vehicle under variable life insurance policies or variable annuity contracts issued by insurance companies (“Variable Contracts”). Individuals may not purchase shares of the Portfolio directly. Shares of the Portfolio also may be sold to qualified pension and retirement plans outside of the separate account context.
The Portfolio seeks capital appreciation by investing under normal circumstances in equity securities, including common and preferred stock (and securities convertible into, or that PIMCO expects to be exchanged for, common or preferred stock), of issuers that PIMCO believes are undervalued. The Portfolio’s bottom-up value investment style attempts to identify securities that are undervalued by the market in comparison to PIMCO’s own determination of the company’s value, taking into account criteria such as asset value, book value and cash flow and earnings estimates.
The Portfolio may be subject to various risks as described in the Portfolio’s prospectus. Some of these risks may include, but are not limited to, the following: equity risk, value investing risk, foreign (non-U.S.) investment risk, emerging markets risk, market risk, issuer risk, interest rate risk, credit risk, high yield and distressed company risk, currency risk, liquidity risk, leveraging risk, management risk, small-cap and mid-cap company risk, arbitrage risk, derivatives risk and short sale risk. A complete description of these risks and other risks is contained in the Portfolio’s prospectus. The Portfolio may use derivative instruments for hedging purposes or as part of an investment strategy. Use of these instruments may involve certain costs and risks such as liquidity risk, interest rate risk, market risk, credit risk, management risk, leverage risk, mispricing or improper valuation risk and the risk that the Portfolio could not close out a position when it would be most advantageous to do so. The Portfolio could lose more than the principal amount invested in these derivative instruments.
On the Performance Summary page in this Annual Report (“Shareholder Report”), the Cumulative Total Return table measures performance assuming that any dividend and capital gain distributions were reinvested. The Cumulative Returns Chart measures the Portfolio’s performance against the performance of a broad-based securities market index (benchmark index). The Portfolio’s past performance, before and after taxes, is not necessarily an indication of how the Portfolio will perform in the future.
An investment in the Portfolio is not a deposit of a bank and is not guaranteed or insured by the Federal Deposit Insurance Corporation or any other government agency. It is possible to lose money on investments in the Portfolio.
PIMCO has adopted written proxy voting policies and procedures (“Proxy Policy”) as required by Rule 206(4)-6 under the Investment Advisers Act of 1940, as amended. The Proxy Policy has been adopted by the Trust as the policies and procedures that PIMCO will use when voting proxies on behalf of the Portfolio. A description of the policies and procedures that PIMCO uses to vote proxies relating to portfolio securities of the Portfolio, and information about how the Portfolio voted proxies relating to portfolio securities held from its inception through June 30th, are available without charge, upon request, by calling the Trust at 1-800-927-4648, on the Portfolio’s website at http://pvit.pimco-funds.com, and on the Securities and Exchange Commission’s (“SEC”) website at http://www.sec.gov.
The Portfolio files a complete schedule of the Portfolio’s portfolio holdings with the SEC for the first and third quarters of each fiscal year on Form N-Q. A copy of the Portfolio’s Form N-Q, once available, will be available on the SEC’s website at http://www.sec.gov and may be reviewed and copied at the SEC’s Public Reference Room in Washington, D.C. The Portfolio’s Form N-Q will also be available without charge, upon request, by calling the Trust at 1-800-927-4648 and on the Portfolio’s website at http://pvit.pimco-funds.com. Information on the operation of the Public Reference Room may be obtained by calling 1-800-SEC-0330.
The Trust is distributed by PIMCO Investments LLC, 1345 Avenue of the Americas, New York, NY 10105.
| Annual Report | December 31, 2010 | 5 |
Table of Contents
Important Information About the Portfolio (Cont.)
The following disclosure provides important information regarding the Portfolio’s Expense Example (“Example” or “Expense Example”), which appears in this Shareholder Report. Please refer to this information when reviewing the Expense Example for the Portfolio.
Example
As a shareholder of the Portfolio, you incur two types of costs: (1) transaction costs and (2) ongoing costs, including management fees, distribution and/or service (12b-1) fees (Advisor Class only), and other Portfolio expenses. The Example is intended to help you understand your ongoing costs (in dollars) of investing in the Portfolio and to compare these costs with the ongoing costs of investing in other mutual funds. The Expense Example does not reflect any fees or other expenses imposed by the Variable Contracts. If it did, the expenses reflected in the Expense Example would be higher. The Example is based on an investment of $1,000 invested at the beginning of the period and held for the entire period, from July 1, 2010 to December 31, 2010.
Actual Expenses
The information in the table under the heading “Actual Performance” provides information about actual account values and actual expenses. You may use the information in these columns, together with the amount you invested, to estimate the expenses that you paid over the period. Simply divide your account value by $1,000 (for example, an $8,600 account value divided by $1,000 = $8.60), then multiply the result by the number in the appropriate column for your share class, in the row entitled “Expenses Paid During Period” to estimate the expenses you paid on your account during this period.
Hypothetical Example for Comparison Purposes
The information in the table under the heading “Hypothetical Performance (5% return before expenses)” provides information about hypothetical account values and hypothetical expenses based on the Portfolio’s actual expense ratio and an assumed rate of return of 5% per year before expenses, which is not the Portfolio’s actual return. The hypothetical account values and expenses may not be used to estimate the actual ending account balance or expenses you paid for the period. You may use this information to compare the ongoing costs of investing in the Portfolio and other portfolios. To do so, compare this 5% hypothetical example with the 5% hypothetical examples that appear in the shareholder reports of the other portfolios.
Please note that the expenses shown in the table are meant to highlight your ongoing costs only and do not reflect any transactional costs. Therefore, the information under the heading “Hypothetical Performance (5% return before expenses)” is useful in comparing ongoing costs only, and will not help you determine the relative total costs of owning different portfolios. In addition, if these transactional costs were included, your costs would have been higher.
Expense ratios may vary from period to period because of various factors such as an increase in expenses that are not covered by the management fees, such as fees and expenses of the independent trustees and their counsel, extraordinary expenses and interest expense.
| 6 | PIMCO Equity Series VIT |
Table of Contents
PIMCO EqS Pathfinder Portfolio™
Cumulative Returns Through December 31, 2010
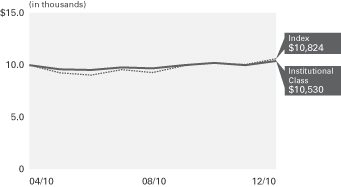
$10,000 invested at the end of the month when the Portfolio’s Institutional Class commenced operations.
Allocation Breakdown‡
| United States | 24.4% | |||
| Short-Term Instruments | 18.4% | |||
| United Kingdom | 12.3% | |||
| France | 10.7% | |||
| Netherlands | 6.4% | |||
| Switzerland | 5.7% | |||
| Other | 22.1% |
| ‡ | % of Total Investments as of 12/31/10 |
| Cumulative Total Return for the period ended December 31, 2010 | ||||||
| Class Inception (04/14/10) | ||||||
 | PIMCO EqS Pathfinder PortfolioTM Institutional Class | 3.30% | ||||
 | MSCI World Index± | 4.81% | ||||
All Portfolio returns are net of fees and expenses.
Performance quoted represents past performance. Past performance is not a guarantee or a reliable indicator of future results. Investment return and principal value will fluctuate so the Portfolio shares when redeemed, may be worth more or less than their original cost. The Portfolio’s performance does not reflect the deduction of additional charges and expenses imposed in connection with investing in Variable Contracts, which will reduce returns. Current performance may be lower or higher than the performance data quoted. Performance data current to the most recent month-end is available at http://pvit.pimco-funds.com or by calling (800) 927-4648. The Portfolio’s total annual operating expense ratio as stated in the Portfolio’s current prospectus, as supplemented to date, is 1.64% for Institutional Class shares.
± The MSCI World Index is a free float-adjusted market capitalization weighted index that is designed to measure the equity market performance of developed markets. As of May 27, 2010 the MSCI World Index consisted of the following 24 developed market country indices: Australia, Austria, Belgium, Canada, Denmark, Finland, France, Germany, Greece, Hong Kong, Ireland, Israel, Italy, Japan, Netherlands, New Zealand, Norway, Portugal, Singapore, Spain, Sweden, Switzerland, the United Kingdom, and the United States. The index represents the unhedged performance of the constituent stocks, in US dollars. It is not possible to invest directly in an unmanaged index.
| Expense Example | Actual Performance | Hypothetical Performance | ||||||
| (5% return before expenses) | ||||||||
Beginning Account Value (07/01/10) | $ | 1,000.00 | $ | 1,000.00 | ||||
Ending Account Value (12/31/10) | $ | 1,121.61 | $ | 1,020.21 | ||||
Expenses Paid During Period† | $ | 5.29 | $ | 5.04 | ||||
† Expenses are equal to the Portfolio’s Institutional Class net annualized expense ratio of 0.99%, multiplied by the average account value over the period, multiplied by 184/365 (to reflect the one-half year period). The annualized expense ratio reflects net annualized expenses after application of expense waiver of 0.11%. Overall fees and expenses of investing in the Portfolio will be higher because the example does not reflect Variable Contract fees and expenses.
Please refer to page 6 herein for an explanation of the information presented in the above Expense Example.
Portfolio Insights
| » | The PIMCO EqS Pathfinder Portfolio™ seeks capital appreciation by investing under normal circumstances in equity securities, including common and preferred stock (and securities convertible into, or that PIMCO expects to be exchanged for, common or preferred stock), of issuers that PIMCO believes are undervalued. The Portfolio’s bottom-up value investment style attempts to identify securities that are undervalued by the market in comparison to PIMCO’s own determination of the company’s value, taking into account criteria such as asset value, book value, cash flow and earnings estimates. |
| » | The Portfolio commenced operations on April 14, 2010. |
| » | During the reporting period, the Portfolio’s Institutional class shares returned 3.30% after fees and the Portfolio’s benchmark index, the MSCI World Index, returned 4.81%. The Portfolio’s performance, although positive, underperformed its benchmark index by 1.51% after fees. |
| » | Stock selection in the energy sector, particularly exposure to offshore oil driller Seadrill Ltd., contributed to performance as its stock appreciated in value during the reporting period. |
| » | British American Tobacco PLC and Link Real Estate Investment Trust were notable contributors to performance as prices on these investments appreciated, as was the Portfolio’s exposure to merger arbitrage investments. |
| » | Holdings in financial companies such as Bank of America, CBOE (the Chicago Board Option Exchange), and Barclays PLC detracted from performance as they underperformed during the period. |
| » | Given the volatility in the equity markets over the time period under review, the Portfolio’s market risk hedging strategies ended up contributing negatively to performance during the reporting period as these market risk hedging investments declined in value as the underlying stock markets appreciated. |
| » | At the end of the reporting period, the Portfolio held approximately 71% in equities we believe are undervalued, about 3% (on the long side only) in merger arbitrage investments, approximately 24% in cash equivalents, and held the balance of the portfolio in currency and market risk hedges. |
| Annual Report | December 31, 2010 | 7 |
Table of Contents
Financial Highlights PIMCO EqS Pathfinder Portfolio™
| Selected Per Share Data for the Period Ended: | 04/14/2010-12/31/2010 | |||
Institutional Class | ||||
Net asset value beginning of period | $ | 10.00 | ||
Net investment income (a) | 0.12 | |||
Net realized/unrealized gain on investments | 0.21 | |||
Total income from investment operations | 0.33 | |||
Net asset value end of period | $ | 10.33 | ||
Total return | 3.30 | % | ||
Net assets end of period (000s) | $ | 3,276 | ||
Ratio of expenses to average net assets | 1.01 | %* | ||
Ratio of expenses to average net assets excluding waivers | 3.72 | %* | ||
Ratio of expenses to average net assets excluding interest expense and dividends on securities sold short | 0.97 | %* | ||
Ratio of expenses to average net assets excluding interest expense, dividends on securities sold short and waivers | 3.68 | %* | ||
Ratio of net investment income to average net assets | 1.69 | %* | ||
Portfolio turnover rate | 25 | %** | ||
| * | Annualized |
| ** | The ratio excludes PIMCO Short-Term Floating NAV Portfolio. |
| (a) | Per share amounts based on average number of shares outstanding during the period. |
| 8 | PIMCO Equity Series VIT | See Accompanying Notes |
Table of Contents
Statement of Assets and Liabilities PIMCO EqS Pathfinder Portfolio™
| (Amounts in thousands, except per share amounts) | December 31, 2010 | |||
Assets: | ||||
Investments, at value | $ | 4,481 | ||
Investments in Affiliates, at value | 901 | |||
Repurchase agreements, at value | 106 | |||
Cash | 1 | |||
Deposits with counterparty | 204 | |||
Foreign currency, at value | 151 | |||
Receivable for investments sold | 5 | |||
Interest and dividends receivable | 17 | |||
Unrealized appreciation on foreign currency contracts | 55 | |||
| 5,921 | ||||
Liabilities: | ||||
Payable for investments purchased | $ | 47 | ||
Payable for Portfolio shares redeemed | 2 | |||
Payable for short sales | 40 | |||
Accrued related party fees | 5 | |||
Unrealized depreciation on foreign currency contracts | 53 | |||
| 147 | ||||
Net Assets | $ | 5,774 | ||
Net Assets Consist of: | ||||
Paid in capital | $ | 5,552 | ||
Undistributed net investment income | 22 | |||
Accumulated undistributed net realized (loss) | (48 | ) | ||
Net unrealized appreciation | 248 | |||
| $ | 5,774 | |||
Net Assets: | ||||
Institutional Class | $ | 3,276 | ||
Advisor Class | 2,498 | |||
Shares Issued and Outstanding: | ||||
Institutional Class | 317 | |||
Advisor Class | 242 | |||
Net Asset Value and Redemption Price Per Share (Net Asset Per Share Outstanding) | ||||
Institutional Class | $ | 10.33 | ||
Advisor Class | 10.31 | |||
Cost of Investments Owned | $ | 4,242 | ||
Cost of Investments in Affiliates Owned | $ | 901 | ||
Cost of Repurchase Agreements Owned | $ | 106 | ||
Cost of Foreign Currency Held | $ | 148 | ||
Proceeds Received on Short Sales | $ | 40 | ||
| See Accompanying Notes | Annual Report | December 31, 2010 | 9 |
Table of Contents
Statement of Operations PIMCO EqS Pathfinder Portfolio™
| (Amounts in thousands) | Period from April 14, 2010 to December 31, 2010 | |||
Investment Income: | ||||
Interest | $ | 2 | ||
Dividends, net of foreign taxes* | 74 | |||
Dividends from Affiliate investments | 1 | |||
Total Income | 77 | |||
Expenses: | ||||
Investment advisory fees | 22 | |||
Supervisory and administrative fees | 10 | |||
Distribution and/or servicing fees – Advisor Class | 2 | |||
Trustees’ fees | 21 | |||
Organization costs | 79 | |||
Interest expense and dividends on securities sold short | 1 | |||
Total Expenses | 135 | |||
Waiver and/or Reimbursement by PIMCO | (103 | ) | ||
Net Expenses | 32 | |||
Net Investment Income | 45 | |||
Net Realized and Unrealized Gain (Loss): | ||||
Net realized (loss) on investments | (25 | ) | ||
Net realized (loss) on written options | (1 | ) | ||
Net realized (loss) on securities sold short | (1 | ) | ||
Net realized (loss) on foreign currency transactions | (44 | ) | ||
Net change in unrealized appreciation on investments | 241 | |||
Net change in unrealized (depreciation) on written options | 0 | |||
Net change in unrealized (depreciation) on securities sold short | (1 | ) | ||
Net change in unrealized appreciation on translation of assets and liabilities denominated in foreign currencies | 8 | |||
Net Gain | 177 | |||
Net Increase in Net Assets Resulting from Operations | $ | 222 | ||
*Foreign tax withholdings | $ | 5 | ||
| 10 | PIMCO Equity Series VIT | See Accompanying Notes |
Table of Contents
Statement of Changes in Net Assets PIMCO EqS Pathfinder Portfolio™
| (Amounts in thousands) | Period from April 14, 2010 to December 31, 2010 | |||
Increase in Net Assets from: | ||||
Operations: | ||||
Net investment income | $ | 45 | ||
Net realized (loss) | (71 | ) | ||
Net change in unrealized appreciation | 248 | |||
Net increase resulting from operations | 222 | |||
Portfolio Share Transactions: | ||||
Net increase resulting from Portfolio share transactions** | 5,552 | |||
Total Increase in Net Assets | 5,774 | |||
Net Assets: | ||||
Beginning of period | 0 | |||
End of period* | $ | 5,774 | ||
*Including undistributed net investment income of: | $ | 22 | ||
| ** | See note 11 in the Notes to Financial Statements. |
| See Accompanying Notes | Annual Report | December 31, 2010 | 11 |
Table of Contents
Schedule of Investments PIMCO EqS Pathfinder Portfolio™
| SHARES | MARKET VALUE (000S) | |||||||||||
| COMMON STOCKS 73.6% | ||||||||||||
| BERMUDA 4.3% | ||||||||||||
| ENERGY 1.7% | ||||||||||||
Seadrill Ltd. | 2,949 | $ | 101 | |||||||||
| FINANCIALS 2.6% | ||||||||||||
Hiscox Ltd. | 9,337 | 56 | ||||||||||
Lancashire Holdings Ltd. | 10,546 | 91 | ||||||||||
| 147 | ||||||||||||
Total Bermuda | 248 | |||||||||||
| DENMARK 2.4% | ||||||||||||
| CONSUMER STAPLES 2.0% | ||||||||||||
Carlsberg A/S | 1,152 | 116 | ||||||||||
| FINANCIALS 0.4% | ||||||||||||
Jyske Bank A/S (a) | 557 | 26 | ||||||||||
Total Denmark | 142 | |||||||||||
| FAEROE ISLANDS 1.3% | ||||||||||||
| CONSUMER STAPLES 0.6% | ||||||||||||
Bakkafrost P/F (a) | 4,176 | 35 | ||||||||||
| FINANCIALS 0.7% | ||||||||||||
BankNordik P/F (a) | 1,575 | 41 | ||||||||||
Total Faeroe Islands | 76 | |||||||||||
| FRANCE 10.1% | ||||||||||||
| CONSUMER DISCRETIONARY 2.0% | ||||||||||||
Eutelsat Communications | 1,967 | 72 | ||||||||||
JC Decaux S.A. (a) | 1,327 | 41 | ||||||||||
| 113 | ||||||||||||
| CONSUMER STAPLES 5.2% | ||||||||||||
Danone | 2,657 | 167 | ||||||||||
L’Oreal S.A. | 266 | 30 | ||||||||||
Pernod-Ricard S.A. | 1,158 | 109 | ||||||||||
| 306 | ||||||||||||
| ENERGY 1.5% | ||||||||||||
Bourbon S.A. | 724 | 33 | ||||||||||
Total S.A. | 972 | 52 | ||||||||||
| 85 | ||||||||||||
| FINANCIALS 0.5% | ||||||||||||
BNP Paribas | 447 | 28 | ||||||||||
| INDUSTRIALS 0.9% | ||||||||||||
Teleperformance | 1,543 | 52 | ||||||||||
Total France | 584 | |||||||||||
| GERMANY 3.6% | ||||||||||||
| FINANCIALS 1.7% | ||||||||||||
Deutsche Boerse AG | 1,425 | 98 | ||||||||||
| HEALTH CARE 0.7% | ||||||||||||
Rhoen Klinikum AG | 1,590 | 35 | ||||||||||
| SHARES | MARKET VALUE (000S) | |||||||||||
| INDUSTRIALS 0.5% | ||||||||||||
Kloeckner & Co. SE (a) | 1,089 | $ | 31 | |||||||||
| UTILITIES 0.7% | ||||||||||||
E.ON AG | 1,371 | 42 | ||||||||||
Total Germany | 206 | |||||||||||
| GUERNSEY, CHANNEL ISLANDS 1.3% | ||||||||||||
| FINANCIALS 1.3% | ||||||||||||
Resolution Ltd. | 20,529 | 75 | ||||||||||
Total Guernsey, Channel Islands | 75 | |||||||||||
| HONG KONG 3.0% | ||||||||||||
| FINANCIALS 2.5% | ||||||||||||
AIA Group Ltd. (a) | 41,000 | 115 | ||||||||||
First Pacific Co. Ltd. | 34,000 | 31 | ||||||||||
| 146 | ||||||||||||
| INDUSTRIALS 0.5% | ||||||||||||
Jardine Matheson Holdings Ltd. | 300 | 13 | ||||||||||
Jardine Strategic Holdings Ltd. | 500 | 14 | ||||||||||
| 27 | ||||||||||||
Total Hong Kong | 173 | |||||||||||
| ITALY 0.4% | ||||||||||||
| FINANCIALS 0.4% | ||||||||||||
Intesa Sanpaolo SpA | 8,672 | 21 | ||||||||||
Total Italy | 21 | |||||||||||
| JAPAN 1.0% | ||||||||||||
| INFORMATION TECHNOLOGY 1.0% | ||||||||||||
Nintendo Co. Ltd. | 200 | 58 | ||||||||||
Total Japan | 58 | |||||||||||
| NETHERLANDS 6.1% | ||||||||||||
| CONSUMER STAPLES 1.8% | ||||||||||||
CSM | 3,052 | 107 | ||||||||||
| ENERGY 1.0% | ||||||||||||
Dockwise Ltd. (a) | 342 | 9 | ||||||||||
Royal Dutch Shell PLC ‘A’ | 1,380 | 46 | ||||||||||
| 55 | ||||||||||||
| FINANCIALS 0.8% | ||||||||||||
ING Groep NV (a) | 4,500 | 44 | ||||||||||
| INFORMATION TECHNOLOGY 0.6% | ||||||||||||
Gemalto NV | 778 | 33 | ||||||||||
| TELECOMMUNICATION SERVICES 1.9% | ||||||||||||
Koninklijke KPN NV | 7,686 | 112 | ||||||||||
Total Netherlands | 351 | |||||||||||
| NORWAY 1.8% | ||||||||||||
| CONSUMER STAPLES 1.1% | ||||||||||||
Marine Harvest ASA | 62,823 | 67 | ||||||||||
| SHARES | MARKET VALUE (000S) | |||||||||||
| INDUSTRIALS 0.7% | ||||||||||||
Orkla ASA | 3,989 | $ | 39 | |||||||||
Total Norway | 106 | |||||||||||
| SINGAPORE 1.3% | ||||||||||||
| FINANCIALS 0.2% | ||||||||||||
Great Eastern Holdings Ltd. | 1,160 | 14 | ||||||||||
| INDUSTRIALS 1.1% | ||||||||||||
Keppel Corp. Ltd. | 7,000 | 62 | ||||||||||
Total Singapore | 76 | |||||||||||
| SWEDEN 0.6% | ||||||||||||
| INDUSTRIALS 0.6% | ||||||||||||
Loomis AB | 2,460 | 37 | ||||||||||
Total Sweden | 37 | |||||||||||
| SWITZERLAND 5.4% | ||||||||||||
| CONSUMER STAPLES 1.4% | ||||||||||||
Nestle S.A. | 1,393 | 82 | ||||||||||
| FINANCIALS 1.8% | ||||||||||||
UBS AG (a) | 3,386 | 56 | ||||||||||
Zurich Financial Services AG | 190 | 49 | ||||||||||
| 105 | ||||||||||||
| HEALTH CARE 1.0% | ||||||||||||
Alcon, Inc. | 348 | 56 | ||||||||||
| INDUSTRIALS 0.6% | ||||||||||||
Schindler Holding AG | 310 | 37 | ||||||||||
| MATERIALS 0.6% | ||||||||||||
Sika AG | 15 | 33 | ||||||||||
Total Switzerland | 313 | |||||||||||
| UNITED KINGDOM 11.7% | ||||||||||||
| CONSUMER DISCRETIONARY 0.3% | ||||||||||||
British Sky Broadcasting Group PLC | 1,153 | 13 | ||||||||||
| CONSUMER STAPLES 6.8% | ||||||||||||
British American Tobacco PLC | 4,281 | 165 | ||||||||||
Imperial Tobacco Group PLC | 5,878 | 181 | ||||||||||
Reckitt Benckiser Group PLC | 825 | 45 | ||||||||||
| 391 | ||||||||||||
| ENERGY 1.8% | ||||||||||||
BP PLC | 14,234 | 105 | ||||||||||
| FINANCIALS 2.8% | ||||||||||||
Barclays PLC | 15,351 | 63 | ||||||||||
HSBC Holdings PLC | 2,648 | 27 | ||||||||||
Lloyds Banking Group PLC (a) | 25,451 | 26 | ||||||||||
Man Group PLC | 10,244 | 48 | ||||||||||
| 164 | ||||||||||||
Total United Kingdom | 673 | |||||||||||
| 12 | PIMCO Equity Series VIT | See Accompanying Notes |
Table of Contents
December 31, 2010
| SHARES | MARKET VALUE (000S) | |||||||||||
| UNITED STATES 19.3% | ||||||||||||
| CONSUMER STAPLES 6.3% | ||||||||||||
Altria Group, Inc. | 2,247 | $ | 55 | |||||||||
CVS Caremark Corp. | 1,973 | 69 | ||||||||||
Lorillard, Inc. | 1,191 | 98 | ||||||||||
Philip Morris International, Inc. | 982 | 58 | ||||||||||
Reynolds American, Inc. | 1,576 | 51 | ||||||||||
Wal-Mart Stores, Inc. | 500 | 27 | ||||||||||
| 358 | ||||||||||||
| ENERGY 1.2% | ||||||||||||
Pride International, Inc. (a) | 2,054 | 67 | ||||||||||
| FINANCIALS 7.5% | ||||||||||||
Alleghany Corp. | 204 | 62 | ||||||||||
Berkshire Hathaway, Inc. (a) | 1,071 | 86 | ||||||||||
Capitol Federal Financial, Inc. | 922 | 11 | ||||||||||
CBOE Holdings, Inc. | 2,478 | 57 | ||||||||||
Marshall & Ilsley Corp. | 4,134 | 29 | ||||||||||
Northwest Bancshares, Inc. | 3,771 | 44 | ||||||||||
People’s United Financial, Inc. | 3,002 | 42 | ||||||||||
Washington Federal, Inc. | 1,364 | 23 | ||||||||||
White Mountains Insurance | 240 | 81 | ||||||||||
| 435 | ||||||||||||
| SHARES | MARKET VALUE (000S) | |||||||||||
| HEALTH CARE 1.1% | ||||||||||||
Genzyme Corp. (a) | 535 | $ | 38 | |||||||||
Pfizer, Inc. | 1,457 | 26 | ||||||||||
| 64 | ||||||||||||
| INDUSTRIALS 0.5% | ||||||||||||
3M Co. | 225 | 19 | ||||||||||
SunPower Corp. ‘B’ (a) | 748 | 9 | ||||||||||
| 28 | ||||||||||||
| INFORMATION TECHNOLOGY 2.7% | ||||||||||||
CommScope, Inc. (a) | 673 | 21 | ||||||||||
Dell, Inc. (a) | 2,856 | 39 | ||||||||||
Microsoft Corp. | 3,612 | 101 | ||||||||||
| 161 | ||||||||||||
Total United States | 1,113 | |||||||||||
Total Common Stocks (Cost $4,047) |
| 4,252 | ||||||||||
| EXCHANGE-TRADED FUNDS 4.0% | ||||||||||||
SPDR Gold Trust | 1,645 | 228 | ||||||||||
Total Exchange-Traded Funds |
| 228 | ||||||||||
| PRINCIPAL AMOUNT (000S) | MARKET VALUE (000S) | |||||||||||
| SHORT-TERM INSTRUMENTS 17.4% | ||||||||||||
| REPURCHASE AGREEMENTS 1.8% | ||||||||||||
State Street Bank and Trust Co. | ||||||||||||
0.010% due 01/03/2011 | $ | 106 | $ | 106 | ||||||||
(Dated 12/31/2010. Collateralized by U.S. Treasury Notes 2.125% due 05/31/2015 valued at $112. Repurchase proceeds are $106.) | ||||||||||||
| SHARES | ||||||||||||
| PIMCO SHORT-TERM FLOATING NAV | ||||||||||||
| PORTFOLIO (b) 15.6% | ||||||||||||
| 89,980 | 901 | |||||||||||
Total Short-Term Instruments |
| 1,007 | ||||||||||
| PURCHASED OPTIONS (d) 0.0% | ||||||||||||
(Cost $1) | 1 | |||||||||||
| Total Investments 95.0% (Cost $5,249) | $ | 5,488 | ||||||||||
| Written Options (e) (0.0%) (Premiums $0) | 0 | |||||||||||
| Other Assets and Liabilities (Net) 5.0% | 286 | |||||||||||
| Net Assets 100.0% | $ | 5,774 | ||||||||||
Notes to Schedule of Investments (amounts in thousands*, except number of contracts):
| * | A zero balance may reflect actual amounts rounding to less than one thousand. |
| (a) | Non-income producing security. |
| (b) | Affiliated to the Portfolio. |
| (c) | Cash of $204 has been pledged as collateral for securities sold short as of December 31, 2010. |
| (d) | Purchased options outstanding on December 31, 2010: |
| Options on Securities | ||||||||||||||||||||
| Description | Strike Price | Expiration Date | Notional Amount | Cost | Market Value | |||||||||||||||
Put - CBOT E.ON AG | EUR 22.000 | 01/21/2011 | EUR 1 | $ | 0 | $ | 0 | |||||||||||||
Put - CBOT Novartis AG ADR | $ 57.500 | 04/16/2011 | $ 0 | 1 | 1 | |||||||||||||||
| $ | 1 | $ | 1 | |||||||||||||||||
| (e) | Written options outstanding on December 31, 2010: |
| Options on Securities | ||||||||||||||||||||
| Description | Strike Price | Expiration Date | Notional Amount | Premium | Market Value | |||||||||||||||
Call - OTC Nestle S.A. | CHF 60.000 | 01/21/2011 | CHF 1 | $ 0 | $ | 0 | ||||||||||||||
Transactions in written call and put options for the period ended December 31, 2010:
| # of Contracts | Notional Amount in CHF | Premium | ||||||||||
Balance at 04/14/2010 | 0 | CHF 0 | $ | 0 | ||||||||
Sales | 87 | 1 | 13 | |||||||||
Closing Buys | (74 | ) | 0 | (10 | ) | |||||||
Expirations | 0 | 0 | 0 | |||||||||
Exercised | (13 | ) | 0 | (3 | ) | |||||||
Balance at 12/31/2010 | 0 | CHF 1 | $ | 0 | ||||||||
| See Accompanying Notes | Annual Report | December 31, 2010 | 13 |
Table of Contents
Schedule of Investments Pimco EqS Pathfinder Portfolio™ (Cont.)
| (f) | Short sales outstanding on December 31, 2010: |
| Description | Shares | Proceeds | Market Value | |||||||||
Bank of Montreal | 520 | $ | 30 | $ | 30 | |||||||
SunPower Corp. ‘A’ | 747 | 10 | 10 | |||||||||
| $ | 40 | $ | 40 | |||||||||
| (g) | Foreign currency contracts outstanding on December 31, 2010: |
| Type | Currency | Principal Amount Covered by Contract | Settlement Month | Counterparty | Unrealized Appreciation | Unrealized (Depreciation) | Net Unrealized Appreciation/ (Depreciation) | |||||||||||||||||||
Buy | AUD | 217 | 01/2011 | BCLY | $ | 14 | $ | 0 | $ | 14 | ||||||||||||||||
Sell | 217 | 01/2011 | CSFB | 0 | (2 | ) | (2 | ) | ||||||||||||||||||
Buy | 217 | 02/2011 | CSFB | 2 | 0 | 2 | ||||||||||||||||||||
Buy | CAD | 231 | 01/2011 | BCLY | 6 | 0 | 6 | |||||||||||||||||||
Sell | 231 | 01/2011 | MSC | 0 | (2 | ) | (2 | ) | ||||||||||||||||||
Buy | 231 | 02/2011 | MSC | 1 | 0 | 1 | ||||||||||||||||||||
Sell | CHF | 161 | 01/2011 | BCLY | 0 | (12 | ) | (12 | ) | |||||||||||||||||
Sell | 9 | 01/2011 | HSBC | 0 | 0 | 0 | ||||||||||||||||||||
Buy | 170 | 01/2011 | UBS | 1 | 0 | 1 | ||||||||||||||||||||
Sell | 170 | 02/2011 | UBS | 0 | (1 | ) | (1 | ) | ||||||||||||||||||
Buy | DKK | 977 | 01/2011 | BCLY | 2 | 0 | 2 | |||||||||||||||||||
Sell | 881 | 01/2011 | BCLY | 0 | (2 | ) | (2 | ) | ||||||||||||||||||
Buy | 20 | 01/2011 | CSFB | 0 | 0 | 0 | ||||||||||||||||||||
Sell | 36 | 01/2011 | HSBC | 0 | 0 | 0 | ||||||||||||||||||||
Sell | 80 | 01/2011 | UBS | 0 | 0 | 0 | ||||||||||||||||||||
Sell | 929 | 02/2011 | BCLY | 0 | (2 | ) | (2 | ) | ||||||||||||||||||
Sell | 4 | 02/2011 | RBC | 0 | 0 | 0 | ||||||||||||||||||||
Sell | EUR | 485 | 01/2011 | BCLY | 0 | (6 | ) | (6 | ) | |||||||||||||||||
Buy | 129 | 01/2011 | BNP | 3 | 0 | 3 | ||||||||||||||||||||
Buy | 256 | 01/2011 | CITI | 2 | 0 | 2 | ||||||||||||||||||||
Sell | 18 | 01/2011 | CITI | 0 | 0 | 0 | ||||||||||||||||||||
Sell | 12 | 01/2011 | HSBC | 0 | 0 | 0 | ||||||||||||||||||||
Sell | 83 | 01/2011 | RBC | 0 | (2 | ) | (2 | ) | ||||||||||||||||||
Buy | 213 | 01/2011 | RBS | 2 | 0 | 2 | ||||||||||||||||||||
Sell | 256 | 02/2011 | CITI | 0 | (2 | ) | (2 | ) | ||||||||||||||||||
Sell | 213 | 02/2011 | RBS | 0 | (2 | ) | (2 | ) | ||||||||||||||||||
Sell | GBP | 223 | 01/2011 | BCLY | 0 | 0 | 0 | |||||||||||||||||||
Sell | 10 | 01/2011 | HSBC | 0 | 0 | 0 | ||||||||||||||||||||
Sell | 9 | 01/2011 | MSC | 0 | 0 | 0 | ||||||||||||||||||||
Sell | 251 | 02/2011 | BNP | 0 | (4 | ) | (4 | ) | ||||||||||||||||||
Sell | 6 | 02/2011 | RBC | 0 | 0 | 0 | ||||||||||||||||||||
Sell | HKD | 110 | 01/2011 | BCLY | 0 | 0 | 0 | |||||||||||||||||||
Buy | JPY | 4,521 | 01/2011 | BCLY | 1 | 0 | 1 | |||||||||||||||||||
Buy | 26,418 | 01/2011 | DUB | 11 | 0 | 11 | ||||||||||||||||||||
Sell | 30,952 | 01/2011 | UBS | 0 | (4 | ) | (4 | ) | ||||||||||||||||||
Buy | 30,952 | 02/2011 | UBS | 4 | 0 | 4 | ||||||||||||||||||||
Buy | NOK | 726 | 01/2011 | BCLY | 2 | 0 | 2 | |||||||||||||||||||
Sell | 726 | 01/2011 | �� | BCLY | 0 | (7 | ) | (7 | ) | |||||||||||||||||
Sell | 726 | 02/2011 | BCLY | 0 | (2 | ) | (2 | ) | ||||||||||||||||||
Buy | SEK | 486 | 01/2011 | BCLY | 3 | 0 | 3 | |||||||||||||||||||
Sell | 449 | 01/2011 | BCLY | 0 | (2 | ) | (2 | ) | ||||||||||||||||||
Sell | 19 | 01/2011 | BNP | 0 | 0 | 0 | ||||||||||||||||||||
Sell | 18 | 01/2011 | RBS | 0 | 0 | 0 | ||||||||||||||||||||
Buy | 267 | 02/2011 | BCLY | 1 | 0 | 1 | ||||||||||||||||||||
Sell | SGD | 45 | 01/2011 | BCLY | 0 | (1 | ) | (1 | ) | |||||||||||||||||
| $ | 55 | $ | (53 | ) | $ | 2 | ||||||||||||||||||||
| 14 | PIMCO Equity Series VIT | See Accompanying Notes |
Table of Contents
December 31, 2010
| (h) | Fair Value Measurements (1) |
The following is a summary of the fair valuations according to the inputs used as of December 31, 2010 in valuing the Portfolio’s assets and liabilities (2):
| Category and Subcategory (3) | Level 1 (4) | Level 2 (5) | Level 3 (6) | Fair Value at 12/31/2010 | ||||||||||||
Investments, at value | ||||||||||||||||
Common Stocks | ||||||||||||||||
Bermuda | ||||||||||||||||
Energy | $ | 0 | $ | 101 | $ | 0 | $ | 101 | ||||||||
Financials | 0 | 147 | 0 | 147 | ||||||||||||
Denmark | ||||||||||||||||
Consumer Staples | 0 | 116 | 0 | 116 | ||||||||||||
Financials | 0 | 26 | 0 | 26 | ||||||||||||
Faeroe Islands | ||||||||||||||||
Consumer Staples | 0 | 35 | 0 | 35 | ||||||||||||
Financials | 41 | 0 | 0 | 41 | ||||||||||||
France | ||||||||||||||||
Consumer Discretionary | 0 | 113 | 0 | 113 | ||||||||||||
Consumer Staples | 0 | 306 | 0 | 306 | ||||||||||||
Energy | 0 | 85 | 0 | 85 | ||||||||||||
Financials | 0 | 28 | 0 | 28 | ||||||||||||
Industrials | 0 | 52 | 0 | 52 | ||||||||||||
Germany | ||||||||||||||||
Financials | 0 | 98 | 0 | 98 | ||||||||||||
Health Care | 0 | 35 | 0 | 35 | ||||||||||||
Industrials | 0 | 31 | 0 | 31 | ||||||||||||
Utilities | 0 | 42 | 0 | 42 | ||||||||||||
Guernsey, Channel Islands | ||||||||||||||||
Financials | 0 | 75 | 0 | 75 | ||||||||||||
Hong Kong | ||||||||||||||||
Financials | 115 | 31 | 0 | 146 | ||||||||||||
Industrials | 0 | 27 | 0 | 27 | ||||||||||||
Italy | ||||||||||||||||
Financials | 0 | 21 | 0 | 21 | ||||||||||||
Japan | ||||||||||||||||
Information Technology | 0 | 58 | 0 | 58 | ||||||||||||
Netherlands | ||||||||||||||||
Consumer Staples | 0 | 107 | 0 | 107 | ||||||||||||
Energy | 9 | 46 | 0 | 55 | ||||||||||||
Financials | 0 | 44 | 0 | 44 | ||||||||||||
Information Technology | 0 | 33 | 0 | 33 | ||||||||||||
Telecommunication Services | 0 | 112 | 0 | 112 | ||||||||||||
Norway | ||||||||||||||||
Consumer Staples | 0 | 67 | 0 | 67 | ||||||||||||
Industrials | 0 | 39 | 0 | 39 | ||||||||||||
| Category and Subcategory (3) | Level 1 (4) | Level 2 (5) | Level 3 (6) | Fair Value at 12/31/2010 | ||||||||||||
Singapore | ||||||||||||||||
Financials | $ | 0 | $ | 14 | $ | 0 | $ | 14 | ||||||||
Industrials | 0 | 62 | 0 | 62 | ||||||||||||
Sweden | ||||||||||||||||
Industrials | 0 | 37 | 0 | 37 | ||||||||||||
Switzerland | ||||||||||||||||
Consumer Staples | 0 | 82 | 0 | 82 | ||||||||||||
Financials | 0 | 105 | 0 | 105 | ||||||||||||
Health Care | 56 | 0 | 0 | 56 | ||||||||||||
Industrials | 0 | 37 | 0 | 37 | ||||||||||||
Materials | 0 | 33 | 0 | 33 | ||||||||||||
United Kingdom | ||||||||||||||||
Consumer Discretionary | 13 | 0 | 0 | 13 | ||||||||||||
Consumer Staples | 0 | 391 | 0 | 391 | ||||||||||||
Energy | 0 | 105 | 0 | 105 | ||||||||||||
Financials | 0 | 164 | 0 | 164 | ||||||||||||
United States | ||||||||||||||||
Consumer Staples | 358 | 0 | 0 | 358 | ||||||||||||
Energy | 67 | 0 | 0 | 67 | ||||||||||||
Financials | 435 | 0 | 0 | 435 | ||||||||||||
Health Care | 64 | 0 | 0 | 64 | ||||||||||||
Industrials | 28 | 0 | 0 | 28 | ||||||||||||
Information Technology | 161 | 0 | 0 | 161 | ||||||||||||
Exchange-Traded Funds | 228 | 0 | 0 | 228 | ||||||||||||
Short-Term Instruments | ||||||||||||||||
Repurchase Agreements | 0 | 106 | 0 | 106 | ||||||||||||
PIMCO Short-Term Floating NAV Portfolio | 901 | 0 | 0 | 901 | ||||||||||||
Purchased Options | ||||||||||||||||
Equity Contracts | 1 | 0 | 0 | 1 | ||||||||||||
| $ | 2,477 | $ | 3,011 | $ | 0 | $ | 5,488 | |||||||||
Short Sales, at value | $ | (40 | ) | $ | 0 | $ | 0 | $ | (40 | ) | ||||||
Financial Derivative Instruments (7) – Assets | ||||||||||||||||
Foreign Exchange Contracts | $ | 0 | $ | 55 | $ | 0 | $ | 55 | ||||||||
Financial Derivative Instruments (7) – Liabilities |
| |||||||||||||||
Foreign Exchange Contracts | $ | 0 | $ | (53 | ) | $ | 0 | $ | (53 | ) | ||||||
Totals | $ | 2,437 | $ | 3,013 | $ | 0 | $ | 5,450 | ||||||||
| (1) | See note 3 in the Notes to Financial Statements for more information regarding pricing inputs and valuation techniques. |
| (2) | There were no significant transfers into and out of level 1, 2, and 3 during the period ended December 31, 2010. |
| (3) | Refer to the Schedule of Investments for additional information. |
| (4) | Quoted prices in active markets for identical investments. |
| (5) | Significant other observable inputs. |
| (6) | Significant unobservable inputs. |
| (7) | Financial derivative instruments may include open written options and foreign currency contracts. |
| See Accompanying Notes | Annual Report | December 31, 2010 | 15 |
Table of Contents
Schedule of Investments Pimco EqS Pathfinder Portfolio™ (Cont.)
| (i) | Fair Value of Financial Derivative Instruments (1) |
The following is a summary of the fair valuations of the Portfolio’s derivative instruments categorized by risk exposure:
Fair Values of Financial Derivative Instruments on the Statement of Assets and Liabilities as of December 31, 2010:
| Derivatives not accounted for as hedging instruments | ||||||||||||||||||||||||
| Interest rate contracts | Foreign exchange contracts | Credit contracts | Equity contracts | Other contracts | Total | |||||||||||||||||||
Assets: | ||||||||||||||||||||||||
Investments, at value (purchased options) | $ | 0 | $ | 0 | $ | 0 | $ | 1 | $ | 0 | $ | 1 | ||||||||||||
Unrealized appreciation on foreign currency contracts | 0 | 55 | 0 | 0 | 0 | 55 | ||||||||||||||||||
| $ | 0 | $ | 55 | $ | 0 | $ | 1 | $ | 0 | $ | 56 | |||||||||||||
Liabilities: | ||||||||||||||||||||||||
Unrealized depreciation on foreign currency contracts | $ | 0 | $ | 53 | $ | 0 | $ | 0 | $ | 0 | $ | 53 | ||||||||||||
The Effect of Financial Derivative Instruments on the Statement of Operations for the Period Ended December 31, 2010:
| Derivatives not accounted for as hedging instruments | ||||||||||||||||||||||||
| Interest rate contracts | Foreign exchange contracts | Credit contracts | Equity contracts | Other contracts | Total | |||||||||||||||||||
Realized (Loss) on Derivatives Recognized as a Result from Operations: | ||||||||||||||||||||||||
Net realized (loss) on investments (purchased options) | $ | 0 | $ | 0 | $ | 0 | $ | (8 | ) | $ | (2 | ) | $ | (10 | ) | |||||||||
Net realized (loss) on written options | 0 | 0 | 0 | (1 | ) | 0 | (1 | ) | ||||||||||||||||
Net realized (loss) on foreign currency transactions | 0 | (26 | ) | 0 | 0 | 0 | (26 | ) | ||||||||||||||||
| $ | 0 | $ | (26 | ) | $ | 0 | $ | (9 | ) | $ | (2 | ) | $ | (37 | ) | |||||||||
Net Change in Unrealized Appreciation on Derivatives Recognized as a Result from Operations: | ||||||||||||||||||||||||
Net change in unrealized appreciation on translation of assets and liabilities denominated in foreign currencies | $ | 0 | $ | 3 | $ | 0 | $ | 0 | $ | 0 | $ | 3 | ||||||||||||
| (1) | See note 5 in the Notes to Financial Statements for additional information. |
| 16 | PIMCO Equity Series VIT | See Accompanying Notes |
Table of Contents
December 31, 2010
1. ORGANIZATION
The PIMCO EqS Pathfinder PortfolioTM (the “Portfolio”) is a series of the PIMCO Equity Series VIT (the “Trust”). The Trust is registered under the Investment Company Act of 1940, as amended (the “Act”), as an open-end management investment company organized as a Delaware statutory trust on December 28, 2009. The Portfolio currently offers two classes of shares: Institutional and Advisor. Information presented on these financial statements pertains to the Institutional Class of the Portfolio. Certain detailed financial information for the Advisor Class is provided separately and is available upon request. The Trust is designed to be used as an investment vehicle by separate accounts of insurance companies that fund variable annuity contracts and variable life insurance policies and by qualified pension and retirement plans.
2. SIGNIFICANT ACCOUNTING POLICIES
The following is a summary of significant accounting policies consistently followed by the Portfolio in the preparation of its financial statements in conformity with accounting principles generally accepted in the United States of America (“U.S. GAAP”). The preparation of financial statements in accordance with U.S. GAAP may require management to make estimates and assumptions that affect the reported amounts of assets and liabilities and disclosure of contingent assets and liabilities at the date of the financial statements and the reported amounts of increases and decreases in net assets from operations during the reporting period. Actual results could differ from those estimates.
(a) Determination of Net Asset Value The Net Asset Value (“NAV”) of the Portfolio’s shares is valued as of the close of regular trading (normally 4:00 p.m., Eastern time) (the “NYSE Close”) on each day that the New York Stock Exchange (“NYSE”) is open. Information that becomes known to the Portfolio or its agents after the NAV has been calculated on a particular day will not generally be used to retroactively adjust the price of a security or the NAV determined earlier that day. The Portfolio reserves the right to change the time its NAV is calculated if the Portfolio closes earlier, or as permitted by the SEC.
(b) Securities Transactions and Investment Income Securities transactions are recorded as of the trade date for financial reporting purposes. Realized gains and losses from securities sold are recorded on the identified cost basis. Dividend income is recorded on the ex-dividend date, except certain dividends from foreign securities where the ex-dividend date may have passed, which are recorded as soon as the Portfolio is informed of the ex-dividend date. Interest income, adjusted for the accretion of discounts and amortization of premiums, is recorded on the accrual basis.
Dividends received by real estate investment trust securities may include return of capital. Such distributions reduce the cost basis of the respective securities. Distributions, if any, in excess of the cost basis of the security are recognized as capital gain.
(c) Foreign Currency Translation Portfolio securities and other assets and liabilities denominated in foreign currencies are translated into U.S. dollars based on the exchange rate of such currencies against U.S. dollars on the date of valuation. Purchases and sales of securities, income and expense items denominated in foreign currencies are translated into U.S. dollars at the exchange rate in effect on the transaction date.
The Portfolio does not separately report the effect of changes in foreign exchange rates from changes in market prices on securities held. Such changes are included in net realized and unrealized gain or loss from investments on the Statement of Operations.
Realized foreign exchange gains or losses arise from sales of foreign currencies, currency gains or losses realized between the trade and settlement dates on securities transactions and the difference between the recorded amounts of dividend, interest, and foreign withholding taxes and the U.S. dollar equivalent of the amounts actually received or paid. Net unrealized foreign exchange gains and losses arise from changes in foreign exchange rates on foreign denominated assets and liabilities other than investments in securities held at the end of the reporting period.
(d) Multiclass Operations Each class offered by the Portfolio has equal rights as to assets and voting privileges (except that shareholders of a class have exclusive voting rights regarding any matter relating solely to that class of shares). Income and non-class specific expenses are allocated daily to each class on the basis of the relative net assets. Realized and unrealized capital gains and losses of each class are allocated daily based on the relative net assets of each class of the Portfolio. Class specific expenses, where applicable, currently include supervisory and administrative, distribution and servicing fees.
(e) Dividends and Distributions to Shareholders Dividends from net investment income, if any, are declared and distributed to shareholders annually. Net realized capital gains earned by the Portfolio, if any, will be distributed no less frequently than once each year.
Income dividends and capital gain distributions are determined in accordance with income tax regulations which may differ from U.S. GAAP. Differences between tax regulations and U.S. GAAP may change the fiscal year when income and capital items are recognized for tax and U.S. GAAP purposes. Examples of events that give rise to timing differences include wash sales, straddles and capital loss carryforwards. Further, the character of investment income and capital gains may be different for certain transactions under the two methods of accounting. Examples of characterization differences include the treatment of swaps, foreign currency transactions, and investments in passive foreign investment companies. As a result, income dividends and capital gain distributions declared during a fiscal period may differ significantly from the net investment income and realized capital gain reported on the Portfolio’s annual financial statements presented under U.S. GAAP.
Distributions classified as a tax basis return of capital, if any, are reflected on the accompanying Statements of Changes in Net Assets and have been reclassified to paid in capital. In addition, other amounts have been reclassified between undistributed net investment income, accumulated undistributed net realized gains or losses and/or paid in capital to more appropriately conform financial accounting to tax characterizations of dividend distributions.
3. INVESTMENT VALUATION AND FAIR VALUE MEASUREMENTS
For purposes of calculating the NAV, portfolio securities and other assets for which market quotes are readily available are valued at fair market value. Fair market value is generally determined on the basis of last reported sales prices, or if no sales are reported, based on quotes obtained from a quotation reporting system, established market makers, or pricing services.
Investments initially valued in currencies other than the U.S. dollar are converted to the U.S. dollar using exchange rates obtained from pricing service providers. As a result, the NAV of the Portfolio’s shares may be affected by changes in the value of currencies in relation to the U.S. dollar. The value of securities traded in markets outside the United States or denominated in currencies other than the U.S. dollar may be affected significantly on a day that the NYSE is closed and the NAV may change on days when an investor is not able to purchase, redeem or exchange shares.
| Annual Report | December 31, 2010 | 17 |
Table of Contents
Notes to Financial Statements (Cont.)
U.S. GAAP defines fair market value as the price that the Portfolio would receive to sell an asset or pay to transfer a liability in an orderly transaction between market participants at the measurement date. It establishes a fair value hierarchy that prioritizes inputs to valuation methods and requires disclosure of the fair value hierarchy, separately for each major category of assets and liabilities, that segregates fair value measurements into levels (Level 1, 2, and 3). The inputs or methodology used for valuing securities are not necessarily an indication of the risk associated with investing in those securities. Levels 1, 2 and 3 of the fair value hierarchy are defined as follows:
| • | Level 1 — Inputs using quoted prices in active markets or exchanges for identical assets and liabilities. |
| • | Level 2 — Significant other observable inputs, which may include, but are not limited to, quoted prices for similar assets or liabilities in markets that are active, quoted prices for identical or similar assets or liabilities in markets that are not active, inputs other than quoted prices that are observable for the assets or liabilities (such as interest rates, yield curves, volatilities, prepayment speeds, loss severities, credit risks and default rates) or other market corroborated inputs. |
| • | Level 3 — Significant unobservable inputs based on the best information available in the circumstances, to the extent observable inputs are not available, which may include assumptions made by the Board of Trustees (the “Board”) or persons acting at their direction that are used in determining the fair market value of investments. |
Level 1 and Level 2 trading assets and trading liabilities, at fair market value The valuation techniques and significant inputs used in determining the fair market values of financial instruments classified as Level 1 and Level 2 of the fair value hierarchy are as follows:
Common stocks, exchange-traded funds and financial derivative instruments, such as futures contracts or options contracts that are traded on a national securities exchange, are stated at the last reported sale or settlement price on the day of valuation. To the extent these securities are actively traded and valuation adjustments are not applied, they are categorized as Level 1 of the fair value hierarchy. Valuation adjustments may be applied to certain securities that are solely traded on a foreign exchange to account for the market movement between the close of the foreign market and the close of the NYSE. These securities are valued using pricing service providers that considers the correlation of the trading patterns of the foreign security to the intraday trading in the U.S. markets for investments. Securities using these valuation adjustments are categorized as Level 2 of the fair value hierarchy. Preferred securities and other equities traded on inactive markets or valued by reference to similar instruments are also categorized as Level 2 of the fair value hierarchy.
Investments in registered open-end investment management companies will be valued based upon the NAVs of such investments and are categorized as Level 1 of the fair value hierarchy. Investments in unregistered open-end management investment companies will be calculated based upon the NAV of such investments and are considered Level 1 provided that the NAV is observable, calculated daily and is the value at which both purchases and sales will be conducted. Investments in privately held investment funds will be valued based upon the NAVs of such investments and are categorized as Level 2 of the fair value hierarchy. Investments in privately held investment funds where the NAV is unobservable will be calculated based upon the NAVs of such investments and are categorized as Level 3 of the fair value hierarchy.
Short-term investments having a maturity of 60 days or less are generally valued at amortized cost which approximates fair market value. These investments are categorized as Level 2 of the fair value hierarchy.
Over-the-counter financial derivative instruments, such as foreign currency contracts or options contracts, derive their value from underlying asset prices, indices, reference rates, and other inputs or a combination of these factors. These contracts are normally valued on the basis of broker dealer quotations or pricing service providers. Depending on the product and the terms of the transaction, the value of the derivative contracts can be estimated by a pricing service provider using a series of techniques, including simulation pricing models. The pricing models use inputs that are observed from actively quoted markets such as issuer details, indices, spreads, interest rates, curves, dividends and exchange rates. Derivatives that use similar valuation techniques and inputs as described above are categorized as Level 2 of the fair value hierarchy.
Level 3 trading assets and trading liabilities, at fair market value The valuation techniques and significant inputs used in determining the fair market values of financial instruments classified as Level 3 of the fair value hierarchy are as follows:
Securities and other assets for which market quotes are not readily available are valued at fair market value as determined in good faith by the Board or persons acting at their direction and are categorized as Level 3 of the fair value hierarchy.
Market quotes are considered not readily available in circumstances where there is an absence of current or reliable market-based data (e.g., trade information or broker quotes), including where events occur after the close of the relevant market, but prior to the NYSE Close, that materially affect the values of the Portfolio’s securities or assets. In addition, market quotes are considered not readily available when, due to extraordinary circumstances, the exchanges or markets on which the securities trade, do not open for trading for the entire day and no other market prices are available. The Board has delegated to the investment adviser, Pacific Investment Management Company LLC (“PIMCO”), the responsibility for monitoring significant events that may materially affect the values of the Portfolio’s securities or assets and for determining whether the value of the applicable securities or assets should be re-evaluated in light of such significant events.
The Board has adopted methods for valuing securities and other assets in circumstances where market quotes are not readily available, and has delegated the responsibility for applying the valuation methods to PIMCO. For instances in which daily market quotes are not readily available investments may be valued, pursuant to guidelines established by the Board, with reference to other securities or indices. In the event that the security or asset cannot be valued pursuant to one of the valuation methods established by the Board, the value of the security or asset will be determined in good faith by the Valuation Committee of the Board, generally based upon recommendations provided by PIMCO. When the Portfolio uses fair valuation methods applied by PIMCO that uses significant unobservable inputs to determine its NAV, securities will be priced by another method that the Board or persons acting at their direction believe accurately reflects fair market value and are categorized as Level 3 of the fair value hierarchy. These methods may require subjective determinations about the value of the security. While the Trust’s policy is intended to result in a calculation of the Portfolio’s NAV that fairly reflects security values as of the time of pricing, the Trust cannot guarantee that values determined by the Board or persons acting at their direction would accurately reflect the price that the Portfolio could obtain for a security if it were to dispose of that security as of the time of pricing (for instance, in a forced or distressed sale). The prices used by the Portfolio may differ from the value that would be realized if the securities were sold.
For fair valuations using significant unobservable inputs, U.S. GAAP requires a reconciliation of the beginning to ending balances for reported market values that presents changes attributable to total realized and unrealized gains or losses, purchases and sales, and transfers in/out of the Level 3 category during the
| 18 | PIMCO Equity Series VIT |
Table of Contents
December 31, 2010
period. The end of period timing recognition is used for the significant transfers between Levels of the Portfolio’s assets and liabilities. In accordance with the requirements of U.S. GAAP, a fair value hierarchy and Level 3 reconciliation, if any, have been included in the Notes to the Schedule of Investments for the Portfolio.
4. SECURITIES AND OTHER INVESTMENTS
(a) Exchange-Trade Funds The Portfolio may invest in exchange-trade funds (“ETFs”), which generally are index-based investment companies that hold substantially all of their assets in securities representing their specific index. ETFs are funds that issue shares that trade throughout the day on an exchange and represent an investment in a portfolio of securities and assets. As a shareholder of another investment company, the portfolio would bear its pro rata portion of the other investment company’s expenses, including advisory fees, in addition to the expenses the Portfolio bears directly in connection with its own operations.
(b) Repurchase Agreements The Portfolio may engage in repurchase transactions. Under the terms of a typical repurchase agreement, the Portfolio takes possession of an underlying debt obligation (collateral) subject to an obligation of the seller to repurchase, and the Portfolio to resell, the obligation at an agreed-upon price and time. The underlying securities for all repurchase agreements are held in safekeeping at the Portfolio’s custodian or designated subcustodians under tri-party repurchase agreements. The market value of the collateral must be equal to or exceed the total amount of the repurchase obligations, including interest. Securities purchased under repurchase agreements are reflected as an asset in the Statement of Assets and Liabilities. Interest earned is recorded as a component of interest income on the Statement of Operations. In periods of increased demand for collateral, the Portfolio may pay a fee for receipt of collateral, which may result in interest expense to the Portfolio. Generally, in the event of counterparty default, the Portfolio has the right to use the collateral to offset losses incurred. If the counterparty should default, the Portfolio will seek to sell the securities which it holds as collateral. This could involve procedural costs or delays in addition to a loss on the securities if their value should fall below their repurchase price.
(c) Short Sales The Portfolio may engage in short sales for investment and risk management purposes. Short sales are transactions in which the Portfolio sells a security or other instrument (such as an option, forward, future or other derivative contract) that it does not own. When the Portfolio engages in a short sale, it must borrow the security sold short and deliver it to the counterparty. The Portfolio will ordinarily have to pay a fee or premium to borrow a security and be obligated to repay the lender of the security any dividend or interest that accrues on the security during the period of the loan. The Portfolio may enter into a specific agreement with a prime broker giving the Portfolio the opportunity to borrow a predetermined amount of a thinly traded security for the duration of the term (the “Term Borrow Agreement”). In exchange for the opportunity to borrow the specified security, the Portfolio will pay the prime broker a fee as detailed in the Term Borrow Agreement. Securities sold in short sale transactions and the dividend or interest payable on such securities, if any, are reflected as payable for short sales on the Statement of Assets and Liabilities. Short sales expose the Portfolio to the risk that it will be required to cover its short position at a time when the security or other asset has appreciated in value, thus resulting in losses to the Portfolio. A short sale is “against the box” if the Portfolio holds in its portfolio or has the right to acquire the security sold short at no additional cost. The Portfolio will be subject to additional risks to the extent that it engages in short sales that are not “against the box.” The Portfolio’s loss on a short sale could theoretically be unlimited in cases where the Portfolio is unable, for whatever reason, to close out its short position.
5. FINANCIAL DERIVATIVE INSTRUMENTS
The following disclosures contain information on how and why the Portfolio uses derivative instruments, the credit-risk-related contingent features in certain
derivative instruments, and how derivative instruments affect the Portfolio’s financial position, results of operations and cash flows. The location and fair value amounts of these instruments on the Statement of Assets and Liabilities and the realized and changes in unrealized gains and losses on the Statement of Operations, each categorized by type of derivative contract, are included in a table in the Notes to Schedule of Investments. The derivative instruments outstanding as of period end as disclosed in the Notes to Schedule of Investments and the amounts of realized and changes in unrealized gains and losses on derivative instruments during the period as disclosed in the Statement of Operations serve as indicators of the volume of derivative activity for the Portfolio.
(a) Foreign Currency Contracts The Portfolio may enter into foreign currency contracts in connection with settling planned purchases or sales of securities, to hedge the currency exposure associated with some or all of the Portfolio’s securities or as a part of an investment strategy. A foreign currency contract is an agreement between two parties to buy and sell a currency at a set price on a future date. The market value of a foreign currency contract fluctuates with changes in foreign currency exchange rates. Foreign currency contracts are marked to market daily and the change in value is recorded by the Portfolio as an unrealized gain or loss. Realized gains or losses equal to the difference between the value of the contract at the time it was opened and the value at the time it was closed are recorded upon delivery or receipt of the currency. These contracts may involve market risk in excess of the unrealized gain or loss reflected on the Statement of Assets and Liabilities. In addition, the Portfolio could be exposed to risk if the counterparties are unable to meet the terms of the contracts or if the value of the currency changes unfavorably to the U.S. dollar. In connection with these contracts, securities may be identified as collateral in accordance with the terms of the respective contracts.
(b) Options Contracts The Portfolio may write call and put options on futures, swaps (“swaptions”), securities, commodities or currencies it owns or in which it may invest. Writing put options tends to increase the Portfolio’s exposure to the underlying instrument. Writing call options tends to decrease the Portfolio’s exposure to the underlying instrument. When the Portfolio writes a call or put option, an amount equal to the premium received is recorded as a liability and subsequently marked to market to reflect the current value of the option written. These liabilities are reflected as written options outstanding on the Statement of Assets and Liabilities. Certain options may be written with premiums to be determined on a future date. Premiums received from writing options which expire are treated as realized gains. Premiums received from writing options which are exercised or closed are added to the proceeds or offset against amounts paid on the underlying futures, swap, security or currency transaction to determine the realized gain or loss. The Portfolio as a writer of an option has no control over whether the underlying instrument may be sold (call) or purchased (put) and as a result bears the market risk of an unfavorable change in the price of the instrument underlying the written option. There is the risk the Portfolio may not be able to enter into a closing transaction because of an illiquid market.
The Portfolio may also purchase put and call options. Purchasing call options tends to increase the Portfolio’s exposure to the underlying instrument. Purchasing put options tends to decrease the Portfolio’s exposure to the underlying instrument. The Portfolio pays a premium which is included on the Statement of Assets and Liabilities as an investment and subsequently marked to market to reflect the current value of the option. Premiums paid for purchasing options which expire are treated as realized losses. Certain options may be purchased with premiums to be determined on a future date. The premiums for these options are based upon implied volatility parameters at specified terms. The risk associated with purchasing put and call options is limited to the premium paid. Premiums paid for purchasing options which are exercised or closed are added to the amounts paid or offset against the proceeds on the underlying investment transaction to determine the realized gain or loss.
| Annual Report | December 31, 2010 | 19 |
Table of Contents
Notes to Financial Statements (Cont.)
6. PRINCIPAL RISKS
In the normal course of business the Portfolio trades financial instruments and enters into financial transactions where risk of potential loss exists due to changes in the market (market risk), or failure or inability of the other party to a transaction to perform (credit and counterparty risk). See below for a detailed description of select principal risks. For a list of potential risks the Portfolio may be subject to, please see the Important Information About the Portfolio.
Market Risks The Portfolio’s investments in derivatives and other financial instruments expose the Portfolio to various risks such as, but not limited to equity, interest rate and foreign currency risks.
The market values of equities, such as common stocks and preferred securities or equity related investments such as futures and options, may decline due to general market conditions which are not specifically related to a particular company, such as real or perceived adverse economic conditions, changes in the general outlook for corporate earnings, changes in interest or currency rates or adverse investor sentiment generally. They may also decline due to factors which affect a particular industry or industries, such as labor shortages or increased production costs and competitive conditions within an industry. Equity securities and equity related investments generally have greater market price volatility than fixed income securities.
Interest rate risk is the risk that fixed income securities will decline in value because of changes in interest rates. As nominal interest rates rise, the value of certain fixed income securities held by the Portfolio is likely to decrease. A nominal interest rate can be described as the sum of a real interest rate and an expected inflation rate. Fixed income securities with longer durations tend to be more sensitive to changes in interest rates, usually making them more volatile than securities with shorter durations. Duration is useful primarily as a measure of the sensitivity of a fixed income’s market price to interest rate (i.e. yield) movements.
If the Portfolio invests directly in foreign currencies or in securities that trade in, and receive revenues in, foreign currencies, or in derivatives that provide exposure to foreign currencies, it will be subject to the risk that those currencies will decline in value relative to the base currency of the Portfolio, or, in the case of hedging positions, that the Portfolio’s base currency will decline in value relative to the currency being hedged. Currency rates in foreign countries may fluctuate significantly over short periods of time for a number of reasons, including changes in interest rates, intervention (or the failure to intervene) by U.S. or foreign governments, central banks or supranational entities such as the International Monetary Fund, or by the imposition of currency controls or other political developments in the United States or abroad. As a result, the Portfolio’s investments in foreign currency denominated securities may reduce the returns of the Portfolio.
Credit and Counterparty Risks The Portfolio will be exposed to credit risk on parties with whom it trades and will also bear the risk of settlement default. The Portfolio minimizes concentrations of credit risk by undertaking transactions with a large number of customers and counterparties on recognized and reputable exchanges. The Portfolio could lose money if the issuer or guarantor of a fixed income security, or the counterparty to a derivatives contract, repurchase agreement or a loan of portfolio securities, is unable or unwilling to make timely principal and/or interest payments, or to otherwise honor its obligations. Securities are subject to varying degrees of credit risk, which are often reflected in credit ratings.
Similar to credit risk, the Portfolio may be exposed to counterparty risk, or the risk that an institution or other entity with which the Portfolio has unsettled or open transactions will default. Financial assets, which potentially expose the Portfolio to counterparty risk, consist principally of cash due from counterparties and
investments. PIMCO, as the investment adviser, minimizes counterparty risks to the Portfolio by performing extensive reviews of each counterparty and obtaining approval from the PIMCO Counterparty Risk Committee prior to entering into transactions with a third party. Furthermore, to the extent that unpaid amounts owed to the Portfolio exceed a predetermined threshold agreed to with the counterparty, such counterparty shall advance collateral to the Portfolio in the form of cash or cash equivalents equal in value to the unpaid amount owed to the Portfolio. The Portfolio may invest such collateral in securities or other instruments and will typically pay interest to the counterparty on the collateral received. If the unpaid amount owed to the Portfolio subsequently falls, the Portfolio would be required to return to the counterparty all or a portion of the collateral previously advanced to the Portfolio.
All transactions in listed securities are settled/paid for upon delivery using approved counterparties. The risk of default is considered minimal, as delivery of securities sold is only made once the Portfolio has received payment. Payment is made on a purchase once the securities have been delivered by the counterparty. The trade will fail if either party fails to meet its obligation.
The Portfolio is subject to various Master Agreements, which govern the terms of certain transactions with select counterparties. These Master Agreements reduce the counterparty risk associated with relevant transactions by allowing the Portfolio to net contracts in the event of default. All amounts with the counterparty are terminated and settled on a net basis. The Portfolio’s overall exposure to counterparty risk can change substantially within a short period, as it is affected by each transaction subject to the relevant Master Agreement.
Master Repurchase Agreements (“Master Repo Agreements”) govern transactions between the Portfolio and select counterparties. The Master Repo Agreements maintain provisions for, initiation, income payments, events of default, and maintenance of collateral for Repurchase Agreements.
International Swaps and Derivatives Association, Inc. Master Agreements (“ISDA Master Agreements”) govern transactions, over-the-counter derivative and foreign exchange contracts, entered into by the Portfolio and those counterparties. The ISDA Master Agreements maintain provisions for general obligations, representations, agreements, collateral and events of default or termination. Events of termination include conditions that may entitle counterparties to elect to terminate early and cause settlement of all outstanding transactions under the applicable ISDA Master Agreement. Any election to early terminate could be material to the financial statements.
Prime Broker Account Agreements between the Portfolio and selected Prime Brokers govern the considerations and factors surrounding accounts opened for short selling transactions and activities, including, but not limited to, margin, execution, and settlement. The Prime Broker Account Agreements maintain provisions for, among other things, payments, maintenance of collateral, events of default, and termination.
7. FEES AND EXPENSES
(a) Investment Advisory Fee PIMCO is a majority-owned subsidiary of Allianz Global Investors of America L.P. (“AGI”), and serves as investment adviser (the “Adviser”) to the Trust, pursuant to an investment advisory contract. The Adviser receives a monthly fee from the Portfolio, at an annual rate based on average daily net assets (the “Investment Advisory Fee”). The Investment Advisory Fee for all classes is charged at an annual rate of 0.75%.
PIMCO has contractually agreed, through May 1, 2012, to waive a portion of its Investment Advisory Fee equal to 0.13% of average daily net assets. Under the Fee Limitation Agreement (see note 7(e)), PIMCO is entitled to reimbursement by the Portfolio of any portion of the management fees waived, reduced or reimbursed pursuant to the Fee Limitation Agreement (the “Reimbursement
| 20 | PIMCO Equity Series VIT |
Table of Contents
December 31, 2010
Amount”) during the previous three years, provided that such amount paid to PIMCO will not: 1) together with any recoupment of organizational expenses and pro rata Trustees’ fees pursuant to the Expense Limitation Agreement, exceed the Expense Limit: 2) exceed the total Reimbursement Amount; or 3) include any amounts previously reimbursed to PIMCO. The Fee Limitation Agreement will automatically renew for one-year terms unless PIMCO provides written notice to the Trust at least 30 days prior to the end of the then current term. As of December 31, 2010, the recoverable Investment Advisory Fee amount to PIMCO was $3,857.
(b) Supervisory and Administrative Fee PIMCO serves as administrator (the “Administrator”), and provides supervisory and administrative services to the Trust for which it receives a monthly supervisory and administrative fee based on each share class’s average daily net assets (the “Supervisory and Administrative Fee”). As the Administrator, PIMCO bears the costs of various third-party services, including audit, custodial, portfolio accounting, legal, transfer agency and printing costs. The Supervisory and Administrative Fee for all classes is charged at the annual rate of 0.35%.
(c) Distribution and Servicing Fees During the fiscal year ended December 31, 2010, Allianz Global Investors Distributors LLC (“AGID”), an indirect wholly-owned subsidiary of AGI, served as the distributor (the “Distributor”) of the Trust’s shares. The Trust has adopted a Distribution Plan for the Advisor Class shares of the Portfolio (the “Plan”). The Plan has been adopted pursuant to Rule 12b-1 under the Act. The Plan permits payments for expenses in connection with the distribution and marketing of Advisor Class shares and/or the provision of shareholder services to Advisor Class shareholders. The Plan permits the Portfolio to make total payments at an annual rate of 0.25% of its average daily net assets attributable to its Advisor Class shares.
Effective February 14, 2011, PIMCO Investments LLC will serve as the Distributor for the Trust. Please see Subsequent Event Note for more details.
(d) Portfolio Expenses The Trust is responsible for the following expenses: (i) salaries and other compensation of any of the Trust’s executive officers and employees who are not officers, directors, stockholders or employees of PIMCO or its subsidiaries or affiliates; (ii) taxes and governmental fees; (iii) brokerage fees and commissions and other portfolio transaction expenses; (iv) the costs of borrowing money, including interest expenses and bank overdraft charges; (v) fees and expenses of the Trustees who are not “interested persons” of PIMCO or the Trust, and any counsel retained exclusively for their benefit; (vi) extraordinary expenses, including costs of litigation and indemnification expenses; (vii) organization expenses, which are capitalized in accordance with generally accepted accounting principles; and (viii) any expenses allocated or allocable to a specific class of shares (“class-specific expenses”). The ratio of expenses to average net assets per share class, as disclosed on the Financial Highlights, may differ from the annual portfolio operating expenses per share class as disclosed in the Prospectus for the reasons set forth above.
Each Trustee, other than those affiliated with PIMCO or its affiliates, receives an annual retainer of $10,000, plus $1,500 for each Board of Trustees meeting attended in person, $250 ($375 in the case of the audit committee chair with respect to audit committee meetings) for each committee meeting attended and $375 for each Board of Trustees meeting attended telephonically, plus reimbursement of related expenses. In addition, the audit committee chair receives an additional annual retainer of $2,000 and each other committee chair receives an additional annual retainer of $250. The Trust pays no compensation directly to any Trustee or any other officer who is affiliated with the Administrator, all of whom receive remuneration for their services to the Trust from the Administrator or its affiliates.
(e) Expense Limitation PIMCO has also contractually agreed, through May 1, 2011, to reduce total annual operating expenses for each of the Portfolio’s separate classes of shares, by reducing the Portfolio’s Supervisory and Administrative fee or reimbursing the Portfolio, to the extent that organizational expenses and pro rata Trustees’ fees attributable to a class of shares of the Portfolio exceed 0.0049% of the Portfolio’s average net assets attributable to
separate classes of shares. This Expense Limitation Agreement renews annually for a full year unless terminated by PIMCO upon at least 30 days prior notice to the end of the contract term. PIMCO may recoup these waivers and reimbursements for a period not exceeding three years, provided that total expenses, including such recoupment, do not exceed the annual expense limit. As of December 31, 2010, the remaining recoverable amount to PIMCO was $99,476.
8. RELATED PARTY TRANSACTIONS
The Adviser, Administrator, and Distributor are related parties. Fees payable to these parties are disclosed in Note 7 and the accrued related party fees amounts are disclosed in the Statement of Assets and Liabilities.
The Portfolio may invest in the PIMCO Short-Term Floating NAV Portfolio to the extent permitted by the Act and rules thereunder. The PIMCO Short-Term Floating NAV Portfolio is a registered investment company created for use solely by the series of the Trust, series of the PIMCO Funds, PIMCO Equity Series and PIMCO Variable Insurance Trust in connection with their cash management activities. The main investments of the PIMCO Short-Term Floating NAV Portfolio are money market instruments and short maturity fixed income instruments. The PIMCO Short-Term Floating NAV Portfolio may incur expenses related to its investment activities, but does not pay Investment Advisory or Supervisory and Administrative Fees to PIMCO. The PIMCO Short-Term Floating NAV Portfolio is considered to be affiliated with the Portfolio. The table below shows the Portfolio’s transactions in and earnings from investments in the PIMCO Short-Term Floating NAV Portfolio for the period ended December 31, 2010 (amounts in thousands):
| Market Value 04/14/2010 | Purchases at Cost | Proceeds from Sales | Net Capital and Realized Gain | Change in Unrealized Appreciation | Market Value 12/31/2010 | Dividend Income | ||||||||||||||||||||
| $ | 0 | $ | 4,101 | $ | (3,200 | ) | $ | 0 | $ | 0 | $ | 901 | $ | 1 | ||||||||||||
9. GUARANTEES AND INDEMNIFICATIONS
Under the Trust’s organizational documents, each Trustee or officer of the Trust is indemnified and each employee or other agent of the Trust (including the Trust’s investment manager) may be indemnified, to the extent permitted by the Act, against certain liabilities that may arise out of performance of their duties to the Portfolio. Additionally, in the normal course of business, the Portfolio enters into contracts that contain a variety of indemnification clauses. The Portfolio’s maximum exposure under these arrangements is unknown as this would involve future claims that may be made against the Portfolio that have not yet occurred. However, the Portfolio has not had prior claims or losses pursuant to these contracts.
10. PURCHASES AND SALES OF SECURITIES
The length of time the Portfolio has held a particular security is not generally a consideration in investment decisions. A change in the securities held by the Portfolio is known as “portfolio turnover.” The Portfolio may engage in frequent and active trading of portfolio securities to achieve its investment objective, particularly during periods of volatile market movements. High portfolio turnover (e.g., over 100%) involves correspondingly greater expenses to the Portfolio, including brokerage commissions or dealer mark-ups and other transaction costs on the sale of securities and reinvestments in other securities. Such sales may also result in realization of taxable capital gains, including short-term capital gains (which are generally taxed at ordinary income tax rates). The trading costs and tax effects associated with portfolio turnover may adversely affect the Portfolio’s performance. The portfolio turnover rates are reported in the Financial Highlights.
The Portfolio’s purchases and sales of securities, other than short-term securities and U.S. Government Agency securities for the period ended December 31, 2010, were as follows (amounts in thousands):
| Purchases | Sales | |||||
| $ | 5,055 | $ | 796 | |||
| Annual Report | December 31, 2010 | 21 |
Table of Contents
Notes to Financial Statements (Cont.)
11. SHARES OF BENEFICIAL INTEREST
The Portfolio may issue an unlimited number of shares of beneficial interest with a $0.001 par value. Changes in shares of beneficial interest were as follows (shares and amounts in thousands):
| Period from 04/14/2010 to 12/31/2010 | ||||||||||||
| Shares | Amount | |||||||||||
Receipts for shares sold | ||||||||||||
Institutional Class | 349 | $ | 3,472 | |||||||||
Advisor Class | 274 | 2,697 | ||||||||||
Cost of shares redeemed | ||||||||||||
Institutional Class | (32 | ) | (306 | ) | ||||||||
Advisor Class | (32 | ) | (311 | ) | ||||||||
Net increase resulting from Portfolio share transactions | 559 | $ | 5,552 | |||||||||
As of December 31, 2010, the number of shareholders each owning 5% or more of the total shares outstanding of each share class of the Portfolio is summarized in the following table:
Number of Shareholders | % of Shares Outstanding | |||||||||||
| Institutional Class | 1 | 98 | ||||||||||
| Advisor Class | 1 | 97 | * | |||||||||
| * | PIMCO LLC, a direct subsidiary of Allianz Global Investors of America L.P. and a related party to the Portfolio, owned 25% or more of the outstanding shares of beneficial interest of the Portfolio and therefore may be presumed to “control” the Portfolio, as that term is defined in the 1940 Act. |
12. REGULATORY AND LITIGATION MATTERS
The Trust is not engaged in any litigation or arbitration proceedings and is not aware of any litigation or claim pending or threatened by or against it. However, PIMCO is a defendant in the following litigation matters unrelated to its management of the Trust.
In Kohen v. PIMCO and PIMCO Funds, plaintiffs challenged certain trades by PIMCO in the June 2005 10 year futures contract. PIMCO’s position is that all such trades
were properly designed to secure best execution for its clients. The parties resolved this matter through settlement, which resolves all of the claims against PIMCO and PIMCO Funds. In settling this matter, PIMCO and PIMCO Funds deny any liability. This settlement is purely private in nature and not a regulatory matter.
13. FEDERAL INCOME TAX MATTERS
The Portfolio intends to qualify as a regulated investment company under sub-chapter M of the Internal Revenue Code (the “Code”) and distribute all of its taxable income and net realized gains, if applicable, to shareholders. Accordingly, no provision for Federal income taxes has been made.
U.S. GAAP provides guidance for how uncertain tax positions should be recognized, measured, presented and disclosed in the financial statements. In accordance with provisions set forth under U.S. GAAP, the Investment Adviser has reviewed the Portfolio’s tax position for all open tax years, and concluded that the adoptions had no effect on the Portfolio’s financial position or results of operations. As of December 31, 2010, the Portfolio has recorded no liability for net unrecognized tax benefits relating to uncertain income tax positions it has taken or expects to take in future tax returns.
The Portfolio files U. S. tax returns. The Portfolio is not aware of any tax positions for which it is reasonably possible that the total amounts of unrecognized tax benefits will significantly change in the next twelve months.
As of December 31, 2010, the components of distributable taxable earnings are as follows (amounts in thousands):
Undistributed Ordinary Income | Undistributed Long-Term Capital Gains | Net Tax Basis Unrealized Appreciation/ (Depreciation) (1) | Other Book-to-Tax Accounting Differences | Accumulated Capital Losses (2) | Post-October Deferral (3) | |||||||||||||||
| $ 31 | $ | — | $ | 228 | $ | — | $ | (30) | $ | (7) | ||||||||||
| (1) | Adjusted for open wash sale loss deferrals and the accelerated recognition of unrealized gain or loss on certain forward contracts for federal income tax purposes. Also adjusted for investments in ETF Trusts. |
| (2) | Capital losses available to offset future net capital gains expire in varying amounts in the years shown below. |
| (3) | Capital losses realized during the period November 1, 2010 through December 31, 2010, which the Portfolio elected to defer to the following taxable year pursuant to income tax regulations. |
As of December 31, 2010, the Fund had accumulated capital losses expiring in the following years (amounts in thousands). The Fund will resume capital gain distributions in the future to the extent gains are realized in excess of accumulated capital losses.
| Expiration of Accumulated Capital Losses | ||||||||||||||||||||||||||
| 12/31/2012 | 12/31/2013 | 12/31/2014 | 12/31/2015 | 12/31/2016 | 12/31/2017 | 12/31/2018 | ||||||||||||||||||||
| $ | — | $ | — | $ | — | $ | — | $ | — | $ | — | $ | 30 | |||||||||||||
As of December 31, 2010, the aggregate cost and the net unrealized appreciation/(depreciation) of investments for federal income tax purposes are as follows (amounts in thousands):
Federal Tax Cost | Unrealized Appreciation | Unrealized (Depreciation) | Net Unrealized Appreciation/ (Depreciation) (4) | |||||||||||
| $ | 5,260 | $ | 307 | $ | (79) | $ | 228 | |||||||
| (4) | Primary differences, if any, between book and tax net unrealized appreciation/(depreciation) on investments are attributable to open wash sale loss deferrals and ETF Trust adjustments. |
14. SUBSEQUENT EVENTS
During the fiscal year ended December 31, 2010 and through February 13, 2011, Allianz Global Investors Distributors LLC (“AGID”), an indirect wholly-owned subsidiary of AGI, served as the distributor to the Trust’s shares. Effective February 14, 2011, PIMCO Investments LLC (the “Distributor”) serves as the Distributor of the Trust’s shares. As such, this Shareholder Report identifies PIMCO Investments LLC as the current Distributor to the Trust’s shares.
| 22 | PIMCO Equity Series VIT |
Table of Contents
Report of Independent Registered Public Accounting Firm
To the Board of Trustees of PIMCO Equity Series VIT and
Institutional Class Shareholders of PIMCO EqS Pathfinder PortfolioTM:
In our opinion, the accompanying statement of assets and liabilities, including the schedule of investments, and the related statements of operations and of changes in net assets and the financial highlights for the Institutional Class present fairly, in all material respects, the financial position of PIMCO EqS Pathfinder PortfolioTM (constituting PIMCO Equity Series VIT, hereinafter referred to as the “Portfolio”) at December 31, 2010 and the results of its operations, the changes in its net assets and the financial highlights for the Institutional Class for the period April 14, 2010 (commencement of operations) through December 31, 2010, in conformity with accounting principles generally accepted in the United States of America. These financial statements and financial highlights (hereafter referred to as “financial statements”) are the responsibility of the Portfolio’s management; our responsibility is to express an opinion on these financial statements based on our audit. We conducted our audit of these financial statements in accordance with the standards of the Public Company Accounting Oversight Board (United States). Those standards require that we plan and perform the audit to obtain reasonable assurance about whether the financial statements are free of material misstatement. An audit includes examining, on a test basis, evidence supporting the amounts and disclosures in the financial statements, assessing the accounting principles used and significant estimates made by management, and evaluating the overall financial statement presentation. We believe that our audit, which included confirmation of securities at December 31, 2010 by correspondence with the custodian, underlying funds’ transfer agent and counterparties, provides a reasonable basis for our opinion.
PricewaterhouseCoopers LLP
Kansas City, Missouri
February 18, 2011
| Annual Report | December 31, 2010 | 23 |
Table of Contents
GLOSSARY: (abbreviations that may be used in the preceding statements)
(Unaudited)
| Counterparty Abbreviations: | ||||||||||
| BCLY | Barclays Bank PLC | DUB | Deutsche Bank AG | RBC | Royal Bank of Canada | |||||
| BNP | BNP Paribas Bank | HSBC | HSBC Bank USA | RBS | Royal Bank of Scotland Group PLC | |||||
| CITI | Citigroup, Inc. | MSC | Morgan Stanley | UBS | UBS Warburg LLC | |||||
| CSFB | Credit Suisse First Boston | |||||||||
| Currency Abbreviations: | ||||||||||
| AUD | Australian Dollar | EUR | Euro | NOK | Norwegian Krone | |||||
| CAD | Canadian Dollar | GBP | British Pound | SEK | Swedish Krona | |||||
| CHF | Swiss Franc | HKD | Hong Kong Dollar | SGD | Singapore Dollar | |||||
| DKK | Danish Krone | JPY | Japanese Yen | USD | United States Dollar | |||||
| Exchange Abbreviations: | ||||||||||
| CBOT | Chicago Board of Trade | OTC | Over-the-Counter | |||||||
| Other Abbreviations: | ||||||||||
| SPDR | Standard & Poor’s Depository Receipts | |||||||||
| 24 | PIMCO Equity Series VIT |
Table of Contents
(Unaudited)
The Portfolio considers customer privacy to be a fundamental aspect of its relationships with shareholders and is committed to maintaining the confidentiality, integrity and security of its current, prospective and former shareholders’ personal information. To ensure its shareholders’ privacy, the Portfolio has developed policies that are designed to protect this confidentiality, while allowing shareholder needs to be served.
Obtaining Personal Information
In the course of providing shareholders with products and services, the Portfolio and certain service providers to the Portfolio, such as the Portfolio’s investment adviser (“Adviser”), may obtain non-public personal information about shareholders, which may come from sources such as account applications and other forms, from other written, electronic or verbal correspondence, from shareholder transactions, from a shareholder’s brokerage or financial advisory firm, financial adviser or consultant, and/or from information captured on the Portfolio’s internet websites.
Respecting Your Privacy
As a matter of policy, the Portfolio does not disclose any personal or account information provided by shareholders or gathered by the Portfolio to non-affiliated third parties, except as required or permitted by law or as necessary for such third parties to perform their agreements with respect to the Portfolio. As is common in the industry, non-affiliated companies may from time to time be used to provide certain services, such as preparing and mailing prospectuses, reports, account statements and other information, conducting research on shareholder satisfaction and gathering shareholder proxies. The Portfolio’s Distributor may also retain non-affiliated companies to market the Portfolio’s shares or products which use the Portfolio’s shares and enter into joint marketing agreements with other companies. These companies may have access to a shareholder’s personal and account information, but are permitted to use this information solely to provide the specific service or as otherwise permitted by law. In most cases, the shareholders will be clients of a third party, but the Portfolio may also provide a shareholder’s personal and account information to the shareholder’s respective brokerage or financial advisory firm.
Sharing Information with Third Parties
The Portfolio reserves the right to disclose or report personal information to non-affiliated third parties, in limited circumstances, where the Portfolio believes in good faith that disclosure is required under law to cooperate with regulators or law enforcement authorities, to protect its rights or property or upon reasonable request by the Portfolio in which a shareholder has chosen to invest. In addition, the Portfolio may disclose information about a shareholder’s accounts to a non-affiliated third party with the consent of the shareholder.
Sharing Information with Affiliates
The Portfolio may share shareholder information with its affiliates in connection with servicing its shareholders’ accounts, and subject to applicable law may provide shareholders with information about products and services that the Portfolio or its Adviser, principal underwriters or their affiliates (“Service Affiliates”) believe may be of interest to such shareholders. The information that the Portfolio shares may include, for example, a shareholder’s participation in the Portfolio or in other investment programs sponsored by a Service Affiliate, a shareholder’s ownership of certain types of accounts (such as IRAs), or other data about a shareholder’s accounts, subject to applicable law. The Portfolio’s Service Affiliates, in turn, are not permitted to share shareholder information with non-affiliated entities, except as required or permitted by law.
Procedures to Safeguard Private Information
The Portfolio takes seriously the obligation to safeguard shareholder non-public personal information. In addition to this policy, the Portfolio has also implemented procedures that are designed to restrict access to a shareholder’s non-public personal information only to internal personnel who need to know that information in order to provide products or services to such shareholders. In order to guard a shareholder’s non-public personal information, physical, electronic and procedural safeguards are in place.
| Annual Report | December 31, 2010 | 25 |
Table of Contents
The chart below identifies the Trustees and Officers of the Trust. The “interested” Trustee as defined by the 1940 Act, is indicated by an asterisk (*). Unless otherwise indicated, the address of all persons below is 840 Newport Center Drive, Newport Beach, CA 92660.
The Fund’s Statement of Additional Information includes more information about the Trustees and Officers. To request a free copy, call PIMCO at 1-800-927-4648 or visit the Fund’s website at http://pvit.pimco-funds.com.
Trustees of the Trust
Name, Year of Birth and Position Held with Trust | Term of Office** and Length of Time Served | Principal Occupation(s) During Past 5 Years | Number of Funds in Fund Complex Overseen by Trustee | Other Directorships Held by Trustee | ||||||
Interested Trustees | ||||||||||
Brent R. Harris* (1959) Chairman of the Board and Trustee | 03/2010 to present | Managing Director and member of Executive Committee, PIMCO. | 141 | Chairman and Trustee, PIMCO Funds, PIMCO Variable Insurance Trust, PIMCO ETF Trust, PIMCO Equity Series VIT; Director, StocksPLUS® Management, Inc.; and member of Board of Governors and Executive Committee, Investment Company Institute. Board Member and Owner, Harris Holdings, LLC (1992-present). Formerly Chairman and Director, PCM Fund, Inc. | ||||||
Independent Trustees | ||||||||||
E. Philip Cannon (1940) Trustee | 03/2010 to present | Proprietor, Cannon & Company (an investment firm). Formerly, President, Houston Zoo. | 141 | Trustee, PIMCO Equity Series VIT; Trustee, PIMCO ETF Trust; Trustee, PIMCO Funds; and Trustee, PIMCO Variable Insurance Trust. Formerly, Director, PCM Fund, Inc. | ||||||
Vern O. Curtis (1934) Trustee | 03/2010 to present | Private Investor. | 141 | Trustee, PIMCO Equity Series VIT; Trustee, PIMCO ETF Trust; Trustee, PIMCO Funds; and Trustee, PIMCO Variable Insurance Trust. Formerly, Director, PCM Fund, Inc. | ||||||
* Mr. Harris is an “interested person” of the Trust (as that term is defined in the 1940 Act) because of his affiliation with PIMCO.
** Trustees serve until their successors are duly elected and qualified.
| 26 | PIMCO Equity Series VIT |
Table of Contents
(Unaudited)
Executive Officers
| Name, Year of Birth and Position Held with Trust | Term of Office and Length of Time Served | Principal Occupation(s) During Past 5 Years | ||
Neel T. Kashkari (1973) President | 03/2010 to present | Managing Director, PIMCO. Formerly, Interim Assistant Secretary for Financial Stability, Assistant Secretary for International Economics and Senior Advisor to Secretary Paulson, United States Department of Treasury | ||
David C. Flattum (1964) Chief Legal Officer | 03/2010 to present | Managing Director and General Counsel, PIMCO. Formerly, Executive Vice President, PIMCO, Managing Director, Chief Operating Officer and General Counsel, Allianz Global Investors of America L.P. and Partner at Latham & Watkins LLP. | ||
Jennifer E. Durham (1970) Chief Compliance Officer | 03/2010 to present | Executive Vice President and Chief Compliance Officer, PIMCO. Formerly; Senior Vice President, PIMCO. Formerly, Vice President and Legal/Compliance Manager, PIMCO. | ||
William H. Gross (1944) Senior Vice President | 03/2010 to present | Managing Director and Co-Chief Investment Officer, PIMCO. | ||
Mohamed El-Erian (1958) Senior Vice President | 03/2010 to present | Managing Director, Co-Chief Investment Officer and Chief Executive Officer, PIMCO. Formerly, President and CEO of Harvard Management Company. Formerly, Managing Director, PIMCO. | ||
Brent R. Harris (1959) Senior Vice President | 03/2010 to present | Managing Director and member of Executive Committee, PIMCO | ||
Douglas M. Hodge (1957) Senior Vice President | 03/2010 to present | Managing Director; Chief Operating Officer (since 7/09); Member of Executive Committee and Head of PIMCO’s Asia Pacific region. Member Global Executive Committee, Allianz Global Investors. | ||
J. Stephen King, Jr. (1962) Vice President - Senior Counsel, Secretary | 03/2010 to present | Senior Vice President and Attorney, PIMCO. Formerly Vice President, PIMCO and Associate, Dechert LLP. | ||
Peter G. Strelow (1970) Vice President | 03/2010 to present | Executive Vice President, PIMCO. Formerly, Senior Vice President and Vice President, PIMCO. | ||
Henrik P. Larsen (1970) Vice President | 03/2010 to present | Senior Vice President, PIMCO. Formerly, Vice President, PIMCO. | ||
John P. Hardaway (1957) Treasurer | 03/2010 to present | Executive Vice President, PIMCO. Formerly, Senior Vice President, PIMCO. | ||
Audrey L. Cheng (1975) Assistant Secretary | 11/2010 to present | Vice President and Attorney, PIMCO. Formerly, Associate, Morrison & Foerster LLP. | ||
Stacie D. Anctil (1969) Assistant Treasurer | 03/2010 to present | Senior Vice President, PIMCO. Formerly, Vice President, PIMCO. Formerly, Specialist, PIMCO. | ||
Erik C. Brown (1967) Assistant Treasurer | 03/2010 to present | Senior Vice President, PIMCO. Formerly, Vice President, PIMCO. | ||
Trent W. Walker (1974) Assistant Treasurer | 03/2010 to present | Senior Vice President, PIMCO. Formerly, Vice President, PIMCO. Formerly, Senior Manager, PricewaterhouseCoopers LLP. | ||
| Annual Report | December 31, 2010 | 27 |
Table of Contents
General Information
Investment Adviser and Administrator
Pacific Investment Management Company LLC
840 Newport Center Drive
Newport Beach, CA 92660
Distributor
PIMCO Investments LLC
1345 Avenue of the Americas
New York, NY 10105
Custodian
State Street Bank and Trust Company
801 Pennsylvania
Kansas City, MO 64105
Transfer Agent
Boston Financial Data Services, Inc.
P.O. Box 8050
Boston, MA 02266-8050
Legal Counsel
Dechert LLP
1775 I Street, N.W.
Washington, D.C. 20006
Independent Registered Public Accounting Firm
PricewaterhouseCoopers LLP
1100 Walnut Street
Kansas City, MO 64106
This report is submitted for the general information of the shareholders of the PIMCO Equity Series VIT.
Table of Contents
PESVITA02_123110
Table of Contents
| Share Class | Advisor |
Annual Report December 31, 2010

PIMCO Equity Series VIT
PIMCO EqS Pathfinder Portfolio™


Table of Contents
| Page | ||||||||
| 1 | ||||||||
| 2 | ||||||||
| 5 | ||||||||
| 7 | ||||||||
| 8 | ||||||||
| 9 | ||||||||
| 10 | ||||||||
| 11 | ||||||||
| 12 | ||||||||
| 17 | ||||||||
| 23 | ||||||||
| 24 | ||||||||
| 25 | ||||||||
| 26 | ||||||||
This material is authorized for use only when preceded or accompanied by the current PIMCO Equity Series VIT (the “Trust”) prospectus for the Portfolio. Investors should consider the investment objectives, risks, charges and expenses of this Portfolio carefully before investing. Ask your financial professional to explain all charges that may apply. This and other information is contained in the Portfolio’s prospectus. The variable product prospectus may be obtained by contacting your Investment Consultant. Please read the Portfolio and variable product prospectuses carefully before you invest or send money.
Table of Contents
Dear Shareholder,
Please find enclosed the Annual Report for the PIMCO Equity Series VIT covering the reporting period from the inception of the PIMCO EqS Pathfinder Portfolio™ on April 14, 2010 through December 31, 2010.
On the following pages are specific details about the investment performance of the Portfolio and a discussion of the factors that affected performance during the reporting period. In addition, the letter from the portfolio managers provides a further review of the factors that influenced Portfolio performance as well as an overview of the Portfolio’s investment strategy.
General highlights of the financial markets during our reporting period include:
| n | Equity markets worldwide were volatile but staged an impressive rally in the last quarter of the reporting period, making up losses posted over the spring and summer months of 2010. Early in the reporting period, investor concerns over rising U.S. unemployment, the potential for a double-dip recession, and the ongoing sovereign debt crisis in Europe helped move equity returns lower. However, renewed investor enthusiasm for riskier assets during the latter part of the reporting period helped move equities higher, due in part to the announcement of expanded quantitative easing programs, and the passage of the Obama administration’s package of tax cuts and extension of unemployment benefits. U.S. equities, as measured by the S&P 500 Index, returned 5.40% and international equities, as represented by the MSCI World Index, returned 4.81%. |
| n | Although yields on U.S. Treasury securities generally ended the period lower than at the beginning of the reporting period on April 14, 2010, an improved economic outlook and market reaction to expanded fiscal policy and monetary stimulus helped drive yields higher toward the latter part of the calendar year. The Federal Reserve again kept short-term yields anchored at low levels, causing a steepening of the U.S. Treasury yield curve. |
Thank you again for the trust you have placed in us. We value your commitment and will continue to work diligently to meet your broad investment needs.
Sincerely,

Brent R. Harris
Chairman of the Board, PIMCO Equity Series VIT
January 20, 2011
| Annual Report | December 31, 2010 | 1 |
Table of Contents
Insights from the Portfolio Managers
Dear Shareholders:
2010 was a milestone for PIMCO with the launch of the first actively managed equity mutual fund, the PIMCO EqS Pathfinder Portfolio™. We would like to thank you for your investment in the Portfolio and participating in its success. It’s a pleasure to give you our first full annual update since the launch of the Portfolio on April 14, 2010, including an update on the implementation of our time-tested style at PIMCO, our views on performance over the reporting period since inception of the Portfolio and our investment outlook.
Review of the Last Period
Since our last letter at the end of June 2010, our progress since the launch of the Portfolio has continued with a very real momentum. The analytical team we’ve assembled is outstanding, the internal resources available to us are ample and high quality, and we continue to be able to identify investment opportunities that fit with our core deep-value philosophy.
While the Portfolio’s performance over the reporting period lagged the returns of the Portfolio’s benchmark index, the MSCI World Index, the Portfolio produced its return with only a little more than half of the risk seen in the market. This risk profile is consistent with the Portfolio Managers’ history in both up and down markets. Our long-term effort to generate attractive returns while managing with intent to limit downside risk has continued to produce what it is intended to do.
Given that our goal is to produce attractive risk adjusted returns relative to the equity market and absolute returns over the course of a market cycle with a focus on capital preservation, we thought it would be helpful to discuss some of our investment successes, some of our investment detractors from performance, as well as some of the reasons that the Portfolio slightly lagged the total return generated by its benchmark index during the reporting period. We also will discuss our assessment of the portfolio’s positioning.
At the forefront of the equity rally seen in the second half of 2010 was QE2, the second iteration of quantitative easing. This well advertised policy response by the Federal Reserve caused a striking move upwards in equity markets with investors forgetting many of the reasons to be prudent, in our opinion. Many of the lowest quality stocks in the market had the most aggressive displays of upward momentum. As we’ve said on several occasions, market timing and speculation is a risky game and it is one that we choose not to play with our investors’ money. Excessive optimism in the markets often ends badly and we don’t have to strain our memories much to think back to a
time in the recent past when it did. To be clear, we aren’t purporting that a crash tantamount to 2008 is imminent, we are simply reiterating what we always have: our approach eschews chasing returns attributable to broad market factors. Instead our focus rests upon investing in individual securities where we believe the odds are substantially tilted in our investors favor to win. And trying to partake in the QE2 rally of 2010 clearly does not meet our criteria for sound fundamental value investing.
That said, our ability to find stocks that generate attractive returns has continued to be robust. Performance over the reporting period contained a number of securities, some long-time positions and some newer to the portfolio, that did substantially better than relevant peers. We’ll discuss the specifics of these stocks in the following segment but as we review the portfolio, we’re happy with the positions we currently own. We have also identified a number of investments we intend to make as and when they reach the appropriate price level. The price we pay for an investment, as it always has been, is an imperative and we won’t compromise this discipline just to proclaim that we’re fully invested at all times. And just as we are cautious about deploying capital and didn’t load up on marginally attractive securities to chase the equity rally, this explains a large part of why we slightly lagged over the reporting period. Our efforts to protect our shareholders’ capital requires this discipline and we are adamant about it as we believe its benefits may become very clear when the market is less buoyant than it has been recently.
Among the stocks that contributed to performance were the Portfolio’s holdings in AIA, Seadrill and CSM.
AIA, a Hong Kong based life insurer, was an initial public offering (“IPO”) that made a substantial contribution to the Portfolio’s performance over the reporting period. With a majority of the equity being floated from parent firm AIG, AIA came to market in October 2010 with many attractive attributes. First, we believe it is a relatively unique company as it is the largest life insurance company that reaches across much of Asia, both developed and developing. With supportive demographics and under penetrated insurance markets in many of their operating regions, AIA is poised to take advantage of structural growth, in our opinion. Second, we believe the value of the brand in Asia is very strong, as the company was founded 92 years ago as a small insurance agency in Shanghai. The company expanded over the decades to many countries and is well known in the region. Third, because of the structure of the company, there may exist a substantial opportunity to restructure the company, offer a more sophisticated suite of products, and enhance their distribution platform. The PIMCO
| 2 | PIMCO Equity Series VIT |
Table of Contents
(Unaudited)
EqS Pathfinder Portfolio™ participated in the IPO and the Portfolio continues to hold AIA stock given our view that there is significant upside potential.
Seadrill is one of the world’s largest offshore drilling rig operators and the company’s stock appreciated nicely in the second half of 2010 as the outlook improved for the premium segments of jack-ups and ultra deep water (“UDW”) rigs. The number of tenders for UDW rigs has increased by close to 200% since the end of the summer and rates have held up remarkably well at between $400,000 and $500,000 per day. Brazil and Western Africa continue to register successes in exploration and we believe Angola is showing signs of becoming a promising market as well. After the Macondo oil spill in 2010, oil companies are reconsidering their safety norms and favor modern and reliable equipment. We believe that Seadrill’s management shares this optimistic outlook and in less than two months, the company acquired one premium jack-up, Petrojack IV, ordered six new vessels for $2.0 billion from various Asian shipyards, and acquired an option on an additional eight rigs. In addition, Seadrill’s management rewarded its shareholders and increased its quarterly dividend by over 6% to $0.65 as of November 30, 2010.
CSM, a Dutch based company, is the leading manufacturer of bakery supplies and lactic acid. After having successfully restructured its bakery supply operations, we believe CSM is now able to leverage its size to supply large customers such as Walmart and Starbucks. CSM holds a 66% market share in lactic acid, a natural preservative used in the food, medical and electronic industries (per company reports). Although these are highly cash generative businesses, CSM trades at a relatively modest multiple at approximately 12 times 2011 estimated earnings (according to Bloomberg estimates), due to concerns about the current, particularly challenging environment for raw material costs. We also think that CSM owns a hidden gem in its leading technology to produce Poly Lactic Acid (“PLA”), which is a key ingredient used in the manufacture of the most advanced form of bio-degradable and renewable plastic. As the quality of PLA packaging has improved by becoming more durable and more heat resistant, we believe several leading manufacturers are about to adapt this type of packaging to enhance their environmental image. In addition, CSM’s PLA technology may reach break-even in 2012, according to industry research reports.
We also owned positions which detracted from Portfolio performance, including holdings in Bank of America, BankNordik, and Nintendo.
The Portfolio’s holding of Bank of America stock, one of the largest bank holding companies in the U.S. by assets, detracted from performance over the period. While the company’s stock trades at a meaningful discount to many other U.S. banks, in our opinion, and is a proxy for both economic and consumer recovery, the stock underperformed in the second half of 2011 due to ongoing issues regarding the weak U.S. economic recovery, high unemployment and mortgage put-backs to both government-sponsored enterprises (“GSEs”) and Private Label issuers.
BankNordik is the largest bank in the Faroe Islands but is generally under analyzed and largely not followed by the broader investment community. Nevertheless, we continue to find substantial value in this company due to what we view as its exceedingly low valuation, wide margins that it earns, and excess capital that will be returned to shareholders. It underperformed during the period due to the illiquid nature of the stock as well as a delay in the return of capital to shareholders. As is our style, we are often inclined to wait for a stock’s hidden value to materialize over the long term and we believe BankNordik fits this profile.
Nintendo, a Japanese gaming company, remains one of the world’s largest producers of entertainment hardware (representing approximately 53% of sales) and software (representing approximately 46% of sales) according to company reports and as of September 30, 2010. During the reporting period, the Portfolio’s holding of Nintendo stock detracted from performance as the stock price suffered from a combination of factors. The company’s sales flattened as consumers waited for the next generation product, the Japanese yen strengthened versus the U.S. dollar, and the Japanese equity market performed poorly during the year. Given the short term and frequently emotional nature of equity markets, we believe this market sentiment had an impact on Nintendo’s stock price, despite the fact that the company is truly multinational with approximately only 19% of sales derived in Japan (per company reports and as of September 30, 2010). Nevertheless, we think the stock remains a high-quality holding and is attractively valued with cash balances accounting for over 30% of market capitalization. Also, the prospect of new product cycles is a strong probability, in our view, which should have a positive impact on the company’s financial performance. We still believe Nintendo’s intrinsic value is substantially above what “The Market” is pricing it and we expect the discount to the stock’s value to begin closing in 2011.
| Annual Report | December 31, 2010 | 3 |
Table of Contents
Insights from the Portfolio Managers (Cont.)
Looking Ahead
As we look to 2011 and beyond, aside from the aforementioned rally in the equity markets, we note a number of interesting items. First, merger activity has picked up as we expected it to do. We think this trend will continue and expect opportunities to come to us in the area of merger arbitrage. Oddly enough, as markets have marched higher it is plausible that we could see capital in the broader market drawn away from the merger arbitrage strategy and devoted to chasing directional stock returns. This would be an opportunity for us as we would expect to see wider spreads and higher returns available in announced deals. Second, the volatility that is seen in equity markets is at times uncomfortable for an investor and unfortunately we expect it to continue. Fortunately, for those like us who seek opportunities from volatility and misunderstanding, it should be something to celebrate. We believe Europe is a prime example of this over the past year as concerns over sovereign debt and the banking system caused many equities to be sold for the wrong reason. Thankfully, we avoided those that were sold for the right reason (such as Greek, Irish, Spanish, and Portuguese equities, for example, where the Portfolio had no exposure) and focused our efforts elsewhere on names, such as BP and Lloyds, that were either guilty only by association or were sold off for completely stock-specific reasons.
Finally, while forecasting the economy isn’t something that will drive our investments, it is something to be aware of as an input into our investment process. Being at PIMCO gives us access to these views, many of them at their genesis, and while we are experiencing a cyclical uplift at this moment, the history of financial crises shows that the secular outlook may be a cloudy one in developed markets. This cloudy economic environment may have its casualties as companies may misstep or suffer because of it, but it also may produce its own unique set of opportunities. Aggressive Gross Domestic Product (“GDP”) growth doesn’t necessarily lead to attractive risk adjusted returns in equities and we believe our approach of ferreting out idiosyncratic opportunities with a focus on capital preservation should continue to yield returns for our investors.
Again, thank you for your investment in the Portfolio.
Sincerely,

Anne Gudefin, CFA |
Charles Lahr, CFA | |

PIMCO EqS Pathfinder Portfolio™, Co-Portfolio Managers
Top 10 Holdings1
| SPDR Gold Trust | 4.2% | |||||||
| Imperial Tobacco Group PLC | 3.3% | |||||||
| Danone | 3.0% | |||||||
| British American Tobacco PLC | 3.0% | |||||||
| Carlsberg A/S | 2.1% | |||||||
| AIA Group Ltd. | 2.1% | |||||||
| Koninklijke KPN NV | 2.0% | |||||||
| Pernod-Ricard S.A. | 2.0% | |||||||
| CSM | 1.9% | |||||||
| BP PLC | 1.9% |
| 1 | % of Total Investments as of 12/31/2010. Top Ten Holdings solely reflect long positions. Securities sold short, derivatives, and short-term instruments are not taken into consideration. |
Geographic Breakdown2
| United States | 24.4% | |||||||
| United Kingdom | 12.3% | |||||||
| France | 10.7% | |||||||
| Netherlands | 6.4% | |||||||
| Switzerland | 5.7% | |||||||
| Bermuda | 4.5% | |||||||
| Germany | 3.8% | |||||||
| Hong Kong | 3.2% | |||||||
| Denmark | 2.6% | |||||||
| Norway | 1.9% | |||||||
| Faeroe Islands | 1.4% | |||||||
| Singapore | 1.4% | |||||||
| Guernsey, Channel Islands | 1.4% | |||||||
| Japan | 1.1% | |||||||
| Sweden | 0.7% | |||||||
| Italy | 0.4% | |||||||
| Short-Term Instruments | 18.4% |
| 2 | % of Total Investments as of 12/31/2010. |
| 4 | PIMCO Equity Series VIT |
Table of Contents
Important Information About the Portfolio
(Unaudited)
PIMCO Equity Series VIT (the “Trust”) is an open-end management investment company currently consisting of one investment portfolio, the PIMCO EqS Pathfinder PortfolioTM (the “Portfolio”). The Portfolio is only available as a funding vehicle under variable life insurance policies or variable annuity contracts issued by insurance companies (“Variable Contracts”). Individuals may not purchase shares of the Portfolio directly. Shares of the Portfolio also may be sold to qualified pension and retirement plans outside of the separate account context.
The Portfolio seeks capital appreciation by investing under normal circumstances in equity securities, including common and preferred stock (and securities convertible into, or that PIMCO expects to be exchanged for, common or preferred stock), of issuers that PIMCO believes are undervalued. The Portfolio’s bottom-up value investment style attempts to identify securities that are undervalued by the market in comparison to PIMCO’s own determination of the company’s value, taking into account criteria such as asset value, book value and cash flow and earnings estimates.
The Portfolio may be subject to various risks as described in the Portfolio’s prospectus. Some of these risks may include, but are not limited to, the following: equity risk, value investing risk, foreign (non-U.S.) investment risk, emerging markets risk, market risk, issuer risk, interest rate risk, credit risk, high yield and distressed company risk, currency risk, liquidity risk, leveraging risk, management risk, small-cap and mid-cap company risk, arbitrage risk, derivatives risk and short sale risk. A complete description of these risks and other risks is contained in the Portfolio’s prospectus. The Portfolio may use derivative instruments for hedging purposes or as part of an investment strategy. Use of these instruments may involve certain costs and risks such as liquidity risk, interest rate risk, market risk, credit risk, management risk, leverage risk, mispricing or improper valuation risk and the risk that the Portfolio could not close out a position when it would be most advantageous to do so. The Portfolio could lose more than the principal amount invested in these derivative instruments.
On the Performance Summary page in this Annual Report (“Shareholder Report”), the Cumulative Total Return table measures performance assuming that any dividend and capital gain distributions were reinvested. The Cumulative Returns Chart measures the Portfolio’s performance against the performance of a broad-based securities market index (benchmark index). The Portfolio’s past performance, before and after taxes, is not necessarily an indication of how the Portfolio will perform in the future.
An investment in the Portfolio is not a deposit of a bank and is not guaranteed or insured by the Federal Deposit Insurance Corporation or any other government agency. It is possible to lose money on investments in the Portfolio.
PIMCO has adopted written proxy voting policies and procedures (“Proxy Policy”) as required by Rule 206(4)-6 under the Investment Advisers Act of 1940, as amended. The Proxy Policy has been adopted by the Trust as the policies and procedures that PIMCO will use when voting proxies on behalf of the Portfolio. A description of the policies and procedures that PIMCO uses to vote proxies relating to portfolio securities of the Portfolio, and information about how the Portfolio voted proxies relating to portfolio securities held from its inception through June 30th, are available without charge, upon request, by calling the Trust at 1-800-927-4648, on the Portfolio’s website at http://pvit.pimco-funds.com, and on the Securities and Exchange Commission’s (“SEC”) website at http://www.sec.gov.
The Portfolio files a complete schedule of the Portfolio’s portfolio holdings with the SEC for the first and third quarters of each fiscal year on Form N-Q. A copy of the Portfolio’s Form N-Q, once available, will be available on the SEC’s website at http://www.sec.gov and may be reviewed and copied at the SEC’s Public Reference Room in Washington, D.C. The Portfolio’s Form N-Q will also be available without charge, upon request, by calling the Trust at 1-800-927-4648 and on the Portfolio’s website at http://pvit.pimco-funds.com. Information on the operation of the Public Reference Room may be obtained by calling 1-800-SEC-0330.
The Trust is distributed by PIMCO Investments LLC, 1345 Avenue of the Americas, New York, NY 10105.
| Annual Report | December 31, 2010 | 5 |
Table of Contents
Important Information About the Portfolio (Cont.)
(Unaudited)
The following disclosure provides important information regarding the Portfolio’s Expense Example (“Example” or “Expense Example”), which appears in this Shareholder Report. Please refer to this information when reviewing the Expense Example for the Portfolio.
Example
As a shareholder of the Portfolio, you incur two types of costs: (1) transaction costs and (2) ongoing costs, including management fees, distribution and/or service (12b-1) fees (Advisor Class only), and other Portfolio expenses. The Example is intended to help you understand your ongoing costs (in dollars) of investing in the Portfolio and to compare these costs with the ongoing costs of investing in other mutual funds. The Expense Example does not reflect any fees or other expenses imposed by the Variable Contracts. If it did, the expenses reflected in the Expense Example would be higher. The Example is based on an investment of $1,000 invested at the beginning of the period and held for the entire period, from July 1, 2010 to December 31, 2010.
Actual Expenses
The information in the table under the heading “Actual Performance” provides information about actual account values and actual expenses. You may use the information in these columns, together with the amount you invested, to estimate the expenses that you paid over the period. Simply divide your account value by $1,000 (for example, an $8,600 account value divided by $1,000 = $8.60), then multiply the result by the number in the appropriate column for your share class, in the row entitled “Expenses Paid During Period” to estimate the expenses you paid on your account during this period.
Hypothetical Example for Comparison Purposes
The information in the table under the heading “Hypothetical Performance (5% return before expenses)” provides information about hypothetical account values and hypothetical expenses based on the Portfolio’s actual expense ratio and an assumed rate of return of 5% per year before expenses, which is not the Portfolio’s actual return. The hypothetical account values and expenses may not be used to estimate the actual ending account balance or expenses you paid for the period. You may use this information to compare the ongoing costs of investing in the Portfolio and other portfolios. To do so, compare this 5% hypothetical example with the 5% hypothetical examples that appear in the shareholder reports of the other portfolios.
Please note that the expenses shown in the table are meant to highlight your ongoing costs only and do not reflect any transactional costs. Therefore, the information under the heading “Hypothetical Performance (5% return before expenses)” is useful in comparing ongoing costs only, and will not help you determine the relative total costs of owning different portfolios. In addition, if these transactional costs were included, your costs would have been higher.
Expense ratios may vary from period to period because of various factors such as an increase in expenses that are not covered by the management fees, such as fees and expenses of the independent trustees and their counsel, extraordinary expenses and interest expense.
| 6 | PIMCO Equity Series VIT |
Table of Contents
PIMCO EqS Pathfinder Portfolio™
Cumulative Returns Through December 31, 2010
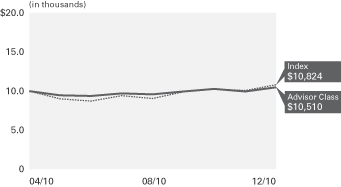
$10,000 invested at the end of the month when the Portfolio’s Advisor Class commenced operations .
Allocation Breakdown‡
| United States | 24.4% | |||
| Short-Term Instruments | 18.4% | |||
| United Kingdom | 12.3% | |||
| France | 10.7% | |||
| Netherlands | 6.4% | |||
| Switzerland | 5.7% | |||
| Other | 22.1% |
| ‡ | % of Total Investments as of 12/31/10 |
| Cumulative Total Return for the period ended December 31, 2010 | ||||||
Class Inception | ||||||
| PIMCO EqS Pathfinder Portfolio™ Advisor Class | 3.10% | ||||
| MSCI World Index± | 4.81% | ||||


All Portfolio returns are net of fees and expenses.
Performance quoted represents past performance. Past performance is not a guarantee or a reliable indicator of future results. Investment return and principal value will fluctuate so the Portfolio shares when redeemed, may be worth more or less than their original cost. The Portfolio’s performance does not reflect the deduction of additional charges and expenses imposed in connection with investing in Variable Contracts, which will reduce returns. Current performance may be lower or higher than the performance data quoted. Performance data current to the most recent month-end is available at www.pimco-funds.com/vit or by calling (800) 927-4648. The Portfolio’s total annual operating expense ratio as stated in the Portfolio’s current prospectus, as supplemented to date, is 1.89% for Advisor Class shares.
± The MSCI World Index is a free float-adjusted market capitalization weighted index that is designed to measure the equity market performance of developed markets. As of May 27, 2010 the MSCI World Index consisted of the following 24 developed market country indices: Australia, Austria, Belgium, Canada, Denmark, Finland, France, Germany, Greece, Hong Kong, Ireland, Israel, Italy, Japan, Netherlands, New Zealand, Norway, Portugal, Singapore, Spain, Sweden, Switzerland, the United Kingdom, and the United States. The index represents the unhedged performance of the constituent stocks, in US dollars. It is not possible to invest directly in an unmanaged index.
| Expense Example | Actual Performance | Hypothetical Performance | ||||||
(5% return before expenses) | ||||||||
Beginning Account Value (07/01/10) | $ | 1,000.00 | $ | 1,000.00 | ||||
Ending Account Value (12/31/10) | $ | 1,119.44 | $ | 1,018.95 | ||||
Expenses Paid During Period† | $ | 6.62 | $ | 6.31 | ||||
† Expenses are equal to the Portfolio’s Advisor Class net annualized expense ratio of 1.24%, multiplied by the average account value over the period, multiplied by 184/365 (to reflect the one-half year period). The annualized expense ratio reflects net annualized expenses after application of expense waiver of 0.11%. Overall fees and expenses of investing in the Portfolio will be higher because the example does not reflect Variable Contract fees and expenses.
Please refer to page 7 herein for an explanation of the information presented in the above Expense Example.
Portfolio Insights
| » | The PIMCO EqS Pathfinder Portfolio™ seeks capital appreciation by investing under normal circumstances in equity securities, including common and preferred stock (and securities convertible into, or that PIMCO expects to be exchanged for, common or preferred stock), of issuers that PIMCO believes are undervalued. The Portfolio’s bottom-up value investment style attempts to identify securities that are undervalued by the market in comparison to PIMCO’s own determination of the company’s value, taking into account criteria such as asset value, book value, cash flow and earnings estimates. |
| » | The Portfolio commenced operations on April 14, 2010. |
| » | During the reporting period, the Portfolio’s Advisor class shares returned 3.10% after fees and the Portfolio’s benchmark index, the MSCI World Index, returned 4.81%. The Portfolio’s performance, although positive, underperformed its benchmark index by 1.71% after fees. |
| » | Stock selection in the energy sector, particularly exposure to offshore oil driller Seadrill Ltd., contributed to performance as its stock appreciated in value during the reporting period. |
| » | British American Tobacco PLC and Link Real Estate Investment Trust were notable contributors to performance as prices on these investments appreciated, as was the Portfolio’s exposure to merger arbitrage investments. |
| » | Holdings in financial companies such as Bank of America, CBOE (the Chicago Board Option Exchange), and Barclays PLC detracted from performance as they underperformed during the period. |
| » | Given the volatility in the equity markets over the time period under review, the Portfolio’s market risk hedging strategies ended up contributing negatively to performance during the reporting period as these market risk hedging investments declined in value as the underlying stock markets appreciated. |
| » | At the end of the reporting period, the Portfolio held approximately 71% in equities we believe are undervalued, about 3% (on the long side only) in merger arbitrage investments, approximately 24% in cash equivalents, and held the balance of the portfolio in currency and market risk hedges. |
| Annual Report | December 31, 2010 | 7 |
Table of Contents
Financial Highlights PIMCO EqS Pathfinder PortfolioTM
| Selected Per Share Data for the Period Ended: | 04/14/2010- 12/31/2010 | |||
Advisor Class | ||||
Net asset value beginning of period | $ | 10.00 | ||
Net investment income (a) | 0.08 | |||
Net realized/unrealized gain on investments | 0.23 | |||
Total income from investment operations | 0.31 | |||
Net asset value end of period | $ | 10.31 | ||
Total return | 3.10 | % | ||
Net assets end of period (000s) | $ | 2,498 | ||
Ratio of expenses to average net assets | 1.24 | %* | ||
Ratio of expenses to average net assets excluding waivers | 7.02 | %* | ||
Ratio of expenses to average net assets excluding interest expense and dividends on securities sold short | 1.22 | %* | ||
Ratio of expenses to average net assets excluding interest expense, dividends on securities sold short and waivers | 7.00 | %* | ||
Ratio of net investment income to average net assets | 1.10 | %* | ||
Portfolio turnover rate | 25 | %** | ||
| * | Annualized |
| ** | The ratio excludes PIMCO Short-Term Floating NAV Portfolio. |
| (a) | Per share amounts based on average number of shares outstanding during the period. |
| 8 | PIMCO Equity Series VIT | See Accompanying Notes |
Table of Contents
Statement of Assets and Liabilities PIMCO EqS Pathfinder Portfolio™
| (Amounts in thousands, except per share amounts) | December 31, 2010 | |||
Assets: | ||||
Investments, at value | $ | 4,481 | ||
Investments in Affiliates, at value | 901 | |||
Repurchase agreements, at value | 106 | |||
Cash | 1 | |||
Deposits with counterparty | 204 | |||
Foreign currency, at value | 151 | |||
Receivable for investments sold | 5 | |||
Interest and dividends receivable | 17 | |||
Unrealized appreciation on foreign currency contracts | 55 | |||
| 5,921 | ||||
Liabilities: | ||||
Payable for investments purchased | $ | 47 | ||
Payable for Portfolio shares redeemed | 2 | |||
Payable for short sales | 40 | |||
Accrued related party fees | 5 | |||
Unrealized depreciation on foreign currency contracts | 53 | |||
| 147 | ||||
Net Assets | $ | 5,774 | ||
Net Assets Consist of: | ||||
Paid in capital | $ | 5,552 | ||
Undistributed net investment income | 22 | |||
Accumulated undistributed net realized (loss) | (48 | ) | ||
Net unrealized appreciation | 248 | |||
| $ | 5,774 | |||
Net Assets: | ||||
Institutional Class | $ | 3,276 | ||
Advisor Class | 2,498 | |||
Shares Issued and Outstanding: | ||||
Institutional Class | 317 | |||
Advisor Class | 242 | |||
Net Asset Value and Redemption Price Per Share (Net Asset Per Share Outstanding) | ||||
Institutional Class | $ | 10.33 | ||
Advisor Class | 10.31 | |||
Cost of Investments Owned | $ | 4,242 | ||
Cost of Investments in Affiliates Owned | $ | 901 | ||
Cost of Repurchase Agreements Owned | $ | 106 | ||
Cost of Foreign Currency Held | $ | 148 | ||
Proceeds Received on Short Sales | $ | 40 | ||
| See Accompanying Notes | Annual Report | December 31, 2010 | 9 |
Table of Contents
Statement of Operations PIMCO EqS Pathfinder Portfolio™
| (Amounts in thousands) | Period from April 14, 2010 to December 31, 2010 | |||
Investment Income: | ||||
Interest | $ | 2 | ||
Dividends, net of foreign taxes* | 74 | |||
Dividends from Affiliate investments | 1 | |||
Total Income | 77 | |||
Expenses: | ||||
Investment advisory fees | 22 | |||
Supervisory and administrative fees | 10 | |||
Distribution and/or servicing fees – Advisor Class | 2 | |||
Trustees’ fees | 21 | |||
Organization costs | 79 | |||
Interest expense and dividends on securities sold short | 1 | |||
Total Expenses | 135 | |||
Waiver and/or Reimbursement by PIMCO | (103 | ) | ||
Net Expenses | 32 | |||
Net Investment Income | 45 | |||
Net Realized and Unrealized Gain (Loss): | ||||
Net realized (loss) on investments | (25 | ) | ||
Net realized (loss) on written options | (1 | ) | ||
Net realized (loss) on securities sold short | (1 | ) | ||
Net realized (loss) on foreign currency transactions | (44 | ) | ||
Net change in unrealized appreciation on investments | 241 | |||
Net change in unrealized (depreciation) on written options | 0 | |||
Net change in unrealized (depreciation) on securities sold short | (1 | ) | ||
Net change in unrealized appreciation on translation of assets and liabilities denominated in foreign currencies | 8 | |||
Net Gain | 177 | |||
Net Increase in Net Assets Resulting from Operations | $ | 222 | ||
*Foreign tax withholdings | $ | 5 | ||
| 10 | PIMCO Equity Series VIT | See Accompanying Notes |
Table of Contents
Statement of Changes in Net Assets PIMCO EqS Pathfinder Portfolio™
| (Amounts in thousands) | Period from April 14, 2010 to December 31, 2010 | |||
Increase in Net Assets from: | ||||
Operations: | ||||
Net investment income | $ | 45 | ||
Net realized (loss) | (71 | ) | ||
Net change in unrealized appreciation | 248 | |||
Net increase resulting from operations | 222 | |||
Portfolio Share Transactions: | ||||
Net increase resulting from Portfolio share transactions** | 5,552 | |||
Total Increase in Net Assets | 5,774 | |||
Net Assets: | ||||
Beginning of period | 0 | |||
End of period* | $ | 5,774 | ||
*Including undistributed net investment income of: | $ | 22 | ||
| ** | See note 11 in the Notes to Financial Statements. |
| See Accompanying Notes | Annual Report | December 31, 2010 | 11 |
Table of Contents
Schedule of Investments PIMCO EqS Pathfinder Portfolio™
| SHARES | MARKET VALUE (000S) | |||||||||||
| COMMON STOCKS 73.6% | ||||||||||||
| BERMUDA 4.3% | ||||||||||||
| ENERGY 1.7% | ||||||||||||
Seadrill Ltd. | 2,949 | $ | 101 | |||||||||
| FINANCIALS 2.6% | ||||||||||||
Hiscox Ltd. | 9,337 | 56 | ||||||||||
Lancashire Holdings Ltd. | 10,546 | 91 | ||||||||||
| 147 | ||||||||||||
Total Bermuda | 248 | |||||||||||
| DENMARK 2.4% | ||||||||||||
| CONSUMER STAPLES 2.0% | ||||||||||||
Carlsberg A/S | 1,152 | 116 | ||||||||||
| FINANCIALS 0.4% | ||||||||||||
Jyske Bank A/S (a) | 557 | 26 | ||||||||||
Total Denmark | 142 | |||||||||||
| FAEROE ISLANDS 1.3% | ||||||||||||
| CONSUMER STAPLES 0.6% | ||||||||||||
Bakkafrost P/F (a) | 4,176 | 35 | ||||||||||
| FINANCIALS 0.7% | ||||||||||||
BankNordik P/F (a) | 1,575 | 41 | ||||||||||
Total Faeroe Islands | 76 | |||||||||||
| FRANCE 10.1% | ||||||||||||
| CONSUMER DISCRETIONARY 2.0% | ||||||||||||
Eutelsat Communications | 1,967 | 72 | ||||||||||
JC Decaux S.A. (a) | 1,327 | 41 | ||||||||||
| 113 | ||||||||||||
| CONSUMER STAPLES 5.2% | ||||||||||||
Danone | 2,657 | 167 | ||||||||||
L’Oreal S.A. | 266 | 30 | ||||||||||
Pernod-Ricard S.A. | 1,158 | 109 | ||||||||||
| 306 | ||||||||||||
| ENERGY 1.5% | ||||||||||||
Bourbon S.A. | 724 | 33 | ||||||||||
Total S.A. | 972 | 52 | ||||||||||
| 85 | ||||||||||||
| FINANCIALS 0.5% | ||||||||||||
BNP Paribas | 447 | 28 | ||||||||||
| INDUSTRIALS 0.9% | ||||||||||||
Teleperformance | 1,543 | 52 | ||||||||||
Total France | 584 | |||||||||||
| GERMANY 3.6% | ||||||||||||
| FINANCIALS 1.7% | ||||||||||||
Deutsche Boerse AG | 1,425 | 98 | ||||||||||
| HEALTH CARE 0.7% | ||||||||||||
Rhoen Klinikum AG | 1,590 | 35 | ||||||||||
| SHARES | MARKET VALUE (000S) | |||||||||||
| INDUSTRIALS 0.5% | ||||||||||||
Kloeckner & Co. SE (a) | 1,089 | $ | 31 | |||||||||
| UTILITIES 0.7% | ||||||||||||
E.ON AG | 1,371 | 42 | ||||||||||
Total Germany | 206 | |||||||||||
| GUERNSEY, CHANNEL ISLANDS 1.3% | ||||||||||||
| FINANCIALS 1.3% | ||||||||||||
Resolution Ltd. | 20,529 | 75 | ||||||||||
Total Guernsey, Channel Islands | 75 | |||||||||||
| HONG KONG 3.0% | ||||||||||||
| FINANCIALS 2.5% | ||||||||||||
AIA Group Ltd. (a) | 41,000 | 115 | ||||||||||
First Pacific Co. Ltd. | 34,000 | 31 | ||||||||||
| 146 | ||||||||||||
| INDUSTRIALS 0.5% | ||||||||||||
Jardine Matheson Holdings Ltd. | 300 | 13 | ||||||||||
Jardine Strategic Holdings Ltd. | 500 | 14 | ||||||||||
| 27 | ||||||||||||
Total Hong Kong | 173 | |||||||||||
| ITALY 0.4% | ||||||||||||
| FINANCIALS 0.4% | ||||||||||||
Intesa Sanpaolo SpA | 8,672 | 21 | ||||||||||
Total Italy | 21 | |||||||||||
| JAPAN 1.0% | ||||||||||||
| INFORMATION TECHNOLOGY 1.0% | ||||||||||||
Nintendo Co. Ltd. | 200 | 58 | ||||||||||
Total Japan | 58 | |||||||||||
| NETHERLANDS 6.1% | ||||||||||||
| CONSUMER STAPLES 1.8% | ||||||||||||
CSM | 3,052 | 107 | ||||||||||
| ENERGY 1.0% | ||||||||||||
Dockwise Ltd. (a) | 342 | 9 | ||||||||||
Royal Dutch Shell PLC ‘A’ | 1,380 | 46 | ||||||||||
| 55 | ||||||||||||
| FINANCIALS 0.8% | ||||||||||||
ING Groep NV (a) | 4,500 | 44 | ||||||||||
| INFORMATION TECHNOLOGY 0.6% | ||||||||||||
Gemalto NV | 778 | 33 | ||||||||||
| TELECOMMUNICATION SERVICES 1.9% | ||||||||||||
Koninklijke KPN NV | 7,686 | 112 | ||||||||||
Total Netherlands | 351 | |||||||||||
| NORWAY 1.8% | ||||||||||||
| CONSUMER STAPLES 1.1% | ||||||||||||
Marine Harvest ASA | 62,823 | 67 | ||||||||||
| SHARES | MARKET VALUE (000S) | |||||||||||
| INDUSTRIALS 0.7% | ||||||||||||
Orkla ASA | 3,989 | $ | 39 | |||||||||
Total Norway | 106 | |||||||||||
| SINGAPORE 1.3% | ||||||||||||
| FINANCIALS 0.2% | ||||||||||||
Great Eastern Holdings Ltd. | 1,160 | 14 | ||||||||||
| INDUSTRIALS 1.1% | ||||||||||||
Keppel Corp. Ltd. | 7,000 | 62 | ||||||||||
Total Singapore | 76 | |||||||||||
| SWEDEN 0.6% | ||||||||||||
| INDUSTRIALS 0.6% | ||||||||||||
Loomis AB | 2,460 | 37 | ||||||||||
Total Sweden | 37 | |||||||||||
| SWITZERLAND 5.4% | ||||||||||||
| CONSUMER STAPLES 1.4% | ||||||||||||
Nestle S.A. | 1,393 | 82 | ||||||||||
| FINANCIALS 1.8% | ||||||||||||
UBS AG (a) | 3,386 | 56 | ||||||||||
Zurich Financial Services AG | 190 | 49 | ||||||||||
| 105 | ||||||||||||
| HEALTH CARE 1.0% | ||||||||||||
Alcon, Inc. | 348 | 56 | ||||||||||
| INDUSTRIALS 0.6% | ||||||||||||
Schindler Holding AG | 310 | 37 | ||||||||||
| MATERIALS 0.6% | ||||||||||||
Sika AG | 15 | 33 | ||||||||||
Total Switzerland | 313 | |||||||||||
| UNITED KINGDOM 11.7% | ||||||||||||
| CONSUMER DISCRETIONARY 0.3% | ||||||||||||
British Sky Broadcasting Group PLC | 1,153 | 13 | ||||||||||
| CONSUMER STAPLES 6.8% | ||||||||||||
British American Tobacco PLC | 4,281 | 165 | ||||||||||
Imperial Tobacco Group PLC | 5,878 | 181 | ||||||||||
Reckitt Benckiser Group PLC | 825 | 45 | ||||||||||
| 391 | ||||||||||||
| ENERGY 1.8% | ||||||||||||
BP PLC | 14,234 | 105 | ||||||||||
| FINANCIALS 2.8% | ||||||||||||
Barclays PLC | 15,351 | 63 | ||||||||||
HSBC Holdings PLC | 2,648 | 27 | ||||||||||
Lloyds Banking Group PLC (a) | 25,451 | 26 | ||||||||||
Man Group PLC | 10,244 | 48 | ||||||||||
| 164 | ||||||||||||
Total United Kingdom | 673 | |||||||||||
| 12 | PIMCO Equity Series VIT | See Accompanying Notes |
Table of Contents
December 31, 2010
| SHARES | MARKET VALUE (000S) | |||||||||||
| UNITED STATES 19.3% | ||||||||||||
| CONSUMER STAPLES 6.3% | ||||||||||||
Altria Group, Inc. | 2,247 | $ | 55 | |||||||||
CVS Caremark Corp. | 1,973 | 69 | ||||||||||
Lorillard, Inc. | 1,191 | 98 | ||||||||||
Philip Morris International, Inc. | 982 | 58 | ||||||||||
Reynolds American, Inc. | 1,576 | 51 | ||||||||||
Wal-Mart Stores, Inc. | 500 | 27 | ||||||||||
| 358 | ||||||||||||
| ENERGY 1.2% | ||||||||||||
Pride International, Inc. (a) | 2,054 | 67 | ||||||||||
| FINANCIALS 7.5% | ||||||||||||
Alleghany Corp. | 204 | 62 | ||||||||||
Berkshire Hathaway, Inc. (a) | 1,071 | 86 | ||||||||||
Capitol Federal Financial, Inc. | 922 | 11 | ||||||||||
CBOE Holdings, Inc. | 2,478 | 57 | ||||||||||
Marshall & Ilsley Corp. | 4,134 | 29 | ||||||||||
Northwest Bancshares, Inc. | 3,771 | 44 | ||||||||||
People’s United Financial, Inc. | 3,002 | 42 | ||||||||||
Washington Federal, Inc. | 1,364 | 23 | ||||||||||
White Mountains Insurance | 240 | 81 | ||||||||||
| 435 | ||||||||||||
| SHARES | MARKET VALUE (000S) | |||||||||||
| HEALTH CARE 1.1% | ||||||||||||
Genzyme Corp. (a) | 535 | $ | 38 | |||||||||
Pfizer, Inc. | 1,457 | 26 | ||||||||||
| 64 | ||||||||||||
| INDUSTRIALS 0.5% | ||||||||||||
3M Co. | 225 | 19 | ||||||||||
SunPower Corp. ‘B’ (a) | 748 | 9 | ||||||||||
| 28 | ||||||||||||
| INFORMATION TECHNOLOGY 2.7% | ||||||||||||
CommScope, Inc. (a) | 673 | 21 | ||||||||||
Dell, Inc. (a) | 2,856 | 39 | ||||||||||
Microsoft Corp. | 3,612 | 101 | ||||||||||
| 161 | ||||||||||||
Total United States | 1,113 | |||||||||||
Total Common Stocks (Cost $4,047) |
| 4,252 | ||||||||||
| EXCHANGE-TRADED FUNDS 4.0% | ||||||||||||
SPDR Gold Trust | 1,645 | 228 | ||||||||||
Total Exchange-Traded Funds |
| 228 | ||||||||||
| PRINCIPAL AMOUNT (000S) | MARKET VALUE (000S) | |||||||||||
| SHORT-TERM INSTRUMENTS 17.4% | ||||||||||||
| REPURCHASE AGREEMENTS 1.8% | ||||||||||||
State Street Bank and Trust Co. | ||||||||||||
0.010% due 01/03/2011 | $ | 106 | $ | 106 | ||||||||
(Dated 12/31/2010. Collateralized by U.S. Treasury Notes 2.125% due 05/31/2015 valued at $112. Repurchase proceeds are $106.) | ||||||||||||
| SHARES | ||||||||||||
| PIMCO SHORT-TERM FLOATING NAV | ||||||||||||
| PORTFOLIO (b) 15.6% | ||||||||||||
| 89,980 | 901 | |||||||||||
Total Short-Term Instruments |
| 1,007 | ||||||||||
| PURCHASED OPTIONS (d) 0.0% | ||||||||||||
(Cost $1) | 1 | |||||||||||
| Total Investments 95.0% (Cost $5,249) | $ | 5,488 | ||||||||||
| Written Options (e) (0.0%) (Premiums $0) | 0 | |||||||||||
| Other Assets and Liabilities (Net) 5.0% | 286 | |||||||||||
| Net Assets 100.0% | $ | 5,774 | ||||||||||
Notes to Schedule of Investments (amounts in thousands*, except number of contracts):
| * | A zero balance may reflect actual amounts rounding to less than one thousand. |
| (a) | Non-income producing security. |
| (b) | Affiliated to the Portfolio. |
| (c) | Cash of $204 has been pledged as collateral for securities sold short as of December 31, 2010. |
| (d) | Purchased options outstanding on December 31, 2010: |
| Options on Securities | ||||||||||||||||||||
| Description | Strike Price | Expiration Date | Notional Amount | Cost | Market Value | |||||||||||||||
Put - CBOT E.ON AG | EUR 22.000 | 01/21/2011 | EUR 1 | $ | 0 | $ | 0 | |||||||||||||
Put - CBOT Novartis AG ADR | $ 57.500 | 04/16/2011 | $ 0 | 1 | 1 | |||||||||||||||
| $ | 1 | $ | 1 | |||||||||||||||||
| (e) | Written options outstanding on December 31, 2010: |
| Options on Securities | ||||||||||||||||||||
| Description | Strike Price | Expiration Date | Notional Amount | Premium | Market Value | |||||||||||||||
Call - OTC Nestle S.A. | CHF 60.000 | 01/21/2011 | CHF 1 | $ 0 | $ | 0 | ||||||||||||||
Transactions in written call and put options for the period ended December 31, 2010:
| # of Contracts | Notional Amount in CHF | Premium | ||||||||||
Balance at 04/14/2010 | 0 | CHF 0 | $ | 0 | ||||||||
Sales | 87 | 1 | 13 | |||||||||
Closing Buys | (74 | ) | 0 | (10 | ) | |||||||
Expirations | 0 | 0 | 0 | |||||||||
Exercised | (13 | ) | 0 | (3 | ) | |||||||
Balance at 12/31/2010 | 0 | CHF 1 | $ | 0 | ||||||||
| See Accompanying Notes | Annual Report | December 31, 2010 | 13 |
Table of Contents
Schedule of Investments Pimco EqS Pathfinder Portfolio™ (Cont.)
| (f) | Short sales outstanding on December 31, 2010: |
| Description | Shares | Proceeds | Market Value | |||||||||
Bank of Montreal | 520 | $ | 30 | $ | 30 | |||||||
SunPower Corp. ‘A’ | 747 | 10 | 10 | |||||||||
| $ | 40 | $ | 40 | |||||||||
| (g) | Foreign currency contracts outstanding on December 31, 2010: |
| Type | Currency | Principal Amount Covered by Contract | Settlement Month | Counterparty | Unrealized Appreciation | Unrealized (Depreciation) | Net Unrealized Appreciation/ (Depreciation) | |||||||||||||||||||
Buy | AUD | 217 | 01/2011 | BCLY | $ | 14 | $ | 0 | $ | 14 | ||||||||||||||||
Sell | 217 | 01/2011 | CSFB | 0 | (2 | ) | (2 | ) | ||||||||||||||||||
Buy | 217 | 02/2011 | CSFB | 2 | 0 | 2 | ||||||||||||||||||||
Buy | CAD | 231 | 01/2011 | BCLY | 6 | 0 | 6 | |||||||||||||||||||
Sell | 231 | 01/2011 | MSC | 0 | (2 | ) | (2 | ) | ||||||||||||||||||
Buy | 231 | 02/2011 | MSC | 1 | 0 | 1 | ||||||||||||||||||||
Sell | CHF | 161 | 01/2011 | BCLY | 0 | (12 | ) | (12 | ) | |||||||||||||||||
Sell | 9 | 01/2011 | HSBC | 0 | 0 | 0 | ||||||||||||||||||||
Buy | 170 | 01/2011 | UBS | 1 | 0 | 1 | ||||||||||||||||||||
Sell | 170 | 02/2011 | UBS | 0 | (1 | ) | (1 | ) | ||||||||||||||||||
Buy | DKK | 977 | 01/2011 | BCLY | 2 | 0 | 2 | |||||||||||||||||||
Sell | 881 | 01/2011 | BCLY | 0 | (2 | ) | (2 | ) | ||||||||||||||||||
Buy | 20 | 01/2011 | CSFB | 0 | 0 | 0 | ||||||||||||||||||||
Sell | 36 | 01/2011 | HSBC | 0 | 0 | 0 | ||||||||||||||||||||
Sell | 80 | 01/2011 | UBS | 0 | 0 | 0 | ||||||||||||||||||||
Sell | 929 | 02/2011 | BCLY | 0 | (2 | ) | (2 | ) | ||||||||||||||||||
Sell | 4 | 02/2011 | RBC | 0 | 0 | 0 | ||||||||||||||||||||
Sell | EUR | 485 | 01/2011 | BCLY | 0 | (6 | ) | (6 | ) | |||||||||||||||||
Buy | 129 | 01/2011 | BNP | 3 | 0 | 3 | ||||||||||||||||||||
Buy | 256 | 01/2011 | CITI | 2 | 0 | 2 | ||||||||||||||||||||
Sell | 18 | 01/2011 | CITI | 0 | 0 | 0 | ||||||||||||||||||||
Sell | 12 | 01/2011 | HSBC | 0 | 0 | 0 | ||||||||||||||||||||
Sell | 83 | 01/2011 | RBC | 0 | (2 | ) | (2 | ) | ||||||||||||||||||
Buy | 213 | 01/2011 | RBS | 2 | 0 | 2 | ||||||||||||||||||||
Sell | 256 | 02/2011 | CITI | 0 | (2 | ) | (2 | ) | ||||||||||||||||||
Sell | 213 | 02/2011 | RBS | 0 | (2 | ) | (2 | ) | ||||||||||||||||||
Sell | GBP | 223 | 01/2011 | BCLY | 0 | 0 | 0 | |||||||||||||||||||
Sell | 10 | 01/2011 | HSBC | 0 | 0 | 0 | ||||||||||||||||||||
Sell | 9 | 01/2011 | MSC | 0 | 0 | 0 | ||||||||||||||||||||
Sell | 251 | 02/2011 | BNP | 0 | (4 | ) | (4 | ) | ||||||||||||||||||
Sell | 6 | 02/2011 | RBC | 0 | 0 | 0 | ||||||||||||||||||||
Sell | HKD | 110 | 01/2011 | BCLY | 0 | 0 | 0 | |||||||||||||||||||
Buy | JPY | 4,521 | 01/2011 | BCLY | 1 | 0 | 1 | |||||||||||||||||||
Buy | 26,418 | 01/2011 | DUB | 11 | 0 | 11 | ||||||||||||||||||||
Sell | 30,952 | 01/2011 | UBS | 0 | (4 | ) | (4 | ) | ||||||||||||||||||
Buy | 30,952 | 02/2011 | UBS | 4 | 0 | 4 | ||||||||||||||||||||
Buy | NOK | 726 | 01/2011 | BCLY | 2 | 0 | 2 | |||||||||||||||||||
Sell | 726 | 01/2011 | BCLY | 0 | (7 | ) | (7 | ) | ||||||||||||||||||
Sell | 726 | 02/2011 | BCLY | 0 | (2 | ) | (2 | ) | ||||||||||||||||||
Buy | SEK | 486 | 01/2011 | BCLY | 3 | 0 | 3 | |||||||||||||||||||
Sell | 449 | 01/2011 | BCLY | 0 | (2 | ) | (2 | ) | ||||||||||||||||||
Sell | 19 | 01/2011 | BNP | 0 | 0 | 0 | ||||||||||||||||||||
Sell | 18 | 01/2011 | RBS | 0 | 0 | 0 | ||||||||||||||||||||
Buy | 267 | 02/2011 | BCLY | 1 | 0 | 1 | ||||||||||||||||||||
Sell | SGD | 45 | 01/2011 | BCLY | 0 | (1 | ) | (1 | ) | |||||||||||||||||
| $ | 55 | $ | (53 | ) | $ | 2 | ||||||||||||||||||||
| 14 | �� | PIMCO Equity Series VIT | See Accompanying Notes |
Table of Contents
December 31, 2010
| (h) | Fair Value Measurements (1) |
The following is a summary of the fair valuations according to the inputs used as of December 31, 2010 in valuing the Portfolio’s assets and liabilities (2):
| Category and Subcategory (3) | Level 1 (4) | Level 2 (5) | Level 3 (6) | Fair Value at 12/31/2010 | ||||||||||||
Investments, at value | ||||||||||||||||
Common Stocks | ||||||||||||||||
Bermuda | ||||||||||||||||
Energy | $ | 0 | $ | 101 | $ | 0 | $ | 101 | ||||||||
Financials | 0 | 147 | 0 | 147 | ||||||||||||
Denmark | ||||||||||||||||
Consumer Staples | 0 | 116 | 0 | 116 | ||||||||||||
Financials | 0 | 26 | 0 | 26 | ||||||||||||
Faeroe Islands | ||||||||||||||||
Consumer Staples | 0 | 35 | 0 | 35 | ||||||||||||
Financials | 41 | 0 | 0 | 41 | ||||||||||||
France | ||||||||||||||||
Consumer Discretionary | 0 | 113 | 0 | 113 | ||||||||||||
Consumer Staples | 0 | 306 | 0 | 306 | ||||||||||||
Energy | 0 | 85 | 0 | 85 | ||||||||||||
Financials | 0 | 28 | 0 | 28 | ||||||||||||
Industrials | 0 | 52 | 0 | 52 | ||||||||||||
Germany | ||||||||||||||||
Financials | 0 | 98 | 0 | 98 | ||||||||||||
Health Care | 0 | 35 | 0 | 35 | ||||||||||||
Industrials | 0 | 31 | 0 | 31 | ||||||||||||
Utilities | 0 | 42 | 0 | 42 | ||||||||||||
Guernsey, Channel Islands | ||||||||||||||||
Financials | 0 | 75 | 0 | 75 | ||||||||||||
Hong Kong | ||||||||||||||||
Financials | 115 | 31 | 0 | 146 | ||||||||||||
Industrials | 0 | 27 | 0 | 27 | ||||||||||||
Italy | ||||||||||||||||
Financials | 0 | 21 | 0 | 21 | ||||||||||||
Japan | ||||||||||||||||
Information Technology | 0 | 58 | 0 | 58 | ||||||||||||
Netherlands | ||||||||||||||||
Consumer Staples | 0 | 107 | 0 | 107 | ||||||||||||
Energy | 9 | 46 | 0 | 55 | ||||||||||||
Financials | 0 | 44 | 0 | 44 | ||||||||||||
Information Technology | 0 | 33 | 0 | 33 | ||||||||||||
Telecommunication Services | 0 | 112 | 0 | 112 | ||||||||||||
Norway | ||||||||||||||||
Consumer Staples | 0 | 67 | 0 | 67 | ||||||||||||
Industrials | 0 | 39 | 0 | 39 | ||||||||||||
| Category and Subcategory (3) | Level 1 (4) | Level 2 (5) | Level 3 (6) | Fair Value at 12/31/2010 | ||||||||||||
Singapore | ||||||||||||||||
Financials | $ | 0 | $ | 14 | $ | 0 | $ | 14 | ||||||||
Industrials | 0 | 62 | 0 | 62 | ||||||||||||
Sweden | ||||||||||||||||
Industrials | 0 | 37 | 0 | 37 | ||||||||||||
Switzerland | ||||||||||||||||
Consumer Staples | 0 | 82 | 0 | 82 | ||||||||||||
Financials | 0 | 105 | 0 | 105 | ||||||||||||
Health Care | 56 | 0 | 0 | 56 | ||||||||||||
Industrials | 0 | 37 | 0 | 37 | ||||||||||||
Materials | 0 | 33 | 0 | 33 | ||||||||||||
United Kingdom | ||||||||||||||||
Consumer Discretionary | 13 | 0 | 0 | 13 | ||||||||||||
Consumer Staples | 0 | 391 | 0 | 391 | ||||||||||||
Energy | 0 | 105 | 0 | 105 | ||||||||||||
Financials | 0 | 164 | 0 | 164 | ||||||||||||
United States | ||||||||||||||||
Consumer Staples | 358 | 0 | 0 | 358 | ||||||||||||
Energy | 67 | 0 | 0 | 67 | ||||||||||||
Financials | 435 | 0 | 0 | 435 | ||||||||||||
Health Care | 64 | 0 | 0 | 64 | ||||||||||||
Industrials | 28 | 0 | 0 | 28 | ||||||||||||
Information Technology | 161 | 0 | 0 | 161 | ||||||||||||
Exchange-Traded Funds | 228 | 0 | 0 | 228 | ||||||||||||
Short-Term Instruments | ||||||||||||||||
Repurchase Agreements | 0 | 106 | 0 | 106 | ||||||||||||
PIMCO Short-Term Floating NAV Portfolio | 901 | 0 | 0 | 901 | ||||||||||||
Purchased Options | ||||||||||||||||
Equity Contracts | 1 | 0 | 0 | 1 | ||||||||||||
| $ | 2,477 | $ | 3,011 | $ | 0 | $ | 5,488 | |||||||||
Short Sales, at value | $ | (40 | ) | $ | 0 | $ | 0 | $ | (40 | ) | ||||||
Financial Derivative Instruments (7) – Assets | ||||||||||||||||
Foreign Exchange Contracts | $ | 0 | $ | 55 | $ | 0 | $ | 55 | ||||||||
Financial Derivative Instruments (7) – Liabilities |
| |||||||||||||||
Foreign Exchange Contracts | $ | 0 | $ | (53 | ) | $ | 0 | $ | (53 | ) | ||||||
Totals | $ | 2,437 | $ | 3,013 | $ | 0 | $ | 5,450 | ||||||||
| (1) | See note 3 in the Notes to Financial Statements for more information regarding pricing inputs and valuation techniques. |
| (2) | There were no significant transfers into and out of level 1, 2, and 3 during the period ended December 31, 2010. |
| (3) | Refer to the Schedule of Investments for additional information. |
| (4) | Quoted prices in active markets for identical investments. |
| (5) | Significant other observable inputs. |
| (6) | Significant unobservable inputs. |
| (7) | Financial derivative instruments may include open written options and foreign currency contracts. |
| See Accompanying Notes | Annual Report | December 31, 2010 | 15 |
Table of Contents
Schedule of Investments Pimco EqS Pathfinder Portfolio™ (Cont.)
(Unaudited)
| (i) | Fair Value of Financial Derivative Instruments (1) |
The following is a summary of the fair valuations of the Portfolio’s derivative instruments categorized by risk exposure:
Fair Values of Financial Derivative Instruments on the Statement of Assets and Liabilities as of December 31, 2010:
| Derivatives not accounted for as hedging instruments | ||||||||||||||||||||||||
| Interest rate contracts | Foreign exchange contracts | Credit contracts | Equity contracts | Other contracts | Total | |||||||||||||||||||
Assets: | ||||||||||||||||||||||||
Investments, at value (purchased options) | $ | 0 | $ | 0 | $ | 0 | $ | 1 | $ | 0 | $ | 1 | ||||||||||||
Unrealized appreciation on foreign currency contracts | 0 | 55 | 0 | 0 | 0 | 55 | ||||||||||||||||||
| $ | 0 | $ | 55 | $ | 0 | $ | 1 | $ | 0 | $ | 56 | |||||||||||||
Liabilities: | ||||||||||||||||||||||||
Unrealized depreciation on foreign currency contracts | $ | 0 | $ | 53 | $ | 0 | $ | 0 | $ | 0 | $ | 53 | ||||||||||||
The Effect of Financial Derivative Instruments on the Statement of Operations for the Period Ended December 31, 2010:
| Derivatives not accounted for as hedging instruments | ||||||||||||||||||||||||
| Interest rate contracts | Foreign exchange contracts | Credit contracts | Equity contracts | Other contracts | Total | |||||||||||||||||||
Realized (Loss) on Derivatives Recognized as a Result from Operations: | ||||||||||||||||||||||||
Net realized (loss) on investments (purchased options) | $ | 0 | $ | 0 | $ | 0 | $ | (8 | ) | $ | (2 | ) | $ | (10 | ) | |||||||||
Net realized (loss) on written options | 0 | 0 | 0 | (1 | ) | 0 | (1 | ) | ||||||||||||||||
Net realized (loss) on foreign currency transactions | 0 | (26 | ) | 0 | 0 | 0 | (26 | ) | ||||||||||||||||
| $ | 0 | $ | (26 | ) | $ | 0 | $ | (9 | ) | $ | (2 | ) | $ | (37 | ) | |||||||||
Net Change in Unrealized Appreciation on Derivatives Recognized as a Result from Operations: | ||||||||||||||||||||||||
Net change in unrealized appreciation on translation of assets and liabilities denominated in foreign currencies | $ | 0 | $ | 3 | $ | 0 | $ | 0 | $ | 0 | $ | 3 | ||||||||||||
| (1) | See note 5 in the Notes to Financial Statements for additional information. |
| 16 | PIMCO Equity Series VIT | See Accompanying Notes |
Table of Contents
December 31, 2010
1. ORGANIZATION
The PIMCO EqS Pathfinder PortfolioTM (the “Portfolio”) is a series of the PIMCO Equity Series VIT (the “Trust”). The Trust is registered under the Investment Company Act of 1940, as amended (the “Act”), as an open-end management investment company organized as a Delaware statutory trust on December 28, 2009. The Portfolio currently offers two classes of shares: Institutional and Advisor. Information presented on these financial statements pertains to the Advisor Class of the Portfolio. Certain detailed financial information for the Institutional Class is provided separately and is available upon request. The Trust is designed to be used as an investment vehicle by separate accounts of insurance companies that fund variable annuity contracts and variable life insurance policies and by qualified pension and retirement plans.
2. SIGNIFICANT ACCOUNTING POLICIES
The following is a summary of significant accounting policies consistently followed by the Portfolio in the preparation of its financial statements in conformity with accounting principles generally accepted in the United States of America (“U.S. GAAP”). The preparation of financial statements in accordance with U.S. GAAP may require management to make estimates and assumptions that affect the reported amounts of assets and liabilities and disclosure of contingent assets and liabilities at the date of the financial statements and the reported amounts of increases and decreases in net assets from operations during the reporting period. Actual results could differ from those estimates.
(a) Determination of Net Asset Value The Net Asset Value (“NAV”) of the Portfolio’s shares is valued as of the close of regular trading (normally 4:00 p.m., Eastern time) (the “NYSE Close”) on each day that the New York Stock Exchange (“NYSE”) is open. Information that becomes known to the Portfolio or its agents after the NAV has been calculated on a particular day will not generally be used to retroactively adjust the price of a security or the NAV determined earlier that day. The Portfolio reserves the right to change the time its NAV is calculated if the Portfolio closes earlier, or as permitted by the SEC.
(b) Securities Transactions and Investment Income Securities transactions are recorded as of the trade date for financial reporting purposes. Realized gains and losses from securities sold are recorded on the identified cost basis. Dividend income is recorded on the ex-dividend date, except certain dividends from foreign securities where the ex-dividend date may have passed, which are recorded as soon as the Portfolio is informed of the ex-dividend date. Interest income, adjusted for the accretion of discounts and amortization of premiums, is recorded on the accrual basis.
Dividends received by real estate investment trust securities may include return of capital. Such distributions reduce the cost basis of the respective securities. Distributions, if any, in excess of the cost basis of the security are recognized as capital gain.
(c) Foreign Currency Translation Portfolio securities and other assets and liabilities denominated in foreign currencies are translated into U.S. dollars based on the exchange rate of such currencies against U.S. dollars on the date of valuation. Purchases and sales of securities, income and expense items denominated in foreign currencies are translated into U.S. dollars at the exchange rate in effect on the transaction date.
The Portfolio does not separately report the effect of changes in foreign exchange rates from changes in market prices on securities held. Such changes are included in net realized and unrealized gain or loss from investments on the Statement of Operations.
Realized foreign exchange gains or losses arise from sales of foreign currencies, currency gains or losses realized between the trade and settlement dates on securities transactions and the difference between the recorded amounts of dividend, interest, and foreign withholding taxes and the U.S. dollar equivalent of the amounts actually received or paid. Net unrealized foreign exchange gains and losses arise from changes in foreign exchange rates on foreign denominated assets and liabilities other than investments in securities held at the end of the reporting period.
(d) Multiclass Operations Each class offered by the Portfolio has equal rights as to assets and voting privileges (except that shareholders of a class have exclusive voting rights regarding any matter relating solely to that class of shares). Income and non-class specific expenses are allocated daily to each class on the basis of the relative net assets. Realized and unrealized capital gains and losses of each class are allocated daily based on the relative net assets of each class of the Portfolio. Class specific expenses, where applicable, currently include supervisory and administrative, distribution and servicing fees.
(e) Dividends and Distributions to Shareholders Dividends from net investment income, if any, are declared and distributed to shareholders annually. Net realized capital gains earned by the Portfolio, if any, will be distributed no less frequently than once each year.
Income dividends and capital gain distributions are determined in accordance with income tax regulations which may differ from U.S. GAAP. Differences between tax regulations and U.S. GAAP may change the fiscal year when income and capital items are recognized for tax and U.S. GAAP purposes. Examples of events that give rise to timing differences include wash sales, straddles and capital loss carryforwards. Further, the character of investment income and capital gains may be different for certain transactions under the two methods of accounting. Examples of characterization differences include the treatment of swaps, foreign currency transactions, and investments in passive foreign investment companies. As a result, income dividends and capital gain distributions declared during a fiscal period may differ significantly from the net investment income and realized capital gain reported on the Portfolio’s annual financial statements presented under U.S. GAAP.
Distributions classified as a tax basis return of capital, if any, are reflected on the accompanying Statements of Changes in Net Assets and have been reclassified to paid in capital. In addition, other amounts have been reclassified between undistributed net investment income, accumulated undistributed net realized gains or losses and/or paid in capital to more appropriately conform financial accounting to tax characterizations of dividend distributions.
3. INVESTMENT VALUATION AND FAIR VALUE MEASUREMENTS
For purposes of calculating the NAV, portfolio securities and other assets for which market quotes are readily available are valued at fair market value. Fair market value is generally determined on the basis of last reported sales prices, or if no sales are reported, based on quotes obtained from a quotation reporting system, established market makers, or pricing services.
Investments initially valued in currencies other than the U.S. dollar are converted to the U.S. dollar using exchange rates obtained from pricing service providers. As a result, the NAV of the Portfolio’s shares may be affected by changes in the value of currencies in relation to the U.S. dollar. The value of securities traded in markets outside the United States or denominated in currencies other than the U.S. dollar may be affected significantly on a day that the NYSE is closed and the NAV may change on days when an investor is not able to purchase, redeem or exchange shares.
| Annual Report | December 31, 2010 | 17 |
Table of Contents
Notes to Financial Statements (Cont.)
U.S. GAAP defines fair market value as the price that the Portfolio would receive to sell an asset or pay to transfer a liability in an orderly transaction between market participants at the measurement date. It establishes a fair value hierarchy that prioritizes inputs to valuation methods and requires disclosure of the fair value hierarchy, separately for each major category of assets and liabilities, that segregates fair value measurements into levels (Level 1, 2, and 3). The inputs or methodology used for valuing securities are not necessarily an indication of the risk associated with investing in those securities. Levels 1, 2 and 3 of the fair value hierarchy are defined as follows:
| • | Level 1 — Inputs using quoted prices in active markets or exchanges for identical assets and liabilities. |
| • | Level 2 — Significant other observable inputs, which may include, but are not limited to, quoted prices for similar assets or liabilities in markets that are active, quoted prices for identical or similar assets or liabilities in markets that are not active, inputs other than quoted prices that are observable for the assets or liabilities (such as interest rates, yield curves, volatilities, prepayment speeds, loss severities, credit risks and default rates) or other market corroborated inputs. |
| • | Level 3 — Significant unobservable inputs based on the best information available in the circumstances, to the extent observable inputs are not available, which may include assumptions made by the Board of Trustees (the “Board”) or persons acting at their direction that are used in determining the fair market value of investments. |
Level 1 and Level 2 trading assets and trading liabilities, at fair market value The valuation techniques and significant inputs used in determining the fair market values of financial instruments classified as Level 1 and Level 2 of the fair value hierarchy are as follows:
Common stocks, exchange-traded funds and financial derivative instruments, such as futures contracts or options contracts that are traded on a national securities exchange, are stated at the last reported sale or settlement price on the day of valuation. To the extent these securities are actively traded and valuation adjustments are not applied, they are categorized as Level 1 of the fair value hierarchy. Valuation adjustments may be applied to certain securities that are solely traded on a foreign exchange to account for the market movement between the close of the foreign market and the close of the NYSE. These securities are valued using pricing service providers that considers the correlation of the trading patterns of the foreign security to the intraday trading in the U.S. markets for investments. Securities using these valuation adjustments are categorized as Level 2 of the fair value hierarchy. Preferred securities and other equities traded on inactive markets or valued by reference to similar instruments are also categorized as Level 2 of the fair value hierarchy.
Investments in registered open-end investment management companies will be valued based upon the NAVs of such investments and are categorized as Level 1 of the fair value hierarchy. Investments in unregistered open-end management investment companies will be calculated based upon the NAV of such investments and are considered Level 1 provided that the NAV is observable, calculated daily and is the value at which both purchases and sales will be conducted. Investments in privately held investment funds will be valued based upon the NAVs of such investments and are categorized as Level 2 of the fair value hierarchy. Investments in privately held investment funds where the NAV is unobservable will be calculated based upon the NAVs of such investments and are categorized as Level 3 of the fair value hierarchy.
Short-term investments having a maturity of 60 days or less are generally valued at amortized cost which approximates fair market value. These investments are categorized as Level 2 of the fair value hierarchy.
Over-the-counter financial derivative instruments, such as foreign currency contracts or options contracts, derive their value from underlying asset prices, indices, reference rates, and other inputs or a combination of these factors. These contracts are normally valued on the basis of broker dealer quotations or pricing service providers. Depending on the product and the terms of the transaction, the value of the derivative contracts can be estimated by a pricing service provider using a series of techniques, including simulation pricing models. The pricing models use inputs that are observed from actively quoted markets such as issuer details, indices, spreads, interest rates, curves, dividends and exchange rates. Derivatives that use similar valuation techniques and inputs as described above are categorized as Level 2 of the fair value hierarchy.
Level 3 trading assets and trading liabilities, at fair market value The valuation techniques and significant inputs used in determining the fair market values of financial instruments classified as Level 3 of the fair value hierarchy are as follows:
Securities and other assets for which market quotes are not readily available are valued at fair market value as determined in good faith by the Board or persons acting at their direction and are categorized as Level 3 of the fair value hierarchy.
Market quotes are considered not readily available in circumstances where there is an absence of current or reliable market-based data (e.g., trade information or broker quotes), including where events occur after the close of the relevant market, but prior to the NYSE Close, that materially affect the values of the Portfolio’s securities or assets. In addition, market quotes are considered not readily available when, due to extraordinary circumstances, the exchanges or markets on which the securities trade, do not open for trading for the entire day and no other market prices are available. The Board has delegated to the investment adviser, Pacific Investment Management Company LLC (“PIMCO”), the responsibility for monitoring significant events that may materially affect the values of the Portfolio’s securities or assets and for determining whether the value of the applicable securities or assets should be re-evaluated in light of such significant events.
The Board has adopted methods for valuing securities and other assets in circumstances where market quotes are not readily available, and has delegated the responsibility for applying the valuation methods to PIMCO. For instances in which daily market quotes are not readily available investments may be valued, pursuant to guidelines established by the Board, with reference to other securities or indices. In the event that the security or asset cannot be valued pursuant to one of the valuation methods established by the Board, the value of the security or asset will be determined in good faith by the Valuation Committee of the Board, generally based upon recommendations provided by PIMCO. When the Portfolio uses fair valuation methods applied by PIMCO that uses significant unobservable inputs to determine its NAV, securities will be priced by another method that the Board or persons acting at their direction believe accurately reflects fair market value and are categorized as Level 3 of the fair value hierarchy. These methods may require subjective determinations about the value of the security. While the Trust’s policy is intended to result in a calculation of the Portfolio’s NAV that fairly reflects security values as of the time of pricing, the Trust cannot guarantee that values determined by the Board or persons acting at their direction would accurately reflect the price that the Portfolio could obtain for a security if it were to dispose of that security as of the time of pricing (for instance, in a forced or distressed sale). The prices used by the Portfolio may differ from the value that would be realized if the securities were sold.
For fair valuations using significant unobservable inputs, U.S. GAAP requires a reconciliation of the beginning to ending balances for reported market values that presents changes attributable to total realized and unrealized gains or losses, purchases and sales, and transfers in/out of the Level 3 category during the
| 18 | PIMCO Equity Series VIT |
Table of Contents
December 31, 2010
period. The end of period timing recognition is used for the significant transfers between Levels of the Portfolio’s assets and liabilities. In accordance with the requirements of U.S. GAAP, a fair value hierarchy and Level 3 reconciliation, if any, have been included in the Notes to the Schedule of Investments for the Portfolio.
4. SECURITIES AND OTHER INVESTMENTS
(a) Exchange-Trade Funds The Portfolio may invest in exchange-trade funds (“ETFs”), which generally are index-based investment companies that hold substantially all of their assets in securities representing their specific index. ETFs are funds that issue shares that trade throughout the day on an exchange and represent an investment in a portfolio of securities and assets. As a shareholder of another investment company, the portfolio would bear its pro rata portion of the other investment company’s expenses, including advisory fees, in addition to the expenses the Portfolio bears directly in connection with its own operations.
(b) Repurchase Agreements The Portfolio may engage in repurchase transactions. Under the terms of a typical repurchase agreement, the Portfolio takes possession of an underlying debt obligation (collateral) subject to an obligation of the seller to repurchase, and the Portfolio to resell, the obligation at an agreed-upon price and time. The underlying securities for all repurchase agreements are held in safekeeping at the Portfolio’s custodian or designated subcustodians under tri-party repurchase agreements. The market value of the collateral must be equal to or exceed the total amount of the repurchase obligations, including interest. Securities purchased under repurchase agreements are reflected as an asset in the Statement of Assets and Liabilities. Interest earned is recorded as a component of interest income on the Statement of Operations. In periods of increased demand for collateral, the Portfolio may pay a fee for receipt of collateral, which may result in interest expense to the Portfolio. Generally, in the event of counterparty default, the Portfolio has the right to use the collateral to offset losses incurred. If the counterparty should default, the Portfolio will seek to sell the securities which it holds as collateral. This could involve procedural costs or delays in addition to a loss on the securities if their value should fall below their repurchase price.
(c) Short Sales The Portfolio may engage in short sales for investment and risk management purposes. Short sales are transactions in which the Portfolio sells a security or other instrument (such as an option, forward, future or other derivative contract) that it does not own. When the Portfolio engages in a short sale, it must borrow the security sold short and deliver it to the counterparty. The Portfolio will ordinarily have to pay a fee or premium to borrow a security and be obligated to repay the lender of the security any dividend or interest that accrues on the security during the period of the loan. The Portfolio may enter into a specific agreement with a prime broker giving the Portfolio the opportunity to borrow a predetermined amount of a thinly traded security for the duration of the term (the “Term Borrow Agreement”). In exchange for the opportunity to borrow the specified security, the Portfolio will pay the prime broker a fee as detailed in the Term Borrow Agreement. Securities sold in short sale transactions and the dividend or interest payable on such securities, if any, are reflected as payable for short sales on the Statement of Assets and Liabilities. Short sales expose the Portfolio to the risk that it will be required to cover its short position at a time when the security or other asset has appreciated in value, thus resulting in losses to the Portfolio. A short sale is “against the box” if the Portfolio holds in its portfolio or has the right to acquire the security sold short at no additional cost. The Portfolio will be subject to additional risks to the extent that it engages in short sales that are not “against the box.” The Portfolio’s loss on a short sale could theoretically be unlimited in cases where the Portfolio is unable, for whatever reason, to close out its short position.
5. FINANCIAL DERIVATIVE INSTRUMENTS
The following disclosures contain information on how and why the Portfolio uses derivative instruments, the credit-risk-related contingent features in certain
derivative instruments, and how derivative instruments affect the Portfolio’s financial position, results of operations and cash flows. The location and fair value amounts of these instruments on the Statement of Assets and Liabilities and the realized and changes in unrealized gains and losses on the Statement of Operations, each categorized by type of derivative contract, are included in a table in the Notes to Schedule of Investments. The derivative instruments outstanding as of period end as disclosed in the Notes to Schedule of Investments and the amounts of realized and changes in unrealized gains and losses on derivative instruments during the period as disclosed in the Statement of Operations serve as indicators of the volume of derivative activity for the Portfolio.
(a) Foreign Currency Contracts The Portfolio may enter into foreign currency contracts in connection with settling planned purchases or sales of securities, to hedge the currency exposure associated with some or all of the Portfolio’s securities or as a part of an investment strategy. A foreign currency contract is an agreement between two parties to buy and sell a currency at a set price on a future date. The market value of a foreign currency contract fluctuates with changes in foreign currency exchange rates. Foreign currency contracts are marked to market daily and the change in value is recorded by the Portfolio as an unrealized gain or loss. Realized gains or losses equal to the difference between the value of the contract at the time it was opened and the value at the time it was closed are recorded upon delivery or receipt of the currency. These contracts may involve market risk in excess of the unrealized gain or loss reflected on the Statement of Assets and Liabilities. In addition, the Portfolio could be exposed to risk if the counterparties are unable to meet the terms of the contracts or if the value of the currency changes unfavorably to the U.S. dollar. In connection with these contracts, securities may be identified as collateral in accordance with the terms of the respective contracts.
(b) Options Contracts The Portfolio may write call and put options on futures, swaps (“swaptions”), securities, commodities or currencies it owns or in which it may invest. Writing put options tends to increase the Portfolio’s exposure to the underlying instrument. Writing call options tends to decrease the Portfolio’s exposure to the underlying instrument. When the Portfolio writes a call or put option, an amount equal to the premium received is recorded as a liability and subsequently marked to market to reflect the current value of the option written. These liabilities are reflected as written options outstanding on the Statement of Assets and Liabilities. Certain options may be written with premiums to be determined on a future date. Premiums received from writing options which expire are treated as realized gains. Premiums received from writing options which are exercised or closed are added to the proceeds or offset against amounts paid on the underlying futures, swap, security or currency transaction to determine the realized gain or loss. The Portfolio as a writer of an option has no control over whether the underlying instrument may be sold (call) or purchased (put) and as a result bears the market risk of an unfavorable change in the price of the instrument underlying the written option. There is the risk the Portfolio may not be able to enter into a closing transaction because of an illiquid market.
The Portfolio may also purchase put and call options. Purchasing call options tends to increase the Portfolio’s exposure to the underlying instrument. Purchasing put options tends to decrease the Portfolio’s exposure to the underlying instrument. The Portfolio pays a premium which is included on the Statement of Assets and Liabilities as an investment and subsequently marked to market to reflect the current value of the option. Premiums paid for purchasing options which expire are treated as realized losses. Certain options may be purchased with premiums to be determined on a future date. The premiums for these options are based upon implied volatility parameters at specified terms. The risk associated with purchasing put and call options is limited to the premium paid. Premiums paid for purchasing options which are exercised or closed are added to the amounts paid or offset against the proceeds on the underlying investment transaction to determine the realized gain or loss.
| Annual Report | December 31, 2010 | 19 |
Table of Contents
Notes to Financial Statements (Cont.)
6. PRINCIPAL RISKS
In the normal course of business the Portfolio trades financial instruments and enters into financial transactions where risk of potential loss exists due to changes in the market (market risk), or failure or inability of the other party to a transaction to perform (credit and counterparty risk). See below for a detailed description of select principal risks. For a list of potential risks the Portfolio may be subject to, please see the Important Information About the Portfolio.
Market Risks The Portfolio’s investments in derivatives and other financial instruments expose the Portfolio to various risks such as, but not limited to equity, interest rate and foreign currency risks.
The market values of equities, such as common stocks and preferred securities or equity related investments such as futures and options, may decline due to general market conditions which are not specifically related to a particular company, such as real or perceived adverse economic conditions, changes in the general outlook for corporate earnings, changes in interest or currency rates or adverse investor sentiment generally. They may also decline due to factors which affect a particular industry or industries, such as labor shortages or increased production costs and competitive conditions within an industry. Equity securities and equity related investments generally have greater market price volatility than fixed income securities.
Interest rate risk is the risk that fixed income securities will decline in value because of changes in interest rates. As nominal interest rates rise, the value of certain fixed income securities held by the Portfolio is likely to decrease. A nominal interest rate can be described as the sum of a real interest rate and an expected inflation rate. Fixed income securities with longer durations tend to be more sensitive to changes in interest rates, usually making them more volatile than securities with shorter durations. Duration is useful primarily as a measure of the sensitivity of a fixed income’s market price to interest rate (i.e. yield) movements.
If the Portfolio invests directly in foreign currencies or in securities that trade in, and receive revenues in, foreign currencies, or in derivatives that provide exposure to foreign currencies, it will be subject to the risk that those currencies will decline in value relative to the base currency of the Portfolio, or, in the case of hedging positions, that the Portfolio’s base currency will decline in value relative to the currency being hedged. Currency rates in foreign countries may fluctuate significantly over short periods of time for a number of reasons, including changes in interest rates, intervention (or the failure to intervene) by U.S. or foreign governments, central banks or supranational entities such as the International Monetary Fund, or by the imposition of currency controls or other political developments in the United States or abroad. As a result, the Portfolio’s investments in foreign currency denominated securities may reduce the returns of the Portfolio.
Credit and Counterparty Risks The Portfolio will be exposed to credit risk on parties with whom it trades and will also bear the risk of settlement default. The Portfolio minimizes concentrations of credit risk by undertaking transactions with a large number of customers and counterparties on recognized and reputable exchanges. The Portfolio could lose money if the issuer or guarantor of a fixed income security, or the counterparty to a derivatives contract, repurchase agreement or a loan of portfolio securities, is unable or unwilling to make timely principal and/or interest payments, or to otherwise honor its obligations. Securities are subject to varying degrees of credit risk, which are often reflected in credit ratings.
Similar to credit risk, the Portfolio may be exposed to counterparty risk, or the risk that an institution or other entity with which the Portfolio has unsettled or open transactions will default. Financial assets, which potentially expose the Portfolio to counterparty risk, consist principally of cash due from counterparties and
investments. PIMCO, as the investment adviser, minimizes counterparty risks to the Portfolio by performing extensive reviews of each counterparty and obtaining approval from the PIMCO Counterparty Risk Committee prior to entering into transactions with a third party. Furthermore, to the extent that unpaid amounts owed to the Portfolio exceed a predetermined threshold agreed to with the counterparty, such counterparty shall advance collateral to the Portfolio in the form of cash or cash equivalents equal in value to the unpaid amount owed to the Portfolio. The Portfolio may invest such collateral in securities or other instruments and will typically pay interest to the counterparty on the collateral received. If the unpaid amount owed to the Portfolio subsequently falls, the Portfolio would be required to return to the counterparty all or a portion of the collateral previously advanced to the Portfolio.
All transactions in listed securities are settled/paid for upon delivery using approved counterparties. The risk of default is considered minimal, as delivery of securities sold is only made once the Portfolio has received payment. Payment is made on a purchase once the securities have been delivered by the counterparty. The trade will fail if either party fails to meet its obligation.
The Portfolio is subject to various Master Agreements, which govern the terms of certain transactions with select counterparties. These Master Agreements reduce the counterparty risk associated with relevant transactions by allowing the Portfolio to net contracts in the event of default. All amounts with the counterparty are terminated and settled on a net basis. The Portfolio’s overall exposure to counterparty risk can change substantially within a short period, as it is affected by each transaction subject to the relevant Master Agreement.
Master Repurchase Agreements (“Master Repo Agreements”) govern transactions between the Portfolio and select counterparties. The Master Repo Agreements maintain provisions for, initiation, income payments, events of default, and maintenance of collateral for Repurchase Agreements.
International Swaps and Derivatives Association, Inc. Master Agreements (“ISDA Master Agreements”) govern transactions, over-the-counter derivative and foreign exchange contracts, entered into by the Portfolio and those counterparties. The ISDA Master Agreements maintain provisions for general obligations, representations, agreements, collateral and events of default or termination. Events of termination include conditions that may entitle counterparties to elect to terminate early and cause settlement of all outstanding transactions under the applicable ISDA Master Agreement. Any election to early terminate could be material to the financial statements.
Prime Broker Account Agreements between the Portfolio and selected Prime Brokers govern the considerations and factors surrounding accounts opened for short selling transactions and activities, including, but not limited to, margin, execution, and settlement. The Prime Broker Account Agreements maintain provisions for, among other things, payments, maintenance of collateral, events of default, and termination.
7. FEES AND EXPENSES
(a) Investment Advisory Fee PIMCO is a majority-owned subsidiary of Allianz Global Investors of America L.P. (“AGI”), and serves as investment adviser (the “Adviser”) to the Trust, pursuant to an investment advisory contract. The Adviser receives a monthly fee from the Portfolio, at an annual rate based on average daily net assets (the “Investment Advisory Fee”). The Investment Advisory Fee for all classes is charged at an annual rate of 0.75%.
PIMCO has contractually agreed, through May 1, 2012, to waive a portion of its Investment Advisory Fee equal to 0.13% of average daily net assets. Under the Fee Limitation Agreement (see note 7(e)), PIMCO is entitled to reimbursement by the Portfolio of any portion of the management fees waived, reduced or reimbursed pursuant to the Fee Limitation Agreement (the “Reimbursement
| 20 | PIMCO Equity Series VIT |
Table of Contents
December 31, 2010
Amount”) during the previous three years, provided that such amount paid to PIMCO will not: 1) together with any recoupment of organizational expenses and pro rata Trustees’ fees pursuant to the Expense Limitation Agreement, exceed the Expense Limit: 2) exceed the total Reimbursement Amount; or 3) include any amounts previously reimbursed to PIMCO. The Fee Limitation Agreement will automatically renew for one-year terms unless PIMCO provides written notice to the Trust at least 30 days prior to the end of the then current term. As of December 31, 2010, the recoverable Investment Advisory Fee amount to PIMCO was $3,857.
(b) Supervisory and Administrative Fee PIMCO serves as administrator (the “Administrator”), and provides supervisory and administrative services to the Trust for which it receives a monthly supervisory and administrative fee based on each share class’s average daily net assets (the “Supervisory and Administrative Fee”). As the Administrator, PIMCO bears the costs of various third-party services, including audit, custodial, portfolio accounting, legal, transfer agency and printing costs. The Supervisory and Administrative Fee for all classes is charged at the annual rate of 0.35%.
(c) Distribution and Servicing Fees During the fiscal year ended December 31, 2010, Allianz Global Investors Distributors LLC (“AGID”), an indirect wholly-owned subsidiary of AGI, served as the distributor (the “Distributor”) of the Trust’s shares. The Trust has adopted a Distribution Plan for the Advisor Class shares of the Portfolio (the “Plan”). The Plan has been adopted pursuant to Rule 12b-1 under the Act. The Plan permits payments for expenses in connection with the distribution and marketing of Advisor Class shares and/or the provision of shareholder services to Advisor Class shareholders. The Plan permits the Portfolio to make total payments at an annual rate of 0.25% of its average daily net assets attributable to its Advisor Class shares.
Effective February 14, 2011, PIMCO Investments LLC will serve as the Distributor for the Trust. Please see Subsequent Event Note for more details.
(d) Portfolio Expenses The Trust is responsible for the following expenses: (i) salaries and other compensation of any of the Trust’s executive officers and employees who are not officers, directors, stockholders or employees of PIMCO or its subsidiaries or affiliates; (ii) taxes and governmental fees; (iii) brokerage fees and commissions and other portfolio transaction expenses; (iv) the costs of borrowing money, including interest expenses and bank overdraft charges; (v) fees and expenses of the Trustees who are not “interested persons” of PIMCO or the Trust, and any counsel retained exclusively for their benefit; (vi) extraordinary expenses, including costs of litigation and indemnification expenses; (vii) organization expenses, which are capitalized in accordance with generally accepted accounting principles; and (viii) any expenses allocated or allocable to a specific class of shares (“class-specific expenses”). The ratio of expenses to average net assets per share class, as disclosed on the Financial Highlights, may differ from the annual portfolio operating expenses per share class as disclosed in the Prospectus for the reasons set forth above.
Each Trustee, other than those affiliated with PIMCO or its affiliates, receives an annual retainer of $10,000, plus $1,500 for each Board of Trustees meeting attended in person, $250 ($375 in the case of the audit committee chair with respect to audit committee meetings) for each committee meeting attended and $375 for each Board of Trustees meeting attended telephonically, plus reimbursement of related expenses. In addition, the audit committee chair receives an additional annual retainer of $2,000 and each other committee chair receives an additional annual retainer of $250. The Trust pays no compensation directly to any Trustee or any other officer who is affiliated with the Administrator, all of whom receive remuneration for their services to the Trust from the Administrator or its affiliates.
(e) Expense Limitation PIMCO has also contractually agreed, through May 1, 2011, to reduce total annual operating expenses for each of the Portfolio’s separate classes of shares, by reducing the Portfolio’s Supervisory and Administrative fee or reimbursing the Portfolio, to the extent that organizational expenses and pro rata Trustees’ fees attributable to a class of shares of the Portfolio exceed 0.0049% of the Portfolio’s average net assets attributable to
separate classes of shares. This Expense Limitation Agreement renews annually for a full year unless terminated by PIMCO upon at least 30 days prior notice to the end of the contract term. PIMCO may recoup these waivers and reimbursements for a period not exceeding three years, provided that total expenses, including such recoupment, do not exceed the annual expense limit. As of December 31, 2010, the remaining recoverable amount to PIMCO was $99,476.
8. RELATED PARTY TRANSACTIONS
The Adviser, Administrator, and Distributor are related parties. Fees payable to these parties are disclosed in Note 7 and the accrued related party fees amounts are disclosed in the Statement of Assets and Liabilities.
The Portfolio may invest in the PIMCO Short-Term Floating NAV Portfolio to the extent permitted by the Act and rules thereunder. The PIMCO Short-Term Floating NAV Portfolio is a registered investment company created for use solely by the series of the Trust, series of the PIMCO Funds, PIMCO Equity Series and PIMCO Variable Insurance Trust in connection with their cash management activities. The main investments of the PIMCO Short-Term Floating NAV Portfolio are money market instruments and short maturity fixed income instruments. The PIMCO Short-Term Floating NAV Portfolio may incur expenses related to its investment activities, but does not pay Investment Advisory or Supervisory and Administrative Fees to PIMCO. The PIMCO Short-Term Floating NAV Portfolio is considered to be affiliated with the Portfolio. The table below shows the Portfolio’s transactions in and earnings from investments in the PIMCO Short-Term Floating NAV Portfolio for the period ended December 31, 2010 (amounts in thousands):
| Market Value 04/14/2010 | Purchases at Cost | Proceeds from Sales | Net Capital and Realized Gain | Change in Unrealized Appreciation | Market Value 12/31/2010 | Dividend Income | ||||||||||||||||||||
| $ | 0 | $ | 4,101 | $ | (3,200 | ) | $ | 0 | $ | 0 | $ | 901 | $ | 1 | ||||||||||||
9. GUARANTEES AND INDEMNIFICATIONS
Under the Trust’s organizational documents, each Trustee or officer of the Trust is indemnified and each employee or other agent of the Trust (including the Trust’s investment manager) may be indemnified, to the extent permitted by the Act, against certain liabilities that may arise out of performance of their duties to the Portfolio. Additionally, in the normal course of business, the Portfolio enters into contracts that contain a variety of indemnification clauses. The Portfolio’s maximum exposure under these arrangements is unknown as this would involve future claims that may be made against the Portfolio that have not yet occurred. However, the Portfolio has not had prior claims or losses pursuant to these contracts.
10. PURCHASES AND SALES OF SECURITIES
The length of time the Portfolio has held a particular security is not generally a consideration in investment decisions. A change in the securities held by the Portfolio is known as “portfolio turnover.” The Portfolio may engage in frequent and active trading of portfolio securities to achieve its investment objective, particularly during periods of volatile market movements. High portfolio turnover (e.g., over 100%) involves correspondingly greater expenses to the Portfolio, including brokerage commissions or dealer mark-ups and other transaction costs on the sale of securities and reinvestments in other securities. Such sales may also result in realization of taxable capital gains, including short-term capital gains (which are generally taxed at ordinary income tax rates). The trading costs and tax effects associated with portfolio turnover may adversely affect the Portfolio’s performance. The portfolio turnover rates are reported in the Financial Highlights.
The Portfolio’s purchases and sales of securities, other than short-term securities and U.S. Government Agency securities for the period ended December 31, 2010, were as follows (amounts in thousands):
| Purchases | Sales | |||||
| $ | 5,055 | $ | 796 | |||
| Annual Report | December 31, 2010 | 21 |
Table of Contents
Notes to Financial Statements (Cont.)
(Unaudited)
11. SHARES OF BENEFICIAL INTEREST
The Portfolio may issue an unlimited number of shares of beneficial interest with a $0.001 par value. Changes in shares of beneficial interest were as follows (shares and amounts in thousands):
| Period from 04/14/2010 to 12/31/2010 | ||||||||||||
| Shares | Amount | |||||||||||
Receipts for shares sold | ||||||||||||
Institutional Class | 349 | $ | 3,472 | |||||||||
Advisor Class | 274 | 2,697 | ||||||||||
Cost of shares redeemed | ||||||||||||
Institutional Class | (32 | ) | (306 | ) | ||||||||
Advisor Class | (32 | ) | (311 | ) | ||||||||
Net increase resulting from Portfolio share transactions | 559 | $ | 5,552 | |||||||||
As of December 31, 2010, the number of shareholders each owning 5% or more of the total shares outstanding of each share class of the Portfolio is summarized in the following table:
Number of Shareholders | % of Shares Outstanding | |||||||||||
| Institutional Class | 1 | 98 | ||||||||||
| Advisor Class | 1 | 97 | * | |||||||||
| * | PIMCO LLC, a direct subsidiary of Allianz Global Investors of America L.P. and a related party to the Portfolio, owned 25% or more of the outstanding shares of beneficial interest of the Portfolio and therefore may be presumed to “control” the Portfolio, as that term is defined in the 1940 Act. |
12. REGULATORY AND LITIGATION MATTERS
The Trust is not engaged in any litigation or arbitration proceedings and is not aware of any litigation or claim pending or threatened by or against it. However, PIMCO is a defendant in the following litigation matters unrelated to its management of the Trust.
In Kohen v. PIMCO and PIMCO Funds, plaintiffs challenged certain trades by PIMCO in the June 2005 10 year futures contract. PIMCO’s position is that all such trades
were properly designed to secure best execution for its clients. The parties resolved this matter through settlement, which resolves all of the claims against PIMCO and PIMCO Funds. In settling this matter, PIMCO and PIMCO Funds deny any liability. This settlement is purely private in nature and not a regulatory matter.
13. FEDERAL INCOME TAX MATTERS
The Portfolio intends to qualify as a regulated investment company under sub-chapter M of the Internal Revenue Code (the “Code”) and distribute all of its taxable income and net realized gains, if applicable, to shareholders. Accordingly, no provision for Federal income taxes has been made.
U.S. GAAP provides guidance for how uncertain tax positions should be recognized, measured, presented and disclosed in the financial statements. In accordance with provisions set forth under U.S. GAAP, the Investment Adviser has reviewed the Portfolio’s tax position for all open tax years, and concluded that the adoptions had no effect on the Portfolio’s financial position or results of operations. As of December 31, 2010, the Portfolio has recorded no liability for net unrecognized tax benefits relating to uncertain income tax positions it has taken or expects to take in future tax returns.
The Portfolio files U. S. tax returns. The Portfolio is not aware of any tax positions for which it is reasonably possible that the total amounts of unrecognized tax benefits will significantly change in the next twelve months.
As of December 31, 2010, the components of distributable taxable earnings are as follows (amounts in thousands):
Undistributed Ordinary Income | Undistributed Long-Term Capital Gains | Net Tax Basis Unrealized Appreciation/ (Depreciation) (1) | Other Book-to-Tax Accounting Differences | Accumulated Capital Losses (2) | Post-October Deferral (3) | |||||||||||||||
| $ 31 | $ | — | $ | 228 | $ | — | $ | (30) | $ | (7) | ||||||||||
| (1) | Adjusted for open wash sale loss deferrals and the accelerated recognition of unrealized gain or loss on certain forward contracts for federal income tax purposes. Also adjusted for investments in ETF Trusts. |
| (2) | Capital losses available to offset future net capital gains expire in varying amounts in the years shown below. |
| (3) | Capital losses realized during the period November 1, 2010 through December 31, 2010, which the Portfolio elected to defer to the following taxable year pursuant to income tax regulations. |
As of December 31, 2010, the Fund had accumulated capital losses expiring in the following years (amounts in thousands). The Fund will resume capital gain distributions in the future to the extent gains are realized in excess of accumulated capital losses.
| Expiration of Accumulated Capital Losses | ||||||||||||||||||||||||||
| 12/31/2012 | 12/31/2013 | 12/31/2014 | 12/31/2015 | 12/31/2016 | 12/31/2017 | 12/31/2018 | ||||||||||||||||||||
| $ | — | $ | — | $ | — | $ | — | $ | — | $ | — | $ | 30 | |||||||||||||
As of December 31, 2010, the aggregate cost and the net unrealized appreciation/(depreciation) of investments for federal income tax purposes are as follows (amounts in thousands):
Federal Tax Cost | Unrealized Appreciation | Unrealized (Depreciation) | Net Unrealized Appreciation/ (Depreciation) (4) | |||||||||||
| $ | 5,260 | $ | 307 | $ | (79) | $ | 228 | |||||||
| (4) | Primary differences, if any, between book and tax net unrealized appreciation/(depreciation) on investments are attributable to open wash sale loss deferrals and ETF Trust adjustments. |
14. SUBSEQUENT EVENTS
During the fiscal year ended December 31, 2010 and through February 13, 2011, Allianz Global Investors Distributors LLC (“AGID”), an indirect wholly-owned subsidiary of AGI, served as the distributor to the Trust’s shares. Effective February 14, 2011, PIMCO Investments LLC (the “Distributor”) serves as the Distributor of the Trust’s shares. As such, this Shareholder Report identifies PIMCO Investments LLC as the current Distributor to the Trust’s shares.
| 22 | PIMCO Equity Series VIT |
Table of Contents
Report of Independent Registered Public Accounting Firm
To the Board of Trustees of PIMCO Equity Series VIT and Advisor Class Shareholders of PIMCO EqS Pathfinder PortfolioTM:
In our opinion, the accompanying statement of assets and liabilities, including the schedule of investments, and the related statements of operations and of changes in net assets and the financial highlights for the Advisor Class present fairly, in all material respects, the financial position of the PIMCO EqS Pathfinder PortfolioTM (constituting PIMCO Equity Series VIT, hereinafter referred to as the “Portfolio”) at December 31, 2010 and the results of its operations, the changes in its net assets and the financial highlights for the Advisor Class for the period April 14, 2010 (commencement of operations) through December 31, 2010, in conformity with accounting principles generally accepted in the United States of America. These financial statements and financial highlights (hereafter referred to as “financial statements”) are the responsibility of the Portfolio’s management; our responsibility is to express an opinion on these financial statements based on our audit. We conducted our audit of these financial statements in accordance with the standards of the Public Company Accounting Oversight Board (United States). Those standards require that we plan and perform the audit to obtain reasonable assurance about whether the financial statements are free of material misstatement. An audit includes examining, on a test basis, evidence supporting the amounts and disclosures in the financial statements, assessing the accounting principles used and significant estimates made by management, and evaluating the overall financial statement presentation. We believe that our audit, which included confirmation of securities at December 31, 2010 by correspondence with the custodian, underlying funds’ transfer agent and counterparties, provides a reasonable basis for our opinion.
PricewaterhouseCoopers LLP
Kansas City, Missouri
February 18, 2011
| Annual Report | December 31, 2010 | 23 |
Table of Contents
GLOSSARY: (abbreviations that may be used in the preceding statements)
(Unaudited)
| Counterparty Abbreviations: | ||||||||||
| BCLY | Barclays Bank PLC | DUB | Deutsche Bank AG | RBC | Royal Bank of Canada | |||||
| BNP | BNP Paribas Bank | HSBC | HSBC Bank USA | RBS | Royal Bank of Scotland Group PLC | |||||
| CITI | Citigroup, Inc. | MSC | Morgan Stanley | UBS | UBS Warburg LLC | |||||
| CSFB | Credit Suisse First Boston | |||||||||
| Currency Abbreviations: | ||||||||||
| AUD | Australian Dollar | EUR | Euro | NOK | Norwegian Krone | |||||
| CAD | Canadian Dollar | GBP | British Pound | SEK | Swedish Krona | |||||
| CHF | Swiss Franc | HKD | Hong Kong Dollar | SGD | Singapore Dollar | |||||
| DKK | Danish Krone | JPY | Japanese Yen | USD | United States Dollar | |||||
| Exchange Abbreviations: | ||||||||||
| CBOT | Chicago Board of Trade | OTC | Over-the-Counter | |||||||
| Other Abbreviations: | ||||||||||
| SPDR | Standard & Poor’s Depository Receipts | |||||||||
| 24 | PIMCO Equity Series VIT |
Table of Contents
(Unaudited)
The Portfolio considers customer privacy to be a fundamental aspect of its relationships with shareholders and is committed to maintaining the confidentiality, integrity and security of its current, prospective and former shareholders’ personal information. To ensure its shareholders’ privacy, the Portfolio has developed policies that are designed to protect this confidentiality, while allowing shareholder needs to be served.
Obtaining Personal Information
In the course of providing shareholders with products and services, the Portfolio and certain service providers to the Portfolio, such as the Portfolio’s investment adviser (“Adviser”), may obtain non-public personal information about shareholders, which may come from sources such as account applications and other forms, from other written, electronic or verbal correspondence, from shareholder transactions, from a shareholder’s brokerage or financial advisory firm, financial adviser or consultant, and/or from information captured on the Portfolio’s internet websites.
Respecting Your Privacy
As a matter of policy, the Portfolio does not disclose any personal or account information provided by shareholders or gathered by the Portfolio to non-affiliated third parties, except as required or permitted by law or as necessary for such third parties to perform their agreements with respect to the Portfolio. As is common in the industry, non-affiliated companies may from time to time be used to provide certain services, such as preparing and mailing prospectuses, reports, account statements and other information, conducting research on shareholder satisfaction and gathering shareholder proxies. The Portfolio’s Distributor may also retain non-affiliated companies to market the Portfolio’s shares or products which use the Portfolio’s shares and enter into joint marketing agreements with other companies. These companies may have access to a shareholder’s personal and account information, but are permitted to use this information solely to provide the specific service or as otherwise permitted by law. In most cases, the shareholders will be clients of a third party, but the Portfolio may also provide a shareholder’s personal and account information to the shareholder’s respective brokerage or financial advisory firm.
Sharing Information with Third Parties
The Portfolio reserves the right to disclose or report personal information to non-affiliated third parties, in limited circumstances, where the Portfolio believes in good faith that disclosure is required under law to cooperate with regulators or law enforcement authorities, to protect its rights or property or upon reasonable request by the Portfolio in which a shareholder has chosen to invest. In addition, the Portfolio may disclose information about a shareholder’s accounts to a non-affiliated third party with the consent of the shareholder.
Sharing Information with Affiliates
The Portfolio may share shareholder information with its affiliates in connection with servicing its shareholders’ accounts, and subject to applicable law may provide shareholders with information about products and services that the Portfolio or its Adviser, principal underwriters or their affiliates (“Service Affiliates”) believe may be of interest to such shareholders. The information that the Portfolio shares may include, for example, a shareholder’s participation in the Portfolio or in other investment programs sponsored by a Service Affiliate, a shareholder’s ownership of certain types of accounts (such as IRAs), or other data about a shareholder’s accounts, subject to applicable law. The Portfolio’s Service Affiliates, in turn, are not permitted to share shareholder information with non-affiliated entities, except as required or permitted by law.
Procedures to Safeguard Private Information
The Portfolio takes seriously the obligation to safeguard shareholder non-public personal information. In addition to this policy, the Portfolio has also implemented procedures that are designed to restrict access to a shareholder’s non-public personal information only to internal personnel who need to know that information in order to provide products or services to such shareholders. In order to guard a shareholder’s non-public personal information, physical, electronic and procedural safeguards are in place.
| Annual Report | December 31, 2010 | 25 |
Table of Contents
The chart below identifies the Trustees and Officers of the Trust. The “interested” Trustee as defined by the 1940 Act, is indicated by an asterisk (*). Unless otherwise indicated, the address of all persons below is 840 Newport Center Drive, Newport Beach, CA 92660.
The Fund’s Statement of Additional Information includes more information about the Trustees and Officers. To request a free copy, call PIMCO at 1-800-927-4648 or visit the Fund’s website at http://pvit.pimco-funds.com.
Trustees of the Trust
Name, Year of Birth and Position Held with Trust | Term of Office** and Length of Time Served | Principal Occupation(s) During Past 5 Years | Number of Funds in Fund Complex Overseen by Trustee | Other Directorships Held by Trustee | ||||||
Interested Trustees | ||||||||||
Brent R. Harris* (1959) Chairman of the Board and Trustee | 03/2010 to present | Managing Director and member of Executive Committee, PIMCO. | 141 | Chairman and Trustee, PIMCO Funds, PIMCO Variable Insurance Trust, PIMCO ETF Trust, PIMCO Equity Series VIT; Director, StocksPLUS® Management, Inc.; and member of Board of Governors and Executive Committee, Investment Company Institute. Board Member and Owner, Harris Holdings, LLC (1992-present). Formerly Chairman and Director, PCM Fund, Inc. | ||||||
Independent Trustees | ||||||||||
E. Philip Cannon (1940) Trustee | 03/2010 to present | Proprietor, Cannon & Company (an investment firm). Formerly, President, Houston Zoo. | 141 | Trustee, PIMCO Equity Series VIT; Trustee, PIMCO ETF Trust; Trustee, PIMCO Funds; and Trustee, PIMCO Variable Insurance Trust. Formerly, Director, PCM Fund, Inc. | ||||||
Vern O. Curtis (1934) Trustee | 03/2010 to present | Private Investor. | 141 | Trustee, PIMCO Equity Series VIT; Trustee, PIMCO ETF Trust; Trustee, PIMCO Funds; and Trustee, PIMCO Variable Insurance Trust. Formerly, Director, PCM Fund, Inc. | ||||||
* Mr. Harris is an “interested person” of the Trust (as that term is defined in the 1940 Act) because of his affiliation with PIMCO.
** Trustees serve until their successors are duly elected and qualified.
| 26 | PIMCO Equity Series VIT |
Table of Contents
(Unaudited)
Executive Officers
| Name, Year of Birth and Position Held with Trust | Term of Office and Length of Time Served | Principal Occupation(s) During Past 5 Years | ||
Neel T. Kashkari (1973) President | 03/2010 to present | Managing Director, PIMCO. Formerly, Interim Assistant Secretary for Financial Stability, Assistant Secretary for International Economics and Senior Advisor to Secretary Paulson, United States Department of Treasury | ||
David C. Flattum (1964) Chief Legal Officer | 03/2010 to present | Managing Director and General Counsel, PIMCO. Formerly, Executive Vice President, PIMCO, Managing Director, Chief Operating Officer and General Counsel, Allianz Global Investors of America L.P. and Partner at Latham & Watkins LLP. | ||
Jennifer E. Durham (1970) Chief Compliance Officer | 03/2010 to present | Executive Vice President and Chief Compliance Officer, PIMCO. Formerly; Senior Vice President, PIMCO. Formerly, Vice President and Legal/Compliance Manager, PIMCO. | ||
William H. Gross (1944) Senior Vice President | 03/2010 to present | Managing Director and Co-Chief Investment Officer, PIMCO. | ||
Mohamed El-Erian (1958) Senior Vice President | 03/2010 to present | Managing Director, Co-Chief Investment Officer and Chief Executive Officer, PIMCO. Formerly, President and CEO of Harvard Management Company. Formerly, Managing Director, PIMCO. | ||
Brent R. Harris (1959) Senior Vice President | 03/2010 to present | Managing Director and member of Executive Committee, PIMCO | ||
Douglas M. Hodge (1957) Senior Vice President | 03/2010 to present | Managing Director; Chief Operating Officer (since 7/09); Member of Executive Committee and Head of PIMCO’s Asia Pacific region. Member Global Executive Committee, Allianz Global Investors. | ||
J. Stephen King, Jr. (1962) Vice President - Senior Counsel, Secretary | 03/2010 to present | Senior Vice President and Attorney, PIMCO. Formerly Vice President, PIMCO and Associate, Dechert LLP. | ||
Peter G. Strelow (1970) Vice President | 03/2010 to present | Executive Vice President, PIMCO. Formerly, Senior Vice President and Vice President, PIMCO. | ||
Henrik P. Larsen (1970) Vice President | 03/2010 to present | Senior Vice President, PIMCO. Formerly, Vice President, PIMCO. | ||
John P. Hardaway (1957) Treasurer | 03/2010 to present | Executive Vice President, PIMCO. Formerly, Senior Vice President, PIMCO. | ||
Audrey L. Cheng (1975) Assistant Secretary | 11/2010 to present | Vice President and Attorney, PIMCO. Formerly, Associate, Morrison & Foerster LLP. | ||
Stacie D. Anctil (1969) Assistant Treasurer | 03/2010 to present | Senior Vice President, PIMCO. Formerly, Vice President, PIMCO. Formerly, Specialist, PIMCO. | ||
Erik C. Brown (1967) Assistant Treasurer | 03/2010 to present | Senior Vice President, PIMCO. Formerly, Vice President, PIMCO. | ||
Trent W. Walker (1974) Assistant Treasurer | 03/2010 to present | Senior Vice President, PIMCO. Formerly, Vice President, PIMCO. Formerly, Senior Manager, PricewaterhouseCoopers LLP. | ||
| Annual Report | December 31, 2010 | 27 |
Table of Contents
General Information
Investment Adviser and Administrator
Pacific Investment Management Company LLC
840 Newport Center Drive
Newport Beach, CA 92660
Distributor
PIMCO Investments LLC
1345 Avenue of the Americas
New York, NY 10105
Custodian
State Street Bank and Trust Company
801 Pennsylvania
Kansas City, MO 64105
Transfer Agent
Boston Financial Data Services, Inc.
P.O. Box 8050
Boston, MA 02266-8050
Legal Counsel
Dechert LLP
1775 I Street, N.W.
Washington, D.C. 20006
Independent Registered Public Accounting Firm
PricewaterhouseCoopers LLP
1100 Walnut Street
Kansas City, MO 64106
This report is submitted for the general information of the shareholders of the PIMCO Equity Series VIT.
Table of Contents
PIMCO
PESVITA01_123110
Table of Contents
Item 2. | Code of Ethics. | |||||||
As of the end of the period covered by this report, the Registrant has adopted a code of ethics (the “Code”) that applies to the Registrant’s principal executive officer and principal financial officer. During the period, the Code was amended to clarify certain defined terms, address the role of the Registrant’s Chief Compliance Officer and provide for the public disclosure of any amendments or waivers. The Registrant did not grant any waivers, including implicit waivers, from any provisions of the Code to the principal executive officer or principal financial officer during the period covered by this report.
A copy of the Code is included as an exhibit to this report. | ||||||||
Item 3. | Audit Committee Financial Expert. | |||||||
| (a) | The Board of Trustees has determined that Vern O. Curtis, who serves on the Board’s audit committee, qualifies as an “audit committee financial expert” as such term is defined in the instructions to this Item 3. The Board has also determined that Mr. Curtis is “independent” as such term is interpreted under this Item 3. | |||||
Item 4. | Principal Accountant Fees and Services. | |||||||
| (a) | Fiscal Year Ended(1) | Audit Fees | ||||||||
| December 31, 2010 | $ | 24,561 | ||||||||
| December 31, 2009 | N/A | |||||||||
| (b) | Fiscal Year Ended(1) | Audit-Related Fees | ||||||||
| December 31, 2010 | $ | 0 | ||||||||
| December 31, 2009 | N/A | |||||||||
| (c) | Fiscal Year Ended(1) | Tax Fees | ||||||||
| December 31, 2010 | $ | 0 | ||||||||
| December 31, 2009 | N/A | |||||||||
| (d) | Fiscal Year Ended(1) | All Other Fees | ||||||||
| December 31, 2010 | $ | 0 | ||||||||
| December 31, 2009 | N/A | |||||||||
| “Audit Fees” represents aggregate fees billed for each of the last two fiscal years for professional services rendered for the audit of the PIMCO Equity Series VIT (the “Trust” or “Registrant”) annual financial statements for those fiscal years or services that are normally provided by the accountant in connection with statutory or regulatory filings or engagements for those fiscal years. | ||||||||||
| “Audit-Related Fees” represents aggregate fees billed for each of the last two fiscal years for assurance and related services reasonably related to the performance of the audit of the Trust’s annual financial statements for those years. | ||||||||||
| “Tax Fees” represents aggregate fees billed for each of the last two fiscal years for professional services related to tax compliance, tax advice and tax planning, including review of federal and state income tax returns, review of excise tax distribution requirements and preparation of excise tax returns. | ||||||||||
| “All Other Fees” represents aggregate fees, if any, billed for other products and services rendered by the principal accountant to the Trust for the last two fiscal years. | ||||||||||
| ||||||||||
(1) The Trust was established on December 28, 2009. | ||||||||||
(e) | Pre-approval policies and procedures | |||||||||
(1) The Registrant’s Audit Committee has adopted pre-approval policies and procedures (the “Procedures”) to govern the Audit Committee’s pre-approval of (i) all audit services and permissible non-audit services to be provided to the Registrant by its independent accountant, and (ii) all permissible non-audit services to be provided by such independent accountant to the Registrant’s investment adviser and to any entity controlling, controlled by, or under common control with the investment adviser that provides ongoing services to the Registrant (collectively, the “Service Affiliates”) if the services provided directly relate to the Registrant’s operations and financial reporting. In accordance with the Procedures, the Audit Committee is responsible for the engagement of the independent accountant to certify the Registrant’s financial statements for each fiscal year. With respect to the pre-approval of non-audit services provided to the Registrant and its Service Affiliates, the Procedures provide that the Audit Committee may annually pre-approve a list of types or categories of non-audit services that may be provided to the Registrant or its Service Affiliates, or the Audit Committee may pre-approve such services on a project-by-project basis as they arise. Unless a type of service has received general pre-approval, it will require specific pre-approval by the Audit Committee if it is to be provided by the independent accountant. The Procedures also permit the Audit Committee to delegate authority to one or more of its members to pre-approve any proposed non-audit services that have not been previously pre-approved by the Committee, subject to the ratification by the full Audit Committee no later than its next scheduled meeting. | ||||||||||
(2) With respect to the services described in paragraphs (b) through (d) of this Item 4, no amount was approved by the Audit Committee pursuant to paragraph (c)(7)(i)(C) of Rule 2-01 of Regulation S-X. | ||||||||||
(f) | Not applicable. | |||||||||
(g) | ||||||||||
| Aggregate Non-Audit Fees Billed to Entity | ||||||||||||
Entity | December 31, 2010 | December 31, 2009 | ||||||||||
| PIMCO Equity Series VIT | $ | 0 | N/A | |||||||||
Pacific Investment Management Company LLC (“PIMCO”) | $ | 2,243,263 | $ | 1,266,510 | ||||||||
| Allianz Global Investors Fund Management LLC | $ | 851,470 | $ | 794,570 | ||||||||
| Allianz Global Investors of America L.P. | $ | 2,945,767 | $ | 2,075,360 | ||||||||
| Totals | $ | 6,040,500 | $ | 4,136,440 | ||||||||
(h) | The Registrant’s Audit Committee has considered whether the provision of non-audit services that were rendered to the Registrant’s investment adviser, and any entity controlling, controlled by, or under common control with the investment adviser that provides ongoing services to the Registrant which were not pre-approved (not requiring pre-approval) is compatible with maintaining the principal accountant’s independence. | |||||||
Item 5. | Audit Committee of Listed Registrants. | |||||||
The Registrant has a separately-designated standing audit committee established in accordance with Section 3(a)(58)(A) of the Securities Exchange Act of 1934, as amended. The audit committee is comprised of:
E. Philip Cannon; Vern O. Curtis | ||||||||
Item 6. | Schedule of Investments. | |||||||
| The Schedule of Investments is included as part of the report to shareholders under Item 1. | ||||||||
Table of Contents
Item 7. | Disclosure of Proxy Voting Policies and Procedures for Closed-End Management Investment Companies. | |||||
| Not applicable. | ||||||
Item 8. | Portfolio Managers of Closed-End Management Investment Companies | |||||
| Not applicable. | ||||||
Item 9. | Purchases of Equity Securities by Closed-End Management Investment Company and Affiliated Purchases. | |||||
| Not applicable. | ||||||
Item 10. | Submission of Matters to a Vote of Security Holders. | |||||
| Not applicable. | ||||||
Item 11. | Controls and Procedures. | |||||
| (a) | The principal executive officer and principal financial officer have concluded that the Registrant’s disclosure controls and procedures (as defined in Rule 30a-3(c) under the Investment Company Act of 1940, as amended) provide reasonable assurances that material information relating to the Trust is made known to them by the appropriate persons, based on their evaluation of these controls and procedures as of a date within 90 days of the filing of this report. | |||||
| (b) | There were no changes in the Registrant’s internal control over financial reporting (as defined in Rule 30a-3(d) under the 1940 Act) that occurred during the second fiscal quarter of the period covered by this report that have materially affected, or are reasonably likely to materially affect, the Registrant’s internal control over financial reporting. | |||||
Item 12. | Exhibits. | |||||
(a)(1) | Exhibit 99.CODE—Code of Ethics to Section 406 of the Sarbanes-Oxley Act of 2002. | |||||
(a)(2) | Exhibit 99.CERT—Certifications pursuant to Section 302 of the Sarbanes-Oxley Act of 2002. | |||||
(b) | Exhibit 99.906CERT—Certifications pursuant to Section 906 of the Sarbanes-Oxley Act of 2002. | |||||
Table of Contents
Signatures
Pursuant to the requirements of the Securities Exchange Act of 1934 and the Investment Company Act of 1940, the registrant has duly caused this report to be signed on its behalf by the undersigned, thereunto duly authorized.
| PIMCO Equity Series VIT | ||
| By: | /s/ NEEL T. KASHKARI | |
| Neel T. Kashkari | ||
| President, Principal Executive Officer | ||
| Date: March 2, 2011 | ||
Pursuant to the requirements of the Securities Exchange Act of 1934 and the Investment Company Act of 1940, this report has been signed below by the following persons on behalf of the registrant and in the capacities and on the dates indicated.
| By: | /s/ NEEL T. KASHKARI | |
| Neel T. Kashkari | ||
| President, Principal Executive Officer | ||
| Date: March 2, 2011 | ||
| By: | /s/ JOHN P. HARDAWAY | |
| John P. Hardaway | ||
| Treasurer, Principal Financial Officer | ||
| Date: March 2, 2011 | ||