UNITED STATES
SECURITIES AND EXCHANGE COMMISSION
Washington, D.C. 20549
FORM N-CSR
CERTIFIED SHAREHOLDER REPORT OF REGISTERED MANAGEMENT
INVESTMENT COMPANIES
Investment Company Act file number: 811-22376
PIMCO Equity Series VIT
(Exact name of registrant as specified in charter)
650 Newport Center Drive, Newport Beach, CA 92660
(Address of principal executive office)
Bijal Y. Parikh
Treasurer (Principal Financial & Accounting Officer)
PIMCO Equity Series VIT
650 Newport Center Drive
Newport Beach, CA 92660
(Name and address of agent for service)
Copies to:
Adam T. Teufel
Dechert LLP
1900 K Street, N.W.
Washington, D.C. 20006
Registrant’s telephone number, including area code: (888) 877-4626
Date of fiscal year end: December 31
Date of reporting period: June 30, 2024
Form N-CSR is to be used by management investment companies to file reports with the Commission not later than 10 days after the transmission to stockholders of any report that is required to be transmitted to stockholders under Rule 30e-1 under the Investment Company Act of 1940 (17 CFR 270.30e-1). The Commission may use the information provided on Form N-CSR in its regulatory, disclosure review, inspection, and policymaking roles.
A registrant is required to disclose the information specified by Form N-CSR, and the Commission will make this information public. A registrant is not required to respond to the collection of information contained in Form N-CSR unless the Form displays a currently valid Office of Management and Budget (“OMB”) control number. Please direct comments concerning the accuracy of the information collection burden estimate and any suggestions for reducing the burden to Secretary, Securities and Exchange Commission, 100 F Street, NE, Washington, DC 20549-1090. The OMB has reviewed this collection of information under the clearance requirements of 44 U.S.C. § 3507.
| Item 1. | Reports to Stockholders. |
| | (a) | The following is a copy of the reports transmitted to shareholders pursuant to Rule 30e-1 under the Investment Company Act of 1940, as amended (the “Act”) (17 CFR 270.30e-1). |
| | ● | | PIMCO StocksPLUS® Global Portfolio Advisor Class |
| | ● | | PIMCO StocksPLUS® Global Portfolio Institutional Class |
| | (b) | Not applicable to the Registrant. |
PIMCO StocksPLUS® Global Portfolio
Semi-Annual Shareholder Report | June 30, 2024
This semi-annual shareholder report contains important information about the PIMCO StocksPLUS® Global Portfolio (the "Portfolio") for the period of January 1, 2024 to June 30, 2024 (the "reporting period"). You can find additional information about the Portfolio at www.pimco.com/pvit. You can also request this information by contacting us at 888.87.PIMCO (888.877.4626).
What were the Portfolio costs for the last six months?
(based on a hypothetical $10,000 investment)
| Class Name | Cost of a $10,000 investment | Costs paid as a percentage of a $10,000 investment |
|---|
| Advisor Class | $51 | 0.97% |
How did the Portfolio perform during the reporting period and what affected its performance?
The following affected performance (on a gross basis) during the reporting period:
• The Portfolio's exposure to equity index derivatives linked to the MSCI World Index contributed to absolute returns, as the MSCI World
Net Total Return Index returned 11.75%.
• The Portfolio's bond alpha strategy contributed to returns. Highlights about the drivers of performance include the following:
• Long exposure to investment grade corporate credit contributed to returns, as spreads tightened.
• Holdings of collateralized loan obligations contributed to returns, as spreads tightened.
• Long exposure to U.S. interest rates detracted from returns, as interest rates increased.
• There were no other material detractors for the Portfolio.
In addition to the Portfolio's performance, the tables in this section include performance of: (i) a broad-based securities market index (i.e., a regulatory index) and (ii) one or more supplemental index(es). Effective July 24, 2024, the Portfolio's regulatory index is the MSCI World Index. The Portfolio's regulatory index is shown in connection with certain regulatory requirements to provide a broad measure of market performance.
The table below illustrates cumulative returns for the 10-year period ended June 30, 2024 or the life of the Portfolio, if shorter. Cumulative returns are based on a hypothetical initial investment equal to the greater of either $10,000 or the investment minimum applicable to the share class.
Cumulative Returns Based on $10,000 Investment
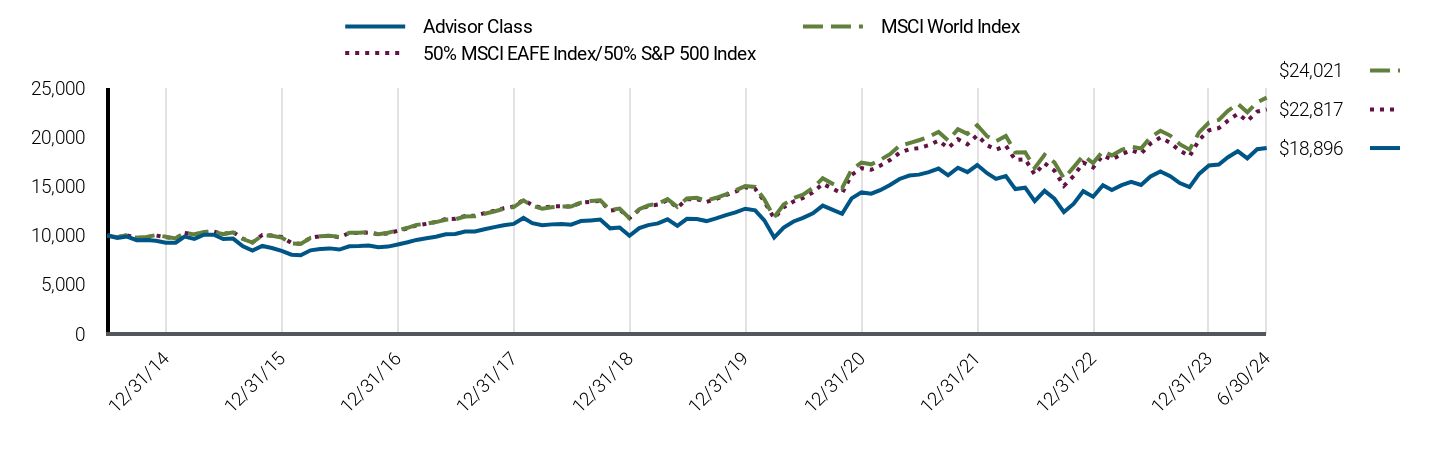
| Advisor Class | MSCI World Index | 50% MSCI EAFE Index/50% S&P 500 Index |
|---|
| 6/30/14 | $10,000 | $10,000 | $10,000 |
| 7/31/14 | $9,757 | $9,840 | $9,833 |
| 8/31/14 | $9,897 | $10,057 | $10,022 |
| 9/30/14 | $9,529 | $9,784 | $9,759 |
| 10/31/14 | $9,536 | $9,848 | $9,807 |
| 11/30/14 | $9,470 | $10,045 | $10,006 |
| 12/31/14 | $9,273 | $9,883 | $9,820 |
| 1/31/15 | $9,273 | $9,704 | $9,697 |
| 2/28/15 | $9,887 | $10,272 | $10,265 |
| 3/31/15 | $9,647 | $10,112 | $10,106 |
| 4/30/15 | $10,089 | $10,349 | $10,361 |
| 5/31/15 | $10,089 | $10,384 | $10,401 |
| 6/30/15 | $9,640 | $10,143 | $10,153 |
| 7/31/15 | $9,692 | $10,325 | $10,365 |
| 8/31/15 | $8,912 | $9,642 | $9,671 |
| 9/30/15 | $8,473 | $9,286 | $9,306 |
| 10/31/15 | $8,942 | $10,022 | $10,062 |
| 11/30/15 | $8,735 | $9,972 | $9,999 |
| 12/31/15 | $8,438 | $9,797 | $9,852 |
| 1/31/16 | $8,055 | $9,211 | $9,252 |
| 2/29/16 | $7,995 | $9,142 | $9,161 |
| 3/31/16 | $8,498 | $9,763 | $9,769 |
| 4/30/16 | $8,630 | $9,917 | $9,930 |
| 5/31/16 | $8,695 | $9,973 | $9,974 |
| 6/30/16 | $8,575 | $9,861 | $9,819 |
| 7/31/16 | $8,906 | $10,278 | $10,249 |
| 8/31/16 | $8,933 | $10,286 | $10,260 |
| 9/30/16 | $8,987 | $10,341 | $10,324 |
| 10/31/16 | $8,801 | $10,141 | $10,124 |
| 11/30/16 | $8,876 | $10,287 | $10,211 |
| 12/31/16 | $9,091 | $10,533 | $10,486 |
| 1/31/17 | $9,318 | $10,787 | $10,738 |
| 2/28/17 | $9,556 | $11,086 | $11,028 |
| 3/31/17 | $9,719 | $11,204 | $11,186 |
| 4/30/17 | $9,880 | $11,370 | $11,386 |
| 5/31/17 | $10,121 | $11,611 | $11,675 |
| 6/30/17 | $10,163 | $11,655 | $11,701 |
| 7/31/17 | $10,406 | $11,934 | $11,990 |
| 8/31/17 | $10,418 | $11,951 | $12,006 |
| 9/30/17 | $10,641 | $12,219 | $12,279 |
| 10/31/17 | $10,852 | $12,450 | $12,516 |
| 11/30/17 | $11,052 | $12,720 | $12,774 |
| 12/31/17 | $11,181 | $12,892 | $12,947 |
| 1/31/18 | $11,791 | $13,573 | $13,642 |
| 2/28/18 | $11,263 | $13,010 | $13,083 |
| 3/31/18 | $11,042 | $12,727 | $12,799 |
| 4/30/18 | $11,136 | $12,873 | $12,970 |
| 5/31/18 | $11,171 | $12,954 | $12,980 |
| 6/30/18 | $11,104 | $12,948 | $12,941 |
| 7/31/18 | $11,469 | $13,352 | $13,341 |
| 8/31/18 | $11,540 | $13,517 | $13,429 |
| 9/30/18 | $11,628 | $13,592 | $13,526 |
| 10/31/18 | $10,731 | $12,594 | $12,525 |
| 11/30/18 | $10,813 | $12,737 | $12,645 |
| 12/31/18 | $9,980 | $11,769 | $11,767 |
| 1/31/19 | $10,762 | $12,685 | $12,625 |
| 2/28/19 | $11,060 | $13,066 | $12,989 |
| 3/31/19 | $11,238 | $13,238 | $13,156 |
| 4/30/19 | $11,651 | $13,707 | $13,607 |
| 5/31/19 | $10,981 | $12,916 | $12,848 |
| 6/30/19 | $11,701 | $13,767 | $13,682 |
| 7/31/19 | $11,687 | $13,835 | $13,694 |
| 8/31/19 | $11,472 | $13,552 | $13,408 |
| 9/30/19 | $11,741 | $13,841 | $13,725 |
| 10/31/19 | $12,071 | $14,193 | $14,121 |
| 11/30/19 | $12,359 | $14,588 | $14,456 |
| 12/31/19 | $12,727 | $15,025 | $14,909 |
| 1/31/20 | $12,568 | $14,934 | $14,751 |
| 2/29/20 | $11,544 | $13,672 | $13,477 |
| 3/31/20 | $9,797 | $11,862 | $11,745 |
| 4/30/20 | $10,811 | $13,158 | $12,878 |
| 5/31/20 | $11,434 | $13,794 | $13,465 |
| 6/30/20 | $11,798 | $14,159 | $13,828 |
| 7/31/20 | $12,268 | $14,836 | $14,379 |
| 8/31/20 | $13,045 | $15,827 | $15,265 |
| 9/30/20 | $12,640 | $15,281 | $14,777 |
| 10/31/20 | $12,218 | $14,813 | $14,285 |
| 11/30/20 | $13,777 | $16,706 | $16,174 |
| 12/31/20 | $14,386 | $17,415 | $16,861 |
| 1/31/21 | $14,256 | $17,242 | $16,686 |
| 2/28/21 | $14,613 | $17,683 | $17,104 |
| 3/31/21 | $15,136 | $18,272 | $17,675 |
| 4/30/21 | $15,754 | $19,122 | $18,412 |
| 5/31/21 | $16,096 | $19,398 | $18,777 |
| 6/30/21 | $16,194 | $19,687 | $18,890 |
| 7/31/21 | $16,446 | $20,039 | $19,186 |
| 8/31/21 | $16,806 | $20,538 | $19,647 |
| 9/30/21 | $16,123 | $19,685 | $18,905 |
| 10/31/21 | $16,897 | $20,800 | $19,799 |
| 11/30/21 | $16,447 | $20,345 | $19,270 |
| 12/31/21 | $17,167 | $21,214 | $20,195 |
| 1/31/22 | $16,339 | $20,092 | $19,185 |
| 2/28/22 | $15,763 | $19,584 | $18,728 |
| 3/31/22 | $16,041 | $20,121 | $19,136 |
| 4/30/22 | $14,725 | $18,450 | $17,682 |
| 5/31/22 | $14,869 | $18,463 | $17,765 |
| 6/30/22 | $13,505 | $16,864 | $16,208 |
| 7/31/22 | $14,546 | $18,203 | $17,359 |
| 8/31/22 | $13,742 | $17,442 | $16,592 |
| 9/30/22 | $12,379 | $15,821 | $15,052 |
| 10/31/22 | $13,233 | $16,957 | $16,066 |
| 11/30/22 | $14,514 | $18,136 | $17,420 |
| 12/31/22 | $13,942 | $17,366 | $16,925 |
| 1/31/23 | $15,112 | $18,594 | $18,142 |
| 2/28/23 | $14,634 | $18,147 | $17,732 |
| 3/31/23 | $15,125 | $18,708 | $18,277 |
| 4/30/23 | $15,461 | $19,036 | $18,678 |
| 5/31/23 | $15,149 | $18,846 | $18,323 |
| 6/30/23 | $16,013 | $19,986 | $19,345 |
| 7/31/23 | $16,517 | $20,657 | $19,969 |
| 8/31/23 | $16,037 | $20,164 | $19,427 |
| 9/30/23 | $15,341 | $19,294 | $18,632 |
| 10/31/23 | $14,929 | $18,734 | $18,059 |
| 11/30/23 | $16,264 | $20,490 | $19,722 |
| 12/31/23 | $17,126 | $21,496 | $20,693 |
| 1/31/24 | $17,225 | $21,754 | $20,927 |
| 2/29/24 | $17,961 | $22,677 | $21,677 |
| 3/31/24 | $18,572 | $23,405 | $22,382 |
| 4/30/24 | $17,849 | $22,536 | $21,639 |
| 5/31/24 | $18,772 | $23,542 | $22,594 |
| 6/30/24 | $18,896 | $24,021 | $22,817 |
The table below shows the average annual total returns of the Portfolio, a regulatory index, and one or more supplemental index(es) for certain periods ended June 30, 2024.
Average Annual Total Returns (%)
| Class/Index Name | 1 Year | 5 Years | 10 Years |
|---|
| Advisor Class | 18.00% | 10.06% | 6.57% |
| MSCI World Index | 20.19% | 11.78% | 9.16% |
| 50% MSCI EAFE Index/50% S&P 500 Index | 17.95% | 10.77% | 8.60% |
All Portfolio returns are net of fees and expenses and include applicable fee waivers and/or expense limitations. Absent any applicable fee waivers and/or expense limitations, performance would have been lower and there can be no assurance that any such waivers or limitations will continue in the future.
Performance quoted represents past performance. Past performance is not a guarantee or a reliable indicator of future results.Current performance may be lower or higher than performance shown. Investment return and the principal value of an investment will fluctuate. Shares may be worth more or less than original cost when redeemed. Returns shown do not reflect the deduction of taxes that a shareholder would pay on Portfolio distributions or the redemption of Portfolio shares.Differences in the Portfolio’s performance versus an index and related attribution information with respect to particular categories of securities or individual positions may be attributable, in part, to differences in the pricing methodologies used by the Portfolio and the index. For performance current to the most recent month-end, visit www.pimco.com/pvit or via 888.87.PIMCO (888.877.4626).
Key Fund StatisticsFootnote Reference* (as of the end of the reporting period)
| Total Net Assets | $187,431 |
| # of Portfolio Holdings | 433 |
| Portfolio Turnover Rate | 37% |
| Total Net Advisory Fees Paid During the Reporting Period | $278 |
| Footnote | Description |
Footnote* | Dollar amounts displayed in 000's |
What did the Portfolio invest in?
Geographic Breakdown (% of Net Assets)Footnote Reference*
| United States | 73.5% |
| Japan | 10.9% |
| Cayman Islands | 7.8% |
| United Kingdom | 1.1% |
| Canada | 0.9% |
| Ireland | 0.8% |
| Switzerland | 0.7% |
| Denmark | 0.7% |
| Netherlands | 0.5% |
| Jersey, Channel Islands | 0.5% |
| Brazil | 0.4% |
| Germany | 0.1% |
| Other Investments | 2.8% |
| Other Assets and Liabilities, Net | (0.7%) |
| Total | 100.0% |
| Footnote | Description |
Footnote* | % of Net Assets includes derivatives instruments, if any,valued at the value used for determining the Portfolio's net asset value. The notional exposure of such derivatives investments therefore may be greater than what is depicted. |
For additional information about the Portfolio, including the Portfolio's prospectus, financial information, holdings and proxy voting information, please visit www.pimco.com/pvit or contact 888.87.PIMCO (888.877.4626). For tax information about the Portfolio, please visit: https://www.pimco.com/tax.
PIMCO StocksPLUS® Global Portfolio
Semi-Annual Shareholder Report |
June 30, 2024
PIMCO StocksPLUS® Global Portfolio
Semi-Annual Shareholder Report | June 30, 2024
This semi-annual shareholder report contains important information about the PIMCO StocksPLUS® Global Portfolio (the "Portfolio") for the period of January 1, 2024 to June 30, 2024 (the "reporting period"). You can find additional information about the Portfolio at www.pimco.com/pvit. You can also request this information by contacting us at 888.87.PIMCO (888.877.4626).
What were the Portfolio costs for the last six months?
(based on a hypothetical $10,000 investment)
| Class Name | Cost of a $10,000 investment | Costs paid as a percentage of a $10,000 investment |
|---|
| Institutional Class | $38 | 0.72% |
How did the Portfolio perform during the reporting period and what affected its performance?
The following affected performance (on a gross basis) during the reporting period:
• The Portfolio's exposure to equity index derivatives linked to the MSCI World Index contributed to absolute returns, as the MSCI World
Net Total Return Index returned 11.75%.
• The Portfolio's bond alpha strategy contributed to returns. Highlights about the drivers of performance include the following:
• Long exposure to investment grade corporate credit contributed to returns, as spreads tightened.
• Holdings of collateralized loan obligations contributed to returns, as spreads tightened.
• Long exposure to U.S. interest rates detracted from returns, as interest rates increased.
• There were no other material detractors for the Portfolio.
In addition to the Portfolio's performance, the tables in this section include performance of: (i) a broad-based securities market index (i.e., a regulatory index) and (ii) one or more supplemental index(es). Effective July 24, 2024, the Portfolio's regulatory index is the MSCI World Index. The Portfolio's regulatory index is shown in connection with certain regulatory requirements to provide a broad measure of market performance.
The table below illustrates cumulative returns for the 10-year period ended June 30, 2024 or the life of the Portfolio, if shorter. Cumulative returns are based on a hypothetical initial investment equal to the greater of either $10,000 or the investment minimum applicable to the share class.
Cumulative Returns Based on $10,000 Investment

| Institutional Class | MSCI World Index | 50% MSCI EAFE Index/50% S&P 500 Index |
|---|
| 6/30/14 | $10,000 | $10,000 | $10,000 |
| 7/31/14 | $9,758 | $9,840 | $9,833 |
| 8/31/14 | $9,897 | $10,057 | $10,022 |
| 9/30/14 | $9,531 | $9,784 | $9,759 |
| 10/31/14 | $9,546 | $9,848 | $9,807 |
| 11/30/14 | $9,480 | $10,045 | $10,006 |
| 12/31/14 | $9,277 | $9,883 | $9,820 |
| 1/31/15 | $9,284 | $9,704 | $9,697 |
| 2/28/15 | $9,902 | $10,272 | $10,265 |
| 3/31/15 | $9,664 | $10,112 | $10,106 |
| 4/30/15 | $10,103 | $10,349 | $10,361 |
| 5/31/15 | $10,111 | $10,384 | $10,401 |
| 6/30/15 | $9,656 | $10,143 | $10,153 |
| 7/31/15 | $9,716 | $10,325 | $10,365 |
| 8/31/15 | $8,941 | $9,642 | $9,671 |
| 9/30/15 | $8,501 | $9,286 | $9,306 |
| 10/31/15 | $8,969 | $10,022 | $10,062 |
| 11/30/15 | $8,773 | $9,972 | $9,999 |
| 12/31/15 | $8,465 | $9,797 | $9,852 |
| 1/31/16 | $8,095 | $9,211 | $9,252 |
| 2/29/16 | $8,028 | $9,142 | $9,161 |
| 3/31/16 | $8,534 | $9,763 | $9,769 |
| 4/30/16 | $8,659 | $9,917 | $9,930 |
| 5/31/16 | $8,734 | $9,973 | $9,974 |
| 6/30/16 | $8,617 | $9,861 | $9,819 |
| 7/31/16 | $8,945 | $10,278 | $10,249 |
| 8/31/16 | $8,973 | $10,286 | $10,260 |
| 9/30/16 | $9,033 | $10,341 | $10,324 |
| 10/31/16 | $8,847 | $10,141 | $10,124 |
| 11/30/16 | $8,931 | $10,287 | $10,211 |
| 12/31/16 | $9,142 | $10,533 | $10,486 |
| 1/31/17 | $9,379 | $10,787 | $10,738 |
| 2/28/17 | $9,627 | $11,086 | $11,028 |
| 3/31/17 | $9,783 | $11,204 | $11,186 |
| 4/30/17 | $9,954 | $11,370 | $11,386 |
| 5/31/17 | $10,194 | $11,611 | $11,675 |
| 6/30/17 | $10,242 | $11,655 | $11,701 |
| 7/31/17 | $10,496 | $11,934 | $11,990 |
| 8/31/17 | $10,496 | $11,951 | $12,006 |
| 9/30/17 | $10,726 | $12,219 | $12,279 |
| 10/31/17 | $10,948 | $12,450 | $12,516 |
| 11/30/17 | $11,147 | $12,720 | $12,774 |
| 12/31/17 | $11,287 | $12,892 | $12,947 |
| 1/31/18 | $11,895 | $13,573 | $13,642 |
| 2/28/18 | $11,369 | $13,010 | $13,083 |
| 3/31/18 | $11,154 | $12,727 | $12,799 |
| 4/30/18 | $11,248 | $12,873 | $12,970 |
| 5/31/18 | $11,283 | $12,954 | $12,980 |
| 6/30/18 | $11,223 | $12,948 | $12,941 |
| 7/31/18 | $11,587 | $13,352 | $13,341 |
| 8/31/18 | $11,658 | $13,517 | $13,429 |
| 9/30/18 | $11,753 | $13,592 | $13,526 |
| 10/31/18 | $10,845 | $12,594 | $12,525 |
| 11/30/18 | $10,940 | $12,737 | $12,645 |
| 12/31/18 | $10,090 | $11,769 | $11,767 |
| 1/31/19 | $10,884 | $12,685 | $12,625 |
| 2/28/19 | $11,196 | $13,066 | $12,989 |
| 3/31/19 | $11,377 | $13,238 | $13,156 |
| 4/30/19 | $11,789 | $13,707 | $13,607 |
| 5/31/19 | $11,122 | $12,916 | $12,848 |
| 6/30/19 | $11,861 | $13,767 | $13,682 |
| 7/31/19 | $11,832 | $13,835 | $13,694 |
| 8/31/19 | $11,618 | $13,552 | $13,408 |
| 9/30/19 | $11,908 | $13,841 | $13,725 |
| 10/31/19 | $12,238 | $14,193 | $14,121 |
| 11/30/19 | $12,525 | $14,588 | $14,456 |
| 12/31/19 | $12,902 | $15,025 | $14,909 |
| 1/31/20 | $12,743 | $14,934 | $14,751 |
| 2/29/20 | $11,720 | $13,672 | $13,477 |
| 3/31/20 | $9,952 | $11,862 | $11,745 |
| 4/30/20 | $10,981 | $13,158 | $12,878 |
| 5/31/20 | $11,603 | $13,794 | $13,465 |
| 6/30/20 | $11,972 | $14,159 | $13,828 |
| 7/31/20 | $12,458 | $14,836 | $14,379 |
| 8/31/20 | $13,251 | $15,827 | $15,265 |
| 9/30/20 | $12,837 | $15,281 | $14,777 |
| 10/31/20 | $12,415 | $14,813 | $14,285 |
| 11/30/20 | $14,006 | $16,706 | $16,174 |
| 12/31/20 | $14,640 | $17,415 | $16,861 |
| 1/31/21 | $14,494 | $17,242 | $16,686 |
| 2/28/21 | $14,851 | $17,683 | $17,104 |
| 3/31/21 | $15,396 | $18,272 | $17,675 |
| 4/30/21 | $16,030 | $19,122 | $18,412 |
| 5/31/21 | $16,388 | $19,398 | $18,777 |
| 6/30/21 | $16,478 | $19,687 | $18,890 |
| 7/31/21 | $16,747 | $20,039 | $19,186 |
| 8/31/21 | $17,107 | $20,538 | $19,647 |
| 9/30/21 | $16,418 | $19,685 | $18,905 |
| 10/31/21 | $17,227 | $20,800 | $19,799 |
| 11/30/21 | $16,759 | $20,345 | $19,270 |
| 12/31/21 | $17,497 | $21,214 | $20,195 |
| 1/31/22 | $16,651 | $20,092 | $19,185 |
| 2/28/22 | $16,076 | $19,584 | $18,728 |
| 3/31/22 | $16,360 | $20,121 | $19,136 |
| 4/30/22 | $15,009 | $18,450 | $17,682 |
| 5/31/22 | $15,171 | $18,463 | $17,765 |
| 6/30/22 | $13,780 | $16,864 | $16,208 |
| 7/31/22 | $14,839 | $18,203 | $17,359 |
| 8/31/22 | $14,039 | $17,442 | $16,592 |
| 9/30/22 | $12,645 | $15,821 | $15,052 |
| 10/31/22 | $13,518 | $16,957 | $16,066 |
| 11/30/22 | $14,816 | $18,136 | $17,420 |
| 12/31/22 | $14,257 | $17,366 | $16,925 |
| 1/31/23 | $15,445 | $18,594 | $18,142 |
| 2/28/23 | $14,970 | $18,147 | $17,732 |
| 3/31/23 | $15,441 | $18,708 | $18,277 |
| 4/30/23 | $15,800 | $19,036 | $18,678 |
| 5/31/23 | $15,513 | $18,846 | $18,323 |
| 6/30/23 | $16,373 | $19,986 | $19,345 |
| 7/31/23 | $16,899 | $20,657 | $19,969 |
| 8/31/23 | $16,421 | $20,164 | $19,427 |
| 9/30/23 | $15,700 | $19,294 | $18,632 |
| 10/31/23 | $15,288 | $18,734 | $18,059 |
| 11/30/23 | $16,667 | $20,490 | $19,722 |
| 12/31/23 | $17,539 | $21,496 | $20,693 |
| 1/31/24 | $17,662 | $21,754 | $20,927 |
| 2/29/24 | $18,395 | $22,677 | $21,677 |
| 3/31/24 | $19,038 | $23,405 | $22,382 |
| 4/30/24 | $18,317 | $22,536 | $21,639 |
| 5/31/24 | $19,237 | $23,542 | $22,594 |
| 6/30/24 | $19,398 | $24,021 | $22,817 |
The table below shows the average annual total returns of the Portfolio, a regulatory index, and one or more supplemental index(es) for certain periods ended June 30, 2024.
Average Annual Total Returns (%)
| Class/Index Name | 1 Year | 5 Years | 10 Years |
|---|
| Institutional Class | 18.47% | 10.34% | 6.85% |
| MSCI World Index | 20.19% | 11.78% | 9.16% |
| 50% MSCI EAFE Index/50% S&P 500 Index | 17.95% | 10.77% | 8.60% |
All Portfolio returns are net of fees and expenses and include applicable fee waivers and/or expense limitations. Absent any applicable fee waivers and/or expense limitations, performance would have been lower and there can be no assurance that any such waivers or limitations will continue in the future.
Performance quoted represents past performance. Past performance is not a guarantee or a reliable indicator of future results.Current performance may be lower or higher than performance shown. Investment return and the principal value of an investment will fluctuate. Shares may be worth more or less than original cost when redeemed. Returns shown do not reflect the deduction of taxes that a shareholder would pay on Portfolio distributions or the redemption of Portfolio shares.Differences in the Portfolio’s performance versus an index and related attribution information with respect to particular categories of securities or individual positions may be attributable, in part, to differences in the pricing methodologies used by the Portfolio and the index. For performance current to the most recent month-end, visit www.pimco.com/pvit or via 888.87.PIMCO (888.877.4626).
Key Fund StatisticsFootnote Reference* (as of the end of the reporting period)
| Total Net Assets | $187,431 |
| # of Portfolio Holdings | 433 |
| Portfolio Turnover Rate | 37% |
| Total Net Advisory Fees Paid During the Reporting Period | $278 |
| Footnote | Description |
Footnote* | Dollar amounts displayed in 000's |
What did the Portfolio invest in?
Geographic Breakdown (% of Net Assets)Footnote Reference*
| United States | 73.5% |
| Japan | 10.9% |
| Cayman Islands | 7.8% |
| United Kingdom | 1.1% |
| Canada | 0.9% |
| Ireland | 0.8% |
| Switzerland | 0.7% |
| Denmark | 0.7% |
| Netherlands | 0.5% |
| Jersey, Channel Islands | 0.5% |
| Brazil | 0.4% |
| Germany | 0.1% |
| Other Investments | 2.8% |
| Other Assets and Liabilities, Net | (0.7%) |
| Total | 100.0% |
| Footnote | Description |
Footnote* | % of Net Assets includes derivatives instruments, if any,valued at the value used for determining the Portfolio's net asset value. The notional exposure of such derivatives investments therefore may be greater than what is depicted. |
For additional information about the Portfolio, including the Portfolio's prospectus, financial information, holdings and proxy voting information, please visit www.pimco.com/pvit or contact 888.87.PIMCO (888.877.4626). For tax information about the Portfolio, please visit: https://www.pimco.com/tax.
PIMCO StocksPLUS® Global Portfolio
Semi-Annual Shareholder Report |
June 30, 2024
The information required by this Item 2 is only required in an annual report on this Form N-CSR.
| Item 3. | Audit Committee Financial Expert. |
The information required by this Item 3 is only required in an annual report on this Form N-CSR.
| Item 4. | Principal Accountant Fees and Services. |
The information required by this Item 4 is only required in an annual report on this Form N-CSR.
| Item 5. | Audit Committee of Listed Registrants. |
The information required by this Item 5 is only required in an annual report on this Form N-CSR.
The information required by this Item 6 is included as part of the semiannual Financial Statements and Financial Highlights filed under Item 7(a) of this Form N-CSR.
| Item 7. | Financial Statements and Financial Highlights for Open-End Management Investment Companies. |
| | (a) | The following is a copy of the report(s) of the Portfolio’s Financial Statements and Financial Highlights. |
| | ● | | PIMCO StocksPLUS® Global Portfolio |
| | (b) | Not applicable to the Registrant. |

PIMCO EQUITY SERIES VIT®
Semiannual Financial and Other Information
June 30, 2024
PIMCO StocksPLUS® Global Portfolio
Table of Contents
This material is authorized for use only when preceded or accompanied by the current PIMCO Equity Series VIT (the “Trust”) prospectus for the Portfolio. (The variable product prospectus may be obtained by contacting your Investment Consultant.)
| | | | |
| Important Information About the PIMCO StocksPLUS® Global Portfolio | | | | |
PIMCO Equity Series VIT (the “Trust”) is an open-end management investment company that includes the PIMCO StocksPLUS® Global Portfolio (the “Portfolio”). The Portfolio is only available as a funding vehicle under variable life insurance policies or variable annuity contracts issued by insurance companies (“Variable Contracts”). Individuals may not purchase shares of the Portfolio directly. Shares of the Portfolio also may be sold to qualified pension and retirement plans outside of the separate account context.
The Portfolio may invest in both fixed income instruments and equity securities. We believe that such a portfolio has an important role to play in a well-diversified investment portfolio. It is important to note, however, that equity funds and bond funds are subject to notable risks. Among other things, equity and equity-related securities may decline in value due to both real and perceived general market, economic and industry conditions. The values of equity securities, such as common stocks and preferred securities, have historically risen and fallen in periodic cycles and may decline due to general market conditions, which are not specifically related to a particular company, such as real or perceived adverse economic conditions, changes in the general outlook for corporate earnings, changes in interest or currency rates or adverse investor sentiment generally. Equity securities may also decline due to factors that affect a particular industry or industries, such as labor shortages, increased production costs and competitive conditions within an industry. In addition, the value of an equity security may decline for a number of reasons that directly relate to the issuer, such as management performance, financial leverage and reduced demand for the issuer’s goods or services, as well as the historical and prospective earnings of the issuer and the value of its assets. Different types of equity securities may react differently to these developments and a change in the financial condition of a single issuer may affect securities markets as a whole.
During a general downturn in the securities markets, multiple asset classes, including equity securities, may decline in value simultaneously. The market price of equity securities owned by the Portfolio may go up or down, sometimes rapidly or unpredictably. Equity securities generally have greater price volatility than fixed income securities and common stocks generally have the greatest appreciation and depreciation potential of all equity securities. Bond funds and fixed income securities are subject to a variety of risks, including interest rate risk, liquidity risk and market risk.
It is important to note, however, that in an environment where interest rates may trend upward, rising rates would negatively impact the performance of most bond funds, and fixed income securities and other instruments held by the Portfolio are likely to decrease in value. A wide variety of factors can cause interest rates or yields of U.S. Treasury securities (or yields of other types of bonds) to rise (e.g., central bank
monetary policies, inflation rates, general economic conditions, etc.). In addition, changes in interest rates can be sudden and unpredictable, and there is no guarantee that Portfolio management will anticipate such movement accurately. The Portfolio may lose money as a result of movements in interest rates.
As of the date of this report, interest rates in the United States and many parts of the world, including certain European countries, remain high. In efforts to combat inflation, the U.S. Federal Reserve (the “Fed”) raised interest rates multiple times in 2022 and 2023. In the second half of 2023 and the beginning of 2024, however, the Fed paused the rate hikes, keeping interest rates steady. It is uncertain whether rates will remain steady, increase or decrease in the future. As such, the Portfolio may face a heightened level of risk associated with rising interest rates and/or bond yields. This could be driven by a variety of factors, including but not limited to central bank monetary policies, changing inflation or real growth rates, general economic conditions, increasing bond issuances or reduced market demand for low yielding investments. Further, while bond markets have steadily grown over the past three decades, dealer inventories of corporate bonds are near historic lows in relation to market size. As a result, there has been a significant reduction in the ability of dealers to “make markets”.
Bond funds and individual bonds with a longer duration (a measure used to determine the sensitivity of a security’s price to changes in interest rates) tend to be more sensitive to changes in interest rates, usually making them more volatile than securities or funds with shorter durations. All of the factors mentioned above, individually or collectively, could lead to increased volatility and/or lower liquidity in the fixed income markets, or negatively impact the Portfolio’s performance or cause the Portfolio to incur losses. As a result, the Portfolio may experience increased shareholder redemptions, which, among other things, could further reduce the net assets of the Portfolio.
The Portfolio may be subject to various risks as described in the Portfolio’s prospectus and in the Principal and Other Risks in the Notes to Financial Statements.
Classifications of the Portfolio’s portfolio holdings in this report are made according to financial reporting standards. The classification of a particular portfolio holding as shown in the Schedule of Investments section of this report may differ from the classification used for the Portfolio’s compliance calculations, including those used in the Portfolio’s prospectus, investment objectives, regulatory and other investment limitations and policies, which may be based on different asset class, sector or geographical classifications. The Portfolio is separately monitored for compliance with respect to prospectus and regulatory requirements.
| | | | | | |
| 2 | | PIMCO EQUITY SERIES VIT | | | | |
The geographical classification of foreign (non-U.S.) securities in this report, if any, are classified by the country of incorporation of a holding. In certain instances, a security’s country of incorporation may be different from its country of economic exposure.
In February 2022, Russia launched an invasion of Ukraine. As a result, Russia and other countries, persons and entities that provided material aid to Russia’s aggression against Ukraine, have been the subject of economic sanctions and import and export controls imposed by countries throughout the world, including the United States. Such measures have had and may continue to have an adverse effect on the Russian, Belarusian and other securities and economies, which may, in turn, negatively impact the Portfolio. The extent, duration and impact of Russia’s military action in Ukraine, related sanctions and retaliatory actions are difficult to ascertain, but could be significant and have severe adverse effects on the region, including significant adverse effects on the regional, European and global economies and the markets for certain securities and commodities, such as oil and natural gas, as well as other sectors. Further, the Portfolio may have investments in securities and instruments that are economically tied to the region and may have been negatively impacted by the sanctions and counter-sanctions by Russia, including declines in value and reductions in liquidity. The sanctions may cause the Portfolio to sell portfolio holdings at a disadvantageous time or price or to continue to hold investments that the Portfolio may no longer seek to hold. PIMCO will continue to actively manage these positions in the best interests of the Portfolio and its shareholders.
The United States’ enforcement of restrictions on U.S. investments in certain issuers and tariffs on goods from certain other countries has contributed to and may continue to contribute to international trade tensions and may impact portfolio securities. The United States’ enforcement of sanctions or other similar measures on various Russian entities and persons, and the Russian government’s response, may also negatively impact securities and instruments that are economically tied to Russia.
The Portfolio may invest in certain instruments that rely in some fashion upon the London Interbank Offered Rate (“LIBOR”). LIBOR was traditionally an average interest rate, determined by the ICE Benchmark Administration, that banks charge one another for the use of short-term money. The United Kingdom’s Financial Conduct Authority, which regulates LIBOR, announced plans to ultimately phase out the use of LIBOR. Although the transition process away from LIBOR for many instruments has been completed, some LIBOR use is continuing and there are potential effects related to the transition away from LIBOR or
continued use of LIBOR on the Portfolio, or on certain instruments in which the Portfolio invests, which can be difficult to ascertain, and may vary depending on factors that include, but are not limited to: (i) existing fallback or termination provisions in individual contracts and (ii) whether, how and when industry participants adopt new reference rates for affected instruments. The transition of investments from LIBOR to a replacement rate as a result of amendment, application of existing fallbacks, statutory requirements or otherwise may also result in a reduction in the value of certain instruments held by the Portfolio or a reduction in the effectiveness of related Portfolio transactions such as hedges. In addition, an instrument’s transition to a replacement rate could result in variations in the reported yields of the Portfolio that holds such instrument. Any such effects of the transition away from LIBOR, as well as other unforeseen effects, could result in losses to the Portfolio.
U.S. and global markets have experienced increased volatility, including as a result of the failures of certain U.S. and non-U.S. banks in 2023, which could be harmful to the Portfolio and issuers in which it invests. For example, if a bank at which the Portfolio or issuer has an account fails, any cash or other assets in bank or custody accounts, which may be substantial in size, could be temporarily inaccessible or permanently lost by the Portfolio or issuer. If a bank that provides a subscription line credit facility, asset-based facility, other credit facility and/or other services to an issuer or to a fund fails, the issuer or fund could be unable to draw funds under its credit facilities or obtain replacement credit facilities or other services from other lending institutions with similar terms.
Issuers in which the Portfolio may invest can be affected by volatility in the banking sector. Even if banks used by issuers in which the Portfolio invests remain solvent, volatility in the banking sector could contribute to, cause or intensify an economic recession, increase the costs of capital and banking services or result in the issuers being unable to obtain or refinance indebtedness at all or on as favorable terms as could otherwise have been obtained. Potential impacts to the Portfolio and issuers resulting from changes in the banking sector, market conditions and potential legislative or regulatory responses are uncertain. Such conditions and responses, as well as a changing interest rate environment, can contribute to decreased market liquidity and erode the value of certain holdings, including those of U.S. and non-U.S. banks. Continued market volatility and uncertainty and/or a downturn in market and economic and financial conditions, as a result of developments in the banking sector or otherwise (including as a result of delayed access to cash or credit facilities), could have an adverse impact on the Portfolio and issuers in which it invests.
| | | | | | | | | | | | |
| | | | SEMIANNUAL FINANCIAL AND OTHER INFORMATION | | | | | | | JUNE 30, 2024 | | | 3 |
| | | | |
| Important Information About the PIMCO StocksPLUS® Global Portfolio | | (Cont.) | | |
The following table discloses the inception dates of the Portfolio and its share classes along with the Portfolio’s diversification status as of period end:
| | | | | | | | | | | | | | | | | | | | | | | | |
| Portfolio Name | | | | | Portfolio Inception | | | Institutional Class | | | Administrative
Class | | | Advisor Class | | | Diversification Status | |
PIMCO StocksPLUS® Global Portfolio | | | | | | | 04/14/10 | | | | 04/14/10 | | | | — | | | | 04/14/10 | | | | Diversified | |
An investment in the Portfolio is not a bank deposit and is not guaranteed or insured by the Federal Deposit Insurance Corporation or any other government agency. It is possible to lose money on investments in the Portfolio.
The Trustees are responsible generally for overseeing the management of the Trust. The Trustees authorize the Trust to enter into service agreements with the Adviser, the Distributor, the Administrator and other service providers in order to provide, and in some cases authorize service providers to procure through other parties, necessary or desirable services on behalf of the Trust and the Portfolio. Shareholders are not parties to or third-party beneficiaries of such service agreements. Neither this Portfolio’s prospectus nor summary prospectus, the Trust’s Statement of Additional Information (“SAI”), any contracts filed as exhibits to the Trust’s registration statement, nor any other communications, disclosure documents or regulatory filings (including this report) from or on behalf of the Trust or the Portfolio creates a contract between or among any shareholder of the Portfolio, on the one hand, and the Trust, the Portfolio, a service provider to the Trust or the Portfolio, and/or the Trustees or officers of the Trust, on the other hand. The Trustees (or the Trust and its officers, service providers or other delegates acting under authority of the Trustees) may amend the most recent prospectus or use a new prospectus, summary prospectus or SAI with respect to the Portfolio or the Trust, and/or amend, file and/or issue any other communications, disclosure documents or regulatory filings, and may amend or enter into any contracts to which the Trust or the Portfolio is a party, and interpret the investment objective(s), policies, restrictions and contractual provisions applicable to the Portfolio, without shareholder input or approval, except in circumstances in which shareholder approval is specifically required by law (such as changes to fundamental investment policies) or where a shareholder approval requirement is specifically disclosed in the Trust’s then-current prospectus or SAI.
PIMCO has adopted written proxy voting policies and procedures (“Proxy Policy”) as required by Rule 206(4)-6 under the Investment Advisers Act of 1940, as amended. The Proxy Policy has been adopted by the Trust as the policies and procedures that PIMCO will use when voting proxies on behalf of the Portfolio. A description of the policies and procedures that PIMCO uses to vote proxies relating to portfolio securities of the Portfolio, and information about how the Portfolio voted proxies relating to portfolio securities held during the most recent twelve-month period ended June 30, are available without charge, upon request, by calling the Trust at (888) 87-PIMCO, on the
Portfolio’s website at www.pimco.com/pvit, and on the Securities and Exchange Commission’s (“SEC”) website at www.sec.gov.
The Portfolio files portfolio holdings information with the SEC on Form N-PORT within 60 days of the end of each fiscal quarter. The Portfolio’s complete schedule of securities holdings as of the end of each fiscal quarter will be made available to the public on the SEC’s website at www.sec.gov and on PIMCO’s website at www.pimco.com/pvit, and will be made available, upon request, by calling PIMCO at (888) 87-PIMCO.
Paper copies of the Portfolio’s shareholder reports are required to be provided free of charge by the Portfolio, the insurance company or financial intermediary upon request.
In October 2022, the SEC adopted changes to the mutual fund and exchange-traded fund (“ETF”) shareholder report and registration statement disclosure requirements and the registered fund advertising rules, which impact the disclosures provided to shareholders. The rule amendments were effective as of January 2023, and compliance with the rule amendments was required as of July 2024. As such, the Portfolio has made significant updates to the content of its shareholder reports. In addition, shareholder reports are now mailed to shareholders who have not opted to receive shareholder report documents electronically.
In September 2023, the SEC adopted amendments to Rule 35d-1 under the Investment Company Act of 1940, as amended, the rule governing fund naming conventions (the “Names Rule”). In general, the Names Rule requires funds with certain types of names to adopt a policy to invest at least 80% of their assets in the type of investment suggested by the name. The amendments expand the scope of the current rule to include any term used in a fund name that suggests the fund makes investments that have, or whose issuers have, particular characteristics. Additionally, the amendments modify the circumstances under which a fund may deviate from its 80% investment policy and address the calculation methodology of derivatives instruments for purposes of the rule. The amendments became effective December 11, 2023, and fund groups with $1 billion or more in net assets will have 24 months to comply with the amendments (fund groups with net assets of less than $1 billion have 30 months to comply).
| | | | | | |
| 4 | | PIMCO EQUITY SERIES VIT | | | | |
(THIS PAGE INTENTIONALLY LEFT BLANK)
| | | | | | | | | | | | |
| | | | SEMIANNUAL FINANCIAL AND OTHER INFORMATION | | | | | | | JUNE 30, 2024 | | | 5 |
| | | | | | |
| Financial Highlights | | PIMCO StocksPLUS® Global Portfolio | | | | |
| | | | | | | | | | | | | | | | | | | | | | | | | | | | |
| | | | | | Investment Operations | | | Less Distributions(c) | |
| | | | | | | | | | | | | | | | | | | | | | |
| Selected Per Share Data for the Year or Period Ended^: | | Net Asset
Value
Beginning of
Year or
Period(a) | | | Net
Investment
Income
(Loss)(b) | | | Net
Realized/
Unrealized
Gain (Loss) | | | Total | | | From Net
Investment
Income | | | From Net
Realized
Capital Gain | | | Total | |
| Institutional Class | | | | | | | | | | | | | | | | | | | | | | | | | | | | |
| | | | | | | |
01/01/2024 - 06/30/2024+ | | $ | 7.17 | | | $ | 0.15 | | | $ | 0.61 | | | $ | 0.76 | | | $ | (0.21 | ) | | $ | 0.00 | | | $ | (0.21 | ) |
| | | | | | | |
12/31/2023 | | | 6.00 | | | | 0.26 | | | | 1.11 | | | | 1.37 | | | | (0.20 | ) | | | 0.00 | | | | (0.20 | ) |
| | | | | | | |
12/31/2022 | | | 9.73 | | | | 0.09 | | | | (1.84 | ) | | | (1.75 | ) | | | (0.09 | ) | | | (1.89 | ) | | | (1.98 | ) |
| | | | | | | |
12/31/2021 | | | 9.01 | | | | 0.00 | | | | 1.70 | | | | 1.70 | | | | (0.02 | ) | | | (0.96 | ) | | | (0.98 | ) |
| | | | | | | |
12/31/2020 | | | 8.95 | | | | 0.06 | | | | 0.91 | | | | 0.97 | | | | (0.11 | ) | | | (0.80 | ) | | | (0.91 | ) |
| | | | | | | |
12/31/2019 | | | 7.12 | | | | 0.17 | | | | 1.80 | | | | 1.97 | | | | (0.14 | ) | | | 0.00 | | | | (0.14 | ) |
| Advisor Class | | | | | | | | | | | | | | | | | | | | | | | | | | | | |
| | | | | | | |
01/01/2024 - 06/30/2024+ | | | 6.98 | | | | 0.14 | | | | 0.58 | | | | 0.72 | | | | (0.20 | ) | | | 0.00 | | | | (0.20 | ) |
| | | | | | | |
12/31/2023 | | | 5.84 | | | | 0.23 | | | | 1.09 | | | | 1.32 | | | | (0.18 | ) | | | 0.00 | | | | (0.18 | ) |
| | | | | | | |
12/31/2022 | | | 9.54 | | | | 0.07 | | | | (1.80 | ) | | | (1.73 | ) | | | (0.08 | ) | | | (1.89 | ) | | | (1.97 | ) |
| | | | | | | |
12/31/2021 | | | 8.85 | | | | (0.02 | ) | | | 1.68 | | | | 1.66 | | | | (0.01 | ) | | | (0.96 | ) | | | (0.97 | ) |
| | | | | | | |
12/31/2020 | | | 8.82 | | | | 0.04 | | | | 0.88 | | | | 0.92 | | | | (0.09 | ) | | | (0.80 | ) | | | (0.89 | ) |
| | | | | | | |
12/31/2019 | | | 7.02 | | | | 0.14 | | | | 1.78 | | | | 1.92 | | | | (0.12 | ) | | | 0.00 | | | | (0.12 | ) |
| ^ | A zero balance may reflect actual amounts rounding to less than $0.01 or 0.01%. |
| * | Annualized, except for organizational expense, if any. |
| (a) | Includes adjustments required by U.S. GAAP and may differ from net asset values and performance reported elsewhere by the Portfolio. |
| (b) | Per share amounts based on average number of shares outstanding during the year or period. |
| (c) | The tax characterization of distributions is determined in accordance with Federal income tax regulations. The actual tax characterization of distributions paid is determined at the end of the fiscal year. See Note 2, Distributions to Shareholders, in the Notes to Financial Statements for more information. |
| (d) | Includes adjustments required by U.S. GAAP and may differ from net asset values and performance reported elsewhere by the Portfolio. Additionally, excludes initial sales charges, contingent deferred sales charges and Variable Contract fees or expenses. |
| | | | | | |
| 6 | | PIMCO EQUITY SERIES VIT | | | See Accompanying Notes | |
| | | | | | | | | | | | | | | | | | | | | | | | | | | | | | | | | | |
| | | | | | | Ratios/Supplemental Data | |
| | | | | | | | | | Ratios to Average Net Assets | | | | |
Net Asset
Value End of
Year or
Period(a) | | | Total Return(d) | | | Net Assets
End of Year
or Period
(000s) | | | Expenses | | | Expenses
Excluding
Waivers | | | Expenses
Excluding
Interest
Expense | | | Expenses
Excluding
Interest
Expense and
Waivers | | | Net
Investment
Income (Loss) | | | Portfolio
Turnover
Rate | |
| | | | | | | | | | | | | | | | | | | | | | | | | | | | | | | | | | |
| | | | | | | | |
| $ | 7.72 | | | | 10.60 | % | | $ | 32,840 | | | | 0.72 | %* | | | 0.76 | %* | | | 0.62 | %* | | | 0.66 | %* | | | 4.12 | %* | | | 37 | % |
| | | | | | | | |
| | 7.17 | | | | 23.02 | | | | 32,119 | | | | 0.66 | | | | 0.71 | | | | 0.61 | | | | 0.66 | | | | 3.90 | | | | 127 | |
| | | | | | | | |
| | 6.00 | | | | (18.52 | ) | | | 28,321 | | | | 0.62 | | | | 0.66 | | | | 0.61 | | | | 0.65 | | | | 1.21 | | | | 30 | |
| | | | | | | | |
| | 9.73 | | | | 19.51 | | | | 40,250 | | | | 0.62 | | | | 0.65 | | | | 0.62 | | | | 0.65 | | | | (0.01 | ) | | | 111 | |
| | | | | | | | |
| | 9.01 | | | | 13.47 | | | | 37,519 | | | | 0.62 | | | | 0.66 | | | | 0.62 | | | | 0.66 | | | | 0.79 | | | | 7 | |
| | | | | | | | |
| | 8.95 | | | | 27.86 | | | | 36,643 | | | | 0.62 | | | | 0.64 | | | | 0.62 | | | | 0.64 | | | | 2.04 | | | | 26 | |
| | | | | | | | | | | | | | | | | | | | | | | | | | | | | | | | | | |
| | | | | | | | |
| | 7.50 | | | | 10.33 | | | | 154,591 | | | | 0.97 | * | | | 1.01 | * | | | 0.87 | * | | | 0.91 | * | | | 3.87 | * | | | 37 | |
| | | | | | | | |
| | 6.98 | | | | 22.84 | | | | 153,294 | | | | 0.91 | | | | 0.96 | | | | 0.86 | | | | 0.91 | | | | 3.64 | | | | 127 | |
| | | | | | | | |
| | 5.84 | | | | (18.79 | ) | | | 146,952 | | | | 0.87 | | | | 0.91 | | | | 0.86 | | | | 0.90 | | | | 0.96 | | | | 30 | |
| | | | | | | | |
| | 9.54 | | | | 19.33 | | | | 208,582 | | | | 0.87 | | | | 0.90 | | | | 0.87 | | | | 0.90 | | | | (0.26 | ) | | | 111 | |
| | | | | | | | |
| | 8.85 | | | | 13.03 | | | | 209,808 | | | | 0.87 | | | | 0.91 | | | | 0.87 | | | | 0.91 | | | | 0.55 | | | | 7 | |
| | | | | | | | |
| | 8.82 | | | | 27.53 | | | | 224,521 | | | | 0.87 | | | | 0.89 | | | | 0.87 | | | | 0.89 | | | | 1.79 | | | | 26 | |
| | | | | | | | | | | | |
| See Accompanying Notes | | | SEMIANNUAL FINANCIAL AND OTHER INFORMATION | | | | | | | JUNE 30, 2024 | | | 7 |
| | | | | | | | |
| Statement of Assets and Liabilities | | PIMCO StocksPLUS® Global Portfolio | | | | June 30, 2024 | | (Unaudited) |
| | | | |
| (Amounts in thousands†, except per share amounts) | | | |
| |
Assets: | | | | |
| |
Investments, at value | | | | |
Investments in securities* | | $ | 182,966 | |
Investments in Affiliates | | | 838 | |
Financial Derivative Instruments | | | | |
Exchange-traded or centrally cleared | | | 237 | |
Over the counter | | | 1,010 | |
Deposits with counterparty | | | 8,451 | |
Foreign currency, at value | | | 406 | |
Receivable for investments sold | | | 4,140 | |
Receivable for TBA investments sold | | | 4,233 | |
Receivable for Portfolio shares sold | | | 46 | |
Interest and/or dividends receivable | | | 817 | |
Dividends receivable from Affiliates | | | 3 | |
Reimbursement receivable from PIMCO | | | 18 | |
Total Assets | | | 203,165 | |
| |
Liabilities: | | | | |
| |
Financial Derivative Instruments | | | | |
Exchange-traded or centrally cleared | | $ | 447 | |
Over the counter | | | 72 | |
Payable for investments purchased | | | 6,322 | |
Payable for investments in Affiliates purchased | | | 4 | |
Payable for TBA investments purchased | | | 8,460 | |
Deposits from counterparty | | | 301 | |
Payable for Portfolio shares redeemed | | | 10 | |
Accrued investment advisory fees | | | 43 | |
Accrued supervisory and administrative fees | | | 45 | |
Accrued distribution fees | | | 30 | |
Total Liabilities | | | 15,734 | |
| |
Commitments and Contingent Liabilities^ | | | | |
| |
Net Assets | | $ | 187,431 | |
| |
Net Assets Consist of: | | | | |
| |
Paid in capital | | $ | 189,503 | |
Distributable earnings (accumulated loss) | | | (2,072 | ) |
| |
Net Assets | | $ | 187,431 | |
| |
Net Assets: | | | | |
| |
Institutional Class | | $ | 32,840 | |
Advisor Class | | | 154,591 | |
| |
Shares Issued and Outstanding: | | | | |
| |
Institutional Class | | | 4,256 | |
Advisor Class | | | 20,600 | |
| |
Net Asset Value Per Share Outstanding(a): | | | | |
| |
Institutional Class | | $ | 7.72 | |
Advisor Class | | | 7.50 | |
| |
Cost of investments in securities | | $ | 184,626 | |
Cost of investments in Affiliates | | $ | 836 | |
Cost of foreign currency held | | $ | 411 | |
Cost or premiums of financial derivative instruments, net | | $ | 1,064 | |
| |
* Includes repurchase agreements of: | | $ | 855 | |
| † | A zero balance may reflect actual amounts rounding to less than one thousand. |
| ^ | See Note 9, Fees and Expenses, in the Notes to Financial Statements for more information. |
| (a) | Includes adjustments required by U.S. GAAP and may differ from net asset values and performance reported elsewhere by the Portfolio. |
| | | | | | |
| 8 | | PIMCO EQUITY SERIES VIT | | | See Accompanying Notes | |
| | | | | | |
| Statement of Operations | | PIMCO StocksPLUS® Global Portfolio | | | | |
| | | | |
| Six Months Ended June 30, 2024 (Unaudited) | |
| (Amounts in thousands†) | |
| |
Investment Income: | | | | |
| |
Interest | | $ | 4,415 | |
Dividends | | | 40 | |
Dividends from Investments in Affiliates | | | 21 | |
Total Income | | | 4,476 | |
| |
Expenses: | | | | |
| |
Investment advisory fees | | | 278 | |
Supervisory and administrative fees | | | 287 | |
Distribution and/or servicing fees - Advisor Class | | | 191 | |
Trustee fees | | | 38 | |
Interest expense | | | 93 | |
Miscellaneous expense | | | 5 | |
Total Expenses | | | 892 | |
Waiver and/or Reimbursement by PIMCO | | | (38 | ) |
Net Expenses | | | 854 | |
| |
Net Investment Income (Loss) | | | 3,622 | |
| |
Net Realized Gain (Loss): | | | | |
| |
Investments in securities | | | (755 | ) |
Exchange-traded or centrally cleared financial derivative instruments | | | 18,362 | |
Over the counter financial derivative instruments | | | 1,016 | |
Foreign currency | | | (41 | ) |
| |
Net Realized Gain (Loss) | | | 18,582 | |
| |
Net Change in Unrealized Appreciation (Depreciation): | | | | |
| |
Investments in securities | | | (1,360 | ) |
Investments in Affiliates | | | 2 | |
Exchange-traded or centrally cleared financial derivative instruments | | | (4,060 | ) |
Over the counter financial derivative instruments | | | 1,823 | |
Foreign currency assets and liabilities | | | (8 | ) |
| |
Net Change in Unrealized Appreciation (Depreciation) | | | (3,603 | ) |
| |
Net Increase (Decrease) in Net Assets Resulting from Operations | | $ | 18,601 | |
| † | A zero balance may reflect actual amounts rounding to less than one thousand. |
| | | | | | | | | | | | |
| See Accompanying Notes | | | SEMIANNUAL FINANCIAL AND OTHER INFORMATION | | | | | | | JUNE 30, 2024 | | | 9 |
| | | | | | |
| Statements of Changes in Net Assets | | PIMCO StocksPLUS® Global Portfolio | | | | |
| | | | | | | | |
| (Amounts in thousands†) | | Six Months Ended
June 30, 2024
(Unaudited) | | | Year Ended
December 31, 2023 | |
| | |
Increase (Decrease) in Net Assets from: | | | | | | | | |
| | |
Operations: | | | | | | | | |
| | |
Net investment income (loss) | | $ | 3,622 | | | $ | 6,629 | |
Net realized gain (loss) | | | 18,582 | | | | 15,901 | |
Net change in unrealized appreciation (depreciation) | | | (3,603 | ) | | | 14,415 | |
| | |
Net Increase (Decrease) in Net Assets Resulting from Operations | | | 18,601 | | | | 36,945 | |
| | |
Distributions to Shareholders: | | | | | | | | |
| | |
From net investment income and/or net realized capital gains | | | | | | | | |
Institutional Class | | | (879 | ) | | | (890 | ) |
Advisor Class | | | (4,121 | ) | | | (4,110 | ) |
| | |
Total Distributions(a) | | | (5,000 | ) | | | (5,000 | ) |
| | |
Portfolio Share Transactions: | | | | | | | | |
| | |
Net increase (decrease) resulting from Portfolio share transactions* | | | (11,583 | ) | | | (21,805 | ) |
| | |
Total Increase (Decrease) in Net Assets | | | 2,018 | | | | 10,140 | |
| | |
Net Assets: | | | | | | | | |
| | |
Beginning of period | | | 185,413 | | | | 175,273 | |
End of period | | $ | 187,431 | | | $ | 185,413 | |
| † | A zero balance may reflect actual amounts rounding to less than one thousand. |
| * | See Note 13, Shares of Beneficial Interest, in the Notes to Financial Statements. |
| (a) | The tax characterization of distributions is determined in accordance with Federal income tax regulations. The actual tax characterization of distributions paid is determined at the end of the fiscal year. See Note 2, Distributions to Shareholders, in the Notes to Financial Statements for more information. |
| | | | | | |
| 10 | | PIMCO EQUITY SERIES VIT | | | See Accompanying Notes | |
| | | | | | | | |
| Schedule of Investments | | PIMCO StocksPLUS® Global Portfolio | | | | June 30, 2024 | | (Unaudited) |
(Amounts in thousands*, except number of shares, contracts, units and ounces, if any)
| | | | | | | | | | | | |
| | | | | PRINCIPAL
AMOUNT
(000S) | | | | | MARKET
VALUE
(000S) | |
| INVESTMENTS IN SECURITIES 97.6% | |
| |
| ASSET-BACKED SECURITIES 32.0% | |
| |
| CANADA 0.5% | |
|
Golden Credit Card Trust | |
4.310% due 09/15/2027 | | $ | | | 500 | | | $ | | | 493 | |
|
Master Credit Card Trust | |
6.183% due 01/21/2027 • | | | | | 500 | | | | | | 502 | |
| | | | | | | | | | | | |
Total Canada | | | | | | | | | | | 995 | |
| | | | | | | | | | | | |
| |
| CAYMAN ISLANDS 7.8% | |
|
522 Funding CLO Ltd. | |
6.626% due 10/20/2031 • | | | | | 1,024 | | | | | | 1,025 | |
|
Apidos CLO | |
6.489% due 07/18/2029 • | | | | | 171 | | | | | | 172 | |
|
Arbor Realty Commercial Real Estate Notes Ltd. | |
6.413% due 12/15/2035 • | | | | | 434 | | | | | | 432 | |
|
Benefit Street Partners CLO Ltd. | |
6.609% due 01/17/2032 • | | | | | 485 | | | | | | 486 | |
6.670% due 07/15/2032 • | | | | | 1,300 | | | | | | 1,302 | |
|
Brightspire Capital Ltd. | |
6.603% due 08/19/2038 • | | | | | 72 | | | | | | 72 | |
|
BSPRT Issuer Ltd. | |
6.543% due 03/15/2036 • | | | | | 1,353 | | | | | | 1,343 | |
|
Carlyle Global Market Strategies CLO Ltd. | |
6.534% due 08/14/2030 • | | | | | 353 | | | | | | 353 | |
6.666% due 04/22/2032 • | | | | | 1,300 | | | | | | 1,302 | |
|
Crestline Denali CLO Ltd. | |
6.616% due 04/20/2030 • | | | | | 101 | | | | | | 101 | |
6.728% due 10/23/2031 • | | | | | 929 | | | | | | 930 | |
|
GoldenTree Loan Management U.S. CLO Ltd. | |
6.473% due 04/24/2031 • | | | | | 1,000 | | | | | | 1,002 | |
|
LCM Ltd. | |
6.666% due 04/20/2031 • | | | | | 600 | | | | | | 600 | |
|
Mountain View CLO LLC | |
6.629% due 01/16/2031 • | | | | | 1,587 | | | | | | 1,587 | |
|
Oaktree CLO Ltd. | |
6.696% due 04/22/2030 • | | | | | 1,300 | | | | | | 1,302 | |
|
Palmer Square Loan Funding Ltd. | |
6.386% due 07/20/2029 • | | | | | 135 | | | | | | 136 | |
|
Sound Point CLO Ltd. | |
7.386% due 07/20/2032 • | | | | | 600 | | | | | | 600 | |
|
Starwood Commercial Mortgage Trust | |
6.646% due 04/18/2038 • | | | | | 876 | | | | | | 859 | |
|
Venture CLO Ltd. | |
6.576% due 07/20/2030 • | | | | | 811 | | | | | | 812 | |
6.716% due 04/20/2032 • | | | | | 250 | | | | | | 250 | |
|
Wellfleet CLO Ltd. | |
6.476% due 07/20/2029 • | | | | | 28 | | | | | | 28 | |
| | | | | | | | | | | | |
Total Cayman Islands | | | | | | | | | | | 14,694 | |
| | | | | | | | | | | | |
| |
| IRELAND 0.6% | |
|
Accunia European CLO DAC | |
4.856% due 07/15/2030 • | | EUR | | | 143 | | | | | | 153 | |
|
BlueMountain Fuji EUR CLO DAC | |
4.626% due 01/15/2031 • | | | | | 447 | | | | | | 478 | |
|
Palmer Square European Loan Funding DAC | |
5.123% due 08/15/2033 • | | | | | 500 | | | | | | 535 | |
| | | | | | | | | | | | |
Total Ireland | | | | | | | | | | | 1,166 | |
| | | | | | | | | | | | |
| |
| JAPAN 0.4% | |
|
Oscar U.S. Funding LLC | |
2.820% due 04/10/2029 | | $ | | | 700 | | | | | | 672 | |
| | | | | | | | | | | | |
Total Japan | | | | | | | | | | | 672 | |
| | | | | | | | | | | | |
| |
| JERSEY, CHANNEL ISLANDS 0.5% | |
|
Saranac CLO Ltd. | |
6.748% due 08/13/2031 • | | | | | 887 | | | | | | 890 | |
| | | | | | | | | | | | |
Total Jersey, Channel Islands | | | | | | | | | | | 890 | |
| | | | | | | | | | | | |
| |
| | | | | | | | | | | | |
| | | | | PRINCIPAL
AMOUNT
(000S) | | | | | MARKET
VALUE
(000S) | |
| UNITED STATES 22.2% | |
|
Ally Auto Receivables Trust | |
5.528% due 03/17/2025 | | $ | | | 164 | | | $ | | | 164 | |
|
American Express Credit Account Master Trust | |
4.870% due 05/15/2028 | | | | | 500 | | | | | | 498 | |
|
AmeriCredit Automobile Receivables Trust | |
5.620% due 06/18/2025 | | | | | 1,342 | | | | | | 1,342 | |
|
BA Credit Card Trust | |
4.790% due 05/15/2028 | | | | | 500 | | | | | | 497 | |
4.980% due 11/15/2028 | | | | | 900 | | | | | | 900 | |
|
Bank of America Auto Trust | |
5.830% due 05/15/2026 | | | | | 335 | | | | | | 336 | |
|
Capital One Multi-Asset Execution Trust | |
2.800% due 03/15/2027 | | | | | 600 | | | | | | 589 | |
|
Capital One Prime Auto Receivables Trust | |
5.983% due 09/15/2025 • | | | | | 12 | | | | | | 12 | |
|
CarMax Auto Owner Trust | |
5.300% due 03/15/2027 | | | | | 700 | | | | | | 699 | |
5.720% due 11/16/2026 | | | | | 355 | | | | | | 355 | |
6.233% due 12/15/2025 • | | | | | 51 | | | | | | 51 | |
|
Carvana Auto Receivables Trust | |
5.630% due 11/10/2027 | | | | | 500 | | | | | | 500 | |
5.900% due 08/10/2027 | | | | | 500 | | | | | | 500 | |
5.980% due 08/10/2026 | | | | | 134 | | | | | | 134 | |
|
Chase Auto Owner Trust | |
5.480% due 04/26/2027 | | | | | 600 | | | | | | 600 | |
|
Chase Issuance Trust | |
4.720% due 01/15/2031 | | | | | 900 | | | | | | 895 | |
|
Citizens Auto Receivables Trust | |
5.110% due 04/17/2028 | | | | | 100 | | | | | | 100 | |
5.430% due 10/15/2026 | | | | | 100 | | | | | | 100 | |
6.090% due 10/15/2026 | | | | | 148 | | | | | | 148 | |
6.130% due 07/15/2026 | | | | | 213 | | | | | | 213 | |
6.283% due 07/15/2026 • | | | | | 213 | | | | | | 213 | |
|
College Avenue Student Loans LLC | |
6.260% due 06/25/2052 • | | | | | 966 | | | | | | 951 | |
|
Countrywide Asset-Backed Certificates Trust | |
5.740% due 12/25/2046 • | | | | | 676 | | | | | | 631 | |
5.940% due 10/25/2046 • | | | | | 419 | | | | | | 406 | |
|
CPS Auto Receivables Trust | |
5.880% due 02/15/2028 | | | | | 900 | | | | | | 900 | |
|
DT Auto Owner Trust | |
6.290% due 08/16/2027 | | | | | 431 | | | | | | 432 | |
|
Enterprise Fleet Financing LLC | |
3.030% due 01/20/2028 | | | | | 220 | | | | | | 218 | |
|
Exeter Automobile Receivables Trust | |
6.070% due 12/15/2025 | | | | | 257 | | | | | | 257 | |
6.320% due 03/15/2027 | | | | | 500 | | | | | | 502 | |
|
Ford Credit Auto Lease Trust | |
5.240% due 07/15/2026 | | | | | 1,600 | | | | | | 1,597 | |
|
Foursight Capital Automobile Receivables Trust | |
1.310% due 07/15/2027 | | | | | 171 | | | | | | 169 | |
|
GLS Auto Receivables Issuer Trust | |
5.570% due 02/16/2027 | | | | | 700 | | | | | | 699 | |
5.770% due 06/15/2027 | | | | | 500 | | | | | | 500 | |
|
GLS Auto Select Receivables Trust | |
5.960% due 10/16/2028 | | | | | 300 | | | | | | 302 | |
6.270% due 08/16/2027 | | | | | 371 | | | | | | 372 | |
|
GM Financial Automobile Leasing Trust | |
5.580% due 01/20/2026 | | | | | 461 | | | | | | 461 | |
|
GM Financial Consumer Automobile Receivables Trust | |
4.850% due 12/18/2028 | | | | | 300 | | | | | | 298 | |
5.120% due 02/16/2027 | | | | | 500 | | | | | | 499 | |
|
GreenState Auto Receivables Trust | |
5.530% due 08/16/2027 | | | | | 700 | | | | | | 699 | |
|
Harley Davidson Motorcycle Trust | |
5.650% due 02/16/2027 | | | | | 500 | | | | | | 500 | |
|
Hertz Vehicle Financing LLC | |
1.210% due 12/26/2025 | | | | | 1,000 | | | | | | 987 | |
|
Hyundai Auto Receivables Trust | |
4.990% due 02/15/2029 | | | | | 500 | | | | | | 498 | |
5.290% due 04/15/2027 | | | | | 500 | | | | | | 499 | |
| | | | | | | | | | | | |
| | | | | PRINCIPAL
AMOUNT
(000S) | | | | | MARKET
VALUE
(000S) | |
|
Mariner Finance Issuance Trust | |
1.860% due 03/20/2036 | | $ | | | 800 | | | $ | | | 741 | |
|
Marlette Funding Trust | |
6.070% due 04/15/2033 | | | | | 144 | | | | | | 144 | |
|
MF1 Ltd. | |
7.143% due 11/15/2035 • | | | | | 320 | | | | | | 320 | |
|
Morgan Stanley Home Equity Loan Trust | |
5.970% due 02/25/2036 • | | | | | 652 | | | | | | 598 | |
|
Navient Private Education Loan Trust | |
6.893% due 07/16/2040 • | | | | | 214 | | | | | | 215 | |
|
Navient Private Education Refi Loan Trust | |
0.940% due 07/15/2069 | | | | | 460 | | | | | | 405 | |
|
Navient Student Loan Trust | |
6.423% due 12/15/2059 • | | | | | 232 | | | | | | 231 | |
|
Nomura Home Equity Loan, Inc. Home Equity Loan Trust | |
6.090% due 02/25/2036 • | | | | | 91 | | | | | | 83 | |
|
OneMain Financial Issuance Trust | |
1.750% due 09/14/2035 | | | | | 500 | | | | | | 467 | |
6.093% due 06/16/2036 • | | | | | 500 | | | | | | 500 | |
|
Oportun Issuance Trust | |
6.334% due 04/08/2031 | | | | | 397 | | | | | | 397 | |
|
Pagaya AI Debt Selection Trust | |
2.030% due 10/15/2029 | | | | | 66 | | | | | | 66 | |
4.970% due 01/15/2030 | | | | | 36 | | | | | | 36 | |
6.278% due 10/15/2031 | | | | | 500 | | | | | | 500 | |
|
Park Place Securities, Inc. Asset-Backed Pass-Through Certificates | |
6.630% due 03/25/2035 • | | | | | 106 | | | | | | 97 | |
7.185% due 02/25/2035 • | | | | | 691 | | | | | | 609 | |
|
Reach ABS Trust | |
6.300% due 02/18/2031 | | | | | 352 | | | | | | 353 | |
|
Santander Drive Auto Receivables Trust | |
5.800% due 09/15/2027 | | | | | 500 | | | | | | 500 | |
5.870% due 03/16/2026 | | | | | 96 | | | | | | 96 | |
5.910% due 06/15/2027 | | | | | 600 | | | | | | 600 | |
5.930% due 07/17/2028 | | | | | 500 | | | | | | 504 | |
6.080% due 08/17/2026 | | | | | 234 | | | | | | 235 | |
|
SBNA Auto Lease Trust | |
5.390% due 11/20/2026 | | | | | 800 | | | | | | 799 | |
5.450% due 01/20/2026 | | | | | 465 | | | | | | 465 | |
|
SCCU Auto Receivables Trust | |
5.700% due 10/16/2028 | | | | | 500 | | | | | | 503 | |
5.850% due 05/17/2027 | | | | | 415 | | | | | | 415 | |
|
SFS Auto Receivables Securitization Trust | |
5.710% due 10/20/2027 | | | | | 500 | | | | | | 500 | |
|
SLC Student Loan Trust | |
6.485% due 11/25/2042 • | | | | | 80 | | | | | | 80 | |
|
SLM Private Credit Student Loan Trust | |
5.931% due 06/15/2039 • | | | | | 916 | | | | | | 898 | |
|
SMB Private Education Loan Trust | |
1.290% due 07/15/2053 | | | | | 236 | | | | | | 217 | |
1.310% due 07/17/2051 | | | | | 345 | | | | | | 313 | |
1.340% due 03/17/2053 | | | | | 588 | | | | | | 532 | |
6.163% due 01/15/2037 • | | | | | 359 | | | | | | 358 | |
6.243% due 01/15/2053 • | | | | | 336 | | | | | | 334 | |
6.783% due 02/16/2055 • | | | | | 702 | | | | | | 707 | |
|
SoFi Consumer Loan Program Trust | |
5.810% due 05/15/2031 | | | | | 99 | | | | | | 99 | |
|
SoFi Professional Loan Program Trust | |
2.540% due 05/15/2046 | | | | | 406 | | | | | | 380 | |
|
Synchrony Card Funding LLC | |
3.370% due 04/15/2028 | | | | | 500 | | | | | | 491 | |
|
Theorem Funding Trust | |
7.600% due 04/15/2029 | | | | | 233 | | | | | | 234 | |
|
Toyota Auto Receivables Owner Trust | |
5.600% due 08/17/2026 | | | | | 352 | | | | | | 352 | |
5.683% due 03/15/2027 • | | | | | 800 | | | | | | 800 | |
|
Tricolor Auto Securitization Trust | |
6.360% due 12/15/2027 | | | | | 479 | | | | | | 480 | |
6.610% due 10/15/2027 | | | | | 384 | | | | | | 384 | |
|
Upstart Securitization Trust | |
3.120% due 03/20/2032 | | | | | 149 | | | | | | 148 | |
6.590% due 02/20/2033 | | | | | 213 | | | | | | 213 | |
| | | | | | | | | | | | |
| See Accompanying Notes | | | SEMIANNUAL FINANCIAL AND OTHER INFORMATION | | | | | | | JUNE 30, 2024 | | | 11 |
| | | | | | | | |
| Schedule of Investments | | PIMCO StocksPLUS® Global Portfolio | | (Cont.) | | | | |
| | | | | | | | | | | | |
| | | | | PRINCIPAL
AMOUNT
(000S) | | | | | MARKET
VALUE
(000S) | |
|
Volkswagen Auto Lease Trust | |
5.400% due 12/21/2026 | | $ | | | 1,000 | | | $ | | | 1,000 | |
|
Westlake Automobile Receivables Trust | |
5.960% due 10/15/2026 | | | | | 350 | | | | | | 351 | |
6.003% due 10/15/2026 • | | | | | 350 | | | | | | 351 | |
6.230% due 01/15/2027 | | | | | 968 | | | | | | 970 | |
|
World Omni Select Auto Trust | |
5.920% due 03/15/2027 | | | | | 338 | | | | | | 338 | |
| | | | | | | | | | | | |
Total United States | | | | | | | | | | | 41,632 | |
| | | | | | | | | | | | |
Total Asset-Backed Securities (Cost $60,536) | | | 60,049 | |
| | | | |
| |
| | | | | SHARES | | | | | | |
| COMMON STOCKS 7.3% | |
| |
| UNITED STATES 7.3% | |
| |
| COMMUNICATION SERVICES 0.1% | |
| | | | |
Verizon Communications, Inc. | | | | | 1,601 | | | | | | 66 | |
| | | | |
Walt Disney Co. | | | | | 1,601 | | | | | | 159 | |
| | | | | | | | | | | | |
| | | | | | | | | | | 225 | |
| | | | | | | | | | | | |
| |
| CONSUMER DISCRETIONARY 0.2% | |
| | | | |
Amazon.com, Inc. (b) | | | | | 1,601 | | | | | | 309 | |
| | | | | | | | | | | | |
| |
| CONSUMER STAPLES 0.8% | |
| | | | |
Coca-Cola Co. | | | | | 1,601 | | | | | | 102 | |
| | | | |
Home Depot, Inc. | | | | | 1,601 | | | | | | 551 | |
| | | | |
McDonald’s Corp. | | | | | 1,601 | | | | | | 408 | |
| | | | |
NIKE, Inc. ‘B’ | | | | | 1,601 | | | | | | 121 | |
| | | | |
Procter & Gamble Co. | | | | | 1,601 | | | | | | 264 | |
| | | | |
Walmart, Inc. | | | | | 1,601 | | | | | | 108 | |
| | | | | | | | | | | | |
| | | | | | | | | | | 1,554 | |
| | | | | | | | | | | | |
| |
| ENERGY 0.1% | |
| | | | |
Chevron Corp. | | | | | 1,601 | | | | | | 250 | |
| | | | | | | | | | | | |
| |
| FINANCIALS 1.2% | |
| | | | |
American Express Co. | | | | | 1,601 | | | | | | 371 | |
| | | | |
Goldman Sachs Group, Inc. | | | | | 1,601 | | | | | | 724 | |
| | | | |
JPMorgan Chase & Co. | | | | | 1,601 | | | | | | 324 | |
| | | | |
Travelers Cos., Inc. | | | | | 1,601 | | | | | | 326 | |
| | | | |
Visa, Inc. ‘A’ | | | | | 1,601 | | | | | | 420 | |
| | | | | | | | | | | | |
| | | | | | | | | | | 2,165 | |
| | | | | | | | | | | | |
| |
| HEALTH CARE 0.9% | |
| | | | |
Amgen, Inc. | | | | | 1,601 | | | | | | 500 | |
| | | | |
Johnson & Johnson | | | | | 1,601 | | | | | | 234 | |
| | | | |
Merck & Co., Inc. | | | | | 1,601 | | | | | | 198 | |
| | | | |
UnitedHealth Group, Inc. | | | | | 1,601 | | | | | | 816 | |
| | | | | | | | | | | | |
| | | | | | | | | | | 1,748 | |
| | | | | | | | | | | | |
| |
| INDUSTRIALS 0.7% 3M Co. | | | 1,601 | | | | | | 164 | |
| | | | |
Boeing Co. (b) | | | | | 1,601 | | | | | | 291 | |
| | | | |
Caterpillar, Inc. | | | | | 1,601 | | | | | | 533 | |
| | | | |
Honeywell International, Inc. | | | | | 1,601 | | | | | | 342 | |
| | | | | | | | | | | | |
| | | | | | | | | | | 1,330 | |
| | | | | | | | | | | | |
| |
| INFORMATION TECHNOLOGY 3.2% | |
| | | | |
Apple, Inc. | | | | | 1,601 | | | | | | 337 | |
| | | | |
Cisco Systems, Inc. | | | | | 1,601 | | | | | | 76 | |
| | | | |
Intel Corp. | | | | | 1,601 | | | | | | 50 | |
| | | | |
International Business Machines Corp. | | | | | 1,601 | | | | | | 277 | |
| | | | |
Microsoft Corp. | | | | | 1,601 | | | | | | 715 | |
| | | | | | | | | | | | |
| | | | | SHARES | | | | | MARKET
VALUE
(000S) | |
| | | | |
NVIDIA Corp. | | | | | 33,926 | | | $ | | | 4,191 | |
| | | | |
Salesforce, Inc. | | | | | 1,601 | | | | | | 412 | |
| | | | | | | | | | | | |
| | | | | | | | | | | 6,058 | |
| | | | | | | | | | | | |
| |
| MATERIALS 0.1% | |
Dow, Inc. | | | | | 1,601 | | | | | | 85 | |
| | | | | | | | | | | | |
Total Common Stocks (Cost $13,565) | | | 13,724 | |
| | | | | | | | | | | | |
| |
| | | | | PRINCIPAL
AMOUNT
(000S) | | | | | | |
| CORPORATE BONDS & NOTES 13.0% | |
| |
| CANADA 0.4% | |
| |
| BANKING & FINANCE 0.4% | |
|
Bank of Nova Scotia | |
5.400% due 06/04/2027 | | $ | | | 700 | | | | | | 703 | |
| | | | | | | | | | | | |
Total Canada | | | | | | | | | | | 703 | |
| | | | | | | | | | | | |
| |
| CAYMAN ISLANDS 0.1% | |
| |
| INDUSTRIALS 0.1% | |
|
Sands China Ltd. | |
4.050% due 01/08/2026 | | | | | 200 | | | | | | 194 | |
| | | | | | | | | | | | |
Total Cayman Islands | | | | | | | | | | | 194 | |
| | | | | | | | | | | | |
| |
| DENMARK 0.7% | |
| |
| BANKING & FINANCE 0.7% | |
|
Nykredit Realkredit AS | |
1.000% due 04/01/2025 | | DKK | | | 4,500 | | | | | | 636 | |
|
Realkredit Danmark AS | |
1.000% due 04/01/2025 | | | | | 5,100 | | | | | | 720 | |
| | | | | | | | | | | | |
| | | | | | | | | | | 1,356 | |
| | | | | | | | | | | | |
Total Denmark | | | | | | | | | | | 1,356 | |
| | | | | | | | | | | | |
| |
| GERMANY 0.1% | |
| |
| BANKING & FINANCE 0.1% | |
|
Deutsche Bank AG | |
2.129% due 11/24/2026 • | | $ | | | 200 | | | | | | 190 | |
| | | | | | | | | | | | |
Total Germany | | | | | | | | | | | 190 | |
| | | | | | | | | | | | |
| |
| IRELAND 0.1% | |
| |
| BANKING & FINANCE 0.1% | |
|
AerCap Ireland Capital DAC | |
2.450% due 10/29/2026 | | | | | 200 | | | | | | 187 | |
| | | | | | | | | | | | |
Total Ireland | | | | | | | | | | | 187 | |
| | | | | | | | | | | | |
| |
| JAPAN 0.3% | |
| |
| BANKING & FINANCE 0.2% | |
|
Mizuho Financial Group, Inc. | |
5.382% due 07/10/2030 (a) | | | | | 400 | | | | | | 399 | |
| | | | | | | | | | | | |
| | | | | | | | | | | | |
| INDUSTRIALS 0.1% | |
|
Nissan Motor Co. Ltd. | |
4.345% due 09/17/2027 | | | | | 200 | | | | | | 191 | |
| | | | | | | | | | | | |
Total Japan | | | | | | | | | | | 590 | |
| | | | | | | | | | | | |
| |
| NETHERLANDS 0.5% | |
| |
| BANKING & FINANCE 0.5% | |
|
ING Groep NV | |
3.869% due 03/28/2026 • | | | | | 1,000 | | | | | | 986 | |
| | | | | | | | | | | | |
Total Netherlands | | | | | | | | | | | 986 | |
| | | | | | | | | | | | |
| |
| | | | | | | | | | | | |
| | | | | PRINCIPAL
AMOUNT
(000S) | | | | | MARKET
VALUE
(000S) | |
| SWITZERLAND 0.8% | |
| |
| BANKING & FINANCE 0.8% | |
|
UBS AG | |
6.629% (SOFRINDX + 1.260%) due 02/21/2025 ~ | | $ | | | 400 | | | $ | | | 402 | |
|
UBS Group AG | |
3.091% due 05/14/2032 • | | | | | 250 | | | | | | 213 | |
1.364% due 01/30/2027 • | | | | | 400 | | | | | | 374 | |
6.944% (SOFRRATE + 1.580%) due 05/12/2026 ~ | | | | | 400 | | | | | | 404 | |
| | | | | | | | | | | | |
| | | | | | | | | | | 1,393 | |
| | | | | | | | | | | | |
Total Switzerland | | | | | | | | | | | 1,393 | |
| | | | | | | | | | | | |
| |
| UNITED KINGDOM 1.0% | |
| |
| BANKING & FINANCE 1.0% | |
|
Barclays PLC | |
6.496% due 09/13/2027 • | | | | | 500 | | | | | | 508 | |
5.829% due 05/09/2027 • | | | | | 500 | | | | | | 501 | |
|
HSBC Holdings PLC | |
1.750% due 07/24/2027 • | | GBP | | | 300 | | | | | | 352 | |
2.357% due 08/18/2031 • | | $ | | | 300 | | | | | | 251 | |
|
Santander U.K. Group Holdings PLC | |
6.833% due 11/21/2026 • | | | | | 200 | | | | | | 203 | |
| | | | | | | | | | | | |
| | | | | | | | | | | 1,815 | |
| | | | | | | | | | | | |
Total United Kingdom | | | | | | | | | | | 1,815 | |
| | | | | | | | | | | | |
| |
| UNITED STATES 9.0% | |
| |
| BANKING & FINANCE 6.6% | |
|
Ally Financial, Inc. | |
5.800% due 05/01/2025 | | | | | 100 | | | | | | 100 | |
|
American Honda Finance Corp. | |
5.914% due 02/12/2025 • | | | | | 400 | | | | | | 401 | |
5.000% due 05/23/2025 | | | | | 500 | | | | | | 498 | |
|
Athene Global Funding | |
5.620% due 05/08/2026 | | | | | 600 | | | | | | 601 | |
|
Bank of America Corp. | |
5.080% due 01/20/2027 • | | | | | 1,300 | | | | | | 1,293 | |
6.684% (SOFRRATE + 1.330%) due 04/02/2026 ~ | | | | | 200 | | | | | | 201 | |
|
Bank of America NA | |
6.148% (SOFRRATE + 0.780%) due 08/18/2025 ~ | | | | | 100 | | | | | | 101 | |
|
Citibank NA | |
5.438% due 04/30/2026 | | | | | 1,000 | | | | | | 1,004 | |
5.488% due 12/04/2026 | | | | | 300 | | | | | | 302 | |
Credit Suisse AG AT1 Claim | | | | | 200 | | | | | | 24 | |
|
Ford Motor Credit Co. LLC | |
3.815% due 11/02/2027 | | | | | 200 | | | | | | 188 | |
5.800% due 03/05/2027 | | | | | 200 | | | | | | 200 | |
2.900% due 02/16/2028 | | | | | 200 | | | | | | 181 | |
|
GA Global Funding Trust | |
6.715% (SOFRRATE + 1.360%) due 04/11/2025 ~ | | | | | 600 | | | | | | 604 | |
|
Goldman Sachs Group, Inc. | |
6.430% (SOFRRATE + 1.065%) due 08/10/2026 ~ | | | | | 100 | | | | | | 100 | |
5.798% due 08/10/2026 • | | | | | 600 | | | | | | 600 | |
3.500% due 11/16/2026 | | | | | 200 | | | | | | 192 | |
3.615% due 03/15/2028 • | | | | | 100 | | | | | | 96 | |
1.431% due 03/09/2027 • | | | | | 400 | | | | | | 373 | |
3.500% due 04/01/2025 | | | | | 100 | | | | | | 98 | |
|
Jackson National Life Global Funding | |
5.600% due 04/10/2026 | | | | | 400 | | | | | | 399 | |
|
JPMorgan Chase & Co. | |
6.680% (SOFRRATE + 1.320%) due 04/26/2026 ~ | | | | | 1,000 | | | | | | 1,009 | |
|
JPMorgan Chase Bank NA | |
5.110% due 12/08/2026 | | | | | 300 | | | | | | 300 | |
|
Morgan Stanley | |
5.050% due 01/28/2027 • | | | | | 700 | | | | | | 696 | |
4.361% due 03/19/2027 ~ | | EUR | | | 200 | | | | | | 215 | |
| | | | | | |
| 12 | | PIMCO EQUITY SERIES VIT | | | See Accompanying Notes | |
| | | | | | | | |
| | | | | | June 30, 2024 | | (Unaudited) |
| | | | | | | | | | | | |
| | | | | PRINCIPAL
AMOUNT
(000S) | | | | | MARKET
VALUE
(000S) | |
|
Morgan Stanley Bank NA | |
5.504% due 05/26/2028 • | | $ | | | 250 | | | $ | | | 252 | |
5.882% due 10/30/2026 | | | | | 300 | | | | | | 304 | |
|
Nissan Motor Acceptance Co. LLC | |
2.750% due 03/09/2028 | | | | | 200 | | | | | | 178 | |
|
Toyota Motor Credit Corp. | |
5.860% due 08/22/2024 • | | | | | 500 | | | | | | 500 | |
|
VICI Properties LP | |
4.375% due 05/15/2025 | | | | | 300 | | | | | | 296 | |
|
Wells Fargo & Co. | |
3.196% due 06/17/2027 • | | | | | 500 | | | | | | 479 | |
5.707% due 04/22/2028 • | | | | | 100 | | | | | | 101 | |
6.303% due 10/23/2029 • | | | | | 100 | | | | | | 104 | |
|
Wells Fargo Bank NA | |
6.162% (SOFRRATE + 0.800%) due 08/01/2025 ~ | | | | | 300 | | | | | | 301 | |
| | | | | | | | | | | | |
| | | | | | | | | | | 12,291 | |
| | | | | | | | | | | | |
| | | | | | | | | | | | |
| INDUSTRIALS 1.7% | | | | | | | | | | | | |
|
Boeing Co. | |
4.875% due 05/01/2025 | | | | | 200 | | | | | | 198 | |
|
Carrier Global Corp. | |
4.375% due 05/29/2025 | | EUR | | | 100 | | | | | | 107 | |
|
DAE Funding LLC | |
1.550% due 08/01/2024 | | $ | | | 500 | | | | | | 498 | |
|
Daimler Truck Finance North America LLC | |
5.200% due 01/17/2025 | | | | | 200 | | | | | | 199 | |
|
Hyatt Hotels Corp. | |
1.800% due 10/01/2024 | | | | | 400 | | | | | | 396 | |
|
Hyundai Capital America | |
5.450% due 06/24/2026 | | | | | 100 | | | | | | 100 | |
6.512% due 08/04/2025 • | | | | | 500 | | | | | | 502 | |
|
Microchip Technology, Inc. | |
0.983% due 09/01/2024 | | | | | 300 | | | | | | 297 | |
|
Volkswagen Group of America Finance LLC | |
5.800% due 09/12/2025 | | | | | 250 | | | | | | 251 | |
6.302% (SOFRRATE + 0.930%) due 09/12/2025 ~ | | | | | 250 | | | | | | 252 | |
|
Warnermedia Holdings, Inc. | |
3.755% due 03/15/2027 | | | | | 200 | | | | | | 190 | |
3.638% due 03/15/2025 | | | | | 200 | | | | | | 197 | |
| | | | | | | | | | | | |
| | | | | | | | | | | 3,187 | |
| | | | | | | | | | | | |
| |
| UTILITIES 0.7% | | | | | | | | | | | | |
|
Georgia Power Co. | |
6.114% (SOFRINDX + 0.750%) due 05/08/2025 ~ | | | | | 600 | | | | | | 603 | |
|
NextEra Energy Capital Holdings, Inc. | |
6.051% due 03/01/2025 | | | | | 200 | | | | | | 200 | |
|
Pinnacle West Capital Corp. | |
6.191% (SOFRRATE + 0.820%) due 06/10/2026 ~ | | | | | 100 | | | | | | 100 | |
|
Southern California Edison Co. | |
5.150% due 06/01/2029 | | | | | 400 | | | | | | 400 | |
4.875% due 02/01/2027 | | | | | 100 | | | | | | 99 | |
| | | | | | | | | | | | |
| | | | | | | | | | | 1,402 | |
| | | | | | | | | | | | |
Total United States | | | | | | | | | | | 16,880 | |
| | | | | | | | | | | | |
Total Corporate Bonds & Notes (Cost $24,500) | | | 24,294 | |
| | | | |
| |
| NON-AGENCY MORTGAGE-BACKED SECURITIES 3.1% | |
| |
| UNITED KINGDOM 0.1% | |
| | | | |
Uropa Securities PLC | | | | | | | | | | | | |
5.552% due 10/10/2040 • | | GBP | | | 162 | | | | | | 202 | |
| | | | | | | | | | | | |
Total United Kingdom | | | | | | | | | | | 202 | |
| | | | | | | | | | | | |
| |
| | | | | | | | | | | | |
| | | | | PRINCIPAL
AMOUNT
(000S) | | | | | MARKET
VALUE
(000S) | |
| UNITED STATES 3.0% | |
|
Chase Home Lending Mortgage Trust | |
6.585% due 05/25/2055 • | | $ | | | 500 | | | $ | | | 501 | |
|
Colony Mortgage Capital Ltd. | |
6.572% due 11/15/2038 • | | | | | 600 | | | | | | 591 | |
|
Countrywide Alternative Loan Trust | |
5.820% due 04/25/2046 • | | | | | 194 | | | | | | 172 | |
|
Cross Mortgage Trust | |
6.093% due 04/25/2069 þ | | | | | 489 | | | | | | 488 | |
6.147% due 07/25/2069 þ | | | | | 500 | | | | | | 501 | |
|
Ellington Financial Mortgage Trust | |
5.900% due 09/25/2067 þ | | | | | 342 | | | | | | 341 | |
|
GCAT Trust | |
6.007% due 01/25/2059 þ | | | | | 458 | | | | | | 457 | |
|
Independence Plaza Trust | |
3.911% due 07/10/2035 | | | | | 300 | | | | | | 285 | |
|
JP Morgan Chase Commercial Mortgage Securities Trust | |
6.726% due 02/15/2035 • | | | | | 483 | | | | | | 476 | |
6.826% due 12/15/2031 • | | | | | 150 | | | | | | 135 | |
|
MASTR Adjustable Rate Mortgages Trust | |
5.994% due 11/21/2034 ~ | | | | | 60 | | | | | | 56 | |
|
Morgan Stanley Capital Trust | |
6.876% due 11/15/2034 • | | | | | 226 | | | | | | 225 | |
|
OBX Trust | |
6.520% due 07/25/2063 þ | | | | | 737 | | | | | | 740 | |
|
Towd Point Mortgage Trust | |
2.250% due 12/25/2061 ~ | | | | | 358 | | | | | | 341 | |
|
TTAN | |
6.293% due 03/15/2038 • | | | | | 309 | | | | | | 306 | |
| | | | | | | | | | | | |
Total United States | | | | | | | | | | | 5,615 | |
| | | | | | | | | | | | |
Total Non-Agency Mortgage-Backed Securities (Cost $5,901) | | | 5,817 | |
| | | | |
| |
| SOVEREIGN ISSUES 0.4% | |
| |
| BRAZIL 0.4% | |
|
Brazil Letras do Tesouro Nacional | |
0.000% due 04/01/2025 (d) | | BRL | | | 4,500 | | | | | | 745 | |
| | | | | | | | | | | | |
Total Sovereign Issues (Cost $771) | | | 745 | |
| | | | |
| |
| U.S. GOVERNMENT AGENCIES 3.6% | |
| |
| UNITED STATES 3.6% | |
|
Fannie Mae | |
5.750% due 12/25/2045 • | | $ | | | 173 | | | | | | 167 | |
5.893% due 09/25/2046 - 11/25/2059 • | | | | | 986 | | | | | | 974 | |
|
Freddie Mac | |
3.000% due 09/01/2032 | | | | | 420 | | | | | | 398 | |
5.883% due 07/15/2040 • | | | | | 81 | | | | | | 80 | |
5.898% due 07/15/2037 • | | | | | 11 | | | | | | 11 | |
5.978% due 10/15/2033 • | | | | | 83 | | | | | | 82 | |
6.427% due 09/01/2037 • | | | | | 125 | | | | | | 128 | |
|
Ginnie Mae | |
6.437% due 12/20/2066 • | | | | | 566 | | | | | | 567 | |
|
Uniform Mortgage-Backed Security | |
3.000% due 01/01/2027 | | | | | 78 | | | | | | 76 | |
|
Uniform Mortgage-Backed Security, TBA | |
5.500% due 08/01/2054 | | | | | 1,500 | | | | | | 1,479 | |
6.500% due 08/01/2054 | | | | | 2,700 | | | | | | 2,747 | |
| | | | | | | | | | | | |
Total U.S. Government Agencies (Cost $6,709) | | | 6,709 | |
| | | | |
| |
| | | | | | | | | | | | |
| | | | | PRINCIPAL
AMOUNT
(000S) | | | | | MARKET
VALUE
(000S) | |
| U.S. TREASURY OBLIGATIONS 23.0% | |
| |
| UNITED STATES 23.0% | |
|
U.S. Treasury Bonds | |
3.875% due 05/15/2043 | | $ | | | 400 | | | $ | | | 361 | |
4.125% due 08/15/2053 | | | | | 300 | | | | | | 280 | |
|
U.S. Treasury Floating Rate Notes | |
5.505% due 01/31/2025 •(i) | | | | | 18,000 | | | | | | 18,017 | |
|
U.S. Treasury Inflation Protected Securities (e) | |
0.125% due 10/15/2024 | | | | | 4,399 | | | | | | 4,355 | |
0.125% due 04/15/2025 | | | | | 364 | | | | | | 354 | |
0.125% due 10/15/2025 | | | | | 2,658 | | | | | | 2,571 | |
0.125% due 01/15/2031 | | | | | 361 | | | | | | 319 | |
0.250% due 01/15/2025 | | | | | 2,912 | | | | | | 2,852 | |
0.375% due 07/15/2025 | | | | | 2,776 | | | | | | 2,707 | |
0.625% due 01/15/2026 | | | | | 660 | | | | | | 638 | |
0.625% due 07/15/2032 | | | | | 324 | | | | | | 290 | |
0.750% due 02/15/2045 | | | | | 133 | | | | | | 100 | |
1.000% due 02/15/2048 | | | | | 127 | | | | | | 98 | |
|
U.S. Treasury Notes | |
0.375% due 09/30/2027 | | | | | 1,100 | | | | | | 965 | |
0.500% due 10/31/2027 | | | | | 600 | | | | | | 527 | |
0.625% due 11/30/2027 | | | | | 2,100 | | | | | | 1,846 | |
0.750% due 01/31/2028 | | | | | 7,810 | | | | | | 6,858 | |
| | | | | | | | | | | | |
Total U.S. Treasury Obligations (Cost $43,563) | | | 43,138 | |
| | | | |
| |
| SHORT-TERM INSTRUMENTS 15.2% | |
| |
| REPURCHASE AGREEMENTS (g) 0.5% | |
| | | | | | | | | | | 855 | |
| | | | | | | | | | | | |
| |
| SHORT-TERM NOTES 0.1% | | | | | | | | | | | | |
|
GreenState Auto Receivables Trust | |
5.601% due 02/18/2025 | | | | | 146 | | | | | | 146 | |
| | | | | | | | | | | | |
| |
| JAPAN TREASURY BILLS 10.3% | |
0.007% due 07/01/2024 - 09/30/2024 (c)(d) | | JPY | | | 3,120,000 | | | | | | 19,392 | |
| | | | | | | | | | | | |
| |
| U.S. TREASURY BILLS 4.3% | | | | | | | | | | | | |
5.392% due 08/15/2024 - 10/15/2024 (c)(d)(k) | | $ | | | 8,186 | | | | | | 8,097 | |
| | | | | | | | | | | | |
| Total Short-Term Instruments (Cost $29,081) | | | | | | 28,490 | |
| | | | | | | | | | | | |
| | | | |
| | | | | | | | | | | | |
| Total Investments in Securities (Cost $184,626) | | | | | | 182,966 | |
| | | | | | | | | | | | |
| |
| | | | | SHARES | | | | | | |
| INVESTMENTS IN AFFILIATES 0.5% | |
| |
| SHORT-TERM INSTRUMENTS 0.5% | |
| |
| CENTRAL FUNDS USED FOR CASH MANAGEMENT PURPOSES 0.5% | |
| | | |
PIMCO Short Asset Portfolio | | | 85,702 | | | | | | 836 | |
| | | |
PIMCO Short-Term Floating NAV Portfolio III | | | 214 | | | | | | 2 | |
| | | | | | | | | | | | |
Total Short-Term Instruments
(Cost $836) | | | | | | 838 | |
| | | | | | | | | | | | |
|
| |
Total Investments in Affiliates
(Cost $836) | | | | | | 838 | |
| | | | |
| | | | | | | | | | | | |
Total Investments 98.1%
(Cost $185,462) | | | $ | | | 183,804 | |
| |
Financial Derivative
Instruments (h)(j) 0.4% (Cost or Premiums, net $1,064) | | | | | | 728 | |
| |
| Other Assets and Liabilities, net 1.5% | | | 2,899 | |
| | | | | | | | | | | | |
| Net Assets 100.0% | | | $ | | | 187,431 | |
| | | | | | | | | | | | |
| | | | | | | | | | | | |
| See Accompanying Notes | | | SEMIANNUAL FINANCIAL AND OTHER INFORMATION | | | | | | | JUNE 30, 2024 | | | 13 |
| | | | | | | | |
| Schedule of Investments | | PIMCO StocksPLUS® Global Portfolio | | (Cont.) | | | | |
NOTES TO SCHEDULE OF INVESTMENTS:
| * | A zero balance may reflect actual amounts rounding to less than one thousand. |
| ~ | Variable or Floating rate security. Rate shown is the rate in effect as of period end. Certain variable rate securities are not based on a published reference rate and spread, rather are determined by the issuer or agent and are based on current market conditions. Reference rate is as of reset date, which may vary by security. These securities may not indicate a reference rate and/or spread in their description. |
| • | Rate shown is the rate in effect as of period end. The rate may be based on a fixed rate, a capped rate or a floor rate and may convert to a variable or floating rate in the future. These securities do not indicate a reference rate and spread in their description. |
| þ | Coupon represents a rate which changes periodically based on a predetermined schedule or event. Rate shown is the rate in effect as of period end. |
| (b) | Security did not produce income within the last twelve months. |
| (c) | Coupon represents a weighted average yield to maturity. |
| (e) | Principal amount of security is adjusted for inflation. |
| (f) | Restricted Securities. |
BORROWINGS AND OTHER FINANCING TRANSACTIONS
(g) REPURCHASE AGREEMENTS:
| | | | | | | | | | | | | | | | | | | | | | | | | | | | | | |
| Counterparty | | Lending
Rate | | | Settlement
Date | | | Maturity
Date | | | Principal
Amount | | | Collateralized By | | Collateral
(Received) | | | Repurchase
Agreements,
at Value | | | Repurchase
Agreement
Proceeds
to be
Received(1) | |
| FICC | | | 2.600 | % | | | 06/28/2024 | | | | 07/01/2024 | | | $ | 855 | | | U.S. Treasury Inflation Protected Securities 0.625% due 01/15/2026 | | $ | (872 | ) | | $ | 855 | | | $ | 855 | |
| | | | | | | | | | | | | | | | | | | | | | | | | | | | | | |
Total Repurchase Agreements | | | | | $ | (872 | ) | | $ | 855 | | | $ | 855 | |
| | | | | | | | | | | | | | | |
BORROWINGS AND OTHER FINANCING TRANSACTIONS SUMMARY
The following is a summary by counterparty of the market value of Borrowings and Other Financing Transactions and collateral pledged/(received) as of June 30, 2024:
| | | | | | | | | | | | | | | | | | | | | | | | |
| Counterparty | | Repurchase
Agreement
Proceeds
to be
Received(1) | | | Payable for
Reverse
Repurchase
Agreements | | | Payable for
Sale-Buyback
Transactions | | | Total
Borrowings and
Other Financing
Transactions | | | Collateral
Pledged/(Received) | | | Net Exposure(2) | |
Global/Master Repurchase Agreement | |
FICC | | $ | 855 | | | $ | 0 | | | $ | 0 | | | $ | 855 | | | $ | (872 | ) | | $ | (17 | ) |
| | | | | | | | | | | | | | | | | | | | | | | | |
Total Borrowings and Other Financing Transactions | | $ | 855 | | | $ | 0 | | | $ | 0 | | | | | | | | | | | | | |
| | | | | | | | | | | | | | | | | | | | | | | | |
| (1) | Includes accrued interest. |
| (2) | Net Exposure represents the net receivable/(payable) that would be due from/to the counterparty in the event of default. Exposure from borrowings and other financing transactions can only be netted across transactions governed under the same master agreement with the same legal entity. See Note 8, Master Netting Arrangements, in the Notes to Financial Statements for more information. |
(h) FINANCIAL DERIVATIVE INSTRUMENTS: EXCHANGE-TRADED OR CENTRALLY CLEARED
FUTURES CONTRACTS:
LONG FUTURES CONTRACTS
| | | | | | | | | | | | | | | | | | | | | | | | |
| Description | | Expiration
Month | | | # of
Contracts | | | Notional
Amount | | | Unrealized
Appreciation/
(Depreciation) | | | Variation Margin | |
| | Asset | | | Liability | |
3-Month SOFR Active Contract June Futures | | | 09/2024 | | | | 84 | | | $ | 19,877 | | | $ | 1 | | | $ | 1 | | | $ | 0 | |
E-mini S&P 500 Index September Futures | | | 09/2024 | | | | 339 | | | | 93,589 | | | | 119 | | | | 0 | | | | (415 | ) |
Mini MSCI EAFE Index September Futures | | | 09/2024 | | | | 804 | | | | 94,197 | | | | 367 | | | | 128 | | | | 0 | |
U.S. Treasury 2-Year Note September Futures | | | 09/2024 | | | | 20 | | | | 4,084 | | | | 6 | | | | 0 | | | | (1 | ) |
U.S. Treasury 5-Year Note September Futures | | | 09/2024 | | | | 4 | | | | 426 | | | | 2 | | | | 0 | | | | (1 | ) |
U.S. Treasury 10-Year Note September Futures | | | 09/2024 | | | | 18 | | | | 1,980 | | | | 11 | | | | 0 | | | | (5 | ) |
U.S. Treasury 10-Year Ultra Long-Term Bond September Futures | | | 09/2024 | | | | 7 | | | | 795 | | | | 4 | | | | 0 | | | | (3 | ) |
U.S. Treasury Long-Term Bond September Futures | | | 09/2024 | | | | 7 | | | | 828 | | | | 10 | | | | 0 | | | | (7 | ) |
U.S. Treasury Ultra Long-Term Bond September Futures | | | 09/2024 | | | | 5 | | | | 627 | | | | 5 | | | | 0 | | | | (8 | ) |
| | | | | | | | | | | | | | | | | | | | | | | | |
| | | | | | | | | | | | | | $ | 525 | | | $ | 129 | | | $ | (440 | ) |
| | | | | | | | | | | | | | | | | | | | | | | | |
| | | | | | |
| 14 | | PIMCO EQUITY SERIES VIT | | | See Accompanying Notes | |
| | | | | | | | |
| | | | | | June 30, 2024 | | (Unaudited) |
| | | | | | | | | | | | | | | | | | | | | | | | |
| SHORT FUTURES CONTRACTS | | | | | | | | | | | | | | | | | | |
| | | | | |
| Description | | Expiration
Month | | | # of
Contracts | | | Notional
Amount | | | Unrealized
Appreciation/
(Depreciation) | | | Variation Margin | |
| | Asset | | | Liability | |
E-Mini DJIA Index September Futures | | | 09/2024 | | | | 48 | | | $ | (9,473 | ) | | $ | (100 | ) | | $ | 19 | | | $ | 0 | |
United Kingdom Long Gilt September Futures | | | 09/2024 | | | | 1 | | | | (123 | ) | | | (1 | ) | | | 1 | | | | 0 | |
| | | | | | | | | | | | | | | | | | | | | | | | |
| | | | | | | | | | | | | | $ | (101 | ) | | $ | 20 | | | $ | 0 | |
| | | | | | | | | | | | | | | | | | | | | | | | |
Total Futures Contracts | | | | | | | | | | | | | | $ | 424 | | | $ | 149 | | | $ | (440 | ) |
| | | | | | | | | | | | | | | | | | | | | | | | |
SWAP AGREEMENTS:
CREDIT DEFAULT SWAPS ON CORPORATE ISSUES - SELL PROTECTION(1)
| | | | | | | | | | | | | | | | | | | | | | | | | | | | | | | | | | | | | | | | |
| Reference Entity | | Fixed
Receive Rate | | | Payment
Frequency | | | Maturity
Date | | | Implied
Credit Spread at
June 30, 2024(2) | | | Notional
Amount(3) | | | Premiums
Paid/(Received) | | | Unrealized
Appreciation/
(Depreciation) | | | Market
Value(4) | | | Variation Margin | |
| | Asset | | | Liability | |
AT&T, Inc. | | | 1.000 | % | | | Quarterly | | | | 12/20/2026 | | | | 0.451 | % | | | $ 100 | | | $ | 2 | | | $ | (1 | ) | | $ | 1 | | | $ | 0 | | | $ | 0 | |
General Motors Co. | | | 5.000 | | | | Quarterly | | | | 12/20/2026 | | | | 0.476 | | | | 240 | | | | 42 | | | | (16 | ) | | | 26 | | | | 0 | | | | 0 | |
General Motors Co. | | | 5.000 | | | | Quarterly | | | | 06/20/2028 | | | | 0.844 | | | | 350 | | | | 42 | | | | 11 | | | | 53 | | | | 0 | | | | 0 | |
Southwest Airlines Co. | | | 1.000 | | | | Quarterly | | | | 12/20/2026 | | | | 0.595 | | | | 100 | | | | 0 | | | | 1 | | | | 1 | | | | 0 | | | | 0 | |
Tesco PLC | | | 1.000 | | | | Quarterly | | | | 12/20/2027 | | | | 0.398 | | | | EUR 400 | | | | 0 | | | | 9 | | | | 9 | | | | 0 | | | | 0 | |
| | | | | | | | | | | | | | | | | | | | | | | | | | | | | | | | | | | | | | | | |
| | | | | | | | | | | | | | | | | | | | | | $ | 86 | | | $ | 4 | | | $ | 90 | | | $ | 0 | | | $ | 0 | |
| | | | | | | | | | | | | | | | | | | | | | | | | | | | | | | | | | | | | | | | |
CREDIT DEFAULT SWAPS ON CREDIT INDICES - SELL PROTECTION(1)
| | | | | | | | | | | | | | | | | | | | | | | | | | | | | | | | | | | | |
| Index/Tranches | | Fixed
Receive Rate | | | Payment
Frequency | | | Maturity
Date | | | Notional
Amount(3) | | | Premiums
Paid/(Received) | | | Unrealized
Appreciation/
(Depreciation) | | | Market
Value(4) | | | Variation Margin | |
| | Asset | | | Liability | |
CDX.EM-34 5-Year Index | | | 1.000 | % | | | Quarterly | | | | 12/20/2025 | | | | $ 368 | | | $ | (11 | ) | | $ | 8 | | | $ | (3 | ) | | $ | 0 | | | $ | 0 | |
CDX.EM-40 5-Year Index | | | 1.000 | | | | Quarterly | | | | 12/20/2028 | | | | 300 | | | | (10 | ) | | | 3 | | | | (7 | ) | | | 0 | | | | 0 | |
CDX.EM-41 5-Year Index | | | 1.000 | | | | Quarterly | | | | 06/20/2029 | | | | 200 | | | | (8 | ) | | | 2 | | | | (6 | ) | | | 0 | | | | 0 | |
CDX.HY-42 5-Year Index | | | 5.000 | | | | Quarterly | | | | 06/20/2029 | | | | 1,900 | | | | 132 | | | | (11 | ) | | | 121 | | | | 0 | | | | (1 | ) |
CDX.IG-40 5-Year Index | | | 1.000 | | | | Quarterly | | | | 06/20/2028 | | | | 400 | | | | 6 | | | | 2 | | | | 8 | | | | 0 | | | | 0 | |
CDX.IG-41 5-Year Index | | | 1.000 | | | | Quarterly | | | | 12/20/2028 | | | | 3,000 | | | | 66 | | | | (2 | ) | | | 64 | | | | 0 | | | | 0 | |
CDX.IG-42 5-Year Index | | | 1.000 | | | | Quarterly | | | | 06/20/2029 | | | | 40,300 | | | | 885 | | | | (48 | ) | | | 837 | | | | 0 | | | | (4 | ) |
| | | | | | | | | | | | | | | | | | | | | | | | | | | | | | | | | | | | |
| | | | | | | | | | | | | | | $ | 1,060 | | | $ | (46 | ) | | $ | 1,014 | | | $ | 0 | | | $ | (5 | ) |
| | | | | | | | | | | | | | | | | | | | | | | | | | | | | | | | | |
INTEREST RATE SWAPS
| | | | | | | | | | | | | | | | | | | | | | | | | | | | | | | | | | | | |
Pay/Receive
Floating Rate | | Floating Rate Index | | Fixed Rate | | | Payment
Frequency | | Maturity
Date | | | Notional
Amount | | | Premiums
Paid/(Received) | | | Unrealized
Appreciation/
(Depreciation) | | | Market
Value | | | Variation Margin | |
| | Asset | | | Liability | |
Receive | | 1-Day USD-SOFR Compounded-OIS | | | 4.500 | % | | Annual | | | 06/20/2025 | | | $ | 27,900 | | | $ | (96 | ) | | $ | 251 | | | $ | 155 | | | $ | 0 | | | $ | 0 | |
Receive | | 1-Day USD-SOFR Compounded-OIS | | | 0.500 | | | Semi-Annual | | | 06/16/2026 | | | | 13,000 | | | | 110 | | | | 973 | | | | 1,083 | | | | 6 | | | | 0 | |
Receive | | 1-Day USD-SOFR Compounded-OIS | | | 3.650 | | | Annual | | | 05/31/2028 | | | | 2,100 | | | | 0 | | | | 43 | | | | 43 | | | | 2 | | | | 0 | |
Receive | | 1-Day USD-SOFR Compounded-OIS | | | 3.655 | | | Annual | | | 05/31/2028 | | | | 200 | | | | 0 | | | | 4 | | | | 4 | | | | 0 | | | | 0 | |
Receive | | 1-Day USD-SOFR Compounded-OIS | | | 3.662 | | | Annual | | | 05/31/2028 | | | | 2,400 | | | | 0 | | | | 48 | | | | 48 | | | | 3 | | | | 0 | |
Receive | | 1-Day USD-SOFR Compounded-OIS | | | 3.807 | | | Annual | | | 05/31/2028 | | | | 100 | | | | 0 | | | | 1 | | | | 1 | | | | 0 | | | | 0 | |
Receive | | 1-Day USD-SOFR Compounded-OIS | | | 3.750 | | | Annual | | | 06/20/2028 | | | | 10,190 | | | | (87 | ) | | | 247 | | | | 160 | | | | 12 | | | | 0 | |
Receive | | 1-Day USD-SOFR Compounded-OIS | | | 3.250 | | | Annual | | | 06/21/2028 | | | | 1,300 | | | | 4 | | | | 40 | | | | 44 | | | | 2 | | | | 0 | |
Receive | | 1-Day USD-SOFR Compounded-OIS | | | 3.750 | | | Annual | | | 12/20/2028 | | | | 700 | | | | 3 | | | | 14 | | | | 17 | | | | 1 | | | | 0 | |
Receive | | 1-Day USD-SOFR Compounded-OIS | | | 3.000 | | | Annual | | | 06/21/2030 | | | | 900 | | | | 13 | | | | 36 | | | | 49 | | | | 3 | | | | 0 | |
Receive | | 1-Day USD-SOFR Compounded-OIS | | | 3.500 | | | Annual | | | 12/20/2030 | | | | 500 | | | | 6 | | | | 13 | | | | 19 | | | | 2 | | | | 0 | |
Receive | | 1-Day USD-SOFR Compounded-OIS | | | 3.750 | | | Annual | | | 06/20/2033 | | | | 4,800 | | | | (94 | ) | | | 172 | | | | 78 | | | | 25 | | | | 0 | |
Receive | | 1-Day USD-SOFR Compounded-OIS | | | 2.000 | | | Semi-Annual | | | 01/15/2050 | | | | 100 | | | | (18 | ) | | | 52 | | | | 34 | | | | 1 | | | | 0 | |
Receive | | 1-Day USD-SOFR Compounded-OIS | | | 1.625 | | | Semi-Annual | | | 01/16/2050 | | | | 200 | | | | (19 | ) | | | 99 | | | | 80 | | | | 2 | | | | 0 | |
Receive | | 1-Day USD-SOFR Compounded-OIS | | | 1.750 | | | Semi-Annual | | | 01/22/2050 | | | | 700 | | | | (86 | ) | | | 352 | | | | 266 | | | | 9 | | | | 0 | |
Receive | | 1-Day USD-SOFR Compounded-OIS | | | 1.625 | | | Semi-Annual | | | 02/03/2050 | | | | 400 | | | | (37 | ) | | | 197 | | | | 160 | | | | 5 | | | | 0 | |
Receive | | 1-Day USD-SOFR Compounded-OIS | | | 1.250 | | | Semi-Annual | | | 06/16/2051 | | | | 1,200 | | | | 219 | | | | 344 | | | | 563 | | | | 15 | | | | 0 | |
| | | | | | | | | | | | | | | | | | | | | | | | | | | | | | | | | | | | |
| | | $ | (82 | ) | | $ | 2,886 | | | $ | 2,804 | | | $ | 88 | | | $ | 0 | |
| | | | | | | | | | | | | | | | | | | | | |
Total Swap Agreements | | | $ | 1,064 | | | $ | 2,844 | | | $ | 3,908 | | | $ | 88 | | | $ | (5 | ) |
| | | | | | | | | | | | | | | | | | | | | |
| | | | | | | | | | | | |
| See Accompanying Notes | | | SEMIANNUAL FINANCIAL AND OTHER INFORMATION | | | | | | | JUNE 30, 2024 | | | 15 |
| | | | | | | | |
| Schedule of Investments | | PIMCO StocksPLUS® Global Portfolio | | (Cont.) | | | | |
FINANCIAL DERIVATIVE INSTRUMENTS: EXCHANGE-TRADED OR CENTRALLY CLEARED SUMMARY
The following is a summary of the market value and variation margin of Exchange-Traded or Centrally Cleared Financial Derivative Instruments as of June 30, 2024:
| | | | | | | | | | | | | | | | | | | | | | | | | | | | | | | | | | | | |
| | | Financial Derivative Assets | | | | | | Financial Derivative Liabilities | |
| | | Market Value | | | Variation Margin
Asset | | | | | | | | | Market Value | | | Variation Margin
Liability(5) | | | | |
| | | Purchased
Options | | | Futures | | | Swap
Agreements | | | Total | | | | | | Written
Options | | | Futures | | | Swap
Agreements | | | Total | |
Total Exchange-Traded or Centrally Cleared | | $ | 0 | | | $ | 149 | | | $ | 88 | | | $ | 237 | | | | | | | $ | 0 | | | $ | (442) | | | $ | (5) | | | $ | (447) | |
| | | | | | | | | | | | | | | | | | | | | | | | | | | | | | | | | | | | |
| (i) | Securities with an aggregate market value of $1,587 and cash of $8,063 have been pledged as collateral for exchange-traded and centrally cleared financial derivative instruments as of June 30, 2024. See Note 8, Master Netting Arrangements, in the Notes to Financial Statements for more information. |
| (1) | If the Portfolio is a seller of protection and a credit event occurs, as defined under the terms of that particular swap agreement, the Portfolio will either (i) pay to the buyer of protection an amount equal to the notional amount of the swap and take delivery of the referenced obligation or underlying securities comprising the referenced index or (ii) pay a net settlement amount in the form of cash, securities or other deliverable obligations equal to the notional amount of the swap less the recovery value of the referenced obligation or underlying securities comprising the referenced index. |
| (2) | Implied credit spreads, represented in absolute terms, utilized in determining the market value of credit default swap agreements on issues as of period end serve as indicators of the current status of the payment/performance risk and represent the likelihood or risk of default for the credit derivative. The implied credit spread of a particular referenced entity reflects the cost of buying/selling protection and may include upfront payments required to be made to enter into the agreement. Wider credit spreads represent a deterioration of the referenced entity’s credit soundness and a greater likelihood or risk of default or other credit event occurring as defined under the terms of the agreement. |
| (3) | The maximum potential amount the Portfolio could be required to pay as a seller of credit protection or receive as a buyer of credit protection if a credit event occurs as defined under the terms of that particular swap agreement. |
| (4) | The prices and resulting values for credit default swap agreements serve as indicators of the current status of the payment/performance risk and represent the likelihood of an expected liability (or profit) for the credit derivative should the notional amount of the swap agreement be closed/sold as of the period end. Increasing market values, in absolute terms when compared to the notional amount of the swap, represent a deterioration of the underlying referenced instrument’s credit soundness and a greater likelihood or risk of default or other credit event occurring as defined under the terms of the agreement. |
| (5) | Unsettled variation margin liability of $(2) for closed futures is outstanding at period end. |
(j) FINANCIAL DERIVATIVE INSTRUMENTS: OVER THE COUNTER
FORWARD FOREIGN CURRENCY CONTRACTS:
| | | | | | | | | | | | | | | | | | | | | | | | |
Counterparty | | Settlement
Month | | | Currency to
be Delivered | | | Currency to
be Received | | | Unrealized Appreciation/
(Depreciation) | |
| | Asset | | | Liability | |
| | | | | | | |
BOA | | | 08/2024 | | | JPY | | | 550,000 | | | $ | | | 3,580 | | | $ | 136 | | | $ | 0 | |
| | | | | | | |
BPS | | | 07/2024 | | | | | | 260,000 | | | | | | 1,747 | | | | 128 | | | | 0 | |
| | | 07/2024 | | | KRW | | | 964,062 | | | | | | 700 | | | | 1 | | | | 0 | |
| | | 07/2024 | | | TWD | | | 13,824 | | | | | | 427 | | | | 2 | | | | 0 | |
| | | 07/2024 | | | $ | | | 687 | | | AUD | | | 1,031 | | | | 1 | | | | 0 | |
| | | 07/2024 | | | | | | 2,423 | | | EUR | | | 2,265 | | | | 3 | | | | (1 | ) |
| | | 07/2024 | | | | | | 50 | | | IDR | | | 819,320 | | | | 0 | | | | 0 | |
| | | 07/2024 | | | | | | 69 | | | INR | | | 5,808 | | | | 0 | | | | 0 | |
| | | 07/2024 | | | | | | 349 | | | SGD | | | 474 | | | | 0 | | | | 0 | |
| | | 08/2024 | | | AUD | | | 1,031 | | | $ | | | 688 | | | | 0 | | | | (1 | ) |
| | | 08/2024 | | | EUR | | | 2,157 | | | | | | 2,310 | | | | 0 | | | | (3 | ) |
| | | 08/2024 | | | SGD | | | 473 | | | | | | 349 | | | | 0 | | | | 0 | |
| | | | | | | |
BRC | | | 07/2024 | | | JPY | | | 140,000 | | | | | | 938 | | | | 68 | | | | 0 | |
| | | 07/2024 | | | MXN | | | 1,142 | | | | | | 62 | | | | 0 | | | | (1 | ) |
| | | 07/2024 | | | SGD | | | 474 | | | | | | 351 | | | | 1 | | | | 0 | |
| | | 07/2024 | | | $ | | | 12 | | | DKK | | | 80 | | | | 0 | | | | 0 | |
| | | 07/2024 | | | | | | 752 | | | PLN | | | 3,003 | | | | 0 | | | | (6 | ) |
| | | 09/2024 | | | JPY | | | 710,000 | | | $ | | | 4,566 | | | | 101 | | | | (1 | ) |
| | | 09/2024 | | | MXN | | | 1,022 | | | | | | 55 | | | | 0 | | | | (1 | ) |
| | | 09/2024 | | | $ | | | 221 | | | MXN | | | 4,214 | | | | 6 | | | | 0 | |
| | | | | | | |
BSH | | | 07/2024 | | | BRL | | | 2,400 | | | $ | | | 476 | | | | 46 | | | | 0 | |
| | | 07/2024 | | | $ | | | 432 | | | BRL | | | 2,400 | | | | 0 | | | | (2 | ) |
| | | | | | | |
CBK | | | 07/2024 | | | BRL | | | 800 | | | $ | | | 144 | | | | 1 | | | | 0 | |
| | | 07/2024 | | | GBP | | | 862 | | | | | | 1,097 | | | | 7 | | | | 0 | |
| | | 07/2024 | | | $ | | | 147 | | | BRL | | | 800 | | | | 0 | | | | (4 | ) |
| | | 08/2024 | | | BRL | | | 803 | | | $ | | | 147 | | | | 4 | | | | 0 | |
| | | 10/2024 | | | CNH | | | 8,365 | | | | | | 1,162 | | | | 6 | | | | 0 | |
| | | | | | | |
DUB | | | 07/2024 | | | AUD | | | 758 | | | | | | 502 | | | | 0 | | | | (4 | ) |
| | | | | | | |
FAR | | | 07/2024 | | | NZD | | | 326 | | | | | | 199 | | | | 0 | | | | 0 | |
| | | 07/2024 | | | $ | | | 716 | | | JPY | | | 114,123 | | | | 0 | | | | (7 | ) |
| | | 08/2024 | | | JPY | | | 113,588 | | | $ | | | 716 | | | | 7 | | | | 0 | |
| | | 08/2024 | | | $ | | | 199 | | | NZD | | | 326 | | | | 0 | | | | 0 | |
| | | | | | |
| 16 | | PIMCO EQUITY SERIES VIT | | | See Accompanying Notes | |
| | | | | | | | |
| | | | | | June 30, 2024 | | (Unaudited) |
| | | | | | | | | | | | | | | | | | | | | | | | |
Counterparty | | Settlement
Month | | | Currency to
be Delivered | | | Currency to
be Received | | | Unrealized Appreciation/
(Depreciation) | |
| | Asset | | | Liability | |
| | | | | | | |
GLM | | | 07/2024 | | | BRL | | | 4,000 | | | $ | | | 746 | | | $ | 30 | | | $ | 0 | |
| | | 07/2024 | | | KRW | | | 88,533 | | | | | | 64 | | | | 0 | | | | 0 | |
| | | 07/2024 | | | TWD | | | 3,182 | | | | | | 98 | | | | 0 | | | | 0 | |
| | | 07/2024 | | | $ | | | 740 | | | BRL | | | 4,000 | | | | 0 | | | | (24 | ) |
| | | 07/2024 | | | | | | 221 | | | MXN | | | 4,104 | | | | 3 | | | | 0 | |
| | | 08/2024 | | | BRL | | | 458 | | | $ | | | 89 | | | | 8 | | | | 0 | |
| | | 04/2025 | | | | | | 4,400 | | | | | | 789 | | | | 26 | | | | 0 | |
| | | 04/2025 | | | DKK | | | 3,100 | | | | | | 458 | | | | 6 | | | | 0 | |
| | | | | | | |
JPM | | | 07/2024 | | | BRL | | | 1,199 | | | | | | 229 | | | | 15 | | | | 0 | |
| | | 07/2024 | | | CAD | | | 1,031 | | | | | | 750 | | | | 0 | | | | (3 | ) |
| | | 07/2024 | | | CHF | | | 281 | | | | | | 318 | | | | 5 | | | | 0 | |
| | | 07/2024 | | | DKK | | | 121 | | | | | | 17 | | | | 0 | | | | 0 | |
| | | 07/2024 | | | KRW | | | 88,298 | | | | | | 64 | | | | 0 | | | | 0 | |
| | | 07/2024 | | | TWD | | | 4,583 | | | | | | 142 | | | | 1 | | | | 0 | |
| | | 07/2024 | | | $ | | | 216 | | | BRL | | | 1,199 | | | | 0 | | | | (1 | ) |
| | | 07/2024 | | | | | | 1,065 | | | CHF | | | 955 | | | | 0 | | | | (1 | ) |
| | | 07/2024 | | | | | | 277 | | | EUR | | | 259 | | | | 0 | | | | 0 | |
| | | 07/2024 | | | | | | 29 | | | INR | | | 2,446 | | | | 0 | | | | 0 | |
| | | 08/2024 | | | CHF | | | 952 | | | $ | | | 1,065 | | | | 1 | | | | 0 | |
| | | 08/2024 | | | $ | | | 17 | | | DKK | | | 120 | | | | 0 | | | | 0 | |
| | | 09/2024 | | | | | | 129 | | | BRL | | | 703 | | | | 0 | | | | (4 | ) |
| | | 04/2025 | | | BRL | | | 100 | | | $ | | | 18 | | | | 0 | | | | 0 | |
| | | | | | | |
MBC | | | 07/2024 | | | EUR | | | 1,466 | | | | | | 1,596 | | | | 26 | | | | 0 | |
| | | 07/2024 | | | JPY | | | 114,220 | | | | | | 726 | | | | 16 | | | | 0 | |
| | | 07/2024 | | | $ | | | 753 | | | CAD | | | 1,032 | | | | 1 | | | | 0 | |
| | | 07/2024 | | | | | | 1,094 | | | GBP | | | 862 | | | | 0 | | | | (4 | ) |
| | | 07/2024 | | | | | | 37 | | | INR | | | 3,057 | | | | 0 | | | | 0 | |
| | | 08/2024 | | | CAD | | | 1,031 | | | $ | | | 753 | | | | 0 | | | | (1 | ) |
| | | 08/2024 | | | GBP | | | 547 | | | | | | 692 | | | | 1 | | | | 0 | |
| | | 09/2024 | | | JPY | | | 310,000 | | | | | | 2,018 | | | | 71 | | | | 0 | |
| | | | | | | |
MYI | | | 07/2024 | | | CHF | | | 675 | | | | | | 754 | | | | 3 | | | | 0 | |
| | | 07/2024 | | | DKK | | | 83 | | | | | | 12 | | | | 0 | | | | 0 | |
| | | 07/2024 | | | TWD | | | 5,050 | | | | | | 156 | | | | 1 | | | | 0 | |
| | | 07/2024 | | | $ | | | 1,015 | | | INR | | | 84,946 | | | | 4 | | | | 0 | |
| | | 07/2024 | | | | | | 300 | | | NZD | | | 489 | | | | 0 | | | | (2 | ) |
| | | 08/2024 | | | | | | 12 | | | DKK | | | 83 | | | | 0 | | | | 0 | |
| | | 09/2024 | | | JPY | | | 570,000 | | | $ | | | 3,632 | | | | 44 | | | | 0 | |
| | | 04/2025 | | | DKK | | | 3,500 | | | | | | 517 | | | | 6 | | | | 0 | |
| | | | | | | |
NGF | | | 07/2024 | | | JPY | | | 450,000 | | | | | | 2,983 | | | | 178 | | | | 0 | |
| | | | | | | |
RYL | | | 07/2024 | | | AUD | | | 273 | | | | | | 182 | | | | 0 | | | | 0 | |
| | | | | | | |
SCX | | | 07/2024 | | | EUR | | | 1,058 | | | | | | 1,137 | | | | 4 | | | | 0 | |
| | | 07/2024 | | | KRW | | | 443,573 | | | | | | 322 | | | | 0 | | | | 0 | |
| | | 07/2024 | | | TWD | | | 10,566 | | | | | | 327 | | | | 2 | | | | 0 | |
| | | 07/2024 | | | $ | | | 770 | | | ZAR | | | 14,189 | | | | 9 | | | | 0 | |
| | | | | | | |
SSB | | | 09/2024 | | | JPY | | | 130,000 | | | $ | | | 841 | | | | 25 | | | | 0 | |
| | | | | | | |
TOR | | | 07/2024 | | | NZD | | | 163 | | | | | | 100 | | | | 1 | | | | 0 | |
| | | 08/2024 | | | $ | | | 100 | | | NZD | | | 163 | | | | 0 | | | | (1 | ) |
| | | | | | | |
UAG | | | 07/2024 | | | | | | 18 | | | DKK | | | 124 | | | | 0 | | | | 0 | |
| | | 04/2025 | | | DKK | | | 3,000 | | | $ | | | 443 | | | | 5 | | | | 0 | |
| | | | | | | | | | | | | | | | | | | | | | | | |
Total Forward Foreign Currency Contracts | | | $ | 1,010 | | | $ | (72 | ) |
| | | | | | | | | |
SWAP AGREEMENTS:
TOTAL RETURN SWAPS ON SECURITIES
| | | | | | | | | | | | | | | | | | | | | | | | | | | | | | | | | | | | |
| Counterparty | | Pay/Receive(1) | | Underlying Reference | | # of Shares | | | Financing Rate | | Payment
Frequency | | | Maturity
Date | | | Notional
Amount | | Premiums
paid/(Received) | | | Unrealized
Appreciation/
(Depreciation) | | | Swap Agreements,
at Value | |
| | Asset | | | Liability | |
MEI | | Pay | | NVIDIA Corp. | | | 33,926 | | | 5.940% (1- Month USD- LIBOR plus a specified spread) | | | Monthly | | | | 07/26/2024 | | | $ 4,191 | | $ | 0 | | | $ | 0 | | | $ | 0 | | | $ | 0 | |
| | | | | | | | | | | | | | | | | | | | | | | | | | | | | | | | | | | | |
Total Swap Agreements | | | | | | | | | | | | | | | | | | $ | 0 | | | $ | 0 | | | $ | 0 | | | $ | 0 | |
| | | | | | | | | | | | | | | | | | | | | | | | | | | | | | | | | | | | |
| | | | | | | | | | | | |
| See Accompanying Notes | | | SEMIANNUAL FINANCIAL AND OTHER INFORMATION | | | | | | | JUNE 30, 2024 | | | 17 |
| | | | | | | | |
| Schedule of Investments | | PIMCO StocksPLUS® Global Portfolio | | (Cont.) | | | | |
FINANCIAL DERIVATIVE INSTRUMENTS: OVER THE COUNTER SUMMARY
The following is a summary by counterparty of the market value of OTC financial derivative instruments and collateral pledged/(received) as of June 30, 2024:
| | | | | | | | | | | | | | | | | | | | | | | | | | | | | | | | | | | | | | | | | | | | | | | | |
| | | Financial Derivative Assets | | | | | | Financial Derivative Liabilities | | | | | | | | | | |
| Counterparty | | Forward
Foreign
Currency
Contracts | | | Purchased
Options | | | Swap
Agreements | | | Total
Over the
Counter | | | | | | Forward
Foreign
Currency
Contracts | | | Written
Options | | | Swap
Agreements | | | Total
Over the
Counter | | | Net Market
Value of OTC
Derivatives | | | Collateral
Pledged/
(Received) | | | Net
Exposure(2) | |
BOA | | $ | 136 | | | $ | 0 | | | $ | 0 | | | $ | 136 | | | | | | | $ | 0 | | | $ | 0 | | | $ | 0 | | | $ | 0 | | | $ | 136 | | | $ | 383 | | | $ | 519 | |
BPS | | | 135 | | | | 0 | | | | 0 | | | | 135 | | | | | | | | (5 | ) | | | 0 | | | | 0 | | | | (5 | ) | | | 130 | | | | 0 | | | | 130 | |
BRC | | | 176 | | | | 0 | | | | 0 | | | | 176 | | | | | | | | (9 | ) | | | 0 | | | | 0 | | | | (9 | ) | | | 167 | | | | 0 | | | | 167 | |
BSH | | | 46 | | | | 0 | | | | 0 | | | | 46 | | | | | | | | (2 | ) | | | 0 | | | | 0 | | | | (2 | ) | | | 44 | | | | 0 | | | | 44 | |
CBK | | | 18 | | | | 0 | | | | 0 | | | | 18 | | | | | | | | (4 | ) | | | 0 | | | | 0 | | | | (4 | ) | | | 14 | | | | 0 | | | | 14 | |
DUB | | | 0 | | | | 0 | | | | 0 | | | | 0 | | | | | | | | (4 | ) | | | 0 | | | | 0 | | | | (4 | ) | | | (4 | ) | | | 0 | | | | (4 | ) |
FAR | | | 7 | | | | 0 | | | | 0 | | | | 7 | | | | | | | | (7 | ) | | | 0 | | | | 0 | | | | (7 | ) | | | 0 | | | | 0 | | | | 0 | |
GLM | | | 73 | | | | 0 | | | | 0 | | | | 73 | | | | | | | | (24 | ) | | | 0 | | | | 0 | | | | (24 | ) | | | 49 | | | | 0 | | | | 49 | |
JPM | | | 22 | | | | 0 | | | | 0 | | | | 22 | | | | | | | | (9 | ) | | | 0 | | | | 0 | | | | (9 | ) | | | 13 | | | | 0 | | | | 13 | |
MBC | | | 115 | | | | 0 | | | | 0 | | | | 115 | | | | | | | | (5 | ) | | | 0 | | | | 0 | | | | (5 | ) | | | 110 | | | | (260 | ) | | | (150 | ) |
MYI | | | 58 | | | | 0 | | | | 0 | | | | 58 | | | | | | | | (2 | ) | | | 0 | | | | 0 | | | | (2 | ) | | | 56 | | | | (30 | ) | | | 26 | |
NGF | | | 178 | | | | 0 | | | | 0 | | | | 178 | | | | | | | | 0 | | | | 0 | | | | 0 | | | | 0 | | | | 178 | | | | 0 | | | | 178 | |
SCX | | | 15 | | | | 0 | | | | 0 | | | | 15 | | | | | | | | 0 | | | | 0 | | | | 0 | | | | 0 | | | | 15 | | | | 0 | | | | 15 | |
SSB | | | 25 | | | | 0 | | | | 0 | | | | 25 | | | | | | | | 0 | | | | 0 | | | | 0 | | | | 0 | | | | 25 | | | | 0 | | | | 25 | |
TOR | | | 1 | | | | 0 | | | | 0 | | | | 1 | | | | | | | | (1 | ) | | | 0 | | | | 0 | | | | (1 | ) | | | 0 | | | | 0 | | | | 0 | |
UAG | | | 5 | | | | 0 | | | | 0 | | | | 5 | | | | | | | | 0 | | | | 0 | | | | 0 | | | | 0 | | | | 5 | | | | (10 | ) | | | (5 | ) |
| | | | | | | | | | | | | | | | | | | | | | | | | | | | | | | | | | | | | | | | | | | | | | | | |
Total Over the Counter | | $ | 1,010 | | | $ | 0 | | | $ | 0 | | | $ | 1,010 | | | | | | | $ | (72 | ) | | $ | 0 | | | $ | 0 | | | $ | (72 | ) | | | | | | | | | | | | |
| | | | | | | | | | | | | | | | | | | | | | | | | | | | | | | | | | | | | | | | | | | | | | | | |
| (k) | Securities with an aggregate market value of $383 have been pledged as collateral for financial derivative instruments as governed by International Swaps and Derivatives Association, Inc. master agreements as of June 30, 2024. |
| (1) | Receive represents that the Portfolio receives payments for any positive net return on the underlying reference. The Portfolio makes payments for any negative net return on such underlying reference. Pay represents that the Portfolio receives payments for any negative net return on the underlying reference. The Portfolio makes payments for any positive net return on such underlying reference. |
| (2) | Net Exposure represents the net receivable/(payable) that would be due from/to the counterparty in the event of default. Exposure from OTC financial derivative instruments can only be netted across transactions governed under the same master agreement with the same legal entity. See Note 8, Master Netting Arrangements, in the Notes to Financial Statements for more information. |
FAIR VALUE OF FINANCIAL DERIVATIVE INSTRUMENTS
The following is a summary of the fair valuation of the Portfolio’s derivative instruments categorized by risk exposure. See Note 7, Principal and Other Risks, in the Notes to Financial Statements on risks of the Portfolio.
Fair Values of Financial Derivative Instruments on the Statement of Assets and Liabilities as of June 30, 2024:
| | | | | | | | | | | | | | | | | | | | | | | | |
| | | Derivatives not accounted for as hedging instruments | |
| | | Commodity
Contracts | | | Credit
Contracts | | | Equity
Contracts | | | Foreign
Exchange
Contracts | | | Interest
Rate Contracts | | | Total | |
Financial Derivative Instruments - Assets | |
Exchange-traded or centrally cleared | |
Futures | | $ | 0 | | | $ | 0 | | | $ | 147 | | | $ | 0 | | | $ | 2 | | | $ | 149 | |
Swap Agreements | | | 0 | | | | 0 | | | | 0 | | | | 0 | | | | 88 | | | | 88 | |
| | | | | | | | | | | | | | | | | | | | | | | | |
| | $ | 0 | | | $ | 0 | | | $ | 147 | | | $ | 0 | | | $ | 90 | | | $ | 237 | |
| | | | | | | | | | | | | | | | | | | | | | | | |
Over the counter | |
Forward Foreign Currency Contracts | | $ | 0 | | | $ | 0 | | | $ | 0 | | | $ | 1,010 | | | $ | 0 | | | $ | 1,010 | |
| | | | | | | | | | | | | | | | | | | | | | | | |
| | $ | 0 | | | $ | 0 | | | $ | 147 | | | $ | 1,010 | | | $ | 90 | | | $ | 1,247 | |
| | | | | | | | | | | | | | | | | | | | | | | | |
|
Financial Derivative Instruments - Liabilities | |
Exchange-traded or centrally cleared | |
Futures | | $ | 0 | | | $ | 0 | | | $ | 417 | | | $ | 0 | | | $ | 25 | | | $ | 442 | |
Swap Agreements | | | 0 | | | | 5 | | | | 0 | | | | 0 | | | | 0 | | | | 5 | |
| | | | | | | | | | | | | | | | | | | | | | | | |
| | $ | 0 | | | $ | 5 | | | $ | 417 | | | $ | 0 | | | $ | 25 | | | $ | 447 | |
| | | | | | | | | | | | | | | | | | | | | | | | |
Over the counter | |
Forward Foreign Currency Contracts | | $ | 0 | | | $ | 0 | | | $ | 0 | | | $ | 72 | | | $ | 0 | | | $ | 72 | |
| | | | | | | | | | | | | | | | | | | | | | | | |
| | $ | 0 | | | $ | 5 | | | $ | 417 | | | $ | 72 | | | $ | 25 | | | $ | 519 | |
| | | | | | | | | | | | | | | | | | | | | | | | |
| | | | | | |
| 18 | | PIMCO EQUITY SERIES VIT | | | See Accompanying Notes | |
| | | | | | | | |
| | | | | | June 30, 2024 | | (Unaudited) |
The effect of Financial Derivative Instruments on the Statement of Operations for the period ended June 30, 2024:
| | | | | | | | | | | | | | | | | | | | | | | | |
| | | Derivatives not accounted for as hedging instruments | |
| | | Commodity
Contracts | | | Credit
Contracts | | | Equity
Contracts | | | Foreign
Exchange
Contracts | | | Interest
Rate Contracts | | | Total | |
Net Realized Gain (Loss) on Financial Derivative Instruments | |
Exchange-traded or centrally cleared | |
Futures | | $ | 0 | | | $ | 0 | | | $ | 19,217 | | | $ | 0 | | | $ | (679 | ) | | $ | 18,538 | |
Swap Agreements | | | 0 | | | | 617 | | | | 0 | | | | 0 | | | | (793 | ) | | | (176 | ) |
| | | | | | | | | | | | | | | | | | | | | | | | |
| | $ | 0 | | | $ | 617 | | | $ | 19,217 | | | $ | 0 | | | $ | (1,472 | ) | | $ | 18,362 | |
| | | | | | | | | | | | | | | | | | | | | | | | |
Over the counter | |
Forward Foreign Currency Contracts | | $ | 0 | | | $ | 0 | | | $ | 0 | | | $ | 1,411 | | | $ | 0 | | | $ | 1,411 | |
Swap Agreements | | | 0 | | | | 0 | | | | (395 | ) | | | 0 | | | | 0 | | | | (395 | ) |
| | | | | | | | | | | | | | | | | | | | | | | | |
| | $ | 0 | | | $ | 0 | | | $ | (395 | ) | | $ | 1,411 | | | $ | 0 | | | $ | 1,016 | |
| | | | | | | | | | | | | | | | | | | | | | | | |
| | $ | 0 | | | $ | 617 | | | $ | 18,822 | | | $ | 1,411 | | | $ | (1,472 | ) | | $ | 19,378 | |
| | | | | | | | | | | | | | | | | | | | | | | | |
|
Net Change in Unrealized Appreciation (Depreciation) on Financial Derivative Instruments | |
Exchange-traded or centrally cleared | |
Futures | | $ | 0 | | | $ | 0 | | | $ | (6,193 | ) | | $ | 0 | | | $ | 335 | | | $ | (5,858 | ) |
Swap Agreements | | | 0 | | | | (332 | ) | | | 0 | | | | 0 | | | | 2,130 | | | | 1,798 | |
| | | | | | | | | | | | | | | | | | | | | | | | |
| | $ | 0 | | | $ | (332 | ) | | $ | (6,193 | ) | | $ | 0 | | | $ | 2,465 | | | $ | (4,060 | ) |
| | | | | | | | | | | | | | | | | | | | | | | | |
Over the counter | |
Forward Foreign Currency Contracts | | $ | 0 | | | $ | 0 | | | $ | 0 | | | $ | 1,697 | | | $ | 0 | | | $ | 1,697 | |
Swap Agreements | | | 0 | | | | 0 | | | | 126 | | | | 0 | | | | 0 | | | | 126 | |
| | | | | | | | | | | | | | | | | | | | | | | | |
| | $ | 0 | | | $ | 0 | | | $ | 126 | | | $ | 1,697 | | | $ | 0 | | | $ | 1,823 | |
| | | | | | | | | | | | | | | | | | | | | | | | |
| | $ | 0 | | | $ | (332 | ) | | $ | (6,067 | ) | | $ | 1,697 | | | $ | 2,465 | | | $ | (2,237 | ) |
| | | | | | | | | | | | | | | | | | | | | | | | |
FAIR VALUE MEASUREMENTS
The following is a summary of the fair valuations according to the inputs used as of June 30, 2024 in valuing the Portfolio’s assets and liabilities:
| | | | | | | | | | | | | | | | |
| Category and Subcategory | | Level 1 | | | Level 2 | | | Level 3 | | | Fair
Value at
06/30/2024 | |
Investments in Securities, at Value | |
Asset-Backed Securities | |
Canada | | $ | 0 | | | $ | 995 | | | $ | 0 | | | $ | 995 | |
Cayman Islands | | | 0 | | | | 14,694 | | | | 0 | | | | 14,694 | |
Ireland | | | 0 | | | | 1,166 | | | | 0 | | | | 1,166 | |
Japan | | | 0 | | | | 672 | | | | 0 | | | | 672 | |
Jersey, Channel Islands | | | 0 | | | | 890 | | | | 0 | | | | 890 | |
United States | | | 0 | | | | 41,632 | | | | 0 | | | | 41,632 | |
Common Stocks | | | | | | | | | | | | | | | | |
United States | | | | | | | | | | | | | | | | |
Communication Services | | | 225 | | | | 0 | | | | 0 | | | | 225 | |
Consumer Discretionary | | | 309 | | | | 0 | | | | 0 | | | | 309 | |
Consumer Staples | | | 1,554 | | | | 0 | | | | 0 | | | | 1,554 | |
Energy | | | 250 | | | | 0 | | | | 0 | | | | 250 | |
Financials | | | 2,165 | | | | 0 | | | | 0 | | | | 2,165 | |
Health Care | | | 1,748 | | | | 0 | | | | 0 | | | | 1,748 | |
Industrials | | | 1,330 | | | | 0 | | | | 0 | | | | 1,330 | |
Information Technology | | | 6,058 | | | | 0 | | | | 0 | | | | 6,058 | |
Materials | | | 85 | | | | 0 | | | | 0 | | | | 85 | |
Corporate Bonds & Notes | | | | | | | | | | | | | | | | |
Canada | | | | | | | | | | | | | | | | |
Banking & Finance | | | 0 | | | | 703 | | | | 0 | | | | 703 | |
Cayman Islands | | | | | | | | | | | | | | | | |
Industrials | | | 0 | | | | 194 | | | | 0 | | | | 194 | |
Denmark | | | | | | | | | | | | | | | | |
Banking & Finance | | | 0 | | | | 1,356 | | | | 0 | | | | 1,356 | |
Germany | | | | | | | | | | | | | | | | |
Banking & Finance | | | 0 | | | | 190 | | | | 0 | | | | 190 | |
Ireland | | | | | | | | | | | | | | | | |
Banking & Finance | | | 0 | | | | 187 | | | | 0 | | | | 187 | |
Japan | | | | | | | | | | | | | | | | |
Banking & Finance | | | 0 | | | | 399 | | | | 0 | | | | 399 | |
Industrials | | | 0 | | | | 191 | | | | 0 | | | | 191 | |
| | | | | | | | | | | | | | | | |
| Category and Subcategory | | Level 1 | | | Level 2 | | | Level 3 | | | Fair
Value at
06/30/2024 | |
Netherlands | | | | | | | | | | | | | | | | |
Banking & Finance | | $ | 0 | | | $ | 986 | | | $ | 0 | | | $ | 986 | |
Switzerland | | | | | | | | | | | | | | | | |
Banking & Finance | | | 0 | | | | 1,393 | | | | 0 | | | | 1,393 | |
United Kingdom | | | | | | | | | | | | | | | | |
Banking & Finance | | | 0 | | | | 1,815 | | | | 0 | | | | 1,815 | |
United States | | | | | | | | | | | | | | | | |
Banking & Finance | | | 0 | | | | 12,291 | | | | 0 | | | | 12,291 | |
Industrials | | | 0 | | | | 3,187 | | | | 0 | | | | 3,187 | |
Utilities | | | 0 | | | | 1,402 | | | | 0 | | | | 1,402 | |
Non-Agency Mortgage-Backed Securities | | | | | | | | | | | | | | | | |
United Kingdom | | | 0 | | | | 202 | | | | 0 | | | | 202 | |
United States | | | 0 | | | | 5,615 | | | | 0 | | | | 5,615 | |
Sovereign Issues | | | | | | | | | | | | | | | | |
Brazil | | | 0 | | | | 745 | | | | 0 | | | | 745 | |
U.S. Government Agencies | | | | | | | | | | | | | | | | |
United States | | | 0 | | | | 6,709 | | | | 0 | | | | 6,709 | |
U.S. Treasury Obligations | | | | | | | | | | | | | | | | |
United States | | | 0 | | | | 43,138 | | | | 0 | | | | 43,138 | |
Short-Term Instruments | | | | | | | | | | | | | | | | |
Repurchase Agreements | | | 0 | | | | 855 | | | | 0 | | | | 855 | |
Short-Term Notes | | | 0 | | | | 146 | | | | 0 | | | | 146 | |
Japan Treasury Bills | | | 0 | | | | 19,392 | | | | 0 | | | | 19,392 | |
U.S. Treasury Bills | | | 0 | | | | 8,097 | | | | 0 | | | | 8,097 | |
| | | | | | | | | | | | | | | | |
| | $ | 13,724 | | | $ | 169,242 | | | $ | 0 | | | $ | 182,966 | |
| | | | | | | | | | | | | | | | |
| | | | |
Investments in Affiliates, at Value | | | | | | | | | | | | | | | | |
Short-Term Instruments | | | | | | | | | | | | | | | | |
Central Funds Used for Cash Management Purposes | | $ | 838 | | | $ | 0 | | | $ | 0 | | | $ | 838 | |
| | | | | | | | | | | | | | | | |
| | | | |
Total Investments | | $ | 14,562 | | | $ | 169,242 | | | $ | 0 | | | $ | 183,804 | |
| | | | | | | | | | | | | | | | |
| | | | | | | | | | | | |
| See Accompanying Notes | | | SEMIANNUAL FINANCIAL AND OTHER INFORMATION | | | | | | | JUNE 30, 2024 | | | 19 |
| | | | | | | | |
| Schedule of Investments | | PIMCO StocksPLUS® Global Portfolio | | (Cont.) | | June 30, 2024 | | (Unaudited) |
| | | | | | | | | | | | | | | | |
| Category and Subcategory | | Level 1 | | | Level 2 | | | Level 3 | | | Fair
Value at
06/30/2024 | |
Financial Derivative Instruments - Assets | |
Exchange-traded or centrally cleared | | $ | 148 | | | $ | 89 | | | $ | 0 | | | $ | 237 | |
Over the counter | | | 0 | | | | 1,010 | | | | 0 | | | | 1,010 | |
| | | | | | | | | | | | | | | | |
| | $ | 148 | | | $ | 1,099 | | | $ | 0 | | | $ | 1,247 | |
| | | | | | | | | | | | | | | | |
| | | | | | | | | | | | | | | | |
| Category and Subcategory | | Level 1 | | | Level 2 | | | Level 3 | | | Fair
Value at
06/30/2024 | |
Financial Derivative Instruments - Liabilities | |
Exchange-traded or centrally cleared | | $ | (415 | ) | | $ | (30 | ) | | $ | 0 | | | $ | (445 | ) |
Over the counter | | | 0 | | | | (72 | ) | | | 0 | | | | (72 | ) |
| | | | | | | | | | | | | | | | |
| | $ | (415 | ) | | $ | (102 | ) | | $ | 0 | | | $ | (517 | ) |
| | | | | | | | | | | | | | | | |
| | | | |
Total Financial Derivative Instruments | | $ | (267 | ) | | $ | 997 | | | $ | 0 | | | $ | 730 | |
| | | | | | | | | | | | | | | | |
| | | | |
Totals | | $ | 14,295 | | | $ | 170,239 | | | $ | 0 | | | $ | 184,534 | |
| | | | | | | | | | | | | | | | |
There were no significant transfers into or out of Level 3 during the period ended June 30, 2024.
| | | | | | |
| 20 | | PIMCO EQUITY SERIES VIT | | | See Accompanying Notes | |
| | | | | | |
| Notes to Financial Statements | | | | June 30, 2024 | | (Unaudited) |
1. ORGANIZATION
PIMCO Equity Series VIT® (the “Trust”) is a Delaware statutory trust established under a trust instrument dated March 30, 2010. The Trust is registered under the Investment Company Act of 1940, as amended (the “Act”), as an open-end management investment company. The Trust is designed to be used as an investment vehicle by separate accounts of insurance companies that fund variable annuity contracts and variable life insurance policies and by qualified pension and retirement plans. Information presented in these financial statements pertains to the Institutional Class and Advisor Class shares of the PIMCO StocksPLUS® Global Portfolio (the “Portfolio”) offered by the Trust. Pacific Investment Management Company LLC (“PIMCO”) serves as the investment adviser (the “Adviser”) for the Portfolio.
Hereinafter, the Board of Trustees of the Portfolio shall be collectively referred to as the “Board.”
2. SIGNIFICANT ACCOUNTING POLICIES
The following is a summary of significant accounting policies consistently followed by the Portfolio in the preparation of its financial statements in conformity with accounting principles generally accepted in the United States of America (“U.S. GAAP”). The Portfolio is treated as an investment company under the reporting requirements of U.S. GAAP. The functional and reporting currency for the Portfolio is the U.S. dollar. The preparation of financial statements in accordance with U.S. GAAP requires management to make estimates and assumptions that affect the reported amounts of assets and liabilities and disclosure of contingent assets and liabilities at the date of the financial statements and the reported amounts of increases and decreases in net assets from operations during the reporting period. Actual results could differ from those estimates.
(a) Securities Transactions and Investment Income Securities transactions are recorded as of the trade date for financial reporting purposes. Securities purchased or sold on a when-issued or delayed-delivery basis may be settled beyond a standard settlement period for the security after the trade date. Realized gains (losses) from securities sold are recorded on the identified cost basis. Dividend income is recorded on the ex-dividend date, except certain dividends from foreign securities where the ex-dividend date may have passed, which are recorded as soon as the Portfolio is informed of the ex-dividend date. Interest income, adjusted for the accretion of discounts and amortization of premiums, is recorded on the accrual basis from settlement date, with the exception of securities with a forward starting effective date, where interest income is recorded on the accrual basis from effective date. For convertible securities, premiums attributable to the conversion feature are not amortized. Estimated tax liabilities on certain foreign securities are recorded on an accrual basis and are
reflected as components of interest income or net change in unrealized appreciation (depreciation) on investments on the Statement of Operations, as appropriate. Tax liabilities realized as a result of such security sales are reflected as a component of net realized gain (loss) on investments on the Statement of Operations. Paydown gains (losses) on mortgage-related and other asset-backed securities, if any, are recorded as components of interest income on the Statement of Operations. Income or short-term capital gain distributions received from registered investment companies, if any, are recorded as dividend income. Long-term capital gain distributions received from registered investment companies, if any, are recorded as realized gains.
Distributions received from investments such as real estate investment trust securities, may include a return of capital invested. Such distributions reduce the cost basis of the respective securities. Return of capital distributions, if any, in excess of the cost basis of the security are recognized as capital gain.
Debt obligations may be placed on non-accrual status and related interest income may be reduced by ceasing current accruals and writing off interest receivable when the collection of all or a portion of interest has become doubtful based on consistently applied procedures. A debt obligation is removed from non-accrual status when the issuer resumes interest payments or when collectability of interest is probable. A debt obligation may be granted, in certain situations, a contractual or non-contractual forbearance for interest payments that are expected to be paid after agreed upon pay dates.
(b) Foreign Currency Translation The market values of foreign securities, currency holdings and other assets and liabilities denominated in foreign currencies are translated into U.S. dollars based on the current exchange rates each business day. Purchases and sales of securities and income and expense items denominated in foreign currencies, if any, are translated into U.S. dollars at the exchange rate in effect on the transaction date. The Portfolio does not separately report the effects of changes in foreign exchange rates from changes in market prices on securities held. Such changes are included in net realized gain (loss) and net change in unrealized appreciation (depreciation) from investments on the Statement of Operations. The Portfolio may invest in foreign currency-denominated securities and may engage in foreign currency transactions either on a spot (cash) basis at the rate prevailing in the currency exchange market at the time or through a forward foreign currency contract. Realized foreign exchange gains (losses) arising from sales of spot foreign currencies, currency gains (losses) realized between the trade and settlement dates on securities transactions and the difference between the recorded amounts of dividends, interest and foreign withholding taxes and the U.S. dollar equivalent of the amounts actually received or paid are included in net realized gain (loss) on foreign currency transactions on
| | | | | | | | | | | | |
| | | | SEMIANNUAL FINANCIAL AND OTHER INFORMATION | | | | | | | JUNE 30, 2024 | | | 21 |
| | | | | | |
| Notes to Financial Statements | | (Cont.) | | | | |
the Statement of Operations. Net unrealized foreign exchange gains (losses) arising from changes in foreign exchange rates on foreign denominated assets and liabilities other than investments in securities held at the end of the reporting period are included in net change in unrealized appreciation (depreciation) on foreign currency assets and liabilities on the Statement of Operations.
(c) Multi-Class Operations Each class offered by the Trust has equal rights as to assets and voting privileges (except that shareholders of a class have exclusive voting rights regarding any matter relating solely to that class of shares). Income and non-class specific expenses are allocated daily to each class on the basis of the relative net assets. Realized and unrealized capital gains (losses) are allocated daily based on the relative net assets of each class of the Portfolio. Class specific expenses, where applicable, currently include supervisory and administrative and distribution and servicing fees. Under certain circumstances, the per share net asset value (“NAV”) of a class of the Portfolio’s shares may be different from the per share NAV of another class of shares as a result of the different daily expense accruals applicable to each class of shares.
(d) Distributions to Shareholders Distributions from net investment income, if any, are declared and distributed to shareholders quarterly. In addition, the Portfolio distributes any net capital gains it earns from the sale of portfolio securities to shareholders no less frequently than annually. The Portfolio may revise its distribution policy or postpone the payment of distributions at any time.
Income distributions and capital gain distributions are determined in accordance with income tax regulations which may differ from U.S. GAAP. Differences between tax regulations and U.S. GAAP may cause timing differences between income and capital gain recognition. Further, the character of investment income and capital gains may be different for certain transactions under the two methods of accounting. As a result, income distributions and capital gain distributions declared during a fiscal period may differ significantly from the net investment income (loss) and realized gains (losses) reported on the Portfolio’s annual financial statements presented under U.S. GAAP.
Separately, if the Portfolio determines or estimates, as applicable, that a portion of a distribution may be comprised of amounts from sources other than net investment income in accordance with its policies, accounting records (if applicable) and accounting practices, the Portfolio will notify shareholders of the estimated composition of such distribution through a Section 19 Notice. For these purposes, the Portfolio determines or estimates, as applicable, the source or sources from which a distribution is paid, to the close of the period as of which it is paid, in reference to its internal accounting records and related accounting practices. If, based on such accounting records and
practices, it is determined or estimated, as applicable, that a particular distribution does not include capital gains or paid-in surplus or other capital sources, a Section 19 Notice generally would not be issued. It is important to note that differences exist between the Portfolio’s daily internal accounting records and practices, the Portfolio’s financial statements presented in accordance with U.S. GAAP, and recordkeeping practices under income tax regulations. For instance, the Portfolio’s internal accounting records and practices may take into account, among other factors, tax-related characteristics of certain sources of distributions that differ from treatment under U.S. GAAP. Examples of such differences may include but are not limited to, for certain portfolios, the treatment of periodic payments under interest rate swap contracts. Accordingly, among other consequences, it is possible that the Portfolio may not issue a Section 19 Notice in situations where the Portfolio’s financial statements prepared later and in accordance with U.S. GAAP and/or the final tax character of those distributions might later report that the sources of those distributions included capital gains and/or a return of capital. Please visit www.pimco.com for the most recent Section 19 Notice, if applicable, for additional information regarding the estimated composition of distributions. Final determination of a distribution’s tax character will be provided to shareholders when such information is available.
Distributions classified as a tax basis return of capital at the Portfolio’s fiscal year end, if any, are reflected on the Statements of Changes in Net Assets and have been recorded to paid in capital on the Statement of Assets and Liabilities. In addition, other amounts have been reclassified between distributable earnings (accumulated loss) and paid in capital on the Statement of Assets and Liabilities to more appropriately conform U.S. GAAP to tax characterizations of distributions.
(e) New Accounting Pronouncements and Regulatory Updates In March 2020, the Financial Accounting Standards Board (“FASB”) issued an Accounting Standards Update (“ASU”), ASU 2020-04, Reference Rate Reform (Topic 848), which provides optional guidance to ease the potential accounting burden associated with transitioning away from the London Interbank Offered Rate and other reference rates that are expected to be discontinued. ASU 2020-04 is effective for certain reference rate-related contract modifications that occurred or will occur during the period March 12, 2020 through December 31, 2024. In January 2021 and December 2022, FASB issued ASU 2021-01 and ASU 2022-06, which include additional amendments to Topic 848. Management is continuously evaluating the potential effect a discontinuation of LIBOR could have on the Portfolio’s investments and has determined that it is unlikely the ASU’s adoption will have a material impact on the Portfolio’s financial statements.
| | | | | | |
| 22 | | PIMCO EQUITY SERIES VIT | | | | |
| | | | | | |
| | | | June 30, 2024 | | (Unaudited) |
In June 2022, the FASB issued ASU 2022-03, Fair Value Measurement (Topic 820), which affects all entities that have investments in equity securities measured at fair value that are subject to a contractual sale restriction. The amendments in ASU 2022-03 clarify that a contractual restriction on the sale of an equity security is not considered part of the unit of account of the equity security and, therefore, is not considered in measuring the fair value. The amendments also require additional disclosures for equity securities subject to contractual sale restrictions that are measured at fair value in accordance with Topic 820. The effective date for the amendments in ASU 2022-03 is for fiscal years beginning after December 15, 2023 and interim periods within those fiscal years. Management has implemented changes in connection with the amendments and has determined that there was no material impact to the Portfolio’s financial statements.
In October 2022, the U.S. Securities and Exchange Commission (“SEC”) adopted changes to the mutual fund and exchange-traded fund (“ETF”) shareholder report and registration statement disclosure requirements and the registered fund advertising rules, which change the disclosures provided to shareholders. The rule amendments were effective as of January 2023, and compliance with the rule amendments was required as of July 2024. As such, the Portfolio has made significant updates to the content of its shareholder reports. In addition, shareholder reports are now mailed to shareholders who have not opted to receive shareholder report documents electronically. Management has implemented format and content changes to the Portfolio’s annual and semiannual financial and other information in connection with the rule amendments and has determined that there was no material impact to the Portfolio’s financial statements.
The SEC made a final ruling on February 15, 2023 to adopt proposed amendments to the Settlement Cycle Rule (Rule 15c6-1) and other related rules under the Securities Exchange Act of 1934, as amended, to shorten the standard settlement cycle for most broker-dealer transactions from two business days after the trade date (T+2) to one business day after the trade date (T+1). The effective date was May 5, 2023, and compliance with the amendments was required as of May 28, 2024. Management has implemented changes in connection with the rule and has determined that there was no material impact to the Portfolio’s financial statements.
In September 2023, the SEC adopted amendments to Rule 35d-1 under the Act, the rule governing fund naming conventions (the “Names Rule”). In general, the Names Rule requires funds with certain types of names to adopt a policy to invest at least 80% of their assets in the type of investment suggested by the name. The amendments expand the scope of the current rule to include any term used in a fund name that suggests the fund makes investments that have, or whose issuers have, particular characteristics. Additionally, the amendments modify
the circumstances under which a fund may deviate from its 80% investment policy and address the calculation methodology of derivatives instruments for purposes of the rule. The amendments became effective December 11, 2023, and fund groups with $1 billion or more in net assets will have 24 months to comply with the amendments (fund groups with net assets of less than $1 billion have 30 months to comply). At this time, management is evaluating the implications of these changes on the financial statements.
3. INVESTMENT VALUATION AND FAIR VALUE MEASUREMENTS
(a) Investment Valuation Policies The NAV of the Portfolio’s shares, or each of its share classes, as applicable, is determined by dividing the total value of portfolio investments and other assets attributable to the Portfolio or class, less any liabilities, as applicable, by the total number of shares outstanding.
On each day that the New York Stock Exchange (“NYSE”) is open, the Portfolio’s shares are ordinarily valued as of the close of regular trading (normally 4:00 p.m., Eastern time) (“NYSE Close”). Information that becomes known to the Portfolio or its agents after the time as of which NAV has been calculated on a particular day will not generally be used to retroactively adjust the price of a security or the NAV determined earlier that day. If regular trading on the NYSE closes earlier than scheduled, the Portfolio may calculate its NAV as of the earlier closing time or calculate its NAV as of the NYSE Close for that day. The Portfolio generally does not calculate its NAV on days on which the NYSE is not open for business. If the NYSE is closed on a day it would normally be open for business, the Portfolio may calculate its NAV as of the NYSE Close for such day or such other time that the Portfolio may determine.
For purposes of calculating NAV, portfolio securities and other assets for which market quotations are readily available are valued at market value. A market quotation is readily available only when that quotation is a quoted price (unadjusted) in active markets for identical investments that the Portfolio can access at the measurement date, provided that a quotation will not be readily available if it is not reliable. Market value is generally determined on the basis of official closing prices or the last reported sales prices. The Portfolio will normally use pricing data for domestic equity securities received shortly after the NYSE Close and does not normally take into account trading, clearances or settlements that take place after the NYSE Close. A foreign (non-U.S.) equity security traded on a foreign exchange or on more than one exchange is typically valued using pricing information from the exchange considered by PIMCO to be the primary exchange. If market value pricing is used, a foreign (non-U.S.) equity security will be valued as of the close of trading on the foreign exchange or the NYSE Close if the NYSE Close occurs before the end of trading on the foreign exchange.
| | | | | | | | | | | | |
| | | | SEMIANNUAL FINANCIAL AND OTHER INFORMATION | | | | | | | JUNE 30, 2024 | | | 23 |
| | | | | | |
| Notes to Financial Statements | | (Cont.) | | | | |
Investments for which market quotations are not readily available are valued at fair value as determined in good faith pursuant to Rule 2a-5 under the Act. As a general principle, the fair value of a security or other asset is the price that would be received to sell an asset or paid to transfer a liability in an orderly transaction between market participants at the measurement date. Pursuant to Rule 2a-5, the Board has designated PIMCO as the valuation designee (“Valuation Designee”) for the Portfolio to perform the fair value determination relating to all Portfolio investments. PIMCO may carry out its designated responsibilities as Valuation Designee through various teams and committees. The Valuation Designee’s policies and procedures govern the Valuation Designee’s selection and application of methodologies for determining and calculating the fair value of portfolio investments. The Valuation Designee may value portfolio securities for which market quotations are not readily available and other Portfolio assets utilizing inputs from pricing services, quotation reporting systems, valuation agents and other third-party sources (together, “Pricing Sources”).
Domestic and foreign (non-U.S.) fixed income securities, non-exchange traded derivatives and equity options are normally valued on the basis of quotes obtained from brokers and dealers or Pricing Sources using data reflecting the earlier closing of the principal markets for those securities. Prices obtained from Pricing Sources may be based on, among other things, information provided by market makers or estimates of market values obtained from yield data relating to investments or securities with similar characteristics. Certain fixed income securities purchased on a delayed-delivery basis are marked to market daily until settlement at the forward settlement date. Common stocks, ETFs, exchange-traded notes and financial derivative instruments, such as futures contracts, rights and warrants, or options on futures that are traded on a national securities exchange, are stated at the last reported sale or settlement price on the day of valuation. Exchange-traded options, except equity options, futures and options on futures are valued at the settlement price determined by the relevant exchange. Swap agreements are valued on the basis of bid quotes obtained from brokers and dealers or market-based prices supplied by Pricing Sources. With respect to any portion of the Portfolio’s assets that are invested in one or more open-end management investment companies (other than ETFs), the Portfolio’s NAV will be calculated based on the NAVs of such investments. Open-end management investment companies may include affiliated funds.
If a foreign (non-U.S.) equity security’s value has materially changed after the close of the security’s primary exchange or principal market but before the NYSE Close, the security may be valued at fair value. Foreign (non-U.S.) equity securities that do not trade when the NYSE is open are also valued at fair value. With respect to foreign (non-U.S.) equity securities, the Portfolio may determine the fair value of
investments based on information provided by Pricing Sources, which may recommend fair value or adjustments with reference to other securities, indexes or assets. In considering whether fair valuation is required and in determining fair values, the Valuation Designee may, among other things, consider significant events (which may be considered to include changes in the value of U.S. securities or securities indexes) that occur after the close of the relevant market and before the NYSE Close. The Portfolio may utilize modeling tools provided by third-party vendors to determine fair values of foreign (non-U.S.) securities. For these purposes, unless otherwise determined by the Valuation Designee, any movement in the applicable reference index or instrument (“zero trigger”) between the earlier close of the applicable foreign market and the NYSE Close may be deemed to be a significant event, prompting the application of the pricing model (effectively resulting in daily fair valuations). Foreign exchanges may permit trading in foreign (non-U.S.) equity securities on days when the Trust is not open for business, which may result in the Portfolio’s portfolio investments being affected when shareholders are unable to buy or sell shares.
Investments valued in currencies other than the U.S. dollar are converted to the U.S. dollar using exchange rates obtained from Pricing Sources. As a result, the value of such investments and, in turn, the NAV of the Portfolio’s shares may be affected by changes in the value of currencies in relation to the U.S. dollar. The value of investments traded in markets outside the United States or denominated in currencies other than the U.S. dollar may be affected significantly on a day that the Trust is not open for business. As a result, to the extent that the Portfolio holds foreign (non-U.S.) investments, the value of those investments may change at times when shareholders are unable to buy or sell shares and the value of such investments will be reflected in the Portfolio’s next calculated NAV.
Fair valuation may require subjective determinations about the value of a security. While the Trust’s and Valuation Designee’s policies and procedures are intended to result in a calculation of the Portfolio’s NAV that fairly reflects security values as of the time of pricing, the Trust cannot ensure that fair values accurately reflect the price that the Portfolio could obtain for a security if it were to dispose of that security as of the time of pricing (for instance, in a forced or distressed sale). The prices used by the Portfolio may differ from the value that would be realized if the securities were sold. The Portfolio’s use of fair valuation may also help to deter “stale price arbitrage” as discussed under the “Frequent or Excessive Purchases, Exchanges and Redemptions” section in the Portfolio’s prospectus.
Under certain circumstances, the per share NAV of a class of the Portfolio’s shares may be different from the per share NAV of another class of shares as a result of the different daily expense accruals applicable to each class of shares.
| | | | | | |
| 24 | | PIMCO EQUITY SERIES VIT | | | | |
| | | | | | |
| | | | June 30, 2024 | | (Unaudited) |
(b) Fair Value Hierarchy U.S. GAAP describes fair value as the price that the Portfolio would receive to sell an asset or pay to transfer a liability in an orderly transaction between market participants at the measurement date. It establishes a fair value hierarchy that prioritizes inputs to valuation methods and requires disclosure of the fair value hierarchy, separately for each major category of assets and liabilities, that segregates fair value measurements into levels (Level 1, 2 or 3). The inputs or methodology used for valuing securities are not necessarily an indication of the risks associated with investing in those securities. Levels 1, 2 and 3 of the fair value hierarchy are defined as follows:
| ∎ | | Level 1 — Quoted prices (unadjusted) in active markets or exchanges for identical assets and liabilities. |
| ∎ | | Level 2 — Significant other observable inputs, which may include, but are not limited to, quoted prices for similar assets or liabilities in markets that are active, quoted prices for identical or similar assets or liabilities in markets that are not active, inputs other than quoted prices that are observable for the assets or liabilities (such as interest rates, yield curves, volatilities, prepayment speeds, loss severities, credit risks and default rates) or other market corroborated inputs. |
| ∎ | | Level 3 — Significant unobservable inputs based on the best information available in the circumstances, to the extent observable inputs are not available, which may include assumptions made by the Valuation Designee that are used in determining the fair value of investments. |
In accordance with the requirements of U.S. GAAP, the amounts of transfers into and out of Level 3, if material, are disclosed in the Notes to Schedule of Investments for the Portfolio.
For fair valuations using significant unobservable inputs, U.S. GAAP requires a reconciliation of the beginning to ending balances for reported fair values that presents changes attributable to realized gain (loss), unrealized appreciation (depreciation), purchases and sales, accrued discounts (premiums), and transfers into and out of the Level 3 category during the period. The end of period value is used for the transfers between Levels of the Portfolio’s assets and liabilities. Additionally, U.S. GAAP requires quantitative information regarding the significant unobservable inputs used in the determination of fair value of assets or liabilities categorized as Level 3 in the fair value hierarchy. In accordance with the requirements of U.S. GAAP, a fair value hierarchy and, if material, a Level 3 reconciliation and details of significant unobservable inputs, have been included in the Notes to Schedule of Investments for the Portfolio.
(c) Valuation Techniques and the Fair Value Hierarchy
Level 1, Level 2 and Level 3 trading assets and trading liabilities, at fair value The valuation methods (or “techniques”) and significant
inputs used in determining the fair values of portfolio securities or other assets and liabilities categorized as Level 1, Level 2 and Level 3 of the fair value hierarchy are as follows:
Common stocks, ETFs, exchange-traded notes and financial derivative instruments, such as futures contracts, rights and warrants, or options on futures that are traded on a national securities exchange, are stated at the last reported sale or settlement price on the day of valuation. To the extent these securities are actively traded and valuation adjustments are not applied, they are categorized as Level 1 of the fair value hierarchy.
Investments in registered open-end investment companies (other than ETFs) will be valued based upon the NAVs of such investments and are categorized as Level 1 of the fair value hierarchy. Investments in unregistered open-end investment companies will be calculated based upon the NAVs of such investments and are considered Level 1 provided that the NAVs are observable, calculated daily and are the value at which both purchases and sales will be conducted.
Fixed income securities including corporate, convertible and municipal bonds and notes, U.S. government agencies, U.S. treasury obligations, sovereign issues, bank loans, convertible preferred securities, non-U.S. bonds and short-term debt instruments (such as commercial paper, time deposits and certificates of deposit) are normally valued on the basis of quotes obtained from brokers and dealers or Pricing Sources that use broker-dealer quotations, reported trades or valuation estimates from their internal pricing models. The Pricing Sources’ internal models use inputs that are observable such as issuer details, interest rates, yield curves, prepayment speeds, credit risks/spreads, default rates and quoted prices for similar assets. Securities that use similar valuation techniques and inputs as described above are categorized as Level 2 of the fair value hierarchy.
Mortgage-related and asset-backed securities are usually issued as separate tranches, or classes, of securities within each deal. These securities are also normally valued by Pricing Sources that use broker-dealer quotations, reported trades or valuation estimates from their internal pricing models. The pricing models for these securities usually consider tranche-level attributes, current market data, estimated cash flows and market-based yield spreads for each tranche, and incorporate deal collateral performance, as available. Mortgage-related and asset-backed securities that use similar valuation techniques and inputs as described above are categorized as Level 2 of the fair value hierarchy.
Valuation adjustments may be applied to certain securities that are solely traded on a foreign exchange to account for the market movement between the close of the foreign market and the NYSE Close. These securities are valued using Pricing Sources that consider
| | | | | | | | | | | | |
| | | | SEMIANNUAL FINANCIAL AND OTHER INFORMATION | | | | | | | JUNE 30, 2024 | | | 25 |
| | | | | | |
| Notes to Financial Statements | | (Cont.) | | | | |
the correlation of the trading patterns of the foreign security to the intraday trading in the U.S. markets for investments. Securities using these valuation adjustments are categorized as Level 2 of the fair value hierarchy. Preferred securities and other equities traded on inactive markets or valued by reference to similar instruments are also categorized as Level 2 of the fair value hierarchy.
Valuation adjustments may be applied to certain exchange traded futures and options to account for market movement between the exchange settlement and the NYSE Close. These securities are valued using quotes obtained from a quotation reporting system, established market makers or Pricing Sources. Financial derivatives using these valuation adjustments are categorized as Level 2 of the fair value hierarchy.
Equity exchange-traded options and over the counter financial derivative instruments, such as forward foreign currency contracts and options contracts derive their value from underlying asset prices, indexes, reference rates and other inputs or a combination of these factors. These contracts are normally valued on the basis of quotes obtained from a quotation reporting system, established market makers or Pricing Sources (normally determined as of the NYSE Close). Depending on the product and the terms of the transaction, financial derivative instruments can be valued by Pricing Sources using a series of techniques, including simulation pricing models. The pricing models use inputs that are observed from actively quoted markets such as quoted prices, issuer details, indexes, bid/ask spreads, interest rates, implied volatilities, yield curves, dividends and exchange rates. Financial derivative instruments that use similar valuation techniques
and inputs as described above are categorized as Level 2 of the fair value hierarchy.
Centrally cleared swaps and over the counter swaps derive their value from underlying asset prices, indexes, reference rates and other inputs or a combination of these factors. They are valued using a broker-dealer bid quotation or on market-based prices provided by Pricing Sources (normally determined as of the NYSE Close). Centrally cleared swaps and over the counter swaps can be valued by Pricing Sources using a series of techniques, including simulation pricing models. The pricing models may use inputs that are observed from actively quoted markets such as the overnight index swap rate, LIBOR forward rate, interest rates, yield curves and credit spreads. These securities are categorized as Level 2 of the fair value hierarchy.
Short-term debt instruments (such as commercial paper, time deposits and certificates of deposit) having a remaining maturity of 60 days or less may be valued at amortized cost, so long as the amortized cost value of such short-term debt instruments is approximately the same as the fair value of the instrument as determined without the use of amortized cost valuation. These securities are categorized as Level 2 or Level 3 of the fair value hierarchy depending on the source of the base price.
When a fair valuation method is applied by PIMCO that uses significant unobservable inputs, investments will be priced by a method that the Valuation Designee believes reflects fair value and are categorized as Level 3 of the fair value hierarchy.
4. SECURITIES AND OTHER INVESTMENTS
(a) Investments in Affiliates
The Portfolio may invest in the PIMCO Short Asset Portfolio and the PIMCO Short-Term Floating NAV Portfolio III (“Central Funds”) to the extent permitted by the Act, rules thereunder or exemptive relief therefrom. The Central Funds are registered investment companies created for use solely by the series of the Trust and other series of registered investment companies advised by the Adviser, in connection with their cash management activities. The main investments of the Central Funds are money market and short maturity fixed income instruments. The Central Funds may incur expenses related to their investment activities, but do not pay Investment Advisory Fees or Supervisory and Administrative Fees to the Adviser. The Central Funds are considered to be affiliated with the Portfolio. A complete schedule of portfolio holdings for each affiliate fund is filed with the SEC for the first and third quarters of each fiscal year on Form N-PORT and is available at the SEC’s website at www.sec.gov. A copy of each affiliate fund’s shareholder report is also available at the SEC’s website at www.sec.gov, on the Portfolio’s website at www.pimco.com, or upon request, as applicable. The tables below show the Portfolio’s transactions in and earnings from investments in the affiliated funds for the period ended June 30, 2024 (amounts in thousands†):
Investment in PIMCO Short Asset Portfolio
| | | | | | | | | | | | | | | | | | | | | | | | | | | | | | |
Market Value
12/31/2023 | | | Purchases
at Cost | | | Proceeds
from Sales | | | Net
Realized
Gain (Loss) | | | Change in
Unrealized
Appreciation
(Depreciation) | | | Market Value
06/30/2024 | | | Dividend
Income(1) | | | Realized Net
Capital Gain
Distributions(1) | |
| $ | 0 | | | $ | 834 | | | $ | 0 | | | $ | 0 | | | $ | 2 | | | $ | 836 | | | $ | 14 | | | $ | 0 | |
| | | | | | |
| 26 | | PIMCO EQUITY SERIES VIT | | | | |
| | | | | | |
| | | | June 30, 2024 | | (Unaudited) |
Investment in PIMCO Short-Term Floating NAV Portfolio III
| | | | | | | | | | | | | | | | | | | | | | | | | | | | | | |
Market Value
12/31/2023 | | | Purchases
at Cost | | | Proceeds
from Sales | | | Net
Realized
Gain (Loss) | | | Change in
Unrealized
Appreciation
(Depreciation) | | | Market Value
06/30/2024 | | | Dividend
Income(1) | | | Realized Net
Capital Gain
Distributions(1) | |
| $ | 0 | | | $ | 2,603 | | | $ | (2,601 | ) | | $ | 0 | | | $ | 0 | | | $ | 2 | | | $ | 7 | | | $ | 0 | |
| † | A zero balance may reflect actual amounts rounding to less than one thousand. |
| (1) | The tax characterization of distributions is determined in accordance with Federal income tax regulations and may contain a return of capital. The actual tax characterization of distributions received is determined at the end of the fiscal year of the affiliated fund. See Note 2, Distributions to Shareholders, in the Notes to Financial Statements for more information. |
Investments in Securities
The Portfolio may utilize the investments and strategies described below to the extent permitted by the Portfolio’s investment policies.
Inflation-Indexed Bonds are fixed income securities whose principal value is periodically adjusted according to the rate of inflation. The interest rate on these bonds is generally fixed at issuance at a rate lower than typical bonds. Over the life of an inflation-indexed bond, however, interest will be paid based on a principal value which is adjusted for inflation. Any increase or decrease in the principal amount of an inflation-indexed bond will be included as interest income on the Statement of Operations, even though investors do not receive their principal until maturity. Repayment of the original bond principal upon maturity (as adjusted for inflation) is guaranteed in the case of U.S. Treasury Inflation-Protected Securities (“TIPS”). For bonds that do not provide a similar guarantee, the adjusted principal value of the bond repaid at maturity may be less than the original principal.
Mortgage-Related and Other Asset-Backed Securities directly or indirectly represent a participation in, or are secured by and payable from, loans on real property. Mortgage-related securities are interests in pools of residential or commercial mortgage loans, including mortgage loans made by savings and loan institutions, mortgage bankers, commercial banks and others. These securities provide a monthly payment which consists of both interest and principal payments. Interest may be determined by fixed or adjustable rates. The rate of prepayments on underlying mortgages will affect the price and volatility of a mortgage-related security, and may have the effect of shortening or extending the effective duration of the security relative to what was anticipated at the time of purchase. The timely payment of principal and interest of certain mortgage-related securities is guaranteed with the full faith and credit of the U.S. Government. Pools created and guaranteed by non-governmental issuers, including government-sponsored corporations, may be supported by various forms of insurance or guarantees, but there can be no assurance that private insurers or guarantors can meet their obligations under the insurance policies or guarantee arrangements. Many of the risks of investing in mortgage-related securities secured by commercial mortgage loans reflect the effects of local and other economic conditions on real estate markets, the ability of tenants to make lease payments and the ability of a property to attract and retain
tenants. These securities may be less liquid and may exhibit greater price volatility than other types of mortgage-related or other asset-backed securities. Other asset-backed securities are created from many types of assets, including, but not limited to, auto loans, accounts receivable such as credit card receivables and hospital account receivables, home equity loans, student loans, boat loans, mobile home loans, recreational vehicle loans, manufactured housing loans, aircraft leases, computer leases, syndicated bank loans, peer-to-peer loans and litigation finance loans.
Collateralized Debt Obligations (“CDOs”) include Collateralized Bond Obligations (“CBOs”), Collateralized Loan Obligations (“CLOs”) and other similarly structured securities. CBOs, CLOs and other CDOs are types of asset-backed securities. A CBO is a trust which is backed by a diversified pool of high risk, below investment grade fixed income securities. A CLO is a trust typically collateralized by a pool of loans, which may include, among others, domestic and foreign senior secured loans, senior unsecured loans, and subordinate corporate loans, including loans that may be rated below investment grade or equivalent unrated loans. Other CDOs are trusts backed by other types of assets representing obligations of various parties. The risks of an investment in a CDO depend largely on the type of the collateral securities and the class of the CDO in which the Portfolio invests. In addition to the normal risks associated with fixed income securities discussed elsewhere in this report and the Portfolio’s prospectus and statement of additional information (e.g., prepayment risk, credit risk, liquidity risk, market risk, structural risk, legal risk and interest rate risk (which may be exacerbated if the interest rate payable on a structured financing changes based on multiples of changes in interest rates or inversely to changes in interest rates)), CBOs, CLOs and other CDOs carry additional risks including, but not limited to: (i) the possibility that distributions from collateral securities will not be adequate to make interest or other payments, (ii) the quality of the collateral may decline in value or default, (iii) risks related to the capability of the servicer of the securitized assets, (iv) the risk that the Portfolio may invest in CBOs, CLOs, or other CDOs that are subordinate to other classes, (v) the structure and complexity of the transaction and the legal documents may not be fully understood at the time of investment and could lead to disputes with the issuer or among investors regarding the characterization of proceeds or unexpected investment results, and (vi) the CDO’s manager may perform poorly.
| | | | | | | | | | | | |
| | | | SEMIANNUAL FINANCIAL AND OTHER INFORMATION | | | | | | | JUNE 30, 2024 | | | 27 |
| | | | | | |
| Notes to Financial Statements | | (Cont.) | | | | |
Collateralized Mortgage Obligations (“CMOs”) are debt obligations of a legal entity that are collateralized by whole mortgage loans or private mortgage bonds and divided into classes. CMOs are structured into multiple classes, often referred to as “tranches,” with each class bearing a different stated maturity and entitled to a different schedule for payments of principal and interest, including prepayments. CMOs may be less liquid and may exhibit greater price volatility than other types of mortgage-related or asset-backed securities.
Restricted Investments are subject to legal or contractual restrictions on resale and may generally be sold privately, but may be required to be registered or exempted from such registration before being sold to the public. Private placement securities are generally considered to be restricted except for those securities traded between qualified institutional investors under the provisions of Rule 144A of the Securities Act of 1933. Disposal of restricted investments may involve time-consuming negotiations and expenses, and prompt sale at an acceptable price may be difficult to achieve. Restricted investments held by the Portfolio as of June 30, 2024, as applicable, are disclosed in the Notes to Schedule of Investments.
Securities Issued by U.S. Government Agencies or Government-Sponsored Enterprises are obligations of and, in certain cases, guaranteed by, the U.S. Government, its agencies or instrumentalities. Some U.S. Government securities, such as Treasury bills, notes and bonds, and securities guaranteed by the Government National Mortgage Association, are supported by the full faith and credit of the U.S. Government; others, such as those of the Federal Home Loan Banks, are supported by the right of the issuer to borrow from the U.S. Department of the Treasury (the “U.S. Treasury”); and others, such as those of the Federal National Mortgage Association (“FNMA” or “Fannie Mae”), are supported by the discretionary authority of the U.S. Government to purchase the agency’s obligations. U.S. Government securities may include zero coupon securities which do not distribute interest on a current basis and tend to be subject to a greater risk than interest-paying securities of similar maturities.
Government-related guarantors (i.e., not backed by the full faith and credit of the U.S. Government) include FNMA and the Federal Home Loan Mortgage Corporation (“FHLMC” or “Freddie Mac”). FNMA is a government-sponsored corporation. FNMA purchases conventional (i.e., not insured or guaranteed by any government agency) residential mortgages from a list of approved seller/servicers which include state and federally chartered savings and loan associations, mutual savings banks, commercial banks and credit unions and mortgage bankers. Pass-through securities issued by FNMA are guaranteed as to timely payment of principal and interest by FNMA, but are not backed by the full faith and credit of the U.S. Government. FHLMC is a government sponsored corporation that issues Participation Certificates (“PCs”),
which are pass-through securities, each representing an undivided interest in a pool of residential mortgages. FHLMC guarantees the timely payment of interest and ultimate collection of principal, but PCs are not backed by the full faith and credit of the U.S. Government.
In June 2019, FNMA and FHLMC started issuing Uniform Mortgage-Backed Securities in place of their current offerings of TBA-eligible securities (the “Single Security Initiative”). The Single Security Initiative seeks to support the overall liquidity of the TBA market and aligns the characteristics of FNMA and FHLMC certificates. The long-term effects that the Single Security Initiative may have on the market for TBA and other mortgage-backed securities are uncertain.
Roll-timing strategies can be used where the Portfolio seeks to extend the expiration or maturity of a position, such as a TBA security on an underlying asset, by closing out the position before expiration and contemporaneously opening a new position with respect to substantially the same underlying asset with a later expiration date. TBA securities purchased or sold are reflected on the Statement of Assets and Liabilities as an asset or liability, respectively. Recently finalized FINRA rules include mandatory margin requirements for the TBA market that require the Portfolio to post collateral in connection with its TBA transactions. There is no similar requirement applicable to the Portfolio’s TBA counterparties. The required collateralization of TBA trades could increase the cost of TBA transactions to the Portfolio and impose added operational complexity.
When-Issued Transactions are purchases or sales made on a when-issued basis. These transactions are made conditionally because a security, although authorized, has not yet been issued in the market. Transactions to purchase or sell securities on a when-issued basis involve a commitment by the Portfolio to purchase or sell these securities for a predetermined price or yield, with payment and delivery taking place beyond the customary settlement period. The Portfolio may sell when-issued securities before they are delivered, which may result in a realized gain (loss).
5. BORROWINGS AND OTHER FINANCING TRANSACTIONS
The Portfolio may enter into the borrowings and other financing transactions described below to the extent permitted by the Portfolio’s investment policies.
The following disclosures contain information on the Portfolio’s ability to lend or borrow cash or securities to the extent permitted under the Act, which may be viewed as borrowing or financing transactions by the Portfolio. The location of these instruments in the Portfolio’s financial statements is described below.
(a) Repurchase Agreements Under the terms of a typical repurchase agreement, the Portfolio purchases an underlying debt obligation
| | | | | | |
| 28 | | PIMCO EQUITY SERIES VIT | | | | |
| | | | | | |
| | | | June 30, 2024 | | (Unaudited) |
(collateral) subject to an obligation of the seller to repurchase, and the Portfolio to resell, the obligation at an agreed-upon price and time. In an open maturity repurchase agreement, there is no pre-determined repurchase date and the agreement can be terminated by the Portfolio or counterparty at any time. The underlying securities for all repurchase agreements are held by the Portfolio’s custodian or designated subcustodians (in the case of tri-party repurchase agreements) and in certain instances will remain in custody with the counterparty. Traditionally, the Portfolio has used bilateral repurchase agreements wherein the underlying securities will be held by the Portfolio’s custodian. The market value of the collateral must be equal to or exceed the total amount of the repurchase obligations, including interest. Repurchase agreements, if any, including accrued interest, are included on the Statement of Assets and Liabilities. Interest earned is recorded as a component of interest income on the Statement of Operations. In periods of increased demand for collateral, the Portfolio may pay a fee for the receipt of collateral, which may result in interest expense to the Portfolio.
(b) Interfund Lending In accordance with an exemptive order (the “Order”) from the SEC, each Portfolio of the Trust may participate in a joint lending and borrowing facility for temporary purposes (the “Interfund Lending Program”), subject to compliance with the terms and conditions of the Order, and to the extent permitted by each Portfolio’s investment policies and restrictions. Each Portfolio is currently permitted to borrow under the Interfund Lending Program. A lending portfolio may lend in aggregate up to 15% of its current net assets at the time of the interfund loan, but may not lend more than 5% of its net assets to any one borrowing portfolio through the Interfund Lending Program. A borrowing portfolio may not borrow through the Interfund Lending Program or from any other source if its total outstanding borrowings immediately after the borrowing would be more than 33 1/3% of its total assets (or any lower threshold provided for by the portfolio’s investment restrictions). If a borrowing portfolio’s total outstanding borrowings exceed 10% of its total assets, each of its outstanding interfund loans will be subject to collateralization of at least 102% of the outstanding principal value of the loan. All interfund loans are for temporary or emergency purposes and the interfund loan rate to be charged will be the average of the highest current overnight repurchase agreement rate available to a lending portfolio and the bank loan rate, as calculated according to a formula established by the Board.
During the period ended June 30, 2024, the Portfolio did not participate in the Interfund Lending Program.
6. FINANCIAL DERIVATIVE INSTRUMENTS
The Portfolio may enter into the financial derivative instruments described below to the extent permitted by the Portfolio’s investment policies.
The following disclosures contain information on how and why the Portfolio uses financial derivative instruments, and how financial derivative instruments affect the Portfolio’s financial position, results of operations and cash flows. The location and fair value amounts of these instruments on the Statement of Assets and Liabilities and the net realized gain (loss) and net change in unrealized appreciation (depreciation) on the Statement of Operations, each categorized by type of financial derivative contract and related risk exposure, are included in a table in the Notes to Schedule of Investments. The financial derivative instruments outstanding as of period end and the amounts of net realized gain (loss) and net change in unrealized appreciation (depreciation) on financial derivative instruments during the period, as disclosed in the Notes to Schedule of Investments, serve as indicators of the volume of financial derivative activity for the Portfolio.
(a) Forward Foreign Currency Contracts may be engaged, in connection with settling planned purchases or sales of securities, to hedge the currency exposure associated with some or all of the Portfolio’s securities or as part of an investment strategy. A forward foreign currency contract is an agreement between two parties to buy and sell a currency at a set price on a future date. The market value of a forward foreign currency contract fluctuates with changes in foreign currency exchange rates. Forward foreign currency contracts are marked to market daily, and the change in value is recorded by the Portfolio as an unrealized gain (loss). Realized gains (losses) are equal to the difference between the value of the contract at the time it was opened and the value at the time it was closed and are recorded upon delivery or receipt of the currency. These contracts may involve market risk in excess of the unrealized gain (loss) reflected on the Statement of Assets and Liabilities. In addition, the Portfolio could be exposed to risk if the counterparties are unable to meet the terms of the contracts or if the value of the currency changes unfavorably to the U.S. dollar. To mitigate such risk, cash or securities may be exchanged as collateral pursuant to the terms of the underlying contracts.
(b) Futures Contracts are agreements to buy or sell a security or other asset for a set price on a future date and are traded on an exchange. The Portfolio may use futures contracts to manage its exposure to the securities markets or to movements in interest rates and currency values. The primary risks associated with the use of futures contracts are the imperfect correlation between the change in market value of the securities held by the Portfolio and the prices of futures contracts and the possibility of an illiquid market. Futures contracts are valued based upon their quoted daily settlement prices. Upon entering into a futures contract, the Portfolio is required to deposit with its futures broker an amount of cash, U.S. Government and Agency Obligations, or select sovereign debt, in accordance with the initial margin
| | | | | | | | | | | | |
| | | | SEMIANNUAL FINANCIAL AND OTHER INFORMATION | | | | | | | JUNE 30, 2024 | | | 29 |
| | | | | | |
| Notes to Financial Statements | | (Cont.) | | | | |
requirements of the broker or exchange. Futures contracts are marked to market daily and based on such movements in the price of the contracts, an appropriate payable or receivable for the change in value may be posted or collected by the Portfolio (“Futures Variation Margin”). Futures Variation Margins, if any, are disclosed within centrally cleared financial derivative instruments on the Statement of Assets and Liabilities. Gains (losses) are recognized but not considered realized until the contracts expire or close. Futures contracts involve, to varying degrees, risk of loss in excess of the Futures Variation Margin included within exchange traded or centrally cleared financial derivative instruments on the Statement of Assets and Liabilities.
(c) Swap Agreements are bilaterally negotiated agreements between the Portfolio and a counterparty to exchange or swap investment cash flows, assets, foreign currencies or market-linked returns at specified, future intervals. Swap agreements may be privately negotiated in the over the counter market (“OTC swaps”) or may be cleared through a third party, known as a central counterparty or derivatives clearing organization (“Centrally Cleared Swaps”). The Portfolio may enter into asset, credit default, cross-currency, interest rate, total return, variance and other forms of swap agreements to manage its exposure to credit, currency, interest rate, commodity, equity and inflation risk. In connection with these agreements, securities or cash may be identified as collateral or margin in accordance with the terms of the respective swap agreements to provide assets of value and recourse in the event of default or bankruptcy/insolvency.
Centrally Cleared Swaps are marked to market daily based upon valuations as determined from the underlying contract or in accordance with the requirements of the central counterparty or derivatives clearing organization. Changes in market value, if any, are reflected as a component of net change in unrealized appreciation (depreciation) on the Statement of Operations. Daily changes in valuation of centrally cleared swaps (“Swap Variation Margin”), if any, are disclosed within centrally cleared financial derivative instruments on the Statement of Assets and Liabilities. Centrally Cleared and OTC swap payments received or paid at the beginning of the measurement period are included on the Statement of Assets and Liabilities and represent premiums paid or received upon entering into the swap agreement to compensate for differences between the stated terms of the swap agreement and prevailing market conditions (credit spreads, currency exchange rates, interest rates, and other relevant factors). Upfront premiums received (paid) are initially recorded as liabilities (assets) and subsequently marked to market to reflect the current value of the swap. These upfront premiums are recorded as realized gain (loss) on the Statement of Operations upon termination or maturity of the swap. A liquidation payment received or made at the termination of the swap is recorded as realized gain (loss) on the Statement of Operations. Net periodic payments received or paid by the Portfolio are included as part of realized gain (loss) on the Statement of Operations.
For purposes of applying certain of the Portfolio’s investment policies and restrictions, swap agreements, like other derivative instruments, may be valued by the Portfolio at market value, notional value or full exposure value. In the case of a credit default swap, in applying certain of the Portfolio’s investment policies and restrictions, the Portfolio will value the credit default swap at its notional value or its full exposure value (i.e., the sum of the notional amount for the contract plus the market value), but may value the credit default swap at market value for purposes of applying certain of the Portfolio’s other investment policies and restrictions. For example, the Portfolio may value credit default swaps at full exposure value for purposes of the Portfolio’s credit quality guidelines (if any) because such value in general better reflects the Portfolio’s actual economic exposure during the term of the credit default swap agreement. As a result, the Portfolio may, at times, have notional exposure to an asset class (before netting) that is greater or lesser than the stated limit or restriction noted in the Portfolio’s prospectus. In this context, both the notional amount and the market value may be positive or negative depending on whether the Portfolio is selling or buying protection through the credit default swap. The manner in which certain securities or other instruments are valued by the Portfolio for purposes of applying investment policies and restrictions may differ from the manner in which those investments are valued by other types of investors.
Entering into swap agreements involves, to varying degrees, elements of interest, credit, market and documentation risk in excess of the amounts recognized on the Statement of Assets and Liabilities. Such risks involve the possibility that there will be no liquid market for these agreements, that the counterparty to the agreements may fail to perform or meet an obligation or disagree as to the meaning of contractual terms in the agreements and that there may be unfavorable changes in interest rates or the values of the asset upon which the swap is based.
The Portfolio’s maximum risk of loss from counterparty credit risk is the discounted net value of the cash flows to be received from the counterparty over the contract’s remaining life, to the extent that amount is positive. The risk may be mitigated by having a master netting arrangement between the Portfolio and the counterparty and by the posting of collateral to the Portfolio to cover the Portfolio’s exposure to the counterparty.
To the extent the Portfolio has a policy to limit the net amount owed to or to be received from a single counterparty under existing swap agreements, such limitation only applies to counterparties to OTC swaps and does not apply to centrally cleared swaps where the counterparty is a central counterparty or derivatives clearing organization.
| | | | | | |
| 30 | | PIMCO EQUITY SERIES VIT | | | | |
| | | | | | |
| | | | June 30, 2024 | | (Unaudited) |
Credit Default Swap Agreements on corporate, loan, sovereign, U.S. municipal or U.S. Treasury issues are entered into to provide a measure of protection against defaults of the issuers (i.e., to reduce risk where the Portfolio owns or has exposure to the referenced obligation) or to take an active long or short position with respect to the likelihood of a particular issuer’s default. Credit default swap agreements involve one party making a stream of payments (referred to as the buyer of protection) to another party (the seller of protection) in exchange for the right to receive a specified return in the event that the referenced entity, obligation or index, as specified in the swap agreement, undergoes a certain credit event. As a seller of protection on credit default swap agreements, the Portfolio will generally receive from the buyer of protection a fixed rate of income throughout the term of the swap provided that there is no credit event. As the seller, the Portfolio would effectively add leverage to its portfolio because, in addition to its total net assets, the Portfolio would be subject to investment exposure on the notional amount of the swap.
If the Portfolio is a seller of protection and a credit event occurs, as defined under the terms of that particular swap agreement, the Portfolio will either (i) pay to the buyer of protection an amount equal to the notional amount of the swap and take delivery of the referenced obligation or underlying securities comprising the referenced index or (ii) pay a net settlement amount in the form of cash, securities or other deliverable obligations equal to the notional amount of the swap less the recovery value of the referenced obligation or underlying securities comprising the referenced index. If the Portfolio is a buyer of protection and a credit event occurs, as defined under the terms of that particular swap agreement, the Portfolio will either (i) receive from the seller of protection an amount equal to the notional amount of the swap and deliver the referenced obligation, other deliverable obligations or underlying securities comprising the referenced index or (ii) receive a net settlement amount in the form of cash, securities or other deliverable obligations equal to the notional amount of the swap less the recovery value of the referenced obligation or underlying securities comprising the referenced index. Recovery values are estimated by market makers considering either industry standard recovery rates or entity specific factors and considerations until a credit event occurs. If a credit event has occurred, the recovery value is determined by a facilitated auction whereby a minimum number of allowable broker bids, together with a specified valuation method, are used to calculate the settlement value. The ability to deliver other obligations may result in a cheapest-to-deliver option (the buyer of protection’s right to choose the deliverable obligation with the lowest value following a credit event).
Credit default swap agreements on credit indexes involve one party making a stream of payments to another party in exchange for the right
to receive a specified return in the event of a write-down, principal shortfall, interest shortfall or default of all or part of the referenced entities comprising the credit index. A credit index is a basket of credit instruments or exposures designed to be representative of some part of the credit market as a whole. These indexes are made up of reference credits that are judged by a poll of dealers to be the most liquid entities in the credit default swap market based on the sector of the index. Components of the indexes may include, but are not limited to, investment grade securities, high yield securities, asset-backed securities, emerging markets and/or various credit ratings within each sector. Credit indexes are traded using credit default swaps with standardized terms including a fixed spread and standard maturity dates. An index credit default swap references all the names in the index, and if there is a default, the credit event is settled based on that name’s weight in the index. The composition of the indexes changes periodically, usually every six months, and for most indexes, each name has an equal weight in the index. Credit default swaps on credit indexes may be used to hedge a portfolio of credit default swaps or bonds, which is less expensive than it would be to buy many credit default swaps to achieve a similar effect. Credit default swaps on indexes are instruments for protecting investors owning bonds against default, and traders use them to speculate on changes in credit quality.
Implied credit spreads, represented in absolute terms, utilized in determining the market value of credit default swap agreements on corporate, loan, sovereign, U.S. municipal or U.S. Treasury issues as of period end, if any, are disclosed in the Notes to Schedule of Investments. They serve as an indicator of the current status of payment/performance risk and represent the likelihood or risk of default for the reference entity. The implied credit spread of a particular referenced entity reflects the cost of buying/selling protection and may include upfront payments required to be made to enter into the agreement. Wider credit spreads represent a deterioration of the referenced entity’s credit soundness and a greater likelihood or risk of default or other credit event occurring as defined under the terms of the agreement. For credit default swap agreements on asset-backed securities and credit indexes, the quoted market prices and resulting values serve as the indicator of the current status of the payment/performance risk. Increasing market values, in absolute terms when compared to the notional amount of the swap, represent a deterioration of the referenced entity’s credit soundness and a greater likelihood or risk of default or other credit event occurring as defined under the terms of the agreement.
The maximum potential amount of future payments (undiscounted) that the Portfolio as a seller of protection could be required to make under a credit default swap agreement equals the notional amount of the agreement. Notional amounts of each individual credit default swap
| | | | | | | | | | | | |
| | | | SEMIANNUAL FINANCIAL AND OTHER INFORMATION | | | | | | | JUNE 30, 2024 | | | 31 |
| | | | | | |
| Notes to Financial Statements | | (Cont.) | | | | |
agreement outstanding as of period end for which the Portfolio is the seller of protection are disclosed in the Notes to Schedule of Investments. These potential amounts would be partially offset by any recovery values of the respective referenced obligations, upfront payments received upon entering into the agreement, or net amounts received from the settlement of buy protection credit default swap agreements entered into by the Portfolio for the same referenced entity or entities.
Interest Rate Swap Agreements may be entered into to help hedge against interest rate risk exposure and to maintain the Portfolio’s ability to generate income at prevailing market rates. The value of the fixed rate bonds that the Portfolio holds may decrease if interest rates rise. To help hedge against this risk and to maintain its ability to generate income at prevailing market rates, the Portfolio may enter into interest rate swap agreements. Interest rate swap agreements involve the exchange by the Portfolio with another party for their respective commitment to pay or receive interest on the notional amount of principal. Certain forms of interest rate swap agreements may include: (i) interest rate caps, under which, in return for a premium, one party agrees to make payments to the other to the extent that interest rates exceed a specified rate, or “cap”, (ii) interest rate floors, under which, in return for a premium, one party agrees to make payments to the other to the extent that interest rates fall below a specified rate, or “floor”, (iii) interest rate collars, under which a party sells a cap and purchases a floor or vice versa in an attempt to protect itself against interest rate movements exceeding given minimum or maximum levels, (iv) callable interest rate swaps, under which the buyer pays an upfront fee in consideration for the right to early terminate the swap transaction in whole, at zero cost and at a predetermined date and time prior to the maturity date, (v) spreadlocks, which allow the interest rate swap users to lock in the forward differential (or spread) between the interest rate swap rate and a specified benchmark, or (vi) basis swaps, under which two parties can exchange variable interest rates based on different segments of money markets.
Total Return Swap Agreements are entered into to gain or mitigate exposure to the underlying reference asset. Total return swap agreements involve commitments where single or multiple cash flows are exchanged based on the price of an underlying reference asset and on a fixed or variable interest rate. Total return swap agreements may involve commitments to pay interest in exchange for a market-linked return. One counterparty pays out the total return of a specific underlying reference asset, which may include a single security, a basket of securities, or an index, and in return receives a fixed or variable rate. At the maturity date, a net cash flow is exchanged where the total return is equivalent to the return of the underlying reference asset less a financing rate, if any. As a receiver, the Portfolio would
receive payments based on any net positive total return and would owe payments in the event of a net negative total return. As the payer, the Portfolio would owe payments on any net positive total return and would receive payments in the event of a net negative total return.
7.PRINCIPAL AND OTHER RISKS
(a) Principal Risks
The principal risks of investing in the Portfolio, which could adversely affect its net asset value, yield and total return, are listed below. Please see “Description of Principal Risks” in the Portfolio’s prospectus for a more detailed description of the risks of investing in the Portfolio.
Equity Risk is the risk that the value of equity or equity-related securities, such as common stocks and preferred securities, may decline due to general market conditions which are not specifically related to a particular company or to factors affecting a particular industry or industries. Equity or equity-related securities generally have greater price volatility than fixed income securities. In addition, preferred securities may be subject to greater credit risk or other risks, such as risks related to deferred and omitted distributions, limited voting rights, liquidity, interest rates, regulatory changes and special redemption rights.
Mortgage-Related and Other Asset-Backed Securities Risk is the risk of investing in mortgage-related and other asset-backed securities, including interest rate risk, extension risk, prepayment risk and credit risk. The Portfolio may invest in any tranche of mortgage-related and other asset-backed securities, including junior and/or equity tranches (to the extent consistent with other of the Portfolio’s guidelines), which generally carry higher levels of the foregoing risks.
Foreign (Non-U.S.) Investment Risk is the risk that investing in foreign (non-U.S.) securities may result in the Portfolio experiencing more rapid and extreme changes in value than a portfolio that invests exclusively in securities of U.S. companies, due to smaller markets, differing reporting, accounting and auditing standards, increased risk of delayed settlement of portfolio transactions or loss of certificates of portfolio securities, and the risk of unfavorable foreign government actions, including nationalization, expropriation or confiscatory taxation, currency blockage, political changes, diplomatic developments or the imposition of sanctions and other similar measures. Foreign securities may also be less liquid and more difficult to value than securities of U.S. issuers.
Emerging Markets Risk is the risk of investing in emerging market securities, primarily increased foreign (non-U.S.) investment risk.
Sovereign Debt Risk is the risk that investments in fixed income instruments issued by sovereign entities may decline in value as a result
| | | | | | |
| 32 | | PIMCO EQUITY SERIES VIT | | | | |
| | | | | | |
| | | | June 30, 2024 | | (Unaudited) |
of default or other adverse credit event resulting from an issuer’s inability or unwillingness to make principal or interest payments in a timely fashion.
Market Risk is the risk that the value of securities owned by the Portfolio may go up or down, sometimes rapidly or unpredictably, due to factors affecting securities markets generally or particular industries.
Issuer Risk is the risk that the value of a security may decline for a reason directly related to the issuer, such as management performance, changes in financial condition or credit rating, financial leverage, reputation or reduced demand for the issuer’s goods or services.
Interest Rate Risk is the risk that fixed income securities and dividend- paying equity securities will fluctuate in value because of a change in interest rates; a portfolio with a longer average portfolio duration will be more sensitive to changes in interest rates than a portfolio with a shorter average portfolio duration.
Call Risk is the risk that an issuer may exercise its right to redeem a fixed income security earlier than expected (a call). Issuers may call outstanding securities prior to their maturity for a number of reasons (e.g., declining interest rates, changes in credit spreads and improvements in the issuer’s credit quality). If an issuer calls a security that the Portfolio has invested in, the Portfolio may not recoup the full amount of its initial investment or may not realize the full anticipated earnings from the investment and may be forced to reinvest in lower-yielding securities, securities with greater credit risks or securities with other, less favorable features.
Credit Risk is the risk that the Portfolio could lose money if the issuer or guarantor of a fixed income security, or the counterparty to a derivative contract, or the issuer or guarantor of collateral, is unable or unwilling, or is perceived (whether by market participants, rating agencies, pricing services or otherwise) as unable or unwilling, to meet its financial obligations.
High Yield Risk is the risk that high yield securities and unrated securities of similar credit quality (commonly known as “junk bonds”) are subject to greater levels of credit, call and liquidity risks. High yield securities are considered primarily speculative with respect to the issuer’s continuing ability to make principal and interest payments, and may be more volatile than higher-rated securities of similar maturity.
Currency Risk is the risk that foreign (non-U.S.) currencies will change in value relative to the U.S. dollar and affect the Portfolio’s investments in foreign (non-U.S.) currencies or in securities that trade in, and receive revenues in, or in derivatives that provide exposure to, foreign (non-U.S.) currencies.
Liquidity Risk is the risk that a particular investment may be difficult to purchase or sell and that the Portfolio may be unable to sell illiquid investments at an advantageous time or price or achieve its desired level of exposure to a certain sector. Liquidity risk may result from the lack of an active market, reduced number and capacity of traditional market participants to make a market in fixed income securities, and may be magnified in a rising interest rate environment or other circumstances where investor redemptions from fixed income funds may be higher than normal, causing increased supply in the market due to selling activity.
Leveraging Risk is the risk that certain transactions of the Portfolio, such as reverse repurchase agreements, loans of portfolio securities, and the use of when-issued, delayed delivery or forward commitment transactions, or derivative instruments, may give rise to leverage, magnifying gains and losses and causing the Portfolio to be more volatile than if it had not been leveraged. This means that leverage entails a heightened risk of loss.
Management Risk is the risk that the investment techniques and risk analyses applied by PIMCO will not produce the desired results and that actual or potential conflicts of interest, legislative, regulatory or tax restrictions, policies or developments may affect the investment techniques available to PIMCO and the individual portfolio managers in connection with managing the Portfolio and may cause PIMCO to restrict or prohibit participation in certain investments. There is no guarantee that the investment objective of the Portfolio will be achieved.
Collateralized Loan Obligations Risk is the risk that investing in collateralized loan obligations (“CLOs”) and other similarly structured investments exposes the Portfolio to heightened credit risk, interest rate risk, liquidity risk, market risk and prepayment and extension risk, as well as the risk of default on the underlying asset. In addition, investments in CLOs carry additional risks including, but not limited to: (i) the possibility that distributions from collateral securities will not be adequate to make interest or other payments; (ii) the quality of the collateral may decline in value or default; (iii) risks related to the capability of the servicer of the securitized assets; (iv) the risk that the Portfolio may invest in tranches of CLOs that are subordinate to other tranches; (v) the structure and complexity of the transaction and the legal documents may not be fully understood at the time of investment and could lead to disputes with the issuer or among investors regarding the characterization of proceeds or unexpected investment results; and (vi) the CLO’s manager may perform poorly.
Derivatives Risk is the risk of investing in derivative instruments (such as forwards, futures, swaps and structured securities) and other similar
| | | | | | | | | | | | |
| | | | SEMIANNUAL FINANCIAL AND OTHER INFORMATION | | | | | | | JUNE 30, 2024 | | | 33 |
| | | | | | |
| Notes to Financial Statements | | (Cont.) | | | | |
investments, including leverage, liquidity, interest rate, market, counterparty (including credit), operational, legal and management risks, and valuation complexity. Changes in the value of a derivative or other similar investment may not correlate perfectly with, and may be more sensitive to market events than, the underlying asset, rate or index, and the Portfolio could lose more than the initial amount invested. Changes in the value of a derivative or other similar instrument may also create margin delivery or settlement payment obligations for the Portfolio. The Portfolio’s use of derivatives or other similar investments may result in losses to the Portfolio, a reduction in the Portfolio’s returns and/or increased volatility. Non-centrally-cleared over-the-counter (“OTC”) derivatives or other similar investments are also subject to the risk that a counterparty to the transaction will not fulfill its contractual obligations to the other party, as many of the protections afforded to centrally-cleared derivative transactions might not be available for non-centrally-cleared OTC derivatives or other similar investments. The primary credit risk on derivatives or other similar investments that are exchange-traded or traded through a central clearing counterparty resides with the Portfolio’s clearing broker or the clearinghouse. Changes in regulation relating to a registered fund’s use of derivatives and related instruments could potentially limit or impact the Portfolio’s ability to invest in derivatives, limit the Portfolio’s ability to employ certain strategies that use derivatives or other similar investments and/or adversely affect the value of derivatives or other similar investments and the Portfolio’s performance.
Futures Contract Risk is the risk that, while the value of a futures contract tends to correlate with the value of the underlying asset that it represents, differences between the futures market and the market for the underlying asset may result in an imperfect correlation. Futures contracts may involve risks different from, and possibly greater than, the risks associated with investing directly in the underlying assets. The purchase or sale of a futures contract may result in losses in excess of the amount invested in the futures contract.
Short Exposure Risk is the risk of entering into short sales or other short positions, including the potential loss of more money than the actual cost of the investment, and the risk that the third party to the short sale or other short position will not fulfill its contractual obligations, causing a loss to the Portfolio.
Exchange-Traded Fund Risk is the risk that an exchange-traded fund may not track the performance of the index it is designed to track, among other reasons, because of exchange rules, market prices of shares of an exchange-traded fund may fluctuate rapidly and materially, or shares of an exchange-traded fund may trade significantly above or below net asset value, any of which may cause losses to the Portfolio invested in the exchange-traded fund.
(b) Other Risks
In general, the Portfolio may be subject to additional risks, including, but not limited to, risks related to government regulation and intervention in financial markets, operational risks, risks associated with financial, economic and global market disruptions, and cyber security risks. Please see the Portfolio’s prospectus and Statement of Additional Information for a more detailed description of the risks of investing in the Portfolio. Please see the Important Information section of this report for additional discussion of certain regulatory and market developments that may impact the Portfolio’s performance.
Market Disruptions Risk The Portfolio is subject to investment and operational risks associated with financial, economic and other global market developments and disruptions, including those arising from war, military conflicts, terrorism, market manipulation, government interventions, defaults and shutdowns, political changes or diplomatic developments, public health emergencies (such as the spread of infectious diseases, pandemics and epidemics), bank failures and natural/environmental disasters, which can all negatively impact the securities markets and cause the Portfolio to lose value. These events can also impair the technology and other operational systems upon which the Portfolio’s service providers, including PIMCO as the Portfolio’s investment adviser, rely, and could otherwise disrupt the Portfolio’s service providers’ ability to fulfill their obligations to the Portfolio.
Government Intervention in Financial Markets Federal, state, and other governments, their regulatory agencies, or self-regulatory organizations may take actions that affect the regulation of the instruments in which the Portfolio invests, or the issuers of such instruments, in ways that are unforeseeable. Legislation or regulation may also change the way in which the Portfolio itself is regulated. Such legislation or regulation could limit or preclude the Portfolio’s ability to achieve its investment objective. Furthermore, volatile financial markets can expose the Portfolio to greater market and liquidity risk and potential difficulty in valuing portfolio instruments held by the Portfolio. The value of the Portfolio’s holdings is also generally subject to the risk of future local, national, or global economic disturbances based on unknown weaknesses in the markets in which the Portfolio invests. In addition, it is not certain that the U.S. Government will intervene in response to a future market disturbance and the effect of any such future intervention cannot be predicted. It is difficult for issuers to prepare for the impact of future financial downturns, although companies can seek to identify and manage future uncertainties through risk management programs.
Regulatory Risk Financial entities, such as investment companies and investment advisers, are generally subject to extensive government regulation and intervention. Government regulation and/or intervention
| | | | | | |
| 34 | | PIMCO EQUITY SERIES VIT | | | | |
| | | | | | |
| | | | June 30, 2024 | | (Unaudited) |
may change the way the Portfolio is regulated, affect the expenses incurred directly by the Portfolio and the value of its investments, and limit and/or preclude the Portfolio’s ability to achieve its investment objective. Government regulation may change frequently and may have significant adverse consequences. Moreover, government regulation may have unpredictable and unintended effects.
Operational Risk An investment in the Portfolio, like any fund, can involve operational risks arising from factors such as processing errors, human errors, inadequate or failed internal or external processes, failures in systems and technology, changes in personnel and errors caused by third-party service providers. The occurrence of any of these failures, errors or breaches could result in a loss of information, regulatory scrutiny, reputational damage or other events, any of which could have a material adverse effect on the Portfolio. While the Portfolio seeks to minimize such events through controls and oversight, there may still be failures that could cause losses to the Portfolio.
Cyber Security Risk As the use of technology, including cloud-based technology, has become more prevalent in the course of business, the Portfolio has become potentially more susceptible to operational and information security risks resulting from breaches in cyber security. A breach in cyber security refers to both intentional and unintentional cyber events that may, among other things, cause the Portfolio to lose proprietary information, suffer data corruption and/or destruction or lose operational capacity, result in the unauthorized release or other misuse of confidential information, or otherwise disrupt normal business operations. Cyber security failures or breaches may result in financial losses to the Portfolio and its shareholders. These failures or breaches may also result in disruptions to business operations, potentially resulting in financial losses; interference with the Portfolio’s ability to calculate its net asset value, process shareholder transactions or otherwise transact business with shareholders; impediments to trading; violations of applicable privacy and other laws; regulatory fines; penalties; third-party claims in litigation; reputational damage; reimbursement or other compensation costs; additional compliance and cyber security risk management costs and other adverse consequences. In addition, substantial costs may be incurred in order to prevent any cyber incidents in the future. There is also a risk that cyber security breaches may not be detected. The Portfolio and its shareholders may suffer losses as a result of a cyber security breach related to the Portfolio, its service providers, trading counterparties or the issuers in which the Portfolio invests.
8. MASTER NETTING ARRANGEMENTS
The Portfolio may be subject to various netting arrangements (“Master Agreements”) with select counterparties. Master Agreements govern the terms of certain transactions, and are intended to reduce the counterparty risk associated with relevant transactions by specifying
credit protection mechanisms and providing standardization that is intended to improve legal certainty. Each type of Master Agreement governs certain types of transactions. Different types of transactions may be traded out of different legal entities or affiliates of a particular organization, resulting in the need for multiple agreements with a single counterparty. As the Master Agreements are specific to unique operations of different asset types, they allow the Portfolio to close out and net its total exposure to a counterparty in the event of a default with respect to all the transactions governed under a single Master Agreement with a counterparty. For financial reporting purposes the Statement of Assets and Liabilities generally presents derivative assets and liabilities on a gross basis, which reflects the full risks and exposures prior to netting.
Master Agreements can also help limit counterparty risk by specifying collateral posting arrangements at pre-arranged exposure levels. Under most Master Agreements, collateral is routinely transferred if the total net exposure to certain transactions (net of existing collateral already in place) governed under the relevant Master Agreement with a counterparty in a given account exceeds a specified threshold, which typically ranges from zero to $250,000 depending on the counterparty and the type of Master Agreement. United States Treasury Bills and U.S. dollar cash are generally the preferred forms of collateral, although other securities may be used depending on the terms outlined in the applicable Master Agreement. Securities and cash pledged as collateral are reflected as assets on the Statement of Assets and Liabilities as either a component of Investments at value (securities) or Deposits with counterparty. Cash collateral received is not typically held in a segregated account and as such is reflected as a liability on the Statement of Assets and Liabilities as Deposits from counterparty. The market value of any securities received as collateral is not reflected as a component of NAV. The Portfolio’s overall exposure to counterparty risk can change substantially within a short period, as it is affected by each transaction subject to the relevant Master Agreement.
Master Repurchase Agreements and Global Master Repurchase Agreements (individually and collectively “Master Repo Agreements”) govern repurchase, reverse repurchase and certain sale-buyback transactions between the Portfolio and select counterparties. Master Repo Agreements maintain provisions for, among other things, initiation, income payments, events of default and maintenance of collateral. The market value of transactions under the Master Repo Agreement, collateral pledged or received, and the net exposure by counterparty as of period end are disclosed in the Notes to Schedule of Investments.
Master Securities Forward Transaction Agreements (“Master Forward Agreements”) govern certain forward settling transactions, such as TBA securities, delayed-delivery or certain sale-buyback transactions by and
| | | | | | | | | | | | |
| | | | SEMIANNUAL FINANCIAL AND OTHER INFORMATION | | | | | | | JUNE 30, 2024 | | | 35 |
| | | | | | |
| Notes to Financial Statements | | (Cont.) | | | | |
between the Portfolio and select counterparties. The Master Forward Agreements maintain provisions for, among other things, transaction initiation and confirmation, payment and transfer, events of default, termination and maintenance of collateral. The market value of forward settling transactions, collateral pledged or received, and the net exposure by counterparty as of period end is disclosed in the Notes to Schedule of Investments.
Customer Account Agreements and related addenda govern cleared derivatives transactions such as futures, options on futures and cleared OTC derivatives. Such transactions require posting of initial margin as determined by each relevant clearing agency which is segregated in an account at a futures commission merchant (“FCM”) registered with the Commodity Futures Trading Commission. In the United States, counterparty risk may be reduced as creditors of an FCM cannot have a claim to Portfolio assets in the segregated account. FCM customers, such as the Portfolio, are permitted to transfer their customer account (and cleared derivative transactions held in such customer account) from one FCM to another FCM. Upon completion of the transfer, the customer maintains the same economic position with respect to the outstanding exposure. As such, these transfers are not recognized as dispositions and reacquisitions of the affected derivative positions. Variation margin, which reflects changes in market value, is generally exchanged daily, but may not be netted between futures and cleared OTC derivatives unless the parties have agreed to a separate arrangement in respect of portfolio margining. The porting of exposure between FCMs has no impact on the market value or accumulated unrealized appreciation (depreciation), initial margin posted, and any unsettled variation margin; these values as of period end are disclosed in the Notes to Schedule of Investments.
Prime Broker Arrangements may be entered into to facilitate execution and/or clearing of listed equity option transactions or short sales of equity securities between the Portfolio and selected counterparties. The arrangements provide guidelines surrounding the rights, obligations and other events, including, but not limited to, margin, execution and settlement. These agreements maintain provisions for, among other things, payments, maintenance of collateral, events of default and termination. Margin and other assets delivered as collateral are typically in the possession of the prime broker and would offset any obligations due to the prime broker. The market values of listed options and securities sold short and related collateral are disclosed in the Notes to Schedule of Investments.
International Swaps and Derivatives Association, Inc. Master Agreements and Credit Support Annexes (“ISDA Master Agreements”) govern bilateral OTC derivative transactions entered into by the Portfolio with select counterparties. ISDA Master Agreements maintain provisions for general obligations, representations, agreements,
collateral posting and events of default or termination. Events of termination include conditions that may entitle counterparties to elect to terminate early and cause settlement of all outstanding transactions under the applicable ISDA Master Agreement. Any election to terminate early could be material to the financial statements. The ISDA Master Agreement may contain additional provisions that add counterparty protection beyond coverage of existing daily exposure if the counterparty has a decline in credit quality below a predefined level or as required by regulation. Similarly, if required by regulation, the Portfolio may be required to post additional collateral beyond coverage of daily exposure. These amounts, if any, may (or if required by law, will) be segregated with a third-party custodian. To the extent the Portfolio is required by regulation to post additional collateral beyond coverage of daily exposure, it could potentially incur costs, including in procuring eligible assets to meet collateral requirements, associated with such posting. The market value of OTC financial derivative instruments, collateral received or pledged, and net exposure by counterparty as of period end are disclosed in the Notes to Schedule of Investments.
9. FEES AND EXPENSES
(a) Investment Advisory Fee PIMCO is a majority-owned subsidiary of Allianz Asset Management of America LLC (“Allianz Asset Management”) and serves as the Adviser to the Trust, pursuant to an investment advisory contract. The Adviser receives a monthly fee from the Portfolio at an annual rate based on average daily net assets (the “Investment Advisory Fee”). The Investment Advisory Fee for all classes is charged at an annual rate as noted in the table in note (b) below.
(b) Supervisory and Administrative Fee PIMCO serves as administrator (the “Administrator”) and provides supervisory and administrative services to the Trust for which it receives a monthly supervisory and administrative fee based on each share class’s average daily net assets (the “Supervisory and Administrative Fee”). As the Administrator, PIMCO bears the costs of various third-party services, including audit, custodial, portfolio accounting, legal, transfer agency and printing costs.
The Investment Advisory Fee and Supervisory and Administrative Fees for all classes, as applicable, are charged at the annual rate as noted in the following table (calculated as a percentage of the Portfolio’s average daily net assets attributable to each class):
| | | | | | | | | | | | | | | | | | |
| Investment Advisory Fee | | Supervisory and Administrative Fee |
| All Classes | | Institutional
Class | | Administrative
Class | | Advisor
Class |
| | | 0.30% | | | | | 0.31% | | | | | 0.31% | * | | | | 0.31% | |
| * | This particular share class has been registered with the SEC, but was not operational during the period ended June 30, 2024. |
| | | | | | |
| 36 | | PIMCO EQUITY SERIES VIT | | | | |
| | | | | | |
| | | | June 30, 2024 | | (Unaudited) |
(c) Distribution and Servicing Fees PIMCO Investments LLC, a wholly-owned subsidiary of PIMCO, serves as the distributor (“Distributor”) of the Trust’s shares.
The Trust has adopted a Distribution and Servicing Plan with respect to the Advisor Class shares of the Portfolio pursuant to Rule 12b-1 under the Act (the “Distribution and Servicing Plan”). The Distribution and Servicing Plan allows the Portfolio to compensate the Distributor for providing or procuring through financial intermediaries, distribution, administrative, recordkeeping, shareholder and/or related services with respect to Advisor Class and Administrative Class shares. The Distribution and Servicing Plan permits the Portfolio to make total payments at an annual rate of up to 0.25% of the average daily net assets attributable to its Advisor Class shares. The Distribution and Servicing Plan for Administrative Class shares also permits the Portfolio to compensate the Distributor for providing or procuring administrative, recordkeeping, and other investor services at an annual rate of up to 0.15% of the average daily net assets attributable to its Administrative Class shares.
| | | | | | | | | | | | |
| | | | | | Distribution Fee | | | Servicing Fee | |
| | | |
Administrative Class* | | | | | | | — | | | | 0.15% | |
| | | |
Advisor Class | | | | | | | 0.25% | | | | — | |
| * | This particular share class has been registered with the SEC, but was not operational during the period ended June 30, 2024. |
(d) Portfolio Expenses PIMCO provides or procures supervisory and administrative services for shareholders and also bears the costs of various third-party services required by the Portfolio, including audit, custodial, portfolio accounting, legal, transfer agency and printing costs. The Trust is responsible for the following expenses: (i) salaries and other compensation of any of the Trust’s executive officers and employees who are not officers, directors, stockholders, or employees of PIMCO or its subsidiaries or affiliates; (ii) taxes and governmental fees; (iii) brokerage fees and commissions and other portfolio transaction expenses; (iv) costs of borrowing money, including interest expenses; (v) fees and expenses of the Trustees who are not “interested persons” of PIMCO or the Trust, and any counsel retained exclusively for their benefit; (vi) extraordinary expenses, including costs of litigation and indemnification expenses; (vii) organizational and offering expenses of the Trust and the Portfolio, and any other expenses which are capitalized in accordance with generally accepted accounting principles; and (viii) any expenses allocated or allocable to a specific class of shares. The ratio of expenses to average net assets per share class, as disclosed on the Financial Highlights, may differ from the annual portfolio operating expenses per share class.
(e) Remuneration Paid to Directors, Officers and Others (N-CSR Item 10) The Trust pays no compensation directly to any Trustee or any other officer who is affiliated with the Administrator, all of whom receive remuneration for their services to the Trust from the Administrator or its affiliates. The pro rata share of Trustee fees for the Portfolio is reflected on the Statement of Operations as Trustee fees.
(f) Expense Limitation Pursuant to the Expense Limitation Agreement, PIMCO has contractually agreed, through May 1, 2025, to waive a portion of the Portfolio’s Supervisory and Administrative Fee, or reimburse the Portfolio, to the extent that the Portfolio’s organizational expenses, pro rata share of expenses related to obtaining or maintaining a Legal Entity Identifier and pro rata share of Trustee fees exceed 0.0049% (the “Expense Limit”) (calculated as a percentage of the Portfolio’s average daily net assets attributable to each class). The Expense Limitation Agreement will automatically renew for one-year terms unless PIMCO provides written notice to the Trust at least 30 days prior to the end of the then current term. The waiver, if any, is reflected on the Statement of Operations as a component of Waiver and/or Reimbursement by PIMCO. As of June 30, 2024, the amount waived and/or reimbursed was $37,786.
In any month in which the investment advisory contract or supervision and administration agreement is in effect, PIMCO is entitled to reimbursement by the Portfolio of any portion of the supervisory and administrative fee waived or reimbursed pursuant to the Expense Limitation Agreement (the “Reimbursement Amount”) within thirty-six months of the time of the waiver, provided that such amount paid to PIMCO will not: i) together with any organizational expenses, pro rata share of expenses related to obtaining or maintaining a Legal Entity Identifier and pro rata Trustee fees, exceed, for such month, the Expense Limit (or the amount of the expense limit in place at the time the amount being recouped was originally waived if lower than the Expense Limit); ii) exceed the total Reimbursement Amount; or iii) include any amounts previously reimbursed to PIMCO. The total recoverable amounts to PIMCO (from the Fee Limitation Agreement and Expense Limitation Agreement combined) as of June 30, 2024, were as follows (amounts in thousands†):
| | | | | | | | | | | | | | |
| Expiring Within | | | | |
| | | |
| 12 months | | | 13-24 months | | | 25-36 months | | | Total | |
| | | |
| $ | 73 | | | $ | 71 | | | $ | 68 | | | $ | 212 | |
| † | A zero balance may reflect actual amounts rounding to less than one thousand. |
10. RELATED PARTY TRANSACTIONS
The Adviser, Administrator and Distributor are related parties. Fees paid to these parties are disclosed in Note 9, Fees and Expenses, and the accrued related party fee amounts are disclosed on the Statement of Assets and Liabilities.
| | | | | | | | | | | | |
| | | | SEMIANNUAL FINANCIAL AND OTHER INFORMATION | | | | | | | JUNE 30, 2024 | | | 37 |
| | | | | | |
| Notes to Financial Statements | | (Cont.) | | | | |
11. GUARANTEES AND INDEMNIFICATIONS
Under the Trust’s organizational documents, each Trustee, officer, employee or other agent of the Trust (including the Trust’s investment manager) is indemnified, to the extent permitted by the Act, against certain liabilities that may arise out of performance of their duties to the Portfolio. Additionally, in the normal course of business, the Portfolio enters into contracts that contain a variety of indemnification clauses. The Portfolio’s maximum exposure under these arrangements is unknown as this would involve future claims that may be made against the Portfolio that have not yet occurred. However, the Portfolio has not had prior claims or losses pursuant to these contracts.
12. PURCHASES AND SALES OF SECURITIES
The length of time the Portfolio has held a particular security is not generally a consideration in investment decisions. A change in the securities held by the Portfolio is known as “portfolio turnover.” The Portfolio may engage in frequent and active trading of portfolio securities to achieve its investment objective(s), particularly during
periods of volatile market movements. High portfolio turnover may involve correspondingly greater transaction costs, including brokerage commissions or dealer mark-ups and other transaction costs on the sale of securities and reinvestments in other securities, which are borne by the Portfolio. Such sales may also result in realization of taxable capital gains, including short-term capital gains (which are generally taxed at ordinary income tax rates when distributed to shareholders). The transaction costs associated with portfolio turnover may adversely affect the Portfolio’s performance. The portfolio turnover rates are reported in the Financial Highlights.
Purchases and sales of securities (excluding short-term investments) for the period ended June 30, 2024, were as follows (amounts in thousands†):
| | | | | | | | | | | | | | |
| U.S. Government/Agency | | | All Other | |
| Purchases | | | Sales | | | Purchases | | | Sales | |
| | | |
| $ | 42,944 | | | $ | 37,486 | | | $ | 50,308 | | | $ | 13,836 | |
| † | A zero balance may reflect actual amounts rounding to less than one thousand. |
13. SHARES OF BENEFICIAL INTEREST
The Trust may issue an unlimited number of shares of beneficial interest with a $0.001 par value. Changes in shares of beneficial interest were as follows (shares and amounts in thousands†):
| | | | | | | | | | | | | | | | | | | | |
| | | | Six Months Ended
06/30/2024 (Unaudited) | | | Year Ended
12/31/2023 | |
| | | | |
| | | | Shares | | | Amount | | | Shares | | | Amount | |
Receipts for shares sold | | | | | | | | | |
| | | | | |
Institutional Class | | | | | | | 5 | | | $ | 37 | | | | 75 | | | $ | 504 | |
| | | | | |
Advisor Class | | | | | | | 66 | | | | 479 | | | | 271 | | | | 1,755 | |
Issued as reinvestment of distributions | | | | | | | | | |
| | | | | |
Institutional Class | | | | | | | 116 | | | | 879 | | | | 131 | | | | 890 | |
| | | | | |
Advisor Class | | | | | | | 557 | | | | 4,121 | | | | 624 | | | | 4,110 | |
Cost of shares redeemed | | | | | | | | | |
| | | | | |
Institutional Class | | | | | | | (346 | ) | | | (2,581 | ) | | | (447 | ) | | | (2,964 | ) |
| | | | | |
Advisor Class | | | | | | | (1,995 | ) | | | (14,518 | ) | | | (4,073 | ) | | | (26,100 | ) |
| | | | | |
Net increase (decrease) resulting from Portfolio share transactions | | | | | | | (1,597 | ) | | $ | (11,583 | ) | | | (3,419 | ) | | $ | (21,805 | ) |
| † | A zero balance may reflect actual amounts rounding to less than one thousand. |
As of June 30, 2024, one person owned of record or beneficially 10% or more of the Portfolio’s total outstanding shares, comprising 94% of the Portfolio. The shareholder is a related party of the Portfolio. Related parties may include, but are not limited to, the investment adviser and its affiliates, affiliated broker dealers, fund of funds and directors or employees of the Trust or Adviser.
14. REGULATORY AND LITIGATION MATTERS
The Portfolio is not named as a defendant in any material litigation or arbitration proceedings and is not aware of any material litigation or claim pending or threatened against it.
The foregoing speaks only as of the date of this report.
15. FEDERAL INCOME TAX MATTERS
The Portfolio intends to qualify as a regulated investment company under Subchapter M of the Internal Revenue Code (the “Code”) and distribute all of its taxable income and net realized gains, if applicable, to shareholders. Accordingly, no provision for Federal income taxes has been made.
The Portfolio may be subject to local withholding taxes, including those imposed on realized capital gains. Any applicable foreign capital gains tax is accrued daily based upon net unrealized gains, and may be payable following the sale of any applicable investments.
In accordance with U.S. GAAP, the Adviser has reviewed the Portfolio’s tax positions for all open tax years. As of June 30, 2024, the Portfolio has recorded no liability for net unrecognized tax benefits relating to uncertain income tax positions it has taken or expects to take in future tax returns.
| | | | | | |
| 38 | | PIMCO EQUITY SERIES VIT | | | | |
| | | | | | |
| | | | June 30, 2024 | | (Unaudited) |
The Portfolio files U.S. federal, state and local tax returns as required. The Portfolio’s tax returns are subject to examination by relevant tax authorities until expiration of the applicable statute of limitations, which is generally three years after the filing of the tax return but which can be extended to six years in certain circumstances. Tax returns for open years have incorporated no uncertain tax positions that require a provision for income taxes.
Shares of the Portfolio currently are sold to segregated asset accounts (“Separate Accounts”) of insurance companies that fund variable annuity contracts and variable life insurance policies (“Variable Contracts”). Please refer to the prospectus for the Separate Account and Variable Contract for information regarding Federal income tax treatment of distributions to the Separate Account.
Under the Regulated Investment Company Modernization Act of 2010, a portfolio is permitted to carry forward any new capital losses for an unlimited period. Additionally, such capital losses that are carried forward will retain their character as either short-term or long-term capital losses rather than being considered all short-term under previous law.
As of its last fiscal year ended December 31, 2023, the Portfolio had the following post-effective capital losses with no expiration (amounts in thousands†):
| | | | | | |
| Short-Term | | | Long-Term | |
| |
| $ | 7,544 | | | $ | 11,051 | |
| † | A zero balance may reflect actual amounts rounding to less than one thousand. |
As of June 30, 2024, the aggregate cost and the net unrealized appreciation/(depreciation) of investments for federal income tax purposes are as follows (amounts in thousands†):
| | | | | | | | | | | | | | |
Federal
Tax Cost | | | Unrealized
Appreciation | | | Unrealized
(Depreciation) | | | Net Unrealized
Appreciation/
(Depreciation)(1) | |
| | | |
| $ | 186,526 | | | $ | 5,124 | | | $ | (2,576 | ) | | $ | 2,548 | |
| † | A zero balance may reflect actual amounts rounding to less than one thousand. |
| (1) | Primary differences, if any, between book and tax net unrealized appreciation/(depreciation) are attributable to wash sale loss deferrals for federal income tax purposes. |
| | | | | | | | | | | | |
| | | | SEMIANNUAL FINANCIAL AND OTHER INFORMATION | | | | | | | JUNE 30, 2024 | | | 39 |
| | | | | | |
| Glossary: | | (abbreviations that may be used in the preceding statements) | | | | (Unaudited) |
| | | | | | | | | | |
|
Counterparty Abbreviations: |
| | | | | |
| BOA | | Bank of America N.A. | | FICC | | Fixed Income Clearing Corporation | | NGF | | Nomura Global Financial Products, Inc. |
| | | | | |
| BPS | | BNP Paribas S.A. | | GLM | | Goldman Sachs Bank USA | | RYL | | NatWest Markets Plc |
| | | | | |
| BRC | | Barclays Bank PLC | | JPM | | JP Morgan Chase Bank N.A. | | SCX | | Standard Chartered Bank, London |
| | | | | |
| BSH | | Banco Santander S.A. - New York Branch | | MBC | | HSBC Bank Plc | | SSB | | State Street Bank and Trust Co. |
| | | | | |
| CBK | | Citibank N.A. | | MEI | | Merrill Lynch International | | TOR | | The Toronto-Dominion Bank |
| | | | | |
| DUB | | Deutsche Bank AG | | MYI | | Morgan Stanley & Co. International PLC | | UAG | | UBS AG Stamford |
| | | | | |
| FAR | | Wells Fargo Bank National Association | | | | | | | | |
|
Currency Abbreviations: |
| | | | | |
| AUD | | Australian Dollar | | GBP | | British Pound | | NZD | | New Zealand Dollar |
| | | | | |
| BRL | | Brazilian Real | | IDR | | Indonesian Rupiah | | PLN | | Polish Zloty |
| | | | | |
| CAD | | Canadian Dollar | | INR | | Indian Rupee | | SGD | | Singapore Dollar |
| | | | | |
| CHF | | Swiss Franc | | JPY | | Japanese Yen | | TWD | | Taiwanese Dollar |
| | | | | |
| CNH | | Chinese Renminbi (Offshore) | | KRW | | South Korean Won | | USD (or $) | | United States Dollar |
| | | | | |
| DKK | | Danish Krone | | MXN | | Mexican Peso | | ZAR | | South African Rand |
| | | | | |
| EUR | | Euro | | | | | | | | |
|
Exchange Abbreviations: |
| | | | | |
| OTC | | Over the Counter | | | | | | | | |
|
Index/Spread Abbreviations: |
| | | | | |
| CDX.EM | | Credit Derivatives Index - Emerging Markets | | EAFE | | Europe, Australasia, and Far East Stock Index | | SOFR | | Secured Overnight Financing Rate |
| | | | | |
| CDX.HY | | Credit Derivatives Index - High Yield | | S&P 500 | | Standard & Poor’s 500 Index | | SOFRINDX | | Secured Overnight Financing Rate Index |
| | | | | |
| CDX.IG | | Credit Derivatives Index - Investment Grade | | | | | | | | |
|
Other Abbreviations: |
| | | | | |
| ABS | | Asset-Backed Security | | LIBOR | | London Interbank Offered Rate | | OIS | | Overnight Index Swap |
| | | | | |
| CLO | | Collateralized Loan Obligation | | MSCI | | Morgan Stanley Capital International | | TBA | | To-Be-Announced |
| | | | | |
| DAC | | Designated Activity Company | | | | | | | | |
| | | | | | |
| 40 | | PIMCO EQUITY SERIES VIT | | | | |
General Information
Investment Adviser and Administrator
Pacific Investment Management Company LLC
650 Newport Center Drive
Newport Beach, CA 92660
Distributor
PIMCO Investments LLC
1633 Broadway
New York, NY 10019
Custodian
State Street Bank and Trust Company
2323 Grand Boulevard, 5th Floor
Kansas City, MO 64108
Transfer Agent
SS&C Global Investor & Distribution Solutions, Inc.
430 W 7th Street STE 219024
Kansas City, MO 64105-1407
Legal Counsel
Dechert LLP
1900 K Street, N.W.
Washington, D.C. 20006
Independent Registered Public Accounting Firm
PricewaterhouseCoopers LLP
1100 Walnut Street, Suite 1300
Kansas City, MO 64106
This report is submitted for the general information of the shareholders of the PIMCO Equity Series VIT.
pimco.com/pvit

EVIT01FSSAR_063024
| Item 8. | Changes in and Disagreements with Accountant for Open-End Management Investment Companies. |
Not applicable to the Registrant.
| Item 9. | Proxy Disclosures for Open-End Management Investment Companies. |
Not applicable to the Registrant.
| Item 10. | Remuneration Paid to Directors, Officers, and Others of Open-End Management Investment Companies. |
The information required by this Item 10 is included as part of the Financial Statements and Financial Highlights filed under Item 7(a) of this Form N-CSR.
| Item 11. | Statement Regarding Basis for Approval of Investment Advisory Contract. |
Not applicable to the Registrant.
| Item 12. | Disclosure of Proxy Voting Policies and Procedures for Closed-End Management Investment Companies. |
Not applicable to open-end investment companies.
| Item 13. | Portfolio Managers of Closed-End Management Investment Companies. |
Not applicable to open-end investment companies.
| Item 14. | Purchases of Equity Securities by Closed-End Management Investment Company and Affiliated Purchasers. |
Not applicable to open-end investment companies.
| Item 15. | Submission of Matters to a Vote of Security Holders. |
There have been no material changes to the procedures by which shareholders may recommend nominees to the Trust’s Board of Trustees since the Trust last provided disclosure in response to this item.
| Item 16. | Controls and Procedures. |
| | (a) | The principal executive officer and principal financial & accounting officer have concluded that the Registrant’s disclosure controls and procedures (as defined in Rule 30a-3(c) under the Act) provide reasonable assurances that material information relating to the Registrant is made known to them by the appropriate persons, based on their evaluation of these controls and procedures as of a date within 90 days of the filing of this report. |
| | (b) | There were no changes in the Registrant’s internal control over financial reporting (as defined in Rule 30a-3(d) under the Act) that occurred during the period covered by this report that have materially affected, or are reasonably likely to materially affect, the Registrant’s internal control over financial reporting. |
| Item 17. | Disclosure of Securities Lending Activities for Closed-End Management Investment Companies. |
Not applicable to open-end investment companies.
| Item 18. | Recovery of Erroneously Awarded Compensation |
| | (a) | Not applicable to the Registrant. |
| | (b) | Not applicable to the Registrant. |
| | (a)(1) | Exhibit 99.CODE—Code of Ethics is not applicable for semiannual reports. |
| | (a)(2) | Not applicable to the Registrant. |
| | (a)(4) | Not applicable to the Registrant. |
| | (a)(5) | There was no change in the Registrant’s independent public accountant for the period covered by the report. |
Signatures
Pursuant to the requirements of the Securities Exchange Act of 1934 and the Investment Company Act of 1940, the registrant has duly caused this report to be signed on its behalf by the undersigned, thereunto duly authorized.
| | |
| PIMCO Equity Series VIT |
| |
| By: | | /s/ Joshua D. Ratner |
| | Joshua D. Ratner |
| | President (Principal Executive Officer) |
| |
| Date: | | August 28, 2024 |
Pursuant to the requirements of the Securities Exchange Act of 1934 and the Investment Company Act of 1940, this report has been signed below by the following persons on behalf of the registrant and in the capacities and on the dates indicated.
| | |
| By: | | /s/ Joshua D. Ratner |
| | Joshua D. Ratner |
| | President (Principal Executive Officer) |
| |
| Date: | | August 28, 2024 |
| |
| By: | | /s/ Bijal Y. Parikh |
| | Bijal Y. Parikh |
| | Treasurer (Principal Financial & Accounting Officer) |
| |
| Date: | | August 28, 2024 |