Exhibit 99.1

[Graphic Appears Here]
[Graphic Appears Here]
could
under
inclusion
plans,
our
results
activity,
or
changes
of the
are
that
made
Safe Harbor Statement
Statements
presentation contains forward-looking statements. Any statements objectives, assumptions or future events or performance are not are often, but not always, made through the use of words or phrases “predicts,” “potential,” “should,” “will,” “estimate,” “plans,” “projects,” phrases. Accordingly, these statements are only predictions and involve uncertainties that could cause actual results to differ materially from from those anticipated -forward looking in such statements tatements as a
“Risk Factors” in the annual report on Form 10-K and other periodic Any or all of our forward-looking statements in this presentation forward-looking information should not be regarded as a representation expectations contemplated by us will be achieved. We have based and projections about futureevents and financial trendsthat business strategy and financial needs. There are important factors or achievements to differ materially from the results, level of activity, forward looking statements including, but not limited to: (1) changes changes in the regulatory environment; (3) economic conditions generally economy affecting real estate values; (5)our ability to achieve loan and business combinations and our ability to integrate the acquired business income growth in our targeted market areas; and (8) volatility and direction which could materially impact credit quality trends and the ability to estimates of future results and actual results may differ materially place undue reliance on such statements which should be read in elsewhere in this presentation. Further, any forward-looking statement undertake no obligation to update or revise any forward-looking statement statement is made or to reflect the occurrence of unanticipated events.
[Graphic Appears Here]
[Graphic Appears Here]
[Graphic Appears Here]
[Graphic Appears Here]
[Graphic Appears Here]
[Graphic Appears Here]
[Graphic Appears Here]
[Graphic Appears Here]
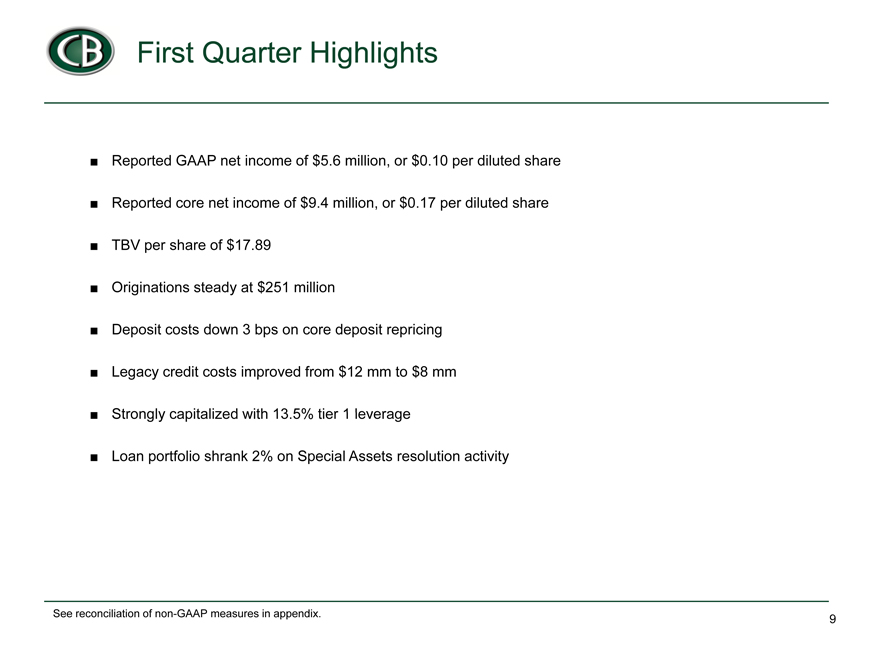
Reported GAAP net income of $5.6 million, or $0.10 per diluted share
Reported core net income of $9.4 million, or $0.17 per diluted share
TBV per share of $17.89
Originations steady at $251 million
Deposit costs down 3 bps on core deposit repricing
Legacy credit costs improved from $12 mm to $8 mm
Strongly capitalizedapitalized with 13.5% tier 1 leverage
Loan portfolio shrank 2% on Special Assets resolution activity
First Quarter Core Earnings Summary
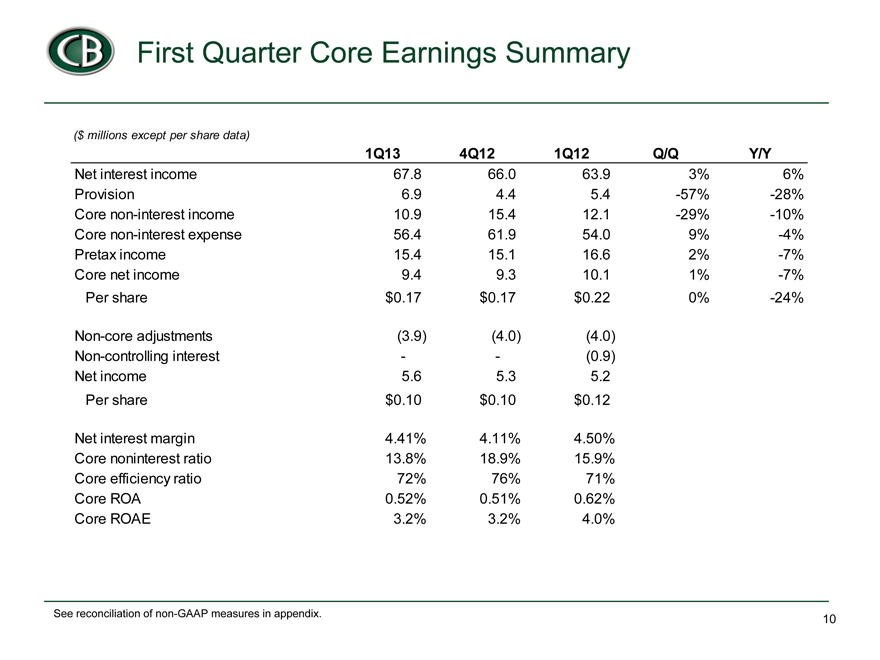
($ millions except per share data)
1Q13 4Q12 1Q12 Q/Q Y/Y
Net interest income 67.8 66.0 63.9 3% 6%
Provision 6.9 4.4 5.4 -57% -28%
Core non-interest income 10.9 15.4 12.1 -29% -10%
Core non-interest expense 56.4 61.9 54.0 9% -4%
Pretax income 15.4 15.1 16.6 2% -7%
Core net income 9.4 9.3 10.1 1% -7%
Per share $ 0.17 $ 0.17 $ 0.22 0% -24%
Non-core adjustments (3.9) (4.0) (4.0)
Non-controlling interest — — (0.9)
Net income 5.6 5.3 5.2
Per share $ 0.10 $ 0.10 $ 0.12
Net interest margin 4.41% 4.11% 4.50%
Core noninterest ratio 13.8% 18.9% 15.9%
Core efficiency ratio 72% 76% 71%
Core ROA 0.52% 0.51% 0.62%
Core ROAE 3.2% 3.2% 4.0%
[Graphic Appears Here]
$ in
[Graphic Appears Here]
[Graphic Appears Here]
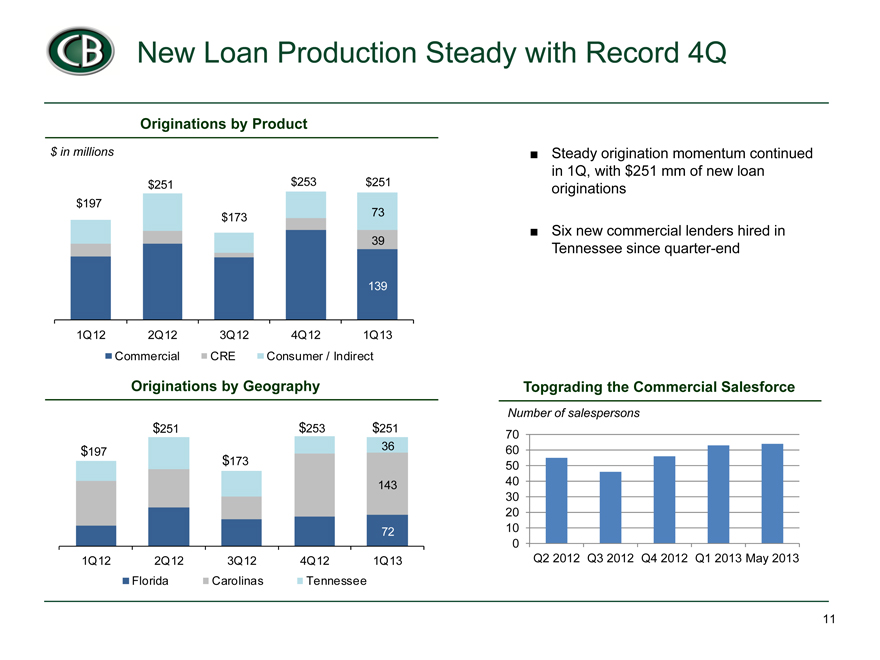
Steady origination momentum continued in 1Q, with $251 mm of new loan originations
Six new commercial lenders hired in Tennessee since quarter-end
?
[Graphic Appears Here]
5,500 5,000 4,500 4,000 3,500
60% 50% 40% 30% 20% 10%
[Graphic Appears Here]
/31/2012 ginations Payoffs al Assets aydowns /31/2013
12 Ori E CR Speci Other P 3
CRE Concentration
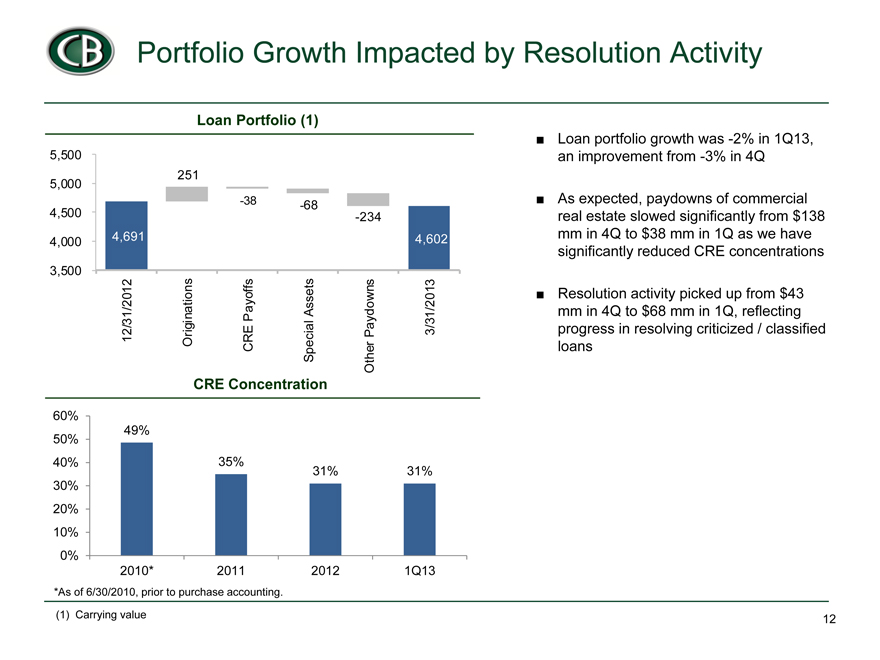
Loan portfolio growth was -2% in 1Q13, an improvement from -3% in 4Q
As expected, paydowns of commercial real estate slowed significantly from $138
in 4Q to $38 mm in 1Q as we have
significantly reduced CRE concentrations
Resolution activity picked up from $43
in 4Q to $68 mm in 1Q, reflecting
progress in resolving criticized / classified loans
[Graphic Appears Here]
[Graphic Appears Here]
$ in
1Q12 2Q12 3Q12 4Q12 1Q13
Transaction Accounts Savings & Money Market
Cost of Deposits
Total Core
0.65% 0.62%
0.58%
0.49% 0.46%
[Graphic Appears Here]
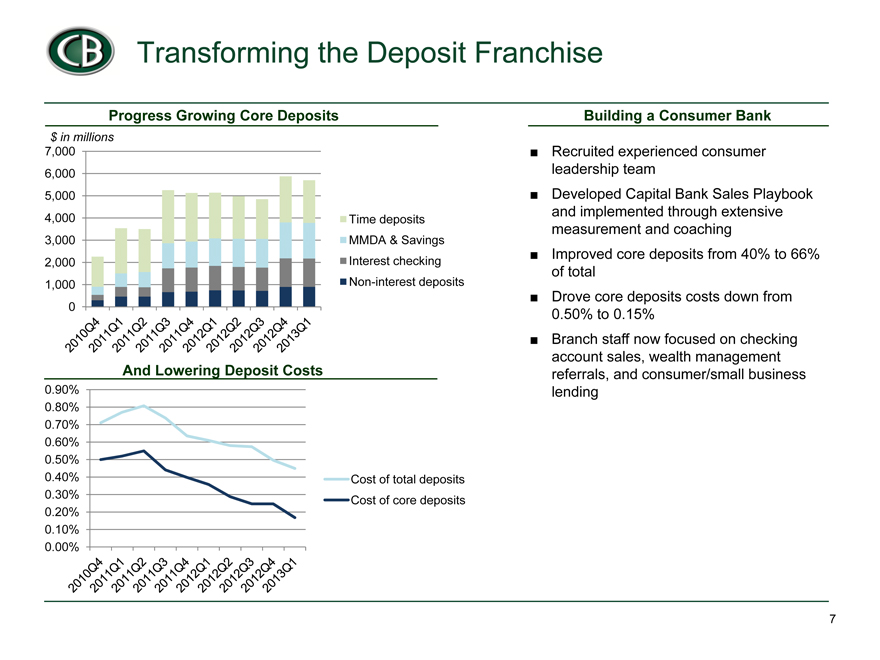
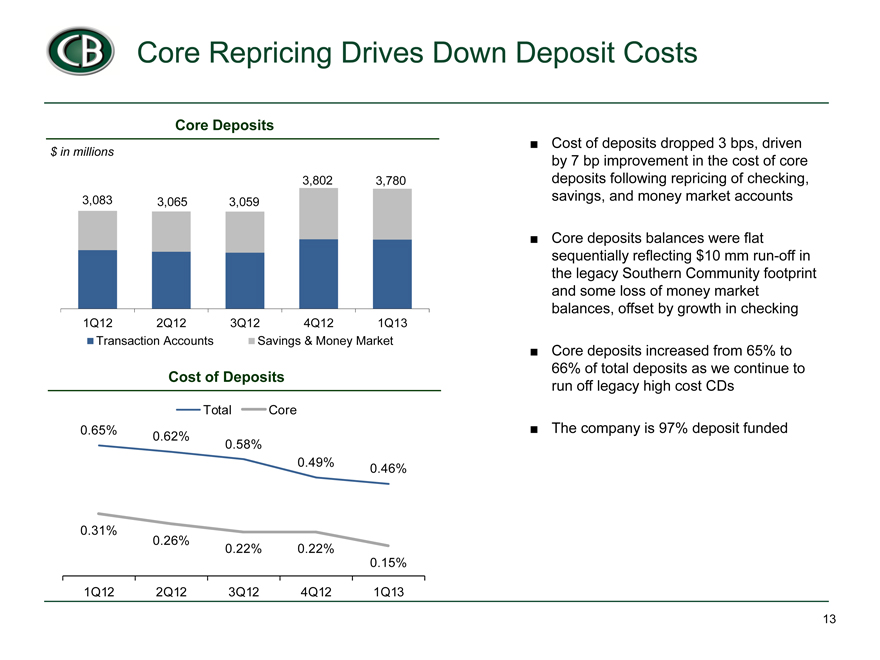
Cost of deposits dropped 3 bps, driven by 7 bp improvement in the cost of core deposits following repricing of checking, savings, and money market accounts
Core deposits balances were flat sequentially reflecting $10 mm run-off in the legacy Southern Community footprint and some loss of money market balances, offset by growth in checking
Core deposits increased from 65% to 66% of total deposits as we continue to run off legacy high cost CDs
The company is 97% deposit funded
[Graphic Appears Here]
[Graphic Appears Here]
6.47% 6.37% 6.28% 6.04% 6.37%
5.24%
4.84% 4.52% 4.27% 4.38%
2.18% 1.96%
1.63% 1.28% 1.43%
1Q12 2Q12 3Q12 4Q12 1Q13
Loan Yields Yield on New Loans Security Yields
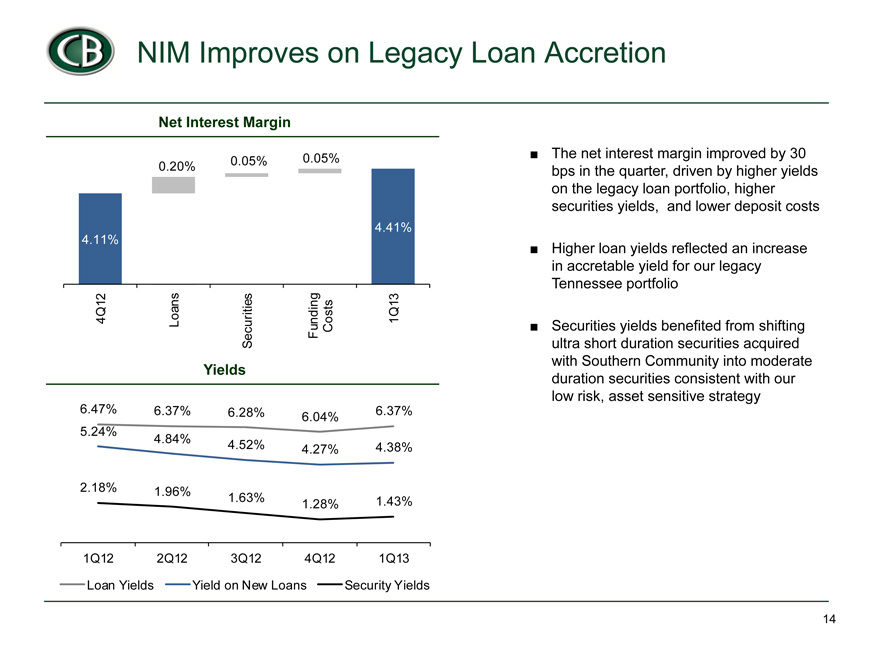
The net interest margin improved by 30 bps in the quarter, driven by higher yields on the legacy loan portfolio, higher securities yields, and lower deposit costs
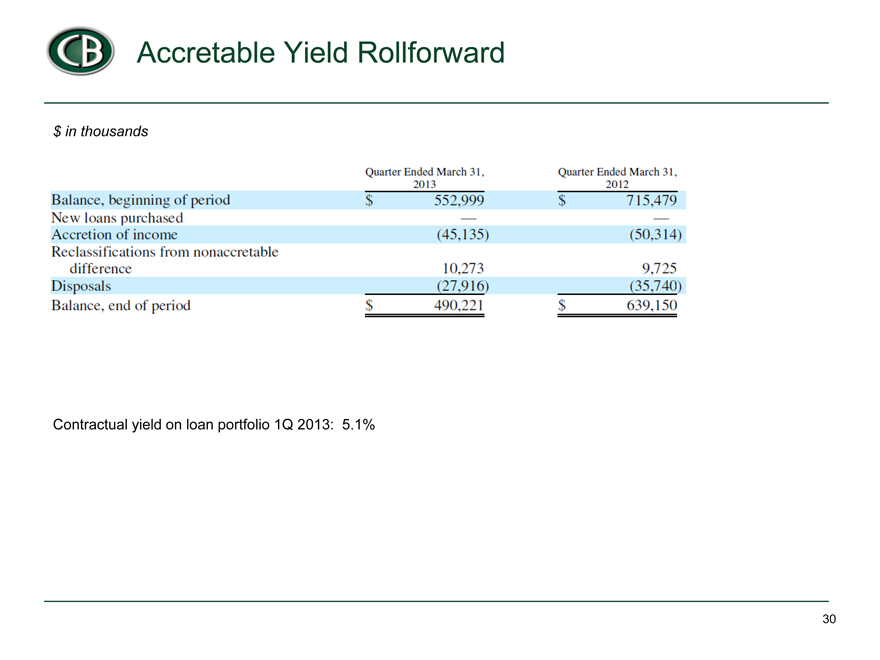
Higher loan yields reflected an increase in accretable yield for our legacy Tennessee portfolio
Securities yields benefited from shifting ultra short duration securities acquired with Southern Community into moderate duration securities consistent with our low risk, asset sensitive strategy
[Graphic Appears Here]
$ in
25 20 15 10 5 0 -5
Services Debit Fees
Other
[Graphic Appears Here]
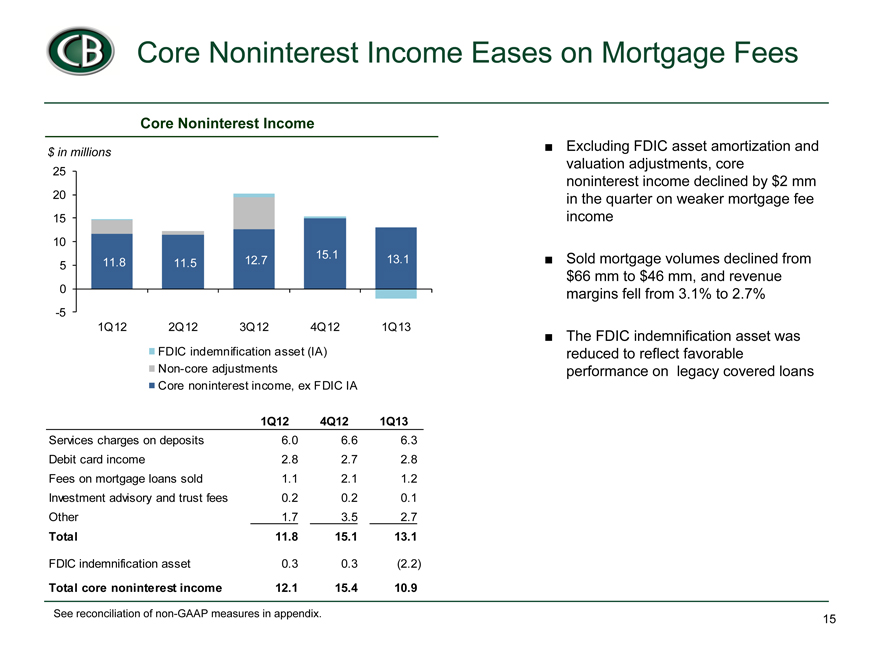
Excluding FDIC asset amortization and valuation adjustments, core noninterest income declined by $2 mm in the quarter on weaker mortgage fee income
Sold mortgage volumes declined from $66 mm to $46 mm, and revenue margins fell from 3.1% to 2.7%
The FDIC indemnification asset was reduced to reflect favorable performance on legacy covered loans
[Graphic Appears Here]
$ in
Net
Other
Total
fees
50 47 46 53 50
1Q12 2Q12 3Q12 4Q12 1Q13
Non-core adjustments
REO expense
Core non-interest expense, before REO
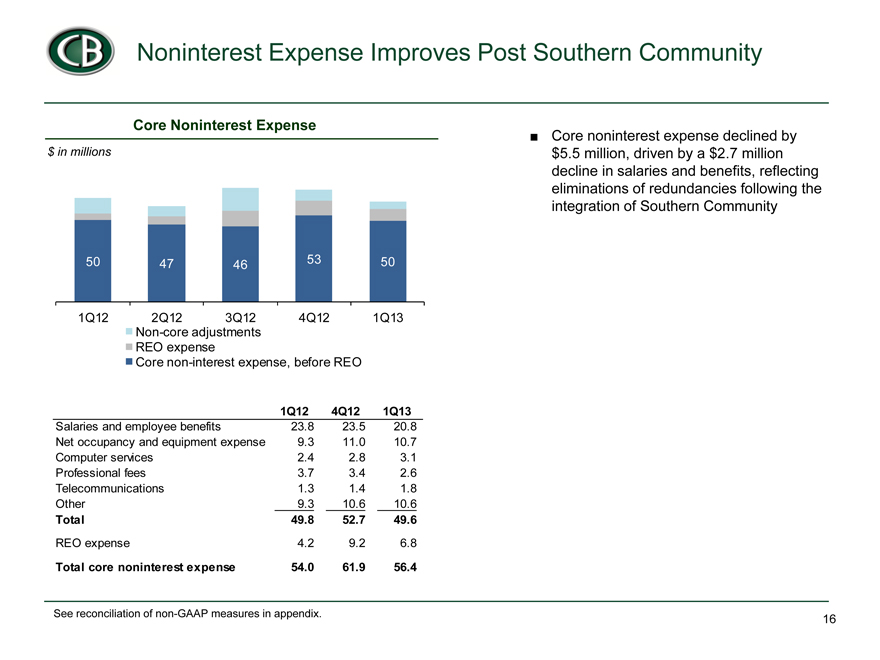
Core noninterest expense declined by $5.5 million, driven by a $2.7 million decline in salaries and benefits, reflecting eliminations of redundancies following the integration of Southern Community
1Q12 4Q12 1Q13
Salaries and employee benefits 23.8 23.5 20.8
Net occupancy and equipment expense 9.3 11.0 10.7
Computer services 2.4 2.8 3.1
Professional fees 3.7 3.4 2.6
Telecommunications 1.3 1.4 1.8
Other 9.3 10.6 10.6
Total 49.8 52.7 49.6
REO expense 4.2 9.2 6.8
Total core noninterest expense 54.0 61.9 56.4
See reconciliation of non-GAAP measures in appendix. 16
[Graphic Appears Here]
$ in
CMO,
$
[Graphic Appears Here]
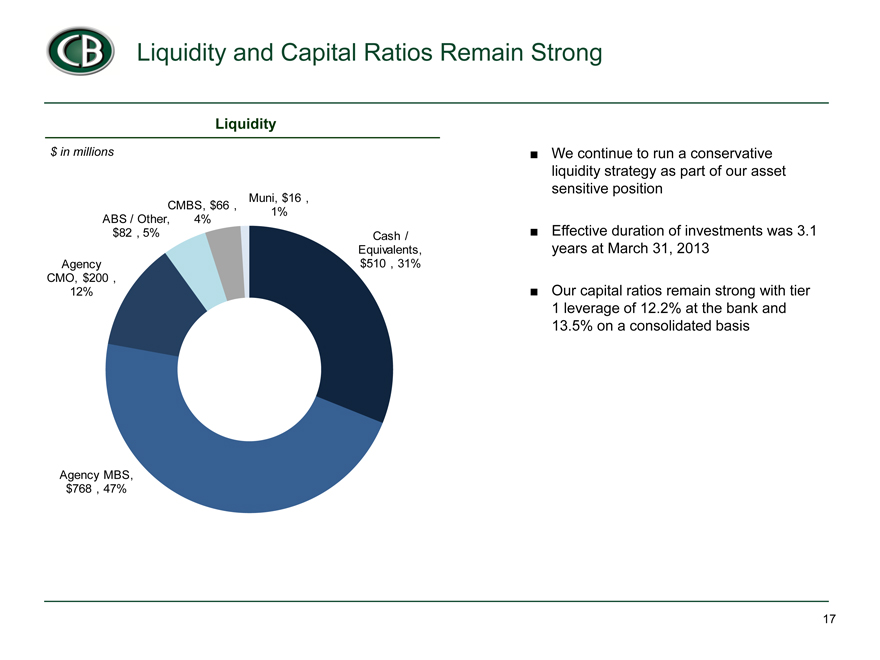
We continue to run a conservative liquidity strategy as part of our asset sensitive position
Effective duration of investments was 3.1 years at March 31, 2013
Our capital ratios remain strong with tier 1 leverage of 12.2% at the bank and 13.5% on a consolidated basis
[Graphic Appears Here]
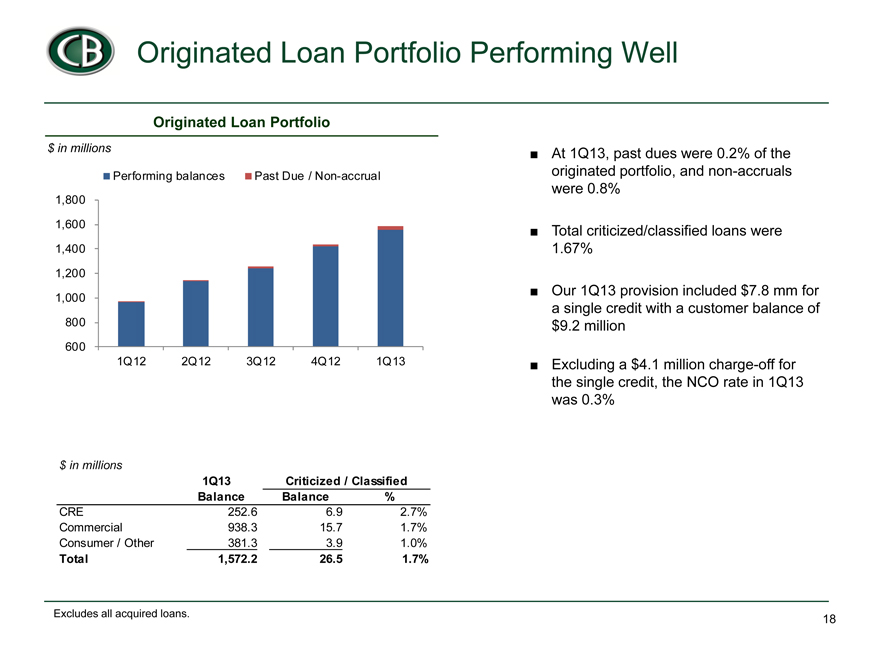
$ in millions
1Q13 Criticized / Classified
Balance Balance %
CRE 252.6 6.9 2.7%
Commercial 938.3 15.7 1.7%
Consumer / Other 381.3 3.9 1.0%
Total 1,572.2 26.5 1.7%
[Graphic Appears Here]
$ in
18 16 14 12 10 8 6 4 2 -
[Graphic Appears Here]
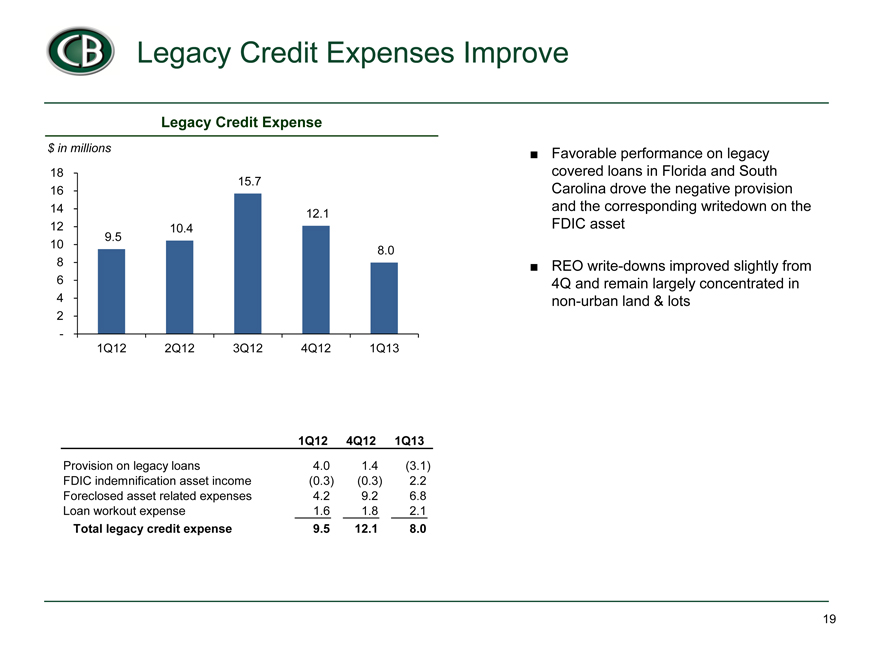
1Q12 4Q12 1Q13
Provision on legacy loans 4.0 1.4 (3.1)
FDIC indemnification asset income (0.3) (0.3) 2.2
Foreclosed asset related expenses 4.2 9.2 6.8
Loan workout expense 1.6 1.8 2.1
Total legacy credit expense 9.5 12.1 8.0
Favorable performance on legacy covered loans in Florida and South Carolina drove the negative provision and the corresponding writedown on the FDIC asset
REO write-downs improved slightly from 4Q and remain largely concentrated in non-urban land & lots
[Graphic Appears Here]
$ in
1,200 1,000 800 600 400 200
Customer
[Graphic Appears Here]
[Graphic Appears Here]
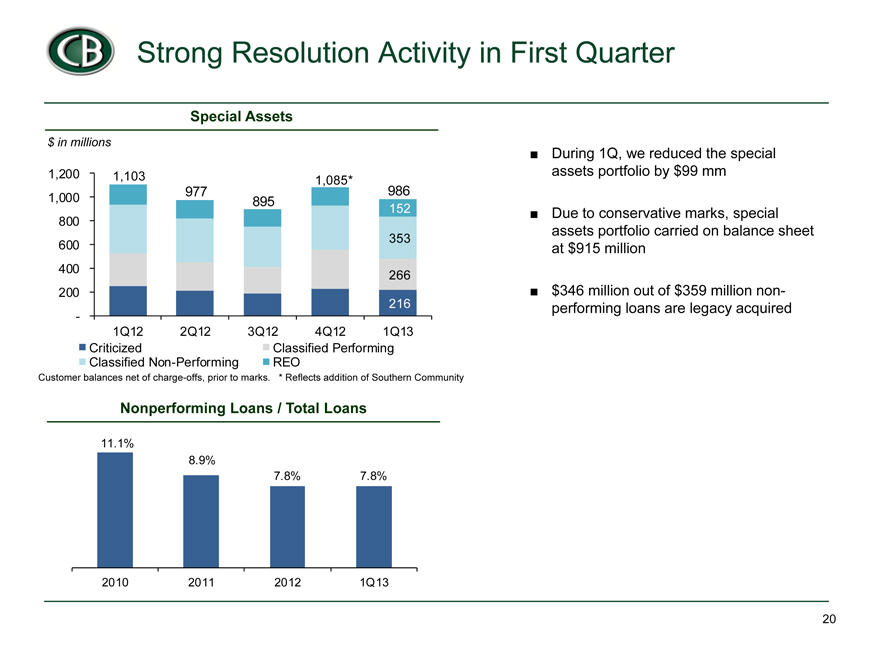
During 1Q, we reduced the special assets portfolio by $99 mm
Due to conservative marks, special assets portfolio carried on balance sheet at $915 million
$346 million out of $359 million non- performing loans are legacy acquired
[Graphic Appears Here]
[Graphic Appears Here]
3.5x
3.0x
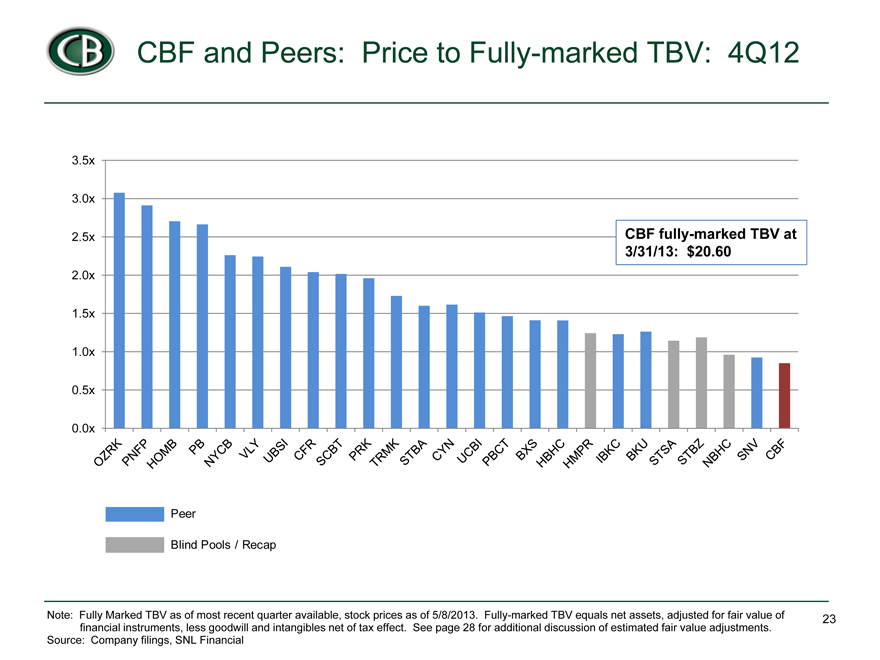
2.5x CBF fully-marked TBV at
3/31/13: $20.60
2.0x
1.5x
1.0x
0.5x
0.0x
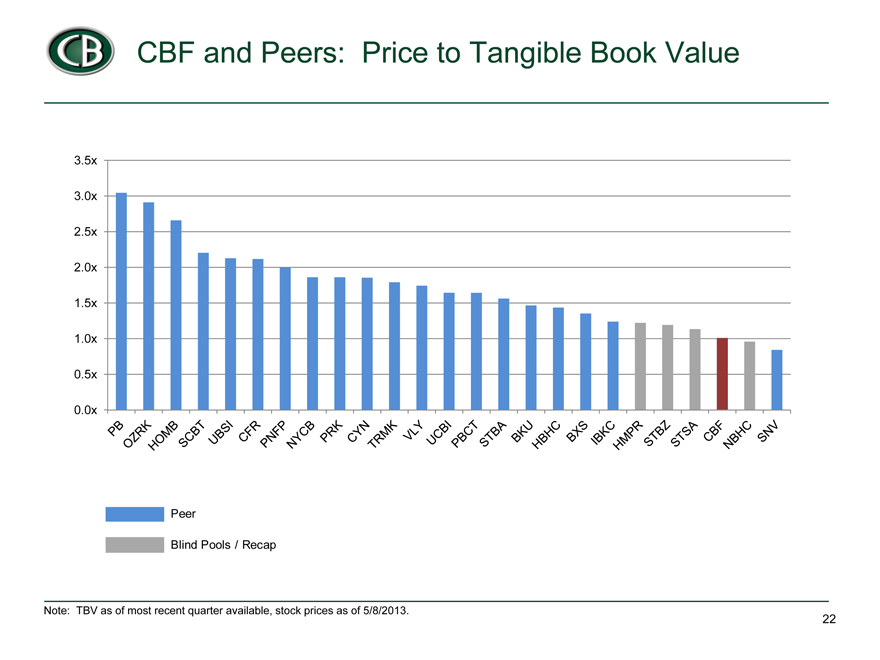
Note: Fully Marked TBV as of most recent quarter available, stock prices as of 5/8/2013. Fully-marked TBV equals net assets, adjusted for fair value of 23
financial instruments, less goodwill and intangibles net of tax effect. See page 28 for additional discussion of estimated fair value adjustments.
Source: Company filings, SNL Financial
[Graphic Appears Here]
filings,
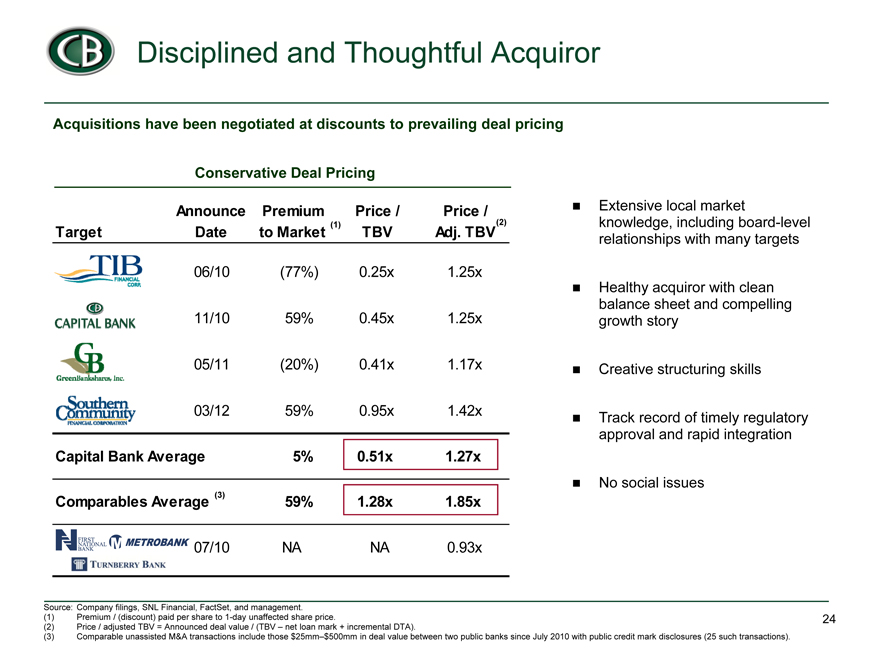
Conservative Deal Pricing
Announce Premium Price / Price /
Target Date to Market (1) TBV Adj. TBV (2)
06/10 (77%) 0.25x 1.25x
11/10 59% 0.45x 1.25x
05/11 (20%) 0.41x 1.17x
03/12 59% 0.95x 142x.
Capital Bank Average 5% 0.51x 1.27x
Comparables Average (3) 59% 1.28x 1.85x
07/10 NA NA 0.93x
Extensive local market knowledge, including board-level relationships with many targets
Healthy acquiror with clean balance sheet and compelling growth story
Creative structuring skills
Track record of timely regulatory approval and rapid integration
No social issues
[Graphic Appears Here]
Source: Company filings, SNL Financial, FactSet, and management.
(1) Premium / (discount) paid per share to 1-day unaffected share price. 24
(2) Price / adjusted TBV = Announced deal value / (TBV – net loan mark + incremental DTA).
(3) Comparable unassisted M&A transactions include those $25mm–$500mm in deal value between two public banks since July 2010 with public credit mark disclosures (25 such transactions).
[Graphic Appears Here]
$
**
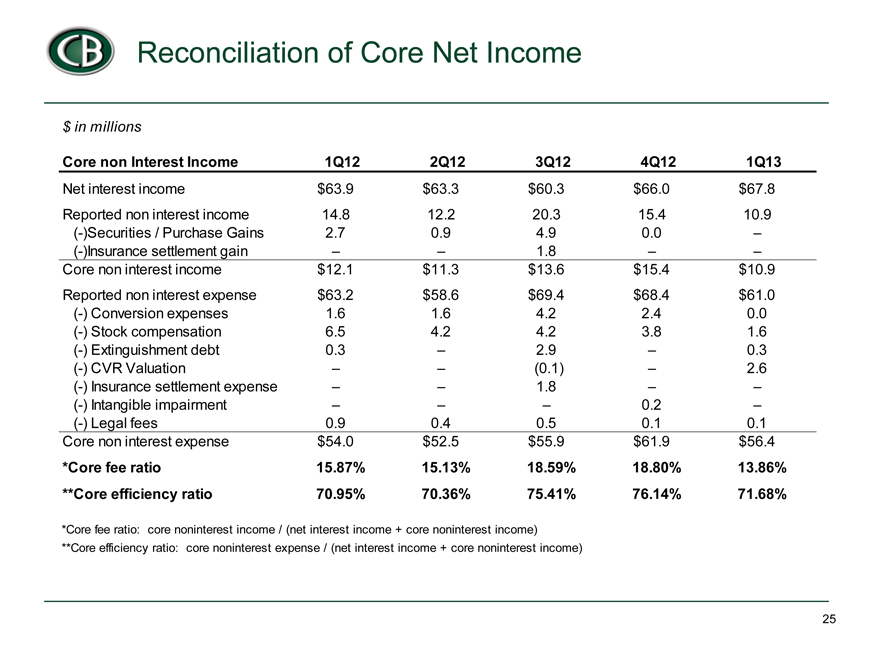
$ in millions
Core non Interest Income 1Q12 2Q12 3Q12 4Q12 1Q13
Net interest income $63.9 $63.3 $60.3 $66.0 $67.8
Reported non interest income 14.8 12.2 20.3 15.4 10.9
(-)Securities / Purchase Gains 2.7 0.9 4.9 0.0 –
(-)Insurance settlement gain – – 1.8 – –
Core non interest income $12.1 $11.3 $13.6 $15.4 $10.9
Reported non interest expense $63.2 $58.6 $69.4 $68.4 $61.0
(-) Conversion expenses 1.6 1.6 4.2 2.4 0.0
(-) Stockoc compensatioompen at 6.5 4.2 4.2 3.8 1.6
(-) Extinguishment debt 0.3 – 2.9 – 0.3
(-) CVR Valuation – – (0.1) – 2.6
(-) Insurance settlement expense – – 1.8 – –
(-) Intangible impairment – – – 0.2 –
(-) Legal fees 0.9 0.4 0.5 0.1 0.1
Core non interest expense $54.0 $52.5 $55.9 $61.9 $56.4
*Core fee ratio 15.87% 15.13% 18.59% 18.80% 13.86%
**Core efficiency ratio 70.95% 70.36% 75.41% 76.14% 71.68%
3Q12
60.3 20.3 4.9 1.8 13.6 69.4 4.2 2 4.
2.9 (0.1) 1.8 –0.5 55.9
18.59% 75.41%
income)
[Graphic Appears Here]
$ in
Net
Core
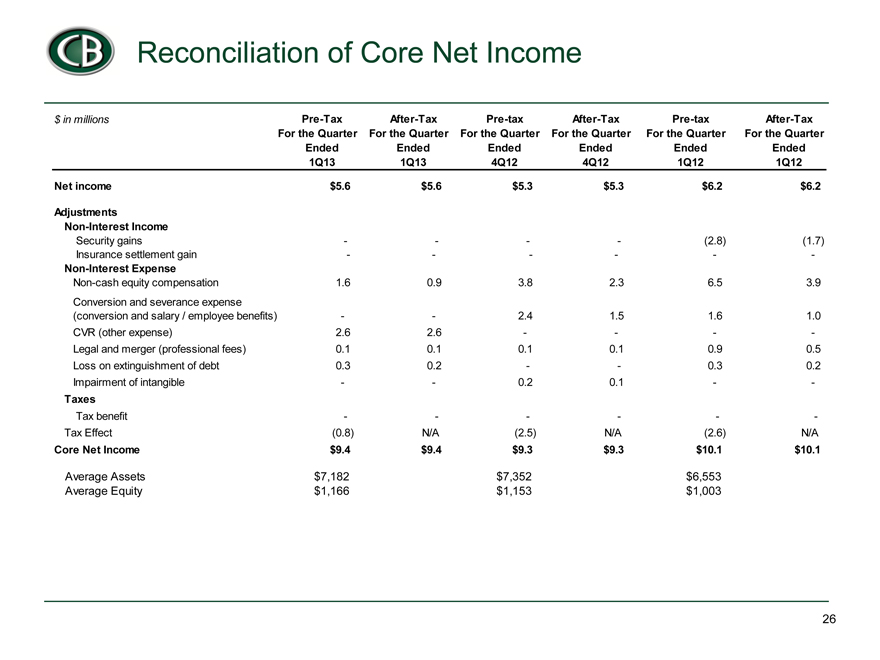
$ in millions Pre-Tax After-Tax Pre-tax After-Tax Pre-tax After-Tax
For the Quarter For the Quarter For the Quarter For the Quarter For the Quarter For the Quarter
Ended Ended Ended Ended Ended Ended
1Q13 1Q13 4Q12 4Q12 1Q12 1Q12
Net income $5.6 $5.6 $5.3 $5.3 $6.2 $6.2
Adjustments
Non-Interest Income
Security gains ———— (2.8) (1.7)
Insurance settlement gain ————— -
Non-Interest Expense
Non-cash equity compensation 1.6 0.9 3.8 2.3 6.5 3.9
Conversion and severance expense
(conversion and salary / employee benefits) —— 2.4 1.5 1.6 1.0
CVR (other expense) 2.6 2.6 ——— -
Legal and merger (professional fees) 0.1 0.1 0.1 0.1 0.9 0.5
Loss on extinguishment of debt 0.3 0.2 —— 0.3 0.2
Impairment of intangible —— 0.2 0.1 — -
Taxes
Tax benefit ————— -
Tax Effect (0.8) N/A (2.5) N/A (2.6) N/A
Core Net Income $9.4 $9.4 $9.3 $9.3 $10.1 $10.1
Average Assets $7,182 $7,352 $6,553
Average Equity $1,166 $1,153 $1,003
[Graphic Appears Here]
$ in
Total
$ in
Assets
Net Net
Plus
Shares
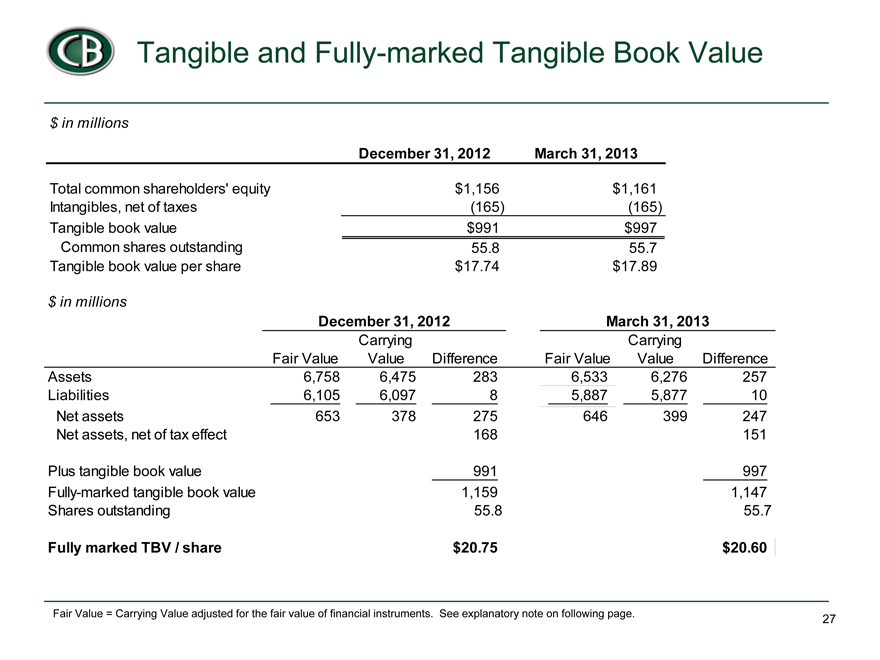
$ in millions
December 31, 2012 March 31, 2013
Total common shareholders’ equity $1,156 $1,161
Intangibles, net of taxes (165) (165)
Tangible book value $991 $997
Common shares outstanding 55.8 55.7
Tangible book value per share $17.74 $17.89
$ in millions
December 31, 2012 March 31, 2013
Carrying Carrying
Fair Value Value Difference Fair Value Value Difference
Assets 6,758 6,475 283 6,533 6,276 257
Liabilities 6,105 6,097 8 5,887 5,877 10
Net assets 653 378 275 646 399 247
Net assets, net of tax effect 168 151
Plus tangible book value 991 997
Fully-marked tangible book value 1,159 1,147
Shares outstanding 55.8 55.7
Fully marked TBV / share $20.75 $20.60
$
page.
[Graphic Appears Here]
The
risk. The The
the
fair and
Tangible and Fully-marked
assumptions used to estimate fair value of financial instruments are
is the estimated fair value for cash and cash equivalents, receivable from As it is not practicable to determine the fair value of Federal Reserve, due to restrictions placed on transferability, the estimated fair value is dealer quotes, and if no such information is available, on the rate and term discounted cash flows when necessary. For fixed rate loans or contractual limits, fair value is based on discounted cash flows using current market impaired loans are estimated using discounted cash flow analysis or similar financing.
off-balance sheet items that includes commitments to extend credit to fund and to fund standby letters of credit is considered nominal.
difference between carrying valueand estimated fair valueof financial of our loan portfolio. As described in Note 14 to the Company’s Consolidated carrying value by approximately $256.8 million. This difference arises as management’s expectation of lifetime credit losses. As our loan cash and the market interest rates for similar instruments have generally discounted cash flows as a primary valuation approach incorporating collateral applicable) along with the LIBOR/Swap curve for market interest rates. For and liquidity factors. Estimated fair values for commercial loans were e2 release, and rated corporate bonds. The Company’s internal risk fair values for commercial real estate loans also incorporated commercial for consumer loans were determined using product-specific survey residential mortgage loans were determined using mortgage backed security spreads were sourced from third party survey data of mortgage banking
[Graphic Appears Here]
Total Less:
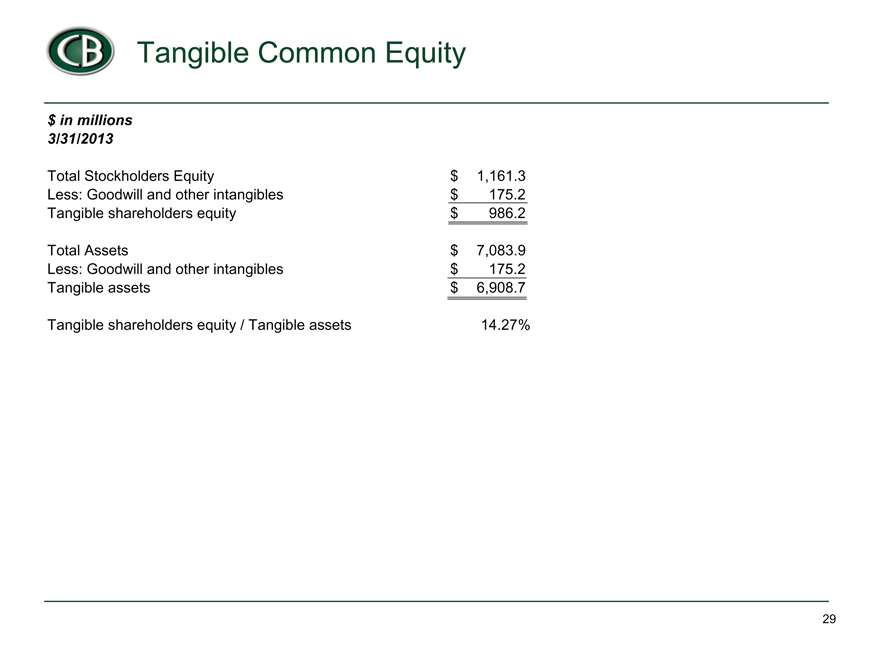
$ in millions
3/31/2013
Total Stockholders Equity $ 1,161.3
Less: Goodwill and other intangibles $ 175.2
Tangible shareholders equity $ 986.2
Total Assets $ 7,083.9
Less: Goodwill and other intangibles $ 175.2
Tangible assets $ 6,908.7
Tangible shareholders equity / Tangible assets 14.27%
[Graphic Appears Here]
[Graphic Appears Here]
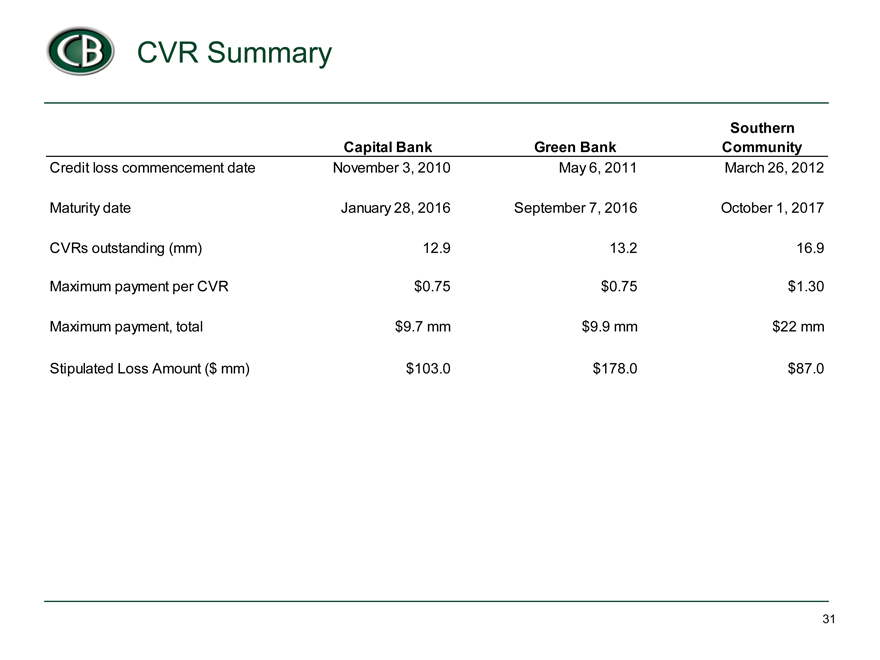
Southern
Capital Bank Green Bank Community
November 3, 2010 May 6, 2011 March 26, 2012
January 28, 2016 September 7, 2016 October 1, 2017
12.9 13.2 16.9
$0.75 $0.75 $1.30
$9.7 mm $9.9 mm $22 mm
$103.0 $178.0 $87.0