2014 Third Quarter Earnings October 16, 2014
Safe Harbor Statement 2 10/16/2014 Forward-Looking Statements Information in this presentation contains forward-looking statements. Any statements about our expectations, beliefs, plans, predictions, forecasts, objectives, assumptions or future events or performance are not historical facts and may be forward- looking. These statements are often, but not always, made through the use of words or phrases such as “anticipate,” “believes,” “can,” “could,” “may,” “predicts,” “potential,” “should,” “will,” “estimate,” “plans,” “projects,” “continuing,” “ongoing,” “expects,” “intends” and similar words or phrases. Accordingly, these statements are only predictions and involve estimates, known and unknown risks, assumptions and uncertainties that could cause actual results to differ materially from those expressed in them. Our actual results could differ materially from those anticipated in such forward-looking statements as a result of several factors more fully described under the caption “Risk Factors” in the annual report on Form 10-K and other periodic reports filed by us with the Securities and Exchange Commission. Any or all of our forward-looking statements in this presentation may turn out to be inaccurate. The inclusion of this forward-looking information should not be regarded as a representation by us or any other person that the future plans, estimates or expectations contemplated by us will be achieved. We have based these forward- looking statements largely on our current expectations and projections about future events and financial trends that we believe may affect our financial condition, results of operations, business strategy and financial needs. There are important factors that could cause our actual results, level of activity, performance or achievements to differ materially from the results, level of activity, performance or achievements expressed or implied by the forward looking statements including, but not limited to: (1) changes in general economic and financial market conditions; (2) changes in the regulatory environment; (3) economic conditions generally and in the financial services industry; (4) changes in the economy affecting real estate values; (5) our ability to achieve loan and deposit growth; (6) the completion of future acquisitions or business combinations and our ability to integrate any acquired businesses into our business model; (7) projected population and income growth in our targeted market areas; (8) competitive pressures in our markets and industry; (9) our ability to attract and retain key personnel; (10) changes in accounting policies or judgments; and (11) volatility and direction of market interest rates and a weakening of the economy which could materially impact credit quality trends and the ability to generate loans. All forward-looking statements are necessarily only estimates of future results and actual results may differ materially from expectations. You are, therefore, cautioned not to place undue reliance on such statements which should be read in conjunction with the other cautionary statements that are included elsewhere in this presentation. Further, any forward-looking statement speaks only as of the date on which it is made and we undertake no obligation to update or revise any forward-looking statement to reflect events or circumstances after the date on which the statement is made or to reflect the occurrence of unanticipated events.
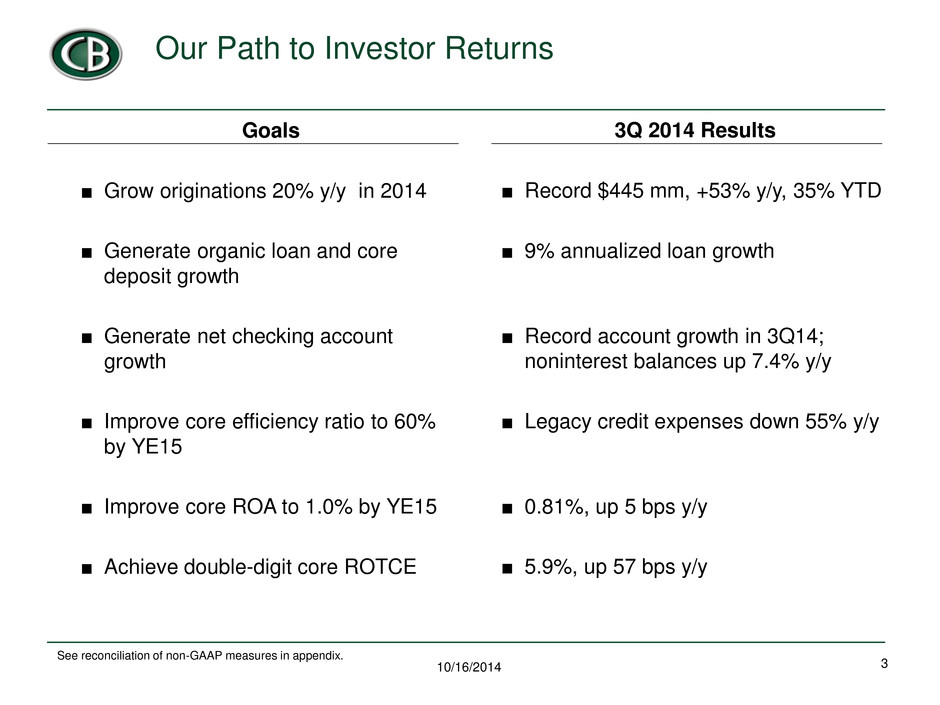
3 Our Path to Investor Returns Goals ■ Grow originations 20% y/y in 2014 ; ■ Generate organic loan and core deposit growth ■ Generate net checking account growth ■ Improve core efficiency ratio to 60% by YE15 ■ Improve core ROA to 1.0% by YE15 ■ Achieve double-digit core ROTCE 10/16/2014 3Q 2014 Results ■ Record $445 mm, +53% y/y, 35% YTD ;;; ■ 9% annualized loan growth xx ■ Record account growth in 3Q14; noninterest balances up 7.4% y/y ■ Legacy credit expenses down 55% y/y x s ■ 0.81%, up 5 bps y/y x ■ 5.9%, up 57 bps y/y ;;;;;;;;;;;; s See reconciliation of non-GAAP measures in appendix.
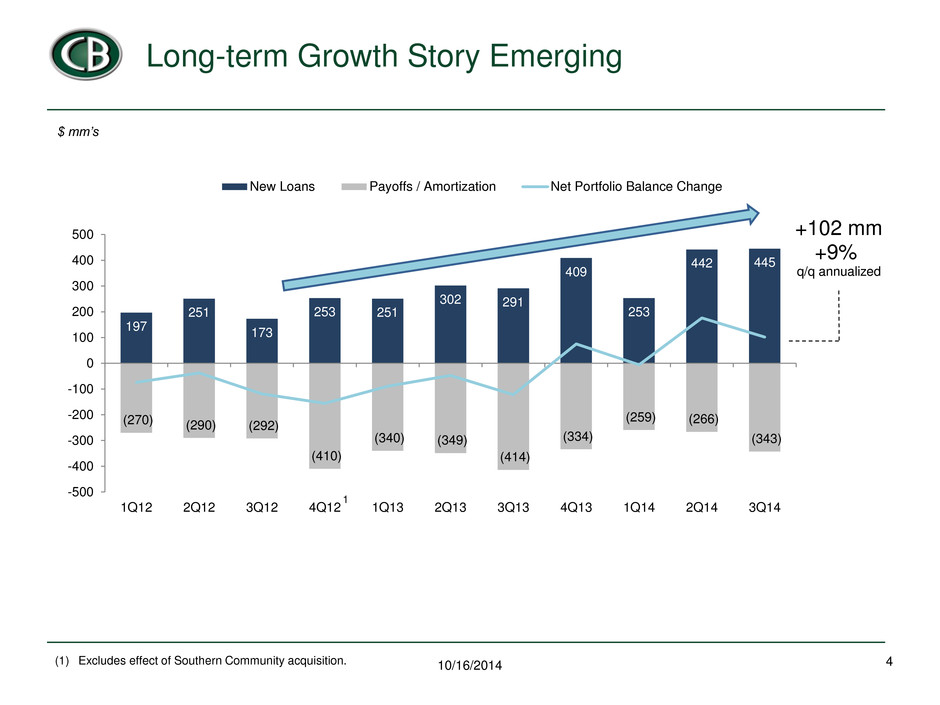
Long-term Growth Story Emerging 4 10/16/2014 $ mm’s (1) Excludes effect of Southern Community acquisition. 197 251 173 253 251 302 291 409 253 442 445 (270) (290) (292) (410) (340) (349) (414) (334) (259) (266) (343) -500 -400 -300 200 -100 0 100 200 300 400 500 1Q12 2Q12 3Q12 4Q12 1Q13 2Q13 3Q13 4Q13 1Q14 2Q14 3Q14 New Loans Payoffs / Amortization Net Portfolio Balance Change 1 +102 mm +9% q/q annualized
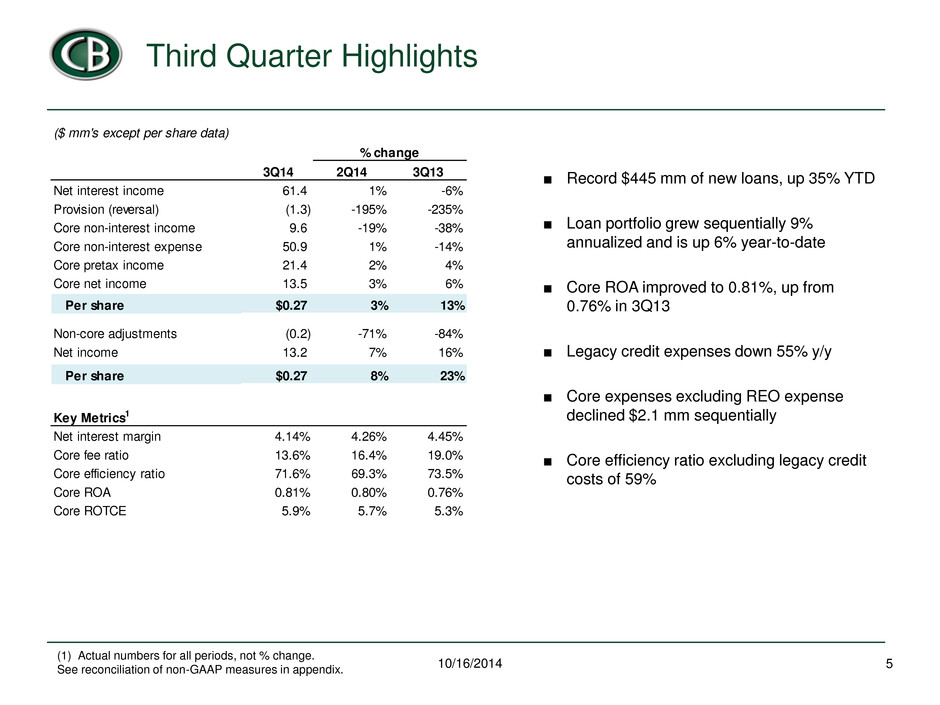
Third Quarter Highlights 5 10/16/2014 (1) Actual numbers for all periods, not % change. See reconciliation of non-GAAP measures in appendix. ($ mm's except per share data) 3Q14 2Q14 3Q13 Net interest income 61.4 1% -6% Provision (reversal) (1.3) -195% -235% Core non-interest income 9.6 -19% -38% Core non-interest expense 50.9 1% -14% Core pretax income 21.4 2% 4% Core net income 13.5 3% 6% Per share $0.27 3% 13% Non-core adjustments (0.2) -71% -84% Net income 13.2 7% 16% Per share $0.27 8% 23% Key Metrics1 Net interest margin 4.14% 4.26% 4.45% Core fee ratio 13.6% 16.4% 19.0% Core efficiency ratio 71.6% 69.3% 73.5% Core ROA 0.81% 0.80% 0.76% Core ROTCE 5.9% 5.7% 5.3% % change ■ Record $445 mm of new loans, up 35% YTD ■ Loan portfolio grew sequentially 9% annualized and is up 6% year-to-date ■ Core ROA improved to 0.81%, up from 0.76% in 3Q13 ■ Legacy credit expenses down 55% y/y ■ Core expenses excluding REO expense declined $2.1 mm sequentially ■ Core efficiency ratio excluding legacy credit costs of 59%
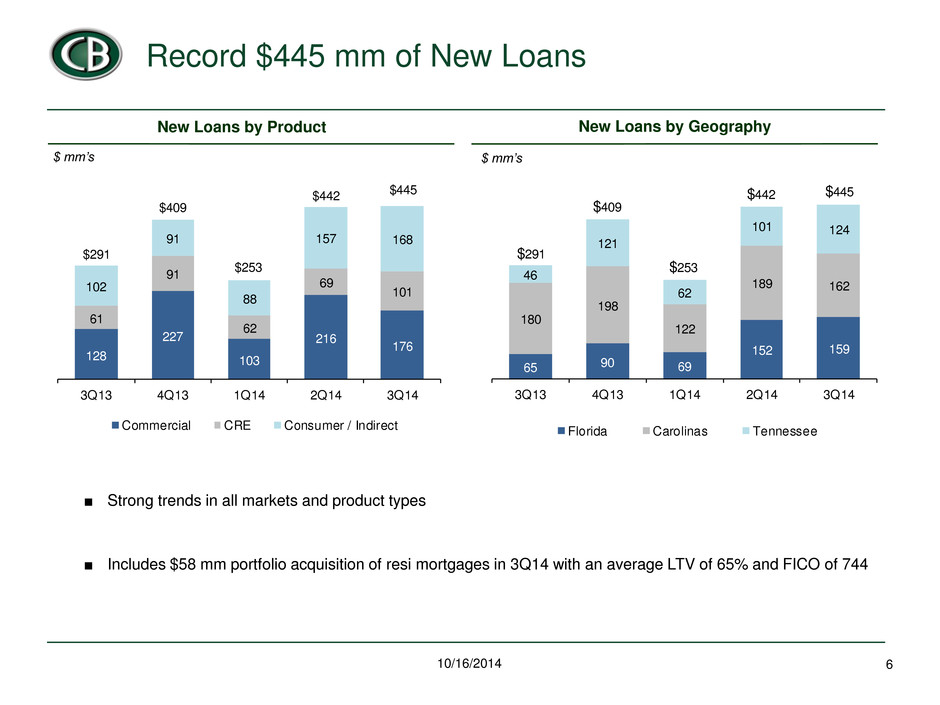
Record $445 mm of New Loans 6 10/16/2014 ■ Strong trends in all markets and product types ■ Includes $58 mm portfolio acquisition of resi mortgages in 3Q14 with an average LTV of 65% and FICO of 744 New Loans by Geography New Loans by Product $ mm’s $ mm’s 128 227 103 216 176 61 91 62 69 101102 91 88 157 168 3Q13 4Q13 1Q14 2Q14 3Q14 Commercial CRE Consumer / Indirect $442 $445 $291 $409 $253 65 90 69 152 159 180 198 122 189 162 46 121 62 101 124 3Q13 4Q13 1Q14 2Q14 3Q14 Florida Carolinas Tennessee $445 $253 $291 $409 $442
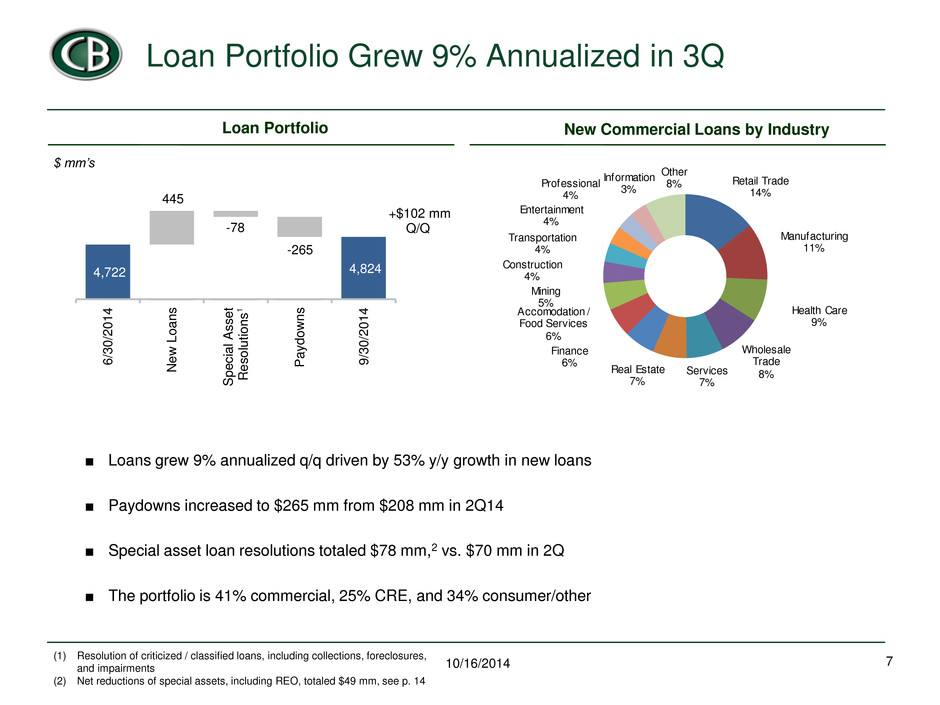
Loan Portfolio Grew 9% Annualized in 3Q 7 10/16/2014 ■ Loans grew 9% annualized q/q driven by 53% y/y growth in new loans ■ Paydowns increased to $265 mm from $208 mm in 2Q14 ■ Special asset loan resolutions totaled $78 mm,2 vs. $70 mm in 2Q ■ The portfolio is 41% commercial, 25% CRE, and 34% consumer/other Loan Portfolio (1) Resolution of criticized / classified loans, including collections, foreclosures, and impairments (2) Net reductions of special assets, including REO, totaled $49 mm, see p. 14 $ mm’s New Commercial Loans by Industry Retail Trade 14% Manufacturing 11% Health Care 9% Wholesale Trade 8%Services 7% Real Estate 7% Finance 6% Accomodation / Food Services 6% Mining 5% Co struction 4% Transportation 4% Entertainment 4% Professional 4% Information 3% Other 8% 4,722 4,824 6/ 30 /2 01 4 Ne w L oa ns Sp ec ial A ss et Re so lut ion s Pa yd ow ns 9/ 30 /2 01 4 445 -78 -265 1 +$102 mm Q/Q
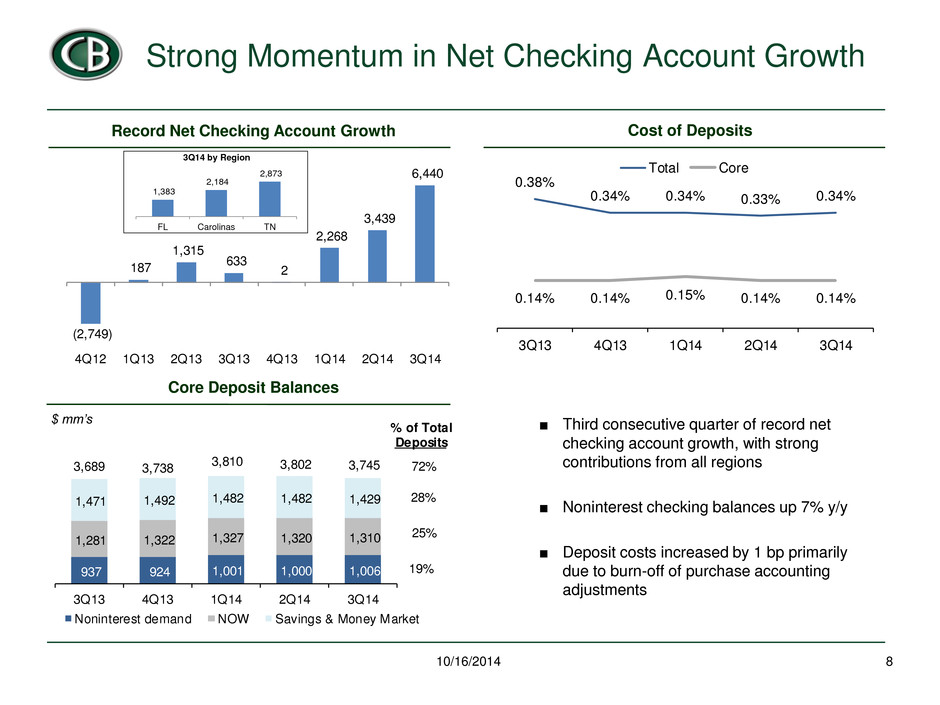
937 924 1,001 1,000 1,006 1,281 1,322 1,327 1,320 1,310 1,471 1,492 1,482 1,482 1,429 3Q13 4Q13 1Q14 2Q14 3Q14 Noninterest demand NOW Savings & Money Market 3,7453,689 3,738 3,810 3,802 % of Total Deposits 72% 28% 25% 19% (2,749) 187 1,315 633 2 2,268 3,439 6,440 4Q12 1Q13 2Q13 3Q13 4Q13 1Q14 2Q14 3Q14 Strong Momentum in Net Checking Account Growth 8 10/16/2014 Cost of Deposits Core Deposit Balances $ mm’s Record Net Checking Account Growth ■ Third consecutive quarter of record net checking account growth, with strong contributions from all regions ■ Noninterest checking balances up 7% y/y ■ Deposit costs increased by 1 bp primarily due to burn-off of purchase accounting adjustments 0.38% 0.34% 0.34% 0.33% 0.34% 0.14% 0.14% 0.15% 0.14% 0.14% 3Q13 4Q 3 1Q1 Q14 3Q14 Total Core 1,383 2,184 2,873 FL Carolinas TN 3Q14 by Region
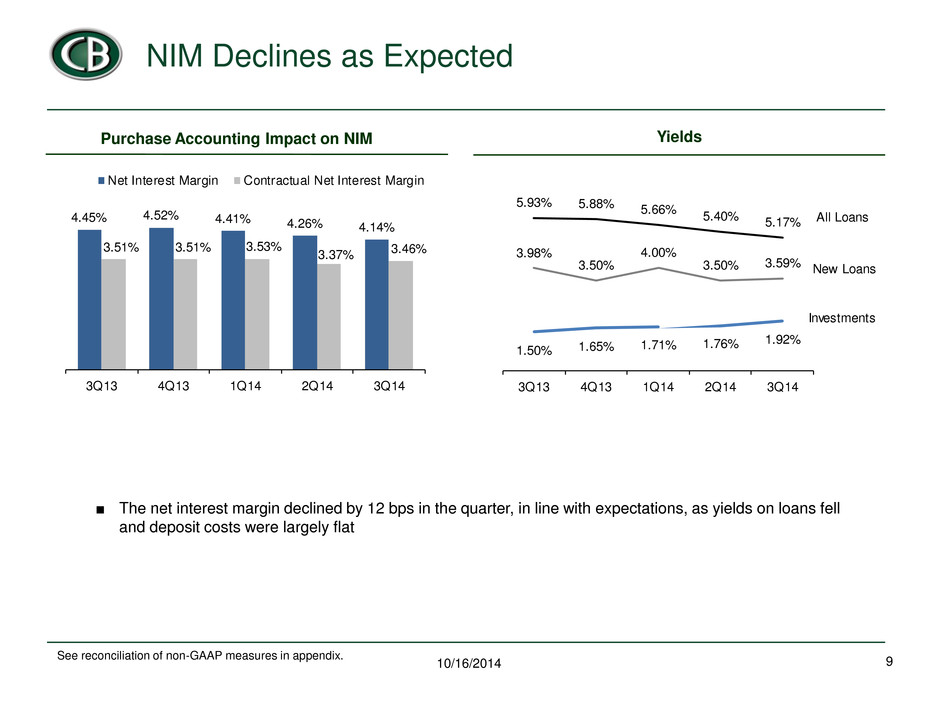
NIM Declines as Expected 9 10/16/2014 ■ The net interest margin declined by 12 bps in the quarter, in line with expectations, as yields on loans fell and deposit costs were largely flat Purchase Accounting Impact on NIM Yields See reconciliation of non-GAAP measures in appendix. 4.45% 4.52% 4.41% 4.26% 4.14% 3.51% 3.51% 3.53% 3.37% 3.46% 3Q13 4Q13 1Q14 2Q14 3Q14 Net Interest Margin Contractual Net Interest Margin 3.98% 3.50% 4.00% 3.50% 3.59% 5.93% 5.88% 5.66% 5.40% 5.17% 1.50% 1.65% 1.71% 1.76% 1.92% Q13 4Q13 1Q14 2Q14 3Q14 All Loans Investments New Loans
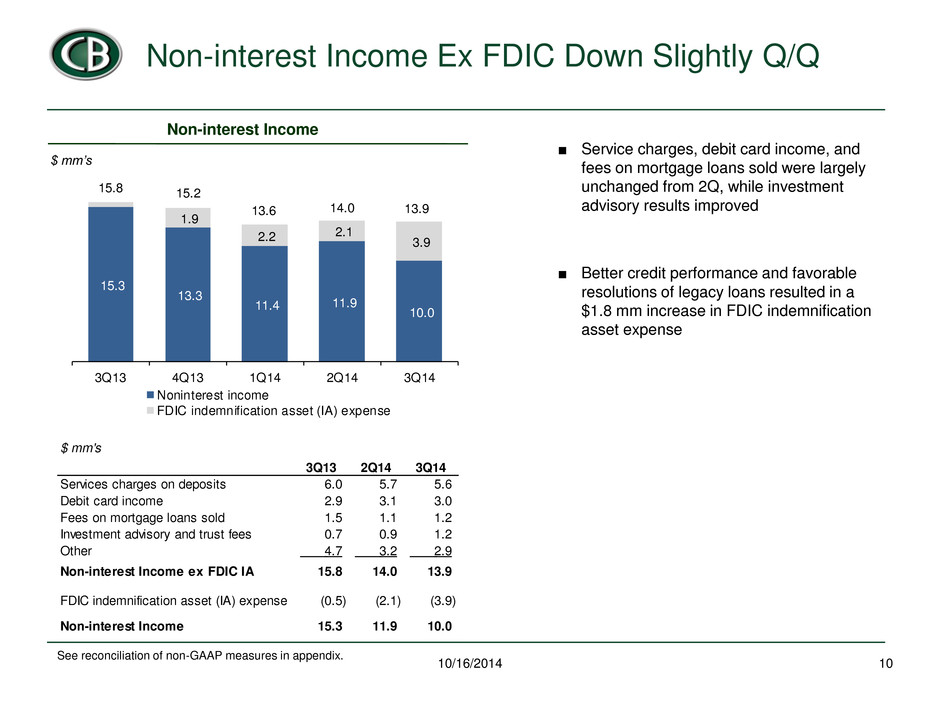
Non-interest Income Ex FDIC Down Slightly Q/Q 10 10/16/2014 ■ Service charges, debit card income, and fees on mortgage loans sold were largely unchanged from 2Q, while investment advisory results improved ■ Better credit performance and favorable resolutions of legacy loans resulted in a $1.8 mm increase in FDIC indemnification asset expense Non-interest Income $ mm’s See reconciliation of non-GAAP measures in appendix. $ mm's 3Q13 2Q14 3Q14 Services charges on d osits 6.0 5.7 5.6 Debit card income 2.9 3.1 3.0 Fees on mortgage loans sold 1.5 1.1 1.2 Investment advisory and trust fees 0.7 0.9 1.2 Other 4.7 3.2 2.9 Non-interest Income ex FDIC IA 15.8 14.0 13.9 FDIC indemnification asset (IA) expense (0.5) (2.1) (3.9) Non-interest Income 15.3 11.9 10.0 15.3 13.3 11.4 11.9 10.0 1.9 2.2 2.1 3.9 3Q13 4Q13 1Q14 2Q14 3Q14 Noninterest income FDIC in emnification asset (IA) expense 15.8 15.2 13.6 14.0 13.9
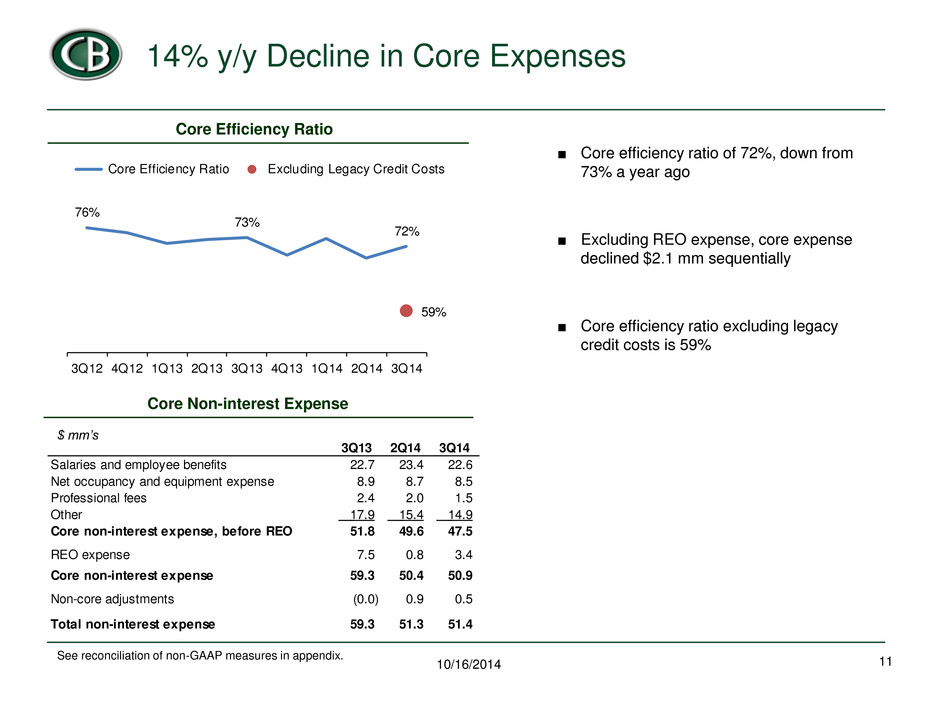
14% y/y Decline in Core Expenses 11 10/16/2014 ■ Core efficiency ratio of 72%, down from 73% a year ago ■ Excluding REO expense, core expense declined $2.1 mm sequentially ■ Core efficiency ratio excluding legacy credit costs is 59% Core Non-interest Expense $ mm’s See reconciliation of non-GAAP measures in appendix. 3Q13 2Q14 3Q14 Salaries and employee benefits 22.7 23.4 22.6 Net occupancy and equipment expense 8.9 8.7 8.5 Professional fees 2.4 2.0 1.5 Other 17.9 15.4 14.9 Core non-interest expense, before REO 51.8 49.6 47.5 REO expense 7.5 0.8 3.4 Core non-interest expense 59.3 50.4 50.9 Non-core adjustments (0.0) 0.9 0.5 Total non-interest expense 59.3 51.3 51.4 Core Efficiency Ratio 76% 73% 72% 59% 3Q12 4Q12 1Q13 2Q13 3Q13 4Q13 1Q14 2Q14 3Q14 Core Efficiency Ratio Excluding Legacy Credit Costs

Liquidity and Capital Ratios Remain Strong 12 10/16/2014 ■ Modified duration of investments was 4.0 years at September 30, 2014, down from 4.1 years at June 30 ■ Our capital ratios remain strong with tier 1 leverage of 14.4%1 on a consolidated basis Liquidity $ mm’s (1) Capital ratios are preliminary. Cash / Equivalents $159 13% Agency MBS $589 49% Agency CMO $131 11% Agency CMBS $254 21% Corporate/ SBA/Other $48 4% Muni $14 1%
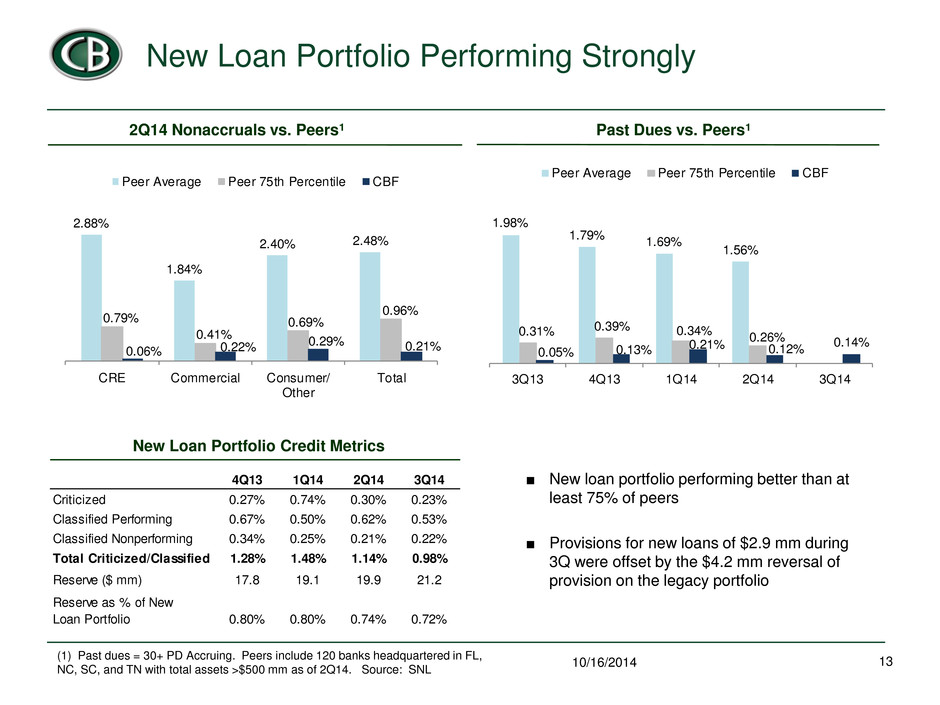
New Loan Portfolio Performing Strongly 13 10/16/2014 ■ New loan portfolio performing better than at least 75% of peers ■ Provisions for new loans of $2.9 mm during 3Q were offset by the $4.2 mm reversal of provision on the legacy portfolio Past Dues vs. Peers1 New Loan Portfolio Credit Metrics (1) Past dues = 30+ PD Accruing. Peers include 120 banks headquartered in FL, NC, SC, and TN with total assets >$500 mm as of 2Q14. Source: SNL 2Q14 Nonaccruals vs. Peers1 2.88% 1.84% 2.40% 2.48% 0.79% 0.41% 0.69% 0.96% 0.06% 0.22% 0.29% 0.21% CRE Commercial Consumer/ Other Total Peer Average Peer 75th Percentile CBF 4Q13 1Q14 2Q14 3Q14 Criticized 0.27% 0.74% 0.30% 0.23% Classified Performing 0.67% 0.50% 0.62% 0.53% Classified Nonperformi g 0.34% 0.25% 0.21% 0.22% Total Criticized/Classified 1.28% 1.48% 1.14% 0.98% Reserve ($ mm) 17.8 19.1 19.9 21.2 Reserve as % of New Loan Portfolio 0.80% 0.80% 0.74% 0.72% 1.98% 1.79% 1.69% 1.56% 0.31% 0.39% 0.34% 0.26% 0.05% 0.13% 0.21% 0.12% 0.14% 3Q13 4Q13 1Q14 2Q14 3Q14 Peer Average Peer 75th Percentile CBF

Special Assets Down 50% Since 2012 14 10/16/2014 ■ During 3Q, we reduced the Special Assets portfolio by $49 mm, bringing the reduction since 2012 to $490 mm or 50% ■ New inflows to non-performing status were $7.1 mm, a record low and down from $27.3 mm in 3Q13 ■ $6 mm decline in REO, or 25% annualized pace, driven by $16 mm in sales ■ Nonperforming loans declined to 3.6% of the portfolio and consist almost entirely of legacy acquired loans which have been marked and are accruing interest Special Assets Nonperforming Loans / Total Loans $ mm’s 7.7% 5.8% 5.2% 4.5% 3.6% 2012 2013 1Q14 2Q14 3Q14 154 129 120 96 90 380 266 237 212 172 258 181 153 152 147 194 130 123 85 86 - 200 400 600 800 1,000 2012 2013 1Q14 2Q14 3Q14 REO Classified Non-Performing Classified Performing Criticized 986 -50% 706 633 545 496
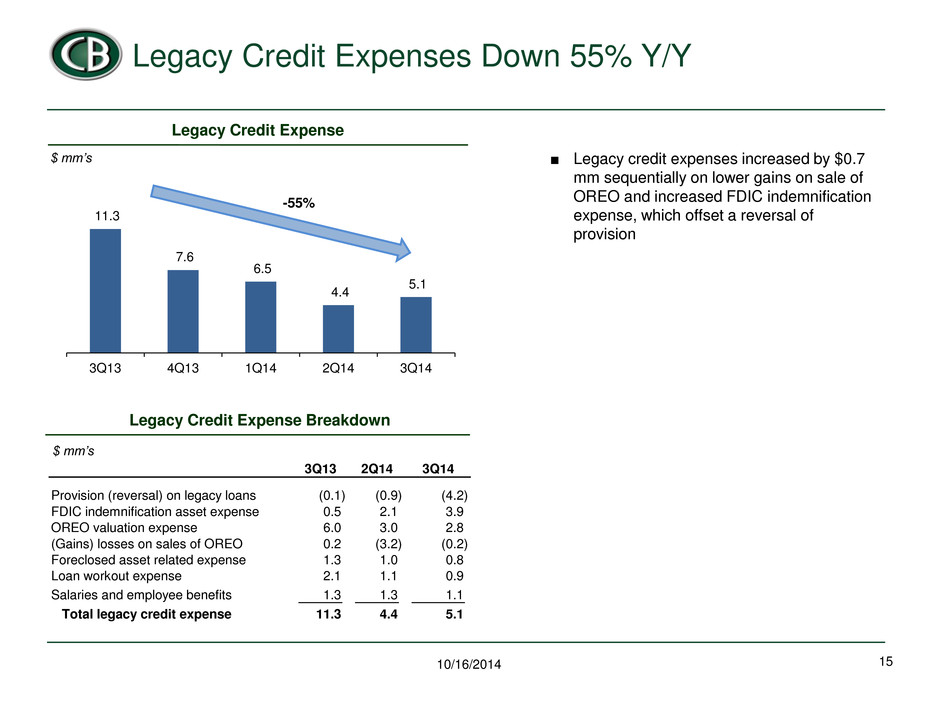
Legacy Credit Expenses Down 55% Y/Y 15 10/16/2014 ■ Legacy credit expenses increased by $0.7 mm sequentially on lower gains on sale of OREO and increased FDIC indemnification expense, which offset a reversal of provision Legacy Credit Expense $ mm’s Legacy Credit Expense Breakdown $ mm’s 11.3 7.6 6.5 4.4 5.1 3Q13 4Q13 1Q14 2Q14 3Q14 -55% 3Q13 2Q14 3Q14 Provision (reversal) on legacy loans (0.1) (0.9) (4.2) FDIC indemnification asset expense 0.5 2.1 3.9 OREO valuation expense 6.0 3.0 2.8 (Gains) losses on sales of OREO 0.2 (3.2) (0.2) Foreclosed asset related expense 1.3 1.0 0.8 Loan workout expense 2.1 1.1 0.9 Salaries and employee benefits 1.3 1.3 1.1 Total legacy credit expense 11.3 4.4 5.1
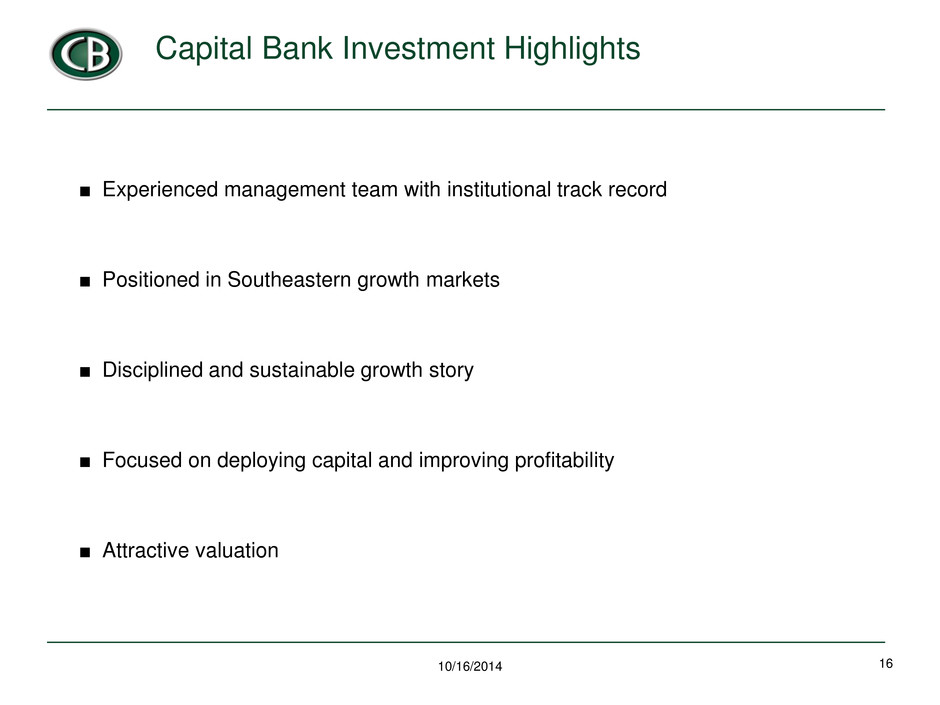
16 Capital Bank Investment Highlights ■ Experienced management team with institutional track record ; ■ Positioned in Southeastern growth markets ■ Disciplined and sustainable growth story ■ Focused on deploying capital and improving profitability ■ Attractive valuation 10/16/2014
Appendix 17 10/16/2014
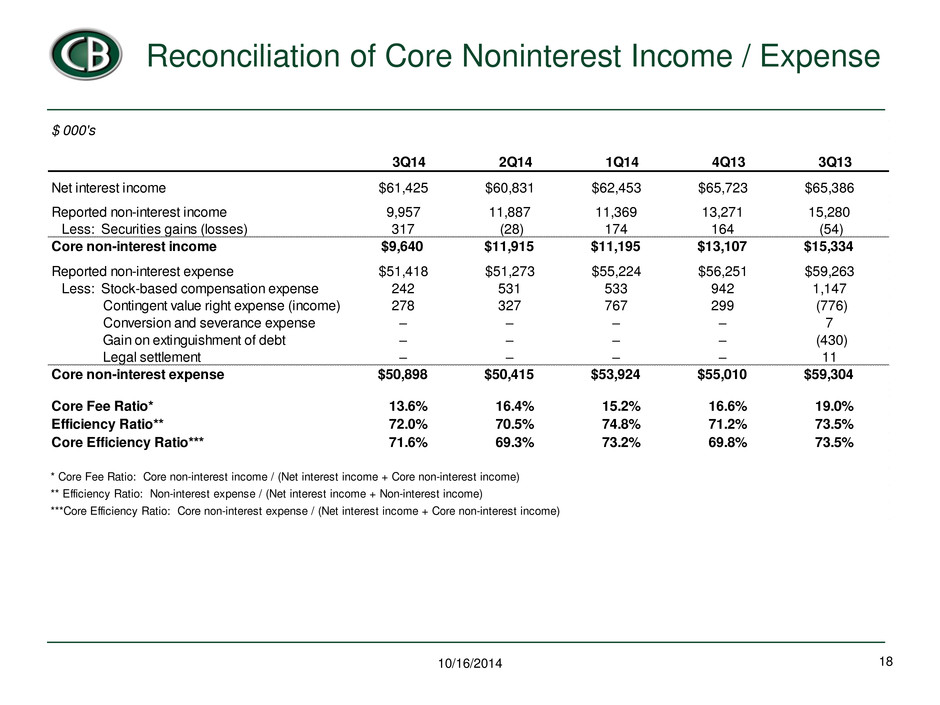
Reconciliation of Core Noninterest Income / Expense 18 10/16/2014 $ 000's 3Q14 2Q14 1Q14 4Q13 3Q13 Net interest income $61,425 $60,831 $62,453 $65,723 $65,386 Reported non-interest income 9,957 11,887 11,369 13,271 15,280 Less: Securities gains (losses) 317 (28) 174 164 (54) Core non-interest income $9,640 $11,915 $11,195 $13,107 $15,334 Reported non-interest expense $51,418 $51,273 $55,224 $56,251 $59,263 Less: Stock-based compensation expense 242 531 533 942 1,147 Contingent value right expense (income) 278 327 767 299 (776) Conversion and severance expense – – – – 7 Gain on extinguishment of debt – – – – (430) Legal settlement – – – – 11 Core non-interest expense $50,898 $50,415 $53,924 $55,010 $59,304 Core Fee Ratio* 13.6% 16.4% 15.2% 16.6% 19.0% Eff ciency Ratio** 72.0% 70.5% 74.8% 71.2% 73.5% Core Efficiency Ratio*** 71.6% 69.3% 73.2% 69.8% 73.5% * Core Fee Ratio: Core non-interest income / (Net interest income + Core non-interest income) ** Efficiency Ratio: Non-interest expense / (Net interest income + Non-interest income) ***Core Efficiency Ratio: Core non-interest expense / (Net interest income + Core non-interest income)
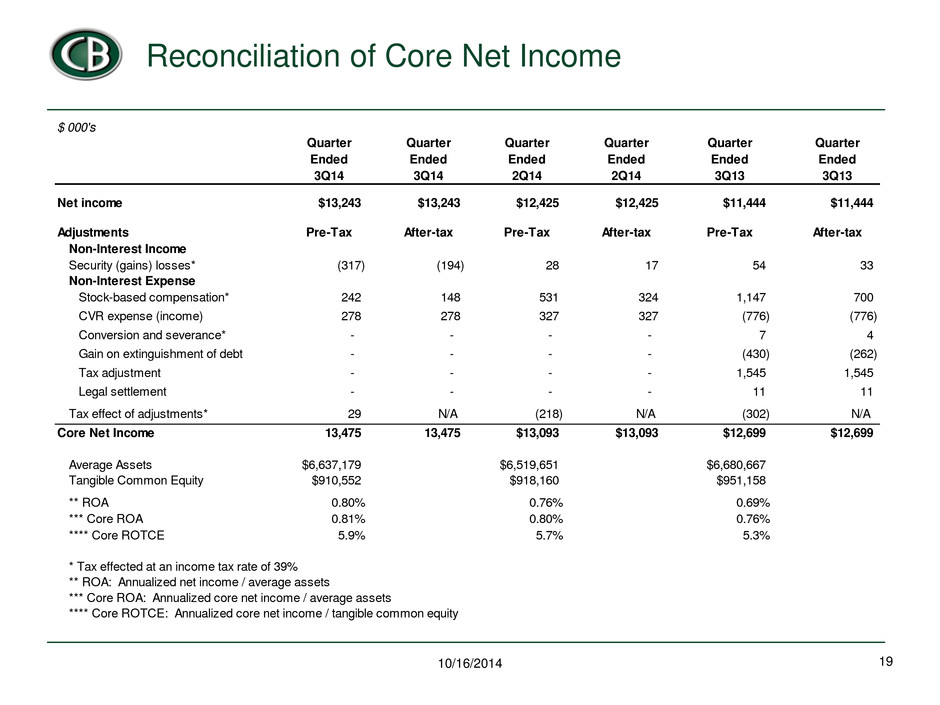
Reconciliation of Core Net Income 19 10/16/2014 $ 000's Quarter Quarter Quarter Quarter Quarter Quarter Ended Ended Ended Ended Ended Ended 3Q14 3Q14 2Q14 2Q14 3Q13 3Q13 $13,243 $13,243 $12,425 $12,425 $11,444 $11,444 Pre-Tax After-tax Pre-Tax After-tax Pre-Tax After-tax Non-Interest Income Security (gains) losses* (317) (194) 28 17 54 33 Non-Interest Expense 242 148 531 324 1,147 700 - - - - 278 278 327 327 (776) (776) - - - - - - - - 7 4 - - - - (430) (262) - - - - 1,545 1,545 - - - - 11 11 Tax effect of adjustments* 29 N/A (218) N/A (302) N/A 13,475 13,475 $13,093 $13,093 $12,699 $12,699 Average Assets $6,637,179 $6,519,651 $6,680,667 Tangible Common Equity $910,552 $918,160 $951,158 ** ROA 0.80% 0.76% 0.69% *** Core ROA 0.81% 0.80% 0.76% **** Core ROTCE 5.9% 5.7% 5.3% * Tax effected at an income tax rate of 39% ** ROA: Annualized net income / average assets *** Core ROA: Annualized core net income / average assets **** Core ROTCE: Annualized core net income / tangible common equity Net income Adjustments Conversion and severance* Gain on extinguishment of debt Tax adjustment Core Net Income Stock-based compensation* CVR expense (income) Legal settlement

Tangible Book Value 20 10/16/2014 (In thousands, except per share data) September 30, 2014 Total common shareholders' equity $1,064,939 Intangibles, net of taxes 146,671 Tangible book value* $918,268 Common shares outstanding 48,331 Tangible book value per share $19.00 * Tangible book value is equal to book value less goodwill and core deposit intangibles, net of related deferred tax liabilities.

Contractual Net Interest Margin 21 10/16/2014 (1) Excludes purchase accounting adjustments $ 000s Average Earning Assets Net Interest Income Net Interest Margin September 30, 2014 Reported 5,911,601 61,660 4.14% Purchase accounting impact (91,982) 10,292 0.68% Contractual Net Interest Margin (1) 3.46% June 30, 2014 Reported 5,756,466 61,077 4.26% Purchase accounting impact (101,062) 12,977 0.89% Contractual Net Interest Margin (1) 3.37% March 31, 2014 Reported 5,774,135 62,721 4.41% Purchase accounting impact (117,732) 12,762 0.88% Contractual Net Interest Margin (1) 3.53% December 31, 2013 Reported 5,790,444 65,997 4.52% Purchase accounting impact (134,367) 15,094 1.01% Contractual Net Interest Margin (1) 3.51% September 30, 2013 Reported 5,847,708 65,640 4.45% Purchase accounting impact (148,206) 14,269 0.94% Contractual Net Interest Margin (1) 3.51%


