UNITED STATES
SECURITIES AND EXCHANGE COMMISSION
WASHINGTON, D.C. 20549
FORM 10-K
(Mark One)
x Annual Report Pursuant to Section 13 or 15(d) of the Securities Exchange Act of 1934
For the fiscal year ended December 31, 2009
or
o Transition Report Pursuant to Section 13 or 15(d) of the Securities Exchange Act of 1934
For the transition period from to
Commission File Number 000-34599
TBS INTERNATIONAL PLC
(Exact name of registrant as specified in its charter)
| Ireland | 98-0646151 |
(State or other jurisdiction of incorporation or organization) | (IRS Employer Identification No.) |
Arthur Cox Building Earlsfort Terrace Dublin 2, Ireland |
| (Address of principal executive offices) |
| |
(Registrant's telephone number, including area code) 1 353(0) 1 618 0000 |
| Securities registered pursuant to section 12(b) of the Act: |
Title of each class | | Name of each exchange on which registered | |
| | | | |
| Class A ordinary shares, par value $0.01 | | The NASDAQ Global Select Market | |
Securities registered pursuant to section 12(g) of the Act: None
| Indicate by check mark if the registrant is a well-known seasoned issuer, as defined in Rule 405 of the Securities Act. | Yes o No x |
| | |
| Indicate by check mark if the registrant is not required to file reports pursuant to Section 13 or Section 15(d) of the Act. | |
| | |
| Indicate by check mark whether the registrant (1) has filed all reports required to be filed by Section 13 or 15(d) of the Securities Exchange Act of 1934 during the preceding 12 months (or for such shorter period that the registrant was required to file such reports), and (2) has been subject to such filing requirements for the past 90 days. | |
| | |
| Indicate by check mark whether the registrant has submitted electronically and posted on its corporate Web site, if any, every Interactive Data File required to be submitted and posted pursuant to Rule 405 of Regulation S-T (§ 232.405 of this chapter) during the preceding 12 months (or for such shorter period that the registrant was required to submit and post such files). | Yes o No o |
| | |
| Indicate by check mark if disclosure of delinquent filers pursuant to Item 405 of Regulation S-K (§ 229.405 of this chapter) is not contained herein, and will not be contained, to the best of registrant’s knowledge, in definitive proxy or information statements incorporated by reference in Part III of this Form 10-K or any amendment to this Form 10-K. | o |
| | |
Indicate by check mark whether the registrant is a large accelerated filer, an accelerated filer, a non-accelerated filer or a smaller reporting company . See the definitions of "large accelerated filer," "accelerated filer" and "smaller reporting company" in Rule 12b-2 of the Exchange Act check one): | |
Large Accelerated Filer ¨ Accelerated Filer x Non-accelerated Filer ¨ (Do not check if a small reporting company) Smaller Reporting Filer ¨ |
| | |
| Indicate by check mark whether the registrant is a shell company (as defined in Rule 12b-2 of the Act). | |
| | |
| The aggregate market value of voting and non-voting common equity held by non-affiliates was $133.3 million on June 30, 2009, based upon the last reported sales price of such stock on the NASDAQ Global Select Market on that date. |
As of February 26, 2010, the registrant had outstanding 17,503,102 Class A ordinary shares, par value $0.01 per share, and 12,390,461 Class B ordinary shares, par value $0.01 per share. |
| |
| |
| DOCUMENTS INCORPORATED BY REFERENCE |
| Portions of the proxy statement for the 2010 Annual Meeting of Stockholders, to be filed within 120 days of the end of the fiscal year ended December 31, 2009, are incorporated in Part III to the extent described herein. |
TBS International plc
| | | | | Page |
| | | | Part I | |
| Item 1 | | |
| | | A | | 4 |
| | | B | | 7 |
| | | C | | 8 |
| | | D | | 9 |
| | | E | | 10 |
| | | F | | 11 |
| | | G | | 11 |
| | | H | | 12 |
| | | I | | 13 |
| | | J | | 14 |
| | | K | | 15 |
| | | L | | 16 |
| | | M | | 17 |
| | | | | |
| Item 1A | | 17 |
| Item 1B | | 34 |
| Item 2 | | 34 |
| Item 3 | | 34 |
| Item 4 | Reserved | |
| | | | | |
| | | | Part II | |
| Item 5 | | 35 |
| Item 6 | | 38 |
| Item 7 | | 41 |
| Item 7A | | 72 |
| Item 8 | | 73 |
| Item 9 | | 73 |
| Item 9A | | 73 |
| Item 9B | | 73 |
| | | | | |
| | | | Part III | |
| Item 10 | | 74 |
| Item 11 | | 76 |
| Item 12 | | 76 |
| Item 13 | | 76 |
| Item 14 | | 76 |
| | | | | |
| | | | Part IV | |
| Item 15 | | 77 |
| | Signatures | |
As used in this Annual Report on Form 10-K, the terms "we," "our," and "us," "TBS" and "the Company" refer to TBS International plc, as successor to TBS International Limited, and its consolidated subsidiaries. We use the term "International," and "TBSI" when we wish to refer only to TBS International plc, the holding company that is the issuer of our ordinary shares and International Limited, the former holding company and issuer of our ordinary shares, and not to TBS International plc and its consolidated subsidiaries.
Forward-Looking Statements
Our filings with the Securities and Exchange Commission or the SEC, including this Annual Report on Form 10-K for the fiscal year ended December 31, 2009, our Annual Report to Shareholders, any quarterly report on Form 10-Q or any current report on Form 8-K (along with any exhibits or amendments to such reports), our press releases, or any other written or oral statements made by or on our behalf, may include or incorporate by reference forward-looking statements within the meaning of the Private Securities Litigation Reform Act of 1995. Forward-looking statements may include, among other things, the information concerning our possible or assumed future results of operations, our newbuilding plan, our drydocking program, business strategies, financing plans, competitive position, potential growth opportunities, customer demand and the effects of future regulation and competition.
Generally, one can identify these forward-looking statements because they use words like "anticipates," "believes," "estimates," "expects," "future," "intends," "plans," "targets," "projects," "seeks", "will," "should," "likely" and similar expressions. These statements appear throughout this Annual Report on Form 10-K including in the sections entitled "Item 1 - Business" and "Item 7 - Management's Discussion and Analysis of Financial Condition and Results of Operations." These statements are only our current expectations. They are based on our management's beliefs and assumptions and on information currently available to our management. The matters discussed in these forward-looking statements involve risks, uncertainties and assumptions. Although we do not make forward-looking statements unless we believe we have a reasonable basis for doing so, we cannot assure you of their accuracy. Actual results may differ materially from those expressed, implied or projected in or by these forward-looking statements due to a number of uncertainties, risks, and other factors. These uncertainties, risks and other factors, among other unforeseen risks, include, but are not limited to:
| ● | changes in demand for our services, which are increasingly difficult to predict due to current economic conditions and uncertainty; |
| ● | the effect of a decline in vessel valuations; |
| ● | our ability to maintain financial ratios and satisfy financial covenants required by our credit facilities; |
| ● | our ability to finance our operations and raise additional capital on commercially reasonable terms or at all; |
| ● | changes in rules and regulations applicable to the shipping industry, including legislation adopted by international organizations such as the International Maritime Organization and the European Union or by individual countries; |
| ● | actions taken by regulatory authorities; |
| ● | changes in trading patterns, which may significantly affect overall vessel tonnage requirements; |
| ● | changes in the typical seasonal variations in charter rates; |
| ● | volatility in costs, including changes in production of or demand for oil and petroleum products, crew wages, insurance, provisions, repairs and maintenance, generally or in particular regions; |
| ● | the risk that financial counterparties will default; |
| ● | a material decline or weakness in shipping rates, which may occur if the economic recovery is not sustainable; |
| ● | changes in general domestic and international political conditions; |
| ● | changes in the condition of our vessels or applicable maintenance or regulatory standards which may affect, among other things, our anticipated drydocking or maintenance and repair costs; |
| ● | increases in the cost of our drydocking program or delays in our anticipated drydocking schedule; |
| ● | China Communications Construction Company Ltd./Nantong Yahua Shipbuilding Group Co., Ltd.’s ability to complete and deliver the remaining vessels on the anticipated schedule and the ability of the parties to satisfy the conditions in the shipbuilding agreements; |
| ● | the possible effects of pending and future legislation in the United States that may limit or eliminate potential U.S. tax benefits resulting from our jurisdiction of incorporation; |
| ● | Irish corporate governance and regulatory requirements which could prove different or more challenging than currently expected; and |
| ● | other factors listed from time to time in our filings with the Securities and Exchange Commission, including, without limitation, our Annual Report on Form 10-K for the period ended December 31, 2009 and our subsequent reports on Form 10- Q and Form 8-K. |
You should not rely on any forward-looking statements. We undertake no obligation to update or revise publicly any forward-looking statements, whether as a result of new information, future events or otherwise, except to the extent required under applicable law.
PART I
We are an ocean transportation services company, originating in 1993, that offers worldwide shipping solutions to a diverse client base of industrial shippers. We offer liner, parcel and bulk services supported by a fleet of multipurpose tweendeckers and handysize and handymax bulk carriers. The flexibility of our fleet allows us to carry a wide range of cargo, including industrial goods, project cargo, steel products, metal concentrates, fertilizer, salt, sugar, grain, aggregates and general cargo, that cannot be carried efficiently by container or large dry bulk carriers. In December 2009, shareholders voted in favor of a reorganization proposal pursuant to which TBS International Ltd. common shares would be cancelled and holders of such shares would receive ordinary shares of TBS International plc, an Irish company, on a one-to-one basis. The reorganization transaction was completed on January 6, 2010, at which time TBS International plc replaced TBS International Ltd. as the ultimate parent company for our operations. Shares of TBS International plc began trading on the NASDAQ Global Select Market on January 7, 2010 under the symbol "TBSI," the same symbol under which TBS International Ltd. shares were previously traded.
Over the past 17 years, we have developed our business model around key trade routes between Latin America and Japan, South Korea and China, as well as ports in North America, Africa, the Caribbean, and the Middle East. We differentiate ourselves from our competitors by offering a fully integrated shipping solution to our customers, which we refer to as our Five Star Service. As part of our Five Star Service, we offer total project coordination, door-to-door supply chain management including port services, terminal operations, trucking, barging, warehousing, distribution, inland pick-up and delivery, and documentation. We also provide frequent, regularly scheduled voyages within our shipping network and offer additional services such as strategic planning, cargo scheduling, loading and discharge.
As of December 31, 2009, our controlled fleet totaled 48 vessels, including 46 ships that we own and two that we charter-in with an option to purchase. On March 29, 2007, we entered into a contract for six "Roymar Class" 34,000 deadweight ton, or dwt, multipurpose vessels with retractable tweendecks, designed to our specifications. We took delivery of the first vessel the Rockaway Belle on September 23, 2009 in China from Nantong Yahua Shipbuilding Group Co., Ltd. Three of the vessels are scheduled for delivery in 2010 and the remaining two in 2011. The three newbuildings, which are expected to be delivered in the first, second and fourth quarter of 2010, have been named Dakota Princess, Montauk Maiden and Omaha Belle, respectively.
Financial data including revenues from external customers, at and for the years ended December 31, 2009, 2008 and 2007: (in millions except for Number of Voyages)
| Year ended December 31, | | Total Assets | | Total Revenue | | Net Income/ (Loss) | | Total revenue tons (RT) carried | | Number of Voyages | |
| | | | | | | | | | | | |
| 2009 | | $ | 953.6 | | $ | 302.5 | | $ | (70.0 | ) | 8.8 RT | | 424 | |
| | | | | | | | | | | | | | | |
| 2008 | | $ | 1,041.7 | | $ | 611.6 | | $ | 191.8 | | 9.3 RT | | 380 | |
| | | | | | | | | | | | | | | |
| 2007 | | $ | 559.1 | | $ | 352.9 | | $ | 98.2 | | 6.6 RT | | 276 | |
We target niche markets, which include trade routes, ports and cargoes not efficiently served by container and large dry bulk vessel operators. In order to effectively serve these markets, we offer regularly scheduled voyages using our fleet of multipurpose tweendeckers and handysize and handymax dry bulk carriers. Tweendeck vessels are differentiated by their retractable decks that can create separate holds, facilitating the transportation of non-containerized cargoes. Our vessels are able to navigate and service many ports with restrictions on vessel size and transport many types of cargo that cannot be carried efficiently by container or large dry bulk carriers.
As part of our comprehensive transportation service offering, we provide portside and inland logistics, related support services and solutions for challenging cargoes. To provide these services, we employ a professional staff of approximately 170 employees at December 31, 2009, with extensive experience and diverse backgrounds. In addition, our affiliate, TBS Commercial Group Ltd. has fully-staffed agencies and representative offices on five continents, with local teams of commercial agents and port captains who meet regularly with customers to tailor solutions to their logistics needs. We believe this full-service approach to shipping provides a superior level of service that has resulted in the development of long-term relationships with our customers.
Our customers rely on our regular service as an integral part of their supply chain, and many of these relationships have been established for over 16 years. We serve approximately 300 customers in more than 20 countries. We have developed long-term relationships with established and well-respected industrial shippers in diverse markets including mining, steel manufacturing, trading, heavy industry, industrial equipment and construction. We believe our business model allows us to respond rapidly to our customers’ changing demands and short delivery windows, increasing the value of our services to them as we enable them to schedule production and distribution.
Shipping freight rates declined during the first three quarters of 2009; however, beginning in the fourth quarter of 2009 rates began to increase slightly. This increase has continued into the first quarter of 2010.
Our Competitive Strengths
Trade Routes and Ports of Call
We provide ocean transportation services over eight routes, focusing primarily on Asia and Latin America, with additional operations in North America, the Middle East and Africa. We began operations in 1993, sailing between East Asia and the West Coast of South America. In 1995, we expanded our routes by adding sailings between the East and West Coasts of South America. In 2002, we began offering cargo service between North America and the East and West Coasts of South America and expanded our routes by offering service from Brazil to West Africa and within the Middle East. We continued to expand our service in the Middle East and North Africa during 2005 and 2006.
During 2009 we operated our vessels in five liner, parcel and bulk services. We have taken a conservative approach to building our service network. The initial sailings on each route are typically based on the requirements of a major customer. After regular sailings are established, we notify other potential customers of the service so their cargoes may be transported as well. As demand increases, we evaluate committing additional resources to serve the route, either by purchasing or chartering-in additional vessels. We plan the loading and stowage of cargo on each sailing to maximize our ability to add cargo as vessels call in selected ports to discharge cargo, increasing our utilization rate and maximizing revenue per sailing. A summary of our services and routes operated during 2009 is as follows:
| | | | |
| TBS Pacific Service | | Eastbound: | | |
| | | Japan, South Korea and | | Steel products, project cargo |
| | | China to the West, North and East Coasts of South America | | and general cargo |
| | | Westbound: | | |
| | | Peru, Ecuador and Chile to East Asia | | Minerals, metals, metal concentrates and fishmeal |
| TBS Latin America Service | | Northbound: | | |
| | | Brazil to the Caribbean basin | | Steel products, project cargo |
| | | and the West Coast of South America | | and general cargo |
| | | Southbound: | | |
| | | Colombia to Brazil and Argentina | | Coal and petroleum coke |
| TBS North America Service | | Southbound: | | |
| | | North America to the Caribbean | | Fertilizer, agricultural products |
| | | basin, South America and West Africa | | and steel products |
| | | Northbound: | | |
| | | Caribbean to North America | | Limestone and aggregates |
| TBS Middle East Carriers | | Middle East region, including ports in the United Arab Emirates, to Qatar and Kuwait | | Bulk aggregates |
| TBS Ocean Carriers | | Brazil to the West Coast of Africa | | Bulk sugar and salt |
Our liner, parcel and bulk services primarily carry steel products, salt, sugar, grain, fertilizers, chemicals, metal concentrates and aggregates plus general and project cargoes.
| · | Steel products include specialty and carbon steel coils, steel pipe and structural steel used in infrastructure development, construction, oil and gas transmission and automotive and appliance manufacturing industries. |
| · | Fertilizers include ammonium sulfate shipped in bulk for use in commercial agriculture. |
| · | Metal concentrates include copper, zinc, silver and other metals generally shipped in small break-bulk lots from 1,000 to 10,000 metric ton parcels that are processed at their destinations by smelters into purer forms. |
| · | General and project cargoes includes industrial machinery, spare parts, oil well supplies, trailers, industrial tanks and other commercial goods used in industrial applications. |
In addition to our liner, parcel and bulk services on the trade routes described above, we time charter-out vessels on an individual customer basis through TBS Ocean Carriers. However, any of our services may time charter-out a vessel to meet our customers' needs. Generally, we time charter-out vessels on a long-term basis to customers seeking vessel tonnage and on a short-term basis to reposition a vessel.
A time charter is a contractual arrangement under which a shipowner is paid for the use of a vessel at a daily rate for a fixed period of time. The shipowner is responsible for providing the crew and paying vessel operating expenses while the charterer is responsible for paying the voyage expenses. At December 31, 2009, 16 vessels of our controlled and owned fleet were time chartered-out with an average remaining duration of 30 days.
The following table shows the annual number of time charters-out, related duration and gross charter revenue since 2005.
| Year | | Number of Charters | | Duration (Days) | | Gross Revenue (in thousands) | |
| 2009 | | 132 | | 4,733 | | $ | 51,201 | |
| 2008 | | 74 | | 3,004 | | | 83,883 | |
| 2007 | | 67 | | 3,659 | | | 88,365 | |
| 2006 | | 57 | | 4,301 | | | 63,114 | |
| 2005 | | 55 | | 4,257 | | | 71,456 | |
Our business strategy consists of providing reliable transportation services to leading industrial shippers over key ocean trade routes. The key elements of our business strategy are:
Focus on Increasing Cargo Volumes on Our Key Routes.We intend to increase cargo volumes on our key Pacific and Latin American trade routes, as well as our third sailing from China and Korea which carries steel parcels to Mexico, Central and South America. By adding additional vessels and sailings to the markets we already serve, we believe we will be able to provide more regular service to our clients, which we expect will allow us to capture a larger share of their shipping needs, and win new clients.
Develop New Trade Routes. We intend to continue developing new trade routes, such as adding sailings from Asia to Africa to our TBS Pacific Service. Our agents and port captains work closely with our clients, as well as potential clients, to identify additional services that we can provide. We target routes that share the characteristics of our established routes and appear suited to our fleet and our full service approach. When developing new trade routes, we initially utilize chartered-in vessels and commit resources to acquire vessels for operation on those routes once we have determined that the economics of the route are favorable and sustainable.
Develop Our Logistics Support. We intend to further develop our logistics support through our Five Star Service. The goal of our Five Star Service is to provide a complete transportation solution to our global customers by providing a fully-integrated cargo and transport management system. We offer total project coordination, door-to-door supply chain management including port services, terminal operations, trucking, barging, warehousing, distribution, inland pick-up and delivery, and documentation. The Five Star Service differentiates us from traditional dry bulk ship owners by adding strategic planning and logistics support to our customers. Additionally, we intend to expand our port warehouse network to support our logistics services.
Expand Our Fleet of Focused Vessel Types. We are expanding our fleet of multipurpose retractable tweendeckers through our newbuilding program. In 2007, we contracted a Chinese shipyard to build six newly designed vessels named the "Roymar Class". These 34,000 dwt vessels are a larger vessel class and their addition to our fleet will be a significant milestone in the implementation of our business plan to modernize and expand our fleet. While we remain committed to expanding our fleet, pending a significant change in global economic conditions, we are temporarily suspending any further acquisitions of secondhand vessels. Our current business strategy includes growing through newbuildings of multipurpose tweendeckers and chartering-in vessels as needed.
In September 2009, we took delivery of the first of six newbuildings, the Rockaway Belle. Three newbuildings are scheduled for delivery in 2010, and the last two newbuild vessels are scheduled for delivery in 2011. At December 31, 2009, the milestones met and the expected delivery dates for the remaining vessels are noted below:
| | | Caton | | Dorchester | | Longwoods | | McHenry | | Sunswyck |
| Maritime Corp. | Maritime Corp. | Maritime Corp. | Maritime Corp. | Maritime Corp. |
| Milestone | | Hull No NYHS200721 | | Hull No NYHS200722 | | Hull No NYHS200723 | | Hull No NYHS200724 | | Hull No NYHS200725 |
| Dakota Princess | Montauk Maiden | To be Named | Omaha Belle | To be Named |
| Contract Signing | | Met | | Met | | Met | | Met | | Met |
| Steel Cutting | | Met | | Met | | Met | | Met | | Met |
| Keel Laying | | Met | | Met | | Met | | Met | | 2nd Qtr 2010 |
| Launching | | Met | | Met | | 3rd Qtr 2010 | | 2nd Qtr 2010 | | 4th Qtr 2010 |
| Anticipated Delivery | | 1st Qtr 2010 | | 3rd Qtr 2010 | | 1st Qtr 2011 | | 4th Qtr 2010 | | 3rd Qtr 2011 |
Our current controlled fleet consists of a total of 48 vessels, aggregating approximately 1.4 million dwt. The fleet consists of 25 multipurpose tweendeckers (8,000–34,000 dwt) and 23 dry bulk carriers, including 18 Handymax (35,000–46,000 dwt) and five Handysize (22,000–29,000 dwt) vessels. All vessels are dual flagged in either Panama or Liberia and the Philippines. In addition to the newbuild vessel that we placed into operation in the third quarter of 2009, we have committed to acquire five additional newbuild 34,000 dwt multipurpose tweendeckers for a total purchase price of $214.3 million. We expect three vessels to be delivered in 2010 and the last two vessels in 2011.
The following table provides information regarding the 48 vessels in our controlled fleet at December 31, 2009, which excludes vessels chartered-in under short-term charter.
| | | | | Year | | Deadweight |
| Vessel Name | | Vessel Type | | Built | | Weight Tons |
| Zia Belle | | Multipurpose Tweendecker | | 1997 | | 8,492 |
| Tamoyo Maiden | | Multipurpose Tweendecker | | 1986 | | 17,235 |
| Ainu Princess | | Multipurpose Tweendecker | | 1987 | | 17,324 |
| Siboney Belle | | Multipurpose Tweendecker | | 1987 | | 17,324 |
| Kiowa Princess | | Multipurpose Tweendecker | | 1986 | | 19,762 |
| Seneca Maiden | | Multipurpose Tweendecker | | 1986 | | 19,764 |
| Aztec Maiden | | Multipurpose Tweendecker | | 1984 | | 19,777 |
| Hopi Princess | | Multipurpose Tweendecker | | 1984 | | 20,401 |
| Navajo Princess | | Multipurpose Tweendecker (1) | | 1987 | | 21,902 |
| Inca Maiden | | Multipurpose Tweendecker (1) | | 1986 | | 22,133 |
| Shawnee Princess | | Multipurpose Tweendecker | | 1984 | | 22,323 |
| Caribe Maiden | | Multipurpose Tweendecker | | 1987 | | 22,800 |
| Ottawa Princess | | Multipurpose Tweendecker | | 1987 | | 22,800 |
| Taino Maiden | | Multipurpose Tweendecker | | 1985 | | 23,278 |
| Tuckahoe Maiden | | Multipurpose Tweendecker | | 1985 | | 23,278 |
| Cherokee Princess | | Multipurpose Tweendecker | | 1990 | | 23,286 |
| Kickapoo Belle | | Multipurpose Tweendecker | | 1987 | | 23,319 |
| Apache Maiden | | Multipurpose Tweendecker | | 1987 | | 23,325 |
| Mohegan Princess | | Multipurpose Tweendecker | | 1983 | | 26,276 |
| Tayrona Princess | | Multipurpose Tweendecker | | 1983 | | 26,320 |
| Laguna Belle (2) | | Multipurpose Tweendecker | | 1996 | | 28,503 |
| Seminole Princess (2) | | Multipurpose Tweendecker | | 1997 | | 28,503 |
| Nanticoke Belle | | Multipurpose Tweendecker | | 1989 | | 28,835 |
| Wichita Belle | | Multipurpose Tweendecker | | 1991 | | 28,843 |
| Rockaway Belle (3) | | Multipurpose Tweendecker | | 2009 | | 34,005 |
| Savannah Belle | | Handysize Bulk Carrier | | 1982 | | 22,558 |
| Arapaho Belle | | Handysize Bulk Carrier | | 1998 | | 24,021 |
| Oneida Princess | | Handysize Bulk Carrier | | 1998 | | 24,247 |
| Mohave Maiden | | Handysize Bulk Carrier | | 1984 | | 28,074 |
| Zuni Princess | | Handysize Bulk Carrier | | 1984 | | 28,166 |
| La Jolla Belle (3) | | Handymax Bulk Carrier | | 1982 | | 35,025 |
| Shinnecock Belle | | Handymax Bulk Carrier | | 1985 | | 37,451 |
| Maori Maiden | | Handymax Bulk Carrier | | 1984 | | 37,734 |
| Tupi Maiden | | Handymax Bulk Carrier | | 1992 | | 38,852 |
| Nyack Princess | | Handymax Bulk Carrier | | 1984 | | 38,885 |
| Biloxi Belle | | Handymax Bulk Carrier | | 1984 | | 39,225 |
| Miami Maiden | | Handymax Bulk Carrier | | 1984 | | 39,333 |
| Iroquois Maiden | | Handymax Bulk Carrier | | 1983 | | 40,876 |
| Fox Maiden | | Handymax Bulk Carrier | | 1985 | | 40,902 |
| Alabama Belle | | Handymax Bulk Carrier | | 1986 | | 41,808 |
| Houma Belle | | Handymax Bulk Carrier | | 1985 | | 42,219 |
| Sioux Maiden | | Handymax Bulk Carrier | | 1989 | | 42,248 |
| Mohawk Princess | | Handymax Bulk Carrier | | 1982 | | 42,360 |
| Yakima Princess | | Handymax Bulk Carrier | | 1990 | | 42,475 |
| Canarsie Princess | | Handymax Bulk Carrier | | 1985 | | 42,842 |
| Chesapeake Belle | | Handymax Bulk Carrier | | 1984 | | 44,146 |
| Tuscarora Belle | | Handymax Bulk Carrier | | 1984 | | 44,189 |
| Manhattan Princess | | Handymax Bulk Carrier | | 1982 | | 45,526 |
| | | Total DWT | | | | 1,432,970 |
| (1) | These vessels are multipurpose tweendeckers with the ability to carry wheeled cargo such as automobiles, tractors or trailers. The vessels allow cargo to be "rolled on" and "rolled off" in addition to allowing cargo to be "lifted-on" and "lifted-off". |
| (2) | These vessels are leased and operated by us under a sale-leaseback arrangement that expires in 2014. The agreements allow for the purchase of the respective vessel at the end of 2012 and each year thereafter until the end of the charter period. |
| (3) | On September 23, 2009 we took delivery of the newly-constructed vessel Rockaway Belle from Nantong Yahua Shipbuilding Group Co., Ltd. La Jolla Belle was previously named Rockaway Belle and was part of our existing fleet. |
Multipurpose Tweendeckers
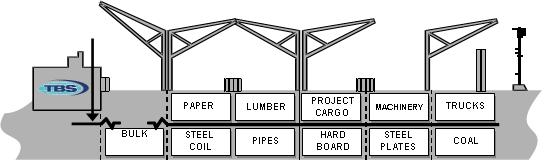
Our multipurpose tweendecker vessels have retractable tweendecks that can convert a multipurpose tweendecker to a bulk carrier, and back again. Unlike container ships, which can carry only cargo that can be or has been pre-packaged into standard 20-foot or 40-foot containers, or bulk carriers that limit the ability to mix different cargoes in any one hold, multipurpose tweendeckers can be divided into multiple cargo compartments by a mezzanine deck, or tweendeck. The tweendeck permits the carriage of cargoes of differing sizes and shapes in the same or separate holds and permits greater flexibility in the stowage and carriage of cargo. Many of our vessels sailing eastbound from Asia will call at multiple Latin American ports to discharge cargo and load additional cargo for shipment to other ports. Cargoes are stowed in a manner that facilitates efficient loading and discharging.
The following diagram shows a typical multipurpose tweendeck ship fitted for different types of cargo.
Bulk Carriers
Our bulk carriers range in size from 22,558 dwt to 45,526 dwt. Several of the vessels have equipment that enables self-loading and discharging in an effort to enhance our ability to serve a broad range of ports.
The hull and machinery of every commercial vessel must be "classed" by a classification society authorized by its country of registry. Our vessels currently are enrolled with Lloyds Register of Shipping, or LR, Nippon Kaiji Kyokai, or NKK, American Bureau of Shipping, or ABS, Det Norske Veritas, or DNV, and Bureau Veritas, or BV. The classification society certifies that a vessel is safe and seaworthy in accordance with the applicable rules and regulations of the country of registry of the vessel and international conventions promulgated by the International Maritime Organization, or IMO. These include the Convention on Maritime Pollution Prevention, the International Safety Management Code, or ISM Code, and International Convention for the Safety of Life at Sea, or SOLAS. All of our vessels have been certified as being "in class" by their respective classification societies.
A vessel must undergo annual surveys, intermediate surveys and special surveys. In lieu of a special survey, a vessel's machinery may be on a continuous survey cycle, under which the machinery would be surveyed periodically over a five-year period. All of our controlled vessels are on special survey cycles for hull inspection and continuous survey cycles for machinery inspection. Every vessel is required to be drydocked twice in every five-year period, with no interval greater than three years. Vessels less than 15 years of age may be underwater inspected instead of drydocked, at the intermediate period. Our fleet of 48 vessels will require approximately 96 drydockings over a five-year period. We anticipate drydocking approximately 19 vessels per year. We had 23 vessels in drydock during 2009, including one vessel that entered into drydock during December 2008. During 2010, we anticipate having 18 vessels in drydock, including two vessels that entered into drydock in late 2009.
| | | For the Year Ended December 31, | |
| | | 2009 | | 2008 | | 2007 | |
| Vessels Entering Drydock | | 22 | | 16 | | 21 | |
In 2009, our drydocking program focused on capital expenditures that were necessary or otherwise recommended by classification surveyors. In the two years prior to 2009, we used vessel drydocking to perform steel renewal and reinforcements that might have been required in the next five to ten years to reduce the cost of subsequent vessel drydockings.
Our drydocking expenditures and surveys are being accounted for using the deferral method. Under the deferral method of accounting for drydocking, the costs incurred are deferred and amortized on a straight-line basis over the period through the date of the next drydocking, which is typically 30 months. We only include in deferred drydocking costs those costs that are incurred to meet regulatory requirements, or are expenditures that add economic life to the vessel, increase the vessel’s earnings capacity or improve the vessel’s efficiency. Normal repairs and maintenance, whether incurred as part of the drydocking or not, are expensed as incurred.
Substantially all of the operations, ship maintenance, supervision of crewing, technical support, purchasing, insurance, financial management services and network of commercial agents necessary to support our fleet and operate our business are supervised by four service companies.
Two of these service companies, TBS Shipping Services Inc. and Roymar Ship Management Inc., are our wholly-owned subsidiaries that manage the accounts of our other subsidiaries and, on their behalf, make payments and advances for costs associated with the operation of our business. The other service companies, TBS Commercial Group Ltd. and Beacon Holdings Ltd., are controlled by certain of our key executive officers. Together these four companies employ approximately 340 experienced professionals who meet regularly with shippers and consignees to market our services in more than 20 countries and address the needs and concerns of our customers.
Operations management
TBS Shipping Services coordinates services to customers, integrates the activities of our commercial agency network, oversees charter activities, administers voyages and provides accounting services, including the preparation of our account ledgers and financial statements.
Ship management
Roymar manages our controlled fleet providing an experienced technical management staff and a full range of vessel maintenance capabilities to ensure that we maintain a high-level of ship performance. The services provided by Roymar include:
| ● | supervising the recruiting of crew; |
| ● | obtaining spares, stores and provisions necessary on board the vessels; |
| ● | implementing our maintenance program; |
| ● | arranging for and supervising all drydocking procedures; |
| ● | arranging for surveys and inspections according to requirements of classification society, flag state and port state rules and regulations; |
| ● | maintaining high safety and environmental protection standards in compliance with the ISM Code and SOLAS; |
| ● | arranging for insurance of the vessels; and |
| ● | identifying vessels to acquire and negotiating purchase options on vessels that we charter. |
We are fully responsible for the maintenance of our controlled fleet. We make every effort to prevent delays at sea or in port caused by malfunctions or breakdowns. Roymar deploys superintendents, including master mariners and engineers, to supervise the maintenance of our controlled fleet. We minimize operation costs through continuous onboard supervision of our vessels and use of the vessels' crews for ship maintenance. We believe that our preventive maintenance practice has extended the lives of the vessels in our controlled fleet, minimized drydocking expenses and nearly eliminated downtimes and off-hire periods resulting from speed deficiencies, stoppages at sea and vessel breakdowns.
Commercial agents
We have established a network of long-term commercial and operational relationships with affiliated commercial agency service companies. The majority of these service companies are wholly or partly-owned by TBS Commercial Group. These service companies employ locally-based sales and customer service professionals who personally meet with shippers and consignees on a regular basis. These professionals provide a competitive advantage by addressing our customers' concerns and anticipating their future needs through their personal contact with our customers. We believe that personal attention to customers has played a critical role in our growth and success. Our method of operation focuses on sales and service for long-term sustained expansion. The agreements with TBS Commercial Group are subject to the approval of the Compensation Committee of our Board of Directors. We paid TBS Commercial Group approximately $7.8 million, $16.8 million and $8.0 million in 2009, 2008, and 2007, respectively. See "Note 14 — Related Party Transactions" to our consolidated financial statements.
As of December 31, 2009, we had approximately 170 office employees located in Yonkers and Scarsdale, New York. At December 31, 2009, we had contracts with three unaffiliated manning agents, to provide approximately 1,150 crew for our vessels. We are not a party to the contracts with the seagoing personnel, all of whom are required to have appropriate maritime licenses. Historically our labor relations have been good.
We believe we distinguish ourselves from our competition by offering proven reliability, frequent and on-time service, flexible cargo management, expert loading and stowage and close client coordination in the ports and on the vessels. This customer focus has enabled us, through our affiliated agents, to develop long-term relationships with established and well-respected industrial shippers in diverse markets including mining companies, steel manufacturers, trading companies, heavy industry, industrial equipment enterprises and construction companies. Our business model is designed to enable us to respond rapidly to our customers' changing demands and short delivery windows, increasing the value of our services to them as we enable them to schedule production and distribution.
A substantial majority of our repeat business is based on our relationships and reputation with our customers, and is not governed by long-term contracts. We depend upon a limited number of customers for a large part of our revenue. Our top ten customers by revenue, accounted for, in the aggregate, 40.5% of our total consolidated revenue for 2009. We have affreightment contracts with several of these customers.
As noted in the table below, only one of our customers accounted for more than 10% of revenue. The loss of this customer could have a material adverse effect on our results of operations. The percentages of consolidated revenues from our major customers for each of the last three fiscal years are as follows:
| | | Year Ended December 31, | |
| Customer | | 2009 | | | 2008 | | | 2007 | |
| Dangote Industry Limited | | | 13.5 | % | | | 13.0 | % | | | 13.4 | % |
We transport cargo throughout the world, including the United States. The amount of voyage revenue generated by country for each of the last three fiscal years is as follows (in thousands):
| | | Year Ended December 31, | |
| Country | | 2009 | | | 2008 | | | 2007 | |
| | | | | | | | | | |
| Brazil | | $ | 53,192 | | | $ | 127,360 | | | $ | 72,053 | |
| Japan | | | 35,914 | | | | 79,812 | | | | 40,592 | |
| United Arab Emirates | | | 32,387 | | | | 69,714 | | | | 24,406 | |
| USA | | | 28,137 | | | | 33,702 | | | | 19,785 | |
| Peru | | | 26,870 | | | | 48,707 | | | | 31,728 | |
| Chile | | | 16,564 | | | | 46,923 | | | | 11,219 | |
| China | | | 12,944 | | | | 42,319 | | | | 21,624 | |
| Argentina | | | 8,021 | | | | 8,312 | | | | 15,059 | |
| Korea | | | 6,744 | | | | 15,699 | | | | 5,775 | |
| Venezuela | | | 5,063 | | | | 9,903 | | | | 4,579 | |
| Others | | | 22,144 | | | | 36,456 | | | | 14,689 | |
| | | $ | 247,980 | | | $ | 518,907 | | | $ | 261,509 | |
| | | | | | | | | | | | | |
Revenue attributed to these countries is based on the location where the cargo is loaded. Time charter revenue by country cannot be allocated because we do not control the itinerary of the vessel.
The cargo markets we serve are highly competitive. Our competition on the routes we serve consists primarily of regional shipping companies focused on the breakbulk market, international bulk shipping companies competing in the large lot segment of the bulk metal concentrates market and larger shipping concerns that compete in diverse shipping segments in addition to the breakbulk market. We compete on the basis of targeting niche markets that include trade routes, ports and cargoes not efficiently served by many container and large dry bulk vessel operators. We focus on smaller lots of 1,000 to 10,000 metric tons in the bulk metal concentrates market in Chile and Peru, whereas other bulk shipping companies focus on shipments of 20,000 to 45,000 metric tons of bulk metal concentrates. Additionally, we compete with other regional shipping companies in providing logistics, operations, port services and strategic planning.
Vessel Environmental Regulations
Ocean shipping and related operations are affected by extensive and changing environmental protection and other laws and regulations. These laws and regulations take the form of international conventions and agreements, including those administered by the IMO, and SOLAS, with which all internationally trading vessels must comply, and national, state and local laws and regulations, all of which are amended frequently. Compliance with these laws and regulations may entail significant expenses at any time, including expenses for ship modifications and changes in operating procedures, which could have an adverse effect on our results of operations. Subject to the discussion below and to the fact that the kinds of permits, licenses and certificates required for the operation of the owned vessels will depend upon a number of factors, we believe that we have and will be able to obtain all permits, licenses and certificates material to the conduct of our operations.
In the United States, we are subject to various federal, state and local environmental laws, ordinances and regulations requiring the cleanup of environmental contamination resulting from a discharge of oil or other regulated material, and may be held liable to a governmental entity or to third parties for remediation costs and related damages in connection with environmental contamination. These laws typically impose cleanup responsibility, and liability, which under these laws, has been interpreted to be strict and under certain circumstances, joint and several, and subject to very limited statutory defenses. The costs of investigation, remediation or removal of such regulated materials and damages resulting from their release may be substantial.
Although we do not transport petroleum products, we are subject to the U.S. Oil Pollution Act of 1990 (“OPA 90”), because we use petroleum products for fuel and because the possibility of accidents involving oil tankers presents an exposure to our vessels. Under OPA 90, vessel owners, operators and bareboat charterers are responsible parties and are jointly, severally and strictly liable, unless the spill results solely from the act or omission of a third party, an act of God or an act of war, for containment and cleanup costs and other damages resulting from the discharge or threatened discharge of oil into the navigable waters, adjoining shorelines or the 200 nautical mile exclusive economic zone of the United States. OPA 90 limits the liability of responsible parties for such costs and damages to the greater of $1,000 per gross ton of the vessel or $854,400 per non-oil tanker vessel that is over 300 gross tons, subject to possible adjustment for inflation. The Federal Water Pollution Control Act (“FWPCA”) imposes significant civil penalties as well as strict, joint and several liability on responsible parties for removal costs and imposes liability for natural resource damages arising from the discharge of oil or other hazardous substances into U.S. navigable waters, adjoining shorelines, waters of the contiguous zone and areas of the outer continental shelf and deepwater ports. The Comprehensive Environmental Response, Compensation & Liability Act of 1980, (“CERCLA”), imposes strict, and under certain circumstances, joint and several liability on responsible parties for releases and threatened releases of hazardous substances (other than oil) whether on land or at sea, subject to limits depending on the nature of the vessel and its cargo. Liability under CERCLA is limited to the greater of $300 per gross ton or $5 million for vessels over 300 gross tons carrying hazardous substances as cargo. The limits on liability under OPA 90, FWPCA and CERCLA do not apply if the discharge is caused by gross negligence, willful misconduct, or in the cases of OPA 90 and CERCLA, the violation by a responsible party or its agent of any applicable safety, construction or operating regulation. The statutory limits on liability may not apply in certain other instances, including if the responsible parties fail or refuse to report the incident or refuse to cooperate and assist in connection with oil removal activities. In addition, OPA 90, FWPCA and CERCLA specifically permit individual states to impose their own liability regimes with regard to oil and hazardous waste releases occurring within their boundaries, and many states have enacted legislation providing for unlimited liability for oil spills. In some cases, states that have enacted such legislation have not yet issued implementing regulations under these laws. We intend to comply with all applicable state regulations in ports where we call.
Pursuant to regulations promulgated by the U.S. Coast Guard, responsible parties (as defined in such regulations) must establish and maintain evidence of financial responsibility in the amount of $1,000 per gross ton, for a non-tank vessel. The Protection & Indemnity (“P&I”) Associations, which historically provided shipowners and operators financial assurance, have refused to furnish evidence of insurance to responsible parties, and therefore responsible parties have obtained financial assurance from other sources at additional cost, including evidence of surety bond, guaranty or by self-insurance. In addition, in recent years the U.S. Coast Guard has increased its inspection of vessels entering the United States to ensure they comply with applicable environmental regulations, including regulations related to the discharge of oil.
Port state authorities in general and in certain jurisdictions in particular have become more active in inspecting older vessels visiting their ports and, in certain instances, demanding that repairs be made before allowing a vessel to sail, even though that vessel may be fully insured, in class and in compliance with all relevant maritime conventions including SOLAS.
The IMO has adopted regulations that are designed to reduce oil pollution in international waters. In complying with OPA 90, IMO and other regulations that may be adopted, shipowners and operators may be forced to meet new maintenance and inspection requirements, develop contingency arrangements for potential spills and obtain additional insurance coverage.
The technical manager of our vessels, Roymar, is ISO 14001:2004 certified. Roymar has developed and implemented environmental practices and monitoring thereof, which protect and preserve the marine environment in which our managed vessels operate. We have high standards in our fleet for pollution prevention, regulatory compliance and continual improvement of our environmental management activities.
Other Regulations
Operation of our vessels also is affected by the requirements of the ISM Code. The ISM Code mandates an extensive “Safety Management System” that includes, among other things, the adoption of a safety and environmental protection policy setting forth instructions and procedures for operating vessels safely and describing procedures for dealing with emergencies. Our owned vessels and Roymar, the technical manager of our vessels, are currently ISM Code certified.
We also are required by various governmental and quasi-governmental agencies and other regulatory authorities to obtain permits, licenses and certificates in connection with our operations. Some countries in which we operate have laws that restrict the carriage of cargoes depending on the registry of a vessel, the nationality of its crew and prior and future ports of call, as well as other considerations relating to particular national interest.
We are subject to a variety of initiatives intended to enhance vessel security, including the Maritime Transportation Security Act of 2002, or MTSA. U.S. Coast Guard regulations require that vessels operating in waters subject to the jurisdiction of the United States implement a number of security measures. Similarly, a new chapter of SOLAS, dealing specifically with maritime security, which came into effect in July 2004, imposes various detailed security obligations on vessels and port authorities, most of which are contained in the International Ship and Port Facilities Security Code, or ISPS Code. The ISPS Code is designed to protect ports and international shipping against terrorism. Since July 1, 2004, to engage in international trade, a vessel must have an International Ship Security Certificate, or ISSC, which attests to the vessel’s compliance with SOLAS security requirements and the ISPS Code, from a recognized security organization approved by the vessel’s flag state. ISPS Code requirements include:
| · | on-board installation of automatic identification systems to provide a means for the automatic transmission of safety-related information among similarly equipped ships and shore stations, including information on a ship's identity, position, course, speed and navigational status; |
| · | on-board installation of ship security alert systems that do not sound on the vessel but instead alert the onshore authorities; |
| · | development of vessel security plans; |
| · | permanent marking of a ship's identification number on its hull; |
| · | maintenance of a continuous synopsis record on-board showing a vessel's history, including the name of the vessel and of the state whose flag the ship is entitled to fly, the date on which the ship was registered with that state, the ship's identification number, the port at which the ship is registered and the name of the registered owners and their registered address; and |
| · | compliance with flag state security certification requirements. |
Coast Guard regulations, intended to align with international maritime security standards, exempt non-U.S. vessels from MTSA vessel security measures, provided they have a valid ISSC on board. Our vessels comply with all MTSA, SOLAS and ISPS Code requirements and vessel certifications, which are kept current by Roymar.
Acts of piracy have historically affected ocean-going vessels trading in regions of the world such as the South China Sea and in the Gulf of Aden off the coast of Somalia. Throughout 2009 piracy incidents have continued in the Gulf of Aden, with dry bulk vessels and tankers particularly vulnerable to such attacks. We have implemented a corporate and vessel anti-piracy plan on all vessels transiting high risk areas. These plans incorporate best prevention and proactive practices in training, procedures and equipment recommended by security consultants and industry panels. These protective measures are being carried out for every transit in high risk areas, but do not ensure that an attack will be repulsed.
Our business is subject to normal hazards associated with owning and operating vessels in international trade. The operation of ocean-going vessels carries an inherent risk of catastrophic marine disaster, including oil spills and other environmental accidents, as well as property losses caused by adverse weather conditions, cargo loss or damage, mechanical failures, human error, war, terrorism and business interruption due to political circumstances in foreign countries, hostilities, piracy and labor action. Not all risk can be insured against and the policies have certain deductibles and other limits on coverage for which we are responsible. We believe that our current insurance coverage is adequate to protect us against normal accident-related risk involved in the conduct of our business. Our principal insurance policies include:
Hull and machinery and war risks insurance includes coverage for damages to a vessel’s hull and machinery in a collision, as well as basic perils of the sea and contributions for general average and salvage charges. This coverage includes the risk of actual or constructive total loss for our controlled fleet. Each vessel is insured for at least its fair market value, with a deductible of $75,000 per vessel per incident under the hull and machinery coverage and no deductible under the war risk coverage. The respective owners of the other vessels that we charter-in maintain insurance on those vessels, and we maintain time charter liability insurance to a limit of $500 million per incident.
Protection and Indemnity, or P&I, Insurance includes coverage for oil pollution, damage to docks and other installations and coverage against third-party liabilities including collision liabilities encountered in our commercial operations. It also includes coverage for the death, injury or illness of our crew. Our P&I insurance is provided by mutual marine insurance associations or P&I Clubs. P&I Clubs are formed by shipowners to provide protection from large financial losses to one member by contribution towards the loss by all members. We are subject to potential additional premiums for prior years due to funding requirements and coverage shortfalls of the clubs in the event claims exceed available funds and reserves. We also are subject to future premium increases based on prior year underwriting loss experience. We have an overall coverage limit of approximately $5.0 billion for damage to cargo and third party liabilities and a sublimit for oil pollution of $1.0 billion per vessel for each accident or occurrence. Deductibles range from $5,000 to $50,000 depending on the nature of the claim.
Other Insurance is maintained for legal expenses with respect to freight, demurrage and defense claims. We also carry limited insurance covering the loss of revenue resulting from extended vessel off-hire periods.
U.S. Taxation of Shipping Income
Unless exempt from U.S. federal income taxation under the rules discussed below, a foreign corporation generally is subject to U.S. federal income tax in respect of shipping income derived from sources within the United States. For these purposes, 50% of shipping income that is attributable to transportation that begins or ends, but that does not both begin and end, in the United States constitutes income from sources within the United States ("U.S. source shipping income"). Shipping income attributable to transportation exclusively between non-U.S. ports will be considered to be 100% derived from sources outside the United States. Accordingly, in the absence of an exemption from tax under Section 883 of the U.S. Internal Revenue Code, as amended (the "Code") our gross U.S. source shipping income would be subject to either a 4% tax imposed without allowance for deductions or to a net basis tax.
The net tax regime is applicable if we are considered to have a fixed place of business in the United States that is involved in the earning of U.S. source shipping income and substantially all of such shipping income is attributable to regularly scheduled transportation. The U.S. source shipping income to which the net tax regime is applicable, net of applicable deductions, would be subject to an effective tax rate of up to 54.5% and certain interest paid would be subject to a 30% branch interest tax, or such lesser percentage as may be available under an applicable treaty. Any gain derived from the sale of a vessel, if considered to be from U.S. sources, also would be partly or wholly subject to the net tax regime. If the net tax regime does not apply, the gross tax regime will apply. Under the gross tax regime, our U.S. source shipping income, which, by operation of the source rule, cannot be more than 50% of our total shipping income, would be subject to a 4% tax imposed on a gross basis, without allowance for deductions.
U.S. source shipping income of a foreign corporation will qualify for exemption from U.S. federal income tax under Section 883 of the Code if (i) the corporation is organized in a foreign country that grants an equivalent exemption to U.S. corporations (the "country of organization requirement"), (ii) the stock of the corporation, or the direct or indirect corporate parent thereof (provided the parent is organized in a country that satisfies the country of organization requirement) is "primarily and regularly traded on an established securities market" in such country, in another country that grants the equivalent exemption from tax to U.S. corporations or in the United States, and (iii) certain other requirements are met, including that non-qualified shareholders, each holding 5% or more of a class of stock of the corporation, do not own 50% or more of the total value of such class of stock for more than one-half the days of taxable year (together, the "publicly traded test"). This exemption is available whether or not the corporation has or is considered to have a fixed place of business in the United States that is involved in the earning of U.S. source shipping income. Regardless of whether our U.S. source shipping income qualifies for exemption under Section 883 of the Code, gain realized on a sale of a vessel generally will not be subject to U.S. federal income tax, provided the sale is considered to occur outside of the United States for U.S. federal income tax purposes.
We currently qualify for exemption under Section 883 of the Code, because International and its subsidiaries currently are incorporated in jurisdictions that satisfy the country of organization requirement and we satisfy the publicly traded test by virtue of International’s Class A ordinary shares being primarily traded on the NASDAQ Global Select Market. Further, the aggregate ownership of all non-qualified 5% shareholders is less than 50% of the total value of the Class A ordinary shares. If at any time we fail to satisfy the publicly traded test and we are unable to qualify for another applicable exemption, our U.S. source shipping income would be subject to U.S. federal income tax, either under the gross tax or under net tax regime, each of which is described above.
Federal and State Taxation of TBS International plc’s U.S. Subsidiaries
Our U.S. subsidiaries, Roymar and TBS Shipping Services and its subsidiaries, are subject to U.S. federal and state income taxes on the income earned by the respective subsidiary.
Ireland Taxation of TBS International plc
TBS International plc, the successor issuer to TBS International Limited, is incorporated in Ireland. TBS International plc as a separate entity is subject to tax in Ireland on its worldwide income and gains at 25% with the exception of dividend income received from its subsidiaries that are sourced from active trading profits, which is subject to tax in Ireland at 12.5%. TBS International plc should be considered an investment company for Irish tax purposes and should be allowed to deduct expenses of management against its income and gains. However, as it is not anticipated that TBS International plc will receive any significant dividends from its subsidiaries in the foreseeable future it is not expected that TBS International plc will have any material income subject to Irish taxation.
Bermuda Taxation of Our Subsidiary, TBS International Limited
There currently is no Bermuda income or profits tax, withholding tax, capital gains tax, capital transfer tax, estate duty or inheritance tax payable by our subsidiary TBS International Limited. We have obtained an assurance from the Minister of Finance of Bermuda under the Exempted Undertakings Tax Protection Act 1966 that, in the event that any legislation is enacted in Bermuda imposing any tax computed on profits or income, or computed on any capital asset, gain or appreciation or any tax in the nature of estate duty or inheritance tax, such tax shall not, until March 28, 2016, be applicable to TBS International Limited or any of its operations, debentures or other obligations except insofar as such tax applies to persons ordinarily resident in Bermuda or to any taxes payable by TBS International Limited in respect of real property owned or leased by us in Bermuda.
Marshall Islands Taxation of TBS International plc
Pursuant to the Marshall Islands Revised Code (the Association Law), a Marshall Islands non-resident corporation is exempt from any corporate profit tax, income tax, withholding tax on revenues of the entity, asset tax, tax reporting requirement on revenues of the entity, stamp duty, exchange controls or other fees. There is an agreement between the Marshall Islands and the United States for the exchange of information with respect to taxes.
We make all of our filings with the SEC, including this annual report on Form 10-K, quarterly reports on Form 10-Q, current reports on Form 8-K, and all related amendments, available free of charge on our website at www.tbsship.com, under the Investor Relations tab, "SEC Filings" section. These reports are available soon after they are filed electronically with the SEC. Our SEC filings are also available at the SEC’s Public Reference Room at 100 F Street, N.E., Washington, DC 20549. Investors may obtain information on the operation of the Public Reference Room by calling the SEC at 1-800-SEC-0330. In addition, the SEC maintains an Internet site at http://www.sec.gov that contains reports, proxy and information statements and other information regarding issuers that file electronically with the SEC, from which investors can electronically access our SEC filings.
Additionally, our corporate governance materials, including the charters of the Audit, Compensation, and Nominating and Corporate Governance Committees, the Corporate Governance Guidelines, and the Code of Business Conduct and Ethics may also be found under the "Governance" section of our website at www.tbsship.com. A copy of the foregoing corporate governance materials is available free of charge upon written request. In addition, we intend to post on our website at www.tbsship.com any amendment to, or waiver from, a provision of our Code of Business Conduct and Ethics that applies to our principal executive officer, principal financial officer, corporate controller and other employees performing similar functions within four business days following the date of such amendment or waiver.
The following risk factors and other information included in or incorporated by reference into this report should be carefully considered. Additional risks and uncertainties not presently known to us may also impair our business operations. If any of the following risks occur, our business, financial condition, operating results and cash flows could be materially adversely affected and the trading price of our Class A ordinary shares could decline.
Risk Factors Relating to the Shipping Industry and Current Economic Conditions
The global financial crisis has had, and may continue to have, an impact on our business and financial condition. Additionally, protracted economic weakness could have a material adverse effect on our operating income, cash flows and ability to service our debt obligations.
The dry bulk shipping industry is volatile and unpredictable. In 2009, we experienced added pressure on freight rates directly correlating to the global financial crisis. The global financial crisis reduced the availability of liquidity and credit to borrowers, which further pressured shipping rates. Many lenders and institutional investors reduced and, in some cases, ceased to provide funding and letters of credit necessary to finance purchases of steel products, agricultural commodities, metal concentrates and aggregates. As a result, corresponding with a decline in freight rates there was a reduced demand for steel products, agricultural commodities, metal concentrates and aggregates.
Shipping rates and the demand for shipping services correspond directly with the demand and price for commodities. Global economic conditions adversely affected the demand for commodities and in conjunction with the volatile prices for steel products, agricultural commodities, metal concentrates and aggregates, the demand for shipping services had moderated. The market turmoil and tightening of credit led to a widespread reduction of business activity, in general, which adversely affected demand for our services. These conditions are continuing into early 2010.
There continues to be uncertainty as to the long-term success of international efforts to address the global economic crisis. We cannot predict the timing and severity of future global economic or shipping downturns. However, a protracted economic slowdown, including recessions in major geographic regions, could reduce the demand for shipping services while decreasing freight rates and increasing our costs, which could have a material adverse effect on our results of operations and financial condition, including causing asset impairments, as well as a material adverse affect on our operating income, cash flows and the trading price of our stock.
Moreover, our business is exposed to risks associated with the creditworthiness and stability of our suppliers, customers and business partners. The consequences of such adverse effects could include interruptions or delays in performance of our contracts, reductions, renegotiations and interruptions in customer contracts, delays in or the inability of customers to obtain financing or letters of credit to finance shipping, and bankruptcy of customers or other creditors. Any of these events may adversely affect our cash flow, profitability and financial condition. Further, a continued downturn in the economy and our revenues could adversely affect our ability to maintain specified financial ratios and satisfy financial covenants required by our credit facilities.
The current worldwide financial crisis has reduced the availability of liquidity and credit to fund or support the continuation and expansion of business operations worldwide. Continued disruption of the credit markets has affected and could continue to adversely affect our suppliers’ and customers’ access to credit, which supports the continuation and expansion of their businesses worldwide and could result in disruptions in our business operations, contract cancellations or suspensions and payment delays or defaults by our customers. If current market conditions continue for a protracted period, our ability to access credit on favorable terms, or at all, may be adversely affected, which may limit our ability to finance future operations or capital needs, acquire vessels or pursue business opportunities.
The global financial crisis has had an adverse impact on our vessel values and cash flows, which in turn has adversely affected our ability to comply with certain financial covenants in our credit facilities.
One of the significant effects of the current global financial downturn has been a reduction in vessel values, which directly affected our ability to comply with certain financial covenants in our credit facilities. The financial covenants require that we maintain certain fixed charge and leverage ratios, as well as maintain tangible net worth within defined limits. We are also required to maintain minimum cash and cash equivalent balances and collateral coverage and to prepay principal or deliver additional security in the event that the fair market value of the vessels falls below limits specified in the loan agreement.. We concluded in early 2009, that due to the downturn in the shipping market and based on third-party vessel valuations, we did not meet our collateral coverage requirements. Consequently, we obtained waivers from all of our lenders to the collateral coverage ratio and financial covenants through January 1, 2010. As a result of the loan modification two additional covenants were introduced that require us to have a minimum end of month cash balance and a minimum EBITDA to interest expense ratio.
We met each of the additional covenants in 2009. In late December 2009, while economic conditions continued to improve, we concluded that based upon internal projections and the four quarter look-back methodology used in computing the ratios, it was probable that we would be in violation of the leverage and fixed charge coverage ratios on January 1, 2010 after the waivers expire. Accordingly, we obtained from all of our lenders, an extension of the waivers until April 1, 2010. The additional covenants are applicable through the extended waiver period.
Based on current internal projections, however, we anticipate that we will not meet certain of the reinstated covenant requirements during the next 12 months. Generally accepted accounting principles require that long-term loans be classified as a current liability when either a covenant violation that gives the lender the right to call the debt has occurred at the balance sheet date, or such a covenant violation would have occurred absent a waiver of those covenants, and in either case it is probable that the covenant violation will not be cured within the next 12 months. Accordingly, long-term loans are classified as a current liability in our consolidated balance sheet at December 31, 2009.
We are in the process of discussing permanent modifications to our credit facilities with our lenders. Additionally, we are seeking alternative financing sources to repay our credit facilities. We cannot give any assurance that we will be able to obtain the permanent covenant modifications and /or other financing. The failure to obtain the permanent covenant modifications or other financing would have a material adverse effect on our business, operations, financial condition and liquidity and would raise substantial doubt about our ability to continue as a going concern.
Costs and revenues in the shipping industry are volatile.
The shipping industry historically has experienced volatility in freight rates, the cost of fuel oil, the cost and availability of crew, port charges and currency exchange rates, as well as in vessel charter rates and vessel values due to changes in the level and pattern of global economic activity and the highly competitive nature of the world shipping industry. In addition, an increasing number of countries are regulating the sulfur content of fuel oil, which may increase the cost of such fuel. Changes to marine regulatory regimes in the ports at which our vessels call also may increase our costs.
Our revenue is influenced by a number of factors that are difficult to predict with certainty, including global and regional economic conditions, developments in international trade, changes in seaborne and other transportation patterns, the effects of global climate change on developing economies and agricultural production, weather patterns, port congestion, canal closures, political developments, armed conflicts, acts of terrorism, embargoes and strikes. Demand for our transportation services is influenced by the demand for the goods we ship, including steel products, agricultural commodities, metal concentrates and aggregates, which in turn is affected by general economic conditions, commodity prices and competition. Steel products, agricultural commodities, metal concentrates and aggregates accounted for approximately 24.2%, 20.7%, 15.1%, and 13.5%, respectively, of our total voyage revenues in 2009. Beginning in the fourth quarter of 2008 and continuing through most of 2009 the worldwide economy experienced a sluggish demand for steel products, metal concentrates, agricultural commodities, and aggregates. The softened demand for products and commodities translated into a decreased demand for shipping. However, a future worsening of worldwide economic conditions could result in a decrease in demand for steel products, metal concentrates, agricultural commodities, and aggregates, which could adversely affect our results of operations.
Our business depends to a significant degree on the stability and growth of the Asian and Latin American economies.
Freight rates for dry bulk transport, whether computed on a spot or period basis, were at or near all-time highs in 2008 as compared to prior years, as were prices for both new and secondhand vessels. The strength of the shipping industry in the past several years has been attributable, to a significant degree, to the rapid growth of the Chinese economy. Economic growth in China caused unprecedented demand for raw materials from Latin America, including iron ore, bauxite, soybeans, timber, zinc, manganese and copper. These raw materials generally are transported by ocean freight.
The growth of the Chinese economy stimulated growth in other Asian economies as well. Any pronounced slowdown or decline in the Chinese economy could be expected to have significant adverse effects on the economies of Latin American and Asian countries and on the demand for our services and could be expected to result in declines in freight rates and the value of our vessels. We expect that a significant decline in the Asian and Latin American economies would have a materially adverse effect on our results of operations.
High or volatile oil prices could adversely affect the global economy and our results of operations.
As oil prices continue to fluctuate, and experience periods of prolonged volatility, the global economy could weaken significantly. A global recession would significantly reduce the demand for ocean freight while our fuel costs could increase. A significant reduction in the demand for ocean freight combined with increased fuel costs would have a material and adverse impact on our results of operations and financial condition.
Acts of piracy on ocean-going vessels have increased recently in frequency and magnitude, which could
adversely affect our business.
Beginning in 2008, acts of piracy have risen steeply. While international efforts have been and continue to be made to prevent them, acts of piracy continue to occur, particularly off the coast of Somalia in the Gulf of Aden and in the South China Sea. If piracy attacks occur in regions in which our vessels are deployed, that are characterized by insurers as ‘‘war risk’’ zones or ‘‘war and strikes’’ listed areas, premiums payable for such insurance coverage could increase significantly and such insurance coverage may be more difficult to obtain. Crew costs, including those due to employing on-board security guards, could increase in such circumstances. In addition, while we believe the time charterer remains liable for charter payments when a vessel is seized by pirates for the period specified in the charter agreement, the charterer may dispute this and withhold charter fees until the vessel is released. A charterer may also claim that a vessel seized by pirates was not "on-hire" for a certain number of days and it is therefore entitled to cancel the charter, a claim that we would dispute. The detention of any of our vessels hijacked as a result of an act of piracy and any unrecoverable costs, increases in insurance premiums payable, or losses due to the unavailability of insurance coverage, could have a material adverse impact on our business, financial condition, results of operations and cash flows.
In the highly competitive international shipping market, we may not be able to compete with new entrants or established companies with greater resources.
We employ our vessels in highly competitive markets that are capital-intensive and highly fragmented. Competition arises primarily from other vessel owners, many of whom have substantially greater resources than we have. Competition for the transportation of cargo by sea is intense and depends on price, location, size, age, condition and the acceptability of the vessel and its operators. Due in part to the highly fragmented market, competitors with greater resources could enter our market and operate larger fleets through consolidation or acquisitions and may be able to offer lower rates and higher quality vessels than we are able to offer.
Worldwide increases in shipping capacity may further reduce shipping rates, which could adversely affect our results of operations.
The worldwide supply of shipping capacity is influenced by the type of vessel, number of newbuilding deliveries, the scrapping of older vessels, vessel casualties and the number of vessels that are out of service. An excess in shipping capacity, particularly dry bulk carriers, may result in a reduction of shipping rates, which may adversely affect the profitability of our shipping services.
Failure to comply with international safety regulations could subject us to increased liability, adversely affect our insurance coverage and result in a denial of access to, or detention in, certain ports.
The operation of our vessels is affected by the requirements of the International Maritime Organization's International Safety Management Code for the Safe Operation of Ships and Pollution Prevention, or the ISM Code. The ISM Code requires shipowners and bareboat charterers to develop and maintain an extensive "Safety Management System" that includes the adoption of a safety and environmental protection policy setting forth instructions and procedures for safe operation and describing procedures for dealing with emergencies. Any failure to comply with the ISM Code could subject us to increased liability, could invalidate existing insurance or decrease available insurance coverage for the affected vessels and could result in a denial of, access to, or detention in certain ports, all of which could materially and adversely affect our results of operations and liquidity.
We could be adversely affected by violations of the U.S. Foreign Corrupt Practices Act and similar worldwide anti-bribery laws.
The U.S. Foreign Corrupt Practices Act and similar worldwide anti-bribery laws generally prohibit companies and their intermediaries from making improper payments to non-U.S. officials for the purpose of obtaining or retaining business. Our policies mandate compliance with these laws. We operate in many parts of the world that have experienced governmental corruption to some degree and, in certain circumstances; strict compliance with anti-bribery laws may conflict with local customs and practices. Despite our training and compliance program, we cannot assure you that our internal control policies and procedures always will protect us from reckless or negligent acts committed by our employees or agents. Violations of these laws, or allegations of such violations, could disrupt our business and result in a material adverse effect on our business and operations.
Compliance with environmental and other laws and regulations could adversely affect our business.
Extensive and changing environmental protection and other laws and regulations directly affect the operation of our vessels. These laws and regulations take the form of international conventions and agreements, including the International Maritime Organization, or IMO, conventions and regulations and the International Convention for the Safety of Life at Sea, or SOLAS, which are applicable to all internationally traded vessels, and national, state and local laws and regulations, all of which are amended frequently. Under these laws and regulations, various governmental and quasi-governmental agencies and other regulatory authorities may require us to obtain permits, licenses and certificates in connection with our operations. Some countries in which we operate have laws that restrict the carriage of cargoes depending on the registry of a vessel, the nationality of its crew and prior and future ports of call, as well as other considerations relating to particular national interest. An increasing number of jurisdictions also regulate the sulfur content of fuel used by our vessels. Changes in governmental regulations and safety or other equipment standards, the passage of new regulations or standards in response to global climate change, may require unbudgeted expenditures for alterations, special surveys, drydocking or the addition of new equipment for our vessels or increased fuel and operating costs Port authorities in various jurisdictions may demand that repairs be made before allowing a vessel to sail, even though that vessel may be certified as "in class" and in compliance with all relevant maritime conventions. Compliance with these laws and regulations may require significant expenditures, including expenses for ship modifications and changes in operating procedures or penalties for failure to comply with these laws and regulations, which could adversely affect our results of operations.
Pursuant to regulations promulgated by the U.S. Coast Guard, responsible parties (as defined in such regulations) must establish and maintain evidence of financial responsibility. The P&I Associations, which historically provided shipowners and operators financial assurance, have refused to furnish evidence of insurance to responsible parties, and therefore responsible parties have obtained financial assurance from other sources at additional cost, including evidence of surety bond, guaranty or by self-insurance. In addition, in recent years the U.S. Coast Guard has increased its inspection of vessels entering the United States to ensure they comply with applicable environmental regulations, including regulations related to the discharge of oil. Any inability on our part to continue to comply with any of these Coast Guard regulations would have a material adverse effect on our results of operations.
Port State authorities in general and in certain jurisdictions in particular have become more active in inspecting older vessels visiting their ports and, in certain instances, demanding that repairs be made before allowing a vessel to sail, even though that vessel may be fully insured, in class and in compliance with all relevant maritime conventions including SOLAS. Vessels under certain flags are more likely to be subject to inspections by the coast guard. Additional expenses may be incurred for unscheduled repairs mandated by port state authorities.
The IMO has adopted regulations that are designed to reduce oil pollution in international waters. In complying with U.S. Oil Pollution Act of 1990, or OPA 90 and IMO regulations and other regulations that may be adopted, shipowners and operators may be forced to incur additional costs in meeting new maintenance and inspection requirements, in developing contingency arrangements for potential spills and in obtaining insurance coverage. Additional laws and regulations may be adopted that could have a material adverse effect on our results of operations. In the United States and in other countries where we operate, we are subject to various federal, state or local environmental laws, ordinances and regulations and may be required to clean up environmental contamination resulting from a discharge of oil or hazardous substances, such as a discharge of fuel. We also may be held liable to a governmental entity or to third parties in connection with the contamination. These laws typically impose cleanup responsibility. Liability under these laws has been interpreted to be strict, joint and several, and subject to very limited statutory defenses. The costs of investigation, remediation or removal of such substances and damages resulting from such releases could be substantial and could adversely affect our results of operations.
The shipping industry has inherent operational risks, which may not be adequately covered by insurance.
The operation of any ocean-going vessel carries with it an inherent risk of marine disaster, environmental mishaps and collision or property losses. In the course of operating a vessel, marine disasters such as oil spills and other environmental mishaps, cargo loss or damage, business interruption due to political developments, labor disputes, strikes and adverse weather conditions could result in loss of revenues, liabilities or increased costs. We transport bulk cargoes such as fertilizer, salt and coal which, if not transported properly, could pose a risk to our vessels and to the environment. We cannot assure you that any insurance we maintain would be sufficient to cover the cost of damages or the loss of income resulting from a vessel being removed from operation or that any insurance claims would be paid or that insurance will be obtainable at reasonable rates in the future. Any significant loss or liability for which we are not insured, or for which our insurers fail to pay us, could have a material adverse effect on our financial condition. In addition, the loss of a vessel would adversely affect our cash flows and results of operations.
Risk associated with the shipping industry could affect our business and reputation, which could adversely affect our results of operations and share price.
As mentioned above, the operation of ocean-going vessels carries inherent risk of marine disaster and environmental mishap. The involvement of our vessels in a marine disaster or an environmental mishap will harm our reputation as a safe and reliable vessel owner and operator could have a material adverse effect on our financial condition and results of operations.
Marine claimants could arrest our vessels, which could damage our on-time performance reputation and result in a loss of cash flow.
Under general maritime law in many jurisdictions, crew members, tort claimants, claimants for breach of certain maritime contracts, vessel mortgagors, suppliers of fuel, materials, goods and services to a vessel and shippers and consignees of cargo may be entitled to a maritime lien against that vessel for unsatisfied debts, claims or damages. In many circumstances, a maritime lien holder may bring an action to enforce its lien by "arresting" a vessel. In some jurisdictions, under the "sister ship" theory of liability, a claimant may arrest not only the vessel subject to the claimant's maritime lien, but also any "associated" vessel owned or controlled by the legal or beneficial owner of that vessel. The arrest of one or more of our vessels could result in a loss of cash flow or require us to pay substantial amounts to have the arrest lifted. Any interruption in our sailing schedule and our on-time performance could adversely affect our customer relationships.
Governments could requisition our vessels during a period of war or emergency, resulting in a loss of earnings.
A government could requisition one or more of our vessels for title or for hire. Requisition for title occurs when a government takes control of a vessel and becomes its owner, while requisition for hire occurs when a government takes control of a vessel and effectively becomes its charterer at dictated charter rates. Generally, requisitions occur during periods of war or emergency, although governments may elect to requisition vessels in other circumstances. Although we would be entitled to compensation in the event of a requisition of one or more of our vessels, the amount and timing of payment would be uncertain. Government requisition of one or more of our vessels could have a material adverse effect on our cash flows and results of operations.
Risks Factors Relating to Our Business
Our competitive advantage in niche markets may be eliminated.
Our fleet primarily consists of vessels suited to niche markets not efficiently served by container ships or large dry bulk vessels. If the markets in which we successfully compete upgrade their port infrastructure to accommodate larger vessels, or if the volume of cargo shipped from these markets increases sufficiently, container ships or large dry bulk vessels would be able to serve these markets more efficiently. Because operators of container ships and large dry bulk vessels have significantly lower costs per cargo ton than we do, their entry into our markets could result in increased price competition and affect our ability to maintain our rates. Our future operating results could be adversely affected if we are unable to identify and efficiently serve new niche markets in the face of more effective competition in our current markets.
We depend upon a limited number of customers for a large part of our revenue.
Our top ten customers by revenue accounted for a significant portion of our consolidated revenue. If any of these customers were to reduce significantly the amount of cargoes shipped on our vessels, our results of operations could be adversely affected.
As our fleet ages, the risks associated with older vessels could adversely affect our operations.
In general, the costs to maintain an ocean-going vessel in good operating condition increase with the age of the vessel. As of December 31, 2009, the average age of the 48 vessels in our controlled fleet was 22 years. We estimate that the economic useful life of most multipurpose tweendeckers and handymax bulk carriers is approximately 30 years, depending on market conditions, the type of cargo being carried and the level of maintenance. Some of our dry bulk carriers are used to transport products such as coal, salt or fertilizer that may damage our vessels and reduce their useful lives, if we do not follow specified maintenance and cleaning routines. Older vessels may develop unexpected mechanical and operational problems despite adherence to regular survey schedules and proper maintenance. Due to improvements in engine technology, older vessels typically are less fuel-efficient than more recently constructed vessels. Cargo insurance rates increase with the age of a vessel. Governmental regulations and safety or other equipment standards related to the age of vessels may require expenditures for alterations or the addition of new equipment, to our vessels and may restrict the type of activities in which our vessels may engage. We cannot assure you that we will be able to operate our vessels profitably during the remainder of their projected useful lives or that we will be able to sell them profitably when we can no longer utilize them in our fleet.
Certain of our expenses are primarily inelastic, and any unexpected decrease in revenue would harm us.
Generally, expenses such as fuel, lube oil, crew wages, insurance, stores, repairs and maintenance do not vary significantly with the amount of cargo carried. As a result, a change in the tons of cargo carried or a decrease in freight rates would have a disproportionate effect on our operating and financial results. Any pronounced slowdown or decline in demand for shipping may require us to run voyages at less than full capacity in an effort to maintain all of our shipping routes. Our inability to fully book a ship would reduce revenue on each voyage while the vessel and voyage costs would remain fairly constant. We do not have long-term contracts with our customers and if we are unable to fully book our vessels, we may operate voyages at a loss. Additionally, we could be affected by factors beyond our control such as irrational pricing from the market. Accordingly our profitability and liquidity would be adversely affected.
We may be required to record a significant charge to earnings if our long-lived assets or goodwill becomes impaired.
We are required to review for impairment whenever events or circumstances indicate that the carrying amount of an asset may not be recoverable. Management performs impairment analyses when certain triggering events occur. Factors that would indicate potential impairment may include, but are not limited to, a significant decrease in the market value of the long-lived asset, a significant change in the long-lived asset’s physical condition, and operating or cash flow losses associated with the use of the long-lived asset. We may be required to record a significant charge to earnings in our financial statements during the period in which any impairment of our long-lived assets is determined.
Goodwill is required to be tested for impairment at least annually or when events or changes in circumstances indicate the carrying value may not be recoverable. Factors that may be considered a change in circumstances indicating that the reporting unit’s carrying value of goodwill may not be recoverable include a decline in stock price and market capitalization, or other materially adverse events. We may be required to record a significant charge to earnings in our financial statements during the period in which any impairment of our goodwill is determined. This may adversely impact our results of operations. As of December 31, 2009, our goodwill was $8.4 million.
We are subject to regulation and liability under environmental laws that could require significant expenditures and adversely affect our financial condition, results of operations and cash flows.
Our business and the operation of our vessels are materially affected by government regulation in the form of international conventions, national, state and local laws and regulations in force in the jurisdictions in which the vessels operate, as well as in the country or countries of their registration. Because such conventions, laws, and regulations are often revised, we may not be able to predict the ultimate cost of complying with such conventions, laws and regulations or the impact thereof on the resale prices or useful lives of our vessels. Additional conventions, laws and regulations may be adopted, which could limit our ability to do business, cause us to incur the costs of retrofitting our vessels or result in financial penalties, thereby adversely affecting our financial condition, results of operations and cash flows.
We also are affected by the requirements of the ISM Code. The ISM Code mandates an extensive "Safety Management System" that includes, among other things, the adoption of a safety and environmental protection policy setting forth instructions and procedures for operating vessels safely and describing procedures for dealing with emergencies. Material noncompliance with the ISM Code may subject shipowners or bareboat charterers to increased liability, may lead to decreases in available insurance coverage for affected vessels and may result in the denial of access to, or detention in, certain ports. Our owned vessels and Roymar, the technical manager for our vessels, are ISM Code certified. However, we cannot assure you that such certification will be maintained indefinitely.
We are required by various governmental and quasi-governmental agencies and other regulatory authorities to obtain permits, licenses and certificates in connection with our operations. Some countries in which we operate, have laws that restrict the carriage of cargoes depending on the registry of a vessel, the nationality of its crew and prior and future ports of call, as well as other considerations relating to particular national interest. We cannot assure you that any failure to comply with these requirements would not have a material adverse effect on our results of operations.
Vessel drydockings could adversely affect our operations.
We anticipate that we will have an average of approximately 19 vessels per year being drydocked, based on our current controlled fleet of 48 vessels and the requirement to drydock each vessel twice during a five-year cycle. During 2010, we expect to drydock 17 vessels, including two vessels, which entered drydock in November and December 2008. In addition, we will need to reposition our vessels or charter-in outside vessels to accommodate our drydocking schedule and business needs. Approximately 30 of our vessels regularly trade in the Atlantic and Middle East region; consequently, drydocking our vessels in Chinese shipyards require complex logistics planning. We are investigating having the drydockings done at shipyards closer to where some of our vessels trade. The loss of earnings while the vessel is being drydocked, as well as the repositioning of our vessels in response to the drydocking and the actual costs of the drydocking and possible charter-in expense in response to the drydocking, could have a material adverse effect on our cash flows and results of operations.
Our vessels may suffer damage and we may need to unexpectedly drydock a vessel, which could adversely affect our operations.
If a vessel suffers damage, it may need to be repaired at a drydocking facility. The costs of drydock repairs are unpredictable and can be substantial. The loss of earnings while the vessel is being repaired and the repositioning of our vessels in response to the unexpected drydocking, as well as the actual costs of the repairs, would have a material adverse effect on our cash flows and results of operations. We may not have insurance that is sufficient to cover all of these costs or losses.
Construction delays or mechanical faults could affect our ability to replace aging vessels or grow our vessel fleet.
We depend on China Communications Construction Company Ltd. and Nantong Yahua Shipbuilding Group Co., Ltd. to construct and deliver the new multipurpose tweendeckers that we contracted to purchase on a timely basis and in good working order. The complicated nature of building these kinds of vessels involves risks. Delays or mechanical faults in vessel construction may affect our ability to increase cargo volumes on key routes or to win new customers and could necessitate unscheduled drydocks and repairs of vessels. Shipyard insolvency and other industrial actions could also delay or indefinitely postpone the timely delivery of new vessels. Construction delays or mechanical faults in new vessels could have a material adverse effect on our ability to replace aging vessels, our ability to grow our vessel fleet, our cash flows and our results of operations.
There are risks associated with the operation of secondhand vessels.
Part of our previous business strategy involved growing our fleet through the purchase of secondhand vessels. Global economic conditions and the reduction in demand for shipping services have caused us to reevaluate acquiring secondhand vessels. Pending any dramatic change in global economic conditions we have decided to suspend any further acquisitions of secondhand vessels. Secondhand vessels generally carry no warranties from the sellers or manufacturers. Although we inspected secondhand vessels prior to purchase, an inspection normally would not provide us with the same knowledge about their condition that we would have if they had been built for and operated exclusively by us. Secondhand vessels may have conditions or defects that we were not aware of when we bought the vessel and that may require us to undertake costly repairs. These repairs may require us to put a vessel into drydock, which would reduce our fleet utilization. The costs of drydock repairs are unpredictable and can be substantial. We may not have insurance that is sufficient to cover all of these repair costs or losses and may have to pay drydocking costs not covered by our insurance. The loss of earnings while our vessels were being repaired in drydock and repositioned, as well as the actual cost of those repairs, would decrease our income from operations. Additionally, our future operating results could be adversely affected if some of the secondhand vessels do not perform as we expect.
The market values of our vessels, which have declined from historically high levels, may fluctuate significantly, which could cause us to breach covenants in our credit facilities and result in foreclosure of the vessels securing such credit facilities.
The shipping industry historically has experienced volatility in vessel valuations. The market value of vessels is highly volatile and will continue to fluctuate depending on economic and market conditions affecting the shipping industry and prevailing charter hire rates, vessel supply and rates of vessel scrapping, competition from other shipping companies and other modes of transportation, types, sizes and age of vessels, applicable governmental regulations and the cost of newbuildings. The market price for secondhand vessels during the past few years had been at all-time highs; however, in late 2008 market prices of all vessel types declined when shipping rates began to fall. This decline in market price continued until late 2009 when market prices began to stabilize. If the market value of our fleet were to decline again we may be in breach of the collateral covenants again and we may be unable to remedy the relevant breach. Our lenders could then accelerate our debt and foreclose on our controlled fleet.
We may not be able to grow our vessel fleet or effectively manage our growth.
A principal focus of our long-term strategy is to continue to grow by increasing the number of vessels in our fleet and by taking advantage of changing market conditions, which may include increasing the frequency of service on routes we already operate or adding new routes and expanding into other regions. Our future growth will depend upon a number of factors, some of which we or our affiliated service company, TBS Commercial Group, can control and some of which TBS Commercial Group or we cannot control. These factors include our ability to:
| ● | identify vessels for acquisitions; |
| ● | integrate any acquired vessels successfully with our existing operations; |
| ● | hire, train and retain qualified personnel to manage and operate our growing business and fleet; |
| ● | identify additional new markets and trade routes; |
| ● | recruit, train and retain the port captains and other local staff required for our affiliated service companies to provide the necessary level of service in any new or expanded markets; |
| ● | improve our operating and financial systems and controls; and |
| ● | obtain required financing for our existing and new operations on acceptable terms. |
The failure to effectively identify, purchase, develop and integrate any newly acquired vessels could adversely affect our business, financial condition and results of operations. Our current operating and financial systems may not be adequate as we expand the size of our fleet and our attempts to improve those systems may be ineffective. As our fleet expands, we may have excess capacity if demand for our services does not grow as we expect. In addition, as we expand our fleet, our service companies will need to hire suitable additional management and administrative personnel and our affiliated service companies will need to recruit and train port captains and other local staff necessary to meet the needs of our growing business. We cannot assure you that we will be able to hire suitable employees as we expand our business. If our operating and financial systems are not effective or if we or our affiliated service companies cannot recruit and retain suitable employees as we grow, our future operations could be adversely affected.
We may be unable to pass along increased fuel costs to our customers.
A majority of our revenue is derived from freight voyages for which we bear the fuel expense, in contrast to charters, for which the charterer bears the fuel expense. Fuel expense represented approximately 49% of our voyage expense for the year ended December 31, 2009, compared to approximately 51% in 2008 and 44% in 2007. If we are unable to pass along increased fuel costs to our customers, high oil prices could adversely affect our results of operations.
Shortages of qualified crews, engineers and vessel captains could adversely affect our business.
Newbuilding programs, including our own, have increased the demand for qualified crew, engineers and vessel captains to work on our vessels, and stringent certification standards required by national and international regulations, such as "Standards of Training, Certification and Watchkeeping for Seafarers" promulgated by the IMO, make it difficult to recruit qualified crewmembers. In 2009 we used four unaffiliated manning agents, Aboitiz Jebsen Bulk Transport Corp., Intermodal Shipping, Inc., Magsaysay Maritime Corp. and C. F. Sharp Crew Management, Inc. to provide Filipino officers and non-officers to crew our vessels. If we are unable to recruit and retain enough crew, engineers or vessel captains with the appropriate skills, we may be unable to satisfy any increased demand for our shipping services, which could have an adverse effect on our business, financial condition and results of operations.
Rising crew costs may adversely affect our results of operations.
Crew costs are a significant operating expense for our operations. The cost of employing suitable crew is unpredictable and fluctuates based on events outside our control, including the supply and demand for crew and the wages paid by other shipping companies. Any increase in crew costs may adversely affect our profitability.
If we have U.S. source income, we will have to pay U.S. federal income tax on it, which would reduce our earnings.
Under the U.S. Internal Revenue Code of 1986 (as amended), or the Code, 50% of the gross
shipping income of a corporation that owns or charters vessels that is attributable to transportation that begins or ends, but that does not both begin and end, in the United States is characterized as U.S. source transportation income. Our U.S. source transportation income will be subject to either a 4% U.S. federal income tax without allowance for any deductions or, if such income is effectively connected with business in the United States, a net basis tax at regular graduated U.S. federal income tax rates, and, possibly, an additional 30% branch profits tax on our effectively connected earnings and profits, unless an exemption is available.
We currently qualify for exemption under Section 883 of the Code, because International and its subsidiaries currently are incorporated in jurisdictions that satisfy the country of organization requirement and we satisfy the publicly traded test by virtue of International’s Class A ordinary being primarily traded on the NASDAQ Global Select Market. Further, the aggregate ownership of all non-qualified 5% shareholders is less than 50% of the total value of the Class A ordinary shares. If at any time we fail to satisfy the publicly traded test and we were unable to qualify for another applicable exemption, our U.S. source shipping income would be subject to U.S. federal income tax.
Our ability to continue to qualify for the exemption depends on circumstances related to the ownership of our ordinary shares that are beyond our control and on interpretations of existing regulations of the U.S. Treasury Department. In particular, if 50% or more of our Class A ordinary shares are held by one or more non-qualified U.S. shareholders, each of whom owns 5% or more of the shares, the exemption would not be available. At December 31, 2009, non-qualified U.S. shareholders who own 5% or more of our shares owned an aggregate of 20.2% of our Class A ordinary shares. We cannot assure you that we will qualify for exemption under Section 883 in the future.
Changes in the Code, the Treasury regulations or the interpretation thereof by the Internal Revenue Service or the courts could also adversely affect our ability to take advantage of the exemption under Section 883.
We may be treated as a passive foreign investment company in the future, which would result in adverse tax consequences to holders of our Class A ordinary shares.
Based upon the nature of our current and projected income, assets and activities, we do not believe that we are, and we do not expect the Class A ordinary shares to be considered shares of a passive foreign investment company, or PFIC, for U.S. federal income tax purposes. However, the determination of whether the Class A ordinary shares constitute shares of a PFIC is a factual determination made annually, and we cannot assure you that we will not be considered a PFIC in the future. If we are treated as a PFIC, a holder of our Class A ordinary shares would be subject to special rules with respect to any gain realized on the sale or other disposition of the Class A ordinary shares and any "excess distribution" by us to the holder (generally, any distribution during a taxable year in which distributions to the holder on the Class A ordinary shares exceed 125% of the average annual taxable distribution the holder received on the Class A ordinary shares during the preceding three taxable years or, if shorter, the holder’s holding period for the Class A ordinary shares). Under those rules, the gain or excess distribution would be allocated ratably over the holder’s holding period for the Class A ordinary shares, the amount allocated to the taxable year in which the gain or excess distribution is realized and to taxable years before the first day we became a PFIC would be taxable as ordinary income, the amount allocated to each other year (with certain exceptions) would be subject to tax at the highest tax rate in effect for that year, and the interest charge generally applicable to underpayments of tax would be imposed in respect of the tax attributable to each such year.
The majority of our revenue is derived from operations outside the United States and may be adversely affected by actions taken by foreign governments or other forces or events over which we have no control.
We derive a significant portion of our voyage revenue from operations in Latin America, Asia, Africa and the Middle East. Our profitability will be affected by changing economic, political and social conditions in these regions. In particular, our operations may be affected by war, terrorism, piracy, expropriation of vessels, the imposition of taxes, increased regulation or other circumstances, any of which could reduce our profitability, impair our assets or cause us to curtail our operations. The economies of the Latin American countries where we conduct operations have been volatile and subject to prolonged, repeated downturns, recessions and depressions. Adverse economic or political developments or conflicts in these countries could have a material adverse effect on our operations.
We have experienced losses and filed for bankruptcy in 2000.
We filed for bankruptcy in 2000. Our ability to generate net income is influenced by a number of factors that are difficult to predict, including changes in global and regional economic conditions and international trade. For example, the losses and bankruptcy in 2000 were attributable in part to the acute decline in the Asian and South American economies in 1998 and 1999.
Foreign currency exchange rates may adversely affect our results.
We are exposed to a variety of market risks, including the effects of changes in foreign currency exchange rates. We incur approximately 8% of our operating expenses in currencies other than U.S. dollars. At December 31, 2009, approximately 9% of our outstanding accounts payable were denominated in currencies other than U.S. dollars. Therefore, when the U.S. dollar weakens in relation to the currencies of the countries where we incur expenses, our U.S. dollar reported expenses increase and our income will decrease. Changes in the relative values of currencies occur from time to time and may, in some instances, have a significant effect on our operating results.
Risk Factors Related to Our Financings
We may not be able to obtain an extension of waivers for financial ratios and financial covenants that expire on April 1, 2010.
In late December 2009, we obtained an extension of waivers for financial ratios and other financial covenants through April 1, 2010 from all our credit facilities. The financial ratios, which are tested quarterly, are based on earnings before interest, taxes, depreciation and amortization for the previous four quarters. As a result of the weak economic conditions and their effects on the shipping industry during 2009, it is probable that we would be in violation of the leverage and fixed charge coverage ratios after the waivers expire. We may be required to take action to reduce our debt or to act in a manner contrary to our business objectives to meet these financial ratios or obtain future waivers or loan modifications to keep us from being in breach of the covenants. If we are unable to obtain additional waivers or loan modifications, lenders could elect to declare the debt, together with accrued interest and other fees, to be immediately due and payable and proceed against the collateral securing that debt. We cannot assure you that we will obtain the waivers or loan modifications, and any inability to do so could have a material adverse effect on our financial condition.
Our indebtedness could affect our ability to provide strong results to the holders of our Class A ordinary shares.
Our indebtedness could have important consequences to investors, including:
| ● | Increasing our vulnerability to general adverse economic and industry conditions by making it more difficult for us to react quickly to changing conditions; |
| ● | Our level of debt may limit our ability to obtain additional financing to fund future working capital, capital expenditures, acquisitions and other general corporate requirements; |
| ● | We may be required to use a substantial portion of our cash flow from operations for the payment of interest on our debt which would reduce our ability to use our cash flow to fund working capital, capital expenditures, acquisitions and general corporate requirements; |
| ● | While most of our debt is covered under swap agreements, we do have some exposure to risks inherent in interest rate fluctuations because some of our borrowings are at variable rates of interest, which could result in a higher interest expense in the event of increases in interest rates; |
| ● | Our current debt could limit our flexibility in planning for, or reacting to, changes in our business, and the industry in which we operate; |
| ● | Our banks could demand mandatory prepayment or delivery of additional security in the event that the fair market value of the vessels falls below limits specified in the loan agreement; and |
| ● | We could be at a competitive disadvantage compared with our competitors that have less indebtedness. |
Our credit facilities require us to maintain specified financial ratios and satisfy financial covenants.
Events beyond our control, including changes in the economic and business conditions in the markets in which we operate, may affect our ability to comply with these covenants. We cannot assure you that we will meet these ratios or satisfy these covenants or that our lenders will waive any failure to do so. A breach of any of the covenants or our inability to maintain the required financial ratios under our credit facilities would result in a default. If a default occurs under any of our credit facilities, the lender could elect to declare that debt, together with accrued interest and other fees, to be immediately due and payable and proceed against the collateral securing that debt, which constitutes all or substantially all of our assets. Moreover, any acceleration of the debt outstanding under the credit facilities or other agreements upon a declaration of default could result in a default under our other credit facilities.
If we default under any of our loan agreements, we could forfeit our rights in our vessels and their charters.
We have pledged all of our vessels as security to the lenders under our loan agreements. Default under any of these loan agreements, if not waived or modified, would permit the lenders to foreclose on the mortgages over the vessels, and we could lose our rights in the vessels and their charters.
Our credit facilities currently impose, and it is possible that any additional debt incurred could impose, significant operating and financial restrictions on us.
The indenture governing our asset-based revolving credit facility debt does, and future agreements may, contain covenants that could limit our ability to finance our future operations or capital needs, make acquisitions or pursue available business opportunities.
Our credit facilities restrict, among other things, our ability to:
| · | incur additional indebtedness or issue certain capital or preferred stock; |
| · | pay dividends on, redeem or repurchase, our shares or make other restricted payments and investments; |
| · | transfer or sell assets; |
| · | agree to certain restrictions on the ability of restricted subsidiaries to make payments to us; |
| · | amalgamate, merge, consolidate or sell all or substantially all of our properties and assets; |
| · | engage in certain transactions with affiliates; and |
| · | designate unrestricted subsidiaries. |
These provisions impose significant operating and financial restrictions on us, and it is possible that
additional debt may include further restrictions upon us.
We will require a significant amount of cash, and our ability to generate sufficient cash depends upon many factors, some of which are beyond our control.
Our ability to make payments on and refinance our indebtedness and to fund working capital needs and planned capital expenditures depends on our ability to generate adequate cash flow in the future. To some extent, this is subject to general economic, financial, competitive, and regulatory factors and other factors that are beyond our control. For example, we need to drydock vessels and make constant upgrades to vessels which could increase our working capital needs. We cannot give assurance that our business will continue to generate cash flow from operations at current levels or that our cash needs will not increase. If we are unable to generate sufficient cash flow from operations in the future to service our indebtedness and meet our other needs, we may have to refinance all or a portion of our existing indebtedness, obtain additional financing, reduce expenditures that we deem necessary to do business. We cannot give assurance that any refinancing of this kind would be possible or that any additional financing could be obtained or could be obtained on commercially reasonable terms. The inability to obtain additional financing could have a material adverse effect on our financial condition and on our ability to meet our financing obligations.
The market values of vessels under construction could decline, which could cause us to fund more of the purchase from working capital.
We rely on The Royal Bank of Scotland Credit Facility, which we refer to as the RBS Credit Facility, to finance a large portion of the scheduled payments as they come due under the shipbuilding contracts. Any decline in the market value of vessels under construction could cause us to fund a larger portion of each installment due under the shipbuilding contract. In the absence of other available funds to pay the higher portion of the installments due would cause us to be in default under the shipbuilding contract, which would cause a default in the RBS Credit Facility.
A default in our credit facilities would result in possible foreclosure of vessels securing such credit facilities.
Any default under our credit facilities would result in a default of all our credit facilities. In such a case our rights to our vessels, including our rights to vessels under the shipbuilding contracts, would be subject to foreclosure by the applicable creditor.
A payment default under the shipbuilding contract would give the shipyard the right to terminate the contract.
A payment default under a shipbuilding contract would give the shipyard the right to terminate the contract without any further obligation to finish construction and we would lose the right to all payments made for the undelivered vessel. It may also give the shipyard rights against us for having failed to make the required payments.
Any default under our credit facilities would result in a default of the RBS Credit Facility and a default under the associated shipbuilding contract. In such a case our rights to the vessels under the related shipbuilding contracts would be subject to foreclosure by the applicable creditor and the holders of our indebtedness would demand immediate payment in full. A payment default under a shipbuilding contract would give the shipyard the right to terminate the contract without any further obligation to finish construction and may give it rights against us for having failed to make the required payments.
Variable rate indebtedness subjects us to interest rate risk, which could cause our debt service obligations to increase significantly.
Certain portions of some of our borrowings, primarily our RBS loan, are, and are expected to continue to be, at variable rates of interest and expose us to interest rate risk. Most of our loans are hedged. However, if interest rates increase, our debt service obligations on the variable rate indebtedness would increase even though the amount borrowed remains the same and our net income would decrease. Pursuant to the indenture governing certain loans, we were required to enter into interest rate swaps, involving the exchange of floating for fixed rate interest payments, or other forms of derivative transactions, to reduce interest rate volatility.
The international nature of our operations may make the outcome of any bankruptcy proceedings difficult to predict.
We are incorporated under the laws of the Republic of Ireland and most of our subsidiaries are incorporated under the laws of the Republic of the Marshall Islands. Our operations are conducted in countries around the world. Consequently, in the event of any bankruptcy, insolvency or similar proceedings involving us or one of our subsidiaries, bankruptcy laws other than those of the United States could apply. We have limited operations in the United States. If we become a debtor under the United States bankruptcy laws, bankruptcy courts in the United States may seek to assert jurisdiction over all of our assets, wherever located, including property situated in other countries. There can be no assurance, however, that we would become a debtor in the United States or that a United States bankruptcy court would be entitled to, or accept, jurisdiction over such bankruptcy case or that courts in other countries that have jurisdiction over us and our operations would recognize a United States bankruptcy court’s jurisdiction if any other bankruptcy court would determine it had jurisdiction.
Risks Factors Relating to Our Corporate Structure
International, the issuer of our ordinary shares, is a holding company and depends on the ability of its subsidiaries to distribute funds to it in order to meet its financial obligations.
International, the issuer of our ordinary shares, is a holding company with no significant assets other than the shares of capital stock of its subsidiaries that conduct all of its operations and own all of its vessels. International derives all of its cash flow from dividends and other payments from its subsidiaries, which in turn derive all of their cash flows from payments from their direct and indirect operations.
We have relied, and will continue to rely, to a significant degree upon affiliated service companies.
We have relied upon and will continue to rely upon TBS Commercial Group and Beacon Holdings Ltd., both affiliated service companies, for agency services that are critical to our business. These companies employ sales and customer service professionals who meet with shippers and consignees to anticipate the needs and address the concerns of our customers. Our business, results of operations and liquidity may be materially adversely affected if we lose our relationship with TBS Commercial Group or Beacon Holdings Ltd., or they become unable to perform these services or their key employees leave their respective company.
TBS Commercial Group is a privately held company, and there is little or no publicly available information about it.
The ability of TBS Commercial Group to continue providing critical services for our benefit will depend in part on its own financial strength. Circumstances beyond our control could impair its financial strength and, because TBS Commercial Group is privately held, it is unlikely that information about its financial strength would become public. As a result, an investor in our Class A ordinary shares might have little advance warning of problems affecting TBS Commercial Group, even though these problems could have a material adverse effect on us.
The interests of our controlling shareholders could be adverse to your interests as a public shareholder.
Our executive officers who control TBS Commercial Group and Beacon Holdings Ltd. could use their positions with us and in TBS Commercial Group or Beacon Holdings Ltd. to shift revenues and operating income from us to TBS Commercial Group or Beacon Holdings Ltd., for their individual benefit and contrary to the interests of our public shareholders. For example, these individuals could cause us to pay above-market fees to TBS Commercial Group or Beacon Holdings Ltd. or to permit TBS Commercial Group or Beacon Holdings Ltd. to take advantage of corporate opportunities. We cannot assure you that these potential conflicts of interest will be handled in the best interests of our public shareholders or holders of our debt.
Risk Factors Related to Our Ordinary Shares and Our Jurisdiction of Incorporation
In December 2009, shareholders voted in favor of a reorganization proposal pursuant to which TBS International Ltd. common shares would be cancelled and holders of such shares would receive ordinary shares of TBS International plc on a one-to-one basis. The reorganization transaction was completed on January 6, 2010, at which time TBS International plc, an Irish company, replaced TBS International Ltd. as the ultimate parent company for our operations. Shares of TBS International plc began trading on the NASDAQ Global Select Market on January 7, 2010 under the symbol "TBSI," the same symbol under which TBS International Ltd. shares were previously traded. Our memorandum and articles of association contains provisions that could make it more difficult for a third party to acquire us without the consent of our Board of Directors. These provisions will provide for our Board of Directors to determine the powers, preferences and rights of our preference shares and to issue the preference shares without shareholder approval.
We have anti-takeover provisions in our memorandum and articles of association that may discourage a change of control.
Our articles of association contain provisions that could make it more difficult for a third party to acquire us without the consent of our Board of Directors. Specifically, our Board of Directors has the power to determine the powers, preferences and rights of our preference shares and to issue the preference shares without shareholder approval. Irish law does not expressly prohibit companies from issuing share purchase rights or adopting a shareholder rights plan as an anti-takeover measure. While a plan would, however be subject to the Irish Takeover Rules (including the prohibition on our Board of Directors from taking action which might frustrate an offer where an approach has been received or is believed to be imminent), these powers of our Board of Directors to issue shares outlined above could make it more difficult for a third party to acquire us, even if the third party's offer may be considered beneficial by many shareholders. As a result, shareholders may be limited in their ability to obtain a premium for their shares.
It may be difficult for shareholders to enforce judgments against us or our directors and executive officers.
It may not be possible to enforce court judgments obtained in the United States against us in Ireland based on the civil liability provisions of the U.S. federal or state securities laws. One of our directors is not a resident of the United States, and a substantial portion of our assets are located outside the United States. As a result, it may be difficult for investors to effect service of process on those persons in the United States or to enforce in the United States judgments obtained in U.S. courts against us or those persons based on the civil liability provisions of the U.S. securities laws. In addition, there is some uncertainty as to whether the courts of Ireland would recognize or enforce judgments of U.S. courts obtained against us or our directors or officers based on the civil liabilities provisions of the U.S. federal or state securities laws or hear actions against us or those persons based on those laws. We have been advised that the United States currently does not have a treaty with Ireland providing for the reciprocal recognition and enforcement of judgments in civil and commercial matters. Therefore, a final judgment for the payment of money rendered by any U.S. federal or state court based on civil liability, whether or not based solely on U.S. federal or state securities laws, would not automatically be enforceable in Ireland.
Irish law differs from the laws in effect in the United States.
As an Irish company, we are governed by the Irish Companies Act, which differs in some material respects from laws generally applicable to U.S. corporations and shareholders. These differences include, among others, differences relating to interested director and officer transactions and shareholder lawsuits. In addition, the duties of directors and officers of an Irish company generally are owed to the company only. Shareholders of Irish companies generally do not have a personal right of action against a company’s directors or officers and may exercise such rights of action on behalf of the company only in limited circumstances. Accordingly, holders of our ordinary shares may have more difficulty protecting their interests than would holders of securities of a corporation incorporated in a jurisdiction of the United States.
A future transfer of your ordinary shares may be subject to Irish stamp duty.
Transfers by shareholders who hold their ordinary shares beneficially through banks, brokers, trustees, custodians or other nominees, which in turn hold those shares through the Depository Trust and Clearing Corporation, or DTC, will generally not be subject to Irish stamp duty where such transfers are to holders who also hold through DTC. If you hold your ordinary shares directly rather than beneficially, any purchase of your shares will be subject to Irish stamp duty. Irish stamp duty is currently levied at the rate of 1% of the price paid or the market value of the ordinary shares acquired, if higher. Any transfer of ordinary shares which is subject to Irish stamp duty will not be registered in the name of the buyer unless an instrument of transfer is executed by or on behalf of the seller, is duly stamped and is provided to our transfer agent. The potential for stamp duty could adversely affect the price of ordinary shares.
Dividends you receive may be subject to Irish dividend withholding tax.
In certain circumstances, as an Irish tax resident company, we may be required to deduct Irish dividend withholding tax (currently at the rate of 20%) from dividends paid to our shareholders. The majority of shareholders will generally not be subject to Irish withholding tax provided that, in each case, they complete certain tax forms.
Legislative or regulatory action could materially and adversely affect us.
Our tax position could be adversely impacted by changes in tax laws, tax treaties or tax regulations or the interpretation or enforcement thereof by any tax authority. For example, legislative proposals have been introduced in the U.S. Congress which, if enacted, could override tax treaties upon which we expect to rely, or could change the circumstances under which we would be treated as a U.S. person for U.S. federal income tax purposes, each of which could materially and adversely affect our effective tax rate and require us to take further action, at potentially significant expense, to seek to preserve our effective tax rate. We cannot predict the outcome of any specific legislative proposals. However, if proposals were enacted limiting our ability as an Irish company to take advantage of the tax treaties between Ireland and the United States, we could be subjected to increased taxation and/or potentially significant expense. In addition, any future amendments to the current income tax treaties between Ireland and other jurisdictions (including the United States) could subject us to increased taxation and/or potentially significant expense. Also, various U.S. federal and state legislative proposals have been introduced and/or enacted in recent years that deny government contracts to certain U.S. companies that reincorporate or have reincorporated outside the United States. While the Company was not a U.S. company that moved outside the United States, our move to Ireland may not eliminate therisk that these contract bans and other legislative proposals could be enacted in a way to affect us.
As an Irish company, we are required to comply with numerous Irish and European Union legal requirements. Compliance with the laws and regulations of Ireland and the European Union may have a material and adverse effect on the Company’s financial condition and results of operations.
None.
Our fleet is described in Item 1. Business - Fleet Overview. Most of our vessels are mortgaged to secure our credit facilities.
At December 31, 2009 we leased four properties, which are used by TBSI’s service company subsidiaries TBS Shipping Services and its subsidaries and Roymar for the administration of their operations. Our principal office, which is leased through our subsidiary TBS Shipping Services, is located in Yonkers, New York and is approximately 15,000 square feet. The office space is leased from our chairman and chief executive officer. The lease expires on December 31, 2010, subject to five one-year renewal options. The lease provides for monthly rent of $20,000, plus operating expenses including real estate taxes. We also leased 7,232 square feet of office space used by our TBS Houston office that is located in Houston Texas. The lease, which runs from October 1, 2009 to September 30, 2014, provides for monthly rent of $8,054 through September 30, 2010, after which monthly rent increases to $8,255 through October 2011, $8,463 through October 2012, $8,677 through October 2013 and $8,898 through October 2014. We also leases a 40,000 square feet warehouse located in Houston, Texas. The lease runs from May 1, 2009 to June 30, 2012 at a monthly rent of $22,000 through June 30, 2010. The monthly rent increases to $22,400 through June 2011 and $22,800 through June 2012.
We lease approximately 12,520 square feet of office space located in Scarsdale, New York at a monthly rent of approximately $27,000 plus an additional charge for real estate tax escalations. The lease expires in November 2010.
We had leased undeveloped land in the Calhoun County Navigation District, Port Comfort, Texas. The lease had a term of ten years expiring December 31, 2016, and provided for monthly rent of $6,000. In May 2008 the lease was cancelled with no lease cancellation costs.
We believe that our facilities are generally adequate for current and anticipated future use.
We are periodically a defendant in cases involving personal injury, property damage claims and other matters that arise in the normal course of business. While any pending or threatened litigation has an element of uncertainty, we believe that the legal proceedings pending against us, individually or in the aggregate, will not materially adversely affect our consolidated financial position, results of operations or cash flows.
PART II
Market Information
During 2009, the Class A common shares of TBS International Ltd. traded on the NASDAQ Global Select Market under the symbol "TBSI". Our Class A ordinary shares began to trade on the NASDAQ Global Select Market under the same symbol on January 7, 2010. Our Class B ordinary shares are not publicly traded.
The following table sets forth for the periods indicated, since our initial public offering, the high and low prices for the Class A common shares of TBS International Ltd. as reported on the NASDAQ Global Select Market:
| Year Ended December 31, 2009 | HIGH | | LOW | |
| Fourth Quarter | | $ | 9.97 | | | $ | 7.17 | |
| Third Quarter | | $ | 9.78 | | | $ | 6.15 | |
| Second Quarter | | $ | 11.90 | | | $ | 6.35 | |
| First Quarter | | $ | 13.95 | | | $ | 5.04 | |
| | | | | | | | | |
| Year Ended December 31, 2008 | HIGH | | LOW | |
| Fourth Quarter | | $ | 13.23 | | | $ | 3.62 | |
| Third Quarter | | $ | 38.49 | | | $ | 12.73 | |
| Second Quarter | | $ | 59.11 | | | $ | 31.89 | |
| First Quarter | | $ | 39.82 | | | $ | 20.19 | |
| | Cumulative Return Comparison | | | |
| | June 24, 2005 | | December 31, 2005 | | December 31, 2006 | | December 31, 2007 | | December 31, 2008 | | December 31, 2009 | |
| | | | | | | | | | | | | |
| TBS International Limited ("TBSI") | 100.00 | | 65.42 | | 86.11 | | 325.71 | | 98.82 | | 72.41 | |
| NASDAQ Transportation Index | 100.00 | | 117.70 | | 124.67 | | 129.06 | | 90.98 | | 94.20 | |
| NASDAQ Composite Index | 100.00 | | 107.21 | | 117.42 | | 128.94 | | 76.67 | | 110.32 | |
Holders
As of March 11, 2010, there were 8,999 holders of record of our Class A ordinary shares and 12 holders of record of our Class B ordinary shares.
Dividend and Dividend Policy
As of December 31, 2009, we have never declared or paid dividends on our ordinary shares. Provisions of our debt instruments and related loan agreements for our syndicated credit facilities allow the subsidiaries borrowing under the credit facilities to pay dividends to us but restrict us from declaring or making dividends or other distributions that would result in a default or the credit facility or exceed 50% or our prior year’s consolidated net income. These restrictions may restrict our ability to pay dividends on our ordinary shares. Future dividends, if any, on our ordinary shares will be at the discretion of our Board of Directors and will depend on, among other things, our results of operations, cash requirements and surplus, financial condition, contractual restrictions and other factors that our Board of Directors may deem relevant, as well as our ability to pay dividends in compliance with Irish law.
Under Irish law, TBS International plc must have “distributable reserves” in its unconsolidated balance sheet prepared in accordance with the Irish Companies Acts to enable it to pay cash dividends buy back shares in the future. Our shareholders passed a resolution that created “distributable reserves” in accordance with Irish law.
Distributions made by us will generally be subject to dividend withholding tax at Ireland’s standard rate of income tax (currently 20 percent). For dividend withholding tax purposes, a dividend includes any distribution made by TBS International plc to its shareholders, including cash dividends, non-cash dividends and additional stock or units taken in lieu of a cash dividend. TBS International plc is responsible for withholding dividend withholding tax and forwarding the relevant payment to the Irish Revenue Commissioners.
U.S. Holders
Dividends paid to U.S. residents will not be subject to Irish dividend withholding tax provided that:
| · | in the case of shareholders who hold their TBS International plc shares beneficially through banks, brokers, trustees, custodians or other nominees, which in turn hold those shares through DTC, the address of the beneficial owner in the records of his or her broker is in the United States and this information is provided by the broker to the qualifying intermediary of TBS International plc; or |
| · | in the case of other shareholders, the shareholder has provided to the transfer agent of TBS International plc a valid W-9 showing either a U.S. address or a valid taxpayer identification number. |
Irish income tax may also arise with respect to dividends paid on the ordinary shares of TBS International plc. A U.S. resident who meets one of the exemptions from dividend withholding tax described above and who does not hold shares in the Company through a branch or agency in Ireland through which a trade is carried on generally will not have any Irish income tax liability on a dividend paid by TBS International plc. In addition, if a U.S. shareholder is subject to the dividend withholding tax, the withholding payment discharges any Irish income tax liability, provided the shareholder furnishes to the Irish Revenue authorities a statement of the dividend withholding tax imposed.
While the U.S./Ireland Double Tax Treaty contains provisions regarding withholding tax, due to the wide scope of the exemptions from dividend withholding tax available under Irish domestic law, in general it would be unnecessary for a U.S. resident shareholder to rely on the treaty provisions.
Relevant territory holders
Dividends paid to “relevant territory” residents will not be subject to Irish DWT provided that the holders have filed the relevant Irish DWT exemption forms with their broker, for onward transmission to the company, (in the case of shares held beneficially through DTC) or with the company or its transfer agent (in the case of shares held directly).
Equity Compensation Plans
Information regarding our equity compensation plans as of December 31, 2009 is disclosed in "Item 12."Security Ownership of Certain Beneficial Owners and Management and Related Stockholder Matters" and in "Note 15 — Stock Plans" to our consolidated financial statements.
Irish Restrictions on Import and Export of Capital
The Financial Transfers Act 1992 provides that the Irish Minister of Finance can make provision for the restriction of financial transfers between Ireland and other countries. For the purposes of this Act, “financial transfers” include all transfers which would be movements of capital or payments within the meaning of the treaties governing the European Communities if they had been made between Member States of the Communities. This Act has been used by the Minister of Finance to implement European Council Directives, which provide for the restriction of financial transfers to certain countries, organizations and people including Belarus, Burma/Myanmar, Democratic People’s Republic of Korea, Democratic Republic of Congo, Iran, Iraq, Ivory Coast, Lebanon, Liberia, Republic of Serbia, Slobodan Milosevic and associated persons, Somalia, Sudan, Osama Bin Laden, Al-Qaeda and the Taliban of Afghanistan, Uzbekistan and Zimbabwe.
Irish Taxation
TBS International plc, the successor issuer to TBS International Limited, is incorporated in Ireland. TBS International plc as a separate entity is subject to tax in Ireland on its worldwide income and gains at 25% with the exception of dividend income received from its subsidiaries that are sourced from active trading profits, which is subject to tax in Ireland at 12.5%. TBS International plc should be considered an investment company for Irish tax purposes and should be allowed to deduct expenses of management against its income and gains. However, as it is not anticipated that TBS International plc will receive any significant dividends from its subsidiaries in the foreseeable future it is not expected that TBS International plc will have any material income subject to Irish taxation.
The selected historical consolidated financial data presented below should be read in conjunction with the consolidated financial statements and notes thereto and Item 7. Management's Discussion and Analysis of Financial Condition and Results of Operations, included in this Report.
| | | | | Year Ended December 31, | |
| | | | | 2009 | | 2008 | | 2007 | | 2006 | | 2005 | |
| | | | | (In thousands, except for share and per share amounts) | |
| Revenue | | | | | | | | | | | |
| | Voyage revenue | | $ | 247,980 | | $ | 518,907 | | $ | 261,509 | | $ | 187,147 | | $ | 173,881 | |
| | Time charter revenue | | | 51,201 | | | 83,883 | | | 88,365 | | | 63,114 | | | 71,456 | |
| | Logistics revenue (1) | | | 2,689 | | | 7,000 | | | 668 | | | | | | | |
| | Other revenue | | | 646 | | | 1,843 | | | 2,379 | | | 1,460 | | | 979 | |
| Revenue | | | 302,516 | | | 611,633 | | | 352,921 | | | 251,721 | | | 246,316 | |
| | | | | | | | | | | | | | | | | | | |
| Operating expenses | | | | | | | | | | | | | | | | |
| | Voyage | | | 113,084 | | | 172,929 | | | 89,241 | | | 81,389 | | | 73,576 | |
| | Logistics (1) | | | 2,193 | | | 5,717 | | | 557 | | | | | | | |
| | Vessel | | | 104,046 | | | 110,354 | | | 85,958 | | | 63,205 | | | 68,711 | |
| | Depreciation of vessels | | | | | | | | | | | | | | | | |
| | | and other fixed assets | | | 95,870 | | | 73,479 | | | 36,022 | | | 29,867 | | | 19,537 | |
| | Management fees | | | | | | | | | | | | | | | 2,624 | |
| | General and administrative | | | 37,265 | | | 39,879 | | | 38,703 | | | 27,256 | | | 17,618 | |
| | Loss (gain) from sale of vessels (2) | | | | | | | | | 814 | | | (2,180 | ) | | | |
| | Operating expenses | | | 352,458 | | | 402,358 | | | 251,295 | | | 199,537 | | | 182,066 | |
| (Loss) income from operations | | | (49,942 | ) | | 209,275 | | | 101,626 | | | 52,184 | | | 64,250 | |
| | | | | | | | | | | | | | | | | | | |
| Other (expenses) and income | | | | | | | | | | | | | | | | |
| | Interest expense | | | (17,119 | ) | | (17,228 | ) | | (10,394 | ) | | (11,577 | ) | | (9,346 | ) |
| | Interest and other income | | | 21 | | | 2,048 | | | 983 | | | 1,810 | | | 752 | |
| | (Loss) on early extinguishment of debt (3) | | | | | | (2,318 | ) | | | | | (3,357 | ) | | | |
| | Gain on sale and insurance recovery of vessel (4) | | | | | | | | | 6,034 | | | | | | | |
| | | Total other (expenses) and income | | | (17,098 | ) | | (17,498 | ) | | (3,377 | ) | | (13,124 | ) | | (8,594 | ) |
| | | | | | | | | | | | | | | | | | | |
| Net (los) income | | | (67,040 | ) | | 191,777 | | | 98,249 | | | 39,060 | | | 55,656 | |
| | | | | | | | | | | | | | | | | | | |
| Amount allocated to participating preferred shareholders | | | | | | | | | | | | | | | (5,706 | ) |
| Net (loss) income available for ordinary shareholders | | $ | (67,040 | ) | $ | 191,777 | | $ | 98,249 | | $ | 39,060 | | $ | 49,950 | |
| | | | | | | | | | | | | | | | | | | |
| Net (loss) income per ordinary share | | | | | | | | | | | | | | | | |
| | Basic (5) (6) | | $ | (2.25 | ) | $ | 6.53 | | $ | 3.49 | | $ | 1.39 | | $ | 2.28 | |
| | Diluted (5) (6) | | $ | (2.25 | ) | $ | 6.53 | | $ | 3.49 | | $ | 1.39 | | $ | 2.04 | |
| Weighted average ordinary shares outstanding | | | | | | | | | | | | | | | | |
| | Basic (5) (6) | | | 29,843,566 | | | 29,263,292 | | | 28,029,340 | | | 27,998,843 | | | 21,870,160 | |
| | Diluted (5) (6) | | | 29,843,566 | | | 29,263,292 | | | 28,029,340 | | | 27,998,843 | | | 24,368,263 | |
| | | December 31, | |
| | | 2009 | | 2008 | | 2007 | | 2006 | | 2005 | |
| | | (In thousands) | |
| Balance Sheet Data: | | | | | | | | | | | |
| Cash and cash equivalents | | $ | 51,040 | | $ | 131,150 | | $ | 30,498 | | $ | 12,007 | | $ | 27,158 | |
| Working capital | | | (285,823 | ) | | 104,311 | | | 1,744 | | | (3,816 | ) | | (866 | ) |
| Total assets | | | 953,588 | | | 1,041,685 | | | 559,113 | | | 403,091 | | | 344,671 | |
| Total Debt | | | 351,247 | | | 383,074 | | | 180,166 | | | 125,804 | | | 105,737 | |
| Obligations under capital leases, including | | | | | | | | | | | | | | | | |
| current portion | | | | | | | | | | | | 21,355 | | | 24,703 | |
| Total shareholders' equity | | | 537,728 | | | 598,296 | | | 319,563 | | | 223,604 | | | 184,207 | |
| | | | | | | | | | | | | | | | | |
| | | Year Ended December 31, | |
| | | 2009 | | 2008 | | 2007 | | 2006 | | 2005 | |
| Other Operating Data: | | | | | | | | | | | |
| Controlled vessels (at end of period) (7) | | | 48 | | | 47 | | | 36 | | | 34 | | | 31 | |
| Chartered vessels (at end of period) (8) | | | | | | | | | 1 | | | 1 | | | 6 | |
| Voyage Days (9) | | | 11,470 | | | 14,904 | | | 11,868 | | | 12,119 | | | 10,885 | |
| Vessel days (10) | | | 17,567 | | | 16,337 | | | 13,236 | | | 12,701 | | | 11,264 | |
| Tons of cargo shipped (in thousands) | | | 8,788 | | | 9,315 | | | 6,621 | | | 4,368 | | | 3,170 | |
| Revenue per ton (11) | | $ | 28.22 | | $ | 55.70 | | $ | 39.49 | | $ | 42.85 | | | | |
| Tons of cargo shipped, excluding | | | | | | | | | | | | | | | | |
| aggregates (in thousands) (12) | | | 4,727 | | | 5,109 | | | 3,447 | | | 3,227 | | | 3,092 | |
| Revenue per ton, excluding | | | | | | | | | | | | | | | | |
| aggregates (11) (12) | | $ | 45.36 | | $ | 88.08 | | $ | 68.79 | | $ | 54.67 | | | | |
| Chartered -out days | | | 4,733 | | | 3,004 | | | 3,659 | | | 4,301 | | | 4,257 | |
| Chartered -out rate per day | | $ | 10,818 | | $ | 27,924 | | $ | 24,150 | | $ | 14,674 | | $ | 16,785 | |
| (1) | Represents revenue and related costs for cargo and transportation management services as part of our Five Star Service |
| (2) | Represents a 2007 loss of $0.8 million on the sale of the Maya Princess and a 2006 gain of $2.2 million on the sale of the Dakota Belle. |
| (3) | The 2008 loss on extinguishment of debt represents the write off of unamortized deferred finance costs in connection with the March 2008 refinancing of the Bank of America syndicated credit facility. The 2006 loss on early extinguishment of debt represents the write-off of unamortized debt finance costs of $1.3 million and the payment of loan prepayment fees of $2.1 million when we repaid most of our then existing credit facilities in July 2006 with our $140.0 million syndicated credit facility. |
| (4) | We recognized a gain on the sale and insurance recovery of the Huron Maiden. The vessel was severely damaged in a grounding accident on an uncharted rock while on passage near Indonesia in March 2007. The vessel was declared a constructive total loss, and we received a net insurance recovery of $8.0 million, after a scrap value credit of $2.0 million. We then sold the vessel for scrap for $2.8 million. After expenses in connection with the accident and sale of the vessel of approximately $1.2 million, we realized a net gain on the casualty and sale of the vessel of approximately $6.0 million. |
| (5) | During the year ended December 31, 2005, the convertible preference shares would have added 2,498,103 ordinary shares on a weighted average basis to diluted shares outstanding. These shares were not included in the diluted earnings per share calculation because the effect would have been anti-dilutive. |
| (6) | In 2009, we adopted the applicable provisions of ASC Topic 260 – Earnings per Share and computed earnings per ordinary share using the two-class method for participating securities and nonvested share-based payment awards that contain non-forfeitable rights to dividends. The adoption of the provisions did not have a material impact on the Company’s previously issued consolidated financial statements; however, for comparability purposes, we recalculated and restated our previously reported earnings per share. Basic earnings per ordinary share for the years ended December 31, 2008, 2007 and 2006 decreased $0.02, $0.02 and $0.01, respectively, from the amounts previously disclosed in our prior filings and there was no change for the year ended December 31, 2005. Diluted earnings per ordinary share for the years ended December 31, 2008, 2007 and 2005 decreased $0.01 from the amounts previously disclosed in our prior filings and there was no change for the year ended December 31, 2006. |
| (7) | Controlled vessels are vessels that we own or charter-in with an option to purchase. As of December 31, 2008, two vessels in our controlled fleet were chartered-in with an option to purchase. |
| (8) | Represents both vessels that we charter-in under short-term charters (less than one year at the start of the charter) and charter-in of vessels under long-term charters without an option to purchase. |
| (9) | Represents the number of days controlled and time-chartered vessels were operated by us, excluding off-hire days. |
| (10) | Represents the number of days that relate to vessel expense for controlled and time-chartered vessels. Vessel expense relating to controlled vessels is based on a 365-day year. Vessel expense relating to chartered-in vessels is based on the actual number of days we operated the vessel, excluding off-hire days. |
| (11) | Revenue tons is a measurement on which shipments are freighted. Cargoes are rated as weight (based on metric tons) or measure (based on cubic meters), whichever produces the higher revenue will be considered the revenue ton. |
| (12) | Aggregates represent high-volume, low-freighted cargo. Including aggregates, therefore, can overstate the amount of tons that we carry on a regular basis and reduce our revenue per ton. We regularly carried aggregates in all years represented in the table above except 2005 when we temporarily suspended the transport of aggregates. We believe that the exclusion of aggregates better reflects our cargo shipped and revenue per ton data for our principal services. |
General
The following is a discussion of our financial condition at December 31, 2009 and 2008 and our results of operations comparing the years ended December 31, 2009 and 2008 and years ended December 31, 2008 and 2007. You should read this section in conjunction with our consolidated financial statements, including the related notes to those financial statements included elsewhere in this Annual Report.
Overview
We are an ocean transportation services company that offers worldwide shipping solutions to a diverse client base of industrial shippers. We offer liner, parcel and bulk services and vessel chartering supported by a fleet of multipurpose tweendeckers and handysize and handymax bulk carriers. In addition to providing frequent, regularly scheduled voyages within our shipping network, we offer services, such as cargo scheduling, loading and discharge, that offer a fully integrated shipping solution to our customer. This distinguishes us from traditional dry cargo shipping companies.
We have a strong position in various trade lanes in the Far East, South America, North America, the Caribbean, the Middle East and Africa. We offer our services globally in more than 20 countries to over 300 customers through a network of affiliated service companies.
Our financial results are largely driven by the following factors:
| · | macroeconomic conditions in the geographic regions where we operate; |
| · | general economic conditions in the industries in which our customers operate; |
| · | the availability of liquidity and credit to fund our suppliers’ and customers’ businesses; |
| · | changes in our freight and sub-time charter rates - rates we charge for vessels we charter out - and, in periods when our voyage and vessel expenses increase, our ability to raise our rates to pass such cost increases through to our customers; |
| · | the extent to which we are able to efficiently utilize our controlled fleet and optimize its capacity; and |
| · | the extent to which we can control our fixed and variable costs, including those for port charges, stevedore and other cargo-related expenses, fuel, and commission expenses. |
In 2009 the global financial crisis reduced demand for shipping services and caused a significant downturn in spot freight and time charter rates. The crisis has adversely affected our revenues, the market values of our vessels and our ability to maintain financial ratios as required by our credit facilities. While there was slight improvement in the global economy in December 2009, the effects of the crisis are continuing and we cannot predict with any degree of certainty how global economic conditions will affect the shipping industry and us.
We continue to take measures to manage our business during the recovery. These measures include considering issuing equity to our executives and employees in lieu of cash compensation, reducing 2010 salary increases, continuing our cost cutting program, negotiating loan modifications, reducing capital expenditures and continuing to scale back our accelerated steel renewal and reinforcement program.
Going Concern
One of the significant effects of the current global financial downturn has been a reduction in vessel values, which directly affected our ability to comply with certain financial covenants in our credit facilities. In 2009, we negotiated waivers to these covenants, including modifications through April 1, 2010 to the minimum consolidated fixed charge coverage ratio and the maximum consolidated leverage ratio requirements. We currently are in compliance with these modified minimum consolidated fixed charge coverage ratio and maximum consolidated leverage ratio requirements. Without these modifications, we would have been in violation of the original minimum consolidated fixed charge coverage ratio and the maximum consolidated leverage ratio requirements at December 31, 2009. Based on current internal projections, we anticipate that we will not meet the modified additional covenant requirements during the next 12 months.
We are in the process of discussing permanent modifications to our credit facilities with our lenders. Additionally, we are seeking alternative financing sources to repay our credit facilities. We cannot assure you that we will be able to obtain permanent covenant modifications or other financing. The failure to obtain permanent covenant modifications or other financing would have a material adverse effect on our business, operations, financial condition and liquidity and would raise substantial doubt about our ability to continue as a going concern.
Generally accepted accounting principles require that long-term debt be classified as a current liability when either a covenant violation that gives the lender the right to call the debt has occurred at the balance sheet date or such a covenant violation would have occurred absent a waiver of the covenant and, in either case, it is probable that the covenant violation will not be cured within the next 12 months. Accordingly, we have classified our long term debt as a current liability in our consolidated balance sheet at December 31, 2009. The financial statements do not include any adjustments that might be necessary if we are unable to continue as a going concern.
New Vessel Construction
The first of six new build vessels was delivered in 2009, three vessels are expected to be delivered in 2010 and the remaining two vessels are expected to be delivered in 2011.
Impairment
Our fleet now numbers 48 vessels. We perform impairment analyses of long-lived assets when certain triggering events occur such as significant decreases in the assets market value, [significant] changes in the assets’ physical condition, and [significant] changes in the operating or cash flow losses associated with the use of the long-lived assets, [in each case?] combined with a history of operating or cash flow losses. Impairment is recognized when the estimate of undiscounted future cash flows expected to be generated by the asset is less than its carrying amount. Measurement of the impairment loss is calculated based upon comparison of the fair value to the carrying value of the asset. Historically, both freight rates and vessel values tend to be volatile. The carrying value of our fleet may not represent their fair market value at any point in time since the market prices of second-hand vessels tend to fluctuate. Our impairment calculations contain uncertainties because they require management to make assumptions about future cash flows. These assumptions are based on historical trends as well as future expectations. Although management believes that the assumptions used to evaluate potential impairment are reasonable and appropriate, such assumptions are highly subjective. Our analysis showed that there was no impairment of long-lived assets at December 31, 2009. We continue to monitor the shipping environment and update our impairment analyses. See "Summary of Critical Accounting Policies".
As of May 31, 2009, we performed our annual impairment analysis of goodwill, which indicated that there was no impairment. Subsequent to our analysis and as of December 31, 2009, no events occurred that indicated that there was an impairment of goodwill during the year 2009.
Drydocking
During 2007 and 2008, we engaged in an accelerated streel renewal and replacement program for our drydocked vessels. Consequently, in 2009, we realized savings in steel renewal and replacement drydocking costs for some vessels, and we expect to realize additional savings in 2010. Under the accelerated program, steel renewal and replacement were made on the basis of the physical condition of the vessel, including renewals and replacements that were, at that time, believed to be required in the upcoming five to ten years.
Vessels must be drydocked twice during a five-year cycle. Our controlled fleet of 48 vessels at December 31, 2009, would require approximately 96 drydockings over five years for an average of 19 vessels per year. The first drydocking of a newly constructed vessel, which would be a special survey of the vessel, is typically done five years after delivery of the vessel from the shipyard.
During 2009, 23 vessels, requiring approximately 2,400 metric tons of steel, were in drydock for 664 days. A summary by quarter is as follows:
| | Actual number of vessels entering drydock during quarter | | Actual number of drydock days during quarter | | Actual metric tons of steel |
| | | | | | | | |
| First Quarter 2009 | 9 (a) | | 154 | days | | 600 | MT |
| Second Quarter 2009 | 3 | | 136 | days | | 400 | MT |
| Third Quarter 2009 | 6 | | 191 | days | | 700 | MT |
| Fourth Quarter 2009 | 5 | | 183 | days | | 700 | MT |
| | | | | | | | |
| (a) Including one vessel that entered into drydock during December 2008. | | | |
Presented in the table below is our preliminary quarterly drydock schedule for vessels we anticipate to be in drydock during 2010, including an estimated number of drydock days and metric tons of steel renewal. Our estimates are based on current and anticipated congestion in the repair shipyards, which could be adversely affected by unanticipated inclement weather or congestion in the shipyard. Further, our 2010 drydock schedule is subject to changes based on unanticipated commercial needs of our business.
| | Estimated number of vessels entering drydock during quarter | | Estimated number of drydock days during quarter | | Estimated metric tons of steel |
| | | | | | | | |
| First Quarter 2010 | 5 (a) | | 77 | days | | 200 | MT |
| Second Quarter 2010 | 5 | | 131 | days | | 400 | MT |
| Third Quarter 2010 | 3 | | 80 | days | | 300 | MT |
| Fourth Quarter 2010 | 5 | | 147 | days | | 900 | MT |
| | | | | | | | |
| (a) Including two vessels that entered into drydock during November and December 2009. | | | |
We estimate that vessel drydockings that require less than 100 metric tons of steel renewal will take from 25 to 35 days and that vessel drydockings that require 100 to 500 metric tons of steel renewal will take from 35 to 75 days. We capitalize vessel improvements, including steel renewal and reinforcement, in connection with the first drydocking after we acquire vessels.
Components of Revenue and Expense
We report our revenue as voyage revenue, reflecting the operations of our vessels that are not chartered out, and charter revenue, reflecting the operations of our vessels that have been chartered out to third parties. Prior to 2008, the revenues and related voyage expenses for voyages in progress were recognized on the percentage of service completed at the balance sheet date by prorating the estimated final voyage revenue and expenses using the ratio of voyage days completed through the balance sheet date to total voyage days. For voyages in progress at December 31, 2009 and 2008, we recognized voyage expense as incurred and recognized voyage revenues ratably over the length of the voyage, all in accordance with the guidance outlined in ASC Topic 605-Revenue Recognition. The effects in 2007 of recognizing voyage expenses ratably over the length of each voyage was not materially different from the method of recognizing such costs as incurred. When a loss is forecast for a voyage, the full amount of the anticipated loss is recognized in the period in which that determination is made. Revenue from time charters in progress is calculated using the daily charter hire rate, net of daily expenses multiplied by the number of charter-out days that the vessel was on-hire through period end.
Voyage revenue consists of freight charges paid to our subsidiaries for the transport of customers' cargo. Freight rates are set by the market and depend on the relationship between the demand for ocean freight transportation and the availability of appropriate vessels. The key factors driving voyage revenue are the number of vessels in the fleet, freight voyage days, revenue tons carried and the freight rates.
Time charter revenue consists of a negotiated daily hire rate for the duration of a voyage. The key factors driving time charter revenue are the number of days vessels are chartered out and the daily charter hire rates.
Voyage expenses consist of costs attributable to specific voyages. The number of voyage days is a significant determinant of voyage expense, which primarily consists of fuel costs, commissions, port call, stevedoring and lashing materials. The costs are paid by our subsidiaries.
Vessel expenses are vessel operating expenses that consist of crewing, stores, lube oil, repairs and maintenance including registration taxes and fees, insurance and communication expenses for vessels we control, charter hire fees we pay to owners for use of their vessels. The costs are paid by our subsidiaries.
Depreciation and amortization expense is computed for vessels and vessel improvements on the remaining useful life of each vessel, which is the period from the date we put the vessel into service to the date 30 years from the time that the vessel was initially delivered by the shipyard. Drydock costs are amortized on a straight-line basis over the period through the date of the next drydocking which is typically 30 months. Other fixed assets, consisting principally of computer hardware, software and office equipment are depreciated on a straight-line basis using useful lives of from three to seven years. Grabs are depreciated on a straight-line basis using a ten year useful life. Vessel leasehold improvements, which are included with vessel improvements and other equipment, are amortized on a straight-line basis over the shorter of the useful life of the improvement or the term of the lease.
Commissions on freight and port agency fees are paid to unrelated companies and TBS Commercial Group and Beacon Holdings. Management fees and commissions paid to TBS Commercial Group are fixed under agreements that are approved by our Board of Directors. The Compensation Committee of our Board of Directors approved, effective October 1, 2007, additional commissions of 1.25% of freight revenue for commercial agency services provided by subsidiaries of TBS Commercial Group and an increase of approximately 33 1/3% in port agency fees for agency services provided by most subsidiaries of TBS Commercial Group and Beacon.
Lack of Historical Operating Data for Vessels Before their Acquisition
Consistent with shipping industry practices, there is no historical financial due diligence process when we acquire secondhand vessels other than the inspection of the physical condition of the vessels and examination of classification society records. Accordingly, we do not obtain the historical operating data for the vessels from the sellers because that information is not material to our decision to make acquisitions, nor do we believe it would be helpful to investors in assessing our business or profitability.
Most vessels are sold under a standardized agreement, which, among other things, provides the buyer with the right to inspect the vessel and the vessel's classification society records. The standard agreement does not give the buyer the right to inspect, or receive copies of, the historical operating data of the vessel and does not provide for financial information or historical results for the vessel to be made available to the buyer. Prior to the delivery of a purchased vessel, the seller typically removes from the vessel all records, including past financial records and accounts related to the vessel. In addition, the technical management agreement between the seller's technical manager and the seller is automatically terminated and the vessel's trading certificates are revoked by its flag state following a change in ownership.
Consistent with shipping industry practice, we treat the acquisition of a vessel, whether acquired with or without charter, as the acquisition of an asset rather than a business. Due to the differences between us and the prior owners of these vessels with respect to the routes we operate, the shippers and consignees we serve, the cargoes we carry, the freight rates and charter hire rates we charge and the costs we incur in operating our vessels, we believe that our operating results will be significantly different from the operating results of the vessels while owned by the prior owners.
The Financial Accounting Standards Board, or FASB, as outlined in ASC Topic 805-Business Combinations, provides guidance for accounting for the acquisition of assets rather than a business. It states that for a transferred set of activities and assets to be a business, it must contain all of the inputs and processes necessary for it to continue to conduct normal operations after the transferred set is separated from the transferor, which includes the ability to sustain a revenue stream by providing its output to customers. The purchase of a vessel alone cannot operate or generate revenue or constitute a business operation without the significant inputs and processes that we provide, as described below:
| · | We provide our own captains, senior officers and crew to the vessels. |
| · | The vessels are managed by our subsidiary Roymar. All of the functions of vessel management, from technical ship management to crewing, vessel maintenance and drydocking, are conducted by Roymar, in a manner different from the prior manager, according to our standards. |
| · | The necessary commercial activities - maintaining customer relationships, providing local teams of commercial agents and port captains, offering transportation management skills and logistics solutions - are provided by our subsidiary TBS Shipping Services and our affiliate TBS Commercial Group in a manner different from the former owners. |
| · | The vessels will operate under our trade name and carry our distinctive native peoples’ naming convention. |
The revenue-producing activity of the vessels we purchase will be generated from carrying cargoes for our customers on the routes we serve. The vessels we purchase are operated by different parties than their former owners, serve different customers, carry different cargoes, charge different rates, cover different routes and, in all respects engage in a different business with different revenues, costs and operating margins. Only the vessels are being purchased and profitable operation of the vessels will depend on our skill and expertise.
Results of Operations
Year ended December 31, 2009 compared to year ended December 31, 2008
| | | Year Ended December 31, | | | | | | | |
| | | 2009 | | | 2008 | | | Increase (Decrease) | |
| | | In Thousands | | | As a % of Total Revenue | | | In Thousands | | | As a % of Total Revenue | | | In Thousands | | | Percentage | |
| Voyage revenue | | $ | 247,980 | | | 82.0 | | | $ | 518,907 | | | 84.8 | | | $ | (270,927 | ) | | (52.2 | ) |
| Time charter revenue | | | 51,201 | | | 16.9 | | | | 83,883 | | | 13.7 | | | | (32,682 | ) | | (39.0 | ) |
| Logistics revenue | | | 2,689 | | | 0.9 | | | | 7,000 | | | 1.2 | | | | (4,311 | ) | | (61.6 | ) |
| Other revenue | | | 646 | | | 0.2 | | | | 1,843 | | | 0.3 | | | | (1,197 | ) | | (64.9 | ) |
| | Total revenue | | | 302,516 | | | 100.0 | | | | 611,633 | | | 100.0 | | | | (309,117 | ) | | (50.5 | ) |
| | | | | | | | | | | | | | | | | | | | | | | | |
| Voyage expense | | | 113,084 | | | 37.4 | | | | 172,929 | | | 28.3 | | | | (59,845 | ) | | (34.6 | ) |
| Logistics expense | | | 2,193 | | | 0.7 | | | | 5,717 | | | 0.9 | | | | (3,524 | ) | | (61.6 | ) |
| Vessel expense | | | 104,046 | | | 34.4 | | | | 110,354 | | | 18.0 | | | | (6,308 | ) | | (5.7 | ) |
| Depreciation and amortization | | | 95,870 | | | 31.7 | | | | 73,479 | | | 12.1 | | | | 22,391 | | | 30.5 | |
| General and administrative | | | 37,265 | | | 12.3 | | | | 39,879 | | | 6.5 | | | | (2,614 | ) | | (6.6 | ) |
| | Total operating expenses | | | 352,458 | | | 116.5 | | | | 402,358 | | | 65.8 | | | | (49,900 | ) | | (12.4 | ) |
| (Loss) income from operations | | | (49,942 | ) | | (16.5 | ) | | | 209,275 | | | 34.2 | | | | (259,217 | ) | | (123.9 | ) |
| Other (expenses) and income | | | | | | | | | | | | | | | | | | | | | |
| | Interest expense | | | (17,119 | ) | | (5.7 | ) | | | (17,228 | ) | | (2.8 | ) | | | 109 | | | (0.6 | ) |
| | Loss on extinguishment of debt | | | | | | | | | | (2,318 | ) | | (0.4 | ) | | | 2,318 | | | (100.0 | ) |
| | Other income (expense) | | | 21 | | | | | | | 2,048 | | | 0.4 | | | | (2,027 | ) | | (99.0 | ) |
| Net (loss) income | | $ | (67,040 | ) | | (22.2 | ) | | $ | 191,777 | | | 31.4 | | | $ | (258,817 | ) | | (135.0 | ) |
Voyage revenue
The table below provides detailed information for voyage revenue:
| | | | Year Ended December 31, | | | | | | | |
| | | | 2009 | | | 2008 | | | Increase/ (Decrease) | |
| | | | | | | | | | | | | | |
| Voyage Revenue (in thousands) | | $ | 247,980 | | | $ | 518,907 | | | | (270,927 | ) | | (52.2 | )% |
| Number of vessels (1) | | | 31 | | | | 33 | | | | (2 | ) | | (6.1 | )% |
| Days available for hire (2) | | | 11,680 | | | | 12,141 | | | | (461 | ) | | (3.8 | )% |
| Freight voyage days (3) | | | 11,470 | | | | 11,900 | | | | (430 | ) | | (3.6 | )% |
| Revenue tons carried (thousands) (4) | | | | | | | | | | | | | | | |
| | For all cargoes | | | 8,788 | | | | 9,315 | | | | (527 | ) | | (5.7 | )% |
| | Excluding aggregates | | | 4,727 | | | | 5,109 | | | | (382 | ) | | (7.5 | )% |
| | Aggregates | | | 4,061 | | | | 4,206 | | | | (145 | ) | | (3.4 | )% |
| Freight Rates (5) | | | | | | | | | | | | | | | |
| | For all cargoes | | $ | 28.22 | | | $ | 55.70 | | | $ | (27.48 | ) | | (49.3 | )% |
| | Excluding aggregates | | $ | 45.36 | | | $ | 88.08 | | | $ | (42.72 | ) | | (48.5 | )% |
| Daily time charter equivalent rates (6) | | $ | 12,069 | | | $ | 29,526 | | | $ | (17,457 | ) | | (59.1 | )% |
| (1) | Weighted average number of vessels in the fleet, not including vessels chartered out. |
| (2) | Number of days that our vessels were available for hire, not including vessels chartered out. |
| (3) | Number of days that our vessels were earning revenue, not including vessels chartered out. |
| (4) | Revenue tons is a measurement on which shipments are freighted. Cargoes are rated as weight (based on metric tons) or measure (based on cubic meters); whichever produces the higher revenue will be considered the revenue ton. |
| (5) | Weighted average freight rates measured in dollars per revenue ton. |
| (6) | Daily Time Charter Equivalent or "TCE" rates are defined as voyage revenue less voyage expenses during the year divided by the number of available freight voyage days during the year. Voyage expenses include fuel, port call, commissions, stevedore and other cargo related and miscellaneous voyage expenses. No deduction is made for vessel or general and administrative expenses. TCE includes the full amount of any probable losses on voyages at the time such losses can be estimated. TCE is an industry standard for measuring and analyzing fluctuations between financial periods and as a method of equating TCE revenue generated from a voyage charter to time charter revenue. |
The 52.2% reduction in voyage revenue during 2009 was caused by the economic downturn, which cut average freight rates in half. Additionally, voyage revenue was also negatively affected by a 5.7% decrease in revenue tons carried.
Freight rates, not under contracts, are set by the market and depend on both the demand for ocean freight transportation and the availability of appropriate vessels. Average freight rates for 2009 decreased $27.48 per ton or 49.3% to $28.22 per ton as compared to $55.70 per ton in 2008. Freight rates during most of 2009, were negatively influenced by supply and demand imbalances for ocean freight transportation caused by the economic crisis. Excluding aggregates, average 2009 freight rates would have been $45.36 per ton or 48.5% lower than the 2008 average freight rate of $88.08 per ton.
Revenue tons carried in 2009 decreased 0.5 million tons or 5.7% to 8.8 million tons from 9.3 million tons carried in 2008, due mainly to a decrease in steel products transported.
The following table shows voyage revenues attributed to our principal cargoes:
| | | Year Ended December 31, | | | | | | |
| | | 2009 | | | 2008 | | | Increase (Decrease) | |
| Description | In Thousands | | As a % of Total Voyage Revenue | | | In Thousands | | As a % of Total Voyage Revenue | | | In Thousands | | % | |
| | | | | | | | | | | | | | | | |
| Steel products | $ | 60,063 | | 24.2 | | | $ | 128,472 | | 24.8 | | | $ | (68,409 | ) | (53.2 | ) |
| Agricultural products | | 51,417 | | 20.7 | | | | 86,650 | | 16.7 | | | | (35,233 | ) | (40.7 | ) |
| Aggregates | | 33,561 | | 13.5 | | | | 68,884 | | 13.3 | | | | (35,323 | ) | (51.3 | ) |
| Metal concentrates | | 37,469 | | 15.1 | | | | 92,824 | | 17.9 | | | | (55,355 | ) | (59.6 | ) |
| Other bulk cargo | | 26,483 | | 10.7 | | | | 59,031 | | 11.3 | | | | (32,548 | ) | (55.1 | ) |
| General cargo | | 9,826 | | 4.0 | | | | 15,012 | | 2.9 | | | | (5,186 | ) | (34.5 | ) |
| Project cargo | | 10,067 | | 4.1 | | | | 22,900 | | 4.4 | | | | (12,833 | ) | (56.0 | ) |
| Rolling stock | | 5,765 | | 2.3 | | | | 19,498 | | 3.7 | | | | (13,733 | ) | (70.4 | ) |
| Fertilizers | | 4,488 | | 1.8 | | | | 8,286 | | 1.6 | | | | (3,798 | ) | (45.8 | ) |
| Automotive products | | 4,426 | | 1.8 | | | | 10,833 | | 2.1 | | | | (6,407 | ) | (59.1 | ) |
| Fishmeal | | 2,544 | | 1.0 | | | | | | | | | | 2,544 | | | |
| Other | | 1,871 | | 0.8 | | | | 6,517 | | 1.3 | | | | (4,646 | ) | (71.3 | ) |
| | Total voyage revenue | $ | 247,980 | | 100.0 | | | $ | 518,907 | | 100.0 | | | $ | (270,927 | ) | (52.2 | ) |
| | | | | | | | | | | | | | | | | | | |
In 2009 and 2008, we transported approximately 3.7 million revenue tons and 6.4 million revenue tons, respectively, under contracts or Contracts of Affreightment ("COA") and generated approximately $53.6 million and $230.4 million of voyage revenue, respectively. A Contract of Affreightment ("COA") obligates the charterers to transport a specified quantity, at a specified rate over a specified number of voyages or period. As of December 31, 2009, we had outstanding COAs to transport approximately 2.4 million revenue tons on contracts expiring through December 2011. We also have requirement or Supply Agreement COAs which differ from the standard COA. While a standard COA specifies a specific range of tons to be shipped or a number of shipments, requirement COAs require the customer to ship with only their partner when cargo is available. In such a case, there would be no penalty for shipping less cargo than called for or estimated in the requirement COA. We have a requirement COA agreement, which expires in 2019 that calls for approximately 300,000 tons to be shipped during the first four years and approximately 400,000 tons to be shipped the final six years. The quantity of cargo may be increased by mutual agreement and the base rate is $25.50 per ton, which equates to a projected total revenue of approximately $91.8 million.
Time charter revenue
The key factors driving time charter revenue for the years 2009 and 2008 are as follows:
| | | Year Ended December 31, | | | | | | | |
| | | 2009 | | | 2008 | | | Increase (Decrease) | |
| | | | | | | | | | | | | |
| Time Charter Revenue (in thousands) | | $ | 51,201 | | | $ | 83,883 | | | $ | (32,682 | ) | | (39.0 | )% |
| Number of vessels (1) | | | 13 | | | | 8 | | | | 5 | | | 62.5 | % |
| Time Charter days (2) | | | 4,733 | | | | 3,004 | | | | 1,729 | | | 57.6 | % |
| Daily charter hire rates (3) | | $ | 10,818 | | | $ | 27,924 | | | $ | (17,106 | ) | | (61.3 | )% |
| Daily time charter equivalent rates (4) | | $ | 10,070 | | | $ | 26,134 | | | $ | (16,064 | ) | | (61.5 | )% |
| (1) | Weighted average number of vessels chartered out. |
| (2) | Number of days the vessels earned charter hire. |
| (3) | Weighted average charter hire rates. |
| (4) | Daily Time Charter Equivalent or "TCE" rates for vessels that are time chartered out are defined as time charter revenue during the year reduced principally by commissions divided by the number of available time charter days during the period. Commission for vessels that are time chartered out for the years ending December 31, 2009 and December 31, 2008 were $2.1 million and $3.6 million, respectively. For the years ending December 31, 2009 and 2008, time charter voyages include fuel cost and other miscellaneous voyage costs of $1.4 million and $1.8 million, respectively. The fuel cost, which made up most of the costs, is related to fuel price differentials caused by volatility in the fuel market and the cost for ballasting vessels to time charter delivery ports. No deduction is made for vessel or general and administrative expenses. TCE is an industry standard for measuring and analyzing fluctuations between financial periods and as a method of equating TCE revenue generated from a voyage charter to time charter revenue. |
The decrease in time charter revenue in 2009 as compared to 2008 was principally caused by a 61.3% decrease in time charter rates. Charter hire rates are set, to a significant degree, by the market and depend on the relationship between the demand for ocean freight transportation and the availability of appropriate vessels. Average time charter rates for 2009 was negatively influenced by supply and demand imbalances for ocean freight transportation caused by the economic crisis.
The lower time charter rates were partially offset by an increase in time charter out days. More vessels were available for time charter-out during 2009 due to the repositioning of vessels and the inability to fully use some vessels in our established voyage business.
Logistics revenue
Logistics revenues represent revenues for both ocean and in-land transportation of cargo that is provided through our Five Star Service. Logistics revenue decreased $4.3 million for the year ending December 31, 2009 as compared to 2008 due to the economic slowdown and its negative effect on the demand for logistics services.
Voyage expense
The principal components of voyage expense are as follows:
| | | | Year Ended December 31, | | | | | |
| | | | 2009 | | 2008 | | Increase (Decrease) | |
| | | | In Thousands | | As a % of Voyage Expense | | As a % of Voyage & Time Charter Revenue | | In Thousands | | As a % of Voyage Expense | | As a % of Voyage & Time Charter Revenue | | In Thousands | | As a % of 2008 Expense | | As a % of Voyage & Time Charter Revenue | |
| | | | | | | | | | | | | | | | | | | | | |
| Fuel expense | | $ | 55,418 | | 49.0 | | 18.5 | | $ | 87,342 | | 50.5 | | 14.5 | | $ | (31,924 | ) | (36.6 | ) | 4.0 | |
| Commission expense | | | 15,123 | | 13.4 | | 5.1 | | | 29,779 | | 17.2 | | 4.9 | | | (14,656 | ) | (49.2 | ) | 0.2 | |
| Port call expense | | | 23,882 | | 21.1 | | 8.0 | | | 27,511 | | 15.9 | | 4.6 | | | (3,629 | ) | (13.2 | ) | 3.4 | |
| Stevedore and other | | | | | | | | | | | | | | | | | | | | | | |
| | cargo-related expense | | | 10,669 | | 9.4 | | 3.6 | | | 18,273 | | 10.6 | | 3.0 | | | (7,604 | ) | (41.6 | ) | 0.6 | |
| Miscellaneous voyage | | | | | | | | | | | | | | | | | | | | | | |
| | expense | | | 7,992 | | 7.1 | | 2.7 | | | 10,024 | | 5.8 | | 1.7 | | | (2,032 | ) | (20.3 | ) | 1.0 | |
| | Voyage expense | | $ | 113,084 | | 100.0 | | 37.9 | | $ | 172,929 | | 100.0 | | 28.7 | | $ | (59,845 | ) | (34.6 | ) | 9.2 | |
| | | | | | | | | | | | | | | | | | | | | | | | |
Voyage expense decreased $59.8 million or 34.6% for the year ending December 31, 2009 as compared to 2008, principally due to a decrease in fuel expense and commission expense.
The decrease in fuel expense was the result of a decrease in the average price per metric ton, or MT, and a decrease in consumption. For the year ending December 31, 2009, the average price per MT decreased $140 per MT or 27.2% to $374 per MT from $514 per MT for the same period in 2008. Consumption decreased 21,913 MT or 12.9% to 148,078 MT for the year ending December 31, 2009 from 169,991 MT in 2008 due to an increase in time-chartered-out vessels and lower daily average fuel consumption per vessel. When vessels are time-charterd out the cost of fuel is the responsibility of the charterer. Average fuel cost per freight voyage day was $4,832 for the year ending December 31, 2009 and $7,340 for the same period in 2008.
The 49.2%, decrease in 2009 commission expense is principally caused by the 50.5% decrease in 2009 freight and time charter revenue as compared to the prior year.
Port call expense varies from period to period depending on the number of port calls, port days and cost structure of the ports called upon. The decrease in port call expense in 2009 is primarily due a decrease in the number of port calls and total port days. The number of port calls decreased to 1,037 port calls for 2009 from 1,201 port calls for 2008 and the total aggregate port days decreased 427 days in 2009 to 5,604 port days as compared to 6,031 port days in 2008.
Logistics expenses, which repesent expenses associated with logistics movements, decreased $3.5 million to $2.2 million in 2009 from $5.7 million in 2008, primarily due to lower business volumes caused by the economic slowdown. Logistics operating margins remained constant at approximately 18.4% in 2009 and 18.3% in 2008.
Vessel expense
The principal components of vessel expense are as follows:
| | | Year Ended December 31, | | | | |
| | | 2009 | | | 2008 | | | Increase (Decrease) | |
| | | In Thousands | | | As a % of Vessel Expense | | | In Thousands | | | As a % of Vessel Expense | | | In Thousands | | | Percentage | |
| | | | | | | | | | | | | | | | | | | |
| Owned vessel expense | | $ | 92,593 | | | | 88.9 | | | $ | 91,377 | | | | 82.8 | | | $ | 1,216 | | | | 1.3 | |
| Chartered-in vessel expense | | | 3,597 | | | | 3.5 | | | | 11,551 | | | | 10.5 | | | | (7,954 | ) | | | (68.9 | ) |
| Controlled vessel expense | | | 6,538 | | | | 6.3 | | | | 6,363 | | | | 5.7 | | | | 175 | | | | 2.8 | |
| Space charter expense | | | 1,318 | | | | 1.3 | | | | 1,063 | | | | 1.0 | | | | 255 | | | | 24.0 | |
| Vessel expense | | $ | 104,046 | | | | 100.0 | | | $ | 110,354 | | | | 100.0 | | | $ | (6,308 | ) | | | (5.7 | ) |
| | | | | | | | | | | | | | | | | | | | | | | | | |
The decrease in vessel expense in 2009 was principally due to a decrease in the average charter-in rate per day we paid to charter-in vessels and a decrease in the number of chartered-in vessels as compared to 2008. Vessel expense as a percentage of total revenue increased 17% to 34% of total revenue for 2009 as compared to 18% of total revenue for 2008, due to the significant decrease in freight and time charter-out rates in 2009.
Average charter-in rate per day for 2009, decreased $7,729 per day or 40.2% to $11,491 per day as compared to $19,220 per day for 2008. Chartered-in vessels days decreased 47.9% to 313 days during 2009 as compared to 601 days during 2008 because our controlled fleet met the needs of our established voyage business, which decreased our demand for charter-in vessels.
The increase in owned vessel expense was due to an increase in fleet size partially offset by a decrease in the vessel operating day rate. Average number of controlled vessels, which is computed based on the number of days that we operated our controlled vessels, increased to 47 vessels or 17,254 vessel days in 2009 from 43 vessels or 15,736 vessel days in 2008. The average vessel operating expense day rate decreased $441 per day or 7.6% to $5,366 per day for 2009 as compared to $5,807 per day for 2008, principally because of decreases in repair and maintenance and related freight expenses partially offset by an increase in crew and related expenses. Owned vessel expenses was reduced by $4.0 million for an out-of-period adjustment related to freight costs incurred and expensed for the years ended December 31, 2008 and 2007. The freight costs were incurred to put into service capitalized assets and should have been capitalized. Excluding this adjustment average vessel operating expense day rate would have been $5,598 per day.
Controlled vessel charter expense relates to a sale-leaseback transaction entered on January 31, 2007 for the Seminole Princess and Laguna Belle, which were chartered back under a bareboat charter party.
Depreciation and amortization
Depreciation and amortization expense increased $22.4 million due to an increase in the average vessel cost of newly acquired vessels, increased vessel improvements and the overall growth of the fleet. The growth of our owned/controlled fleet increased to an average number of 47 vessels for the year ended December 31, 2009 as compared to 43 vessels for the year ending December 31, 2008.
General and administrative expense
General and administrative expense decreased $2.6 million in 2009 as compared to 2008 due principally to cost cutting efforts.
Loss from operations
We had a loss from operations in 2009 because our revenues, which are more market driven, decreased in greater proportion than our operating costs, some of which are fixed in nature.
Interest expense
Interest expense decreased $0.1 million for the year ending December 31, 2009 due to lower debt levels which were partially off-set by higher interest rates. Average debt levels decreased $19.2 million to $261.0 million in 2009 as compared to $280.2 million in 2008; average effective interest rates increased 0.50% to 6.0% during 2009 as compared to 5.5 % during 2008. The increase in our average effective interest rate was due to higher bank margins on our bank loans, which increased when we obtained covenant waivers in March 2009. The increases in margins were partially offset by lower average LIBOR rates on un-hedged debt in 2009 as compared to 2008.
Loss on extinguishment of debt
The $2.3 million loss on extinguishment of debt in 2008 represents the write-off of unamortized deferred financing costs in connection with the March 2008 refinancing of our original Bank of America credit facility.
Results of Operations
Year ended December 31, 2008 compared to year ended December 31, 2007
| | | | Year Ended December 31, | | | | | | | |
| | | | 2008 | | | 2007 | | | Increase (Decrease) | |
| | | | In Thousands | | | As a % of Total Revenue | | | In Thousands | | | As a % of Total Revenue | | | In Thousands | | | Percentage | |
| Voyage revenue | | $ | 518,907 | | | 84.8 | | | $ | 261,509 | | | 74.1 | | | $ | 257,398 | | | 98.4 | |
| Time charter revenue | | | 83,883 | | | 13.7 | | | | 88,365 | | | 25.0 | | | | (4,482 | ) | | (5.1 | ) |
| Logistics revenue | | | 7,000 | | | 1.2 | | | | 668 | | | 0.2 | | | | 6,332 | | | | |
| Other revenue | | | 1,843 | | | 0.3 | | | | 2,379 | | | 0.7 | | | | (536 | ) | | (22.5 | ) |
| | Total revenue | | | 611,633 | | | 100.0 | | | | 352,921 | | | 100.0 | | | | 258,712 | | | 73.3 | |
| | | | | | | | | | | | | | | | | | | | | | | |
| Voyage expense | | | 172,929 | | | 28.3 | | | | 89,241 | | | 25.3 | | | | 83,688 | | | 93.8 | |
| Logistics | | | 5,717 | | | 0.9 | | | | 557 | | | 0.2 | | | | 5,160 | | | | |
| Vessel expense | | | 110,354 | | | 18.0 | | | | 85,958 | | | 24.4 | | | | 24,396 | | | 28.4 | |
| Depreciation and amortization | | | 73,479 | | | 12.1 | | | | 36,022 | | | 10.2 | | | | 37,457 | | | 104.0 | |
| General and administrative | | | 39,879 | | | 6.5 | | | | 38,703 | | | 11.0 | | | | 1,176 | | | 3.0 | |
| Loss from sale of vessel | | | | | | | | | | 814 | | | 0.2 | | | | (814 | ) | | (100.0 | ) |
| | Total operating expenses | | | 402,358 | | | 65.8 | | | | 251,295 | | | 71.3 | | | | 151,063 | | | 60.1 | |
| Income from operations | | | 209,275 | | | 34.2 | | | | 101,626 | | | 28.7 | | | | 107,649 | | | 105.9 | |
| Other (expenses) and income | | | | | | | | | | | | | | | | | | | | | |
| | Interest expense | | | (17,228 | ) | | (2.8 | ) | | | (10,394 | ) | | (2.9 | ) | | | (6,834 | ) | | 65.7 | |
| | Loss on extinguishment of debt | | | (2,318 | ) | | (0.4 | ) | | | | | | | | | | (2,318 | ) | | | |
| | Gain from sale and insurance recovery of vessel | | | | | | | | | | 6,034 | | | 1.7 | | | | (6,034 | ) | | (100.0 | ) |
| | Other income (expense) | | | 2,048 | | | 0.4 | | | | 983 | | | 0.3 | | | | 1,065 | | | 108.3 | |
| Net income | | $ | 191,777 | | | 31.4 | | | $ | 98,249 | | | 27.8 | | | $ | 93,528 | | | 95.2 | |
Voyage revenue
The table below provides detailed information for voyage revenue:
| | | | Year Ended December 31, | | | | | | | |
| | | | 2008 | | | 2007 | | | Increase (Decrease) | |
| Voyage Revenue (in thousands) | | $ | 518,907 | | | $ | 261,509 | | | $ | 257,398 | | | 98.4 | % |
| Number of vessels (1) | | | 33 | | | | 22 | | | | 11 | | | 50.0 | % |
| Freight voyage days (2) | | | 11,900 | | | | 8,209 | | | | 3,691 | | | 45.0 | % |
| Days on hire (3) | | | 12,141 | | | | 8,292 | | | | 3,849 | | | 46.4 | % |
| Revenue tons carried (thousands) (4) | | | | | | | | | | | | | | | |
| | For all cargoes | | | 9,315 | | | | 6,621 | | | | 2,694 | | | 40.7 | % |
| | Excluding aggregates | | | 5,109 | | | | 3,447 | | | | 1,662 | | | 48.2 | % |
| | Aggregates | | | 4,206 | | | | 3,174 | | | | 1,032 | | | 32.5 | % |
| Freight Rates (5) | | | | | | | | | | | | | | | |
| | For all cargoes | | $ | 55.70 | | | $ | 39.49 | | | $ | 16.21 | | | 41.0 | % |
| | Excluding aggregates | | $ | 88.08 | | | $ | 68.79 | | | $ | 19.29 | | | 28.0 | % |
| Daily time charter equivalent rates (6) | | $ | 29,526 | | | $ | 21,658 | | | $ | 7,868 | | | 36.3 | % |
| (1) | Weighted average number of vessels in the fleet, not including vessels chartered out. |
| (2) | Number of days that our vessels were earning revenue, not including vessels chartered out. |
| (3) | Number of days that our vessels were available for hire, not including vessels chartered out. |
| (4) | Revenue tons is a measurement on which shipments are freighted. Cargoes are rated as weight (based on metric tons) or measure (based on cubic meters); whichever produces the higher revenue will be considered the revenue ton. |
| (5) | Weighted average freight rates measured in dollars per revenue ton. |
| (6) | Daily Time Charter Equivalent or "TCE" rates are defined as voyage revenue less voyage expenses during the year divided by the number of available freight voyage days during the year. Voyage expenses include: fuel, port call, commissions, stevedore and other cargo related and miscellaneous voyage expenses. To conform with the 2008 presentation, daily time charter equivalent rates for 2007 were revised to exclude intercompany commissions and management fees eliminated in consolidation. No deduction is made for vessel or general and administrative expenses. TCE includes the full amount of any probable losses on voyages at the time such losses can be estimated. TCE is an industry standard for measuring and analyzing fluctuations between financial periods and as a method of equating TCE revenue generated from a voyage charter to time charter revenue. |
Voyage revenue in 2008 increased primarily due to an increase in revenue tons carried coupled with an increase in freight rates. Approximately 63% of the increase in voyage revenue is attributable to the increase in revenue tons carried, with the balance of approximately 37% due to higher freight rates on cargoes carried.
Revenue tons carried in 2008 increased 2.7 million tons or 40.7% to 9.3 million tons from 6.6 million tons carried in 2007. We increased our TBS Middle East service in 2008, which increased the aggregate bulk cargo we carried and, consequently, was the principal reason for the increase in revenue tons. Aggregate bulk cargo accounted for 38% of the increase in revenue tons carried.
Freight rates, not under contracts, are set by the market and depend on both the demand for ocean freight transportation and the availability of appropriate vessels. A COA obligates the charterers to transport a specified quantity, at a specified rate over a specified number of voyages or period. In 2008 and 2007, we had COAs under which we carried approximately 6.4 million revenue tons and 4.2 million revenue tons and generated approximately $230.4 million and $89.6 million of voyage revenue, respectively. As of December 31, 2008, we had outstanding COAs to transport approximately 3.2 million revenue tons on contracts expiring through December 2009.
Average freight rates for 2008 increased $16.21 per ton or 41.0% to $55.70 per ton as compared to $39.49 per ton in 2007. The increase was principally caused by higher rates for the aggregates carried. Excluding aggregates, average freight rates would have been $88.08 per ton and $68.79 per ton for 2008 and 2007, respectively.
The following table shows voyage revenues attributed to our principal cargoes:
| | | | Year Ended December 31, | | | | | |
| | | | 2008 | | 2007 | | Increase (Decrease) | |
| Description | | In Thousands | | As a % of Total Voyage Revenue | | In Thousands | | As a % of Total Voyage Revenue | | In Thousands | | Percentage | |
| | | | | | | | | | | | | | | |
| Steel products | | $ | 128,472 | | 24.8 | | $ | 91,182 | | 34.9 | | $ | 37,290 | | 40.9 | |
| Metal concentrates | | | 92,824 | | 17.9 | | | 38,772 | | 14.8 | | | 54,052 | | 139.4 | |
| Agricultural products | | | 86,650 | | 16.7 | | | 45,247 | | 17.3 | | | 41,403 | | 91.5 | |
| Aggregates | | | 68,884 | | 13.3 | | | 24,406 | | 9.4 | | | 44,478 | | 182.2 | |
| Other bulk cargo | | | 59,031 | | 11.3 | | | 19,866 | | 7.6 | | | 39,165 | | 197.1 | |
| Project cargo | | | 22,900 | | 4.4 | | | 2,757 | | 1.1 | | | 20,143 | | | |
| Rolling stock | | | 19,498 | | 3.7 | | | 13,110 | | 5.0 | | | 6,388 | | 48.7 | |
| Automotive products | | | 10,833 | | 2.1 | | | 5,345 | | 2.0 | | | 5,488 | | 102.7 | |
| General cargo | | | 15,012 | | 2.9 | | | 5,769 | | 2.2 | | | 9,243 | | 160.2 | |
| Fertilizers | | | 8,286 | | 1.6 | | | 9,709 | | 3.7 | | | (1,423 | ) | (14.7 | ) |
| Other | | | 6,517 | | 1.3 | | | 5,346 | | 2.0 | | | 1,171 | | 21.9 | |
| | Total voyage revenue | | $ | 518,907 | | 100.0 | | $ | 261,509 | | 100.0 | | $ | 257,398 | | 98.4 | |
| | | | | | | | | | | | | | | | | | |
Time charter revenue
The key factors driving time charter revenue for the years 2008 and 2007 are as follows:
| | | Year Ended December 31, | | | | | | | |
| | | 2008 | | | 2007 | | | Increase (Decrease) | |
| | | | | | | | | | | | | |
| Time Charter Revenue (in thousands) | | $ | 83,883 | | | $ | 88,365 | | | $ | (4,482 | ) | | (5.1 | )% |
| Number of vessels (1) | | | 8 | | | | 10 | | | | (2 | ) | | (20.0 | )% |
| Time Charter days (2) | | | 3,004 | | | | 3,659 | | | | (655 | ) | | (17.9 | )% |
| Daily charter hire rates (3) | | $ | 27,924 | | | $ | 24,150 | | | $ | 3,774 | | | 15.6 | % |
| Daily time charter equivalent rates (4) | | $ | 26,134 | | | $ | 23,078 | | | $ | 3,056 | | | 13.2 | % |
| | | | | | | | | | | | | | | | |
| (1) | Weighted average number of vessels chartered out. |
| (2) | Number of days the vessels earned charter hire. |
| (3) | Weighted average charter hire rates. |
| (4) | Daily Time Charter Equivalent or "TCE" rates for vessels that are time chartered out, are defined as time charter revenue during the year reduced principally by commissions divided by the number of available time charter days during the year. Commission for vessels that are time chartered out for the year ended December 31, 2008 and December 31, 2007 were $3.6 million and $3.9 million, respectively. For the year ended December 31, 2008, time charter voyages include fuel and other miscellaneous voyage expenses of $1.8 million. The fuel expense cost, which made up most of the expenses, is related to fuel price differentials caused by volatility in the fuel market and the cost for ballasting vessels to time charter delivery ports. To conform with the 2008 presentation daily time charter equivalent rates for 2007 were revised to exclude intercompany commissions and management fees eliminated in consolidation. No deduction is made for vessel or general and administrative expenses. TCE is an industry standard for measuring and analyzing fluctuations between financial periods and as a method of equating TCE revenue generated from a voyage charter to time charter revenue. |
The decrease in time charter revenue in 2008 was the result of a decrease in the number of time charter-out days. The decrease in time charter-out days is due mainly to the reduced number of vessels available for time charter-out because of the increased use of our controlled vessels in our established voyage business.
An increase in average charter hire rates offset the decrease in the time charter-out days in 2008. Charter hire rates are set, to a significant degree, by the market and depend on the relationship between the demand for ocean freight transportation and the availability of appropriate vessels. The increase in average time charter rates for 2008 as compared to 2007 was reflective of the strong worldwide shipping markets for most of 2008.
Logistics revenue and expenses
Logistics revenues represent revenues from cargo and transportation management services provided through our Five Star Service. For 2008, logistics revenues and related cargo and management costs represent a full year's growth compared to 2007 when we initiated logistics support in the fourth quarter. The logistics operating margin was approximately 18.3% in 2008.
Voyage expense
The principal components of voyage expense are as follows:
| | | Year Ended December 31, | | | | | |
| | | 2008 | | 2007 | | Increase (Decrease) | |
| | | In Thousands | | As a % of Voyage Expense | | As a % of Voyage & Time Charter Revenue | | In Thousands | | As a % of Voyage Expense | | As a % of Voyage & Time Charter Revenue | | In Thousands | | As a % of 2007 Expense | | As a % of Voyage & Time Charter Revenue | |
| | | | | | | | | | | | | | | | | | | | |
| Fuel expense | $ | 87,342 | | 50.5 | | 14.5 | | $ | 39,427 | | 44.2 | | 11.3 | | $ | 47,915 | | 121.5 | | 3.2 | |
| Commission expense | | 29,779 | | 17.2 | | 4.9 | | | 16,196 | | 18.1 | | 4.6 | | | 13,583 | | 83.9 | | 0.3 | |
| Port call expense | | 27,511 | | 15.9 | | 4.6 | | | 17,225 | | 19.3 | | 4.9 | | | 10,286 | | 59.7 | | (0.3 | ) |
| Stevedore and other | | | | | | | | | | | | | | | | | | | | | |
| | cargo-related expense | | 18,273 | | 10.6 | | 3.0 | | | 11,072 | | 12.4 | | 3.2 | | | 7,201 | | 65.0 | | (0.2 | ) |
| Miscellaneous voyage | | | | | | | | | | | | | | | | | | | | | |
| | expense | | 10,024 | | 5.8 | | 1.7 | | | 5,321 | | 6.0 | | 1.5 | | | 4,703 | | 88.4 | | 0.2 | |
| | Voyage expense | $ | 172,929 | | 100.0 | | 28.7 | | $ | 89,241 | | 100.0 | | 25.5 | | $ | 83,688 | | 93.8 | | 3.2 | |
| | | | | | | | | | | | | | | | | | | | | | | |
Voyage expense increased in 2008 primarily due to an increase in fuel expense, which resulted from higher average fuel costs, an increase in fuel consumption and higher average port call costs.
Fuel expense increased $47.9 million in 2008 primarily due to an increase in the average price paid per MT. In 2008, the average price paid per MT increased $112 or approximately 28% to $514 per MT compared to the average price paid per MT of $402 per MT during 2007. Consumption increased 72,006 MT to 169,991 MT for the year, compared to 97,985 to 2007. The increase in consumption is directly related to the increase in freight voyages. Average fuel cost per freight voyage day was $7,340 during 2008 and $4,803 during 2007.
The increase in commission expenses in 2008 is attributable to increased revenues and to a lesser extent because the commission rate paid to our unconsolidated affiliate TBS Commercial Group was increased effective October 1, 2007. The rate increase to TBS Commercial Group accounted for approximately 31% of the commission increase.
Port call expense varies from period to period depending on the number of port calls, port days and cost structure of the ports called upon. The increase in port call expense in 2008 is primarily due to additional port calls and port days by vessels. The number of port calls increased to 1,201 port calls for 2008 from 894 port calls for 2007 and the total aggregate port days in 2008 was 6,031 as compared to 3,970 port days in 2007.
Stevedore and other cargo-related expenses fluctuate based on cargo volumes and the shipping terms under which the cargo is booked. Stevedore and other cargo-related cost increased in 2008 due to a higher percentage of cargo being booked under "full liner" terms and a combination of "free-in, free-out" terms. For analysis purposes we group cargoes into three categories: (1) cargo booked under "free-in, free-out" terms which are shipments that the customer pays all or part of the costs of loading and unloading, (2) cargo booked under "full liner" terms, which are shipments where we bear the costs of loading and unloading and (3) a combination of free-in free-out and full liner terms.
Vessel expense
The principal components of vessel expense are as follows:
| | | Year Ended December 31, | | | | |
| | | 2008 | | | 2007 | | | Increase (Decrease) | |
| | | | | | | | | | | | | | | | |
| | | In Thousands | | | As a % of Vessel Expense | | | In Thousands | | | As a % of Vessel Expense | | | In Thousands | | | Percentage | |
| | | | | | | | | | | | | | | | | | | |
| Owned vessel expense | | $ | 91,377 | | | 82.8 | | | $ | 56,856 | | | 66.2 | | | $ | 34,521 | | | 60.7 | |
| Chartered-in vessel expense | | | 11,551 | | | 10.5 | | | | 22,905 | | | 26.6 | | | | (11,354 | ) | | (49.6 | ) |
| Controlled vessel expense | | | 6,363 | | | 5.7 | | | | 6,073 | | | 7.1 | | | | 290 | | | 4.8 | |
| Space charter expense | | | 1,063 | | | 1.0 | | | | 124 | | | 0.1 | | | | 939 | | | | |
| Vessel expense | | $ | 110,354 | | | 100.0 | | | $ | 85,958 | | | 100.0 | | | $ | 24,396 | | | 28.4 | |
| | | | | | | | | | | | | | | | | | | | | | |
The increase in vessel expense in 2008 was primarily due to an increase in our fleet of owned and controlled vessels. Vessel expense as a percentage of total revenue decreased 6.0% to 18% of total revenue for 2008 as compared to 24% of total revenue for 2007, primarily due to the increase in revenue resulting from higher freight rates.
The increase in owned vessel expense was due to an increase in the average operating expense day rate of $1,187 per day to $5,807 for 2008 as compared to $4,620 per day for 2007. The average operating expense day rate, increased principally because of increases in crew cost, insurance and maintenance and repairs. The owned vessel expense increase was also due to an increase in the average number of controlled vessels, which increased the number of vessel days. Vessel days are the total days we operated our controlled vessels which increased 3,430 days to 15,736 during 2008 from 12,306 days during 2007.
The decrease in chartered-in vessel expense was due to a decrease in the average charter-in rate per day we paid to charter in vessels. The average charter-in rate per day decreased $5,409 per day to $19,220 per day in 2008 as compared to $24,629 per day for 2007. We chartered-in vessels for 601 days during 2008 as compared to 930 days during 2007 because of an increase in our controlled fleet, which decreased our demand for charter-in vessels.
Controlled vessel charter expense relates to a sale-leaseback transaction entered on January 31, 2007 for the Seminole Princess and Laguna Belle, which were chartered back under a bareboat charter party. Controlled vessel expense increased in 2008 as compared to 2007 because we chartered-in the vessels for the full year during 2008. Charter-in days increased to 366 days per vessel in 2008 as compared to 336 days per vessel in 2007.
Depreciation and amortization
The increase in depreciation and amortization expense to $73.5 million in 2008 from $36.0 million in 2007 was due principally to additional depreciation and amortization on vessel improvements and drydockings made during 2008. The growth of our owned/controlled fleet, which increased to an average of 43 vessels for the year ended December 31, 2008 as compared to an average of 34 vessels for the year ended December 31, 2007, also added to the increase in depreciation and amortization.
General and administrative expense
The $1.2 million net increase in general and administrative expense in 2008 as compared to 2007 is primarily made up of a $2.6 million and $1.6 million increase in professional fees and miscellaneous expense, respectively, offset by a $4.0 million decrease in salary and related expenses. Salaries and related expenses decreased principally due to management's decision to eliminate our 2008-bonus in response to current worldwide economic conditions and its impact on the shipping industry. Our bonus program, under which employees may receive an annual cash bonus payment based on our annual operating performance, is discretionary. For the year ended December 31, 2007, we gave bonuses to our officers and employees of $10.2 million. We had previously made provisions for a 2008 bonus of approximately $15.1 million. The elimination of the bonus was offset by an increase in salaries and related expenses of $4.3 million due to increases in staff levels, which increased to approximately 170 employees at December 31, 2008 from approximately 130 employees at December 31, 2007, to manage the growth of our business. Higher non-cash stock-based compensation, which increased to $2.4 million from $0.5 million for the years ended December 31, 2008 and 2007, respectively, also added to the increase in salaries and related expenses.
Loss from sale of vessels
The loss in 2007 represents the sale, on March 13, 2007, of the vessel Maya Princess for $13.0 million. The loss on sale was $0.8 million after deducting the cost of vessel and improvements less accumulated depreciation, and other closing costs.
Income from operations
The increase in income from operations was mainly attributable to an increase in revenue resulting from increased freight rates and increased revenue tons carried. Freight and charter hire rates increased due to strong market conditions in the ocean transport industry through September 30, 2008. The charter hire rates declined during the fourth quarter of 2008 which partially offset earlier revenue increases. Operating expenses increased in 2008 as previously described for voyage expense, vessel expense, depreciation, and general and administrative expenses. The increase in revenue was greater than the increase in operating expenses causing our operating margin to increase to 34.2% for 2008 from 28.7% for 2007.
Interest expense
Interest expense increased $6.8 million for the year ended December 31, 2008 as compared to the same period in 2007 principally due to higher debt levels, increased costs related to our interest swap contracts and higher bank fees. These increases were offset by a reduction in interest rates and a decrease in our borrowing costs when we repaid our capital lease obligation with loan proceeds having lower borrowing costs. Our average effective interest rate decreased to approximately 5.5% for 2008 compared to approximately 8.1% for 2007.
For the year ended December 31, 2008, our debt levels averaged $280.2 million as compared to $114.5 million during the same period in 2007. The increase in the average debt level for 2008 is attributable to debt incurred to fund vessel acquisitions and $75.0 million borrowed during the fourth quarter of 2008 under the Bank of America revolving credit facility. During 2008, we capitalized interest of $3.6 million directly related to The Royal Bank of Scotland credit facility for the new vessel building program and interest of $2.3 million imputed on construction in progress payments funded with cash flows from operations and other debt, as required by generally accepted accounting principals.
Loss on extinguishment of debt
The $2.3 million loss on extinguishment of debt in 2008 was due to the write-off of unamortized deferred financing costs incurred in connection with the March 2008 refinancing of our original Bank of America credit facility.
Gain on sale and insurance recovery of vessel
The Huron Maiden was severely damaged in a grounding accident on an uncharted rock while on passage near Indonesia on March 9, 2007. On April 4, 2007, the vessel was declared a constructive total loss. Accordingly, we received a net amount of $8.0 million from our Hull & Machinery/Increased Value insurances after a scrap value credit of $2.0 million. We retained the proceeds on the sale of the vessel for scrap, which was sold and delivered to the buyer on May 4, 2007 for $2.8 million. After deducting the cost of vessel and improvements less accumulated depreciation and expenses incurred in connection with the accident and sale of the vessel we realized a gain on the sale of the vessel and insurance recovery of approximately $6.0 million.
Balance Sheet
December 31, 2009 as compared to December 31, 2008
Charter Hire Receivables
Our gross charter hire receivables balance at December 31, 2009 and December 31, 2008 was $35.6 million ($34.6 million after the allowance for doubtful accounts of $1.0 million and $46.3 million ($45.8 million after the allowance for doubtful accounts of $0.5 million), respectively.
In accordance with our bad debt allowance policy, we identify specific receivables that we believe will be difficult to collect and create allowances for those receivables. The aggregate allowance totaled $1.0 million at December 31, 2009 and $0.5 million at December 31, 2008. Charter receivable balances at December 31, 2009 are lower than the previous year due in part to lower average revenue per voyage and tighter collections efforts.
Fuel and Other Inventories
Fuel and other inventories at December 31, 2009 increased $2.9 million to $15.0 million from the December 31, 2008 balance of $12.1 million. Approximately $2.5 million of the increase was due to an increase in the average fuel prices at December 31, 2009 as compared to December 31, 2008, which was partially offset by a $0.5 million decrease caused by lower quantities of fuel on board the vessels and a lower number of vessels with fuel inventory at December 31, 2009 as compared to December 31, 2008. At December 31, 2009, the combined average price for industrial fuel oil/marine diesel oil increased $133 per metric ton to $503 per metric ton from $370 per metric ton at December 31, 2008. Changes in fuel quantities result principally from the timing of vessel refueling and the number of vessels having fuel inventory. The number of vessels having fuel inventory will fluctuate from period to period based on the number of vessels on time charter. When a vessel is time chartered out, the fuel on board the vessel is sold to the charterer and later repurchased at a price stipulated in the charter party agreement. Vessels having fuel included in inventory decreased to 32 vessels as of December 31, 2009, as compared to 37 vessels as of December 31, 2008. The remaining increase in fuel and other inventories at December 31, 2009 as compared to December 31, 2008, was due to an $0.9 million increase in lubricating oil on board vessels at December 31, 2009. The increase is principally due to the timing of lubricating oil deliveries to the vessels.
Off-Balance Sheet Arrangements
At December 31, 2009 we had outstanding, interest rate swap agreements having a total notional amount of $186.7 million. See "Item 7A Quantitative and Qualitative Disclosures about Market Risk" for additional information.
Other Commitments
Our contractual obligations as of December 31, 2009 are shown in the following table (in thousands):
| | | Total | | | Less than 1 year | | | 1-3 years | | | 3-5 years | | | More than 5 years | |
| | | | | | | | | | | | | | | | |
| Debt Obligations (1) | | $ | 351,247 | | | $ | 73,541 | | | $ | 175,101 | | | $ | 45,873 | | | $ | 56,732 | |
| Estimated variable interest payments (2 ) | | | 63,332 | | | | 22,013 | | | | 26,466 | | | | 11,630 | | | $ | 3,223 | |
| Operating lease obligations (3) | | | 25,325 | | | | 6,890 | | | | 12,125 | | | | 6,310 | | | | | |
| Other newbuild program obligations (4) (5) | | | 67,100 | | | | 51,400 | | | | 15,700 | | | | | | | | | |
| Total contractual cash obligations | | $ | 507,004 | | | $ | 153,844 | | | $ | 229,392 | | | $ | 63,813 | | | $ | 59,955 | |
| | | | | | | | | | | | | | | | | | | | | |
| (1) | As of December 31, 2009, we had $351.2 million of indebtedness outstanding under loans to our subsidiaries that we guarantee, $28.7 million under the $40.0 million credit facility with Credit Suisse, $35.9 million under the $75.0 million credit facility with DVB Group Merchant Bank (Asia) Ltd., $19.2 million under the $35.0 million credit facility with AIG Commercial Equipment Finance, $76.0 million under the $142.5 term loan with Bank of America, $75.0 million under the $85.0 million revolving credit facility with Bank of America, $4.5 million under the $12.5 million credit facility with Commerzbank AG, $8.1 million under the $13.0 million credit facility with Berenberg Bank and $103.8 million under the $150.0 million credit facility with The Royal Bank of Scotland for the new vessel building program. The above schedule does not reflect future advances of $45.0 million under the $150.0 million credit facility with The Royal Bank of Scotland for the new vessel building. The long-term portion of the debt obligations on the above table have not been reclassified to current debt, but see Footnote 11 – Financing, Debt Reclassification. If the debt obligations of $351.2 million were reclassified to current debt and shown as being due in the less than one year column, “Total contractual cash obligations” on the above table would have been as follows: less than one year, $431.6 million; 1-3 years, $27.8 million; 3-5 years, $6.3 million; and more than 5 years, $2.6 million. |
| (2) | Amounts for all periods represent our estimated future interest payments on our debt facilities based upon amounts outstanding at December 31, 2009 and an annual interest rate of 7.0%, which approximates the average interest rate on all outstanding debt at December 31, 2009. |
| (3) | Operating lease obligations includes obligations under two seven-year bareboat charters for the Seminole Princess and the Laguna Belle and office leases. |
| (4) | Approximately $45.0 million of the purchase obligation for the new vessels will be funded under the $150.0 million credit facility with The Royal Bank of Scotland for the newbuilding program. Under the loan modification construction advances made during the covenant waiver period are subject to adjustment if the amount scheduled for advance by the lenders, exceeds 75% of the value of the vessel, as determined by a valuation of similar size and type ship and due to be delivered at the same time as the ship in construction. We had outstanding purchase obligations to the shipyard at December 31, 2009 on the purchase of the five remaining vessels to be delivered as follows (in thousands): |
| Owning Subsidiary | | Hull Number | | Total | | | Less than 1 year | | | 1-3 years | |
| | | | | | | | | | | | |
| Argyle Maritime Corp. | | NYHS200720 - Rockaway | | $ | | | | $ | | | | $ | | |
| Caton Maritime Corp. | | NYHS200721 - Dakota | | | 7,600 | | | | 7,600 | | | | | |
| Dorchester Maritime Corp. | | NYHS200722 - Montauk | | | 7,800 | | | | 7,800 | | | | | |
| Longwoods Maritime Corp. | | NYHS200723 | | | 14,800 | | | | 7,000 | | | | 7,800 | |
| McHenry Maritime Corp. | | NYHS200724- Omaha | | | 14,800 | | | | 14,800 | | | | | |
| Sunswyck Maritime Corp. | | NYHS200725 | | | 21,800 | | | | 14,000 | | | | 7,800 | |
| | | Total | | $ | 66,800 | | | $ | 51,200 | | | $ | 15,600 | |
| (5) | In connection with the newbuilding program, we entered into a contract for the supervision and inspection of vessels under construction. As of December 31, 2009, commitments under the contract were $0.3 million, with $0.2 million due within one year and $0.1 million due between one and three years. |
Liquidity and Capital Resources
Our ability to fund operating expenses and capital expenditures and our ability to make scheduled payments of interest and to satisfy any other present or future debt obligations will depend on future operating performance, prevailing economic conditions and financial and other factors beyond our control, including those disclosed below and under "Item 1A. Risk Factors."
Our principal sources of funds are operating cash flows and long-term bank borrowings. Our principal uses of funds are expenditures to operate our fleet of vessels, capital expenditures to maintain the quality of our fleet and keep us in compliance with international shipping standards and regulations, and to pay principal and interest on outstanding debt. Through the first three quarters of 2009, we continued to experience lower freight rates as a result of the global financial crisis, which began in 2008. Additionally, there was a corresponding reduction in the demand for our services, which began to stabilize in December 2009. Consequently, our operating cash flows were adversely impacted.
Management continued its efforts to mitigate the impact of the economic decline by extending many of the actions it took at the beginning of the financial crisis in late 2008. These actions included but were not limited to freezing salaries at 2008 levels; scaling back our steel renewal and reinforcement during drydocking program; suspending the purchase of second-hand bulk carriers and reducing capital expenditures. Resumption of the acquisition of vessels will be subject to improvement in global economic conditions, management’s expectations, and the availability of funding on favorable terms. Our business is capital intensive, and our future success will still depend on our ability to maintain a high-quality fleet through the ongoing maintenance of our currently owned ships and, in the long term, the acquisition of additional ships. We believe our current cost control initiatives will not impact our long term goals.
The economic downturn and its effect on the market value of vessels gave an indication of possible collateral coverage (loan to value) ratio and financial covenant issues in 2009. In the fourth quarter of 2008 we decided to prepay certain loans, and we initiated discussions with our lenders to obtain waivers to the collateral and other financial covenants. Our various debt agreements contain both financial and non-financial covenants, and include customary restrictions on our ability to incur indebtedness or grant liens, pay dividends under certain circumstances, enter into transactions with affiliates, merge, consolidate, or dispose of assets, and change the nature of our business. The financial covenants require that we maintain certain fixed charge and leverage ratios, as well as maintain tangible net worth within defined limits. We are also required to maintain minimum cash and cash equivalent balances and collateral coverage. In addition, certain credit agreements restrict the payment of dividends, and the amount of leverage, investment and capital expenditures we may undertake without consent of the lender. Further, mandatory prepayment or delivery of additional security is required in the event that the fair market value of the vessels falls below limits specified in the loan agreement.
We concluded in early 2009, that due to the downturn in the shipping market and based on third-party vessel valuations we would not meet our collateral coverage requirements. Consequently, we obtained waivers from all of our lenders to the collateral coverage ratio and financial covenants through January 1, 2010. As a result of the loan modification two additional covenants were introduced that required us to have a minimum end of month cash balance of not less than $40.0 million during 2009 and earnings before interest, depreciation and amortization or EBITDA to interest expense ratio of not less than:
| 1.10 to 1.00 | EBITDA for the two fiscal quarters ended June 30, 2009 to interest expense for the same period; |
| 1.35 to 1.00 | EBITDA for the three fiscal quarters ended September 30, 2009 to interest expense for the same period; and |
| 1.75 to 1.00 | EBITDA for the four fiscal quarters ended December 31, 2009 to interest expense for the same period. |
Each of the additional covenants were met in 2009. In late December 2009, while economic conditions continued to improve, we concluded that based upon internal projections and the four quarter look back methodology used in computing the ratios, it was probable that we would violate the leverage and fixed charge coverage ratios once the waivers expired on January 1, 2010. Accordingly, we obtained from all of our lenders an extension of the waivers until April 1, 2010. In connection with these waivers, the minimum end of month cash balance was reduced from $40.0 million to $25.0 million. The additional covenants are applicable through the extended waiver period. As long as the two additional covenants are met, the financial covenants described in the table below are waived.
| Covenant | | Required | Actual |
| | | | |
| Minimum Consolidated Tangible Net Worth | | $235 million plus 75% of net income per quarter for all quarters after September 30, 2007, with no reduction for losses, plus 100% of increases to shareholders equity for the issuance of stock. At December 31, 2009, a Consolidated Tangible Net Worth of $501.0 million. | $522.0 million |
| | | | |
| Maximum Consolidated Leverage Ratio | | Not more than a ratio of 3.00 to 1.00 of Consolidated Funded Indebtedness, as defined in the loan agreements, at the end of a quarter to Consolidated EBITDA for the four previous quarters. | 5.93 to 1.00 waived |
| | | | |
| Minimum Consolidated Fixed Charge Coverage Ratio | | Not less than a ratio of 1.50 to 1.00 of Consolidated EBITDA for the four previous quarters to Consolidated interest expense for the same period plus regularly scheduled debt payments for the following 12 months | 0.48 to 1.00 waived |
| | | | |
| Minimum Cash Liquidity | | Qualified cash of $15.0 million, [$10.0 million under the AIG credit facility] [Qualified cash is defined in the agreement as cash and cash equivalents plus the available unused portion under the revolving credit facility] | $51.0 million |
Although we were in compliance with all modified additional covenants on December 31, 2009 and the debt was not and is not currently callable by the lenders absent the waivers, we would have been in violation of the previously effective minimum consolidated fixed charge coverage ratio and the maximum consolidate leverage ratio as shown above. Based on current internal projections, we anticipate that we will not meet certain of the reinstated covenant requirements during the next 12 months. Generally accepted accounting principles require that long-term loans be classified as a current liability when either a covenant violation that gives the lender the right to call the debt has occurred at the balance sheet date, or such a covenant violation would have occurred absent a waiver of those covenants, and in either case it is probable that the covenant violation will not be cured within the next 12 months. Accordingly, long-term loans are classified as a current liability in the consolidated balance sheet at December 31, 2009. If and when we are able to obtain alternative financing or modifications to our credit facilities, we expect to reclassify the portion of our outstanding debt that is scheduled to come due in more than one year as long-term debt on our consolidated balance sheet.
We are actively pursuing a more permanent borrowing solution, which may include obtaining alternative financingor modifications to, or repayment of, our existing credit facilities. In conjunction with any alternative financing or modifications, additional future borrowings may be reduced. We cannot make assurances that we will be able to obtain such financing or modifications to the credit facilities. Failure to do so would result in a default, which would enable the lenders to accelerate the timing of payments and exercise their lien on essentially all of our assets, which would have a material adverse effect on our business, operations, financial condition and liquidity and would raise substantial doubt about our ability to continue as a going concern.
On December 31, 2009, our cash balance was $51.0 million, which excludes $8.7 million of restricted cash on deposit with The Royal Bank of Scotland to be used to pay our portion of installments due under our shipbuilding contracts. The $8.7 million is not counted toward the $25.0 million end of month cash balance requirement that we are required to maintain under our loan agreements. The $8.7 million of restricted cash will decrease as payments are made to the shipyard. Additionally, we have $10.0 million available, subject to collateral limits, on the BA Revolving Credit Facility, which expires on March 26, 2012.
We are not certain about whether we will have sufficient liquidity to meet our needs for operating cash for fiscal year ending December 31, 2010. We expect that our ability to meet such needs will depend primarily on our cash balance at December 31, 2009 of $51.0 million, our 2010 operating cash flows; our ability to borrow under our existing credit facilities and our ability to secure additional or replacement financing for our business.
Below is a summary of investing and financing activities for the years ended December 31, 2009 and 2008:
Financing Activities 2009
| · | We made scheduled debt repayments totaling $7.5 million; |
| · | We prepaid principal payments in the amount of $53.5 million, consisting of $3.0 million to Credit Suisse, $19.6 million to DVB, $19.0 million to Bank of America, $7.9 million to AIG, $2.0 million to Commerzbank, $0.4 million to The Royal Bank of Scotland and $1.6 million to Berenberg Bank; |
| · | We borrowed an additional $29.2 million under our $150.0 million credit facility with The Royal Bank of Scotland to fund construction payments due on the building of the new multipurpose vessels with retractable tweendecks. At December 31, 2009, we had total borrowings under the credit facility of $103.8 million with $46.2 million available for future drawdown upon the ship yard meeting specific construction milestones; |
| · | We paid $3.4 million of deferred financing and leasing costs |
Investing Activities 2009
Using capital from operations and borrowings, we made the following acquisitions and capital improvements:
| | | For the Year Ended | |
| | | December 31, | |
| | | 2009 | | | 2008 | |
| | | (in millions) | |
| | | | | | | |
| Vessels purchased | | $ | 39.8 | | | $ | 313.7 | |
| Vessel improvements and other equipment | | | 29.3 | | | | 49.3 | |
| Construction in progress | | | 44.5 | | | | 63.2 | |
| Amount reclassed from construction in progress to vessels | | | (39.8 | ) | | | 0.0 | |
| Other fixed assets | | | 2.0 | | | | 3.5 | |
| Sub total | | | 75.8 | | | | 429.7 | |
| Less: Vessel deposits paid in prior years | | | | | | | (14.8 | ) |
| Total Vessel acquisitions / capital improvement | | $ | 75.8 | | | $ | 414.9 | |
| | | | | | | | | |
| · | In connection with our new vessel construction program we made payments to the ship building yard and incurred capitalized costs totaling $44.5 million. During the third quarter the Rockaway Belle, which is the first of the six vessels being built, was delivered. Three of the remaining vessels are scheduled to be delivered in 2010, with the remaining two vessels scheduled to be delivered in 2011. The project is being funded from our $150.0 million credit facility with The Royal Bank of Scotland and operating cash flows. |
| · | In connection with the March 2009 amendment to The Royal Bank of Scotland Credit Facility, we were required to deposit $20.0 million with The Royal Bank of Scotland after the signing of the loan modification to be used to pay our portion of the 2009 newbuild installment payments that are not funded by The Royal Bank of Scotland new building credit facility. The restricted cash balance decreases as payments are made to the shipyard in 2009. For the year ended December 31, 2009, payments of approximately $11.3 million were made to the shipyard from the $20.0 million of restricted cash. |
| · | We spent $29.3 million for vessel improvements and vessel equipment. Vessel improvements and other equipment include steel renewal and replacement, major overhauls, new equipment, and takeover costs, including the cost of first drydocking after acquisition. |
| · | We spent $2.0 million in other assets. |
Financing Activities 2008
During 2008, we increased our working capital by the following activities:
| · | We made debt repayments totaling $183.5 million consisting of $58.3 million in scheduled debt principal payments and $125.2 million to payoff our former credit facilities with Bank of America and The Royal Bank of Scotland. |
| · | We prepaid principal payments due in 2009 totaling $26.6 million consisting of $3.0 million to Credit Suisse, $19.0 million to Bank of America, $3.0 million to Commerzbank AG, and $1.6 million to Berenberg Bank. |
| · | In June, we received $95.7 million in net proceeds from a secondary offering of Class A common shares of TBS International Ltd. |
| · | We borrowed $12.5 million from Commerzbank AG in June. The proceeds of this loan, together with working capital, were used to purchase the vessel Caribe Maiden. |
| · | Also in June, we borrowed $13.0 million from Berenberg Bank. The proceeds of this loan together with working capital were used to purchase the vessel Ottawa Princess. |
| · | In March, we amended and restated our existing Bank of America Credit Facility. In connection with the amendment, we increased the term loan facility to $142.5 million and the revolving credit facility to $125.0 million. We borrowed $142.5 million under the term loan credit facility to repay the existing credit facility and pay closing costs and fees. After the repayment of principal, interest and fees, the remaining amount of $18.9 million was used for general corporate purposes. At December 31, we have drawn down $75.0 million under our revolving credit facility. |
| · | We borrowed an additional $20.0 million in February, and $20.0 million in December 2008 under our $150.0 million credit facility with The Royal Bank of Scotland to fund the construction payments due on the building of six new multipurpose vessels with retractable tweendecks. |
| · | In February, we borrowed the remaining $20.0 million available under the Credit Suisse credit facility. The proceeds of this loan, together with available working capital, were used to purchase the vessel Oneida Princess. |
| · | We borrowed $35.0 million from AIG Commercial Equipment Finance, Inc. in February to replenish operating funds used to purchase the Mohave Maiden, Zuni Princess and Hopi Princess. |
| · | In January, we borrowed $75.0 million, under a syndicated credited facility with DVB Group Merchant Bank (Asia) Ltd. The proceeds were used to replenish funds used to exercise a purchase option for seven tweendeck vessels chartered-in under a sale-leaseback arrangement, to fund additional vessel acquisitions and for general corporate purposes. |
Investing Activities 2008
Using capital from operations and borrowings, we made the following acquisitions and capital improvements:
| | | For the Year Ended | |
| | | December 31, | |
| | | 2008 | | | 2007 | |
| | | (in millions) | |
| | | | | | | |
| Vessels purchased | | $ | 313.7 | | | $ | 88.4 | |
| Vessel improvements and other equipment | | | 49.3 | | | | 44.4 | |
| Construction in progress | | | 63.2 | | | | 60.6 | |
| Other fixed assets | | | 3.5 | | | | 3.9 | |
| Sub total | | | 429.7 | | | | 197.3 | |
| Less: Vessel deposits paid in prior years | | | (14.8 | ) | | | (1.7 | ) |
| Total Vessel acquisitions / capital improvement | | $ | 414.9 | | | $ | 195.6 | |
| · | We acquired eleven vessels that were delivered during the year ended December 31 2008 for a total purchase price of $313.7 million, including $14.8 million in deposits paid in 2007. We used cash from borrowings and operations to fund the acquisitions. |
| · | We spent $49.3 million for vessel improvements and vessel equipment. Vessel improvements and other equipment includes steel renewal and replacement, major overhauls, new equipment, and takeover costs, including the cost of first drydocking after acquisition. |
| · | In connection with our construction program to build six newly designed multipurpose vessels with retractable tweendecks, we made payments to the ship building yard and incurred capitalized costs totaling $63.2 million. These ships were designed by a TBS team drawn from all phases of our operations specifically to optimize our efficient cargo transportation in our trade lanes, support the requirements of our customer base and enhance the growth of our business. Two of the vessels are scheduled for delivery in 2009, and four vessels are scheduled for delivery in 2010. The project is being funded from our $150.0 million credit facility with The Royal Bank of Scotland and operating cash flow. |
Dividend Policy
We have not declared or paid and do not anticipate declaring or paying any cash dividends on our ordinary shares in the foreseeable future. Because we are a holding company with no material assets other than the stock of our subsidiaries, our ability to pay dividends will depend on the earnings and cash flow of our subsidiaries and their ability to pay dividends to us. The provisions of some of our debt instruments and related loan agreements prevent some of our subsidiaries from paying dividends to TBSI, which may restrict our ability to pay dividends on our ordinary shares. The timing and amount of future cash dividends, if any, would be determined by our Board of Directors and would depend upon our earnings, financial condition, cash requirements, obligations to lenders at the time and other factors that our Board of Directors may deem relevant, as well as our ability to pay dividends in compliance with Irish law.
Under Irish law, TBS International plc must have “distributable reserves” in its unconsolidated balance sheet prepared in accordance with the Irish Companies Acts to enable it to pay cash dividends or buy back shares in the future. Our shareholders passed a resolution that created “distributable reserves” in accordance with Irish law.
Significant Related Party Transactions
Certain of our key executive officers control each of TBS Commercial Group and Beacon Holdings. We have established long-term commercial and operational relationships with other commercial agency service companies that are located in various overseas ports in which we conduct our business. The majority of these companies are wholly- or partly-owned direct or indirect subsidiaries of either TBS Commercial Group or Beacon Holdings. We believe that the transactions described below are on terms no less favorable than those that could be obtained pursuant to arm's-length negotiations with independent third parties. Under the arrangements with these commercial agents, we generally pay a commission on freight revenue booked by the agent, which is based upon market rates, and on certain freights where they attend to the receivers of the cargo. Commissions paid to TBS Commercial Group and Beacon Holdings for commercial agency services were approximately $5.9 million, $14.6 million and $7.1 million for the years ended December 31, 2009, 2008, and 2007, respectively. Port agency fees paid to TBS Commercial Group and Beacon Holdings are for agents to attend to vessels while in port and are based on market rates for such services. For the years ended December 31, 2009, 2008, and 2007, we paid approximately $1.9 million, $2.2 million and $1.0 million respectively.
TBS Commercial Group made payments for consulting fees of $60,000 to Lawrence A. Blatte, who is an Executive Vice President, during 2007.
Globe Maritime Limited ("Globe") occasionally acts as a broker for chartering and vessel sales and purchases. Globe is owned by James W. Bayley who is an officer of International and member of International's Board of Directors. During 2009, 2008 and 2007, we paid Globe approximately $0.1 million, $1.2 million and $0.2 million, respectively.
TBS Shipping Services maintains an office in Yonkers, New York that is leased from our chairman and chief executive officer, Joseph E. Royce. During 2009, 2008 and 2007, payments to Mr. Royce, as required under the lease, totaled $240,000 per year.
Our board of directors has delegated authority to the Compensation Committee to review and approve or ratify on an annual basis all transactions with our executive officers, directors, and affiliates.
Summary of Critical Accounting Policies
The discussion and analysis of our financial condition and results of operations is based upon our consolidated financial statements, which have been prepared in accordance with accounting principles generally accepted in the United States, or GAAP. The preparation of those financial statements requires us to make estimates and judgments that affect the reported amount of assets and liabilities, revenues and expenses and related disclosure of contingent assets and liabilities at the date of our financial statements. Actual results may differ from these estimates under different assumptions or conditions.
Critical accounting policies are those that reflect significant judgments or uncertainties and could result in materially different results under different assumptions and conditions. We have described below what we believe are our most critical accounting policies that involve a high degree of judgment and the methods of their application. For a description of all of our significant accounting policies, see "Note 2 —Summary of Significant Accounting Policies" to our consolidated financial statements.
Allowance for doubtful accounts
We assess the recoverability of doubtful accounts, and we create an allowance for the possibility of non-recoverability. Although we believe our allowances to be based on fair judgment at the time of their creation, it is possible that an amount under dispute is not recovered and the estimated allowance for doubtful recoverability is inadequate.
Claims Receivable
Claims receivable represent claims for reimbursement of expenses incurred that have been or will be made under our hull and machinery and P&I insurance coverage. We record the probable amount that we expect to recover from insurance, net of the applicable deductible.
Fuel and Other Inventories
Fuel and other inventories, consisting primarily of fuel, lubricating oil and spare parts aboard the vessels, are valued at the lower of cost (determined using a first-in, first-out basis for fuel and a weighted average basis for lubricating oil and spare parts) or market.
Depreciation
Vessels are stated at cost, which includes contract price and other direct costs relating to acquiring and placing the vessels in service, less accumulated depreciation. Major vessel improvements are capitalized and depreciated over the remaining useful lives of the vessels. Depreciation on vessels is calculated, based on cost less estimated residual value, using the straight-line method over the remaining useful life of the vessel. Salvage, or scrap, value is based on a vessel’s lightweight tonnage multiplied by a scrap rate. We use a scrap rate of $180 per lightweight tonnage, which may differ from actual salvage rates. Depreciation on vessel improvements is calculated using the straight-line method over the remaining useful life of the vessel. The remaining useful life of each vessel is estimated as the period from the date the vessel is put in service to the date 30 years from the time that the vessel was initially delivered by the shipyard. Maintenance and repair costs that do not improve or extend the useful lives of the vessels, other than dry dock costs discussed below, are expensed as incurred.
Vessel construction in progress
We capitalize direct and indirect costs clearly associated with the development, design, and construction of the vessels as these costs have a future benefit. Costs include installments paid to the shipyard, payments made to third parties in connection with the vessel construction program and interest costs incurred during the construction period, which is defined as the period from the start of construction until the date that each vessel is substantially complete and ready for use.
Drydocking
Within the shipping industry, two methods are used to account for drydockings: (1) the deferral method, in which drydocking costs are capitalized and then amortized over the period to the next scheduled drydocking, and (2) the incurred method, in which drydocking costs are expensed as incurred. We use the deferral method and amortize drydocking costs on a straight-line basis over the period through the date of the next drydocking, which is typically 30 months. We include in deferred drydocking costs those costs that are incurred as part of the drydocking to meet regulatory requirements, or are expenditures that either; add economic life to the vessel, increase the vessel’s earnings capacity or improve the vessel’s efficiency. Normal repairs and maintenance, whether incurred as part of the drydocking or not are expensed as incurred. We believe the deferral method better matches costs with revenue than expensing the costs as incurred. We use judgment when estimating the period between drydocks performed, which can result in adjustments to the estimated amortization of drydock expense if the subsequent drydock is done earlier than anticipated.
Valuation of Long-Lived Assets and Goodwill
As of December 31, 2009, due to the improving current economic conditions and their impact on the shipping industry, which has resulted in an improvement and stabilization of charter rates, we concluded that there is presently no indication of possible impairment of long-lived assets and goodwill.
In accordance with the guidance outlined in ASC Topic 360-Property, Plant and Equipment, we perform tests for impairment of long-lived assets whenever events or circumstances, such as significant changes in charter rates or vessel valuations, suggest that long-lived assets may not be recoverable. An analysis of long-lived assets differs from our goodwill analysis in that impairment is only deemed to have occurred if the sum of the forecasted undiscounted future cash flows related to the assets is less than the carrying value of the assets we are testing for impairment. If the forecasted cash flows from long-lived assets are less than the carrying value of such assets, then we must write down the carrying value to its estimated fair value.
Due to the economic crisis, and the resulting decline in spot shipping rates that started in late 2008 and carried into 2009, together with the decline in our market capitalization, we concluded that there was a possible indication of impairment of long-lived assets at December 31, 2008 and prepared an analysis. Forecasting future cash flows involves the use of significant estimates and assumptions. Revenue and expense assumptions used in the cash flow projections are consistent with internal projections and reflected our economic outlook at the time of preparation. The cash flow period used was based on the remaining lives of the vessels, which ranged from 4 to 30 years. As of the December 31, 2008 analysis, there was no impairment of long-lived assets.
During 2009, we continued to monitor the overall shipping market including freight and charter rates. Based on our observations, we believe that the assumptions used in our December 31, 2008 impairment analysis are still applicable and there have not been any significant changes in events or circumstances. Consequently, we have concluded that there are no new triggering events requiring an additional impairment analysis during 2009 and there is no impairment to our fleet at December 31, 2009. Future events or circumstances, which could require us to perform updated tests for impairment, may cause us to conclude that impairment of our fleet exists.
The provisions of ASC Topic 350 – Intangible – Goodwill and Other require that an annual impairment test be performed on goodwill. We perform our annual impairment analysis of goodwill on May 31st of each year, or more often if there are indicators of impairment present. The first of two steps require us to compare the reporting unit’s carrying value of net assets to their fair value. If the fair value exceeds the carrying value, goodwill is considered not impaired and we are not required to perform further testing. If the carrying value of the net assets exceeds the fair value, then we must perform the second step of the impairment test in order to determine the implied fair value of goodwill. If the carrying value of goodwill exceeds its implied fair value, then we are required to record an impairment loss equal to the difference.
Determining the reporting unit’s fair value involves the use of significant estimates and assumptions. The reporting unit consists of the companies acquired in connection with the initial public offering that created goodwill of $8.4 million. We estimate the fair value using income and market approaches through the application of discounted cash flow. We performed our annual analysis at May 31, 2009 by: (a) updating our 2009 budgeted cash flow based on actual results, (b) updating our forecast for years 2010 through 2013 based on changes made to our cash flow estimates, (c) updating our estimates of the weighted-average cost of capital. From the time we performed our analysis at May 31, 2009 until December 31, 2009, there were no changes in circumstances that necessitated further goodwill impairment testing, and we concluded that there was no indication of goodwill impairment at December 31, 2009.
Deferred Financing Costs
Deferred financing costs are amortized over the term of the related financing using the straight-line method, which we believe, is not materially different than the effective interest method. Fees incurred in a refinancing of existing loans, which results in an extinguishment of the debt, are written off and included in the gain or loss on extinguishment of debt.
Leases
Leases are classified as either capital or operating. Those leases that transfer substantially all the benefits and risks of ownership of property to us are accounted for as capital leases. All other leases are accounted for as operating leases. Capital leases are accounted for as assets and are fully amortized on a straight-line basis over the expected useful life of the assets. Commitments to repay the principal amounts arising under capital lease obligations are included in current liabilities to the extent that the amount is repayable within one year; otherwise the principal is included in amounts due after one year. The capitalized lease obligation reflects the present value of future lease payments. The financing element of the lease payments is charged to income over the term of the lease. Deferred leasing costs are amortized over the term of the lease using the straight-line method, which is not materially different than the effective interest method. Rental expense, for leases classified as operating and that contain predetermined fixed decreases of minimum rentals during the term of the lease, is recognized on a straight-line basis over the life of the lease, beginning with the point at which we obtain control and possession of the leased properties. The difference between the amounts charged to operations and amounts paid is recorded as deferred rent expense.
Revenue recognition
Revenue is generally recorded when services are rendered, we have a signed charter agreement or other evidence of an arrangement, pricing is fixed or determinable and collection is reasonably assured. We generally employ our vessels under time or voyage charters. With time charters, we receive a fixed charter hire per on-hire day and are responsible for meeting all the vessel operating expenses such as crew costs, insurance, stores and lubricants and repairs and maintenance. Time charter revenues are recorded over the term of the charter as service is provided. Revenue from time charters in progress at year end is calculated using the daily charter hire rate, net of daily expenses, multiplied by the number of voyage days on-hire through year end.
In the case of voyage charters, the vessel is contracted for a voyage between two or more ports. We are paid for the cargo transported and we pay all voyage expenses, such as fuel, port call expenses and commissions, as well as all vessel operating expenses. Prior to 2008, the revenues and related voyage expenses for voyages in progress were recognized on the percentage of service completed at the balance sheet date by prorating the estimated final voyage revenue and expenses using the ratio of voyage days completed through the balance sheet date to total voyage days. For voyages in progress at December 31, 2009 and 2008, we recognized voyage expense as incurred and recognized voyage revenues ratably over the length of the voyage, all in accordance with the guidance outlined in ASC Topic 605 —Revenue Recognition. The effects in 2007 of recognizing voyage expenses ratably over the length of each voyage was not materially different from the method of recognizing such costs as incurred. Probable losses on voyages are provided for in full at the time such losses can be estimated. A voyage is deemed to commence upon the completion of discharge of the vessel's previous cargo and is deemed to end upon the completion of discharge of the current cargo. Vessel operating expenses for both voyage and time charters are expensed as incurred.
Stock Based Compensation
The Company accounts for stock based compensation in accordance with the guidelines outlined in ASC Topic 718 – Compensation – Stock Compensation using the modified prospective method which requires measurement of compensation cost for all stock-based awards at fair value on the date of grant and recognition of compensation over the service period for awards expected to vest.
Earnings Per Share
Basic earnings (loss) per ordinary share are computed using the two-class method for share-based payment transactions, which are participating securities. The two-class method of computing earnings per share is an earnings allocation formula that determines earnings per share for ordinary stock and any participating securities according to dividends declared (whether paid or unpaid) and participation rights in undistributed earnings. Our non-vested stock, consisting of time-vested restricted shares, are considered participating securities since the share-based awards contain a non-forfeitable right to dividends irrespective of whether the awards ultimately vest.
Fair Value of Financial Instruments
Financial instruments, which potentially subject us to concentrations of credit risk, consist principally of cash equivalents, charter hire receivables and debt. We place our cash equivalents with a number of financial institutions to help limit the amount of credit exposure to any one financial institution. Concentrations of credit risk with respect to trade receivables are limited due to the large number of customers comprising our customer base, and their dispersion across many geographic areas. As of December 31, 2009 and 2008, one customer accounted for 11.7% and 7.7%, respectively, of charter hire receivables.
The following method and assumptions were used to estimate the fair value of financial instruments included in the following categories:
| · | Cash and cash equivalents, charter hire and claims receivable - The carrying amount reported in the accompanying consolidated balance sheets for cash and cash equivalents, charter hire and claims receivable approximates their fair value due to the current maturities. |
| · | Short-term debt - The carrying amount reported in the accompanying consolidated balance sheets for short-term debt approximates its fair value due to the current maturity of such instruments and their variable rates. |
| · | Long-term debt - The carrying amount of our long-term debt, which was reclassified to short-term in our 2009 balance sheet, approximates fair value due to the variable interest rates on bank borrowings and based on the current rates offered to us for debt of the same remaining maturities. |
| · | Interest Rate Swaps - We utilize certain derivative financial instruments to manage interest rate risk. Derivative instruments are entered into for periods consistent with related underlying exposures and do not constitute positions independent of those exposures. We do not enter into contracts for speculative purposes, nor are we a party to any leveraged derivative instruments. We are exposed to credit loss in the event of nonperformance by the counterparties on derivative contracts. We minimize our credit risk on these transactions by dealing with several financial institutions and, therefore, we do not anticipate nonperformance. |
Foreign Currency Transactions
The financial statements are expressed in United States dollars. Gains and losses resulting from foreign currency transactions, which are not significant, are included in other income.
Financial Derivative Instruments and Hedging Activities
We seek to manage our interest rate risk associated with variable rate borrowings with the use of derivative financial instruments. We account for derivative financial instruments in accordance with the guidance outlined in ASC Topic 815 – Derivatives and Hedging. The fair value of derivative financial instruments are recognized as assets or liabilities at each balance sheet date, with changes in fair value affecting net income (loss) or comprehensive income (loss) as applicable. We do not purchase or hold any derivative instruments for trading purposes.
New Accounting Pronouncements
In June 2009, the FASB issued the FASB Accounting Standards Codification (ASC), The Codification and the Hierarchy of Generally Accepted Accounting Principles Topic ASC 105-10. We implemented the guidance in the third quarter of 2009, which stipulates that the Codification as the authoritative version of the FASB Accounting Standards Codification (Codification) as the single source of authoritative nongovernmental U.S. GAAP. The statement is effective for interim and annual periods ending after September 15, 2009. We have updated our references to GAAP in our consolidated financial statements issued for the year ended December 31, 2009. As the Codification was not intended to change or alter existing GAAP, its adoption did not have any impact on our consolidated financial statements.
Adopted
In August 2009, the FASB issued changes to fair value accounting for liabilities. These changes clarify existing guidance that in circumstances in which a quoted price in an active market for the identical liability is not available, an entity is required to measure fair value using either a valuation technique that uses a quoted price of either a similar liability or a quoted price of an identical or similar liability when traded as an asset, or another valuation technique that is consistent with the principles of fair value measurements, such as an income approach (e.g., present value technique). The adoption of the provisions did not have a material impact on our previously issued consolidated financial statements.
In May 2009, the FASB issued guidance on accounting for and disclosure of events that occur after the balance sheet date but before financial statements are issued or are available to be issued. The guidance, which is outlined in ASC Topic 855 – Subsequent Events, establishes the period after the balance sheet date during which management of a reporting entity should evaluate events or transactions that may occur for potential recognition or disclosure in the financial statements, the circumstances under which an entity should recognize events or transactions occurring after the balance sheet date in its financial statements, and the disclosures that an entity should make about events or transactions that occurred after the balance sheet date. The adoption of these changes did not have an impact on our consolidated financial statements because we had already followed a similar approach prior to the adoption of this guidance.
In April 2009, the FASB issued updated guidance on interim disclosures about the fair value of financial instruments effective for interim and annual reporting periods ending after June 15, 2009. The guidance, which is outlined in ASC Topic 825 – Financial Instruments, did not have an impact on our consolidated financial statements.
On January 1, 2009, we adopted changes issued by the FASB on determining whether instruments granted in share-based payment transactions are participating securities and should be included in the computation of earnings per share using the two-class method. The guidance, which is outlined in ASC Topic 260 – Earnings per Share, provides that unvested share-based payment awards that contain non-forfeitable rights to dividends are participating securities that should use the two-class method of computing earnings per share, which is an earnings allocation formula that determines earnings per share for ordinary stock and any participating securities according to dividends declared (whether paid or unpaid) and participation rights in undistributed earnings. Our non-vested stock, consisting of time-vested restricted shares, are considered participating securities since the share-based awards contain a non-forfeitable right to dividends irrespective of whether the awards ultimately vest. The adoption of the provisions did not have a material impact on our previously issued consolidated financial statements.
On January 1, 2009, we adopted changes issued by the FASB on accounting and reporting standards for entities with an outstanding noncontrolling interest in one or more subsidiaries or that deconsolidate a subsidiary. The guidance, which is outlined in ASC Topic 810 – Consolidation is effective for fiscal years and interim periods beginning after December 15, 2008. The changes improve the relevance, comparability and transparency of financial information that a reporting entity provides in its consolidated financial statements. The guidance requires: (i) ownership interests in subsidiaries held by parties other than the parent be clearly identified and presented within equity but separate from the parent's equity in the consolidated statement of financial position; (ii) consolidated net income attributable to the parent and the noncontrolling interest be identified and presented on the face of the consolidated statement of income; (iii) changes in a parent's ownership interest while the parent retains its controlling financial interest in its subsidiary be consistently accounted for as equity transactions; (iv) any retained noncontrolling equity investment in a deconsolidated subsidiary be initially measured at fair value and that any gain or loss on the deconsolidation of a subsidiary be measured using fair value of the noncontrolling equity investment rather than the carrying amount of that retained investment and (v) entities provide sufficient disclosures that clearly identify and distinguish between the interests of the parent and noncontrolling owners. Adoption of these changes had no impact on our consolidated financial statements as all consolidated subsidiaries are wholly owned.
On January 1, 2009, we adopted changes issued by the FASB on accounting for business combinations. The guidance, which is outlined in ASC Topic 805 – Business Combinations, applies prospectively to business combinations for which the acquisition date is on or after the beginning of the first annual reporting period beginning on or after December 15, 2008. The changes, while retaining the fundamental requirements of accounting for business combinations, require that the purchase method be used for all business combinations. The guidance establishes principles and requirements for how an acquiring entity measures and recognizes in its financial statements: (i) the identifiable assets acquired; (ii) the liabilities assumed; (iii) any noncontrolling interest in the acquiree and (iv) the goodwill acquired or a gain from a bargain purchase. It further sets forth disclosure criteria to enable a better understanding of the nature and effects of a business combination. Adoption of this guidance did not have an impact on our consolidated financial statements.
As of January 1, 2009, we adopted changes issued by the FASB on fair value accounting and reporting relating to nonfinancial assets and liabilities that are not recognized or disclosed at fair value in the financial statements. We had previously adopted as of January 1, 2008, changes issued by the FASB on fair value accounting and reporting of financial assets and liabilities. The guidance, which is outlined in ASC Topic 820 – Fair Value Measurements and Disclosures, defines fair value, establishes a framework for measuring fair value and expands the related disclosure requirements about fair value measurement. The guidance applies to other accounting standards that require or permit fair value measurements and indicates, among other things, that a fair value measurement assumes that the transaction to sell an asset or transfer a liability occurs in the principal market for the asset or liability or, in the absence of a principal market, the most advantageous market for the asset or liability. Fair value is defined in the guidance as based upon an exit price model. Adoption of these changes did not have an impact on our consolidated financial statements.
Starting with the consolidated financial statements for the first quarter of 2008, we adopted changes issued by the FASB on disclosures about derivative instruments and hedging activities. The changes enhance disclosures about an entity’s derivative and hedging activities, including: (i) how and why an entity uses derivative instruments, (ii) how derivative instruments and related hedged items are accounted for, and (iii) how derivative instruments and related hedged items affect an entity’s financial position, financial performance, and cash flows. The guidance, which is outlined in ASC Topic 815 – Derivatives and Hedging, was effective for fiscal years and interim periods beginning after November 15, 2008 with early application encouraged. Adoption of these changes had no impact on our consolidated financial statements other than additional disclosures made in our notes to the consolidated financial statements.
Issued
In June 2009, the FASB issued changes to the accounting for variable interest entities. These changes, as discussed in ASC Topic 810-Consolidation, require an enterprise to: (i) perform an analysis to determine whether the enterprise’s variable interest or interests give it a controlling financial interest in a variable interest entity; (ii) require ongoing reassessments of whether an enterprise is the primary beneficiary of a variable interest entity; (iii) eliminate the quantitative approach previously required for determining the primary beneficiary of a variable interest entity; (iv) add an additional reconsideration event for determining whether an entity is a variable interest entity when any changes in facts and circumstances occur such that holders of the equity investment at risk, as a group, lose the power from voting rights or similar rights of those investments to direct the activities of the entity that most significantly impact the entity’s economic performance and (v) require enhanced disclosures that will provide users of financial statements with more transparent information about an enterprise’s involvement in a variable interest entity. These changes became effective January 1, 2010, and we are currently evaluating the potential impact of these changes on our consolidated financial statements.
Interest Rate Risk
We are exposed to various market risks associated with changes in interest rates relating to our floating rate debt. We use derivative instruments, solely interest rate swaps, to manage our borrowing costs and convert floating rate debt to fixed rate debt. All derivative contracts are for non-trading purposes and are entered into with financial institutions thereby minimizing counterparty risk.
At December 31, 2009, we had $351.2 million of floating debt outstanding. In order to hedge our interest rate risk, we entered into interest rate swap contracts that hedged approximately 53.2% of our outstanding debt at December 31, 2009. We had interest rate swap contracts to pay an average fixed rate of 3.79% before loan margin and receive a floating rate of interest on the notional amount of $186.7 million. At December 31, 2009, the fair value of interest rate swap agreements was a $10.0 million liability. Interest loan margins over LIBOR at December 31, 2009, after changes made under the December 2009 loan modifications, were 5.25% on $151.0 million of debt; 5.00%, on $55.1 million of debt; 4.00% on $8.1 million of debt; 3.75% on $103.8 million of debt 3.00% on $4.5 million of debt; and 2.75% on $28.7 million of debt.
As an indication of the extent of our sensitivity to interest rate changes, an increase in the LIBOR rate of 100 basis points would have increased our net loss for the year ended December 31, 2009 by approximately $1.6 million, based on our unhedged debt at December 31, 2009, of $164.5 million.
The following table sets forth the sensitivity of our outstanding average unhedged debt in U.S. dollars to a 100 basis point increase in LIBOR during the next five years:
| Year | | Unhedged Debt subject to Floating Rate | | | Estimated Interest Change | |
| | | (in thousands) | |
| 2010 | | $ | 134,125 | | | $ | 1,341 | |
| 2011 | | | 111,530 | | | | 1,115 | |
| 2012 | | | 27,389 | | | | 274 | |
| 2013 | | | 36,481 | | | | 365 | |
| 2014 | | | 6,732 | | | | 67 | |
Foreign Exchange Rate Risk
We consider the U.S. dollar to be the functional currency for all of our entities. Our financial results are affected by changes in foreign exchange rates. Changes in foreign exchange rates could adversely affect our earnings. We generate all of our revenues in U.S. dollars, but incurred approximately 8% of our operating expenses in currencies other than U.S. dollars for the year ended December 31, 2009. For accounting purposes, expenses incurred in currencies other than U.S. dollars are converted into U.S. dollars at the exchange rate prevailing on the date of each transaction. At December 31, 2009, approximately 9% of our outstanding accounts payable were denominated in currencies other than U.S. dollars.
Information with respect to this Item is contained in our consolidated financial statements included in "Item 15 – Exhibits and Financial Statement Schedules."
There were no changes in or disagreements with accountants on accounting and financial disclosure.
Disclosure Controls and Procedures
Under the supervision and with the participation of our management, including our Chief Executive Officer, Chief Financial Officer and Chief Accounting Officer, we conducted an evaluation of the effectiveness of the design and operation of our disclosure controls and procedures as of December 31, 2009, as defined in Rules 13a-15(e) and 15d-15(e) under the Securities Exchange Act of 1934, as amended, or the Exchange Act, as of the end of the period covered by this report (the "Evaluation Date"). Based on this evaluation, our Chief Executive Officer, Chief Financial Officer and Chief Accounting Officer concluded as of the Evaluation Date that our disclosure controls and procedures were effective such that the information relating to the Company, including our consolidated subsidiaries, required to be disclosed in our SEC reports (i) is recorded, processed, summarized and reported within the time periods specified in SEC rules and forms, and (ii) is accumulated and communicated to the Company's management, including our Chief Executive Officer, Chief Financial Officer and Chief Accounting Officer, as appropriate to allow timely decisions regarding required disclosure.
Management's Report on Internal Control over Financial Reporting
Our management is responsible for establishing and maintaining adequate internal control over financial reporting, as such term is defined in Rules 13a-15(f) and 15d-15(f) of the Exchange Act. Our internal control over financial reporting was designed to provide reasonable assurance regarding the reliability of financial reporting and the preparation of financial statements for external purposes, in accordance with generally accepted accounting principles. Because of inherent limitations, a system of internal control over financial reporting may not prevent or detect misstatements. Also, projections of any evaluation of effectiveness to future periods are subject to the risk that controls may become inadequate due to change in conditions, or that the degree of compliance with the policies or procedures may deteriorate.
Our management, including our Chief Executive Officer, Chief Financial Officer and Chief Accounting Officer, conducted an evaluation of the effectiveness of our internal control over financial reporting using the criteria set forth by the Committee of Sponsoring Organizations of the Treadway Commission (COSO) in Internal Control—Integrated Framework. Based on its evaluation, our management concluded that our internal control over financial reporting was effective as of December 31, 2009.
The effectiveness of the Company’s internal control over financial reporting as of December 31, 2009, has been audited by PricewaterhouseCoopers LLP, an independent registered public accounting firm, as stated in their report that appears herein.
Changes in Internal Control over Financial Reporting
There were no changes in our internal control over financial reporting, as defined in Rules 13a-15(f) and 15d-15(f) of the Exchange Act, during the fourth quarter of fiscal 2009 that have materially affected, or are reasonably likely to materially affect, our internal control over financial reporting.
None.
PART III
The following table provides information regarding our executive officers and directors.
| Name | Age | Title |
| Joseph E. Royce | 65 | President, Chief Executive Officer, Chairman and Director |
| Gregg L. McNelis | 54 | Senior Executive Vice President, Chief Operating Officer and Director |
| Lawrence A. Blatte | 80 | Senior Executive Vice President |
| Ferdinand V. Lepere | 58 | Executive Vice President and Chief Financial Officer |
| James W. Bayley | 69 | Vice President and Director |
| John P. Cahill | 51 | Director |
| Randee E. Day | 61 | Director |
| William P. Harrington | 52 | Director |
| Peter S. Shaerf | 55 | Director |
| Alexander Smigelski | 52 | Director |
Our directors hold office until the earlier of their death, resignation, removal or disqualification or until their successors have been elected and qualified. Executive officers are appointed by and serve at the pleasure of our Board of Directors. A brief biography of each director and executive officer follows:
Joseph E. Royce: Mr. Royce has been President, Chairman and a director since our inception, and Chief Executive Officer since March 2005. Since 1993, Mr. Royce has served as President of TBS Shipping Services, a subsidiary of TBS International that provides commercial and operational management. Mr. Royce has over 40 years experience in the maritime industry and has expertise in breakbulk, liner and bulk cargo shipping in developing economies. Between 1984 and 1993, Mr. Royce was President of COTCO, a dry cargo pool of over 45 vessels. From 1973 to 1983, he was active as a shipbroker and independent ship operations manager involved in the shipment of various products worldwide. Mr. Royce is a director of Covenant House New York, the not-for-profit adolescent care agency.
Gregg L. McNelis: Mr. McNelis has served as a director since February 2004 and as Senior Executive Vice President and Chief Operating Officer since March 2005. Since 1993, Mr. McNelis has served as Executive Vice President of the Commercial Department at TBS Shipping Services, where he manages the chartering department, responsible for commercial employment of the fleet. He has worked with Mr. Royce for over 25 years, engaging in contract negotiations, time charters, voyage charters, contracts of affreightment, and developing and controlling trade lanes. Mr. McNelis previously served as vice president of COTCO. Mr. McNelis has over 30 years of experience in the international shipping industry.
Lawrence A. Blatte: Since March 2005, Mr. Blatte has served as Senior Executive Vice President of the Company and in this role provides business development services. He served as our corporate legal counsel from our inception until December 31, 2005. Mr. Blatte has also served as Vice Chairman of TBS Shipping Services since January 2004. As a public servant, Mr. Blatte held the position of Mayor of the Village of Lawrence, New York from 1996 to 2002, and served as a Trustee of the Village from 1979 to 1996.
Ferdinand V. Lepere: Mr. Lepere has served as Executive Vice President and Chief Financial Officer since March 2005 and as Executive Vice President of Finance of TBS Shipping Services since January 1995, responsible for all financial and accounting matters. Mr. Lepere has over 30 years of experience in shipping, most recently from February 1981 to December 1994 with Hapag-Lloyd A.G. as chief financial officer and board member of its American subsidiary. Mr. Lepere is a Certified Public Accountant and holds a Masters Degree in Finance and Accounting.
James W. Bayley: Mr. Bayley has served as a director since 2007, having previously served as a director from our inception until 2006, and has been Vice President since November 2001. Mr. Bayley is the owner and Managing Director of Globe Maritime Limited, a company that is well established in the London shipping market. Mr. Bayley has been in the shipping industry since 1956 and a member of the Baltic Exchange London since 1962, becoming a Fellow of the Institute of Chartered Shipbrokers in 1967.
John P. Cahill: Mr. Cahill has served as a director since June 2007. Mr. Cahill is counsel at Chadbourne & Parke LLC, a law firm in New York City that he joined in March 2007. Mr. Cahill is also Co-Founder and CEO of the Pataki-Cahill Group, LLC, a specialized consulting firm in New York City that focuses on energy issues and asset privatization. He is an attorney with experience in both the private and public sectors. From 2002 until 2006, Mr. Cahill served as the Secretary and Chief of Staff to the Governor of the State of New York, which is the highest ranking appointed official in New York State Government. Prior to this appointment, Mr. Cahill was Commissioner of the New York State Department of Environmental Conservation.
Randee E. Day: Ms. Day has served as a director and Chairperson of the Audit Committee since 2001. Since 2004, Ms. Day has been a Managing Director at Seabury Transportation Holdings LLC, a leading advisory and consulting firm specializing in the transportation industry, and is responsible for all of Seabury’s activities related to the maritime industry. Ms. Day has more than 25 years of specialized international financial experience in the marine and energy sectors. From 1985 to 2004, Ms. Day was president and chief executive officer of Day & Partners, Inc., a financial advisory and consulting firm focused on the maritime, energy and cruise industries with a diversified client base consisting of shipping companies, commercial banks and government agencies. Ms. Day has an extensive background in international trust and maritime law and has worked with clients on bankruptcies, foreign judgments and strategies for disposing of real estate and shipping assets in various international jurisdictions. From 1979 to 1985, Ms. Day served as the head of J.P. Morgan’s Marine Transportation and Finance department in New York, where she was responsible for managing a loan portfolio and overseeing relationships with the bank’s shipping clients in the Western Hemisphere and the Far East. She also served in the London offices of J.P. Morgan, Continental Illinois National Bank & Trust and Bank of America. Ms. Day has served as an independent director of DHT Maritime, Inc. (NYSE) since July 2005 and is the chairperson of its audit committee.
William P. Harrington: Mr. Harrington has served as a director since 2005 and is Chairperson of the Nominating and Corporate Governance Committee and the Lead Independent Director. Mr. Harrington is a partner and head of the litigation and toxic tort/complex litigation practice groups at Bleakley, Platt & Schmidt, LLP, a law firm in White Plains, New York. He is an experienced trial attorney who has represented Fortune 500 companies in criminal, commercial, environmental, real estate and employment discrimination matters. From 2000 until 2006, Mr. Harrington served as a member of the New York Gubernatorial Review Panel for the Federal Judiciary. Mr. Harrington also once served as a law clerk to Hon. Charles L. Brient, Chief Judge of the United States District Court for the Southern District of New York. Mr. Harrington became an independent director of Community Mutual Savings Bank (NASDAQ) in March 2009.
Peter S. Shaerf: Mr. Shaerf has served as a director since 2001 and is Chairperson of the Compensation Committee. Since 2002, Mr. Shaerf has been a Partner and Managing Director at AMA Capital Partners LLC, an investment bank and private equity firm specializing in the maritime industry. From 1998 to April 2002, Mr. Shaerf was a Managing Director of Poseidon Capital, an independent maritime consulting and investment company that works extensively in the investment community. From 1980 to 2002, he was a partner of The Commonwealth Group, a brokerage and consulting company that specialized in the dry cargo and liner shipping industry. From 1977 to 1980, he was a director of Common Brothers U.S.A. Ltd., a shipbroking subsidiary of a British shipowner of dry cargo and tanker tonnage. Mr. Shaerf is a director of General Maritime Corporation (NYSE) and a director of Seaspan Corporation (NYSE). Mr. Shaerf is Chairman of New York Maritime Inc. (NYMAR), a leading global trade association that promotes New York maritime center. Mr. Shaerf holds a B.A. degree in international business law from the London Metropolitan University.
Alexander Smigelski: Mr. Smigelski has served as a director since June 2007. Mr. Smigelski is a senior partner with Kings Point Capital Partners, a New York-based private equity firm investing in multiple strategies since 2006, and is presently the CEO of its Restaurant Division. Until mid-2006, Mr. Smigelski was Senior Vice President with Morgan Keegan & Company Inc., a leading brokerage and investment firm. Mr. Smigelski’s overall Wall Street career spanned 17 years, primarily with Merrill Lynch. In addition, he is a Master Mariner and was the youngest captain in the Exxon fleet.
Other information required by Item 10 will be in the definitive proxy statement for the Company's 2010 Annual General Meeting of Shareholders and is incorporated by reference.
Information required by Item 11 will be in the definitive proxy statement for the Company's 2010 Annual General Meeting of Shareholders and is incorporated herein by reference.
Certain Information required by Item 12 will be in the definitive proxy statement for the Company's 2010 Annual General Meeting of Shareholders and is incorporated herein by reference.
The table below sets forth information about the shares authorized for issuance under the Company's equity compensation plans (2005 Equity Incentive Plan and Employee Share Purchase Plan) as of December 31, 2009.
Plan category | | Number of securities to be issued upon exercise of outstanding options, warrants and rights | | Weighted average exercise price of outstanding options, warrants and rights | | Number of securities remaining available for future issuance |
| | | | | | | |
| Equity compensation plans approved by security holders | | 61,000 | | $ | | 3,062,500 |
| | | | | | | |
| Equity compensation plans not approved by security holders | | | | | | |
| Total | | 61,000 | | $ | | 3,062,500 |
| | | | | | | |
Information required by Item 12 will be in the definitive proxy statement for the Company's 2010 Annual General Meeting of Shareholders and is incorporated herein by reference.
Information required by Item 14 will be in the definitive proxy statement for the Company's 2010 Annual General Meeting of Shareholders and is incorporated herein by reference.
PART IV
(a) Documents filed as part of this Annual Report
The following consolidated financial statements of the Company are included in a separate section of this report:
| | Report of Independent Registered Public Accounting Firm | | F-1 |
| | | | |
| | Consolidated Balance Sheets as of December 31, 2009 and December 31, 2008 | | F-2 |
| | | | |
| | Consolidated Statements of Operations for the Years ended December 31, 2009, 2008 and 2007 | | F-3 |
| | | | |
| | Consolidated Statements of Cash Flows for the Years ended December 31, 2009, 2008 and 2007 | | F-4 |
| | | | |
| | Consolidated Statements of Changes in Shareholders' Equity for the Years ended December 31, 2009, 2008 and 2007 | | F-5 |
| | | | |
| | Notes to Consolidated Financial Statements | | F-6 - F-33 |
| 2. | Financial Statement Schedules. |
| | All schedules are omitted because they are not applicable or not required or because the required information is included in the Consolidated Financial Statements or the Notes thereto. |
| | The following exhibits are filed as part of, or incorporated by reference into, this Annual Report: |
| Exhibit | Description | Filed Herewith | Incorporated by Reference |
| Form | File No. | Exhibit | Filing Date |
| 3.1 | Certificate of Incorporation of TBS International plc | | S-8 POS | 333-137517 | 4.2 | 1/19/2010 |
| 3.2 | Amended and Restated Memorandum of Association of TBS International plc | | 8-K12B | 001-34599 | 3.1 | 1/8/2010 |
| 4.1 | Form of Indenture of TBS International Limited. | | S-3/A | 000-51368 | 4.3 | 10/8/2009 |
| 4.2 | Form of Subordinated Indenture of TBS International Limited | | S-3/A | 000-51368 | 4.4 | 10/8/2009 |
| 4.3 | Form of Deposit Agreement/Deposit Receipt | | S-3/A | 000-51368 | 4.5 | 10/8/2009 |
10.1 | TBS International Amended and Restated 2005 Equity Incentive Plan* | | S-8 POS | 333-137517 | 99.1 | 1/19/2010 |
10.2 | Form of Restricted Share Award Agreement under the TBS International Limited 2005 Equity Incentive Plan* | | 8-K | 000-51368 | 10.2 | 1/26/2007 |
10.3 | Form of Bonus Share Award Agreement under the TBS International Limited 2005 Equity Incentive Plan* | | 8-K | 000-51368 | 10.3 | 1/26/2007 |
10.4 | Form of Share Unit Award Agreement under the TBS International Limited 2005 Equity Incentive Plan* | | 10-Q | 000-51368 | 10.1 | 11/9/2007 |
10.5 | Form of Restricted Share Award Agreement under the TBS International Limited 2005 Equity Incentive Plan* | | 10-Q | 000-51368 | 10.1 | 5/9/2008 |
10.6 | Form of Share Unit Award Agreement under the TBS International Limited 2005 Equity Incentive Plan* | | 10-Q | 000-51368 | 10.2 | 5/9/2008 |
10.7 | Restricted Stock Grant Agreement, dated June 29, 2005, between Ferdinand Lepere and TBS International Ltd.* | | 10-Q | 000-51368 | 10.7 | 8/10/2007 |
10.8 | First Amendment, dated May 8, 2008, to Restricted Stock Grant Agreement, dated June 29, 2005, between Ferdinand Lepere and TBS International Ltd.* | | 10-Q | 000-51368 | 10.4 | 5/9/2008 |
10.9 | Form of Restricted Share Award Agreement under the TBS International Amended and Restated 2005 Equity Incentive Plan* | X | | | 10.1 | |
10.10 | Form of Bonus Share Award Agreement under the TBS International Amended and Restated 2005 Equity Incentive Plan* | X | | | 10.2 | |
10.11 | Form of Share Unit Award Agreement under the TBS International Amended and Restated 2005 Equity Incentive Plan* | X | | | 10.3 | |
10.12 | Deed Poll of Assumption by and between TBS International Limited and TBS International plc | | 8-K | 001-34599 | 10.1 | 1/8/2010 |
10.13 | Deed Poll of Indemnity by and between TBS International Limited and TBS International plc | | 8-K | 001-34599 | 10.2 | 1/8/2010 |
10.14 | Lease of Real Property, dated January 1, 2008, between Joseph E. Royce and TBS Shipping Services Inc. | | 10-K | 000-51368 | 10.40 | 3/14/2008 |
10.15 | Lease agreement, dated January 1, 2009, between Joseph E. Royce and TBS Shipping Services Inc. | | 10-K | 000-51368 | 10.1 | 3/30/2009 |
10.16 | Lease agreement, dated January 1, 2010, between Joseph E. Royce and TBS Shipping Services Inc. | X | | | 10.4 | |
10.17 | Loan Agreement, dated December 21, 2004, between Avon Maritime Corp. and The Royal Bank of Scotland plc. | | S-1/A | 333-123157 | 10.5 | 5/16/2005 |
10.18 | Umbrella Agreement, dated December 5, 2003, between TBS International Limited and Arkadia Shipping Inc. | | S-1/A | 333-123157 | 10.7 | 4/19/2005 |
10.19 | Form of Memorandum of Agreement related to sale-leaseback financings with Arkadia Shipping Inc. | | S-1/A | 333-123157 | 10.8 | 4/19/2005 |
10.20 | Form of Bareboat Charter related to sale-leaseback financings with Arkadia Shipping Inc. | | S-1/A | 333-123157 | 10.9 | 4/19/2005 |
10.21 | Management Agreement, dated February 8, 2001, by and among TBS Shipping International Limited, TBS Worldwide Services Inc., its indirect and direct subsidiaries, TBS Commercial Group Ltd. and Beacon Holdings Ltd. | | S-1/A | 333-123157 | 10.1 | 4/19/2005 |
10.22 | Form of Commercial Agency Agreement with TBS Worldwide Services Inc. and its direct and indirect subsidiaries | | S-1/A | 333-123157 | 10.6 | 4/19/2005 |
10.23 | Memorandum of Agreement, dated as of January 24, 2007, by and between TBS International Limited, Fairfax Shipping Corp. and Adirondack Shipping LLC | | 10-K | 000-51368 | 10.1 | 3/12/2007 |
10.24 | Bareboat Charter Agreement, dated January 24, 2007, by and between TBS International Limited, Fairfax Shipping Corp and Adirondack Shipping LLC | | 10-K | 000-51368 | 10.3 | 3/12/2007 |
10.25 | First Amendatory Agreement, dated March 26, 2009, to the Bareboat Charter Agreement, dated January 24, 2007, by and between TBS International Limited, Fairfax Shipping Corp and Adirondack Shipping LLC | | 8-K | 000-51368 | 10.12 | 4/2/2009 |
10.26 | Second Amendatory Agreement, dated April 16, 2009, to the Bareboat Charter Agreement, dated January 24, 2007, by and between TBS International Limited, Fairfax Shipping Corp and Adirondack Shipping LLC | X | | | 10.5 | |
10.27 | Third Amendatory Agreement, dated December 31, 2009, to the Bareboat Charter Agreement, dated January 24, 2007, by and between TBS International Limited, Fairfax Shipping Corp and Adirondack Shipping LLC | X | | | 10.6 | |
| 10.28 | Fourth Amendatory Agreement, dated January 12, 2010, to the Bareboat Charter Agreement, dated January 24, 2007, by and between TBS International Limited, Fairfax Shipping Corp and Adirondack Shipping LLC | X | | | 10.7 | |
10.29 | Memorandum of Agreement, dated January 24, 2007, by and between TBS International Limited, Rushmore Shipping LLC and Beckman Shipping Corp. | | 10-K | 000-51368 | 10.2 | 3/12/2007 |
| 10.30 | Bareboat Charter Agreement, dated January 24, 2007, by and between TBS International Limited, Rushmore Shipping LLC and Beckman Shipping Corp. | | 10-K | 000-51368 | 10.4 | 3/12/2007 |
10.31 | First Amendatory Agreement, dated March 26, 2009, to the Bareboat Charter Agreement, dated January 24, 2007, by and between TBS International Limited, Rushmore Shipping LLC and Beckman Shipping Corp. | | 8-K | 000-51368 | 10.13 | 4/2/2009 |
10.32 | Second Amendatory Agreement, dated April 16, 2009, to the Bareboat Charter Agreement, dated January 24, 2007, by and between TBS International Limited, Rushmore Shipping LLC and Beckman Shipping Corp. | X | | | 10.8 | |
10.33 | Third Amendatory Agreement, dated December 31, 2009, to the Bareboat Charter Agreement, dated January 24, 2007, by and between TBS International Limited, Rushmore Shipping LLC and Beckman Shipping Corp. | X | | | 10.9 | |
| 10.34 | Fourth Amendatory Agreement, dated January 12, 2010, to the Bareboat Charter Agreement, dated January 24, 2007, by and between TBS International Limited, Rushmore Shipping LLC and Beckman Shipping Corp. | X | | | 10.10 | |
10.35 | Overall Agreement, dated February 2007, relating to the construction of six multipurpose vessels, between TBS International Limited, China Communications Construction Company Ltd and Nantong Yahua Shipbuilding Co., Ltd.** | | 10-Q | 000-51368 | 10.1 | 5/15/2007 |
10.35 | Shipbuilding Contract, dated February 2007, between Argyle Maritime Corp., China Communications Construction Company Ltd and Nantong Yahua Shipbuilding Co., Ltd.** | | 10-Q | 000-51368 | 10.2 | 5/15/2007 |
10.36 | Amendment Number 1, dated June 27, 2007, to Shipbuilding Contract, dated February 2007, between Argyle Maritime Corp., China Communications Construction Company Ltd and Nantong Yahua Shipbuilding Co., Ltd. | | 10-Q | 000-51368 | 10.1 | 8/10/2007 |
10.37 | Shipbuilding Contract, dated February 2007, between Caton Maritime Corp., China Communications Construction Company Ltd and Nantong Yahua Shipbuilding Co., Ltd.** | | 10-Q | 000-51368 | 10.3 | 5/15/2007 |
10.38 | Amendment Number 2, dated June 27, 2007, to Shipbuilding Contract, dated February 2007, between Caton Maritime Corp., China Communications Construction Company Ltd and Nantong Yahua Shipbuilding Co., Ltd. | | 10-Q | 000-51368 | 10.2 | 8/10/2007 |
10.39 | Shipbuilding Contract, dated February 2007, between Dorchester Maritime Corp., China Communications Construction Company Ltd and Nantong Yahua Shipbuilding Co., Ltd.** | | 10-Q | 000-51368 | 10.4 | 5/15/2007 |
| 10.40 | Amendment Number 2, dated June 27, 2007, to Shipbuilding Contract, dated February 2007, between Dorchester Maritime Corp., China Communications Construction Company Ltd and Nantong Yahua Shipbuilding Co., Ltd. | | 10-Q | 000-51368 | 10.3 | 8/10/2007 |
10.41 | Shipbuilding Contract, dated February 2007, between Longwoods Maritime Corp., China Communications Construction Company Ltd and Nantong Yahua Shipbuilding Co., Ltd.** | | 10-Q | 000-51368 | 10.5 | 5/15/2007 |
10.42 | Amendment Number 2, dated June 27, 2007, to Shipbuilding Contract, dated February 2007, between Longwoods Maritime Corp., China Communications Construction Company Ltd and Nantong Yahua Shipbuilding Co., Ltd. | | 10-Q | 000-51368 | 10.4 | 8/10/2007 |
10.43 | Shipbuilding Contract, dated February 2007, between McHenry Maritime Corp., China Communications Construction Company Ltd and Nantong Yahua Shipbuilding Co., Ltd.** | | 10-Q | 000-51368 | 10.6 | 5/15/2007 |
10.44 | Amendment Number 2, dated June 27, 2007, to Shipbuilding Contract between McHenry Maritime Corp. and China Communications Construction Company Ltd and Nantong Yahua Shipbuilding Co., Ltd. | | 10-Q | 000-51368 | 10.5 | 8/10/2007 |
10.45 | Shipbuilding Contract, dated February 2007, between Sunswyck Maritime Corp., China Communications Construction Company Ltd and Nantong Yahua Shipbuilding Co., Ltd.** | | 10-Q | 000-51368 | 10.7 | 5/15/2007 |
10.46 | Amendment Number 1, dated June 27, 2007, to Shipbuilding Contract, dated February 2007, between Sunswyck Maritime Corp., China Communications Construction Company Ltd and Nantong Yahua Shipbuilding Co., Ltd. | | 10-Q | 000-51368 | 10.6 | 8/10/2007 |
10.47 | Term Loan Facility Agreement, dated March 29, 2007, among TBS International Limited, certain subsidiaries of TBS International Limited, certain lenders and The Royal Bank of Scotland plc. | | 8-K | 000-51368 | 10.1 | 4/2/2007 |
10.48 | Supplemental Agreement, dated March 27, 2009, to the Term Loan Facility Agreement, dated March 29, 2007, among TBS International Limited, certain subsidiaries of TBS International Limited, certain lenders and The Royal Bank of Scotland plc. | | 10-Q | 000-51368 | 10.7 | 8/7/2009 |
10.49 | Supplemental Agreement, dated December 31, 2009, to the Term Loan Facility Agreement, dated March 29, 2007, among TBS International Limited, certain subsidiaries of TBS International Limited, certain lenders and The Royal Bank of Scotland plc. | X | | | 10.11 | |
| 10.50 | Guarantee, dated January 7, 2010, by TBS International plc pursuant to which it guaranteed certain obligations under the Term Loan Facility Agreement, dated March 29, 2007, among TBS International Limited, certain subsidiaries of TBS International Limited, certain lenders and The Royal Bank of Scotland plc. | X | | | 10.12 | |
10.51 | Guarantee Facility Agreement, dated March 29, 2007, among TBS International Limited, certain subsidiaries of TBS International Limited and The Royal Bank of Scotland plc. | | 10-Q | 000-51368 | 10.1 | 8/7/2009 |
10.52 | Supplemental Agreement, dated March 27, 2009, to the Guarantee Facility Agreement, dated March 29, 2007, among TBS International Limited, certain subsidiaries of TBS International Limited and The Royal Bank of Scotland plc. | | 10-Q | 000-51368 | 10.8 | 8/7/2009 |
10.53 | Supplemental Agreement, dated December 31, 2009, to the Guarantee Facility Agreement, dated March 29, 2007, among TBS International Limited, certain subsidiaries of TBS International Limited and The Royal Bank of Scotland plc. | X | | | 10.13 | |
10.54 | Guarantee, dated January 7, 2010, by TBS International plc pursuant to which it guaranteed certain obligations under the Guarantee Facility Agreement, dated March 29, 2007, among TBS International Limited, certain subsidiaries of TBS International Limited and The Royal Bank of Scotland plc. | X | | | 10.14 | |
10.55 | Loan Agreement, dated December 7, 2007, by and among Claremont Shipping Corp., Yorkshire Shipping Corp. and Credit Suisse | | 10-K | 000-51368 | 10.37 | 3/14/2008 |
10.56 | Supplemental Letter, dated March 24, 2009, to the Loan Agreement, dated December 7, 2007, by and among Claremont Shipping Corp., Yorkshire Shipping Corp. and Credit Suisse | | 8-K | 000-51368 | 10.10 | 4/2/2009 |
10.57 | Supplemental Letter, dated December 22, 2009, to the Loan Agreement, dated December 7, 2007, by and among Claremont Shipping Corp., Yorkshire Shipping Corp. and Credit Suisse | X | | | 10.15 | |
10.58 | Guarantee, dated January 11, 2010, by TBS International plc pursuant to which it guaranteed certain obligations under the Loan Agreement, dated December 7, 2007, by and among Claremont Shipping Corp., Yorkshire Shipping Corp. and Credit Suisse | X | | | 10.16 | |
10.59 | Loan Agreement, dated January 16, 2008, by and among TBS International Limited, certain subsidiaries of TBS International Limited, DVB Group Merchant Bank (Asia) Ltd., The Governor and Company of the Bank of Ireland, DVB Bank AG, Natixis and Mount Washington LLC | | 10-Q | 000-51368 | 10.2 | 8/7/2009 |
| 10.60 | First Amendatory Agreement, dated March 23, 2009, to Loan Agreement, dated January 16, 2008, by and among TBS International Limited, certain subsidiaries of TBS International Limited, DVB Group Merchant Bank (Asia) Ltd., The Governor and Company of the Bank of Ireland, DVB Bank AG, Natixis and Mount Washington LLC | | 8-K | 000-51368 | 10.9 | 8-K |
10.61 | Second Amendatory Agreement, dated December 31, 2009, to the Loan Agreement, dated January 16, 2008, by and among TBS International Limited, certain subsidiaries of TBS International Limited, DVB Group Merchant Bank (Asia) Ltd., The Governor and Company of the Bank of Ireland, DVB Bank AG, Natixis and Mount Washington LLC | X | | | 10.17 | |
10.62 | Guarantee, dated January 11, 2010, by TBS International plc pursuant to which it guaranteed certain obligations under Loan Agreement, dated January 16, 2008, by and among TBS International Limited, certain subsidiaries of TBS International Limited, DVB Group Merchant Bank (Asia) Ltd., The Governor and Company of the Bank of Ireland, DVB Bank AG, Natixis and Mount Washington LLC | X | | | 10.18 | |
10.63 | Loan Agreement, dated February 29, 2008, by and among TBS International Limited, certain subsidiaries of TBS International Limited and AIG Commercial Equipment Finance, Inc. | | 10-K | 000-51368 | 10.39 | 3/14/2008 |
10.64 | First Amendment, dated March 27, 2009, to Loan Agreement, dated February 29, 2008, by and among TBS International Limited, certain subsidiaries of TBS International Limited and AIG Commercial Equipment Finance, Inc. | | 10-Q | 000-51368 | 10.5 | 8/7/2009 |
10.65 | Second Amendment, dated December 30, 2009, to Loan Agreement, dated February 29, 2008, by and among TBS International Limited, certain subsidiaries of TBS International Limited and AIG Commercial Equipment Finance, Inc. | X | | | 10.19 | |
10.66 | Guarantee, dated January 7, 2010, by TBS International plc pursuant to which it guaranteed certain obligations under the Loan Agreement, dated February 29, 2008, by and among TBS International Limited, certain subsidiaries of TBS International Limited and AIG Commercial Equipment Finance, Inc. | X | | | 10.20 | |
10.67 | Amended and Restated Credit Agreement, dated March 26, 2008, by and among TBS International Limited, certain subsidiaries of TBS International Limited, Bank of America, N.A. and the lenders named thereto | | 10-Q | 000-51368 | 10.3 | 8/7/2009 |
10.68 | Amendment No. 1 and Waiver, dated March 27, 2009, to the Amended and Restated Credit Agreement, dated March 26, 2008, by and among TBS International Limited, certain subsidiaries of TBS International Limited, Bank of America, N.A. and the lenders named thereto.** | | 10-Q | 000-51368 | 10.4 | 8/7/2009 |
10.69 | Amendment No. 2 and Waiver, dated December 31, 2009, to the Amended and Restated Credit Agreement, dated March 26, 2008, by and among TBS International Limited, certain subsidiaries of TBS International Limited, Bank of America, N.A. and the lenders named thereto. | X | | | 10.21 | |
| 10.70 | Joinder Agreement, effective as of January 7, 2010, by TBS International plc pursuant to which it guaranteed certain obligations under the Amended and Restated Credit Agreement, dated March 26, 2008, by and among TBS International Limited, certain subsidiaries of TBS International Limited, Bank of America, N.A. and the lenders named thereto. | X | | | 10.22 | |
| 10.71 | Loan Agreement, dated May 28, 2008, by and between among Dyker Maritime Corp., TBS International Limited and Commerzbank AG | | 10-Q | 000-51368 | 99.2 | 8/7/2008 |
10.72 | Supplemental Letter, dated March 2, 2009, to the Loan Agreement, dated May 28, 2008, by and between among Dyker Maritime Corp., TBS International Limited and Commerzbank AG | | 8-K | 000-51368 | 10.11 | 4/2/2009 |
10.73 | Supplemental Letter, dated December 28, 2009, to the Loan Agreement, dated May 28, 2008, by and between among Dyker Maritime Corp., TBS International Limited and Commerzbank AG | X | | | 10.23 | |
10.74 | Guarantee, dated January 11, 2010, by TBS International plc pursuant to which it guaranteed certain obligations under the Loan Agreement, dated May 28, 2008, by and between among Dyker Maritime Corp., TBS International Limited and Commerzbank AG | X | | | 10.24 | |
10.75 | Loan Agreement, dated June 19, 2008, by and between among Grainger Maritime Corp. and Joh. Berenberg, Gossler & Co. KG | | 10-Q | 000-51368 | 99.1 | 8/7/2008 |
10.76 | Supplemental Letter, dated March 10, 2009, to the Loan Agreement, dated June 19, 2008, by and between among Grainger Maritime Corp. and Joh. Berenberg, Gossler & Co. KG | | 10-Q | 000-51368 | 10.6 | 8/7/2009 |
10.77 | Supplemental Letter, dated December 30, 2009, to the Loan Agreement, dated June 19, 2008, by and between among Grainger Maritime Corp. and Joh. Berenberg, Gossler & Co. KG | X | | | 10.25 | |
| 10.78 | Guarantee, dated January 28, 2010, by TBS International plc pursuant to which it guaranteed certain obligations under the Loan Agreement, dated June 19, 2008, by and between among Grainger Maritime Corp. and Joh. Berenberg, Gossler & Co. KG | X | | | 10.26 | |
| 21.1 | Subsidiaries of the Registrant | X | | | 21.1 | |
| 23.1 | Consent of PricewaterhouseCoopers LLP | X | | | 23.1 | |
| 31.1 | Certification of the Chief Executive Officer pursuant to Rule 13a-14(a) and 15d-14(a) of the Securities and Exchange Act, as amended | X | | | 31.1 | |
| 31.2 | Certification of the Chief Financial and Accounting Officer pursuant to Rule 13a-14(a) and 15d-14(a) of the Securities and Exchange Act, as amended | X | | | 31.2 | |
| 31.3 | Certification of the Chief Accounting Officer pursuant to Rule 13a-14(a) and 15d-14(a) of the Securities and Exchange Act, as amended | X | | | 31.3 | |
| 32 | Certification of Chief Executive Officer, Chief Financial Officer and Chief Accounting Officer pursuant to 18 U.S.C. Section 1350, as adopted pursuant to Section 906 of the Sarbanes-Oxley Act of 2002 | X | | | 32 | |
* Management contract or compensatory plan.
Report of Independent Registered Public Accounting Firm
To Shareholders and
Board of Directors
of TBS International PLC
In our opinion, the consolidated financial statements listed in the index appearing under Item 15(a)(1) present fairly, in all material respects, the financial position of TBS International PLC and its subsidiaries at December 31, 2009 and 2008, and the results of their operations and their cash flows for each of the three years in the period ended December 31, 2009 in conformity with accounting principles generally accepted in the United States of America. Also in our opinion, the Company maintained, in all material respects, effective internal control over financial reporting as of December 31, 2009, based on criteria established in Internal Control - Integrated Framework issued by the Committee of Sponsoring Organizations of the Treadway Commission (COSO). The Company's management is responsible for these financial statements, for maintaining effective internal control over financial reporting and for its assessment of the effectiveness of internal control over financial reporting, included in Management's Report on Internal Control over Financial Reporting appearing under Item 9A. Our responsibility is to express opinions on these financial statements and on the Company's internal control over financial reporting based on our integrated audits. We conducted our audits in accordance with the standards of the Public Company Accounting Oversight Board (United States). Those standards require that we plan and perform the audits to obtain reasonable assurance about whether the financial statements are free of material misstatement and whether effective internal control over financial reporting was maintained in all material respects. Our audits of the financial statements included examining, on a test basis, evidence supporting the amounts and disclosures in the financial statements, assessing the accounting principles used and significant estimates made by management, and evaluating the overall financial statement presentation. Our audit of internal control over financial reporting included obtaining an understanding of internal control over financial reporting, assessing the risk that a material weakness exists, and testing and evaluating the design and operating effectiveness of internal control based on the assessed risk. Our audits also included performing such other procedures as we considered necessary in the circumstances. We believe that our audits provide a reasonable basis for our opinions.
The consolidated financial statements have been prepared assuming that the Company will continue as a going concern. As discussed in Notes 2 and 11 to the consolidated financial statements, the Company believes it will not be in compliance with the financial covenants under its credit facilities during 2010, which under the agreements would make the debt callable. This has created uncertainty regarding the Company's ability to fulfill its financial commitments as they become due. These conditions raise substantial doubt about the Company's ability to continue as a going concern. Management’s plans concerning these matters are also described in Notes 2 and 11. The consolidated financial statements do not include any adjustments that might result from the outcome of this uncertainty.
A company’s internal control over financial reporting is a process designed to provide reasonable assurance regarding the reliability of financial reporting and the preparation of financial statements for external purposes in accordance with generally accepted accounting principles. A company’s internal control over financial reporting includes those policies and procedures that (i) pertain to the maintenance of records that, in reasonable detail, accurately and fairly reflect the transactions and dispositions of the assets of the company; (ii) provide reasonable assurance that transactions are recorded as necessary to permit preparation of financial statements in accordance with generally accepted accounting principles, and that receipts and expenditures of the company are being made only in accordance with authorizations of management and directors of the company; and (iii) provide reasonable assurance regarding prevention or timely detection of unauthorized acquisition, use, or disposition of the company’s assets that could have a material effect on the financial statements.
Because of its inherent limitations, internal control over financial reporting may not prevent or detect misstatements. Also, projections of any evaluation of effectiveness to future periods are subject to the risk that controls may become inadequate because of changes in conditions, or that the degree of compliance with the policies or procedures may deteriorate.
/s/ PricewaterhouseCoopers LLP
New York, New York
March 16, 2010
Part I. FINANCIAL INFORMATION
Item 1. Financial Statements
TBS INTERNATIONAL PLC AND SUBSIDIARIES
CONSOLIDATED BALANCE SHEETS
(in thousands, except par value per share)
| | | | | | December 31, | | | December 31, | |
| | | | | | 2009 | | | 2008 | |
| | | | | | | | | | |
| Assets | | | | | | |
| | Current assets | | | | | | |
| | | Cash and cash equivalents | | $ | 51,040 | | | $ | 131,150 | |
| | | Restricted cash | | | 8,675 | | | | | |
| | | Charter hire receivable, net of allowance of $1,000 in 2009 and $500 in 2008 | | | 34,605 | | | | 45,786 | |
| | | Fuel and other inventories | | | 15,040 | | | | 12,079 | |
| | | Prepaid expenses and other current assets | | | 9,314 | | | | 10,722 | |
| | | Advances to affiliates | | | 1,386 | | | | 6,402 | |
| | | | Total current assets | | | 120,060 | | | | 206,139 | |
| | Fixed assets, net | | | 804,258 | | | | 808,706 | |
| | Goodwill | | | 8,426 | | | | 8,426 | |
| | Other assets and deferred charges | | | 20,844 | | | | 18,414 | |
| | | | | | | | | | | | |
| | | | Total assets | | $ | 953,588 | | | $ | 1,041,685 | |
| | | | | | | | | | | | |
| Liabilities and Shareholders' Equity | | | | | | | | |
| | Current liabilities | | | | | | | | |
| | | Debt (Note 1 and 8) | | $ | 351,247 | | | $ | 56,945 | |
| | | Accounts payable and accrued expenses | | | 52,054 | | | | 41,602 | |
| | | Voyages in progress | | | 1,892 | | | | 3,268 | |
| | | Advances from affiliates | | | 690 | | | | 13 | |
| | | | Total current liabilities | | | 405,883 | | | | 101,828 | |
| | | | | | | | | | | | |
| | Debt, long-term portion (Note 8) | | | | | | | 326,129 | |
| | Other liabilities | | | 9,977 | | | | 15,432 | |
| | | | Total liabilities | | | 415,860 | | | | 443,389 | |
| | | | | | | | | | | | |
| | COMMITMENTS AND CONTINGENCIES (Note 12) | | | | | | | | |
| | | | | | | | | | | | |
| | Shareholders' equity | | | | | | | | |
| | | Ordinary shares, Class A, $.01 par value, 75,000,000 authorized, 17,533,996 shares issued and 17,513,125 shares outstanding in 2009 and 17, 519,496 shares issued and 17,509,496 outstanding in 2008 | | | 175 | | | | 175 | |
| | | Ordinary shares, Class B, $.01 par value, 30,000,000 authorized, 12,390,461 shares issued and outstanding in 2009 and 2008 | | | 124 | | | | 124 | |
| | | Warrants | | | 21 | | | | 21 | |
| | | Additional paid-in capital | | | 187,798 | | | | 186,683 | |
| | | Accumulated other comprehensive (loss) | | | (8,275 | ) | | | (13,727 | ) |
| | | Retained earnings | | | 358,369 | | | | 425,409 | |
| | | Less: Treasury stock (20,871 shares, at cost) | | | (484 | ) | | | (389 | ) |
| | | | Total shareholders' equity | | | 537,728 | | | | 598,296 | |
| | | | Total liabilities and shareholders' equity | | $ | 953,588 | | | $ | 1,041,685 | |
| | | | | | | | | | | | |
The accompanying notes are an integral part of these consolidated financial statements.
TBS INTERNATIONAL PLC AND SUBSIDIARIES
CONSOLIDATED STATEMENTS OF OPERATIONS
(in thousands, except per share amounts and outstanding shares)
| | | | | Year Ended December 31, | |
| | | | | 2009 | | | 2008 | | | 2007 | |
| | | | | | | | | | | | |
| Revenue | | | | | | | | | |
| | Voyage revenue | | $ | 247,980 | | | $ | 518,907 | | | $ | 261,509 | |
| | Time charter revenue | | | 51,201 | | | | 83,883 | | | | 88,365 | |
| | Logistics revenue | | | 2,689 | | | | 7,000 | | | | 668 | |
| | Other revenue | | | 646 | | | | 1,843 | | | | 2,379 | |
| | | Total revenue | | | 302,516 | | | | 611,633 | | | | 352,921 | |
| Operating expenses | | | | | | | | | | | | |
| | Voyage | | | 113,084 | | | | 172,929 | | | | 89,241 | |
| | Logistics | | | 2,193 | | | | 5,717 | | | | 557 | |
| | Vessel | | | 104,046 | | | | 110,354 | | | | 85,958 | |
| | Depreciation of vessels | | | | | | | | | | | | |
| | | and other fixed assets | | | 95,870 | | | | 73,479 | | | | 36,022 | |
| | General and administrative | | | 37,265 | | | | 39,879 | | | | 38,703 | |
| | Loss (gain) from sale of vessel | | | | | | | | | | | 814 | |
| | | Total operating expenses | | | 352,458 | | | | 402,358 | | | | 251,295 | |
| (Loss) income from operations | | | (49,942 | ) | | | 209,275 | | | | 101,626 | |
| Other (expenses) and income | | | | | | | | | | | | |
| | Interest expense | | | (17,119 | ) | | | (17,228 | ) | | | (10,394 | ) |
| | Loss on extinguishment of debt | | | | | | | (2,318 | ) | | | | |
| | Gain on sale and insurance recovery of vessel | | | | | | | | | | | 6,034 | |
| | Interest and other income (expense) | | | 21 | | | | 2,048 | | | | 983 | |
| | | Total other (expenses) and income, net | | | (17,098 | ) | | | (17,498 | ) | | | (3,377 | ) |
| | | | | | | | | | | | | | | |
| Net (loss) income | | $ | (67,040 | ) | | $ | 191,777 | | | $ | 98,249 | |
| | | | | | | | | | | | | | | |
| | | | | | | | | | | | | | | |
| Earnings per share | | | | | | | | | | | | |
| Net (loss) income per ordinary share | | | | | | | | | | | | |
| | Basic and Diluted | | $ | (2.25 | ) | | $ | 6.53 | | | $ | 3.49 | |
| | | | | | | | | | | | | | | |
| Weighted average ordinary shares outstanding | | | | | | | | | | | | |
| | Basic and Diluted | | | 29,843,566 | | | | 29,263,292 | | | | 28,029,340 | |
| | | | | | | | | | | | | | | |
The accompanying notes are an integral part of these consolidated financial statements.
TBS INTERNATIONAL PLC AND SUBSIDIARIES
CONSOLIDATED STATEMENTS OF CASH FLOWS
(in thousands)
| | | | | | Year Ended December 31, | |
| | | | | | 2009 | | | 2008 | | | 2007 | |
| | | | | | | | | | | | | |
| Cash flows from operating activities | | | | | | | | | |
| | Net (loss) income | | $ | (67,040 | ) | | $ | 191,777 | | | $ | 98,249 | |
| | Adjustments to reconcile net income to net cash | | | | | | | | | | | | |
| | | provided by operating activities | | | | | | | | | | | | |
| | | Gain on sale and insurance recovery of vessel | | | | | | | | | | | (6,034 | ) |
| | | Loss (gain) on sale of vessel | | | | | | | | | | | 814 | |
| | | Depreciation and amortization | | | 95,870 | | | | 73,479 | | | | 36,022 | |
| | | (Gain) loss on change in value of interest swap contract | | | (3 | ) | | | 1,138 | | | | 568 | |
| | | Amortization and write-off of deferred financing costs | | | 2,489 | | | | 3,486 | | | | 1,074 | |
| | | Addition to allowance for bad debt | | | 901 | | | | 54 | | | | 81 | |
| | | Non cash stock based compensation | | | 1,115 | | | | 2,436 | | | | 525 | |
| | | Drydocking expenditures | | | (15,581 | ) | | | (8,349 | ) | | | (6,209 | ) |
| | | (Income) loss in joint venture | | | (101 | ) | | | (226 | ) | | | 27 | |
| | | Distribution from joint venture | | | | | | | 100 | | | | | |
| | | Changes in operating assets and liabilities | | | | | | | | | | | | |
| | | | Decrease (increase) in charter hire receivable | | | 10,280 | | | | (15,759 | ) | | | (4,766 | ) |
| | | | (Increase) decrease in fuel and other inventories | | | (2,961 | ) | | | (956 | ) | | | (3,866 | ) |
| | | | Decrease (increase) in prepaid expenses and other current assets | | | 1,408 | | | | (2,980 | ) | | | 302 | |
| | | | (Increase) in other assets and deferred charges | | | (1,029 | ) | | | (1,706 | ) | | | (1,127 | ) |
| | | | Increase (decrease) in accounts payable and accrued expenses | | | 10,452 | | | | (6,835 | ) | | | 20,982 | |
| | | | (Decrease) increase in voyages in progress | | | (1,376 | ) | | | (3,748 | ) | | | 2,747 | |
| | | | Increase (decrease) in advances from/to affiliates, net | | | 5,693 | | | | (5,939 | ) | | | (926 | ) |
| Net cash provided by operating activities | | | 40,117 | | | | 225,972 | | | | 138,463 | |
| Cash flows from investing activities | | | | | | | | | | | | |
| | Proceeds on sale of vessels | | | | | | | | | | | 62,014 | |
| | Vessel acquisitions / capital improvement costs | | | (75,841 | ) | | | (414,919 | ) | | | (195,635 | ) |
| | Deposit for vessel purchases | | | | | | | | | | | (14,836 | ) |
| | Restricted cash to fund 2009 new vessel payments | | | (20,000 | ) | | | | | | | | |
| | Decrease in restricted cash for new vessel payments | | | 11,325 | | | | | | | | | |
| | Return of investment in security | | | | | | | | | | | 160 | |
| | Investment in government securities | | | | | | | | | | | (229 | ) |
| | Investment in joint venture | | | (351 | ) | | | (4,660 | ) | | | | |
| | Repayment of loans from joint venture / (Loans to joint venture) | | | | | | | 760 | | | | (360 | ) |
| Net cash (used) by investing activities | | | (84,867 | ) | | | (418,819 | ) | | | (148,886 | ) |
| Cash flows from financing activities | | | | | | | | | | | | |
| | Proceeds from issuance of shares in secondary public offering , | | | | | | | | | | | | |
| | | net of offering costs | | | | | | | 95,739 | | | | | |
| | Repayment of debt principal | | | (61,002 | ) | | | (139,716 | ) | | | (21,199 | ) |
| | Proceeds from credit facilities | | | 29,175 | | | | 338,000 | | | | 60,000 | |
| | Payment of deferred financing costs | | | (3,438 | ) | | | (4,760 | ) | | | (4,093 | ) |
| | Proceeds from revolving debt facility | | | | | | | 75,000 | | | | 101,000 | |
| | Repayment of revolving debt facility | | | | | | | (70,375 | ) | | | (85,439 | ) |
| | Acquistion of treasury stock | | | (95 | ) | | | (389 | ) | | | | |
| | Reduction of obligations under capital leases | | | | | | | | | | | (21,355 | ) |
| Net cash (used in) provided by financing activities | | | (35,360 | ) | | | 293,499 | | | | 28,914 | |
| | | | | | | | | | | | | | | | |
| Net (decrease) increase in cash and cash equivalents | | | (80,110 | ) | | | 100,652 | | | | 18,491 | |
| Cash and cash equivalents beginning of period | | | 131,150 | | | | 30,498 | | | | 12,007 | |
| | Cash and cash equivalents end of period | | $ | 51,040 | | | $ | 131,150 | | | $ | 30,498 | |
| Supplemental cash flow information: | | | | | | | | | | | | |
| | Interest paid, net of amounts capitalized | | $ | 23,589 | | | $ | 14,741 | | | $ | 9,868 | |
| | | | | | | | | | | | | | | | |
| | | | | | | | | | | | | | | | |
| Noncash Investing activities: | | | | | | | | | | | | |
| For the year ended December 31, 2007, the proceeds on the sale-leaseback of the vessels Laguna Belle and Seminole Princess excludes the noncash portion of $5.5 million, which was retained by the buyer/lessor as a deposit on the bareboat charters. | |
| | | | | | | | | | | | | | | | |
| | | | | | | | | | | | | | | | |
| | | | | | | | | | | | | | | | |
| Noncash Financing activities: | | | | | | | | | | | | |
| For the years ended December 31, 2009, 2008, and 2007, 45,500,42,500 and 31,000 shares were issued to independent directors and employees, respectively under the 2005 Employee Incentive Plan. | |
| | | | | | | | | | | | | | | | |
The accompanying notes are an integral part of these consolidated financial statements.
TBS INTERNATIONAL PLC AND SUBSIDIARIES
CONSOLIDATED STATEMENT OF CHANGES IN SHAREHOLDERS' EQUITY
(in thousands, except shares)
| | | | | | | | | | | | | | | | | | | Accumulated | | | |
| | | | | | | | | | | | | | | | | | | Other Com- | | | |
| | | | | | | | | | | | | | | Additional | | | | prehensive | | | |
| | | Ordinary Shares | | Treasury Stocks | | Warrants | | Paid-in | | Retained | | Income | | | |
| | | Shares | | Amount | | Shares | | Amount | | Shares | | Amount | | Capital | | Earnings | | (Loss) | | Total | |
| | | | | | | | | | | | | | | | | | | | | | |
| Balance at December 31, 2006 | 27,724,457 | | | 277 | | | | | | 288,853 | | | 21 | | | 87,881 | | | 135,383 | | | 42 | | | 223,604 | |
| Net income | | | | | | | | | | | | | | | | | | | 98,249 | | | | | | 98,249 | |
| Unrealized loss on cash flow hedges | | | | | | | | | | | | | | | | | | | | | | (2,939 | ) | | (2,939 | ) |
| Comprehensive income | | | | | | | | | | | | | | | | | | | | | | | | | 95,310 | |
| Stock-based award activity | 31,000 | | | | | | | | | | | | | | | 649 | | | | | | | | | 649 | |
| Balance at December 31, 2007 | 27,755,457 | | | 277 | | | | | | 288,853 | | | 21 | | | 88,530 | | | 233,632 | | | (2,897 | ) | | 319,563 | |
| Net income | | | | | | | | | | | | | | | | | | | 191,777 | | | | | | 191,777 | |
| Unrealized loss on cash flow hedges | | | | | | | | | | | | | | | | | | | | | | (10,830 | ) | | (10,830 | ) |
| Comprehensive income | | | | | | | | | | | | | | | | | | | | | | | | | 180,947 | |
| Stock based compensation | 154,500 | | | 2 | | | | | | | | | | | | 2,434 | | | | | | | | | 2,436 | |
| Secondary public offering, | | | | | | | | | | | | | | | | | | | | | | | | | | |
| | net of expenses | 2,000,000 | | | 20 | | | | | | | | | | | | 95,719 | | | | | | | | | 95,739 | |
| Increase in Warrants due to | | | | | | | | | | | | | | | | | | | | | | | | | | |
| | anti-dilutive provisions | | | | | | | | | | 23,050 | | | | | | | | | | | | | | | | |
| Treasury stock | | | | | | 10,000 | | | (389 | ) | | | | | | | | | | | | | | | | (389 | ) |
| Balance at December 31, 2008 | 29,909,957 | | | 299 | | 10,000 | | | (389 | ) | 311,903 | | | 21 | | | 186,683 | | | 425,409 | | | (13,727 | ) | $ | 598,296 | |
| Net loss | | | | | | | | | | | | | | | | | | | | (67,040 | ) | | | | | (67,040 | ) |
| Unrealized gain on cash flow hedges | | | | | | | | | | | | | | | | | | | | | | | 5,452 | | | 5,452 | |
| Comprehensive income | | | | | | | | | | | | | | | | | | | | | | | | | | (61,588 | ) |
| Stock based compensation | 14,500 | | | | | | | | | | | | | | | | 1,115 | | | | | | | | | 1,115 | |
| Treasury stock | | | | | | 10,871 | | | (95 | ) | | | | | | | | | | | | | | | | (95 | ) |
| | | | | | | | | | | | | | | | | | | | | | | | | | | | | |
| Balance at December 31, 2009 | 29,924,457 | | $ | 299 | | 20,871 | | $ | (484 | ) | 311,903 | | $ | 21 | | $ | 187,798 | | $ | 358,369 | | $ | (8,275 | ) | $ | 537,728 | |
| | | | | | | | | | | | | | | | | | | | | | | | | | | | | |
The accompanying notes are an integral part of these consolidated financial statements.
TBS INTERNATIONAL PLC AND SUBSIDIARIES
NOTES TO FINANCIAL STATEMENTS
Note 1 — Organization and Nature of Business
TBS International plc ("TBSI"), which is the successor to TBS International Limited, is organized in Ireland. In December 2009, the shareholders of TBS International Limited approved a plan to hold shares in TBS International plc rather than TBS International Limited, a Bermuda company. Effective January 7, 2010, shareholders exchanged their shares in TBS International Limited for an equal number of shares in TBS International plc. TBSI through its subsidiaries is engaged in the ocean transportation of dry cargo through the use of owned and chartered vessels. All the related corporations of TBSI, except Roymar and TBS Shipping Services and its subsidiaries, are foreign corporations and conduct their business operations worldwide. Roymar and TBS Shipping Services and its subsidiaries conduct their business operations in the United States. The terms "we," "our," and "us," and "the Company" refer to TBS International plc and its consolidated subsidiaries. We use the term "International," and "TBSI" when we wish to refer only to TBS International plc, the holding company that is the issuer of our ordinary shares, and not to TBS International plc and its consolidated subsidiaries.
A listing of all of TBSI’s subsidiaries, with their country of registry and vessel owned, if applicable is as follows:
| TBS International plc (Ireland) |
| | TBS International Limited (Bermuda) |
| | TBS Holdings Limited (Bermuda) |
| | Westbrook Holdings Ltd. and its Subsidiaries (Marshall Islands) |
| | | Ablemarle Maritime Corp. - Mohawk Princess |
| | | Amoros Maritime Corp. - Hopi Princess |
| | | Arden Maritime Corp. - Tayrona Princess |
| | | Argyle Maritime Corp. - Rockaway Belle |
| | | Avon Maritime Corp. - Wichita Belle |
| | | Bedford Maritime Corp. - Apache Maiden |
| | | Beekman Shipping Corp. - Laguna Belle |
| | | Birnam Maritime Corp. - Sioux Maiden |
| | | Brighton Maritime Corp. - Kickapoo Belle |
| | | Bristol Maritime Corp. - Tuscarora Belle |
| | | Chatham Maritime Corp. - Zuni Princess |
| | | Chester Shipping Corp. - Tamoyo Maiden |
| | | Claremont Shipping Corp. - Arapaho Belle |
| | | Columbus Maritime Corp. - Seneca Maiden |
| | | Cumberland Navigation Corp. - Fox Maiden |
| | | Darby Navigation Corp. - Nyack Princess |
| | | Dover Maritime Corp. - Aztec Maiden |
| | | Dyker Maritime Corp. - Caribe Maiden |
| | | Elrod Shipping Corp. - Nanticoke Belle |
| | | Exeter Shipping Corp. - Alabama Belle |
| | | Fairfax Shipping Corp. - Seminole Princess |
| | | Frankfort Maritime Corp. - Shawnee Princess |
| | | Glenwood Maritime Corp. - Miami Maiden |
| | | Grainger Maritime Corp. - Ottawa Princess |
| | | Hancock Navigation Corp. - Kiowa Princess |
| | | Hansen Shipping Corp. - Ainu Princess |
| | | Hari Maritime Corp. - Navajo Princess |
| | | Hartley Navigation Corp. - Canarsie Princess |
| | | Henley Maritime Corp. - Tuckahoe Maiden |
| | | Hudson Maritime Corp. - Chesapeake Belle |
| | | Jessup Maritime Corp.- Savannah Belle |
| | | Lancaster Maritime Corp. - Mohave Maiden |
| | | Leaf Shipping Corp. - Management Company |
| | | Montrose Maritime Corp. - Yakima Princess |
| | | Oldcastle Shipping Corp. - Taino Maiden |
| | | Pacific Rim Shipping Corp. - Philippine |
| | | Prospect Navigation Corp. - Inca Maiden |
| | | Quentin Navigation Corp.- Houma Belle |
| | | Rector Shipping Corp. - Siboney Belle |
| | | Remsen Navigation Corp. - Maori Maiden |
| | | Sheffield Maritime Corp. - Manhattan Princess |
| | | Sherman Maritime Corp. - La Jolla Belle |
| | | Sherwood Shipping Corp. - Zia Belle |
| | | Sterling Shipping Corp. - Biloxi Belle |
| | | Stratford Shipping Corp. - Iroquois Maiden |
| | | Vedado Maritime Corp. - Tupi Maiden |
| | | Vernon Maritime Corp. - Mohegan Princess |
| | | Whitehall Marine Transport Corp. - Cherokee Princess |
| | | Windsor Maritime Corp. - Shinnecock Belle |
| | | Yorkshire Shipping Corp.- Oneida Princess |
| | | Caton Maritime Corp. - Dakota Princess (New Vessel Building) |
| | | Dorchester Maritime Corp. - Montauk Maiden (New Vessel Building) |
| | | Longwoods Maritime Corp. - (New Vessel Building) |
| | | McHenry Maritime Corp. - Omaha Belle (New Vessel Building) |
| | | Sunswyck Maritime Corp. (New Vessel Building) |
| | Transworld Cargo Carriers S.A. (Marshall Islands) |
| | TBS Worldwide Services, Inc. (Marshall Islands) |
| | | TBS African Ventures Limited |
| | | | GMTBS Africa line, Ltd (Hong Kong - 50%) |
| | | TBS Eurolines, Ltd. |
| | | TBS Latin America Liner, Ltd. |
| | | TBS Middle East Carriers, Ltd. |
| | | TBS North America Liner, Ltd. |
| | | TBS Ocean Carriers, Ltd. |
| | | TBS Pacific Liner, Ltd. |
| | Mercury Marine Ltd. (Marshall Islands) |
| | Roymar Ship Management, Inc. (New York) |
| | TBS Shipping Services Inc. (New York) |
| | | Compass Chartering Corp. (New York) |
| | | | Azalea Shipping & Chartering Inc. (New York) |
| | | TBS US Enterprises LLC (Delaware) |
| | | TBS Energy Logistics LP (Delaware) |
| | | TBS Logistics Incorporated (Texas) |
| | TBS Warehouse & Equipment Holdings Ltd. (Marshall Islands) |
| | | TBS Warehouse & Distribution Group Ltd. (Marshall Islands) |
| | | | Panamerican Port Services SAC (50% ownership) |
| | TBS Mining Limited (Marshall Islands) |
| | | GAT-TBS Consorcio S.A. (50% ownership) |
| | TBSI New Ship Development Corp. (Marshall Islands) |
Westbrook Holdings Ltd. and its subsidiaries ("Westbrook") operate their vessels under pool agreements with an affiliate, TBS Worldwide Services Inc. ("TBS Worldwide") and its subsidiaries, (TBS Pacific Liner, Ltd., TBS Latin America Liner, Ltd., TBS North America Liner, Ltd., TBS Ocean Carriers, Ltd., TBS Middle East Carriers, Ltd., TBS African Ventures Limited and TBS Eurolines, Ltd.) (collectively, the "Pools"). Transworld Cargo Carriers, S.A. ("TWCC") operates substantially all its vessels under pool agreements with TBS Worldwide. Roymar and TBS Shipping Services provide technical and operational management services to TBS and its other subsidiaries. TBS Warehouse & Equipment Holdings Ltd. and TBS Mining Limited hold interests in joint ventures. TBSI New Ship Development Corp manages the Company’s ship building program.
Note 2 — Summary of Significant Accounting Policies and Basis of Presentation
A summary of the significant accounting policies followed in the preparation of the accompanying consolidated financial statements is presented below:
Basis of Presentation
The accompanying consolidated financial statements are prepared on the accrual basis of accounting in accordance with accounting standards generally accepted in the United States of America.
One of the significant effects of the current global financial downturn has been a reduction in vessel values. In 2008, the Company made advance payments on its debt, and obtained waivers to existing financial and collateral covenants. The waivers to the credit facilities, which expire on January 1, 2010, modified the original financial and collateral covenants. At December 31, 2009, the Company was in compliance with all modified additional covenants and the debt was not callable by the lenders. However, the Company anticipates that it will not meet the existing consolidated fixed charge and consolidated leverage ratio requirements during the next 12 months and consequently, long term debt is classified as a current liability in the consolidated balance sheet at December 31, 2009.
The Company is discussing with its lenders the modification of financial covenants and other terms to its credit facilities, and in connection with those discussions obtained a three month extension, to April 1, 2010, of waivers expiring on January 1, 2010. Additionally, the Company is pursuing alternative financing sources to repay some of the existing credit facilities. The Company cannot give any assurance that it will be able to obtain the covenant modifications and /or other financing. The failure to obtain the covenant modifications and/or other financing would have a material adverse effect on its business, operations, financial condition and liquidity and would raise substantial doubt about its ability to continue as a going concern. The financial statements do not include any adjustments that might be necessary if the Company is unable to continue as a going concern. Refer to Note 11-Financing for more detailed explanation of our financing agreements and the classification of long-term debt.
Out of Period Adjustment
During the fourth quarter of 2009, the Company identified an out-of-period adjustment in its consolidated financial statements for the years ended December 31, 2008 and 2007. Freight costs incurred in putting into service the capitalized assets were expensed when they should have been capitalized. In the fourth quarter of 2009, the Company recorded a cumulative effect of this adjustment, net depreciation that reduced vessel expense and increased vessel improvements and other equipment by $4.0 million. Approximately $1.9 million and $2.1 million of the change related to the years ended December 31, 2008 and 2007, respectively. The amounts involved are not material to the Company’s consolidated financial statements in any individual prior period, and the cumulative amount is not material to the results of operations for the year ending December 31, 2009.
Principles of Consolidation
The consolidated financial statements include the accounts of TBS and all subsidiaries that are more than 50 percent owned. All significant intercompany transactions and balances have been eliminated in consolidation. Companies that are not consolidated, but over which the Company exercises significant influence, are accounted for under the equity method of accounting.
Segment Reporting
The Company has determined, in accordance with ASC Topic 280-Segment Reporting that it operates in one reportable segment, the worldwide ocean transportation of dry cargo.
Use of Estimates
The preparation of financial statements in conformity with accounting principles generally accepted in the United States of America ("GAAP") requires management to make estimates and assumptions that affect the reported amounts of assets, liabilities, revenues and expenses and disclosure of contingent assets and liabilities at the date of the financial statements. Actual results could differ from those estimates. The most significant estimates relate to; cash flow estimates used for impairment analysis, allowances for charter hire and claims receivable, estimated lives of vessels and voyages in progress.
Revenue Recognition – Related Expenses
Revenue is generally recorded when services are rendered, evidence of an arrangement is obtained, pricing is fixed or determinable and collection is reasonably assured. The Company generally employs its vessels under time or voyage charters. With time charters, the Company receives a fixed charter hire per on-hire day and is responsible for meeting all the vessel operating expenses such as crew costs, insurance, stores and lubricants and repairs and maintenance. Time charter revenue is recorded over the term of the charter as service is provided. Revenue from time charters in progress at year end is calculated using the daily charter hire rate, net of daily expenses, multiplied by the number of voyage days on-hire through year end.
In the case of voyage charters, the vessel is contracted for a voyage between two or more ports. The Company is paid for the cargo transported and pays all voyage expenses, such as fuel, port call expenses and commissions, as well as all vessel operating expenses. Prior to 2008, the revenues and related voyage expenses for voyages in progress were recognized on the percentage of service completed at the balance sheet date by prorating the estimated final voyage revenue and expenses using the ratio of voyage days completed through the balance sheet date to total voyage days. The impact of recognizing voyage expenses ratably over the length of each voyage was not materially different from the method of recognizing such costs as incurred in accordance with the guidance, as outlined in ASC Topic 605-Revenue Recognition, on both a quarterly and annual basis. For voyages in progress at December 31, 2009 and 2008, we recognized voyage expense as incurred and recognized voyage revenues ratably over the length of the voyage. Probable losses on voyages are provided for in full at the time such losses can be estimated. A voyage is deemed to commence upon the completion of discharge of the vessel's previous cargo and is deemed to end upon the completion of discharge of the current cargo. Vessel operating expenses for both voyage and time charters are expensed as incurred.
Cash and Cash Equivalents
The Company considers all highly liquid investments with maturities when purchased of three months or less to be cash equivalents.
Charter Hire Receivable and Allowance for Doubtful Accounts
Charter hire receivables are recorded at the invoiced amount and do not bear interest. The allowance for doubtful accounts is the Company's best estimate of the amount of probable credit losses in the Company's existing accounts receivable. The Company determines the allowance based on specific identification of certain receivable balances for which management believes collectability is questionable and by maintaining a percentage of outstanding receivable balances as an allowance to assure coverage for risks not specifically identified.
Claims Receivable
Claims receivable, which are included in prepaid expenses and other current assets, represent claims for reimbursement of expenses incurred that have been or will be made under our hull and machinery, and protection and indemnity coverages. We record the probable amount that we expect to recover from insurance net of the applicable deductible.
Concentrations of Credit Risk
Financial instruments which potentially subject the Company to significant concentrations of credit risk consist principally of cash, charter hire receivables and derivative instruments. These financial institutions are located throughout the world, and the Company's policy is designed to limit exposure to any one institution. The Company maintains reserves for potential credit losses, and historically such losses have not been significant.
Fuel and Other Inventories
Fuel and other inventories, consisting primarily of fuel, lubricating oil and spare parts aboard the vessels, are valued at the lower of cost (determined using a first-in, first-out basis for fuel and a weighted average basis for lubricating oil and spare parts) or market.
Fixed Assets
Vessels are stated at cost, which includes contract price and other direct costs relating to acquiring and placing the vessels in service, less accumulated depreciation. Major vessel improvements are capitalized and depreciated over the remaining useful lives of the vessels. Depreciation on vessels is calculated, based on cost less estimated residual value, using the straight-line method over the remaining useful life of the vessel. Depreciation on vessel improvements is calculated using the straight-line method over the remaining useful life of the vessel. The remaining useful life of each vessel is estimated as the period from the date we put the vessel in service to the date 30 years from the time that the vessel was initially delivered by the shipyard. Maintenance and repair costs that do not improve or extend the useful lives of the vessels, other than dry dock costs discussed below, are expensed as incurred.
Vessel construction in progress represents the accumulated costs to build vessels. The Company capitalizes direct and indirect costs clearly associated with the development, design, and construction of new vessels as these costs have a future benefit. Costs include installments paid to the shipyard, payments made to third parties in connection with the vessel construction program, and interest costs incurred during the construction period, which is defined as the period from the start of construction until the date that each vessel is substantially complete and ready for use.
Vessel leasehold improvements are the cost of improvements made to two vessels chartered in under long term charters. Vessel leasehold improvements, which are included with vessel improvements and other equipment, are amortized on a straight-line basis over the shorter of the useful life of the improvement or the term of the lease.
Deferred dry docking costs represent amounts incurred for periodic inspections and overhaul activities required for regulatory and insurance purposes. Dry dock costs are amortized on a straight-line basis over the period through the date of the next drydocking which is typically 30 months.
Other fixed assets, consisting principally of grabs, computer hardware, software and office equipment are depreciated on a straight-line basis.
We use the following useful lives to calculate depreciation and amortization:
| Description | Useful Life |
| Vessel | Remaining vessel life, 4 -21 years |
| Vessel improvements | Remaining vessel life, 4 -21 years |
| Vessel equipment | 2-5 years |
| Other fixed assets including grabs | 3-10 years |
Valuation of Long-Lived Assets and Goodwill
In accordance with the guidance outlined in ASC Topic 360-Property, Plant and Equipment , we perform tests for impairment of long-lived assets whenever events or circumstances, such as significant changes in charter rates or vessel valuations, suggest that long-lived assets may not be recoverable. An analysis of long-lived assets differs from our goodwill analysis in that impairment is only deemed to have occurred if the sum of the forecasted undiscounted future cash flows related to the assets is less than the carrying value of the assets we are testing for impairment. If the forecasted cash flows from long-lived assets are less than the carrying value of such assets, then we must write down the carrying value to its estimated fair value.
Due to the economic crisis, and the resulting decline in spot shipping rates that started in late 2008 and carried into 2009, together with the decline in our market capitalization, we concluded that there was a possible indication of impairment of long-lived assets at December 31, 2008 and prepared an analysis. Forecasting future cash flows involves the use of significant estimates and assumptions. Revenue and expense assumptions used in the cash flow projections are consistent with internal projections and reflected our economic outlook at the time of preparation. The cash flow period used was based on the remaining lives of the vessels, which range from 4 to 30 years. As of the December 31, 2008 analysis, there was no impairment of long-lived assets.
During the year ended December 31, 2009, we continued to monitor the overall shipping market including freight and charter rates. Based on our observations it is our belief that the assumptions used in our December 31, 2008 impairment analysis, are still applicable, and that there have not been any significant changes in events or circumstances. Consequently we have concluded that there are no new triggering events requiring an additional impairment analysis during 2009 and there is no impairment to our fleet at December 31, 2009. Future events or circumstances, which could require us to perform updated tests for impairment, may cause us to conclude that impairment of our fleet exists.
The provisions of ASC Topic 350 – Intangible – Goodwill and Other require an annual impairment test be performed on goodwill. We perform our annual impairment analysis of goodwill on May 31st of each year, or more often if there are indicators of impairment present. A two step approach is required. The first requires us to compare the reporting unit’s carrying value of net assets to their fair value. If the fair value exceeds the carrying value, goodwill is considered not impaired and we are not required to perform further testing. If the carrying value of the net assets exceeds the fair value, then we must perform the second step of the impairment test in order to determine the implied fair value of goodwill. If the carrying value of goodwill exceeds its implied fair value, then we are required to record an impairment loss equal to the difference.
Determining the reporting unit’s fair value involves the use of significant estimates and assumptions. The reporting unit consists of the companies acquired in connection with the initial public offering that created goodwill of $8.4 million. We estimate the fair value using income and market approaches through the application of discounted cash flow. We performed our annual analysis at May 31, 2009 by: (a) updating our 2009 budgeted cash flow based on actual results, (b) updating our forecast for years 2010 through 2013 based on changes made to our cash flow estimates, (c) updating our estimates of the weighted-average cost of capital. From the time we performed our analysis at May 31, 2009 to December 31, 2009, there were no changes in circumstances that necessitated further goodwill impairment testing and we concluded that there was no indication of goodwill impairment at December 31, 2009.
Deferred Financing Costs
Deferred financing costs are amortized over the term of the related financing using the straight-line method, which is not materially different than the effective interest method. Unamortized deferred financing costs are written off when the related debt is repaid and included in debt extinguishment gain or loss in the accompanying consolidated statements of operations.
Leases
Leases are classified as either capital or operating. Those leases that transfer substantially all the benefits and risks of ownership of property to the Company are accounted for as capital leases. All other leases are accounted for as operating leases. Capital leases are accounted for as assets and are fully amortized on a straight-line basis over the lesser of the estimated useful lives or the remaining available lease terms. Commitments to repay the principal amounts arising under capital lease obligations are included in current liabilities to the extent that the amount is repayable within one year; otherwise the principal is included in amounts due after one year. The capitalized lease obligation reflects the present value of future lease payments. The financing element of the lease payments is charged to income over the term of the lease. Deferred leasing costs are amortized over the term of the lease using the straight-line method, which is not materially different than the effective interest method. Rental expense for leases classified as operating and that contain predetermined fixed decreases of minimum rentals during the term of the lease is recognized on a straight-line basis over the life of the lease, beginning with the point at which the Company obtains control and possession of the leased properties. The difference between the amounts charged to operations and amounts paid is recorded as deferred rent expense.
Taxation
As discussed above, the shareholders of the Bermuda company exchanged their shares for an equal number of shares in a newly formed Irish company. TBSI is not subject to corporate income taxes on its profits in Ireland because its income is derived from sources outside this jurisdiction. Currently there is no Bermuda income or profit tax and there is no Marshall Islands corporate income taxes on income derived from sources outside the Marshall Islands. Minor registration and tonnage taxes must be paid annually and have been included in the vessels' operating expenses in the accompanying consolidated statements of operations.
Pursuant to the Internal Revenue Code of the United States, U.S. source income from the international operations of ships is generally exempt from U.S. tax if the company operating the ships meets certain requirements. Among other things, in order to qualify for this exemption, the company operating the ships must meet two requirements. First, a company must be incorporated in a country which grants an equivalent exemption from income taxes to U.S. citizens and U.S. corporations. Second, more than 50% of the outstanding shares of stock of either the company or its parent, by both total combined voting and total value, must be listed on an exchange in the country of incorporation or another country that grants an equivalent exemption from income taxes to U.S. citizens and U.S. corporations or on a U.S. exchange and be regularly traded, as defined.
TBSI and its foreign subsidiaries are incorporated in countries that grant equivalent exemption from income taxes to U.S. citizens and U.S. corporations. In June 2005, TBSI met the second requirement for exemption from U.S. income tax when it completed its initial public offering and its stock began being regularly traded on the NASDAQ market.
United States federal and state income taxes that TBSI's U.S. subsidiaries are subject to are not significant to the accompanying consolidated financial statements and are included as a component of general and administrative expenses in the consolidated statements of operations.
Stock Based Compensation
The Company accounts for stock based compensation in accordance with the guidelines outlined in ASC Topic 718-Stock Compensation using the modified prospective method which requires measurement of compensation cost for all stock-based awards at fair value on the date of grant and recognition of compensation over the service period for awards expected to vest.
Earnings Per Share
Basic earnings (loss) per ordinary share are computed using the two-class method for share-based payment transactions, which are participating securities. The two-class method of computing earnings per share is an earnings allocation formula that determines earnings per share for ordinary stock and any participating securities according to dividends declared (whether paid or unpaid) and participation rights in undistributed earnings. The earning (loss) available to ordinary shares are divided by the weighted-average number of ordinary shares outstanding during the year. Diluted earnings (loss) per share is computed by dividing the earning (loss) available to ordinary shares by the weighted-average number of ordinary shares outstanding during the year excluding dilutive shares that are participating securities.
Fair Value of Financial Instruments
Financial instruments, which potentially subject us to concentrations of credit risk, consist principally of cash equivalents, charter hire receivables, derivate instruments and debt. We place our cash equivalents with a number of financial institutions to help limit the amount of credit exposure to any one financial institution. Concentrations of credit risk with respect to trade receivables are limited due to the large number of customers comprising our customer base, and their dispersion across many geographic areas. As of December 31, 2009 and 2008, one customer accounted for 11.7% and 7.7%, respectively, of charter hire receivables.
The following method and assumptions were used to estimate the fair value of financial instruments included in the following categories:
| · | Cash and cash equivalents, charter hire and claims receivable - The carrying amount reported in the accompanying consolidated balance sheets for cash and cash equivalents, charter hire and claims receivable approximates their fair value due to the current maturities. |
| · | Short-term debt - The carrying amount reported in the accompanying consolidated balance sheets for short-term debt approximates its fair value due to the current maturity of such instruments and their variable rates. |
| · | Long-term debt - The carrying amount of our long-term debt, which was reclassified to short-term due to probable financial ratio covenant violations within the next 12 months, approximates fair value due to the variable interest rates on bank borrowings and based on the current rates offered to us for debt of the same remaining maturities. |
| · | Interest Rate Swaps - The Company utilizes certain derivative financial instruments to manage interest rate risk. Derivative instruments are entered into for periods consistent with related underlying exposures and do not constitute positions independent of those exposures. The Company does not enter into contracts for speculative purposes, nor is it a party to any leveraged derivative instruments. The Company is exposed to credit loss in the event of nonperformance by the counterparties on derivative contracts. The Company minimizes its credit risk on these transactions by dealing with several financial institutions and, therefore, does not anticipate nonperformance. |
Foreign Currency Transactions
The financial statements are expressed in United States dollars. Gains and losses resulting from foreign currency transactions, which are not significant, are included in other income.
Financial Derivative Instruments and Hedging Activities
The Company seeks to manage its interest rate risk associated with variable rate borrowings with the use of derivative financial instruments. The Company accounts for derivative financial instruments in accordance with the guidance outlined in ASC Topic 815 – Derivatives and Hedging. The fair value of derivative financial instruments are recognized as assets or liabilities at each balance sheet date, with changes in fair value affecting net income (loss) or comprehensive income (loss) as appropriate.
Note 3 — New Accounting Pronouncements
In June 2009, the Financial Accounting Standards Board (FASB) issued the FASB Accounting Standards Codification (ASC), The Codification and the Hierarchy of Generally Accepted Accounting Principles Topic ASC 105-10. The Company implemented the guidance in the third quarter of 2009 which stipulates the Codification as the authoritative version of the FASB Accounting Standards Codification (Codification) as the single source of authoritative nongovernmental U.S. Generally Accepted Accounting Principles (GAAP). The statement is effective for interim and annual periods ending after September 15, 2009. The Company has updated its references to GAAP in its consolidated financial statements issued for the year ended December 31, 2009. As the Codification was not intended to change or alter existing GAAP, it did not have any impact on the Company’s consolidated financial statements.
Adopted
In August 2009, the FASB issued changes to fair value accounting for liabilities. These changes clarify existing guidance that in circumstances in which a quoted price in an active market for the identical liability is not available, an entity is required to measure fair value using either a valuation technique that uses a quoted price of either a similar liability or a quoted price of an identical or similar liability when traded as an asset, or another valuation technique that is consistent with the principles of fair value measurements, such as an income approach (e.g., present value technique). The adoption of the provisions did not have a material impact on the Company’s previously issued consolidated financial statements.
In May 2009, the FASB issued guidance on accounting for and disclosure of events that occur after the balance sheet date but before financial statements are issued or are available to be issued. The guidance, which is outlined in ASC Topic 855 – Subsequent Events, establishes the period after the balance sheet date during which management of a reporting entity should evaluate events or transactions that may occur for potential recognition or disclosure in the financial statements, the circumstances under which an entity should recognize events or transactions occurring after the balance sheet date in its financial statements, and the disclosures that an entity should make about events or transactions that occurred after the balance sheet date. The adoption of these changes did not have an impact on our consolidated financial statements because the Company already followed a similar approach prior to the adoption of this guidance.
In April 2009, the FASB issued updated guidance on interim disclosures about the fair value of financial instruments effective for interim and annual reporting periods ending after June 15, 2009. The guidance, which is outlined in ASC Topic 825 – Financial Instruments, did not have an impact on our consolidated financial statements.
On January 1, 2009, the Company adopted changes issued by the FASB on determining whether instruments granted in share-based payment transactions are participating securities and should be included in the computation of earnings per share using the two-class method. The guidance, which is outlined in ASC Topic 260 – Earnings per Share, provides that unvested share-based payment awards that contain non-forfeitable rights to dividends are participating securities that should use the two-class method of computing earnings per share, which is an earnings allocation formula that determines earnings per share for ordinary shares and any participating securities according to dividends declared (whether paid or unpaid) and participation rights in undistributed earnings. Our non-vested stock, consisting of time-vested restricted shares, are considered participating securities since the share-based awards contain a non-forfeitable right to dividends irrespective of whether the awards ultimately vest. The adoption of the provisions did not have a material impact on the Company’s previously issued consolidated financial statements.
On January 1, 2009, the Company adopted changes issued by the FASB on accounting and reporting standards for entities with an outstanding noncontrolling interest in one or more subsidiaries or that deconsolidate a subsidiary. The guidance, which is outlined in ASC Topic 810 – Consolidation is effective for fiscal years and interim periods beginning after December 15, 2008. The changes improve the relevance, comparability and transparency of financial information that a reporting entity provides in its consolidated financial statements. The guidance requires: (i) ownership interests in subsidiaries held by parties other than the parent be clearly identified and presented within equity but separate from the parent's equity in the consolidated statement of financial position; (ii) consolidated net income attributable to the parent and the noncontrolling interest be identified and presented on the face of the consolidated statement of income; (iii) changes in a parent's ownership interest while the parent retains its controlling financial interest in its subsidiary be consistently accounted for as equity transactions; (iv) any retained noncontrolling equity investment in a deconsolidated subsidiary be initially measured at fair value and that any gain or loss on the deconsolidation of a subsidiary be measured using fair value of the noncontrolling equity investment rather than the carrying amount of that retained investment and (v) entities provide sufficient disclosures that clearly identify and distinguish between the interests of the parent and noncontrolling owners. Adoption of these changes had no impact on our consolidated financial statements as all consolidated subsidiaries are wholly owned.
On January 1, 2009, the Company adopted changes issued by the FASB on accounting for business combinations. The guidance, which is outlined in ASC Topic 805 – Business Combinations, applies prospectively to business combinations for which the acquisition date is on or after the beginning of the first annual reporting period beginning on or after December 15, 2008. The changes, while retaining the fundamental requirements of accounting for business combinations, require that the purchase method be used for all business combinations. The guidance establishes principles and requirements for how an acquiring entity measures and recognizes in its financial statements: (i) the identifiable assets acquired; (ii) the liabilities assumed; (iii) any noncontrolling interest in the acquiree and (iv) the goodwill acquired or a gain from a bargain purchase. It further sets forth disclosure criteria to enable a better understanding of the nature and effects of a business combination. Adoption of this guidance did not have an impact on our consolidated financial statements.
As of January 1, 2009, the Company adopted changes issued by the FASB on fair value accounting and reporting relating to nonfinancial assets and liabilities that are not recognized or disclosed at fair value in the financial statements. The Company had previously adopted as of January 1, 2008, changes issued by the FASB on fair value accounting and reporting of financial assets and liabilities. The guidance, which is outlined in ASC Topic 820 – Fair Value Measurements and Disclosures, defines fair value, establishes a framework for measuring fair value and expands the related disclosure requirements about fair value measurement. The guidance applies to other accounting standards that require or permit fair value measurements and indicates, among other things, that a fair value measurement assumes that the transaction to sell an asset or transfer a liability occurs in the principal market for the asset or liability or, in the absence of a principal market, the most advantageous market for the asset or liability. Fair value is defined in the guidance as based upon an exit price model. Adoption of these changes did not have an impact on our consolidated financial statements.
Starting with the consolidated financial statements for the first quarter of 2008, the Company adopted changes issued by the FASB on disclosures about derivative instruments and hedging activities. The changes enhance disclosures about an entity’s derivative and hedging activities, including (i) how and why an entity uses derivative instruments, (ii) how derivative instruments and related hedged items are accounted for, and (iii) how derivative instruments and related hedged items affect an entity’s financial position, financial performance, and cash flows. The guidance, which is outlined in ASC Topic 815 – Derivatives and Hedging, was effective for fiscal years and interim periods beginning after November 15, 2008 with early application encouraged. Adoption of these changes had no impact on our consolidated financial statements other than additional disclosures made in our notes to the consolidated financial statements.
Issued
In June 2009, the FASB issued changes to the accounting for variable interest entities. These changes, as discussed in ASC Topic 810-Consolidation, require an enterprise (i) to perform an analysis to determine whether the enterprise’s variable interest or interests give it a controlling financial interest in a variable interest entity; (ii) to require ongoing reassessments of whether an enterprise is the primary beneficiary of a variable interest entity; (iii) to eliminate the quantitative approach previously required for determining the primary beneficiary of a variable interest entity; (iv) to add an additional reconsideration event for determining whether an entity is a variable interest entity when any changes in facts and circumstances occur such that holders of the equity investment at risk, as a group, lose the power from voting rights or similar rights of those investments to direct the activities of the entity that most significantly impact the entity’s economic performance and (v) to require enhanced disclosures that will provide users of financial statements with more transparent information about an enterprise’s involvement in a variable interest entity. These changes become effective January 1, 2010, and the Company is currently evaluating the potential impact of these changes on our consolidated financial statements.
Note 4 — Allowance for Charter Hire
The Company reviews the allowances for doubtful accounts monthly. Account balances are charged off against the allowance when the Company feels that it is probable the receivable will not be recovered.
Allowance for doubtful charter hire receivable is as follows (in thousands):
| | Balance at | | | | Write-offs Net of | | | Balance at | |
| | Beginning of Year | | Additions | | Recoveries | | | End of Year | |
| December 31, 2009 | $ | 500 | | $ | 901 | | $ | (401 | ) | | $ | 1,000 | |
| December 31, 2008 | $ | 490 | | $ | 54 | | $ | (44 | ) | | $ | 500 | |
| December 31, 2007 | $ | 443 | | $ | 81 | | $ | (34 | ) | | $ | 490 | |
Prepaid expenses and other current assets consist of the following (in thousands):
| | | December 31, | | | December 31, | |
| Description | | 2009 | | | 2008 | |
| | | | | | | |
| Claims receivable | | $ | 4,908 | | | $ | 5,302 | |
| Due from agents | | | 1,546 | | | | 2,120 | |
| Other receivables | | | 807 | | | | 1,163 | |
| Prepaid expenses | | | 2,053 | | | | 2,137 | |
| TOTAL | | $ | 9,314 | | | $ | 10,722 | |
Note 6 — Fuel and Other Inventories
Fuel and other inventories consist of the following (in thousands):
| | | December 31, | | | December 31, | |
| Description | | 2009 | | | 2008 | |
| Fuel | | $ | 9,093 | | | $ | 7,081 | |
| Lubricating oil | | | 5,235 | | | | 4,356 | |
| Other | | | 712 | | | | 642 | |
| TOTAL | | $ | 15,040 | | | $ | 12,079 | |
Note 7 — Fixed Assets
Fixed assets consist of the following (in thousands):
| Description | | December 31, 2009 | | | December 31, 2008 | |
| Vessels | | $ | 717,535 | | | $ | 677,901 | |
| Vessel improvements and other equipment | | | 170,325 | | | | 140,738 | |
| Deferred drydocking costs | | | 26,619 | | | | 15,724 | |
| Vessel construction in process | | | 130,711 | | | | 126,024 | |
| Other fixed assets | | | 18,912 | | | | 16,979 | |
| | | | 1,064,102 | | | | 977,366 | |
| Less accumulated depreciation and amortization | | | (259,844 | ) | | | (168,660 | ) |
| | | $ | 804,258 | | | $ | 808,706 | |
In September 2009, the Rockaway Belle, which is the first of the six vessels being built under individual contracts with China Communications Construction Company Ltd. and Nantong Yahua Shipbuilding Group Co., Ltd. ("Shipyard"), was delivered. The contracts to build six multipurpose vessels with retractable tweendecks were entered into in February 2007 at an original contract purchase price of $35.4 million per vessel. Three of the vessels are tentatively scheduled to be delivered during the 1st, 2nd and 4th quarters of 2010 and two remaining vessels are scheduled for delivery during the 1st and 3rd quarters of 2011. Installments of $7.0 million per vessel are due to the Shipyard when each of four pre-delivery milestones (contract signing, steel cutting, keel laying, and launching) are met. At delivery, the final installment of $7.4 million, as adjusted, is due to the Shipyard. Payments made for the five remaining vessels to be delivered as of December 31, 2009 are as follows (in thousands):
| Hull Number | Vessel Name | | Payments through December 31, 2009 | |
| | | | | |
| Hull No NYHS200721 | Dakota Princess | | $ | 28,000 | |
| Hull No NYHS200722 | Montauk Maiden | | | 28,000 | |
| Hull No NYHS200723 | To be Named | | | 21,000 | |
| Hull No NYHS200724 | Omaha Belle | | | 21,000 | |
| Hull No NYHS200725 | To be Named | | | 14,000 | |
| | Payments to yard | | $ | 112,000 | |
| | Cap interest | | | 14,856 | |
| | Design & other costs | | | 3,855 | |
| | | | $ | 130,711 | |
The Company capitalized interest, including loan origination fees, of $4.2 million, $5.8 million, and $4.9 million in 2009, 2008 and 2007, respectively. Capitalized interest and deferred finance costs are added to the cost of each vessel and will be amortized over the estimated useful life of the respective vessel when the vessel is placed into service.
During 2009, 2008 and 2007 the Company took delivery of one vessel for $39.8 million, 11 vessels for $312.5 million and four vessels for $85.7 million.
In 2007 the Company sold four vessels for $62.4 million. The Maya Princess was sold for $13.0 million from which the Company realized a loss of approximately $0.8 million. The Huron Maiden was severely damaged in a grounding accident that resulted in the vessel being declared a total loss. The Company received insurances proceeds of $8.0 million, after a scrap value credit of $2.0 million, in addition to sale proceeds on the sale of the vessel for scrap of $2.8 million and realized a gain on the casualty and sale of the vessel of approximately $6.0 million. Lastly, in January 2007, the Company sold and leased back the Seminole Princess and Laguna Belle for $23.0 million and $22.0 million, respectively. Net proceeds from the transactions were $38.6 million after expenses of $0.9 million and a buyer/lessor deposit retained by the charters of $5.5 million. The Company had taken delivery of the vessels for a cost of $45.1 million in November 2006. Under the sale-leaseback arrangement, the Company entered into a seven-year bareboat charters for each vessel. The charters are classified as operating leases – see Note 18 "Commitments and Contingencies."
The bareboat charters allow the Company to purchase the respective vessel at the end of the fifth, sixth or seventh year of the charter period at a vessel price of $11.1 million, $9.15 million or $6.75 million, respectively. The purchase options can be exercised at any other date during the option period at a pro-rata price. The $5.5 million deposit will be returned or can be applied toward the purchase option if the vessels are purchased.
Depreciation and amortization of vessels and other assets was $95.9 million, $73.5 million, and $36.0 million respectively, for the years ended December 31, 2009, 2008 and 2007, respectively.
Note 8 — Advances to / from Affiliates
Advances to/from affiliates, which are entities related by ordinary shareholders, are non-interest-bearing, due on demand and expected to be collected or paid in the ordinary course of business, generally within the year. The Company typically advances funds to affiliates in connection with the payment of management fees, commissions and consulting fees. Advances from affiliates originated primarily from amounts due to affiliates for management fees, commissions and consulting fees earned.
Note 9 — Other assets and deferred charges
Other assets and deferred charges consist of the following (in thousands):
| | | December 31, | |
| Description | | 2009 | | | 2008 | |
| | | | | | | |
| Deferred financing costs, net | | $ | 5,963 | | | $ | 5,015 | |
| Deposit for bareboat charter | | | | | | | | |
| and deferred rent expense | | | 9,152 | | | | 8,123 | |
| Investment in equity securities available for sale | | | 404 | | | | 404 | |
| Investments in joint ventures | | | 5,325 | | | | 4,872 | |
| Total | | $ | 20,844 | | | $ | 18,414 | |
| | | | | | | | | |
Deferred financing costs represent fees incurred to obtain new financing, refinance existing debt or arranging long term leases on vessels. Accumulated amortization of deferred financing costs was $3.4 million and $1.2 million at December 31, 2009 and 2008, respectively.
In connection with the sale-leaseback of the Seminole Princess and Laguna Belle in January 2007, $5.5 million was retained by the buyer/lessor as a deposit on the bareboat charters. The leases for the vessels contain predetermined fixed decreases of charter hire payments due under the charters during the term of the leases. The Company recognizes the related rental expense on a straight-line basis over the life of the leases and records the difference between the amounts charged to operations and amounts paid as deferred rent expense.
In March 2008, the Company acquired a 50% interest in Panamerican Port Services SAC ("PPS") for $1.9 million. PPS operates a warehouse located in Callao, Peru. In September 2008, the Company acquired a 50% interest in GAT-TBS Mining Consortium S.A ("GAT-TBS Mining"), which mines calcium carbonate aggregates in the Dominican Republic. Investments of $0.4 million and $2.8 million were made in GAT-TBS Mining for the years ending December 31, 2009 and 2008, respectively.
In November 2005, the Company entered into a joint venture with GMT Shipping Line Ltd. to provide liner services to and from the East and North Coasts of South America and from and to the West Coast of Africa. The Company acquired a 50% interest in the joint venture for $0.9 million in investments and loans. In November 2007, the joint venture partners agreed to end the activities of the joint venture in 2008 when all outstanding loans of $0.8 million were repaid and a partial distribution of profits of $0.1 million was paid to the Company.
All investments are accounted for using the equity method. For the years ended December 2009 and 2008, income earned from joint ventures was $0.1 million and $0.2 million, respectively. For the year ended December 2007 losses from joint ventures was $27,000.
Note 10 — Accounts Payable-Accrued Expenses
Accrued expenses consist of the following (in thousands):
| | | December 31, | |
| Description | | 2009 | | | 2008 | |
| Accounts payable and accrued expenses - vessel | | | 33,631 | | | | 29,082 | |
| Accounts payable and accrued expenses - voyage | | | 16,288 | | | | 11,126 | |
| Accrued payroll and related costs | | | 2,135 | | | | 1,394 | |
| Total | | $ | 52,054 | | | $ | 41,602 | |
| | | | | | | | | |
Note 11 — Financing
The Company’s outstanding debt balances consist of the following (in thousands)
| | | Interest Rate at December 31, 2009 | | December 31, 2009 | | December 31, 2008 | |
| | | | | | | | |
| Bank of America - term credit facility, | | | | | | | |
| expires December 31, 2011 | | 5.53% | | $ | 76,000 | | $ | 95,000 | |
| Bank of America - revolving credit facility, | | 5.53% | | | | | | | |
| expires March 26, 2012 | | 75,000 | | | 75,000 | |
| The Royal Bank of Scotland credit facility, | | | | | | | | | |
| new vessel buildings, expires December 2015 | | 4.00% | | | 103,758 | | | 75,000 | |
| Credit Suisse credit facility, | | | | | | | | | |
| expires December 12, 2017 and February 19, 2018 | | 3.00% & 3.02% | | | 28,750 | | | 31,750 | |
| DVB Group Merchant Bank (Asia) Ltd credit facility, | | | | | | | | | |
| expires January 23, 2013 | | 6.28% | | | 35,864 | | | 60,324 | |
| AIG Commercial Equipment Finance, Inc. credit facility, | | | | | | | | | |
| expires April 1, 2012 | | 10.00% | | | 19,250 | | | 29,750 | |
| Commerzbank AG credit facility, | | | | | | | | | |
| expires June 2, 2011 | | 3.25% | | | 4,500 | | | 6,500 | |
| Berenberg Bank credit facility, | | | | | | | | | |
| expires June 19, 2012 | | 4.25% | | | 8,125 | | | 9,750 | |
| Total | | | | $ | 351,247 | | $ | 383,074 | |
| Less: Current Portion | | | | | (351,247 | ) | | (56,945 | ) |
| Long Term Portion | | | | | | | | 326,129 | |
| | | | | | | | | | |
Below are payment obligations due during the next five years according to the scheduled repayment terms in the credit facility agreements.
| 2010 | | $ | 73,897 | |
| 2011 | | | 72,533 | |
| 2012 | | | 103,908 | |
| 2013 | | | 15,959 | |
| 2014 | | | 29,584 | |
| Thereafter | | | 55,366 | |
| | | $ | 351,247 | |
| | | | | |
Debt Reclassification
Generally accepted accounting principles require that long-term loans be classified as a current liability when either a covenant violation that gives the lender the right to call the debt has occurred at the balance sheet date, or such a covenant violation would have occurred absent a waiver of those covenants, and in either case it is probable that the covenant violation will not be cured within the next 12 months. At December 31, 2009, the Company was in compliance with all modified additional covenants and the debt was not callable by the lenders. The Company anticipates, however, that it will not meet the existing consolidated fixed charge and consolidated leverage ratio requirements during the next 12 months. The Company is discussing with its lenders the modification of financial covenants and other terms to its credit facilities. Additionally, the Company is pursuing alternative financing sources to repay some of the existing credit facilities. The long-term portion of outstanding debt is required to be classified as a current liability on the consolidated balance sheet at December 31, 2009, until the loan modifications have been finalized or funding from alternative financing sources has been received. However, once the loan modifications are made or alternative financing is received, the debt due after 2010 will be classified as long term debt in the consolidated balance sheet.
Loan Modifications
As a result of the global financial downturn and its impact on the shipping industry, specifically vessel market valuations, the Company started discussions with its lenders in early 2009 to obtain waivers of the collateral coverage requirement and financial covenants such as the consolidated leverage ratio, consolidated fixed interest coverage ratios and minimum cash balance requirement. The credit facilities were modified in March 2009, to waive the collateral coverage and financial covenants through January 1, 2010, provided that we meet two additional covenants. The loan modifications introduced the requirement that the Company have earnings before interest, taxes, depreciation and amortization or EBITDA to interest expense ratio of not less than 1.10 to 1.00, 1.35 to 1.00 and 1.75 to 1.00 for the second, third and fourth quarters of 2009, respectively, and minimum month-end cash balance of not less than $40.0 million during 2009. In connection with the March 2009 loan modifications, the Company incurred financing costs of $4.4 million, which is being deferred and amortized over the remaining in term of the respective credit facilities.
In connection with the March 2009 modifications that introduced the additional covenants, some of the credit facilities were further modified and additional minimum cash sub-requirements were imposed, which are counted toward the month-end minimum cash balance requirement. The amount available under the Bank of America Revolving credit facility was reduced to $85.0 million from $125.0 million and an average monthly cash balance of $15 million is required to be kept with Bank of America. The repayment term of each of the loans made under The Royal Bank of Scotland credit facility or RBS were modified from 40 quarterly installments to 20 quarterly installments. Further, while the quarterly installments of $0.4 million due on each of the RBS loans remained the same, the final payment due increased to $16.6 million from $8.3 million and an average monthly cash balance of $10 million is required to be kept with RBS. The Company was also required to deposit $20.0 million into a restricted cash account from which payments due to the shipyard that are not funded by RBS are to be paid. Cash held in the restricted cash account is not counted toward the minimum month-end cash balance requirement. In 2009, payments of $11.3 million were made to the shipyard from the restricted cash account and at December 31, 2009, there was a balance of $8.7 million in the restricted cash account.
The Company began discussion in late 2009 with its lenders to modify financial covenants and other terms to its credit facilities. In connection with those ongoing discussions, the Company obtained a three month extension to April 1, 2010, of waivers expiring on January 1, 2010. Under the waiver extensions an EBITDA to interest expense ratio of not less than 1.75 to 1.00 is allowed at the determination date (March 31, 2010). Additionally, a minimum month-end cash balance of not less than $25 million is required, which was a reduction from the previous minimum month-end cash balance of $40.0 million. In connection with the waiver extension the Company incurred finance costs of $1.5 million, which are being deferred and amortized over the remaining in term of the respective credit facility.
Covenants
At December 31, 2009, the Company was required, under the March 2009 waiver, to meet modified covenants consisting of EBITDA to interest expense ratio of not less than 1.75 to 1.00 and month-end cash balance of not less than $40.0 million. The Company was in compliance with the modified covenants at December 31, 2009, and consequently, the minimum consolidated fixed charge ratio and maximum consolidated leverage ratio covenants, as provided for in the original credit facilities, were waived. The covenants for all but the Berenberg Bank credit facility require that the Company maintain a minimum consolidated fixed charge ratio, a maximum restricted consolidated leverage ratio, as well as maintain tangible net worth within defined limits and maintain minimum month-end cash and cash equivalent
Balances as described in the below table:
| Convenant | | Required | | Actual |
| | | | | |
| Minimum Consolidated Tangible Net Worth | | $235 million plus 75% of net income per quarter for all quarters after September 30, 2007, with no reduction for losses, plus 100% of increases to shareholders equity for the issuance of stock. At December 31, 2009, a Consolidated Tangible Net Worth of $501.0 million | | $522.0 million |
| | | | | |
| Maximum Consolidated Leverage Ratio | | Not more than a ratio of 3.00 to 1.00 of Consolidated Funded Indebtedness, as defined in the loan agreements, at the end of a quarter to Consolidated EBITDA for the four previous quarters. | | 5.93 to 1.00 waived |
| | | | | |
| Minimum Consolidated Fixed Charge Coverage Ratio | | Not less than a ratio of 1.50 to 1.00 [1.25 to 1.00 under the Credit Suisse credit facility] of Consolidated EBITDA for the four previous quarters to Consolidated interest expense for the same period. plus regularly scheduled debt payments for the following 12 months | | 0.48 to 1.00 waived |
| | | | | |
| Minimum Cash Liquidity | | Qualified cash of $15.0 million, [$10.0 million under the AIG credit facility] [Qualified cash is defined in the agreement as cash and cash equivalents plus the available unused portion under the revolving credit facility] | | $51.0 million |
The credit facilities include, among others requirements, customary restrictions on the Company’s ability to incur indebtedness or grant liens, enter into transactions with affiliates, merge, consolidate, or dispose of assets, change the nature of its business, and the requirements to comply with maritime laws and regulations, maintain the vessels consistent with first-class ship ownership and management practice, keep appropriate accounting records and maintain adequate insurance. In addition, some of the credit facilities restrict the Company as to the payment of dividends, and the amount of leverage, investment and capital expenditures without consent of the lender.
The table below summarizes the repayment terms, interest rate benchmark and post amendment margin rates, number of vessels and net book value at December 31, 2009 collateralizing each credit facility:
| Credit Facility | | Repayment terms | | Base and Margin Interst Rate | | Net Book Value of Collateral at December 31, 2009 in millions | | Number of Vessels Collateralizing Credit Facility |
| | | | | | | | | | |
| Bank of America - term credit facility | | 15 quarterly installments of $9.5 million through December 31, 2011 | | LIBOR plus 5.25% | | | | |
| | | | | | | | | | |
| Bank of America - revolving credit facility, | | Balloon Payment due March 26, 2012 | | LIBOR plus 5.25% | | $ 390.7 | | 30 |
| | | | | | | | | |
| The Royal Bank of Scotland credit facility | | | | | | | | |
| | Construction Period | | Conversion to term loan of the debt associated with each vessel upon delivery of the respective vessel | | LIBOR plus 3.75% | | $ 130.7 | | 5 (a) |
| | | | | | | | | | |
| | | | | | | | | | |
| | Post Delivery Term Loan | | 20 quarterly installments of $0.4 million commencing three months after delivery of each vessel with a final installment due of $16.6 million | | LIBOR plus 1.50% | | $ 39.8 | | 1 |
| | | | | | | | | | |
| DVB Group Merchant Bank (Asia) Ltd credit facility | | 10 quarterly installments of $4.9 million and 10 quarterly installments of $2.6 million through January 2013 | | LIBOR plus 5.00% | | $ 35.1 | | 7 |
| | | | | | | | | | |
| AIG Commercial Equipment Finance, Inc. credit facility | | 8 quarterly installments of $2.63 million and 8 quarterly installments of $1.75 million through April 2012 | | LIBOR plus 5.00% | | | | |
| | | | | With an Interest Rate Floor of 10% | | $ 80.8 | | 4 |
| | | | | | | | | | |
| Credit Suisse credit facility | | 8 quarterly installments of $1.5 million and 32 quarterly installments of $0.9 million through December 2017 and February 2018 | | LIBOR plus 2.75% | | $ 59.0 | | 2 |
| | | | | | | | | | |
| Commerzbank AG credit facility | | 4 quarterly installments of $1.5 million, and 4 quarterly installments of $1.0 million and 2 quarterly installments of $0.25 million through June 2011 | | LIBOR plus 3.00% | | $ 22.3 | | 1 |
| | | | | | | | | |
| Berenberg Bank credit facility | | 16 quarterly installments of $0.8 million through June 2012 | | LIBOR plus 4.00% | | $ 23.4 | | 1 |
| | | | | | | | | |
| | | | | | | | | | 51 |
| | (a) - vessels are under construction at December 31, 2009 and collaterialized by shipbuilding contracts. | | | | | |
The above credit facilities are collateralized primarily by vessels that are subject to the respective ship mortgages and assignment of the respective vessels’ freight revenue and insurance, as well as guarantees by TBSI and each of its subsidiaries with an ownership interest in the collateralized vessel. The BOA credit facility is also guaranteed by the Company’s non vessel owning subsidiaries. The market value of the vessels, as determined by appraisal, is required to be above specified value to loan ratios, as defined in each credit facility agreements, that range from 125% to 177% of the respective credit facility’s outstanding amount. The credit facilities require mandatory prepayment or delivery of additional security in the event that the fair market value of the vessels falls below limits specified in each credit facility agreement.
The RBS credit facility is collateralized by the respective shipbuilding contracts while the vessels are under construction and by Preferred Ship Mortgages on the new vessels and assignment of freight revenue and insurance after delivery of the respective vessel. Further, the RBS credit facility prohibits the Company from materially amending or failing to enforce the shipbuilding contracts.
At December 31, 2009 the Company had $24.6 million outstanding under the RBS credit facility, which was collateralized by the Rockaway Belle, and the following draw downs made with respect to building milestones;
| · | $ 19.6 million drawn down on the contract signing, steel cutting keel laying and launch of Hull No NYHS200721 (M/V Dakota Princess); |
| · | $ 20.0 million drawn down on the contract signing, steel cutting, keel laying of Hull No NYHS200722 (M/V Montauk Maiden); |
| · | $ 15.0 million drawn down on the contract signing, steel cutting, keel laying of Hull No NYHS200723; |
| · | $ 14.6 million drawn down on the contract signing, steel cutting, keel laying of Hull No NYHS200724; (M/V Omaha Belle), and |
| · | $ 10.0 million drawn down on the contract signing, steel cutting of Hull No NYHS200725. |
Guarantee Facility
Concurrent with the Company entering into the RBS credit facility, the Company entered into an agreement ("Guarantee Facility") to have The Royal Bank of Scotland plc guarantee payments due under the shipbuilding contracts. Under the Guarantee Facility, The Royal Bank of Scotland plc has agreed to guarantee the second, third, and fourth installments due by the Company under the respective shipbuilding contract. The Guarantee Facility provides for a guarantee of up to $14.0 million for each vessel loan for an aggregate guarantee of $84.0 million. The Guarantee Facility expires 12 months after the rescheduled anticipated delivery date of the respective vessel. TBSI guarantees the Guarantee Facility.
Note 12 — Derivative Financial Instruments
The Company is exposed to certain risks relating to its ongoing business operations. Currently, the only risk managed by using derivative instruments is interest rate risk. Interest rate swaps are entered into to manage interest rate risk associated with the Company’s floating-rate borrowings. ASC Topic 815 - Derivative and Hedging requires companies to recognize all derivative instruments as either assets or liabilities at fair value in the statement of financial position. The Company designates and accounts for its interest rate swap contracts as cash flow hedges in accordance with ASC Subtopic 815-30 Cash Flow Hedges.
For derivative instruments that are designated and qualify as a cash flow hedge, the effective portion of the gain or loss on the derivative is reported as a component of other comprehensive income and reclassified into earnings in the same period or periods during which the hedged transaction affects earnings. Gains and losses on the derivative representing either hedge ineffectiveness or hedge components excluded from the assessment of effectiveness are recognized in current earnings.
As of December 31, 2009, the total notional amount of the Company’s receive-variable/pay-fixed interest rate swaps was $186.7 million and have various maturity dates from June 2010 to December 2019. Interest rate contracts have fixed interest rates ranging from 2.92%to 5.24%, with a weighted average rate of 3.79%. Interest rate contracts having a notional amount of $186.7 million at December 31, 2009, decrease as principal payments on the respective debt are made. Information on the location and amounts of derivative fair values in the consolidated balance sheets and derivative gains and losses in the consolidated income statements is shown below (in thousands):
| | | Liability Derivatives | |
| | | December 31, 2009 | | December 31, 2008 | |
| | | Balance Sheet Location | | Fair Value | | Balance Sheet Location | | Fair Value | |
| | | | | | | | | | |
| Derivatives designated as hedging instruments under ASC Topic 815 | | | | | | | | |
| | Interest rate contracts | Other liabilities | | $ | 8,997 | | Other liabilities | | $ | 13,727 | |
| | | | | | | | | | | | |
| Derivatives not designated as hedging instruments under ASC Topic 815 | | | | | | | | | | |
| | Interest rate contracts | Other liabilities | | | 980 | | Other liabilities | | | 1,705 | |
| | | | | | | | | | | | |
| Total liability derivatives | | | $ | 9,977 | | | | $ | 15,432 | |
| | | | | | | | | | | | |
| | | Amount of Gain or (Loss) Recognized in OCI on Derivatives (Effective Portion) | |
| | | For the Years Ended December 31, | |
| Derivatives in ASC Topic 815 Cash Flow Hedging Relationships | | 2009 | | | 2008 | | | 2007 | |
| | | | | | | | | | |
| Interest rate contracts | | $ | (8,275 | ) | | $ | (13,727 | ) | | $ | (2,897 | ) |
| | | | Amount of Gain or (Loss) Recognized in Income on Derivatives | |
| | | | For the Years Ended December 31, | |
Derivatives Not Designated as Hedging Instruments under ASC Topic 815 | Location of Gain or (Loss) Recognized in Income on Derivatives | | 2009 | | | 2008 | | | 2007 | |
| | | | | | | | | | | |
| Interest rate contracts | Interest expense | | $ | 3 | | | $ | (1,138 | ) | | $ | (568 | ) |
| | | | | | | | | | | | | | |
A deferred starting interest rate contract, which starts December 29, 2014 and continues through December 29, 2019, for the notional amount of $20.0 million of debt, is callable at the bank’s option at anytime during the contract. Accordingly, changes to the value of the swap contract do not qualify for hedge accounting treatment and are included as a component of interest expense in the consolidated statement of income. For the years ended December 31, 2009, 2008 and 2007 approximately $0.7 million gain, $1.1 million loss and $0.6 million loss, respectively, were recognized and included in interest expense.
In connection with the loan modifications completed in March 2009, the Company prepaid principal installments on all its credit facilities. The prepayment resulted in the notional amount of certain swap contracts being greater than the debt balance being hedged. For the year ended December 31, 2009 approximately $0.7 million loss was recognized as additional interest expense for the ineffective portion of derivatives caused by the prepayment of principal installments.
The Company does not obtain collateral or other security to support financial instruments subject to credit risk. The Company monitors the credit risk of our counterparties and enters into agreements only with established banking institutions. The financial stability of those institutions is subject to current and future global and national economic conditions, and governmental support.
Effective January 1, 2008, the Company adopted ASC Topic 820 - Fair Value Measurements and Disclosures, which defines fair value, establishes a framework for measuring fair value, and expands disclosures about fair value measurements. The fair value hierarchy for disclosure of fair value measurements is as follows:
Level 1 – Quoted prices in active markets for identical assets or liabilities
Level 2 – Quoted prices for similar assets and liabilities in active markets or inputs that are observable
Level 3 – Inputs that are unobservable (for example cash flow modeling inputs based on assumptions)
The following table summarizes assets and liabilities measured at fair value on a recurring basis at December 31, 2009:
| | | | Level 1 | | Level 2 | | Level 3 |
| Liabilities | | | | | | | |
| | Interest rate contracts | | | | $ 9,977 | | |
Our interest rate swap contracts are traded in the over-the-counter market. The fair value is based on the quoted market price for a similar liability or determined using inputs that use as their basis readily observable market data that are actively quoted and can be validated through external sources.
Note 13 — Equity Transactions
Class A and Class B Ordinary Shares
The Company has two classes of ordinary shares that are issued and outstanding: Class A ordinary shares, which are listed on the NASDAQ Global Select Market under the symbol "TBSI", and Class B ordinary shares. The Class A ordinary shares and Class B ordinary shares have identical rights to dividends, surplus and assets on liquidation; however, the holders of Class A ordinary shares are entitled to one vote for each Class A ordinary share on all matters submitted to a vote of holders of ordinary shares, while holders of Class B ordinary shares are entitled to one-half of a vote for each Class B ordinary share.
The holders of Class A ordinary shares can convert their Class A ordinary shares into Class B ordinary shares, and the holders of Class B ordinary shares can convert their Class B ordinary shares into Class A ordinary shares at any time. Further, the Class B ordinary shares will automatically convert into Class A ordinary shares upon transfer to any person other than another holder of Class B ordinary shares, in each case as long as the conversion will not cause the Company to become a controlled foreign corporation, as defined in the Internal Revenue Code of 1986, as amended ("Code"), or the Class A ordinary shares cease to be regularly traded on an established securities market for purposes of Section 883 of the Code.
In conjunction with the secondary public offering completed on May 28, 2008 shareholders of Class B shares elected to convert an aggregate of 1,014,000 Class B ordinary shares to Class A ordinary shares. On December 31, 2009, there were 17,533,996 Class A ordinary shares issued, of which 17,513,125 were outstanding, and 12,390,461 Class B ordinary shares issued and outstanding.
The Company's shareholders have approved the proposal that resulted in shareholders holding shares in TBS International plc, an Irish company, rather than TBS International Limited, a Bermuda company. The Supreme Court of Bermuda and the Irish High Court approved the transaction on January 7, 2010.
Warrants
At December 31, 2009, there were outstanding exercisable warrants to purchase 106,156 Class A ordinary shares and 205,747 Class B ordinary shares held by parties not affiliated with existing shareholders. The warrants are exercisable for a period of ten years following the date on which their exercise condition was met (February 8, 2005), at a price of $0.01 per share.
Treasury Stock
The Company's Equity Incentive Plan permits stock grant recipients to elect a net settlement. Under the terms of a net settlement, the Company retains a specified number of shares to cover the recipients’ estimated statutory minimum tax liability. The retained shares are held in the Company's treasury ("Treasury Stock"). In 2009, employees vested in a total of 65,500 Class A common shares. Certain employees elected to have the Company withhold and remit their respective payroll tax obligations. Accordingly, the Company retained and added to Treasury Stock 10,871 Class A common shares, valued at $95,204, to cover the recipient's estimated payroll tax liability. At December 31, 2009, there were 20,871 Treasury Stock shares held by the Company having a cost of $484,304.
Note 14 —Related Party Transactions
Commercial and Port Agency Services
Two companies affiliated with the Company’s major shareholders provide commercial and port agency service to us.
| (1) | TBS Commercial Group Ltd. ("TBS Commercial Group") - This Bermuda-based holding company owns 25 operating companies that operate commercial and port agencies in South America, Europe, and Asia. Its subsidiaries are (1) Solar Shipping Logistica e Tranportes Ltda. (TBS Do Brasil); (2) TBS-Tecnisea C. Ltda.; (3) Aquarius Shipping Colombia Ltda.; (4) TBS De Venezuela C.A.; (5) TBS Bolivia S.R.L.; (6) TBS Asia Ltd.; (7) TBS Shipping Services Europe GmbH; (8) Seganport S.A. (TBS Peru); (9) Brasinav Agenciamentos Ltda.; (10) Seganport Selva S.A.; (11) GMTBS Africa Line GmbH; (12) Nautica Groupe Ltd.; (13) Hermes Logistics Ltd.; (14) Interport Logistics Ltda.; (15) Almacenera Grau; (16) Yonkers Real Estate; (17) TBS Logistics Bolivia SRL; (18) TBS Logistics de Colombia S.A.; (19) TBS Project Logistics Limited; (20) TBS de Colombia S.A.; (21) Interproject Carriers Ltd.; (22) Cia Vapores Arco Iris; (23) Transportes Maritimas Y Fluviales SRL; (24) Bademar and (25) Groupa Sedei |
| (2) | Beacon Holdings Ltd. ("Beacon") - This Bermuda-based holding company owns four operating companies: (1) TBS Real Estate de Colombia S.A.; (2) Beacon Real Estate Holdings Ltd.; (3) Beacon Holdings America Latin Ltda. and (4) TBS Japan Ltd. Beacon is in the same business as TBS Commercial Group Ltd. |
Port agency fees and commission rates are based upon contractual agreements with us. Individuals who own a majority of the Company’s ordinary shares, some of whom are members of our Board of Directors, own these companies. As a result of their share ownership and board positions, and for so long as they collectively own a significant percentage of our issued and outstanding ordinary shares, they will be able to influence the Company and determine the outcome of any shareholder vote.
Port agency fees paid to TBS Commercial Group and Beacon for the years ended December 31, 2009, 2008, and 2007, were approximately $1.9 million, $2.1 million and $1.0 million, respectively. Effective October 1, 2007, the Board of Directors’ Compensation Committee approved an increase of approximately 33 1/3% in port agency fees for agency services provided by most subsidiaries of TBS Commercial Group and Beacon. A higher increase was approved for the Brazilian and Colombian agents to reflect the greater currency depreciation that occurred in those countries.
Commissions paid to TBS Commercial Group and Beacon for commercial agency services were approximately $5.9 million, $14.6 million, and $7.1 million for the years ended December 31, 2009, 2008, and 2007, respectively. Effective October 1, 2007, the Board of Directors’ Compensation Committee approved additional commissions of 1.25% of freight revenue for commercial agency services provided by subsidiaries of TBS Commercial Group.
At December 31, 2009 and 2008, the below amounts due to related commercial and port agents are included in accounts payable and accrued expenses and other liabilities (in thousands):
| | | | | | Accrued | | | | |
| | | Accounts | | | and Other | | | | |
| Period | | Payable | | | Liabilities | | | Total | |
| | | | | | | | | | |
| December 31, 2009 | | $ | 1,726 | | | $ | 2,970 | | | $ | 4,696 | |
| December 31, 2008 | | $ | 1,530 | | | $ | 1,293 | | | $ | 2,823 | |
Consulting Fees
TBS Commercial Group Ltd. made no payments for consulting fees for 2009 and 2008 and $60,000 in payments to Lawrence A. Blatte, who is an Executive Vice President, during 2007.
Commercial, Operational and Vessel Agency Services
Chartering Broker
Globe Maritime Limited ("Globe") occasionally acts as a broker for chartering and vessel sales and purchases. James W. Bayley who is a Company officer and member of the Board of Directors owns Globe. During 2009, 2008 and 2007, we paid Globe approximately $0.1 million $1.2 million and $0.2 million, respectively.
Lease
TBS Shipping Services maintains an office in Yonkers, New York that is leased from our chairman and chief executive officer, Joseph E. Royce. During 2009, 2008 and 2007, payments to Mr. Royce under this lease totaled $240,000 per year.
Note 15 — Stock Plans
2005 Equity Incentive Plan
The Company adopted an Equity Incentive Plan in 2005, which authorizes the grant of "non-qualified" shares to employees, independent directors. In 2009 the Equity Incentive Plan was amended to increase the maximum number of shares that can be granted under the plan, allow for the granting of both Class A ordinary shares and Class B ordinary shares and expand the definition of eligible persons under the plan to include affiliates and agency service companies. The maximum number of shares that can be granted under the plan increased to 5,000,000 shares, including no more than 1,000,000 Class B shares.
In January 2007, the Company awarded 6,000 restricted Class A shares to its independent directors that vested at the time of our Annual General Meeting on June 19, 2007. In August 2007, the Company awarded 15,000 share units to an officer (the Director – New Shipbuilding Projects). One-third of these units vested upon the launch of the first vessel in November 2008. The remaining units will vest in two equal installments upon the first and second anniversaries of the launch date. In November 2007, the Company awarded 73,500 restricted Class A shares to its employees. Approximately one-third of the shares vest annually starting on January 20, 2009.
On April 1, 2008, the Company awarded 1,500 restricted Class A shares to an employee. Approximately one-third of the shares vest annually starting on January 20, 2009. In 2009, the remaining 1,000 non-vested shares of this grant were forfeited. On April 8, 2008, the Company awarded 12,500 restricted Class A shares to its independent directors that vested at the time of the Company's Annual General Meeting on June 17, 2008. Lastly, in April 2008, the Company awarded 12,000 restricted Class A shares to its Executive Vice President and Chief Financial Officer. The shares vest in equal installments over four years commencing March 1, 2009.
On April 28, 2009, the Company awarded 12,500 restricted Class A shares to its independent directors that vested at the time of the Company's Annual General Meeting on June 22, 2009.
The Company recognized total stock-based compensation costs of $1.1 million (less forfeitures of $0.1 million) $2.4 million and $0.5 million in 2009, 2008, and 2007, respectively. These amounts are reflected in the Consolidated Statement of Income in general and administrative expenses. There is no material income tax benefit for stock-based compensation due to the Company’s tax structure.
At December 31, 2009, unrecognized stock-based compensation expense related to non-vested restricted stock and share unit awards totaled $.5 million. The cost of these non-vested awards will be recognized over a weighted-average period of 1.7 years.
Transactions under the Equity Incentive Plan are summarized as follows (aggregate values in thousands):
| | | Number of Share Units | | | Number of Restricted Shares | | | Weighted-Average Fair Value at Grant Date | | | Aggregate Value at Grant Date | |
| | | | | | | | | | | | | |
| Non-vested at December 31, 2006 | | | | | | 75,000 | | | | | | | |
| Granted, restricted shares | | | | | | 79,500 | | | $ | 34.01 | | | $ | 2,704 | |
| Granted, share units | | | 15,000 | | | | | | | $ | 31.19 | | | $ | 468 | |
| Forfeited | | | | | | | | | | | | | | | | |
| Vested | | | | | | | ( 31,000 | ) | | | | | | | | |
| Non-vested at December 31, 2007 | | | 15,000 | | | | 123,500 | | | | | | | | | |
| Granted, restricted shares | | | | | | | 26,000 | | | $ | 33.80 | | | $ | 879 | |
| Granted, share units | | | | | | | | | | | | | | | | |
| Forfeited | | | | | | | | | | | | | | | | |
| Vested | | | ( 5,000 | ) | | | ( 37,500 | ) | | | | | | | | |
| Non-vested at December 31, 2008 | | | 10,000 | | | | 112,000 | | | | | | | | | |
| Granted, restricted shares | | | | | | | 12,500 | | | $ | 7.64 | | | $ | 95 | |
| Granted, share units | | | | | | | | | | | | | | | | |
| Forfeited | | | | | | | ( 3,000 | ) | | | | | | | | |
| Vested | | | ( 5,000 | ) | | | ( 65,500 | ) | | | | | | | | |
| Non-vested at December 31, 2009 | | | 5,000 | | | | 56,000 | | | | | | | | | |
| | | | | | | | | | | | | | | | | |
Employee Share Purchase Plan
The Company adopted an Employee Share Purchase Plan in 2005, effective on the date of our initial public offering. Under the share purchase plan a maximum of 1,300,000 shares can be granted. All eligible employees, as defined in the plan, can subscribe to purchase shares of the Company’s stock at a purchase price of 95% of the fair market value of the common shares on the last day of the subscription period. At December 31, 2009, no shares were subscribed or issued under the plan.
Note 16 — Employee Benefit Plans
The Company maintains, through its subsidiaries TBS Shipping Services and Roymar, an employee savings plan under Section 401(k) of the Internal Revenue Code. The plan covers all office employees and allows participants to contribute to the plan a percentage of pre-tax compensation, but not in excess of the maximum allowed under the Internal Revenue Code. The Company does not make matching contributions.
The Company also has a discretionary cash bonus program under which employees may receive an annual cash bonus payment based on the Company’s annual operating performance. For the years ended December 31, 2009 and 2008, the Company did not pay bonuses. For the year ended December 31, 2007, the Company made cash bonus payments totaling $10.2 million.
Note 17 — Earnings Per Share
In accordance with ASC Topic 260 – Earnings per Share, the following table sets forth the computation of basic and diluted net (loss) income per share for 2009, 2008 and 2007:
| | | | Year Ended December 31, | |
| | | | 2009 | | | 2008 | | | 2007 | |
| | | | (In thousands, except number of shares and earnings per share amounts) | |
| Numerators: | | | | | | | | | |
| | Net (loss) income | | $ | (67,040 | ) | | $ | 191,777 | | | $ | 98,249 | |
| | Allocation of undistributed income to nonvested restriced common shares | | | | | | $ | (711 | ) | | $ | (433 | ) |
| | | | | | | | | | | | | | |
| | (Loss) earnings available to common shareholders-Basic and Diluted | | $ | (67,040 | ) | | $ | 191,066 | | | $ | 97,816 | |
| | | | | | | | | | | | | | |
| Denominators: | | | | | | | | | | | | |
| | Weighted average common shares outstanding-Basic and Diluted | | | 29,843,566 | | | | 29,263,292 | | | | 28,029,340 | |
| | | | | | | | | | | | | | |
| | | | | | | | | | | | | | |
| Net (loss) income per common share: | | | | | | | | | | | | |
| | Basic and Diluted | | $ | (2.25 | ) | | $ | 6.53 | | | $ | 3.49 | |
| | | | | | | | | | | | | | |
| | Anti-dilutive warrants not included above | | $ | 311,903 | | | | | | | | | |
| | | | | | | | | | | | | | |
As outlined in sections of ASC Topic 260 – Earnings per Share, nonvested share-based payment awards that contain non-forfeitable rights to dividends are participating securities that should be included in the two-class method of computing earnings per share. The two-class method of computing earnings per share is an earnings allocation formula that determines earnings per share for ordinary shares and any participating securities according to dividends declared (whether paid or unpaid) and participation rights in undistributed earnings. The Company’s nonvested stock, consisting of time-vested restricted shares are considered participating securities since the share-based awards contain a non-forfeitable right to dividends regardless of whether the awards ultimately vest. We have adopted the applicable provisions of ASC Topic 260 and computed earnings per ordinary share using the two-class method for all periods presented. The adoption of the provisions did not have a material impact on the Company’s previously issued consolidated financial statements; however, for comparability purposes, we recalculated and restated our previously reported earnings per share. Basic and diluted earnings per ordinary share for the year ended December 31, 2008 decreased $0.02 and $0.01, respectively, and basic and diluted earnings per ordinary share for the year ended December 31, 2007 also decreased $0.02 and $0.01, respectively, from the amounts previously disclosed in our prior filings.
At December 31, 2009 and 2008, there were outstanding exercisable warrants to purchase 106,156 Class A ordinary shares and 205,747 Class B ordinary shares. At December 31, 2007, there were outstanding exercisable warrants to purchase 98,311 Class A ordinary shares and 190,542 Class B ordinary shares. All warrants are held by parties not affiliated with existing shareholders. The warrants have been excluded from the computation of basic and diluted earnings per share because they are anti-dilutive. However, the warrants have been treated as outstanding for purposes of basic earnings per share for the years ended December 31, 2008 and 2007 because they are issuable for nominal consideration upon exercise of the warrants.
Note 18 — Commitments and Contingencies
Charters-in of Vessels
At December 31, 2009, we chartered-in two vessels under long-term operating leases and no vessels under short-term operating leases. Charters or leases that have initial terms of more than one year at the inception of the charter and are noncancelable are treated as long-term leases. Total lease expense, consisting of both short and long term charters-in, classified as operating leases, is as follows (in thousands):
| | | Year ended December 31, | |
| | | 2009 | | | 2008 | | | 2007 | |
| | | | | | | | | | |
| Charters-in under short term operating leases | | $ | 3,597 | | | $ | 11,551 | | | $ | 22,905 | |
| Charters-in under long term operating leases | | | 6,538 | | | | 6,363 | | | | 6,073 | |
| Total lease expense | | $ | 10,135 | | | $ | 17,914 | | | $ | 28,978 | |
| | | | | | | | | | | | | |
The Company charters-in two vessels (Laguna Belle and Seminole Princess) under long-term noncancelable operating leases (bareboat charters) that were part of a sale-leaseback transaction. Both bareboat charters expire on January 30, 2014. Each bareboat charter requires charter hire payments of $10,500 per day for the first two years of the charter, $10,000 per day during the third year of the charter and $7,350 per day during the fourth through seventh years of the charter. The charter agreements allow for the purchase of the respective vessel at the end of the fifth, sixth or seventh year of the charter period at a vessel price of $11.1 million, $9.15 million, or $6.75 million, respectively and for the purchase options to be exercised at any other date during the option period at a pro-rata price. The leases under the sale-leaseback transactions were classified as operating leases. Deposits of $2.75 million, to be held by the lessor for each charter during the charter period, were required at the inception of the lease. The deposits are to be returned, without interest, at the expiration of the charter period, unless applied earlier toward the amounts due upon exercise of the purchase option. Deferred leasing costs of $1.2 million are being amortized over the terms of the leases.
As mentioned above, the bareboat charters contain predetermined fixed decreases of the charter hire payments due under the charters. The Company recognizes the related rental expense on a straight-line basis over the term of the charters and records the difference between the amounts charged to operations and amounts paid as deferred rent expense. At December 31, 2009, deferred rent expense was $3.5 million. In December 2009, the bareboat charters were amended increasing the daily charter hire payment required to be made during the fourth through seventh years. Each bareboat charter, which originally required payments of $7,350 per day during the fourth through seventh years, was amended to increase the daily charter hire payment to $8,041 per day during the fourth year, $7,909 per day during the fifth year, $7,827 per day during the sixth year and $7,748 per day during the seventh year. The amendment did not change the lease classification as an operating lease.
Other Leases
The Company leases four properties, two of which are used by TBSI’s service company subsidiaries Roymar and TBS Shipping Services and its subsidiaries for the administration of their operations, the third is office space leased by TBS Energy Logistics and the fourth is a warehouse leased by TBS Energy Logistics.
TBS Shipping Services leases its main office space from our chairman and chief executive officer, Joseph E. Royce. The lease expires on December 31, 2010, subject to five one-year renewal options. The lease provides for monthly rent of $20,000, plus operating expenses including real estate taxes.
Roymar renewed the lease for its main offices in November 2009 for one year through November 30, 2010, under the first of two one-year renewal options at a monthly rent of approxiamately $27,000. The lease requires Roymar to pay additional rent for real estate tax escalations.
At December 31, 2009, we leased property through our subsidiary TBS Energy Logistics. The lease term is for 5 years commencing October 1, 2009 through September 30, 2014. There is a monthly rent of $8,054 for the first year, October 1, 2009 through September 30, 2010. The monthly rent increases to $8,255, $8,463, $8,677 and $8,898, for the second through fifth years.
TBS Energy Logistics, LP also leases a warehouse for 38 months commencing May 1, 2009 through June 30, 2012 at a monthly rent of $22,000 for the year commencing July 1, 2009 through June 30, 2010. The monthly rent increases to $22,400 and $22,800, in each of the subsequent years ending June 2011 and June 2012, respectively.
As of December 31, 2009, future minimum commitments under operating leases with initial or remaining lease terms exceeding one-year are as follows (in thousands):
| | | | | | Office | | | | |
| At December 31, 2009 | | Vessel Hire | | | Premises | | | Total | |
| | | | | | | | | | |
| 2010 | | | 6,007 | | | | 902 | | | | 6,909 | |
| 2011 | | | 5,781 | | | | 371 | | | | 6,152 | |
| 2012 | | | 5,734 | | | | 239 | | | | 5,973 | |
| 2013 | | | 5,660 | | | | 105 | | | | 5,765 | |
| Thereafter | | | 465 | | | | 80 | | | | 545 | |
| | | $ | 23,647 | | | $ | 1,697 | | | $ | 25,344 | |
| | | | | | | | | | | | | |
Purchase Obligations –Vessels
Purchase Obligations –New Vessel Buildings
At December 31, 2009, the Company had purchase obligations totaling $67.1 million in connection with its new vessel building program, including obligations under the contract for the supervision and inspection of vessels under construction. The obligations will become payable as the shipyard meets several milestones through September 2010. As of December 31, 2009, $66.8 million of the purchase obligation is scheduled to be paid as follows: $51.2 million in 2010 and $15.6 million in 2011. The timing of actual payments will vary based upon when the milestones are met.
Litigation
The Company is periodically a defendant in cases involving personal injury and other matters that arise in the normal course of business. While any pending or threatened litigation has an element of uncertainty, the Company believes that the outcome of these lawsuits or claims, individually or combined, will not materially adversely affect the consolidated financial position, results of operations or cash flows of the Company.
Note 19 — Business Segment
The Company is managed as a single business unit that provides worldwide ocean transportation of dry cargo to its customers through the use of owned and chartered vessels. The vessels are operated as one fleet and when making resource allocation decisions, our chief operating decision maker evaluates voyage profitability data, which considers vessel type and route economics, but gives no weight to the financial impact of the resource allocation decision on an individual vessel basis. The Company's objective in making resource allocation decisions is to maximize its consolidated financial results, not the individual results of the respective vessels or routes.
The Company transports cargo throughout the world, including the U.S. The amount of voyage revenue generated in countries other than the U.S. was $219.8 million, $485.2 million and $241.7 million for the years ended December 31, 2009, 2008 and 2007 respectively.
Revenue was generated in the following principal foreign geographic areas:
| | | Year Ended December 31, | |
| Country | | 2009 | | | 2008 | | | 2007 | |
| | | | | | | | | | |
| Brazil | | $ | 53,192 | | | $ | 127,360 | | | $ | 72,053 | |
| Japan | | | 35,914 | | | | 79,812 | | | | 40,592 | |
| United Arab Emirates | | | 32,387 | | | | 69,714 | | | | 24,406 | |
| Peru | | | 26,870 | | | | 48,707 | | | | 31,728 | |
| Chile | | | 16,564 | | | | 46,923 | | | | 11,219 | |
| China | | | 12,943 | | | | 42,319 | | | | 21,624 | |
| Korea | | | 6,744 | | | | 15,699 | | | | 5,775 | |
| Venezuela | | | 5,063 | | | | 9,903 | | | | 4,579 | |
| Argentina | | | 8,021 | | | | 8,312 | | | | 15,059 | |
| Others | | | 22,144 | | | | 36,457 | | | | 14,690 | |
| | | $ | 219,842 | | | $ | 485,206 | | | $ | 241,725 | |
| | | | | | | | | | | | | |
Revenue is attributed to these countries based on the location where the cargo is loaded. The difference between total voyage revenue and total voyage revenue by country is revenue from the United States, which is $28.1 million, $33.7 million, and $19.8 million for 2009, 2008, 2007, respectively. Time charter revenue by country cannot be allocated because the Company does not control the itinerary of the vessel.
One customer accounted for 11.7% of charter hire receivables at December 31, 2009 and no customer accounted for more than 10.0% of charter hire receivables at December 31, 2008. One customer accounted for 13.6% and 13.0% of voyage and time charter revenue for the year ended December 31, 2009 and December 31, 2008 respectively.
Note 20 — Subsequent Events
On January 29, 2010, the Company entered into a joing ventured with Log. Star Navegacao S.A and invested $3.4 million for a 70% interest in TBS Do Sul Ltd. . The joint venture will bareboat and operate three vessels in Brazil.
On January 7, 2010 the Supreme Court of Bermuda and the Irish High Court approved the transaction that resulted in shareholders holding shares in TBS International plc, an Irish company, rather than TBS International Limited, a Bermuda company.
Note 21 — Selected Quarterly Financial Information (unaudited)
The following information is presented as supplementary financial information for 2009 and 2008 (in thousands, except per share information):
| | | | Year Ended December 31, 2009 | |
| | | | First Quarter | | | Second Quarter | | | Third Quarter | | | Fourth Quarter | |
| | | | | | | | | | | | | | |
| Revenue | | $ | 71,158 | | | $ | 72,236 | | | $ | 74,332 | | | $ | 84,790 | |
| | | | | | | | | | | | | | | | | | |
| (Loss) from operations | | $ | (17,474 | ) | | $ | (12,722 | ) | | $ | (13,262 | ) | | $ | (6,484 | ) |
| | | | | | | | | | | | | | | | | | |
| Net (loss) (a) | | $ | (21,288 | ) | | $ | (16,913 | ) | | $ | (18,139 | ) | | $ | (10,700 | ) |
| | | | | | | | | | | | | | | | | | |
| Net (loss) per share:(a) | | | | | | | | | | | | | | | | |
| | Basic and Diluted | | $ | (0.71 | ) | | $ | (0.57 | ) | | $ | (0.61 | ) | | $ | (0.36 | ) |
| | | | Year Ended December 31, 2008 | |
| | | | First Quarter | | | Second Quarter | | | Third Quarter | | | Fourth Quarter | |
| | | | | | | | | | | | | | |
| Revenue | | $ | 131,576 | | | $ | 156,947 | | | $ | 183,322 | | | $ | 139,788 | |
| | | | | | | | | | | | | | | | | | |
| Income from operations | | $ | 50,464 | | | $ | 56,699 | | | $ | 63,854 | | | $ | 38,258 | |
| | | | | | | | | | | | | | | | | | |
| Net income (a) | | $ | 45,378 | | | $ | 52,641 | | | $ | 59,143 | | | $ | 34,615 | |
| | | | | | | | | | | | | | | | | | |
| Net income per share:(a) | | | | | | | | | | | | | | | | |
| | Basic and Diluted | | $ | 1.61 | | | $ | 1.82 | | | $ | 1.96 | | | $ | 1.15 | |
| | | | | | | | | | | | | | | | | | |
| (a) | The quarterly computations are independent of the annual computation. The computation of quarterly and annual earnings per share includes a weighting of the then average number of shares outstanding that will vary for each period. Accordingly, the sum of the four quarters' net income per share will not equal the annual earnings per share. See "Note 17 -- Earnings per share." |
TBS International plc, and Subsidiaries
Pursuant to the requirements of Section 13 or 15(d) of the Securities Exchange Act of 1934, the Registrant has duly caused this Annual Report on Form 10-K to be signed on its behalf by the undersigned, thereunto duly authorized, on the 16th day of March 2010.
| | | TBS INTERNATIONAL PLC |
| | | (Registrant) |
| | | |
| | | |
| | | /s/ Joseph E. Royce |
| | | Joseph E. Royce President, Chief Executive Officer, Chairman and Director |
| | | |
| | | /s/ Ferdinand V. Lepere |
| | | Ferdinand V. Lepere Executive Vice President, Chief Financial Officer |
| | | |
| | | /s/ Frank J. Pittella |
| | | Frank J. Pittella Chief Accounting Officer |
Pursuant to the requirements of the Securities Exchange Act of 1934, this Annual Report on Form 10-K has been signed on the 16th day of March 2010 by the following persons in the capacities indicated:
| /s/ Joseph E. Royce | | /s/ Ferdinand V. Lepere |
Joseph E. Royce, President, Chief Executive Officer, Chairman and Director | | Ferdinand V. Lepere, Executive Vice President, Chief Financial Officer |
| | | |
| /s/ Frank J. Pittella | | /s/ Gregg L. McNelis McNelis |
| Frank J. Pittella, Chief Accounting Officer | | Gregg L. McNelis, Senior Executive Vice President, |
| | | Chief Operating Officer and Director |
| | | |
| /s/ James W. Bayley | | /s/ John P. Cahill |
| James W. Bayley, Vice President and Director | | John P. Cahill, Director |
| | | |
| /s/ Randee E. Day | | /s/ William P. Harrington |
| Randee E. Day, Director | | William P. Harrington, Director |
| | | |
| /s/ Alexander Smigelski | | /s/ Peter S. Shaerf |
| Alexander Smigelski, Director | | Peter S. Shaerf, Director |
| | | |