As filed with the Securities and Exchange Commission on June 2, 2016
UNITED STATES
SECURITIES AND EXCHANGE COMMISSION
Washington, D.C. 20549
FORM N-CSR
CERTIFIED SHAREHOLDER REPORT OF REGISTERED
MANAGEMENT INVESTMENT COMPANIES
Investment Company Act file number 811-22378
DoubleLine Funds Trust
(Exact name of registrant as specified in charter)
333 South Grand Avenue, Suite 1800
Los Angeles, CA 90071
(Address of principal executive offices) (Zip code)
Ronald R. Redell
President
DoubleLine Funds Trust
333 South Grand Avenue, Suite 1800
Los Angeles, CA 90071
(Name and address of agent for service)
(213) 633-8200
Registrant’s telephone number, including area code
Date of fiscal year end: March 31
Date of reporting period: March 31, 2016
Item 1. Reports to Stockholders.

Annual Report
March 31, 2016

DoubleLine Total Return Bond Fund
DBLTX (I-share)
DLTNX (N-share)
DoubleLine Core Fixed Income Fund
DBLFX (I-share)
DLFNX (N-share)
DoubleLine Emerging Markets Fixed Income Fund
DBLEX (I-share)
DLENX (N-share)
DoubleLine Multi-Asset Growth Fund
DMLIX (I-share)
DMLAX (A-share)
DoubleLine Low Duration Bond Fund
DBLSX (I-share)
DLSNX (N-share)
DoubleLine Floating Rate Fund
DBFRX (I-share)
DLFRX (N-share)
DoubleLine Shiller Enhanced CAPE®
DSEEX (I-share)
DSENX (N-share)
DoubleLine Flexible Income Fund
DFLEX (I-share)
DLINX (N-share)
DoubleLine Low Duration Emerging Markets Fixed Income Fund
DBLLX (I-share)
DELNX (N-share)
DoubleLine Long Duration
Total Return Bond Fund
DBLDX (I-share)
DLLDX (N-share)
DoubleLine Strategic Commodity Fund
DBCMX (I-share)
DLCMX (N-share)
DoubleLine Global Bond Fund
DBLGX (I-share)
DLGBX (N-share)
| | |
DoubleLine Capital LP DoubleLine Commodity LP | | 333 S. Grand Avenue 18th Floor Los Angeles, California 90071 doubleline.com |

| | | | | | |
| | Annual Report | | March 31, 2016 | | 3 |
| | |
| President’s Letter | | (Unaudited) March 31, 2016 |
Dear DoubleLine Funds Shareholder,
On behalf of the DoubleLine Funds, I am pleased to deliver the Annual Report for the 12-month period ended March 31, 2016. On the following pages you will find specific information regarding each Fund’s operations and holdings. In addition, we discuss each Fund’s investment performance and the main drivers of that performance during the reporting period.
If you have any questions regarding the DoubleLine Funds please don’t hesitate to call us at 877-DLine11 (877-354-6311), or visit our website www.doublelinefunds.com to hear our investment management team offer deeper insights and analysis on relevant capital market activity impacting investors today. We value the trust that you have placed with us, and we will continue to strive to offer thoughtful investment solutions to our shareholders.
Sincerely,

Ronald R. Redell, CFA
President
DoubleLine Funds Trust
May 1, 2016
| | |
| Financial Markets Highlights | | (Unaudited) March 31, 2016 |
| · | | Agency Mortgage-Backed Securities (Agency MBS) |
For the 12-month period ended March 31, 2016, the Barclays U.S. MBS Index returned 2.43% with its duration shortening from 3.54 to 3.06 as U.S. Treasury 10-year yields declined by about 0.15%. Aggregate prepayment speeds have declined year-over-year (YoY) but have remained within a narrow range during the past 30-month period ended March 31, 2016. Total gross issuance of Agency MBS has largely followed seasonal trends in the housing market with heightened volumes seen in the summer/spring months compared to the fall/winter months. Issuance on a gross basis has totaled approximately $1.3 trillion over the past reporting period based on the Bloomberg Agency MBS Pool Issuance numbers. Overall housing turnover has steadily increased over this time as a function of higher purchasing activity, as measured by the Mortgage Bankers Association Purchase Index, seasonally-adjusted. Overall refinancing activity has also picked up, as measured by the Mortgage Bankers Association Refinance Index, as 30-year mortgage rates are at their local lows. Current coupon spreads against U.S. 10-year yields have widened especially towards the end of 2015 as market participants became more concerned over the timing of when the Federal Reserve (Fed) would stop the reinvestment of paydowns of their invested MBS; however, recent guidance by the Fed has reestablished the market’s expectation that reinvestments are likely to continue for the rest of this year given the Fed’s more dovish tone in regard to ongoing policies.
| · | | Non-Agency Mortgage-Backed Securities (Non-Agency MBS) |
Non-Agency MBS have experienced relatively low price volatility over the last few years, but that changed in the fall of 2015. As macroeconomic risk increased globally in the fall, all risk asset classes dropped in price. However, given this context, non-Agency MBS experienced less volatility than other structured products. By the end of the first quarter of 2016, non-Agency MBS prices have returned to the levels seen at the beginning of 2016. Given current trends, we believe non-Agency MBS have the potential to appreciate further. Approximately $96 billion of non-Agency MBS have been put out on bid lists and about $70 billion has traded. Apart from the “risk off” environment of August and September 2015, and January and February 2016, respectively, trading volume has been robust. Over the reporting period, prepayments and defaults have marginally slowed down and loss severities have remained flat. Mortgage interest rates did not change substantially during the reporting period, which has kept prepayments contained. In addition, positive house price appreciation has helped improve defaults and severities.
| · | | Commercial Mortgage-Backed Securities (CMBS) |
Over the 12-month period ended March 31, 2016, CMBS spreads widened before rallying from multi-year wide levels. During the period, the Barclays U.S. CMBS Index returned 2.80%, outperforming the broader Barclays U.S. Aggregate Bond Index by 0.84%. For the period, 10-year AAA last cash flows (LCFs) were trading at 1.29% over swaps, representing a 0.42% widening YoY, while BBB- bonds traded at 6.00% over swaps, a 2.50% widening YoY. On the new issue front, private label CMBS issuance was down 10.26%, with $83.7 billion in new issuance over 107 deals during the 12-month reporting period compared to $93.3 billion in 108 deals from April 2014 through March 2015. Delinquency rates across all asset classes (Industrial, Hospitality, Multifamily, Office and Retail properties) improved during the period; the overall delinquency rate dropped from 5.58% as of March 31, 2015 to 4.22% as of March 31, 2016. As a comparative reference point, the all-time high delinquency rate was 10.34% in July 2012.
| · | | Emerging Markets (EM) Debt |
Over the 12-month period ended March 31, 2016, U.S. dollar (USD)-denominated EM fixed income sovereign and corporate bonds indices, represented by the JP Morgan Emerging Markets Bond Index Global Diversified (EMBI) and the JP Morgan Corporate Emerging Markets Bond Index Broad Diversified (CEMBI), respectively, posted low to mid single digit returns. The EM return profile was a story of two distinct periods. Both EM sovereign and corporate spreads widened significantly over 2015 to mid-February 2016, on the back of slowing global growth, China policy uncertainty and falling commodity prices. Mid-February to March 31, 2016 saw a return of risk appetite, as developed market central banks, including the European Central Bank (ECB), Bank of Japan (BoJ), and the People’s Bank of China (PBoC) pushed through aggressive easing monetary policy, and the Fed became more dovish, lowering the expected pace of the rate hiking cycle. Risk assets, including EM fixed income benefited from increased monetary policy liquidity and improving commodity prices, and EM credit spreads tightened aggressively, retracing half of the widening seen over 2015 and early 2016.
| · | | Investment Grade (IG) Credit |
For the 12-month period ended March 31, 2016, investment grade credit recorded a total return of 0.93%. A majority of the performance can be attributed to the recent rally in credit during the first quarter of 2016. Over the reporting period, spreads widened
| | | | | | |
| | Annual Report | | March 31, 2016 | | 5 |
| | |
| Financial Markets Highlights (Cont.) | | (Unaudited) March 31, 2016 |
by 0.30%, from 1.24% to 1.54%. A closer look at performance shows that the long-end (10-year plus) of the Index was the biggest underperformer posting a return of -1.08%. By credit quality, higher quality AA and A-rated credits were the strongest performers, posting returns of 2.53% and 2.21%, respectively. The Metals & Mining and Energy sectors were the worst performing sectors over the reporting period.
For the 12-month period ended March 31, 2016, the S&P/LSTA Leveraged Loan Index returned -1.25%. Loans with a higher facility rating were the outperformers over this time period with BB-rated loans returning 1.66%. Meanwhile, lower CCC-rated loans were down 10.82%. First lien loans returned -0.90%, outperforming the second lien loan return of -8.47%. The top performing industries included Food Service (+6.02%) and Cosmetics – Toiletries (+4.62%). Underperforming industries were focused around the commodity sector. The worst performing industries were Oil and Gas (-32.86%), Forest Products (-31.73%) and Nonferrous Metals – Minerals (-28.97%). As of the end of the period, the default rate rose to 1.75% on a par-weighted basis and 2.03% on an issuer-weighted basis.
For the 12-month period ended March 31, 2016, the Citi High-Yield Cash-Pay Capped Index declined 4.58% as weak commodity prices and uncertainty surrounding the Fed’s decision to hike rates persisted. Credit quality was a major differentiator as higher-rated bonds outperformed lower-rated ones. Specifically, BB-rated issues returned -2.34% while B-rated issues were down 5.58% and CCC-rated issues declined 11.25%. Notable outperformers by industry were Gaming (+6.33%), Broadband (+5.76%), and Restaurants (+5.49%). The underperforming industries were again mostly commodity related. Underperformance by sector was led by Secondary Oil & Gas Producers (-37.22%), Metals/Mining (-19.78%) and Paper & Forest Products (-17.15%). The 12-month par-weighted High Yield default rate as of March 31, 2016 was 3.22% while the more stable issuer-weighted default rate rose to a 5-year high of 3.93%.
| · | | Collateralized Loan Obligations (CLOs) |
For the 12-month period ended March 31, 2016, the CLO market experienced some of the strongest and weakest issuance for a total of $74.22 billion across 148 deals. April and June were the strongest months with $10.18 billion and $12.74 billion, respectively, in issuance. Issuance slowed down during the summer due to seasonality with an average monthly issuance of $6.31 billion. The fourth quarter of 2015 issued slightly more with $6.53 billion on average per month. As market volatility increased around the Fed’s announcement of the first rate raise, CLO prices began their downward movement. BB-rated securities felt the brunt of the downward pressure on prices. The first quarter of 2016 was the weakest quarter of issuance with only $7.10 billion total across all three months. March was a positive month, but spreads ended the month wider than where they were 12-months prior.
Global equities, as measured by the Morgan Stanley Capital International (MSCI) All Country World Index (MSCI ACWI), declined during the 12-month period ended March 31, 2016 to -3.79%. U.S. equities performed fairly better with the S&P 500® Index up 1.78% during the period. European equities underperformed the broader market with the Euro Stoxx 50 Index down -15.94%. Asian equity markets sold off significantly with Japanese equities, as measured by the Nikkei 225 Index -11.17%, and Chinese equities, as measured by the Shanghai Composite Index down 18.57%. EM equities retreated with over the period as measured by the MSCI Emerging Markets Index (MSCI EM) -11.71%.
In the 12-month period ended March 31, 2016, the commodity market declined by 28.68% as measured by the S&P Goldman Sachs Commodity Index (GSCI). Four out of the five sectors in the GSCI lost value over this period. The worst performing sectors were Energy (-39.88%) and Industrial Metals (-19.06%) as a glut of supply saturated a market already suffering from weak global economic activity. The Agriculture (-8.95%) and Livestock (-12.34%) sectors also finished the period lower. Precious Metals (+2.57%) was the only sector with gains as Gold rallied 3.93% due to unpredictable central bank policies and global financial uncertainty.
| | |
| | | (Unaudited) March 31, 2016 |
| · | | U.S. Large Cap Equities |
For the 12-month period ended March 31, 2016, the large capitalization U.S. equity market was largely flat, with the S&P 500® Index down slightly in price and up 1.78% including dividends. The value portion of the large capitalization market delivered worse returns, with the Russell 1000® Value Index losing 1.6%. Examining the S&P 500® Index at a sector level reveals a very defensive market: the three best returning sectors were sectors that tend to be defensive and yield-oriented. The Telecommunications sector delivered the best returns, rising over 19%. Similarly, Utilities and Consumer Staples returned 16% and 12%, respectively. Energy was, by a wide margin, the worst performing sector losing over 16% of its value in the face of oil prices falling by approximately a third and North American drilling activity collapsing. The Materials, Healthcare and Financials sectors all delivered negative returns in the 12-month period.
The Treasury market was broadly stable for the 12-month period ended March 31, 2016. The 10-year note yield ended the period at 1.78%, just 0.15% lower from the prior year’s 1.93% yield. The market was pressured by the Fed; the Federal Open Market Committee (FOMC) talked of a sustained rate “renormalization” process which would include multiple rate hikes each year for several years. The market was stubbornly skeptical during the period, discounting the aggressive Fed guidance and focusing on lackluster global growth, low inflation, falling commodity prices and economic stress overseas. The market remained steady when the Fed hiked rates for the first time in over eight years at its December 2015 meeting. Rates then fell in January and February 2016 in the face of struggling EM economies and a dovish turn by the Fed. As of the end of the period, many market participants expected less than one full Fed hike through the remainder of 2016.
Municipals were steady through the first half of the 12-month period ended March 31, 2016. Municipals strengthened both in absolute yield and relative to Treasuries through the fourth quarter of 2015 as investor demand remained robust while supply fell short of expectations. Issuance picked up in early 2016 as yields reached multi-year lows, reversing most of the previous quarter’s gains. Municipal yields and Municipal/Treasury yield ratios ended the period modestly lower than a year earlier.
| | | | | | |
| | Annual Report | | March 31, 2016 | | 7 |
| | |
| Management’s Discussion of Fund Performance | | (Unaudited) March 31, 2016 |
DoubleLine Total Return Bond Fund
The DoubleLine Total Return Bond Fund outperformed its benchmark, the Barclays U.S. Aggregate Bond Index return of 1.96%, for the 12-month period ended March 31, 2016. Much of the outperformance was driven by longer duration Agency MBS, which benefited from the rally in the U.S. Treasury sector as 10-year yields fell by about 0.15%. Agency MBS broadly performed well with fixed rate CMOs and passthroughs contributing the most to total return, with a combination of strong price appreciation and high coupon returns. Other Agency Residential MBS (RMBS) sectors with smaller allocations, such as inverse floating rate and inverse interest-only securities also performed well from a total return standpoint as they benefited from LIBOR remaining relatively low. Although non-Agency MBS contributed positively to performance, the sector faced some declines in valuations across the credit quality spectrum due to broad concerns in the credit markets related to a weak commodities market and slowing global growth. Not surprisingly, the higher credit quality, prime sector performed the best with only slight declines in valuations and strong interest carry. Other credit sectors such as CMBS and CLOs suffered from widening spreads during this period and detracted from the Fund’s performance.
| | | | | | |
| Period Ended 3-31-16 | | | | 1-Year | |
I-Share | | | | | 2.45% | |
N-Share | | | | | 2.20% | |
Barclays U.S. Aggregate Bond Index | | | | | 1.96% | |
For additional performance information, please refer to the “Standardized Performance Summary.”
DoubleLine Core Fixed Income Fund
For the 12-month period ended March 31, 2016, the DoubleLine Core Fixed Income Fund underperformed the Barclays U.S. Aggregate Bond Index return of 1.96% as the U.S. yield curve flattened over this year with longer-term rates declining and shorter-term rates increasing. As a result, longer duration asset classes performed well while more credit-sensitive sector returns were poor – worsened by increased market volatility as oil prices declined. Not surprisingly, High Yield Debt, Bank Loans and EM Fixed Income were the most affected by the drop in oil prices, which led these holdings to perform the worst for the period. CLOs also underperformed as investors worried about existing energy concentrations in those portfolios causing the sector to generally trade poorly. CMBS, which also underperformed, had yields that started to widen during the middle of last year due to low investor demand. Conversely, RMBS and Municipal debt contributed strong returns over the 12-month period. While RMBS prices mildly declined, the bonds benefited from high interest income. Investment grade corporate debt and other government holdings held in the Fund performed in line with the Fund’s Index.
| | | | | | |
| Period Ended 3-31-16 | | | | 1-Year | |
I-Share | | | | | 1.31% | |
N-Share | | | | | 0.97% | |
Barclays U.S. Aggregate Bond Index | | | | | 1.96% | |
For additional performance information, please refer to the “Standardized Performance Summary.”
DoubleLine Emerging Markets Fixed Income Fund
Over the 12-month period ended March 31, 2016, the DoubleLine Emerging Markets Fixed Income Fund underperformed the JP Morgan Emerging Markets Bond Index (EMBI) Global Diversified. The Fund’s underperformance was largely driven by the Fund avoiding exposure to high beta, idiosyncratic credits. The sovereign credits avoided by the Fund include Russia, Ukraine, Kazakhstan, Venezuela, and Argentina. All five were among the top performing countries within the EMBI over the 12-month period. In general, they rallied on the back of stabilization in geo-political risks or domestic political or election outcomes that benefited the credit profile of each country. The Fund’s underperformance was also due to an overweight allocation, relative to the EMBI, to credits in Latin America. Energy, transportation, and media related credits in Colombia and Mexico held in the Fund saw negative returns as a result of lower commodity prices, slowing growth
| | |
| | | (Unaudited) March 31, 2016 |
and weak foreign currencies in the region. Additionally, one of the largest independent oil and gas producers in Colombia defaulted, further impacting performance. Performance also was hurt by exposure to commodity-related producers in India and Indonesia.
| | | | | | |
| Period Ended 3-31-16 | | | | 1-Year | |
I-Share | | | | | -0.48% | |
N-Share | | | | | -0.73% | |
JP Morgan Emerging Markets Bond Index Global Diversified | | | | | 4.19% | |
For additional performance information, please refer to the “Standardized Performance Summary.”
DoubleLine Multi-Asset Growth Fund
The DoubleLine Multi-Asset Growth Fund outperformed the Blended Benchmark for the 12-month period ended March 31, 2016; the Blended Benchmark returned -4.34% for the period. The equity sleeve detracted from performance during the 12-month period with global equities as measured by the MSCI ACWI down 3.79%. Short positions in EM equities contributed to performance with MSCI EM down 11.71% during the period. The fixed income sleeve underperformed the Barclays U.S. Aggregate Bond Index return of 1.96%. Positions in Agency and non-Agency MBS contributed to performance while credit detracted from performance. The real assets sleeve contributed to performance significantly outperforming the S&P/Goldman Sachs Commodity Index which was down -28.68% during the period. The positive performance of the Fund’s real asset sleeve was driven in large part by our systematic long/short commodity strategy.
| | | | | | |
| Period Ended 3-31-16 | | | | 1-Year | |
I-Share | | | | | -4.29% | |
A-Share | | | | | | |
Without Load | | | | | -4.42% | |
With Load | | | | | -8.49% | |
S&P 500® Index | | | | | 1.78% | |
Blended Benchmark* | | | | | -4.34% | |
| * | Blended Benchmark: 60% Barclays U.S. Aggregate Bond Index/25% Morgan Stanley Capital International All Country World Index/15% S&P Goldman Sachs Commodity Index (GSCI) Total Return |
For additional performance information, please refer to the “Standardized Performance Summary.”
DoubleLine Low Duration Bond Fund
For the 12-month period ended March 31, 2016, the DoubleLine Low Duration Bond Fund’s Class I-Shares outperformed the BofA/Merrill Lynch 1-3 Year U.S. Treasury Index’s return of 0.92% as the U.S. yield curve flattened over the year with longer-term rates declining and shorter-term rates increasing. More credit-sensitive sectors’ returns were poor given the increased market volatility as oil declined. Within the Fund, RMBS contributed strong returns over the period. While prices mildly declined in RMBS, the bonds benefited from high interest income. EM fixed income, while positive for the period, lagged behind its respective index as the EM sector’s index holdings had a relatively shorter duration in the rising short-term rate environment. Other sectors such as IG corporate bonds and CLOs, performed in line with their respective indices and contributed positive returns.
| | | | | | |
| Period Ended 3-31-16 | | | | 1-Year | |
I-Share | | | | | 1.00% | |
N-Share | | | | | 0.85% | |
BofA/Merrill Lynch 1-3 Year U.S. Treasury Index | | | | | 0.92% | |
For additional performance information, please refer to the “Standardized Performance Summary.”
DoubleLine Floating Rate Fund
The DoubleLine Floating Rate Fund outperformed the S&P/LSTA Leveraged Loan Index during the 12-month period ended March 31, 2016. The outperformance was partially due to a reduction in risk across different portfolio characteristics such as asset class selection, credit
| | | | | | |
| | Annual Report | | March 31, 2016 | | 9 |
| | |
| Management’s Discussion of Fund Performance (Cont.) | | (Unaudited) March 31, 2016 |
quality, and industry allocation as deterioration in technical and fundamental factors began to accelerate in the overall loan market. As the Fund’s Index began to exhibit weakness and negative returns after the first few months of the 12-month period, the Fund opportunistically decreased its out-of-Index exposure to high-yield bonds from approximately 5.0% down to 0% by October 2015. The Fund also decreased its second-lien loan exposure from approximately 3.5% to approximately 0.5% by the end of the 12-month period (the Fund’s Index held about 5% second-liens, which returned -8.47% as a whole during the 12-month period), and increased cash holdings from less than 5.0% to the low double-digits by the end of the 12-month period. Outperformance was also achieved from a credit quality perspective, as the Fund maintained a tilt towards BB-rated credits at the expense of single B-rated credits relative to the Fund’s Index. During the period, BB-rated credits outperformed single B-rated credits by almost 300 bps. In addition, the Fund maintained significant underweight exposure to CCC-rated loans and D-rated loans, which returned -10.82% and -43.44%, respectively, during the period. With regard to industry allocation, the Fund was materially underweight Oil & Gas, Metals & Mining, and Utilities, which returned -32.86%, -28.97%, and -16.40%, respectively. These three industries contributed almost -3.00% to the Index’s performance for the period, and was one of the largest drivers behind the negative Index returns during the same time frame.
| | | | | | |
| Period Ended 3-31-16 | | | | 1-Year | |
I-Share | | | | | 0.02% | |
N-Share | | | | | -0.23% | |
S&P/LSTA Leveraged Loan Index | | | | | -1.25% | |
For additional performance information, please refer to the “Standardized Performance Summary.”
DoubleLine Shiller Enhanced CAPE®
In the 12-month period ended March 31, 2016, DoubleLine Shiller Enhanced CAPE® significantly outperformed the S&P 500® Index return of 1.78%. The Fund’s outperformance of 4.31% (Class I-Shares) was driven by both the Fund’s equity and fixed income exposures. The Shiller Barclays CAPE® U.S. Sector Total Return Index exposure contributed 5.82% in return while the fixed income portfolio contributed 0.27% in return. The Index was allocated to a total of six different sectors over the course of the year with Materials and Technology/Telecommunications exposure being the biggest drivers of performance. The fixed income portfolio’s key drivers of return were the Agency MBS, non-Agency MBS and EM sectors.
| | | | | | |
| Period Ended 3-31-16 | | | | 1-Year | |
I-Share | | | | | 6.09% | |
N-Share | | | | | 5.84% | |
S&P 500® Index | | | | | 1.78% | |
Shiller Barclays CAPE® U.S. Sector Total Return Index | | | | | 6.81% | |
For additional performance information, please refer to the “Standardized Performance Summary.”
DoubleLine Flexible Income Fund
In the 12-month period ended March 31, 2016, the DoubleLine Flexible Income Fund underperformed the LIBOR USD 3 Month and experienced increased volatility as credit sensitive assets generally widened due to the volatility in energy related industries. The U.S. yield curve flattened over the year with longer-term rates declining and shorter-term rates increasing. As a result, longer duration asset classes performed well while more credit-sensitive sector returns were poor – worsened by increased market volatility as oil declined. Not surprisingly, High Yield debt, Bank Loans and EM Fixed Income were the most affected by the drop in oil, which led these holdings to perform the worst relative to the Fund’s other asset classes for the period. CLOs also underperformed as investors worried about existing energy concentrations in those portfolios causing the sector to generally trade poorly. CMBS, which also underperformed, had started to widen in the middle of last year due to low investor demand. Conversely, RMBS contributed strong returns over the 12-month period. While prices mildly declined in RMBS, the bonds benefited from high interest income.
| | | | | | |
| Period Ended 3-31-16 | | | | 1-Year | |
I-Share | | | | | -0.43% | |
N-Share | | | | | -0.66% | |
LIBOR USD 3 Month | | | | | 0.39% | |
| | | | | | |
| 10 | | DoubleLine Funds Trust | | | | |
| | |
| | | (Unaudited) March 31, 2016 |
For additional performance information, please refer to the “Standardized Performance Summary.”
DoubleLine Low Duration Emerging Markets Fixed Income Fund
Over the 12-month period ended March 31, 2016, the DoubleLine Low Duration Emerging Markets Fixed Income Fund underperformed the JP Morgan Corporate Emerging Markets Bond Index (CEMBI) Broad Diversified 1-3 Year Index. The Fund’s underperformance was driven by an overweight position in Latin American credits relative to the Index. Performance also suffered from exposure to commodity related producers, as commodity prices declined over the period. Additionally, one of the largest independent oil and gas producers in Colombia defaulted, further impacting performance.
| | | | | | |
| Period Ended 3-31-16 | | | | 1-Year | |
I-Share | | | | | 1.06% | |
N-Share | | | | | 0.82% | |
JP Morgan CEMBI Broad Diversified 1-3 Year Index | | | | | 3.23% | |
For additional performance information, please refer to the “Standardized Performance Summary.”
DoubleLine Long Duration Total Return Bond Fund
For the 12-month period ended March 31, 2016, the DoubleLine Long Duration Total Return Bond Fund outperformed its benchmark, the Barclays U.S. Long Government/Credit Index return of 0.39%. The outperformance was partly driven by the Fund’s shorter duration profile relative to the benchmark when interest rates rose during the second quarter of 2015. Additionally, the increasing volatility in the corporate space due to concerns over a weak commodities sector, specifically the Oil and Energy space, resulted in widening spreads for the sector, to which the Fund had no allocation. Agency fixed-rate CMOs contributed the most to total return as they benefited from not only solid price appreciation, but also strong interest carry for the period. Although a small allocation within the portfolio, Principal-Only securities also contributed positively to performance as they had robust price gains. At period end, there continued to be an active allocation to U.S. Treasuries for the purpose of duration and convexity management.
| | | | | | |
| Period Ended 3-31-16 | | | | 1-Year | |
I-Share | | | | | 2.76% | |
N-Share | | | | | 2.51% | |
Barclays U.S. Long Government/Credit Index | | | | | 0.39% | |
For additional performance information, please refer to the “Standardized Performance Summary.”
DoubleLine Strategic Commodity Fund
For the period since inception (May 18, 2015) through March 31, 2016, the DoubleLine Strategic Commodity Fund outperformed the broader commodity market, outperforming the Bloomberg Commodity Index (BCOM) return of -24.90% and the GSCI return of -35.96%. The Fund was exposed to both the long-only commodity beta (Backwardation Focused Multi Commodity Beta Basket (BFMCBB)) and the DoubleLine Commodity Long Short (DCLS) Alpha Strategy during the period. The BFMCBB declined by 25.05% while the DCLS returned a positive 13.79% over this time. The Fund’s outperformance of 11.83% (Class I-Shares) over the BCOM was driven primarily by the alpha beta mix as the allocation to the alpha added to performance. The strategy is fully collateralized by U.S. Treasury bills, which added incremental return over the period.
| | | | | | |
| Period From 5-18-15 through 3-31-16 | | | | Since Inception* (Not Annualized) | |
I-Share | | | | | -13.07% | |
N-Share | | | | | -13.27% | |
Bloomberg Commodity Index Total Return | | | | | -24.90% | |
| * | Inception Date of 5-18-2015 |
For additional performance information, please refer to the “Standardized Performance Summary.”
| | | | | | |
| | Annual Report | | March 31, 2016 | | 11 |
| | |
| Management’s Discussion of Fund Performance (Cont.) | | (Unaudited) March 31, 2016 |
DoubleLine Global Bond Fund
For the period since inception (December 17, 2015) to March 31, 2016, the DoubleLine Global Bond Fund saw strong positive performance, returning 5.11%. Returns were driven by both capital appreciation and foreign currency appreciation versus the U.S. dollar (USD). Supportive monetary policy by the BoJ, ECB, and PBoC, and a more dovish stance by the Fed allowed local rates to broadly rally over March, benefiting the Fund. The March Fed “dot plot” showed the Fed’s expectation for a slower pace of future rate hikes in 2016, curbing dollar appreciation and benefiting the non-dollar exposure of the Fund. The Fund underperformed its benchmark, the Citi World Government Bond Index (WGBI), which returned 7.51% over the period. The Fund’s underperformance was primarily due to an underweight allocation, relative to the WGBI, to Japan. Over the first quarter of 2016, Japan’s currency rallied 8.87% versus the USD, and was the best performing currency of the G10 countries. Japanese Government Bond yields also fell on the back of the BoJ introducing negative interest rates on certain bank’s excess deposits. The Fund’s underperformance, relative to the Index, was partially offset by the Fund’s longer duration, relative to the WGBI, in U.S. Treasury bonds, which rallied on the back of a more dovish comments from the Fed Chair Yellen.
| | | | | | |
| Period From 12-17-15 through 3-31-16 | | | | Since Inception* (Not Annualized) | |
I-Share | | | | | 5.11% | |
N-Share | | | | | 5.07% | |
Citi World Government Bond Index | | | | | 7.51% | |
| * | Inception Date of 12-17-2015 |
For additional performance information, please refer to the “Standardized Performance Summary.”
Past Performance is not a guarantee of future results.
Opinions expressed herein are as of March 31, 2016 and are subject to change at any time, are not guaranteed and should not be considered investment advice.
The performance shown assumes the reinvestment of all dividends and distributions and does not reflect any reductions for taxes. Investment performance reflects fee waivers in effect. In the absence of such waivers, total return would be reduced.
Fund holdings and sector allocations are subject to change at any time and are not recommendations to buy or sell any security. Please refer to the Schedules of Investments for a complete list of Fund holdings.
This report is for the information of shareholders of the Funds. It may also be used as sales literature when preceded or accompanied by the current prospectus.
Mutual fund investing involves risk. Principal loss is possible. Investments in debt securities typically decrease when interest rates rise. This risk is usually greater for longer-term debt securities. Investments in lower rated and non-rated securities present a great risk of loss to principal and interest than higher rated securities.
Investments in Asset-Backed and Mortgage-Backed securities include additional risks that investors should be aware of including credit risk, prepayment risk, possible illiquidity and default, as well as increased susceptibility to adverse economic developments.
Investments in foreign securities involve political, economic, and currency risks, greater volatility, and differences in accounting methods. These risks are greater for investments in emerging markets.
Investments in securities related to real estate may decline in value as a result of factors affecting the real estate industry.
Commodity-linked derivative instruments may involve additional costs and risks such as changes in commodity index volatility or factors affecting a particular industry or commodity, such as drought, floods, weather, livestock disease, embargoes, tariffs and international economic, political and regulatory developments. Investing in derivatives could result in losing more than the amount invested.
Equities may decline in value due to both real and perceived general market, economic, and industry conditions.
Derivatives involve risks different from, and in certain cases, greater than the risks presented by more traditional investments. Derivatives may involve certain costs and risks such as liquidity, interest rate, market, credit, management and the risk that a position could not be closed when most advantageous. Investing in derivatives could lose more than the amount invested. ETF investments involve additional risks such as the market price trading at a discount to its net asset value, an active secondary trading market may not develop or be maintained, or trading may be halted by the exchange in which they trade, which may impact a fund’s ability to sell its shares.
Floating rate loans and other floating rate investments are subject to credit risk, interest rate risk, counterparty risk and financial services risks, among others.
Additional principal risks for the Funds can be found in the prospectus.
Diversification does not assure a profit or protect against loss in a declining market.
Credit ratings from Moody’s range from the highest rating of Aaa for bonds of the highest quality that offer the lowest degree of investment risk to the lowest rating of C for the lowest rated class of bonds. Credit ratings from Standard & Poor’s (S&P) range from the highest rating of AAA for bonds of the highest quality that offer the lowest degree of investment risk to the lowest rating of D for bonds that are in default.
Credit ratings are determined by the highest available credit rating from any Nationally Recognized Statistical Rating Agency (“NRSRO”, generally S&P, Moody’s and Fitch). DoubleLine chooses to display credit ratings using S&P’s rating convention, although the rating itself might be sourced from another NRSRO.
Alpha—A measure of performance on a risk-adjusted basis. Alpha takes the volatility (price risk) of a mutual fund and compares its risk-adjusted performance to a benchmark index.
Backwardation—As the contract approaches expiration, the futures contract will trade at a higher price compared to when the contract was further away from expiration. This is said to occur due to the convenience yield being higher than the prevailing risk free rate.
| | | | | | |
| 12 | | DoubleLine Funds Trust | | | | |
| | |
| | | (Unaudited) March 31, 2016 |
Backwardation Focused Multi-Commodity Beta Basket—This basket is composed of futures contracts on eleven commodities, which were selected based on (i) the contracts’ historical backwardation relative to other commodity-related futures contracts and (ii) the contracts’ historical liquidity. Of the commodities represented in the basket, five are in the energy sector, two are in the industrial metals sector, and four are in the agricultural and livestock sectors.
Barclays U.S. Aggregate Bond Index—This index represents securities that are SEC-registered, taxable, and dollar denominated. The index covers the U.S. investment grade fixed rate bond market, with index components for government and corporate securities, mortgage pass-through securities, and asset-backed securities. These major sectors are subdivided into more specific indices that are calculated and reported on a regular basis.
Barclays U.S. CMBS Index—This index measures the performance of investment grade commercial mortgage-backed securities, which are classes of securities that represent interests in pools of commercial mortgages.
Barclays U.S. Long Government/Credit Index—The index includes publicly issued U.S. Treasury debt, U.S. government agency debt, taxable debt issued by U.S. states and territories and their political subdivisions, debt issued by U.S. and non-U.S. corporations, non-U.S. government debt and supranational debt.
Barclays U.S. MBS Index—This index measures the performance of investment grade fixed-rate mortgage-backed pass-through securities of the Government-Sponsored Enterprises (GSEs): Ginnie Mae (GNMA), Fannie Mae (FNMA), and Freddie Mac (FHLMC).
Basis Point—A basis point (bps) equals to 0.01%.
Bank of America (BofA)/Merrill Lynch 1-3 Year U.S. Treasury Index—This index is an unmanaged index that tracks the performance of the direct sovereign debt of the U.S. Government having a maturity of at least one year and less than three years.
Beta—The measure of a mutual fund’s volatility in relation to the market. By definition, the market has a beta of 1.0, and individual mutual funds are ranked according to how much they deviate from the market. A beta of above 1.0 means the fund swings more than the market. If the fund moves less than the market, the beta is less than 1.0.
Bloomberg Commodity Index (BCOM)—An index calculated on an excess return basis that reflects commodity futures price movements. The index rebalances annually weighted 2/3 by trading volume and 1/3 by world production and weight-caps are applied at the commodity, sector and group level for diversification. Roll period typically occurs from 6th-10th business day based on the roll schedule.
Citi High-Yield Cash-Pay Capped Index—This index represents the cash-pay securities of the Citigroup High-Yield Market Capped Index, which represents a modified version of the High Yield Market Index by delaying the entry of fallen angel issues and capping the par value of individual issuers at $5 billion par amount outstanding.
Citi World Government Bond Index (WGBI)—This index measures the performance of fixed-rate, local currency, investment grade sovereign bonds. The WGBI is a widely used benchmark that currently comprises sovereign debt from over 20 countries, denominated in a variety of currencies, and has more than 25 years of history available. The WGBI provides a broad benchmark for the global sovereign fixed income market. Sub-indices are available in any combination of currency, maturity, or rating.
Duration—A measure of the sensitivity of a price of a fixed income investment to a change in interest rates, expressed as a number of years.
Eurostoxx 50—A stock index of Eurozone stocks designed by STOXX, an index provider owned by Deutsche Borse Group and SIX group, with the goal of providing a blue-chip representation of Supersector leaders in the Eurozone.
Investment Grade—Securities rated AAA to BBB- are considered to be investment grade. A bond is considered investment grade if its credit rating is BBB- or higher by Standard & Poor’s or Baa3 by Moody’s. Ratings based on corporate bond model. The higher the rating, the more likely the bond is to pay back at par/$100 cents on the dollar. AAA is considered the highest quality and the lowest degree of risk. They are considered to be extremely stable and dependable.
JP Morgan Corporate Emerging Markets Bond Index (CEMBI) Broad Diversified 1-3 Year Index—This index is a market capitalization weighted index consisting of US-denominated Emerging Market corporate bonds with 1-3 year maturity. It is a liquid global corporate benchmark representing Asia, Latin America, Europe and the Middle East/Africa.
JP Morgan Emerging Markets Bond Index (EMBI) Global Diversified—This Index is a uniquely-weighted version of the EMBI Global. It limits the weights of those index countries with larger debt stocks by only including specified portions of these countries’ eligible current face amounts of debt outstanding. The countries covered in the EMBI Global Diversified are identical to those covered by EMBI Global.
Last Cash Flow (LCF)—The last revenue stream paid to a bond over a given period.
London Interbank Offered Rate (LIBOR)—An indicative average interest rate at which a selection of banks known as the panel banks are prepared to lend one another unsecured funds on the London money market.
Morgan Stanley Capital International All Country World Index (MSCI ACWI)—The Index is a market-capitalization-weighted index designed to provide a broad measure of stock performance throughout the world, including both developed and emerging markets.
Morgan Stanley Capital International Emerging Markets Index (MSCI EM)—The Index is a float-adjusted market capitalization index designed to measure equity market performance in global emerging markets. It consists of indices in 26 emerging economies, including but not limited to, Argentina, Brazil, China, India, Poland, Thailand, Turkey, and Venezuela.
Mortgage Bankers Association (MBA) Purchase Index—An index that includes all mortgage applications for purchases of single-family homes. It covers the entire market, both conventional and government loans and all products.
Mortgage Bankers Association (MBA) Refinance Index—An index that covers all mortgage applications to refinance an existing mortgage. It includes conventional and government refinances.
Nikkei 225 Index—A price-weighted index comprised of Japan’s top 225 blue-chip companies on the Tokyo Stock Exchange. The Nikkei is equivalent to the Dow Jones Industrial Average Index in the U.S.
Russell 1000® Value Index—This index that measures the performance of the large-cap value segment of the U.S. equity universe. It includes those Russell 1000 companies with lower price-to-book ratios and lower expected growth values.
Shanghai Composite Index—A capitalization-weighted index that tracks the daily performance of all A-shares and B-shares listed on the Shanghai Stock Exchange. The index was developed on December 19, 1990 with a base value of 100.
Shiller Barclays CAPE® US Sector Total Return Index—An index that incorporates the principles of long-term investing distilled by Dr. Robert Shiller and expressed through the CAPE® (Cyclically Adjusted Price Earnings) ratio (the “CAPE® Ratio”). It aims to identify undervalued sectors based on a modified CAPE® Ratio, and then uses a momentum factor to seek to mitigate the effects of potential value traps.
Spread—The difference between yields on differing debt instruments, calculated by deducting the yield of one instrument from another. The higher the yield spread, the greater the difference between the yields offered by each instrument. The spread can be measured between debt instruments of differing maturities, credit ratings and risk.
| | | | | | |
| | Annual Report | | March 31, 2016 | | 13 |
| | |
| Management’s Discussion of Fund Performance (Cont.) | | (Unaudited) March 31, 2016 |
S&P 500® Index—The Index is an unmanaged capitalization-weighted index of 500 stocks designed to measure performance of the broad domestic economy through changes in the aggregate market value of 500 stocks representing all major industries.
S&P Goldman Sachs Commodity Index (GSCI)—This composite index of commodity sector returns represents a broadly diversified, unleveraged, long-only position in commodity futures. The index’s components qualify for inclusion in the index based on liquidity measures and are weighted in relation to their global production levels, making the Index a valuable economic indicator and commodities market benchmark. The GSCI Excess Return index is one of the three S&P GSCI Indices published, measuring the return accrued from investing in uncollateralized nearby commodity futures. This Excess Return Index includes an Energy component, which was referenced in this commentary.
S&P/LSTA Leveraged Loan Index—Capitalization-weighted syndicated loan indices are based upon market weightings, spreads and interest payments, and this index covers the U.S. market back to 1997 and currently calculates on a daily basis. Created by the Leveraged Commentary & Data (LCD) team at S&P Capital IQ, the review provides an overview and outlook of the leveraged loan market as well as an expansive review of the S&P Leveraged Loan Index and sub-indexes. The review consists of index general characteristics, results, risk-return profile, default/distress statistics, and repayment analysis.
A direct investment cannot be made in an index. The performance of any index mentioned in this commentary has not been adjusted for ongoing management, distribution and operating expenses applicable to mutual fund investments.
The DoubleLine Funds are distributed by Quasar Distributors, LLC.
DoubleLine® is a registered trademark of DoubleLine Capital LP.
This commentary may include statements that constitute “forward-looking statements” under the U.S. securities laws. Forward-looking statements include, among other things, projections, estimates, and information about possible or future results related to a Fund and market or regulatory developments. The views expressed above are not guarantees of future performance or economic results and involve certain risks, uncertainties and assumptions that could cause actual outcomes and results to differ materially from the views expressed herein.
DoubleLine has no obligation to provide revised assessments in the event of changed circumstances. While we have gathered this information from sources believed to be reliable, DoubleLine cannot guarantee the accuracy of the information provided. Securities discussed are not recommendations and are presented as examples of issue selection or portfolio management processes. They have been picked for comparison or illustration purposes only. No security presented within is either offered for sale or purchase. DoubleLine reserves the right to change its investment perspective and outlook without notice as market conditions dictate or as additional information becomes available.
Investment strategies may not achieve the desired results due to implementation lag, other timing factors, portfolio management decision making, economic or market conditions or other unanticipated factors. The views and forecasts expressed in this material are as of the date indicated, are subject to change without notice, may not come to pass and do not represent a recommendation or offer of any particular security, strategy, or investment. Past performance is no guarantee of future results.
| | | | | | |
| 14 | | DoubleLine Funds Trust | | | | |
| | |
| Standardized Performance Summary | | (Unaudited) March 31, 2016 |
| | | | | | | | | | | | | | | | | | | | |
| DBLTX/DLTNX | | | | | | | | | | | | | | | | |
Total Return Bond Fund
Returns as of March 31, 2016 | | 1 Year | | | 3 Year Annualized | | | 5 Year Annualized | | | Since Inception Annualized
(4-6-10 to 3-31-16) | | | Gross
Expense Ratio |
I-share (DBLTX) | | | 2.45% | | | | 3.15% | | | | 5.36% | | | | 7.59% | | | 0.47% |
N-share (DLTNX) | | | 2.20% | | | | 2.93% | | | | 5.11% | | | | 7.33% | | | 0.72% |
Barclays U.S. Aggregate Bond Index | | | 1.96% | | | | 2.50% | | | | 3.78% | | | | 4.11% | | | | | |
| DBLFX/DLFNX | | | | | | | | | | | | | | | | |
Core Fixed Income Fund
Returns as of March 31, 2016 | | 1 Year | | | 3 Year Annualized | | | 5 Year Annualized | | | Since Inception Annualized
(6-1-10 to 3-31-16) | | | Gross
Expense Ratio |
I-share (DBLFX) | | | 1.31% | | | | 2.78% | | | | 5.16% | | | | 6.11% | | | 0.50% |
N-share (DLFNX) | | | 0.97% | | | | 2.52% | | | | 4.89% | | | | 5.85% | | | 0.75% |
Barclays U.S. Aggregate Bond Index | | | 1.96% | | | | 2.50% | | | | 3.78% | | | | 3.78% | | | | | |
| DBLEX/DLENX | | | | | | | | | | | | | | | | |
Emerging Markets Fixed Income Fund
Returns as of March 31, 2016 | | 1 Year | | | 3 Year Annualized | | | 5 Year Annualized | | | Since Inception
Annualized
(4-6-10 to 3-31-16) | | | Gross
Expense Ratio |
I-share (DBLEX) | | | -0.48% | | | | 1.11% | | | | 3.81% | | | | 5.07% | | | 0.90% |
N-share (DLENX) | | | -0.73% | | | | 0.86% | | | | 3.56% | | | | 4.82% | | | 1.15% |
JP Morgan Emerging Markets Bond Global Diversified Index | | | 4.19% | | | | 3.44% | | | | 6.22% | | | | 6.59% | | | | | |
| DMLIX/DMLAX | | | | | | | | | | | | | | | | |
Multi-Asset Growth Fund
Returns as of March 31, 2016 | | 1 Year | | | 3 Year Annualized | | | 5 Year Annualized | | | Since Inception
Annualized
(12-20-10 to 3-31-16) | | | Gross Expense Ratio | | Net Expense Ratio* |
I-share (DMLIX) | | | -4.29% | | | | 1.76% | | | | 2.09% | | | | 2.22% | | | 1.49% | | 1.39% |
A-share (DMLAX) | | | | | | | | | | | | | | | | | | 1.74% | | 1.64% |
A-share (No Load) | | | -4.42% | | | | 1.51% | | | | 1.86% | | | | 1.95% | | | | | |
A-share (With Load) | | | -8.49% | | | | 0.05% | | | | 0.97% | | | | 1.12% | | | | | |
Blended Benchmark** | | | -4.34% | | | | -0.98% | | | | 1.04% | | | | 1.77% | | | | | |
S&P 500® Index TR | | | 1.78% | | | | 11.82% | | | | 11.58% | | | | 12.35% | | | | | |
| DBLSX/DLSNX | | | | | | | | | | | | | | | | |
Low Duration Bond Fund
Returns as of March 31, 2016 | | 1 Year | | | 3 Year Annualized | | | | | | Since Inception
Annualized
(9-30-11 to 3-31-16) | | | Gross
Expense Ratio |
I-share (DBLSX) | | | 1.00% | | | | 1.42% | | | | | | | | 2.13% | | | 0.46% |
N-share (DLSNX) | | | 0.85% | | | | 1.21% | | | | | | | | 1.89% | | | 0.71% |
BofA/Merrill Lynch 1-3 Year U.S. Treasury Index | | | 0.92% | | | | 0.77% | | | | | | | | 0.68% | | | | | |
| DBFRX/DLFRX | | | | | | | | | | | | | | | | |
Floating Rate Fund
Returns as of March 31, 2016 | | 1 Year | | | 3 Year Annualized | | | | | | Since Inception
Annualized
(2-1-13 to 3-31-16) | | | Gross Expense Ratio+ | | Net Expense Ratio* |
I-share (DBFRX) | | | 0.02% | | | | 2.14% | | | | | | | | 2.29% | | | 0.68% | | 0.71% |
N-share (DLFRX) | | | -0.23% | | | | 1.95% | | | | | | | | 2.11% | | | 0.93% | | 0.96% |
S&P LSTA Leveraged Loan Index | | | -1.25% | | | | 1.85% | | | | | | | | 2.10% | | | | | |
| DSEEX/DSENX | | | | | | | | | | | | | | | | |
Shiller Enhanced CAPE® Returns as of March 31, 2016 | | 1 Year | | | | | | | | | Since Inception
Annualized
(10-31-13 to 3-31-16) | | | Gross
Expense
Ratio | | Net
Expense
Ratio* |
I-share (DSEEX) | | | 6.09% | | | | | | | | | | | | 12.82% | | | 0.84% | | 0.67% |
N-share (DSENX) | | | 5.84% | | | | | | | | | | | | 12.53% | | | 1.09% | | 0.92% |
Shiller Barclays CAPE® U.S. Sector Total Return USD Index | | | 6.81% | | | | | | | | | | | | 11.61% | | | | | |
S&P 500® Index | | | 1.78% | | | | | | | | | | | | 9.11% | | | | | |
| | | | | | |
| | Annual Report | | March 31, 2016 | | 15 |
| | |
| Standardized Performance Summary (Cont.) | | (Unaudited) March 31, 2016 |
| | | | | | | | | | | | | | |
| DFLEX/DLINX | | | | | | | | | | | | | |
Flexible Income Fund Returns as of March 31, 2016 | | 1 Year | | | | | | | Since Inception Annualized
(4-7-14 to 3-31-16) | | Gross
Expense Ratio | | Net
Expense Ratio* |
I-share (DFLEX) | | | -0.43% | | | | | | | 1.71% | | 1.35% | | 0.84% |
N-share (DLINX) | | | -0.66% | | | | | | | 1.48% | | 1.60% | | 1.09% |
LIBOR USD 3-Month Index | | | 0.39% | | | | | | | 0.33% | | | | |
| DBLLX/DELNX | | | | | | | | | | | | | |
Low Duration Emerging Markets Fixed Income Fund Returns as of March 31, 2016 | | 1 Year | | | | | | | Since Inception Annualized
(4-7-14 to 3-31-16) | | Gross
Expense Ratio | | Net
Expense Ratio* |
I-share (DBLLX) | | | 1.06% | | | | | | | 1.51% | | 0.91% | | 0.59% |
N-share (DELNX) | | | 0.82% | | | | | | | 1.32% | | 1.16% | | 0.84% |
JP Morgan CEMBI Broad Diversified 1-3 Years | | | 3.23% | | | | | | | 2.62% | | | | |
| DBLDX/DLLDX | | | | | | | | | | | | | |
Long Duration Total Return Bond Fund Returns as of March 31, 2016 | | 1 Year | | | | | | | Since Inception (12-15-14 to 3-31-16) | | Gross
Expense
Ratio | | Net
Expense
Ratio*** |
I-share (DBLDX) | | | 2.76% | | | | | | | 6.18% | | 1.33% | | 0.65% |
N-share (DLLDX) | | | 2.51% | | | | | | | 5.86% | | 1.58% | | 0.90% |
Barclays Long Government/Credit Index | | | 0.39% | | | | | | | 3.26% | | | | |
| DBCMX/DLCMX | | | | | | | | | | | | | |
Strategic Commodity Fund Returns as of March 31, 2016 | | | | | | | | | Since Inception
Not Annualized
(5-18-15 to 3-31-16) | | Gross
Expense
Ratio | | Net
Expense
Ratio**** |
I-share (DBCMX) | | | | | | | | | | -13.07% | | 1.30% | | 1.11% |
N-share (DLCMX) | | | | | | | | | | -13.27% | | 1.55% | | 1.36% |
Bloomberg Commodity Index Total Return | | | | | | | | | | -24.90% | | | | |
| DBLGX/DLGBX | | | | | | | | | | | | | |
Global Bond Fund Returns as of March 31, 2016 | | | | | | | | | Since Inception
Not Annualized
(12-17-15 to 3-31-16) | | Gross
Expense
Ratio | | Net
Expense
Ratio++ |
I-share (DBLGX) | | | | | | | | | | 5.11% | | 0.93% | | 0.71% |
N-share (DLGBX) | | | | | | | | | | 5.07% | | 1.18% | | 0.96% |
Citi World Government Bond Index | | | | | | | | | | 7.51% | | | | |
The performance information shown assumes the reinvestment of all dividends and distributions. Returns over 1 year are average annual returns. Performance data quoted represents past performance; past performance does not guarantee future results. The investment return and principal value of an investment will fluctuate so that an investor’s shares, when redeemed, may be worth more or less than the original cost. Current performance of a Fund may be lower or higher than the performance quoted. The Funds’ gross and net expense ratios are taken from the most recent prospectus and may change over time. The Funds’ gross expense ratio also includes “acquired fund fees and expenses,” which are expenses incurred indirectly as a result of a Fund’s investments in one or more underlying funds, including ETFs and money market funds. Because these costs are indirect, the expense ratios will not correlate to the expense ratios in the Funds’ financial statements, since financial statements only include direct costs of the Funds and not indirect costs of investing in the underlying funds. Performance data current to the most recent month-end may be obtained by calling (213) 633-8200 or by visiting www.doublelinefunds.com.
Performance data shown for the Multi-Asset Growth Fund Class reflects the Class A maximum sales charge of 4.25%. Performance data shown for the Class A No Load does not reflect the deduction of the sales load or fee. If reflected, the load or fee would reduce the performance quoted. The Multi-Asset Growth Fund imposes a Deferred Sales Charge of 0.75% on purchases of $1 million or more of Class A shares if redeemed within 18 months of purchase. The Multi-Asset Growth Fund and Floating Rate Fund impose a 1.00% redemption fee on all share classes if shares are sold within 90 days of purchase. Performance data does not reflect the redemption fee. If it had, returns would be reduced.
*The Adviser has contractually agreed to waive fees and reimburse expenses through July 31, 2016. For additional information regarding these expense limitation arrangements, please see Note 3 in the Notes to Financial Statements.
**The Blended Benchmark for the Multi-Asset Growth Fund is 60% Barclays U.S. Aggregate Bond Index, 25% MSCI All Country World Index & 15% SP GSCI Total Return Index.
***The Adviser has contractually agreed to waive fees and reimburse expenses through November 20, 2016.
****The Adviser has contractually agreed to waive fees and reimburse expenses through May 13, 2017.
+ The Gross Expense Ratio for the Floating Rate Fund is lower than its Net Expense Ratio because the Adviser recouped 0.03% in fees it had waived or expenses it had reimbursed in a prior period pursuant to an expense limitation agreement with the Fund.
++ The Adviser has contractually agreed to waive fees and reimburse expenses through November 20, 2017.
Mutual Fund Investing involves risk. Principal loss is possible.
| | | | | | |
| 16 | | DoubleLine Funds Trust | | | | |
| | |
| Schedule of Investments DoubleLine Total Return Bond Fund | | March 31, 2016 |
| | | | | | | | | | | | | | | | |
PRINCIPAL
AMOUNT $ | | | SECURITY DESCRIPTION | | RATE | | | MATURITY | | | VALUE $ | |
| | ASSET BACKED OBLIGATIONS 2.4% | |
| |
| | | | AMPLIT Trust, | |
| | 40,464,261 | | | Series 2015-A-A | | | 5.00% | ^ | | | 09/15/2021 | | | | 40,337,810 | |
| |
| | | | AVANT Loans Funding Trust, | |
| | 11,104,115 | | | Series 2015-A-A | | | 4.00% | ^ | | | 08/16/2021 | | | | 10,931,979 | |
| |
| | | | Blue Elephant Loan Trust, | |
| | 6,836,823 | | | Series 2015-1-A | | | 3.12% | ^ | �� | | 12/15/2022 | | | | 6,831,826 | |
| |
| | | | CAN Capital Funding LLC, | |
| | 50,000,000 | | | Series 2012-1A-B1 | | | 3.12% | ^ | | | 04/15/2020 | | | | 49,875,000 | |
| |
| | | | Castlelake Aircraft Securitization Trust, | |
| | 39,000,000 | | | Series 2015-1A-A | | | 4.70% | ^ | | | 12/15/2040 | | | | 38,315,550 | |
| |
| | | | Citi Held For Asset Issuance, | |
| | 39,471,613 | | | Series 2015-PM1-A | | | 1.85% | ^ | | | 12/15/2021 | | | | 39,274,926 | |
| | 29,000,000 | | | Series 2015-PM1-B | | | 2.93% | ^ | | | 12/15/2021 | | | | 28,377,486 | |
| | 10,500,000 | | | Series 2015-PM1-C | | | 5.01% | ^ | | | 12/15/2021 | | | | 9,952,918 | |
| | 34,196,132 | | | Series 2015-PM2-A | | | 2.35% | ^ | | | 03/15/2022 | | | | 34,097,750 | |
| | 45,000,000 | | | Series 2015-PM2-B | | | 4.00% | ^ | | | 03/15/2022 | | | | 42,798,690 | |
| | 30,000,000 | | | Series 2015-PM2-C | | | 5.96% | ^ | | | 03/15/2022 | | | | 29,054,880 | |
| | 8,851,720 | | | Series 2015-PM3-A | | | 2.56% | ^ | | | 05/16/2022 | | | | 8,846,019 | |
| | 34,434,999 | | | Series 2016-MF1-A | | | 4.48% | ^ | | | 08/15/2022 | | | | 34,561,651 | |
| | 50,000,000 | | | Series 2016-PM1-A | | | 4.65% | ^ | | | 04/15/2025 | | | | 50,095,700 | |
| |
| | | | Commonbond Student Loan Trust, | |
| | 25,797,009 | | | Series 2015-A-A1 | | | 3.20% | ^ | | | 06/25/2032 | | | | 25,781,538 | |
| |
| | | | Conn’s Receivables Funding LLC, | |
| | 90,000,000 | | | Series 2016-A-A | | | 4.68% | ^ | | | 04/16/2018 | | | | 90,076,923 | |
| |
| | | | Consumer Credit Origination Loan Trust, | |
| | 23,010,548 | | | Series 2015-1-A | | | 2.82% | ^ | | | 03/15/2021 | | | | 23,020,415 | |
| |
| | | | DB Master Finance LLC, | |
| | 53,955,000 | | | Series 2015-1A-A2I | | | 3.26% | ^ | | | 02/20/2045 | | | | 53,266,820 | |
| | 37,125,000 | | | Series 2015-1A-A2II | | | 3.98% | ^ | | | 02/20/2045 | | | | 36,395,861 | |
| |
| | | | Eaglewood Consumer Loan Trust, | |
| | 114,000,000 | | | Series 2014-1-A | | | 3.50% | ^¥ | | | 10/15/2019 | | | | 113,426,466 | |
| |
| | | | ECAF Ltd., | |
| | 74,337,893 | | | Series 2015-1A-A2 | | | 4.95% | ^ | | | 06/15/2040 | | | | 72,239,631 | |
| |
| | | | Element Rail Leasing LLC, | |
| | 10,000,000 | | | Series 2016-1A-A1 | | | 3.97% | ^ | | | 03/19/2046 | | | | 10,079,650 | |
| |
| | | | MarketPlace Loan Trust, | |
| | 27,567,742 | | | Series 2015-AV2-A | | | 4.00% | ^ | | | 10/15/2021 | | | | 27,172,669 | |
| | 29,586,903 | | | Series 2015-CB1-A | | | 4.00% | ^ | | | 07/15/2021 | | | | 29,234,760 | |
| | 30,975,654 | | | Series 2015-LD1-A | | | 4.00% | ^ | | | 12/15/2021 | | | | 30,503,182 | |
| | 66,815,161 | | | Series 2016-LD1-A | | | 5.25% | | | | 03/15/2022 | | | | 66,806,007 | |
| |
| | | | Nelnet Student Loan Trust, | |
| | 27,300,000 | | | Series 2007-2A-B1 | | | 1.67% | ^ | | | 09/25/2035 | | | | 22,678,847 | |
| |
| | | | OneMain Financial Issuance Trust, | |
| | 9,910,000 | | | Series 2014-1A-A | | | 2.43% | ^ | | | 06/18/2024 | | | | 9,886,937 | |
| | 90,000,000 | | | Series 2016-2A-A | | | 4.10% | ^ | | | 03/20/2028 | | | | 90,682,191 | |
| |
| | | | Progreso Receivables Funding II LLC, | |
| | 10,000,000 | | | Series 2014-A-A | | | 3.50% | ^ | | | 07/08/2019 | | | | 9,986,700 | |
| |
| | | | Shenton Aircraft Investment Ltd., | |
| | 48,335,792 | | | Series 2015-1A-A | | | 4.75% | ^ | | | 10/15/2042 | | | | 47,941,855 | |
| |
| | | | SLM Private Credit Student Loan Trust, | |
| | 12,220,539 | | | Series 2004-A-A3 | | | 1.03% | # | | | 06/15/2033 | | | | 11,277,936 | |
| |
| | | | SoFi Professional Loan Program, | |
| | 28,000,000 | | | Series 2016-A-A2 | | | 2.76% | ^ | | | 12/26/2036 | | | | 27,823,499 | |
| |
| | | | SpringCastle America Funding LLC, | |
| | 68,147,484 | | | Series 2014-AA-A | | | 2.70% | ^ | | | 05/25/2023 | | | | 67,890,125 | |
| | 74,445,000 | | | Series 2014-AA-B | | | 4.61% | ^ | | | 10/25/2027 | | | | 74,573,299 | |
| | | | | | | | | | | | | | | | |
| | | | Total Asset Backed Obligations
(Cost $1,376,481,433) | | | | 1,364,097,496 | |
| | | | | | | | | | | | | | | | |
| | COLLATERALIZED LOAN OBLIGATIONS 4.6% | |
| |
| | | | Adams Mill Ltd., | |
| | 20,000,000 | | | Series 2014-1A-A1 | | | 2.10% | #^ | | | 07/15/2026 | | | | 19,817,694 | |
| | 10,000,000 | | | Series 2014-1A-C1 | | | 3.62% | #^ | | | 07/15/2026 | | | | 9,548,942 | |
| | | | | | | | | | | | | | | | |
PRINCIPAL
AMOUNT $ | | | SECURITY DESCRIPTION | | RATE | | | MATURITY | | | VALUE $ | |
| |
| | | | AIMCO, | |
| | 7,664,750 | | | Series 2006-AA-A1 | | | 0.87% | #^ | | | 08/20/2020 | | | | 7,625,030 | |
| |
| | | | ALM Loan Funding, | |
| | 27,725,000 | | | Series 2012-7A-A1 | | | 2.04% | #^ | | | 10/19/2024 | | | | 27,741,532 | |
| | 20,000,000 | | | Series 2014-14A-A1 | | | 2.05% | #^ | | | 07/28/2026 | | | | 19,873,410 | |
| |
| | | | Anchorage Capital Ltd., | |
| | 12,600,000 | | | Series 2014-4A-A1A | | | 2.07% | #^ | | | 07/28/2026 | | | | 12,447,860 | |
| | 20,000,000 | | | Series 2014-5A-A | | | 2.22% | #^ | | | 10/15/2026 | | | | 19,839,742 | |
| |
| | | | Apidos Ltd., | |
| | 10,448,506 | | | Series 2007-5A-A18 | | | 0.85% | #^ | | | 04/15/2021 | | | | 10,355,912 | |
| | 43,900,000 | | | Series 2013-16A-A1 | | | 2.07% | #^ | | | 01/19/2025 | | | | 43,693,341 | |
| | 5,500,000 | | | Series 2014-18A-B | | | 3.42% | #^ | | | 07/22/2026 | | | | 5,312,365 | |
| | 25,000,000 | | | Series 2014-19A-A1 | | | 2.12% | #^ | | | 10/17/2026 | | | | 24,859,935 | |
| | 23,000,000 | | | Series 2015-20A-A1 | | | 2.17% | #^ | | | 01/16/2027 | | | | 22,892,141 | |
| |
| | | | ARES Ltd., | |
| | 201,675,976 | | | Series 2007-11A-A1B | | | 0.88% | #^ | | | 10/11/2021 | | | | 198,965,794 | |
| | 17,148,454 | | | Series 2007-12A-A | | | 1.26% | #^ | | | 11/25/2020 | | | | 16,889,588 | |
| | 25,000,000 | | | Series 2013-1A-B | | | 2.37% | #^ | | | 04/15/2025 | | | | 23,409,255 | |
| | 6,500,000 | | | Series 2013-1A-D | | | 4.37% | #^ | | | 04/15/2025 | | | | 5,555,055 | |
| | 3,764,443 | | | Series 2014-30A-A2 | | | 1.47% | #^ | | | 04/20/2023 | | | | 3,747,111 | |
| |
| | | | Atrium Corporation, | |
| | 17,150,653 | | | Series 5A-A2A | | | 0.84% | #^ | | | 07/20/2020 | | | | 17,096,439 | |
| |
| | | | Avery Point Ltd., | |
| | 3,950,000 | | | Series 2013-2A-D | | | 4.07% | #^ | | | 07/17/2025 | | | | 3,468,409 | |
| | 5,000,000 | | | Series 2014-1A-A | | | 2.14% | #^ | | | 04/25/2026 | | | | 4,939,133 | |
| |
| | | | Babson Ltd., | |
| | 4,500,000 | | | Series 2014-3A-D2 | | | 4.83% | #^ | | | 01/15/2026 | | | | 4,019,788 | |
| | 4,750,000 | | | Series 2014-IIA-C | | | 3.52% | #^ | | | 10/17/2026 | | | | 4,358,121 | |
| | 3,750,000 | | | Series 2014-IIA-D | | | 4.22% | #^ | | | 10/17/2026 | | | | 3,196,536 | |
| |
| | | | Baker Street Funding Ltd., | |
| | 5,000,000 | | | Series 2005-1A-B | | | 1.08% | #^ | | | 12/15/2018 | | | | 4,920,025 | |
| |
| | | | Birchwood Park Ltd., | |
| | 5,000,000 | | | Series 2014-1A-C2 | | | 3.77% | #^ | | | 07/15/2026 | | | | 4,980,640 | |
| | 6,500,000 | | | Series 2014-1A-D2 | | | 4.82% | #^ | | | 07/15/2026 | | | | 5,873,429 | |
| |
| | | | BlackRock Senior Income, | |
| | 1,897,435 | | | Series 2006-4A-A | | | 0.86% | #^ | | | 04/20/2019 | | | | 1,897,357 | |
| |
| | | | BlueMountain Ltd., | |
| | 71,250,000 | | | Series 2012-2A-A1 | | | 2.04% | #^ | | | 11/20/2024 | | | | 70,987,900 | |
| | 19,000,000 | | | Series 2012-2A-B1 | | | 2.68% | #^ | | | 11/20/2024 | | | | 19,019,923 | |
| | 16,150,000 | | | Series 2012-2A-C | | | 3.37% | #^ | | | 11/20/2024 | | | | 16,021,533 | |
| | 33,150,000 | | | Series 2013-1A-A1 | | | 1.82% | #^ | | | 05/15/2025 | | | | 32,598,878 | |
| | 4,000,000 | | | Series 2013-4A-A | | | 2.12% | #^ | | | 04/15/2025 | | | | 3,986,250 | |
| | 5,000,000 | | | Series 2014-3A-A1 | | | 2.10% | #^ | | | 10/15/2026 | | | | 4,985,918 | |
| | 6,250,000 | | | Series 2014-4A-B1 | | | 3.04% | #^ | | | 11/30/2026 | | | | 6,140,163 | |
| | 58,250,000 | | | Series 2015-3A-A1 | | | 1.81% | #^ | | | 10/20/2027 | | | | 58,110,549 | |
| | 34,500,000 | | | Series 2015-4A-B | | | 2.71% | #^ | | | 01/20/2027 | | | | 34,383,269 | |
| | 9,250,000 | | | Series 2015-4A-C | | | 3.66% | #^ | | | 01/20/2027 | | | | 8,960,210 | |
| | 8,750,000 | | | Series 2015-4A-D1 | | | 5.06% | #^ | | | 01/20/2027 | | | | 8,581,421 | |
| |
| | | | Bridgeport Ltd., | |
| | 544,143 | | | Series 2006-1A-A1 | | | 0.87% | #^ | | | 07/21/2020 | | | | 537,950 | |
| |
| | | | Brookside Mill Ltd., | |
| | 17,000,000 | | | Series 2013-1A-C1 | | | 3.32% | #^ | | | 04/17/2025 | | | | 16,041,598 | |
| |
| | | | Callidus Debt Partners Fund Ltd., | |
| | 17,081,213 | | | Series 2007-6A-A1T | | | 0.88% | #^ | | | 10/23/2021 | | | | 16,629,546 | |
| |
| | | | Canyon Capital Ltd., | |
| | 9,500,000 | | | Series 2012-1A-B1 | | | 2.57% | #^ | | | 01/15/2024 | | | | 9,150,781 | |
| | 1,000,000 | | | Series 2014-1A-B | | | 3.27% | #^ | | | 04/30/2025 | | | | 932,901 | |
| |
| | | | Carlyle Global Market Strategies Ltd., | |
| | 36,790,000 | | | Series 2012-2A-A1R | | | 1.92% | #^ | | | 07/20/2023 | | | | 36,661,110 | |
| | 10,000,000 | | | Series 2012-4A-A | | | 2.01% | #^ | | | 01/20/2025 | | | | 9,959,230 | |
| | 17,000,000 | | | Series 2014-3A-B | | | 3.77% | #^ | | | 07/27/2026 | | | | 16,893,815 | |
| | 2,500,000 | | | Series 2014-3A-C2 | | | 4.82% | #^ | | | 07/27/2026 | | | | 2,288,921 | |
| | 20,000,000 | | | Series 2015-5A-A1A | | | 3.38% | #^ | | | 01/20/2028 | | | | 19,993,298 | |
| | 8,000,000 | | | Series 2015-5A-A2A | | | 2.74% | #^ | | | 01/20/2028 | | | | 7,770,970 | |
| | 4,000,000 | | | Series 2015-5A-B2 | | | 3.74% | #^ | | | 01/20/2028 | | | | 3,991,062 | |
| |
| | | | Carlyle High Yield Partners Ltd., | |
| | 1,750,000 | | | Series 2006-8A-B | | | 1.00% | #^ | | | 05/21/2021 | | | | 1,696,134 | |
| | 24,751,061 | | | Series 2007-10A-A2A | | | 0.83% | #^ | | | 04/19/2022 | | | | 24,210,317 | |
| | | | | | |
| The accompanying notes are an integral part of these financial statements. | | Annual Report | | March 31, 2016 | | 17 |
| | |
| Schedule of Investments DoubleLine Total Return Bond Fund (Cont.) | | March 31, 2016 |
| | | | | | | | | | | | | | | | |
PRINCIPAL
AMOUNT $ | | | SECURITY DESCRIPTION | | RATE | | | MATURITY | | | VALUE $ | |
| |
| | | | Catamaran Ltd., | |
| | 8,500,000 | | | Series 2015-1A1-B | | | 2.82% | #^ | | | 04/22/2027 | | | | 8,230,396 | |
| | 47,000,000 | | | Series 2015-1A-A | | | 2.17% | #^ | | | 04/22/2027 | | | | 46,688,413 | |
| |
| | | | Cent Ltd., | |
| | 10,963,258 | | | Series 2006-11A-A1 | | | 0.88% | #^ | | | 04/25/2019 | | | | 10,835,697 | |
| | 1,661,905 | | | Series 2007-14A-A1 | | | 0.86% | #^ | | | 04/15/2021 | | | | 1,635,263 | |
| | 13,943,164 | | | Series 2007-14A-A2A | | | 0.85% | #^ | | | 04/15/2021 | | | | 13,652,934 | |
| | 11,000,000 | | | Series 2014-21A-A1A | | | 2.11% | #^ | | | 07/27/2026 | | | | 10,888,085 | |
| | 6,250,000 | | | Series 2014-22A-B | | | 3.82% | #^ | | | 11/07/2026 | | | | 6,151,414 | |
| | 7,250,000 | | | Series 2014-22A-C | | | 4.37% | #^ | | | 11/07/2026 | | | | 6,022,405 | |
| |
| | | | Covenant Credit Partners Ltd., | |
| | 5,000,000 | | | Series 2014-1A-A | | | 2.10% | #^ | | | 07/20/2026 | | | | 4,856,782 | |
| |
| | | | Crown Point Ltd., | |
| | 7,067,532 | | | Series 2012-1A-A1LB | | | 2.12% | #^ | | | 11/21/2022 | | | | 7,062,131 | |
| |
| | | | Dryden Leveraged Loan, | |
| | 5,000,000 | | | Series 2006-11A-C1 | | | 2.22% | #^ | | | 04/12/2020 | | | | 4,707,810 | |
| |
| | | | Dryden Senior Loan Fund, | |
| | 10,000,000 | | | Series 2012-25A-B1 | | | 2.87% | #^ | | | 01/15/2025 | | | | 9,974,243 | |
| |
| | | | Eaton Vance Ltd., | |
| | 12,348,302 | | | Series 2006-8A-A | | | 0.87% | #^ | | | 08/15/2022 | | | | 12,019,272 | |
| |
| | | | Flagship Ltd., | |
| | 25,000,000 | | | Series 2014-8A-A | | | 2.18% | #^ | | | 01/16/2026 | | | | 24,598,985 | |
| |
| | | | Flatiron Ltd., | |
| | 18,100,000 | | | Series 2013-1A-A1 | | | 2.02% | #^ | | | 01/17/2026 | | | | 17,778,745 | |
| | 6,750,000 | | | Series 2014-1A-C | | | 3.92% | #^ | | | 07/17/2026 | | | | 5,809,477 | |
| |
| | | | Fortress Credit Ltd., | |
| | 10,000,000 | | | Series 2013-1A-A | | | 1.80% | #^ | | | 01/19/2025 | | | | 9,805,821 | |
| | 10,000,000 | | | Series 2013-1A-B | | | 2.52% | #^ | | | 01/19/2025 | | | | 9,662,668 | |
| |
| | | | Galaxy Ltd., | |
| | 30,500,000 | | | Series 2013-15A-A | | | 1.87% | #^ | | | 04/15/2025 | | | | 30,203,003 | |
| | 15,000,000 | | | Series 2013-15A-B | | | 2.47% | #^ | | | 04/15/2025 | | | | 14,508,371 | |
| | 13,100,000 | | | Series 2013-15A-C | | | 3.22% | #^ | | | 04/15/2025 | | | | 12,708,723 | |
| | 6,125,000 | | | Series 2013-15A-D | | | 4.02% | #^ | | | 04/15/2025 | | | | 5,146,259 | |
| |
| | | | GLG Ore Hill Ltd., | |
| | 37,000,000 | | | Series 2013-1A-A | | | 1.74% | #^ | | | 07/15/2025 | | | | 36,046,532 | |
| |
| | | | GoldenTree Loan Opportunities Ltd., | |
| | 30,000,000 | | | Series 2014-9A-A | | | 2.13% | #^ | | | 10/29/2026 | | | | 30,026,751 | |
| |
| | | | Halcyon Loan Advisors Funding Ltd., | |
| | 6,500,000 | | | Series 2014-2A-C | | | 4.12% | #^ | | | 04/28/2025 | | | | 5,361,672 | |
| | 1,750,000 | | | Series 2014-2A-D | | | 5.62% | #^ | | | 04/28/2025 | | | | 941,769 | |
| | 5,000,000 | | | Series 2014-3A-D | | | 4.27% | #^ | | | 10/22/2025 | | | | 4,079,564 | |
| |
| | | | Harbourview Ltd., | |
| | 30,000,000 | | | Series 7A-A1 | | | 2.22% | #^ | | | 11/18/2026 | | | | 29,720,922 | |
| |
| | | | Hildene Ltd., | |
| | 25,000,000 | | | Series 2014-3A-A | | | 2.22% | #^ | | | 10/20/2026 | | | | 24,818,103 | |
| | 5,000,000 | | | Series 2015-4A-A1A | | | 2.12% | #^ | | | 07/23/2027 | | | | 4,922,125 | |
| |
| | | | ICE Global Credit Ltd., | |
| | 20,000,000 | | | Series 2013-1A-A1 | | | 2.37% | #^¥ | | | 04/20/2024 | | | | 18,802,440 | |
| | 15,000,000 | | | Series 2013-1A-B2 | | | 3.17% | #^¥ | | | 04/20/2024 | | | | 12,948,510 | |
| |
| | | | ING Ltd., | |
| | 5,000,000 | | | Series 2006-2A-A2 | | | 0.96% | #^ | | | 08/01/2020 | | | | 4,975,808 | |
| | 10,649,273 | | | Series 2007-5A-A1A | | | 0.85% | #^ | | | 05/01/2022 | | | | 10,502,608 | |
| | 9,284,420 | | | Series 2012-1RA-A1R | | | 1.83% | #^ | | | 03/14/2022 | | | | 9,261,259 | |
| | 10,500,000 | | | Series 2013-3A-A1 | | | 2.22% | # | | | 08/01/2020 | | | | 9,930,504 | |
| | 3,415,000 | | | Series 2013-3A-A1 | | | 2.07% | #^ | | | 01/18/2026 | | | | 3,368,053 | |
| | 4,250,000 | | | Series 2013-3A-B | | | 3.32% | #^ | | | 01/18/2026 | | | | 4,136,133 | |
| |
| | | | Jamestown Ltd., | |
| | 15,000,000 | | | Series 2012-1A-A1 | | | 2.05% | #^ | | | 11/05/2024 | | | | 14,963,688 | |
| | 50,000,000 | | | Series 2013-3A-A1A | | | 2.07% | #^ | | | 01/15/2026 | | | | 49,000,250 | |
| | 15,000,000 | | | Series 2014-4A-A1A | | | 2.12% | #^ | | | 07/15/2026 | | | | 14,524,950 | |
| | 28,750,000 | | | Series 2015-6A-A1A | | | 2.22% | #^ | | | 02/20/2027 | | | | 28,429,633 | |
| |
| | | | KKR Financial Corporation, | |
| | 6,345,360 | | | Series 2007-1A-A | | | 0.97% | #^ | | | 05/15/2021 | | | | 6,321,076 | |
| |
| | | | KVK Ltd., | |
| | 20,000,000 | | | Series 2013-1A-A | | | 2.02% | #^ | | | 04/14/2025 | | | | 19,793,942 | |
| | | | | | | | | | | | | | | | |
PRINCIPAL
AMOUNT $ | | | SECURITY DESCRIPTION | | RATE | | | MATURITY | | | VALUE $ | |
| |
| | | | Landmark Ltd., | |
| | 9,500,000 | | | Series 2006-8A-C | | | 1.37% | #^ | | | 10/19/2020 | | | | 9,134,070 | |
| |
| | | | LCM LP, | |
| | 3,650,000 | | | Series 11A-D2 | | | 4.57% | #^ | | | 04/19/2022 | | | | 3,528,136 | |
| | 12,600,000 | | | Series 13A-C | | | 3.52% | #^ | | | 01/19/2023 | | | | 12,410,814 | |
| | 7,825,000 | | | Series 14A-D | | | 4.12% | #^ | | | 07/15/2025 | | | | 7,081,769 | |
| | 21,000,000 | | | Series 16A-A | | | 2.12% | #^ | | | 07/15/2026 | | | | 20,960,963 | |
| | 2,750,000 | | | Series 16A-D | | | 4.22% | #^ | | | 07/15/2026 | | | | 2,425,194 | |
| |
| | | | Limerock Ltd., | |
| | 7,250,000 | | | Series 2014-2A-A | | | 2.12% | #^ | | | 04/18/2026 | | | | 7,218,219 | |
| | 25,000,000 | | | Series 2014-3A-A1 | | | 2.15% | #^ | | | 10/20/2026 | | | | 24,897,033 | |
| |
| | | | Madison Park Funding Ltd., | |
| | 4,289,999 | | | Series 2007-4A-A1A | | | 0.84% | #^ | | | 03/22/2021 | | | | 4,241,702 | |
| | 7,000,000 | | | Series 2007-4A-A1B | | | 0.92% | #^ | | | 03/22/2021 | | | | 6,798,939 | |
| | 4,000,000 | | | Series 2012-9A-AR | | | 1.91% | #^ | | | 08/15/2022 | | | | 3,997,544 | |
| | 3,000,000 | | | Series 2014-14A-C1 | | | 3.72% | #^ | | | 07/20/2026 | | | | 2,989,191 | |
| | 5,500,000 | | | Series 2014-15A-C | | | 4.32% | #^ | | | 01/27/2026 | | | | 4,867,759 | |
| |
| | | | Magnetite Ltd., | |
| | 19,250,000 | | | Series 2015-12A-A | | | 2.12% | #^ | | | 04/15/2027 | | | | 19,189,528 | |
| |
| | | | MAPS Fund Ltd., | |
| | 10,000,000 | | | Series 2007-2A-B | | | 1.52% | #^ | | | 07/20/2022 | | | | 9,416,486 | |
| |
| | | | Marathon Ltd., | |
| | 17,000,000 | | | Series 2013-5A-A2A | | | 2.97% | #^ | | | 02/21/2025 | | | | 16,675,140 | |
| |
| | | | Mountain Capital Ltd., | |
| | 821,226 | | | Series 2007-6A-A | | | 0.85% | #^ | | | 04/25/2019 | | | | 816,342 | |
| |
| | | | Mountain View Ltd., | |
| | 25,000,000 | | | Series 2007-3A-A2 | | | 0.96% | #^ | | | 04/16/2021 | | | | 24,580,565 | |
| |
| | | | Nautique Funding Ltd., | |
| | 4,416,786 | | | Series 2006-1A-A1A | | | 0.87% | #^ | | | 04/15/2020 | | | | 4,377,071 | |
| | 2,000,000 | | | Series 2006-1A-C | | | 2.32% | #^ | | | 04/15/2020 | | | | 1,862,073 | |
| |
| | | | Nomad Ltd., | |
| | 9,000,000 | | | Series 2013-1A-B | | | 3.57% | #^ | | | 01/15/2025 | | | | 8,393,303 | |
| | 3,500,000 | | | Series 2013-1A-C | | | 4.12% | #^ | | | 01/15/2025 | | | | 2,966,213 | |
| |
| | | | Northwoods Capital Corporation, | |
| | 30,000,000 | | | Series 2012-9A-A | | | 2.04% | #^ | | | 01/18/2024 | | | | 29,850,183 | |
| | 16,660,000 | | | Series 2013-10-A1 | | | 2.02% | #^ | | | 11/04/2025 | | | | 16,260,205 | |
| |
| | | | NYLIM Flatiron Ltd., | |
| | 3,846,089 | | | Series 2006-1A-A2A | | | 0.84% | #^ | | | 08/08/2020 | | | | 3,828,712 | |
| | 10,000,000 | | | Series 2006-1A-A2B | | | 0.94% | #^ | | | 08/08/2020 | | | | 9,839,420 | |
| |
| | | | Oak Hill Credit Partners, | |
| | 29,000,000 | | | Series 2012-7A-A | | | 2.04% | #^ | | | 11/20/2023 | | | | 28,914,966 | |
| | 18,000,000 | | | Series 2012-7A-B1 | | | 2.87% | #^ | | | 11/20/2023 | | | | 17,887,347 | |
| |
| | | | Ocean Trails, | |
| | 50,000,000 | | | Series 2014-5A-A2 | | | 2.28% | #^ | | | 10/13/2026 | | | | 49,600,975 | |
| |
| | | | OCP Ltd., | |
| | 8,299,661 | | | Series 2012-2A-A2 | | | 2.10% | #^ | | | 11/22/2023 | | | | 8,321,817 | |
| | 462,162 | | | Series 2012-2A-X2 | | | 2.10% | #^ | | | 11/22/2023 | | | | 462,653 | |
| | 10,000,000 | | | Series 2013-3A-B | | | 3.37% | #^ | | | 01/17/2025 | | | | 9,568,680 | |
| |
| | | | Octagon Investment Partners Ltd., | |
| | 20,000,000 | | | Series 2013-1A-A | | | 1.91% | #^ | | | 01/19/2025 | | | | 19,756,900 | |
| | 3,500,000 | | | Series 2014-1A-A | | | 2.14% | #^ | | | 04/15/2026 | | | | 3,478,118 | |
| | 15,000,000 | | | Series 2014-1A-A | | | 2.06% | #^ | | | 08/12/2026 | | | | 14,897,925 | |
| | 13,500,000 | | | Series 2014-1A-B | | | 3.82% | #^ | | | 11/14/2026 | | | | 13,257,586 | |
| | 5,500,000 | | | Series 2014-1A-C | | | 4.27% | #^ | | | 11/14/2026 | | | | 4,852,304 | |
| | 1,500,000 | | | Series 2014-1A-C2 | | | 4.12% | #^ | | | 11/25/2025 | | | | 1,498,694 | |
| |
| | | | OZLM Funding Ltd., | |
| | 9,000,000 | | | Series 2013-5A-A1 | | | 2.12% | #^ | | | 01/17/2026 | | | | 8,950,753 | |
| |
| | | | OZLM Ltd., | |
| | 6,700,000 | | | Series 2014-6A-A1 | | | 2.17% | #^ | | | 04/17/2026 | | | | 6,681,821 | |
| | 25,000,000 | | | Series 2014-9A-A1 | | | 2.20% | #^ | | | 01/20/2027 | | | | 24,938,748 | |
| | 38,500,000 | | | Series 2015-11A-A1A | | | 2.17% | #^ | | | 01/30/2027 | | | | 38,358,697 | |
| | 5,000,000 | | | Series 2015-11A-A2A | | | 2.87% | #^ | | | 01/30/2027 | | | | 4,816,026 | |
| |
| | | | Prospect Park Ltd., | |
| | 4,060,211 | | | Series 2006-1A-A | | | 0.87% | #^ | | | 07/15/2020 | | | | 4,039,396 | |
| |
| | | | Race Point Ltd., | |
| | 30,000,000 | | | Series 2012-7A-A | | | 2.04% | #^ | | | 11/08/2024 | | | | 29,835,168 | |
| | | | | | |
| 18 | | DoubleLine Funds Trust | | | | The accompanying notes are an integral part of these financial statements. |
| | | | | | | | | | | | | | | | |
PRINCIPAL
AMOUNT $ | | | SECURITY DESCRIPTION | | RATE | | | MATURITY | | | VALUE $ | |
| |
| | | | Race Point Ltd., (Cont.) | |
| | 24,000,000 | | | Series 2012-7A-B | | | 2.87% | #^ | | | 11/08/2024 | | | | 23,829,910 | |
| | 5,500,000 | | | Series 2013-8A-B | | | 2.52% | #^ | | | 02/20/2025 | | | | 5,312,380 | |
| |
| | | | Regatta Funding Ltd., | |
| | 30,000,000 | | | Series 2014-1A-A1A | | | 2.18% | #^ | | | 10/25/2026 | | | | 29,674,611 | |
| |
| | | | Saturn Ltd., | |
| | 3,200,000 | | | Series 2007-1A-D | | | 4.62% | #^ | | | 05/13/2022 | | | | 2,994,895 | |
| |
| | | | Silverado Ltd., | |
| | 1,375,012 | | | Series 2006-2A-A1 | | | 0.86% | #^ | | | 10/16/2020 | | | | 1,353,529 | |
| |
| | | | Sound Harbor Loan Fund Ltd., | |
| | 25,000,000 | | | Series 2014-1A-A1 | | | 2.12% | #^ | | | 10/30/2026 | | | | 24,813,138 | |
| |
| | | | Steele Creek Ltd., | |
| | 22,000,000 | | | Series 2014-1A-A1 | | | 2.22% | #^ | | | 08/21/2026 | | | | 21,720,193 | |
| |
| | | | Symphony Ltd., | |
| | 7,880,000 | | | Series 2010-10A-AR | | | 1.89% | #^ | | | 07/23/2023 | | | | 7,880,233 | |
| | 29,500,000 | | | Series 2013-11A-B1 | | | 2.82% | #^ | | | 01/17/2025 | | | | 28,966,318 | |
| | 10,250,000 | | | Series 2013-11A-C | | | 3.77% | #^ | | | 01/17/2025 | | | | 10,227,584 | |
| |
| | | | Thacher Park Ltd., | |
| | 2,000,000 | | | Series 2014-1A-C | | | 3.67% | #^ | | | 10/20/2026 | | | | 1,980,518 | |
| | 4,500,000 | | | Series 2014-1A-D1 | | | 4.15% | #^ | | | 10/20/2026 | | | | 3,954,033 | |
| |
| | | | Venture Ltd., | |
| | 11,431,872 | | | Series 2006-1A-A1 | | | 0.86% | #^ | | | 08/03/2020 | | | | 11,284,722 | |
| | 6,037,819 | | | Series 2007-8A-A2A | | | 0.84% | #^ | | | 07/22/2021 | | | | 5,901,864 | |
| | 24,500,000 | | | Series 2014-17A-A | | | 2.10% | #^ | | | 07/15/2026 | | | | 24,339,525 | |
| | 3,500,000 | | | Series 2014-17A-B2 | | | 2.72% | #^ | | | 07/15/2026 | | | | 3,326,917 | |
| |
| | | | Voya Ltd., | |
| | 28,000,000 | | | Series 2014-4A-A1 | | | 2.12% | #^ | | | 10/14/2026 | | | | 27,825,031 | |
| |
| | | | Washington Mill Ltd., | |
| | 56,500,000 | | | Series 2014-1A-A1 | | | 2.12% | #^ | | | 04/20/2026 | | | | 55,746,928 | |
| | 5,000,000 | | | Series 2014-1A-B1 | | | 2.67% | #^ | | | 04/20/2026 | | | | 4,806,846 | |
| | 4,750,000 | | | Series 2014-1A-C | | | 3.62% | #^ | | | 04/20/2026 | | | | 4,547,114 | |
| |
| | | | Wellfleet Ltd., | |
| | 2,000,000 | | | Series 2016-1A-X | | | 1.63% | #^ | | | 04/20/2028 | | | | 2,000,000 | |
| |
| | | | Westwood Ltd., | |
| | 19,425,446 | | | Series 2006-1X-A1 | | | 0.87% | # | | | 03/25/2021 | | | | 19,122,597 | |
| | 13,861,834 | | | Series 2007-2A-A1 | | | 0.84% | #^ | | | 04/25/2022 | | | | 13,572,069 | |
| |
| | | | WhiteHorse Ltd., | |
| | 50,000,000 | | | Series 2012-1A-A1L | | | 2.01% | #^ | | | 02/03/2025 | | | | 49,703,825 | |
| |
| | | | Wind River Ltd., | |
| | 59,000,000 | | | Series 2012-1A-A | | | 2.02% | #^ | | | 01/15/2024 | | | | 58,743,545 | |
| | 18,000,000 | | | Series 2012-1A-B1 | | | 2.72% | #^ | | | 01/15/2024 | | | | 17,753,002 | |
| | 13,750,000 | | | Series 2012-1A-C1 | | | 3.67% | #^ | | | 01/15/2024 | | | | 13,451,705 | |
| | 19,000,000 | | | Series 2014-1A-A | | | 2.14% | #^ | | | 04/18/2026 | | | | 18,800,886 | |
| |
| | | | Zais Ltd., | |
| | 30,000,000 | | | Series 2014-2A-A1A | | | 2.12% | #^ | | | 07/25/2026 | | | | 29,514,114 | |
| | | | | | | | | | | | | | | | |
| | | | Total Collateralized Loan Obligations
(Cost $2,676,240,482) | | | | 2,645,554,600 | |
| | | | | | | | | | | | | | | | |
| | NON-AGENCY COMMERCIAL MORTGAGE BACKED OBLIGATIONS 7.2% | |
| |
| | | | BAMLL Commercial Mortgage Securities Trust, | |
| | 10,150,000 | | | Series 2011-07C1-A3B | | | 5.38% | ^ | | | 12/15/2016 | | | | 10,255,267 | |
| | 8,350,000 | | | Series 2014-IP-E | | | 2.72% | #^ | | | 06/15/2028 | | | | 8,195,178 | |
| |
| | | | Banc of America Commercial Mortgage Trust, | |
| | 19,741,000 | | | Series 2006-4-AM | | | 5.68% | | | | 07/10/2046 | | | | 19,813,141 | |
| | 5,038,000 | | | Series 2006-6-AM | | | 5.39% | | | | 10/10/2045 | | | | 5,102,584 | |
| | 27,685,000 | | | Series 2007-1-AMFX | | | 5.48% | # | | | 01/15/2049 | | | | 28,006,295 | |
| | 11,700,000 | | | Series 2007-2-AM | | | 5.62% | # | | | 04/10/2049 | | | | 11,973,995 | |
| | 59,298,515 | | | Series 2007-5-AM | | | 5.77% | # | | | 02/10/2051 | | | | 61,233,983 | |
| | 222,023,331 | | | Series 2007-5-XW | | | 0.34% | # I/O ^ | | | 02/10/2051 | | | | 1,042,200 | |
| | 4,000,000 | | | Series 2015-UBS7-B | | | 4.37% | # | | | 09/15/2048 | | | | 4,213,443 | |
| | 60,442,798 | | | Series 2015-UBS7-XA | | | 0.94% | # I/O | | | 09/15/2048 | | | | 3,757,723 | |
| |
| | | | BBCMS Trust, | |
| | 27,365,000 | | | Series 2015-STP-D | | | 4.28% | #^ | | | 09/10/2028 | | | | 26,906,031 | |
| |
| | | | Bear Stearns Commercial Mortgage Securities, Inc., | |
| | 8,809,628 | | | Series 2006-PW13-A4 | | | 5.54% | | | | 09/11/2041 | | | | 8,836,684 | |
| | | | | | | | | | | | | | | | |
PRINCIPAL
AMOUNT $ | | | SECURITY DESCRIPTION | | RATE | | | MATURITY | | | VALUE $ | |
| |
| | | | Bear Stearns Commercial Mortgage Securities, Inc., (Cont.) | |
| | 4,848,000 | | | Series 2006-PW13-AJ | | | 5.61% | # | | | 09/11/2041 | | | | 4,827,256 | |
| | 19,225,000 | | | Series 2006-PW14-AM | | | 5.24% | | | | 12/11/2038 | | | | 19,459,199 | |
| | 7,180,000 | | | Series 2007-PW15-AM | | | 5.36% | | | | 02/11/2044 | | | | 7,262,754 | |
| | 28,000,000 | | | Series 2007-PW16-AM | | | 5.72% | # | | | 06/11/2040 | | | | 28,844,133 | |
| | 12,815,000 | | | Series 2007-PW17-AMFL | | | 1.13% | #^ | | | 06/11/2050 | | | | 12,290,080 | |
| | 4,500,000 | | | Series 2007-T26-AJ | | | 5.57% | # | | | 01/12/2045 | | | | 4,432,947 | |
| |
| | | | Boca Hotel Portfolio Trust, | |
| | 9,500,000 | | | Series 2013-BOCA-E | | | 4.19% | #^ | | | 08/15/2026 | | | | 9,484,196 | |
| |
| | | | CD Commercial Mortgage Trust, | |
| | 7,775,017 | | | Series 2006-CD2-AM | | | 5.39% | # | | | 01/15/2046 | | | | 7,765,753 | |
| | 99,887,000 | | | Series 2007-CD4-AMFX | | | 5.37% | # | | | 12/11/2049 | | | | 101,604,617 | |
| |
| | | | CDGJ Commercial Mortgage Trust, | |
| | 33,200,000 | | | Series 2014-BXCH-B | | | 2.29% | #^ | | | 12/15/2027 | | | | 32,441,506 | |
| |
| | | | CGGS Commercial Mortgage Trust, | |
| | 6,567,000 | | | Series 2016-RNDB-AFL | | | 2.10% | #^ | | | 02/15/2033 | | | | 6,575,232 | |
| |
| | | | Citigroup Commercial Mortgage Trust, | |
| | 28,847,000 | | | Series 2007-C6-AM | | | 5.70% | # | | | 12/10/2049 | | | | 29,171,503 | |
| | 7,020,000 | | | Series 2007-C6-AMFX | | | 5.70% | #^ | | | 12/10/2049 | | | | 7,099,426 | |
| | 11,250,000 | | | Series 2008-C7-AM | | | 6.14% | # | | | 12/10/2049 | | | | 11,493,724 | |
| | 291,814,578 | | | Series 2012-GC8-XA | | | 2.16% | # I/O ^ | | | 09/10/2045 | | | | 22,343,746 | |
| | 9,011,000 | | | Series 2014-GC25-A4 | | | 3.64% | | | | 10/10/2047 | | | | 9,546,437 | |
| | 198,494,312 | | | Series 2014-GC25-XA | | | 1.09% | # I/O | | | 10/10/2047 | | | | 13,343,899 | |
| | 50,000,000 | | | Series 2015-GC27-A5 | | | 3.14% | | | | 02/10/2048 | | | | 51,075,920 | |
| | 6,265,000 | | | Series 2015-GC27-B | | | 3.77% | | | | 02/10/2048 | | | | 6,068,812 | |
| | 8,216,000 | | | Series 2015-GC27-D | | | 4.43% | #^ | | | 02/10/2048 | | | | 6,314,337 | |
| | 222,720,984 | | | Series 2015-GC27-XA | | | 1.44% | # I/O | | | 02/10/2048 | | | | 20,596,301 | |
| | 14,310,000 | | | Series 2015-GC33-C | | | 4.57% | # | | | 09/10/2058 | | | | 13,087,656 | |
| | 180,642,133 | | | Series 2015-GC33-XA | | | 0.99% | # I/O | | | 09/10/2058 | | | | 12,126,434 | |
| | 20,725,000 | | | Series 2015-GC35-C | | | 4.65% | | | | 11/10/2048 | | | | 19,356,479 | |
| | 221,254,571 | | | Series 2016-GC36-XA | | | 1.36% | # I/O | | | 02/10/2049 | | | | 20,914,818 | |
| | 114,932,000 | | | Series 2016-P3-XA | | | 1.72% | # I/O | | | 04/15/2049 | | | | 13,760,935 | |
| |
| | | | COBALT Commercial Mortgage Trust, | |
| | 3,809,000 | | | Series 2006-C1-AM | | | 5.25% | | | | 08/15/2048 | | | | 3,785,663 | |
| | 17,400,000 | | | Series 2007-C2-AJFX | | | 5.57% | # | | | 04/15/2047 | | | | 17,003,012 | |
| | 22,750,000 | | | Series 2007-C2-AMFX | | | 5.53% | # | | | 04/15/2047 | | | | 23,439,134 | |
| |
| | | | Colony Mortgage Capital Ltd., | |
| | 7,591,000 | | | Series 2015-FL3-A | | | 2.39% | #^ | | | 09/05/2032 | | | | 7,569,730 | |
| |
| | | | Commercial Mortgage Pass-Through Certificates, | |
| | 148,613,648 | | | Series 2002-LC4-XA | | | 2.38% | # I/O ^ | | | 12/10/2044 | | | | 13,507,361 | |
| | 8,494,191 | | | Series 2007-C9-AJFL | | | 1.13% | #^ | | | 12/10/2049 | | | | 7,942,150 | |
| | 35,690,600 | | | Series 2012-CR2-XA | | | 1.75% | # I/O | | | 08/15/2045 | | | | 3,001,069 | |
| | 179,600,542 | | | Series 2012-CR3-XA | | | 2.10% | # I/O | | | 10/15/2045 | | | | 15,771,047 | |
| | 182,153,061 | | | Series 2013-CR10-XA | | | 0.96% | # I/O | | | 08/10/2046 | | | | 7,737,042 | |
| | 9,850,000 | | | Series 2014-CR19-C | | | 4.72% | # | | | 08/10/2047 | | | | 9,828,848 | |
| | 5,211,000 | | | Series 2014-CR20-A4 | | | 3.59% | | | | 11/10/2047 | | | | 5,563,296 | |
| | 30,400,000 | | | Series 2014-CR20-C | | | 4.51% | # | | | 11/10/2047 | | | | 30,227,024 | |
| | 71,378,000 | | | Series 2014-CR21-A3 | | | 3.53% | | | | 12/10/2047 | | | | 75,935,257 | |
| | 26,910,000 | | | Series 2014-KYO-E | | | 2.79% | #^ | | | 06/11/2027 | | | | 26,391,439 | |
| | 14,529,240 | | | Series 2014-KYO-F | | | 3.94% | #^ | | | 06/11/2027 | | | | 14,402,532 | |
| | 15,011,000 | | | Series 2014-UBS3-A4 | | | 3.82% | | | | 06/10/2047 | | | | 16,174,498 | |
| | 20,970,000 | | | Series 2015-CR22-D | | | 4.13% | #^ | | | 03/10/2048 | | | | 15,692,019 | |
| | 225,201,801 | | | Series 2015-CR22-XA | | | 1.03% | # I/O | | | 03/10/2048 | | | | 13,738,999 | |
| | 9,230,000 | | | Series 2015-CR23-D | | | 4.26% | # | | | 05/10/2048 | | | | 6,873,245 | |
| | 9,110,000 | | | Series 2015-CR26-B | | | 4.50% | # | | | 10/10/2048 | | | | 9,385,260 | |
| | 91,695,774 | | | Series 2015-CR26-XA | | | 1.07% | # I/O | | | 10/10/2048 | | | | 6,524,329 | |
| | 50,000,000 | | | Series 2015-DC1-A5 | | | 3.35% | | | | 02/10/2048 | | | | 52,157,800 | |
| | 8,715,000 | | | Series 2015-DC1-C | | | 4.35% | # | | | 02/10/2048 | | | | 8,514,295 | |
| | 13,275,000 | | | Series 2015-DC1-D | | | 4.35% | #^ | | | 02/10/2048 | | | | 10,074,614 | |
| | 409,643,811 | | | Series 2015-DC1-XA | | | 1.18% | # I/O | | | 02/10/2048 | | | | 28,410,314 | |
| | 35,000,000 | | | Series 2015-LC19-A4 | | | 3.18% | | | | 02/10/2048 | | | | 36,279,460 | |
| | 29,922,000 | | | Series 2016-CR28-C | | | 4.65% | # | | | 02/10/2049 | | | | 29,528,403 | |
| |
| | | | Core Industrial Trust Commercial Mortgage Pass-Through Certificates, | |
| | 8,215,000 | | | Series 2015-CALW-D | | | 3.85% | #^ | | | 02/10/2034 | | | | 8,065,961 | |
| |
| | | | Countrywide Commercial Mortgage Trust, | |
| | 24,012,548 | | | Series 2007-MF1-A | | | 6.07% | #^ | | | 11/12/2043 | | | | 24,783,520 | |
| |
| | | | Credit Suisse First Boston Mortgage Securities Corporation, | |
| | 1,002,613 | | | Series 1998-C2-F | | | 6.75% | #^ | | | 11/15/2030 | | | | 1,009,916 | |
| | 29,551 | | | Series 2001-CF2-G | | | 6.93% | ^ | | | 02/15/2034 | | | | 29,446 | |
| | | | | | |
| The accompanying notes are an integral part of these financial statements. | | Annual Report | | March 31, 2016 | | 19 |
| | |
| Schedule of Investments DoubleLine Total Return Bond Fund (Cont.) | | March 31, 2016 |
| | | | | | | | | | | | | | | | |
PRINCIPAL
AMOUNT $ | | | SECURITY DESCRIPTION | | RATE | | | MATURITY | | | VALUE $ | |
| |
| | | | Credit Suisse Mortgage Capital Certificates, | |
| | 4,558,000 | | | Series 2006-C3-AM | | | 6.14% | # | | | 06/15/2038 | | | | 4,569,178 | |
| | 19,881,000 | | | Series 2006-C4-AM | | | 5.51% | | | | 09/15/2039 | | | | 20,054,154 | |
| | 51,221,320 | | | Series 2006-C5-AM | | | 5.34% | | | | 12/15/2039 | | | | 51,850,318 | |
| | 5,164,000 | | | Series 2007-C2-AM | | | 5.59% | # | | | 01/15/2049 | | | | 5,287,380 | |
| | 38,067,000 | | | Series 2007-C4-A1AM | | | 5.94% | # | | | 09/15/2039 | | | | 38,097,134 | |
| | 3,981,919 | | | Series 2007-C5-A4 | | | 5.70% | # | | | 09/15/2040 | | | | 4,109,468 | |
| | 16,900,000 | | | Series 2009-RR2-IQB | | | 5.69% | #^ | | | 04/16/2049 | | | | 17,201,946 | |
| | 8,800,000 | | | Series 2010-RR1-1B | | | 5.69% | #^ | | | 04/16/2049 | | | | 9,014,667 | |
| | 5,150,000 | | | Series 2010-RR2-3B | | | 5.34% | #^ | | | 12/15/2043 | | | | 5,250,589 | |
| | 10,000,000 | | | Series 2010-RR5-2B | | | 5.34% | #^ | | | 12/16/2043 | | | | 10,235,578 | |
| | 150,822,000 | | | Series 2014-USA-X1 | | | 0.55% | # I/O ^ | | | 09/15/2037 | | | | 6,505,549 | |
| |
| | | | CSAIL Commercial Mortgage Trust, | |
| | 4,606,000 | | | Series 2015-C1-C | | | 4.30% | # | | | 04/15/2050 | | | | 4,348,152 | |
| | 13,360,000 | | | Series 2015-C2-AS | | | 3.85% | | | | 06/15/2057 | | | | 14,106,199 | |
| | 22,320,000 | | | Series 2015-C3-C | | | 4.36% | # | | | 08/15/2048 | | | | 19,955,098 | |
| | 9,759,000 | | | Series 2015-C4-C | | | 4.59% | # | | | 11/15/2048 | | | | 9,190,248 | |
| | 321,567,903 | | | Series 2015-C4-XA | | | 0.96% | # I/O | | | 11/15/2048 | | | | 20,173,241 | |
| |
| | | | DBRR Trust, | |
| | 14,554,963 | | | Series 2011-C32-A3B | | | 5.70% | #^ | | | 06/17/2049 | | | | 14,895,599 | |
| |
| | | | DBUBS Mortgage Trust, | |
| | 166,397,215 | | | Series 2011-LC2A-XA | | | 1.36% | # I/O ^ | | | 07/10/2044 | | | | 5,765,347 | |
| |
| | | | GE Commercial Mortgage Corporation Trust, | |
| | 11,417,000 | | | Series 2007-C1-AM | | | 5.61% | # | | | 12/10/2049 | | | | 11,308,637 | |
| |
| | | | Greenwich Capital Commercial Funding Corporation, | |
| | 12,765,000 | | | Series 2006-GG7-AM | | | 5.89% | # | | | 07/10/2038 | | | | 12,793,951 | |
| | 35,860,000 | | | Series 2007-GG11-AJ | | | 6.03% | # | | | 12/10/2049 | | | | 35,345,341 | |
| | 20,167,000 | | | Series 2007-GG11-AM | | | 5.87% | # | | | 12/10/2049 | | | | 20,751,657 | |
| | 55,894,500 | | | Series 2007-GG9-AM | | | 5.48% | | | | 03/10/2039 | | | | 56,762,665 | |
| | 21,460,000 | | | Series 2007-GG9-AMFX | | | 5.48% | | | | 03/10/2039 | | | | 21,814,360 | |
| |
| | | | GS Mortgage Securities Corporation, | |
| | 4,992,592 | | | Series 2006-GG6-XC | | | 0.00% | # I/O ^ | | | 04/10/2038 | | | | 50 | |
| | 58,968,900 | | | Series 2006-GG8-AJ | | | 5.62% | | | | 11/10/2039 | | | | 54,502,006 | |
| | 25,000,000 | | | Series 2006-GG8-AM | | | 5.59% | | | | 11/10/2039 | | | | 25,339,230 | |
| | 14,534,394 | | | Series 2007-GG10-A4 | | | 5.79% | # | | | 08/10/2045 | | | | 14,988,428 | |
| | 21,083,141 | | | Series 2011-GC3-X | | | 0.70% | # I/O ^ | | | 03/10/2044 | | | | 561,256 | |
| | 109,600,700 | | | Series 2012-GC6-XA | | | 2.05% | # I/O ^ | | | 01/10/2045 | | | | 9,274,324 | |
| | 330,228 | | | Series 2012-GCJ7-A1 | | | 1.14% | | | | 05/10/2045 | | | | 330,112 | |
| | 27,857,276 | | | Series 2013-GC10-XA | | | 1.61% | # I/O | | | 02/10/2046 | | | | 2,242,079 | |
| | 43,133,096 | | | Series 2014-GC20-XA | | | 1.18% | # I/O | | | 04/10/2047 | | | | 2,666,078 | |
| | 60,850,000 | | | Series 2014-GC26-A5 | | | 3.63% | | | | 11/10/2047 | | | | 64,538,118 | |
| | 35,000,000 | | | Series 2015-GC28-A5 | | | 3.40% | | | | 02/10/2048 | | | | 36,441,286 | |
| | 290,859,428 | | | Series 2015-GC28-XA | | | 1.17% | # I/O | | | 02/10/2048 | | | | 19,575,741 | |
| | 255,139,163 | | | Series 2015-GC32-XA | | | 0.90% | # I/O | | | 07/10/2048 | | | | 13,999,282 | |
| | 175,951,956 | | | Series 2015-GC34-XA | | | 1.38% | # I/O | | | 10/10/2048 | | | | 16,079,880 | |
| | 69,701,102 | | | Series 2015-GS1-XA | | | 0.84% | # I/O | | | 11/10/2048 | | | | 4,244,923 | |
| |
| | | | JP Morgan Chase Commercial Mortgage Securities Corporation, | |
| | 5,132,777 | | | Series 2004-CBX-X1 | | | 0.47% | # I/O ^ | | | 01/12/2037 | | | | 20,351 | |
| | 130,544 | | | Series 2004-LN2-A2 | | | 5.12% | | | | 07/15/2041 | | | | 130,722 | |
| | 8,561,745 | | | Series 2005-CIBC12-AJ | | | 4.99% | # | | | 09/12/2037 | | | | 8,580,388 | |
| | 6,640,921 | | | Series 2005-LDP4-X1 | | | 0.20% | # I/O ^ | | | 10/15/2042 | | | | 4,263 | |
| | 9,704,000 | | | Series 2006-LDP7-AM | | | 5.94% | # | | | 04/17/2045 | | | | 9,718,824 | |
| | 83,793,844 | | | Series 2006-LDP8-X | | | 0.53% | # I/O | | | 05/15/2045 | | | | 113,331 | |
| | 49,615,685 | | | Series 2006-LDP9-AM | | | 5.37% | | | | 05/15/2047 | | | | 49,850,238 | |
| | 13,098,000 | | | Series 2007-C1-AM | | | 5.94% | # | | | 02/15/2051 | | | | 13,328,551 | |
| | 2,326,790 | | | Series 2007-C1-ASB | | | 5.86% | | | | 02/15/2051 | | | | 2,363,340 | |
| | 24,000,000 | | | Series 2007-CB18-AMFX | | | 5.40% | | | | 06/12/2047 | | | | 24,433,632 | |
| | 157,082,756 | | | Series 2007-CB18-X | | | 0.26% | # I/O | | | 06/12/2047 | | | | 259,406 | |
| | 22,680,000 | | | Series 2007-CB20-AM | | | 5.88% | # | | | 02/12/2051 | | | | 23,734,845 | |
| | 979,250,534 | | | Series 2007-CB20-X1 | | | 0.31% | # I/O ^ | | | 02/12/2051 | | | | 3,931,691 | |
| | 24,600,399 | | | Series 2007-CIBC18-AM | | | 5.47% | # | | | 06/12/2047 | | | | 24,957,447 | |
| | 22,100,000 | | | Series 2007-CIBC19-AM | | | 5.70% | # | | | 02/12/2049 | | | | 22,581,479 | |
| | 35,539,000 | | | Series 2007-CIBC20-AJ | | | 6.08% | # | | | 02/12/2051 | | | | 34,657,583 | |
| | 51,440,330 | | | Series 2007-LD12-AM | | | 6.01% | # | | | 02/15/2051 | | | | 53,675,865 | |
| | 11,336,000 | | | Series 2009-RR2-GEB | | | 5.54% | ^ | | | 12/13/2049 | | | | 11,588,394 | |
| | 748,978 | | | Series 2011-PLSD-A1 | | | 2.19% | ^ | | | 11/13/2028 | | | | 750,874 | |
| | 209,978,853 | | | Series 2012-C6-XA | | | 1.84% | # I/O | | | 05/15/2045 | | | | 14,771,634 | |
| | 447,341,736 | | | Series 2012-C8-XA | | | 2.04% | # I/O | | | 10/15/2045 | | | | 35,738,981 | |
| | 148,746,409 | | | Series 2012-CBX-XA | | | 1.70% | # I/O | | | 06/15/2045 | | | | 9,328,824 | |
| | 5,425,000 | | | Series 2014-DSTY-A | | | 3.43% | ^ | | | 06/10/2027 | | | | 5,628,032 | |
| | 6,725,000 | | | Series 2014-INN-C | | | 2.14% | #^ | | | 06/15/2029 | | | | 6,442,550 | |
| | | | | | | | | | | | | | | | |
PRINCIPAL
AMOUNT $ | | | SECURITY DESCRIPTION | | RATE | | | MATURITY | | | VALUE $ | |
| |
| | | | JP Morgan Chase Commercial Mortgage Securities Corporation, (Cont.) | |
| | 7,250,000 | | | Series 2014-INN-D | | | 2.79% | #^ | | | 06/15/2029 | | | | 6,852,452 | |
| | 24,200,000 | | | Series 2014-PHH-D | | | 2.84% | #^ | | | 08/15/2027 | | | | 23,956,018 | |
| | 14,406,000 | | | Series 2014-PHH-E | | | 3.74% | #^ | | | 08/15/2027 | | | | 14,270,347 | |
| | 7,595,000 | | | Series 2015-CSMO-C | | | 2.69% | #^ | | | 01/15/2032 | | | | 7,409,018 | |
| | 80,776,606 | | | Series 2015-JP1-XA | | | 1.16% | # I/O | | | 01/15/2049 | | | | 5,590,040 | |
| | 39,057,000 | | | Series 2007-LD11-AM | | | 5.74% | # | | | 06/15/2049 | | | | 38,686,318 | |
| | 18,654,402 | | | Series 2008-C2-A4 | | | 6.07% | | | | 02/12/2051 | | | | 19,459,401 | |
| |
| | | | JPMBB Commercial Mortgage Securities Trust, | |
| | 107,097,895 | | | Series 2014-C18-XA | | | 1.13% | # I/O | | | 02/15/2047 | | | | 5,765,230 | |
| | 3,396,000 | | | Series 2014-C21-C | | | 4.66% | # | | | 08/15/2047 | | | | 3,343,124 | |
| | 222,150,077 | | | Series 2014-C25-XA | | | 1.01% | # I/O | | | 11/15/2047 | | | | 12,843,696 | |
| | 32,031,000 | | | Series 2014-C26-A4 | | | 3.49% | | | | 01/15/2048 | | | | 33,905,140 | |
| | 6,499,000 | | | Series 2014-C26-C | | | 4.43% | # | | | 01/15/2048 | | | | 6,383,221 | |
| | 257,218,561 | | | Series 2014-C26-XA | | | 1.18% | # I/O | | | 01/15/2048 | | | | 16,296,468 | |
| | 14,055,000 | | | Series 2015-C27-C | | | 4.34% | # | | | 02/15/2048 | | | | 13,004,886 | |
| | 10,425,000 | | | Series 2015-C27-D | | | 3.84% | #^ | | | 02/15/2048 | | | | 7,513,548 | |
| | 59,249,499 | | | Series 2015-C27-XA | | | 1.38% | # I/O | | | 02/15/2048 | | | | 4,559,930 | |
| | 44,705,789 | | | Series 2015-C28-XA | | | 1.20% | # I/O | | | 10/15/2048 | | | | 3,053,325 | |
| | 64,970,391 | | | Series 2015-C29-XA | | | 0.96% | # I/O | | | 05/15/2048 | | | | 3,031,064 | |
| | 6,762,000 | | | Series 2015-C30-B | | | 4.31% | # | | | 07/15/2048 | | | | 6,562,719 | |
| | 174,417,200 | | | Series 2015-C30-XA | | | 0.72% | # I/O | | | 07/15/2048 | | | | 7,008,676 | |
| | 27,395,000 | | | Series 2015-C32-C | | | 4.67% | # | | | 11/15/2048 | | | | 24,639,657 | |
| | 101,444,193 | | | Series 2015-C32-XA | | | 1.53% | # I/O | | | 11/15/2048 | | | | 8,154,642 | |
| | 17,630,000 | | | Series 2015-C33-C | | | 4.62% | # | | | 12/15/2048 | | | | 16,320,523 | |
| | 32,345,000 | | | Series 2016-C1-C | | | 4.90% | # | | | 03/15/2049 | | | | 29,467,421 | |
| |
| | | | LB Commercial Mortgage Trust, | |
| | 23,169,000 | | | Series 2007-C3-AMB | | | 5.19% | | | | 07/15/2044 | | | | 23,765,129 | |
| | 7,550,000 | | | Series 2007-C3-AMFL | | | 5.90% | #^ | | | 07/15/2044 | | | | 7,803,964 | |
| |
| | | | LB-UBS Commercial Mortgage Trust, | |
| | 131,026,291 | | | Series 2006-C7-XCL | | | 0.67% | # I/O ^ | | | 11/15/2038 | | | | 433,278 | |
| | 63,149,000 | | | Series 2007-C1-AJ | | | 5.48% | | | | 02/15/2040 | | | | 63,079,814 | |
| | 38,308,952 | | | Series 2007-C1-AM | | | 5.46% | | | | 02/15/2040 | | | | 38,912,724 | |
| | 49,774,000 | | | Series 2007-C2-AM | | | 5.49% | # | | | 02/15/2040 | | | | 50,588,800 | |
| | 28,975,000 | | | Series 2007-C7-AJ | | | 6.24% | # | | | 09/15/2045 | | | | 28,379,882 | |
| |
| | | | Merrill Lynch Mortgage Investors Trust, | |
| | 121,818,118 | | | Series 1998-C1-IO | | | 0.61% | # I/O | | | 11/15/2026 | | | | 1,594,282 | |
| |
| | | | Merrill Lynch Mortgage Trust, | |
| | 9,757,000 | | | Series 2006-C1-AJ | | | 5.76% | # | | | 05/12/2039 | | | | 9,596,343 | |
| | 6,912,000 | | | Series 2006-C2-AJ | | | 5.80% | # | | | 08/12/2043 | | | | 6,798,915 | |
| | 56,203,000 | | | Series 2007-C1-AM | | | 5.84% | # | | | 06/12/2050 | | | | 55,043,397 | |
| |
| | | | Merrill Lynch/Countrywide Commercial Mortgage Trust, | |
| | 6,970,000 | | | Series 2006-4-AM | | | 5.20% | | | | 12/12/2049 | | | | 7,089,638 | |
| | 42,850,000 | | | Series 2007-5-AM | | | 5.42% | | | | 08/12/2048 | | | | 43,343,015 | |
| |
| | | | Morgan Stanley Bank of America Merrill Lynch Trust, | |
| | 212,491,977 | | | Series 2013-C12-XA | | | 0.96% | # I/O | | | 10/15/2046 | | | | 8,442,540 | |
| | 43,049,275 | | | Series 2013-C7-XA | | | 1.65% | # I/O | | | 02/15/2046 | | | | 2,977,856 | |
| | 11,700,000 | | | Series 2014-C18-C | | | 4.49% | | | | 10/15/2047 | | | | 11,570,243 | |
| | 45,025,000 | | | Series 2014-C19-A4 | | | 3.53% | | | | 12/15/2047 | | | | 47,625,617 | |
| | 37,950,000 | | | Series 2014-C19-C | | | 4.00% | | | | 12/15/2047 | | | | 33,926,799 | |
| | 56,050,000 | | | Series 2015-C20-A4 | | | 3.25% | | | | 02/15/2048 | | | | 58,056,842 | |
| | 20,087,700 | | | Series 2015-C20-B | | | 4.16% | | | | 02/15/2048 | | | | 20,560,390 | |
| | 6,457,500 | | | Series 2015-C20-C | | | 4.46% | # | | | 02/15/2048 | | | | 5,997,791 | |
| | 249,262,464 | | | Series 2015-C20-XA | | | 1.42% | # I/O | | | 02/15/2048 | | | | 21,220,112 | |
| | 10,616,000 | | | Series 2015-C23-C | | | 4.14% | # | | | 07/15/2050 | | | | 9,528,588 | |
| | 8,460,000 | | | Series 2015-C25-C | | | 4.53% | # | | | 10/15/2048 | | | | 7,998,912 | |
| | 19,422,000 | | | Series 2015-C27-C | | | 4.54% | # | | | 12/15/2047 | | | | 18,050,704 | |
| | 1,517,000 | | | Series 2015-C27-D | | | 3.24% | #^ | | | 12/15/2047 | | | | 999,962 | |
| | 176,651,371 | | | Series 2016-C28-XA | | | 1.30% | # I/O | | | 01/15/2049 | | | | 15,622,729 | |
| |
| | | | Morgan Stanley Capital, Inc., | |
| | 292,762,618 | | | Series 2006-HQ10-X1 | | | 0.50% | # I/O ^ | | | 11/12/2041 | | | | 227,184 | |
| | 5,016,119 | | | Series 2006-HQ8-AJ | | | 5.49% | # | | | 03/12/2044 | | | | 5,005,953 | |
| | 45,421,000 | | | Series 2007-HQ11-AJ | | | 5.51% | # | | | 02/12/2044 | | | | 44,695,763 | |
| | 4,372,000 | | | Series 2007-IQ13-AM | | | 5.41% | | | | 03/15/2044 | | | | 4,510,224 | |
| | 2,575,000 | | | Series 2014-CPT-E | | | 3.45% | #^ | | | 07/13/2029 | | | | 2,492,208 | |
| | 2,325,000 | | | Series 2014-CPT-F | | | 3.45% | #^ | | | 07/13/2029 | | | | 2,187,912 | |
| | 12,400,000 | | | Series 2014-MP-D | | | 3.69% | #^ | | | 08/11/2029 | | | | 12,434,064 | |
| | 11,000,000 | | | Series 2014-MP-E | | | 3.69% | #^ | | | 08/11/2029 | | | | 11,015,462 | |
| | 28,269,888 | | | Series 2015-UBS8-XA | | | 0.99% | # I/O | | | 12/15/2048 | | | | 1,968,670 | |
| | | | | | |
| 20 | | DoubleLine Funds Trust | | | | The accompanying notes are an integral part of these financial statements. |
| | | | | | | | | | | | | | | | |
PRINCIPAL
AMOUNT $ | | | SECURITY DESCRIPTION | | RATE | | | MATURITY | | | VALUE $ | |
| |
| | | | Morgan Stanley Re-Remic Trust, | |
| | 12,529,000 | | | Series 2009-GG10-A4B | | | 5.79% | #^ | | | 08/12/2045 | | | | 12,810,961 | |
| | 28,800,000 | | | Series 2010-GG10-A4B | | | 5.79% | #^ | | | 08/15/2045 | | | | 29,751,296 | |
| | 46,919,315 | | | Series 2013-AJ-AJA | | | 0.50% | ^ | | | 12/17/2049 | | | | 45,404,994 | |
| |
| | | | TIAA Seasoned Commercial Mortgage Trust, | |
| | 5,167,543 | | | Series 2007-C4-AJ | | | 5.53% | # | | | 08/15/2039 | | | | 5,192,314 | |
| |
| | | | UBS-Barclays Commercial Mortgage Trust, | |
| | 103,108,133 | | | Series 2012-C3-XA | | | 2.08% | # I/O ^ | | | 08/10/2049 | | | | 9,221,105 | |
| |
| | | | Wachovia Bank Commercial Mortgage Trust, | |
| | 73,901,401 | | | Series 2006-C28-AJ | | | 5.63% | # | | | 10/15/2048 | | | | 72,268,601 | |
| | 19,500,000 | | | Series 2006-C28-AM | | | 5.60% | # | | | 10/15/2048 | | | | 19,751,269 | |
| | 10,000,000 | | | Series 2007-30-AMFL | | | 0.64% | #^ | | | 12/15/2043 | | | | 9,482,939 | |
| | 75,061,000 | | | Series 2007-C30-AJ | | | 5.41% | # | | | 12/15/2043 | | | | 73,892,405 | |
| | 19,285,000 | | | Series 2007-C30-AM | | | 5.38% | | | | 12/15/2043 | | | | 19,639,094 | |
| | 5,000,000 | | | Series 2007-C31-AM | | | 5.59% | # | | | 04/15/2047 | | | | 5,127,717 | |
| | 8,565,000 | | | Series 2007-C32-AMFX | | | 5.70% | ^ | | | 06/15/2049 | | | | 8,762,485 | |
| | 50,726,700 | | | Series 2007-C33-AJ | | | 5.95% | # | | | 02/15/2051 | | | | 50,070,332 | |
| | 12,989,316 | | | Series 2007-C33-AM | | | 5.95% | # | | | 02/15/2051 | | | | 13,437,466 | |
| |
| | | | Waterfall Commercial Mortgage Trust, | |
| | 169,171,281 | | | Series 2015-SBC5-A | | | 4.10% | #^ | | | 09/14/2022 | | | | 167,014,415 | |
| |
| | | | Wells Fargo Commercial Mortgage Trust, | |
| | 38,265,000 | | | Series 2014-LC18-A5 | | | 3.41% | | | | 12/15/2047 | | | | 40,091,844 | |
| | 4,346,710 | | | Series 2014-LC18-B | | | 3.96% | | | | 12/15/2047 | | | | 4,476,917 | |
| | 30,000,000 | | | Series 2015-C26-A4 | | | 3.17% | | | | 02/15/2048 | | | | 30,875,370 | |
| | 11,460,000 | | | Series 2015-C26-C | | | 4.07% | # | | | 02/15/2048 | | | | 10,332,320 | |
| | 459,724,075 | | | Series 2015-C26-XA | | | 1.41% | # I/O | | | 02/15/2048 | | | | 37,719,901 | |
| | 28,000,000 | | | Series 2015-C27-A5 | | | 3.45% | | | | 02/15/2048 | | | | 29,434,213 | |
| | 266,851,286 | | | Series 2015-C27-XA | | | 1.00% | # I/O | | | 02/15/2048 | | | | 17,445,776 | |
| | 9,701,000 | | | Series 2015-C31-C | | | 4.61% | # | | | 11/15/2048 | | | | 9,305,670 | |
| | 145,192,820 | | | Series 2015-C31-XA | | | 1.12% | # I/O | | | 11/15/2048 | | | | 11,233,118 | |
| | 279,602,137 | | | Series 2015-LC20-XA | | | 1.40% | # I/O | | | 04/15/2050 | | | | 23,114,681 | |
| | 12,000,000 | | | Series 2015-LC22-C | | | 4.54% | # | | | 09/15/2058 | | | | 11,531,886 | |
| | 1,794,000 | | | Series 2015-NXS4-C | | | 4.60% | # | | | 12/15/2048 | | | | 1,722,405 | |
| | 5,405,000 | | | Series 2015-P2-A4 | | | 3.81% | | | | 12/15/2048 | | | | 5,834,495 | |
| | 131,442,155 | | | Series 2015-P2-XA | | | 1.04% | # I/O | | | 12/15/2048 | | | | 9,212,018 | |
| | 11,469,000 | | | Series 2016-C32-C | | | 4.72% | # | | | 01/15/2059 | | | | 10,912,895 | |
| |
| | | | WF-RBS Commercial Mortgage Trust, | |
| | 75,468,248 | | | Series 2011-C4-XA | | | 0.57% | # I/O ^ | | | 06/15/2044 | | | | 1,309,540 | |
| | 111,929,920 | | | Series 2012-C6-XA | | | 2.36% | # I/O ^ | | | 04/15/2045 | | | | 9,166,546 | |
| | 131,690,742 | | | Series 2012-C8-XA | | | 2.15% | # I/O ^ | | | 08/15/2045 | | | | 10,458,918 | |
| | 51,435,117 | | | Series 2012-C9-XA | | | 2.16% | # I/O ^ | | | 11/15/2045 | | | | 4,487,740 | |
| | 99,373,482 | | | Series 2014-C19-XA | | | 1.27% | # I/O | | | 03/15/2047 | | | | 6,239,333 | |
| | 65,413,033 | | | Series 2014-C24-XA | | | 0.98% | # I/O | | | 11/15/2047 | | | | 3,739,029 | |
| | 55,000,000 | | | Series 2014-C25-A5 | | | 3.63% | | | | 11/15/2047 | | | | 58,618,560 | |
| | 8,000,000 | | | Series 2014-C25-C | | | 4.33% | # | | | 11/15/2047 | | | | 7,800,771 | |
| | 204,122,224 | | | Series 2014-C25-XA | | | 0.95% | # I/O | | | 11/15/2047 | | | | 11,735,987 | |
| | | | | | | | | | | | | | | | |
| | | | Total Non-Agency Commercial Mortgage Backed Obligations
(Cost $4,327,151,234) | | | | 4,160,981,697 | |
| | | | | | | | | | | | | | | | |
| NON-AGENCY RESIDENTIAL COLLATERALIZED MORTGAGE
OBLIGATIONS 21.0% |
|
| |
| | | | Acacia Ltd., | |
| | 33,190,026 | | | Series 2004-5A-A | | | 1.00% | #^ | | | 11/08/2039 | | | | 30,617,799 | |
| |
| | | | Accredited Mortgage Loan Trust, | |
| | 10,000,000 | | | Series 2005-4-MI | | | 0.83% | # | | | 12/25/2035 | | | | 7,838,501 | |
| | 103,157,000 | | | Series 2006-2-A4 | | | 0.69% | # | | | 09/25/2036 | | | | 86,828,144 | |
| |
| | | | ACE Securities Corporation, | |
| | 706,876 | | | Series 2006-HE1-A2C | | | 0.62% | # | | | 02/25/2036 | | | | 707,568 | |
| |
| | | | Adjustable Rate Mortgage Trust, | |
| | 7,745,620 | | | Series 2005-10-3A31 | | | 2.68% | # | | | 01/25/2036 | | | | 6,756,187 | |
| | 56,033,479 | | | Series 2005-11-4A1 | | | 2.72% | # | | | 02/25/2036 | | | | 39,744,681 | |
| | 6,200,000 | | | Series 2005-2-6M2 | | | 1.42% | # | | | 06/25/2035 | | | | 5,676,472 | |
| | 5,171,165 | | | Series 2005-7-3A1 | | | 3.19% | # | | | 10/25/2035 | | | | 4,541,900 | |
| | 28,724,774 | | | Series 2006-1-2A1 | | | 3.17% | # | | | 03/25/2036 | | | | 20,866,532 | |
| | 25,612,553 | | | Series 2006-2-3A1 | | | 3.10% | # | | | 05/25/2036 | | | | 22,694,522 | |
| | 20,997,634 | | | Series 2006-2-5A1 | | | 3.91% | # | | | 05/25/2036 | | | | 13,971,849 | |
| | 24,756,045 | | | Series 2007-1-3A1 | | | 3.32% | # | | | 03/25/2037 | | | | 20,673,590 | |
| | 3,888,729 | | | Series 2007-3-1A1 | | | 3.78% | #^ | | | 11/25/2037 | | | | 3,215,934 | |
| | | | | | | | | | | | | | | | |
PRINCIPAL
AMOUNT $ | | | SECURITY DESCRIPTION | | RATE | | | MATURITY | | | VALUE $ | |
| |
| | | | Aegis Asset Backed Securities Trust, | |
| | 411,458 | | | Series 2003-2-M2 | | | 2.98% | # | | | 11/25/2033 | | | | 381,001 | |
| | 2,023,569 | | | Series 2004-1-M2 | | | 2.46% | # | | | 04/25/2034 | | | | 1,779,224 | |
| | 617,792 | | | Series 2004-2-M2 | | | 2.38% | # | | | 06/25/2034 | | | | 450,740 | |
| | 19,241,256 | | | Series 2004-6-M2 | | | 1.43% | # | | | 03/25/2035 | | | | 17,563,957 | |
| |
| | | | Ajax Master Trust, | |
| | 99,508,058 | | | Series 2016-1-PC | | | 4.12% | #^¥ | | | 01/01/2057 | | | | 86,721,273 | |
| |
| | | | Ajax Mortgage Loan Trust, | |
| | 35,190,882 | | | Series 2015-C-A | | | 3.88% | #^ | | | 03/25/2057 | | | | 34,726,738 | |
| |
| | | | American General Mortgage Loan Trust, | |
| | 1,843,791 | | | Series 2010-1-A3 | | | 5.65% | #^ | | | 03/25/2058 | | | | 1,847,632 | |
| | 12,000,000 | | | Series 2010-1-A4 | | | 5.65% | #^ | | | 03/25/2058 | | | | 12,210,060 | |
| |
| | | | American Home Mortgage Investment Trust, | |
| | 3,011,794 | | | Series 2005-1-7A2 | | | 2.88% | # | | | 06/25/2045 | | | | 2,936,058 | |
| | 10,651,306 | | | Series 2005-4-3A1 | | | 0.73% | # | | | 11/25/2045 | | | | 8,268,974 | |
| | 36,272,361 | | | Series 2005-4-5A | | | 2.63% | # | | | 11/25/2045 | | | | 27,287,324 | |
| | 2,444,320 | | | Series 2006-2-3A4 | | | 6.60% | # | | | 06/25/2036 | | | | 1,067,224 | |
| | 8,945,673 | | | Series 2007-A-13A1 | | | 6.10% | #^ | | | 01/25/2037 | | | | 4,875,988 | |
| |
| | | | Ameriquest Mortgage Securities, Inc., | |
| | 16,500,000 | | | Series 2004-R8-M2 | | | 1.45% | # | | | 09/25/2034 | | | | 14,348,641 | |
| |
| | | | Amortizing Residential Collateral Trust, | |
| | 12,868,593 | | | Series 2002-BC7-M1 | | | 1.63% | # | | | 10/25/2032 | | | | 9,103,780 | |
| |
| | | | Argent Securities, Inc., | |
| | 216,696 | | | Series 2004-W6-M1 | | | 1.26% | # | | | 05/25/2034 | | | | 205,889 | |
| |
| | | | Asset Backed Securities Corporation Home Equity Loan Trust, | |
| | 4,411,193 | | | Series 2003-HE6-M1 | | | 1.41% | # | | | 11/25/2033 | | | | 4,192,265 | |
| | 861,541 | | | Series 2004-HE3-M2 | | | 2.11% | # | | | 06/25/2034 | | | | 783,801 | |
| |
| | | | Banc of America Alternative Loan Trust, | |
| | 9,827,732 | | | Series 2004-8-1CB1 | | | 6.00% | | | | 09/25/2034 | | | | 9,495,902 | |
| | 23,440,420 | | | Series 2005-10-2CB1 | | | 6.00% | | | | 11/25/2035 | | | | 22,199,198 | |
| | 3,819,144 | | | Series 2005-10-4A1 | | | 5.75% | | | | 11/25/2035 | | | | 3,557,612 | |
| | 12,346,375 | | | Series 2005-11-2CB1 | | | 6.00% | | | | 12/25/2035 | | | | 11,286,203 | |
| | 4,139,152 | | | Series 2005-5-2CB1 | | | 6.00% | | | | 06/25/2035 | | | | 4,017,679 | |
| | 6,831,940 | | | Series 2005-6-2CB2 | | | 6.00% | | | | 07/25/2035 | | | | 6,487,264 | |
| | 3,810,970 | | | Series 2005-6-4CB1 | | | 6.50% | | | | 07/25/2035 | | | | 3,634,642 | |
| | 2,419,732 | | | Series 2005-8-2CB1 | | | 6.00% | | | | 09/25/2035 | | | | 2,247,576 | |
| | 12,134,487 | | | Series 2006-1-3CB1 | | | 6.50% | | | | 02/25/2036 | | | | 11,482,984 | |
| | 6,829,687 | | | Series 2006-2-1CB1 | | | 6.00% | | | | 03/25/2036 | | | | 6,670,490 | |
| | 9,629,402 | | | Series 2006-2-3CB1 | | | 6.50% | | | | 03/25/2036 | | | | 8,422,097 | |
| | 7,020,016 | | | Series 2006-3-4CB1 | | | 6.50% | | | | 04/25/2036 | | | | 6,301,270 | |
| | 2,138,209 | | | Series 2006-5-CB14 | | | 6.00% | # | | | 06/25/2046 | | | | 1,750,782 | |
| | 4,233,046 | | | Series 2006-6-CB3 | | | 6.00% | | | | 07/25/2046 | | | | 3,444,399 | |
| | 16,196,308 | | | Series 2006-7-A4 | | | 6.00% | # | | | 10/25/2036 | | | | 10,181,429 | |
| | 6,215,028 | | | Series 2006-8-1A1 | | | 6.07% | # I/F I/O | | | 11/25/2036 | | | | 1,184,065 | |
| | 2,214,999 | | | Series 2006-8-1A2 | | | 0.88% | # | | | 11/25/2036 | | | | 1,354,172 | |
| | 10,658,827 | | | Series 2006-9-1CB1 | | | 6.00% | | | | 01/25/2037 | | | | 8,948,371 | |
| | 1,733,467 | | | Series 2007-2-2A1 | | | 6.00% | | | | 06/25/2037 | | | | 1,386,274 | |
| |
| | | | Banc of America Funding Corporation, | |
| | 11,336,680 | | | Series 2006-2-3A1 | | | 6.00% | | | | 03/25/2036 | | | | 11,343,803 | |
| | 318,002 | | | Series 2006-2-4A1 | | | 21.50% | I/F | | | 03/25/2036 | | | | 452,959 | |
| | 1,301,171 | | | Series 2006-2-6A2 | | | 5.50% | | | | 03/25/2036 | | | | 1,283,869 | |
| | 9,892,300 | | | Series 2006-3-1A1 | | | 6.00% | | | | 03/25/2036 | | | | 9,346,787 | |
| | 1,801,671 | | | Series 2006-3-6A1 | | | 6.29% | # | | | 03/25/2036 | | | | 1,825,951 | |
| | 9,959,104 | | | Series 2006-6-1A7 | | | 6.25% | | | | 08/25/2036 | | | | 9,762,374 | |
| | 2,603,891 | | | Series 2006-7-T2A5 | | | 6.04% | # | | | 10/25/2036 | | | | 2,196,568 | |
| | 12,272,921 | | | Series 2006-7-T2A8 | | | 5.91% | # | | | 10/25/2036 | | | | 10,296,335 | |
| | 2,429,244 | | | Series 2006-8T2-A8 | | | 6.10% | # | | | 10/25/2036 | | | | 1,989,771 | |
| | 1,208,937 | | | Series 2006-B-7A1 | | | 4.43% | # | | | 03/20/2036 | | | | 1,082,220 | |
| | 14,021,576 | | | Series 2006-D-6A1 | | | 3.36% | # | | | 05/20/2036 | | | | 11,729,561 | |
| | 1,127,663 | | | Series 2006-G-2A1 | | | 0.65% | # | | | 07/20/2036 | | | | 1,046,839 | |
| | 547,818 | | | Series 2006-H-3A1 | | | 2.79% | # | | | 09/20/2046 | | | | 435,435 | |
| | 1,732,195 | | | Series 2007-1-TA10 | | | 5.84% | # | | | 01/25/2037 | | | | 1,427,733 | |
| | 2,334,900 | | | Series 2007-3-TA1B | | | 5.83% | # | | | 04/25/2037 | | | | 2,054,291 | |
| | 3,534,081 | | | Series 2007-5-1A1 | | | 5.50% | | | | 07/25/2037 | | | | 2,782,528 | |
| | 4,306,894 | | | Series 2009-R14-3A | | | 15.11% | # I/F ^ | | | 06/26/2035 | | | | 5,473,238 | |
| | 6,107,936 | | | Series 2009-R15A-4A2 | | | 5.75% | ^ | | | 12/26/2036 | | | | 5,851,472 | |
| | 2,295,502 | | | Series 2010-R1-3A | | | 13.61% | # I/F ^ | | | 07/26/2036 | | | | 2,446,981 | |
| | 19,184,977 | | | Series 2012-R4-A | | | 0.70% | #^ | | | 03/04/2039 | | | | 19,099,929 | |
| | 9,067,467 | | | Series 2012-R5-A | | | 0.70% | #^ | | | 10/03/2039 | | | | 9,036,274 | |
| | | | | | |
| The accompanying notes are an integral part of these financial statements. | | Annual Report | | March 31, 2016 | | 21 |
| | |
| Schedule of Investments DoubleLine Total Return Bond Fund (Cont.) | | March 31, 2016 |
| | | | | | | | | | | | | | | | |
PRINCIPAL
AMOUNT $ | | | SECURITY DESCRIPTION | | RATE | | | MATURITY | | | VALUE $ | |
| |
| | | | Banc of America Mortgage Securities, Inc., | |
| | 1,712,057 | | | Series 2004-K-4A1 | | | 2.85% | # | | | 12/25/2034 | | | | 1,669,018 | |
| | 5,778,008 | | | Series 2006-1-A9 | | | 6.00% | | | | 05/25/2036 | | | | 5,135,723 | |
| | 716,065 | | | Series 2007-1-2A5 | | | 5.75% | | | | 01/25/2037 | | | | 634,001 | |
| |
| | | | Bayview Opportunity Master Fund Trust, | |
| | 4,668,452 | | | Series 2014-15RP-A | | | 3.72% | #^ | | | 10/28/2019 | | | | 4,663,290 | |
| | 44,048,925 | | | Series 2016-1-A1 | | | 4.35% | #^ | | | 01/28/2031 | | | | 44,153,435 | |
| | 40,685,511 | | | Series 2016-A-A | | | 4.46% | #^ | | | 01/28/2036 | | | | 40,823,936 | |
| | 72,000,000 | | | Series 2016-B-A | | | 4.25% | #^ | | | 03/28/2036 | | | | 72,054,000 | |
| |
| | | | BCAP LLC Trust, | |
| | 4,553,752 | | | Series 2007-AA2-2A7 | | | 6.00% | | | | 04/25/2037 | | | | 3,743,219 | |
| | 4,930,056 | | | Series 2007-AA2-2A8 | | | 5.75% | | | | 04/25/2037 | | | | 4,004,390 | |
| | 16,823,693 | | | Series 2008-RR3-A1B | | | 6.65% | #^ | | | 10/25/2036 | | | | 12,368,003 | |
| | 5,466,267 | | | Series 2009-RR13-18A2 | | | 5.75% | #^ | | | 07/26/2037 | | | | 5,021,574 | |
| | 18,220,708 | | | Series 2009-RR1-3A3 | | | 6.00% | #^ | | | 08/26/2037 | | | | 17,972,683 | |
| | 7,811,945 | | | Series 2009-RR4-4A2 | | | 5.75% | ^ | | | 02/26/2036 | | | | 6,316,312 | |
| | 6,372,530 | | | Series 2010-RR10-5A1 | | | 7.04% | #^ | | | 04/27/2037 | | | | 6,908,778 | |
| | 10,534,380 | | | Series 2010-RR12-3A15 | | | 6.37% | #^ | | | 08/26/2037 | | | | 10,954,049 | |
| | 3,350,000 | | | Series 2010-RR5-2A3 | | | 6.10% | #^ | | | 04/26/2037 | | | | 3,425,615 | |
| | 2,419,639 | | | Series 2011-RR12-2A5 | | | 2.35% | #^ | | | 12/26/2036 | | | | 2,410,851 | |
| | 3,060,263 | | | Series 2012-RR1-3A3 | | | 3.50% | #^ | | | 10/26/2035 | | | | 3,063,186 | |
| |
| | | | Bear Stearns Adjustable Rate Mortgage Trust, | |
| | 9,839,437 | | | Series 2005-12-13A1 | | | 3.12% | # | | | 02/25/2036 | | | | 9,272,259 | |
| | 10,851,378 | | | Series 2006-4-4A1 | | | 4.64% | # | | | 10/25/2046 | | | | 9,513,858 | |
| | 7,067,634 | | | Series 2007-1 | | | 2.88% | # | | | 02/25/2047 | | | | 5,800,575 | |
| | 12,182,004 | | | Series 2007-1-2A1 | | | 2.93% | # | | | 02/25/2047 | | | | 10,030,451 | |
| |
| | | | Bear Stearns Alt-A Trust, | |
| | 4,586,196 | | | Series 2004-11-2A3 | | | 2.76% | # | | | 11/25/2034 | | | | 4,445,659 | |
| | 31,444,365 | | | Series 2006-3-21A1 | | | 2.75% | # | | | 05/25/2036 | | | | 23,802,513 | |
| | 16,904,078 | | | Series 2006-6-2A1 | | | 4.40% | # | | | 11/25/2036 | | | | 11,907,924 | |
| |
| | | | Bear Stearns Asset Backed Securities Trust, | |
| | 9,731,541 | | | Series 2004-AC4-A2 | | | 6.00% | # | | | 08/25/2034 | | | | 9,893,415 | |
| | 25,592,908 | | | Series 2005-AC2-1A | | | 5.75% | # | | | 04/25/2035 | | | | 25,657,520 | |
| | 8,633,801 | | | Series 2005-AC2-2A1 | | | 5.75% | # | | | 04/25/2035 | | | | 8,812,175 | |
| | 13,268,054 | | | Series 2005-AC7-A4 | | | 6.00% | # | | | 10/25/2035 | | | | 12,894,430 | |
| | 17,492,727 | | | Series 2006-AC1-1A1 | | | 6.25% | # | | | 02/25/2036 | | | | 12,263,726 | |
| | 2,203,279 | | | Series 2007-SD1-1A2A | | | 6.00% | | | | 10/25/2036 | | | | 1,637,729 | |
| | 1,551,820 | | | Series 2007-SD1-1A3A | | | 6.50% | | | | 10/25/2036 | | | | 1,159,955 | |
| | 5,334,799 | | | Series 2007-SD1-23A1 | | | 2.76% | # | | | 10/25/2036 | | | | 4,130,100 | |
| |
| | | | Belle Haven Ltd., | |
| | 1,100,599,018 | | | Series 2006-1A-A1 | | | 0.86% | #^ | | | 07/05/2046 | | | | 47,876,057 | |
| |
| | | | Centex Home Equity, | |
| | 2,750,000 | | | Series 2004-A-AF5 | | | 5.43% | # | | | 01/25/2034 | | | | 2,761,750 | |
| |
| | | | Chase Funding Mortgage Loan Asset-Backed Certificates, | |
| | 1,840,753 | | | Series 2003-4-2M1 | | | 1.33% | # | | | 03/25/2033 | | | | 1,749,711 | |
| |
| | | | Chase Mortgage Finance Trust, | |
| | 12,344,861 | | | Series 2005-A1-2A4 | | | 2.68% | # | | | 12/25/2035 | | | | 11,243,020 | |
| | 18,141,446 | | | Series 2006-S2-1A9 | | | 6.25% | | | | 10/25/2036 | | | | 15,499,609 | |
| | 9,367,239 | | | Series 2006-S3-1A2 | | | 6.00% | | | | 11/25/2036 | | | | 7,831,926 | |
| | 24,758,400 | | | Series 2006-S4-A8 | | | 6.00% | | | | 12/25/2036 | | | | 20,746,153 | |
| | 11,080,636 | | | Series 2007-A2-6A4 | | | 2.72% | # | | | 07/25/2037 | | | | 9,745,432 | |
| | 4,783,101 | | | Series 2007-S3-1A5 | | | 6.00% | | | | 05/25/2037 | | | | 3,888,253 | |
| | 2,445,127 | | | Series 2007-S3-2A1 | | | 5.50% | | | | 05/25/2037 | | | | 2,086,836 | |
| | 4,854,890 | | | Series 2007-S5-1A18 | | | 6.00% | | | | 07/25/2037 | | | | 4,003,457 | |
| |
| | | | ChaseFlex Trust, | |
| | 8,942,219 | | | Series 2005-1-3A1 | | | 6.00% | | | | 02/25/2035 | | | | 8,841,935 | |
| | 38,108 | | | Series 2006-1-A2A | | | 4.71% | # | | | 06/25/2036 | | | | 38,091 | |
| | 2,754,101 | | | Series 2006-1-A5 | | | 4.71% | # | | | 06/25/2036 | | | | 2,670,527 | |
| | 7,515,850 | | | Series 2006-2-A2B | | | 0.64% | # | | | 09/25/2036 | | | | 5,354,685 | |
| | 6,382,522 | | | Series 2007-1-1A1 | | | 6.50% | | | | 02/25/2037 | | | | 4,383,018 | |
| | 14,675,955 | | | Series 2007-M1-2F4 | | | 4.41% | # | | | 08/25/2037 | | | | 12,107,412 | |
| | 15,264,298 | | | Series 2007-M1-2F5 | | | 4.41% | # | | | 08/25/2037 | | | | 12,590,423 | |
| |
| | | | Citicorp Mortgage Securities, Inc., | |
| | 11,459,866 | | | Series 2005-1-1A4 | | | 5.50% | | | | 02/25/2035 | | | | 11,543,017 | |
| | 2,486,956 | | | Series 2006-7-1A1 | | | 6.00% | | | | 12/25/2036 | | | | 2,265,334 | |
| |
| | | | Citicorp Residential Mortgage Securities, Inc., | |
| | 6,594,000 | | | Series 2006-2-A5 | | | 5.89% | # | | | 09/25/2036 | | | | 6,591,704 | |
| | 45,704,518 | | | Series 2007-1-A4 | | | 5.80% | # | | | 03/25/2037 | | | | 48,198,668 | |
| | | | | | | | | | | | | | | | |
PRINCIPAL
AMOUNT $ | | | SECURITY DESCRIPTION | | RATE | | | MATURITY | | | VALUE $ | |
| |
| | | | Citigroup Mortgage Loan Trust, Inc., | |
| | 3,201,512 | | | Series 2005-5-2A2 | | | 5.75% | | | | 08/25/2035 | | | | 2,751,869 | |
| | 1,790,154 | | | Series 2005-9-21A1 | | | 5.50% | | | | 11/25/2035 | | | | 1,583,618 | |
| | 5,566,000 | | | Series 2006-4-2A1A | | | 6.00% | | | | 12/25/2035 | | | | 5,140,693 | |
| | 5,298,578 | | | Series 2006-FX1-A6 | | | 5.85% | # | | | 10/25/2036 | | | | 4,339,864 | |
| | 2,684,156 | | | Series 2006-WF1-A2D | | | 5.30% | # | | | 03/25/2036 | | | | 1,832,423 | |
| | 16,132,305 | | | Series 2006-WF2-A2D | | | 6.16% | # | | | 05/25/2036 | | | | 10,204,209 | |
| | 7,580,000 | | | Series 2006-WFH3-M1 | | | 0.72% | # | | | 10/25/2036 | | | | 6,639,352 | |
| | 8,850,280 | | | Series 2007-10-1A1A | | | 5.66% | # | | | 04/25/2037 | | | | 9,082,314 | |
| | 1,187,513 | | | Series 2007-12-2A1 | | | 6.50% | ^ | | | 10/25/2036 | | | | 928,245 | |
| | 591,688 | | | Series 2007-2-2A | | | 6.00% | | | | 11/25/2036 | | | | 551,444 | |
| | 34,978,761 | | | Series 2007-9-1A1 | | | 5.75% | ^ | | | 04/25/2047 | | | | 29,411,381 | |
| | 1,830,506 | | | Series 2007-9-2A2 | | | 6.50% | ^ | | | 05/25/2037 | | | | 1,533,984 | |
| | 110,002,211 | | | Series 2007-AMC2-A1 | | | 0.57% | #^ | | | 01/25/2037 | | | | 83,076,585 | |
| | 6,800,158 | | | Series 2007-OPX1-A3A | | | 5.97% | # | | | 01/25/2037 | | | | 4,836,441 | |
| | 14,989,994 | | | Series 2007-OXP1-A5A | | | 5.76% | # | | | 01/25/2037 | | | | 10,663,856 | |
| | 46,007,051 | | | Series 2007-WFH3-A2 | | | 0.59% | # | | | 06/25/2037 | | | | 43,657,503 | |
| | 20,000,000 | | | Series 2008-AR4-1A1B | | | 2.98% | #^ | | | 11/25/2038 | | | | 19,126,264 | |
| | 533,524 | | | Series 2010-12-3A1 | | | 4.00% | ^ | | | 04/25/2037 | | | | 535,758 | |
| | 733,063 | | | Series 2010-2-5A1 | | | 5.50% | #^ | | | 12/25/2035 | | | | 742,970 | |
| | 181,478,129 | | | Series 2010-8-5A4 | | | 6.66% | #^ | | | 11/25/2036 | | | | 169,701,687 | |
| | 3,742,814 | | | Series 2010-8-5A6 | | | 4.00% | ^ | | | 11/25/2036 | | | | 3,752,328 | |
| | 142,079,827 | | | Series 2010-8-6A4 | | | 6.56% | #^ | | | 12/25/2036 | | | | 131,724,864 | |
| | 10,435,678 | | | Series 2010-8-76I2 | | | 1.00% | I/O ^ | | | 06/25/2037 | | | | 41,215 | |
| | 128,635,184 | | | Series 2010-8-7A4 | | | 6.29% | #^ | | | 06/25/2037 | | | | 120,872,707 | |
| | 292,783 | | | Series 2011-12-1A1 | | | 3.50% | #^ | | | 04/25/2036 | | | | 292,359 | |
| | 2,946,859 | | | Series 2011-12-3A1 | | | 2.75% | #^ | | | 09/25/2047 | | | | 2,937,993 | |
| |
| | | | CitiMortgage Alternative Loan Trust, | |
| | 7,097,404 | | | Series 2006-A2-A2 | | | 6.00% | | | | 05/25/2036 | | | | 6,135,629 | |
| | 6,416,985 | | | Series 2006-A3-1A13 | | | 6.00% | | | | 07/25/2036 | | | | 5,710,401 | |
| | 4,603,563 | | | Series 2006-A4-1A8 | | | 6.00% | | | | 09/25/2036 | | | | 4,073,263 | |
| | 2,023,783 | | | Series 2006-A5-2A1 | | | 5.50% | | | | 10/25/2021 | | | | 2,034,600 | |
| | 4,380,966 | | | Series 2006-A5-3A3 | | | 6.00% | | | | 10/25/2036 | | | | 3,604,392 | |
| | 7,674,505 | | | Series 2007-A1-1A5 | | | 6.00% | | | | 01/25/2037 | | | | 6,549,757 | |
| | 3,741,829 | | | Series 2007-A1-1A7 | | | 6.00% | | | | 01/25/2037 | | | | 3,193,440 | |
| | 9,573,950 | | | Series 2007-A1-1A9 | | | 4.97% | # I/F I/O | | | 01/25/2037 | | | | 1,675,266 | |
| | 8,220,293 | | | Series 2007-A3-1A1 | | | 6.00% | # | | | 03/25/2037 | | | | 7,203,686 | |
| | 18,917,528 | | | Series 2007-A3-1A3 | | | 4.97% | # I/F I/O | | | 03/25/2037 | | | | 3,334,033 | |
| | 7,413,374 | | | Series 2007-A3-1A4 | | | 5.75% | | | | 03/25/2037 | | | | 6,396,839 | |
| | 13,289,122 | | | Series 2007-A4-1A3 | | | 0.76% | # | | | 04/25/2037 | | | | 9,135,732 | |
| | 13,289,122 | | | Series 2007-A4-1A4 | | | 6.24% | # I/F I/O | | | 04/25/2037 | | | | 3,109,479 | |
| | 1,916,003 | | | Series 2007-A5-1A11 | | | 6.00% | | | | 05/25/2037 | | | | 1,643,025 | |
| | 25,261,102 | | | Series 2007-A5-1A8 | | | 6.00% | | | | 05/25/2037 | | | | 21,662,089 | |
| | 886,596 | | | Series 2007-A8-A1 | | | 6.00% | | | | 10/25/2037 | | | | 801,532 | |
| |
| | | | COLT Funding LLC, | |
| | 26,762,807 | | | Series 2015-1-A1F | | | 4.00% | #^ | | | 12/26/2045 | | | | 26,620,423 | |
| |
| | | | Countrywide Alternative Loan Trust, | |
| | 38,831,140 | | | Series 2004-36CB-1A1 | | | 6.00% | | | | 02/25/2035 | | | | 35,449,037 | |
| | 9,641,909 | | | Series 2005-13CB-A3 | | | 5.50% | | | | 05/25/2035 | | | | 9,503,014 | |
| | 7,447,851 | | | Series 2005-20CB-2A1 | | | 0.93% | # | | | 07/25/2035 | | | | 5,970,542 | |
| | 15,206,029 | | | Series 2005-20CB-2A2 | | | 4.57% | # I/F I/O | | | 07/25/2035 | | | | 2,400,138 | |
| | 1,356,613 | | | Series 2005-20CB-4A1 | | | 5.25% | | | | 07/25/2020 | | | | 1,338,410 | |
| | 5,436,465 | | | Series 2005-26CB-A11 | | | 12.27% | # I/F | | | 07/25/2035 | | | | 6,164,485 | |
| | 7,534,878 | | | Series 2005-28CB-1A2 | | | 1.18% | # | | | 08/25/2035 | | | | 6,012,308 | |
| | 2,564,379 | | | Series 2005-28CB-3A6 | | | 6.00% | | | | 08/25/2035 | | | | 2,008,415 | |
| | 3,727,395 | | | Series 2005-46CB-A20 | | | 5.50% | | | | 10/25/2035 | | | | 3,447,191 | |
| | 11,340,205 | | | Series 2005-48T1-A2 | | | 5.50% | | | | 11/25/2035 | | | | 10,347,013 | |
| | 4,853,752 | | | Series 2005-54CB-3A4 | | | 5.50% | | | | 11/25/2035 | | | | 4,551,372 | |
| | 44,854,912 | | | Series 2005-57CB-1A1 | | | 5.50% | | | | 12/25/2035 | | | | 42,498,589 | |
| | 921,580 | | | Series 2005-60T1-A7 | | | 32.76% | # I/F | | | 12/25/2035 | | | | 1,556,234 | |
| | 1,393,901 | | | Series 2005-64CB-1A14 | | | 5.50% | | | | 12/25/2035 | | | | 1,338,517 | |
| | 20,230,726 | | | Series 2005-64CB-1A4 | | | 5.50% | | | | 12/25/2035 | | | | 19,426,896 | |
| | 3,368,102 | | | Series 2005-73CB-1A5 | | | 1.23% | # | | | 01/25/2036 | | | | 2,781,676 | |
| | 8,473,447 | | | Series 2005-73CB-1A6 | | | 4.27% | # I/F I/O | | | 01/25/2036 | | | | 1,077,290 | |
| | 75,200,085 | | | Series 2005-77T1-1A1 | | | 6.00% | | | | 02/25/2036 | | | | 64,874,204 | |
| | 1,852,700 | | | Series 2005-79CB-A5 | | | 5.50% | | | | 01/25/2036 | | | | 1,691,433 | |
| | 46,753,602 | | | Series 2005-85CB-1A1 | | | 6.00% | | | | 02/25/2036 | | | | 39,606,117 | |
| | 4,261,874 | | | Series 2005-85CB-2A6 | | | 20.05% | # I/F | | | 02/25/2036 | | | | 6,352,842 | |
| | 2,578,390 | | | Series 2005-86CB-A5 | | | 5.50% | | | | 02/25/2036 | | | | 2,317,887 | |
| | 4,733,889 | | | Series 2005-J10-1A11 | | | 5.50% | | | | 10/25/2035 | | | | 4,392,398 | |
| | 1,077,322 | | | Series 2005-J10-1A13 | | | 1.13% | # | | | 10/25/2035 | | | | 839,755 | |
| | 504,665 | | | Series 2005-J10-1A15 | | | 5.50% | | | | 10/25/2035 | | | | 468,260 | |
| | 1,249,723 | | | Series 2005-J11-1A3 | | | 5.50% | | | | 11/25/2035 | | | | 1,073,420 | |
| | 1,407,520 | | | Series 2005-J11-6A1 | | | 6.50% | | | | 09/25/2032 | | | | 1,359,198 | |
| | | | | | |
| 22 | | DoubleLine Funds Trust | | | | The accompanying notes are an integral part of these financial statements. |
| | | | | | | | | | | | | | | | |
PRINCIPAL
AMOUNT $ | | | SECURITY DESCRIPTION | | RATE | | | MATURITY | | | VALUE $ | |
| |
| | | | Countrywide Alternative Loan Trust, (Cont.) | |
| | 2,064,055 | | | Series 2005-J13-2A5 | | | 0.91% | # | | | 11/25/2035 | | | | 1,551,346 | |
| | 4,128,109 | | | Series 2005-J13-2A6 | | | 4.59% | # I/F I/O | | | 11/25/2035 | | | | 611,530 | |
| | 3,891,000 | | | Series 2005-J1-5A3 | | | 5.50% | | | | 02/25/2035 | | | | 3,601,879 | |
| | 2,447,653 | | | Series 2005-J1-7A1 | | | 5.50% | | | | 01/25/2020 | | | | 2,465,634 | |
| | 1,571,762 | | | Series 2005-J2-1A5 | | | 0.93% | # | | | 04/25/2035 | | | | 1,254,398 | |
| | 4,836,192 | | | Series 2005-J2-1A6 | | | 4.57% | # I/F I/O | | | 04/25/2035 | | | | 639,584 | |
| | 12,388,020 | | | Series 2005-J3-2A8 | | | 0.73% | # | | | 05/25/2035 | | | | 9,563,936 | |
| | 12,388,020 | | | Series 2005-J3-2A9 | | | 4.77% | # I/F I/O | | | 05/25/2035 | | | | 2,227,410 | |
| | 5,859,992 | | | Series 2006-12CB-A3 | | | 5.75% | # | | | 05/25/2036 | | | | 4,740,696 | |
| | 2,843,010 | | | Series 2006-15CB-A1 | | | 6.50% | | | | 06/25/2036 | | | | 2,168,331 | |
| | 2,057,650 | | | Series 2006-18CB-A12 | | | 1.03% | # | | | 07/25/2036 | | | | 1,297,830 | |
| | 2,057,650 | | | Series 2006-18CB-A13 | | | 5.07% | # I/F I/O | | | 07/25/2036 | | | | 439,925 | |
| | 10,015,643 | | | Series 2006-19CB-A12 | | | 0.83% | # | | | 08/25/2036 | | | | 6,700,811 | |
| | 13,581,813 | | | Series 2006-19CB-A13 | | | 5.17% | # I/F I/O | | | 08/25/2036 | | | | 3,526,451 | |
| | 2,091,112 | | | Series 2006-19CB-A15 | | | 6.00% | | | | 08/25/2036 | | | | 1,894,281 | |
| | 3,308,088 | | | Series 2006-24CB-A11 | | | 5.75% | | | | 06/25/2036 | | | | 2,788,730 | |
| | 9,682,369 | | | Series 2006-24CB-A14 | | | 6.72% | # I/F I/O | | | 06/25/2036 | | | | 2,846,223 | |
| | 7,763,999 | | | Series 2006-24CB-A22 | | | 6.00% | | | | 06/25/2036 | | | | 6,672,888 | |
| | 8,333,103 | �� | | Series 2006-24CB-A5 | | | 1.03% | # | | | 06/25/2036 | | | | 5,069,295 | |
| | 3,113,389 | | | Series 2006-26CB-A17 | | | 6.25% | | | | 09/25/2036 | | | | 2,630,150 | |
| | 3,996,300 | | | Series 2006-26CB-A9 | | | 6.50% | | | | 09/25/2036 | | | | 3,438,478 | |
| | 6,779,078 | | | Series 2006-29T1-1A2 | | | 6.25% | | | | 10/25/2036 | | | | 6,133,038 | |
| | 1,043,381 | | | Series 2006-29T1-2A12 | | | 43.34% | # I/F | | | 10/25/2036 | | | | 2,258,564 | |
| | 639,093 | | | Series 2006-29T1-2A23 | | | 31.49% | # I/F | | | 10/25/2036 | | | | 1,123,343 | |
| | 7,229,299 | | | Series 2006-30T1-1A2 | | | 6.25% | | | | 11/25/2036 | | | | 6,739,900 | |
| | 4,983,383 | | | Series 2006-32CB-A1 | | | 1.10% | # | | | 11/25/2036 | | | | 3,455,496 | |
| | 8,312,284 | | | Series 2006-32CB-A2 | | | 4.90% | # I/F I/O | | | 11/25/2036 | | | | 2,164,572 | |
| | 7,829,474 | | | Series 2006-36T2-2A1 | | | 6.25% | | | | 12/25/2036 | | | | 5,982,553 | |
| | 2,824,410 | | | Series 2006-39CB-1A10 | | | 6.00% | | | | 01/25/2037 | | | | 2,717,158 | |
| | 19,247,558 | | | Series 2006-39CB-2A2 | | | 6.12% | # I/F I/O | | | 01/25/2037 | | | | 6,895,199 | |
| | 6,554,702 | | | Series 2006-39CB-2A4 | | | 0.88% | # | | | 01/25/2037 | | | | 1,990,702 | |
| | 3,996,118 | | | Series 2006-40T1-1A11 | | | 6.00% | | | | 01/25/2037 | | | | 3,602,130 | |
| | 6,800,033 | | | Series 2006-40T1-1A4 | | | 5.02% | # I/F I/O | | | 01/25/2037 | | | | 1,276,899 | |
| | 7,060,609 | | | Series 2006-41CB-1A10 | | | 6.00% | | | | 01/25/2037 | | | | 6,078,406 | |
| | 7,434,973 | | | Series 2006-41CB-1A9 | | | 6.00% | | | | 01/25/2037 | | | | 6,400,692 | |
| | 6,043,002 | | | Series 2006-45T1-1A4 | | | 1.03% | # | | | 02/25/2037 | | | | 3,226,080 | |
| | 6,043,002 | | | Series 2006-45T1-1A5 | | | 4.97% | # I/F I/O | | | 02/25/2037 | | | | 1,076,708 | |
| | 2,290,495 | | | Series 2006-6CB-1A4 | | | 5.50% | | | | 05/25/2036 | | | | 2,128,604 | |
| | 13,967,051 | | | Series 2006-J1-1A3 | | | 5.50% | | | | 02/25/2036 | | | | 12,483,119 | |
| | 6,883,842 | | | Series 2006-J1-A10 | | | 5.50% | | | | 02/25/2036 | | | | 6,152,467 | |
| | 2,465,566 | | | Series 2006-J4-2A2 | | | 6.00% | | | | 07/25/2036 | | | | 2,112,273 | |
| | 1,471,304 | | | Series 2007-11T1-A24 | | | 37.30% | # I/F | | | 05/25/2037 | | | | 3,412,045 | |
| | 23,424,635 | | | Series 2007-15CB-A1 | | | 6.00% | | | | 07/25/2037 | | | | 21,636,499 | |
| | 15,546,655 | | | Series 2007-16CB-2A1 | | | 0.88% | # | | | 08/25/2037 | | | | 9,235,663 | |
| | 4,501,923 | | | Series 2007-16CB-2A2 | | | 50.98% | # I/F | | | 08/25/2037 | | | | 11,559,390 | |
| | 9,178,674 | | | Series 2007-16CB-4A7 | | | 6.00% | | | | 08/25/2037 | | | | 8,950,123 | |
| | 13,870,962 | | | Series 2007-17CB-1A10 | | | 27.91% | # I/F | | | 08/25/2037 | | | | 23,211,672 | |
| | 2,255,908 | | | Series 2007-18CB-2A25 | | | 6.00% | | | | 08/25/2037 | | | | 1,985,986 | |
| | 1,275,950 | | | Series 2007-19-1A10 | | | 36.40% | # I/F | | | 08/25/2037 | | | | 2,779,136 | |
| | 18,753,736 | | | Series 2007-19-1A4 | | | 6.00% | | | | 08/25/2037 | | | | 14,743,662 | |
| | 41,784,356 | | | Series 2007-19-2A1 | | | 6.50% | | | | 08/25/2037 | | | | 28,240,559 | |
| | 6,912,113 | | | Series 2007-21CB-2A2 | | | 26.67% | # I/F | | | 09/25/2037 | | | | 12,478,966 | |
| | 30,174,198 | | | Series 2007-22-2A16 | | | 6.50% | | | | 09/25/2037 | | | | 23,150,897 | |
| | 16,915,601 | | | Series 2007-23CB-A3 | | | 0.93% | # | | | 09/25/2037 | | | | 10,462,120 | |
| | 24,006,744 | | | Series 2007-23CB-A4 | | | 6.07% | # I/F I/O | | | 09/25/2037 | | | | 7,474,821 | |
| | 16,590,493 | | | Series 2007-4CB-2A1 | | | 7.00% | | | | 03/25/2037 | | | | 6,657,851 | |
| | 8,929,672 | | | Series 2007-5CB-1A18 | | | 5.22% | # I/F I/O | | | 04/25/2037 | | | | 2,102,396 | |
| | 8,929,672 | | | Series 2007-5CB-1A23 | | | 0.98% | # | | | 04/25/2037 | | | | 5,498,562 | |
| | 7,293,794 | | | Series 2007-6-A4 | | | 5.75% | | | | 04/25/2047 | | | | 6,367,458 | |
| | 619,389 | | | Series 2007-8CB-A12 | | | 37.60% | # I/F | | | 05/25/2037 | | | | 1,224,292 | |
| | 661,188 | | | Series 2007-8CB-A8 | | | 37.48% | # I/F | | | 05/25/2037 | | | | 1,302,534 | |
| | 905,273 | | | Series 2007-9T1-1A4 | | | 0.93% | # | | | 05/25/2037 | | | | 512,390 | |
| | 905,273 | | | Series 2007-9T1-1A5 | | | 5.07% | # I/F I/O | | | 05/25/2037 | | | | 199,034 | |
| | 24,796,655 | | | Series 2007-9T1-1A6 | | | 6.00% | | | | 05/25/2037 | | | | 19,093,050 | |
| | 2,613,347 | | | Series 2007-9T1-2A1 | | | 6.00% | | | | 05/25/2037 | | | | 2,080,105 | |
| | 949,522 | | | Series 2007-9T1-3A1 | | | 5.50% | | | | 05/25/2022 | | | | 829,980 | |
| | 35,014,961 | | | Series 2007-HY2-1A | | | 2.72% | # | | | 03/25/2047 | | | | 30,343,989 | |
| | 8,953,494 | | | Series 2007-HY5R-2A1B | | | 2.84% | # | | | 03/25/2047 | | | | 8,683,985 | |
| |
| | | | Countrywide Asset-Backed Certificates, | |
| | 3,994,855 | | | Series 2003-BC6-M1 | | | 1.26% | # | | | 11/25/2033 | | | | 3,896,547 | |
| | 2,218,103 | | | Series 2005-13-AF3 | | | 4.84% | # | | | 04/25/2036 | | | | 1,985,792 | |
| | 23,200,000 | | | Series 2005-4-AF5B | | | 4.93% | # | | | 10/25/2035 | | | | 23,095,347 | |
| | 973,549 | | | Series 2006-2-2A2 | | | 0.62% | # | | | 10/25/2034 | | | | 952,572 | |
| | | | | | | | | | | | | | | | |
PRINCIPAL
AMOUNT $ | | | SECURITY DESCRIPTION | | RATE | | | MATURITY | | | VALUE $ | |
| |
| | | | Countrywide Home Loans, | |
| | 1,109,190 | | | Series 2002-32-2A6 | | | 5.00% | | | | 01/25/2018 | | | | 1,117,664 | |
| | 4,021,770 | | | Series 2003-60-4A1 | | | 2.77% | # | | | 02/25/2034 | | | | 3,982,118 | |
| | 4,441,337 | | | Series 2004-R2-1AF1 | | | 0.85% | #^ | | | 11/25/2034 | | | | 3,774,001 | |
| | 4,327,206 | | | Series 2004-R2-1AS | | | 5.74% | # I/O ^ | | | 11/25/2034 | | | | 527,399 | |
| | 9,144,449 | | | Series 2005-20-A5 | | | 5.50% | | | | 10/25/2035 | | | | 8,711,647 | |
| | 6,803,999 | | | Series 2005-20-A8 | | | 5.25% | | | | 10/25/2035 | | | | 6,433,554 | |
| | 20,287,571 | | | Series 2005-23-A1 | | | 5.50% | | | | 11/25/2035 | | | | 18,474,528 | |
| | 5,477,855 | | | Series 2005-24-A8 | | | 5.50% | | | | 11/25/2035 | | | | 5,260,376 | |
| | 1,585,088 | | | Series 2005-27-2A1 | | | 5.50% | | | | 12/25/2035 | | | | 1,425,650 | |
| | 2,858,868 | | | Series 2005-28-A7 | | | 5.25% | | | | 01/25/2019 | | | | 2,631,574 | |
| | 33,282,908 | | | Series 2005-HYB1-4A1 | | | 2.69% | # | | | 03/25/2035 | | | | 30,929,147 | |
| | 3,872,498 | | | Series 2005-HYB8-1A1 | | | 2.66% | # | | | 12/20/2035 | | | | 3,154,057 | |
| | 5,456,841 | | | Series 2005-J3-2A4 | | | 4.50% | | | | 09/25/2035 | | | | 5,201,804 | |
| | 5,790,262 | | | Series 2005-J4-A5 | | | 5.50% | | | | 11/25/2035 | | | | 5,672,724 | |
| | 1,353,036 | | | Series 2005-R1-1AF1 | | | 0.79% | #^ | | | 03/25/2035 | | | | 1,189,977 | |
| | 1,331,737 | | | Series 2005-R1-1AS | | | 5.67% | # I/O ^ | | | 03/25/2035 | | | | 212,300 | |
| | 9,045,548 | | | Series 2006-16-2A1 | | | 6.50% | | | | 11/25/2036 | | | | 8,051,760 | |
| | 10,264,368 | | | Series 2006-1-A2 | | | 6.00% | | | | 03/25/2036 | | | | 9,321,477 | |
| | 4,161,864 | | | Series 2006-20-1A21 | | | 6.00% | | | | 02/25/2037 | | | | 3,658,472 | |
| | 2,874,474 | | | Series 2006-J3-A4 | | | 5.50% | | | | 05/25/2036 | | | | 2,887,660 | |
| | 11,167,347 | | | Series 2007-10-A7 | | | 6.00% | | | | 07/25/2037 | | | | 9,689,672 | |
| | 35,355,131 | | | Series 2007-11-A1 | | | 6.00% | | | | 08/25/2037 | | | | 31,615,810 | |
| | 23,851,386 | | | Series 2007-12-A9 | | | 5.75% | | | | 08/25/2037 | | | | 21,861,157 | |
| | 9,719,026 | | | Series 2007-13-A1 | | | 6.00% | | | | 08/25/2037 | | | | 9,131,482 | |
| | 11,384,014 | | | Series 2007-13-A110 | | | 6.00% | | | | 08/25/2037 | | | | 10,695,817 | |
| | 11,009,565 | | | Series 2007-15-1A1 | | | 6.25% | | | | 09/25/2037 | | | | 10,647,901 | |
| | 1,214,041 | | | Series 2007-15-1A16 | | | 6.25% | | | | 09/25/2037 | | | | 1,174,159 | |
| | 5,409,684 | | | Series 2007-15-1A29 | | | 6.25% | | | | 09/25/2037 | | | | 5,224,877 | |
| | 11,523,025 | | | Series 2007-17-1A2 | | | 6.00% | | | | 10/25/2037 | | | | 11,112,044 | |
| | 1,374,018 | | | Series 2007-18-1A1 | | | 6.00% | | | | 11/25/2037 | | | | 1,258,856 | |
| | 11,601,469 | | | Series 2007-3-A1 | | | 6.00% | | | | 04/25/2037 | | | | 10,589,197 | |
| | 4,468,136 | | | Series 2007-3-A12 | | | 6.00% | | | | 04/25/2037 | | | | 4,078,274 | |
| | 8,326,090 | | | Series 2007-4-1A39 | | | 6.00% | | | | 05/25/2037 | | | | 7,432,108 | |
| | 4,198,072 | | | Series 2007-5-A2 | | | 5.75% | | | | 05/25/2037 | | | | 3,978,495 | |
| | 15,666,254 | | | Series 2007-7-A1 | | | 6.00% | | | | 06/25/2037 | | | | 15,041,084 | |
| | 4,696,208 | | | Series 2007-7-A2 | | | 5.75% | | | | 06/25/2037 | | | | 4,461,973 | |
| | 11,563,583 | | | Series 2007-8-1A4 | | | 6.00% | | | | 01/25/2038 | | | | 10,296,997 | |
| | 6,068,526 | | | Series 2007-8-1A5 | | | 5.44% | | | | 01/25/2038 | | | | 5,191,954 | |
| | 14,089,840 | | | Series 2007-8-1A9 | | | 6.00% | # | | | 01/25/2038 | | | | 12,512,718 | |
| | 2,537,191 | | | Series 2007-9-A11 | | | 5.75% | | | | 07/25/2037 | | | | 2,386,202 | |
| | 17,512,743 | | | Series 2007-HY1-1A1 | | | 3.02% | # | | | 04/25/2037 | | | | 16,520,886 | |
| | 32,222,363 | | | Series 2007-J1-2A1 | | | 6.00% | | | | 02/25/2037 | | | | 24,791,760 | |
| | 932,768 | | | Series 2007-J3-A1 | | | 0.93% | # | | | 07/25/2037 | | | | 645,476 | |
| | 4,663,842 | | | Series 2007-J3-A2 | | | 5.07% | # I/F I/O | | | 07/25/2037 | | | | 481,505 | |
| |
| | | | Credit Suisse First Boston Mortgage Backed Trust, | |
| | 5,632,170 | | | Series 2006-3-A4B | | | 6.11% | # | | | 11/25/2036 | | | | 2,524,036 | |
| | 3,714,723 | | | Series 2006-4-A6A | | | 5.68% | # | | | 12/25/2036 | | | | 1,919,570 | |
| | 12,340,960 | | | Series 2007-1-1A1A | | | 5.90% | # | | | 05/25/2037 | | | | 6,098,190 | |
| |
| | | | Credit Suisse First Boston Mortgage Securities Corporation, | |
| | 160,613 | | | Series 2004-AR8-2A1 | | | 2.69% | # | | | 09/25/2034 | | | | 158,591 | |
| | 3,658,283 | | | Series 2005-10-5A4 | | | 5.50% | | | | 11/25/2035 | | | | 3,333,333 | |
| | 1,085,863 | | | Series 2005-10-5A5 | | | 5.50% | | | | 11/25/2035 | | | | 983,962 | |
| | 20,124,308 | | | Series 2005-12-5A1 | | | 5.25% | | | | 01/25/2036 | | | | 19,142,898 | |
| | 11,773,228 | | | Series 2005-12-7A1 | | | 7.00% | | | | 01/25/2036 | | | | 5,030,341 | |
| | 8,451,059 | | | Series 2005-8-3A10 | | | 5.50% | | | | 09/25/2035 | | | | 8,096,357 | |
| | 5,877,473 | | | Series 2005-8-7A1 | | | 7.00% | | | | 09/25/2035 | | | | 4,277,043 | |
| |
| | | | Credit Suisse Mortgage Capital Certificates, | |
| | 3,390,398 | | | Series 2005-1R-2A5 | | | 5.75% | ^ | | | 12/26/2035 | | | | 3,094,541 | |
| | 23,422,471 | | | Series 2006-1-2A1 | | | 6.00% | | | | 02/25/2036 | | | | 17,113,842 | |
| | 3,621,582 | | | Series 2006-2-3A1 | | | 6.50% | | | | 03/25/2036 | | | | 2,318,267 | |
| | 4,279,942 | | | Series 2006-2-5A1 | | | 1.13% | # | | | 03/25/2036 | | | | 2,264,202 | |
| | 23,922,906 | | | Series 2006-2-5A2 | | | 4.87% | # I/F I/O | | | 03/25/2036 | | | | 5,999,838 | |
| | 4,983,108 | | | Series 2006-2-5A3 | | | 6.25% | | | | 03/25/2036 | | | | 3,834,966 | |
| | 13,486,283 | | | Series 2006-2-5A4 | | | 6.00% | | | | 03/25/2036 | | | | 10,167,889 | |
| | 7,275,928 | | | Series 2006-3-4A3 | | | 5.50% | | | | 04/25/2036 | | | | 6,730,527 | |
| | 4,398,485 | | | Series 2006-3-4A4 | | | 5.50% | | | | 04/25/2036 | | | | 4,068,776 | |
| | 5,357,121 | | | Series 2006-4-1A8 | | | 6.00% | # | | | 05/25/2036 | | | | 4,252,422 | |
| | 24,691,128 | | | Series 2006-4-4A1 | | | 7.00% | | | | 05/25/2036 | | | | 10,569,489 | |
| | 17,059,679 | | | Series 2006-4-6A1 | | | 6.00% | | | | 05/25/2036 | | | | 13,709,712 | |
| | 15,441,022 | | | Series 2006-6-1A4 | | | 6.00% | | | | 07/25/2036 | | | | 11,562,271 | |
| | 11,936,264 | | | Series 2006-6-3A1 | | | 7.00% | | | | 07/25/2036 | | | | 3,859,517 | |
| | 471,783 | | | Series 2006-7-3A11 | | | 6.00% | | | | 08/25/2036 | | | | 402,655 | |
| | 5,806,177 | | | Series 2006-7-7A5 | | | 6.00% | | | | 08/25/2036 | | | | 5,442,287 | |
| | | | | | |
| The accompanying notes are an integral part of these financial statements. | | Annual Report | | March 31, 2016 | | 23 |
| | |
| Schedule of Investments DoubleLine Total Return Bond Fund (Cont.) | | March 31, 2016 |
| | | | | | | | | | | | | | | | |
PRINCIPAL
AMOUNT $ | | | SECURITY DESCRIPTION | | RATE | | | MATURITY | | | VALUE $ | |
| |
| | | | Credit Suisse Mortgage Capital Certificates, (Cont.) | |
| | 9,376,682 | | | Series 2006-9-2A1 | | | 5.50% | | | | 11/25/2036 | | | | 8,691,995 | |
| | 29,936,885 | | | Series 2006-9-3A1 | | | 6.00% | | | | 11/25/2036 | | | | 28,095,892 | |
| | 8,352,834 | | | Series 2006-9-4A1 | | | 6.00% | | | | 11/25/2036 | | | | 6,833,761 | |
| | 11,008,487 | | | Series 2006-9-6A14 | | | 6.00% | | | | 11/25/2036 | | | | 10,465,557 | |
| | 1,788,698 | | | Series 2006-9-6A15 | | | 37.29% | # I/F | | | 11/25/2036 | | | | 3,471,467 | |
| | 12,552,595 | | | Series 2007-1-1A4 | | | 6.13% | # | | | 02/25/2037 | | | | 6,383,385 | |
| | 14,593,000 | | | Series 2007-1-3A1 | | | 6.00% | | | | 02/25/2022 | | | | 11,254,454 | |
| | 8,296,354 | | | Series 2007-1-5A14 | | | 6.00% | | | | 02/25/2037 | | | | 7,153,524 | |
| | 129,156 | | | Series 2007-2-2A1 | | | 5.00% | | | | 03/25/2037 | | | | 127,165 | |
| | 12,984,811 | | | Series 2007-3-2A10 | | | 6.00% | | | | 04/25/2037 | | | | 10,646,080 | |
| | 7,408,301 | | | Series 2007-5-2A5 | | | 5.00% | | | | 08/25/2037 | | | | 6,580,557 | |
| | 56,532,314 | | | Series 2007-5-3A19 | | | 6.00% | | | | 08/25/2037 | | | | 57,270,202 | |
| | 25,478,257 | | | Series 2007-5-3A9 | | | 6.00% | | | | 08/25/2037 | | | | 24,760,055 | |
| | 5,125,847 | | | Series 2009-1R-4A2 | | | 3.15% | #^ | | | 07/20/2035 | | | | 4,642,787 | |
| | 93,898,000 | | | Series 2010-17R-6A1 | | | 2.23% | #^ | | | 06/26/2037 | | | | 89,067,699 | |
| | 33,398,322 | | | Series 2010-2R-4A17 | | | 6.00% | #^ | | | 03/26/2037 | | | | 32,489,618 | |
| | 66,537,127 | | | Series 2010-4R-3A17 | | | 6.00% | #^ | | | 06/26/2037 | | | | 66,273,660 | |
| | 32,851,280 | | | Series 2010-4R-8A17 | | | 6.00% | #^ | | | 06/26/2037 | | | | 32,447,133 | |
| | 4,091,834 | | | Series 2010-6R-2A2 | | | 6.25% | ^ | | | 07/26/2037 | | | | 4,120,676 | |
| | 6,964,758 | | | Series 2010-6R-2A6A | | | 6.25% | ^ | | | 07/26/2037 | | | | 7,267,751 | |
| | 24,815,846 | | | Series 2010-7R-4A17 | | | 6.00% | #^ | | | 04/26/2037 | | | | 23,899,065 | |
| | 46,315,037 | | | Series 2010-9R-2A5 | | | 4.00% | ^ | | | 02/27/2038 | | | | 45,289,802 | |
| | 70,545,124 | | | Series 2013-6-1A1 | | | 2.50% | #^ | | | 07/25/2028 | | | | 71,360,838 | |
| | 60,420,586 | | | Series 2013-9R-A1 | | | 3.00% | #^ | | | 05/27/2043 | | | | 60,791,230 | |
| | 43,109,907 | | | Series 2013-IVR4 | | | 3.50% | #^ | | | 07/25/2043 | | | | 43,898,473 | |
| | 30,496,267 | | | Series 2013-IVR4-A2 | | | 3.00% | #^ | | | 07/25/2043 | | | | 30,672,566 | |
| | 72,415,762 | | | Series 2014-CIM1-A3 | | | 2.49% | #^ | | | 01/25/2058 | | | | 72,542,982 | |
| | 11,050,473 | | | Series 2014-WIN1-2A4 | | | 3.00% | #^ | | | 09/25/2044 | | | | 11,017,444 | |
| | 131,087,366 | | | Series 2015-1-A1 | | | 2.50% | #^ | | | 01/25/2045 | | | | 128,948,256 | |
| | 151,752,633 | | | Series 2015-PR2-A1 | | | 4.25% | #^ | | | 07/26/2055 | | | | 149,460,257 | |
| | 93,626,166 | | | Series 2015-RPL1-A1 | | | 3.63% | #^ | | | 02/25/2057 | | | | 92,213,113 | |
| | 104,364,379 | | | Series 2015-RPL2-A1A | | | 3.75% | #^ | | | 11/25/2057 | | | | 102,831,527 | |
| | 28,487,665 | | | Series 2015-RPL3-A1 | | | 3.75% | #^ | | | 12/25/2056 | | | | 28,047,195 | |
| |
| | | | Credit-Based Asset Servicing and Securitization LLC, | |
| | 488,226 | | | Series 2005-CB6-A4 | | | 3.89% | # | | | 07/25/2035 | | | | 487,176 | |
| | 9,750,000 | | | Series 2007-MX1-A3 | | | 5.83% | #^ | | | 12/25/2036 | | | | 9,383,372 | |
| |
| | | | CSMLT Trust, | |
| | 11,658,325 | | | Series 2015-1-A9 | | | 3.50% | #^ | | | 05/25/2045 | | | | 11,893,595 | |
| | 64,199,124 | | | Series 2015-2-A7 | | | 3.50% | #^ | | | 08/25/2045 | | | | 65,433,295 | |
| | 26,294,691 | | | Series 2015-3-1A2 | | | 3.50% | #^ | | | 11/25/2045 | | | | 26,714,923 | |
| |
| | | | Deutsche ALT-A Securities, Inc. Mortgage Loan Trust, | |
| | 23,975,450 | | | Series 2005-4-A5 | | | 5.50% | # | | | 09/25/2035 | | | | 20,816,104 | |
| | 1,658,243 | | | Series 2005-5-1A6 | | | 32.76% | # I/F | | | 11/25/2035 | | | | 2,533,584 | |
| | 1,663,256 | | | Series 2005-5-2A1 | | | 0.63% | # | | | 11/25/2035 | | | | 824,069 | |
| | 5,019,886 | | | Series 2005-5-2A2 | | | 4.87% | # I/F I/O | | | 11/25/2035 | | | | 977,712 | |
| | 17,193,036 | | | Series 2005-6-2A1 | | | 5.50% | | | | 12/25/2035 | | | | 14,314,507 | |
| | 203,073 | | | Series 2006-AF1-A3 | | | 0.61% | # | | | 04/25/2036 | | | | 203,098 | |
| | 50,310,526 | | | Series 2007-1-1A3A | | | 0.64% | # | | | 08/25/2037 | | | | 44,083,301 | |
| | 41,049,072 | | | Series 2007-2-2A1 | | | 0.73% | # | | | 09/25/2047 | | | | 31,501,743 | |
| | 20,689,321 | | | Series 2007-OA5-A1B | | | 0.65% | # | | | 08/25/2047 | | | | 16,841,279 | |
| | 1,351,449 | | | Series 2006-AB2-A2 | | | 5.96% | # | | | 06/25/2036 | | | | 1,114,084 | |
| | 2,637,694 | | | Series 2006-AB4-A1A | | | 6.01% | # | | | 10/25/2036 | | | | 2,138,432 | |
| | 36,833,211 | | | Series 2006-AB4-A2 | | | 5.65% | # | | | 10/25/2036 | | | | 29,600,019 | |
| | 2,623,923 | | | Series 2006-AB4-A3 | | | 5.90% | # | | | 10/25/2036 | | | | 2,127,494 | |
| | 3,860,063 | | | Series 2006-AB4-A3A1 | | | 5.90% | # | | | 10/25/2036 | | | | 3,129,765 | |
| | 7,681,751 | | | Series 2006-AB4-A6A1 | | | 5.87% | # | | | 10/25/2036 | | | | 6,231,839 | |
| |
| | | | Deutsche Mortgage Securities, Inc., | |
| | 20,649,724 | | | Series 2006-PR1-3A1 | | | 11.51% | # I/F ^ | | | 04/15/2036 | | | | 23,304,218 | |
| | 7,659,883 | | | Series 2006-PR1-4AI1 | | | 11.50% | # I/F ^ | | | 04/15/2036 | | | | 8,954,492 | |
| | 12,494,512 | | | Series 2006-PR1-4AI2 | | | 13.77% | # I/F ^ | | | 04/15/2036 | | | | 15,776,818 | |
| | 682,213 | | | Series 2006-PR1-5AI1 | | | 18.04% | # I/F ^ | | | 04/15/2036 | | | | 1,055,730 | |
| | 5,928,573 | | | Series 2006-PR1-5AI3 | | | 11.96% | # I/F ^ | | | 04/15/2036 | | | | 7,663,923 | |
| | 98,160,299 | | | Series 2006-PR1-5AI4 | | | 11.51% | # I/F ^ | | | 04/15/2036 | | | | 119,940,852 | |
| | 13,189,926 | | | Series 2009-RS2-4A2 | | | 0.57% | #^ | | | 04/26/2037 | | | | 12,849,624 | |
| |
| | | | Federal Home Loan Mortgage Corporation, | |
| | 57,929,470 | | | Series 2015-SC02-1A | | | 3.00% | | | | 09/25/2045 | | | | 58,906,793 | |
| |
| | | | First Franklin Mortgage Loan Trust, | |
| | 6,112,057 | | | Series 2006-FF1-2A3 | | | 0.67% | # | | | 01/25/2036 | | | | 6,035,460 | |
| | 13,979,074 | | | Series 2006-FF3-A2B | | | 0.63% | # | | | 02/25/2036 | | | | 13,472,626 | |
| |
| | | | First Horizon Alternative Mortgage Securities, | |
| | 13,738,269 | | | Series 2005-AA4-1A1 | | | 2.41% | # | | | 05/25/2035 | | | | 11,361,083 | |
| | | | | | | | | | | | | | | | |
PRINCIPAL
AMOUNT $ | | | SECURITY DESCRIPTION | | RATE | | | MATURITY | | | VALUE $ | |
| |
| | | | First Horizon Alternative Mortgage Securities, (Cont.) | |
| | 8,193,392 | | | Series 2005-FA5-1A4 | | | 5.50% | | | | 08/25/2035 | | | | 7,399,606 | |
| | 11,480,724 | | | Series 2005-FA8-1A4 | | | 5.50% | | | | 11/25/2035 | | | | 9,950,342 | |
| | 1,357,499 | | | Series 2005-FA8-2A1 | | | 5.00% | | | | 11/25/2020 | | | | 1,368,716 | |
| | 8,977,274 | | | Series 2005-FA9-A4A | | | 5.50% | | | | 12/25/2035 | | | | 7,612,768 | |
| | 6,646,332 | | | Series 2006-AA3-A1 | | | 2.46% | # | | | 06/25/2036 | | | | 5,409,251 | |
| | 5,106,892 | | | Series 2006-FA1-1A12 | | | 6.00% | | | | 04/25/2036 | | | | 4,045,572 | |
| | 368,497 | | | Series 2006-FA1-1A6 | | | 1.18% | # | | | 04/25/2036 | | | | 359,028 | |
| | 3,333,830 | | | Series 2006-FA2-1A5 | | | 6.00% | | | | 05/25/2036 | | | | 2,703,856 | |
| | 1,019,619 | | | Series 2006-FA7-A8 | | | 6.25% | | | | 12/25/2036 | | | | 795,912 | |
| | 4,695,684 | | | Series 2006-FA8-1A5 | | | 6.00% | | | | 02/25/2037 | | | | 3,532,539 | |
| | 10,254,616 | | | Series 2006-RE1-A1 | | | 5.50% | | | | 05/25/2035 | | | | 9,442,555 | |
| | 28,290,098 | | | Series 2007-FA3-A3 | | | 6.00% | | | | 06/25/2037 | | | | 21,913,363 | |
| | 1,455,671 | | | Series 2007-FA3-A4 | | | 6.00% | | | | 06/25/2037 | | | | 1,127,555 | |
| | 1,565,187 | | | Series 2007-FA4-1A13 | | | 6.25% | | | | 08/25/2037 | | | | 1,200,304 | |
| | 4,831,852 | | | Series 2007-FA4-1A4 | | | 6.25% | | | | 08/25/2037 | | | | 3,705,429 | |
| | 2,270,277 | | | Series 2007-FA4-1A5 | | | 6.25% | | | | 08/25/2037 | | | | 1,741,020 | |
| |
| | | | First Horizon Asset Securities, Inc., | |
| | 3,658,145 | | | Series 2006-1-1A2 | | | 6.00% | | | | 05/25/2036 | | | | 3,443,144 | |
| | 7,677,928 | | | Series 2007-1-A3 | | | 6.00% | | | | 03/25/2037 | | | | 6,911,936 | |
| | 5,463,886 | | | Series 2007-4-1A1 | | | 6.00% | | | | 08/25/2037 | | | | 4,667,457 | |
| |
| | | | GCAT LLC, | |
| | 75,000,000 | | | Series 2016-1-A1 | | | 4.50% | #^ | | | 03/25/2021 | | | | 75,073,800 | |
| |
| | | | GE-WMC Asset-Backed Pass-Through Certificates, | |
| | 46,273,000 | | | Series 2005-2-A2D | | | 0.75% | # | | | 12/25/2035 | | | | 34,741,898 | |
| |
| | | | GMACM Mortgage Loan Trust, | |
| | 7,598,385 | | | Series 2003-AR1-A5 | | | 3.34% | # | | | 10/19/2033 | | | | 7,646,293 | |
| | 10,012,739 | | | Series 2005-AR5-3A1 | | | 3.16% | # | | | 09/19/2035 | | | | 9,544,158 | |
| | 13,137,173 | | | Series 2005-J1-A14 | | | 5.50% | | | | 12/25/2035 | | | | 12,791,944 | |
| |
| | | | GS Mortgage Securities Corporation, | |
| | 1,869,823 | | | Series 2008-2R-1A1 | | | 7.50% | #^ | | | 09/25/2036 | | | | 1,523,557 | |
| | 8,111,233 | | | Series 2009-3R-1A2 | | | 6.00% | #^ | | | 04/25/2037 | | | | 7,819,586 | |
| |
| | | | GSAA Home Equity Trust, | |
| | 293,866 | | | Series 2005-12-AF3 | | | 5.07% | # | | | 09/25/2035 | | | | 251,251 | |
| | 41,091,659 | | | Series 2005-7-AF3 | | | 4.75% | # | | | 05/25/2035 | | | | 41,049,421 | |
| | 12,242,259 | | | Series 2006-10-AF3 | | | 5.98% | # | | | 06/25/2036 | | | | 6,159,838 | |
| | 8,761,995 | | | Series 2006-10-AF4 | | | 6.30% | # | | | 06/25/2036 | | | | 4,406,416 | |
| | 16,761,391 | | | Series 2006-15-AF4 | | | 5.96% | # | | | 09/25/2036 | | | | 8,814,135 | |
| | 2,768,140 | | | Series 2006-18-AF3A | | | 5.77% | # | | | 11/25/2036 | | | | 1,579,601 | |
| | 5,927,283 | | | Series 2006-18-AF6 | | | 5.68% | # | | | 11/25/2036 | | | | 3,066,260 | |
| | 7,336,288 | | | Series 2007-10-A1A | | | 6.00% | | | | 11/25/2037 | | | | 6,341,321 | |
| | 4,286,782 | | | Series 2007-10-A2A | | | 6.50% | | | | 11/25/2037 | | | | 3,143,999 | |
| |
| | | | GSMPS Mortgage Loan Trust, | |
| | 16,866,601 | | | Series 2005-RP2-1AF | | | 0.78% | #^ | | | 03/25/2035 | | | | 14,342,475 | |
| | 16,866,601 | | | Series 2005-RP2-1AS | | | 4.48% | # I/O ^ | | | 03/25/2035 | | | | 2,110,997 | |
| | 9,529,324 | | | Series 2005-RP3-1AF | | | 0.78% | #^ | | | 09/25/2035 | | | | 7,769,535 | |
| | 9,529,324 | | | Series 2005-RP3-1AS | | | 4.34% | # I/O ^ | | | 09/25/2035 | | | | 1,419,941 | |
| | 36,707,020 | | | Series 2006-RP1-1AS | | | 4.23% | # I/O ^ | | | 01/25/2036 | | | | 6,334,864 | |
| | 36,707,020 | | | Series 2006-RP1-AF1 | | | 0.78% | #^ | | | 01/25/2036 | | | | 31,699,170 | |
| |
| | | | GSR Mortgage Loan Trust, | |
| | 3,360,940 | | | Series 2005-1F-1A2 | | | 5.50% | | | | 02/25/2035 | | | | 3,422,442 | |
| | 6,583,330 | | | Series 2005-1F-3A3 | | | 6.00% | | | | 01/25/2035 | | | | 6,666,477 | |
| | 1,101,285 | | | Series 2005-6F-3A5 | | | 6.00% | | | | 07/25/2035 | | | | 1,122,405 | |
| | 10,668,542 | | | Series 2005-6F-3A9 | | | 6.47% | # I/F I/O | | | 07/25/2035 | | | | 1,735,522 | |
| | 1,037,633 | | | Series 2005-6F-4A1 | | | 0.93% | # | | | 07/25/2035 | | | | 817,386 | |
| | 652,623 | | | Series 2005-7F-3A1 | | | 0.93% | # | | | 09/25/2035 | | | | 602,943 | |
| | 14,786,047 | | | Series 2005-8F-3A5 | | | 6.00% | | | | 11/25/2035 | | | | 12,303,470 | |
| | 5,183,412 | | | Series 2005-8F-4A1 | | | 6.00% | | | | 11/25/2035 | | | | 4,055,096 | |
| | 2,145,435 | | | Series 2006-1F-1A2 | | | 5.50% | | | | 02/25/2036 | | | | 2,042,350 | |
| | 1,430,114 | | | Series 2006-2F-2A3 | | | 5.75% | | | | 02/25/2036 | | | | 1,324,292 | |
| | 5,068,395 | | | Series 2006-2F-3A3 | | | 6.00% | | | | 02/25/2036 | | | | 4,120,637 | |
| | 6,086,618 | | | Series 2006-2F-3A6 | | | 6.00% | | | | 02/25/2036 | | | | 4,948,458 | |
| | 18,860,258 | | | Series 2006-6F-2A3 | | | 6.00% | | | | 07/25/2036 | | | | 16,013,093 | |
| | 15,737,046 | | | Series 2006-7F-2A1 | | | 6.00% | | | | 08/25/2036 | | | | 14,498,018 | |
| | 9,326,649 | | | Series 2006-7F-3A4 | | | 6.25% | | | | 08/25/2036 | | | | 6,890,746 | |
| | 11,968,887 | | | Series 2006-9F-2A1 | | | 6.00% | | | | 10/25/2036 | | | | 11,286,927 | |
| | 28,908,570 | | | Series 2006-9F-4A1 | | | 6.50% | | | | 10/25/2036 | | | | 24,762,930 | |
| | 219,544 | | | Series 2006-9F-8A1 | | | 5.50% | | | | 08/25/2021 | | | | 203,405 | |
| | 18,529,933 | | | Series 2006-OA1-2A1 | | | 0.62% | # | | | 08/25/2046 | | | | 17,990,295 | |
| | 2,415,018 | | | Series 2007-1F-2A2 | | | 5.50% | | | | 01/25/2037 | | | | 2,291,665 | |
| | 3,451,003 | | | Series 2007-4F-1A1 | | | 5.00% | | | | 07/25/2037 | | | | 3,210,072 | |
| | 47,334,676 | | | Series 2007-4F-3A11 | | | 6.00% | | | | 07/25/2037 | | | | 42,878,216 | |
| | | | | | |
| 24 | | DoubleLine Funds Trust | | | | The accompanying notes are an integral part of these financial statements. |
| | | | | | | | | | | | | | | | |
PRINCIPAL
AMOUNT $ | | | SECURITY DESCRIPTION | | RATE | | | MATURITY | | | VALUE $ | |
| |
| | | | HarborView Mortgage Loan Trust, | |
| | 2,869,212 | | | Series 2005-14-3A1A | | | 2.94% | # | | | 12/19/2035 | | | | 2,511,742 | |
| | 10,153,641 | | | Series 2006-10-2A1A | | | 0.61% | # | | | 11/19/2036 | | | | 8,106,964 | |
| | 25,219,783 | | | Series 2006-11-A1A | | | 0.60% | # | | | 12/19/2036 | | | | 18,613,680 | |
| |
| | | | Home Equity Asset Trust, | |
| | 1,757,936 | | | Series 2003-3-M1 | | | 1.72% | # | | | 08/25/2033 | | | | 1,674,187 | |
| | 665,735 | | | Series 2004-7-M2 | | | 1.42% | # | | | 01/25/2035 | | | | 588,267 | |
| |
| | | | Home Equity Loan Trust, | |
| | 15,000,000 | | | Series 2007-FRE1-2AV2 | | | 0.59% | # | | | 04/25/2037 | | | | 12,806,652 | |
| |
| | | | HomeBanc Mortgage Trust, | |
| | 2,186,788 | | | Series 2005-1-M2 | | | 0.92% | # | | | 03/25/2035 | | | | 1,693,984 | |
| | 32,870,336 | | | Series 2005-3-A1 | | | 0.67% | # | | | 07/25/2035 | | | | 30,881,073 | |
| | 3,356,983 | | | Series 2006-1-3A1 | | | 2.44% | # | | | 04/25/2037 | | | | 2,989,764 | |
| |
| | | | HSI Asset Loan Obligation Trust, | |
| | 45,234,778 | | | Series 2007-2-3A6 | | | 6.00% | | | | 09/25/2037 | | | | 35,915,708 | |
| | 7,513,528 | | | Series 2007-AR1-3A1 | | | 2.70% | # | | | 01/25/2037 | | | | 6,036,492 | |
| |
| | | | IMPAC Trust, | |
| | 1,224,496 | | | Series 2002-9F-A1 | | | 5.22% | # | | | 12/25/2032 | | | | 1,231,888 | |
| |
| | | | IndyMac Mortgage Loan Trust, | |
| | 3,087,651 | | | Series 2006-AR2-1A1 | | | 2.90% | # | | | 09/25/2036 | | | | 2,427,322 | |
| | 8,387,643 | | | Series 2006-AR2-4A1 | | | 2.82% | # | | | 09/25/2036 | | | | 7,145,417 | |
| | 35,840,266 | | | Series 2006-AR3-1A1 | | | 2.92% | # | | | 12/25/2036 | | | | 31,434,160 | |
| | 11,223,761 | | | Series 2006-AR7-3A1 | | | 2.82% | # | | | 05/25/2036 | | | | 9,449,389 | |
| | 6,652,860 | | | Series 2007-A1-A1 | | | 6.00% | | | | 08/25/2037 | | | | 5,512,997 | |
| | 4,870,414 | | | Series 2007-A1-A7 | | | 6.00% | | | | 08/25/2037 | | | | 4,035,945 | |
| | 30,139,735 | | | Series 2007-A3-A1 | | | 6.25% | | | | 11/25/2037 | | | | 24,856,746 | |
| | 7,398,853 | | | Series 2007-AR3-3A1 | | | 5.05% | # | | | 07/25/2037 | | | | 6,409,353 | |
| | 627,599 | | | Series 2007-F2-1A2 | | | 6.00% | | | | 07/25/2037 | | | | 556,763 | |
| | 29,920,222 | | | Series 2007-F2-2A1 | | | 6.50% | | | | 07/25/2037 | | | | 18,400,158 | |
| |
| | | | Jefferies & Company, Inc., | |
| | 3,596,425 | | | Series 2010-R1-1A1 | | | 6.00% | #^ | | | 03/26/2037 | | | | 3,697,866 | |
| | 10,550,036 | | | Series 2010-R4-1A4 | | | 6.24% | #^ | | | 10/26/2036 | | | | 10,012,355 | |
| |
| | | | JP Morgan Alternative Loan Trust, | |
| | 16,371,234 | | | Series 2005-S1-2A11 | | | 6.00% | | | | 12/25/2035 | | | | 14,983,418 | |
| | 5,248,268 | | | Series 2005-S1-2A9 | | | 6.00% | | | | 12/25/2035 | | | | 4,867,998 | |
| | 5,286,868 | | | Series 2006-S1-1A8 | | | 5.75% | | | | 03/25/2036 | | | | 4,357,152 | |
| | 16,761,461 | | | Series 2006-S2-A4 | | | 6.19% | # | | | 05/25/2036 | | | | 12,163,988 | |
| | 8,725,983 | | | Series 2006-S4-A3A | | | 5.78% | # | | | 12/25/2036 | | | | 8,347,584 | |
| | 27,573,110 | | | Series 2006-S4-A4 | | | 5.96% | # | | | 12/25/2036 | | | | 22,085,546 | |
| |
| | | | JP Morgan Mortgage Acquisition Corporation, | |
| | 13,877,182 | | | Series 2006-CH2-AF3 | | | 5.46% | # | | | 10/25/2036 | | | | 10,322,228 | |
| | 4,839,508 | | | Series 2006-WF1-A5 | | | 6.41% | # | | | 07/25/2036 | | | | 2,714,321 | |
| | 23,000,000 | | | Series 2007-CH1-AF5 | | | 4.96% | # | | | 11/25/2036 | | | | 21,508,176 | |
| | 1,635,198 | | | Series 2007-CH5-A3 | | | 0.54% | # | | | 05/25/2037 | | | | 1,619,832 | |
| |
| | | | JP Morgan Mortgage Trust, | |
| | 2,010,744 | | | Series 2005-A6-5A1 | | | 2.64% | # | | | 08/25/2035 | | | | 1,845,906 | |
| | 3,245,566 | | | Series 2005-S2-2A13 | | | 5.50% | | | | 09/25/2035 | | | | 3,315,899 | |
| | 2,329,856 | | | Series 2006-S2-3A3 | | | 6.00% | | | | 07/25/2036 | | | | 1,975,290 | |
| | 6,918,247 | | | Series 2006-S3-1A2 | | | 6.00% | | | | 08/25/2036 | | | | 5,851,111 | |
| | 11,199,390 | | | Series 2006-S3-1A21 | | | 0.81% | # | | | 08/25/2036 | | | | 5,106,821 | |
| | 11,199,390 | | | Series 2006-S3-1A22 | | | 6.69% | # I/FI/O | | | 08/25/2036 | | | | 4,964,055 | |
| | 3,223,382 | | | Series 2006-S3-1A9 | | | 6.00% | | | | 08/25/2036 | | | | 2,726,182 | |
| | 10,979,045 | | | Series 2006-S4-A8 | | | 0.81% | # | | | 01/25/2037 | | | | 6,598,496 | |
| | 10,979,045 | | | Series 2006-S4-A9 | | | 6.19% | # I/FI/O | | | 01/25/2037 | | | | 2,797,400 | |
| | 3,579,612 | | | Series 2007-A2-2A1 | | | 2.80% | # | | | 04/25/2037 | | | | 3,142,437 | |
| | 14,710,070 | | | Series 2007-S1-2A6 | | | 6.00% | | | | 03/25/2037 | | | | 12,197,493 | |
| | 5,704,965 | | | Series 2007-S3-1A1 | | | 5.50% | | | | 08/25/2037 | | | | 5,083,524 | |
| | 9,912,418 | | | Series 2007-S3-1A35 | | | 6.00% | | | | 08/25/2037 | | | | 8,689,342 | |
| | 1,679,314 | | | Series 2007-S3-1A9 | | | 6.00% | | | | 08/25/2037 | | | | 1,464,790 | |
| | 9,139,754 | | | Series 2007-S3-1A96 | | | 6.00% | | | | 08/25/2037 | | | | 7,981,247 | |
| | 10,409,650 | | | Series 2007-S3-1A97 | | | 6.00% | | | | 08/25/2037 | | | | 9,092,284 | |
| | 1,751,533 | | | Series 2007-S3-2A2 | | | 5.50% | | | | 08/25/2022 | | | | 1,722,720 | |
| |
| | | | JP Morgan Resecuritization Trust, | |
| | 21,613,731 | | | Series 2010-1-1A4 | | | 6.00% | ^ | | | 02/26/2037 | | | | 18,750,571 | |
| | 17,641,584 | | | Series 2010-2-3A9 | | | 6.00% | ^ | | | 07/26/2036 | | | | 16,055,750 | |
| | 1,502,783 | | | Series 2010-8-2A3 | | | 2.68% | #^ | | | 11/26/2034 | | | | 1,497,155 | |
| | 4,171,126 | | | Series 2011-2-7A11 | | | 6.00% | #^ | | | 04/26/2036 | | | | 4,171,873 | |
| | 2,897,850 | | | Series 2012-2-3A3 | | | 2.45% | #^ | | | 10/26/2036 | | | | 2,887,413 | |
| | | | | | | | | | | | | | | | |
PRINCIPAL
AMOUNT $ | | | SECURITY DESCRIPTION | | RATE | | | MATURITY | | | VALUE $ | |
| |
| | | | Lehman Mortgage Trust, | |
| | 5,105,362 | | | Series 2005-2-3A5 | | | 5.50% | | | | 12/25/2035 | | | | 4,465,756 | |
| | 4,393,916 | | | Series 2005-2-5A5 | | | 5.75% | | | | 12/25/2035 | | | | 4,111,987 | |
| | 6,183,014 | | | Series 2005-3-2A1 | | | 6.00% | | | | 01/25/2036 | | | | 5,674,265 | |
| | 526,508 | | | Series 2005-3-2A3 | | | 5.50% | | | | 01/25/2036 | | | | 473,408 | |
| | 2,827,841 | | | Series 2005-3-2A7 | | | 6.00% | | | | 01/25/2036 | | | | 2,595,162 | |
| | 2,640,252 | | | Series 2006-1-1A1 | | | 1.18% | # | | | 02/25/2036 | | | | 1,557,748 | |
| | 7,920,755 | | | Series 2006-1-1A2 | | | 4.32% | # I/F I/O | | | 02/25/2036 | | | | 1,197,776 | |
| | 9,692,551 | | | Series 2006-1-3A1 | | | 1.18% | # | | | 02/25/2036 | | | | 8,071,033 | |
| | 9,692,551 | | | Series 2006-1-3A2 | | | 4.32% | # I/F I/O | | | 02/25/2036 | | | | 1,287,991 | |
| | 6,244,828 | | | Series 2006-1-3A4 | | | 5.50% | | | | 02/25/2036 | | | | 5,904,158 | |
| | 5,152,148 | | | Series 2006-4-1A3 | | | 4.97% | # I/F I/O | | | 08/25/2036 | | | | 998,521 | |
| | 3,274,594 | | | Series 2006-4-1A4 | | | 6.00% | | | | 08/25/2036 | | | | 2,763,596 | |
| | 9,334,175 | | | Series 2006-5-2A1 | | | 0.78% | # | | | 09/25/2036 | | | | 3,470,268 | |
| | 19,442,985 | | | Series 2006-5-2A2 | | | 6.72% | # I/F I/O | | | 09/25/2036 | | | | 7,637,825 | |
| | 15,225,284 | | | Series 2006-6-3A9 | | | 5.50% | | | | 10/25/2036 | | | | 12,103,638 | |
| | 7,211,416 | | | Series 2006-6-4A5 | | | 6.00% | | | | 12/25/2036 | | | | 6,855,596 | |
| | 4,651,076 | | | Series 2006-7-2A2 | | | 0.88% | # | | | 11/25/2036 | | | | 1,824,082 | |
| | 15,195,499 | | | Series 2006-7-2A5 | | | 6.12% | # I/F I/O | | | 11/25/2036 | | | | 5,286,193 | |
| | 4,195,314 | | | Series 2006-9-1A19 | | | 28.69% | # I/F | | | 01/25/2037 | | | | 6,697,764 | |
| | 4,636,112 | | | Series 2006-9-1A5 | | | 1.03% | # | | | 01/25/2037 | | | | 2,865,940 | |
| | 13,792,126 | | | Series 2006-9-1A6 | | | 4.72% | # I/F I/O | | | 01/25/2037 | | | | 2,482,890 | |
| | 5,694,143 | | | Series 2006-9-2A1 | | | 0.81% | # | | | 01/25/2037 | | | | 2,116,827 | |
| | 11,142,907 | | | Series 2006-9-2A2 | | | 6.19% | # I/F I/O | | | 01/25/2037 | | | | 3,751,032 | |
| | 12,018,609 | | | Series 2007-10-2A1 | | | 6.50% | | | | 01/25/2038 | | | | 9,370,123 | |
| | 3,732,652 | | | Series 2007-2-1A1 | | | 5.75% | | | | 02/25/2037 | | | | 3,203,977 | |
| | 3,938,061 | | | Series 2007-4-2A11 | | | 0.76% | # | | | 05/25/2037 | | | | 1,750,741 | |
| | 15,836,003 | | | Series 2007-4-2A8 | | | 6.24% | # I/F I/O | | | 05/25/2037 | | | | 5,659,360 | |
| | 1,573,444 | | | Series 2007-4-2A9 | | | 0.76% | # | | | 05/25/2037 | | | | 775,099 | |
| | 15,935,642 | | | Series 2007-5-11A1 | | | 5.36% | # | | | 06/25/2037 | | | | 11,561,670 | |
| | 5,471,116 | | | Series 2007-5-3A4 | | | 5.00% | | | | 12/25/2035 | | | | 5,024,658 | |
| | 2,497,486 | | | Series 2007-5-4A3 | | | 37.48% | # I/F | | | 08/25/2036 | | | | 4,668,759 | |
| | 1,197,154 | | | Series 2007-5-7A3 | | | 7.50% | | | | 10/25/2036 | | | | 935,133 | |
| | 752,070 | | | Series 2007-6-1A8 | | | 6.00% | | | | 07/25/2037 | | | | 677,143 | |
| | 7,565,162 | | | Series 2008-2-1A6 | | | 6.00% | | | | 03/25/2038 | | | | 5,829,975 | |
| |
| | | | Lehman XS Trust, | |
| | 1,658,523 | | | Series 2005-10-2A3B | | | 5.55% | # | | | 01/25/2036 | | | | 1,489,154 | |
| | 14,375,582 | | | Series 2005-4-2A3A | | | 5.00% | # | | | 10/25/2035 | | | | 12,969,383 | |
| | 1,701,167 | | | Series 2006-5-2A4A | | | 5.89% | # | | | 04/25/2036 | | | | 1,587,485 | |
| | 25,562,747 | | | Series 2007-1-2A1 | | | 5.35% | # | | | 02/25/2037 | | | | 21,599,693 | |
| |
| | | | Long Beach Mortgage Loan Trust, | |
| | 7,577,455 | | | Series 2006-WL1-2A3 | | | 0.67% | # | | | 01/25/2046 | | | | 7,116,891 | |
| |
| | | | MASTR Adjustable Rate Mortgages Trust, | |
| | 5,746,164 | | | Series 2005-2-2A1 | | | 2.80% | # | | | 03/25/2035 | | | | 4,458,150 | |
| | 4,771,252 | | | Series 2005-6-5A1 | | | 2.62% | # | | | 07/25/2035 | | | | 4,161,806 | |
| | 25,588,773 | | | Series 2007-1-2A1 | | | 3.04% | # | | | 11/25/2036 | | | | 22,897,865 | |
| | 3,183,582 | | | Series 2007-2-A2 | | | 0.54% | # | | | 03/25/2047 | | | | 3,126,875 | |
| |
| | | | MASTR Alternative Loans Trust, | |
| | 2,083,786 | | | Series 2005-2-3A1 | | | 6.00% | | | | 03/25/2035 | | | | 1,998,917 | |
| | 757,990 | | | Series 2005-5-2A3 | | | 5.50% | | | | 07/25/2025 | | | | 754,218 | |
| | 5,828,497 | | | Series 2005-6-1A5 | | | 5.50% | | | | 12/25/2035 | | | | 5,144,964 | |
| | 3,141,668 | | | Series 2006-3-1A2 | | | 6.25% | | | | 07/25/2036 | | | | 2,680,814 | |
| | 6,140,302 | | | Series 2007-1-1A5 | | | 5.75% | | | | 10/25/2036 | | | | 5,761,678 | |
| | 7,238,042 | | | Series 2007-1-2A7 | | | 6.00% | | | | 10/25/2036 | | | | 5,222,468 | |
| |
| | | | MASTR Asset Backed Securities Trust, | |
| | 4,975,000 | | | Series 2003-OPT1-M3 | | | 4.56% | # | | | 12/25/2032 | | | | 4,983,658 | |
| | 19,708,017 | | | Series 2006-AM2-A3 | | | 0.60% | # | | | 06/25/2036 | | | | 14,991,162 | |
| | 357,931 | | | Series 2006-NC1-A3 | | | 0.62% | # | | | 01/25/2036 | | | | 357,949 | |
| |
| | | | MASTR Asset Securitization Trust, | |
| | 282,549 | | | Series 2003-1-30B2 | | | 5.75% | | | | 02/25/2033 | | | | 281,913 | |
| | 8,267,515 | | | Series 2006-1-1A4 | | | 5.75% | | | | 05/25/2036 | | | | 7,852,475 | |
| | 5,320,444 | | | Series 2006-2-1A11 | | | 6.00% | # | | | 06/25/2036 | | | | 5,107,003 | |
| | 101,553 | | | Series 2007-1-1A1 | | | 5.50% | | | | 11/25/2037 | | | | 102,001 | |
| | 5,768,559 | | | Series 2007-1-1A3 | | | 6.25% | | | | 11/25/2037 | | | | 4,875,939 | |
| |
| | | | MASTR Resecuritization Trust, | |
| | 24,535,004 | | | Series 2008-4-A1 | | | 6.00% | #^ | | | 06/27/2036 | | | | 21,301,178 | |
| |
| | | | MASTR Seasoned Securitization Trust, | |
| | 1,863,591 | | | Series 2005-2-1A4 | | | 6.00% | | | | 10/25/2032 | | | | 1,852,318 | |
| | 1,824,022 | | | Series 2005-2-2A1 | | | 0.83% | # | | | 10/25/2032 | | | | 1,614,489 | |
| | | | | | |
| The accompanying notes are an integral part of these financial statements. | | Annual Report | | March 31, 2016 | | 25 |
| | |
| Schedule of Investments DoubleLine Total Return Bond Fund (Cont.) | | March 31, 2016 |
| | | | | | | | | | | | | | | | |
PRINCIPAL
AMOUNT $ | | | SECURITY DESCRIPTION | | RATE | | | MATURITY | | | VALUE $ | |
| |
| | | | Merrill Lynch Mortgage Investors Trust, | |
| | 10,746,329 | | | Series 2006-3-1A | | | 2.53% | # | | | 10/25/2036 | | | | 10,415,687 | |
| | 3,152,480 | | | Series 2006-F1-1A2 | | | 6.00% | | | | 04/25/2036 | | | | 2,896,344 | |
| |
| | | | Monterey Ltd., | |
| | 72,413,988 | | | Series 2006-1A-A1A | | | 0.87% | #^ | | | 09/06/2042 | | | | 6,300,017 | |
| | 285,875,316 | | | Series 2006-1A-A1B | | | 0.87% | #^ | | | 09/06/2042 | | | | 24,871,152 | |
| |
| | | | Morgan Stanley Capital, Inc., | |
| | 681,420 | | | Series 2003-NC6-M2 | | | 3.36% | # | | | 06/25/2033 | | | | 656,436 | |
| |
| | | | Morgan Stanley Mortgage Loan Trust, | |
| | 2,350,965 | | | Series 2005-10-1A1 | | | 1.13% | # | | | 12/25/2035 | | | | 1,889,954 | |
| | 5,890,227 | | | Series 2005-10-1A6 | | | 5.75% | | | | 12/25/2035 | | | | 5,705,382 | |
| | 7,863,585 | | | Series 2005-10-2A1 | | | 5.51% | # | | | 12/25/2035 | | | | 7,839,299 | |
| | 798,153 | | | Series 2005-6AR-1A1 | | | 0.71% | # | | | 11/25/2035 | | | | 769,262 | |
| | 6,361,601 | | | Series 2006-11-1A6 | | | 6.23% | # | | | 08/25/2036 | | | | 2,829,449 | |
| | 14,645,777 | | | Series 2006-11-2A1 | | | 6.00% | | | | 08/25/2036 | | | | 11,836,286 | |
| | 8,620,839 | | | Series 2006-17XS-A3A | | | 5.65% | # | | | 10/25/2046 | | | | 4,924,490 | |
| | 2,703,589 | | | Series 2006-17XS-A6 | | | 5.58% | # | | | 10/25/2046 | | | | 1,369,768 | |
| | 9,047,852 | | | Series 2006-2-2A3 | | | 5.75% | | | | 02/25/2036 | | | | 8,586,244 | |
| | 42,078,169 | | | Series 2006-7-3A | | | 5.22% | # | | | 06/25/2036 | | | | 34,799,946 | |
| | 3,786,503 | | | Series 2006-7-4A4 | | | 6.00% | | | | 06/25/2036 | | | | 3,344,339 | |
| | 3,833,180 | | | Series 2006-7-4A7 | | | 6.00% | | | | 06/25/2036 | | | | 3,328,650 | |
| | 5,257,510 | | | Series 2007-13-6A1 | | | 6.00% | | | | 10/25/2037 | | | | 4,305,524 | |
| | 19,740,195 | | | Series 2007-14AR-2A3 | | | 2.72% | # | | | 10/25/2037 | | | | 16,531,243 | |
| | 4,329,841 | | | Series 2007-1XS-2A3 | | | 5.92% | # | | | 09/25/2046 | | | | 2,231,270 | |
| | 3,151,600 | | | Series 2007-1XS-2A4A | | | 6.08% | # | | | 09/25/2046 | | | | 1,818,587 | |
| | 1,409,878 | | | Series 2007-3XS-1A2A | | | 5.62% | # | | | 01/25/2047 | | | | 1,345,262 | |
| | 9,219,621 | | | Series 2007-3XS-2A3S | | | 5.86% | # | | | 01/25/2047 | | | | 6,058,373 | |
| | 5,392,609 | | | Series 2007-3XS-2A4S | | | 5.96% | # | | | 01/25/2047 | | | | 3,543,122 | |
| |
| | | | Morgan Stanley Re-Remic Trust, | |
| | 746,656 | | | Series 2010-R9-1A | | | 4.00% | #^ | | | 08/26/2036 | | | | 749,224 | |
| | 6,599,188 | | | Series 2010-R9-1B | | | 6.25% | #^ | | | 08/26/2036 | | | | 5,056,127 | |
| | 48,980,280 | | | Series 2010-R9-3C | | | 6.00% | #^ | | | 11/26/2036 | | | | 48,521,085 | |
| | 6,210,548 | | | Series 2011-R1-1A | | | 5.94% | #^ | | | 02/26/2037 | | | | 6,607,705 | |
| |
| | | | MSCC Heloc Trust, | |
| | 19,218,042 | | | Series 2007-1-A | | | 0.53% | # | | | 12/25/2031 | | | | 18,847,887 | |
| |
| | | | New Century Home Equity Loan Trust, | |
| | 33,589,250 | | | Series 2005-2-M3 | | | 0.92% | # | | | 06/25/2035 | | | | 27,236,001 | |
| |
| | | | New Residential Mortgage Loan Trust, | |
| | 26,256,007 | | | Series 2014-2A-A3 | | | 3.75% | #^ | | | 05/25/2054 | | | | 27,142,294 | |
| | 70,604,964 | | | Series 2015-2A-A1 | | | 3.75% | # | | | 08/25/2055 | | | | 73,290,452 | |
| |
| | | | New York Mortgage Trust, | |
| | 1,194,048 | | | Series 2005-2-A | | | 0.76% | # | | | 08/25/2035 | | | | 1,098,732 | |
| |
| | | | Nomura Asset Acceptance Corporation, | |
| | 549,033 | | | Series 2005-AP1-2A5 | | | 4.86% | # | | | 02/25/2035 | | | | 555,364 | |
| | 18,727,388 | | | Series 2006-AF1-1A2 | | | 6.16% | # | | | 05/25/2036 | | | | 9,223,585 | |
| | 3,805,740 | | | Series 2006-AF1-1A3 | | | 6.41% | # | | | 05/25/2036 | | | | 1,874,023 | |
| | 22,484,218 | | | Series 2006-AP1-A2 | | | 5.52% | # | | | 01/25/2036 | | | | 12,220,307 | |
| | 3,800,306 | | | Series 2006-AP1-A3 | | | 5.65% | # | | | 01/25/2036 | | | | 2,082,066 | |
| | 1,910,264 | | | Series 2006-WF1-A2 | | | 5.76% | # | | | 06/25/2036 | | | | 1,014,861 | |
| |
| | | | Nomura Home Equity Loan, Inc., | |
| | 20,164,241 | | | Series 2006-AF1-A2 | | | 5.80% | # | | | 10/25/2036 | | | | 9,912,376 | |
| | 3,658,450 | | | Series 2007-1-1A1 | | | 6.06% | # | | | 02/25/2037 | | | | 1,737,080 | |
| | 18,234,557 | | | Series 2007-1-1A3 | | | 5.99% | # | | | 02/25/2037 | | | | 8,659,015 | |
| |
| | | | Oaks Mortgage Trust Series, | |
| | 75,827,086 | | | Series 2015-2-A3 | | | 3.50% | #^ | | | 10/25/2045 | | | | 77,071,561 | |
| |
| | | | Option One Mortgage Loan Trust, | |
| | 911,893 | | | Series 2002-2-A | | | 0.97% | # | | | 06/25/2032 | | | | 821,298 | |
| | 1,306,686 | | | Series 2004-3-M3 | | | 1.41% | # | | | 11/25/2034 | | | | 1,168,568 | |
| |
| | | | Park Place Securities, Inc., | |
| | 13,000,000 | | | Series 2005-WHQ4-M2 | | | 0.92% | # | | | 09/25/2035 | | | | 10,247,219 | |
| |
| | | | PFCA Home Equity Investment Trust, | |
| | 41,718,666 | | | Series 2003-IFC5-A | | | 4.24% | #^ | | | 01/22/2035 | | | | 39,724,455 | |
| | 46,763,271 | | | Series 2003-IFC6-A | | | 4.09% | #^ | | | 04/22/2035 | | | | 43,052,190 | |
| |
| | | | PHH Alternative Mortgage Trust, | |
| | 10,937,907 | | | Series 2007-1-1A1 | | | 0.59% | # | | | 02/25/2037 | | | | 9,110,162 | |
| | 30,765,486 | | | Series 2007-2-2A1 | | | 6.00% | | | | 05/25/2037 | | | | 27,347,499 | |
| | 1,329,756 | | | Series 2007-2-3A1 | | | 6.00% | | | | 05/25/2037 | | | | 1,169,025 | |
| | 15,109,087 | | | Series 2007-3-A2 | | | 0.62% | # | | | 07/25/2037 | | | | 14,711,763 | |
| | | | | | | | | | | | | | | | |
PRINCIPAL
AMOUNT $ | | | SECURITY DESCRIPTION | | RATE | | | MATURITY | | | VALUE $ | |
| |
| | | | Popular ABS Mortgage Pass-Through Trust, | |
| | 277,825 | | | Series 2005-5-AF6 | | | 4.42% | # | | | 11/25/2035 | | | | 277,775 | |
| |
| | | | PR Mortgage Loan Trust, | |
| | 281,448,569 | | | Series 2014-1-APT | | | 5.92% | # | | | 10/25/2049 | | | | 289,383,252 | |
| |
| | | | Pretium Mortgage Credit Partners LLC, | |
| | 67,000,000 | | | Series 2016-NPL1-A1 | | | 4.38% | #^ | | | 02/27/2031 | | | | 67,027,095 | |
| | 92,471,468 | | | Series 2016-NPL2-A1 | | | 4.38% | #^ | | | 03/27/2031 | | | | 92,869,043 | |
| |
| | | | Prime Mortgage Trust, | |
| | 13,159,120 | | | Series 2006-DR1-2A1 | | | 5.50% | ^ | | | 05/25/2035 | | | | 12,010,934 | |
| | 6,322,252 | | | Series 2006-DR1-2A2 | | | 6.00% | ^ | | | 05/25/2035 | | | | 5,852,067 | |
| |
| | | | RBSGC Structured Trust, | |
| | 43,620,942 | | | Series 2008-B-A1 | | | 6.00% | ^ | | | 06/25/2037 | | | | 39,072,159 | |
| |
| | | | RCO Mortgage LLC, | |
| | 21,461,967 | | | Series 2015-2A-A | | | 4.50% | #^ | | | 11/25/2045 | | | | 21,523,872 | |
| | 20,000,000 | | | Series 2016-1-A | | | 4.50% | # | | | 11/25/2047 | | | | 20,038,152 | |
| |
| | | | Renaissance Home Equity Loan Trust, | |
| | 1,332,223 | | | Series 2006-1-AF6 | | | 5.75% | # | | | 05/25/2036 | | | | 877,003 | |
| | 10,781,093 | | | Series 2006-4-AF4 | | | 5.47% | # | | | 01/25/2037 | | | | 5,675,097 | |
| | 21,230,166 | | | Series 2006-4-AF5 | | | 5.69% | # | | | 01/25/2037 | | | | 11,640,279 | |
| | 18,019,864 | | | Series 2007-2-AF2 | | | 5.68% | # | | | 06/25/2037 | | | | 8,077,254 | |
| | 9,745,735 | | | Series 2007-2-AF5 | | | 6.20% | # | | | 06/25/2037 | | | | 4,794,847 | |
| |
| | | | Residential Accredit Loans, Inc., | |
| | 5,832,959 | | | Series 2004-QS15-A1 | | | 5.25% | | | | 11/25/2034 | | | | 5,974,370 | |
| | 54,399,613 | | | Series 2005-QA11-4A1 | | | 3.49% | # | | | 10/25/2035 | | | | 44,841,237 | |
| | 28,187,500 | | | Series 2005-QA13-2A1 | | | 3.75% | # | | | 12/25/2035 | | | | 23,400,341 | |
| | 17,881,253 | | | Series 2005-QA3-CB1 | | | 3.54% | # | | | 03/25/2035 | | | | 12,042,588 | |
| | 739,926 | | | Series 2005-QS12-A11 | | | 46.39% | # I/F | | | 08/25/2035 | | | | 1,419,075 | |
| | 3,259,465 | | | Series 2005-QS13-1A6 | | | 5.50% | | | | 09/25/2035 | | | | 2,844,108 | |
| | 6,223,370 | | | Series 2005-QS13-2A1 | | | 1.13% | # | | | 09/25/2035 | | | | 4,570,949 | |
| | 25,515,817 | | | Series 2005-QS13-2A2 | | | 4.62% | # I/F I/O | | | 09/25/2035 | | | | 3,594,132 | |
| | 11,170,398 | | | Series 2005-QS14-2A1 | | | 6.00% | | | | 09/25/2035 | | | | 8,384,522 | |
| | 4,874,885 | | | Series 2005-QS15-2A | | | 6.00% | | | | 10/25/2035 | | | | 3,737,701 | |
| | 5,380,132 | | | Series 2005-QS15-3A | | | 6.00% | | | | 10/25/2035 | | | | 4,779,762 | |
| | 6,451,787 | | | Series 2005-QS16-A1 | | | 1.13% | # | | | 11/25/2035 | | | | 4,374,912 | |
| | 6,450,672 | | | Series 2005-QS16-A2 | | | 4.37% | # I/F I/O | | | 11/25/2035 | | | | 1,049,348 | |
| | 2,847,212 | | | Series 2005-QS17-A1 | | | 6.00% | | | | 12/25/2035 | | | | 2,455,876 | |
| | 1,972,971 | | | Series 2005-QS17-A10 | | | 6.00% | | | | 12/25/2035 | | | | 1,701,796 | |
| | 8,251,821 | | | Series 2005-QS17-A11 | | | 6.00% | | | | 12/25/2035 | | | | 7,117,648 | |
| | 5,865,134 | | | Series 2005-QS17-A2 | | | 1.28% | # | | | 12/25/2035 | | | | 4,046,228 | |
| | 5,865,134 | | | Series 2005-QS17-A4 | | | 4.72% | # I/F I/O | | | 12/25/2035 | | | | 1,129,410 | |
| | 4,719,269 | | | Series 2005-QS17-A6 | | | 6.00% | | | | 12/25/2035 | | | | 4,070,628 | |
| | 1,913,740 | | | Series 2005-QS1-A5 | | | 5.50% | | | | 01/25/2035 | | | | 1,914,336 | |
| | 2,452,157 | | | Series 2005-QS5-A3 | | | 5.70% | | | | 04/25/2035 | | | | 2,288,618 | |
| | 1,952,729 | | | Series 2005-QS9-A1 | | | 0.93% | # | | | 06/25/2035 | | | | 1,588,332 | |
| | 4,771,735 | | | Series 2005-QS9-A4 | | | 4.57% | # I/F I/O | | | 06/25/2035 | | | | 756,095 | |
| | 2,349,867 | | | Series 2006-QS10-A4 | | | 5.75% | | | | 08/25/2036 | | | | 1,873,462 | |
| | 15,478,434 | | | Series 2006-QS11-1A1 | | | 6.50% | | | | 08/25/2036 | | | | 12,940,483 | |
| | 2,526,193 | | | Series 2006-QS12-1A1 | | | 6.50% | | | | 09/25/2036 | | | | 1,832,129 | |
| | 6,284,580 | | | Series 2006-QS12-2A18 | | | 5.75% | | | | 09/25/2036 | | | | 5,073,844 | |
| | 9,558,100 | | | Series 2006-QS14-A18 | | | 6.25% | | | | 11/25/2036 | | | | 7,952,238 | |
| | 4,954,621 | | | Series 2006-QS15-A1 | | | 6.50% | | | | 10/25/2036 | | | | 4,075,171 | |
| | 1,935,700 | | | Series 2006-QS16-A10 | | | 6.00% | | | | 11/25/2036 | | | | 1,556,811 | |
| | 6,883,041 | | | Series 2006-QS16-A11 | | | 6.00% | | | | 11/25/2036 | | | | 5,535,772 | |
| | 2,009,237 | | | Series 2006-QS16-A7 | | | 6.00% | | | | 11/25/2036 | | | | 1,615,954 | |
| | 2,171,217 | | | Series 2006-QS16-A8 | | | 6.00% | | | | 11/25/2036 | | | | 1,746,229 | |
| | 859,191 | | | Series 2006-QS16-A9 | | | 6.00% | | | | 11/25/2036 | | | | 691,015 | |
| | 4,386,133 | | | Series 2006-QS17-A4 | | | 6.00% | | | | 12/25/2036 | | | | 3,582,991 | |
| | 24,367,460 | | | Series 2006-QS17-A5 | | | 6.00% | | | | 12/25/2036 | | | | 19,905,549 | |
| | 2,470,616 | | | Series 2006-QS1-A6 | | | 39.54% | # I/F | | | 01/25/2036 | | | | 5,125,361 | |
| | 17,213,009 | | | Series 2006-QS3-1A11 | | | 6.00% | | | | 03/25/2036 | | | | 14,709,542 | |
| | 3,860,732 | | | Series 2006-QS4-A8 | | | 8.00% | # I/F | | | 04/25/2036 | | | | 3,763,470 | |
| | 11,073,037 | | | Series 2006-QS5-A3 | | | 6.00% | | | | 05/25/2036 | | | | 9,483,120 | |
| | 33,001,814 | | | Series 2006-QS5-A4 | | | 6.00% | | | | 05/25/2036 | | | | 28,263,265 | |
| | 4,309,199 | | | Series 2006-QS6-1A16 | | | 6.00% | | | | 06/25/2036 | | | | 3,514,360 | |
| | 7,087,736 | | | Series 2006-QS6-1A2 | | | 6.00% | | | | 06/25/2036 | | | | 5,780,391 | |
| | 14,315,209 | | | Series 2006-QS8-A1 | | | 6.00% | | | | 08/25/2036 | | | | 11,267,923 | |
| | 24,824,662 | | | Series 2006-QS8-A5 | | | 5.12% | # I/F I/O | | | 08/25/2036 | | | | 5,054,631 | |
| | 8,008,801 | | | Series 2006-QS9-1A6 | | | 4.87% | # I/F I/O | | | 07/25/2036 | | | | 2,312,521 | |
| | 8,038,616 | | | Series 2007-QS11-A1 | | | 7.00% | | | | 10/25/2037 | | | | 6,582,635 | |
| | 27,355,988 | | | Series 2007-QS1-1A2 | | | 5.02% | # I/F I/O | | | 01/25/2037 | | | | 5,736,192 | |
| | 2,753,670 | | | Series 2007-QS1-1A4 | | | 6.00% | | | | 01/25/2037 | | | | 2,285,561 | |
| | | | | | |
| 26 | | DoubleLine Funds Trust | | | | The accompanying notes are an integral part of these financial statements. |
| | | | | | | | | | | | | | | | |
PRINCIPAL
AMOUNT $ | | | SECURITY DESCRIPTION | | RATE | | | MATURITY | | | VALUE $ | |
| |
| | | | Residential Accredit Loans, Inc., (Cont.) | |
| | 6,646,868 | | | Series 2007-QS1-2A10 | | | 6.00% | | | | 01/25/2037 | | | | 5,373,386 | |
| | 1,205,999 | | | Series 2007-QS2-A6 | | | 6.25% | | | | 01/25/2037 | | | | 961,402 | |
| | 43,684,639 | | | Series 2007-QS3-A1 | | | 6.50% | | | | 02/25/2037 | | | | 35,478,125 | |
| | 6,965,788 | | | Series 2007-QS3-A4 | | | 6.25% | | | | 02/25/2037 | | | | 5,560,157 | |
| | 11,134,354 | | | Series 2007-QS4-3A3 | | | 6.00% | | | | 03/25/2037 | | | | 9,474,785 | |
| | 5,150,500 | | | Series 2007-QS5-A1 | | | 5.50% | | | | 03/25/2037 | | | | 3,889,890 | |
| | 2,124,791 | | | Series 2007-QS5-A5 | | | 0.73% | # | | | 03/25/2037 | | | | 1,204,215 | |
| | 7,056,918 | | | Series 2007-QS5-A8 | | | 6.27% | # I/F I/O | | | 03/25/2037 | | | | 1,909,092 | |
| | 5,788,938 | | | Series 2007-QS6-A102 | | | 5.75% | | | | 04/25/2037 | | | | 4,710,877 | |
| | 1,861,312 | | | Series 2007-QS6-A13 | | | 51.39% | # I/F | | | 04/25/2037 | | | | 4,534,031 | |
| | 8,289,305 | | | Series 2007-QS6-A45 | | | 5.75% | | | | 04/25/2037 | | | | 6,745,607 | |
| | 13,210,591 | | | Series 2007-QS6-A6 | | | 6.25% | | | | 04/25/2037 | | | | 11,246,348 | |
| | 912,414 | | | Series 2007-QS6-A77 | | | 52.23% | # I/F | | | 04/25/2037 | | | | 2,258,529 | |
| | 10,022,009 | | | Series 2007-QS7-2A1 | | | 6.75% | | | | 06/25/2037 | | | | 6,379,022 | |
| | 43,422,627 | | | Series 2007-QS9-A33 | | | 6.50% | | | | 07/25/2037 | | | | 36,832,891 | |
| |
| | | | Residential Asset Mortgage Products, Inc., | |
| | 119,397 | | | Series 2004-RS4-AI6 | | | 5.07% | # | | | 04/25/2034 | | | | 122,447 | |
| | 982,887 | | | Series 2004-RS5-AI6 | | | 5.55% | # | | | 05/25/2034 | | | | 994,354 | |
| | 7,000,042 | | | Series 2004-RS7-A3 | | | 2.86% | # | | | 07/25/2034 | | | | 6,143,160 | |
| | 1,379,123 | | | Series 2004-RS7-AI6 | | | 5.22% | # | | | 07/25/2034 | | | | 1,309,720 | |
| | 421,842 | | | Series 2004-RS9-AI6 | | | 4.72% | # | | | 07/25/2034 | | | | 435,067 | |
| | 443,608 | | | Series 2004-RZ2-AI4 | | | 5.35% | # | | | 02/25/2033 | | | | 441,388 | |
| | 6,791,326 | | | Series 2005-RS1-AI5 | | | 5.41% | # | | | 01/25/2035 | | | | 6,836,594 | |
| | 54,412,384 | | | Series 2005-RS9-AI4 | | | 0.75% | # | | | 11/25/2035 | | | | 43,748,145 | |
| | 39,927,376 | | | Series 2006-RS2-A3A | | | 0.73% | # | | | 03/25/2036 | | | | 34,660,468 | |
| | 835,979 | | | Series 2006-RS5-A3 | | | 0.60% | # | | | 09/25/2036 | | | | 829,506 | |
| | 12,760,000 | | | Series 2006-RX5-A3 | | | 0.68% | # | | | 08/25/2046 | | | | 10,801,762 | |
| | 12,300,000 | | | Series 2006-RZ3-A3 | | | 0.72% | # | | | 08/25/2036 | | | | 11,255,469 | |
| |
| | | | Residential Asset Securities Corporation, | |
| | 288,221 | | | Series 2002-KS1-AI6 | | | 6.08% | # | | | 06/25/2032 | | | | 301,885 | |
| | 2,317,298 | | | Series 2003-KS11-MI1 | | | 5.13% | # | | | 01/25/2034 | | | | 2,220,896 | |
| | 1,496,241 | | | Series 2005-AHL3-A2 | | | 0.67% | # | | | 11/25/2035 | | | | 1,478,422 | |
| | 27,100,365 | | | Series 2005-KS11-M2 | | | 0.85% | # | | | 12/25/2035 | | | | 23,094,207 | |
| | 13,043,209 | | | Series 2006-EMX5-A3 | | | 0.59% | # | | | 07/25/2036 | | | | 11,421,661 | |
| | 35,541,697 | | | Series 2007-KS3-AI3 | | | 0.68% | # | | | 04/25/2037 | | | | 32,456,962 | |
| |
| | | | Residential Asset Securitization Trust, | |
| | 7,300,400 | | | Series 2005-A11-2A4 | | | 6.00% | | | | 10/25/2035 | | | | 5,816,745 | |
| | 4,570,852 | | | Series 2005-A12-A7 | | | 4.57% | # I/F I/O | | | 11/25/2035 | | | | 704,931 | |
| | 3,743,998 | | | Series 2005-A12-A8 | | | 0.98% | # | | | 11/25/2035 | | | | 2,703,426 | |
| | 14,798,948 | | | Series 2005-A13-2A1 | | | 5.50% | | | | 10/25/2035 | | | | 11,138,636 | |
| | 14,337,773 | | | Series 2005-A15-5A3 | | | 5.75% | | | | 02/25/2036 | | | | 11,186,362 | |
| | 2,729,487 | | | Series 2005-A7-A3 | | | 5.50% | | | | 06/25/2035 | | | | 2,380,630 | |
| | 6,886,950 | | | Series 2005-A8CB-A11 | | | 6.00% | | | | 07/25/2035 | | | | 6,514,765 | |
| | 6,859,438 | | | Series 2005-A8CB-A2 | | | 4.57% | # I/F I/O | | | 07/25/2035 | | | | 1,337,179 | |
| | 6,979,477 | | | Series 2006-A10-A5 | | | 6.50% | | | | 09/25/2036 | | | | 4,897,956 | |
| | 1,123,033 | | | Series 2006-A1-1A3 | | | 6.00% | | | | 04/25/2036 | | | | 885,706 | |
| | 9,991,239 | | | Series 2006-A12-A1 | | | 6.25% | | | | 11/25/2036 | | | | 6,832,132 | |
| | 9,602,298 | | | Series 2006-A13-A1 | | | 6.25% | | | | 12/25/2036 | | | | 6,401,723 | |
| | 19,701,011 | | | Series 2006-A1-3A2 | | | 6.00% | | | | 04/25/2036 | | | | 14,991,557 | |
| | 17,920,512 | | | Series 2006-A14C-2A6 | | | 0.88% | # | | | 12/25/2036 | | | | 4,838,726 | |
| | 39,547,882 | | | Series 2006-A14C-2A7 | | | 6.12% | # I/F I/O | | | 12/25/2036 | | | | 15,216,530 | |
| | 9,081,675 | | | Series 2006-A2-A11 | | | 6.00% | | | | 01/25/2046 | | | | 6,863,538 | |
| | 6,287,600 | | | Series 2006-A2-A4 | | | 6.00% | | | | 01/25/2046 | | | | 4,751,897 | |
| | 995,308 | | | Series 2006-A4-2A5 | | | 6.00% | | | | 05/25/2036 | | | | 909,298 | |
| | 6,135,236 | | | Series 2006-A8-1A1 | | | 6.00% | | | | 08/25/2036 | | | | 5,543,911 | |
| | 7,790,413 | | | Series 2006-R1-A1 | | | 26.67% | # I/F | | | 01/25/2046 | | | | 14,654,502 | |
| | 45,248,185 | | | Series 2007-A2-1A2 | | | 6.00% | | | | 04/25/2037 | | | | 37,994,856 | |
| | 1,270,455 | | | Series 2007-A3-1A2 | | | 43.06% | # I/F | | | 04/25/2037 | | | | 3,071,435 | |
| | 25,727,303 | | | Series 2007-A5-1A4 | | | 5.67% | # I/F I/O | | | 05/25/2037 | | | | 6,357,909 | |
| | 6,639,053 | | | Series 2007-A5-1A6 | | | 0.83% | # | | | 05/25/2037 | | | | 1,368,805 | |
| | 9,603,482 | | | Series 2007-A5-2A3 | | | 6.00% | | | | 05/25/2037 | | | | 8,109,769 | |
| | 4,208,716 | | | Series 2007-A5-2A5 | | | 6.00% | | | | 05/25/2037 | | | | 3,554,097 | |
| | 17,507,264 | | | Series 2007-A6-1A2 | | | 6.00% | | | | 06/25/2037 | | | | 15,357,619 | |
| | 11,320,484 | | | Series 2007-A7-A1 | | | 6.00% | | | | 07/25/2037 | | | | 7,878,386 | |
| | 49,794,762 | | | Series 2007-A7-A2 | | | 6.00% | | | | 07/25/2037 | | | | 34,654,201 | |
| | 22,063,008 | | | Series 2007-A7-A6 | | | 6.00% | | | | 07/25/2037 | | | | 15,354,545 | |
| |
| | | | Residential Funding Mortgage Securities Trust, | |
| | 1,953,386 | | | Series 2003-S16-A1 | | | 4.75% | | | | 09/25/2018 | | | | 1,962,086 | |
| | 4,879,690 | | | Series 2005-S9-A10 | | | 6.25% | | | | 12/25/2035 | | | | 4,611,428 | |
| | 12,791,717 | | | Series 2005-S9-A6 | | | 5.75% | | | | 12/25/2035 | | | | 12,715,328 | |
| | 951,087 | | | Series 2005-S9-A8 | | | 5.50% | | | | 12/25/2035 | | | | 926,645 | |
| | 16,638,142 | | | Series 2006-S10-1A1 | | | 6.00% | | | | 10/25/2036 | | | | 14,841,771 | |
| | | | | | | | | | | | | | | | |
PRINCIPAL
AMOUNT $ | | | SECURITY DESCRIPTION | | RATE | | | MATURITY | | | VALUE $ | |
| |
| | | | Residential Funding Mortgage Securities Trust, (Cont.) | |
| | 28,801,319 | | | Series 2006-S11-A1 | | | 6.00% | | | | 11/25/2036 | | | | 26,893,229 | |
| | 5,304,370 | | | Series 2006-S5-A12 | | | 6.00% | | | | 06/25/2036 | | | | 4,838,000 | |
| | 363,160 | | | Series 2006-S5-A15 | | | 6.00% | | | | 06/25/2036 | | | | 331,230 | |
| | 9,179,125 | | | Series 2006-S9-A1 | | | 6.25% | | | | 09/25/2036 | | | | 8,491,312 | |
| | 7,073,189 | | | Series 2007-S1-A7 | | | 6.00% | | | | 01/25/2037 | | | | 6,417,363 | |
| | 6,137,681 | | | Series 2007-S2-A1 | | | 6.00% | | | | 02/25/2037 | | | | 5,592,126 | |
| | 6,914,773 | | | Series 2007-S2-A4 | | | 6.00% | | | | 02/25/2037 | | | | 6,300,145 | |
| | 12,909,091 | | | Series 2007-S2-A5 | | | 6.00% | | | | 02/25/2037 | | | | 11,761,651 | |
| | 2,017,261 | | | Series 2007-S2-A9 | | | 6.00% | | | | 02/25/2037 | | | | 1,837,954 | |
| | 5,971,030 | | | Series 2007-S3-1A4 | | | 6.00% | | | | 03/25/2037 | | | | 5,401,343 | |
| | 1,971,345 | | | Series 2007-S4-A1 | | | 6.00% | | | | 04/25/2037 | | | | 1,750,753 | |
| | 5,262,454 | | | Series 2007-S4-A2 | | | 6.00% | | | | 04/25/2037 | | | | 4,673,590 | |
| | 41,998,195 | | | Series 2007-S5-A1 | | | 6.00% | | | | 05/25/2037 | | | | 38,098,335 | |
| | 12,171,243 | | | Series 2007-S5-A8 | | | 6.00% | | | | 05/25/2037 | | | | 11,041,048 | |
| | 6,497,267 | | | Series 2007-S6-2A4 | | | 6.00% | | | | 06/25/2037 | | | | 6,011,744 | |
| | 33,843,889 | | | Series 2007-S7-A20 | | | 6.00% | | | | 07/25/2037 | | | | 30,584,381 | |
| | 14,105,308 | | | Series 2007-S8-1A1 | | | 6.00% | | | | 09/25/2037 | | | | 12,544,399 | |
| | 6,249,308 | | | Series 2007-SA1-4A | | | 5.97% | # | | | 02/25/2037 | | | | 5,480,872 | |
| | 14,065,857 | | | Series 2007-SA2-2A1 | | | 3.36% | # | | | 04/25/2037 | | | | 11,923,544 | |
| |
| | | | RMAT LLC, | |
| | 44,167,074 | | | Series 2015-PR2-A1 | | | 5.85% | #^�� | | | 11/25/2035 | | | | 44,322,622 | |
| | 29,696,885 | | | Series 2015-RPL1-A1 | | | 3.97% | #^ | | | 05/26/2020 | | | | 29,476,317 | |
| |
| | | | Saxon Asset Securities Trust, | |
| | 58,952,602 | | | Series 2006-3-A3 | | | 0.60% | # | | | 10/25/2046 | | | | 47,555,296 | |
| |
| | | | Securitized Mortgage Asset Loan Trust, | |
| | 400,088,209 | | | Series 2015-1-PC | | | 4.02% | #^¥ | | | 02/25/2054 | | | | 296,619,317 | |
| | 80,913,443 | | | Series 2015-2-PC | | | 3.57% | ^¥ | | | 12/26/2059 | | | | 71,503,194 | |
| | 141,056,660 | | | Series 2015-3-PC | | | 3.59% | ^¥ | | | 10/25/2044 | | | | 131,966,348 | |
| |
| | | | Sequoia Mortgage Trust, | |
| | 280,598 | | | Series 2003-4-2A1 | | | 0.78% | # | | | 07/20/2033 | | | | 263,755 | |
| | 13,629,191 | | | Series 2013-2-A | | | 1.87% | # | | | 02/25/2043 | | | | 12,950,144 | |
| | 112,521,567 | | | Series 2015-4-A1 | | | 3.00% | #^ | | | 11/25/2030 | | | | 114,989,007 | |
| |
| | | | SG Mortgage Securities Trust, | |
| | 20,679,194 | | | Series 2006-FRE1-A1A | | | 0.60% | # | | | 02/25/2036 | | | | 18,542,752 | |
| |
| | | | Shellpoint Co-Originator Trust, | |
| | 93,205,754 | | | Series 2015-1-A3 | | | 3.50% | #^ | | | 08/25/2045 | | | | 94,637,087 | |
| |
| | | | Soundview Home Equity Loan Trust, | |
| | 2,728,280 | | | Series 2007-NS1-A2 | | | 0.58% | # | | | 01/25/2037 | | | | 2,720,424 | |
| | 21,880,000 | | | Series 2007-NS1-A3 | | | 0.63% | # | | | 01/25/2037 | | | | 18,417,361 | |
| |
| | | | Springleaf Mortgage Loan Trust, | |
| | 118,132,750 | | | Series 2013-1A-B3F | | | 6.00% | #^ | | | 06/25/2058 | | | | 118,042,697 | |
| | 61,983,000 | | | Series 2013-2A-B1 | | | 6.00% | #^ | | | 12/25/2065 | | | | 62,311,423 | |
| |
| | | | STARM Mortgage Loan Trust, | |
| | 20,315,031 | | | Series 2007-2-1A1 | | | 3.05% | # | | | 04/25/2037 | | | | 16,926,918 | |
| | 10,878,576 | | | Series 2007-3-1A1 | | | 2.75% | # | | | 06/25/2037 | | | | 9,639,652 | |
| |
| | | | Structured Adjustable Rate Mortgage Loan Trust, | |
| | 9,924,216 | | | Series 2004-12-8A | | | 2.66% | # | | | 09/25/2034 | | | | 9,697,034 | |
| | 4,020,550 | | | Series 2006-1-8A1 | | | 2.85% | # | | | 02/25/2036 | | | | 2,880,227 | |
| | 6,639,501 | | | Series 2006-6-3A1 | | | 4.10% | # | | | 07/25/2036 | | | | 5,354,466 | |
| |
| | | | Structured Asset Securities Corporation, | |
| | 58,269 | | | Series 2003-18XS-A6 | | | 4.54% | # | | | 06/25/2033 | | | | 58,293 | |
| | 3,914,744 | | | Series 2003-24A-1A3 | | | 2.55% | # | | | 07/25/2033 | | | | 3,832,459 | |
| | 9,208,209 | | | Series 2003-35-1A1 | | | 5.23% | # | | | 12/25/2033 | | | | 9,471,133 | |
| | 2,687,378 | | | Series 2004-11XS-2A2 | | | 5.40% | # | | | 06/25/2034 | | | | 3,151,616 | |
| | 1,791,117 | | | Series 2004-15-2A1 | | | 4.75% | | | | 09/25/2019 | | | | 1,808,046 | |
| | 8,203,072 | | | Series 2004-22-A2 | | | 5.07% | # | | | 01/25/2035 | | | | 8,434,325 | |
| | 26,011,756 | | | Series 2005-10-1A1 | | | 5.75% | | | | 06/25/2035 | | | | 25,060,506 | |
| | 2,756,315 | | | Series 2005-10-6A1 | | | 5.00% | | | | 06/25/2020 | | | | 2,808,439 | |
| | 6,256,260 | | | Series 2005-13-3A1 | | | 6.00% | | | | 09/25/2035 | | | | 5,199,497 | |
| | 2,132,208 | | | Series 2005-14-1A1 | | | 0.73% | # | | | 07/25/2035 | | | | 1,791,737 | |
| | 863,002 | | | Series 2005-14-1A4 | | | 22.60% | # I/F | | | 07/25/2035 | | | | 1,197,239 | |
| | 41,261,314 | | | Series 2005-14-4A1 | | | 5.75% | | | | 07/25/2035 | | | | 41,694,442 | |
| | 3,957,142 | | | Series 2005-15-1A1 | | | 5.50% | | | | 08/25/2035 | | | | 4,149,001 | |
| | 7,415,155 | | | Series 2005-15-2A7 | | | 5.50% | | | | 08/25/2035 | | | | 7,284,026 | |
| | 12,860,639 | | | Series 2005-15-3A1 | | | 4.78% | # | | | 08/25/2035 | | | | 12,579,870 | |
| | 7,780,481 | | | Series 2005-16-1A2 | | | 5.50% | | | | 09/25/2035 | | | | 7,847,686 | |
| | 9,046,522 | | | Series 2005-3-1A6 | | | 5.75% | | | | 03/25/2035 | | | | 8,484,758 | |
| | 2,371,172 | | | Series 2005-6-4A1 | | | 5.00% | | | | 05/25/2035 | | | | 2,395,814 | |
| | | | | | |
| The accompanying notes are an integral part of these financial statements. | | Annual Report | | March 31, 2016 | | 27 |
| | |
| Schedule of Investments DoubleLine Total Return Bond Fund (Cont.) | | March 31, 2016 |
| | | | | | | | | | | | | | | | |
PRINCIPAL
AMOUNT $ | | | SECURITY DESCRIPTION | | RATE | | | MATURITY | | | VALUE $ | |
| |
| | | | Structured Asset Securities Corporation, (Cont.) | |
| | 69,502,884 | | | Series 2006-BC4-A4 | | | 0.60% | # | | | 12/25/2036 | | | | 58,924,260 | |
| | 141,846,092 | | | Series 2007-4-1A3 | | | 5.70% | # I/F I/O ^ | | | 03/28/2045 | | | | 26,691,463 | |
| |
| | | | Suntrust Alternative Loan Trust, | |
| | 1,251,117 | | | Series 2005-1F-2A3 | | | 5.75% | | | | 12/25/2035 | | | | 1,136,682 | |
| | 2,074,246 | | | Series 2006-1F-1A3 | | | 6.00% | | | | 04/25/2036 | | | | 1,592,258 | |
| |
| | | | Thornburg Mortgage Securities Trust, | |
| | 1,020,443 | | | Series 2003-6-A2 | | | 1.43% | # | | | 12/25/2033 | | | | 949,615 | |
| | 8,086,510 | | | Series 2004-4-5A | | | 2.57% | # | | | 12/25/2044 | | | | 7,678,821 | |
| | 23,598,092 | | | Series 2007-1-A1 | | | 2.54% | # | | | 03/25/2037 | | | | 22,512,847 | |
| | 6,091,030 | | | Series 2007-1-A2A | | | 2.54% | # | | | 03/25/2037 | | | | 5,415,176 | |
| |
| | | | Towd Point Mortgage Trust, | |
| | 17,034,706 | | | Series 2015-1-AE | | | 3.00% | ^ | | | 10/25/2053 | | | | 17,112,104 | |
| | 15,756,065 | | | Series 2015-1-AES | | | 3.00% | ^ | | | 10/25/2053 | | | | 15,869,976 | |
| | 8,762,520 | | | Series 2015-2-1A12 | | | 2.75% | ^ | | | 11/25/2060 | | | | 8,842,492 | |
| | 28,040,066 | | | Series 2015-2-1A13 | | | 2.50% | #^ | | | 11/25/2060 | | | | 28,061,724 | |
| | 86,043,958 | | | Series 2015-5-A1B | | | 2.75% | #^ | | | 05/25/2055 | | | | 86,173,230 | |
| | 99,582,500 | | | Series 2015-6-A1B | | | 2.75% | #^ | | | 04/25/2055 | | | | 99,611,419 | |
| |
| | | | VOLT LLC, | |
| | 36,715,295 | | | Series 2015-NPL5-A1 | | | 3.50% | #^ | | | 03/25/2055 | | | | 36,188,251 | |
| | 197,757,269 | | | Series 2016-NPL1-A1 | | | 4.25% | #^ | | | 02/26/2046 | | | | 198,018,091 | |
| |
| | | | Washington Mutual Mortgage Pass-Through Certificates, | |
| | 9,622,713 | | | Series 2005-1-2A | | | 6.00% | | | | 03/25/2035 | | | | 8,846,383 | |
| | 4,007,107 | | | Series 2005-4-5A1 | | | 5.50% | | | | 06/25/2035 | | | | 3,729,963 | |
| | 1,524,558 | | | Series 2005-5-CB12 | | | 45.84% | # I/F | | | 07/25/2035 | | | | 3,307,639 | |
| | 4,936,892 | | | Series 2005-5-CB6 | | | 1.03% | # | | | 07/25/2035 | | | | 3,942,732 | |
| | 1,500,465 | | | Series 2005-6-2A7 | | | 5.50% | | | | 08/25/2035 | | | | 1,374,867 | |
| | 1,825,157 | | | Series 2005-7-3CB | | | 6.50% | | | | 08/25/2035 | | | | 1,450,292 | |
| | 20,217,326 | | | Series 2005-8-1A2 | | | 5.50% | | | | 10/25/2035 | | | | 18,735,616 | |
| | 16,414,735 | | | Series 2005-9-2A2 | | | 5.50% | | | | 11/25/2035 | | | | 16,097,544 | |
| | 4,114,531 | | | Series 2005-9-CX | | | 5.50% | I/O | | | 11/25/2035 | | | | 975,738 | |
| | 6,047,179 | | | Series 2006-1-3A1 | | | 5.75% | | | | 02/25/2036 | | | | 5,569,946 | |
| | 3,062,240 | | | Series 2006-1-3A2 | | | 5.75% | | | | 02/25/2036 | | | | 2,820,573 | |
| | 2,600,915 | | | Series 2006-1-3A7 | | | 5.75% | | | | 02/25/2036 | | | | 2,395,655 | |
| | 3,706,955 | | | Series 2006-5-1A8 | | | 5.75% | | | | 07/25/2036 | | | | 3,083,799 | |
| | 7,021,584 | | | Series 2006-5-2CB1 | | | 6.00% | | | | 07/25/2036 | | | | 5,562,608 | |
| | 12,754,151 | | | Series 2006-5-2CB6 | | | 6.00% | | | | 07/25/2036 | | | | 10,104,036 | |
| | 8,008,337 | | | Series 2006-5-3A5 | | | 6.45% | # | | | 07/25/2036 | | | | 3,767,436 | |
| | 4,874,489 | | | Series 2006-9-A7 | | | 4.96% | # | | | 10/25/2036 | | | | 2,770,254 | |
| | 15,358,106 | | | Series 2006-AR10-1A1 | | | 2.43% | # | | | 09/25/2036 | | | | 13,878,190 | |
| | 24,033,875 | | | Series 2006-AR15-1A | | | 1.19% | # | | | 11/25/2046 | | | | 18,484,600 | |
| | 1,870,586 | | | Series 2006-AR6-2A3 | | | 4.26% | # | | | 08/25/2036 | | | | 1,658,519 | |
| | 19,311,496 | | | Series 2007-2-1A2 | | | 6.00% | | | | 04/25/2037 | | | | 16,213,927 | |
| | 19,752,815 | | | Series 2007-2-1A6 | | | 6.00% | | | | 04/25/2037 | | | | 16,584,457 | |
| | 13,813,255 | | | Series 2007-3-A3 | | | 6.00% | | | | 04/25/2037 | | | | 11,654,536 | |
| | 11,271,148 | | | Series 2007-4-1A1 | | | 5.50% | | | | 06/25/2037 | | | | 10,507,395 | |
| | 623,318 | | | Series 2007-5-A11 | | | 36.88% | # I/F | | | 06/25/2037 | | | | 1,536,027 | |
| | 15,582,947 | | | Series 2007-5-A6 | | | 6.00% | | | | 06/25/2037 | | | | 13,738,661 | |
| | 28,238,433 | | | Series 2007-HY3-4A1 | | | 2.54% | # | | | 03/25/2037 | | | | 26,622,065 | |
| | 27,822,339 | | | Series 2007-HY5-1A1 | | | 2.08% | # | | | 05/25/2037 | | | | 24,002,360 | |
| | 23,881,291 | | | Series 2007-HY6-2A3 | | | 2.26% | # | | | 06/25/2037 | | | | 21,430,731 | |
| |
| | | | Wells Fargo Alternative Loan Trust, | |
| | 2,704,731 | | | Series 2007-PA1-A10 | | | 6.00% | | | | 03/25/2037 | | | | 2,439,833 | |
| | 11,875,876 | | | Series 2007-PA1-A3 | | | 6.00% | | | | 03/25/2037 | | | | 10,712,770 | |
| | 10,239,603 | | | Series 2007-PA1-A5 | | | 6.00% | | | | 03/25/2037 | | | | 9,236,751 | |
| | 16,782,196 | | | Series 2007-PA1-A6 | | | 6.00% | | | | 03/25/2037 | | | | 15,138,573 | |
| | 81,183,570 | | | Series 2007-PA2-1A1 | | | 6.00% | | | | 06/25/2037 | | | | 78,690,982 | |
| | 11,229,489 | | | Series 2007-PA2-3A1 | | | 0.78% | # | | | 06/25/2037 | | | | 7,845,207 | |
| | 16,542,775 | | | Series 2007-PA2-3A2 | | | 6.22% | # I/F I/O | | | 06/25/2037 | | | | 4,460,036 | |
| | 1,042,649 | | | Series 2007-PA3-1A4 | | | 5.75% | | | | 07/25/2037 | | | | 919,994 | |
| | 26,879,733 | | | Series 2007-PA3-2A1 | | | 6.00% | | | | 07/25/2037 | | | | 25,065,332 | |
| | 10,679,490 | | | Series 2007-PA3-2A4 | | | 6.00% | | | | 07/25/2037 | | | | 9,958,617 | |
| | 18,507,030 | | | Series 2007-PA3-3A1 | | | 6.25% | | | | 07/25/2037 | | | | 16,737,986 | |
| | 10,626,019 | | | Series 2007-PA3-4A3 | | | 6.50% | | | | 07/25/2037 | | | | 8,648,466 | |
| | 138,812,873 | | | Series 2007-PA5-1A1 | | | 6.25% | | | | 11/25/2037 | | | | 133,607,307 | |
| | 471,597 | | | Series 2007-PA5-2A1 | | | 6.00% | | | | 11/25/2022 | | | | 478,121 | |
| | 11,239,157 | | | Series 2007-PA6-A1 | | | 2.74% | # | | | 12/28/2037 | | | | 9,460,183 | |
| |
| | | | Wells Fargo Mortgage Backed Securities Trust, | |
| | 20,372,120 | | | Series 2004-Y-3A3 | | | 2.80% | # | | | 11/25/2034 | | | | 20,684,698 | |
| | 37,881,045 | | | Series 2005-17-1A1 | | | 5.50% | | | | 01/25/2036 | | | | 37,154,702 | |
| | 87,678 | | | Series 2005-4-A7 | | | 22.17% | # I/F | | | 04/25/2035 | | | | 114,158 | |
| | | | | | | | | | | | | | | | |
PRINCIPAL
AMOUNT $ | | | SECURITY DESCRIPTION | | RATE | | | MATURITY | | | VALUE $ | |
| |
| | | | Wells Fargo Mortgage Backed Securities Trust, (Cont.) | |
| | 3,271,918 | | | Series 2005-8-A1 | | | 5.50% | | | | 10/25/2035 | | | | 3,382,015 | |
| | 2,974,230 | | | Series 2005-AR16-6A4 | | | 2.76% | # | | | 10/25/2035 | | | | 2,853,673 | |
| | 7,233,629 | | | Series 2006-12-A3 | | | 6.00% | | | | 10/25/2036 | | | | 7,046,682 | |
| | 8,513,606 | | | Series 2006-14-A1 | | | 6.00% | | | | 10/25/2036 | | | | 8,502,508 | |
| | 10,488,249 | | | Series 2006-15-A1 | | | 6.00% | | | | 11/25/2036 | | | | 10,124,319 | |
| | 125,533 | | | Series 2006-2-1A4 | | | 18.20% | # I/F | | | 03/25/2036 | | | | 181,370 | |
| | 6,504,777 | | | Series 2006-2-3A1 | | | 5.75% | | | | 03/25/2036 | | | | 6,621,801 | |
| | 25,196,400 | | | Series 2006-3-A11 | | | 5.50% | | | | 03/25/2036 | | | | 25,645,733 | |
| | 5,703,583 | | | Series 2006-3-A6 | | | 5.50% | | | | 03/25/2036 | | | | 5,718,799 | |
| | 386,897 | | | Series 2006-4-2A2 | | | 5.50% | | | | 04/25/2036 | | | | 361,329 | |
| | 5,928,824 | | | Series 2006-6-2A1 | | | 0.83% | # | | | 05/25/2036 | | | | 4,943,241 | |
| | 5,928,824 | | | Series 2006-6-2A2 | | | 6.67% | # I/F I/O | | | 05/25/2036 | | | | 1,534,447 | |
| | 2,676,914 | | | Series 2006-9-2A1 | | | 0.00% | P/O | | | 08/25/2036 | | | | 1,392,487 | |
| | 2,676,914 | | | Series 2006-9-2A2 | | | 6.00% | I/O | | | 08/25/2036 | | | | 619,384 | |
| | 13,945,231 | | | Series 2006-AR12-1A1 | | | 2.74% | # | | | 09/25/2036 | | | | 13,129,504 | |
| | 7,244,654 | | | Series 2006-AR13-A2 | | | 2.74% | # | | | 09/25/2036 | | | | 6,697,074 | |
| | 7,620,243 | | | Series 2006-AR4-2A1 | | | 3.40% | # | | | 04/25/2036 | | | | 6,989,973 | |
| | 2,538,521 | | | Series 2007-10-1A18 | | | 6.00% | | | | 07/25/2037 | | | | 2,526,990 | |
| | 4,758,867 | | | Series 2007-10-2A11 | | | 6.00% | | | | 07/25/2037 | | | | 4,561,563 | |
| | 2,634,509 | | | Series 2007-11-A14 | | | 6.00% | | | | 08/25/2037 | | | | 2,602,985 | |
| | 5,258,206 | | | Series 2007-11-A36 | | | 6.00% | | | | 08/25/2037 | | | | 5,195,288 | |
| | 3,736,844 | | | Series 2007-11-A96 | | | 6.00% | | | | 08/25/2037 | | | | 3,692,129 | |
| | 45,348,250 | | | Series 2007-14-1A1 | | | 6.00% | | | | 10/25/2037 | | | | 44,621,835 | |
| | 26,853,452 | | | Series 2007-2-1A1 | | | 6.00% | | | | 03/25/2037 | | | | 26,380,563 | |
| | 1,554,092 | | | Series 2007-2-1A18 | | | 5.75% | | | | 03/25/2037 | | | | 1,515,099 | |
| | 3,500,227 | | | Series 2007-2-1A9 | | | 6.00% | | | | 03/25/2037 | | | | 3,438,588 | |
| | 1,287,411 | | | Series 2007-2-3A2 | | | 5.25% | | | | 03/25/2037 | | | | 1,317,647 | |
| | 2,866,438 | | | Series 2007-3-1A3 | | | 6.00% | | | | 04/25/2037 | | | | 2,806,709 | |
| | 2,799,050 | | | Series 2007-4-A11 | | | 6.50% | | | | 04/25/2037 | | | | 2,799,482 | |
| | 10,752,111 | | | Series 2007-4-A15 | | | 6.00% | | | | 04/25/2037 | | | | 10,578,846 | |
| | 6,342,083 | | | Series 2007-4-A3 | | | 6.00% | | | | 04/25/2037 | | | | 6,239,883 | |
| | 6,688,576 | | | Series 2007-4-A8 | | | 6.00% | | | | 04/25/2037 | | | | 6,580,793 | |
| | 7,762,709 | | | Series 2007-6-A4 | | | 6.00% | | | | 05/25/2037 | | | | 7,721,508 | |
| | 3,709,400 | | | Series 2007-6-A6 | | | 6.00% | | | | 05/25/2037 | | | | 3,689,712 | |
| | 11,880,537 | | | Series 2007-7-A1 | | | 6.00% | | | | 06/25/2037 | | | | 11,806,278 | |
| | 826,268 | | | Series 2007-7-A32 | | | 5.75% | | | | 06/25/2037 | | | | 814,428 | |
| | 26,754,095 | | | Series 2007-7-A34 | | | 6.00% | | | | 06/25/2037 | | | | 26,586,869 | |
| | 7,221,829 | | | Series 2007-7-A36 | | | 6.00% | | | | 06/25/2037 | | | | 7,176,689 | |
| | 2,464,356 | | | Series 2007-7-A43 | | | 0.93% | # | | | 06/25/2037 | | | | 2,065,594 | |
| | 6,732,569 | | | Series 2007-7-A49 | | | 6.00% | | | | 06/25/2037 | | | | 6,690,487 | |
| | 2,850,213 | | | Series 2007-7-A8 | | | 0.93% | # | | | 06/25/2037 | | | | 2,389,015 | |
| | 1,285,781 | | | Series 2007-7-A9 | | | 36.40% | # I/F | | | 06/25/2037 | | | | 2,178,128 | |
| | 2,015,941 | | | Series 2007-8-1A13 | | | 0.80% | # | | | 07/25/2037 | | | | 1,719,411 | |
| | 2,015,941 | | | Series 2007-8-1A14 | | | 37.18% | # I/F | | | 07/25/2037 | | | | 3,519,162 | |
| | 32,759,037 | | | Series 2007-8-1A16 | | | 6.00% | | | | 07/25/2037 | | | | 32,381,853 | |
| | 21,859,602 | | | Series 2007-8-1A2 | | | 6.00% | | | | 07/25/2037 | | | | 21,607,912 | |
| | 3,090,313 | | | Series 2007-8-1A20 | | | 6.00% | | | | 07/25/2037 | | | | 3,054,732 | |
| | 27,609,915 | | | Series 2007-8-1A22 | | | 6.00% | | | | 07/25/2037 | | | | 27,292,028 | |
| | 9,609,302 | | | Series 2007-8-1A3 | | | 6.00% | | | | 07/25/2037 | | | | 9,498,664 | |
| | 12,110,194 | | | Series 2007-8-2A9 | | | 6.00% | | | | 07/25/2037 | | | | 12,310,469 | |
| | 61,965,096 | | | Series 2007-AR9-A1 | | | 6.00% | # | | | 12/28/2037 | | | | 60,217,271 | |
| |
| | | | Wells Fargo Mortgage Loan Trust, | |
| | 3,832,333 | | | Series 2012-RR1-A1 | | | 2.85% | #^ | | | 08/27/2037 | | | | 3,831,114 | |
| |
| | | | WinWater Mortgage Loan Trust, | |
| | 39,908,697 | | | Series 2015-4-A5 | | | 3.50% | #^ | | | 06/20/2045 | | | | 40,512,795 | |
| | 130,817,001 | | | Series 2015-5-A3 | | | 3.50% | #^ | | | 08/20/2045 | | | | 133,331,840 | |
| | 34,518,477 | | | Series 2016-1-1A5 | | | 3.50% | #^ | | | 01/20/2046 | | | | 35,669,751 | |
| | | | | | | | | | | | | | | | |
| | | | Total Non-Agency Residential Collateralized Mortgage Obligations
(Cost $12,439,485,558) | | | | 12,171,510,334 | |
| | | | | | | | | | | | | | | | |
| | US GOVERNMENT / AGENCY MORTGAGE BACKED OBLIGATIONS 48.8% | |
| |
| | | | Federal Home Loan Mortgage Corporation, | |
| | 13,986,666 | | | Pool C03490 | | | 4.50% | | | | 08/01/2040 | | | | 15,248,134 | |
| | 77,636,298 | | | Pool C91388 | | | 3.50% | | | | 02/01/2032 | | | | 82,100,704 | |
| | 40,556,549 | | | Pool C91403 | | | 3.50% | | | | 03/01/2032 | | | | 42,887,592 | |
| | 40,243,275 | | | Pool C91413 | | | 3.50% | | | | 12/01/2031 | | | | 42,554,867 | |
| | 20,075,227 | | | Pool C91417 | | | 3.50% | | | | 01/01/2032 | | | | 21,228,562 | |
| | 81,285,282 | | | Pool C91447 | | | 3.50% | | | | 05/01/2032 | | | | 85,960,056 | |
| | 88,271,737 | | | Pool C91594 | | | 3.00% | | | | 01/01/2033 | | | | 91,892,066 | |
| | 25,874,628 | | | Pool C91596 | | | 3.00% | | | | 02/01/2033 | | | | 26,935,605 | |
| | 13,913,197 | | | Pool D98901 | | | 3.50% | | | | 01/01/2032 | | | | 14,713,207 | |
| | | | | | |
| 28 | | DoubleLine Funds Trust | | | | The accompanying notes are an integral part of these financial statements. |
| | | | | | | | | | | | | | | | |
PRINCIPAL
AMOUNT $ | | | SECURITY DESCRIPTION | | RATE | | | MATURITY | | | VALUE $ | |
| |
| | | | Federal Home Loan Mortgage Corporation, (Cont.) | |
| | 38,485,183 | | | Pool D98923 | | | 3.50% | | | | 01/01/2032 | | | | 40,691,438 | |
| | 33,864,361 | | | Pool D99724 | | | 3.00% | | | | 11/01/2032 | | | | 35,253,240 | |
| | 34,487,340 | | | Pool G01840 | | | 5.00% | | | | 07/01/2035 | | | | 38,299,817 | |
| | 7,447,785 | | | Pool G04817 | | | 5.00% | | | | 09/01/2038 | | | | 8,182,477 | |
| | 18,914,836 | | | Pool G06172 | | | 5.50% | | | | 12/01/2038 | | | | 21,206,913 | |
| | 26,387,252 | | | Pool G06954 | | | 6.00% | | | | 05/01/2040 | | | | 30,000,757 | |
| | 37,355,706 | | | Pool G07011 | | | 6.00% | | | | 05/01/2040 | | | | 42,554,501 | |
| | 31,404,746 | | | Pool G07801 | | | 4.00% | | | | 10/01/2044 | | | | 33,747,561 | |
| | 61,340,165 | | | Pool G07862 | | | 4.00% | | | | 01/01/2044 | | | | 65,915,877 | |
| | 69,192,838 | | | Pool G07905 | | | 4.00% | | | | 01/01/2042 | | | | 74,151,826 | |
| | 99,341,773 | | | Pool G08534 | | | 3.00% | | | | 06/01/2043 | | | | 101,929,455 | |
| | 31,850,007 | | | Pool G08537 | | | 3.00% | | | | 07/01/2043 | | | | 32,678,006 | |
| | 87,417,570 | | | Pool G08614 | | | 3.00% | | | | 11/01/2044 | | | | 89,636,178 | |
| | 102,049,864 | | | Pool G08619 | | | 3.00% | | | | 12/01/2044 | | | | 104,639,831 | |
| | 133,126,969 | | | Pool G08622 | | | 3.00% | | | | 01/01/2045 | | | | 136,505,656 | |
| | 248,741,257 | | | Pool G08626 | | | 3.00% | | | | 02/01/2045 | | | | 255,054,168 | |
| | 129,871,315 | | | Pool G08631 | | | 3.00% | | | | 03/01/2045 | | | | 133,167,375 | |
| | 322,959,203 | | | Pool G08635 | | | 3.00% | | | | 04/01/2045 | | | | 331,155,723 | |
| | 94,311,812 | | | Pool G08640 | | | 3.00% | | | | 05/01/2045 | | | | 96,705,392 | |
| | 483,776,500 | | | Pool G08648 | | | 3.00% | | | | 06/01/2045 | | | | 496,054,472 | |
| | 93,256,801 | | | Pool G08653 | | | 3.00% | | | | 07/01/2045 | | | | 95,623,605 | |
| | 51,063,626 | | | Pool G08658 | | | 3.00% | | | | 08/01/2045 | | | | 52,359,592 | |
| | 64,017,095 | | | Pool G08670 | | | 3.00% | | | | 10/01/2045 | | | | 65,641,812 | |
| | 740,716,643 | | | Pool G08675 | | | 3.00% | | | | 11/01/2045 | | | | 759,515,609 | |
| | 319,321,887 | | | Pool G08680 | | | 3.00% | | | | 12/01/2045 | | | | 327,426,095 | |
| | 216,604,715 | | | Pool G08686 | | | 3.00% | | | | 01/01/2046 | | | | 222,102,019 | |
| | 288,769,585 | | | Pool G08692 | | | 3.00% | | | | 02/01/2046 | | | | 296,098,392 | |
| | 484,913,589 | | | Pool G08697 | | | 3.00% | | | | 03/01/2046 | | | | 497,220,419 | |
| | 79,024,282 | | | Pool G60251 | | | 3.50% | | | | 10/01/2045 | | | | 83,229,233 | |
| | 285,841,751 | | | Pool G60393 | | | 3.50% | | | | 01/01/2046 | | | | 300,627,582 | |
| | 142,636,718 | | | Pool J22834 | | | 2.50% | | | | 03/01/2028 | | | | 147,076,306 | |
| | 144,513,874 | | | Pool Q16672 | | | 3.00% | | | | 03/01/2043 | | | | 148,300,433 | |
| | 9,254,068 | | | Pool Q23595 | | | 4.00% | | | | 12/01/2043 | | | | 10,000,617 | |
| | 12,248,802 | | | Pool Q24052 | | | 4.00% | | | | 01/01/2044 | | | | 13,236,975 | |
| | 10,544,890 | | | Pool Q24172 | | | 4.00% | | | | 01/01/2044 | | | | 11,394,450 | |
| | 8,507,690 | | | Pool Q24979 | | | 4.00% | | | | 02/01/2044 | | | | 9,193,197 | |
| | 74,408,728 | | | Pool Q31596 | | | 3.50% | | | | 02/01/2045 | | | | 78,009,284 | |
| | 25,577,941 | | | Pool Q32861 | | | 3.50% | | | | 04/01/2045 | | | | 26,844,468 | |
| | 68,448,025 | | | Pool Q32921 | | | 3.50% | | | | 04/01/2045 | | | | 71,758,407 | |
| | 37,544,766 | | | Pool Q39502 | | | 3.50% | | | | 03/01/2046 | | | | 39,486,881 | |
| | 12,964,586 | | | Pool T60392 | | | 4.00% | | | | 10/01/2041 | | | | 13,537,719 | |
| | 11,016,006 | | | Pool T60681 | | | 4.00% | | | | 05/01/2042 | | | | 11,505,608 | |
| | 30,565,360 | | | Pool T60782 | | | 3.50% | | | | 07/01/2042 | | | | 31,554,648 | |
| | 50,749,494 | | | Pool T60853 | | | 3.50% | | | | 09/01/2042 | | | | 52,389,246 | |
| | 43,720,748 | | | Pool T60854 | | | 3.50% | | | | 09/01/2042 | | | | 45,141,064 | |
| | 4,651,906 | | | Pool T65110 | | | 3.50% | | | | 10/01/2042 | | | | 4,802,564 | |
| | 10,978,084 | | | Pool T69016 | | | 5.00% | | | | 06/01/2041 | | | | 11,756,408 | |
| | 830,827 | | | Pool U60299 | | | 4.00% | | | | 11/01/2040 | | | | 891,274 | |
| | 187,830,724 | | | Pool V81821 | | | 3.00% | | | | 08/01/2045 | | | | 192,597,761 | |
| | 49,575,895 | | | Pool V82117 | | | 3.00% | | | | 12/01/2045 | | | | 50,834,102 | |
| | 57,797,701 | | | Pool V82209 | | | 3.50% | | | | 02/01/2046 | | | | 60,787,510 | |
| | 2,587,006 | | | Series 2519-ZD | | | 5.50% | | | | 11/15/2032 | | | | 2,871,744 | |
| | 1,574,155 | | | Series 2596-ZL | | | 5.00% | | | | 04/15/2033 | | | | 1,741,364 | |
| | 67,939,221 | | | Series 267-30 | | | 3.00% | | | | 08/15/2042 | | | | 69,426,325 | |
| | 866,847 | | | Series 2684-ZN | | | 4.00% | | | | 10/15/2033 | | | | 933,762 | |
| | 127,540,086 | | | Series 269-30 | | | 3.00% | | | | 08/15/2042 | | | | 130,414,205 | |
| | 55,179,503 | | | Series 274-30 | | | 3.00% | | | | 08/15/2042 | | | | 56,439,136 | |
| | 5,570,985 | | | Series 2750-ZT | | | 5.00% | | | | 02/15/2034 | | | | 6,190,325 | |
| | 154,384,956 | | | Series 280-30 | | | 3.00% | | | | 09/15/2042 | | | | 158,216,747 | |
| | 23,136,243 | | | Series 2819-MS | | | 6.03% | # I/F I/O | | | 06/15/2040 | | | | 3,818,542 | |
| | 13,321,659 | | | Series 2825-PZ | | | 5.50% | | | | 07/15/2034 | | | | 15,112,855 | |
| | 37,281,770 | | | Series 284-300 | | | 3.00% | | | | 10/15/2042 | | | | 38,125,499 | |
| | 8,559,527 | | | Series 2898-JZ | | | 5.00% | | | | 12/15/2034 | | | | 9,574,145 | |
| | 18,076,952 | | | Series 2899-AZ | | | 5.00% | | | | 12/15/2034 | | | | 20,062,384 | |
| | 13,438,713 | | | Series 2909-Z | | | 5.00% | | | | 12/15/2034 | | | | 14,885,259 | |
| | 25,240,027 | | | Series 2932-Z | | | 5.00% | | | | 02/15/2035 | | | | 27,951,937 | |
| | 2,398,152 | | | Series 2990-JL | | | 6.21% | # I/F I/O | | | 03/15/2035 | | | | 332,891 | |
| | 8,062,644 | | | Series 3002-SN | | | 6.06% | # I/F I/O | | | 07/15/2035 | | | | 1,405,013 | |
| | 5,564,043 | | | Series 3030-SL | | | 5.66% | # I/F I/O | | | 09/15/2035 | | | | 777,917 | |
| | 1,641,453 | | | Series 3045-DI | | | 6.29% | # I/F I/O | | | 10/15/2035 | | | | 317,593 | |
| | 13,434,764 | | | Series 3116-Z | | | 5.50% | | | | 02/15/2036 | | | | 15,164,543 | |
| | 2,487,983 | | | Series 3117-ZN | | | 4.50% | | | | 02/15/2036 | | | | 2,664,283 | |
| | 7,379,178 | | | Series 3174-PZ | | | 5.00% | | | | 01/15/2036 | | | | 8,232,018 | |
| | 1,694,313 | | | Series 3187-JZ | | | 5.00% | | | | 07/15/2036 | | | | 1,883,757 | |
| | | | | | | | | | | | | | | | |
PRINCIPAL
AMOUNT $ | | | SECURITY DESCRIPTION | | RATE | | | MATURITY | | | VALUE $ | |
| |
| | | | Federal Home Loan Mortgage Corporation, (Cont.) | |
| | 4,321,611 | | | Series 3188-ZK | | | 5.00% | | | | 07/15/2036 | | | | 4,784,063 | |
| | 6,593,611 | | | Series 3203-SE | | | 6.06% | # I/F I/O | | | 08/15/2036 | | | | 1,170,242 | |
| | 10,556,622 | | | Series 3203-Z | | | 5.00% | | | | 07/15/2036 | | | | 11,765,959 | |
| | 16,727,042 | | | Series 3203-ZC | | | 5.00% | | | | 07/15/2036 | | | | 18,643,245 | |
| | 7,788,577 | | | Series 3261-SA | | | 5.99% | # I/F I/O | | | 01/15/2037 | | | | 1,499,984 | |
| | 5,845,742 | | | Series 3267-BA | | | 5.80% | | | | 11/15/2036 | | | | 6,302,927 | |
| | 10,222,415 | | | Series 3275-SC | | | 5.64% | # I/F I/O | | | 02/15/2037 | | | | 1,640,564 | |
| | 6,053,069 | | | Series 3315-HZ | | | 6.00% | | | | 05/15/2037 | | | | 6,511,341 | |
| | 16,895,687 | | | Series 3326-GS | | | 6.21% | # I/F I/O | | | 06/15/2037 | | | | 2,376,471 | |
| | 1,775,891 | | | Series 3351-ZC | | | 5.50% | | | | 07/15/2037 | | | | 1,995,439 | |
| | 17,129,394 | | | Series 3355-BI | | | 5.61% | # I/F I/O | | | 08/15/2037 | | | | 3,188,169 | |
| | 1,423,525 | | | Series 3369-Z | | | 6.00% | | | | 09/15/2037 | | | | 1,558,203 | |
| | 4,825,659 | | | Series 3405-ZG | | | 5.50% | | | | 01/15/2038 | | | | 5,272,713 | |
| | 7,292,618 | | | Series 3417-SI | | | 5.74% | # I/F I/O | | | 02/15/2038 | | | | 792,972 | |
| | 9,724,319 | | | Series 3423-GS | | | 5.21% | # I/F I/O | | | 03/15/2038 | | | | 1,162,503 | |
| | 1,596,836 | | | Series 3423-SG | | | 5.21% | # I/F I/O | | | 03/15/2038 | | | | 180,488 | |
| | 1,894,292 | | | Series 3451-S | | | 5.59% | # I/F I/O | | | 02/15/2037 | | | | 248,877 | |
| | 2,247,562 | | | Series 3455-SC | | | 5.62% | # I/F I/O | | | 06/15/2038 | | | | 316,410 | |
| | 1,393,365 | | | Series 3473-SM | | | 5.63% | # I/F I/O | | | 07/15/2038 | | | | 147,584 | |
| | 9,162,063 | | | Series 3484-SE | | | 5.41% | # I/F I/O | | | 08/15/2038 | | | | 1,442,511 | |
| | 8,654,564 | | | Series 3519-SD | | | 5.11% | # I/F I/O | | | 02/15/2038 | | | | 1,363,896 | |
| | 3,184,628 | | | Series 3524-LB | | | 4.25% | # | | | 06/15/2038 | | | | 3,226,110 | |
| | 203,335 | | | Series 3530-GZ | | | 4.50% | | | | 05/15/2039 | | | | 212,426 | |
| | 11,870,634 | | | Series 3541-EI | | | 6.31% | # I/F I/O | | | 06/15/2039 | | | | 2,227,059 | |
| | 3,379,952 | | | Series 3545-SA | | | 5.71% | # I/F I/O | | | 06/15/2039 | | | | 450,284 | |
| | 1,406,053 | | | Series 3549-SA | | | 5.36% | # I/F I/O | | | 07/15/2039 | | | | 181,529 | |
| | 13,888,280 | | | Series 3577-LS | | | 6.76% | # I/F I/O | | | 08/15/2035 | | | | 2,733,175 | |
| | 3,577,050 | | | Series 3582-SA | | | 5.56% | # I/F I/O | | | 10/15/2049 | | | | 560,491 | |
| | 4,270,322 | | | Series 3583-GB | | | 4.50% | | | | 10/15/2039 | | | | 4,633,895 | |
| | 29,760,179 | | | Series 3606-CS | | | 5.91% | # I/F I/O | | | 12/15/2039 | | | | 5,937,441 | |
| | 7,457,858 | | | Series 3616-SG | | | 5.91% | # I/F I/O | | | 03/15/2032 | | | | 1,157,491 | |
| | 11,964,175 | | | Series 3626-AZ | | | 5.50% | | | | 08/15/2036 | | | | 13,282,029 | |
| | 2,181,802 | | | Series 3631-SE | | | 5.96% | # I/F I/O | | | 05/15/2039 | | | | 104,949 | |
| | 16,134,050 | | | Series 3641-Z | | | 5.50% | | | | 02/15/2036 | | | | 18,039,065 | |
| | 17,514,174 | | | Series 3654-ZB | | | 5.50% | | | | 11/15/2037 | | | | 19,345,119 | |
| | 36,017,634 | | | Series 3666-VZ | | | 5.50% | | | | 08/15/2036 | | | | 40,306,041 | |
| | 4,549,820 | | | Series 3667-SB | | | 6.01% | # I/F I/O | | | 05/15/2040 | | | | 515,138 | |
| | 13,757,682 | | | Series 3702-SG | | | 5.61% | # I/F I/O | | | 08/15/2032 | | | | 2,047,268 | |
| | 5,177,196 | | | Series 3704-EI | | | 5.00% | I/O | | | 12/15/2036 | | | | 745,981 | |
| | 3,741,293 | | | Series 3712-SG | | | 22.81% | # I/F | | | 08/15/2040 | | | | 6,340,382 | |
| | 9,903,017 | | | Series 3724-CM | | | 5.50% | | | | 06/15/2037 | | | | 11,202,009 | |
| | 98,939,562 | | | Series 3725-CS | | | 5.56% | # I/F I/O | | | 05/15/2040 | | | | 14,387,207 | |
| | 31,459,067 | | | Series 3726-SA | | | 5.61% | # I/F I/O | | | 09/15/2040 | | | | 5,266,204 | |
| | 98,000,000 | | | Series 3738-BP | | | 4.00% | | | | 12/15/2038 | | | | 103,904,951 | |
| | 4,165,070 | | | Series 3741-SC | | | 9.13% | # I/F | | | 10/15/2040 | | | | 4,587,007 | |
| | 26,881,846 | | | Series 3752-BS | | | 9.12% | # I/F | | | 11/15/2040 | | | | 30,274,007 | |
| | 15,593,611 | | | Series 3768-ZX | | | 5.00% | | | | 12/15/2040 | | | | 18,412,566 | |
| | 11,370,973 | | | Series 3771-AL | | | 4.00% | | | | 12/15/2030 | | | | 12,202,828 | |
| | 18,761,630 | | | Series 3779-BY | | | 3.50% | | | | 12/15/2030 | | | | 20,334,462 | |
| | 28,249,374 | | | Series 3779-DZ | | | 4.50% | | | | 12/15/2040 | | | | 31,232,420 | |
| | 24,250,000 | | | Series 3779-LB | | | 4.00% | | | | 12/15/2030 | | | | 26,177,793 | |
| | 1,567,520 | | | Series 3779-SH | | | 8.93% | # I/F | | | 12/15/2040 | | | | 1,644,897 | |
| | 3,500,000 | | | Series 3779-YA | | | 3.50% | | | | 12/15/2030 | | | | 3,824,633 | |
| | 15,000,000 | | | Series 3783-AC | | | 4.00% | | | | 01/15/2031 | | | | 16,771,921 | |
| | 12,335,232 | | | Series 3786-SG | | | 8.63% | # I/F | | | 01/15/2041 | | | | 13,604,962 | |
| | 11,731,674 | | | Series 3788-AY | | | 3.50% | | | | 01/15/2031 | | | | 12,530,674 | |
| | 9,722,090 | | | Series 3790-Z | | | 4.00% | | | | 01/15/2041 | | | | 10,404,840 | |
| | 12,291,501 | | | Series 3795-VZ | | | 4.00% | | | | 01/15/2041 | | | | 13,537,277 | |
| | 643,229 | | | Series 3798-SD | | | 8.73% | # I/F | | | 12/15/2040 | | | | 699,747 | |
| | 19,515,803 | | | Series 3800-VZ | | | 4.50% | | | | 02/15/2041 | | | | 22,688,216 | |
| | 13,287,072 | | | Series 3803-ZM | | | 4.00% | | | | 02/15/2041 | | | | 14,309,953 | |
| | 70,709,226 | | | Series 3806-CZ | | | 5.50% | | | | 07/15/2034 | | | | 80,005,622 | |
| | 18,000,000 | | | Series 3808-DB | | | 3.50% | | | | 02/15/2031 | | | | 19,094,243 | |
| | 15,277,557 | | | Series 3812-EY | | | 3.50% | | | | 02/15/2031 | | | | 16,268,788 | |
| | 9,897,727 | | | Series 3818-CZ | | | 4.50% | | | | 03/15/2041 | | | | 10,956,790 | |
| | 18,927,511 | | | Series 3819-ZU | | | 5.50% | | | | 07/15/2034 | | | | 21,148,507 | |
| | 35,500,000 | | | Series 3824-EY | | | 3.50% | | | | 03/15/2031 | | | | 38,568,712 | |
| | 3,350,433 | | | Series 3828-SW | | | 11.89% | # I/F | | | 02/15/2041 | | | | 4,773,108 | |
| | 15,872,956 | | | Series 3829-VZ | | | 4.00% | | | | 03/15/2041 | | | | 17,028,545 | |
| | 6,390,168 | | | Series 3843-PZ | | | 5.00% | | | | 04/15/2041 | | | | 7,831,309 | |
| | 833,294 | | | Series 3845-LS | | | 12.04% | # I/F | | | 03/15/2041 | | | | 837,593 | |
| | 56,562,611 | | | Series 3863-ZA | | | 5.50% | | | | 08/15/2034 | | | | 62,935,215 | |
| | 10,229,000 | | | Series 3870-PB | | | 4.50% | | | | 06/15/2041 | | | | 11,380,689 | |
| | 79,301,831 | | | Series 3871-LZ | | | 5.50% | | | | 06/15/2041 | | | | 93,089,248 | |
| | | | | | |
| The accompanying notes are an integral part of these financial statements. | | Annual Report | | March 31, 2016 | | 29 |
| | |
| Schedule of Investments DoubleLine Total Return Bond Fund (Cont.) | | March 31, 2016 |
| | | | | | | | | | | | | | | | |
PRINCIPAL
AMOUNT $ | | | SECURITY DESCRIPTION | | RATE | | | MATURITY | | | VALUE $ | |
| |
| | | | Federal Home Loan Mortgage Corporation, (Cont.) | |
| | 27,504,985 | | | Series 3872-BA | | | 4.00% | | | | 06/15/2041 | | | | 28,965,670 | |
| | 21,574,169 | | | Series 3877-EY | | | 4.50% | | | | 06/15/2041 | | | | 23,513,687 | |
| | 12,378,000 | | | Series 3877-GY | | | 4.50% | | | | 06/15/2041 | | | | 13,468,598 | |
| | 54,835,198 | | | Series 3877-ZU | | | 4.50% | | | | 06/15/2041 | | | | 58,158,858 | |
| | 31,928,562 | | | Series 3888-ZG | | | 4.00% | | | | 07/15/2041 | | | | 34,412,770 | |
| | 19,731,098 | | | Series 3888-ZU | | | 4.50% | | | | 06/15/2041 | | | | 22,793,551 | |
| | 12,105,576 | | | Series 3900-SB | | | 5.53% | # I/F I/O | | | 07/15/2041 | | | | 1,744,605 | |
| | 42,689,856 | | | Series 3901-VZ | | | 4.00% | | | | 07/15/2041 | | | | 46,106,078 | |
| | 22,625,154 | | | Series 3910-GZ | | | 5.00% | | | | 08/15/2041 | | | | 27,683,379 | |
| | 10,055,624 | | | Series 3910-ZE | | | 5.00% | | | | 10/15/2034 | | | | 11,251,151 | |
| | 12,330,000 | | | Series 3919-KL | | | 4.50% | | | | 09/15/2041 | | | | 13,601,507 | |
| | 28,862,428 | | | Series 3919-ZJ | | | 4.00% | | | | 09/15/2041 | | | | 31,142,597 | |
| | 5,818,641 | | | Series 3942-JZ | | | 4.00% | | | | 10/15/2041 | | | | 6,044,057 | |
| | 11,928,828 | | | Series 3944-AZ | | | 4.00% | | | | 10/15/2041 | | | | 12,863,900 | |
| | 8,746,485 | | | Series 3946-SM | | | 13.39% | # I/F | | | 10/15/2041 | | | | 9,550,209 | |
| | 8,144,608 | | | Series 3957-DZ | | | 3.50% | | | | 11/15/2041 | | | | 8,421,058 | |
| | 10,000,000 | | | Series 3964-VM | | | 4.00% | | | | 11/15/2034 | | | | 10,891,630 | |
| | 49,998,419 | | | Series 3969-AB | | | 4.00% | | | | 10/15/2033 | | | | 53,304,369 | |
| | 11,567,578 | | | Series 3982-AZ | | | 3.50% | | | | 01/15/2042 | | | | 12,105,734 | |
| | 58,120,137 | | | Series 3990-ZA | | | 3.50% | | | | 01/15/2042 | | | | 61,242,072 | |
| | 17,656,640 | | | Series 3999-EZ | | | 4.00% | | | | 02/15/2042 | | | | 19,265,870 | |
| | 49,438,592 | | | Series 3999-ZB | | | 4.00% | | | | 02/15/2042 | | | | 53,903,935 | |
| | 28,031,597 | | | Series 4016-KZ | | | 4.00% | | | | 03/15/2042 | | | | 31,141,846 | |
| | 26,709,698 | | | Series 4050-BC | | | 2.00% | | | | 05/15/2041 | | | | 26,157,803 | |
| | 69,692,668 | | | Series 4057-ZA | | | 4.00% | | | | 06/15/2042 | | | | 77,373,455 | |
| | 69,437,977 | | | Series 4084-TZ | | | 4.00% | | | | 07/15/2042 | | | | 78,549,531 | |
| | 12,632,106 | | | Series 4097-TG | | | 2.00% | | | | 05/15/2039 | | | | 12,693,768 | |
| | 39,041,146 | | | Series 4097-ZA | | | 3.50% | | | | 08/15/2042 | | | | 42,117,151 | |
| | 97,063,000 | | | Series 4109-GE | | | 4.50% | | | | 10/15/2041 | | | | 108,616,254 | |
| | 38,003,181 | | | Series 4109-KD | | | 3.00% | | | | 05/15/2032 | | | | 38,617,069 | |
| | 5,353,226 | | | Series 4121-AV | | | 3.00% | | | | 12/15/2035 | | | | 5,567,229 | |
| | 70,048,136 | | | Series 4160-HP | | | 2.50% | | | | 01/15/2033 | | | | 72,503,604 | |
| | 27,903,723 | | | Series 4162-ZJ | | | 3.00% | | | | 02/15/2033 | | | | 27,934,743 | |
| | 5,876,018 | | | Series 4165-ZT | | | 3.00% | | | | 02/15/2043 | | | | 5,597,121 | |
| | 40,041,156 | | | Series 4174-Z | | | 3.50% | | | | 03/15/2043 | | | | 42,918,882 | |
| | 99,539,763 | | | Series 4179-AZ | | | 4.00% | | | | 01/15/2041 | | | | 109,435,618 | |
| | 29,523,175 | | | Series 4183-ZB | | | 3.00% | | | | 03/15/2043 | | | | 29,805,366 | |
| | 23,284,605 | | | Series 4186-ZJ | | | 3.00% | | | | 03/15/2033 | | | | 23,315,734 | |
| | 13,000,000 | | | Series 4189-ML | | | 3.00% | | | | 04/15/2038 | | | | 13,427,306 | |
| | 203,918,837 | | | Series 4212-US | | | 4.87% | # I/F | | | 06/15/2043 | | | | 198,520,270 | |
| | 17,308,864 | | | Series 4215-KC | | | 2.25% | | | | 03/15/2038 | | | | 17,644,828 | |
| | 88,597,260 | | | Series 4223-US | | | 4.90% | # I/F | | | 07/15/2043 | | | | 82,893,820 | |
| | 22,247,320 | | | Series 4223-ZV | | | 4.00% | | | | 07/15/2043 | | | | 24,976,572 | |
| | 27,670,237 | | | Series 4229-TZ | | | 3.00% | | | | 06/15/2043 | | | | 27,301,412 | |
| | 27,809,150 | | | Series 4229-ZA | | | 4.00% | | | | 07/15/2043 | | | | 31,216,402 | |
| | 20,572,300 | | | Series 4250-BZ | | | 3.00% | | | | 09/15/2033 | | | | 20,740,983 | |
| | 20,563,323 | | | Series 4267-BZ | | | 4.00% | | | | 10/15/2040 | | | | 22,490,452 | |
| | 108,502,989 | | | Series 4323-GA | | | 3.00% | | | | 06/15/2040 | | | | 112,146,334 | |
| | 41,285,243 | | | Series 4360-KA | | | 3.00% | | | | 05/15/2040 | | | | 42,776,532 | |
| | 67,930,238 | | | Series 4375-CG | | | 3.00% | | | | 04/15/2039 | | | | 71,102,988 | |
| | 14,155,885 | | | Series 4376-GZ | | | 3.00% | | | | 08/15/2044 | | | | 13,467,705 | |
| | 45,004,980 | | | Series 4377-LZ | | | 3.00% | | | | 08/15/2044 | | | | 42,770,320 | |
| | 54,726,822 | | | Series 4377-UZ | | | 3.00% | | | | 08/15/2044 | | | | 52,569,501 | |
| | 9,873,454 | | | Series 4379-KA | | | 3.00% | | | | 08/15/2044 | | | | 10,263,689 | |
| | 32,590,754 | | | Series 4384-A | | | 3.00% | | | | 12/15/2040 | | | | 33,801,344 | |
| | 24,600,469 | | | Series 4384-ZY | | | 3.00% | | | | 09/15/2044 | | | | 24,042,941 | |
| | 6,476,933 | | | Series 4386-US | | | 7.37% | # I/F | | | 09/15/2044 | | | | 6,466,072 | |
| | 275,258,207 | | | Series 4390-NY | | | 3.00% | | | | 06/15/2040 | | | | 287,772,931 | |
| | 124,679,519 | | | Series 4390-NZ | | | 3.00% | | | | 09/15/2044 | | | | 122,494,324 | |
| | 71,790,026 | | | Series 4391-MA | | | 3.00% | | | | 07/15/2040 | | | | 74,883,142 | |
| | 96,782,546 | | | Series 4408-PB | | | 3.00% | | | | 04/15/2044 | | | | 100,199,579 | |
| | 25,182,182 | | | Series 4419-TB | | | 3.00% | | | | 02/15/2040 | | | | 25,676,830 | |
| | 140,376,570 | | | Series 4427-CE | | | 3.00% | | | | 02/15/2034 | | | | 146,875,781 | |
| | 83,696,912 | | | Series 4427-MA | | | 3.00% | | | | 02/15/2034 | | | | 87,509,114 | |
| | 48,225,669 | | | Series 4427-PS | | | 5.16% | # I/F I/O | | | 07/15/2044 | | | | 7,956,840 | |
| | 73,186,488 | | | Series 4429-HA | | | 3.00% | | | | 04/15/2034 | | | | 75,998,972 | |
| | 23,758,816 | | | Series 4434-LZ | | | 3.00% | | | | 02/15/2045 | | | | 22,721,475 | |
| | 21,856,160 | | | Series 4438-B | | | 3.00% | | | | 10/15/2043 | | | | 22,679,525 | |
| | 8,883,731 | | | Series 4441-VZ | | | 3.00% | | | | 02/15/2045 | | | | 8,589,637 | |
| | 74,432,704 | | | Series 4444-CH | | | 3.00% | | | | 01/15/2041 | | | | 77,429,647 | |
| | 25,824,800 | | | Series 4444-CZ | | | 3.00% | | | | 02/15/2045 | | | | 24,290,933 | |
| | 72,532,002 | | | Series 4447-A | | | 3.00% | | | | 06/15/2041 | | | | 75,604,922 | |
| | 7,728,120 | | | Series 4450-JZ | | | 3.00% | | | | 03/15/2045 | | | | 7,386,406 | |
| | 6,720,640 | | | Series 4461-LZ | | | 3.00% | | | | 03/15/2045 | | | | 6,465,530 | |
| | | | | | | | | | | | | | | | |
PRINCIPAL
AMOUNT $ | | | SECURITY DESCRIPTION | | RATE | | | MATURITY | | | VALUE $ | |
| |
| | | | Federal Home Loan Mortgage Corporation, (Cont.) | |
| | 7,926,751 | | | Series 4462-ZA | | | 3.00% | | | | 04/15/2045 | | | | 7,748,114 | |
| | 46,253,085 | | | Series 4463-ZC | | | 3.00% | | | | 04/15/2045 | | | | 46,684,474 | |
| | 25,696,159 | | | Series 4467-ZA | | | 3.00% | | | | 04/15/2045 | | | | 24,082,910 | |
| | 213,206,679 | | | Series 4471-BA | | | 3.00% | | | | 12/15/2041 | | | | 222,359,727 | |
| | 185,395,033 | | | Series 4471-BC | | | 3.00% | | | | 12/15/2041 | | | | 193,354,116 | |
| | 160,287,486 | | | Series 4471-GA | | | 3.00% | | | | 02/15/2044 | | | | 165,654,953 | |
| | 74,608,172 | | | Series 4481-B | | | 3.00% | | | | 12/15/2042 | | | | 76,936,708 | |
| | 300,527,702 | | | Series 4483-CA | | | 3.00% | | | | 06/15/2044 | | | | 314,191,435 | |
| | 187,057,835 | | | Series 4483-PA | | | 2.50% | | | | 06/15/2045 | | | | 191,404,984 | |
| | 15,340,895 | | | Series 4484-ZL | | | 3.00% | | | | 06/15/2045 | | | | 14,898,887 | |
| | 8,188,583 | | | Series 4492-GZ | | | 3.50% | | | | 07/15/2045 | | | | 8,376,886 | |
| | 54,101,514 | | | Series 4498-PD | | | 2.50% | | | | 08/15/2042 | | | | 54,821,675 | |
| | 42,946,371 | | | Series 4499-AB | | | 3.00% | | | | 06/15/2042 | | | | 44,286,671 | |
| | 75,475,343 | | | Series 4504-CA | | | 3.00% | | | | 04/15/2044 | | | | 78,996,887 | |
| | 48,844,848 | | | Series 4511-QA | | | 3.00% | | | | 01/15/2041 | | | | 50,679,089 | |
| | 38,562,182 | | | Series 4511-QC | | | 3.00% | | | | 12/15/2040 | | | | 40,092,846 | |
| | 87,316,577 | | | Series 4527-CA | | | 3.00% | | | | 02/15/2044 | | | | 91,066,737 | |
| | 215,130,379 | | | Series 4527-GA | | | 3.00% | | | | 02/15/2044 | | | | 223,962,385 | |
| | 202,949,299 | | | Series 4533-AB | | | 3.00% | | | | 06/15/2044 | | | | 208,085,013 | |
| | 172,221,532 | | | Series 4543-HG | | | 2.70% | | | | 04/15/2044 | | | | 175,532,181 | |
| | 116,327,156 | | | Series R003-ZA | | | 5.50% | | | | 10/15/2035 | | | | 132,448,774 | |
| |
| | | | Federal National Mortgage Association, | |
| | 1,433,124 | | | Series 2002-70-QZ | | | 5.50% | | | | 11/25/2032 | | | | 1,601,169 | |
| | 2,261,640 | | | Series 2002-75-ZG | | | 5.50% | | | | 11/25/2032 | | | | 2,558,968 | |
| | 1,603,855 | | | Series 2003-117-KS | | | 6.67% | # I/F I/O | | | 08/25/2033 | | | | 90,303 | |
| | 27,147,198 | | | Series 2003-129-ZT | | | 5.50% | | | | 01/25/2034 | | | | 31,224,887 | |
| | 5,917,435 | | | Series 2003-29-ZL | | | 5.00% | | | | 04/25/2033 | | | | 6,564,418 | |
| | 2,754,376 | | | Series 2003-64-ZG | | | 5.50% | | | | 07/25/2033 | | | | 3,031,845 | |
| | 23,888,348 | | | Series 2003-84-PZ | | | 5.00% | | | | 09/25/2033 | | | | 26,687,721 | |
| | 17,577,728 | | | Series 2003-W17-1A7 | | | 5.75% | | | | 08/25/2033 | | | | 20,095,484 | |
| | 6,344,866 | | | Series 2004-46-PJ | | | 5.57% | # I/F I/O | | | 03/25/2034 | | | | 940,801 | |
| | 4,809,992 | | | Series 2004-51-XP | | | 7.27% | # I/F I/O | | | 07/25/2034 | | | | 1,079,555 | |
| | 5,000,000 | | | Series 2004-W10-A6 | | | 5.75% | | | | 08/25/2034 | | | | 5,710,409 | |
| | 2,931,316 | | | Series 2004-W4-A5 | | | 5.50% | | | | 06/25/2034 | | | | 3,065,560 | |
| | 443,029 | | | Series 2005-107-EG | | | 4.50% | | | | 01/25/2026 | | | | 477,512 | |
| | 1,460,469 | | | Series 2005-37-ZK | | | 4.50% | | | | 05/25/2035 | | | | 1,566,665 | |
| | 12,559,163 | | | Series 2005-87-SE | | | 5.62% | # I/F I/O | | | 10/25/2035 | | | | 2,015,160 | |
| | 10,213,777 | | | Series 2005-87-SG | | | 6.27% | # I/F I/O | | | 10/25/2035 | | | | 1,924,728 | |
| | 8,224,410 | | | Series 2006-101-SA | | | 6.15% | # I/F I/O | | | 10/25/2036 | | | | 1,660,848 | |
| | 3,362,361 | | | Series 2006-123-LI | | | 5.89% | # I/F I/O | | | 01/25/2037 | | | | 686,616 | |
| | 3,306,014 | | | Series 2006-16-HZ | | | 5.50% | | | | 03/25/2036 | | | | 3,564,500 | |
| | 14,486,653 | | | Series 2006-56-SM | | | 6.32% | # I/F I/O | | | 07/25/2036 | | | | 2,749,249 | |
| | 20,616,630 | | | Series 2006-60-YI | | | 6.14% | # I/F I/O | | | 07/25/2036 | | | | 4,166,792 | |
| | 2,285,209 | | | Series 2006-93-SN | | | 6.17% | # I/F I/O | | | 10/25/2036 | | | | 383,091 | |
| | 13,052,212 | | | Series 2007-109-VZ | | | 5.00% | | | | 10/25/2035 | | | | 14,803,255 | |
| | 2,436,856 | | | Series 2007-116-BI | | | 5.82% | # I/F I/O | | | 05/25/2037 | | | | 430,789 | |
| | 13,192,187 | | | Series 2007-14-PS | | | 6.38% | # I/F I/O | | | 03/25/2037 | | | | 2,329,238 | |
| | 6,287,929 | | | Series 2007-30-OI | | | 6.01% | # I/F I/O | | | 04/25/2037 | | | | 1,318,773 | |
| | 1,669,228 | | | Series 2007-30-SI | | | 5.68% | # I/F I/O | | | 04/25/2037 | | | | 241,335 | |
| | 7,057,394 | | | Series 2007-32-SG | | | 5.67% | # I/F I/O | | | 04/25/2037 | | | | 1,196,939 | |
| | 5,731,065 | | | Series 2007-57-SX | | | 6.19% | # I/F I/O | | | 10/25/2036 | | | | 909,605 | |
| | 9,179,532 | | | Series 2007-60-VZ | | | 6.00% | | | | 07/25/2037 | | | | 10,507,498 | |
| | 4,022,022 | | | Series 2007-71-GZ | | | 6.00% | | | | 07/25/2047 | | | | 4,453,051 | |
| | 6,714,462 | | | Series 2007-75-ID | | | 5.44% | # I/F I/O | | | 08/25/2037 | | | | 1,225,542 | |
| | 2,324,098 | | | Series 2007-9-SD | | | 6.22% | # I/F I/O | | | 03/25/2037 | | | | 299,390 | |
| | 2,441,806 | | | Series 2008-27-B | | | 5.50% | | | | 04/25/2038 | | | | 2,661,360 | |
| | 8,492,836 | | | Series 2008-29-ZA | | | 4.50% | | | | 04/25/2038 | | | | 9,249,881 | |
| | 15,846,767 | | | Series 2008-48-BE | | | 5.00% | | | | 06/25/2034 | | | | 17,698,655 | |
| | 3,424,653 | | | Series 2008-48-SD | | | 5.57% | # I/F I/O | | | 06/25/2037 | | | | 452,858 | |
| | 3,842,162 | | | Series 2008-53-LI | | | 5.72% | # I/F I/O | | | 07/25/2038 | | | | 575,689 | |
| | 3,771,387 | | | Series 2008-57-SE | | | 5.57% | # I/F I/O | | | 02/25/2037 | | | | 457,080 | |
| | 2,234,147 | | | Series 2008-5-MS | | | 5.82% | # I/F I/O | | | 02/25/2038 | | | | 342,346 | |
| | 2,946,860 | | | Series 2008-61-SC | | | 5.57% | # I/F I/O | | | 07/25/2038 | | | | 427,802 | |
| | 3,329,249 | | | Series 2008-62-SC | | | 5.57% | # I/F I/O | | | 07/25/2038 | | | | 486,921 | |
| | 4,714,412 | | | Series 2008-65-SA | | | 5.57% | # I/F I/O | | | 08/25/2038 | | | | 693,949 | |
| | 4,922,178 | | | Series 2008-81-LP | | | 5.50% | | | | 09/25/2038 | | | | 5,417,162 | |
| | 14,149,957 | | | Series 2009-106-EZ | | | 4.50% | | | | 01/25/2040 | | | | 14,971,305 | |
| | 4,076,074 | | | Series 2009-111-SE | | | 5.82% | # I/F I/O | | | 01/25/2040 | | | | 534,966 | |
| | 1,192,569 | | | Series 2009-16-MZ | | | 5.00% | | | | 03/25/2029 | | | | 1,320,541 | |
| | | | | | |
| 30 | | DoubleLine Funds Trust | | | | The accompanying notes are an integral part of these financial statements. |
| | | | | | | | | | | | | | | | |
PRINCIPAL
AMOUNT $ | | | SECURITY DESCRIPTION | | RATE | | | MATURITY | | | VALUE $ | |
| |
| | | | Federal National Mortgage Association, (Cont.) | |
| | 8,364,911 | | | Series 2009-42-SI | | | 5.57% | # I/F I/O | | | 06/25/2039 | | | | 1,120,103 | |
| | 4,853,581 | | | Series 2009-42-SX | | | 5.57% | # I/F I/O | | | 06/25/2039 | | | | 730,014 | |
| | 4,154,807 | | | Series 2009-47-SA | | | 5.67% | # I/F I/O | | | 07/25/2039 | | | | 525,139 | |
| | 1,685,464 | | | Series 2009-48-WS | | | 5.52% | # I/F I/O | | | 07/25/2039 | | | | 192,903 | |
| | 10,199,219 | | | Series 2009-49-S | | | 6.32% | # I/F I/O | | | 07/25/2039 | | | | 1,631,644 | |
| | 1,567,795 | | | Series 2009-51-BZ | | | 4.50% | | | | 07/25/2039 | | | | 1,653,208 | |
| | 3,315,689 | | | Series 2009-54-EZ | | | 5.00% | | | | 07/25/2039 | | | | 3,609,245 | |
| | 3,554,499 | | | Series 2009-70-SA | | | 5.37% | # I/F I/O | | | 09/25/2039 | | | | 388,771 | |
| | 10,000,000 | | | Series 2009-80-PM | | | 4.50% | | | | 10/25/2039 | | | | 10,899,674 | |
| | 5,955,802 | | | Series 2009-83-Z | | | 4.50% | | | | 10/25/2039 | | | | 6,298,320 | |
| | 21,965,742 | | | Series 2009-85-ES | | | 6.80% | # I/F I/O | | | 01/25/2036 | | | | 4,403,409 | |
| | 29,303,377 | | | Series 2009-85-JS | | | 6.32% | # I/F I/O | | | 10/25/2039 | | | | 6,729,688 | |
| | 5,631,245 | | | Series 2009-90-IB | | | 5.29% | # I/F I/O | | | 04/25/2037 | | | | 673,403 | |
| | 3,496,514 | | | Series 2009-94-BC | | | 5.00% | | | | 11/25/2039 | | | | 3,763,914 | |
| | 25,772,184 | | | Series 2010-101-SA | | | 4.05% | # I/F I/O | | | 09/25/2040 | | | | 3,630,306 | |
| | 15,275,080 | | | Series 2010-101-ZC | | | 4.50% | | | | 09/25/2040 | | | | 16,521,728 | |
| | 46,452,478 | | | Series 2010-101-ZH | | | 4.50% | | | | 07/25/2040 | | | | 49,700,296 | |
| | 10,298,295 | | | Series 2010-10-SA | | | 5.92% | # I/F I/O | | | 02/25/2040 | | | | 1,855,675 | |
| | 4,892,843 | | | Series 2010-10-ZA | | | 4.50% | | | | 02/25/2040 | | | | 5,164,220 | |
| | 2,832,560 | | | Series 2010-111-S | | | 5.52% | # I/F I/O | | | 10/25/2050 | | | | 384,910 | |
| | 9,300,462 | | | Series 2010-116-Z | | | 4.00% | | | | 10/25/2040 | | | | 9,975,293 | |
| | 5,192,666 | | | Series 2010-117-SA | | | 4.07% | # I/F I/O | | | 10/25/2040 | | | | 547,242 | |
| | 7,419,879 | | | Series 2010-120-KD | | | 4.00% | | | | 10/25/2040 | | | | 7,938,825 | |
| | 48,217,407 | | | Series 2010-121-SD | | | 4.07% | # I/F I/O | | | 10/25/2040 | | | | 5,274,512 | |
| | 242,685 | | | Series 2010-126-SU | | | 50.18% | # I/F | | | 11/25/2040 | | | | 970,788 | |
| | 178,693 | | | Series 2010-126-SX | | | 13.68% | # I/F | | | 11/25/2040 | | | | 321,740 | |
| | 11,978,422 | | | Series 2010-128-HZ | | | 4.00% | | | | 11/25/2040 | | | | 12,635,778 | |
| | 9,183,145 | | | Series 2010-132-Z | | | 4.50% | | | | 11/25/2040 | | | | 9,711,334 | |
| | 88,008 | | | Series 2010-137-VS | | | 13.68% | # I/F | | | 12/25/2040 | | | | 141,096 | |
| | 4,895,474 | | | Series 2010-142-AV | | | 4.00% | | | | 11/25/2029 | | | | 4,949,709 | |
| | 19,021,907 | | | Series 2010-142-AZ | | | 4.00% | | | | 12/25/2040 | | | | 20,874,458 | |
| | 25,636,241 | | | Series 2010-148-SA | | | 6.22% | # I/F I/O | | | 01/25/2026 | | | | 3,629,792 | |
| | 33,297,677 | | | Series 2010-150-ZA | | | 4.00% | | | | 01/25/2041 | | | | 35,479,271 | |
| | 20,107,991 | | | Series 2010-16-SA | | | 5.02% | # I/F I/O | | | 03/25/2040 | | | | 2,885,155 | |
| | 3,715,236 | | | Series 2010-21-DZ | | | 5.00% | | | | 03/25/2040 | | | | 4,219,784 | |
| | 3,723,204 | | | Series 2010-21-KS | | | 4.52% | # I/F I/O | | | 03/25/2040 | | | | 323,781 | |
| | 1,665,546 | | | Series 2010-2-GS | | | 6.02% | # I/F I/O | | | 12/25/2049 | | | | 193,367 | |
| | 4,674,218 | | | Series 2010-2-MS | | | 5.82% | # I/F I/O | | | 02/25/2050 | | | | 702,281 | |
| | 5,174,176 | | | Series 2010-31-SA | | | 4.57% | # I/F I/O | | | 04/25/2040 | | | | 459,384 | |
| | 12,658,661 | | | Series 2010-31-VZ | | | 4.00% | | | | 04/25/2040 | | | | 13,192,760 | |
| | 9,411,680 | | | Series 2010-34-PS | | | 4.50% | # I/F I/O | | | 04/25/2040 | | | | 846,696 | |
| | 2,004,296 | | | Series 2010-35-ES | | | 6.02% | # I/F I/O | | | 04/25/2040 | | | | 287,805 | |
| | 2,828,912 | | | Series 2010-35-SV | | | 6.02% | # I/F I/O | | | 04/25/2040 | | | | 356,340 | |
| | 2,896,979 | | | Series 2010-46-MS | | | 4.52% | # I/F I/O | | | 05/25/2040 | | | | 242,153 | |
| | 21,328,968 | | | Series 2010-49-ZW | | | 4.50% | | | | 05/25/2040 | | | | 22,667,625 | |
| | 4,832,439 | | | Series 2010-4-SK | | | 5.80% | # I/F I/O | | | 02/25/2040 | | | | 739,396 | |
| | 2,237,335 | | | Series 2010-58-ES | | | 11.36% | # I/F | | | 06/25/2040 | | | | 2,576,705 | |
| | 12,286,420 | | | Series 2010-59-MS | | | 5.34% | # I/F I/O | | | 06/25/2040 | | | | 2,174,145 | |
| | 23,341,527 | | | Series 2010-59-PS | | | 6.02% | # I/F I/O | | | 03/25/2039 | | | | 2,432,178 | |
| | 13,251,744 | | | Series 2010-59-SC | | | 4.57% | # I/F I/O | | | 01/25/2040 | | | | 1,483,706 | |
| | 2,512,558 | | | Series 2010-60-VZ | | | 5.00% | | | | 10/25/2039 | | | | 2,693,061 | |
| | 1,492,955 | | | Series 2010-61-EL | | | 4.50% | | | | 06/25/2040 | | | | 1,621,599 | |
| | 14,564,519 | | | Series 2010-64-EZ | | | 5.00% | | | | 06/25/2040 | | | | 16,317,650 | |
| | 41,980,123 | | | Series 2010-76-ZK | | | 4.50% | | | | 07/25/2040 | | | | 46,101,559 | |
| | 13,000,751 | | | Series 2010-79-CZ | | | 4.00% | | | | 07/25/2040 | | | | 13,513,428 | |
| | 37,812,423 | | | Series 2010-79-VZ | | | 4.50% | | | | 07/25/2040 | | | | 42,588,249 | |
| | 9,834,216 | | | Series 2010-84-ZC | | | 4.50% | | | | 08/25/2040 | | | | 10,634,858 | |
| | 19,668,390 | | | Series 2010-84-ZD | | | 4.50% | | | | 08/25/2040 | | | | 21,269,670 | |
| | 22,669,120 | | | Series 2010-84-ZG | | | 4.50% | | | | 08/25/2040 | | | | 24,156,196 | |
| | 2,567,413 | | | Series 2010-90-SA | | | 5.42% | # I/F I/O | | | 08/25/2040 | | | | 340,345 | |
| | 3,542,050 | | | Series 2010-94-Z | | | 4.50% | | | | 08/25/2040 | | | | 3,742,702 | |
| | 8,668,587 | | | Series 2010-99-SG | | | 22.81% | # I/F | | | 09/25/2040 | | | | 15,932,008 | |
| | 5,498,248 | | | Series 2010-9-DS | | | 4.87% | # I/F I/O | | | 02/25/2040 | | | | 747,532 | |
| | 33,457,711 | | | Series 2011-106-LZ | | | 3.50% | | | | 10/25/2041 | | | | 34,978,230 | |
| | 520,021 | | | Series 2011-110-LS | | | 9.22% | # I/F | | | 11/25/2041 | | | | 730,198 | |
| | 19,348,234 | | | Series 2011-111-CZ | | | 4.00% | | | | 11/25/2041 | | | | 20,415,181 | |
| | 8,290,280 | | | Series 2011-111-EZ | | | 5.00% | | | | 11/25/2041 | | | | 9,426,476 | |
| | 11,678,699 | | | Series 2011-111-VZ | | | 4.00% | | | | 11/25/2041 | | | | 12,794,570 | |
| | 30,000,000 | | | Series 2011-131-PB | | | 4.50% | | | | 12/25/2041 | | | | 34,516,950 | |
| | 29,500,000 | | | Series 2011-16-AL | | | 3.50% | | | | 03/25/2031 | | | | 31,947,503 | |
| | 38,800,000 | | | Series 2011-17-NY | | | 3.50% | | | | 03/25/2031 | | | | 42,001,962 | |
| | 2,307,737 | | | Series 2011-17-SA | | | 6.04% | # I/F I/O | | | 03/25/2041 | | | | 314,476 | |
| | 11,000,000 | | | Series 2011-25-KY | | | 3.00% | | | | 04/25/2026 | | | | 11,541,635 | |
| | 4,744,126 | | | Series 2011-27-BS | | | 8.12% | # I/F | | | 04/25/2041 | | | | 5,570,013 | |
| | | | | | | | | | | | | | | | |
PRINCIPAL
AMOUNT $ | | | SECURITY DESCRIPTION | | RATE | | | MATURITY | | | VALUE $ | |
| |
| | | | Federal National Mortgage Association, (Cont.) | |
| | 56,000,000 | | | Series 2011-29-AL | | | 3.50% | | | | 04/25/2031 | | | | 60,120,827 | |
| | 18,437,252 | | | Series 2011-2-GZ | | | 4.00% | | | | 02/25/2041 | | | | 19,544,000 | |
| | 10,000,000 | | | Series 2011-2-VD | | | 4.00% | | | | 07/25/2027 | | | | 10,161,348 | |
| | 61,049,830 | | | Series 2011-32-X | | | 4.00% | | | | 04/25/2041 | | | | 64,368,944 | |
| | 11,453,396 | | | Series 2011-36-VZ | | | 4.50% | | | | 05/25/2041 | | | | 12,118,880 | |
| | 30,538,206 | | | Series 2011-37-Z | | | 4.50% | | | | 05/25/2041 | | | | 33,250,451 | |
| | 8,102,772 | | | Series 2011-38-BZ | | | 4.00% | | | | 05/25/2041 | | | | 8,549,029 | |
| | 8,748,233 | | | Series 2011-39-CB | | | 3.00% | | | | 05/25/2026 | | | | 9,177,812 | |
| | 23,801,532 | | | Series 2011-39-ZD | | | 4.00% | | | | 02/25/2041 | | | | 25,303,440 | |
| | 8,825,464 | | | Series 2011-40-LZ | | | 4.50% | | | | 05/25/2041 | | | | 9,344,827 | |
| | 16,400,567 | | | Series 2011-42-MZ | | | 4.50% | | | | 05/25/2041 | | | | 17,922,006 | |
| | 18,222,462 | | | Series 2011-45-ZA | | | 4.00% | | | | 05/25/2031 | | | | 19,930,672 | |
| | 29,448,224 | | | Series 2011-45-ZB | | | 4.50% | | | | 05/25/2041 | | | | 32,630,581 | |
| | 8,403,186 | | | Series 2011-48-SC | | | 8.33% | # I/F | | | 06/25/2041 | | | | 9,090,994 | |
| | 19,622,082 | | | Series 2011-58-SA | | | 6.12% | # I/F I/O | | | 07/25/2041 | | | | 4,005,346 | |
| | 3,416,675 | | | Series 2011-59-MA | | | 4.50% | | | | 07/25/2041 | | | | 3,712,135 | |
| | 13,969,748 | | | Series 2011-60-EL | | | 3.00% | | | | 07/25/2026 | | | | 14,867,609 | |
| | 7,024,011 | | | Series 2011-63-ZE | | | 4.00% | | | | 08/25/2038 | | | | 7,114,010 | |
| | 34,747,657 | | | Series 2011-64-DB | | | 4.00% | | | | 07/25/2041 | | | | 37,695,578 | |
| | 11,229,994 | | | Series 2011-74-KL | | | 5.00% | | | | 06/25/2040 | | | | 12,472,417 | |
| | 24,578,330 | | | Series 2011-77-Z | | | 3.50% | | | | 08/25/2041 | | | | 25,402,701 | |
| | 21,787,531 | | | Series 2011-8-AV | | | 4.00% | | | | 01/25/2030 | | | | 22,961,600 | |
| | 24,479,928 | | | Series 2011-99-CZ | | | 4.50% | | | | 10/25/2041 | | | | 28,590,750 | |
| | 112,656,371 | | | Series 2011-99-DZ | | | 5.00% | | | | 10/25/2041 | | | | 128,012,808 | |
| | 11,675,719 | | | Series 2012-104-Z | | | 3.50% | | | | 09/25/2042 | | | | 12,193,096 | |
| | 11,301,182 | | | Series 2012-111-LB | | | 3.50% | | | | 05/25/2041 | | | | 11,941,965 | |
| | 44,434,820 | | | Series 2012-111-MJ | | | 4.00% | | | | 04/25/2042 | | | | 48,031,357 | |
| | 33,330,454 | | | Series 2012-114-DC | | | 2.00% | | | | 08/25/2039 | | | | 33,633,142 | |
| | 131,787,305 | | | Series 2012-122-AD | | | 2.00% | | | | 02/25/2040 | | | | 132,574,761 | |
| | 97,853,224 | | | Series 2012-122-DB | | | 3.00% | | | | 11/25/2042 | | | | 100,262,625 | |
| | 107,900,212 | | | Series 2012-125-LA | | | 3.00% | | | | 11/25/2042 | | | | 110,354,272 | |
| | 10,697,101 | | | Series 2012-133-PB | | | 6.50% | | | | 04/25/2042 | | | | 12,028,744 | |
| | 67,208,662 | | | Series 2012-144-PT | | | 4.33% | # | | | 11/25/2049 | | | | 71,901,857 | |
| | 10,005,429 | | | Series 2012-14-BZ | | | 4.00% | | | | 03/25/2042 | | | | 10,956,970 | |
| | 22,866,322 | | | Series 2012-15-PZ | | | 4.00% | | | | 03/25/2042 | | | | 25,469,950 | |
| | 17,300,906 | | | Series 2012-20-ZT | | | 3.50% | | | | 03/25/2042 | | | | 18,292,234 | |
| | 52,793,940 | | | Series 2012-30-DZ | | | 4.00% | | | | 04/25/2042 | | | | 59,052,910 | |
| | 43,408,351 | | | Series 2012-31-Z | | | 4.00% | | | | 04/25/2042 | | | | 47,550,245 | |
| | 17,481,148 | | | Series 2012-63-EB | | | 2.00% | | | | 08/25/2040 | | | | 17,441,774 | |
| | 31,186,866 | | | Series 2012-74-Z | | | 4.00% | | | | 07/25/2042 | | | | 34,200,415 | |
| | 14,613,958 | | | Series 2012-80-EA | | | 2.00% | | | | 04/25/2042 | | | | 14,085,563 | |
| | 22,970,829 | | | Series 2012-86-ZC | | | 3.50% | | | | 08/25/2042 | | | | 24,646,027 | |
| | 32,004,383 | | | Series 2012-96-VZ | | | 3.50% | | | | 09/25/2042 | | | | 33,541,473 | |
| | 63,505,578 | | | Series 2012-98-BG | | | 4.50% | | | | 08/25/2040 | | | | 69,135,366 | |
| | 87,935,348 | | | Series 2012-99-QE | | | 3.00% | | | | 09/25/2042 | | | | 91,439,660 | |
| | 24,007,108 | | | Series 2013-130-ZE | | | 3.00% | | | | 01/25/2044 | | | | 23,594,774 | |
| | 21,570,240 | | | Series 2013-133-ZT | | | 3.00% | | | | 01/25/2039 | | | | 21,012,736 | |
| | 11,487,540 | | | Series 2013-36-Z | | | 3.00% | | | | 04/25/2043 | | | | 11,326,484 | |
| | 24,867,139 | | | Series 2013-41-ZH | | | 3.00% | | | | 05/25/2033 | | | | 25,381,424 | |
| | 19,292,416 | | | Series 2013-51-HS | | | 4.88% | # I/F | | | 04/25/2043 | | | | 17,796,843 | |
| | 8,321,815 | | | Series 2013-53-AB | | | 1.50% | | | | 03/25/2028 | | | | 8,229,871 | |
| | 8,605,363 | | | Series 2013-58-SC | | | 5.35% | # I/F | | | 06/25/2043 | | | | 8,092,423 | |
| | 123,883,864 | | | Series 2013-81-ZQ | | | 3.00% | | | | 08/25/2043 | | | | 113,330,966 | |
| | 37,212,987 | | | Series 2013-82-SH | | | 5.62% | # I/F I/O | | | 12/25/2042 | | | | 6,625,147 | |
| | 24,712,466 | | | Series 2013-8-Z | | | 3.00% | | | | 02/25/2043 | | | | 23,438,316 | |
| | 21,510,535 | | | Series 2014-12-GZ | | | 3.50% | | | | 03/25/2044 | | | | 22,754,158 | |
| | 23,358,655 | | | Series 2014-21-GZ | | | 3.00% | | | | 04/25/2044 | | | | 22,389,969 | |
| | 27,879,204 | | | Series 2014-37-ZY | | | 2.50% | | | | 07/25/2044 | | | | 25,435,191 | |
| | 44,261,008 | | | Series 2014-39-ZA | | | 3.00% | | | | 07/25/2044 | | | | 42,080,312 | |
| | 14,811,001 | | | Series 2014-46-NZ | | | 3.00% | | | | 06/25/2043 | | | | 14,607,329 | |
| | 76,657,853 | | | Series 2014-55-MA | | | 3.00% | | | | 10/25/2039 | | | | 80,085,893 | |
| | 9,162,206 | | | Series 2014-56-AD | | | 3.00% | | | | 01/25/2040 | | | | 9,312,153 | |
| | 53,048,415 | | | Series 2014-60-EZ | | | 3.00% | | | | 10/25/2044 | | | | 52,268,937 | |
| | 37,446,131 | | | Series 2014-61-ZV | | | 3.00% | | | | 10/25/2044 | | | | 35,853,813 | |
| | 31,578,331 | | | Series 2014-64-NZ | | | 3.00% | | | | 10/25/2044 | | | | 30,204,010 | |
| | 154,467,741 | | | Series 2014-65-CD | | | 3.00% | | | | 06/25/2040 | | | | 160,788,777 | |
| | 11,119,308 | | | Series 2014-67-DZ | | | 3.00% | | | | 10/25/2044 | | | | 10,716,124 | |
| | 148,947,156 | | | Series 2014-68-MA | | | 3.00% | | | | 11/25/2040 | | | | 154,818,623 | |
| | 35,546,649 | | | Series 2014-68-MZ | | | 3.00% | | | | 11/25/2044 | | | | 33,823,575 | |
| | 25,334,425 | | | Series 2014-6-Z | | | 2.50% | | | | 02/25/2044 | | | | 22,295,951 | |
| | 63,773,307 | | | Series 2014-73-CQ | | | 3.00% | | | | 06/25/2040 | | | | 66,405,168 | |
| | 20,066,456 | | | Series 2014-77-VZ | | | 3.00% | | | | 11/25/2044 | | | | 19,157,720 | |
| | 35,626,338 | | | Series 2014-82-YA | | | 3.00% | | | | 04/25/2041 | | | | 37,080,519 | |
| | 25,770,598 | | | Series 2014-84-KZ | | | 3.00% | | | | 12/25/2044 | | | | 24,767,243 | |
| | | | | | |
| The accompanying notes are an integral part of these financial statements. | | Annual Report | | March 31, 2016 | | 31 |
| | |
| Schedule of Investments DoubleLine Total Return Bond Fund (Cont.) | | March 31, 2016 |
| | | | | | | | | | | | | | | | |
PRINCIPAL
AMOUNT $ | | | SECURITY DESCRIPTION | | RATE | | | MATURITY | | | VALUE $ | |
| |
| | | | Federal National Mortgage Association, (Cont.) | |
| | 170,820,864 | | | Series 2014-95-NA | | | 3.00% | | | | 04/25/2041 | | | | 177,523,072 | |
| | 198,036,380 | | | Series 2014-M11-1A | | | 3.12% | # | | | 08/25/2024 | | | | 210,737,008 | |
| | 118,959,964 | | | Series 2015-09-HA | | | 3.00% | | | | 01/25/2045 | | | | 124,369,811 | |
| | 59,125,202 | | | Series 2015-11-A | | | 3.00% | | | | 05/25/2034 | | | | 61,994,010 | |
| | 141,674,027 | | | Series 2015-21-G | | | 3.00% | | | | 02/25/2042 | | | | 148,159,212 | |
| | 26,578,577 | | | Series 2015-42-CA | | | 3.00% | | | | 03/25/2044 | | | | 27,656,245 | |
| | 82,535,539 | | | Series 2015-49-A | | | 3.00% | | | | 03/25/2044 | | | | 86,102,156 | |
| | 23,430,082 | | | Series 2015-63-KD | | | 3.00% | | | | 07/25/2041 | | | | 24,202,693 | |
| | 89,825,862 | | | Series 2015-88-AC | | | 3.00% | | | | 04/25/2043 | | | | 92,187,169 | |
| | 241,514,505 | | | Series 2015-88-BA | | | 3.00% | | | | 04/25/2044 | | | | 251,197,933 | |
| | 77,423,246 | | | Series 2016-02-JA | | | 2.50% | | | | 02/25/2046 | | | | 79,323,275 | |
| | 17,569,116 | | | Series 400-S4 | | | 5.02% | # I/F I/O | | | 11/25/2039 | | | | 2,509,660 | |
| | 146,758,935 | | | Series 412-A3 | | | 3.00% | | | | 08/25/2042 | | | | 149,950,117 | |
| |
| | | | Federal National Mortgage Association Pass-Thru, | |
| | 17,290,756 | | | Pool 555743 | | | 5.00% | | | | 09/01/2033 | | | | 19,233,062 | |
| | 18,528,499 | | | Pool 735141 | | | 5.50% | | | | 01/01/2035 | | | | 20,995,937 | |
| | 6,902,343 | | | Pool 735230 | | | 5.50% | | | | 02/01/2035 | | | | 7,813,449 | |
| | 13,019,947 | | | Pool 735382 | | | 5.00% | | | | 04/01/2035 | | | | 14,456,266 | |
| | 21,325,332 | | | Pool 735402 | | | 5.00% | | | | 04/01/2035 | | | | 23,673,929 | |
| | 15,005,437 | | | Pool 735484 | | | 5.00% | | | | 05/01/2035 | | | | 16,652,831 | |
| | 5,740,259 | | | Pool 735667 | | | 5.00% | | | | 07/01/2035 | | | | 6,382,915 | |
| | 4,880,729 | | | Pool 735893 | | | 5.00% | | | | 10/01/2035 | | | | 5,412,848 | |
| | 12,267,619 | | | Pool 745275 | | | 5.00% | | | | 02/01/2036 | | | | 13,606,810 | |
| | 1,162,855 | | | Pool 745571 | | | 4.00% | | | | 01/01/2019 | | | | 1,211,153 | |
| | 547,977 | | | Pool 888695 | | | 5.00% | | | | 08/01/2037 | | | | 606,088 | |
| | 2,601,223 | | | Pool 888968 | | | 5.00% | | | | 08/01/2035 | | | | 2,890,449 | |
| | 6,730,493 | | | Pool 889509 | | | 6.00% | | | | 05/01/2038 | | | | 7,688,944 | |
| | 12,968,094 | | | Pool 889662 | | | 6.00% | | | | 06/01/2038 | | | | 14,802,703 | |
| | 19,544,616 | | | Pool 890549 | | | 4.00% | | | | 11/01/2043 | | | | 21,195,149 | |
| | 21,411,615 | | | Pool 890565 | | | 3.00% | | | | 11/01/2043 | | | | 22,027,410 | |
| | 1,746,326 | | | Pool 929321 | | | 5.50% | | | | 03/01/2038 | | | | 1,958,561 | |
| | 1,456,376 | | | Pool 931104 | | | 5.00% | | | | 05/01/2039 | | | | 1,611,222 | |
| | 987,651 | | | Pool 961410 | | | 6.00% | | | | 01/01/2038 | | | | 1,126,221 | |
| | 407,507 | | | Pool 975116 | | | 5.00% | | | | 05/01/2038 | | | | 450,722 | |
| | 4,945,131 | | | Pool 982036 | | | 6.00% | | | | 05/01/2038 | | | | 5,633,861 | |
| | 4,320,678 | | | Pool 985190 | | | 6.00% | | | | 08/01/2038 | | | | 4,924,055 | |
| | 2,516,988 | | | Pool 986864 | | | 6.50% | | | | 08/01/2038 | | | | 2,949,428 | |
| | 2,866,589 | | | Pool 987316 | | | 6.50% | | | | 09/01/2038 | | | | 3,279,031 | |
| | 11,997,015 | | | Pool 995070 | | | 5.50% | | | | 08/01/2037 | | | | 13,598,731 | |
| | 43,661,024 | | | Pool 995112 | | | 5.50% | | | | 07/01/2036 | | | | 49,478,607 | |
| | 22,755,072 | | | Pool 995203 | | | 5.00% | | | | 07/01/2035 | | | | 25,302,825 | |
| | 1,821,362 | | | Pool 995581 | | | 6.00% | | | | 01/01/2039 | | | | 2,075,124 | |
| | 39,079,937 | | | Pool 995849 | | | 5.00% | | | | 08/01/2036 | | | | 43,436,986 | |
| | 31,914,523 | | | Pool AB2123 | | | 4.00% | | | | 01/01/2031 | | | | 34,405,937 | |
| | 681,072 | | | Pool AB2370 | | | 4.50% | | | | 09/01/2035 | | | | 715,466 | |
| | 4,153,063 | | | Pool AB3713 | | | 4.00% | | | | 10/01/2031 | | | | 4,475,827 | |
| | 16,841,984 | | | Pool AB3796 | | | 3.50% | | | | 11/01/2031 | | | | 17,836,218 | |
| | 8,312,838 | | | Pool AB3850 | | | 4.00% | | | | 11/01/2041 | | | | 8,689,314 | |
| | 15,377,799 | | | Pool AB3923 | | | 4.00% | | | | 11/01/2041 | | | | 16,074,890 | |
| | 52,583,577 | | | Pool AB4167 | | | 3.50% | | | | 01/01/2032 | | | | 55,688,011 | |
| | 52,396,077 | | | Pool AB4261 | | | 3.50% | | | | 01/01/2032 | | | | 55,483,247 | |
| | 10,020,909 | | | Pool AB5084 | | | 3.50% | | | | 05/01/2032 | | | | 10,661,971 | |
| | 20,112,943 | | | Pool AB5156 | | | 3.50% | | | | 05/01/2032 | | | | 21,300,456 | |
| | 31,721,758 | | | Pool AB5212 | | | 3.50% | | | | 05/01/2032 | | | | 33,590,824 | |
| | 12,596,569 | | | Pool AB5243 | | | 4.00% | | | | 05/01/2042 | | | | 13,168,783 | |
| | 45,545,977 | | | Pool AB5911 | | | 3.00% | | | | 08/01/2032 | | | | 47,499,675 | |
| | 12,230,046 | | | Pool AB6280 | | | 3.00% | | | | 09/01/2042 | | | | 12,544,525 | |
| | 19,590,749 | | | Pool AB6349 | | | 3.00% | | | | 10/01/2032 | | | | 20,431,134 | |
| | 57,233,147 | | | Pool AB6750 | | | 3.00% | | | | 10/01/2032 | | | | 59,685,838 | |
| | 27,607,376 | | | Pool AB6751 | | | 3.00% | | | | 10/01/2032 | | | | 28,791,640 | |
| | 153,485,040 | | | Pool AB6854 | | | 3.00% | | | | 11/01/2042 | | | | 157,900,157 | |
| | 115,838,636 | | | Pool AB7077 | | | 3.00% | | | | 11/01/2042 | | | | 119,170,929 | |
| | 93,138,516 | | | Pool AB7344 | | | 3.00% | | | | 12/01/2032 | | | | 97,134,025 | |
| | 41,324,234 | | | Pool AB7776 | | | 3.00% | | | | 02/01/2043 | | | | 42,389,608 | |
| | 50,429,717 | | | Pool AB7877 | | | 3.00% | | | | 02/01/2043 | | | | 51,730,448 | |
| | 23,322,542 | | | Pool AB8418 | | | 3.00% | | | | 02/01/2033 | | | | 24,366,054 | |
| | 34,939,962 | | | Pool AB8520 | | | 3.00% | | | | 02/01/2033 | | | | 36,503,238 | |
| | 37,871,818 | | | Pool AB8703 | | | 3.00% | | | | 03/01/2038 | | | | 39,077,168 | |
| | 19,326,930 | | | Pool AB8858 | | | 3.00% | | | | 04/01/2033 | | | | 20,191,686 | |
| | 31,666,870 | | | Pool AB9020 | | | 3.00% | | | | 04/01/2038 | | | | 32,674,752 | |
| | 31,711,521 | | | Pool AB9197 | | | 3.00% | | | | 05/01/2033 | | | | 33,130,525 | |
| | 93,259,412 | | | Pool AB9406 | | | 3.00% | | | | 05/01/2033 | | | | 97,432,535 | |
| | 20,212,271 | | | Pool AB9409 | | | 3.00% | | | | 05/01/2033 | | | | 21,116,671 | |
| | | | | | | | | | | | | | | | |
PRINCIPAL
AMOUNT $ | | | SECURITY DESCRIPTION | | RATE | | | MATURITY | | | VALUE $ | |
| |
| | | | Federal National Mortgage Association Pass-Thru, (Cont.) | |
| | 854,926 | | | Pool AC1032 | | | 5.00% | | | | 06/01/2040 | | | | 906,635 | |
| | 41,114,322 | | | Pool AD0189 | | | 5.50% | | | | 02/01/2039 | | | | 46,490,579 | |
| | 19,494,941 | | | Pool AD0500 | | | 5.50% | | | | 09/01/2036 | | | | 22,089,569 | |
| | 1,279,155 | | | Pool AD2177 | | | 4.50% | | | | 06/01/2030 | | | | 1,400,051 | |
| | 2,012,662 | | | Pool AD6438 | | | 5.00% | | | | 06/01/2040 | | | | 2,232,910 | |
| | 1,442,866 | | | Pool AD7859 | | | 5.00% | | | | 06/01/2040 | | | | 1,606,916 | |
| | 13,586,175 | | | Pool AH0607 | | | 4.00% | | | | 12/01/2040 | | | | 14,609,425 | |
| | 2,354,025 | | | Pool AH1140 | | | 4.50% | | | | 12/01/2040 | | | | 2,477,125 | |
| | 14,005,383 | | | Pool AH4437 | | | 4.00% | | | | 01/01/2041 | | | | 14,635,787 | |
| | 3,090,451 | | | Pool AH7309 | | | 4.00% | | | | 02/01/2031 | | | | 3,331,396 | |
| | 15,754,772 | | | Pool AH9323 | | | 4.00% | | | | 04/01/2026 | | | | 16,816,541 | |
| | 2,093,518 | | | Pool AI8889 | | | 4.00% | | | | 08/01/2041 | | | | 2,187,762 | |
| | 8,372,467 | | | Pool AI9831 | | | 4.00% | | | | 09/01/2041 | | | | 8,747,019 | |
| | 2,381,242 | | | Pool AJ1265 | | | 4.00% | | | | 09/01/2041 | | | | 2,488,262 | |
| | 4,633,865 | | | Pool AJ1399 | | | 4.00% | | | | 09/01/2041 | | | | 4,841,194 | |
| | 14,428,104 | | | Pool AJ1467 | | | 4.00% | | | | 10/01/2041 | | | | 15,080,122 | |
| | 8,687,722 | | | Pool AJ3392 | | | 4.00% | | | | 10/01/2041 | | | | 9,080,979 | |
| | 2,630,980 | | | Pool AJ3854 | | | 4.00% | | | | 10/01/2041 | | | | 2,746,551 | |
| | 43,784,120 | | | Pool AJ4118 | | | 4.00% | | | | 11/01/2041 | | | | 45,766,813 | |
| | 11,005,761 | | | Pool AJ4131 | | | 4.00% | | | | 10/01/2041 | | | | 11,503,244 | |
| | 1,932,065 | | | Pool AJ5172 | | | 4.00% | | | | 11/01/2041 | | | | 2,018,707 | |
| | 53,409,564 | | | Pool AJ5322 | | | 4.00% | | | | 11/01/2041 | | | | 57,421,370 | |
| | 28,038,866 | | | Pool AJ7677 | | | 3.50% | | | | 12/01/2041 | | | | 28,985,715 | |
| | 5,346,123 | | | Pool AJ8334 | | | 4.00% | | | | 12/01/2041 | | | | 5,587,827 | |
| | 53,226,602 | | | Pool AK0713 | | | 3.50% | | | | 01/01/2032 | | | | 56,365,745 | |
| | 14,523,718 | | | Pool AK4039 | | | 4.00% | | | | 02/01/2042 | | | | 15,182,725 | |
| | 10,496,941 | | | Pool AK4763 | | | 4.00% | | | | 02/01/2042 | | | | 10,974,524 | |
| | 11,986,122 | | | Pool AK9438 | | | 4.00% | | | | 03/01/2042 | | | | 12,530,788 | |
| | 15,921,959 | | | Pool AK9439 | | | 4.00% | | | | 03/01/2042 | | | | 16,645,600 | |
| | 2,201,000 | | | Pool AK9446 | | | 4.50% | | | | 03/01/2042 | | | | 2,315,878 | |
| | 11,967,225 | | | Pool AL1485 | | | 6.00% | | | | 01/01/2040 | | | | 13,662,402 | |
| | 6,781,957 | | | Pool AL1548 | | | 6.00% | | | | 07/01/2039 | | | | 7,747,427 | |
| | 12,934,724 | | | Pool AL1554 | | | 6.00% | | | | 01/01/2040 | | | | 14,745,997 | |
| | 25,576,031 | | | Pool AL1690 | | | 6.00% | | | | 05/01/2041 | | | | 29,182,553 | |
| | 34,214,894 | | | Pool AL1744 | | | 6.00% | | | | 10/01/2040 | | | | 39,048,503 | |
| | 10,287,171 | | | Pool AL1745 | | | 6.00% | | | | 03/01/2040 | | | | 11,719,911 | |
| | 12,233,336 | | | Pool AL1793 | | | 6.00% | | | | 01/01/2041 | | | | 13,954,336 | |
| | 115,210,212 | | | Pool AL3038 | | | 3.00% | | | | 01/01/2033 | | | | 120,151,643 | |
| | 163,233,966 | | | Pool AL3699 | | | 3.00% | | | | 06/01/2043 | | | | 167,430,891 | |
| | 82,588,903 | | | Pool AL3883 | | | 3.00% | | | | 07/01/2043 | | | | 84,716,771 | |
| | 7,261,777 | | | Pool AL4292 | | | 4.50% | | | | 04/01/2026 | | | | 7,837,145 | |
| | 15,713,444 | | | Pool AL4312 | | | 4.00% | | | | 10/01/2043 | | | | 17,040,543 | |
| | 33,179,235 | | | Pool AL6075 | | | 3.50% | | | | 09/01/2053 | | | | 34,199,304 | |
| | 41,735,455 | | | Pool AL6076 | | | 3.00% | | | | 06/01/2053 | | | | 42,200,547 | |
| | 140,449,883 | | | Pool AL6141 | | | 4.00% | | | | 04/01/2042 | | | | 151,349,877 | |
| | 84,871,642 | | | Pool AL6325 | | | 3.00% | | | | 10/01/2044 | | | | 87,295,119 | |
| | 57,992,417 | | | Pool AL6486 | | | 4.50% | | | | 02/01/2045 | | | | 63,365,008 | |
| | 129,582,725 | | | Pool AL6538 | | | 4.50% | | | | 06/01/2044 | | | | 141,325,518 | |
| | 50,295,762 | | | Pool AO2980 | | | 4.00% | | | | 05/01/2042 | | | | 52,588,153 | |
| | 101,496,734 | | | Pool AP4787 | | | 3.50% | | | | 09/01/2042 | | | | 104,915,524 | |
| | 96,058,236 | | | Pool AP4789 | | | 3.50% | | | | 09/01/2042 | | | | 99,314,912 | |
| | 22,917,411 | | | Pool AQ5541 | | | 3.00% | | | | 12/01/2042 | | | | 23,575,490 | |
| | 28,136,985 | | | Pool AR9856 | | | 3.00% | | | | 04/01/2043 | | | | 28,945,531 | |
| | 54,194,149 | | | Pool AS1927 | | | 4.50% | | | | 03/01/2044 | | | | 59,160,007 | |
| | 54,791,745 | | | Pool AS2038 | | | 4.50% | | | | 03/01/2044 | | | | 59,833,826 | |
| | 49,754,564 | | | Pool AS2517 | | | 4.50% | | | | 05/01/2044 | | | | 54,325,898 | |
| | 24,718,914 | | | Pool AS2551 | | | 4.50% | | | | 06/01/2044 | | | | 26,897,536 | |
| | 22,737,044 | | | Pool AS2765 | | | 4.50% | | | | 07/01/2044 | | | | 24,737,519 | |
| | 58,101,005 | | | Pool AS3201 | | | 3.00% | | | | 08/01/2034 | | | | 60,674,558 | |
| | 25,727,105 | | | Pool AS3456 | | | 3.00% | | | | 10/01/2034 | | | | 26,869,070 | |
| | 57,658,458 | | | Pool AS3666 | | | 3.00% | | | | 10/01/2034 | | | | 60,215,254 | |
| | 228,007,321 | | | Pool AS3961 | | | 3.00% | | | | 12/01/2044 | | | | 234,214,000 | |
| | 62,947,899 | | | Pool AS4154 | | | 3.00% | | | | 12/01/2044 | | | | 64,661,429 | |
| | 46,349,382 | | | Pool AS4212 | | | 3.00% | | | | 01/01/2035 | | | | 48,410,428 | |
| | 70,465,750 | | | Pool AS4281 | | | 3.00% | | | | 01/01/2035 | | | | 73,594,268 | |
| | 37,882,353 | | | Pool AS4345 | | | 3.50% | | | | 01/01/2045 | | | | 39,956,168 | |
| | 53,432,950 | | | Pool AS4360 | | | 3.00% | | | | 01/01/2035 | | | | 55,809,621 | |
| | 391,563,452 | | | Pool AS4625 | | | 3.00% | | | | 03/01/2045 | | | | 402,222,357 | |
| | 162,958,716 | | | Pool AS4645 | | | 3.00% | | | | 03/01/2045 | | | | 167,394,681 | |
| | 60,900,853 | | | Pool AS4779 | | | 3.00% | | | | 04/01/2035 | | | | 63,191,030 | |
| | 60,240,210 | | | Pool AS4780 | | | 3.00% | | | | 04/01/2035 | | | | 62,505,504 | |
| | 82,207,209 | | | Pool AS4840 | | | 3.00% | | | | 04/01/2035 | | | | 85,298,637 | |
| | 39,615,519 | | | Pool AS4881 | | | 3.00% | | | | 05/01/2035 | | | | 41,105,278 | |
| | 40,086,946 | | | Pool AS4882 | | | 3.00% | | | | 05/01/2035 | | | | 41,594,430 | |
| | | | | | |
| 32 | | DoubleLine Funds Trust | | | | The accompanying notes are an integral part of these financial statements. |
| | | | | | | | | | | | | | | | |
PRINCIPAL
AMOUNT $ | | | SECURITY DESCRIPTION | | RATE | | | MATURITY | | | VALUE $ | |
| |
| | | | Federal National Mortgage Association Pass-Thru, (Cont.) | |
| | 67,128,369 | | | Pool AX9696 | | | 3.00% | | | | 07/01/2045 | | | | 68,024,005 | |
| | 112,275,234 | | | Pool AY3974 | | | 3.00% | | | | 03/01/2045 | | | | 115,331,523 | |
| | 43,527,718 | | | Pool AY4295 | | | 3.00% | | | | 02/01/2045 | | | | 44,097,702 | |
| | 23,684,047 | | | Pool AY4296 | | | 3.00% | | | | 01/01/2045 | | | | 23,990,141 | |
| | 23,266,757 | | | Pool AY5471 | | | 3.00% | | | | 03/01/2045 | | | | 23,572,542 | |
| | 4,342,654 | | | Pool MA0264 | | | 4.50% | | | | 12/01/2029 | | | | 4,723,878 | |
| | 117,055 | | | Pool MA0315 | | | 4.50% | | | | 01/01/2025 | | | | 117,767 | |
| | 16,828,611 | | | Pool MA0353 | | | 4.50% | | | | 03/01/2030 | | | | 18,305,930 | |
| | 3,681,112 | | | Pool MA0406 | | | 4.50% | | | | 05/01/2030 | | | | 4,004,262 | |
| | 249,190 | | | Pool MA0445 | | | 5.00% | | | | 06/01/2040 | | | | 268,482 | |
| | 1,031,318 | | | Pool MA0459 | | | 4.00% | | | | 07/01/2020 | | | | 1,076,488 | |
| | 666,627 | | | Pool MA0468 | | | 5.00% | | | | 07/01/2040 | | | | 707,196 | |
| | 3,401,599 | | | Pool MA0502 | | | 4.00% | | | | 08/01/2020 | | | | 3,551,241 | |
| | 1,506,096 | | | Pool MA0517 | | | 4.00% | | | | 09/01/2020 | | | | 1,572,498 | |
| | 5,230,737 | | | Pool MA0534 | | | 4.00% | | | | 10/01/2030 | | | | 5,637,645 | |
| | 9,294,999 | | | Pool MA0536 | | | 4.00% | | | | 10/01/2020 | | | | 9,706,406 | |
| | 11,462,770 | | | Pool MA0580 | | | 4.00% | | | | 11/01/2020 | | | | 11,971,906 | |
| | 1,089,921 | | | Pool MA0587 | | | 4.00% | | | | 12/01/2030 | | | | 1,174,982 | |
| | 27,593,741 | | | Pool MA0616 | | | 4.00% | | | | 01/01/2031 | | | | 29,742,539 | |
| | 11,638,254 | | | Pool MA0896 | | | 4.00% | | | | 11/01/2041 | | | | 12,167,184 | |
| | 195,100,715 | | | Pool MA0919 | | | 3.50% | | | | 12/01/2031 | | | | 206,579,138 | |
| | 83,585,015 | | | Pool MA0949 | | | 3.50% | | | | 01/01/2032 | | | | 88,509,168 | |
| | 99,948,810 | | | Pool MA0976 | | | 3.50% | | | | 02/01/2032 | | | | 105,847,340 | |
| | 48,772,362 | | | Pool MA1010 | | | 3.50% | | | | 03/01/2032 | | | | 51,645,757 | |
| | 15,026,536 | | | Pool MA1039 | | | 3.50% | | | | 04/01/2042 | | | | 15,534,016 | |
| | 65,905,899 | | | Pool MA1059 | | | 3.50% | | | | 05/01/2032 | | | | 69,791,287 | |
| | 9,423,482 | | | Pool MA1068 | | | 3.50% | | | | 05/01/2042 | | | | 9,741,931 | |
| | 142,577,575 | | | Pool MA1084 | | | 3.50% | | | | 06/01/2032 | | | | 150,992,371 | |
| | 21,600,059 | | | Pool MA1093 | | | 3.50% | | | | 06/01/2042 | | | | 22,329,087 | |
| | 17,873,683 | | | Pool MA1094 | | | 4.00% | | | | 06/01/2042 | | | | 18,686,194 | |
| | 84,571,596 | | | Pool MA1107 | | | 3.50% | | | | 07/01/2032 | | | | 89,561,499 | |
| | 196,063,987 | | | Pool MA1117 | | | 3.50% | | | | 07/01/2042 | | | | 202,689,427 | |
| | 235,110,971 | | | Pool MA1136 | | | 3.50% | | | | 08/01/2042 | | | | 243,043,829 | |
| | 56,234,183 | | | Pool MA1138 | | | 3.50% | | | | 08/01/2032 | | | | 59,554,775 | |
| | 63,665,456 | | | Pool MA1179 | | | 3.50% | | | | 09/01/2042 | | | | 65,821,366 | |
| | 11,162,074 | | | Pool MA1201 | | | 3.50% | | | | 10/01/2032 | | | | 11,821,215 | |
| | 139,976,667 | | | Pool MA1209 | | | 3.50% | | | | 10/01/2042 | | | | 144,699,082 | |
| | 343,179,790 | | | Pool MA1237 | | | 3.00% | | | | 11/01/2032 | | | | 357,901,555 | |
| | 8,617,358 | | | Pool MA1242 | | | 3.50% | | | | 11/01/2042 | | | | 8,907,397 | |
| | 265,283,873 | | | Pool MA1275 | | | 3.00% | | | | 12/01/2032 | | | | 276,664,317 | |
| | 36,351,482 | | | Pool MA1338 | | | 3.00% | | | | 02/01/2033 | | | | 37,910,609 | |
| | 142,902,775 | | | Pool MA1366 | | | 3.00% | | | | 03/01/2033 | | | | 149,296,583 | |
| | 87,682,149 | | | Pool MA1401 | | | 3.00% | | | | 04/01/2033 | | | | 91,605,393 | |
| | 154,667,210 | | | Pool MA1459 | | | 3.00% | | | | 06/01/2033 | | | | 161,588,276 | |
| | 19,495,976 | | | Pool MA1490 | | | 3.00% | | | | 07/01/2033 | | | | 20,368,399 | |
| | 128,971,338 | | | Pool MA2018 | | | 3.50% | | | | 09/01/2034 | | | | 136,391,808 | |
| | 62,093,771 | | | Pool MA2114 | | | 3.50% | | | | 12/01/2044 | | | | 64,149,392 | |
| | 49,212,919 | | | Pool MA2151 | | | 3.50% | | | | 01/01/2045 | | | | 50,842,298 | |
| | 75,797,503 | | | Pool MA2164 | | | 3.50% | | | | 02/01/2035 | | | | 80,139,044 | |
| | 190,044,845 | | | Pool MA2166 | | | 3.50% | | | | 02/01/2045 | | | | 196,336,947 | |
| | 141,243,101 | | | Pool MA2248 | | | 3.00% | | | | 04/01/2045 | | | | 143,092,614 | |
| | 142,566,142 | | | Pool MA2270 | | | 3.00% | | | | 05/01/2045 | | | | 144,431,876 | |
| | 14,186,742 | | | Pool MA3894 | | | 4.00% | | | | 09/01/2031 | | | | 15,296,324 | |
| |
| | | | Government National Mortgage Association, | |
| | 12,382,685 | | | Pool MA251 | | | 3.50% | | | | 01/20/2045 | | | | 12,905,580 | |
| | 14,700,000 | | | Series 2003-67-SP | | | 6.67% | # I/F I/O | | | 08/20/2033 | | | | 4,356,917 | |
| | 9,566,129 | | | Series 2003-86-ZK | | | 5.00% | | | | 10/20/2033 | | | | 10,562,510 | |
| | 4,449,427 | | | Series 2004-49-Z | | | 6.00% | | | | 06/20/2034 | | | | 5,036,123 | |
| | 3,393,536 | | | Series 2004-80-PH | | | 5.00% | | | | 07/20/2034 | | | | 3,548,890 | |
| | 9,677,806 | | | Series 2004-83-CS | | | 5.65% | # I/F I/O | | | 10/20/2034 | | | | 1,790,604 | |
| | 2,523,115 | | | Series 2005-21-Z | | | 5.00% | | | | 03/20/2035 | | | | 2,766,234 | |
| | 22,662,871 | | | Series 2005-39-ZB | | | 5.00% | | | | 07/20/2034 | | | | 25,605,188 | |
| | 919,520 | | | Series 2006-24-CX | | | 36.80% | # I/F | | | 05/20/2036 | | | | 2,463,134 | |
| | 13,453,176 | | | Series 2007-26-SJ | | | 4.26% | # I/F I/O | | | 04/20/2037 | | | | 1,377,729 | |
| | 7,789,095 | | | Series 2008-2-SM | | | 6.06% | # I/F I/O | | | 01/16/2038 | | | | 1,619,724 | |
| | 13,071,223 | | | Series 2008-42-AI | | | 7.25% | # I/F I/O | | | 05/16/2038 | | | | 3,440,437 | |
| | 5,990,442 | | | Series 2008-43-SH | | | 5.90% | # I/F I/O | | | 05/20/2038 | | | | 947,921 | |
| | 6,916,443 | | | Series 2008-51-SC | | | 5.82% | # I/F I/O | | | 06/20/2038 | | | | 1,283,448 | |
| | 4,408,964 | | | Series 2008-51-SE | | | 5.81% | # I/F I/O | | | 06/16/2038 | | | | 859,745 | |
| | 2,681,038 | | | Series 2008-82-SM | | | 5.62% | # I/F I/O | | | 09/20/2038 | | | | 477,638 | |
| | 4,854,838 | | | Series 2008-83-SD | | | 6.12% | # I/F I/O | | | 11/16/2036 | | | | 1,058,105 | |
| | 15,948,641 | | | Series 2009-106-VZ | | | 4.50% | | | | 11/20/2039 | | | | 17,579,180 | |
| | 9,044,606 | | | Series 2009-10-NS | | | 6.21% | # I/F I/O | | | 02/16/2039 | | | | 1,908,992 | |
| | 4,190,813 | | | Series 2009-24-SN | | | 5.67% | # I/F I/O | | | 09/20/2038 | | | | 566,649 | |
| | | | | | | | | | | | | | | | |
PRINCIPAL
AMOUNT $ /
SHARES | | | SECURITY DESCRIPTION | | RATE | | | MATURITY | | | VALUE $ | |
| |
| | | | Government National Mortgage Association, (Cont.) | |
| | 11,229,137 | | | Series 2009-32-ZE | | | 4.50% | | | | 05/16/2039 | | | | 12,238,185 | |
| | 64,373,209 | | | Series 2009-35-DZ | | | 4.50% | | | | 05/20/2039 | | | | 70,440,642 | |
| | 6,632 | | | Series 2009-41-ZQ | | | 4.50% | | | | 06/16/2039 | | | | 8,511 | |
| | 7,324,133 | | | Series 2009-48-Z | | | 5.00% | | | | 06/16/2039 | | | | 8,154,238 | |
| | 1,774,410 | | | Series 2009-50-KP | | | 4.50% | | | | 06/20/2039 | | | | 1,892,622 | |
| | 6,029,928 | | | Series 2009-69-TS | | | 5.76% | # I/F I/O | | | 04/16/2039 | | | | 798,649 | |
| | 9,957,662 | | | Series 2009-75-GZ | | | 4.50% | | | | 09/20/2039 | | | | 10,799,665 | |
| | 7,771,934 | | | Series 2009-87-IG | | | 6.31% | # I/F I/O | | | 03/20/2037 | | | | 1,120,288 | |
| | 53,957,610 | | | Series 2010-106-PS | | | 5.62% | # I/F I/O | | | 03/20/2040 | | | | 7,855,608 | |
| | 14,039,111 | | | Series 2010-1-SA | | | 5.31% | # I/F I/O | | | 01/16/2040 | | | | 1,881,481 | |
| | 3,371,988 | | | Series 2010-25-ZB | | | 4.50% | | | | 02/16/2040 | | | | 3,781,447 | |
| | 132,793,478 | | | Series 2010-26-QS | | | 5.82% | # I/F I/O | | | 02/20/2040 | | | | 21,436,373 | |
| | 11,509,857 | | | Series 2010-42-AY | | | 5.00% | | | | 11/20/2039 | | | | 12,846,711 | |
| | 11,566,466 | | | Series 2010-42-ES | | | 5.25% | # I/F I/O | | | 04/20/2040 | | | | 1,684,549 | |
| | 3,509,660 | | | Series 2010-61-AS | | | 6.12% | # I/F I/O | | | 09/20/2039 | | | | 543,557 | |
| | 34,512,998 | | | Series 2010-62-SB | | | 5.32% | # I/F I/O | | | 05/20/2040 | | | | 5,111,189 | |
| | 9,130,443 | | | Series 2010-62-ZG | | | 5.50% | | | | 05/16/2040 | | | | 10,448,908 | |
| | 61,120,116 | | | Series 2010-9-XD | | | 6.16% | # I/F I/O | | | 01/16/2040 | | | | 10,317,772 | |
| | 7,833,334 | | | Series 2011-18-SN | | | 8.64% | # I/F | | | 12/20/2040 | | | | 9,267,868 | |
| | 8,333,334 | | | Series 2011-18-YS | | | 8.64% | # I/F | | | 12/20/2040 | | | | 9,859,141 | |
| | 9,527,502 | | | Series 2011-51-UZ | | | 4.50% | | | | 04/20/2041 | | | | 10,392,599 | |
| | 5,920,648 | | | Series 2011-69-OC | | | 0.00% | P/O | | | 05/20/2041 | | | | 5,506,602 | |
| | 49,270,013 | | | Series 2011-69-SB | | | 4.92% | # I/F I/O | | | 05/20/2041 | | | | 7,099,434 | |
| | 25,926,407 | | | Series 2011-71-ZA | | | 4.50% | | | | 02/20/2041 | | | | 28,465,147 | |
| | 18,312,791 | | | Series 2011-72-AS | | | 4.95% | # I/F I/O | | | 05/20/2041 | | | | 2,522,393 | |
| | 6,068,246 | | | Series 2011-72-DO | | | 0.00 | % P/O | | | 03/16/2033 | | | | 6,049,580 | |
| | 13,156,255 | | | Series 2011-72-SK | | | 5.72% | # I/F I/O | | | 05/20/2041 | | | | 2,181,281 | |
| | 12,118,033 | | | Series 2012-105-SE | | | 5.77% | # I/F I/O | | | 01/20/2041 | | | | 1,001,975 | |
| | 23,224,664 | | | Series 2012-52-PN | | | 2.00% | | | | 12/20/2039 | | | | 23,697,713 | |
| | 48,686,398 | | | Series 2013-116-LS | | | 5.72% | # I/F I/O | | | 08/20/2043 | | | | 8,186,788 | |
| | 41,176,761 | | | Series 2013-136-CS | | | 5.76% | # I/F I/O | | | 09/16/2043 | | | | 8,088,092 | |
| | 17,982,604 | | | Series 2013-182-WZ | | | 2.50% | | | | 12/20/2043 | | | | 17,012,277 | |
| | 55,432,310 | | | Series 2013-182-ZW | | | 2.50% | | | | 12/20/2043 | | | | 52,229,620 | |
| | 32,073,260 | | | Series 2013-186-SG | | | 5.81% | # I/F I/O | | | 02/16/2043 | | | | 5,357,238 | |
| | 32,414,921 | | | Series 2013-26-MS | | | 5.82% | # I/F I/O | | | 02/20/2043 | | | | 5,488,222 | |
| | 56,284,267 | | | Series 2013-34-PL | | | 3.00% | | | | 03/20/2042 | | | | 58,120,349 | |
| | 66,026,758 | | | Series 2014-163-PS | | | 5.17% | # I/F I/O | | | 11/20/2044 | | | | 9,257,731 | |
| | 68,370,962 | | | Series 2014-167-SA | | | 5.17% | # I/F I/O | | | 11/20/2044 | | | | 10,270,077 | |
| | 93,691,883 | | | Series 2014-21-SE | | | 5.12% | # I/F I/O | | | 02/20/2044 | | | | 15,845,808 | |
| | 55,465,537 | | | Series 2014-39-SK | | | 5.77% | # I/F I/O | | | 03/20/2044 | | | | 9,746,160 | |
| | 42,567,426 | | | Series 2014-59-DS | | | 5.81% | # I/F I/O | | | 04/16/2044 | | | | 7,973,641 | |
| | | | | | | | | | | | | | | | |
| | | | Total US Government / Agency Mortgage Backed Obligations
(Cost $27,290,609,789) | | | | 28,199,031,981 | |
| | | | | | | | | | | | | | | | |
| | US GOVERNMENT BONDS AND NOTES 3.5% | |
| | 1,325,000,000 | | | United States Treasury Notes | | | 1.63% | | | | 11/15/2022 | | | | 1,335,507,250 | |
| | 700,000,000 | | | United States Treasury Notes | | | 2.00% | | | | 02/15/2023 | | | | 721,669,900 | |
| | | | | | | | | | | | | | | | |
| | | | Total US Government Bonds and Notes
(Cost $1,999,491,016) | | | | 2,057,177,150 | |
| | | | | | | | | | | | | | | | |
| | SHORT TERM INVESTMENTS 12.0% | |
| | 220,303,473 | | | BlackRock Liquidity Funds FedFund - Institutional Shares | | | 0.24% | ¨ | | | | | | | 220,303,473 | |
| | 164,785,000 | | | Federal Home Loan Banks | | | 0.50% | | | | 09/28/2016 | | | | 164,790,438 | |
| | 175,000,000 | | | Federal Home Loan Banks | | | 0.63% | | | | 11/23/2016 | | | | 175,102,200 | |
| | 100,000,000 | | | Federal Home Loan Banks | | | 0.40% | | | | 10/28/2016 | | | | 100,007,900 | |
| | 100,000,000 | | | Federal Home Loan Banks | | | 0.55% | | | | 11/25/2016 | | | | 100,021,500 | |
| | 150,000,000 | | | Federal Home Loan Banks | | | 5.13% | | | | 10/19/2016 | | | | 153,770,400 | |
| | | | | | |
| The accompanying notes are an integral part of these financial statements. | | Annual Report | | March 31, 2016 | | 33 |
| | |
| Schedule of Investments DoubleLine Total Return Bond Fund (Cont.) | | March 31, 2016 |
| | | | | | | | | | | | | | | | |
PRINCIPAL
AMOUNT $ / | | | SECURITY DESCRIPTION | | RATE | | | MATURITY | | | VALUE $ | |
| | 175,000,000 | | | Federal Home Loan Banks | | | 4.75% | | | | 12/16/2016 | | | | 180,194,175 | |
| | 100,000,000 | | | Federal Home Loan Banks | | | 0.22% | | | | 04/07/2016 | | | | 100,001,600 | |
| | 100,000,000 | | | Federal Home Loan Banks | | | 0.50% | | | | 08/19/2016 | | | | 100,062,200 | |
| | 233,000,000 | | | Federal Home Loan Banks | | | 0.40% | | | | 07/29/2016 | | | | 233,029,125 | |
| | 200,000,000 | | | Federal Home Loan Banks | | | 0.50% | | | | 09/30/2016 | | | | 200,041,200 | |
| | 100,000,000 | | | Federal Home Loan Bank Discount Notes | | | 0.00% | | | | 04/08/2016 | | | | 99,996,100 | |
| | 250,000,000 | | | Federal Home Loan Bank Discount Notes | | | 0.00% | | | | 04/11/2016 | | | | 249,986,000 | |
| | 100,000,000 | | | Federal Home Loan Bank Discount Notes | | | 0.00% | | | | 04/14/2016 | | | | 99,992,800 | |
| | 200,000,000 | | | Federal Home Loan Bank Discount Notes | | | 0.00% | | | | 04/19/2016 | | | | 199,980,000 | |
| | 250,000,000 | | | Federal Home Loan Bank Discount Notes | | | 0.00% | | | | 04/22/2016 | | | | 249,970,750 | |
| | 250,000,000 | | | Federal Home Loan Bank Discount Notes | | | 0.00% | | | | 04/27/2016 | | | | 249,964,000 | |
| | 275,000,000 | | | Federal Home Loan Bank Discount Notes | | | 0.00% | | | | 04/29/2016 | | | | 274,957,100 | |
| | 100,000,000 | | | Federal Home Loan Bank Discount Notes | | | 0.00% | | | | 05/18/2016 | | | | 99,967,400 | |
| | 100,000,000 | | | Federal Home Loan Bank Discount Notes | | | 0.00% | | | | 05/20/2016 | | | | 99,966,000 | |
| | 150,000,000 | | | Federal Home Loan Bank Discount Notes | | | 0.00% | | | | 05/23/2016 | | | | 149,945,850 | |
| | 100,000,000 | | | Federal Home Loan Bank Discount Notes | | | 0.00% | | | | 05/25/2016 | | | | 99,962,500 | |
| | 200,000,000 | | | Federal Home Loan Bank Discount Notes | | | 0.00% | | | | 05/27/2016 | | | | 199,922,200 | |
| | 100,000,000 | | | Federal Home Loan Bank Discount Notes | | | 0.00% | | | | 05/31/2016 | | | | 99,958,300 | |
| | 150,000,000 | | | Federal Home Loan Bank Discount Notes | | | 0.00% | | | | 06/06/2016 | | | | 149,917,500 | |
| | 100,000,000 | | | Federal Home Loan Bank Discount Notes | | | 0.00% | | | | 06/10/2016 | | | | 99,941,700 | |
| | 100,000,000 | | | Federal Home Loan Bank Discount Notes | | | 0.00% | | | | 06/14/2016 | | | | 99,938,300 | |
| | 100,000,000 | | | Federal Home Loan Bank Discount Notes | | | 0.00% | | | | 06/17/2016 | | | | 99,935,800 | |
| | 100,000,000 | | | Federal Home Loan Bank Discount Notes | | | 0.00% | | | | 07/01/2016 | | | | 99,911,500 | |
| | 100,000,000 | | | Federal Home Loan Bank Discount Notes | | | 0.00% | | | | 07/06/2016 | | | | 99,906,700 | |
| | 100,000,000 | | | Federal Home Loan Bank Discount Notes | | | 0.00% | | | | 07/19/2016 | | | | 99,894,000 | |
| | 150,000,000 | | | Federal Home Loan Bank Discount Notes | | | 0.00% | | | | 07/22/2016 | | | | 149,836,650 | |
| | 100,000,000 | | | Federal Home Loan Bank Discount Notes | | | 0.00% | | | | 07/25/2016 | | | | 99,888,200 | |
| | 200,000,000 | | | Federal Home Loan Bank Discount Notes | | | 0.00% | | | | 08/26/2016 | | | | 199,681,400 | |
| | 200,000,000 | | | Federal Home Loan Bank Discount Notes | | | 0.00% | | | | 08/30/2016 | | | | 199,672,800 | |
| | 100,000,000 | | | Federal Home Loan Bank Discount Notes | | | 0.00% | | | | 09/06/2016 | | | | 99,820,100 | |
| | 100,000,000 | | | Federal Home Loan Bank Discount Notes | | | 0.00% | | | | 09/07/2016 | | | | 99,818,900 | |
| | | | | | | | | | | | | | | | |
PRINCIPAL
AMOUNT $ /
SHARES | | | SECURITY DESCRIPTION | | RATE | | | MATURITY | | | VALUE $ | |
| | 150,000,000 | | | Federal Home Loan Bank Discount Notes | | | 0.00% | | | | 09/27/2016 | | | | 149,694,150 | |
| | 125,000,000 | | | Federal Home Loan Bank Discount Notes | | | 0.00% | | | | 12/01/2016 | | | | 124,593,375 | |
| | 100,000,000 | | | Federal Home Loan Bank Discount Notes | | | 0.00% | | | | 01/23/2017 | | | | 99,595,800 | |
| | 166,133,000 | | | Federal Home Loan Mortgage Corporation | | | 2.00% | | | | 08/25/2016 | | | | 167,125,479 | |
| | 138,610,000 | | | Federal Home Loan Mortgage Corporation | | | 0.50% | | | | 01/27/2017 | | | | 138,476,380 | |
| | 73,840,000 | | | Federal National Mortgage Association | | | 0.63% | | | | 08/26/2016 | | | | 73,891,614 | |
| | 100,000,000 | | | Federal National Mortgage Association Discount Notes | | | 0.00% | | | | 07/25/2016 | | | | 99,888,200 | |
| | 150,000,000 | | | Federal National Mortgage Association | | | 5.00% | | | | 02/13/2017 | | | | 155,646,600 | |
| | 220,303,473 | | | Fidelity Institutional Money Market Government Portfolio - Class I | | | 0.23% | ¨ | | | | | | | 220,303,473 | |
| | 220,303,473 | | | Morgan Stanley Institutional Liquidity Funds Government Portfolio - Institutional Share Class | | | 0.25% | ¨ | | | | | | | 220,303,473 | |
| | | | | | | | | | | | | | | | |
| | | | Total Short Term Investments
(Cost $6,947,751,334) | | | | 6,949,575,305 | |
| | | | | | | | | | | | | | | | |
| | | | Total Investments 99.5%
(Cost $57,057,210,846) | | | | 57,547,928,563 | |
| | | | Other Assets in Excess of Liabilities 0.5% | | | | 285,119,459 | |
| | | | | | | | | | | | | | | | |
| | | | NET ASSETS 100.0% | | | $ | 57,833,048,022 | |
| | | | | | | | | | | | | | | | |
| | | | |
| SECURITY TYPE BREAKDOWN as a % of Net Assets: | |
US Government / Agency Mortgage Backed Obligations | | | 48.8% | |
Non-Agency Residential Collateralized Mortgage Obligations | | | 21.0% | |
Short Term Investments | | | 12.0% | |
Non-Agency Commercial Mortgage Backed Obligations | | | 7.2% | |
Collateralized Loan Obligations | | | 4.6% | |
US Government Bonds and Notes | | | 3.5% | |
Asset Backed Obligations | | | 2.4% | |
Other Assets and Liabilities | | | 0.5% | |
| | | | |
| | | 100.0% | |
| | | | |
| ^ | Security exempt from registration under Rule 144A of the Securities Act of 1933. These securities may be resold in transactions exempt from registration to qualified institutional buyers. These securities are determined to be liquid by the Adviser, unless otherwise noted, under procedures established by the Fund’s Board of Trustees. At March 31, 2016, the value of these securities amounted to $9,619,654,665 or 16.6% of net assets. |
| ¥ | Illiquid security. At March 31, 2016, the value of these securities amounted to $731,987,548 or 1.3% of net assets. |
| # | Variable rate security. Rate disclosed as of March 31, 2016. |
| I/O | Interest only security |
| I/F | Inverse floating rate security whose interest rate moves in the opposite direction of reference interest rates |
| P/O | Principal only security |
| ¨ | Seven-day yield as of March 31, 2016 |
| | | | | | |
| 34 | | DoubleLine Funds Trust | | | | The accompanying notes are an integral part of these financial statements. |
| | |
| Schedule of Investments DoubleLine Core Fixed Income Fund | | March 31, 2016 |
| | | | | | | | | | | | | | | | |
PRINCIPAL
AMOUNT $ | | | SECURITY DESCRIPTION | | RATE | | | MATURITY | | | VALUE $ | |
| | ASSET BACKED OBLIGATIONS 1.2% | |
| |
| | | | Castlelake Aircraft Securitization Trust, | |
| | 6,825,000 | | | Series 2015-1A-A | | | 4.70% | ^ | | | 12/15/2040 | | | | 6,705,221 | |
| |
| | | | Citi Held For Asset Issuance, | |
| | 5,000,000 | | | Series 2015-PM1-B | | | 2.93% | ^ | | | 12/15/2021 | | | | 4,892,670 | |
| |
| | | | DB Master Finance LLC, | |
| | 14,850,000 | | | Series 2015-1A-A2I | | | 3.26% | ^ | | | 02/20/2045 | | | | 14,660,593 | |
| | 9,900,000 | | | Series 2015-1A-A2II | | | 3.98% | ^ | | | 02/20/2045 | | | | 9,705,563 | |
| | | | |
| | | | Hero Funding Trust, | | | | | | | | | | | | |
| | 9,883,533 | | | Series 2016-1A-A | | | 4.05% | ^ | | | 09/20/2041 | | | | 9,830,182 | |
| |
| | | | MarketPlace Loan Trust, | |
| | 6,772,906 | | | Series 2015-CB1-A | | | 4.00% | ^ | | | 07/15/2021 | | | | 6,692,295 | |
| |
| | | | Shenton Aircraft Investment Ltd., | |
| | 9,667,158 | | | Series 2015-1A-A | | | 4.75% | ^ | | | 10/15/2042 | | | | 9,588,371 | |
| |
| | | | SoFi Professional Loan Program, | |
| | 10,000,000 | | | Series 2016-A-A2 | | | 2.76% | ^ | | | 12/26/2036 | | | | 9,936,964 | |
| | | | | | | | | | | | | | | | |
| | | | Total Asset Backed Obligations
(Cost $72,717,822) | | | | 72,011,859 | |
| | | | | | | | | | | | | | | | |
| | BANK LOANS 2.5% | |
| |
| | | | Acadia Healthcare Company, Inc., | |
| | 897,600 | | | Guaranteed Senior Secured 1st Lien Term Loan, Tranche B2 | | | 4.50% | # | | | 02/16/2023 | | | | 901,527 | |
| | | |
| | | | Activision Blizzard, Inc., | | | | | | | | | |
| | 872,000 | | | Guaranteed Senior Secured 1st Lien Term Loan, Tranche B | | | 3.25% | # | | | 10/13/2020 | | | | 877,045 | |
| |
| | | | Albertson’s Holdings LLC, | |
| | 1,756,019 | | | Guaranteed Senior Secured 1st Lien Term Loan, Tranche B4 | | | 5.50% | # | | | 08/25/2021 | | | | 1,760,848 | |
| |
| | | | Alere, Inc., | |
| | 887,835 | | | Guaranteed Senior Secured 1st Lien Term Loan, Tranche B | | | 4.25% | # | | | 06/20/2022 | | | | 883,951 | |
| |
| | | | AlixPartners LLP, | |
| | 1,757,399 | | | Guaranteed Senior Secured 1st Lien Term Loan, Tranche B | | | 4.50% | # | | | 07/28/2022 | | | | 1,756,300 | |
| |
| | | | Allflex Holdings, Inc., | |
| | 1,776,927 | | | Guaranteed Senior Secured 1st Lien Term Loan, Tranche B | | | 4.25% | # | | | 07/17/2020 | | | | 1,757,487 | |
| |
| | | | Allied Security Holdings LLC, | |
| | 1,632,883 | | | Senior Secured 1st Lien Term Loan, Tranche B | | | 4.25% | # | | | 02/12/2021 | | | | 1,596,143 | |
| |
| | | | American Airlines, Inc., | |
| | 1,770,000 | | | Guaranteed Senior Secured 1st Lien Term Loan, Tranche B | | | 3.25% | # | | | 06/29/2020 | | | | 1,765,265 | |
| |
| | | | American Renal Holdings, Inc., | |
| | 1,791,119 | | | Guaranteed Senior Secured 1st Lien Term Loan, Tranche B | | | 4.50% | # | | | 08/20/2019 | | | | 1,792,238 | |
| |
| | | | American Tire Distributors, Inc., | |
| | 575,816 | | | Guaranteed Senior Secured 1st Lien Term Loan, Tranche B | | | 5.25% | # | | | 09/01/2021 | | | | 574,737 | |
| |
| | | | Ardagh Packaging Finance, | |
| | 1,752,120 | | | Guaranteed Senior Secured 1st Lien Delayed-Draw Term Loan, Tranche B | | | 4.00% | # | | | 12/17/2019 | | | | 1,753,215 | |
| | | | | | | | | | | | | | | | |
PRINCIPAL
AMOUNT $ | | | SECURITY DESCRIPTION | | RATE | | | MATURITY | | | VALUE $ | |
| |
| | | | Asurion LLC, | |
| | 788,000 | | | Senior Secured 1st Lien Term Loan, Tranche B | | | 5.00% | # | | | 08/04/2022 | | | | 772,736 | |
| | 955,956 | | | Senior Secured 1st Lien Term Loan, Tranche B1 | | | 5.00% | # | | | 05/24/2019 | | | | 944,403 | |
| |
| | | | Avago Technologies Finance Ltd., | |
| | 1,770,000 | | | Guaranteed Senior Secured 1st Lien Term Loan, Tranche B1 | | | 4.25% | # | | | 02/01/2023 | | | | 1,763,663 | |
| |
| | | | B&G Foods, Inc., | |
| | 1,357,313 | | | Guaranteed Senior Secured 1st Lien Term Loan, Tranche B | | | 3.75% | # | | | 11/02/2022 | | | | 1,361,385 | |
| |
| | | | B/E Aerospace, Inc., | |
| | 1,748,715 | | | Guaranteed Senior Secured 1st Lien Term Loan, Tranche B | | | 4.00% | # | | | 12/16/2021 | | | | 1,757,826 | |
| |
| | | | Beacon Roofing Supply, Inc., | |
| | 1,754,986 | | | Guaranteed Senior Secured 1st Lien Term Loan, Tranche B | | | 4.00% | # | | | 09/23/2022 | | | | 1,756,083 | |
| |
| | | | Berry Plastics Corporation, | |
| | 1,760,284 | | | Guaranteed Senior Secured 1st Lien Term Loan, Tranche F | | | 4.00% | # | | | 10/01/2022 | | | | 1,763,039 | |
| |
| | | | Burger King Corporation, | |
| | 1,614,369 | | | Guaranteed Senior Secured 1st Lien Term Loan, Tranche B2 | | | 3.75% | # | | | 12/10/2021 | | | | 1,615,717 | |
| |
| | | | Calpine Corporation, | |
| | 1,440,157 | | | Guaranteed Senior Secured 1st Lien Term Loan, Tranche B5 | | | 3.50% | # | | | 05/27/2022 | | | | 1,424,856 | |
| |
| | | | Candy Intermediate Holdings, Inc., | |
| | 1,776,942 | | | Guaranteed Senior Secured 1st Lien Term Loan, Tranche B | | | 7.50% | # | | | 06/18/2018 | | | | 1,781,384 | |
| |
| | | | Capital Automotive LP, | |
| | 1,720,224 | | | Senior Secured 1st Lien Term Loan, Tranche B | | | 4.00% | # | | | 04/10/2019 | | | | 1,724,524 | |
| |
| | | | CCO Safari III LLC, | |
| | 1,785,000 | | | Senior Secured 1st Lien Term Loan, Tranche I | | | 3.50% | # | | | 01/24/2023 | | | | 1,789,463 | |
| |
| | | | CSC Holdings LLC, | |
| | 1,775,000 | | | Guaranteed Senior Secured 1st Lien Term Loan, Tranche B | | | 5.00% | # | | | 10/11/2022 | | | | 1,780,130 | |
| |
| | | | CSM Bakery Supplies LLC, | |
| | 1,831,166 | | | Senior Secured 1st Lien Term Loan, Tranche B | | | 5.00% | # | | | 07/03/2020 | | | | 1,786,531 | |
| |
| | | | Dealer Tire LLC, | |
| | 1,600,395 | | | Senior Secured 1st Lien Term Loan, Tranche B | | | 5.50% | # | | | 12/22/2021 | | | | 1,602,395 | |
| |
| | | | Dell International LLC, | |
| | 1,760,967 | | | Guaranteed Senior Secured 1st Lien Term Loan, Tranche B2 | | | 4.00% | # | | | 04/29/2020 | | | | 1,761,909 | |
| |
| | | | Duff & Phelps Corporation, | |
| | 1,789,312 | | | Senior Secured 1st Lien Term Loan, Tranche B1 | | | 4.75% | # | | | 04/23/2020 | | | | 1,780,365 | |
| |
| | | | EFS Cogen Holdings LLC, | |
| | 1,699,722 | | | Guaranteed Senior Secured 1st Lien Term Loan, Tranche B | | | 3.75% | # | | | 12/17/2020 | | | | 1,680,600 | |
| | | | | | |
| The accompanying notes are an integral part of these financial statements. | | Annual Report | | March 31, 2016 | | 35 |
| | |
| Schedule of Investments DoubleLine Core Fixed Income Fund (Cont.) | | March 31, 2016 |
| | | | | | | | | | | | | | | | |
PRINCIPAL
AMOUNT $ | | | SECURITY DESCRIPTION | | RATE | | | MATURITY | | | VALUE $ | |
| |
| | | | Eldorado Resorts, Inc., | |
| | 1,756,191 | | | Guaranteed Senior Secured 1st Lien Term Loan, Tranche B | | | 4.25% | # | | | 07/23/2022 | | | | 1,756,200 | |
| |
| | | | Emerald Expositions Holdings, Inc., | |
| | 1,906,814 | | | Senior Secured 1st Lien Term Loan, Tranche B | | | 4.75% | # | | | 06/17/2020 | | | | 1,902,047 | |
| |
| | | | Endo Luxembourg Finance I Company S.A.R.L., | |
| | 1,770,563 | | | Guaranteed Senior Secured 1st Lien Term Loan, Tranche B | | | 3.75% | # | | | 09/26/2022 | | | | 1,747,049 | |
| |
| | | | Energy Transfer Equity LP, | |
| | 925,235 | | | Guaranteed Senior Secured 1st Lien Term Loan, Tranche C | | | 4.00% | # | | | 12/02/2019 | | | | 836,565 | |
| |
| | | | Ensemble S Merger Sub, Inc., | |
| | 1,807,324 | | | Senior Secured 1st Lien Term Loan, Tranche B | | | 4.75% | # | | | 09/16/2022 | | | | 1,783,602 | |
| |
| | | | Envision Healthcare Corporation, | |
| | 1,605,975 | | | Guaranteed Senior Secured 1st Lien Term Loan, Tranche B2 | | | 4.50% | # | | | 10/28/2022 | | | | 1,608,986 | |
| |
| | | | Federal-Mogul Holdings Corporation, | |
| | 619,634 | | | Guaranteed Senior Secured 1st Lien Term Loan, Tranche C | | | 4.75% | # | | | 04/15/2021 | | | | 564,090 | |
| |
| | | | Filtration Group, Inc., | |
| | 1,650,472 | | | Senior Secured 1st Lien Term Loan, Tranche B | | | 4.25% | # | | | 11/20/2020 | | | | 1,647,716 | |
| |
| | | | First Data Corporation, | |
| | 616,000 | | | Guaranteed Senior Secured 1st Lien Term Loan, Tranche B | | | 4.43% | # | | | 03/24/2021 | | | | 615,230 | |
| | 1,311,835 | | | Guaranteed Senior Secured 1st Lien Term Loan, Tranche C1 | | | 3.93% | # | | | 03/23/2018 | | | | 1,311,507 | |
| |
| | | | Four Seasons Holdings, Inc., | |
| | 1,746,004 | | | Guaranteed Senior Secured 1st Lien Term Loan | | | 3.50% | # | | | 06/27/2020 | | | | 1,737,815 | |
| |
| | | | Galleria Company, | |
| | 1,765,000 | | | Guaranteed Senior Secured 1st Lien Term Loan, Tranche B | | | 3.75% | # | | | 01/26/2023 | | | | 1,764,453 | |
| |
| | | | Global Payments, Inc., | |
| | 365,000 | | | Guaranteed Senior Secured 1st Lien Term Loan, Tranche B | | | 3.50% | # | | | 03/21/2023 | | | | 367,435 | |
| |
| | | | Gray Television, Inc., | |
| | 1,620,938 | | | Guaranteed Senior Secured 1st Lien Term Loan, Tranche C | | | 4.25% | # | | | 06/11/2021 | | | | 1,625,500 | |
| |
| | | | Guggenheim Partners Investment Management Holdings LLC, | |
| | 1,407,553 | | | Guaranteed Senior Secured 1st Lien Term Loan, Tranche B | | | 4.25% | # | | | 07/22/2020 | | | | 1,409,897 | |
| |
| | | | Hillman Group, Inc., | |
| | 1,279,076 | | | Guaranteed Senior Secured 1st Lien Term Loan, Tranche B | | | 4.50% | # | | | 06/30/2021 | | | | 1,250,834 | |
| |
| | | | Hilton Worldwide Finance LLC, | |
| | 1,770,000 | | | Guaranteed Senior Secured 1st Lien Term Loan, Tranche B | | | 3.50% | # | | | 10/26/2020 | | | | 1,772,398 | |
| |
| | | | Hostess Brands LLC, | |
| | 1,773,197 | | | Senior Secured 1st Lien Term Loan | | | 4.50% | # | | | 08/03/2022 | | | | 1,777,258 | |
| | | | | | | | | | | | | | | | |
PRINCIPAL
AMOUNT $ | | | SECURITY DESCRIPTION | | RATE | | | MATURITY | | | VALUE $ | |
| |
| | | | Huntsman International LLC, | |
| | 1,795,000 | | | Guaranteed Senior Secured 1st Lien Term Loan, Tranche B | | | 3.50% | # | | | 03/24/2023 | | | | 1,789,956 | |
| |
| | | | Informatica Corporation, | |
| | 831,162 | | | Senior Secured 1st Lien Term Loan, Tranche B | | | 4.50% | # | | | 08/05/2022 | | | | 817,655 | |
| |
| | | | Jeld-Wen, Inc., | |
| | 1,762,349 | | | Senior Secured 1st Lien Term Loan, Tranche B | | | 4.75% | # | | | 06/30/2022 | | | | 1,761,802 | |
| |
| | | | KAR Auction Services, Inc., | |
| | 1,294,000 | | | Guaranteed Senior Secured 1st Lien Term Loan, Tranche B3 | | | 4.25% | # | | | 03/09/2023 | | | | 1,299,927 | |
| |
| | | | KIK Custom Products, Inc., | |
| | 1,837,223 | | | Senior Secured 1st Lien Term Loan, Tranche B | | | 6.00% | # | | | 08/18/2022 | | | | 1,776,742 | |
| |
| | | | Kloeckner Pentaplast of America, Inc., | |
| | 771,832 | | | Senior Secured 1st Lien Term Loan | | | 5.00% | # | | | 04/28/2020 | | | | 773,762 | |
| | 329,843 | | | Senior Secured 1st Lien Term Loan | | | 5.00% | # | | | 04/28/2020 | | | | 330,667 | |
| |
| | | | Level 3 Financing, Inc., | |
| | 1,770,000 | | | Guaranteed Senior Secured 1st Lien Term Loan, Tranche BII | | | 3.50% | # | | | 05/31/2022 | | | | 1,768,894 | |
| |
| | | | Life Time Fitness, Inc., | |
| | 1,765,553 | | | Senior Secured 1st Lien Term Loan, Tranche B | | | 4.25% | # | | | 06/10/2022 | | | | 1,748,339 | |
| |
| | | | Live Nation Entertainment, Inc., | |
| | 1,608,063 | | | Guaranteed Senior Secured 1st Lien Term Loan, Tranche B1 | | | 3.50% | # | | | 08/14/2020 | | | | 1,610,741 | |
| |
| | | | MacDermid, Inc., | |
| | 1,742,943 | | | Guaranteed Senior Secured 1st Lien Term Loan, Tranche B2 | | | 5.50% | # | | | 06/05/2020 | | | | 1,689,025 | |
| |
| | | | Match Group, Inc., | |
| | 1,754,813 | | | Guaranteed Senior Secured 1st Lien Term Loan, Tranche B | | | 5.50% | # | | | 11/16/2022 | | | | 1,760,305 | |
| |
| | | | MGOC, Inc., | |
| | 1,779,515 | | | Guaranteed Senior Secured 1st Lien Delayed-Draw Term Loan, Tranche B | | | 4.00% | # | | | 07/31/2020 | | | | 1,779,071 | |
| |
| | | | Michaels Stores, Inc., | |
| | 1,757,957 | | | Guaranteed Senior Secured 1st Lien Term Loan, Tranche B2 | | | 4.00% | # | | | 01/28/2020 | | | | 1,761,719 | |
| |
| | | | Microsemi Corporation, | |
| | 1,770,515 | | | Guaranteed Senior Secured 1st Lien Term Loan, Tranche B | | | 5.25% | # | | | 01/17/2023 | | | | 1,781,306 | |
| |
| | | | Mitchell International, Inc., | |
| | 519,206 | | | Guaranteed Secured 2nd Lien Term Loan | | | 8.50% | # | | | 10/11/2021 | | | | 461,444 | |
| |
| | | | National Vision, Inc., | |
| | 1,826,093 | | | Senior Secured 1st Lien Term Loan, Tranche B | | | 4.00% | # | | | 03/12/2021 | | | | 1,778,733 | |
| |
| | | | Nord Anglia Education Finance LLC, | |
| | 1,817,227 | | | Guaranteed Senior Secured 1st Lien Term Loan, Tranche B | | | 5.00% | # | | | 03/31/2021 | | | | 1,794,521 | |
| | | | | | |
| 36 | | DoubleLine Funds Trust | | | | The accompanying notes are an integral part of these financial statements. |
| | | | | | | | | | | | | | | | |
PRINCIPAL
AMOUNT $ | | | SECURITY DESCRIPTION | | RATE | | | MATURITY | | | VALUE $ | |
| |
| | | | NXP B.V., | |
| | 1,771,013 | | | Guranteed Senior Secured 1st Lien Term Loan, Tranche B | | | 3.75% | # | | | 12/07/2020 | | | | 1,777,238 | |
| |
| | | | ON Semiconductor Corporation, | |
| | 1,477,000 | | | Senior Secured 1st Lien Term Loan, Tranche B | | | 5.25% | # | | | 03/31/2023 | | | | 1,481,387 | |
| |
| | | | Party City Holdings, Inc., | |
| | 1,797,167 | | | Guaranteed Senior Secured 1st Lien Term Loan, Tranche B | | | 4.25% | # | | | 08/19/2022 | | | | 1,786,491 | |
| |
| | | | Pharmaceutical Product Development LLC, | |
| | 1,640,255 | | | Senior Secured 1st Lien Term Loan, Tranche B | | | 4.25% | # | | | 08/18/2022 | | | | 1,628,642 | |
| |
| | | | Pinnacle Foods Finance LLC, | |
| | 1,610,963 | | | Guaranteed Senior Secured 1st Lien Term Loan, Tranche I | | | 3.75% | # | | | 01/13/2023 | | | | 1,619,291 | |
| |
| | | | PODS LLC, | |
| | 1,781,814 | | | Senior Secured 1st Lien Term Loan, Tranche B | | | 4.50% | # | | | 02/02/2022 | | | | 1,782,928 | |
| |
| | | | PolyOne Corporation, | |
| | 1,770,963 | | | Guaranteed Senior Secured 1st Lien Term Loan, Tranche B | | | 3.75% | # | | | 11/10/2022 | | | | 1,777,055 | |
| |
| | | | Prestige Brands, Inc., | |
| | 1,771,593 | | | Guaranteed Senior Secured 1st Lien Term Loan, Tranche B3 | | | 3.50% | # | | | 09/03/2021 | | | | 1,776,686 | |
| |
| | | | Protection One, Inc., | |
| | 1,802,248 | | | Senior Secured 1st Lien Term Loan | | | 5.00% | # | | | 07/01/2021 | | | | 1,789,110 | |
| |
| | | | Reynolds Group Holdings, Inc., | |
| | 1,789,671 | | | Guaranteed Senior Secured 1st Lien Term Loan, Tranche B1 | | | 4.50% | # | | | 11/30/2018 | | | | 1,792,938 | |
| |
| | | | Scientific Games International, Inc., | |
| | 1,836,422 | | | Guaranteed Senior Secured 1st Lien Term Loan, Tranche B2 | | | 6.00% | # | | | 10/01/2021 | | | | 1,783,340 | |
| |
| | | | Serta Simmons Holdings LLC, | |
| | 1,791,672 | | | Senior Secured 1st Lien Term Loan, Tranche B | | | 4.25% | # | | | 10/01/2019 | | | | 1,793,078 | |
| |
| | | | Signode Industrial Group, Inc., | |
| | 1,803,317 | | | Senior Secured 1st Lien Term Loan, Tranche B | | | 3.75% | # | | | 04/30/2021 | | | | 1,755,979 | |
| |
| | | | SolarWinds Holdings, Inc., | |
| | 1,795,000 | | | Guaranteed Senior Secured 1st Lien Term Loan | | | 6.50% | # | | | 02/06/2023 | | | | 1,781,538 | |
| |
| | | | Solenis International LP, | |
| | 677,091 | | | Guaranteed Senior Secured 1st Lien Term Loan | | | 4.25% | # | | | 07/31/2021 | | | | 653,995 | |
| |
| | | | Southeast PowerGen LLC, | |
| | 1,662,078 | | | Senior Secured 1st Lien Term Loan, Tranche B | | | 4.50% | # | | | 12/02/2021 | | | | 1,533,267 | |
| |
| | | | Spin Holdco, Inc., | |
| | 1,821,889 | | | Guaranteed Senior Secured 1st Lien Term Loan, Tranche B | | | 4.25% | # | | | 11/14/2019 | | | | 1,779,074 | |
| |
| | | | Station Casinos LLC, | |
| | 1,780,848 | | | Guaranteed Senior Secured 1st Lien Term Loan, Tranche B | | | 4.25% | # | | | 03/02/2020 | | | | 1,778,622 | |
| | | | | | | | | | | | | | | | |
PRINCIPAL
AMOUNT $ | | | SECURITY DESCRIPTION | | RATE | | | MATURITY | | | VALUE $ | |
| |
| | | | Summit Materials LLC, | |
| | 1,786,110 | | | Guaranteed Senior Secured 1st Lien Term Loan, Tranche B | | | 4.00% | # | | | 07/18/2022 | | | | 1,786,110 | |
| |
| | | | Surgery Center Holdings, Inc., | |
| | 1,603,146 | | | Guaranteed Senior Secured 1st Lien Term Loan | | | 5.25% | # | | | 11/03/2020 | | | | 1,586,618 | |
| |
| | | | Team Health, Inc., | |
| | 1,775,863 | | | Guaranteed Senior Secured 1st Lien Term Loan, Tranche B | | | 4.50% | # | | | 11/23/2022 | | | | 1,781,394 | |
| |
| | | | T-Mobile USA, Inc., | |
| | 1,775,913 | | | Guaranteed Senior Secured 1st Lien Term Loan, Tranche B | | | 3.50% | # | | | 11/09/2022 | | | | 1,784,934 | |
| |
| | | | Transtar Holding Company, | |
| | 653,934 | | | Senior Secured 1st Lien Term Loan | | | 5.75% | # | | | 10/09/2018 | | | | 441,405 | |
| |
| | | | TransUnion LLC, | |
| | 1,781,828 | | | Guaranteed Senior Secured 1st Lien Term Loan, Tranche B2 | | | 3.50% | # | | | 04/09/2021 | | | | 1,767,573 | |
| |
| | | | Travelport Finance Luxembourg S.A.R.L., | |
| | 1,684,627 | | | Guaranteed Senior Secured 1st Lien Term Loan, Tranche B | | | 5.75% | # | | | 09/02/2021 | | | | 1,685,890 | |
| |
| | | | Tribune Media Company, | |
| | 1,765,779 | | | Guaranteed Senior Secured 1st Lien Term Loan, Tranche B | | | 3.75% | # | | | 12/24/2020 | | | | 1,762,106 | |
| |
| | | | Univar, Inc., | |
| | 1,682,186 | | | Guaranteed Senior Secured 1st Lien Term Loan, Tranche B | | | 4.25% | # | | | 07/01/2022 | | | | 1,663,001 | |
| |
| | | | Univision Communications Inc, | |
| | 1,666,046 | | | Guaranteed Senior Secured 1st Lien Term Loan, Tranche C3 | | | 4.00% | # | | | 02/28/2020 | | | | 1,652,335 | |
| |
| | | | US Renal Care, Inc., | |
| | 1,635,900 | | | Senior Secured 1st Lien Term Loan | | | 5.25% | # | | | 12/30/2022 | | | | 1,633,176 | |
| |
| | | | USAGM HoldCo LLC, | |
| | 1,640,888 | | | Senior Secured 1st Lien Term Loan | | | 4.75% | # | | | 07/28/2022 | | | | 1,591,661 | |
| |
| | | | Virgin Media Investment Holdings Ltd., | |
| | 1,675,000 | | | Guaranteed Senior Secured 1st Lien Term Loan, Tranche F | | | 3.50% | # | | | 06/30/2023 | | | | 1,663,493 | |
| |
| | | | Vizient, Inc., | |
| | 1,600,000 | | | Senior Secured 1st Lien Term Loan, Tranche B | | | 6.25% | # | | | 02/13/2023 | | | | 1,615,328 | |
| |
| | | | Yankee Cable Acquisition LLC, | |
| | 832,839 | | | Senior Secured 1st Lien Term Loan, Tranche B | | | 4.25% | # | | | 02/28/2020 | | | | 830,411 | |
| |
| | | | York Risk Services Group, Inc., | |
| | 1,726,730 | | | Guaranteed Senior Secured 1st Lien Term Loan, Tranche B | | | 4.75% | # | | | 10/01/2021 | | | | 1,491,463 | |
| | | | | | | | | | | | | | | | |
| | | | Total Bank Loans
(Cost $151,722,517) | | | | 151,036,513 | |
| | | | | | | | | | | | | | | | |
| | COLLATERALIZED LOAN OBLIGATIONS 3.6% | |
| |
| | | | Adams Mill Ltd., | |
| | 875,000 | | | Series 2014-1A-D1 | | | 4.12% | #^ | | | 07/15/2026 | | | | 739,863 | |
| | 1,000,000 | | | Series 2014-1A-E1 | | | 5.62% | #^ | | | 07/15/2026 | | | | 588,857 | |
| | | | | | |
| The accompanying notes are an integral part of these financial statements. | | Annual Report | | March 31, 2016 | | 37 |
| | |
| Schedule of Investments DoubleLine Core Fixed Income Fund (Cont.) | | March 31, 2016 |
| | | | | | | | | | | | | | | | |
PRINCIPAL
AMOUNT $ | | | SECURITY DESCRIPTION | | RATE | | | MATURITY | | | VALUE $ | |
| |
| | | | ALM Ltd., | |
| | 1,880,000 | | | Series 2014-11A-C | | | 4.12% | #^ | | | 10/17/2026 | | | | 1,701,062 | |
| |
| | | | Apidos Ltd., | |
| | 2,000,000 | | | Series 2007-5A-B | | | 1.32% | #^ | | | 04/15/2021 | | | | 1,906,314 | |
| | 2,000,000 | | | Series 2013-16A-A1 | | | 2.07% | #^ | | | 01/19/2025 | | | | 1,990,585 | |
| | 2,950,000 | | | Series 2013-16A-B | | | 3.42% | #^ | | | 01/19/2025 | | | | 2,886,817 | |
| | 2,000,000 | | | Series 2014-18A-C | | | 4.27% | #^ | | | 07/22/2026 | | | | 1,801,100 | |
| | 1,000,000 | | | Series 2014-18A-D | | | 5.82% | #^ | | | 07/22/2026 | | | | 829,143 | |
| | 1,000,000 | | | Series 2014-19A-D | | | 4.37% | #^ | | | 10/17/2026 | | | | 886,261 | |
| | 1,500,000 | | | Series 2015-20A-B | | | 3.82% | #^ | | | 01/16/2027 | | | | 1,484,808 | |
| | 1,500,000 | | | Series 2015-20A-C | | | 4.32% | #^ | | | 01/16/2027 | | | | 1,337,429 | |
| | 2,250,000 | | | Series 2015-21A-C | | | 4.17% | #^ | | | 07/18/2027 | | | | 1,870,191 | |
| |
| | | | ARES Ltd., | |
| | 2,000,000 | | | Series 2013-1A-D | | | 4.37% | #^ | | | 04/15/2025 | | | | 1,709,248 | |
| | 1,882,222 | | | Series 2014-30A-A2 | | | 1.47% | #^ | | | 04/20/2023 | | | | 1,873,556 | |
| |
| | | | Babson Ltd., | |
| | 5,000,000 | | | Series 2007-1A-B1 | | | 1.17% | #^ | | | 01/18/2021 | | | | 4,802,107 | |
| | 1,500,000 | | | Series 2012-1A-C | | | 4.62% | #^ | | | 04/15/2022 | | | | 1,424,696 | |
| | 2,000,000 | | | Series 2012-IIR-CR | | | 4.22% | #^ | | | 05/15/2023 | | | | 1,896,630 | |
| | 1,000,000 | | | Series 2014-3A-D2 | | | 4.83% | #^ | | | 01/15/2026 | | | | 893,286 | |
| | 2,750,000 | | | Series 2015-1A-D1 | | | 4.07% | #^ | | | 04/20/2027 | | | | 2,364,267 | |
| | 5,000,000 | | | Series 2015-2A-D | | | 4.42% | #^ | | | 07/20/2027 | | | | 4,452,374 | |
| |
| | | | Betony Ltd., | |
| | 2,500,000 | | | Series 2015-1A-C | | | 3.77% | #^ | | | 04/15/2027 | | | | 2,459,313 | |
| | 3,000,000 | | | Series 2015-1A-D | | | 4.22% | #^ | | | 04/15/2027 | | | | 2,645,434 | |
| |
| | | | Birchwood Park Ltd., | |
| | 1,000,000 | | | Series 2014-1A-C2 | | | 3.77% | #^ | | | 07/15/2026 | | | | 996,128 | |
| | 1,000,000 | | | Series 2014-1A-D2 | | | 4.82% | #^ | | | 07/15/2026 | | | | 903,604 | |
| | 1,000,000 | | | Series 2014-1A-E2 | | | 7.02% | #^ | | | 07/15/2026 | | | | 854,066 | |
| |
| | | | BlueMountain Ltd., | |
| | 1,500,000 | | | Series 2012-1A-E | | | 6.12% | #^ | | | 07/20/2023 | | | | 1,289,269 | |
| | 5,000,000 | | | Series 2015-2A-D | | | 4.17% | #^ | | | 07/18/2027 | | | | 4,227,532 | |
| | 2,000,000 | | | Series 2015-2A-E | | | 5.97% | #^ | | | 07/18/2027 | | | | 1,543,992 | |
| | 4,000,000 | | | Series 2015-3A-B | | | 3.43% | #^ | | | 10/20/2027 | | | | 3,841,337 | |
| | 4,000,000 | | | Series 2015-3A-C | | | 3.88% | #^ | | | 10/20/2027 | | | | 3,484,767 | |
| | 5,000,000 | | | Series 2015-4A-C | | | 3.66% | #^ | | | 01/20/2027 | | | | 4,843,357 | |
| | 4,000,000 | | | Series 2015-4A-D1 | | | 5.06% | #^ | | | 01/20/2027 | | | | 3,922,935 | |
| |
| | | | Brookside Mill Ltd., | |
| | 1,250,000 | | | Series 2013-1A-C1 | | | 3.32% | #^ | | | 04/17/2025 | | | | 1,179,529 | |
| | 2,250,000 | | | Series 2013-1A-D | | | 3.67% | #^ | | | 04/17/2025 | | | | 1,827,673 | |
| | 1,250,000 | | | Series 2013-1A-E | | | 5.02% | #^ | | | 04/17/2025 | | | | 786,722 | |
| |
| | | | Canyon Capital Ltd., | |
| | 2,500,000 | | | Series 2012-1A-C | | | 3.42% | #^ | | | 01/15/2024 | | | | 2,369,211 | |
| | 5,000,000 | | | Series 2014-1A-B | | | 3.27% | #^ | | | 04/30/2025 | | | | 4,664,503 | |
| | 2,750,000 | | | Series 2014-1A-C | | | 3.87% | #^ | | | 04/30/2025 | | | | 2,357,006 | |
| |
| | | | Carlyle Global Market Strategies Ltd., | |
| | 1,250,000 | | | Series 2014-3A-B | | | 3.77% | #^ | | | 07/27/2026 | | | | 1,242,192 | |
| | 2,000,000 | | | Series 2014-3A-C2 | | | 4.82% | #^ | | | 07/27/2026 | | | | 1,831,137 | |
| |
| | | | Carlyle High Yield Partners Ltd., | |
| | 297,586 | | | Series 2006-8A-A2A | | | 0.86% | #^ | | | 05/21/2021 | | | | 294,888 | |
| | 4,341,330 | | | Series 2007-10-A1 | | | 0.84% | #^ | | | 04/19/2022 | | | | 4,214,041 | |
| |
| | | | Catamaran Ltd., | |
| | 2,500,000 | | | Series 2015-1A-C1 | | | 3.72% | #^ | | | 04/22/2027 | | | | 2,430,197 | |
| |
| | | | Cent Ltd., | |
| | 2,000,000 | | | Series 2013-18A-D | | | 4.07% | #^ | | | 07/23/2025 | | | | 1,758,880 | |
| | 1,500,000 | | | Series 2013-18A-E | | | 5.22% | #^ | | | 07/23/2025 | | | | 1,176,353 | |
| | 1,000,000 | | | Series 2014-22A-C | | | 4.37% | #^ | | | 11/07/2026 | | | | 830,677 | |
| |
| | | | Dorchester Park Ltd., | |
| | 2,000,000 | | | Series 2015-1A-C | | | 3.82% | #^ | | | 01/20/2027 | | | | 1,997,415 | |
| | 1,000,000 | | | Series 2015-1A-D | | | 4.17% | #^ | | | 01/20/2027 | | | | 885,766 | |
| |
| | | | Dryden Leveraged Loan, | |
| | 500,000 | | | Series 2006-11A-C1 | | | 2.22% | #^ | | | 04/12/2020 | | | | 470,781 | |
| |
| | | | Dryden Senior Loan Fund, | |
| | 2,000,000 | | | Series 2013-28A-B1L | | | 3.82% | #^ | | | 08/15/2025 | | | | 1,742,330 | |
| | 2,000,000 | | | Series 2014-33A-B | | | 2.62% | #^ | | | 07/15/2026 | | | | 1,927,154 | |
| |
| | | | Eaton Vance Ltd., | |
| | 2,000,000 | | | Series 2006-8A-B | | | 1.27% | #^ | | | 08/15/2022 | | | | 1,874,415 | |
| | | | | | | | | | | | | | | | |
PRINCIPAL
AMOUNT $ | | | SECURITY DESCRIPTION | | RATE | | | MATURITY | | | VALUE $ | |
| |
| | | | Emerson Park Ltd., | |
| | 1,000,000 | | | Series 2013-1A-C1 | | | 3.37% | #^ | | | 07/15/2025 | | | | 976,564 | |
| |
| | | | Flatiron Ltd., | |
| | 2,000,000 | | | Series 2014-1A-C | | | 3.92% | #^ | | | 07/17/2026 | | | | 1,721,326 | |
| |
| | | | Four Corners Ltd., | |
| | 2,000,000 | | | Series 2006-3A-D | | | 2.12% | #^ | | | 07/22/2020 | | | | 1,866,164 | |
| |
| | | | Galaxy Ltd., | |
| | 1,000,000 | | | Series 2013-15A-C | | | 3.22% | #^ | | | 04/15/2025 | | | | 970,131 | |
| | 1,000,000 | | | Series 2013-15A-D | | | 4.02% | #^ | | | 04/15/2025 | | | | 840,206 | |
| |
| | | | GoldenTree Loan Opportunities Ltd., | |
| | 2,000,000 | | | Series 2012-6A-D | | | 4.82% | #^ | | | 04/17/2022 | | | | 1,938,461 | |
| | 3,750,000 | | | Series 2015-10A-D | | | 3.97% | #^ | | | 07/20/2027 | | | | 3,115,238 | |
| |
| | | | Gulf Stream Ltd., | |
| | 1,000,000 | | | Series 2007-1X-B | | | 1.09% | # | | | 06/17/2021 | | | | 976,369 | |
| |
| | | | Halcyon Loan Advisors Funding Ltd., | |
| | 740,000 | | | Series 2013-2A-C | | | 3.32% | #^ | | | 08/01/2025 | | | | 685,177 | |
| | 1,500,000 | | | Series 2014-3A-D | | | 4.27% | #^ | | | 10/22/2025 | | | | 1,223,869 | |
| |
| | | | ING Ltd., | |
| | 2,000,000 | | | Series 2013-3A-A1 | | | 2.22% | # | | | 08/01/2020 | | | | 1,891,525 | |
| | 2,000,000 | | | Series 2013-3A-B | | | 3.32% | #^ | | | 01/18/2026 | | | | 1,946,416 | |
| |
| | | | Inwood Park Ltd., | |
| | 2,000,000 | | | Series 2006-1A-B | | | 1.01% | #^ | | | 01/20/2021 | | | | 1,913,487 | |
| |
| | | | Jamestown Ltd., | |
| | 2,000,000 | | | Series 2015-6A-A1A | | | 2.22% | #^ | | | 02/20/2027 | | | | 1,977,714 | |
| |
| | | | LCM LP, | |
| | 2,000,000 | | | Series 11A-D2 | | | 4.57% | #^ | | | 04/19/2022 | | | | 1,933,225 | |
| | 1,000,000 | | | Series 12A-E | | | 6.37% | #^ | | | 10/19/2022 | | | | 884,280 | |
| | 2,850,000 | | | Series 14A-D | | | 4.12% | #^ | | | 07/15/2025 | | | | 2,579,302 | |
| | 2,500,000 | | | Series 15A-C | | | 3.73% | #^ | | | 08/25/2024 | | | | 2,479,667 | |
| | 1,000,000 | | | Series 16A-D | | | 4.22% | #^ | | | 07/15/2026 | | | | 881,889 | |
| | 2,000,000 | | | Series 19A-D | | | 4.07% | #^ | | | 07/15/2027 | | | | 1,676,396 | |
| |
| | | | Madison Park Funding Ltd., | |
| | 5,000,000 | | | Series 2007-4A-A1B | | | 0.92% | #^ | | | 03/22/2021 | | | | 4,856,385 | |
| | 5,000,000 | | | Series 2007-4A-B | | | 0.99% | #^ | | | 03/22/2021 | | | | 4,686,614 | |
| | 1,000,000 | | | Series 2007-4A-D | | | 2.05% | #^ | | | 03/22/2021 | | | | 915,256 | |
| | 2,750,000 | | | Series 2007-6A-C | | | 1.62% | #^ | | | 07/26/2021 | | | | 2,619,750 | |
| | 1,000,000 | | | Series 2014-13A-D | | | 3.97% | #^ | | | 01/19/2025 | | | | 890,713 | |
| | 1,000,000 | | | Series 2014-13X-E | | | 5.62% | # | | | 01/19/2025 | | | | 819,634 | |
| | 4,750,000 | | | Series 2014-14A-D | | | 4.22% | #^ | | | 07/20/2026 | | | | 4,269,917 | |
| | 750,000 | | | Series 2014-14A-E | | | 5.37% | #^ | | | 07/20/2026 | | | | 608,791 | |
| | 2,000,000 | | | Series 2014-15A-C | | | 4.32% | #^ | | | 01/27/2026 | | | | 1,770,094 | |
| | 3,000,000 | | | Series 2015-16A-B | | | 3.62% | #^ | | | 04/20/2026 | | | | 2,967,638 | |
| | 5,000,000 | | | Series 2015-18A-D2 | | | 4.57% | #^ | | | 10/21/2026 | | | | 4,486,774 | |
| |
| | | | Magnetite Ltd., | |
| | 1,500,000 | | | Series 2012-7A-D | | | 5.87% | #^ | | | 01/15/2025 | | | | 1,278,416 | |
| | 2,000,000 | | | Series 2014-11A-C | | | 4.22% | #^ | | | 01/18/2027 | | | | 1,755,875 | |
| | 1,500,000 | | | Series 2014-8A-C | | | 3.72% | #^ | | | 04/15/2026 | | | | 1,477,513 | |
| |
| | | | Nautique Funding Ltd., | |
| | 1,000,000 | | | Series 2006-1A-C | | | 2.32% | #^ | | | 04/15/2020 | | | | 931,037 | |
| |
| | | | Nomad Ltd., | |
| | 1,500,000 | | | Series 2013-1A-B | | | 3.57% | #^ | | | 01/15/2025 | | | | 1,398,884 | |
| | 1,500,000 | | | Series 2013-1A-C | | | 4.12% | #^ | | | 01/15/2025 | | | | 1,271,234 | |
| |
| | | | North End Ltd., | |
| | 1,000,000 | | | Series 2013-1A-D | | | 3.12% | #^ | | | 07/17/2025 | | | | 873,916 | |
| |
| | | | OCP Ltd., | |
| | 2,000,000 | | | Series 2013-3A-B | | | 3.37% | #^ | | | 01/17/2025 | | | | 1,913,736 | |
| |
| | | | Octagon Investment Partners Ltd., | |
| | 2,000,000 | | | Series 2013-1A-D | | | 3.97% | #^ | | | 07/17/2025 | | | | 1,746,175 | |
| | 2,000,000 | | | Series 2013-1A-E | | | 5.12% | #^ | | | 07/17/2025 | | | | 1,437,854 | |
| | 1,000,000 | | | Series 2014-1A-C2 | | | 4.12% | #^ | | | 11/25/2025 | | | | 999,130 | |
| | 1,000,000 | | | Series 2014-1A-D2 | | | 5.20% | #^ | | | 11/25/2025 | | | | 904,020 | |
| |
| | | | OZLM Funding Ltd., | |
| | 10,000,000 | | | Series 2013-3A-A1 | | | 1.95% | #^ | | | 01/22/2025 | | | | 9,906,250 | |
| |
| | | | OZLM Ltd., | |
| | 1,500,000 | | | Series 2015-11A-A2A | | | 2.87% | #^ | | | 01/30/2027 | | | | 1,444,808 | |
| | | | | | |
| 38 | | DoubleLine Funds Trust | | | | The accompanying notes are an integral part of these financial statements. |
| | | | | | | | | | | | | | | | |
PRINCIPAL
AMOUNT $ | | | SECURITY DESCRIPTION | | RATE | | | MATURITY | | | VALUE $ | |
| |
| | | | Race Point Ltd., | |
| | 1,000,000 | | | Series 2013-8A-B | | | 2.52% | #^ | | | 02/20/2025 | | | | 965,887 | |
| |
| | | | Saturn Ltd., | |
| | 500,000 | | | Series 2007-1A-D | | | 4.62% | #^ | | | 05/13/2022 | | | | 467,952 | |
| |
| | | | Symphony Ltd., | |
| | 3,000,000 | | | Series 2013-11A-B1 | | | 2.82% | #^ | | | 01/17/2025 | | | | 2,945,727 | |
| | 3,000,000 | | | Series 2013-11A-C | | | 3.77% | #^ | | | 01/17/2025 | | | | 2,993,439 | |
| |
| | | | Thacher Park Ltd., | |
| | 1,000,000 | | | Series 2014-1A-C | | | 3.67% | #^ | | | 10/20/2026 | | | | 990,259 | |
| | 1,000,000 | | | Series 2014-1A-D1 | | | 4.15% | #^ | | | 10/20/2026 | | | | 878,674 | |
| |
| | | | Venture Ltd., | |
| | 1,900,000 | | | Series 2006-1A-B | | | 1.26% | #^ | | | 08/03/2020 | | | | 1,785,348 | |
| | 500,000 | | | Series 2012-10A-C | | | 3.87% | #^ | | | 07/20/2022 | | | | 496,414 | |
| | 2,000,000 | | | Series 2012-10A-D | | | 4.82% | #^ | | | 07/20/2022 | | | | 1,872,466 | |
| | 5,000,000 | | | Series 2013-15A-C | | | 3.72% | #^ | | | 07/15/2025 | | | | 4,797,723 | |
| | 2,500,000 | | | Series 2014-17A-C | | | 3.47% | #^ | | | 07/15/2026 | | | | 2,286,950 | |
| |
| | | | WG Horizons, | |
| | 1,500,000 | | | Series 2006-1A-C | | | 2.34% | #^ | | | 05/24/2019 | | | | 1,424,126 | |
| |
| | | | Wind River Ltd., | |
| | 3,000,000 | | | Series 2013-1A-C | | | 4.02% | #^ | | | 04/20/2025 | | | | 2,501,407 | |
| | | | | | | | | | | | | | | | |
| | | | Total Collateralized Loan Obligations
(Cost $231,641,954) | | | | 217,425,390 | |
| | | | | | | | | | | | | | | | |
| | FOREIGN CORPORATE BONDS 11.9% | |
| | 4,300,000 | | | Abengoa Transmision Sur S.A. | | | 6.88% | ^ | | | 04/30/2043 | | | | 4,396,750 | |
| | 5,200,000 | | | Abengoa Transmision Sur S.A. | | | 6.88% | | | | 04/30/2043 | | | | 5,317,000 | |
| | 5,000,000 | | | Aeropuerto Internacional de Tocumen S.A. | | | 5.75% | | | | 10/09/2023 | | | | 5,150,000 | |
| | 500,000 | | | Aeropuertos Dominicanos | | | 9.75% | #^ | | | 11/13/2019 | | | | 530,000 | |
| | 1,800,000 | | | Aeropuertos Dominicanos | | | 9.75% | # | | | 11/13/2019 | | | | 1,908,000 | |
| | 2,000,000 | | | AES El Salvador Trust | | | 6.75% | | | | 03/28/2023 | | | | 1,570,000 | |
| | 1,000,000 | | | AES Gener S.A. | | | 5.25% | | | | 08/15/2021 | | | | 1,064,198 | |
| | 3,500,000 | | | Agromercantil Senior Trust | | | 6.25% | | | | 04/10/2019 | | | | 3,622,500 | |
| | 3,500,000 | | | Agromercantil Senior Trust | | | 6.25% | ^ | | | 04/10/2019 | | | | 3,622,500 | |
| | 1,700,000 | | | Ajecorp B.V. | | | 6.50% | | | | 05/14/2022 | | | | 731,000 | |
| | 15,695,000 | | | Alibaba Group Holding Ltd. | | | 3.60% | | | | 11/28/2024 | | | | 15,851,416 | |
| | 8,775,000 | | | AstraZeneca PLC | | | 2.38% | | | | 11/16/2020 | | | | 8,962,162 | |
| | 10,835,000 | | | Australia and New Zealand Banking Group Ltd. | | | 4.88% | ^ | | | 01/12/2021 | | | | 12,095,555 | |
| | 4,700,000 | | | Avianca Holdings S.A. | | | 8.38% | | | | 05/10/2020 | | | | 3,713,000 | |
| | 2,600,000 | | | Avianca Holdings S.A. | | | 8.38% | ^ | | | 05/10/2020 | | | | 2,054,000 | |
| | 5,883,000 | | | Banco Continental SAECA | | | 8.88% | | | | 10/15/2017 | | | | 5,963,891 | |
| | 2,000,000 | | | Banco de Costa Rica | | | 5.25% | ^ | | | 08/12/2018 | | | | 2,035,000 | |
| | 2,000,000 | | | Banco de Credito del Peru | | | 6.13% | # | | | 04/24/2027 | | | | 2,142,500 | |
| | 2,500,000 | | | Banco do Brasil S.A. | | | 8.50% | #† | | | 10/20/2020 | | | | 2,224,250 | |
| | 4,500,000 | | | Banco do Brasil S.A. | | | 9.00% | #^† | | | 06/18/2024 | | | | 3,145,500 | |
| | 1,250,000 | | | Banco GNB Sudameris S.A. | | | 3.88% | | | | 05/02/2018 | | | | 1,231,875 | |
| | 4,005,000 | | | Banco GNB Sudameris S.A. | | | 7.50% | | | | 07/30/2022 | | | | 4,005,000 | |
| | 10,340,000 | | | Banco International del Peru S.A.A. | | | 6.63% | # | | | 03/19/2029 | | | | 10,663,125 | |
| | | | | | | | | | | | | | | | |
PRINCIPAL
AMOUNT $ | | | SECURITY DESCRIPTION | | RATE | | | MATURITY | | | VALUE $ | |
| | 3,900,000 | | | Banco Latinoamericano do Comercio Exterior S.A. | | | 3.25% | | | | 05/07/2020 | | | | 3,890,250 | |
| | 485,000 | | | Banco Mercantil del Norte | | | 6.86% | # | | | 10/13/2021 | | | | 489,850 | |
| | 3,500,000 | | | Banco Nacional de Comercio Exterior S.N.C. | | | 4.38% | ^ | | | 10/14/2025 | | | | 3,533,250 | |
| | 1,000,000 | | | Banco Nacional de Comercio Exterior S.N.C. | | | 4.38% | | | | 10/14/2025 | | | | 1,009,500 | |
| | 2,650,000 | | | Banco Nacional de Costa Rica | | | 4.88% | | | | 11/01/2018 | | | | 2,643,375 | |
| | 5,450,000 | | | Banco Regional SAECA | | | 8.13% | | | | 01/24/2019 | | | | 5,629,850 | |
| | 400,000 | | | Banco Regional SAECA | | | 8.13% | ^ | | | 01/24/2019 | | | | 413,200 | |
| | 8,099,000 | | | Banco Santander | | | 5.95% | # | | | 01/30/2024 | | | | 8,394,613 | |
| | 6,000,000 | | | Bancolombia S.A. | | | 6.13% | | | | 07/26/2020 | | | | 6,358,200 | |
| | 8,115,000 | | | Bank of Montreal | | | 2.38% | | | | 01/25/2019 | | | | 8,275,263 | |
| | 1,250,000 | | | Bantrab Senior Trust | | | 9.00% | | | | 11/14/2020 | | | | 1,207,812 | |
| | 2,000,000 | | | BBVA Banco Continental S.A. | | | 5.25% | # | | | 09/22/2029 | | | | 2,022,500 | |
| | 7,200,000 | | | BBVA Bancomer S.A. | | | 6.01% | # | | | 05/17/2022 | | | | 7,326,000 | |
| | 2,557,000 | | | BBVA Bancomer S.A. | | | 5.35% | # | | | 11/12/2029 | | | | 2,467,505 | |
| | 5,700,000 | | | BBVA Bancomer S.A. | | | 5.35% | #^ | | | 11/12/2029 | | | | 5,500,500 | |
| | 1,250,000 | | | BBVA Colombia S.A. | | | 4.88% | ^ | | | 04/21/2025 | | | | 1,212,500 | |
| | 2,000,000 | | | BBVA Colombia S.A. | | | 4.88% | | | | 04/21/2025 | | | | 1,940,000 | |
| | 1,000,000 | | | Bharat Petrol Corporation Ltd. | | | 4.00% | | | | 05/08/2025 | | | | 1,008,099 | |
| | 8,000,000 | | | Bharti Airtel Ltd. | | | 4.38% | | | | 06/10/2025 | | | | 8,144,760 | |
| | 8,515,000 | | | BP Capital Markets PLC | | | 3.06% | | | | 03/17/2022 | | | | 8,731,613 | |
| | 1,000,000 | | | BR Malls International Finance Ltd. | | | 8.50% | † | | | 01/29/2049 | | | | 895,000 | |
| | 3,300,000 | | | Braskem Finance Company | | | 7.13% | | | | 07/22/2041 | | | | 2,816,385 | |
| | 15,413,000 | | | British Telecommunications PLC | | | 5.95% | | | | 01/15/2018 | | | | 16,629,379 | |
| | 1,500,000 | | | Camposol S.A. | | | 9.88% | ^ | | | 02/02/2017 | | | | 1,312,500 | |
| | 650,000 | | | Camposol S.A. | | | 9.88% | | | | 02/02/2017 | | | | 568,750 | |
| | 1,875,000 | | | Cementos Progreso Trust | | | 7.13% | | | | 11/06/2023 | | | | 1,992,187 | |
| | 500,000 | | | Cencosud S.A. | | | 6.63% | | | | 02/12/2045 | | | | 472,854 | |
| | 6,000,000 | | | Central American Bottling Corporation | | | 6.75% | | | | 02/09/2022 | | | | 6,345,000 | |
| | 2,000,000 | | | CIMPOR Financial Operations B.V. | | | 5.75% | ^ | | | 07/17/2024 | | | | 1,470,000 | |
| | 1,900,000 | | | CIMPOR Financial Operations B.V. | | | 5.75% | | | | 07/17/2024 | | | | 1,396,500 | |
| | 7,000,000 | | | CNOOC Finance Ltd. | | | 2.63% | | | | 05/05/2020 | | | | 7,022,141 | |
| | 2,700,000 | | | Comcel Trust | | | 6.88% | | | | 02/06/2024 | | | | 2,538,000 | |
| | 4,000,000 | | | Comcel Trust | | | 6.88% | ^ | | | 02/06/2024 | | | | 3,760,000 | |
| | 1,000,000 | | | Comision Federal de Electricidad | | | 4.88% | | | | 01/15/2024 | | | | 1,032,500 | |
| | 2,000,000 | | | Comision Federal de Electricidad | | | 6.13% | | | | 06/16/2045 | | | | 1,995,000 | |
| | 5,000,000 | | | Compania Minera Ares S.A.C. | | | 7.75% | | | | 01/23/2021 | | | | 4,975,000 | |
| | 2,322,000 | | | CorpGroup Banking S.A. | | | 6.75% | | | | 03/15/2023 | | | | 2,173,973 | |
| | 3,500,000 | | | CorpGroup Banking S.A. | | | 6.75% | ^ | | | 03/15/2023 | | | | 3,276,875 | |
| | 4,000,000 | | | Corporacion Azucarera del Peru S.A. | | | 6.38% | | | | 08/02/2022 | | | | 3,460,000 | |
| | 4,664,000 | | | Corporacion Financiera de Desarrolo S.A. | | | 4.75% | | | | 02/08/2022 | | | | 4,908,860 | |
| | 3,910,000 | | | Cosan Overseas Ltd. | | | 8.25% | † | | | 11/29/2049 | | | | 3,323,500 | |
| | 3,000,000 | | | Credito Real S.A.B. de C.V. | | | 7.50% | ^ | | | 03/13/2019 | | | | 2,977,500 | |
| | 5,000,000 | | | DBS Bank Ltd. | | | 3.63% | # | | | 09/21/2022 | | | | 5,125,455 | |
| | 5,000,000 | | | Delek & Avner Tamar Bond Ltd. | | | 4.44% | ^ | | | 12/30/2020 | | | | 5,037,500 | |
| | 8,000,000 | | | Delek & Avner Tamar Bond Ltd. | | | 5.41% | ^ | | | 12/30/2025 | | | | 8,030,000 | |
| | 500,000 | | | Digicel Ltd. | | | 7.00% | | | | 02/15/2020 | | | | 460,000 | |
| | 3,000,000 | | | Digicel Ltd. | | | 8.25% | | | | 09/30/2020 | | | | 2,591,250 | |
| | | | | | |
| The accompanying notes are an integral part of these financial statements. | | Annual Report | | March 31, 2016 | | 39 |
| | |
| Schedule of Investments DoubleLine Core Fixed Income Fund (Cont.) | | March 31, 2016 |
| | | | | | | | | | | | | | | | |
PRINCIPAL
AMOUNT $ | | | SECURITY DESCRIPTION | | RATE | | | MATURITY | | | VALUE $ | |
| | 3,900,000 | | | Digicel Ltd. | | | 7.13% | ^ | | | 04/01/2022 | | | | 3,051,360 | |
| | 5,100,000 | | | Digicel Ltd. | | | 7.13% | | | | 04/01/2022 | | | | 3,990,240 | |
| | 1,300,000 | | | Ecopetrol S.A. | | | 7.38% | | | | 09/18/2043 | | | | 1,196,000 | |
| | 11,900,000 | | | Ecopetrol S.A. | | | 5.88% | | | | 05/28/2045 | | | | 9,427,180 | |
| | 4,000,000 | | | Empresa de Energia de Bogota S.A. | | | 6.13% | | | | 11/10/2021 | | | | 4,164,000 | |
| | 16,000,000 | | | Empresa Electrica Angamos S.A. | | | 4.88% | | | | 05/25/2029 | | | | 14,884,720 | |
| | 6,000,000 | | | Empresa Electrica Guacolda S.A. | | | 4.56% | ^ | | | 04/30/2025 | | | | 5,757,930 | |
| | 5,713,547 | | | ENA Norte Trust | | | 4.95% | | | | 04/25/2023 | | | | 5,856,385 | |
| | 2,000,000 | | | ENTEL Chile S.A. | | | 4.75% | | | | 08/01/2026 | | | | 1,926,974 | |
| | 3,800,000 | | | ESAL GmbH | | | 6.25% | ^ | | | 02/05/2023 | | | | 3,358,250 | |
| | 2,100,000 | | | ESAL GmbH | | | 6.25% | | | | 02/05/2023 | | | | 1,855,875 | |
| | 2,900,730 | | | Fermaca Enterprises S. de R.L. de C.V. | | | 6.38% | ^ | | | 03/30/2038 | | | | 2,748,442 | |
| | 6,091,533 | | | Fermaca Enterprises S. de R.L. de C.V. | | | 6.38% | | | | 03/30/2038 | | | | 5,771,727 | |
| | 4,000,000 | | | Freeport-McMoRan Copper & Gold, Inc. | | | 4.00% | | | | 11/14/2021 | | | | 2,850,000 | |
| | 800,000 | | | Freeport-McMoRan Copper & Gold, Inc. | | | 3.88% | | | | 03/15/2023 | | | | 551,296 | |
| | 10,000,000 | | | Freeport-McMoRan Copper & Gold, Inc. | | | 5.45% | | | | 03/15/2043 | | | | 6,100,000 | |
| | 3,000,000 | | | Global Bank Corporation | | | 4.75% | | | | 10/05/2017 | | | | 3,048,750 | |
| | 5,000,000 | | | Global Bank Corporation | | | 5.13% | ^ | | | 10/30/2019 | | | | 5,087,500 | |
| | 9,500,000 | | | Global Bank Corporation | | | 5.13% | | | | 10/30/2019 | | | | 9,666,250 | |
| | 6,000,000 | | | GNL Quintero S.A. | | | 4.63% | | | | 07/31/2029 | | | | 6,067,398 | |
| | 1,000,000 | | | Gol LuxCo S.A. | | | 8.88% | ^ | | | 01/24/2022 | | | | 350,000 | |
| | 12,000,000 | | | Grupo Aval Ltd. | | | 4.75% | | | | 09/26/2022 | | | | 11,220,000 | |
| | 3,950,000 | | | Grupo Cementos de Chihuahua S.A.B de C.V. | | | 8.13% | | | | 02/08/2020 | | | | 4,108,000 | |
| | 4,350,000 | | | Grupo Elektra S.A.B. de C.V. | | | 7.25% | | | | 08/06/2018 | | | | 4,241,250 | |
| | 2,890,000 | | | Grupo Idesa S.A. de C.V. | | | 7.88% | ^ | | | 12/18/2020 | | | | 2,821,362 | |
| | 5,000,000 | | | Grupo Idesa S.A. de C.V. | | | 7.88% | | | | 12/18/2020 | | | | 4,881,250 | |
| | 600,000 | | | Grupo Posadas S.A.B. de C.V. | | | 7.88% | ^ | | | 06/30/2022 | | | | 592,500 | |
| | 4,000,000 | | | GrupoSura Finance S.A. | | | 5.70% | | | | 05/18/2021 | | | | 4,158,000 | |
| | 400,000 | | | GTL Trade Finance, Inc. | | | 5.89% | | | | 04/29/2024 | | | | 327,000 | |
| | 11,483,718 | | | Guanay Finance Ltd. | | | 6.00% | | | | 12/15/2020 | | | | 11,167,916 | |
| | 4,000,000 | | | Hutchison Whampoa International Ltd. | | | 6.00% | #† | | | 05/07/2017 | | | | 4,142,000 | |
| | 5,000,000 | | | Hutchison Whampoa International Ltd. | | | 3.25% | | | | 11/08/2022 | | | | 5,191,435 | |
| | 800,000 | | | Industrial Senior Trust | | | 5.50% | ^ | | | 11/01/2022 | | | | 770,000 | |
| | 8,284,000 | | | Industrial Senior Trust | | | 5.50% | | | | 11/01/2022 | | | | 7,973,350 | |
| | 1,668,000 | | | Inkia Energy Ltd. | | | 8.38% | | | | 04/04/2021 | | | | 1,672,170 | |
| | 1,800,000 | | | Inkia Energy Ltd. | | | 8.38% | ^ | | | 04/04/2021 | | | | 1,804,500 | |
| | 2,300,000 | | | Instituto Costarricense de Electricidad | | | 6.95% | ^ | | | 11/10/2021 | | | | 2,305,750 | |
| | 2,800,000 | | | Instituto Costarricense de Electricidad | | | 6.95% | | | | 11/10/2021 | | | | 2,807,000 | |
| | 2,970,000 | | | Intelsat Jackson Holdings S.A. | | | 5.50% | | | | 08/01/2023 | | | | 1,804,275 | |
| | 320,000 | | | Intelsat Jackson Holdings S.A. | | | 8.00% | ^ | | | 02/15/2024 | | | | 330,400 | |
| | 1,700,000 | | | Intercorp Peru Ltd. | | | 5.88% | | | | 02/12/2025 | | | | 1,636,250 | |
| | 2,000,000 | | | Inversiones CMPC S.A. | | | 4.50% | | | | 04/25/2022 | | | | 2,061,092 | |
| | 5,000,000 | | | Israel Electric Corporation Ltd. | | | 5.00% | ^ | | | 11/12/2024 | | | | 5,315,000 | |
| | 200,000 | | | JBS Investments GmbH | | | 7.25% | ^ | | | 04/03/2024 | | | | 184,500 | |
| | 3,800,000 | | | JBS Investments GmbH | | | 7.25% | | | | 04/03/2024 | | | | 3,505,500 | |
| | 6,000,000 | | | Latam Airlines Group S.A. | | | 7.25% | ^ | | | 06/09/2020 | | | | 5,550,000 | |
| | 10,600,000 | | | Lima Metro Line 2 Finance Ltd. | | | 5.88% | | | | 07/05/2034 | | | | 10,600,000 | |
| | 485,000 | | | Maestro Peru S.A. | | | 6.75% | | | | 09/26/2019 | | | | 510,463 | |
| | 1,600,000 | | | Magnesita Finance Ltd. | | | 8.63% | † | | | 04/05/2017 | | | | 936,000 | |
| | | | | | | | | | | | | | | | |
PRINCIPAL
AMOUNT $ | | | SECURITY DESCRIPTION | | RATE | | | MATURITY | | | VALUE $ | |
| | 2,900,000 | | | Marfrig Holdings B.V. | | | 6.88% | ^ | | | 06/24/2019 | | | | 2,765,875 | |
| | 2,100,000 | | | Marfrig Holdings B.V. | | | 6.88% | | | | 06/24/2019 | | | | 2,002,875 | |
| | 7,649,096 | | | Mexico Generadora de Energia | | | 5.50% | | | | 12/06/2032 | | | | 6,721,643 | |
| | 3,500,000 | | | Minerva Luxembourg S.A. | | | 8.75% | #^† | | | 04/03/2019 | | | | 3,303,125 | |
| | 4,800,000 | | | Minerva Luxembourg S.A. | | | 8.75% | #† | | | 04/03/2019 | | | | 4,530,000 | |
| | 2,000,000 | | | Minsur S.A. | | | 6.25% | | | | 02/07/2024 | | | | 1,910,000 | |
| | 10,095,000 | | | National Gas Company of Trinidad and Tobago Ltd. | | | 6.05% | | | | 01/15/2036 | | | | 10,284,281 | |
| | 5,300,000 | | | OAS Financial Ltd. | | | 8.88% | #^†W | | | 04/25/2018 | | | | 32,860 | |
| | 1,500,000 | | | OAS Financial Ltd. | | | 8.88% | #†W | | | 04/29/2049 | | | | 9,300 | |
| | 1,700,000 | | | Odebrecht Finance Ltd. | | | 7.13% | | | | 06/26/2042 | | | | 726,750 | |
| | 1,500,000 | | | Odebrecht Finance Ltd. | | | 7.50% | † | | | 09/29/2049 | | | | 648,000 | |
| | 6,200,000 | | | ONGC Videsh Ltd. | | | 3.75% | | | | 05/07/2023 | | | | 6,208,066 | |
| | 2,000,000 | | | ONGC Videsh Ltd. | | | 4.63% | | | | 07/15/2024 | | | | 2,101,742 | |
| | 2,866,000 | | | Orange S.A. | | | 2.75% | | | | 09/14/2016 | | | | 2,887,670 | |
| | 5,793,000 | | | Orange S.A. | | | 2.75% | | | | 02/06/2019 | | | | 5,976,047 | |
| | 14,000,000 | | | Oversea-Chinese Banking Corporation | | | 4.00% | # | | | 10/15/2024 | | | | 14,557,452 | |
| | 4,700,000 | | | Pacific Rubiales Energy Corporation | | | 5.13% | W | | | 03/28/2023 | | | | 822,500 | |
| | 1,500,000 | | | Pacific Rubiales Energy Corporation | | | 5.13% | ^W | | | 03/28/2023 | | | | 262,500 | |
| | 5,000,000 | | | Pacific Rubiales Energy Corporation | | | 5.63% | ^W | | | 01/19/2025 | | | | 875,000 | |
| | 1,000,000 | | | Pacific Rubiales Energy Corporation | | | 5.63% | W | | | 01/19/2025 | | | | 175,000 | |
| | 5,800,000 | | | Peru Enhanced Pass-Through Finance Ltd. | | | 0.00% | | | | 06/02/2025 | | | | 4,488,678 | |
| | 1,000,000 | | | Pesquera Exalmar S.A.A. | | | 7.38% | | | | 01/31/2020 | | | | 710,000 | |
| | 1,800,000 | | | Pesquera Exalmar S.A.A. | | | 7.38% | ^ | | | 01/31/2020 | | | | 1,278,000 | |
| | 3,000,000 | | | Petroleos Mexicanos | | | 5.50% | | | | 01/21/2021 | | | | 3,118,125 | |
| | 1,000,000 | | | Petroleos Mexicanos | | | 4.50% | | | | 01/23/2026 | | | | 934,000 | |
| | 4,000,000 | | | Petroleos Mexicanos | | | 6.38% | | | | 01/23/2045 | | | | 3,728,000 | |
| | 15,285,000 | | | Petroleos Mexicanos | | | 5.63% | | | | 01/23/2046 | | | | 12,902,833 | |
| | 6,960,000 | | | Reliance Industries Ltd. | | | 5.88% | † | | | 02/05/2018 | | | | 6,916,500 | |
| | 4,500,000 | | | Reliance Industries Ltd. | | | 4.13% | | | | 01/28/2025 | | | | 4,645,800 | |
| | 2,040,000 | | | Royal Bank of Canada | | | 2.50% | | | | 01/19/2021 | | | | 2,085,331 | |
| | 1,000,000 | | | Sixsigma Networks Mexico S.A. de C.V. | | | 8.25% | ^ | | | 11/07/2021 | | | | 947,500 | |
| | 1,000,000 | | | Sixsigma Networks Mexico S.A. de C.V. | | | 8.25% | | | | 11/07/2021 | | | | 947,500 | |
| | 1,000,000 | | | Sociedad Quimica y Minera S.A. | | | 5.50% | | | | 04/21/2020 | | | | 1,038,250 | |
| | 6,400,000 | | | Sociedad Quimica y Minera S.A. | | | 4.38% | | | | 01/28/2025 | | | | 6,064,000 | |
| | 1,500,000 | | | Southern Copper Corporation | | | 7.50% | | | | 07/27/2035 | | | | 1,576,126 | |
| | 6,000,000 | | | Southern Copper Corporation | | | 6.75% | | | | 04/16/2040 | | | | 5,865,300 | |
| | 3,800,000 | | | Southern Copper Corporation | | | 5.25% | | | | 11/08/2042 | | | | 3,134,939 | |
| | 5,333,000 | | | SUAM Finance B.V. | | | 4.88% | | | | 04/17/2024 | | | | 5,372,997 | |
| | 8,310,000 | | | Sumitomo Mitsui Financial Group, Inc. | | | 2.93% | | | | 03/09/2021 | | | | 8,477,488 | |
| | 9,791,000 | | | Tanner Servicios Financieros S.A. | | | 4.38% | | | | 03/13/2018 | | | | 9,619,658 | |
| | 8,000,000 | | | Telefonica Celular del Paraguay S.A. | | | 6.75% | | | | 12/13/2022 | | | | 7,880,000 | |
| | 8,942,000 | | | Teva Pharmaceutical Finance Company B.V. | | | 2.95% | | | | 12/18/2022 | | | | 9,010,675 | |
| | 2,926,000 | | | Toronto Dominion Bank | | | 1.75% | | | | 07/23/2018 | | | | 2,940,089 | |
| | 5,430,000 | | | Toronto Dominion Bank | | | 2.13% | | | | 04/07/2021 | | | | 5,420,769 | |
| | 1,175,000 | | | Transportadora de Gas Internacional S.A. | | | 5.70% | ^ | | | 03/20/2022 | | | | 1,196,737 | |
| | 12,825,000 | | | Transportadora de Gas Internacional S.A. | | | 5.70% | | | | 03/20/2022 | | | | 13,062,263 | |
| | | | | | |
| 40 | | DoubleLine Funds Trust | | | | The accompanying notes are an integral part of these financial statements. |
| | | | | | | | | | | | | | | | |
PRINCIPAL
AMOUNT $ | | | SECURITY DESCRIPTION | | RATE | | | MATURITY | | | VALUE $ | |
| | 3,350,000 | | | TV Azteca S.A.B. de C.V. | | | 7.50% | | | | 05/25/2018 | | | | 2,169,125 | |
| | 3,200,000 | | | TV Azteca S.A.B. de C.V. | | | 7.63% | | | | 09/18/2020 | | | | 1,888,000 | |
| | 2,419,000 | | | Unifin Financiera S.A.P.I. de C.V. | | | 6.25% | | | | 07/22/2019 | | | | 2,310,145 | |
| | 1,000,000 | | | Union Andina de Cementos S.A.A. | | | 5.88% | | | | 10/30/2021 | | | | 1,005,000 | |
| | 2,000,000 | | | Union Andina de Cementos S.A.A. | | | 5.88% | ^ | | | 10/30/2021 | | | | 2,010,000 | |
| | 14,000,000 | | | United Overseas Bank Ltd. | | | 3.75% | # | | | 09/19/2024 | | | | 14,438,620 | |
| | 5,000,000 | | | Vedanta Resources PLC | | | 8.25% | | | | 06/07/2021 | | | | 3,000,000 | |
| | 1,800,000 | | | Vedanta Resources PLC | | | 7.13% | | | | 05/31/2023 | | | | 1,008,000 | |
| | 2,200,000 | | | Vedanta Resources PLC | | | 7.13% | ^ | | | 05/31/2023 | | | | 1,232,000 | |
| | 7,800,000 | | | Volcan Cia Minera S.A.A. | | | 5.38% | | | | 02/02/2022 | | | | 5,976,750 | |
| | 8,000,000 | | | VTR Finance B.V. | | | 6.88% | | | | 01/15/2024 | | | | 7,862,400 | |
| | 8,230,000 | | | Westpac Banking Corporation | | | 2.60% | | | | 11/23/2020 | | | | 8,412,081 | |
| | | | | | | | | | | | | | | | |
| | | | Total Foreign Corporate Bonds
(Cost $765,937,725) | | | | 720,585,576 | |
| | | | | | | | | | | | | | | | |
| FOREIGN GOVERNMENT BONDS AND NOTES, SUPRANATIONALS AND
FOREIGN AGENCIES 0.5% |
|
| | 20,000,000 | | | Colombia Government International Bond | | | 4.38% | | | | 07/12/2021 | | | | 20,900,000 | |
| | 11,822,000 | | | Mexico Government International Bond | | | 4.00% | | | | 10/02/2023 | | | | 12,413,100 | |
| | | | | | | | | | | | | | | | |
| | | | Total Foreign Government Bonds and Notes, Supranationals and Foreign Agencies
(Cost $32,648,931) | | | | 33,313,100 | |
| | | | | | | | | | | | | | | | |
| | MUNICIPAL BONDS 0.2% | |
| | 4,500,000 | | | New York State Dormitory Authority | | | 5.00% | | | | 03/15/2033 | | | | 5,384,655 | |
| | 4,480,000 | | | State of California | | | 5.00% | | | | 08/01/2033 | | | | 5,377,344 | |
| | | | | | | | | | | | | | | | |
| | | | Total Municipal Bonds
(Cost $10,151,630) | | | | 10,761,999 | |
| | | | | | | | | | | | | | | | |
| | NON-AGENCY COMMERCIAL MORTGAGE BACKED OBLIGATIONS 6.6% | |
| |
| | | | BAMLL Commercial Mortgage Securities Trust, | |
| | 2,000,000 | | | Series 2014-IP-E | | | 2.72% | #^ | | | 06/15/2028 | | | | 1,962,917 | |
| | 118,650,000 | | | Series 2015-200P-XA | | | 0.38% | #^ I/O | | | 04/14/2033 | | | | 3,803,183 | |
| |
| | | | Bear Stearns Commercial Mortgage Securities, Inc., | |
| | 3,775,000 | | | Series 2007-T26-AJ | | | 5.57% | # | | | 01/12/2045 | | | | 3,718,750 | |
| |
| | | | CD Commercial Mortgage Trust, | |
| | 3,735,300 | | | Series 2007-CD4-AMFX | | | 5.37% | # | | | 12/11/2049 | | | | 3,799,531 | |
| |
| | | | CFCRE Commercial Mortgage Trust, | |
| | 75,456,911 | | | Series 2016-C3-XA | | | 1.10% | # I/O | | | 01/10/2048 | | | | 5,911,921 | |
| |
| | | | Citigroup Commercial Mortgage Trust, | |
| | 11,371,294 | | | Series 2012-GC8-XA | | | 2.16% | #^ I/O | | | 09/10/2045 | | | | 870,681 | |
| | 4,234,500 | | | Series 2015-GC27-D | | | 4.43% | #^ | | | 02/10/2048 | | | | 3,254,389 | |
| | 4,250,798 | | | Series 2015-GC27-XA | | | 1.44% | # I/O | | | 02/10/2048 | | | | 393,096 | |
| | 5,572,000 | | | Series 2015-GC35-C | | | 4.65% | | | | 11/10/2048 | | | | 5,204,067 | |
| | 74,253,943 | | | Series 2015-GC35-XA | | | 0.91% | # I/O | | | 11/10/2048 | | | | 4,320,013 | |
| | 46,139,000 | | | Series 2016-P3-XA | | | 1.72% | # I/O | | | 04/15/2049 | | | | 5,524,273 | |
| |
| | | | COBALT Commercial Mortgage Trust, | |
| | 2,602,680 | | | Series 2007-C2-AJFX | | | 5.57% | # | | | 04/15/2047 | | | | 2,543,299 | |
| |
| | | | Commercial Mortgage Pass-Through Certificates, | |
| | 4,562,508 | | | Series 2002-LC4-XA | | | 2.38% | #^ I/O | | | 12/10/2044 | | | | 414,682 | |
| | 1,074,034 | | | Series 2010-C1-XPA | | | 1.57% | #^ I/O | | | 07/10/2046 | | | | 27,175 | |
| | 28,150,996 | | | Series 2012-CR3-XA | | | 2.10% | # I/O | | | 10/15/2045 | | | | 2,471,990 | |
| | 3,500,000 | | | Series 2014-CR20-C | | | 4.51% | # | | | 11/10/2047 | | | | 3,480,085 | |
| | | | | | | | | | | | | | | | |
PRINCIPAL
AMOUNT $ | | | SECURITY DESCRIPTION | | RATE | | | MATURITY | | | VALUE $ | |
| |
| | | | Commercial Mortgage Pass-Through Certificates, (Cont.) | |
| | 6,073,872 | | | Series 2014-KYO-F | | | 3.94% | #^ | | | 06/11/2027 | | | | 6,020,902 | |
| | 5,000,000 | | | Series 2015-CR23-D | | | 4.26% | # | | | 05/10/2048 | | | | 3,723,318 | |
| | 1,400,000 | | | Series 2015-CR25-C | | | 4.55% | # | | | 08/10/2048 | | | | 1,289,281 | |
| | 61,639,859 | | | Series 2015-CR26-XA | | | 1.07% | # I/O | | | 10/10/2048 | | | | 4,385,793 | |
| | 4,310,000 | | | Series 2015-LC21-C | | | 4.31% | # | | | 07/10/2048 | | | | 3,959,546 | |
| | 5,579,000 | | | Series 2015-LC23-C | | | 4.65% | # | | | 10/10/2053 | | | | 5,439,652 | |
| | 6,664,000 | | | Series 2016-CR28-C | | | 4.65% | # | | | 02/10/2049 | | | | 6,576,341 | |
| | 3,786,000 | | | Series 2016-DC2-C | | | 4.80% | # | | | 02/10/2049 | | | | 3,734,841 | |
| | 60,155,000 | | | Series 2016-DC2-XA | | | 1.24% | # I/O | | | 02/10/2049 | | | | 4,490,360 | |
| |
| | | | Credit Suisse First Boston Mortgage Securities Corporation, | |
| | 328,726 | | | Series 1998-C2-F | | | 6.75% | #^ | | | 11/15/2030 | | | | 331,120 | |
| | 7,777 | | | Series 2001-CF2-G | | | 6.93% | ^ | | | 02/15/2034 | | | | 7,749 | |
| |
| | | | Credit Suisse Mortgage Capital Certificates, | |
| | 6,530,000 | | | Series 2006-C4-AM | | | 5.51% | | | | 09/15/2039 | | | | 6,586,873 | |
| | 2,500,000 | | | Series 2007-C4-A1AM | | | 5.94% | # | | | 09/15/2039 | | | | 2,501,979 | |
| | 3,800,000 | | | Series 2009-RR2-IQB | | | 5.69% | #^ | | | 04/16/2049 | | | | 3,867,893 | |
| | 5,135,000 | | | Series 2015-SAND-D | | | 3.29% | #^ | | | 08/15/2030 | | | | 4,960,621 | |
| |
| | | | CSAIL Commercial Mortgage Trust, | |
| | 5,597,000 | | | Series 2015-C4-C | | | 4.59% | # | | | 11/15/2048 | | | | 5,270,808 | |
| |
| | | | DBRR Trust, | |
| | 1,000,000 | | | Series 2011-C32-A3B | | | 5.70% | #^ | | | 06/17/2049 | | | | 1,023,403 | |
| |
| | | | DBUBS Mortgage Trust, | |
| | 4,819,413 | | | Series 2011-LC2A-XA | | | 1.36% | #^ I/O | | | 07/10/2044 | | | | 166,984 | |
| |
| | | | Deutsche Bank Commercial Mortgage Trust, | |
| | 4,475,000 | | | Series 2016-C1-C | | | 3.35% | # | | | 05/10/2049 | | | | 3,917,727 | |
| |
| | | | GE Commercial Mortgage Corporation Trust, | |
| | 4,078,000 | | | Series 2007-C1-AM | | | 5.61% | # | | | 12/10/2049 | | | | 4,039,294 | |
| |
| | | | Greenwich Capital Commercial Funding Corporation, | |
| | 3,795,300 | | | Series 2007-GG11-AJ | | | 6.03% | # | | | 12/10/2049 | | | | 3,740,830 | |
| | 3,500,000 | | | Series 2007-GG11-AM | | | 5.87% | # | | | 12/10/2049 | | | | 3,601,468 | |
| | 3,681,100 | | | Series 2007-GG9-AMFX | | | 5.48% | | | | 03/10/2039 | | | | 3,741,885 | |
| |
| | | | GS Mortgage Securities Corporation, | |
| | 453,595 | | | Series 2006-GG6-XC | | | 0.00% | #^ I/O | | | 04/10/2038 | | | | 5 | |
| | 5,191,022 | | | Series 2007-GG10-A4 | | | 5.79% | # | | | 08/10/2045 | | | | 5,353,183 | |
| | 4,379,150 | | | Series 2011-GC5-XA | | | 1.62% | #^ I/O | | | 08/10/2044 | | | | 175,834 | |
| | 5,539,583 | | | Series 2012-GC6-XA | | | 2.05% | #^ I/O | | | 01/10/2045 | | | | 468,755 | |
| | 3,741,000 | | | Series 2014-GC26-C | | | 4.51% | # | | | 11/10/2047 | | | | 3,641,819 | |
| | 3,748,000 | | | Series 2014-GC26-D | | | 4.51% | #^ | | | 11/10/2047 | | | | 2,915,417 | |
| | 986,700 | | | Series 2015-GC32-B | | | 4.40% | # | | | 07/10/2048 | | | | 1,014,899 | |
| | 99,803,977 | | | Series 2015-GS1-XA | | | 0.84% | # I/O | | | 11/10/2048 | | | | 6,078,242 | |
| | 5,663,000 | | | Series 2016-ICE2-A | | | 2.37% | #^ | | | 02/15/2033 | | | | 5,671,104 | |
| |
| | | | JP Morgan Chase Commercial Mortgage Securities Corporation, | |
| | 23,024,180 | | | Series 2006-LDP8-X | | | 0.53% | # I/O | | | 05/15/2045 | | | | 31,140 | |
| | 2,500,000 | | | Series 2006-LDP9-AM | | | 5.37% | | | | 05/15/2047 | | | | 2,511,818 | |
| | 1,000,000 | | | Series 2007-CB18-AMFX | | | 5.40% | | | | 06/12/2047 | | | | 1,018,068 | |
| | 5,568,600 | | | Series 2007-CIBC19-AM | | | 5.70% | # | | | 02/12/2049 | | | | 5,689,920 | |
| | 5,055,300 | | | Series 2007-CIBC20-AJ | | | 6.08% | # | | | 02/12/2051 | | | | 4,929,921 | |
| | 6,350,000 | | | Series 2007-LD12-AM | | | 6.01% | # | | | 02/15/2051 | | | | 6,625,963 | |
| | 12,050,000 | | | Series 2009-IWST-XB | | | 0.29% | #^ I/O | | | 12/05/2027 | | | | 160,539 | |
| | 1,000,000 | | | Series 2009-RR2-GEB | | | 5.54% | ^ | | | 12/13/2049 | | | | 1,022,265 | |
| | 9,109,339 | | | Series 2011-C4-XA | | | 1.41% | #^ I/O | | | 07/15/2046 | | | | 290,652 | |
| | 31,522,093 | | | Series 2012-C8-XA | | | 2.04% | # I/O | | | 10/15/2045 | | | | 2,518,360 | |
| | 6,594,990 | | | Series 2012-CBX-XA | | | 1.70% | # I/O | | | 06/15/2045 | | | | 413,613 | |
| | 1,700,000 | | | Series 2015-CSMO-C | | | 2.69% | #^ | | | 01/15/2032 | | | | 1,658,371 | |
| | 79,863,013 | | | Series 2015-JP1-XA | | | 1.16% | # I/O | | | 01/15/2049 | | | | 5,526,816 | |
| |
| | | | JPMBB Commercial Mortgage Securities Trust, | |
| | 58,550,102 | | | Series 2014-C18-XA | | | 1.13% | # I/O | | | 02/15/2047 | | | | 3,151,834 | |
| | 3,000,000 | | | Series 2014-C21-C | | | 4.66% | # | | | 08/15/2047 | | | | 2,953,290 | |
| | 2,766,125 | | | Series 2014-C23-C | | | 4.46% | # | | | 09/15/2047 | | | | 2,728,446 | |
| | 3,766,500 | | | Series 2014-C25-C | | | 4.45% | # | | | 11/15/2047 | | | | 3,729,869 | |
| | 58,539,380 | | | Series 2014-C25-XA | | | 1.01% | # I/O | | | 11/15/2047 | | | | 3,384,478 | |
| | 50,791,688 | | | Series 2014-C26-XA | | | 1.18% | # I/O | | | 01/15/2048 | | | | 3,217,984 | |
| | 4,474,600 | | | Series 2015-C27-D | | | 3.84% | #^ | | | 02/15/2048 | | | | 3,224,952 | |
| | 34,648,830 | | | Series 2015-C27-XA | | | 1.38% | # I/O | | | 02/15/2048 | | | | 2,666,626 | |
| | 4,500,000 | | | Series 2015-C30-B | | | 4.31% | # | | | 07/15/2048 | | | | 4,367,382 | |
| | 52,198,245 | | | Series 2015-C31-XA | | | 1.03% | # I/O | | | 08/15/2048 | | | | 3,417,717 | |
| | 4,750,000 | | | Series 2015-C32-C | | | 4.67% | # | | | 11/15/2048 | | | | 4,272,253 | |
| | 6,470,000 | | | Series 2015-C33-C | | | 4.62% | # | | | 12/15/2048 | | | | 5,989,438 | |
| | 6,122,000 | | | Series 2016-C1-C | | | 4.90% | # | | | 03/15/2049 | | | | 5,577,355 | |
| | | | | | |
| The accompanying notes are an integral part of these financial statements. | | Annual Report | | March 31, 2016 | | 41 |
| | |
| Schedule of Investments DoubleLine Core Fixed Income Fund (Cont.) | | March 31, 2016 |
| | | | | | | | | | | | | | | | |
PRINCIPAL
AMOUNT $ | | | SECURITY DESCRIPTION | | RATE | | | MATURITY | | | VALUE $ | |
| |
| | | | LB Commercial Mortgage Trust, | |
| | 3,000,000 | | | Series 2007-C3-AMFL | | | 5.90% | #^ | | | 07/15/2044 | | | | 3,100,913 | |
| |
| | | | LB-UBS Commercial Mortgage Trust, | |
| | 7,852,102 | | | Series 2006-C7-XCL | | | 0.67% | #^ I/O | | | 11/15/2038 | | | | 25,965 | |
| | 6,332,606 | | | Series 2006-C7-XW | | | 0.67% | #^ I/O | | | 11/15/2038 | | | | 20,941 | |
| | 5,488,832 | | | Series 2007-C1-AJ | | | 5.48% | | | | 02/15/2040 | | | | 5,482,818 | |
| |
| | | | Merrill Lynch Mortgage Trust, | |
| | 3,050,000 | | | Series 2006-C1-AJ | | | 5.76% | # | | | 05/12/2039 | | | | 2,999,779 | |
| | 1,600,000 | | | Series 2006-C2-AJ | | | 5.80% | # | | | 08/12/2043 | | | | 1,573,823 | |
| |
| | | | Merrill Lynch/Countrywide Commercial Mortgage Trust, | |
| | 3,728,700 | | | Series 2007-5-AM | | | 5.42% | | | | 08/12/2048 | | | | 3,771,601 | |
| |
| | | | Morgan Stanley Bank of America Merrill Lynch Trust, | |
| | 2,696,418 | | | Series 2012-C5-XA | | | 1.74% | #^ I/O | | | 08/15/2045 | | | | 173,479 | |
| | 3,000,000 | | | Series 2014-C18-C | | | 4.49% | | | | 10/15/2047 | | | | 2,966,729 | |
| | 4,000,000 | | | Series 2014-C19-C | | | 4.00% | | | | 12/15/2047 | | | | 3,575,947 | |
| | 39,461,764 | | | Series 2015-C20-XA | | | 1.42% | # I/O | | | 02/15/2048 | | | | 3,359,443 | |
| | 4,600,000 | | | Series 2015-C25-C | | | 4.53% | # | | | 10/15/2048 | | | | 4,349,290 | |
| | 7,500,000 | | | Series 2015-C26-D | | | 3.06% | ^ | | | 10/15/2048 | | | | 4,969,885 | |
| | 4,674,000 | | | Series 2015-C27-C | | | 4.54% | # | | | 12/15/2047 | | | | 4,343,991 | |
| | 6,710,000 | | | Series 2015-C27-D | | | 3.24% | #^ | | | 12/15/2047 | | | | 4,423,034 | |
| |
| | | | Morgan Stanley Capital, Inc., | |
| | 1,796,053 | | | Series 2006-HQ8-AJ | | | 5.49% | # | | | 03/12/2044 | | | | 1,792,413 | |
| | 3,462,000 | | | Series 2007-1Q16-AMA | | | 6.05% | # | | | 12/12/2049 | | | | 3,601,128 | |
| | 2,325,000 | | | Series 2007-HQ11-AJ | | | 5.51% | # | | | 02/12/2044 | | | | 2,287,877 | |
| | 3,700,000 | | | Series 2007-IQ13-AM | | | 5.41% | | | | 03/15/2044 | | | | 3,816,978 | |
| | 1,400,000 | | | Series 2007-IQ16-AM | | | 6.05% | # | | | 12/12/2049 | | | | 1,463,879 | |
| | 12,951,428 | | | Series 2011-C1-XA | | | 0.48% | #^ I/O | | | 09/15/2047 | | | | 232,389 | |
| | 4,000,000 | | | Series 2014-CPT-G | | | 3.45% | #^ | | | 07/13/2029 | | | | 3,577,834 | |
| | 4,000,000 | | | Series 2014-MP-D | | | 3.69% | #^ | | | 08/11/2029 | | | | 4,010,988 | |
| | 93,567,590 | | | Series 2015-UBS8-XA | | | 0.99% | # I/O | | | 12/15/2048 | | | | 6,515,897 | |
| | 5,617,000 | | | Series 2015-XLF2-AFSC | | | 3.44% | #^ | | | 08/15/2026 | | | | 5,612,920 | |
| |
| | | | TIAA Seasoned Commercial Mortgage Trust, | |
| | 308,584 | | | Series 2007-C4-AJ | | | 5.53% | # | | | 08/15/2039 | | | | 310,063 | |
| |
| | | | UBS-Barclays Commercial Mortgage Trust, | |
| | 14,060,200 | | | Series 2012-C3-XA | | | 2.08% | #^ I/O | | | 08/10/2049 | | | | 1,257,423 | |
| |
| | | | Wachovia Bank Commercial Mortgage Trust, | |
| | 623,173 | | | Series 2006-C24-AJ | | | 5.66% | # | | | 03/15/2045 | | | | 622,292 | |
| | 2,500,000 | | | Series 2006-C28-AJ | | | 5.63% | # | | | 10/15/2048 | | | | 2,444,764 | |
| | 15,738,821 | | | Series 2006-C29-IO | | | 0.37% | # I/O | | | 11/15/2048 | | | | 32,899 | |
| | 1,900,000 | | | Series 2007-C30-AJ | | | 5.41% | # | | | 12/15/2043 | | | | 1,870,420 | |
| | 5,488,832 | | | Series 2007-C33-AM | | | 5.95% | # | | | 02/15/2051 | | | | 5,678,204 | |
| | 2,500,000 | | | Series 2007-C33-B | | | 5.95% | # | | | 02/15/2051 | | | | 2,367,877 | |
| |
| | | | Wells Fargo Commercial Mortgage Trust, | |
| | 6,750,000 | | | Series 2014-LC16-D | | | 3.94% | ^ | | | 08/15/2050 | | | | 5,063,363 | |
| | 2,200,000 | | | Series 2015-C28-C | | | 4.14% | # | | | 05/15/2048 | | | | 2,039,002 | |
| | 5,403,000 | | | Series 2015-C31-C | | | 4.61% | # | | | 11/15/2048 | | | | 5,182,820 | |
| | 78,802,559 | | | Series 2015-C31-XA | | | 1.12% | # I/O | | | 11/15/2048 | | | | 6,096,710 | |
| | 4,610,000 | | | Series 2015-LC22-C | | | 4.54% | # | | | 09/15/2058 | | | | 4,430,166 | |
| | 56,123,926 | | | Series 2015-NXS1-XA | | | 1.20% | # I/O | | | 05/15/2048 | | | | 4,117,150 | |
| | 4,000,000 | | | Series 2015-NXS3-C | | | 4.49% | # | | | 09/15/2057 | | | | 3,668,675 | |
| | 5,672,000 | | | Series 2015-NXS4-C | | | 4.60% | # | | | 12/15/2048 | | | | 5,445,641 | |
| | 5,613,000 | | | Series 2015-P2-A4 | | | 3.81% | | | | 12/15/2048 | | | | 6,059,023 | |
| | 79,057,148 | | | Series 2015-P2-XA | | | 1.04% | # I/O | | | 12/15/2048 | | | | 5,540,657 | |
| | 4,650,000 | | | Series 2016-C32-C | | | 4.72% | # | | | 01/15/2059 | | | | 4,424,532 | |
| | 4,483,000 | | | Series 2016-C33-C | | | 3.90% | # | | | 03/15/2059 | | | | 3,914,336 | |
| |
| | | | WF-RBS Commercial Mortgage Trust, | |
| | 18,533,842 | | | Series 2012-C9-XA | | | 2.16% | #^ I/O | | | 11/15/2045 | | | | 1,617,087 | |
| | 88,089,205 | | | Series 2014-C21-XA | | | 1.18% | # I/O | | | 08/15/2047 | | | | 5,821,675 | |
| | 56,286,647 | | | Series 2014-C22-XA | | | 0.95% | # I/O | | | 09/15/2057 | | | | 2,999,932 | |
| | 59,235,606 | | | Series 2014-C24-XA | | | 0.98% | # I/O | | | 11/15/2047 | | | | 3,385,925 | |
| | | | | | | | | | | | | | | | |
| | | | Total Non-Agency Commercial Mortgage Backed Obligations
(Cost $416,753,789) | | | | 399,917,625 | |
| | | | | | | | | | | | | | | | |
| NON-AGENCY RESIDENTIAL COLLATERALIZED MORTGAGE
OBLIGATIONS 7.7% |
|
| |
| | | | Adjustable Rate Mortgage Trust, | |
| | 13,337,821 | | | Series 2007-1-4A1 | | | 3.93% | # | | | 03/25/2037 | | | | 10,348,902 | |
| | 87,440 | | | Series 2007-3-1A1 | | | 3.78% | # ^ | | | 11/25/2037 | | | | 72,312 | |
| | | | | | | | | | | | | | | | |
PRINCIPAL
AMOUNT $ | | | SECURITY DESCRIPTION | | RATE | | | MATURITY | | | VALUE $ | |
| |
| | | | American General Mortgage Loan Trust, | |
| | 614,597 | | | Series 2010-1-A3 | | | 5.65% | #^ | | | 03/25/2058 | | | | 615,877 | |
| |
| | | | Banc of America Funding Corporation, | |
| | 1,694,209 | | | Series 2005-G-A3 | | | 2.87% | # | | | 10/20/2035 | | | | 1,582,609 | |
| | 851,552 | | | Series 2006-2-6A2 | | | 5.50% | | | | 03/25/2036 | | | | 840,228 | |
| | 651,276 | | | Series 2006-6-1A2 | | | 6.25% | | | | 08/25/2036 | | | | 639,841 | |
| |
| | | | BCAP LLC Trust, | |
| | 797,794 | | | Series 2009-RR13-6A5 | | | 6.00% | #^ | | | 04/26/2037 | | | | 811,242 | |
| |
| | | | Bear Stearns Asset Backed Securities Trust, | |
| | 300,352 | | | Series 2007-SD1-1A3A | | | 6.50% | | | | 10/25/2036 | | | | 224,507 | |
| |
| | | | Chase Mortgage Finance Trust, | |
| | 4,934,866 | | | Series 2007-A2-6A4 | | | 2.72% | # | | | 07/25/2037 | | | | 4,340,221 | |
| | 1,809,244 | | | Series 2007-S3-2A1 | | | 5.50% | | | | 05/25/2037 | | | | 1,544,131 | |
| |
| | | | Citicorp Mortgage Securities, Inc., | |
| | 138,451 | | | Series 2005-1-1A4 | | | 5.50% | | | | 02/25/2035 | | | | 139,455 | |
| |
| | | | Citicorp Residential Mortgage Securities, Inc., | |
| | 1,800,000 | | | Series 2006-2-A5 | | | 5.89% | # | | | 09/25/2036 | | | | 1,799,373 | |
| |
| | | | Citigroup Mortgage Loan Trust, Inc., | |
| | 347,067 | | | Series 2006-WF2-A2C | | | 5.85% | # | | | 05/25/2036 | | | | 219,591 | |
| | 4,928,000 | | | Series 2008-AR4-2A1B | | | 2.90% | #^ | | | 11/25/2038 | | | | 4,690,830 | |
| | 2,655,778 | | | Series 2010-8-5A4 | | | 6.66% | #^ | | | 11/25/2036 | | | | 2,483,439 | |
| | 13,294,019 | | | Series 2010-8-6A4 | | | 6.56% | #^ | | | 12/25/2036 | | | | 12,325,133 | |
| | 982,286 | | | Series 2011-12-3A1 | | | 2.75% | #^ | | | 09/25/2047 | | | | 979,331 | |
| |
| | | | CitiMortgage Alternative Loan Trust, | |
| | 232,440 | | | Series 2006-A2-A2 | | | 6.00% | | | | 05/25/2036 | | | | 200,942 | |
| | 99,448 | | | Series 2006-A5-3A3 | | | 6.00% | | | | 10/25/2036 | | | | 81,820 | |
| | 229,092 | | | Series 2007-A1-1A7 | | | 6.00% | | | | 01/25/2037 | | | | 195,517 | |
| | 13,159,662 | | | Series 2007-A5-1A10 | | | 5.75% | | | | 05/25/2037 | | | | 11,122,346 | |
| |
| | | | Countrywide Alternative Loan Trust, | |
| | 2,493,335 | | | Series 2004-22CB-1A1 | | | 6.00% | | | | 10/25/2034 | | | | 2,505,007 | |
| | 284,368 | | | Series 2005-20CB-1A1 | | | 5.50% | | | | 07/25/2035 | | | | 266,407 | |
| | 337,033 | | | Series 2005-28CB-3A6 | | | 6.00% | | | | 08/25/2035 | | | | 263,963 | |
| | 1,631,671 | | | Series 2005-46CB-A22 | | | 5.25% | | | | 10/25/2035 | | | | 1,479,617 | |
| | 269,331 | | | Series 2005-J10-1A13 | | | 1.13% | # | | | 10/25/2035 | | | | 209,939 | |
| | 546,960 | | | Series 2006-26CB-A9 | | | 6.50% | | | | 09/25/2036 | | | | 470,613 | |
| | 12,936,554 | | | Series 2006-42-1A8 | | | 6.00% | | | | 01/25/2047 | | | | 11,519,960 | |
| | 1,981,019 | | | Series 2007-12T1-A1 | | | 6.00% | | | | 06/25/2037 | | | | 1,643,711 | |
| | 2,169,301 | | | Series 2007-16CB-2A1 | | | 0.88% | # | | | 08/25/2037 | | | | 1,288,697 | |
| | 628,175 | | | Series 2007-16CB-2A2 | | | 50.98 | %# I/F | | | 08/25/2037 | | | | 1,612,938 | |
| | 157,625 | | | Series 2007-17CB-1A10 | | | 27.91 | %# I/F | | | 08/25/2037 | | | | 263,769 | |
| | 786,833 | | | Series 2007-18CB-2A17 | | | 6.00% | | | | 08/25/2037 | | | | 692,688 | |
| | 3,311,967 | | | Series 2007-23CB-A3 | | | 0.93% | # | | | 09/25/2037 | | | | 2,048,417 | |
| | 3,253,445 | | | Series 2007-23CB-A4 | | | 6.07% | # I/F I/O | | | 09/25/2037 | | | | 1,013,004 | |
| | 776,818 | | | Series 2007-4CB-2A1 | | | 7.00% | | | | 03/25/2037 | | | | 311,741 | |
| |
| | | | Countrywide Asset-Backed Certificates, | |
| | 141,581 | | | Series 2005-13-AF3 | | | 4.84% | # | | | 04/25/2036 | | | | 126,753 | |
| |
| | | | Countrywide Home Loans, | |
| | 73,946 | | | Series 2002-32-2A6 | | | 5.00% | | | | 01/25/2018 | | | | 74,511 | |
| | 621,493 | | | Series 2005-28-A7 | | | 5.25% | | | | 01/25/2019 | | | | 572,081 | |
| | 1,183,141 | | | Series 2007-10-A5 | | | 6.00% | | | | 07/25/2037 | | | | 1,026,587 | |
| | 503,827 | | | Series 2007-15-1A16 | | | 6.25% | | | | 09/25/2037 | | | | 487,276 | |
| | 1,395,873 | | | Series 2007-3-A17 | | | 6.00% | | | | 04/25/2037 | | | | 1,274,078 | |
| |
| | | | Credit Suisse First Boston Mortgage Securities Corporation, | |
| | 147,442 | | | Series 2005-10-5A5 | | | 5.50% | | | | 11/25/2035 | | | | 133,606 | |
| | 2,168,559 | | | Series 2005-8-1A3 | | | 5.25% | | | | 09/25/2035 | | | | 1,945,225 | |
| |
| | | | Credit Suisse Mortgage Capital Certificates, | |
| | 5,686,560 | | | Series 2006-4-6A1 | | | 6.00% | | | | 05/25/2036 | | | | 4,569,904 | |
| | 194,756 | | | Series 2006-4-7A1 | | | 5.50% | | | | 05/25/2021 | | | | 185,585 | |
| | 165,266 | | | Series 2007-1-3A1 | | | 6.00% | | | | 02/25/2022 | | | | 127,457 | |
| | 50,837 | | | Series 2007-2-2A1 | | | 5.00% | | | | 03/25/2037 | | | | 50,053 | |
| | 6,831,327 | | | Series 2010-4R-3A17 | | | 6.00% | #^ | | | 06/26/2037 | | | | 6,804,277 | |
| | 11,661,076 | | | Series 2013-IVR1-A1 | | | 2.50% | #^ | | | 03/25/2043 | | | | 11,396,782 | |
| | 23,949,948 | | | Series 2013-IVR4 | | | 3.50% | #^ | | | 07/25/2043 | | | | 24,388,041 | |
| | 18,969,079 | | | Series 2015-PR2-A1 | | | 4.25% | #^ | | | 07/26/2055 | | | | 18,682,532 | |
| | 47,097,708 | | | Series 2015-RPL3-A1 | | | 3.75% | #^ | | | 12/25/2056 | | | | 46,369,492 | |
| |
| | | | Deutsche ALT-A Securities, Inc. Mortgage Loan Trust, | |
| | 16,170,646 | | | Series 2005-6-2A1 | | | 5.50% | | | | 12/25/2035 | | | | 13,463,290 | |
| | | | | | |
| 42 | | DoubleLine Funds Trust | | | | The accompanying notes are an integral part of these financial statements. |
| | | | | | | | | | | | | | | | |
PRINCIPAL
AMOUNT $ | | | SECURITY DESCRIPTION | | RATE | | | MATURITY | | | VALUE $ | |
| |
| | | | Deutsche Mortgage Securities, Inc., | |
| | 1,907,855 | | | Series 2006-PR1-3A1 | | | 11.51% | #^ I/F | | | 04/15/2036 | | | | 2,153,107 | |
| | 217,566 | | | Series 2006-PR1-4AI2 | | | 13.77% | #^ I/F | | | 04/15/2036 | | | | 274,721 | |
| | 1,599,819 | | | Series 2006-PR1-5AI4 | | | 11.51% | #^ I/F | | | 04/15/2036 | | | | 1,954,798 | |
| |
| | | | First Horizon Alternative Mortgage Securities, | |
| | 543,414 | | | Series 2006-FA2-1A5 | | | 6.00% | | | | 05/25/2036 | | | | 440,729 | |
| | 5,036,043 | | | Series 2006-FA8-1A1 | | | 6.25% | | | | 02/25/2037 | | | | 3,879,549 | |
| | 131,391 | | | Series 2006-RE1-A1 | | | 5.50% | | | | 05/25/2035 | | | | 120,986 | |
| |
| | | | GMACM Mortgage Loan Trust, | |
| | 7,153,416 | | | Series 2006-J1-A6 | | | 5.75% | | | | 04/25/2036 | | | | 6,757,530 | |
| |
| | | | GSAA Home Equity Trust, | |
| | 391,245 | | | Series 2005-7-AF5 | | | 4.61% | # | | | 05/25/2035 | | | | 405,388 | |
| | 1,754,076 | | | Series 2007-10-A1A | | | 6.00% | | | | 11/25/2037 | | | | 1,516,184 | |
| | 1,610,059 | | | Series 2007-10-A2A | | | 6.50% | | | | 11/25/2037 | | | | 1,180,845 | |
| |
| | | | GSR Mortgage Loan Trust, | |
| | 71,226 | | | Series 2006-2F-5A1 | | | 4.50% | | | | 01/25/2021 | | | | 68,475 | |
| | 7,052,190 | | | Series 2006-3F-4A1 | | | 6.00% | | | | 03/25/2036 | | | | 6,385,719 | |
| | 1,002,232 | | | Series 2007-1F-2A2 | | | 5.50% | | | | 01/25/2037 | | | | 951,041 | |
| |
| | | | Impac Secured Assets Trust, | |
| | 36,826,855 | | | Series 2006-5-1A1C | | | 0.70% | # | | | 02/25/2037 | | | | 23,657,822 | |
| |
| | | | JP Morgan Alternative Loan Trust, | |
| | 429,781 | | | Series 2006-S2-A4 | | | 6.19% | # | | | 05/25/2036 | | | | 311,897 | |
| | 9,404,362 | | | Series 2006-S3-A4 | | | 6.31% | # | | | 08/25/2036 | | | | 7,580,287 | |
| | 1,121,490 | | | Series 2006-S3-A6 | | | 6.12% | # | | | 08/25/2036 | | | | 1,047,560 | |
| | 1,470,660 | | | Series 2006-S4-A6 | | | 5.71% | # | | | 12/25/2036 | | | | 1,382,563 | |
| |
| | | | JP Morgan Mortgage Trust, | |
| | 409,449 | | | Series 2007-S3-1A7 | | | 6.00% | | | | 08/25/2037 | | | | 357,144 | |
| |
| | | | JP Morgan Resecuritization Trust, | |
| | 1,076,713 | | | Series 2011-2-2A3 | | | 3.50% | #^ | | | 07/26/2036 | | | | 1,077,572 | |
| |
| | | | Lehman Mortgage Trust, | |
| | 2,495,858 | | | Series 2005-1-2A4 | | | 5.50% | | | | 11/25/2035 | | | | 2,293,407 | |
| | 873,777 | | | Series 2006-3-1A5 | | | 6.00% | | | | 07/25/2036 | | | | 651,191 | |
| | 63,445 | | | Series 2006-9-1A19 | | | 28.69% | # I/F | | | 01/25/2037 | | | | 101,289 | |
| | 1,045,096 | | | Series 2007-10-2A1 | | | 6.50% | | | | 01/25/2038 | | | | 814,793 | |
| | 234,817 | | | Series 2007-2-1A1 | | | 5.75% | | | | 02/25/2037 | | | | 201,559 | |
| |
| | | | MASTR Alternative Loans Trust, | |
| | 138,270 | | | Series 2005-2-3A1 | | | 6.00% | | | | 03/25/2035 | | | | 132,638 | |
| | 63,225 | | | Series 2007-1-2A7 | | | 6.00% | | | | 10/25/2036 | | | | 45,619 | |
| |
| | | | MASTR Asset Securitization Trust, | |
| | 190,781 | | | Series 2003-2-30B2 | | | 5.75% | | | | 04/25/2033 | | | | 188,542 | |
| | 3,733,645 | | | Series 2006-2-1A11 | | | 6.00% | # | | | 06/25/2036 | | | | 3,583,861 | |
| |
| | | | Morgan Stanley Mortgage Loan Trust, | |
| | 192,346 | | | Series 2004-1-1A1 | | | 5.00% | | | | 11/25/2018 | | | | 197,138 | |
| | 1,634,946 | | | Series 2005-7-7A4 | | | 5.50% | | | | 11/25/2035 | | | | 1,651,214 | |
| | 4,488,338 | | | Series 2006-7-3A | | | 5.22% | # | | | 06/25/2036 | | | | 3,711,994 | |
| |
| | | | Morgan Stanley Re-Remic Trust, | |
| | 2,647,957 | | | Series 2010-R6-5C | | | 5.75% | #^ | | | 05/26/2037 | | | | 2,427,485 | |
| |
| | | | Nomura Asset Acceptance Corporation, | |
| | 259,047 | | | Series 2006-AP1-A2 | | | 5.52% | # | | | 01/25/2036 | | | | 140,793 | |
| |
| | | | Nomura Home Equity Loan, Inc., | |
| | 681,192 | | | Series 2006-AF1-A2 | | | 5.80% | # | | | 10/25/2036 | | | | 334,862 | |
| | 1,219,483 | | | Series 2007-1-1A1 | | | 6.06% | # | | | 02/25/2037 | | | | 579,027 | |
| |
| | | | Option One Mortgage Loan Trust, | |
| | 77,684 | | | Series 2004-3-M3 | | | 1.41% | # | | | 11/25/2034 | | | | 69,473 | |
| |
| | | | PHH Alternative Mortgage Trust, | |
| | 661,248 | | | Series 2007-2-4A1 | | | 6.00% | | | | 05/25/2022 | | | | 588,706 | |
| |
| | | | PR Mortgage Loan Trust, | |
| | 12,779,682 | | | Series 2014-1-APT | | | 5.92% | # | | | 10/25/2049 | | | | 13,139,970 | |
| |
| | | | Residential Accredit Loans, Inc., | |
| | 330,624 | | | Series 2004-QS15-A1 | | | 5.25% | | | | 11/25/2034 | | | | 338,639 | |
| | 553,556 | | | Series 2005-QS14-3A3 | | | 6.00% | | | | 09/25/2035 | | | | 501,010 | |
| | 109,881 | | | Series 2005-QS1-A5 | | | 5.50% | | | | 01/25/2035 | | | | 109,915 | |
| | 621,110 | | | Series 2006-QS10-A4 | | | 5.75% | | | | 08/25/2036 | | | | 495,188 | |
| | 6,777,545 | | | Series 2006-QS10-A9 | | | 6.50% | | | | 08/25/2036 | | | | 5,674,429 | |
| | 6,804,627 | | | Series 2006-QS4-A10 | | | 6.00% | | | | 04/25/2036 | | | | 5,630,817 | |
| | 1,378,259 | | | Series 2006-QS6-1A15 | | | 6.00% | | | | 06/25/2036 | | | | 1,124,037 | |
| | | | | | | | | | | | | | | | |
PRINCIPAL
AMOUNT $ | | | SECURITY DESCRIPTION | | RATE | | | MATURITY | | | VALUE $ | |
| |
| | | | Residential Accredit Loans, Inc., (Cont.) | |
| | 333,656 | | | Series 2006-QS6-2A1 | | | 6.00% | | | | 06/25/2021 | | | | 326,248 | |
| | 2,073,151 | | | Series 2007-QS3-A4 | | | 6.25% | | | | 02/25/2037 | | | | 1,654,809 | |
| | 7,297,920 | | | Series 2007-QS9-A33 | | | 6.50% | | | | 07/25/2037 | | | | 6,190,402 | |
| |
| | | | Residential Asset Mortgage Products, Inc., | |
| | 494,732 | | | Series 2005-RS1-AI5 | | | 5.41% | # | | | 01/25/2035 | | | | 498,030 | |
| |
| | | | Residential Asset Securitization Trust, | |
| | 264,880 | | | Series 2005-A10-A3 | | | 5.50% | | | | 09/25/2035 | | | | 226,777 | |
| | 365,020 | | | Series 2005-A11-2A4 | | | 6.00% | | | | 10/25/2035 | | | | 290,837 | |
| | 84,417 | | | Series 2005-A7-A3 | | | 5.50% | | | | 06/25/2035 | | | | 73,628 | |
| | 2,005,244 | | | Series 2006-A6-1A1 | | | 6.50% | | | | 07/25/2036 | | | | 1,116,378 | |
| | 191,568 | | | Series 2006-R1-A1 | | | 26.67 | %# I/F | | | 01/25/2046 | | | | 360,357 | |
| |
| | | | Residential Funding Mortgage Securities Trust, | |
| | 177,370 | | | Series 2006-S10-1A2 | | | 6.00% | | | | 10/25/2036 | | | | 158,220 | |
| | 897,066 | | | Series 2006-S11-A3 | | | 6.00% | | | | 11/25/2036 | | | | 837,636 | |
| | 1,728,693 | | | Series 2007-S2-A4 | | | 6.00% | | | | 02/25/2037 | | | | 1,575,036 | |
| | 1,194,206 | | | Series 2007-S3-1A4 | | | 6.00% | | | | 03/25/2037 | | | | 1,080,269 | |
| |
| | | | Securitized Mortgage Asset Loan Trust, | |
| | 50,175,745 | | | Series 2015-1-PC | | | 4.02% | #^¥ | | | 02/25/2054 | | | | 37,199,534 | |
| | 9,500,434 | | | Series 2015-2-PC | | | 3.57% | ^¥ | | | 12/26/2059 | | | | 8,395,532 | |
| | 15,570,154 | | | Series 2015-3-PC | | | 3.59% | ^¥ | | | 10/25/2044 | | | | 14,566,745 | |
| |
| | | | Structured Asset Securities Corporation, | |
| | 1,283,568 | | | Series 2003-35-1A1 | | | 5.23% | # | | | 12/25/2033 | | | | 1,320,219 | |
| | 1,961,631 | | | Series 2005-14-1A1 | | | 0.73% | # | | | 07/25/2035 | | | | 1,648,398 | |
| | 1,692,744 | | | Series 2005-16-1A3 | | | 5.50% | | | | 09/25/2035 | | | | 1,707,366 | |
| | 1,787,246 | | | Series 2005-RF1-A | | | 0.78% | #^ | | | 03/25/2035 | | | | 1,472,291 | |
| | 1,787,246 | | | Series 2005-RF1-AIO | | | 4.74% | #^ I/O | | | 03/25/2035 | | | | 337,261 | |
| |
| | | | Washington Mutual Mortgage Pass-Through Certificates, | |
| | 191,052 | | | Series 2005-1-2A | | | 6.00% | | | | 03/25/2035 | | | | 175,638 | |
| | 1,555,124 | | | Series 2006-1-3A1 | | | 5.75% | | | | 02/25/2036 | | | | 1,432,397 | |
| | 3,253,203 | | | Series 2006-2-4CB | | | 6.00% | | | | 03/25/2036 | | | | 2,844,537 | |
| | 5,534,394 | | | Series 2006-8-A6 | | | 4.66% | # | | | 10/25/2036 | | | | 3,299,961 | |
| | 4,489,295 | | | Series 2006-AR19-2A | | | 1.91% | # | | | 01/25/2047 | | | | 3,852,113 | |
| | 2,982,871 | | | Series 2007-3-A6 | | | 6.00% | | | | 04/25/2037 | | | | 2,516,711 | |
| | 200,604 | | | Series 2007-5-A11 | | | 36.88 | %# I/F | | | 06/25/2037 | | | | 494,344 | |
| | 13,485,796 | | | Series 2007-5-A3 | | | 7.00% | | | | 06/25/2037 | | | | 8,628,086 | |
| |
| | | | Wells Fargo Alternative Loan Trust, | |
| | 2,054,015 | | | Series 2007-PA5-1A1 | | | 6.25% | | | | 11/25/2037 | | | | 1,976,988 | |
| |
| | | | Wells Fargo Mortgage Backed Securities Trust, | |
| | 1,862,232 | | | Series 2005-17-1A1 | | | 5.50% | | | | 01/25/2036 | | | | 1,826,525 | |
| | 99,672 | | | Series 2005-AR14-A6 | | | 2.74% | # | | | 08/25/2035 | | | | 94,604 | |
| | 165,235 | | | Series 2005-AR16-6A4 | | | 2.76% | # | | | 10/25/2035 | | | | 158,537 | |
| | 749,598 | | | Series 2006-2-3A1 | | | 5.75% | | | | 03/25/2036 | | | | 763,084 | |
| | 1,681,579 | | | Series 2006-7-2A1 | | | 6.00% | | | | 06/25/2036 | | | | 1,623,056 | |
| | 1,619,123 | | | Series 2007-10-1A5 | | | 6.00% | | | | 07/25/2037 | | | | 1,619,609 | |
| | 1,967,612 | | | Series 2007-10-2A11 | | | 6.00% | | | | 07/25/2037 | | | | 1,886,035 | |
| | 2,782,756 | | | Series 2007-11-A96 | | | 6.00% | | | | 08/25/2037 | | | | 2,749,458 | |
| | 3,199,078 | | | Series 2007-14-1A1 | | | 6.00% | | | | 10/25/2037 | | | | 3,147,833 | |
| | 792,827 | | | Series 2007-4-A16 | | | 5.50% | | | | 04/25/2037 | | | | 767,841 | |
| | 194,359 | | | Series 2007-7-A1 | | | 6.00% | | | | 06/25/2037 | | | | 193,144 | |
| |
| | | | WinWater Mortgage Loan Trust, | |
| | 26,697,347 | | | Series 2015-5-A3 | | | 3.50% | #^ | | | 08/20/2045 | | | | 27,210,580 | |
| | | | | | | | | | | | | | | | |
| | | | Total Non-Agency Residential Collateralized Mortgage Obligations
(Cost $473,568,878) | | | | 467,054,215 | |
| | | | | | | | | | | | | | | | |
| | US CORPORATE BONDS 13.6% | |
| | 4,054,000 | | | 21st Century Fox America, Inc. | | | 4.75% | | | | 09/15/2044 | | | | 4,214,109 | |
| | 8,231,000 | | | AbbVie, Inc. | | | 4.70% | | | | 05/14/2045 | | | | 8,790,412 | |
| | 8,132,000 | | | Actavis Funding SCS | | | 2.35% | | | | 03/12/2018 | | | | 8,231,300 | |
| | 2,053,000 | | | Activision Blizzard, Inc. | | | 5.63% | ^ | | | 09/15/2021 | | | | 2,168,481 | |
| | 8,005,000 | | | Air Lease Corporation | | | 3.75% | | | | 02/01/2022 | | | | 7,984,291 | |
| | 2,351,000 | | | Air Medical Merger Sub Corporation | | | 6.38% | ^ | | | 05/15/2023 | | | | 2,215,817 | |
| | 1,635,000 | | | Alere, Inc. | | | 6.50% | | | | 06/15/2020 | | | | 1,674,240 | |
| | 6,937,000 | | | Ally Financial, Inc. | | | 4.13% | | | | 03/30/2020 | | | | 6,902,315 | |
| | | | | | |
| The accompanying notes are an integral part of these financial statements. | | Annual Report | | March 31, 2016 | | 43 |
| | |
| Schedule of Investments DoubleLine Core Fixed Income Fund (Cont.) | | March 31, 2016 |
| | | | | | | | | | | | | | | | |
PRINCIPAL
AMOUNT $ | | | SECURITY DESCRIPTION | | RATE | | | MATURITY | | | VALUE $ | |
| | 3,830,000 | | | Amazon.com, Inc. | | | 3.80% | | | | 12/05/2024 | | | | 4,194,367 | |
| | 2,080,000 | | | American Axle & Manufacturing, Inc. | | | 6.63% | | | | 10/15/2022 | | | | 2,168,400 | |
| | 2,645,000 | | | American Express Credit Corporation | | | 2.13% | | | | 03/18/2019 | | | | 2,677,732 | |
| | 13,755,000 | | | American Express Credit Corporation | | | 2.25% | | | | 08/15/2019 | | | | 13,936,030 | |
| | 3,845,000 | | | Anheuser-Busch InBev Finance, Inc. | | | 4.90% | | | | 02/01/2046 | | | | 4,306,627 | |
| | 7,471,000 | | | Apache Corporation | | | 4.75% | | | | 04/15/2043 | | | | 6,732,193 | |
| | 5,909,000 | | | Apple, Inc. | | | 4.65% | | | | 02/23/2046 | | | | 6,468,553 | |
| | 750,000 | | | Argos Merger Sub, Inc. | | | 7.13% | ^ | | | 03/15/2023 | | | | 796,875 | |
| | 884,000 | | | Asbury Automotive Group, Inc. | | | 6.00% | | | | 12/15/2024 | | | | 897,260 | |
| | 2,170,000 | | | Ashland, Inc. | | | 4.75% | | | | 08/15/2022 | | | | 2,213,400 | |
| | 8,820,000 | | | AT&T, Inc. | | | 3.40% | | | | 05/15/2025 | | | | 8,858,782 | |
| | 13,629,000 | | | Bank of America Corporation | | | 2.00% | | | | 01/11/2018 | | | | 13,692,511 | |
| | 8,155,000 | | | BB&T Corporation | | | 2.45% | | | | 01/15/2020 | | | | 8,303,690 | |
| | 9,949,000 | | | Berkshire Hathaway Energy Company | | | 6.50% | | | | 09/15/2037 | | | | 13,018,227 | |
| | 1,545,000 | | | Berry Plastics Corporation | | | 5.50% | | | | 05/15/2022 | | | | 1,589,419 | |
| | 5,043,000 | | | Boeing Company | | | 6.88% | | | | 03/15/2039 | | | | 7,374,702 | |
| | 8,292,000 | | | Boston Properties LP | | | 4.13% | | | | 05/15/2021 | | | | 8,899,936 | |
| | 8,049,000 | | | Burlington Northern Santa Fe LLC | | | 4.55% | | | | 09/01/2044 | | | | 8,745,907 | |
| | 6,988,000 | | | Cardinal Health, Inc. | | | 1.95% | | | | 06/15/2018 | | | | 7,025,330 | |
| | 2,817,000 | | | CCO Holdings LLC | | | 5.25% | | | | 09/30/2022 | | | | 2,908,552 | |
| | 535,000 | | | CCO Holdings LLC | | | 5.13% | ^ | | | 05/01/2023 | | | | 545,700 | |
| | 340,000 | | | CDW LLC | | | 6.00% | | | | 08/15/2022 | | | | 360,611 | |
| | 4,055,000 | | | Celgene Corporation | | | 3.88% | | | | 08/15/2025 | | | | 4,271,602 | |
| | 2,800,000 | | | Centene Escrow Corporation | | | 5.63% | ^ | | | 02/15/2021 | | | | 2,926,000 | |
| | 3,270,000 | | | Cequel Communications LLC | | | 6.38% | ^ | | | 09/15/2020 | | | | 3,253,650 | |
| | 4,910,000 | | | Chevron Corporation | | | 1.37% | | | | 03/02/2018 | | | | 4,929,444 | |
| | 2,641,000 | | | Chevron Corporation | | | 1.79% | | | | 11/16/2018 | | | | 2,674,316 | |
| | 8,355,000 | | | Cisco Systems, Inc. | | | 1.65% | | | | 06/15/2018 | | | | 8,484,603 | |
| | 7,860,000 | | | Citigroup, Inc. | | | 2.65% | | | | 10/26/2020 | | | | 7,945,965 | |
| | 4,455,000 | | | Citigroup, Inc. | | | 2.70% | | | | 03/30/2021 | | | | 4,494,748 | |
| | 4,155,000 | | | Coca Cola Company | | | 1.88% | | | | 10/27/2020 | | | | 4,224,505 | |
| | 4,465,000 | | | Coca-Cola Company | | | 1.65% | | | | 11/01/2018 | | | | 4,550,540 | |
| | 2,875,000 | | | Comcast Corporation | | | 4.20% | | | | 08/15/2034 | | | | 3,045,513 | |
| | 5,455,000 | | | Comcast Corporation | | | 4.40% | | | | 08/15/2035 | | | | 5,922,957 | |
| | 2,298,000 | | | CommScope, Inc. | | | 5.00% | ^ | | | 06/15/2021 | | | | 2,323,852 | |
| | 4,080,000 | | | Covidien International Finance S.A. | | | 2.95% | | | | 06/15/2023 | | | | 4,213,273 | |
| | 890,000 | | | CSC Holdings LLC | | | 5.25% | | | | 06/01/2024 | | | | 795,437 | |
| | 1,190,000 | | | Dana Holding Corporation | | | 5.50% | | | | 12/15/2024 | | | | 1,127,525 | |
| | 6,399,000 | | | Delphi Corporation | | | 4.15% | | | | 03/15/2024 | | | | 6,592,902 | |
| | 2,119,000 | | | Delphi Corporation | | | 4.25% | | | | 01/15/2026 | | | | 2,217,173 | |
| | 565,000 | | | Dollar Tree, Inc. | | | 5.75% | ^ | | | 03/01/2023 | | | | 601,372 | |
| | 8,955,000 | | | Duke Energy Progress, Inc. | | | 4.15% | | | | 12/01/2044 | | | | 9,430,869 | |
| | 6,260,000 | | | Eli Lilly & Company | | | 3.70% | | | | 03/01/2045 | | | | 6,389,244 | |
| | 2,625,000 | | | Energy Gulf Coast, Inc. | | | 9.25% | W | | | 12/15/2017 | | | | 100,078 | |
| | 427,000 | | | Energy Gulf Coast, Inc. | | | 11.00% | ^W | | | 03/15/2020 | | | | 61,915 | |
| | 720,000 | | | Energy Gulf Coast, Inc. | | | 7.50% | W | | | 12/15/2021 | | | | 27,000 | |
| | 1,355,000 | | | Energy Partners Ltd. | | | 8.25% | W | | | 02/15/2018 | | | | 68,597 | |
| | 1,715,000 | | | Energy Transfer Partners LP | | | 5.20% | | | | 02/01/2022 | | | | 1,630,198 | |
| | 7,410,000 | | | Energy Transfer Partners LP | | | 4.75% | | | | 01/15/2026 | | | | 6,809,634 | |
| | 2,955,000 | | | Ensemble S Merger Sub, Inc. | | | 9.00% | ^ | | | 09/30/2023 | | | | 2,906,981 | |
| | 5,673,000 | | | Enterprise Products Operating LLC | | | 3.70% | | | | 02/15/2026 | | | | 5,643,960 | |
| | 4,095,000 | | | EOG Resources, Inc. | | | 4.15% | | | | 01/15/2026 | | | | 4,254,590 | |
| | 1,225,000 | | | Equinix, Inc. | | | 5.88% | | | | 01/15/2026 | | | | 1,292,987 | |
| | 3,080,000 | | | ESH Hospitality, Inc. | | | 5.25% | ^ | | | 05/01/2025 | | | | 3,022,250 | |
| | 4,060,000 | | | Express Scripts Holding Company | | | 4.50% | | | | 02/25/2026 | | | | 4,224,641 | |
| | | | | | | | | | | | | | | | |
PRINCIPAL
AMOUNT $ | | | SECURITY DESCRIPTION | | RATE | | | MATURITY | | | VALUE $ | |
| | 8,060,000 | | | FedEx Corporation | | | 4.75% | | | | 11/15/2045 | | | | 8,567,014 | |
| | 6,335,000 | | | Fidelity National Information Services, Inc. | | | 3.63% | | | | 10/15/2020 | | | | 6,556,738 | |
| | 1,030,000 | | | First Data Corporation | | | 7.00% | ^ | | | 12/01/2023 | | | | 1,044,162 | |
| | 1,215,000 | | | First Data Corporation | | | 5.75% | ^ | | | 01/15/2024 | | | | 1,219,435 | |
| | 6,665,000 | | | Ford Motor Company | | | 7.45% | | | | 07/16/2031 | | | | 8,711,055 | |
| | 1,490,000 | | | Frontier Communications Corporation | | | 10.50% | ^ | | | 09/15/2022 | | | | 1,532,837 | |
| | 2,770,000 | | | Gannett Company, Inc. | | | 4.88% | ^ | | | 09/15/2021 | | | | 2,860,025 | |
| | 3,710,000 | | | Gates Global LLC | | | 6.00% | ^ | | | 07/15/2022 | | | | 3,190,600 | |
| | 12,665,000 | | | GE Capital International Funding Company | | | 0.96% | ^ | | | 04/15/2016 | | | | 12,665,747 | |
| | 4,045,000 | | | General Motors Financial Company, Inc. | | | 3.20% | | | | 07/13/2020 | | | | 4,041,537 | |
| | 6,300,000 | | | General Motors Financial Company, Inc. | | | 4.20% | | | | 03/01/2021 | | | | 6,516,997 | |
| | 16,252,000 | | | Georgia-Pacific LLC | | | 3.60% | ^ | | | 03/01/2025 | | | | 16,851,146 | |
| | 9,315,000 | | | Goldman Sachs Group, Inc. | | | 2.88% | | | | 02/25/2021 | | | | 9,493,746 | |
| | 2,300,000 | | | Goodyear Tire & Rubber Company | | | 5.13% | | | | 11/15/2023 | | | | 2,363,250 | |
| | 1,335,000 | | | Gray Television, Inc. | | | 7.50% | | | | 10/01/2020 | | | | 1,415,100 | |
| | 1,865,000 | | | HCA, Inc. | | | 5.38% | | | | 02/01/2025 | | | | 1,887,734 | |
| | 1,100,000 | | | HCA, Inc. | | | 5.88% | | | | 02/15/2026 | | | | 1,135,750 | |
| | 1,940,000 | | | HD Supply, Inc. | | | 7.50% | | | | 07/15/2020 | | | | 2,068,525 | |
| | 435,000 | | | HD Supply, Inc. | | | 5.75% | ^ | | | 04/15/2024 | | | | 448,050 | |
| | 6,295,000 | | | Hewlett Packard Company | | | 3.60% | ^ | | | 10/15/2020 | | | | 6,555,166 | |
| | 6,297,000 | | | HJ Heinz Company | | | 1.60% | ^ | | | 06/30/2017 | | | | 6,319,669 | |
| | 2,018,000 | | | HJ Heinz Company | | | 2.00% | ^ | | | 07/02/2018 | | | | 2,038,063 | |
| | 3,601,000 | | | Home Depot, Inc. | | | 3.35% | | | | 09/15/2025 | | | | 3,908,554 | |
| | 4,980,000 | | | Home Depot, Inc. | | | 3.00% | | | | 04/01/2026 | | | | 5,234,189 | |
| | 2,435,000 | | | Infor US, Inc. | | | 6.50% | | | | 05/15/2022 | | | | 2,228,025 | |
| | 10,000,000 | | | International Business Machines Corporation | | | 1.13% | | | | 02/06/2018 | | | | 10,022,470 | |
| | 2,680,000 | | | JBS LLC | | | 5.75% | ^ | | | 06/15/2025 | | | | 2,358,400 | |
| | 8,283,000 | | | JP Morgan Chase & Company | | | 2.55% | | | | 10/29/2020 | | | | 8,403,385 | |
| | 8,060,000 | | | JP Morgan Chase & Company | | | 4.25% | | | | 10/01/2027 | | | | 8,406,854 | |
| | 5,970,000 | | | Kinder Morgan Energy Partners LP | | | 6.95% | | | | 01/15/2038 | | | | 5,989,701 | |
| | 9,516,000 | | | Kroger Company | | | 3.40% | | | | 04/15/2022 | | | | 10,088,311 | |
| | 8,112,000 | | | Laboratory Corporation | | | 2.50% | | | | 11/01/2018 | | | | 8,187,206 | |
| | 8,450,000 | | | Laboratory Corporation | | | 4.70% | | | | 02/01/2045 | | | | 8,467,001 | |
| | 2,236,000 | | | Level 3 Communications, Inc. | | | 5.75% | | | | 12/01/2022 | | | | 2,314,260 | |
| | 1,440,000 | | | Levi Strauss & Company | | | 5.00% | | | | 05/01/2025 | | | | 1,461,600 | |
| | 10,599,000 | | | Liberty Mutual Group, Inc. | | | 6.50% | ^ | | | 05/01/2042 | | | | 12,413,761 | |
| | 7,835,000 | | | Lockheed Martin Corporation | | | 4.70% | | | | 05/15/2046 | | | | 8,799,857 | |
| | 4,530,000 | | | McGraw Hill Financial, Inc. | | | 4.40% | | | | 02/15/2026 | | | | 4,935,720 | |
| | 3,338,000 | | | Memorial Productions Partners LP | | | 6.88% | | | | 08/01/2022 | | | | 934,640 | |
| | 335,000 | | | Microsemi Corporation | | | 9.13% | ^ | | | 04/15/2023 | | | | 369,337 | |
| | 7,665,000 | | | Microsoft Corporation | | | 4.45% | | | | 11/03/2045 | | | | 8,495,296 | |
| | 2,480,000 | | | Milacron LLC | | | 7.75% | ^ | | | 02/15/2021 | | | | 2,294,000 | |
| | 8,225,000 | | | Morgan Stanley | | | 2.65% | | | | 01/27/2020 | | | | 8,357,126 | |
| | 9,035,000 | | | Morgan Stanley | | | 3.88% | | | | 01/27/2026 | | | | 9,447,728 | |
| | 1,675,000 | | | MPLX LP | | | 5.50% | ^ | | | 02/15/2023 | | | | 1,624,197 | |
| | | | | | |
| 44 | | DoubleLine Funds Trust | | | | The accompanying notes are an integral part of these financial statements. |
| | | | | | | | | | | | | | | | |
PRINCIPAL
AMOUNT $ | | | SECURITY DESCRIPTION | | RATE | | | MATURITY | | | VALUE $ | |
| | 8,269,000 | | | MUFG Americas Holdings Corporation | | | 1.63% | | | | 02/09/2018 | | | | 8,244,334 | |
| | 2,715,000 | | | National Rural Utilities Cooperative Finance Corporation | | | 10.38% | | | | 11/01/2018 | | | | 3,312,599 | |
| | 7,690,000 | | | National Rural Utilities Cooperative Finance Corporation | | | 2.00% | | | | 01/27/2020 | | | | 7,761,886 | |
| | 2,086,000 | | | NCL Corporation Ltd. | | | 5.25% | ^ | | | 11/15/2019 | | | | 2,148,580 | |
| | 1,965,000 | | | Newell Rubbermaid, Inc. | | | 3.15% | | | | 04/01/2021 | | | | 2,021,677 | |
| | 1,970,000 | | | Occidental Petroleum Corporation | | | 3.40% | | | | 04/15/2026 | | | | 1,987,829 | |
| | 4,915,000 | | | Omnicom Group, Inc. | | | 3.63% | | | | 05/01/2022 | | | | 5,169,297 | |
| | 3,285,000 | | | Omnicom Group, Inc. | | | 3.60% | | | | 04/15/2026 | | | | 3,373,373 | |
| | 1,400,000 | | | OPE KAG Finance Sub, Inc. | | | 7.88% | ^ | | | 07/31/2023 | | | | 1,403,500 | |
| | 8,612,000 | | | Oracle Corporation | | | 2.38% | | | | 01/15/2019 | | | | 8,932,711 | |
| | 8,322,000 | | | Oracle Corporation | | | 2.25% | | | | 10/08/2019 | | | | 8,592,681 | |
| | 8,205,000 | | | Oracle Corporation | | | 4.13% | | | | 05/15/2045 | | | | 8,406,671 | |
| | 2,782,000 | | | Phillips 66 | | | 5.88% | | | | 05/01/2042 | | | | 3,034,127 | |
| | 705,000 | | | Phillips 66 | | | 4.88% | | | | 11/15/2044 | | | | 709,175 | |
| | 770,000 | | | Pilgrim’s Pride Corporation | | | 5.75% | ^ | | | 03/15/2025 | | | | 776,738 | |
| | 2,203,000 | | | Plastipak Holdings, Inc. | | | 6.50% | ^ | | | 10/01/2021 | | | | 2,175,463 | |
| | 7,986,000 | | | PNC Funding Corporation | | | 3.30% | | | | 03/08/2022 | | | | 8,369,655 | |
| | 1,310,000 | | | Post Holdings, Inc. | | | 7.38% | | | | 02/15/2022 | | | | 1,390,238 | |
| | 1,560,000 | | | Quintiles Transnational Corporation | | | 4.88% | ^ | | | 05/15/2023 | | | | 1,602,323 | |
| | 1,210,000 | | | Regal Entertainment Group | | | 5.75% | | | | 03/15/2022 | | | | 1,258,400 | |
| | 2,524,000 | | | Revlon Consumer Products Corporation | | | 5.75% | | | | 02/15/2021 | | | | 2,606,030 | |
| | 3,095,000 | | | Reynolds Group Issuer LLC | | | 8.25% | | | | 02/15/2021 | | | | 3,178,256 | |
| | 7,985,000 | | | Reynolds, Inc. | | | 4.00% | | | | 06/12/2022 | | | | 8,694,012 | |
| | 1,405,000 | | | Rite Aid Corporation | | | 6.13% | ^ | | | 04/01/2023 | | | | 1,494,569 | |
| | 1,490,000 | | | Sabre GLBL, Inc. | | | 5.25% | ^ | | | 11/15/2023 | | | | 1,523,376 | |
| | 1,951,000 | | | Sally Holdings LLC | | | 5.75% | | | | 06/01/2022 | | | | 2,053,428 | |
| | 965,000 | | | Sanchez Energy Corporation | | | 6.13% | | | | 01/15/2023 | | | | 525,925 | |
| | 365,000 | | | Sandridge Energy, Inc. | | | 8.75% | ^W | | | 06/01/2020 | | | | 90,338 | |
| | 2,033,000 | | | SBA Communications Corporation | | | 5.63% | | | | 10/01/2019 | | | | 2,129,568 | |
| | 3,675,000 | | | Schlumberger Holdings Corporation | | | 2.35% | ^ | | | 12/21/2018 | | | | 3,701,159 | |
| | 2,350,000 | | | Scientific Games International, Inc. | | | 7.00% | ^ | | | 01/01/2022 | | | | 2,408,750 | |
| | 2,485,000 | | | Select Medical Corporation | | | 6.38% | | | | 06/01/2021 | | | | 2,360,750 | |
| | 2,027,000 | | | Service Corporation International | | | 5.38% | | | | 01/15/2022 | | | | 2,128,350 | |
| | 3,460,000 | | | Signode Industrial Group, Inc. | | | 6.38% | ^ | | | 05/01/2022 | | | | 3,161,575 | |
| | 8,715,000 | | | Simon Property Group LP | | | 3.30% | | | | 01/15/2026 | | | | 9,059,643 | |
| | 2,345,000 | | | Sinclair Television Group, Inc. | | | 5.63% | ^ | | | 08/01/2024 | | | | 2,368,450 | |
| | 1,090,000 | | | Solera Finance, Inc. | | | 10.50% | ^ | | | 03/01/2024 | | | | 1,098,175 | |
| | 13,261,000 | | | Southern Company | | | 2.45% | | | | 09/01/2018 | | | | 13,482,857 | |
| | 2,020,000 | | | Spectrum Brands, Inc. | | | 5.75% | | | | 07/15/2025 | | | | 2,156,350 | |
| | 5,865,000 | | | State Street Corporation | | | 3.55% | | | | 08/18/2025 | | | | 6,250,759 | |
| | 1,335,000 | | | Station Casinos LLC | | | 7.50% | | | | 03/01/2021 | | | | 1,415,100 | |
| | 8,764,000 | | | Synchrony Financial | | | 3.00% | | | | 08/15/2019 | | | | 8,911,717 | |
| | | | | | | | | | | | | | | | |
PRINCIPAL
AMOUNT $ | | | SECURITY DESCRIPTION | | RATE | | | MATURITY | | | VALUE $ | |
| | 1,185,000 | | | Team Health, Inc. | | | 7.25% | ^ | | | 12/15/2023 | | | | 1,270,913 | |
| | 2,440,000 | | | Tenet Healthcare Corporation | | | 6.75% | | | | 06/15/2023 | | | | 2,348,500 | |
| | 2,096,000 | | | Terex Corporation | | | 6.00% | | | | 05/15/2021 | | | | 2,038,360 | |
| | 13,055,000 | | | Thermo Fisher Scientific, Inc. | | | 3.30% | | | | 02/15/2022 | | | | 13,337,275 | |
| | 7,635,000 | | | TIAA Asset Management Finance Company LLC | | | 2.95% | ^ | | | 11/01/2019 | | | | 7,757,633 | |
| | 4,105,000 | | | Time Warner, Inc. | | | 3.60% | | | | 07/15/2025 | | | | 4,223,515 | |
| | 2,980,000 | | | TransDigm, Inc. | | | 6.00% | | | | 07/15/2022 | | | | 2,983,725 | |
| | 800,000 | | | Treehouse Foods, Inc. | | | 6.00% | ^ | | | 02/15/2024 | | | | 852,000 | |
| | 3,150,000 | | | Tribune Media Company | | | 5.88% | ^ | | | 07/15/2022 | | | | 3,079,125 | |
| | 15,310,000 | | | Tyson Foods, Inc. | | | 3.95% | | | | 08/15/2024 | | | | 16,356,209 | |
| | 3,325,000 | | | Ultra Petroleum Corporation | | | 5.75% | ^ | | | 12/15/2018 | | | | 249,375 | |
| | 16,965,000 | | | Verizon Communications, Inc. | | | 4.40% | | | | 11/01/2034 | | | | 17,207,939 | |
| | 1,600,000 | | | Viking Cruises Ltd. | | | 8.50% | ^ | | | 10/15/2022 | | | | 1,520,000 | |
| | 1,595,000 | | | Vizient, Inc. | | | 10.38% | ^ | | | 03/01/2024 | | | | 1,710,638 | |
| | 8,050,000 | | | Wal-Mart Stores, Inc. | | | 4.30% | | | | 04/22/2044 | | | | 9,027,061 | |
| | 6,340,000 | | | Waste Management, Inc. | | | 4.10% | | | | 03/01/2045 | | | | 6,392,964 | |
| | 1,615,000 | | | WCI Communities, Inc. | | | 6.88% | | | | 08/15/2021 | | | | 1,610,963 | |
| | 410,000 | | | WellPoint, Inc. | | | 1.88% | | | | 01/15/2018 | | | | 411,522 | |
| | 7,597,000 | | | WellPoint, Inc. | | | 2.30% | | | | 07/15/2018 | | | | 7,687,799 | |
| | 16,855,000 | | | Wells Fargo & Company | | | 3.55% | | | | 09/29/2025 | | | | 17,699,705 | |
| | 605,000 | | | Western Digital Corporation | | | 7.38% | ^ | | | 04/01/2023 | | | | 618,613 | |
| | 1,225,000 | | | WMG Acquisition Corporation | | | 6.75% | ^ | | | 04/15/2022 | | | | 1,218,875 | |
| | 6,440,000 | | | Xerox Corporation | | | 2.95% | | | | 03/15/2017 | | | | 6,480,508 | |
| | 6,429,000 | | | Zimmer Holdings, Inc. | | | 1.45% | | | | 04/01/2017 | | | | 6,428,736 | |
| | 2,074,000 | | | Zimmer Holdings, Inc. | | | 2.70% | | | | 04/01/2020 | | | | 2,105,790 | |
| | | | | | | | | | | | | | | | |
| | | | Total US Corporate Bonds
(Cost $815,401,637) | | | | 826,666,191 | |
| | | | | | | | | | | | | | | | |
| | US GOVERNMENT / AGENCY MORTGAGE BACKED OBLIGATIONS 17.0% | |
| |
| | | | Federal Home Loan Mortgage Corporation, | |
| | 1,291,152 | | | Pool G01840 | | | 5.00% | | | | 07/01/2035 | | | | 1,433,885 | |
| | 737,777 | | | Pool G04817 | | | 5.00% | | | | 09/01/2038 | | | | 810,555 | |
| | 20,953,952 | | | Pool G08537 | | | 3.00% | | | | 07/01/2043 | | | | 21,498,688 | |
| | 54,168,905 | | | Pool G08622 | | | 3.00% | | | | 01/01/2045 | | | | 55,543,681 | |
| | 13,910,395 | | | Pool G08686 | | | 3.00% | | | | 01/01/2046 | | | | 14,263,432 | |
| | 3,830,201 | | | Pool N70081 | | | 5.50% | | | | 07/01/2038 | | | | 4,236,538 | |
| | 10,455,360 | | | Pool Q33789 | | | 3.50% | | | | 06/01/2045 | | | | 11,011,650 | |
| | 5,456,907 | | | Pool T60854 | | | 3.50% | | | | 09/01/2042 | | | | 5,634,180 | |
| | 854,752 | | | Pool U60299 | | | 4.00% | | | | 11/01/2040 | | | | 916,940 | |
| | 98,183 | | | Series 2692-SC | | | 12.41% | # I/F | | | 07/15/2033 | | | | 115,142 | |
| | 3,635,995 | | | Series 2722-PS | | | 9.40% | # I/F | | | 12/15/2033 | | | | 4,140,416 | |
| | 192,103 | | | Series 2750-ZT | | | 5.00% | | | | 02/15/2034 | | | | 213,460 | |
| | 366,484 | | | Series 3002-SN | | | 6.06% | # I/F I/O | | | 07/15/2035 | | | | 63,864 | |
| | 161,273 | | | Series 3045-DI | | | 6.29% | # I/F I/O | | | 10/15/2035 | | | | 31,204 | |
| | 604,564 | | | Series 3116-Z | | | 5.50% | | | | 02/15/2036 | | | | 682,404 | |
| | 53,528 | | | Series 3117-ZN | | | 4.50% | | | | 02/15/2036 | | | | 57,321 | |
| | 743,424 | | | Series 3203-ZC | | | 5.00% | | | | 07/15/2036 | | | | 828,589 | |
| | 208,621 | | | Series 3275-SC | | | 5.64% | # I/F I/O | | | 02/15/2037 | | | | 33,481 | |
| | 1,253,110 | | | Series 3382-SB | | | 5.56% | # I/F I/O | | | 11/15/2037 | | | | 176,142 | |
| | 1,405,439 | | | Series 3384-S | | | 5.95% | # I/F I/O | | | 11/15/2037 | | | | 188,954 | |
| | 1,567,913 | | | Series 3417-SX | | | 5.74% | # I/F I/O | | | 02/15/2038 | | | | 177,732 | |
| | 163,778 | | | Series 3423-GS | | | 5.21% | # I/F I/O | | | 03/15/2038 | | | | 19,579 | |
| | 163,778 | | | Series 3423-SG | | | 5.21% | # I/F I/O | | | 03/15/2038 | | | | 18,512 | |
| | 262,462 | | | Series 3524-LB | | | 4.25% | # | | | 06/15/2038 | | | | 265,881 | |
| | 610,778 | | | Series 3562-WS | | | 4.51% | # I/F I/O | | | 08/15/2039 | | | | 68,901 | |
| | | | | | |
| The accompanying notes are an integral part of these financial statements. | | Annual Report | | March 31, 2016 | | 45 |
| | |
| Schedule of Investments DoubleLine Core Fixed Income Fund (Cont.) | | March 31, 2016 |
| | | | | | | | | | | | | | | | |
PRINCIPAL
AMOUNT $ | | | SECURITY DESCRIPTION | | RATE | | | MATURITY | | | VALUE $ | |
| |
| | | | Federal Home Loan Mortgage Corporation, (Cont.) | |
| | 466,572 | | | Series 3582-SA | | | 5.56% | # I/F I/O | | | 10/15/2049 | | | | 73,108 | |
| | 850,291 | | | Series 3606-CS | | | 5.91% | # I/F I/O | | | 12/15/2039 | | | | 169,641 | |
| | 455,442 | | | Series 3616-SG | | | 5.91% | # I/F I/O | | | 03/15/2032 | | | | 70,687 | |
| | 2,153,551 | | | Series 3626-AZ | | | 5.50% | | | | 08/15/2036 | | | | 2,390,765 | |
| | 805,054 | | | Series 3666-SC | | | 5.33% | # I/F I/O | | | 05/15/2040 | | | | 145,250 | |
| | 519,384 | | | Series 3666-VZ | | | 5.50% | | | | 08/15/2036 | | | | 581,224 | |
| | 2,539,160 | | | Series 3779-DZ | | | 4.50% | | | | 12/15/2040 | | | | 2,807,287 | |
| | 1,400,000 | | | Series 3779-YA | | | 3.50% | | | | 12/15/2030 | | | | 1,529,853 | |
| | 147,853 | | | Series 3780-YS | | | 9.03% | # I/F | | | 12/15/2040 | | | | 159,296 | |
| | 672,831 | | | Series 3786-SG | | | 8.63% | # I/F | | | 01/15/2041 | | | | 742,089 | |
| | 11,076,531 | | | Series 3792-SE | | | 8.99% | # I/F | | | 01/15/2041 | | | | 11,804,075 | |
| | 2,458,300 | | | Series 3795-VZ | | | 4.00% | | | | 01/15/2041 | | | | 2,707,455 | |
| | 80,404 | | | Series 3798-SD | | | 8.73% | # I/F | | | 12/15/2040 | | | | 87,468 | |
| | 1,860,769 | | | Series 3806-CZ | | | 5.50% | | | | 07/15/2034 | | | | 2,105,411 | |
| | 1,156,635 | | | Series 3808-DB | | | 3.50% | | | | 02/15/2031 | | | | 1,226,948 | |
| | 3,599,174 | | | Series 3818-CZ | | | 4.50% | | | | 03/15/2041 | | | | 3,984,287 | |
| | 2,348,152 | | | Series 3819-ZU | | | 5.50% | | | | 07/15/2034 | | | | 2,623,689 | |
| | 3,736,782 | | | Series 3824-EY | | | 3.50% | | | | 03/15/2031 | | | | 4,059,799 | |
| | 251,282 | | | Series 3828-SW | | | 11.89% | # I/F | | | 02/15/2041 | | | | 357,983 | |
| | 3,649,201 | | | Series 3863-ZA | | | 5.50% | | | | 08/15/2034 | | | | 4,060,336 | |
| | 3,614,554 | | | Series 3888-ZG | | | 4.00% | | | | 07/15/2041 | | | | 3,895,785 | |
| | 18,072,771 | | | Series 3889-VZ | | | 4.00% | | | | 07/15/2041 | | | | 19,408,063 | |
| | 2,732,085 | | | Series 3910-GZ | | | 5.00% | | | | 08/15/2041 | | | | 3,342,888 | |
| | 20,293,460 | | | Series 3967-ZP | | | 4.00% | | | | 09/15/2041 | | | | 22,213,164 | |
| | 5,800,658 | | | Series 3972-AZ | | | 3.50% | | | | 12/15/2041 | | | | 5,860,783 | |
| | 23,230,889 | | | Series 4057-ZA | | | 4.00% | | | | 06/15/2042 | | | | 25,791,152 | |
| | 8,468,041 | | | Series 4096-DZ | | | 3.50% | | | | 08/15/2042 | | | | 9,011,778 | |
| | 26,833,815 | | | Series 4165-ZT | | | 3.00% | | | | 02/15/2043 | | | | 25,560,188 | |
| | 10,786,537 | | | Series 4291-MS | | | 5.46% | # I/F I/O | | | 01/15/2054 | | | | 1,882,539 | |
| | 17,399,860 | | | Series 4341-AZ | | | 3.00% | | | | 05/15/2044 | | | | 16,690,349 | |
| | 23,601,415 | | | Series 4377-A | | | 3.00% | | | | 06/15/2039 | | | | 24,393,832 | |
| | 16,702,152 | | | Series 4391-MA | | | 3.00% | | | | 07/15/2040 | | | | 17,421,774 | |
| | 12,572,418 | | | Series 4413-AZ | | | 3.50% | | | | 11/15/2044 | | | | 13,494,380 | |
| | 10,072,873 | | | Series 4419-TB | | | 3.00% | | | | 02/15/2040 | | | | 10,270,732 | |
| | 10,446,546 | | | Series 4423-Z | | | 3.50% | | | | 12/15/2044 | | | | 10,843,517 | |
| | 23,435,135 | | | Series 4427-MA | | | 3.00% | | | | 02/15/2034 | | | | 24,502,552 | |
| | 33,263,855 | | | Series 4471-BA | | | 3.00% | | | | 12/15/2041 | | | | 34,691,886 | |
| | 45,796,425 | | | Series 4471-GA | | | 3.00% | | | | 02/15/2044 | | | | 47,329,987 | |
| | 28,695,451 | | | Series 4481-B | | | 3.00% | | | | 12/15/2042 | | | | 29,591,041 | |
| | 19,537,939 | | | Series 4511-QA | | | 3.00% | | | | 01/15/2041 | | | | 20,271,636 | |
| | 83,109,139 | | | Series 4542-AC | | | 2.70% | | | | 01/15/2045 | | | | 84,754,135 | |
| | 4,781,000 | | | Series K050-A2 | | | 3.33% | # | | | 08/25/2025 | | | | 5,176,235 | |
| | 6,528,000 | | | Series K053-A2 | | | 3.00% | | | | 12/25/2025 | | | | 6,875,153 | |
| | 802,810 | | | Series R003-ZA | | | 5.50% | | | | 10/15/2035 | | | | 914,070 | |
| |
| | | | Federal National Mortgage Association, | |
| | 77,813 | | | Series 2003-117-KS | | | 6.67% | # I/F I/O | | | 08/25/2033 | | | | 4,381 | |
| | 450,711 | | | Series 2003-W17-1A7 | | | 5.75% | | | | 08/25/2033 | | | | 515,269 | |
| | 4,067,289 | | | Series 2005-20-QH | | | 5.00% | | | | 03/25/2035 | | | | 4,525,068 | |
| | 685,820 | | | Series 2006-101-SA | | | 6.15% | # I/F I/O | | | 10/25/2036 | | | | 138,495 | |
| | 309,324 | | | Series 2006-56-SM | | | 6.32% | # I/F I/O | | | 07/25/2036 | | | | 58,703 | |
| | 262,420 | | | Series 2007-116-BI | | | 5.82% | # I/F I/O | | | 05/25/2037 | | | | 46,391 | |
| | 2,772,221 | | | Series 2007-30-FS | | | 27.82% | # I/F | | | 04/25/2037 | | | | 4,806,964 | |
| | 1,077,931 | | | Series 2007-30-OI | | | 6.01% | # I/F I/O | | | 04/25/2037 | | | | 226,075 | |
| | 206,423 | | | Series 2008-29-ZA | | | 4.50% | | | | 04/25/2038 | | | | 224,824 | |
| | 221,950 | | | Series 2008-62-SC | | | 5.57% | # I/F I/O | | | 07/25/2038 | | | | 32,461 | |
| | 1,386,240 | | | Series 2009-111-EZ | | | 5.00% | | | | 01/25/2040 | | | | 1,472,378 | |
| | 71,931 | | | Series 2009-111-SE | | | 5.82% | # I/F I/O | | | 01/25/2040 | | | | 9,441 | |
| | 137,195 | | | Series 2009-16-MZ | | | 5.00% | | | | 03/25/2029 | | | | 151,917 | |
| | 198,290 | | | Series 2009-48-WS | | | 5.52% | # I/F I/O | | | 07/25/2039 | | | | 22,695 | |
| | 997,085 | | | Series 2009-62-PS | | | 5.67% | # I/F I/O | | | 08/25/2039 | | | | 126,148 | |
| | 2,180,894 | | | Series 2009-77-ZA | | | 4.50% | | | | 10/25/2039 | | | | 2,373,334 | |
| | 529,405 | | | Series 2009-83-Z | | | 4.50% | | | | 10/25/2039 | | | | 559,851 | |
| | 251,969 | | | Series 2010-101-ZH | | | 4.50% | | | | 07/25/2040 | | | | 269,586 | |
| | 55,491 | | | Series 2010-109-BS | | | 50.18% | # I/F | | | 10/25/2040 | | | | 240,524 | |
| | 917,085 | | | Series 2010-112-ZA | | | 4.00% | | | | 10/25/2040 | | | | 952,931 | |
| | 484,851 | | | Series 2010-121-SD | | | 4.07% | # I/F I/O | | | 10/25/2040 | | | | 53,038 | |
| | 29,336 | | | Series 2010-137-VS | | | 13.68% | # I/F | | | 12/25/2040 | | | | 47,032 | |
| | 2,466,495 | | | Series 2010-150-ZA | | | 4.00% | | | | 01/25/2041 | | | | 2,628,094 | |
| | 152,182 | | | Series 2010-31-SA | | | 4.57% | # I/F I/O | | | 04/25/2040 | | | | 13,511 | |
| | 182,162 | | | Series 2010-34-PS | | | 4.50% | # I/F I/O | | | 04/25/2040 | | | | 16,388 | |
| | 320,138 | | | Series 2010-35-SP | | | 5.92% | # I/F I/O | | | 04/25/2050 | | | | 52,967 | |
| | 130,305 | | | Series 2010-35-SV | | | 6.02% | # I/F I/O | | | 04/25/2040 | | | | 16,414 | |
| | 4,476,024 | | | Series 2010-37-MY | | | 4.50% | | | | 04/25/2040 | | | | 4,858,287 | |
| | | | | | | | | | | | | | | | |
PRINCIPAL
AMOUNT $ | | | SECURITY DESCRIPTION | | RATE | | | MATURITY | | | VALUE $ | |
| |
| | | | Federal National Mortgage Association, (Cont.) | |
| | 362,057 | | | Series 2010-59-PS | | | 6.02% | # I/F I/O | | | 03/25/2039 | | | | 37,726 | |
| | 444,689 | | | Series 2010-59-SC | | | 4.57% | # I/F I/O | | | 01/25/2040 | | | | 49,789 | |
| | 2,246,220 | | | Series 2010-60-VZ | | | 5.00% | | | | 10/25/2039 | | | | 2,407,589 | |
| | 401,354 | | | Series 2010-64-EZ | | | 5.00% | | | | 06/25/2040 | | | | 449,665 | |
| | 923,302 | | | Series 2010-7-PE | | | 5.00% | | | | 02/25/2040 | | | | 997,860 | |
| | 490,756 | | | Series 2010-90-GS | | | 5.57% | # I/F I/O | | | 08/25/2040 | | | | 64,517 | |
| | 57,791 | | | Series 2010-99-SG | | | 22.81% | # I/F | | | 09/25/2040 | | | | 106,213 | |
| | 7,220,116 | | | Series 2011-141-PZ | | | 4.00% | | | | 01/25/2042 | | | | 7,514,067 | |
| | 15,435,839 | | | Series 2011-18-UZ | | | 4.00% | | | | 03/25/2041 | | | | 16,159,974 | |
| | 1,533,918 | | | Series 2011-25-KY | | | 3.00% | | | | 04/25/2026 | | | | 1,609,447 | |
| | 1,000,000 | | | Series 2011-29-AL | | | 3.50% | | | | 04/25/2031 | | | | 1,073,586 | |
| | 2,369,686 | | | Series 2011-59-MA | | | 4.50% | | | | 07/25/2041 | | | | 2,574,606 | |
| | 4,214,407 | | | Series 2011-63-ZE | | | 4.00% | | | | 08/25/2038 | | | | 4,268,406 | |
| | 23,408,291 | | | Series 2013-45-LZ | | | 3.00% | | | | 05/25/2043 | | | | 23,077,628 | |
| | 30,057,731 | | | Series 2013-6-ZB | | | 3.00% | | | | 02/25/2043 | | | | 29,588,935 | |
| | 16,138,495 | | | Series 2014-55-MA | | | 3.00% | | | | 10/25/2039 | | | | 16,860,188 | |
| | 24,083,896 | | | Series 2014-70-VZ | | | 3.00% | | | | 11/25/2044 | | | | 23,243,454 | |
| | 8,061,771 | | | Series 2014-73-CZ | | | 3.00% | | | | 11/25/2044 | | | | 7,755,813 | |
| | 41,516,229 | | | Series 2015-09-HA | | | 3.00% | | | | 01/25/2045 | | | | 43,404,229 | |
| | 6,348,000 | | | Series 2016-M3-A2 | | | 2.70% | # | | | 02/25/2026 | | | | 6,435,823 | |
| | 598,947 | | | Series 400-S4 | | | 5.02% | # I/F I/O | | | 11/25/2039 | | | | 85,557 | |
| |
| | | | Federal National Mortgage Association Pass-Thru, | |
| | 253,530 | | | Pool 555743 | | | 5.00% | | | | 09/01/2033 | | | | 282,010 | |
| | 216,999 | | | Pool 735382 | | | 5.00% | | | | 04/01/2035 | | | | 240,938 | |
| | 1,658,773 | | | Pool 735383 | | | 5.00% | | | | 04/01/2035 | | | | 1,841,359 | |
| | 888,555 | | | Pool 735402 | | | 5.00% | | | | 04/01/2035 | | | | 986,414 | |
| | 1,276,951 | | | Pool 735484 | | | 5.00% | | | | 05/01/2035 | | | | 1,417,143 | |
| | 242,729 | | | Pool 931104 | | | 5.00% | | | | 05/01/2039 | | | | 268,537 | |
| | 1,528,136 | | | Pool 995112 | | | 5.50% | | | | 07/01/2036 | | | | 1,731,751 | |
| | 1,460,330 | | | Pool 995203 | | | 5.00% | | | | 07/01/2035 | | | | 1,623,835 | |
| | 1,318,634 | | | Pool AB2123 | | | 4.00% | | | | 01/01/2031 | | | | 1,421,573 | |
| | 131,489 | | | Pool AB2370 | | | 4.50% | | | | 09/01/2035 | | | | 138,130 | |
| | 18,231,962 | | | Pool AB6854 | | | 3.00% | | | | 11/01/2042 | | | | 18,756,419 | |
| | 45,201 | | | Pool AC1032 | | | 5.00% | | | | 06/01/2040 | | | | 47,935 | |
| | 36,128 | | | Pool AD2177 | | | 4.50% | | | | 06/01/2030 | | | | 39,542 | |
| | 1,854,271 | | | Pool AH7309 | | | 4.00% | | | | 02/01/2031 | | | | 1,998,838 | |
| | 38,173,897 | | | Pool AS4645 | | | 3.00% | | | | 03/01/2045 | | | | 39,213,044 | |
| | 1,042,237 | | | Pool MA0264 | | | 4.50% | | | | 12/01/2029 | | | | 1,133,731 | |
| | 89,940 | | | Pool MA0282 | | | 5.00% | | | | 12/01/2039 | | | | 99,998 | |
| | 764,488 | | | Pool MA0353 | | | 4.50% | | | | 03/01/2030 | | | | 831,600 | |
| | 42,665 | | | Pool MA0468 | | | 5.00% | | | | 07/01/2040 | | | | 45,262 | |
| | 28,146,529 | | | Pool MA2151 | | | 3.50% | | | | 01/01/2045 | | | | 29,078,426 | |
| | 14,124,310 | | | Pool MA2248 | | | 3.00% | | | | 04/01/2045 | | | | 14,309,261 | |
| |
| | | | Government National Mortgage Association, | |
| | 728,879 | | | Pool 752494 | | | 5.50% | | | | 09/20/2039 | | | | 803,954 | |
| | 271,875 | | | Series 2003-67-SP | | | 6.67% | # I/F I/O | | | 08/20/2033 | | | | 80,581 | |
| | 268,104 | | | Series 2008-82-SM | | | 5.62% | # I/F I/O | | | 09/20/2038 | | | | 47,764 | |
| | 3,572,907 | | | Series 2009-32-ZE | | | 4.50% | | | | 05/16/2039 | | | | 3,893,968 | |
| | 4,096,477 | | | Series 2009-35-DZ | | | 4.50% | | | | 05/20/2039 | | | | 4,482,586 | |
| | 4,356,477 | | | Series 2009-75-GZ | | | 4.50% | | | | 09/20/2039 | | | | 4,724,853 | |
| | 5,339,495 | | | Series 2009-75-HZ | | | 5.00% | | | | 09/20/2039 | | | | 5,913,877 | |
| | 13,344,814 | | | Series 2010-113-SM | | | 5.62% | # I/F I/O | | | 09/20/2040 | | | | 2,136,989 | |
| | 116,566 | | | Series 2010-25-ZB | | | 4.50% | | | | 02/16/2040 | | | | 130,720 | |
| | 7,510,775 | | | Series 2011-45-GZ | | | 4.50% | | | | 03/20/2041 | | | | 8,113,204 | |
| | 8,390,271 | | | Series 2011-70-WS | | | 8.84% | # I/F | | | 12/20/2040 | | | | 9,796,812 | |
| | 12,424,599 | | | Series 2011-71-ZA | | | 4.50% | | | | 02/20/2041 | | | | 13,641,228 | |
| | 27,665,798 | | | Series 2013-117-MS | | | 5.72% | # I/F I/O | | | 02/20/2043 | | | | 3,815,133 | |
| | 12,102,598 | | | Series 2013-122-SB | | | 5.66% | # I/F I/O | | | 08/16/2043 | | | | 2,005,657 | |
| | 56,874,877 | | | Series 2013-169-SE | | | 5.61% | # I/F I/O | | | 11/16/2043 | | | | 8,910,268 | |
| | 18,982,693 | | | Series 2014-102-TS | | | 5.17% | # I/F I/O | | | 07/20/2044 | | | | 2,553,218 | |
| | 15,706,064 | | | Series 2014-118-PS | | | 5.77% | # I/F I/O | | | 08/20/2044 | | | | 2,378,479 | |
| | 13,742,807 | | | Series 2014-118-SA | | | 5.77% | # I/F I/O | | | 08/20/2044 | | | | 2,146,097 | |
| | | | | | | | | | | | | | | | |
| | | | Total US Government / Agency Mortgage Backed Obligations
(Cost $990,298,793) | | | | 1,031,594,774 | |
| | | | | | | | | | | | | | | | |
| | US GOVERNMENT BONDS AND NOTES 25.3% | |
| | 153,400,000 | | | United States Treasury Bonds | | | 2.75% | | | | 11/15/2042 | | | | 158,238,696 | |
| | 92,900,000 | | | United States Treasury Bonds | | | 3.00% | | | | 11/15/2044 | | | | 100,295,676 | |
| | | | | | |
| 46 | | DoubleLine Funds Trust | | | | The accompanying notes are an integral part of these financial statements. |
| | | | | | | | | | | | | | | | |
PRINCIPAL
AMOUNT $ /
SHARES | | | SECURITY DESCRIPTION | | RATE | | | MATURITY | | | VALUE $ | |
| | 205,300,000 | | | United States Treasury Notes | | | 0.50% | | | | 06/30/2016 | | | | 205,403,882 | |
| | 167,500,000 | | | United States Treasury Notes | | | 0.50% | | | | 03/31/2017 | | | | 167,329,820 | |
| | 21,300,000 | | | United States Treasury Notes | | | 1.00% | | | | 05/15/2018 | | | | 21,406,074 | |
| | 73,606,624 | | | United States Treasury Notes | | | 0.13% | | | | 04/15/2019 | | | | 75,228,767 | |
| | 6,250,000 | | | United States Treasury Notes | | | 1.00% | | | | 11/30/2019 | | | | 6,250,000 | |
| | 175,100,000 | | | United States Treasury Notes | | | 2.00% | | | | 11/30/2020 | | | | 181,485,021 | |
| | 141,100,000 | | | United States Treasury Notes | | | 2.25% | | | | 03/31/2021 | | | | 148,019,967 | |
| | 8,200,000 | | | United States Treasury Notes | | | 1.88% | | | | 11/30/2021 | | | | 8,425,664 | |
| | 72,300,000 | | | United States Treasury Notes | | | 1.75% | | | | 03/31/2022 | | | | 73,623,162 | |
| | 123,700,000 | | | United States Treasury Notes | | | 2.50% | | | | 05/15/2024 | | | | 131,609,997 | |
| | 5,400,000 | | | United States Treasury Notes | | | 2.38% | | | | 08/15/2024 | | | | 5,690,358 | |
| | 120,200,000 | | | United States Treasury Notes | | | 2.25% | | | | 11/15/2024 | | | | 125,395,405 | |
| | 124,700,000 | | | United States Treasury Notes | | | 2.00% | | | | 02/15/2025 | | | | 127,449,760 | |
| | | | | | | | | | | | | | | | |
| | | | Total US Government Bonds and Notes
(Cost $1,503,595,343) | | | | 1,535,852,249 | |
| | | | | | | | | | | | | | | | |
| | AFFILIATED MUTUAL FUNDS 2.2% | |
| | 8,165,507 | | | DoubleLine Global Bond Fund (Class I) | | | | | | | | | | | 85,656,164 | |
| | 5,000,000 | | | DoubleLine Long Duration Total Return Bond Fund (Class I) | | | | | | | | | | | 52,000,000 | |
| | | | | | | | | | | | | | | | |
| | | | Total Affiliated Mutual Funds
(Cost $131,500,000) | | | | 137,656,164 | |
| | | | | | | | | | | | | | | | |
| | SHORT TERM INVESTMENTS 5.1% | |
| | 102,833,999 | | | BlackRock Liquidity Funds FedFund - Institutional Shares | | | 0.24% | ¨ | | | | | | | 102,833,999 | |
| | 102,833,999 | | | Fidelity Institutional Money Market Government Portfolio - Class I | | | 0.23% | ¨ | | | | | | | 102,833,999 | |
| | 102,833,999 | | | Morgan Stanley Institutional Liquidity Funds Government Portfolio - Institutional Share Class | | | 0.25% | ¨ | | | | | | | 102,833,999 | |
| | | | | | | | | | | | | | | | |
| | | | Total Short Term Investments
(Cost $308,501,997) | | | | 308,501,997 | |
| | | | | | | | | | | | | | | | |
| | | | Total Investments 97.4%
(Cost $5,904,441,016) | | | | 5,912,377,652 | |
| | | | | | | | | | | | | | | | |
| | | | Other Assets in Excess of Liabilities 2.6% | | | | 154,877,560 | |
| | | | | | | | | | | | | | | | |
| | | | NET ASSETS 100.0% | | | | | | | $ | 6,067,255,212 | |
| | | | | | | | | | | | | | | | |
| | | | |
| SECURITY TYPE BREAKDOWN as a % of Net Assets: | | | | |
US Government Bonds and Notes | | | 25.3% | |
US Government / Agency Mortgage Backed Obligations | | | 17.0% | |
US Corporate Bonds | | | 13.6% | |
Foreign Corporate Bonds | | | 11.9% | |
Non-Agency Residential Collateralized Mortgage Obligations | | | 7.7% | |
Non-Agency Commercial Mortgage Backed Obligations | | | 6.6% | |
Short Term Investments | | | 5.1% | |
Collateralized Loan Obligations | | | 3.6% | |
Bank Loans | | | 2.5% | |
Affiliated Mutual Funds | | | 2.2% | |
Asset Backed Obligations | | | 1.2% | |
Foreign Government Bonds and Notes, Supranationals and Foreign Agencies | | | 0.5% | |
Municipal Bonds | | | 0.2% | |
Other Assets and Liabilities | | | 2.6% | |
| | | | |
| | | 100.0% | |
| | | | |
| | | | |
| COUNTRY BREAKDOWN as a % of Net Assets: | | | | |
United States | | | 84.9% | |
Mexico | | | 1.8% | |
Colombia | | | 1.4% | |
Peru | | | 1.4% | |
Chile | | | 1.4% | |
Brazil | | | 0.6% | |
United Kingdom | | | 0.6% | |
India | | | 0.6% | |
Singapore | | | 0.6% | |
Panama | | | 0.5% | |
Guatemala | | | 0.5% | |
Israel | | | 0.4% | |
China | | | 0.4% | |
Canada | | | 0.4% | |
Australia | | | 0.3% | |
Paraguay | | | 0.3% | |
Trinidad and Tobago | | | 0.2% | |
Jamaica | | | 0.2% | |
Costa Rica | | | 0.2% | |
Indonesia | | | 0.2% | |
Hong Kong | | | 0.2% | |
France | | | 0.1% | |
Japan | | | 0.1% | |
Luxembourg | | | 0.1% | |
Dominican Republic | | | 0.0% | ~ |
Netherlands | | | 0.0% | ~ |
El Salvador | | | 0.0% | ~ |
Germany | | | 0.0% | ~ |
Qatar | | | 0.0% | ~ |
Other Assets and Liabilities | | | 2.6% | |
| | | | |
| | | 100.0% | |
| | | | |
| | | | | | |
| The accompanying notes are an integral part of these financial statements. | | Annual Report | | March 31, 2016 | | 47 |
| | |
| Schedule of Investments DoubleLine Core Fixed Income Fund (Cont.) | | March 31, 2016 |
| | | | |
| INVESTMENT BREAKDOWN as a % of Net Assets: | | | | |
US Government Bonds and Notes | | | 25.3% | |
US Government / Agency Mortgage Backed Obligations | | | 17.0% | |
Non-Agency Residential Collateralized Mortgage Obligations | | | 7.7% | |
Non-Agency Commercial Mortgage Backed Obligations | | | 6.6% | |
Banking | | | 5.3% | |
Short Term Investments | | | 5.1% | |
Collateralized Loan Obligations | | | 3.6% | |
Oil & Gas | | | 2.3% | |
Affiliated Mutual Funds | | | 2.2% | |
Telecommunications | | | 1.7% | |
Transportation | | | 1.5% | |
Technology | | | 1.5% | |
Utilities | | | 1.4% | |
Media | | | 1.4% | |
Healthcare | | | 1.3% | |
Asset Backed Obligations | | | 1.2% | |
Electronics/Electric | | | 1.0% | |
Finance | | | 1.0% | |
Retailers (other than Food/Drug) | | | 0.9% | |
Mining | | | 0.7% | |
Consumer Products | | | 0.7% | |
Business Equipment and Services | | | 0.6% | |
Food Products | | | 0.6% | |
Financial Intermediaries | | | 0.5% | |
Automotive | | | 0.5% | |
| | | | |
Foreign Government Bonds and Notes, Supranationals and Foreign Agencies | | | 0.5% | |
Chemicals/Plastics | | | 0.5% | |
Pharmaceuticals | | | 0.5% | |
Real Estate | | | 0.5% | |
Containers and Glass Products | | | 0.4% | |
Aerospace & Defense | | | 0.4% | |
Beverage and Tobacco | | | 0.4% | |
Building and Development (including Steel/Metals) | | | 0.3% | |
Insurance | | | 0.3% | |
Pulp & Paper | | | 0.3% | |
Leisure | | | 0.3% | |
Industrial Equipment | | | 0.2% | |
Food/Drug Retailers | | | 0.2% | |
Energy | | | 0.2% | |
Hotels/Motels/Inns and Casinos | | | 0.2% | |
Municipal Bonds | | | 0.2% | |
Conglomerates | | | 0.2% | |
Environmental Control | | | 0.1% | |
Health Care Providers & Services | | | 0.1% | |
Cosmetics/Toiletries | | | 0.0% | ~ |
Computers & Electronics | | | 0.0% | ~ |
Construction | | | 0.0% | ~ |
Other Assets and Liabilities | | | 2.6% | |
| | | | |
| | | 100.0% | |
| | | | |
| ^ | Security exempt from registration under Rule 144A of the Securities Act of 1933. These securities may be resold in transactions exempt from registration to qualified institutional buyers. These securities are determined to be liquid by the Adviser, unless otherwise noted, under procedures established by the Fund’s Board of Trustees. At March 31, 2016, the value of these securities amounted to $843,996,326 or 13.9% of net assets. |
| # | Variable rate security. Rate disclosed as of March 31, 2016. |
| W | Security is in default or has failed to make a scheduled payment. Income is not being accrued. |
| I/O | Interest only security |
| I/F | Inverse floating rate security whose interest rate moves in the opposite direction of reference interest rates |
| ¥ | Illiquid security. At March 31, 2016, the value of these securities amounted to $60,161,811 or 1.0% of net assets. |
| ¨ | Seven-day yield as of March 31, 2016 |
| ~ | Represents less than 0.05% of net assets |
A summary of the DoubleLine Core Fixed Income Fund’s investments in affiliated mutual funds for the year ended March 31, 2016 is as follows:
| | | | | | | | | | | | | | | | | | | | | | | | | | | | |
| Fund | | Value at
March 31,
2015 | | | Gross
Purchases | | | Gross
Sales | | | Shares
Held at
March 31,
2016 | | | Value at
March 31,
2016 | | | Dividend
Income Earned
in the Year
Ended March 31,
2016 | | | Net Realized
Gain (Loss) in
the Year
Ended March 31,
2016 | |
DoubleLine Floating Rate Fund | | $ | 107,442,440 | | | $ | — | | | $ | 106,854,579 | | | | — | | | $ | — | | | $ | 1,074,438 | | | $ | 481,640 | |
DoubleLine Global Bond Fund | | | — | | | | 81,500,000 | | | | — | | | | 8,165,507 | | | | 85,656,164 | | | | 152,645 | | | | — | |
DoubleLine Long Duration Total Return Bond Fund | | | 52,150,000 | | | | — | | | | — | | | | 5,000,000 | | | | 52,000,000 | | | | 1,512,543 | | | | — | |
| | | | |
| | $ | 159,592,440 | | | $ | 81,500,000 | | | $ | 106,854,579 | | | | 13,165,507 | | | $ | 137,656,164 | | | $ | 2,739,626 | | | $ | 481,640 | |
| | | | |
| | | | | | |
| 48 | | DoubleLine Funds Trust | | | | The accompanying notes are an integral part of these financial statements. |
| | |
| Schedule of Investments DoubleLine Emerging Markets Fixed Income Fund | | March 31, 2016 |
| | | | | | | | | | | | | | | | |
PRINCIPAL
AMOUNT $ | | | SECURITY DESCRIPTION | | RATE | | | MATURITY | | | VALUE $ | |
| | FOREIGN CORPORATE BONDS 93.1% | |
| | |
| | BRAZIL 8.1% | |
| | 10,000,000 | | | Banco do Brasil S.A. | | | 9.00% | #^† | | | 06/18/2024 | | | | 6,990,000 | |
| | 1,300,000 | | | BR Malls International Finance Ltd. | | | 8.50% | † | | | 01/29/2049 | | | | 1,163,500 | |
| | 2,700,000 | | | Braskem Finance Company | | | 7.13% | | | | 07/22/2041 | | | | 2,304,315 | |
| | 4,500,000 | | | CIMPOR Financial Operations B.V. | | | 5.75% | ^ | | | 07/17/2024 | | | | 3,307,500 | |
| | 2,200,000 | | | CIMPOR Financial Operations B.V. | | | 5.75% | | | | 07/17/2024 | | | | 1,617,000 | |
| | 4,131,000 | | | Cosan Overseas Ltd. | | | 8.25% | † | | | 11/29/2049 | | | | 3,511,350 | |
| | 1,000,000 | | | ESAL GmbH | | | 6.25% | ^ | | | 02/05/2023 | | | | 883,750 | |
| | 2,000,000 | | | Globo Communicacao e Participacoes S.A. | | | 5.31% | # | | | 05/11/2022 | | | | 1,988,000 | |
| | 3,200,000 | | | Gol LuxCo S.A. | | | 8.88% | ^ | | | 01/24/2022 | | | | 1,120,000 | |
| | 2,000,000 | | | GTL Trade Finance, Inc. | | | 5.89% | ^ | | | 04/29/2024 | | | | 1,635,000 | |
| | 1,000,000 | | | JBS Investments GmbH | | | 7.25% | ^ | | | 04/03/2024 | | | | 922,500 | |
| | 1,000,000 | | | JBS Investments GmbH | | | 7.25% | | | | 04/03/2024 | | | | 922,500 | |
| | 6,575,000 | | | Magnesita Finance Ltd. | | | 8.63% | † | | | 04/05/2017 | | | | 3,846,375 | |
| | 11,000,000 | | | Marfrig Holdings B.V. | | | 6.88% | ^ | | | 06/24/2019 | | | | 10,491,250 | |
| | 3,500,000 | | | Marfrig Holdings B.V. | | | 6.88% | | | | 06/24/2019 | | | | 3,338,125 | |
| | 7,600,000 | | | Minerva Luxembourg S.A. | | | 8.75% | #^† | | | 04/03/2019 | | | | 7,172,500 | |
| | 3,900,000 | | | Minerva Luxembourg S.A. | | | 8.75% | #† | | | 04/03/2019 | | | | 3,680,625 | |
| | 1,500,000 | | | Minerva Luxembourg S.A. | | | 7.75% | ^ | | | 01/31/2023 | | | | 1,520,625 | |
| | 500,000 | | | Minerva Luxembourg S.A. | | | 7.75% | | | | 01/31/2023 | | | | 506,875 | |
| | 11,000,000 | | | OAS Financial Ltd. | | | 8.88% | #^†W | | | 04/25/2018 | | | | 68,200 | |
| | 4,900,000 | | | Odebrecht Finance Ltd. | | | 7.13% | | | | 06/26/2042 | | | | 2,094,750 | |
| | 3,500,000 | | | Odebrecht Finance Ltd. | | | 7.50% | † | | | 09/29/2049 | | | | 1,512,000 | |
| | | | | | | | | | | | | | | | |
| | | | | | | | | | | | | | | 60,596,740 | |
| | | | | | | | | | | | | | | | |
| | CHILE 16.1% | |
| | 8,000,000 | | | AES Gener S.A. | | | 5.25% | | | | 08/15/2021 | | | | 8,513,584 | |
| | 1,000,000 | | | Cencosud S.A. | | | 4.88% | ^ | | | 01/20/2023 | | | | 1,009,263 | |
| | 550,000 | | | Cencosud S.A. | | | 6.63% | | | | 02/12/2045 | | | | 520,139 | |
| | 8,200,000 | | | CorpGroup Banking S.A. | | | 6.75% | ^ | | | 03/15/2023 | | | | 7,677,250 | |
| | 26,000,000 | | | Empresa Electrica Angamos S.A. | | | 4.88% | | | | 05/25/2029 | | | | 24,187,670 | |
| | 13,650,000 | | | Empresa Electrica Guacolda S.A. | | | 4.56% | ^ | | | 04/30/2025 | | | | 13,099,291 | |
| | 1,000,000 | | | ENTEL Chile S.A. | | | 4.75% | ^ | | | 08/01/2026 | | | | 963,487 | |
| | 500,000 | | | ENTEL Chile S.A. | | | 4.75% | | | | 08/01/2026 | | | | 481,743 | |
| | 8,000,000 | | | GNL Quintero S.A. | | | 4.63% | | | | 07/31/2029 | | | | 8,089,864 | |
| | 20,096,506 | | | Guanay Finance Ltd. | | | 6.00% | | | | 12/15/2020 | | | | 19,543,852 | |
| | 10,300,000 | | | Latam Airlines Group S.A. | | | 7.25% | ^ | | | 06/09/2020 | | | | 9,527,500 | |
| | 1,000,000 | | | Sociedad Quimica y Minera S.A. | | | 5.50% | | | | 04/21/2020 | | | | 1,038,250 | |
| | 1,000,000 | | | Sociedad Quimica y Minera S.A. | | | 4.38% | | | | 01/28/2025 | | | | 947,500 | |
| | 4,400,000 | | | SUAM Finance B.V. | | | 4.88% | | | | 04/17/2024 | | | | 4,433,000 | |
| | 11,883,000 | | | Tanner Servicios Financieros S.A. | | | 4.38% | | | | 03/13/2018 | | | | 11,675,048 | |
| | 9,500,000 | | | VTR Finance B.V. | | | 6.88% | | | | 01/15/2024 | | | | 9,336,600 | |
| | | | | | | | | | | | | | | | |
| | | | | | | | | | | | | | | 121,044,041 | |
| | | | | | | | | | | | | | | | |
| | COLOMBIA 11.5% | |
| | 5,100,000 | | | Avianca Holdings S.A. | | | 8.38% | ^ | | | 05/10/2020 | | | | 4,029,000 | |
| | 8,900,000 | | | Avianca Holdings S.A. | | | 8.38% | | | | 05/10/2020 | | | | 7,031,000 | |
| | 5,300,000 | | | Banco GNB Sudameris S.A. | | | 7.50% | | | | 07/30/2022 | | | | 5,300,000 | |
| | 3,450,000 | | | Bancolombia S.A. | | | 6.13% | | | | 07/26/2020 | | | | 3,655,965 | |
| | 1,750,000 | | | BBVA Colombia S.A. | | | 4.88% | ^ | | | 04/21/2025 | | | | 1,697,500 | |
| | 4,530,000 | | | Ecopetrol S.A. | | | 4.13% | | | | 01/16/2025 | | | | 3,850,500 | |
| | 1,810,000 | | | Ecopetrol S.A. | | | 7.38% | | | | 09/18/2043 | | | | 1,665,200 | |
| | 17,870,000 | | | Ecopetrol S.A. | | | 5.88% | | | | 05/28/2045 | | | | 14,156,614 | |
| | 6,845,000 | | | Empresa de Energia de Bogota S.A. | | | 6.13% | | | | 11/10/2021 | | | | 7,125,645 | |
| | | | | | | | | | | | | | | | |
PRINCIPAL
AMOUNT $ | | | SECURITY DESCRIPTION | | RATE | | | MATURITY | | | VALUE $ | |
| | 5,513,000 | | | Grupo Aval Ltd. | | | 4.75% | | | | 09/26/2022 | | | | 5,154,655 | |
| | 8,000,000 | | | GrupoSura Finance S.A. | | | 5.70% | | | | 05/18/2021 | | | | 8,316,000 | |
| | 14,600,000 | | | Pacific Rubiales Energy Corporation | | | 5.13% | W | | | 03/28/2023 | | | | 2,555,000 | |
| | 4,000,000 | | | Pacific Rubiales Energy Corporation | | | 5.63% | ^W | | | 01/19/2025 | | | | 700,000 | |
| | 2,000,000 | | | Pacific Rubiales Energy Corporation | | | 5.63% | W | | | 01/19/2025 | | | | 350,000 | |
| | 935,000 | | | Transportadora de Gas Internacional S.A. | | | 5.70% | ^ | | | 03/20/2022 | | | | 952,297 | |
| | 19,565,000 | | | Transportadora de Gas Internacional S.A. | | | 5.70% | | | | 03/20/2022 | | | | 19,926,953 | |
| | | | | | | | | | | | | | | | |
| | | | | | | | | | | | | | | 86,466,329 | |
| | | | | | | | | | | | | | | | |
| | COSTA RICA 1.1% | |
| | 3,600,000 | | | Instituto Costarricense de Electricidad | | | 6.95% | ^ | | | 11/10/2021 | | | | 3,609,000 | |
| | 4,500,000 | | | Instituto Costarricense de Electricidad | | | 6.95% | | | | 11/10/2021 | | | | 4,511,250 | |
| | | | | | | | | | | | | | | | |
| | | | | | | | | | | | | | | 8,120,250 | |
| | | | | | | | | | | | | | | | |
| | EL SALVADOR 0.8% | |
| | 7,200,000 | | | AES El Salvador Trust | | | 6.75% | | | | 03/28/2023 | | | | 5,652,000 | |
| | | | | | | | | | | | | | | | |
| | | | | | | | | | | | | | | 5,652,000 | |
| | | | | | | | | | | | | | | | |
| | GUATEMALA 5.1% | |
| | 6,000,000 | | | Agromercantil Senior Trust | | | 6.25% | ^ | | | 04/10/2019 | | | | 6,210,000 | |
| | 5,000,000 | | | Agromercantil Senior Trust | | | 6.25% | | | | 04/10/2019 | | | | 5,175,000 | |
| | 2,500,000 | | | Bantrab Senior Trust | | | 9.00% | | | | 11/14/2020 | | | | 2,415,625 | |
| | 6,000,000 | | | Comcel Trust | | | 6.88% | ^ | | | 02/06/2024 | | | | 5,640,000 | |
| | 5,500,000 | | | Comcel Trust | | | 6.88% | | | | 02/06/2024 | | | | 5,170,000 | |
| | 5,900,000 | | | Industrial Senior Trust | | | 5.50% | ^ | | | 11/01/2022 | | | | 5,678,750 | |
| | 8,000,000 | | | Industrial Senior Trust | | | 5.50% | | | | 11/01/2022 | | | | 7,700,000 | |
| | | | | | | | | | | | | | | | |
| | | | | | | | | | | | | | | 37,989,375 | |
| | | | | | | | | | | | | | | | |
| | HONG KONG 0.3% | |
| | 2,000,000 | | | Hutchison Whampoa International Ltd. | | | 6.00% | #† | | | 05/07/2017 | | | | 2,071,000 | |
| | | | | | | | | | | | | | | | |
| | | | | | | | | | | | | | | 2,071,000 | |
| | | | | | | | | | | | | | | | |
| | INDIA 2.9% | |
| | 1,405,000 | | | Bharat Petrol Corporation Ltd. | | | 4.00% | | | | 05/08/2025 | | | | 1,416,379 | |
| | 4,500,000 | | | Bharti Airtel Ltd. | | | 4.38% | | | | 06/10/2025 | | | | 4,581,427 | |
| | 5,000,000 | | | ONGC Videsh Ltd. | | | 3.75% | | | | 05/07/2023 | | | | 5,006,505 | |
| | 4,177,000 | | | Reliance Industries Ltd. | | | 5.88% | † | | | 02/05/2018 | | | | 4,150,894 | |
| | 500,000 | | | Reliance Industries Ltd. | | | 8.25% | | | | 01/15/2027 | | | | 653,873 | |
| | 5,400,000 | | | Vedanta Resources PLC | | | 8.25% | | | | 06/07/2021 | | | | 3,240,000 | |
| | 4,400,000 | | | Vedanta Resources PLC | | | 7.13% | ^ | | | 05/31/2023 | | | | 2,464,000 | |
| | | | | | | | | | | | | | | | |
| | | | | | | | | | | | | | | 21,513,078 | |
| | | | | | | | | | | | | | | | |
| | INDONESIA 1.7% | |
| | 4,200,000 | | | Freeport-McMoRan Copper & Gold, Inc. | | | 4.00% | | | | 11/14/2021 | | | | 2,992,500 | |
| | 3,800,000 | | | Freeport-McMoRan Copper & Gold, Inc. | | | 3.88% | | | | 03/15/2023 | | | | 2,618,656 | |
| | 12,000,000 | | | Freeport-McMoRan Copper & Gold, Inc. | | | 5.45% | | | | 03/15/2043 | | | | 7,320,000 | |
| | | | | | | | | | | | | | | | |
| | | | | | | | | | | | | | | 12,931,156 | |
| | | | | | | | | | | | | | | | |
| | ISRAEL 0.9% | |
| | 2,500,000 | | | Delek & Avner Tamar Bond Ltd. | | | 4.44% | ^ | | | 12/30/2020 | | | | 2,518,750 | |
| | 4,440,000 | | | Delek & Avner Tamar Bond Ltd. | | | 5.41% | ^ | | | 12/30/2025 | | | | 4,456,650 | |
| | | | | | | | | | | | | | | | |
| | | | | | | | | | | | | | | 6,975,400 | |
| | | | | | | | | | | | | | | | |
| | | | | | |
| The accompanying notes are an integral part of these financial statements. | | Annual Report | | March 31, 2016 | | 49 |
| | |
| Schedule of Investments DoubleLine Emerging Markets Fixed Income Fund (Cont.) | | March 31, 2016 |
| | | | | | | | | | | | | | | | |
PRINCIPAL
AMOUNT $ | | | SECURITY DESCRIPTION | | RATE | | | MATURITY | | | VALUE $ | |
| | JAMAICA 2.1% | |
| | 500,000 | | | Digicel Ltd. | | | 7.00% | | | | 02/15/2020 | | | | 460,000 | |
| | 7,500,000 | | | Digicel Ltd. | | | 7.13% | ^ | | | 04/01/2022 | | | | 5,868,000 | |
| | 12,000,000 | | | Digicel Ltd. | | | 7.13% | | | | 04/01/2022 | | | | 9,388,800 | |
| | | | | | | | | | | | | | | | |
| | | | | | | | | | | | | | | 15,716,800 | |
| | | | | | | | | | | | | | | | |
| | MEXICO 15.3% | |
| | 8,000,000 | | | Banco Santander | | | 5.95% | # | | | 01/30/2024 | | | | 8,292,000 | |
| | 4,000,000 | | | BBVA Bancomer S.A. | | | 6.01% | # | | | 05/17/2022 | | | | 4,070,000 | |
| | 5,000,000 | | | BBVA Bancomer S.A. | | | 5.35% | #^ | | | 11/12/2029 | | | | 4,825,000 | |
| | 7,600,000 | | | BBVA Bancomer S.A. | | | 5.35% | # | | | 11/12/2029 | | | | 7,334,000 | |
| | 2,200,000 | | | Cemex S.A.B. de C.V. | | | 7.75% | ^ | | | 04/16/2026 | | | | 2,265,560 | |
| | 8,000,000 | | | Comision Federal de Electricidad | | | 6.13% | | | | 06/16/2045 | | | | 7,980,000 | |
| | 3,000,000 | | | Credito Real S.A.B. de C.V. | | | 7.50% | | | | 03/13/2019 | | | | 2,977,500 | |
| | 5,801,460 | | | Fermaca Enterprises S. de R.L. de C.V. | | | 6.38% | ^ | | | 03/30/2038 | | | | 5,496,883 | |
| | 8,218,735 | | | Fermaca Enterprises S. de R.L. de C.V. | | | 6.38% | | | | 03/30/2038 | | | | 7,787,251 | |
| | 1,000,000 | | | Grupo Cementos de Chihuahua S.A.B de C.V. | | | 8.13% | | | | 02/08/2020 | | | | 1,040,000 | |
| | 8,407,000 | | | Grupo Elektra S.A.B. de C.V. | | | 7.25% | | | | 08/06/2018 | | | | 8,196,825 | |
| | 8,500,000 | | | Grupo Idesa S.A. de C.V. | | | 7.88% | ^ | | | 12/18/2020 | | | | 8,298,125 | |
| | 7,104,000 | | | Grupo Idesa S.A. de C.V. | | | 7.88% | | | | 12/18/2020 | | | | 6,935,280 | |
| | 1,500,000 | | | Grupo Posadas S.A.B. de C.V. | | | 7.88% | ^ | | | 06/30/2022 | | | | 1,481,250 | |
| | 4,900,000 | | | Mexichem S.A.B. de C.V. | | | 5.88% | | | | 09/17/2044 | | | | 4,416,125 | |
| | 9,432,594 | | | Mexico Generadora de Energia | | | 5.50% | | | | 12/06/2032 | | | | 8,288,892 | |
| | 1,500,000 | | | Petroleos Mexicanos | | | 5.50% | | | | 01/21/2021 | | | | 1,559,063 | |
| | 2,000,000 | | | Petroleos Mexicanos | | | 4.50% | | | | 01/23/2026 | | | | 1,868,000 | |
| | 6,000,000 | | | Petroleos Mexicanos | | | 6.38% | | | | 01/23/2045 | | | | 5,592,000 | |
| | 2,000,000 | | | Sixsigma Networks Mexico S.A. de C.V. | | | 8.25% | ^ | | | 11/07/2021 | | | | 1,895,000 | |
| | 6,834,000 | | | TV Azteca S.A.B. de C.V. | | | 7.50% | | | | 05/25/2018 | | | | 4,425,015 | |
| | 7,200,000 | | | TV Azteca S.A.B. de C.V. | | | 7.63% | | | | 09/18/2020 | | | | 4,248,000 | |
| | 2,800,000 | | | Unifin Financiera S.A.P.I. de C.V. | | | 6.25% | ^ | | | 07/22/2019 | | | | 2,674,000 | |
| | 3,000,000 | | | Unifin Financiera S.A.P.I. de C.V. | | | 6.25% | | | | 07/22/2019 | | | | 2,865,000 | |
| | | | | | | | | | | | | | | | |
| | | | | | | | | | | | | | | 114,810,769 | |
| | | | | | | | | | | | | | | | |
| | PANAMA 5.3% | |
| | 9,700,000 | | | Aeropuerto Internacional de Tocumen S.A. | | | 5.75% | | | | 10/09/2023 | | | | 9,991,000 | |
| | 13,478,834 | | | ENA Norte Trust | | | 4.95% | | | | 04/25/2023 | | | | 13,815,805 | |
| | 9,000,000 | | | Global Bank Corporation | | | 5.13% | ^ | | | 10/30/2019 | | | | 9,157,500 | |
| | 7,000,000 | | | Global Bank Corporation | | | 5.13% | | | | 10/30/2019 | | | | 7,122,500 | |
| | | | | | | | | | | | | | | | |
| | | | | | | | | | | | | | | 40,086,805 | |
| | | | | | | | | | | | | | | | |
| | PARAGUAY 3.3% | |
| | 6,910,000 | | | Banco Continental SAECA | | | 8.88% | | | | 10/15/2017 | | | | 7,005,012 | |
| | 900,000 | | | Banco Regional SAECA | | | 8.13% | ^ | | | 01/24/2019 | | | | 929,700 | |
| | 8,340,000 | | | Banco Regional SAECA | | | 8.13% | | | | 01/24/2019 | | | | 8,615,220 | |
| | 400,000 | | | Telefonica Celular del Paraguay S.A. | | | 6.75% | ^ | | | 12/13/2022 | | | | 394,000 | |
| | 7,600,000 | | | Telefonica Celular del Paraguay S.A. | | | 6.75% | | | | 12/13/2022 | | | | 7,486,000 | |
| | | | | | | | | | | | | | | | |
| | | | | | | | | | | | | | | 24,429,932 | |
| | | | | | | | | | | | | | | | |
| | | | | | | | | | | | | | | | |
PRINCIPAL
AMOUNT $ | | | SECURITY DESCRIPTION | | RATE | | | MATURITY | | | VALUE $ | |
| | PERU 16.0% | |
| | 9,810,000 | | | Abengoa Transmision Sur S.A. | | | 6.88% | ^ | | | 04/30/2043 | | | | 10,030,725 | |
| | 9,190,000 | | | Abengoa Transmision Sur S.A. | | | 6.88% | | | | 04/30/2043 | | | | 9,396,775 | |
| | 3,900,000 | | | Ajecorp B.V. | | | 6.50% | | | | 05/14/2022 | | | | 1,677,000 | |
| | 11,000,000 | | | Banco International del Peru S.A.A. | | | 6.63% | # | | | 03/19/2029 | | | | 11,343,750 | |
| | 3,000,000 | | | Camposol S.A. | | | 9.88% | ^ | | | 02/02/2017 | | | | 2,625,000 | |
| | 2,818,000 | | | Camposol S.A. | | | 9.88% | | | | 02/02/2017 | | | | 2,465,750 | |
| | 900,000 | | | Compania Minera Ares S.A.C. | | | 7.75% | ^ | | | 01/23/2021 | | | | 895,500 | |
| | 11,100,000 | | | Compania Minera Ares S.A.C. | | | 7.75% | | | | 01/23/2021 | | | | 11,044,500 | |
| | 6,300,000 | | | Corporacion Azucarera del Peru S.A. | | | 6.38% | | | | 08/02/2022 | | | | 5,449,500 | |
| | 2,900,000 | | | Inkia Energy Ltd. | | | 8.38% | ^ | | | 04/04/2021 | | | | 2,907,250 | |
| | 1,900,000 | | | Inkia Energy Ltd. | | | 8.38% | | | | 04/04/2021 | | | | 1,904,750 | |
| | 7,800,000 | | | Intercorp Peru Ltd. | | | 5.88% | | | | 02/12/2025 | | | | 7,507,500 | |
| | 4,000,000 | | | Lima Metro Line 2 Finance Ltd. | | | 5.88% | | | | 07/05/2034 | | | | 4,000,000 | |
| | 5,300,000 | | | Minsur S.A. | | | 6.25% | | | | 02/07/2024 | | | | 5,061,500 | |
| | 20,632,000 | | | Peru Enhanced Pass-Through Finance Ltd. | | | 0.00% | | | | 06/02/2025 | | | | 15,967,311 | |
| | 4,100,000 | | | Pesquera Exalmar S.A.A. | | | 7.38% | ^ | | | 01/31/2020 | | | | 2,911,000 | |
| | 2,730,000 | | | Pesquera Exalmar S.A.A. | | | 7.38% | | | | 01/31/2020 | | | | 1,938,300 | |
| | 2,000,000 | | | Southern Copper Corporation | | | 7.50% | | | | 07/27/2035 | | | | 2,101,502 | |
| | 4,800,000 | | | Southern Copper Corporation | | | 6.75% | | | | 04/16/2040 | | | | 4,692,240 | |
| | 7,000,000 | | | Southern Copper Corporation | | | 5.25% | | | | 11/08/2042 | | | | 5,774,888 | |
| | 4,440,000 | | | Southern Copper Corporation | | | 5.88% | | | | 04/23/2045 | | | | 3,951,360 | |
| | 8,138,000 | | | Volcan Cia Minera S.A.A. | | | 5.38% | | | | 02/02/2022 | | | | 6,235,743 | |
| | | | | | | | | | | | | | | | |
| | | | | | | | | | | | | | | 119,881,844 | |
| | | | | | | | | | | | | | | | |
| | SINGAPORE 2.2% | |
| | 8,000,000 | | | Oversea-Chinese Banking Corporation | | | 4.00% | # | | | 10/15/2024 | | | | 8,318,544 | |
| | 8,000,000 | | | United Overseas Bank Ltd. | | | 3.75% | # | | | 09/19/2024 | | | | 8,250,640 | |
| | | | | | | | | | | | | | | | |
| | | | | | | | | | | | | | | 16,569,184 | |
| | | | | | | | | | | | | | | | |
| | TRINIDAD AND TOBAGO 0.4% | |
| | 3,000,000 | | | National Gas Company of Trinidad and Tobago Ltd. | | | 6.05% | | | | 01/15/2036 | | | | 3,056,250 | |
| | | | | | | | | | | | | | | | |
| | | | | | | | | | | | | | | 3,056,250 | |
| | | | | | | | | | | | | | | | |
| | | | Total Foreign Corporate Bonds (Cost $784,358,704) | | | | 697,910,953 | |
| | | | | | | | | | | | | | | | |
| FOREIGN GOVERNMENT BONDS AND NOTES, SUPRANATIONALS AND
FOREIGN AGENCIES 4.6% |
|
| | |
| | COLOMBIA 3.9% | |
| | 28,000,000 | | | Colombia Government International Bond | | | 4.38% | | | | 07/12/2021 | | | | 29,260,000 | |
| | | | | | | | | | | | | | | | |
| | | | | | | | | | | | | | | 29,260,000 | |
| | | | | | | | | | | | | | | | |
| | PANAMA 0.4% | |
| | 2,500,000 | | | Panama Government International Bond | | | 3.88% | | | | 03/17/2028 | | | | 2,531,250 | |
| | | | | | | | | | | | | | | | |
| | | | | | | | | | | | | | | 2,531,250 | |
| | | | | | | | | | | | | | | | |
| | | | | | |
| 50 | | DoubleLine Funds Trust | | | | The accompanying notes are an integral part of these financial statements. |
| | | | | | | | | | | | | | | | |
PRINCIPAL
AMOUNT $ /
SHARES | | | SECURITY DESCRIPTION | | RATE | | | MATURITY | | | VALUE $ | |
| | PARAGUAY 0.3% | |
| | 2,500,000 | | | Paraguay Government International Bond | | | 5.00% | ^ | | | 04/15/2026 | | | | 2,518,750 | |
| | | | | | | | | | | | | | | | |
| | | | | | | | | | | | | | | 2,518,750 | |
| | | | | | | | | | | | | | | | |
| | | | Total Foreign Government Bonds and Notes, Supranationals and Foreign Agencies (Cost $34,377,566) | | | | 34,310,000 | |
| | | | | | | | | | | | | | | | |
| | SHORT TERM INVESTMENTS 0.0% | |
| | 157 | | | BlackRock Liquidity Funds FedFund - Institutional Shares | | | 0.24% | ¨ | | | | | | | 157 | |
| | 157 | | | Fidelity Institutional Money Market Government Portfolio - Class I | | | 0.23% | ¨ | | | | | | | 157 | |
| | 157 | | | Morgan Stanley Institutional Liquidity Funds Government Portfolio - Institutional Share Class | | | 0.25% | ¨ | | | | | | | 157 | |
| | | | | | | | | | | | | | | | |
| | | | Total Short Term Investments (Cost $471) | | | | | | | | 471 | |
| | | | | | | | | | | | | | | | |
| | | | Total Investments 97.7% (Cost $818,736,741) | | | | | | | | 732,221,424 | |
| | | | Other Assets in Excess of Liabilities 2.3% | | | | 17,289,464 | |
| | | | | | | | | | | | | | | | |
| | | | NET ASSETS 100.0% | | | $ | 749,510,888 | |
| | | | | | | | | | | | | | | | |
| | | | |
| COUNTRY BREAKDOWN as a % of Net Assets: | | | | |
Chile | | | 16.1% | |
Peru | | | 16.0% | |
Colombia | | | 15.4% | |
Mexico | | | 15.3% | |
Brazil | | | 8.1% | |
Panama | | | 5.7% | |
Guatemala | | | 5.1% | |
Paraguay | | | 3.6% | |
India | | | 2.9% | |
Singapore | | | 2.2% | |
Jamaica | | | 2.1% | |
Indonesia | | | 1.7% | |
Costa Rica | | | 1.1% | |
Israel | | | 0.9% | |
El Salvador | | | 0.8% | |
Trinidad and Tobago | | | 0.4% | |
Hong Kong | | | 0.3% | |
United States | | | 0.0% | ~ |
Other Assets and Liabilities | | | 2.3% | |
| | | | |
| | | 100.0% | |
| | | | |
| | | | |
| INVESTMENT BREAKDOWN as a % of Net Assets: | | | | |
Banking | | | 17.4% | |
Utilities | | | 14.7% | |
Transportation | | | 14.0% | |
Oil & Gas | | | 10.1% | |
Mining | | | 7.7% | |
Finance | | | 7.2% | |
Telecommunications | | | 6.7% | |
Consumer Products | | | 6.0% | |
Foreign Government Bonds and Notes, Supranationals and Foreign Agencies | | | 4.6% | |
Chemicals/Plastics | | | 3.1% | |
Building and Development (including Steel/Metals) | | | 1.7% | |
Media | | | 1.5% | |
Retailers (other than Food/Drug) | | | 1.1% | |
Construction | | | 0.5% | |
Conglomerates | | | 0.3% | |
Technology | | | 0.3% | |
Beverage and Tobacco | | | 0.2% | |
Food/Drug Retailers | | | 0.2% | |
Hotels/Motels/Inns and Casinos | | | 0.2% | |
Real Estate | | | 0.2% | |
Short Term Investments | | | 0.0% | ~ |
Other Assets and Liabilities | | | 2.3% | |
| | | | |
| | | 100.0% | |
| | | | |
| # | Variable rate security. Rate disclosed as of March 31, 2016. |
| ^ | Security exempt from registration under Rule 144A of the Securities Act of 1933. These securities may be resold in transactions exempt from registration to qualified institutional buyers. These securities are determined to be liquid by the Adviser, unless otherwise noted, under procedures established by the Fund’s Board of Trustees. At March 31, 2016, the value of these securities amounted to $169,517,306 or 22.6% of net assets. |
| W | Security is in default or has failed to make a scheduled payment. Income is not being accrued. |
| ¨ | Seven-day yield as of March 31, 2016 |
| ~ | Represents less than 0.05% of net assets |
| | | | | | |
| The accompanying notes are an integral part of these financial statements. | | Annual Report | | March 31, 2016 | | 51 |
| | |
| Schedule of Investments (Consolidated) DoubleLine Multi-Asset Growth Fund | | March 31, 2016 |
| | | | | | | | | | | | | | | | |
PRINCIPAL
AMOUNT $ | | | SECURITY DESCRIPTION | | RATE | | | MATURITY | | | VALUE $ | |
| | ASSET BACKED OBLIGATIONS 2.4% | |
| |
| | | | AVANT Loans Funding Trust, | |
| | 555,206 | | | Series 2015-A-A | | | 4.00% | ^ | | | 08/16/2021 | | | | 546,599 | |
| | 1,000,000 | | | Series 2015-A-B | | | 6.00% | ^ | | | 08/16/2021 | | | | 992,625 | |
| |
| | | | Citi Held For Asset Issuance, | |
| | 381,983 | | | Series 2015-PM1-A | | | 1.85% | ^ | | | 12/15/2021 | | | | 380,080 | |
| | 1,000,000 | | | Series 2015-PM1-B | | | 2.93% | ^ | | | 12/15/2021 | | | | 978,534 | |
| | 500,000 | | | Series 2015-PM1-C | | | 5.01% | ^ | | | 12/15/2021 | | | | 473,948 | |
| |
| | | | MarketPlace Loan Trust, | |
| | 356,469 | | | Series 2015-CB1-A | | | 4.00% | ^ | | | 07/15/2021 | | | | 352,226 | |
| | | | | | | | | | | | | | | | |
| | | | Total Asset Backed Obligations
(Cost $3,792,829) | | | | 3,724,012 | |
| | | | | | | | | | | | | | | | |
| | COLLATERALIZED LOAN OBLIGATIONS 3.6% | |
| |
| | | | Babson Ltd., | |
| | 333,324 | | | Series 2007-1A-A1 | | | 0.84% | #^ | | | 01/18/2021 | | | | 328,589 | |
| |
| | | | Brookside Mill Ltd., | |
| | 1,000,000 | | | Series 2013-1A-E | | | 5.02% | #^ | | | 04/17/2025 | | | | 629,378 | |
| | 1,000,000 | | | Series 2013-1A-SUB | | | 0.00% | #^@ | | | 04/17/2025 | | | | 324,015 | |
| |
| | | | Carlyle High Yield Partners Ltd., | |
| | 297,586 | | | Series 2006-8A-A2A | | | 0.86% | #^ | | | 05/21/2021 | | | | 294,887 | |
| |
| | | | Cent Ltd., | |
| | 1,000,000 | | | Series 2013-18A-D | | | 4.07% | #^ | | | 07/23/2025 | | | | 879,440 | |
| | 1,000,000 | | | Series 2013-18A-E | | | 5.22% | #^ | | | 07/23/2025 | | | | 784,236 | |
| | 1,000,000 | | | Series 2013-18A-SUB | | | 0.64% | #^@ | | | 07/23/2025 | | | | 379,529 | |
| | 500,000 | | | Series 2014-22A-C | | | 4.37% | #^ | | | 11/07/2026 | | | | 415,338 | |
| |
| | | | Madison Park Funding Ltd., | |
| | 500,000 | | | Series 2014-13A-D | | | 3.97% | #^ | | | 01/19/2025 | | | | 445,356 | |
| |
| | | | Octagon Investment Partners Ltd., | |
| | 500,000 | | | Series 2014-1A-C | | | 4.27% | #^ | | | 11/14/2026 | | | | 441,118 | |
| | 500,000 | | | Series 2014-1A-D | | | 7.22% | #^ | | | 11/14/2026 | | | | 415,826 | |
| |
| | | | Saturn Ltd., | |
| | 211,677 | | | Series 2007-1A-A1 | | | 0.84% | #^ | | | 05/13/2022 | | | | 210,335 | |
| | | | | | | | | | | | | | | | |
| | | | Total Collateralized Loan Obligations (Cost $7,562,874) | | | | 5,548,047 | |
| | | | | | | | | | | | | | | | |
| | MUNICIPAL BONDS 1.1% | |
| | 2,500,000 | | | Commonwealth of Puerto Rico General Obligation | | | 8.00% | | | | 07/01/2035 | | | | 1,725,000 | |
| | | | | | | | | | | | | | | | |
| | | | Total Municipal Bonds (Cost $2,263,574) | | | | 1,725,000 | |
| | | | | | | | | | | | | | | | |
| | NON-AGENCY RESIDENTIAL COLLATERALIZED MORTGAGE OBLIGATIONS 6.1% | |
| |
| | | | Adjustable Rate Mortgage Trust, | |
| | 260,750 | | | Series 2006-1-2A1 | | | 3.17% | # | | | 03/25/2036 | | | | 189,417 | |
| |
| | | | Banc of America Alternative Loan Trust, | |
| | 500,917 | | | Series 2006-7-A4 | | | 6.00% | # | | | 10/25/2036 | | | | 314,890 | |
| |
| | | | BCAP LLC Trust, | |
| | 47,735 | | | Series 2007-AA2-2A5 | | | 6.00% | | | | 04/25/2037 | | | | 39,334 | |
| | 2,800,579 | | | Series 2009-RR4-1A2 | | | 9.62% | #^ | | | 06/26/2037 | | | | 1,428,488 | |
| |
| | | | ChaseFlex Trust, | |
| | 280,474 | | | Series 2007-M1-2F4 | | | 4.41% | # | | | 08/25/2037 | | | | 231,386 | |
| |
| | | | Citicorp Mortgage Securities, Inc., | |
| | 59,596 | | | Series 2007-2-3A1 | | | 5.50% | | | | 02/25/2037 | | | | 59,301 | |
| |
| | | | Citigroup Mortgage Loan Trust, Inc., | |
| | 233,120 | | | Series 2009-7-2A2 | | | 5.50% | ^ | | | 10/25/2021 | | | | 241,410 | |
| |
| | | | CitiMortgage Alternative Loan Trust, | |
| | 308,385 | | | Series 2007-A6-1A11 | | | 6.00% | | | | 06/25/2037 | | | | 266,149 | |
| |
| | | | Countrywide Alternative Loan Trust, | |
| | 116,892 | | | Series 2006-32CB-A16 | | | 5.50% | | | | 11/25/2036 | | | | 102,946 | |
| | 820,219 | | | Series 2006-J1-2A1 | | | 7.00% | | | | 02/25/2036 | | | | 391,247 | |
| | | | | | | | | | | | | | | | |
PRINCIPAL
AMOUNT $ | | | SECURITY DESCRIPTION | | RATE | | | MATURITY | | | VALUE $ | |
| |
| | | | Countrywide Alternative Loan Trust, (Cont.) | |
| | 25,220 | | | Series 2007-17CB-1A10 | | | 27.91% | # I/F | | | 08/25/2037 | | | | 42,203 | |
| | 17,280 | | | Series 2007-21CB-2A2 | | | 26.67% | # I/F | | | 09/25/2037 | | | | 31,197 | |
| |
| | | | Countrywide Home Loans, | |
| | 282,134 | | | Series 2007-10-A5 | | | 6.00% | | | | 07/25/2037 | | | | 244,801 | |
| | 14,712 | | | Series 2007-4-1A5 | | | 6.50% | | | | 05/25/2037 | | | | 13,570 | |
| |
| | | | Credit Suisse First Boston Mortgage Securities Corporation, | |
| | 173,485 | | | Series 2005-8-1A3 | | | 5.25% | | | | 09/25/2035 | | | | 155,618 | |
| |
| | | | Credit Suisse Mortgage Capital Certificates, | |
| | 47,459 | | | Series 2006-9-4A1 | | | 6.00% | | | | 11/25/2036 | | | | 38,828 | |
| | 354,512 | | | Series 2010-7R-4A17 | | | 6.00% | #^ | | | 04/26/2037 | | | | 341,415 | |
| |
| | | | Deutsche Mortgage Securities, Inc., | |
| | 169,745 | | | Series 2006-PR1-3A1 | | | 11.51% | #^ I/F | | | 04/15/2036 | | | | 191,566 | |
| | 319,964 | | | Series 2006-PR1-5AI4 | | | 11.51% | #^ I/F | | | 04/15/2036 | | | | 390,960 | |
| |
| | | | First Horizon Alternative Mortgage Securities, | |
| | 64,249 | | | Series 2007-FA2-1A3 | | | 6.00% | | | | 04/25/2037 | | | | 47,841 | |
| |
| | | | GSAA Home Equity Trust, | |
| | 1,000,000 | | | Series 2006-15-AF3B | | | 5.93% | # | | | 09/25/2036 | | | | 182,106 | |
| |
| | | | GSR Mortgage Loan Trust, | |
| | 152,997 | | | Series 2006-2F-2A20 | | | 10.66% | # I/F | | | 02/25/2036 | | | | 161,970 | |
| |
| | | | JP Morgan Alternative Loan Trust, | |
| | 37,780 | | | Series 2005-S1-2A11 | | | 6.00% | | | | 12/25/2035 | | | | 34,577 | |
| | 603,200 | | | Series 2006-S1-1A3 | | | 5.50% | | | | 03/25/2036 | | | | 487,200 | |
| |
| | | | JP Morgan Mortgage Acquisition Corporation, | |
| | 173,465 | | | Series 2006-CH2-AF3 | | | 5.46% | # | | | 10/25/2036 | | | | 129,028 | |
| |
| | | | Lavender Trust, | |
| | 297,000 | | | Series 2010-R12A-A3 | | | 6.00% | ^ | | | 06/26/2037 | | | | 299,273 | |
| |
| | | | Lehman Mortgage Trust, | |
| | 97,210 | | | Series 2006-4-1A3 | | | 4.97% | # I/F I/O | | | 08/25/2036 | | | | 18,840 | |
| | 6,075 | | | Series 2006-4-1A4 | | | 6.00% | | | | 08/25/2036 | | | | 5,127 | |
| | 53,119 | | | Series 2007-5-11A1 | | | 5.36% | # | | | 06/25/2037 | | | | 38,539 | |
| |
| | | | Lehman XS Trust, | |
| | 243,477 | | | Series 2005-1-3A3A | | | 5.11% | # | | | 07/25/2035 | | | | 224,889 | |
| |
| | | | Long Beach Mortgage Loan Trust, | |
| | 186,680 | | | Series 2005-WL2-M1 | | | 1.14% | # | | | 08/25/2035 | | | | 185,566 | |
| |
| | | | MASTR Resecuritization Trust, | |
| | 363,416 | | | Series 2008-4-A1 | | | 6.00% | #^ | | | 06/27/2036 | | | | 315,516 | |
| |
| | | | Morgan Stanley Mortgage Loan Trust, | |
| | 343,185 | | | Series 2007-13-6A1 | | | 6.00% | | | | 10/25/2037 | | | | 281,044 | |
| |
| | | | Residential Accredit Loans, Inc., | |
| | 267,887 | | | Series 2006-QS10-A9 | | | 6.50% | | | | 08/25/2036 | | | | 224,286 | |
| | 4,824 | | | Series 2006-QS13-1A8 | | | 6.00% | | | | 09/25/2036 | | | | 3,834 | |
| | 269,125 | | | Series 2006-QS2-1A4 | | | 5.50% | | | | 02/25/2036 | | | | 234,664 | |
| | 55,398 | | | Series 2006-QS7-A4 | | | 0.83% | # | | | 06/25/2036 | | | | 32,812 | |
| | 166,195 | | | Series 2006-QS7-A5 | | | 5.17% | # I/F I/O | | | 06/25/2036 | | | | 33,679 | |
| | 102,336 | | | Series 2006-QS8-A4 | | | 0.88% | # | | | 08/25/2036 | | | | 59,343 | |
| | 307,008 | | | Series 2006-QS8-A5 | | | 5.12% | # I/F I/O | | | 08/25/2036 | | | | 62,511 | |
| |
| | | | Residential Asset Mortgage Products, Inc., | |
| | 334,974 | | | Series 2004-RS2-MII1 | | | 1.30% | # | | | 02/25/2034 | | | | 320,135 | |
| |
| | | | Residential Asset Securitization Trust, | |
| | 26,825 | | | Series 2005-A12-A12 | | | 5.50% | | | | 11/25/2035 | | | | 24,849 | |
| | 636,951 | | | Series 2006-A16-1A3 | | | 6.00% | | | | 02/25/2037 | | | | 505,573 | |
| | 507,182 | | | Series 2007-A1-A8 | | | 6.00% | | | | 03/25/2037 | | | | 347,319 | |
| | 436,038 | | | Series 2007-A5-2A5 | | | 6.00% | | | | 05/25/2037 | | | | 368,217 | |
| |
| | | | Washington Mutual Mortgage Pass-Through Certificates, | |
| | 325,553 | | | Series 2006-8-A6 | | | 4.66% | # | | | 10/25/2036 | | | | 194,115 | |
| | | | | | | | | | | | | | | | |
| | | | Total Non-Agency Residential Collateralized Mortgage Obligations (Cost $9,426,933) | | | | 9,537,579 | |
| | | | | | | | | | | | | | | | |
| | | | | | |
| 52 | | DoubleLine Funds Trust | | | | The accompanying notes are an integral part of these financial statements. |
| | | | | | | | | | | | | | | | |
PRINCIPAL
AMOUNT $ /
SHARES | | | SECURITY DESCRIPTION | | RATE | | | MATURITY | | | VALUE $ | |
| | US GOVERNMENT / AGENCY MORTGAGE BACKED OBLIGATIONS 3.7% | |
| |
| | | | Federal Home Loan Mortgage Corporation, | |
| | 77,886 | | | Series 3261-SA | | | 5.99% | # I/F I/O | | | 01/15/2037 | | | | 15,000 | |
| | 62,161 | | | Series 3317-DS | | | 13.91% | # I/F | | | 05/15/2037 | | | | 84,030 | |
| | 160,088 | | | Series 3355-BI | | | 5.61% | # I/F I/O | | | 08/15/2037 | | | | 29,796 | |
| | 131,760 | | | Series 3384-S | | | 5.95% | # I/F I/O | | | 11/15/2037 | | | | 17,714 | |
| | 229,676 | | | Series 3384-SG | | | 5.87% | # I/F I/O | | | 08/15/2036 | | | | 34,018 | |
| | 145,852 | | | Series 3417-SX | | | 5.74% | # I/F I/O | | | 02/15/2038 | | | | 16,533 | |
| | 204,723 | | | Series 3423-GS | | | 5.21% | # I/F I/O | | | 03/15/2038 | | | | 24,474 | |
| | 2,042,881 | | | Series 3423-TG | | | 0.35% | # I/F I/O | | | 03/15/2038 | | | | 16,448 | |
| | 211,471 | | | Series 3500-SA | | | 5.08% | # I/F I/O | | | 01/15/2039 | | | | 22,236 | |
| | 330,012 | | | Series 3523-SM | | | 5.56% | # I/F I/O | | | 04/15/2039 | | | | 52,232 | |
| | 61,078 | | | Series 3562-WS | | | 4.51% | # I/F I/O | | | 08/15/2039 | | | | 6,890 | |
| | 354,448 | | | Series 3728-SV | | | 4.01% | # I/F I/O | | | 09/15/2040 | | | | 37,717 | |
| | 280,849 | | | Series 3758-S | | | 5.59% | # I/F I/O | | | 11/15/2040 | | | | 44,782 | |
| | 79,653 | | | Series 3779-DZ | | | 4.50% | | | | 12/15/2040 | | | | 88,065 | |
| | 13,927 | | | Series 3780-YS | | | 9.03% | # I/F | | | 12/15/2040 | | | | 15,004 | |
| | 334,126 | | | Series 3815-ST | | | 5.41% | # I/F I/O | | | 02/15/2041 | | | | 54,025 | |
| | 128,783 | | | Series 3900-SB | | | 5.53% | # I/F I/O | | | 07/15/2041 | | | | 18,560 | |
| | 411,822 | | | Series 3923-CZ | | | 5.00% | | | | 09/15/2041 | | | | 506,907 | |
| |
| | | | Federal National Mortgage Association, | |
| | 142,879 | | | Series 2006-101-SA | | | 6.15% | # I/F I/O | | | 10/25/2036 | | | | 28,853 | |
| | 73,972 | | | Series 2006-123-LI | | | 5.89% | # I/F I/O | | | 01/25/2037 | | | | 15,106 | |
| | 514,018 | | | Series 2007-39-AI | | | 5.69% | # I/F I/O | | | 05/25/2037 | | | | 92,777 | |
| | 243,875 | | | Series 2007-57-SX | | | 6.19% | # I/F I/O | | | 10/25/2036 | | | | 38,707 | |
| | 15,703 | | | Series 2009-49-S | | | 6.32% | # I/F I/O | | | 07/25/2039 | | | | 2,512 | |
| | 395,890 | | | Series 2009-86-CI | | | 5.37% | # I/F I/O | | | 09/25/2036 | | | | 54,090 | |
| | 177,542 | | | Series 2009-90-IA | | | 5.32% | # I/F I/O | | | 03/25/2037 | | | | 22,837 | |
| | 168,937 | | | Series 2009-90-IB | | | 5.29% | # I/F I/O | | | 04/25/2037 | | | | 20,202 | |
| | 410,446 | | | Series 2010-39-SL | | | 5.24% | # I/F I/O | | | 05/25/2040 | | | | 65,737 | |
| | 229,359 | | | Series 2011-5-PS | | | 5.97% | # I/F I/O | | | 11/25/2040 | | | | 22,644 | |
| | 350,786 | | | Series 2012-30-DZ | | | 4.00% | | | | 04/25/2042 | | | | 392,374 | |
| | 1,088,602 | | | Series 2013-53-ZC | | | 3.00% | | | | 06/25/2043 | | | | 1,069,963 | |
| | 829,635 | | | Series 2013-55-KS | | | 5.35% | # I/F | | | 06/25/2043 | | | | 779,262 | |
| | 1,016,627 | | | Series 2013-55-VZ | | | 3.00% | | | | 06/25/2043 | | | | 1,008,115 | |
| |
| | | | Government National Mortgage Association, | |
| | 39,832 | | | Series 2009-6-SM | | | 5.52% | # I/F I/O | | | 02/20/2038 | | | | 6,264 | |
| | 625,898 | | | Series 2011-45-GZ | | | 4.50% | | | | 03/20/2041 | | | | 676,100 | |
| | 250,000 | | | Series 2011-7-LS | | | 9.02% | # I/F | | | 12/20/2040 | | | | 295,866 | |
| | | | | | | | | | | | | | | | |
| | | | Total US Government / Agency Mortgage Backed Obligations (Cost $5,153,007) | | | | 5,675,840 | |
| | | | | | | | | | | | | | | | |
| | US GOVERNMENT BONDS AND NOTES 1.0% | |
| | 1,275,000 | | | United States Treasury Bonds | | | 3.75% | | | | 08/15/2041 | | | | 1,572,783 | |
| | | | | | | | | | | | | | | | |
| | | | Total US Government Bonds and Notes (Cost $1,573,732) | | | | 1,572,783 | |
| | | | | | | | | | | | | | | | |
| | REAL ESTATE INVESTMENT TRUSTS 2.9% | |
| | 240,000 | | | Annaly Capital Management, Inc. | | | | | | | | | | | 2,462,400 | |
| | 148,747 | | | Chimera Investment Corporation | | | | | | | | | | | 2,021,472 | |
| | | | | | | | | | | | | | | | |
| | | | Total Real Estate Investment Trusts (Cost $4,537,178) | | | | 4,483,872 | |
| | | | | | | | | | | | | | | | |
| | AFFILIATED MUTUAL FUNDS 23.8% | |
| | 578,000 | | | DoubleLine Core Fixed Income Fund (Class I) | | | | | | | | | | | 6,282,858 | |
| | 199,203 | | | DoubleLine Flexible Income Fund (Class I) | | | | | | | | | | | 1,902,390 | |
| | 2,663,622 | | | DoubleLine Total Return Bond Fund (Class I) | | | | | | | | | | | 28,953,571 | |
| | | | | | | | | | | | | | | | |
| | | | Total Affiliated Mutual Funds (Cost $38,297,852) | | | | 37,138,819 | |
| | | | | | | | | | | | | | | | |
| | | | | | | | | | | | | | |
SHARES /
CONTRACTS | | | SECURITY DESCRIPTION | | RATE | | | MATURITY | | VALUE $ | |
| | EXCHANGE TRADED FUNDS AND COMMON STOCKS 14.2% | |
| | 55,000 | | | iShares MSCI Hong Kong Index Fund | | | | | | | | | 1,087,350 | |
| | 38,750 | | | iShares MSCI Singapore Index Fund | | | | | | | | | 420,825 | |
| | 18,000 | | | iShares MSCI Sweden Index Fund | | | | | | | | | 530,100 | |
| | 62,000 | | | iShares MSCI Switzerland Capped Index Fund | | | | | | | | | 1,843,260 | |
| | 170,500 | | | iShares MSCI United Kingdom Index Fund | | | | | | | | | 2,673,440 | |
| | 42,500 | | | Morgan Stanley Emerging Markets Domestic Debt Fund, Inc. | | | | | | | | | 324,700 | |
| | 70,000 | | | SPDR Barclays International Treasury Bond ETF* | | | | | | | | | 3,901,800 | |
| | 40,000 | | | SPDR S&P 500 ETF | | | | | | | | | 8,222,400 | |
| | 25,600 | | | Stone Harbor Emerging Markets Income Fund | | | | | | | | | 327,168 | |
| | 37,500 | | | Templeton Emerging Markets Income Fund | | | | | | | | | 385,500 | |
| | 20,000 | | | Vanguard REIT ETF | | | | | | | | | 1,676,000 | |
| | 25,300 | | | Western Asset Emerging Markets Debt Fund, Inc. | | | | | | | | | 367,356 | |
| | 36,400 | | | Western Asset Emerging Markets Income Fund, Inc. | | | | | | | | | 373,464 | |
| | | | | | | | | | | | | | |
| | | | Total Exchange Traded Funds and Common Stocks (Cost $22,973,817) | | | 22,133,363 | |
| | | | | | | | | | | | | | |
| | PURCHASED OPTIONS 0.2% | |
| |
| | | | S&P 500 Index Put, | |
| | 100 | | | Expiration June 2016, Strike Price $2,000 | | | | | | | | | 365,000 | |
| | | | | | | | | | | | | | |
| | | | Total Purchased Options (Cost $521,200) | | | 365,000 | |
| | | | | | | | | | | | | | |
| | SHORT TERM INVESTMENTS 36.7% | |
| | 18,824,271 | | | BlackRock Liquidity Funds FedFund - Institutional Shares | | | 0.24% | ¨ | | | | | 18,824,271 | |
| | 3,446,057 | | | Dreyfus Government Cash Management - Institutional Shares | | | 0.21% | ¨ | | | | | 3,446,057 | |
| | 15,378,215 | | | Fidelity Institutional Money Market Government Portfolio - Class I | | | 0.23% | ¨ | | | | | 15,378,215 | |
| | 19,571,271 | | | Morgan Stanley Institutional Liquidity Funds Government Portfolio - Institutional Share Class | | | 0.25% | ¨‡ | | | | | 19,571,271 | |
| | | | | | | | | | | | | | |
| | | | Total Short Term Investments (Cost $57,219,814) | | | 57,219,814 | |
| | | | | | | | | | | | | | |
| | | | Total Investments 95.7% (Cost $153,322,810) | | | 149,124,129 | |
| | | | Other Assets in Excess of Liabilities 4.3% | | | 6,756,866 | |
| | | | | | | | | | | | | | |
| | | | NET ASSETS 100.0% | | $ | 155,880,995 | |
| | | | | | | | | | | | | | |
| | | | | | |
| The accompanying notes are an integral part of these financial statements. | | Annual Report | | March 31, 2016 | | 53 |
| | |
| Schedule of Investments (Consolidated) DoubleLine Multi-Asset Growth Fund (Cont.) | | March 31, 2016 |
| | | | |
| SECURITY TYPE BREAKDOWN as a % of Net Assets: | |
Short Term Investments | | | 36.7% | |
Affiliated Mutual Funds | | | 23.8% | |
Exchange Traded Funds and Common Stocks | | | 14.2% | |
Non-Agency Residential Collateralized Mortgage Obligations | | | 6.1% | |
US Government / Agency Mortgage Backed Obligations | | | 3.7% | |
Collateralized Loan Obligations | | | 3.6% | |
Real Estate Investment Trusts | | | 2.9% | |
Asset Backed Obligations | | | 2.4% | |
Municipal Bonds | | | 1.1% | |
US Government Bonds and Notes | | | 1.0% | |
Purchased Options | | | 0.2% | |
Other Assets and Liabilities | | | 4.3% | |
| | | | |
| | | 100.0% | |
| | | | |
| ^ | Security exempt from registration under Rule 144A of the Securities Act of 1933. These securities may be resold in transactions exempt from registration to qualified institutional buyers. These securities are determined to be liquid by the Adviser, unless otherwise noted, under procedures established by the Fund’s Board of Trustees. At March 31, 2016, the value of these securities amounted to $12,480,687 or 8.0% of net assets. |
| # | Variable rate security. Rate disclosed as of March 31, 2016. |
| @ | Security pays interest at rates that represent residual cashflows available after more senior tranches have been paid. The interest rate disclosed reflects the estimated rate in effect as of March 31, 2016. |
| I/F | Inverse floating rate security whose interest rate moves in the opposite direction of reference interest rates |
| I/O | Interest only security |
| ¨ | Seven-day yield as of March 31, 2016 |
| ‡ | All or a portion of security has been pledged as collateral in connection with swaps. |
| | | | | | |
| Written Options | | | | | |
| Contracts | | Security Description | | Value | |
100 | | S&P 500 Index Put, Expiration June 2016, Strike Price $1,900 | | $ | 179,000 | |
| | | | | | |
Total Written Options (Premiums Received $279,800) | | $ | 179,000 | |
| | | | |
| | | | | | | | | | |
| Futures Contracts - Long | |
| Contracts | | Security Description | | Expiration
Month/
Year | | | Unrealized
Appreciation
(Depreciation) | |
27 | | Gold Future | | | 06/2016 | | | $ | 18,548 | |
76 | | Ultra 10 Year US Treasury Note Future | | | 06/2016 | | | | 15,168 | |
140 | | E-mini S&P 500 Future | | | 06/2016 | | | | 220,850 | |
270 | | Euro STOXX 50 Future | | | 06/2016 | | | | (106,821 | ) |
36 | | mini MSCI EAFE Index Future | | | 06/2016 | | | | (3,416 | ) |
174 | | mini MSCI Emerging Markets Index Future | | | 06/2016 | | | | 89,249 | |
| | | | | | | | | | |
| | | | | | | | $ | 233,578 | |
| | | | | | | | | | |
| | | | | | | | | | |
| Futures Contracts - Short | |
| Contracts | | Security Description | | Expiration
Month/
Year | | | Unrealized
Appreciation
(Depreciation) | |
43 | | Euro/Bund Future | | | 06/2016 | | | $ | (43,349 | ) |
| | | | | | | | | | |
| | | | | | | | $ | (43,349 | ) |
| | | | | | | | | | |
| | | | | | | | | | | | | | | | | | |
| Total Return Swaps - Long | | | | | | | | | | | | |
| Reference Entity | | Counterparty | | Financing
Rate | | | Notional
Amount | | | Termination
Date | | | Unrealized
Appreciation
(Depreciation) | |
S&P GSCI Copper Official Close Index | | Morgan Stanley | | | 0.25% | | | | 590,000 | | | | 04/07/2016 | | | $ | — | |
S&P GSCI Cotton Official Close Index | | Morgan Stanley | | | 0.25% | | | | 590,000 | | | | 04/07/2016 | | | | — | |
S&P GSCI Gold Official Close Index | | Morgan Stanley | | | 0.20% | | | | 590,000 | | | | 04/07/2016 | | | | — | |
S&P GSCI Nickel Official Close Index | | Morgan Stanley | | | 0.25% | | | | 590,000 | | | | 04/07/2016 | | | | — | |
S&P GSCI Silver Official Close Index | | Morgan Stanley | | | 0.20% | | | | 590,000 | | | | 04/07/2016 | | | | — | |
S&P GSCI Zinc Official Close Index | | Morgan Stanley | | | 0.25% | | | | 590,000 | | | | 04/07/2016 | | | | — | |
Shiller Barclays CAPE® US Sector ER II USD Index¤ | | Barclays Capital, Inc. | | | 0.40% | | | | 31,300,000 | | | | 04/28/2017 | | | | — | |
| | | | | | | | | | | | | | | | | | |
| | | | | | | | | | | | | | | | $ | — | |
| | | | | | | | | | | | | | | | | | |
| | | | | | |
| 54 | | DoubleLine Funds Trust | | | | The accompanying notes are an integral part of these financial statements. |
| | | | | | | | | | | | | | | | | | |
| Total Return Swaps - Short | | | | | | | | | | | | |
| Reference Entity | | Counterparty | | Financing
Rate | | | Notional
Amount | | | Termination
Date | | | Unrealized
Appreciation
(Depreciation) | |
S&P GSCI Brent Crude Official Close Index | | Morgan Stanley | | | 0.15% | | | | 590,000 | | | | 04/07/2016 | | | $ | — | |
S&P GSCI Crude Oil Official Close Index | | Morgan Stanley | | | 0.15% | | | | 590,000 | | | | 04/07/2016 | | | | — | |
S&P GSCI GasOil Official Close Index | | Morgan Stanley | | | 0.15% | | | | 590,000 | | | | 04/07/2016 | | | | — | |
S&P GSCI Heating Oil Official Close Index | | Morgan Stanley | | | 0.20% | | | | 590,000 | | | | 04/07/2016 | | | | — | |
S&P GSCI Kansas Wheat Official Close Index | | Morgan Stanley | | | 0.25% | | | | 590,000 | | | | 04/07/2016 | | | | — | |
S&P GSCI Natural Gas Official Close Index | | Morgan Stanley | | | 0.15% | | | | 590,000 | | | | 04/07/2016 | | | | — | |
| | | | | | | | | | | | | | | | | | |
| | | | | | | | | | | | | | | | $ | — | |
| | | | | | | | | | | | | | | | | | |
| ¤ | Shiller Barclays CAPE® US Sector ER II USD Index aims to provide notional long exposure to the top four United States equity sectors that are relatively undervalued, as defined by a modified version of the classic CAPE® Ratio (the “Relative CAPE® Indicator”) and that possess relatively strong price momentum over the prior twelve months. Each U.S. equity sector is represented by an index that invests primarily in equity securities of companies in the relevant sector. At March 31, 2016, the four sector constituents and their weightings were as follows: Technology 25.5%, Industrial 25.2%, Consumer Discretionary 25.0%, and Healthcare 24.3%. |
| | | | | | | | | | | | | | | | | | | | | | | | | | |
| Forward Currency Exchange Contracts | | | | | | | | | | | | | | | | |
| Settlement Date | | Currency to be Delivered | | U.S. Value | | | Currency to be Received | | U.S. Value | | | Counterparty | | Unrealized
Appreciation
(Depreciation) | |
05/09/2016 | | | 5,000,000 | | | U.S. Dollars | | $ | 5,000,000 | | | | 4,473,755 | | | Euro | | $ | 5,096,743 | | | BNP Paribas | | $ | 96,743 | |
05/09/2016 | | | 4,000,000 | | | U.S. Dollars | | | 4,000,000 | | | | 3,537,034 | | | Euro | | | 4,029,580 | | | Bank of America | | | 29,580 | |
05/16/2016 | | | 5,000,000 | | | U.S. Dollars | | | 5,000,000 | | | | 557,798,300 | | | Japanese Yen | | | 4,962,795 | | | Morgan Stanley | | | (37,205 | ) |
| | | | | | | | | | | | | | | | | | | | | | | | | | |
| | | | | | | | $ | 14,000,000 | | | | | | | | | $ | 14,089,118 | | | | | $ | 89,118 | |
| | | | | | | | | | | | | | | | | | | | | | | | | | |
A summary of the DoubleLine Multi-Asset Growth Fund’s (Consolidated) investments in affiliated mutual funds for the year ended March 31, 2016 is as follows:
| | | | | | | | | | | | | | | | | | | | | | | | | | | | |
| Fund | | Value at
March 31,
2015 | | | Gross
Purchases | | | Gross
Sales | | | Shares
Held at
March 31,
2016 | | | Value at
March 31,
2016 | | | Dividend
Income Earned
in the Year
Ended March 31,
2016 | | | Net Realized
Gain (Loss)
in the Year
Ended March 31,
2016 | |
DoubleLine Core Fixed Income Fund | | $ | 7,263,507 | | | $ | — | | | $ | 850,000 | | | | 578,000 | | | $ | 6,282,858 | | | $ | 213,578 | | | $ | 27,809 | |
DoubleLine Emerging Markets Fixed Income Fund | | | 6,805,772 | | | | — | | | | 6,588,154 | | | | — | | | | — | | | | 125,329 | | | | (511,846 | ) |
DoubleLine Equities Growth Fund | | | 2,566,964 | | | | — | | | | 2,047,582 | | | | — | | | | — | | | | 21,161 | | | | (452,418 | ) |
DoubleLine Flexible Income Fund | | | — | | | | 2,000,000 | | | | — | | | | 199,203 | | | | 1,902,390 | | | | 66,604 | | | | — | |
DoubleLine Total Return Bond Fund | | | 26,370,639 | | | | 3,000,000 | | | | — | | | | 2,663,622 | | | | 28,953,571 | | | | 1,054,268 | | | | — | |
| | | | | | | | | | | | | | | | | | | | | | | | | | | | |
| | $ | 43,006,882 | | | $ | 5,000,000 | | | $ | 9,485,736 | | | | 3,440,825 | | | $ | 37,138,819 | | | $ | 1,480,940 | | | $ | (936,455 | ) |
| | | | | | | | | | | | | | | | | | | | | | | | | | | | |
| | | | | | |
| The accompanying notes are an integral part of these financial statements. | | Annual Report | | March 31, 2016 | | 55 |
| | |
| Schedule of Investments DoubleLine Low Duration Bond Fund | | March 31, 2016 |
| | | | | | | | | | | | | | | | |
PRINCIPAL
AMOUNT $ | | | SECURITY DESCRIPTION | | RATE | | | MATURITY | | | VALUE $ | |
| | ASSET BACKED OBLIGATIONS 2.6% | |
| |
| | | | Access Group, Inc., | |
| | 13,099,661 | | | Series 2007-A-B | | | 1.18% | # | | | 02/25/2037 | | | | 11,236,150 | |
| |
| | | | Access Point Funding LLC, | |
| | 5,403,310 | | | Series 2015-A-A | | | 2.61% | ^ | | | 04/15/2020 | | | | 5,386,424 | |
| |
| | | | Blue Elephant Loan Trust, | |
| | 1,968,176 | | | Series 2015-1-A | | | 3.12% | ^ | | | 12/15/2022 | | | | 1,966,738 | |
| |
| | | | Consumer Credit Origination Loan Trust, | |
| | 2,786,230 | | | Series 2015-1-A | | | 2.82% | ^ | | | 03/15/2021 | | | | 2,787,425 | |
| |
| | | | Eaglewood Consumer Loan Trust, | |
| | 5,000,000 | | | Series 2014-1-A | | | 3.50% | ^¥ | | | 10/15/2019 | | | | 4,974,845 | |
| |
| | | | Earnest Student Loan Program, | |
| | 20,000,000 | | | Series 2016-A-A2 | | | 2.50% | ^ | | | 04/25/2033 | | | | 19,626,630 | |
| |
| | | | OneMain Financial Issuance Trust, | |
| | 6,010,000 | | | Series 2014-1A-A | | | 2.43% | ^ | | | 06/18/2024 | | | | 5,996,014 | |
| |
| | | | SoFi Professional Loan Program, | |
| | 4,792,322 | | | Series 2013-A-A | | | 3.75% | ^ | | | 12/25/2029 | | | | 4,800,325 | |
| | 1,600,982 | | | Series 2014-A-A2 | | | 3.02% | ^ | | | 10/25/2027 | | | | 1,618,278 | |
| | 5,945,024 | | | Series 2015-C-A2 | | | 2.51% | ^ | | | 08/25/2033 | | | | 5,864,312 | |
| | 10,000,000 | | | Series 2016-A-A2 | | | 2.76% | ^ | | | 12/26/2036 | | | | 9,936,964 | |
| | | | | | | | | | | | | | | | |
| | | | Total Asset Backed Obligations
(Cost $75,210,323) | | | | 74,194,105 | |
| | | | | | | | | | | | | | | | |
| | COLLATERALIZED LOAN OBLIGATIONS 19.7% | |
| |
| | | | AB Ltd., | |
| | 5,250,000 | | | Series 2007-1A-B | | | 1.37% | #^ | | | 04/15/2021 | | | | 5,274,373 | |
| |
| | | | ACAS Ltd., | |
| | 222,649 | | | Series 2007-1X-A1S | | | 0.83% | # | | | 04/20/2021 | | | | 222,744 | |
| |
| | | | ALM Loan Funding, | |
| | 10,000,000 | | | Series 2012-7A-A1 | | | 2.04% | #^ | | | 10/19/2024 | | | | 10,005,963 | |
| |
| | | | Anchorage Capital Ltd., | |
| | 950,000 | | | Series 2014-4A-A1A | | | 2.07% | #^ | | | 07/28/2026 | | | | 938,529 | |
| |
| | | | Apidos Ltd., | |
| | 443,250 | | | Series 2007-5A-A18 | | | 0.85% | #^ | | | 04/15/2021 | | | | 439,322 | |
| | 9,975,000 | | | Series 2013-16A-A1 | | | 2.07% | #^ | | | 01/19/2025 | | | | 9,928,043 | |
| |
| | | | ARES Ltd., | |
| | 13,771,588 | | | Series 2007-11A-A1B | | | 0.88% | #^ | | | 10/11/2021 | | | | 13,586,521 | |
| | 2,939,768 | | | Series 2007-12A-A | | | 1.26% | #^ | | | 11/25/2020 | | | | 2,895,390 | |
| | 750,000 | | | Series 2007-12A-C | | | 2.63% | #^ | | | 11/25/2020 | | | | 729,469 | |
| | 2,570,771 | | | Series 2007-3RA-A2 | | | 0.84% | #^ | | | 04/16/2021 | | | | 2,508,813 | |
| |
| | | | Atrium Corporation, | |
| | 3,489,527 | | | Series 5A-A2A | | | 0.84% | #^ | | | 07/20/2020 | | | | 3,478,496 | |
| |
| | | | Avalon Capital Ltd., | |
| | 6,653,471 | | | Series 2014-1AR-AR | | | 1.79% | #^ | | | 04/17/2023 | | | | 6,631,070 | |
| |
| | | | Avenue Ltd., | |
| | 33,870 | | | Series 2007-6A-A1 | | | 0.84% | #^ | | | 07/17/2019 | | | | 33,911 | |
| |
| | | | Avery Point Ltd., | |
| | 3,000,000 | | | Series 2014-1A-A | | | 2.14% | #^ | | | 04/25/2026 | | | | 2,963,480 | |
| |
| | | | Babson Ltd., | |
| | 3,124,772 | | | Series 2007-1A-A2A | | | 0.83% | #^ | | | 01/18/2021 | | | | 3,120,192 | |
| | 2,416,491 | | | Series 2007-1X-A2A | | | 0.83% | # | | | 01/18/2021 | | | | 2,412,948 | |
| | 2,500,000 | | | Series 2016-1A-X | | | 1.62% | #^ | | | 04/23/2027 | | | | 2,501,966 | |
| |
| | | | Birchwood Park Ltd., | |
| | 1,000,000 | | | Series 2014-1A-C2 | | | 3.77% | #^ | | | 07/15/2026 | | | | 996,128 | |
| |
| | | | BlackRock Senior Income, | |
| | 2,119,516 | | | Series 2006-4A-A | | | 0.86% | #^ | | | 04/20/2019 | | | | 2,119,429 | |
| |
| | | | BlueMountain Ltd., | |
| | 6,924,122 | | | Series 2007-3A-A1B | | | 0.89% | #^ | | | 03/17/2021 | | | | 6,809,772 | |
| | 10,000,000 | | | Series 2012-2A-A1 | | | 2.04% | #^ | | | 11/20/2024 | | | | 9,963,214 | |
| | 9,500,000 | | | Series 2014-3A-A1 | | | 2.10% | #^ | | | 10/15/2026 | | | | 9,473,245 | |
| | 4,000,000 | | | Series 2014-4A-B1 | | | 3.04% | #^ | | | 11/30/2026 | | | | 3,929,704 | |
| | 15,000,000 | | | Series 2015-2A-A1 | | | 2.05% | #^ | | | 07/18/2027 | | | | 14,815,062 | |
| | 15,000,000 | | | Series 2015-3A-A1 | | | 1.81% | #^ | | | 10/20/2027 | | | | 14,964,090 | |
| | | | | | | | | | | | | | | | |
PRINCIPAL
AMOUNT $ | | | SECURITY DESCRIPTION | | RATE | | | MATURITY | | | VALUE $ | |
| |
| | | | Bridgeport Ltd., | |
| | 544,143 | | | Series 2006-1A-A1 | | | 0.87% | #^ | | | 07/21/2020 | | | | 537,950 | |
| |
| | | | Carlyle Global Market Strategies Ltd., | |
| | 2,250,000 | | | Series 2013-2A-D | | | 4.37% | #^ | | | 04/18/2025 | | | | 2,019,296 | |
| |
| | | | Carlyle High Yield Partners Ltd., | |
| | 1,104,596 | | | Series 2006-8A-A1 | | | 0.87% | #^ | | | 05/21/2021 | | | | 1,090,480 | |
| | 11,382,651 | | | Series 2006-8A-A2A | | | 0.86% | #^ | | | 05/21/2021 | | | | 11,279,448 | |
| | 6,412,710 | | | Series 2006-9A-A1 | | | 0.87% | #^ | | | 08/01/2021 | | | | 6,320,477 | |
| | 17,365,322 | | | Series 2007-10-A1 | | | 0.84% | #^ | | | 04/19/2022 | | | | 16,856,165 | |
| | 7,961,951 | | | Series 2007-10A-A2A | | | 0.83% | #^ | | | 04/19/2022 | | | | 7,788,004 | |
| |
| | | | Catamaran Ltd., | |
| | 5,000,000 | | | Series 2012-1A-A | | | 1.98% | #^ | | | 12/20/2023 | | | | 4,987,625 | |
| | 5,000,000 | | | Series 2014-1A-A1 | | | 2.17% | #^ | | | 04/20/2026 | | | | 4,974,404 | |
| | 1,250,000 | | | Series 2014-1A-B | | | 3.27% | #^ | | | 04/20/2026 | | | | 1,181,842 | |
| |
| | | | Cent Ltd., | |
| | 1,442,534 | | | Series 2006-11A-A1 | | | 0.88% | #^ | | | 04/25/2019 | | | | 1,425,750 | |
| | 949,660 | | | Series 2007-14A-A1 | | | 0.86% | #^ | | | 04/15/2021 | | | | 934,436 | |
| | 2,360,167 | | | Series 2007-14A-A2A | | | 0.85% | #^ | | | 04/15/2021 | | | | 2,311,040 | |
| |
| | | | Clydesdale Ltd., | |
| | 1,392,891 | | | Series 2006-1A-A1 | | | 0.87% | #^ | | | 12/19/2018 | | | | 1,381,473 | |
| |
| | | | ColumbusNova Ltd., | |
| | 5,000,000 | | | Series 2007-2A-B | | | 1.87% | #^ | | | 10/15/2021 | | | | 4,894,044 | |
| |
| | | | Cornerstone Ltd., | |
| | 1,034,572 | | | Series 2007-1A-A1S | | | 0.84% | #^ | | | 07/15/2021 | | | | 1,026,854 | |
| |
| | | | Covenant Credit Partners Ltd., | |
| | 5,000,000 | | | Series 2014-1A-A | | | 2.10% | #^ | | | 07/20/2026 | | | | 4,856,781 | |
| |
| | | | Dryden Leveraged Loan, | |
| | 4,460,302 | | | Series 2006-11A-A1 | | | 0.87% | #^ | | | 04/12/2020 | | | | 4,436,797 | |
| | 2,500,000 | | | Series 2006-16A-A2 | | | 1.00% | #^ | | | 10/20/2020 | | | | 2,470,791 | |
| |
| | | | Dryden Senior Loan Fund, | |
| | 500,000 | | | Series 2012-25A-D | | | 4.62% | #^ | | | 01/15/2025 | | | | 464,411 | |
| |
| | | | Eaton Vance Ltd., | |
| | 5,433,253 | | | Series 2006-8A-A | | | 0.87% | #^ | | | 08/15/2022 | | | | 5,288,480 | |
| | 1,500,000 | | | Series 2006-8A-B | | | 1.27% | #^ | | | 08/15/2022 | | | | 1,405,811 | |
| |
| | | | Flatiron Ltd., | |
| | 1,000,000 | | | Series 2013-1A-A1 | | | 2.02% | #^ | | | 01/17/2026 | | | | 982,251 | |
| |
| | | | Four Corners Ltd., | |
| | 5,091,461 | | | Series 2006-2A-A | | | 0.89% | #^ | | | 01/26/2020 | | | | 5,026,839 | |
| | 1,115,141 | | | Series 2006-3A-A | | | 0.87% | #^ | | | 07/22/2020 | | | | 1,110,867 | |
| |
| | | | Franklin Ltd., | |
| | 419,421 | | | Series 6A-A | | | 0.85% | #^ | | | 08/09/2019 | | | | 409,363 | |
| |
| | | | Galaxy Ltd., | |
| | 2,500,000 | | | Series 2013-15A-A | | | 1.87% | #^ | | | 04/15/2025 | | | | 2,475,656 | |
| | 3,000,000 | | | Series 2014-18A-A | | | 2.09% | #^ | | | 10/15/2026 | | | | 2,949,205 | |
| |
| | | | GoldenTree Loan Opportunities Ltd., | |
| | 1,093,142 | | | Series 2007-4A-A1B | | | 0.85% | #^ | | | 08/18/2022 | | | | 1,074,894 | |
| | 638,223 | | | Series 2007-5A-A | | | 1.31% | #^ | | | 10/18/2021 | | | | 635,333 | |
| | 2,000,000 | | | Series 2012-6A-D | | | 4.82% | #^ | | | 04/17/2022 | | | | 1,938,461 | |
| | 5,000,000 | | | Series 2014-8A-A | | | 2.07% | #^ | | | 04/19/2026 | | | | 4,956,416 | |
| |
| | | | Gulf Stream Ltd., | |
| | 158,447 | | | Series 2007-1A-A1A | | | 0.86% | #^ | | | 06/17/2021 | | | | 158,103 | |
| |
| | | | Halcyon Loan Advisors Funding Ltd., | |
| | 9,000,000 | | | Series 2012-1X-A2 | | | 3.12% | # | | | 08/15/2023 | | | | 9,045,238 | |
| | 1,000,000 | | | Series 2014-1A-A1 | | | 2.15% | #^ | | | 04/18/2026 | | | | 985,759 | |
| | 2,250,000 | | | Series 2014-2A-C | | | 4.12% | #^ | | | 04/28/2025 | | | | 1,855,963 | |
| |
| | | | Highbridge Loan Management Ltd., | |
| | 1,000,000 | | | 2016-8A-X | | | 5.33% | # | | | 04/20/2028 | | | | 1,000,000 | |
| |
| | | | ING Ltd., | |
| | 8,046,498 | | | Series 2012-1RA-A1R | | | 1.83% | #^ | | | 03/14/2022 | | | | 8,026,425 | |
| | 1,280,000 | | | Series 2012-4A-A1 | | | 2.01% | #^ | | | 10/15/2023 | | | | 1,273,329 | |
| | 3,000,000 | | | Series 2012-4A-A2 | | | 2.87% | #^ | | | 10/15/2023 | | | | 2,993,118 | |
| |
| | | | Inwood Park Ltd., | |
| | 565,259 | | | Series 2006-1A-A1A | | | 0.85% | #^ | | | 01/20/2021 | | | | 564,978 | |
| | | | | | |
| 56 | | DoubleLine Funds Trust | | | | The accompanying notes are an integral part of these financial statements. |
| | | | | | | | | | | | | | | | |
PRINCIPAL
AMOUNT $ | | | SECURITY DESCRIPTION | | RATE | | | MATURITY | | | VALUE $ | |
| |
| | | | Jamestown Ltd., | |
| | 4,000,000 | | | Series 2014-4A-A1A | | | 2.12% | #^ | | | 07/15/2026 | | | | 3,873,320 | |
| |
| | | | KKR Financial Corporation, | |
| | 1,048,025 | | | Series 2007-1A-A | | | 0.97% | #^ | | | 05/15/2021 | | | | 1,044,015 | |
| |
| | | | KKR Ltd., | |
| | 2,000,000 | | | Series 13-X | | | 1.37% | #^ | | | 01/16/2028 | | | | 2,004,768 | |
| |
| | | | Landmark Ltd., | |
| | 5,455,080 | | | Series 2006-8A-A1 | | | 0.86% | #^ | | | 10/19/2020 | | | | 5,416,499 | |
| |
| | | | LCM LP, | |
| | 8,654,439 | | | Series 10AR-AR | | | 1.82% | #^ | | | 04/15/2022 | | | | 8,594,697 | |
| | 500,000 | | | Series 10AR-BR | | | 2.52% | #^ | | | 04/15/2022 | | | | 497,262 | |
| | 500,000 | | | Series 10AR-CR | | | 3.47% | #^ | | | 04/15/2022 | | | | 495,464 | |
| | 1,000,000 | | | Series 11A-B | | | 2.77% | #^ | | | 04/19/2022 | | | | 1,005,009 | |
| | 25,500,000 | | | Series 12A-AR | | | 1.88% | #^ | | | 10/19/2022 | | | | 25,114,279 | |
| | 1,000,000 | | | Series 15A-C | | | 3.73% | #^ | | | 08/25/2024 | | | | 991,867 | |
| | 5,500,000 | | | Series 16A-A | | | 2.12% | #^ | | | 07/15/2026 | | | | 5,489,776 | |
| |
| | | | Madison Park Funding Ltd., | |
| | 461,263 | | | Series 2007-4A-A2 | | | 0.85% | #^ | | | 03/22/2021 | | | | 451,567 | |
| | 10,000,000 | | | Series 2012-10A-A1A | | | 1.99% | #^ | | | 01/20/2025 | | | | 9,958,916 | |
| | 500,000 | | | Series 2014-15A-C | | | 4.32% | #^ | | | 01/27/2026 | | | | 442,524 | |
| |
| | | | Magnetite Ltd., | |
| | 4,750,000 | | | Series 2014-9A-A1 | | | 2.04% | #^ | | | 07/25/2026 | | | | 4,714,375 | |
| | 250,000 | | | Series 2015-12A-A | | | 2.12% | #^ | | | 04/15/2027 | | | | 249,215 | |
| |
| | | | MAPS Fund Ltd., | |
| | 1,000,000 | | | Series 2007-2A-B | | | 1.52% | #^ | | | 07/20/2022 | | | | 941,649 | |
| |
| | | | Mountain Capital Ltd., | |
| | 312,848 | | | Series 2007-6A-A | | | 0.85% | #^ | | | 04/25/2019 | | | | 310,987 | |
| |
| | | | Mountain Hawk Ltd., | |
| | 18,400,000 | | | Series 2014-A3-A | | | 2.12% | #^ | | | 04/18/2025 | | | | 18,197,066 | |
| |
| | | | Mountain View Ltd., | |
| | 12,990,807 | | | Series 2006-2A-A1 | | | 0.87% | #^ | | | 01/12/2021 | | | | 12,858,753 | |
| | 800,000 | | | Series 2007-3A-A2 | | | 0.96% | #^ | | | 04/16/2021 | | | | 786,578 | |
| |
| | | | Nautique Funding Ltd., | |
| | 3,312,590 | | | Series 2006-1A-A1A | | | 0.87% | #^ | | | 04/15/2020 | | | | 3,282,803 | |
| |
| | | | Navigare Funding Ltd., | |
| | 3,000,000 | | | Series 2007-2A-C | | | 1.37% | #^ | | | 04/17/2021 | | | | 2,834,836 | |
| |
| | | | Neuberger Berman Ltd., | |
| | 3,000,000 | | | Series 2016-21A-X | | | 1.62% | #^ | | | 04/20/2027 | | | | 3,001,441 | |
| |
| | | | NewMark Capital Funding Ltd., | |
| | 9,750,000 | | | Series 2013-1A-A2 | | | 1.75% | #^ | | | 06/02/2025 | | | | 9,500,176 | |
| |
| | | | Northwoods Capital Corporation, | |
| | 20,000,000 | | | Series 2012-9A-A | | | 2.04% | #^ | | | 01/18/2024 | | | | 19,900,122 | |
| | 3,000,000 | | | Series 2013-10-A1 | | | 2.02% | #^ | | | 11/04/2025 | | | | 2,928,008 | |
| |
| | | | NYLIM Flatiron Ltd., | |
| | 3,464,329 | | | Series 2006-1A-A1 | | | 0.86% | #^ | | | 08/08/2020 | | | | 3,444,617 | |
| |
| | | | Oak Hill Credit Partners, | |
| | 1,000,000 | | | Series 2012-7A-A | | | 2.04% | #^ | | | 11/20/2023 | | | | 997,068 | |
| |
| | | | Ocean Trails, | |
| | 1,408,355 | | | Series 2006-1X-A1 | | | 0.87% | # | | | 10/12/2020 | | | | 1,392,206 | |
| |
| | | | Octagon Investment Partners Ltd., | |
| | 2,209,618 | | | Series 2012-1A-AR | | | 1.89% | #^ | | | 05/05/2023 | | | | 2,210,018 | |
| |
| | | | OZLM Funding Ltd., | |
| | 3,110,000 | | | Series 2013-5A-A1 | | | 2.12% | #^ | | | 01/17/2026 | | | | 3,092,982 | |
| |
| | | | OZLM Ltd., | |
| | 11,900,000 | | | Series 2014-6A-A1 | | | 2.17% | #^ | | | 04/17/2026 | | | | 11,867,712 | |
| |
| | | | Pacifica Corporation, | |
| | 2,936,137 | | | Series 2006-6A-A1A | | | 0.86% | #^ | | | 08/15/2021 | | | | 2,896,602 | |
| |
| | | | Prospect Park Ltd., | |
| | 1,873,944 | | | Series 2006-1A-A | | | 0.87% | #^ | | | 07/15/2020 | | | | 1,864,336 | |
| |
| | | | Race Point Ltd., | |
| | 1,000,000 | | | Series 2012-7A-A | | | 2.04% | #^ | | | 11/08/2024 | | | | 994,506 | |
| |
| | | | Regatta Funding Ltd., | |
| | 3,000,000 | | | Series 2014-1A-A1A | | | 2.18% | #^ | | | 10/25/2026 | | | | 2,967,461 | |
| | | | | | | | | | | | | | | | |
PRINCIPAL
AMOUNT $ | | | SECURITY DESCRIPTION | | RATE | | | MATURITY | | | VALUE $ | |
| |
| | | | Silverado Ltd., | |
| | 3,437,530 | | | Series 2006-2A-A1 | | | 0.86% | #^ | | | 10/16/2020 | | | | 3,383,822 | |
| |
| | | | Slater Mill Loan Fund, | |
| | 3,800,000 | | | Series 2012-1A-B | | | 3.27% | #^ | | | 08/17/2022 | | | | 3,789,651 | |
| |
| | | | Sound Harbor Loan Fund Ltd., | |
| | 3,000,000 | | | Series 2014-1A-A1 | | | 2.12% | #^ | | | 10/30/2026 | | | | 2,977,576 | |
| |
| | | | Sound Point Ltd., | |
| | 2,000,000 | | | Series 2015-3A-X | | | 1.46% | #^ | | | 01/20/2028 | | | | 2,002,155 | |
| |
| | | | Steele Creek Ltd., | |
| | 2,000,000 | | | Series 2014-1A-A1 | | | 2.22% | #^ | | | 08/21/2026 | | | | 1,974,563 | |
| |
| | | | Symphony Ltd., | |
| | 25,000,000 | | | Series 2010-10A-AR | | | 1.89% | #^ | | | 07/23/2023 | | | | 25,000,740 | |
| | 8,753,133 | | | Series 2012-8AR-AR | | | 1.72% | #^ | | | 01/09/2023 | | | | 8,713,745 | |
| | 10,000,000 | | | Series 2013-11A-A | | | 1.92% | #^ | | | 01/17/2025 | | | | 9,870,509 | |
| |
| | | | Venture Ltd., | |
| | 9,250,000 | | | Series 2014-16A-A1L | | | 2.12% | #^ | | | 04/15/2026 | | | | 9,147,306 | |
| | 2,500,000 | | | Series 2014-17A-A | | | 2.10% | #^ | | | 07/15/2026 | | | | 2,483,625 | |
| | 1,000,000 | | | Series 2014-17A-B2 | | | 2.72% | #^ | | | 07/15/2026 | | | | 950,548 | |
| |
| | | | Wasatch Ltd., | |
| | 11,266,427 | | | Series 2006-1A-A1B | | | 0.86% | #^ | | | 11/14/2022 | | | | 10,940,540 | |
| |
| | | | Washington Mill Ltd., | |
| | 5,000,000 | | | Series 2014-1A-A1 | | | 2.12% | #^ | | | 04/20/2026 | | | | 4,933,357 | |
| | 1,000,000 | | | Series 2014-1A-B1 | | | 2.67% | #^ | | | 04/20/2026 | | | | 961,369 | |
| | 1,000,000 | | | Series 2014-1A-C | | | 3.62% | #^ | | | 04/20/2026 | | | | 957,287 | |
| |
| | | | Westwood Ltd., | |
| | 4,995,115 | | | Series 2006-1X-A1 | | | 0.87% | # | | | 03/25/2021 | | | | 4,917,239 | |
| | 2,704,158 | | | Series 2007-2A-A1 | | | 0.84% | #^ | | | 04/25/2022 | | | | 2,647,631 | |
| |
| | | | WhiteHorse Ltd., | |
| | 2,500,000 | | | Series 2012-1A-B1L | | | 4.86% | #^ | | | 02/03/2025 | | | | 2,152,527 | |
| | 5,000,000 | | | Series 2013-1A-A1L | | | 2.02% | #^ | | | 11/24/2025 | | | | 4,960,918 | |
| | 3,250,000 | | | Series 2014-1A-A | | | 2.12% | #^ | | | 05/01/2026 | | | | 3,188,294 | |
| |
| | | | Wind River Ltd., | |
| | 10,000,000 | | | Series 2013-2A-A1 | | | 2.07% | #^ | | | 01/18/2026 | | | | 9,786,077 | |
| | 5,000,000 | | | Series 2014-1A-A | | | 2.14% | #^ | | | 04/18/2026 | | | | 4,947,601 | |
| |
| | | | Zais Ltd., | |
| | 4,500,000 | | | Series 2014-2A-A1A | | | 2.12% | #^ | | | 07/25/2026 | | | | 4,427,117 | |
| | | | | | | | | | | | | | | | |
| | | | Total Collateralized Loan Obligations
(Cost $571,341,274) | | | | 567,864,108 | |
| | | | | | | | | | | | | | | | |
| | FOREIGN CORPORATE BONDS 17.0% | |
| | 1,500,000 | | | AES Gener S.A. | | | 5.25% | | | | 08/15/2021 | | | | 1,596,297 | |
| | 1,450,000 | | | Agromercantil Senior Trust | | | 6.25% | ^ | | | 04/10/2019 | | | | 1,500,750 | |
| | 3,550,000 | | | Agromercantil Senior Trust | | | 6.25% | | | | 04/10/2019 | | | | 3,674,250 | |
| | 1,000,000 | | | Banco
Continental SAECA | | | 8.88% | | | | 10/15/2017 | | | | 1,013,750 | |
| | 7,000,000 | | | Banco Davivienda S.A. | | | 2.95% | | | | 01/29/2018 | | | | 6,994,750 | |
| | 5,500,000 | | | Banco de Bogota S.A. | | | 5.00% | | | | 01/15/2017 | | | | 5,582,500 | |
| | 2,453,000 | | | Banco de Chile | | | 6.25% | | | | 06/15/2016 | | | | 2,477,417 | |
| | 6,900,000 | | | Banco de Costa Rica | | | 5.25% | | | | 08/12/2018 | | | | 7,020,750 | |
| | 2,000,000 | | | Banco de Credito del Peru | | | 2.75% | ^ | | | 01/09/2018 | | | | 2,020,000 | |
| | 5,500,000 | | | Banco de Credito del Peru | | | 2.75% | | | | 01/09/2018 | | | | 5,555,000 | |
| | 1,000,000 | | | Banco GNB Sudameris S.A. | | | 3.88% | ^ | | | 05/02/2018 | | | | 985,500 | |
| | 8,300,000 | | | Banco GNB Sudameris S.A. | | | 3.88% | | | | 05/02/2018 | | | | 8,179,650 | |
| | 2,000,000 | | | Banco Latinoamericano de Comercio Exterior S.A. | | | 3.75% | | | | 04/04/2017 | | | | 2,038,000 | |
| | | | | | |
| The accompanying notes are an integral part of these financial statements. | | Annual Report | | March 31, 2016 | | 57 |
| | |
| Schedule of Investments DoubleLine Low Duration Bond Fund (Cont.) | | March 31, 2016 |
| | | | | | | | | | | | | | | | |
PRINCIPAL
AMOUNT $ | | | SECURITY DESCRIPTION | | RATE | | | MATURITY | | | VALUE $ | |
| | 2,000,000 | | | Banco Latinoamericano do Comercio Exterior S.A. | | | 3.25% | | | | 05/07/2020 | | | | 1,995,000 | |
| | 5,000,000 | | | Banco Latinoamericano do Comercio Exterior S.A. | | | 3.25% | ^ | | | 05/07/2020 | | | | 4,987,500 | |
| | 3,725,000 | | | Banco Mercantil del Norte | | | 6.86% | # | | | 10/13/2021 | | | | 3,762,250 | |
| | 7,000,000 | | | Banco Nacional de Costa Rica | | | 4.88% | | | | 11/01/2018 | | | | 6,982,500 | |
| | 1,000,000 | | | Banco Regional SAECA | | | 8.13% | | | | 01/24/2019 | | | | 1,033,000 | |
| | 11,100,000 | | | Banco Santander | | | 5.95% | # | | | 01/30/2024 | | | | 11,505,150 | |
| | 1,146,000 | | | Bancolombia S.A. | | | 6.88% | | | | 05/25/2017 | | | | 1,194,705 | |
| | 5,150,000 | | | Bancolombia S.A. | | | 6.13% | | | | 07/26/2020 | | | | 5,457,455 | |
| | 5,100,000 | | | Bank of Montreal | | | 1.80% | | | | 07/31/2018 | | | | 5,122,884 | |
| | 8,750,000 | | | BBVA Banco Continental S.A. | | | 3.25% | | | | 04/08/2018 | | | | 8,903,125 | |
| | 12,800,000 | | | BBVA Bancomer S.A. | | | 6.01% | # | | | 05/17/2022 | | | | 13,024,000 | |
| | 2,761,000 | | | BP Capital Markets PLC | | | 1.85% | | | | 05/05/2017 | | | | 2,774,935 | |
| | 2,000,000 | | | BP Capital Markets PLC | | | 1.67% | | | | 02/13/2018 | | | | 2,003,178 | |
| | 4,545,000 | | | British Telecommunications PLC | | | 5.95% | | | | 01/15/2018 | | | | 4,903,687 | |
| | 125,000 | | | Celulosa Arauco y Constitucion S.A. | | | 5.00% | | | | 01/21/2021 | | | | 133,854 | |
| | 1,000,000 | | | Cementos Progreso Trust | | | 7.13% | | | | 11/06/2023 | | | | 1,062,500 | |
| | 4,100,000 | | | Cemex S.A.B. de C.V. | | | 5.37% | # | | | 10/15/2018 | | | | 4,089,750 | |
| | 7,000,000 | | | Cencosud S.A. | | | 5.50% | | | | 01/20/2021 | | | | 7,485,471 | |
| | 6,000,000 | | | Central American Bottling Corporation | | | 6.75% | | | | 02/09/2022 | | | | 6,345,000 | |
| | 8,000,000 | | | CNOOC Finance Ltd. | | | 2.63% | | | | 05/05/2020 | | | | 8,025,304 | |
| | 1,000,000 | | | CNPC General Capital Ltd. | | | 2.75% | | | | 05/14/2019 | | | | 1,015,739 | |
| | 1,000,000 | | | Colbun S.A. | | | 6.00% | | | | 01/21/2020 | | | | 1,100,168 | |
| | 2,000,000 | | | Comision Federal de Electricidad | | | 4.88% | | | | 05/26/2021 | | | | 2,112,500 | |
| | 500,000 | | | Compania Minera Ares S.A.C. | | | 7.75% | | | | 01/23/2021 | | | | 497,500 | |
| | 5,000,000 | | | Corp Nacional del Cobre de Chile | | | 3.88% | | | | 11/03/2021 | | | | 5,130,515 | |
| | 10,500,000 | | | Corpbanca S.A. | | | 3.13% | | | | 01/15/2018 | | | | 10,570,245 | |
| | 400,000 | | | Corpbanca S.A. | | | 3.88% | | | | 09/22/2019 | | | | 410,738 | |
| | 3,000,000 | | | Corporacion Financiera de Desarrollo S.A. | | | 3.25% | | | | 07/15/2019 | | | | 3,060,000 | |
| | 4,000,000 | | | Corporacion Financiera de Desarrollo S.A. | | | 3.25% | ^ | | | 07/15/2019 | | | | 4,080,000 | |
| | 2,000,000 | | | Corporacion Nacional del Cobre de Chile | | | 3.75% | | | | 11/04/2020 | | | | 2,095,772 | |
| | 1,500,000 | | | Cosan Overseas Ltd. | | | 8.25% | † | | | 11/29/2049 | | | | 1,275,000 | |
| | 9,000,000 | | | DBS Bank Ltd. | | | 3.63% | # | | | 09/21/2022 | | | | 9,225,819 | |
| | 7,000,000 | | | Delek & Avner Tamar Bond Ltd. | | | 3.84% | ^ | | | 12/30/2018 | | | | 7,006,300 | |
| | 5,000,000 | | | Delek & Avner Tamar Bond Ltd. | | | 4.44% | ^ | | | 12/30/2020 | | | | 5,037,500 | |
| | 2,000,000 | | | Embraer Overseas Ltd. | | | 6.38% | | | | 01/24/2017 | | | | 2,067,500 | |
| | 300,000 | | | Empresa de Energia de Bogota S.A. | | | 6.13% | | | | 11/10/2021 | | | | 312,300 | |
| | 5,000,000 | | | Empresas Publicas de Medellin E.S.P. | | | 7.63% | | | | 07/29/2019 | | | | 5,675,000 | |
| | 12,223,138 | | | ENA Norte Trust | | | 4.95% | | | | 04/25/2023 | | | | 12,528,716 | |
| | 5,400,000 | | | Fondo Mivivienda S.A. | | | 3.38% | | | | 04/02/2019 | | | | 5,474,250 | |
| | 3,000,000 | | | Fondo Mivivienda S.A. | | | 3.38% | ^ | | | 04/02/2019 | | | | 3,041,250 | |
| | 9,000,000 | | | Freeport-McMoRan Copper & Gold, Inc. | | | 2.38% | | | | 03/15/2018 | | | | 8,010,000 | |
| | 8,000,000 | | | Global Bank Corporation | | | 4.75% | | | | 10/05/2017 | | | | 8,130,000 | |
| | 2,000,000 | | | Global Bank Corporation | | | 5.13% | | | | 10/30/2019 | | | | 2,035,000 | |
| | 4,000,000 | | | Global Bank Corporation | | | 5.13% | ^ | | | 10/30/2019 | | | | 4,070,000 | |
| | 12,550,000 | | | Globo Communicacao e Participacoes S.A. | | | 5.31% | # | | | 05/11/2022 | | | | 12,474,700 | |
| | 11,080,000 | | | Grupo Aval Ltd. | | | 5.25% | | | | 02/01/2017 | | | | 11,343,150 | |
| | 200,000 | | | Grupo Aval Ltd. | | | 5.25% | ^ | | | 02/01/2017 | | | | 204,750 | |
| | 2,500,000 | | | Grupo Aval Ltd. | | | 4.75% | | | | 09/26/2022 | | | | 2,337,500 | |
| | 500,000 | | | Grupo Bimbo S.A.B. de C.V. | | | 4.50% | | | | 01/25/2022 | | | | 531,643 | |
| | | | | | | | | | | | | | | | |
PRINCIPAL
AMOUNT $ | | | SECURITY DESCRIPTION | | RATE | | | MATURITY | | | VALUE $ | |
| | 2,800,000 | | | Grupo Cementos de Chihuahua S.A.B de C.V. | | | 8.13% | | | | 02/08/2020 | | | | 2,912,000 | |
| | 500,000 | | | Grupo Idesa S.A. de C.V. | | | 7.88% | | | | 12/18/2020 | | | | 488,125 | |
| | 1,000,000 | | | Grupo Televisa S.A.B | | | 6.00% | | | | 05/15/2018 | | | | 1,085,915 | |
| | 6,400,000 | | | GrupoSura Finance S.A. | | | 5.70% | | | | 05/18/2021 | | | | 6,652,800 | |
| | 9,569,765 | | | Guanay Finance Ltd. | | | 6.00% | | | | 12/15/2020 | | | | 9,306,596 | |
| | 11,000,000 | | | Hutchison Whampoa International Ltd. | | | 6.00% | #† | | | 05/07/2017 | | | | 11,390,500 | |
| �� | 3,543,014 | | | Interoceanica Finance Ltd. | | | 0.00% | | | | 11/30/2018 | | | | 3,383,579 | |
| | 8,000,000 | | | Inversiones CMPC S.A. | | | 4.75% | | | | 01/19/2018 | | | | 8,281,456 | |
| | 400,000 | | | Israel Electric Corporation Ltd. | | | 2.50% | # | | | 01/17/2018 | | | | 395,000 | |
| | 5,000,000 | | | Israel Electric Corporation Ltd. | | | 5.63% | | | | 06/21/2018 | | | | 5,323,450 | |
| | 2,800,000 | | | Marfrig Holdings B.V. | | | 6.88% | ^ | | | 06/24/2019 | | | | 2,670,500 | |
| | 2,000,000 | | | Minerva Luxembourg S.A. | | | 8.75% | #† | | | 04/03/2019 | | | | 1,887,500 | |
| | 9,450,000 | | | Nacional Financiera S.N.C. | | | 3.38% | | | | 11/05/2020 | | | | 9,544,500 | |
| | 4,000,000 | | | Oleoducto Central S.A. | | | 4.00% | | | | 05/07/2021 | | | | 3,805,000 | |
| | 9,470,000 | | | ONGC Videsh Ltd. | | | 3.25% | | | | 07/15/2019 | | | | 9,626,539 | |
| | 8,100,000 | | | Ooredoo Tamweel Ltd. | | | 3.04% | | | | 12/03/2018 | | | | 8,263,013 | |
| | 1,995,000 | | | Orange S.A. | | | 2.75% | | | | 09/14/2016 | | | | 2,010,084 | |
| | 2,847,000 | | | Orange S.A. | | | 2.75% | | | | 02/06/2019 | | | | 2,936,960 | |
| | 3,000,000 | | | Oversea-Chinese Banking Corporation | | | 3.75% | # | | | 11/15/2022 | | | | 3,084,750 | |
| | 9,000,000 | | | Oversea-Chinese Banking Corporation | | | 4.00% | # | | | 10/15/2024 | | | | 9,358,362 | |
| | 1,000,000 | | | Pacific Rubiales Energy Corporation | | | 5.38% | ^W | | | 01/26/2019 | | | | 175,000 | |
| | 7,000,000 | | | Pacific Rubiales Energy Corporation | | | 5.38% | W | | | 01/26/2019 | | | | 1,225,000 | |
| | 5,161,647 | | | Peru Enhanced Pass-Through Finance Ltd. | | | 0.00% | | | | 05/31/2018 | | | | 4,973,298 | |
| | 134,481 | | | Peru Enhanced Pass-Through Finance Ltd. | | | 0.00% | ^ | | | 05/31/2018 | | | | 129,574 | |
| | 5,000,000 | | | Petroleos Mexicanos | | | 3.50% | | | | 07/18/2018 | | | | 5,080,000 | |
| | 2,400,000 | | | Petroleos Mexicanos | | | 2.64% | # | | | 07/18/2018 | | | | 2,354,040 | |
| | 2,600,000 | | | Petroleos Mexicanos | | | 5.50% | | | | 01/21/2021 | | | | 2,702,375 | |
| | 2,144,700 | | | Ras Laffan Liquefied Natural Gas Company | | | 5.30% | | | | 09/30/2020 | | | | 2,310,107 | |
| | 500,000 | | | Reliance Holdings, Inc. | | | 4.50% | | | | 10/19/2020 | | | | 538,724 | |
| | 5,400,000 | | | Royal Bank of Canada | | | 2.00% | | | | 12/10/2018 | | | | 5,455,577 | |
| | 9,000,000 | | | Sigma Alimentos S.A. | | | 5.63% | | | | 04/14/2018 | | | | 9,594,000 | |
| | 1,800,000 | | | Sinopec Group Overseas Development Ltd. | | | 2.50% | ^ | | | 04/28/2020 | | | | 1,809,925 | |
| | 3,200,000 | | | Sinopec Group Overseas Development Ltd. | | | 2.50% | | | | 04/28/2020 | | | | 3,217,645 | |
| | 3,000,000 | | | SK Telecom
Company Ltd. | | | 2.13% | | | | 05/01/2018 | | | | 3,020,778 | |
| | 8,800,000 | | | Sociedad Quimica y Minera S.A. | | | 6.13% | | | | 04/15/2016 | | | | 8,807,225 | |
| | 3,000,000 | | | Sociedad Quimica y Minera S.A. | | | 5.50% | | | | 04/21/2020 | | | | 3,114,750 | |
| | 6,108,000 | | | Southern Copper Corporation | | | 3.50% | | | | 11/08/2022 | | | | 5,895,203 | |
| | 1,000,000 | | | Tanner Servicios Financieros S.A. | | | 4.38% | ^ | | | 03/13/2018 | | | | 982,500 | |
| | 4,000,000 | | | Tanner Servicios Financieros S.A. | | | 4.38% | | | | 03/13/2018 | | | | 3,930,000 | |
| | 200,000 | | | Telefonica Celular del Paraguay S.A. | | | 6.75% | | | | 12/13/2022 | | | | 197,000 | |
| | 1,400,000 | | | Tencent Holdings Ltd. | | | 2.88% | ^ | | | 02/11/2020 | | | | 1,424,998 | |
| | 4,924,000 | | | Thomson Reuters Corporation | | | 1.30% | | | | 02/23/2017 | | | | 4,916,289 | |
| | 4,875,000 | | | Toronto Dominion Bank | | | 1.75% | | | | 07/23/2018 | | | | 4,898,473 | |
| | 10,164,000 | | | Transportadora de Gas Internacional S.A. | | | 5.70% | | | | 03/20/2022 | | | | 10,352,034 | |
| | 575,000 | | | Transportadora de Gas Internacional S.A. | | | 5.70% | ^ | | | 03/20/2022 | | | | 585,638 | |
| | 420,000 | | | Union Andina de Cementos S.A.A. | | | 5.88% | | | | 10/30/2021 | | | | 422,100 | |
| | | | | | |
| 58 | | DoubleLine Funds Trust | | | | The accompanying notes are an integral part of these financial statements. |
| | | | | | | | | | | | | | | | |
PRINCIPAL
AMOUNT $ | | | SECURITY DESCRIPTION | | RATE | | | MATURITY | | | VALUE $ | |
| | 5,000,000 | | | United Overseas Bank Ltd. | | | 2.88% | # | | | 10/17/2022 | | | | 5,078,000 | |
| | 9,000,000 | | | United Overseas Bank Ltd. | | | 3.75% | # | | | 09/19/2024 | | | | 9,281,970 | |
| | 4,715,000 | | | Westpac Banking Corporation | | | 1.95% | | | | 11/23/2018 | | | | 4,757,543 | |
| | | | | | | | | | | | | | | | |
| | | | Total Foreign Corporate Bonds
(Cost $495,743,451) | | | | 489,919,812 | |
| | | | | | | | | | | | | | | | |
| FOREIGN GOVERNMENT BONDS AND NOTES, SUPRANATIONALS AND
FOREIGN AGENCIES 0.7% |
|
| | 400,000 | | | Brazilian Government International Bond | | | 8.00% | | | | 01/15/2018 | | | | 425,000 | |
| | 6,000,000 | | | Colombia Government International Bond | | | 4.38% | | | | 07/12/2021 | | | | 6,270,000 | |
| | 9,000,000 | | | Mexico Government International Bond | | | 3.50% | | | | 01/21/2021 | | | | 9,337,500 | |
| | 5,000,000 | | | Panama Government International Bond | | | 5.20% | | | | 01/30/2020 | | | | 5,525,000 | |
| | | | | | | | | | | | | | | | |
| | | | Total Foreign Government Bonds and Notes, Supranationals and Foreign Agencies
(Cost $21,315,853) | | | | 21,557,500 | |
| | | | | | | | | | | | | | | | |
| | NON-AGENCY COMMERCIAL MORTGAGE BACKED OBLIGATIONS 20.4% | |
| |
| | | | Arbor Realty Ltd., | |
| | 3,710,000 | | | Series 2015-FL2A-C | | | 5.44% | #^ | | | 09/15/2025 | | | | 3,262,177 | |
| |
| | | | Asset Securitization Corporation, | |
| | 4,521,455 | | | Series 1997-D4-PS1 | | | 1.41% | # I/O | | | 04/14/2029 | | | | 80,879 | |
| |
| | | | Banc of America Commercial Mortgage Trust, | |
| | 9,750,000 | | | Series 2006-5-AM | | | 5.45% | | | | 09/10/2047 | | | | 9,861,251 | |
| | 6,340,000 | | | Series 2006-6-AM | | | 5.39% | | | | 10/10/2045 | | | | 6,421,275 | |
| | 9,150,000 | | | Series 2007-5-AM | | | 5.77% | # | | | 02/10/2051 | | | | 9,448,651 | |
| |
| | | | Bear Stearns Commercial Mortgage Securities Trust, | |
| | 2,645,000 | | | Series 2007-PW18-AM | | | 6.08% | # | | | 06/11/2050 | | | | 2,767,515 | |
| |
| | | | Bear Stearns Commercial Mortgage Securities, Inc., | |
| | 6,981,460 | | | Series 2006-PW13-A4 | | | 5.54% | | | | 09/11/2041 | | | | 7,002,901 | |
| | 6,254,000 | | | Series 2006-PW13-AJ | | | 5.61% | # | | | 09/11/2041 | | | | 6,227,240 | |
| | 10,250,000 | | | Series 2006-PW13-AM | | | 5.58% | # | | | 09/11/2041 | | | | 10,347,847 | |
| | 3,762,000 | | | Series 2007-PW16-AM | | | 5.72% | # | | | 06/11/2040 | | | | 3,875,415 | |
| | 5,209,139 | | | Series 2007-T26-AJ | | | 5.57% | # | | | 01/12/2045 | | | | 5,131,519 | |
| |
| | | | Boca Hotel Portfolio Trust, | |
| | 1,523,024 | | | Series 2013-BOCA-A | | | 1.59% | #^ | | | 08/15/2026 | | | | 1,521,333 | |
| | 4,100,000 | | | Series 2013-BOCA-D | | | 3.49% | #^ | | | 08/15/2026 | | | | 4,087,231 | |
| |
| | | | CD Commercial Mortgage Trust, | |
| | 1,704,113 | | | Series 2006-CD2-AM | | | 5.39% | # | | | 01/15/2046 | | | | 1,702,083 | |
| |
| | | | CGGS Commercial Mortgage Trust, | |
| | 9,446,000 | | | Series 2016-RNDB-AFL | | | 2.10% | #^ | | | 02/15/2033 | | | | 9,457,842 | |
| |
| | | | Citigroup Commercial Mortgage Trust, | |
| | 10,500,000 | | | Series 2007-C6-AMFX | | | 5.70% | #^ | | | 12/10/2049 | | | | 10,618,799 | |
| | 9,157,400 | | | Series 2008-C7-AM | | | 6.14% | # | | | 12/10/2049 | | | | 9,355,790 | |
| | 65,794,000 | | | Series 2016-P3-XA | | | 1.72% | # I/O | | | 04/15/2049 | | | | 7,877,588 | |
| |
| | | | COBALT Commercial Mortgage Trust, | |
| | 9,341,000 | | | Series 2006-C1-AM | | | 5.25% | | | | 08/15/2048 | | | | 9,283,771 | |
| | 12,000,000 | | | Series 2007-C2-AJFX | | | 5.57% | # | | | 04/15/2047 | | | | 11,726,215 | |
| |
| | | | Colony Mortgage Capital Ltd., | |
| | 9,315,000 | | | Series 2015-FL3-A | | | 2.39% | #^ | | | 09/05/2032 | | | | 9,288,899 | |
| |
| | | | Commercial Mortgage Pass-Through Certificates, | |
| | 8,705,024 | | | Series 2012-CR2-XA | | | 1.75% | # I/O | | | 08/15/2045 | | | | 731,968 | |
| | 28,473,450 | | | Series 2014-CR19-XA | | | 1.29% | # I/O | | | 08/10/2047 | | | | 1,891,132 | |
| | 8,600,000 | | | Series 2014-KYO-E | | | 2.79% | #^ | | | 06/11/2027 | | | | 8,434,276 | |
| | 9,650,000 | | | Series 2014-KYO-F | | | 3.94% | #^ | | | 06/11/2027 | | | | 9,565,843 | |
| | 3,890,000 | | | Series 2014-TWC-C | | | 2.28% | #^ | | | 02/13/2032 | | | | 3,789,638 | |
| |
| | | | Countrywide Commercial Mortgage Trust, | |
| | 9,243,298 | | | Series 2007-MF1-A | | | 6.07% | #^ | | | 11/12/2043 | | | | 9,540,073 | |
| | | | | | | | | | | | | | | | |
PRINCIPAL
AMOUNT $ | | | SECURITY DESCRIPTION | | RATE | | | MATURITY | | | VALUE $ | |
| | | | Credit Suisse First Boston Mortgage Securities Corporation, | |
| | 164,363 | | | Series 1998-C2-F | | | 6.75% | #^ | | | 11/15/2030 | | | | 165,560 | |
| |
| | | | Credit Suisse Mortgage Capital Certificates, | |
| | 10,381,000 | | | Series 2006-C3-AM | | | 6.14% | # | | | 06/15/2038 | | | | 10,406,458 | |
| | 10,381,000 | | | Series 2006-C4-AM | | | 5.51% | | | | 09/15/2039 | | | | 10,471,413 | |
| | 10,500,000 | | | Series 2007-C4-A1AM | | | 5.94% | # | | | 09/15/2039 | | | | 10,508,312 | |
| | 6,918,248 | | | Series 2007-C5-A4 | | | 5.70% | # | | | 09/15/2040 | | | | 7,139,854 | |
| | 3,180,000 | | | Series 2008-C1-AM | | | 6.07% | #^ | | | 02/15/2041 | | | | 3,332,804 | |
| | 678,000 | | | Series 2009-RR2-IQB | | | 5.69% | #^ | | | 04/16/2049 | | | | 690,114 | |
| |
| | | | GE Commercial Mortgage Corporation Trust, | |
| | 10,497,000 | | | Series 2007-C1-AM | | | 5.61% | # | | | 12/10/2049 | | | | 10,397,369 | |
| |
| | | | Greenwich Capital Commercial Funding Corporation, | |
| | 4,838,500 | | | Series 2007-GG11-AJ | | | 6.03% | # | | | 12/10/2049 | | | | 4,769,058 | |
| | 8,430,000 | | | Series 2007-GG11-AM | | | 5.87% | # | | | 12/10/2049 | | | | 8,674,392 | |
| | 11,500,000 | | | Series 2007-GG9-AM | | | 5.48% | | | | 03/10/2039 | | | | 11,678,620 | |
| |
| | | | GS Mortgage Securities Corporation, | |
| | 9,116,392 | | | Series 2007-GG10-A4 | | | 5.79% | # | | | 08/10/2045 | | | | 9,401,176 | |
| | 91,730 | | | Series 2012-GCJ7-A1 | | | 1.14% | | | | 05/10/2045 | | | | 91,698 | |
| | 9,379,000 | | | Series 2016-ICE2-A | | | 2.37% | #^ | | | 02/15/2033 | | | | 9,392,422 | |
| |
| | | | JP Morgan Chase Commercial Mortgage Securities Corporation, | |
| | 74,566 | | | Series 2004-LN2-A2 | | | 5.12% | | | | 07/15/2041 | | | | 74,669 | |
| | 3,866 | | | Series 2006-CB17-ASB | | | 5.42% | | | | 12/12/2043 | | | | 3,862 | |
| | 5,970,000 | | | Series 2006-LDP8-AJ | | | 5.48% | # | | | 05/15/2045 | | | | 5,955,267 | |
| | 8,680,000 | | | Series 2006-LDP9-AM | | | 5.37% | | | | 05/15/2047 | | | | 8,721,034 | |
| | 4,260,000 | | | Series 2007-C1-AM | | | 5.94% | # | | | 02/15/2051 | | | | 4,334,985 | |
| | 10,866,373 | | | Series 2007-CB20-AM | | | 5.88% | # | | | 02/12/2051 | | | | 11,371,767 | |
| | 11,495,000 | | | Series 2007-CIBC18-AM | | | 5.47% | # | | | 06/12/2047 | | | | 11,661,837 | |
| | 10,548,000 | | | Series 2007-CIBC19-AM | | | 5.70% | # | | | 02/12/2049 | | | | 10,777,803 | |
| | 9,950,000 | | | Series 2007-CIBC20-AJ | | | 6.08% | # | | | 02/12/2051 | | | | 9,703,226 | |
| | 16,360,000 | | | Series 2007-LD12-AM | | | 6.01% | # | | | 02/15/2051 | | | | 17,070,986 | |
| | 77,940 | | | Series 2010-C1-A1 | | | 3.85% | ^ | | | 06/15/2043 | | | | 77,881 | |
| | 149,796 | | | Series 2011-PLSD-A1 | | | 2.19% | ^ | | | 11/13/2028 | | | | 150,175 | |
| | 2,500,000 | | | Series 2014-INN-C | | | 2.14% | #^ | | | 06/15/2029 | | | | 2,395,000 | |
| | 2,500,000 | | | Series 2014-INN-D | | | 2.79% | #^ | | | 06/15/2029 | | | | 2,362,915 | |
| | 9,000,000 | | | Series 2014-PHH-D | | | 2.84% | #^ | | | 08/15/2027 | | | | 8,909,263 | |
| | 10,500,000 | | | Series 2015-CSMO-C | | | 2.69% | #^ | | | 01/15/2032 | | | | 10,242,882 | |
| | 7,726,287 | | | Series 2015-JP1-A1 | | | 1.95% | | | | 01/15/2049 | | | | 7,782,662 | |
| |
| | | | JP Morgan Chase Commercial Mortgage Securities Trust, | |
| | 9,341,000 | | | Series 2007-LD11-AM | | | 5.74% | # | | | 06/15/2049 | | | | 9,252,346 | |
| | 8,903,173 | | | Series 2008-C2-A4 | | | 6.07% | | | | 02/12/2051 | | | | 9,287,374 | |
| |
| | | | LB Commercial Mortgage Trust, | |
| | 10,730,000 | | | Series 2007-C3-AM | | | 5.90% | # | | | 07/15/2044 | | | | 11,097,348 | |
| |
| | | | LB-UBS Commercial Mortgage Trust, | |
| | 4,350,000 | | | Series 2006-C7-AM | | | 5.38% | | | | 11/15/2038 | | | | 4,410,940 | |
| | 10,584,723 | | | Series 2007-C1-AJ | | | 5.48% | | | | 02/15/2040 | | | | 10,573,126 | |
| | 7,482,000 | | | Series 2007-C1-AM | | | 5.46% | | | | 02/15/2040 | | | | 7,599,921 | |
| | 7,650,000 | | | Series 2007-C2-AM | | | 5.49% | # | | | 02/15/2040 | | | | 7,775,231 | |
| | 8,338,600 | | | Series 2007-C7-AJ | | | 6.24% | # | | | 09/15/2045 | | | | 8,167,334 | |
| |
| | | | LMREC, Inc., | |
| | 8,385,000 | | | Series 2015-CRE1-A | | | 2.18% | #^ | | | 02/22/2032 | | | | 8,267,920 | |
| |
| | | | Merrill Lynch Mortgage Trust, | |
| | 9,341,000 | | | Series 2007-C1-AM | | | 5.84% | # | | | 06/12/2050 | | | | 9,148,273 | |
| |
| | | | Merrill Lynch/Countrywide Commercial Mortgage Trust, | |
| | 1,697,962 | | | Series 2006-1-AJ | | | 5.74% | # | | | 02/12/2039 | | | | 1,696,425 | |
| | 2,985,000 | | | Series 2006-2-AJ | | | 5.95% | # | | | 06/12/2046 | | | | 2,999,631 | |
| |
| | | | Morgan Stanley Bank of America Merrill Lynch Trust, | |
| | 3,595,224 | | | Series 2012-C5-XA | | | 1.74% | #^ I/O | | | 08/15/2045 | | | | 231,306 | |
| |
| | | | Morgan Stanley Capital, Inc., | |
| | 638,156 | | | Series 2005-T19-AJ | | | 4.99% | # | | | 06/12/2047 | | | | 637,854 | |
| | 20,911,616 | | | Series 2006-HQ10-X1 | | | 0.50% | #^ I/O | | | 11/12/2041 | | | | 16,227 | |
| | 9,252,567 | | | Series 2006-XLF-J | | | 0.86% | #^ | | | 07/15/2019 | | | | 9,014,387 | |
| | 9,000,000 | | | Series 2007-HQ11-AJ | | | 5.51% | # | | | 02/12/2044 | | | | 8,856,297 | |
| | 7,657,000 | | | Series 2007-IQ13-AM | | | 5.41% | | | | 03/15/2044 | | | | 7,899,082 | |
| | 10,780,000 | | | Series 2007-IQ14-A4 | | | 5.69% | # | | | 04/15/2049 | | | | 11,041,859 | |
| | 10,055,000 | | | Series 2007-IQ16-AM | | | 6.05% | # | | | 12/12/2049 | | | | 10,513,786 | |
| | 1,815,368 | | | Series 2007-XLFA-D | | | 0.63% | #^ | | | 10/15/2020 | | | | 1,817,754 | |
| |
| | | | Morgan Stanley Re-Remic Trust, | |
| | 1,715,000 | | | Series 2009-GG10-A4B | | | 5.79% | #^ | | | 08/12/2045 | | | | 1,753,596 | |
| | 572,090 | | | Series 2012-IO-AXA | | | 1.00% | ^ | | | 03/27/2051 | | | | 566,526 | |
| | | | | | |
| The accompanying notes are an integral part of these financial statements. | | Annual Report | | March 31, 2016 | | 59 |
| | |
| Schedule of Investments DoubleLine Low Duration Bond Fund (Cont.) | | March 31, 2016 |
| | | | | | | | | | | | | | | | |
PRINCIPAL
AMOUNT $ | | | SECURITY DESCRIPTION | | RATE | | | MATURITY | | | VALUE $ | |
| |
| | | | Velocity Commercial Capital Loan Trust, | |
| | 17,655,763 | | | Series 2015-1-AFL | | | 2.86% | #^ | | | 06/25/2045 | | | | 17,766,111 | |
| |
| | | | Wachovia Bank Commercial Mortgage Trust, | |
| | 967,601 | | | Series 2006-C24-AJ | | | 5.66% | # | | | 03/15/2045 | | | | 966,234 | |
| | 8,770,000 | | | Series 2006-C28-AJ | | | 5.63% | # | | | 10/15/2048 | | | | 8,576,233 | |
| | 9,160,000 | | | Series 2007-C30-AM | | | 5.38% | | | | 12/15/2043 | | | | 9,328,188 | |
| | 6,770,000 | | | Series 2007-C31-AM | | | 5.59% | # | | | 04/15/2047 | | | | 6,942,929 | |
| | 6,850,000 | | | Series 2007-C32-AMFX | | | 5.70% | ^ | | | 06/15/2049 | | | | 7,007,942 | |
| | 4,120,000 | | | Series 2007-C33-AJ | | | 5.95% | # | | | 02/15/2051 | | | | 4,066,690 | |
| | 10,065,000 | | | Series 2007-C33-AM | | | 5.95% | # | | | 02/15/2051 | | | | 10,412,257 | |
| |
| | | | WF-RBS Commercial Mortgage Trust, | |
| | 17,712,102 | | | Series 2012-C8-XA | | | 2.15% | #^ I/O | | | 08/15/2045 | | | | 1,406,701 | |
| | | | | | | | | | | | | | | | |
| | | | Total Non-Agency Commercial Mortgage Backed Obligations
(Cost $608,222,842) | | | | 591,112,443 | |
| | | | | | | | | | | | | | | | |
| NON-AGENCY RESIDENTIAL COLLATERALIZED MORTGAGE
OBLIGATIONS 11.9% |
|
| |
| | | | Ajax Mortgage Loan Trust, | |
| | 23,046,605 | | | Series 2015-B-A | | | 3.88% | #^ | | | 07/25/2060 | | | | 23,136,176 | |
| |
| | | | Banc of America Funding Corporation, | |
| | 703,321 | | | Series 2005-E-6A1 | | | 2.70% | # | | | 05/20/2035 | | | | 697,512 | |
| | 201,947 | | | Series 2012-R4-A | | | 0.70% | #^ | | | 03/04/2039 | | | | 201,052 | |
| | 896,782 | | | Series 2012-R5-A | | | 0.70% | #^ | | | 10/03/2039 | | | | 893,697 | |
| |
| | | | Banc of America Mortgage Securities, Inc., | |
| | 3,392,257 | | | Series 2005-E-2A1 | | | 2.78% | # | | | 06/25/2035 | | | | 3,225,141 | |
| |
| | | | Bayview Opportunity Master Fund Trust, | |
| | 5,867,200 | | | Series 2015-1-A | | | 3.84% | #^ | | | 01/28/2030 | | | | 5,877,726 | |
| | 19,703,858 | | | Series 2016-A-A | | | 4.46% | #^ | | | 01/28/2036 | | | | 19,770,897 | |
| |
| | | | BCAP LLC Trust, | |
| | 21,471 | | | Series 2009-RR13-6A5 | | | 6.00% | #^ | | | 04/26/2037 | | | | 21,833 | |
| | 584,313 | | | Series 2011-RR12-2A5 | | | 2.35% | #^ | | | 12/26/2036 | | | | 582,191 | |
| | 3,675,259 | | | Series 2011-RR1-8A3 | | | 6.00% | #^ | | | 08/28/2021 | | | | 3,711,677 | |
| | 4,018,484 | | | Series 2013-RR1-4A2 | | | 4.00% | #^ | | | 08/26/2037 | | | | 4,001,235 | |
| |
| | | | Bear Stearns Adjustable Rate Mortgage Trust, | |
| | 6,195,675 | | | Series 2003-9-4A1 | | | 2.87% | # | | | 02/25/2034 | | | | 6,161,142 | |
| |
| | | | Bear Stearns Asset Backed Securities Trust, | |
| | 1,032,526 | | | Series 2004-AC2-2A | | | 5.00% | | | | 05/25/2034 | | | | 1,026,339 | |
| |
| | | | CAM Mortgage LLC, | |
| | 24,575,943 | | | Series 2015-1-A | | | 3.50% | #^ | | | 07/15/2064 | | | | 24,659,425 | |
| |
| | | | Citicorp Residential Mortgage Securities, Inc., | |
| | 4,207,443 | | | Series 2007-1-A4 | | | 5.80% | # | | | 03/25/2037 | | | | 4,437,048 | |
| | 19,262,334 | | | Series 2007-2-A4 | | | 5.44% | # | | | 06/25/2037 | | | | 20,045,178 | |
| |
| | | | Citigroup Mortgage Loan Trust, Inc., | |
| | 3,346,109 | | | Series 2006-AR1-2A1 | | | 2.73% | # | | | 03/25/2036 | | | | 3,201,032 | |
| | 2,668,393 | | | Series 2007-WFHE2-A3 | | | 0.61% | # | | | 03/25/2037 | | | | 2,618,707 | |
| | 160,870 | | | Series 2010-12-3A1 | | | 4.00% | ^ | | | 04/25/2037 | | | | 161,543 | |
| | 407,346 | | | Series 2010-8-5A6 | | | 4.00% | ^ | | | 11/25/2036 | | | | 408,382 | |
| | 83,177 | | | Series 2011-12-1A1 | | | 3.50% | #^ | | | 04/25/2036 | | | | 83,057 | |
| | 376,412 | | | Series 2011-12-3A1 | | | 2.75% | #^ | | | 09/25/2047 | | | | 375,280 | |
| |
| | | | Countrywide Alternative Loan Trust, | |
| | 742,075 | | | Series 2004-28CB-1A1 | | | 5.50% | | | | 01/25/2035 | | | | 745,711 | |
| |
| | | | Countrywide Asset-Backed Certificates, | |
| | 636,350 | | | Series 2005-15-1AF6 | | | 4.38% | # | | | 04/25/2036 | | | | 645,704 | |
| | 409,915 | | | Series 2006-2-2A2 | | | 0.62% | # | | | 10/25/2034 | | | | 401,083 | |
| |
| | | | Countrywide Home Loans, | |
| | 11,698,834 | | | Series 2004-HYB9-1A1 | | | 2.76% | # | | | 02/20/2035 | | | | 11,643,674 | |
| |
| | | | Credit Suisse First Boston Mortgage Securities Corporation, | |
| | 186,902 | | | Series 2005-11-5A1 | | | 5.25% | | | | 12/25/2020 | | | | 186,603 | |
| |
| | | | Credit Suisse Mortgage Capital Certificates, | |
| | 12,000,000 | | | Series 2011-5R-6A9 | | | 2.74% | #^ | | | 11/27/2037 | | | | 10,897,422 | |
| | 6,123,013 | | | Series 2013-3R-1A1 | | | 1.57% | #^ | | | 04/27/2035 | | | | 5,709,953 | |
| | 28,487,665 | | | Series 2015-RPL3-A1 | | | 3.75% | #^ | | | 12/25/2056 | | | | 28,047,195 | |
| |
| | | | Fieldstone Mortgage Investment Trust, | |
| | 1,062,815 | | | Series 2004-5-M2 | | | 2.16% | # | | | 02/25/2035 | | | | 1,055,300 | |
| | | | | | | | | | | | | | | | |
PRINCIPAL
AMOUNT $ | | | SECURITY DESCRIPTION | | RATE | | | MATURITY | | | VALUE $ | |
| |
| | | | First Franklin Mortgage Loan Trust, | |
| | 526,153 | | | Series 2006-FF1-2A3 | | | 0.67% | # | | | 01/25/2036 | | | | 519,559 | |
| |
| | | | First Horizon Asset Securities, Inc., | |
| | 11,872,951 | | | Series 2007-AR2-1A1 | | | 2.70% | # | | | 08/25/2037 | | | | 9,452,517 | |
| |
| | | | GreenPoint Mortgage Funding Trust, | |
| | 1 | | | Series 2006-AR8-1A1A | | | 0.51% | # | | | 01/25/2047 | | | | 1 | |
| | 84 | | | Series 2007-AR2-1A1 | | | 0.56% | # | | | 04/25/2047 | | | | 84 | |
| |
| | | | GSR Mortgage Loan Trust, | |
| | 5,942,897 | | | Series 2005-AR7-3A1 | | | 2.76% | # | | | 11/25/2035 | | | | 5,592,658 | |
| | 827,209 | | | Series 2006-4F-2A7 | | | 5.50% | | | | 05/25/2036 | | | | 806,045 | |
| |
| | | | Home Equity Mortgage Loan Asset-Backed Trust, | |
| | 729,468 | | | Series 2006-D-2A2 | | | 0.54% | # | | | 11/25/2036 | | | | 723,855 | |
| |
| | | | Impac Secured Assets Trust, | |
| | 18,130,144 | | | Series 2006-5-1A1C | | | 0.70% | # | | | 02/25/2037 | | | | 11,646,928 | |
| |
| | | | JP Morgan Alternative Loan Trust, | |
| | 980,440 | | | Series 2006-S4-A6 | | | 5.71% | # | | | 12/25/2036 | | | | 921,709 | |
| |
| | | | JP Morgan Mortgage Acquisition Corporation, | |
| | 1,553,438 | | | Series 2007-CH5-A3 | | | 0.54% | # | | | 05/25/2037 | | | | 1,538,841 | |
| |
| | | | JP Morgan Mortgage Trust, | |
| | 146,983 | | | Series 2007-S1-1A1 | | | 5.00% | | | | 03/25/2022 | | | | 145,329 | |
| | 104,258 | | | Series 2007-S3-2A2 | | | 5.50% | | | | 08/25/2022 | | | | 102,543 | |
| |
| | | | JP Morgan Resecuritization Trust, | |
| | 19,571 | | | Series 2009-7-8A1 | | | 3.02% | #^ | | | 01/27/2047 | | | | 19,555 | |
| | 89,726 | | | Series 2011-2-2A3 | | | 3.50% | #^ | | | 07/26/2036 | | | | 89,798 | |
| | 528,413 | | | Series 2012-2-3A3 | | | 2.45% | #^ | | | 10/26/2036 | | | | 526,510 | |
| |
| | | | Lehman XS Trust, | |
| | 952,233 | | | Series 2007-4N-1A1 | | | 0.57% | # | | | 03/25/2047 | | | | 941,055 | |
| |
| | | | MASTR Adjustable Rate Mortgages Trust, | |
| | 10,068,724 | | | Series 2006-2-2A1 | | | 2.75% | # | | | 04/25/2036 | | | | 9,289,271 | |
| | 1,453,375 | | | Series 2007-2-A2 | | | 0.54% | # | | | 03/25/2047 | | | | 1,427,487 | |
| |
| | | | MASTR Asset Backed Securities Trust, | |
| | 14,008 | | | Series 2006-NC1-A3 | | | 0.62% | # | | | 01/25/2036 | | | | 14,008 | |
| |
| | | | Merrill Lynch Mortgage Investors Trust, | |
| | 7,463,914 | | | Series 2005-3-2A | | | 2.42% | # | | | 11/25/2035 | | | | 7,345,675 | |
| |
| | | | Morgan Stanley Capital, Inc., | |
| | 1,029,292 | | | Series 2005-WMC3-M3 | | | 1.14% | # | | | 03/25/2035 | | | | 1,028,779 | |
| |
| | | | Morgan Stanley Mortgage Loan Trust, | |
| | 69,944 | | | Series 2004-1-1A1 | | | 5.00% | | | | 11/25/2018 | | | | 71,686 | |
| |
| | | | Morgan Stanley Re-Remic Trust, | |
| | 5,019,657 | | | Series 2012-R3-2A | | | 0.67% | #^ | | | 02/26/2037 | | | | 4,717,928 | |
| |
| | | | NRTL Trust, | |
| | 18,865,097 | | | Series 2016-LH1-A | | | 4.50% | #^ | | | 04/25/2019 | | | | 18,795,245 | |
| |
| | | | Opteum Mortgage Acceptance Corporation, | |
| | 865,812 | | | Series 2005-5-2AN | | | 5.68% | # | | | 12/25/2035 | | | | 876,371 | |
| |
| | | | Pacific Bay Ltd., | |
| | 8,807,218 | | | Series 2003-1A-A2 | | | 1.80% | #^ | | | 11/04/2038 | | | | 8,366,857 | |
| |
| | | | Residential Asset Mortgage Products, Inc., | |
| | 5,950,950 | | | Series 2005-EFC7-AI3 | | | 0.68% | # | | | 04/25/2034 | | | | 5,633,481 | |
| |
| | | | Residential Asset Securities Corporation, | |
| | 2,453,033 | | | Series 2006-KS6-A3 | | | 0.58% | # | | | 08/25/2036 | | | | 2,372,727 | |
| |
| | | | Residential Funding Mortgage Securities Trust, | |
| | 83,123 | | | Series 2003-S16-A1 | | | 4.75% | | | | 09/25/2018 | | | | 83,493 | |
| |
| | | | Soundview Home Equity Loan Trust, | |
| | 725,452 | | | Series 2007-NS1-A2 | | | 0.58% | # | | | 01/25/2037 | | | | 723,363 | |
| |
| | | | Springleaf Mortgage Loan Trust, | |
| | 5,269,567 | | | Series 2014-3A-A | | | 1.87% | #^ | | | 09/25/2057 | | | | 5,281,984 | |
| |
| | | | Structured Adjustable Rate Mortgage Loan Trust, | |
| | 1,890,965 | | | Series 2007-1-2A2 | | | 4.13% | # | | | 02/25/2037 | | | | 1,811,340 | |
| |
| | | | Structured Asset Securities Corporation, | |
| | 462,648 | | | Series 2003-24A-1A3 | | | 2.55% | # | | | 07/25/2033 | | | | 452,924 | |
| | 168,973 | | | Series 2004-15-2A1 | | | 4.75% | | | | 09/25/2019 | | | | 170,570 | |
| | 382,259 | | | Series 2005-10-6A1 | | | 5.00% | | | | 06/25/2020 | | | | 389,488 | |
| | 1,621,650 | | | Series 2005-AXS-1A3 | | | 5.00% | # | | | 03/25/2035 | | | | 1,624,769 | |
| | | | | | |
| 60 | | DoubleLine Funds Trust | | | | The accompanying notes are an integral part of these financial statements. |
| | | | | | | | | | | | | | | | |
PRINCIPAL
AMOUNT $ | | | SECURITY DESCRIPTION | | RATE | | | MATURITY | | | VALUE $ | |
| |
| | | | Towd Point Mortgage Trust, | |
| | 26,287,561 | | | Series 2015-2-1A13 | | | 2.50% | #^ | | | 11/25/2060 | | | | 26,307,866 | |
| |
| | | | VOLT LLC, | |
| | 22,255,025 | | | Series 2014-NPL6-A1 | | | 3.13% | #^ | | | 09/25/2043 | | | | 21,995,407 | |
| |
| | | | Washington Mutual Mortgage Pass-Through Certificates, | |
| | 1,295,597 | | | Series 2002-AR16-A | | | 2.55% | # | | | 12/25/2032 | | | | 1,259,855 | |
| |
| | | | Wells Fargo Alternative Loan Trust, | |
| | 218,583 | | | Series 2007-PA5-2A1 | | | 6.00% | | | | 11/25/2022 | | | | 221,607 | |
| |
| | | | Wells Fargo Mortgage Backed Securities Trust, | |
| | 5,289,545 | | | Series 2006-AR6-5A1 | | | 2.80% | # | | | 03/25/2036 | | | | 5,249,745 | |
| |
| | | | Wells Fargo Mortgage Loan Trust, | |
| | 95,808 | | | Series 2012-RR1-A1 | | | 2.85% | #^ | | | 08/27/2037 | | | | 95,778 | |
| | | | | | | | | | | | | | | | |
| | | | Total Non-Agency Residential Collateralized Mortgage Obligations
(Cost $347,048,846) | | | | 343,263,606 | |
| | | | | | | | | | | | | | | | |
| | US CORPORATE BONDS 9.6% | |
| | 4,815,000 | | | AbbVie, Inc. | | | 1.80% | | | | 05/14/2018 | | | | 4,850,458 | |
| | 5,090,000 | | | Amazon.com, Inc. | | | 2.60% | | | | 12/05/2019 | | | | 5,301,627 | |
| | 5,100,000 | | | American Express Credit Corporation | | | 1.80% | | | | 07/31/2018 | | | | 5,124,449 | |
| | 4,785,000 | | | American Honda Finance Corporation | | | 1.70% | | | | 02/22/2019 | | | | 4,827,687 | |
| | 5,385,000 | | | Anheuser-Busch InBev Finance, Inc. | | | 1.90% | | | | 02/01/2019 | | | | 5,465,150 | |
| | 2,055,000 | | | Apple, Inc. | | | 1.70% | | | | 02/22/2019 | | | | 2,087,613 | |
| | 4,770,000 | | | AT&T, Inc. | | | 2.30% | | | | 03/11/2019 | | | | 4,874,549 | |
| | 6,380,000 | | | Bank of America Corporation | | | 2.00% | | | | 01/11/2018 | | | | 6,409,731 | |
| | 4,654,000 | | | BB&T Corporation | | | 2.15% | | | | 03/22/2017 | | | | 4,701,238 | |
| | 725,000 | | | BB&T Corporation | | | 2.25% | | | | 02/01/2019 | | | | 737,757 | |
| | 4,875,000 | | | Berkshire Hathaway Finance Corporation | | | 1.70% | | | | 03/15/2019 | | | | 4,956,690 | |
| | 4,545,000 | | | Boston Properties LP | | | 5.88% | | | | 10/15/2019 | | | | 5,088,468 | |
| | 4,570,000 | | | Cardinal Health, Inc. | | | 1.95% | | | | 06/15/2018 | | | | 4,594,413 | |
| | 4,910,000 | | | Caterpillar Financial Services Corporation | | | 1.70% | | | | 06/16/2018 | | | | 4,951,519 | |
| | 5,110,000 | | | Celgene Corporation | | | 2.13% | | | | 08/15/2018 | | | | 5,171,576 | |
| | 2,960,000 | | | Chevron Corporation | | | 1.37% | | | | 03/02/2018 | | | | 2,971,722 | |
| | 1,714,000 | | | Chevron Corporation | | | 1.79% | | | | 11/16/2018 | | | | 1,735,622 | |
| | 4,950,000 | | | Cisco Systems, Inc. | | | 1.65% | | | | 06/15/2018 | | | | 5,026,784 | |
| | 6,390,000 | | | Citigroup, Inc. | | | 2.05% | | | | 12/07/2018 | | | | 6,422,052 | |
| | 4,251,000 | | | Comcast Corporation | | | 6.50% | | | | 01/15/2017 | | | | 4,435,876 | |
| | 4,909,000 | | | ConocoPhillips Company | | | 1.05% | | | | 12/15/2017 | | | | 4,840,588 | |
| | 4,324,000 | | | Covidien International Finance S.A. | | | 6.00% | | | | 10/15/2017 | | | | 4,640,772 | |
| | 4,714,000 | | | CVS Health Corporation | | | 1.90% | | | | 07/20/2018 | | | | 4,786,134 | |
| | 160,000 | | | Daimler Finance North America LLC | | | 2.25% | ^ | | | 03/02/2020 | | | | 161,138 | |
| | 4,725,000 | | | Daimler Finance North America LLC | | | 1.65% | ^ | | | 03/02/2018 | | | | 4,732,541 | |
| | 4,550,000 | | | Duke Energy Corporation | | | 1.63% | | | | 08/15/2017 | | | | 4,559,209 | |
| | 1,150,000 | | | Express Scripts Holding Company | | | 2.65% | | | | 02/15/2017 | | | | 1,165,317 | |
| | 3,410,000 | | | Express Scripts Holding Company | | | 1.25% | | | | 06/02/2017 | | | | 3,404,179 | |
| | 235,000 | | | Express Scripts Holding Company | | | 2.25% | | | | 06/15/2019 | | | | 236,940 | |
| | 2,685,000 | | | GE Capital International Funding Company | | | 0.96% | ^ | | | 04/15/2016 | | | | 2,685,158 | |
| | 4,825,000 | | | General Mills, Inc. | | | 2.20% | | | | 10/21/2019 | | | | 4,911,372 | |
| | | | | | | | | | | | | | | | |
PRINCIPAL
AMOUNT $ | | | SECURITY DESCRIPTION | | RATE | | | MATURITY | | | VALUE $ | |
| | 5,295,000 | | | Goldman Sachs Group, Inc. | | | 2.90% | | | | 07/19/2018 | | | | 5,422,382 | |
| | 6,235,000 | | | Hewlett-Packard Company | | | 2.85% | ^ | | | 10/05/2018 | | | | 6,344,537 | |
| | 4,955,000 | | | HJ Heinz Company | | | 2.00% | ^ | | | 07/02/2018 | | | | 5,004,263 | |
| | 3,515,000 | | | Home Depot, Inc. | | | 2.00% | | | | 06/15/2019 | | | | 3,608,699 | |
| | 4,885,000 | | | John Deere Capital Corporation | | | 1.60% | | | | 07/13/2018 | | | | 4,926,430 | |
| | 4,965,000 | | | JP Morgan Chase & Company | | | 2.25% | | | | 01/23/2020 | | | | 5,008,697 | |
| | 4,748,000 | | | Kinder Morgan Energy Partners LP | | | 6.00% | | | | 02/01/2017 | | | | 4,889,514 | |
| | 3,720,000 | | | Kroger Company | | | 2.20% | | | | 01/15/2017 | | | | 3,748,737 | |
| | 770,000 | | | Kroger Company | | | 6.40% | | | | 08/15/2017 | | | | 823,260 | |
| | 4,890,000 | | | Laboratory Corporation | | | 2.50% | | | | 11/01/2018 | | | | 4,935,335 | |
| | 4,955,000 | | | McGraw Hill Financial, Inc. | | | 2.50% | | | | 08/15/2018 | | | | 5,024,583 | |
| | 4,893,000 | | | McKesson Corporation | | | 1.29% | | | | 03/10/2017 | | | | 4,903,177 | |
| | 220,000 | | | Medtronic, Inc. | | | 1.50% | | | | 03/15/2018 | | | | 221,984 | |
| | 4,725,000 | | | Metropolitan Life Global Funding | | | 1.50% | ^ | | | 01/10/2018 | | | | 4,733,325 | |
| | 6,565,000 | | | Morgan Stanley | | | 2.45% | | | | 02/01/2019 | | | | 6,666,987 | |
| | 5,110,000 | | | MUFG Americas Holdings Corporation | | | 1.63% | | | | 02/09/2018 | | | | 5,094,757 | |
| | 3,965,000 | | | National Rural Utilities Cooperative Finance Corporation | | | 2.30% | | | | 11/15/2019 | | | | 4,053,991 | |
| | 4,775,000 | | | Newell Rubbermaid, Inc. | | | 2.60% | | | | 03/29/2019 | | | | 4,848,831 | |
| | 3,995,000 | | | Oracle Corporation | | | 2.38% | | | | 01/15/2019 | | | | 4,143,774 | |
| | 1,000,000 | | | Oracle Corporation | | | 2.25% | | | | 10/08/2019 | | | | 1,032,526 | |
| | 285,000 | | | Pepsico, Inc. | | | 1.50% | | | | 02/22/2019 | | | | 288,711 | |
| | 3,510,000 | | | Pepsico, Inc. | | | 2.15% | | | | 10/14/2020 | | | | 3,602,243 | |
| | 4,120,000 | | | Philip Morris International, Inc. | | | 5.65% | | | | 05/16/2018 | | | | 4,510,036 | |
| | 2,765,000 | | | Phillips 66 | | | 2.95% | | | | 05/01/2017 | | | | 2,816,324 | |
| | 4,775,000 | | | Procter & Gamble Company | | | 1.60% | | | | 11/15/2018 | | | | 4,845,613 | |
| | 3,065,000 | | | Reynolds
American, Inc. | | | 3.25% | | | | 06/12/2020 | | | | 3,210,781 | |
| | 4,759,000 | | | Simon Property Group LP | | | 2.15% | | | | 09/15/2017 | | | | 4,811,297 | |
| | 4,840,000 | | | Southern Company | | | 2.45% | | | | 09/01/2018 | | | | 4,920,973 | |
| | 3,010,000 | | | Thermo Fisher Scientific, Inc. | | | 2.15% | | | | 12/14/2018 | | | | 3,029,092 | |
| | 2,750,000 | | | Toyota Motor Credit Corporation | | | 1.55% | | | | 07/13/2018 | | | | 2,776,331 | |
| | 2,740,000 | | | Toyota Motor Credit Corporation | | | 1.70% | | | | 02/19/2019 | | | | 2,767,252 | |
| | 5,200,000 | | | United Technologies Corporation | | | 1.78% | # | | | 05/04/2018 | | | | 5,215,423 | |
| | 3,754,000 | | | Waste Management, Inc. | | | 2.60% | | | | 09/01/2016 | | | | 3,778,604 | |
| | 725,000 | | | Waste Management, Inc. | | | 6.10% | | | | 03/15/2018 | | | | 792,399 | |
| | 4,000,000 | | | WellPoint, Inc. | | | 1.88% | | | | 01/15/2018 | | | | 4,014,852 | |
| | 905,000 | | | WellPoint, Inc. | | | 2.30% | | | | 07/15/2018 | | | | 915,817 | |
| | 4,695,000 | | | Wells Fargo & Company | | | 2.10% | | | | 05/08/2017 | | | | 4,749,570 | |
| | 410,000 | | | Wells Fargo & Company | | | 1.50% | | | | 01/16/2018 | | | | 412,560 | |
| | 4,525,000 | | | Xerox Corporation | | | 2.95% | | | | 03/15/2017 | | | | 4,553,462 | |
| | 4,451,000 | | | Zimmer Holdings, Inc. | | | 1.45% | | | | 04/01/2017 | | | | 4,450,818 | |
| | 465,000 | | | Zimmer Holdings, Inc. | | | 2.70% | | | | 04/01/2020 | | | | 472,128 | |
| | | | | | | | | | | | | | | | |
| | | | Total US Corporate Bonds
(Cost $276,530,961) | | | | 278,228,404 | |
| | | | | | | | | | | | | | | | |
| | | | | | |
| The accompanying notes are an integral part of these financial statements. | | Annual Report | | March 31, 2016 | | 61 |
| | |
| Schedule of Investments DoubleLine Low Duration Bond Fund (Cont.) | | March 31, 2016 |
| | | | | | | | | | | | | | | | |
PRINCIPAL
AMOUNT $ /
SHARES | | | SECURITY DESCRIPTION | | RATE | | | MATURITY | | | VALUE $ | |
| | US GOVERNMENT / AGENCY MORTGAGE BACKED OBLIGATIONS 1.9% | |
| |
| | | | Federal Home Loan Mortgage Corporation, | |
| | 157,143 | | | Pool G06871 | | | 6.00% | | | | 06/01/2038 | | | | 179,379 | |
| | 335,416 | | | Pool G06954 | | | 6.00% | | | | 05/01/2040 | | | | 381,348 | |
| | 459,624 | | | Pool N70081 | | | 5.50% | | | | 07/01/2038 | | | | 508,385 | |
| | 34,525,810 | | | Series 2015-95-AP | | | 3.00% | | | | 08/25/2042 | | | | 35,737,482 | |
| | 68,922 | | | Series 3267-BA | | | 5.80% | | | | 11/15/2036 | | | | 74,313 | |
| | 226,323 | | | Series 3818-JA | | | 4.50% | | | | 01/15/2040 | | | | 235,931 | |
| | 64,149 | | | Series 3872-BA | | | 4.00% | | | | 06/15/2041 | | | | 67,555 | |
| | 5,231,451 | | | Series 4050-BC | | | 2.00% | | | | 05/15/2041 | | | | 5,123,355 | |
| |
| | | | Federal National Mortgage Association, | |
| | 235,378 | | | Series 2011-64-DB | | | 4.00% | | | | 07/25/2041 | | | | 255,347 | |
| | 2,139,420 | | | Series 2012-133-PB | | | 6.50% | | | | 04/25/2042 | | | | 2,405,749 | |
| |
| | | | Federal National Mortgage Association Pass-Thru, | |
| | 54,576 | | | Pool 995112 | | | 5.50% | | | | 07/01/2036 | | | | 61,848 | |
| | 213,979 | | | Pool AB3850 | | | 4.00% | | | | 11/01/2041 | | | | 223,670 | |
| | 172,428 | | | Pool AD0189 | | | 5.50% | | | | 02/01/2039 | | | | 194,976 | |
| | 320,180 | | | Pool AL1690 | | | 6.00% | | | | 05/01/2041 | | | | 365,329 | |
| | 244,597 | | | Pool AL1691 | | | 6.00% | | | | 06/01/2041 | | | | 279,074 | |
| | 322,900 | | | Pool AL1744 | | | 6.00% | | | | 10/01/2040 | | | | 368,517 | |
| | 6,779,809 | | | Pool AL4292 | | | 4.50% | | | | 04/01/2026 | | | | 7,316,989 | |
| | | | | | | | | | | | | | | | |
| | | | Total US Government / Agency Mortgage Backed Obligations
(Cost $52,738,706) | | | | 53,779,247 | |
| | | | | | | | | | | | | | | | |
| | US GOVERNMENT BONDS AND NOTES 10.4% | |
| | 44,400,000 | | | United States Treasury Notes | | | 3.13% | | | | 01/31/2017 | | | | 45,329,647 | |
| | 30,200,000 | | | United States Treasury Notes | | | 0.88% | | | | 07/15/2017 | | | | 30,278,460 | |
| | 45,200,000 | | | United States Treasury Notes | | | 1.00% | | | | 09/15/2017 | | | | 45,401,276 | |
| | 48,600,000 | | | United States Treasury Notes | | | 0.75% | | | | 04/15/2018 | | | | 48,596,209 | |
| | 69,900,000 | | | United States Treasury Notes | | | 0.88% | | | | 07/15/2018 | | | | 70,044,693 | |
| | 60,500,000 | | | United States Treasury Notes | | | 1.00% | | | | 09/15/2018 | | | | 60,807,219 | |
| | | | | | | | | | | | | | | | |
| | | | Total US Government Bonds and Notes
(Cost $299,145,925) | | | | 300,457,504 | |
| | | | | | | | | | | | | | | | |
| | AFFILIATED MUTUAL FUNDS 1.7% | |
| | 5,000,000 | | | DoubleLine Low Duration Emerging Markets Fixed Income Fund (Class I) | | | | | | | | | | | 47,950,000 | |
| | | | | | | | | | | | | | | | |
| | | | Total Affiliated Mutual Funds
(Cost $50,000,000) | | | | 47,950,000 | |
| | | | | | | | | | | | | | | | |
| | SHORT TERM INVESTMENTS 2.1% | |
| | 19,783,655 | | | BlackRock Liquidity Funds FedFund - Institutional Shares | | | 0.24% | ¨ | | | | | | | 19,783,655 | |
| | 19,783,656 | | | Fidelity Institutional Money Market Government Portfolio - Class I | | | 0.23% | ¨ | | | | | | | 19,783,656 | |
| | | | | | | | | | | | | | |
| SHARES | | | SECURITY DESCRIPTION | | RATE | | | MATURITY | | VALUE $ | |
| | 19,783,655 | | | Morgan Stanley Institutional Liquidity Funds Government Portfolio - Institutional
Share Class | | | 0.25% | ¨ | | | | | 19,783,655 | |
| | | | | | | | | | | | | | |
| | | | Total Short Term Investments
(Cost $59,350,966) | | | | | | 59,350,966 | |
| | | | | | | | | | | | | | |
| | | | Total Investments 98.0%
(Cost $2,856,649,147) | | | | | | 2,827,677,695 | |
| | | | Other Assets in Excess of Liabilities 2.0% | | | 57,568,156 | |
| | | | | | | | | | | | | | |
| | | | NET ASSETS 100.0% | | | | | $ | 2,885,245,851 | |
| | | | | | | | | | | | | | |
| | | | |
| SECURITY TYPE BREAKDOWN as a % of Net Assets: | |
Non-Agency Commercial Mortgage Backed Obligations | | | 20.4% | |
Collateralized Loan Obligations | | | 19.7% | |
Foreign Corporate Bonds | | | 17.0% | |
Non-Agency Residential Collateralized Mortgage Obligations | | | 11.9% | |
US Government Bonds and Notes | | | 10.4% | |
US Corporate Bonds | | | 9.6% | |
Asset Backed Obligations | | | 2.6% | |
Short Term Investments | | | 2.1% | |
US Government / Agency Mortgage Backed Obligations | | | 1.9% | |
Affiliated Mutual Funds | | | 1.7% | |
Foreign Government Bonds and Notes, Supranationals and Foreign Agencies | | | 0.7% | |
Other Assets and Liabilities | | | 2.0% | |
| | | | |
| | | 100.0% | |
| | | | |
| | | | |
| COUNTRY BREAKDOWN as a % of Net Assets: | |
United States | | | 80.3% | |
Mexico | | | 2.7% | |
Colombia | | | 2.7% | |
Chile | | | 2.3% | |
Peru | | | 1.6% | |
Panama | | | 1.4% | |
Singapore | | | 1.2% | |
Brazil | | | 0.7% | |
Canada | | | 0.7% | |
Israel | | | 0.6% | |
China | | | 0.5% | |
Costa Rica | | | 0.5% | |
Guatemala | | | 0.4% | |
Hong Kong | | | 0.4% | |
India | | | 0.4% | |
Qatar | | | 0.4% | |
United Kingdom | | | 0.3% | |
Indonesia | | | 0.3% | |
France | | | 0.2% | |
Australia | | | 0.2% | |
South Korea | | | 0.1% | |
Paraguay | | | 0.1% | |
Other Assets and Liabilities | | | 2.0% | |
| | | | |
| | | 100.0% | |
| | | | |
| | | | | | |
| 62 | | DoubleLine Funds Trust | | | | The accompanying notes are an integral part of these financial statements. |
| | | | |
| INVESTMENT BREAKDOWN as a % of Net Assets: | | | | |
Non-Agency Commercial Mortgage Backed Obligations | | | 20.4% | |
Collateralized Loan Obligations | | | 19.7% | |
Non-Agency Residential Collateralized Mortgage Obligations | | | 11.9% | |
US Government Bonds and Notes | | | 10.4% | |
Banking | | | 9.2% | |
Asset Backed Obligations | | | 2.6% | |
Oil & Gas | | | 2.5% | |
Short Term Investments | | | 2.1% | |
US Government / Agency Mortgage Backed Obligations | | | 1.9% | |
Affiliated Mutual Funds | | | 1.7% | |
Transportation | | | 1.5% | |
Healthcare | | | 1.0% | |
Media | | | 1.0% | |
Telecommunications | | | 1.0% | |
Consumer Products | | | 0.9% | |
Finance | | | 0.8% | |
Mining | | | 0.8% | |
Beverage and Tobacco | | | 0.7% | |
Technology | | | 0.7% | |
Foreign Government Bonds and Notes, Supranationals and Foreign Agencies | | | 0.7% | |
Utilities | | | 0.7% | |
| | | | |
Food/Drug Retailers | | | 0.6% | |
Automotive | | | 0.6% | |
Chemicals/Plastics | | | 0.4% | |
Electronics/Electric | | | 0.4% | |
Conglomerates | | | 0.4% | |
Food Products | | | 0.4% | |
Real Estate | | | 0.4% | |
Construction | | | 0.4% | |
Insurance | | | 0.4% | |
Pulp & Paper | | | 0.3% | |
Building and Development (including Steel/Metals) | | | 0.2% | |
Business Equipment and Services | | | 0.2% | |
Aerospace & Defense | | | 0.2% | |
Biotechnology | | | 0.2% | |
Energy | | | 0.2% | |
Pharmaceuticals | | | 0.2% | |
Environmental Control | | | 0.1% | |
Retailers (other than Food/Drug) | | | 0.1% | |
Financial Intermediaries | | | 0.1% | |
Other Assets and Liabilities | | | 2.0% | |
| | | | |
| | | 100.0% | |
| | | | |
| # | Variable rate security. Rate disclosed as of March 31, 2016. |
| ^ | Security exempt from registration under Rule 144A of the Securities Act of 1933. These securities may be resold in transactions exempt from registration to qualified institutional buyers. These securities are determined to be liquid by the Adviser, unless otherwise noted, under procedures established by the Fund’s Board of Trustees. At March 31, 2016, the value of these securities amounted to $1,046,073,601 or 36.3% of net assets. |
| ¥ | Illiquid security. At March 31, 2016, the value of these securities amounted to $4,974,845 or 0.2% of net assets. |
| W | Security is in default or has failed to make a scheduled payment. Income is not being accrued. |
| I/O | Interest only security |
| ¨ | Seven-day yield as of March 31, 2016 |
A summary of the DoubleLine Low Duration Bond Fund’s investments in affiliated mutual funds for the year ended March 31, 2016 is as follows:
| | | | | | | | | | | | | | | | | | | | | | | | | | | | |
| Fund | | Value at
March 31,
2015 | | | Gross
Purchases | | | Gross
Sales | | | Shares
Held at
March 31,
2016 | | | Value at
March 31,
2016 | | | Dividend
Income Earned
in the Year
Ended March 31,
2016 | | | Net Realized
Gain (Loss) in the
Year Ended
March 31, 2016 | |
DoubleLine Low Duration Emerging Markets Fixed Income Fund | | $ | 49,150,000 | | | $ | — | | | $ | — | | | | 5,000,000 | | | $ | 47,950,000 | | | $ | 1,712,019 | | | $ | — | |
| | | | | | |
| The accompanying notes are an integral part of these financial statements. | | Annual Report | | March 31, 2016 | | 63 |
| | |
| Schedule of Investments DoubleLine Floating Rate Fund | | March 31, 2016 |
| | | | | | | | | | | | | | | | |
PRINCIPAL
AMOUNT $ | | | SECURITY DESCRIPTION | | RATE | | | MATURITY | | | VALUE $ | |
| | BANK LOANS 87.7% | |
| | |
| | AEROSPACE & DEFENSE 1.0% | |
| |
| | | | B/E Aerospace, Inc., | |
| | 3,062,727 | | | Guaranteed Senior Secured 1st Lien Term Loan, Tranche B | | | 4.00% | # | | | 12/16/2021 | | | | 3,078,684 | |
| | | | | | | | | | | | | | | | |
| | AUTOMOTIVE 2.1% | |
| |
| | | | American Tire Distributors, Inc., | |
| | 968,180 | | | Guaranteed Senior Secured 1st Lien Term Loan, Tranche B | | | 5.25% | # | | | 09/01/2021 | | | | 966,365 | |
| |
| | | | Dealer Tire LLC, | |
| | 3,083,991 | | | Senior Secured 1st Lien Term Loan, Tranche B | | | 5.50% | # | | | 12/22/2021 | | | | 3,087,846 | |
| |
| | | | Federal-Mogul Holdings Corporation, | |
| | 1,655,472 | | | Guaranteed Senior Secured 1st Lien Term Loan, Tranche C | | | 4.75% | # | | | 04/15/2021 | | | | 1,507,075 | |
| |
| | | | Transtar Holding Company, | |
| | 1,317,816 | | | Senior Secured 1st Lien Term Loan | | | 5.75% | # | | | 10/09/2018 | | | | 889,526 | |
| | | | | | | | | | | | | | | | |
| | | | | | | | | | | | | | | 6,450,812 | |
| | | | | | | | | | | | | | | | |
| | BUILDING AND DEVELOPMENT (INCLUDING STEEL/METALS) 3.9% | |
| |
| | | | Beacon Roofing Supply, Inc., | |
| | 2,951,995 | | | Guaranteed Senior Secured 1st Lien Term Loan, Tranche B | | | 4.00% | # | | | 09/23/2022 | | | | 2,953,840 | |
| |
| | | | Capital Automotive LP, | |
| | 2,470,856 | | | Senior Secured 1st Lien Term Loan, Tranche B | | | 4.00% | # | | | 04/10/2019 | | | | 2,477,033 | |
| |
| | | | Jeld-Wen, Inc., | |
| | 3,144,200 | | | Senior Secured 1st Lien Term Loan, Tranche B | | | 4.75% | # | | | 06/30/2022 | | | | 3,143,225 | |
| |
| | | | Summit Materials LLC, | |
| | 3,161,361 | | | Guaranteed Senior Secured 1st Lien Term Loan, Tranche B | | | 4.00% | # | | | 07/18/2022 | | | | 3,161,361 | |
| | | | | | | | | | | | | | | | |
| | | | | | | | | | | | | | | 11,735,459 | |
| | | | | | | | | | | | | | | | |
| | BUSINESS EQUIPMENT AND SERVICES 9.1% | |
| |
| | | | AlixPartners LLP, | |
| | 3,114,350 | | | Guaranteed Senior Secured 1st Lien Term Loan, Tranche B | | | 4.50% | # | | | 07/28/2022 | | | | 3,112,404 | |
| |
| | | | Allied Security Holdings LLC, | |
| | 3,119,565 | | | Senior Secured 1st Lien Term Loan, Tranche B | | | 4.25% | # | | | 02/12/2021 | | | | 3,049,375 | |
| |
| | | | Duff & Phelps Corporation, | |
| | 3,121,294 | | | Senior Secured 1st Lien Term Loan, Tranche B1 | | | 4.75% | # | | | 04/23/2020 | | | | 3,105,688 | |
| |
| | | | Hillman Group, Inc., | |
| | 2,209,250 | | | Guaranteed Senior Secured 1st Lien Term Loan, Tranche B | | | 4.50% | # | | | 06/30/2021 | | | | 2,160,469 | |
| |
| | | | KAR Auction Services, Inc., | |
| | 2,282,000 | | | Guaranteed Senior Secured 1st Lien Term Loan, Tranche B3 | | | 4.25% | # | | | 03/09/2023 | | | | 2,292,452 | |
| |
| | | | Mitchell International, Inc., | |
| | 1,544,603 | | | Guaranteed Secured 2nd Lien Term Loan | | | 8.50% | # | | | 10/11/2021 | | | | 1,372,766 | |
| |
| | | | Protection One, Inc., | |
| | 3,084,500 | | | Senior Secured 1st Lien Term Loan | | | 5.00% | # | | | 07/01/2021 | | | | 3,062,014 | |
| | | | | | | | | | | | | | | | |
PRINCIPAL
AMOUNT $ | | | SECURITY DESCRIPTION | | RATE | | | MATURITY | | | VALUE $ | |
| |
| | | | TransUnion LLC, | |
| | 3,066,532 | | | Guaranteed Senior Secured 1st Lien Term Loan, Tranche B2 | | | 3.50% | # | | | 04/09/2021 | | | | 3,041,999 | |
| |
| | | | Travelport Finance Luxembourg S.A.R.L., | |
| | 2,958,000 | | | Guaranteed Senior Secured 1st Lien Term Loan, Tranche B | | | 5.75% | # | | | 09/02/2021 | | | | 2,960,218 | |
| |
| | | | USAGM HoldCo LLC, | |
| | 3,281,775 | | | Senior Secured 1st Lien Term Loan | | | 4.75% | # | | | 07/28/2022 | | | | 3,183,322 | |
| | | | | | | | | | | | | | | | |
| | | | | | | | | | | | | | | 27,340,707 | |
| | | | | | | | | | | | | | | | |
| | CHEMICALS/PLASTICS 4.4% | |
| |
| | | | Huntsman International LLC, | |
| | 2,975,000 | | | Guaranteed Senior Secured 1st Lien Term Loan, Tranche B | | | 3.50% | # | | | 03/24/2023 | | | | 2,966,640 | |
| |
| | | | MacDermid, Inc., | |
| | 3,124,233 | | | Guaranteed Senior Secured 1st Lien Term Loan, Tranche B2 | | | 5.50% | # | | | 06/05/2020 | | | | 3,027,584 | |
| |
| | | | PolyOne Corporation, | |
| | 3,102,225 | | | Guaranteed Senior Secured 1st Lien Term Loan, Tranche B | | | 3.75% | # | | | 11/10/2022 | | | | 3,112,897 | |
| |
| | | | Solenis International LP, | |
| | 1,255,742 | | | Guaranteed Senior Secured 1st Lien Term Loan | | | 4.25% | # | | | 07/31/2021 | | | | 1,212,909 | |
| |
| | | | Univar, Inc., | |
| | 3,079,525 | | | Guaranteed Senior Secured 1st Lien Term Loan, Tranche B | | | 4.25% | # | | | 07/01/2022 | | | | 3,044,403 | |
| | | | | | | | | | | | | | | | |
| | | | | | | | | | | | | | | 13,364,433 | |
| | | | | | | | | | | | | | | | |
| | COMPUTERS & ELECTRONICS 1.0% | |
| |
| | | | Avago Technologies Finance Ltd., | |
| | 3,155,000 | | | Guaranteed Senior Secured 1st Lien Term Loan, Tranche B1 | | | 4.25% | # | | | 02/01/2023 | | | | 3,143,705 | |
| | | | | | | | | | | | | | | | |
| | CONTAINERS AND GLASS PRODUCTS 4.0% | |
| |
| | | | Ardagh Packaging Finance, | |
| | 3,146,051 | | | Guaranteed Senior Secured 1st Lien Delayed-Draw Term Loan, Tranche B | | | 4.00% | # | | | 12/17/2019 | | | | 3,148,017 | |
| |
| | | | Berry Plastics Corporation, | |
| | 2,953,148 | | | Guaranteed Senior Secured 1st Lien Term Loan, Tranche F | | | 4.00% | # | | | 10/01/2022 | | | | 2,957,769 | |
| |
| | | | Kloeckner Pentaplast of America, Inc., | |
| | 897,410 | | | Senior Secured 1st Lien Term Loan | | | 5.00% | # | | | 04/28/2020 | | | | 899,654 | |
| |
| | | | Kloeckner Pentaplast of America, Inc., | |
| | 2,099,940 | | | Senior Secured 1st Lien Term Loan | | | 5.00% | # | | | 04/28/2020 | | | | 2,105,190 | |
| |
| | | | Reynolds Group Holdings, Inc., | |
| | 3,069,774 | | | Guaranteed Senior Secured 1st Lien Term Loan, Tranche B1 | | | 4.50% | # | | | 11/30/2018 | | | | 3,075,376 | |
| | | | | | | | | | | | | | | | |
| | | | | | | | | | | | | | | 12,186,006 | |
| | | | | | | | | | | | | | | | |
| | COSMETICS/TOILETRIES 3.0% | |
| |
| | | | Galleria Company, | |
| | 3,030,000 | | | Guaranteed Senior Secured 1st Lien Term Loan, Tranche B | | | 3.75% | # | | | 01/26/2023 | | | | 3,029,061 | |
| | | | | | |
| 64 | | DoubleLine Funds Trust | | | | The accompanying notes are an integral part of these financial statements. |
| | | | | | | | | | | | | | | | |
PRINCIPAL
AMOUNT $ | | | SECURITY DESCRIPTION | | RATE | | | MATURITY | | | VALUE $ | |
| |
| | | | KIK Custom Products, Inc., | |
| | 3,104,400 | | | Senior Secured 1st Lien Term Loan, Tranche B | | | 6.00% | # | | | 08/18/2022 | | | | 3,002,203 | |
| |
| | | | Prestige Brands, Inc., | |
| | 3,006,016 | | | Guaranteed Senior Secured 1st Lien Term Loan, Tranche B3 | | | 3.50% | # | | | 09/03/2021 | | | | 3,014,658 | |
| | | | | | | | | | | | | | | | |
| | | | | | | | | | | | | | | 9,045,922 | |
| | | | | | | | | | | | | | | | |
| | ELECTRONICS/ELECTRIC 5.3% | |
| |
| | | | Allflex Holdings, Inc., | |
| | 3,186,039 | | | Guaranteed Senior Secured 1st Lien Term Loan, Tranche B | | | 4.25% | # | | | 07/17/2020 | | | | 3,151,183 | |
| |
| | | | Ensemble S Merger Sub, Inc., | |
| | 3,109,375 | | | Senior Secured 1st Lien Term Loan, Tranche B | | | 4.75% | # | | | 09/16/2022 | | | | 3,068,564 | |
| |
| | | | Informatica Corporation, | |
| | 1,547,225 | | | Senior Secured 1st Lien Term Loan, Tranche B | | | 4.50% | # | | | 08/05/2022 | | | | 1,522,083 | |
| |
| | | | Microsemi Corporation, | |
| | 2,835,000 | | | Guaranteed Senior Secured 1st Lien Term Loan, Tranche B | | | 5.25% | # | | | 01/17/2023 | | | | 2,852,279 | |
| |
| | | | NXP B.V., | |
| | 3,022,425 | | | Guranteed Senior Secured 1st Lien Term Loan, Tranche B | | | 3.75% | # | | | 12/07/2020 | | | | 3,033,049 | |
| |
| | | | ON Semiconductor Corporation, | |
| | 2,418,000 | | | Senior Secured 1st Lien Term Loan, Tranche B | | | 5.25% | # | | | 03/31/2023 | | | | 2,425,182 | |
| | | | | | | | | | | | | | | | |
| | | | | | | | | | | | | | | 16,052,340 | |
| | | | | | | | | | | | | | | | |
| | FINANCIAL INTERMEDIARIES 2.2% | |
| |
| | | | First Data Corporation, | |
| | 525,000 | | | Guaranteed Senior Secured 1st Lien Term Loan, Tranche B | | | 4.43% | # | | | 03/24/2021 | | | | 524,344 | |
| | 2,498,542 | | | Guaranteed Senior Secured 1st Lien Term Loan, Tranche C1 | | | 3.93% | # | | | 03/23/2018 | | | | 2,497,917 | |
| |
| | | | Global Payments, Inc., | |
| | 576,000 | | | Guaranteed Senior Secured 1st Lien Term Loan, Tranche B | | | 3.50% | # | | | 03/21/2023 | | | | 579,842 | |
| |
| | | | Guggenheim Partners Investment Management Holdings LLC, | |
| | 3,036,766 | | | Guaranteed Senior Secured 1st Lien Term Loan, Tranche B | | | 4.25% | # | | | 07/22/2020 | | | | 3,041,822 | |
| | | | | | | | | | | | | | | | |
| | | | | | | | | | | | | | | 6,643,925 | |
| | | | | | | | | | | | | | | | |
| | FOOD PRODUCTS 4.5% | |
| |
| | | | B&G Foods, Inc., | |
| | 2,701,861 | | | Guaranteed Senior Secured 1st Lien Term Loan, Tranche B | | | 3.75% | # | | | 11/02/2022 | | | | 2,709,967 | |
| |
| | | | Candy Intermediate Holdings, Inc., | |
| | 3,028,468 | | | Guaranteed Senior Secured 1st Lien Term Loan, Tranche B | | | 7.50% | # | | | 06/18/2018 | | | | 3,036,040 | |
| |
| | | | CSM Bakery Supplies LLC, | |
| | 3,199,132 | | | Senior Secured 1st Lien Term Loan, Tranche B | | | 5.00% | # | | | 07/03/2020 | | | | 3,121,153 | |
| |
| | | | Hostess Brands LLC, | |
| | 3,069,575 | | | Senior Secured 1st Lien Term Loan | | | 4.50% | # | | | 08/03/2022 | | | | 3,076,604 | |
| | | | | | | | | | | | | | | | |
PRINCIPAL
AMOUNT $ | | | SECURITY DESCRIPTION | | RATE | | | MATURITY | | | VALUE $ | |
| |
| | | | Pinnacle Foods Finance LLC, | |
| | 1,546,125 | | | Guaranteed Senior Secured 1st Lien Term Loan, Tranche I | | | 3.75% | # | | | 01/13/2023 | | | | 1,554,118 | |
| | | | | | | | | | | | | | | | |
| | | | | | | | | | | | | | | 13,497,882 | |
| | | | | | | | | | | | | | | | |
| | FOOD/DRUG RETAILERS 2.0% | |
| |
| | | | Albertson’s Holdings LLC, | |
| | 3,032,486 | | | Guaranteed Senior Secured 1st Lien Term Loan, Tranche B4 | | | 5.50% | # | | | 08/25/2021 | | | | 3,040,825 | |
| |
| | | | Burger King Corporation, | |
| | 3,107,501 | | | Guaranteed Senior Secured 1st Lien Term Loan, Tranche B2 | | | 3.75% | # | | | 12/10/2021 | | | | 3,110,096 | |
| | | | | | | | | | | | | | | | |
| | | | | | | | | | | | | | | 6,150,921 | |
| | | | | | | | | | | | | | | | |
| | HEALTHCARE 8.2% | |
| |
| | | | Acadia Healthcare Company, Inc., | |
| | 1,531,250 | | | Guaranteed Senior Secured 1st Lien Term Loan, Tranche B2 | | | 4.50% | # | | | 02/16/2023 | | | | 1,537,949 | |
| |
| | | | Alere, Inc., | |
| | 1,695,525 | | | Guaranteed Senior Secured 1st Lien Term Loan, Tranche B | | | 4.25% | # | | | 06/20/2022 | | | | 1,688,107 | |
| |
| | | | American Renal Holdings, Inc., | |
| | 3,029,486 | | | Guaranteed Senior Secured 1st Lien Term Loan, Tranche B | | | 4.50% | # | | | 08/20/2019 | | | | 3,031,379 | |
| |
| | | | Envision Healthcare Corporation, | |
| | 3,082,275 | | | Guaranteed Senior Secured 1st Lien Term Loan, Tranche B2 | | | 4.50% | # | | | 10/28/2022 | | | | 3,088,054 | |
| |
| | | | Pharmaceutical Product Development LLC, | |
| | 3,135,678 | | | Senior Secured 1st Lien Term Loan, Tranche B | | | 4.25% | # | | | 08/18/2022 | | | | 3,113,478 | |
| |
| | | | Surgery Center Holdings, Inc., | |
| | 3,094,615 | | | Guaranteed Senior Secured 1st Lien Term Loan | | | 5.25% | # | | | 11/03/2020 | | | | 3,062,710 | |
| |
| | | | Team Health, Inc., | |
| | 3,147,113 | | | Guaranteed Senior Secured 1st Lien Term Loan, Tranche B | | | 4.50% | # | | | 11/23/2022 | | | | 3,156,916 | |
| |
| | | | US Renal Care, Inc., | |
| | 2,753,100 | | | Senior Secured 1st Lien Term Loan | | | 5.25% | # | | | 12/30/2022 | | | | 2,748,516 | |
| |
| | | | Vizient, Inc., | |
| | 3,000,000 | | | Senior Secured 1st Lien Term Loan, Tranche B | | | 6.25% | # | | | 02/13/2023 | | | | 3,028,740 | |
| | | | | | | | | | | | | | | | |
| | | | | | | | | | | | | | | 24,455,849 | |
| | | | | | | | | | | | | | | | |
| | HOTELS/MOTELS/INNS AND CASINOS 5.2% | |
| |
| | | | Eldorado Resorts, Inc., | |
| | 3,131,499 | | | Guaranteed Senior Secured 1st Lien Term Loan, Tranche B | | | 4.25% | # | | | 07/23/2022 | | | | 3,131,515 | |
| |
| | | | Four Seasons Holdings, Inc., | |
| | 3,132,250 | | | Guaranteed Senior Secured 1st Lien Term Loan | | | 3.50% | # | | | 06/27/2020 | | | | 3,117,560 | |
| |
| | | | Hilton Worldwide Finance LLC, | |
| | 3,203,119 | | | Guaranteed Senior Secured 1st Lien Term Loan, Tranche B | | | 3.50% | # | | | 10/26/2020 | | | | 3,207,459 | |
| | | | | | |
| The accompanying notes are an integral part of these financial statements. | | Annual Report | | March 31, 2016 | | 65 |
| | |
| Schedule of Investments DoubleLine Floating Rate Fund (Cont.) | | March 31, 2016 |
| | | | | | | | | | | | | | | | |
PRINCIPAL
AMOUNT $ | | | SECURITY DESCRIPTION | | RATE | | | MATURITY | | | VALUE $ | |
| |
| | | | Scientific Games International, Inc., | |
| | 3,280,588 | | | Guaranteed Senior Secured 1st Lien Term Loan, Tranche B2 | | | 6.00% | # | | | 10/01/2021 | | | | 3,185,762 | |
| |
| | | | Station Casinos LLC, | |
| | 2,954,039 | | | Guaranteed Senior Secured 1st Lien Term Loan, Tranche B | | | 4.25% | # | | | 03/02/2020 | | | | 2,950,347 | |
| | | | | | | | | | | | | | | | |
| | | | | | | | | | | | | | | 15,592,643 | |
| | | | | | | | | | | | | | | | |
| | INDUSTRIAL EQUIPMENT 1.9% | |
| |
| | | | Filtration Group, Inc., | |
| | 3,035,957 | | | Senior Secured 1st Lien Term Loan, Tranche B | | | 4.25% | # | | | 11/20/2020 | | | | 3,030,887 | |
| |
| | | | Signode Industrial Group, Inc., | |
| | 2,879,553 | | | Senior Secured 1st Lien Term Loan, Tranche B | | | 3.75% | # | | | 04/30/2021 | | | | 2,803,964 | |
| | | | | | | | | | | | | | | | |
| | | | | | | | | | | | | | | 5,834,851 | |
| | | | | | | | | | | | | | | | |
| | INSURANCE 2.1% | |
| |
| | | | Asurion LLC, | |
| | 1,576,000 | | | Senior Secured 1st Lien Term Loan, Tranche B | | | 5.00% | # | | | 08/04/2022 | | | | 1,545,473 | |
| |
| | | | Asurion LLC, | |
| | 1,895,093 | | | Senior Secured 1st Lien Term Loan, Tranche B1 | | | 5.00% | # | | | 05/24/2019 | | | | 1,872,191 | |
| |
| | | | York Risk Services Group, Inc., | |
| | 3,253,485 | | | Guaranteed Senior Secured 1st Lien Term Loan, Tranche B | | | 4.75% | # | | | 10/01/2021 | | | | 2,810,197 | |
| | | | | | | | | | | | | | | | |
| | | | | | | | | | | | | | | 6,227,861 | |
| | | | | | | | | | | | | | | | |
| | LEISURE 5.5% | |
| |
| | | | Activision Blizzard, Inc., | |
| | 1,477,000 | | | Guaranteed Senior Secured 1st Lien Term Loan, Tranche B | | | 3.25% | # | | | 10/13/2020 | | | | 1,485,544 | |
| |
| | | | Emerald Expositions Holdings, Inc., | |
| | 3,041,603 | | | Senior Secured 1st Lien Term Loan, Tranche B | | | 4.75% | # | | | 06/17/2020 | | | | 3,033,999 | |
| |
| | | | Life Time Fitness, Inc., | |
| | 2,987,475 | | | Senior Secured 1st Lien Term Loan, Tranche B | | | 4.25% | # | | | 06/10/2022 | | | | 2,958,347 | |
| |
| | | | Live Nation Entertainment, Inc., | |
| | 3,036,641 | | | Guaranteed Senior Secured 1st Lien Term Loan, Tranche B1 | | | 3.50% | # | | | 08/14/2020 | | | | 3,041,697 | |
| |
| | | | Match Group, Inc., | |
| | 2,962,500 | | | Guaranteed Senior Secured 1st Lien Term Loan, Tranche B | | | 5.50% | # | | | 11/16/2022 | | | | 2,971,773 | |
| |
| | | | Nord Anglia Education Finance LLC, | |
| | 3,132,063 | | | Guaranteed Senior Secured 1st Lien Term Loan, Tranche B | | | 5.00% | # | | | 03/31/2021 | | | | 3,092,928 | |
| | | | | | | | | | | | | | | | |
| | | | | | | | | | | | | | | 16,584,288 | |
| | | | | | | | | | | | | | | | |
| | MEDIA 6.1% | |
| |
| | | | CCO Safari III LLC, | |
| | 3,160,000 | | | Senior Secured 1st Lien Term Loan, Tranche I | | | 3.50% | # | | | 01/24/2023 | | | | 3,167,900 | |
| |
| | | | CSC Holdings LLC, | |
| | 3,070,000 | | | Guaranteed Senior Secured 1st Lien Term Loan, Tranche B | | | 5.00% | # | | | 10/11/2022 | | | | 3,078,872 | |
| | | | | | | | | | | | | | | | |
PRINCIPAL
AMOUNT $ | | | SECURITY DESCRIPTION | | RATE | | | MATURITY | | | VALUE $ | |
| |
| | | | MGOC, Inc., | |
| | 3,014,645 | | | Guaranteed Senior Secured 1st Lien Delayed-Draw Term Loan, Tranche B | | | 4.00% | # | | | 07/31/2020 | | | | 3,013,892 | |
| |
| | | | Tribune Media Company, | |
| | 2,977,111 | | | Guaranteed Senior Secured 1st Lien Term Loan, Tranche B | | | 3.75% | # | | | 12/24/2020 | | | | 2,970,918 | |
| |
| | | | Univision Communications Inc, | |
| | 3,093,527 | | | Guaranteed Senior Secured 1st Lien Term Loan, Tranche C3 | | | 4.00% | # | | | 02/28/2020 | | | | 3,068,067 | |
| |
| | | | Virgin Media Investment Holdings Ltd., | |
| | 3,105,000 | | | Guaranteed Senior Secured 1st Lien Term Loan, Tranche F | | | 3.50% | # | | | 06/30/2023 | | | | 3,083,669 | |
| | | | | | | | | | | | | | | | |
| | | | | | | | | | | | | | | 18,383,318 | |
| | | | | | | | | | | | | | | | |
| | OIL & GAS 0.6% | |
| |
| | | | Energy Transfer Equity LP, | |
| | 2,064,235 | | | Guaranteed Senior Secured 1st Lien Term Loan, Tranche C | | | 4.00% | # | | | 12/02/2019 | | | | 1,866,409 | |
| | | | | | | | | | | | | | | | |
| | PHARMACEUTICALS 1.0% | |
| |
| | | | Endo Luxembourg Finance I Company S.A.R.L., | |
| | 3,187,013 | | | Guaranteed Senior Secured 1st Lien Term Loan, Tranche B | | | 3.75% | # | | | 09/26/2022 | | | | 3,144,689 | |
| | | | | | | | | | | | | | | | |
| | RETAILERS (OTHER THAN FOOD/DRUG) 5.1% | |
| |
| | | | Michaels Stores, Inc., | |
| | 3,016,756 | | | Guaranteed Senior Secured 1st Lien Term Loan, Tranche B2 | | | 4.00% | # | | | 01/28/2020 | | | | 3,023,211 | |
| |
| | | | National Vision, Inc., | |
| | 3,203,696 | | | Senior Secured 1st Lien Term Loan, Tranche B | | | 4.00% | # | | | 03/12/2021 | | | | 3,120,608 | |
| |
| | | | Party City Holdings, Inc., | |
| | 3,114,176 | | | Guaranteed Senior Secured 1st Lien Term Loan, Tranche B | | | 4.25% | # | | | 08/19/2022 | | | | 3,095,678 | |
| |
| | | | Serta Simmons Holdings LLC, | |
| | 2,979,179 | | | Senior Secured 1st Lien Term Loan, Tranche B | | | 4.25% | # | | | 10/01/2019 | | | | 2,981,518 | |
| |
| | | | Spin Holdco, Inc., | |
| | 3,096,953 | | | Guaranteed Senior Secured 1st Lien Term Loan, Tranche B | | | 4.25% | # | | | 11/14/2019 | | | | 3,024,175 | |
| | | | | | | | | | | | | | | | |
| | | | | | | | | | | | | | | 15,245,190 | |
| | | | | | | | | | | | | | | | |
| | TECHNOLOGY 2.0% | |
| |
| | | | Dell International LLC, | |
| | 2,966,106 | | | Guaranteed Senior Secured 1st Lien Term Loan, Tranche B2 | | | 4.00% | # | | | 04/29/2020 | | | | 2,967,692 | |
| |
| | | | SolarWinds Holdings, Inc., | |
| | 3,065,000 | | | Guaranteed Senior Secured 1st Lien Term Loan | | | 6.50% | # | | | 02/06/2023 | | | | 3,042,013 | |
| | | | | | | | | | | | | | | | |
| | | | | | | | | | | | | | | 6,009,705 | |
| | | | | | | | | | | | | | | | |
| | TELECOMMUNICATIONS 2.5% | |
| |
| | | | Level 3 Financing, Inc., | |
| | 3,090,000 | | | Guaranteed Senior Secured 1st Lien Term Loan, Tranche BII | | | 3.50% | # | | | 05/31/2022 | | | | 3,088,069 | |
| | | | | | |
| 66 | | DoubleLine Funds Trust | | | | The accompanying notes are an integral part of these financial statements. |
| | | | | | | | | | | | | | | | |
PRINCIPAL
AMOUNT $ | | | SECURITY DESCRIPTION | | RATE | | | MATURITY | | | VALUE $ | |
| |
| | | | T-Mobile USA, Inc., | |
| | 3,042,375 | | | Guaranteed Senior Secured 1st Lien Term Loan, Tranche B | | | 3.50% | # | | | 11/09/2022 | | | | 3,057,830 | |
| |
| | | | Yankee Cable Acquisition LLC, | |
| | 1,496,118 | | | Senior Secured 1st Lien Term Loan, Tranche B | | | 4.25% | # | | | 02/28/2020 | | | | 1,491,757 | |
| | | | | | | | | | | | | | | | |
| | | | | | | | | | | | | | | 7,637,656 | |
| | | | | | | | | | | | | | | | |
| | TRANSPORTATION 2.1% | |
| |
| | | | American Airlines, Inc., | |
| | 3,000,000 | | | Guaranteed Senior Secured 1st Lien Term Loan, Tranche B | | | 3.25% | # | | | 06/29/2020 | | | | 2,991,975 | |
| |
| | | | PODS LLC, | |
| | 3,124,771 | | | Senior Secured 1st Lien Term Loan, Tranche B | | | 4.50% | # | | | 02/02/2022 | | | | 3,126,725 | |
| | | | | | | | | | | | | | | | |
| | | | | | | | | | | | | | | 6,118,700 | |
| | | | | | | | | | | | | | | | |
| | UTILITIES 2.9% | |
| |
| | | | Calpine Corporation, | |
| | 3,096,600 | | | Guaranteed Senior Secured 1st Lien Term Loan, Tranche B5 | | | 3.50% | # | | | 05/27/2022 | | | | 3,063,698 | |
| |
| | | | EFS Cogen Holdings LLC, | |
| | 2,940,310 | | | Guaranteed Senior Secured 1st Lien Term Loan, Tranche B | | | 3.75% | # | | | 12/17/2020 | | | | 2,907,231 | |
| |
| | | | Southeast PowerGen LLC, | |
| | 3,121,294 | | | Senior Secured 1st Lien Term Loan, Tranche B | | | 4.50% | # | | | 12/02/2021 | | | | 2,879,394 | |
| | | | | | | | | | | | | | | | |
| | | | | | | | | | | | | | | 8,850,323 | |
| | | | | | | | | | | | | | | | |
| | | | Total Bank Loans
(Cost $266,039,410) | | | | 264,642,278 | |
| | | | | | | | | | | | | | | | |
| | | | | | | | | | | | | | |
SHARES | | | SECURITY DESCRIPTION | | RATE | | | MATURITY | | VALUE $ | |
| | SHORT TERM INVESTMENTS 13.5% | | | | |
| | | | |
| | 13,616,099 | | | BlackRock Liquidity Funds FedFund - Institutional Shares | | | 0.24%¨ | | | | | | 13,616,099 | |
| | | | |
| | 13,616,099 | | | Fidelity Institutional Money Market Government Portfolio - Class I | | | 0.23%¨ | | | | | | 13,616,099 | |
| | | | |
| | 13,616,099 | | | Morgan Stanley Institutional Liquidity Funds Government Portfolio - Institutional Share Class | | | 0.25%¨ | | | | | | 13,616,099 | |
| | | | | | | | | | | | | | |
| | | | Total Short Term Investments
(Cost $40,848,297) | | | 40,848,297 | |
| | | | | | | | | | | | | | |
| | | | Total Investments 101.2%
(Cost $306,887,707) | | | 305,490,575 | |
| | | | Liabilities in Excess of Other Assets (1.2)% | | | (3,597,515 | ) |
| | | | | | | | | | | | | | |
| | | | NET ASSETS 100.0% | | $ | 301,893,060 | |
| | | | | | | | | | | | | | |
| | | | |
| SECURITY TYPE BREAKDOWN as a % of Net Assets: | |
Bank Loans | | | 87.7% | |
Short Term Investments | | | 13.5% | |
Other Assets and Liabilities | | | (1.2)% | |
| | | | |
| | | 100.0% | |
| | | | |
| # | Variable rate security. Rate disclosed as of March 31, 2016. |
| ¨ | Seven-day yield as of March 31, 2016 |
| | | | | | |
| The accompanying notes are an integral part of these financial statements. | | Annual Report | | March 31, 2016 | | 67 |
| | |
| Schedule of Investments DoubleLine Shiller Enhanced CAPE® | | March 31, 2016 |
| | | | | | | | | | | | | | | | |
PRINCIPAL AMOUNT $ | | | SECURITY DESCRIPTION | | RATE | | | MATURITY | | | VALUE $ | |
| | ASSET BACKED OBLIGATIONS 1.9% | |
| |
| | | | Blue Elephant Loan Trust, | |
| | 414,353 | | | Series 2015-1-A | | | 3.12% | ^ | | | 12/15/2022 | | | | 414,050 | |
| |
| | | | Citi Held For Asset Issuance, | |
| | 1,000,000 | | | Series 2015-PM1-B | | | 2.93% | ^ | | | 12/15/2021 | | | | 978,534 | |
| |
| | | | Consumer Credit Origination Loan Trust, | |
| | 910,169 | | | Series 2015-1-A | | | 2.82% | ^ | | | 03/15/2021 | | | | 910,559 | |
| |
| | | | Hero Funding Trust, | |
| | 5,930,120 | | | Series 2016-1A-A | | | 4.05% | ^ | | | 09/20/2041 | | | | 5,898,109 | |
| |
| | | | OneMain Financial Issuance Trust, | |
| | 8,000,000 | | | Series 2014-1A-A | | | 2.43% | ^ | | | 06/18/2024 | | | | 7,981,382 | |
| | | | | | | | | | | | | | | | |
| | | | Total Asset Backed Obligations
(Cost $16,227,298) | | | | 16,182,634 | |
| | | | | | | | | | | | | | | | |
| | BANK LOANS 2.4% | |
| |
| | | | Acadia Healthcare Company, Inc., | |
| | 224,450 | | | Guaranteed Senior Secured 1st Lien Term Loan, Tranche B2 | | | 4.50% | # | | | 02/16/2023 | | | | 225,432 | |
| |
| | | | Activision Blizzard, Inc., | |
| | 115,000 | | | Guaranteed Senior Secured 1st Lien Term Loan, Tranche B | | | 3.25% | # | | | 10/13/2020 | | | | 115,665 | |
| |
| | | | Albertson’s Holdings LLC, | |
| | 230,802 | | | Guaranteed Senior Secured 1st Lien Term Loan, Tranche B4 | | | 5.50% | # | | | 08/25/2021 | | | | 231,436 | |
| |
| | | | Alere, Inc., | |
| | 109,360 | | | Guaranteed Senior Secured 1st Lien Term Loan, Tranche B | | | 4.25% | # | | | 06/20/2022 | | | | 108,881 | |
| |
| | | | AlixPartners LLP, | |
| | 234,125 | | | Guaranteed Senior Secured 1st Lien Term Loan, Tranche B | | | 4.50% | # | | | 07/28/2022 | | | | 233,979 | |
| |
| | | | Allflex Holdings, Inc., | |
| | 234,107 | | | Guaranteed Senior Secured 1st Lien Term Loan, Tranche B | | | 4.25% | # | | | 07/17/2020 | | | | 231,546 | |
| |
| | | | Allied Security Holdings LLC, | |
| | 203,687 | | | Senior Secured 1st Lien Term Loan, Tranche B | | | 4.25% | # | | | 02/12/2021 | | | | 199,104 | |
| |
| | | | American Airlines, Inc., | |
| | 235,000 | | | Guaranteed Senior Secured 1st Lien Term Loan, Tranche B | | | 3.25% | # | | | 06/29/2020 | | | | 234,371 | |
| |
| | | | American Renal Holdings, Inc., | |
| | 238,116 | | | Guaranteed Senior Secured 1st Lien Term Loan, Tranche B | | | 4.50% | # | | | 08/20/2019 | | | | 238,265 | |
| |
| | | | American Tire Distributors, Inc., | |
| | 77,759 | | | Guaranteed Senior Secured 1st Lien Term Loan, Tranche B | | | 5.25% | # | | | 09/01/2021 | | | | 77,614 | |
| |
| | | | Ardagh Packaging Finance, | |
| | 232,379 | | | Guaranteed Senior Secured 1st Lien Delayed-Draw Term Loan, Tranche B | | | 4.00% | # | | | 12/17/2019 | | | | 232,525 | |
| |
| | | | Asurion LLC, | |
| | 197,000 | | | Senior Secured 1st Lien Term Loan, Tranche B | | | 5.00% | # | | | 08/04/2022 | | | | 193,184 | |
| | 238,676 | | | Senior Secured 1st Lien Term Loan, Tranche B1 | | | 5.00% | # | | | 05/24/2019 | | | | 235,792 | |
| | | | | | | | | | | | | | | | |
PRINCIPAL AMOUNT $ | | | SECURITY DESCRIPTION | | RATE | | | MATURITY | | | VALUE $ | |
| |
| | | | Avago Technologies Finance Ltd., | |
| | 230,000 | | | Guaranteed Senior Secured 1st Lien Term Loan, Tranche B1 | | | 4.25% | # | | | 02/01/2023 | | | | 229,177 | |
| |
| | | | B&G Foods, Inc., | |
| | 187,216 | | | Guaranteed Senior Secured 1st Lien Term Loan, Tranche B | | | 3.75% | # | | | 11/02/2022 | | | | 187,777 | |
| |
| | | | B/E Aerospace, Inc., | |
| | 229,091 | | | Guaranteed Senior Secured 1st Lien Term Loan, Tranche B | | | 4.00% | # | | | 12/16/2021 | | | | 230,285 | |
| |
| | | | Beacon Roofing Supply, Inc., | |
| | 228,940 | | | Guaranteed Senior Secured 1st Lien Term Loan, Tranche B | | | 4.00% | # | | | 09/23/2022 | | | | 229,083 | |
| |
| | | | Berry Plastics Corporation, | |
| | 230,219 | | | Guaranteed Senior Secured 1st Lien Term Loan, Tranche F | | | 4.00% | # | | | 10/01/2022 | | | | 230,579 | |
| |
| | | | Burger King Corporation, | |
| | 376,623 | | | Guaranteed Senior Secured 1st Lien Term Loan, Tranche B2 | | | 3.75% | # | | | 12/10/2021 | | | | 376,937 | |
| |
| | | | Calpine Corporation, | |
| | 168,725 | | | Guaranteed Senior Secured 1st Lien Term Loan, Tranche B5 | | | 3.50% | # | | | 05/27/2022 | | | | 166,932 | |
| |
| | | | Candy Intermediate Holdings, Inc., | |
| | 236,059 | | | Guaranteed Senior Secured 1st Lien Term Loan, Tranche B | | | 7.50% | # | | | 06/18/2018 | | | | 236,649 | |
| |
| | | | Capital Automotive LP, | |
| | 234,705 | | | Senior Secured 1st Lien Term Loan, Tranche B | | | 4.00% | # | | | 04/10/2019 | | | | 235,292 | |
| |
| | | | CCO Safari III LLC, | |
| | 235,000 | | | Senior Secured 1st Lien Term Loan, Tranche I | | | 3.50% | # | | | 01/24/2023 | | | | 235,588 | |
| |
| | | | CSC Holdings LLC, | |
| | 235,000 | | | Guaranteed Senior Secured 1st Lien Term Loan, Tranche B | | | 5.00% | # | | | 10/11/2022 | | | | 235,679 | |
| |
| | | | CSM Bakery Supplies LLC, | |
| | 239,553 | | | Senior Secured 1st Lien Term Loan, Tranche B | | | 5.00% | # | | | 07/03/2020 | | | | 233,714 | |
| |
| | | | Dealer Tire LLC, | |
| | 202,374 | | | Senior Secured 1st Lien Term Loan, Tranche B | | | 5.50% | # | | | 12/22/2021 | | | | 202,627 | |
| |
| | | | Dell International LLC, | |
| | 229,497 | | | Guaranteed Senior Secured 1st Lien Term Loan, Tranche B2 | | | 4.00% | # | | | 04/29/2020 | | | | 229,620 | |
| |
| | | | Duff & Phelps Corporation, | |
| | 233,529 | | | Senior Secured 1st Lien Term Loan, Tranche B1 | | | 4.75% | # | | | 04/23/2020 | | | | 232,362 | |
| |
| | | | EFS Cogen Holdings LLC, | |
| | 222,380 | | | Guaranteed Senior Secured 1st Lien Term Loan, Tranche B | | | 3.75% | # | | | 12/17/2020 | | | | 219,879 | |
| |
| | | | Eldorado Resorts, Inc., | |
| | 233,562 | | | Guaranteed Senior Secured 1st Lien Term Loan, Tranche B | | | 4.25% | # | | | 07/23/2022 | | | | 233,563 | |
| |
| | | | Emerald Expositions Holdings, Inc., | |
| | 223,391 | | | Senior Secured 1st Lien Term Loan, Tranche B | | | 4.75% | # | | | 06/17/2020 | | | | 222,833 | |
| | | | | | |
| 68 | | DoubleLine Funds Trust | | | | The accompanying notes are an integral part of these financial statements. |
| | | | | | | | | | | | | | | | |
PRINCIPAL AMOUNT $ | | | SECURITY DESCRIPTION | | RATE | | | MATURITY | | | VALUE $ | |
| |
| | | | Endo Luxembourg Finance I Company S.A.R.L., | |
| | 234,413 | | | Guaranteed Senior Secured 1st Lien Term Loan, Tranche B | | | 3.75% | # | | | 09/26/2022 | | | | 231,300 | |
| |
| | | | Energy Transfer Equity LP, | |
| | 112,882 | | | Guaranteed Senior Secured 1st Lien Term Loan, Tranche C | | | 4.00% | # | | | 12/02/2019 | | | | 102,064 | |
| |
| | | | Ensemble S Merger Sub, Inc., | |
| | 238,975 | | | Senior Secured 1st Lien Term Loan, Tranche B | | | 4.75% | # | | | 09/16/2022 | | | | 235,838 | |
| |
| | | | Envision Healthcare Corporation, | |
| | 219,450 | | | Guaranteed Senior Secured 1st Lien Term Loan, Tranche B2 | | | 4.50% | # | | | 10/28/2022 | | | | 219,862 | |
| |
| | | | Federal-Mogul Holdings Corporation, | |
| | 89,591 | | | Guaranteed Senior Secured 1st Lien Term Loan, Tranche C | | | 4.75% | # | | | 04/15/2021 | | | | 81,560 | |
| |
| | | | Filtration Group, Inc., | |
| | 204,128 | | | Senior Secured 1st Lien Term Loan, Tranche B | | | 4.25% | # | | | 11/20/2020 | | | | 203,788 | |
| |
| | | | First Data Corporation, | |
| | 40,000 | | | Guaranteed Senior Secured 1st Lien Term Loan, Tranche B | | | 4.43% | # | | | 03/24/2021 | | | | 39,950 | |
| | 181,639 | | | Guaranteed Senior Secured 1st Lien Term Loan, Tranche C1 | | | 3.93% | # | | | 03/23/2018 | | | | 181,593 | |
| |
| | | | Four Seasons Holdings, Inc., | |
| | 231,479 | | | Guaranteed Senior Secured 1st Lien Term Loan | | | 3.50% | # | | | 06/27/2020 | | | | 230,393 | |
| |
| | | | Galleria Company, | |
| | 235,000 | | | Guaranteed Senior Secured 1st Lien Term Loan, Tranche B | | | 3.75% | # | | | 01/26/2023 | | | | 234,927 | |
| |
| | | | Global Payments, Inc., | |
| | 42,000 | | | Guaranteed Senior Secured 1st Lien Term Loan, Tranche B | | | 3.50% | # | | | 03/21/2023 | | | | 42,280 | |
| |
| | | | Gray Television, Inc., | |
| | 99,750 | | | Guaranteed Senior Secured 1st Lien Term Loan, Tranche C | | | 4.25% | # | | | 06/11/2021 | | | | 100,031 | |
| |
| | | | Guggenheim Partners Investment Management Holdings LLC, | |
| | 167,443 | | | Guaranteed Senior Secured 1st Lien Term Loan, Tranche B | | | 4.25% | # | | | 07/22/2020 | | | | 167,722 | |
| |
| | | | Hillman Group, Inc., | |
| | 168,522 | | | Guaranteed Senior Secured 1st Lien Term Loan, Tranche B | | | 4.50% | # | | | 06/30/2021 | | | | 164,801 | |
| |
| | | | Hilton Worldwide Finance LLC, | |
| | 235,000 | | | Guaranteed Senior Secured 1st Lien Term Loan, Tranche B | | | 3.50% | # | | | 10/26/2020 | | | | 235,318 | |
| |
| | | | Hostess Brands LLC, | |
| | 278,600 | | | Senior Secured 1st Lien Term Loan | | | 4.50% | # | | | 08/03/2022 | | | | 279,238 | |
| |
| | | | Huntsman International LLC, | |
| | 240,000 | | | Guaranteed Senior Secured 1st Lien Term Loan, Tranche B | | | 3.50% | # | | | 03/24/2023 | | | | 239,326 | |
| |
| | | | Informatica Corporation, | |
| | 104,525 | | | Senior Secured 1st Lien Term Loan, Tranche B | | | 4.50% | # | | | 08/05/2022 | | | | 102,826 | |
| | | | | | | | | | | | | | | | |
PRINCIPAL AMOUNT $ | | | SECURITY DESCRIPTION | | RATE | | | MATURITY | | | VALUE $ | |
| |
| | | | Jeld-Wen, Inc., | |
| | 234,050 | | | Senior Secured 1st Lien Term Loan, Tranche B | | | 4.75% | # | | | 06/30/2022 | | | | 233,977 | |
| |
| | | | KAR Auction Services, Inc., | |
| | 152,000 | | | Guaranteed Senior Secured 1st Lien Term Loan, Tranche B3 | | | 4.25% | # | | | 03/09/2023 | | | | 152,696 | |
| |
| | | | KIK Custom Products, Inc., | |
| | 244,125 | | | Senior Secured 1st Lien Term Loan, Tranche B | | | 6.00% | # | | | 08/18/2022 | | | | 236,088 | |
| |
| | | | Kloeckner Pentaplast of America, Inc., | |
| | 264,231 | | | Senior Secured 1st Lien Term Loan | | | 5.00% | # | | | 04/28/2020 | | | | 264,891 | |
| | 112,919 | | | Senior Secured 1st Lien Term Loan | | | 5.00% | # | | | 04/28/2020 | | | | 113,201 | |
| |
| | | | Level 3 Financing, Inc., | |
| | 235,000 | | | Guaranteed Senior Secured 1st Lien Term Loan, Tranche BII | | | 3.50% | # | | | 05/31/2022 | | | | 234,853 | |
| |
| | | | Life Time Fitness, Inc., | |
| | 229,422 | | | Senior Secured 1st Lien Term Loan, Tranche B | | | 4.25% | # | | | 06/10/2022 | | | | 227,185 | |
| |
| | | | Live Nation Entertainment, Inc., | |
| | 217,315 | | | Guaranteed Senior Secured 1st Lien Term Loan, Tranche B1 | | | 3.50% | # | | | 08/14/2020 | | | | 217,677 | |
| |
| | | | MacDermid, Inc., | |
| | 234,407 | | | Guaranteed Senior Secured 1st Lien Term Loan, Tranche B2 | | | 5.50% | # | | | 06/05/2020 | | | | 227,155 | |
| |
| | | | Match Group, Inc., | |
| | 232,500 | | | Guaranteed Senior Secured 1st Lien Term Loan, Tranche B | | | 5.50% | # | | | 11/16/2022 | | | | 233,228 | |
| |
| | | | MGOC, Inc., | |
| | 232,598 | | | Guaranteed Senior Secured 1st Lien Delayed-Draw Term Loan, Tranche B | | | 4.00% | # | | | 07/31/2020 | | | | 232,540 | |
| |
| | | | Michaels Stores, Inc., | |
| | 232,625 | | | Guaranteed Senior Secured 1st Lien Term Loan, Tranche B2 | | | 4.00% | # | | | 01/28/2020 | | | | 233,123 | |
| |
| | | | Microsemi Corporation, | |
| | 235,294 | | | Guaranteed Senior Secured 1st Lien Term Loan, Tranche B | | | 5.25% | # | | | 01/17/2023 | | | | 236,728 | |
| |
| | | | Mitchell International, Inc., | |
| | 85,000 | | | Guaranteed Secured 2nd Lien Term Loan | | | 8.50% | # | | | 10/11/2021 | | | | 75,544 | |
| |
| | | | National Vision, Inc., | |
| | 244,114 | | | Senior Secured 1st Lien Term Loan, Tranche B | | | 4.00% | # | | | 03/12/2021 | | | | 237,783 | |
| |
| | | | Nord Anglia Education Finance LLC, | |
| | 244,038 | | | Guaranteed Senior Secured 1st Lien Term Loan, Tranche B | | | 5.00% | # | | | 03/31/2021 | | | | 240,989 | |
| |
| | | | NXP B.V., | |
| | 234,450 | | | Guranteed Senior Secured 1st Lien Term Loan, Tranche B | | | 3.75% | # | | | 12/07/2020 | | | | 235,274 | |
| |
| | | | ON Semiconductor Corporation, | |
| | 190,000 | | | Senior Secured 1st Lien Term Loan, Tranche B | | | 5.25% | # | | | 03/31/2023 | | | | 190,564 | |
| |
| | | | Party City Holdings, Inc., | |
| | 238,987 | | | Guaranteed Senior Secured 1st Lien Term Loan, Tranche B | | | 4.25% | # | | | 08/19/2022 | | | | 237,568 | |
| | | | | | |
| The accompanying notes are an integral part of these financial statements. | | Annual Report | | March 31, 2016 | | 69 |
| | |
| Schedule of Investments DoubleLine Shiller Enhanced CAPE® (Cont.) | | March 31, 2016 |
| | | | | | | | | | | | | | | | |
PRINCIPAL AMOUNT $ | | | SECURITY DESCRIPTION | | RATE | | | MATURITY | | | VALUE $ | |
| |
| | | | Pharmaceutical Product Development LLC, | |
| | 218,574 | | | Senior Secured 1st Lien Term Loan, Tranche B | | | 4.25% | # | | | 08/18/2022 | | | | 217,027 | |
| |
| | | | Pinnacle Foods Finance LLC, | |
| | 214,463 | | | Guaranteed Senior Secured 1st Lien Term Loan, Tranche I | | | 3.75% | # | | | 01/13/2023 | | | | 215,571 | |
| |
| | | | PODS LLC, | |
| | 238,571 | | | Senior Secured 1st Lien Term Loan, Tranche B | | | 4.50% | # | | | 02/02/2022 | | | | 238,720 | |
| |
| | | | PolyOne Corporation, | |
| | 234,463 | | | Guaranteed Senior Secured 1st Lien Term Loan, Tranche B | | | 3.75% | # | | | 11/10/2022 | | | | 235,269 | |
| |
| | | | Prestige Brands, Inc., | |
| | 232,705 | | | Guaranteed Senior Secured 1st Lien Term Loan, Tranche B3 | | | 3.50% | # | | | 09/03/2021 | | | | 233,374 | |
| |
| | | | Protection One, Inc., | |
| | 238,937 | | | Senior Secured 1st Lien Term Loan | | | 5.00% | # | | | 07/01/2021 | | | | 237,196 | |
| |
| | | | Reynolds Group Holdings, Inc., | |
| | 237,336 | | | Guaranteed Senior Secured 1st Lien Term Loan, Tranche B1 | | | 4.50% | # | | | 11/30/2018 | | | | 237,769 | |
| |
| | | | Scientific Games International, Inc., | |
| | 245,998 | | | Guaranteed Senior Secured 1st Lien Term Loan, Tranche B2 | | | 6.00% | # | | | 10/01/2021 | | | | 238,887 | |
| |
| | | | Serta Simmons Holdings LLC, | |
| | 240,000 | | | Senior Secured 1st Lien Term Loan, Tranche B | | | 4.25% | # | | | 10/01/2019 | | | | 240,188 | |
| |
| | | | Signode Industrial Group, Inc., | |
| | 240,007 | | | Senior Secured 1st Lien Term Loan, Tranche B | | | 3.75% | # | | | 04/30/2021 | | | | 233,707 | |
| |
| | | | SolarWinds Holdings, Inc., | |
| | 235,000 | | | Guaranteed Senior Secured 1st Lien Term Loan | | | 6.50% | # | | | 02/06/2023 | | | | 233,238 | |
| |
| | | | Solenis International LP, | |
| | 88,893 | | | Guaranteed Senior Secured 1st Lien Term Loan | | | 4.25% | # | | | 07/31/2021 | | | | 85,861 | |
| |
| | | | Southeast PowerGen LLC, | |
| | 218,567 | | | Senior Secured 1st Lien Term Loan, Tranche B | | | 4.50% | # | | | 12/02/2021 | | | | 201,628 | |
| |
| | | | Spin Holdco, Inc., | |
| | 241,061 | | | Guaranteed Senior Secured 1st Lien Term Loan, Tranche B | | | 4.25% | # | | | 11/14/2019 | | | | 235,396 | |
| |
| | | | Station Casinos LLC, | |
| | 239,443 | | | Guaranteed Senior Secured 1st Lien Term Loan, Tranche B | | | 4.25% | # | | | 03/02/2020 | | | | 239,144 | |
| |
| | | | Summit Materials LLC, | |
| | 238,587 | | | Guaranteed Senior Secured 1st Lien Term Loan, Tranche B | | | 4.00% | # | | | 07/18/2022 | | | | 238,587 | |
| |
| | | | Surgery Center Holdings, Inc., | |
| | 198,618 | | | Guaranteed Senior Secured 1st Lien Term Loan | | | 5.25% | # | | | 11/03/2020 | | | | 196,570 | |
| |
| | | | Team Health, Inc., | |
| | 239,463 | | | Guaranteed Senior Secured 1st Lien Term Loan, Tranche B | | | 4.50% | # | | | 11/23/2022 | | | | 240,208 | |
| |
| | | | T-Mobile USA, Inc., | |
| | 239,475 | | | Guaranteed Senior Secured 1st Lien Term Loan, Tranche B | | | 3.50% | # | | | 11/09/2022 | | | | 240,692 | |
| | | | | | | | | | | | | | | | |
PRINCIPAL AMOUNT $ | | | SECURITY DESCRIPTION | | RATE | | | MATURITY | | | VALUE $ | |
| |
| | | | TransUnion LLC, | |
| | 236,057 | | | Guaranteed Senior Secured 1st Lien Term Loan, Tranche B2 | | | 3.50% | # | | | 04/09/2021 | | | | 234,168 | |
| |
| | | | Travelport Finance Luxembourg S.A.R.L., | |
| | 216,195 | | | Guaranteed Senior Secured 1st Lien Term Loan, Tranche B | | | 5.75% | # | | | 09/02/2021 | | | | 216,357 | |
| |
| | | | Tribune Media Company, | |
| | 229,447 | | | Guaranteed Senior Secured 1st Lien Term Loan, Tranche B | | | 3.75% | # | | | 12/24/2020 | | | | 228,970 | |
| |
| | | | Univar, Inc., | |
| | 219,025 | | | Guaranteed Senior Secured 1st Lien Term Loan, Tranche B | | | 4.25% | # | | | 07/01/2022 | | | | 216,527 | |
| |
| | | | Univision Communications Inc, | |
| | 215,894 | | | Guaranteed Senior Secured 1st Lien Term Loan, Tranche C3 | | | 4.00% | # | | | 02/28/2020 | | | | 214,117 | |
| |
| | | | US Renal Care, Inc., | |
| | 209,475 | | | Senior Secured 1st Lien Term Loan | | | 5.25% | # | | | 12/30/2022 | | | | 209,126 | |
| |
| | | | USAGM HoldCo LLC, | |
| | 418,950 | | | Senior Secured 1st Lien Term Loan | | | 4.75% | # | | | 07/28/2022 | | | | 406,382 | |
| |
| | | | Virgin Media Investment Holdings Ltd., | |
| | 215,000 | | | Guaranteed Senior Secured 1st Lien Term Loan, Tranche F | | | 3.50% | # | | | 06/30/2023 | | | | 213,523 | |
| |
| | | | Vizient, Inc., | |
| | 200,000 | | | Senior Secured 1st Lien Term Loan, Tranche B | | | 6.25% | # | | | 02/13/2023 | | | | 201,916 | |
| |
| | | | Yankee Cable Acquisition LLC, | |
| | 104,728 | | | Senior Secured 1st Lien Term Loan, Tranche B | | | 4.25% | # | | | 02/28/2020 | | | | 104,423 | |
| |
| | | | York Risk Services Group, Inc., | |
| | 223,977 | | | Guaranteed Senior Secured 1st Lien Term Loan, Tranche B | | | 4.75% | # | | | 10/01/2021 | | | | 193,460 | |
| | | | | | | | | | | | | | | | |
| | | | Total Bank Loans
(Cost $20,617,888) | | | | 20,558,252 | |
| | | | | | | | | | | | | | | | |
| | COLLATERALIZED LOAN OBLIGATIONS 16.7% | |
| |
| | | | AB Ltd., | |
| | 500,000 | | | Series 2007-1A-B | | | 1.37% | #^ | | | 04/15/2021 | | | | 502,321 | |
| |
| | | | Adams Mill Ltd., | |
| | 1,000,000 | | | Series 2014-1A-A1 | | | 2.10% | #^ | | | 07/15/2026 | | | | 990,885 | |
| | 250,000 | | | Series 2014-1A-D1 | | | 4.12% | #^ | | | 07/15/2026 | | | | 211,389 | |
| |
| | | | AIMCO, | |
| | 289,783 | | | Series 2006-AA-A1 | | | 0.87% | #^ | | | 08/20/2020 | | | | 288,281 | |
| |
| | | | ALM Loan Funding, | |
| | 2,500,000 | | | Series 2012-7A-A1 | | | 2.04% | #^ | | | 10/19/2024 | | | | 2,501,491 | |
| | 3,935,000 | | | Series 2014-14A-A1 | | | 2.05% | #^ | | | 07/28/2026 | | | | 3,910,093 | |
| |
| | | | Anchorage Capital Ltd., | |
| | 650,000 | | | Series 2014-3A-A2A | | | 2.87% | #^ | | | 04/28/2026 | | | | 650,631 | |
| |
| | | | Apidos Ltd., | |
| | 2,000,000 | | | Series 2007-5A-B | | | 1.32% | #^ | | | 04/15/2021 | | | | 1,906,314 | |
| | 2,000,000 | | | Series 2013-16A-A1 | | | 2.07% | #^ | | | 01/19/2025 | | | | 1,990,585 | |
| | 500,000 | | | Series 2014-19A-D | | | 4.37% | #^ | | | 10/17/2026 | | | | 443,130 | |
| | 1,000,000 | | | Series 2015-20A-A1 | | | 2.17% | #^ | | | 01/16/2027 | | | | 995,310 | |
| | 500,000 | | | Series 2015-20A-A2 | | | 2.97% | #^ | | | 01/16/2027 | | | | 493,836 | |
| | | | | | |
| 70 | | DoubleLine Funds Trust | | | | The accompanying notes are an integral part of these financial statements. |
| | | | | | | | | | | | | | | | |
PRINCIPAL AMOUNT $ | | | SECURITY DESCRIPTION | | RATE | | | MATURITY | | | VALUE $ | |
| |
| | | | ARES Ltd., | |
| | 730,034 | | | Series 2007-12A-A | | | 1.26% | #^ | | | 11/25/2020 | | | | 719,014 | |
| | 500,000 | | | Series 2014-1A-A2 | | | 2.62% | #^ | | | 04/17/2026 | | | | 476,041 | |
| | 752,889 | | | Series 2014-30A-A2 | | | 1.47% | #^ | | | 04/20/2023 | | | | 749,422 | |
| |
| | | | Atrium Corporation, | |
| | 296,981 | | | Series 5A-A2A | | | 0.84% | #^ | | | 07/20/2020 | | | | 296,042 | |
| |
| | | | Avalon Capital Ltd., | |
| | 1,709,305 | | | Series 2014-1AR-AR | | | 1.79% | #^ | | | 04/17/2023 | | | | 1,703,551 | |
| |
| | | | Avery Point Ltd., | |
| | 250,000 | | | Series 2013-2A-D | | | 4.07% | #^ | | | 07/17/2025 | | | | 219,520 | |
| | 500,000 | | | Series 2014-1A-C | | | 3.72% | #^ | | | 04/25/2026 | | | | 477,277 | |
| |
| | | | Babson Ltd., | |
| | 2,701,588 | | | Series 2007-1A-A1 | | | 0.84% | #^ | | | 01/18/2021 | | | | 2,663,212 | |
| | 124,991 | | | Series 2007-1A-A2A | | | 0.83% | #^ | | | 01/18/2021 | | | | 124,808 | |
| | 500,000 | | | Series 2014-3A-C1 | | | 3.62% | #^ | | | 01/15/2026 | | | | 465,142 | |
| | 500,000 | | | Series 2014-3A-D2 | | | 4.83% | #^ | | | 01/15/2026 | | | | 446,643 | |
| | 2,500,000 | | | Series 2015-2A-D | | | 4.42% | #^ | | | 07/20/2027 | | | | 2,226,187 | |
| |
| | | | Betony Ltd., | |
| | 1,000,000 | | | Series 2015-1A-C | | | 3.77% | #^ | | | 04/15/2027 | | | | 983,725 | |
| | 1,000,000 | | | Series 2015-1A-D | | | 4.22% | #^ | | | 04/15/2027 | | | | 881,811 | |
| |
| | | | Birchwood Park Ltd., | |
| | 500,000 | | | Series 2014-1A-C2 | | | 3.77% | #^ | | | 07/15/2026 | | | | 498,064 | |
| | 500,000 | | | Series 2014-1A-D2 | | | 4.82% | #^ | | | 07/15/2026 | | | | 451,802 | |
| |
| | | | Black Diamond Ltd., | |
| | 54,404 | | | Series 2005-2A-A | | | 0.88% | #^ | | | 01/07/2018 | | | | 54,463 | |
| |
| | | | BlackRock Senior Income, | |
| | 190,219 | | | Series 2006-4A-A | | | 0.86% | #^ | | | 04/20/2019 | | | | 190,211 | |
| |
| | | | BlueMountain Ltd., | |
| | 750,000 | | | Series 2012-1A-A | | | 1.94% | #^ | | | 07/20/2023 | | | | 747,588 | |
| | 2,500,000 | | | Series 2012-2A-A1 | | | 2.04% | #^ | | | 11/20/2024 | | | | 2,490,803 | |
| | 1,000,000 | | | Series 2013-1A-A1 | | | 1.82% | #^ | | | 05/15/2025 | | | | 983,375 | |
| | 2,500,000 | | | Series 2013-4A-A | | | 2.12% | #^ | | | 04/15/2025 | | | | 2,491,406 | |
| | 1,000,000 | | | Series 2014-4A-B1 | | | 3.04% | #^ | | | 11/30/2026 | | | | 982,426 | |
| | 4,000,000 | | | Series 2015-3A-A1 | | | 1.81% | #^ | | | 10/20/2027 | | | | 3,990,424 | |
| |
| | | | Canyon Capital Ltd., | |
| | 1,000,000 | | | Series 2012-1A-C | | | 3.42% | #^ | | | 01/15/2024 | | | | 947,684 | |
| | 1,500,000 | | | Series 2014-1A-B | | | 3.27% | #^ | | | 04/30/2025 | | | | 1,399,351 | |
| |
| | | | Carlyle Global Market Strategies Ltd., | |
| | 2,500,000 | | | Series 2012-4A-A | | | 2.01% | #^ | | | 01/20/2025 | | | | 2,489,807 | |
| | 1,250,000 | | | Series 2014-1A-C | | | 3.62% | #^ | | | 04/17/2025 | | | | 1,232,222 | |
| | 500,000 | | | Series 2014-3A-B | | | 3.77% | #^ | | | 07/27/2026 | | | | 496,877 | |
| | 500,000 | | | Series 2014-3A-C2 | | | 4.82% | #^ | | | 07/27/2026 | | | | 457,784 | |
| | 2,000,000 | | | Series 2015-1A-A | | | 2.15% | #^ | | | 04/20/2027 | | | | 1,991,296 | |
| |
| | | | Carlyle High Yield Partners Ltd., | |
| | 892,757 | | | Series 2006-8A-A2A | | | 0.86% | #^ | | | 05/21/2021 | | | | 884,663 | |
| | 500,000 | | | Series 2006-8A-B | | | 1.00% | #^ | | | 05/21/2021 | | | | 484,610 | |
| | 1,808,888 | | | Series 2007-10-A1 | | | 0.84% | #^ | | | 04/19/2022 | | | | 1,755,851 | |
| | 1,384,687 | | | Series 2007-10A-A2A | | | 0.83% | #^ | | | 04/19/2022 | | | | 1,354,435 | |
| |
| | | | Catamaran Ltd., | |
| | 250,000 | | | Series 2014-1A-B | | | 3.27% | #^ | | | 04/20/2026 | | | | 236,368 | |
| | 1,000,000 | | | Series 2015-1A1-B | | | 2.82% | #^ | | | 04/22/2027 | | | | 968,282 | |
| | 2,000,000 | | | Series 2015-1A-A | | | 2.17% | #^ | | | 04/22/2027 | | | | 1,986,741 | |
| |
| | | | Cent Ltd., | |
| | 1,000,000 | | | Series 2013-19A-A1A | | | 1.95% | #^ | | | 10/29/2025 | | | | 980,689 | |
| | 1,000,000 | | | Series 2014-21A-A1A | | | 2.11% | #^ | | | 07/27/2026 | | | | 989,826 | |
| | 500,000 | | | Series 2014-22A-B | | | 3.82% | #^ | | | 11/07/2026 | | | | 492,113 | |
| | 250,000 | | | Series 2014-22A-C | | | 4.37% | #^ | | | 11/07/2026 | | | | 207,669 | |
| |
| | | | ColumbusNova Ltd., | |
| | 2,500,000 | | | Series 2007-2A-B | | | 1.87% | #^ | | | 10/15/2021 | | | | 2,447,022 | |
| |
| | | | Cornerstone Ltd., | |
| | 606,949 | | | Series 2007-1A-A1S | | | 0.84% | #^ | | | 07/15/2021 | | | | 602,421 | |
| |
| | | | Dryden Leveraged Loan, | |
| | 800,000 | | | Series 2006-11A-C1 | | | 2.22% | #^ | | | 04/12/2020 | | | | 753,250 | |
| |
| | | | Eaton Vance Ltd., | |
| | 1,852,245 | | | Series 2006-8A-A | | | 0.87% | #^ | | | 08/15/2022 | | | | 1,802,891 | |
| | 2,500,000 | | | Series 2006-8A-B | | | 1.27% | #^ | | | 08/15/2022 | | | | 2,343,018 | |
| | | | | | | | | | | | | | | | |
PRINCIPAL AMOUNT $ | | | SECURITY DESCRIPTION | | RATE | | | MATURITY | | | VALUE $ | |
| |
| | | | Flatiron Ltd., | |
| | 500,000 | | | Series 2013-1A-B | | | 3.37% | #^ | | | 01/17/2026 | | | | 464,124 | |
| | 250,000 | | | Series 2014-1A-C | | | 3.92% | #^ | | | 07/17/2026 | | | | 215,166 | |
| |
| | | | Four Corners Ltd., | |
| | 1,761,751 | | | Series 2006-2A-A | | | 0.89% | #^ | | | 01/26/2020 | | | | 1,739,391 | |
| |
| | | | Galaxy Ltd., | |
| | 2,000,000 | | | Series 2014-18A-A | | | 2.09% | #^ | | | 10/15/2026 | | | | 1,966,137 | |
| | 500,000 | | | Series 2014-18A-D1 | | | 4.32% | #^ | | | 10/15/2026 | | | | 429,577 | |
| |
| | | | GoldenTree Loan Opportunities Ltd., | |
| | 700,000 | | | Series 2012-6A-D | | | 4.82% | #^ | | | 04/17/2022 | | | | 678,461 | |
| |
| | | | Gulf Stream Ltd., | |
| | 156,878 | | | Series 2007-1A-A1A | | | 0.86% | #^ | | | 06/17/2021 | | | | 156,537 | |
| |
| | | | Halcyon Loan Advisors Funding Ltd., | |
| | 500,000 | | | Series 2012-1X-A2 | | | 3.12% | # | | | 08/15/2023 | | | | 502,513 | |
| | 500,000 | | | Series 2013-2A-C | | | 3.32% | #^ | | | 08/01/2025 | | | | 462,957 | |
| | 250,000 | | | Series 2013-2A-D | | | 4.42% | #^ | | | 08/01/2025 | | | | 211,928 | |
| | 500,000 | | | Series 2014-2A-C | | | 4.12% | #^ | | | 04/28/2025 | | | | 412,436 | |
| |
| | | | Hildene Ltd., | |
| | 3,000,000 | | | Series 2015-4A-A1A | | | 2.12% | #^ | | | 07/23/2027 | | | | 2,953,275 | |
| |
| | | | Highbridge Loan Management Ltd., | |
| | 2,000,000 | | | 2016-8A-X | | | 5.33% | # | | | 04/20/2028 | | | | 2,000,000 | |
| |
| | | | ING Ltd., | |
| | 1,439,085 | | | Series 2012-1RA-A1R | | | 1.83% | #^ | | | 03/14/2022 | | | | 1,435,495 | |
| | 500,000 | | | Series 2012-1RA-BR | | | 3.38% | #^ | | | 03/14/2022 | | | | 498,456 | |
| |
| | | | Inwood Park Ltd., | |
| | 1,000,000 | | | Series 2006-1A-B | | | 1.01% | #^ | | | 01/20/2021 | | | | 956,744 | |
| |
| | | | Jamestown Ltd., | |
| | 1,000,000 | | | Series 2015-6A-A1A | | | 2.22% | #^ | | | 02/20/2027 | | | | 988,857 | |
| |
| | | | KKR Financial Corporation, | |
| | 1,886,446 | | | Series 2007-1A-A | | | 0.97% | #^ | | | 05/15/2021 | | | | 1,879,226 | |
| |
| | | | LCM LP, | |
| | 500,000 | | | Series 10AR-BR | | | 2.52% | #^ | | | 04/15/2022 | | | | 497,262 | |
| | 500,000 | | | Series 10AR-CR | | | 3.47% | #^ | | | 04/15/2022 | | | | 495,464 | |
| | 500,000 | | | Series 11A-B | | | 2.77% | #^ | | | 04/19/2022 | | | | 502,504 | |
| | 250,000 | | | Series 11A-D2 | | | 4.57% | #^ | | | 04/19/2022 | | | | 241,653 | |
| | 500,000 | | | Series 14A-D | | | 4.12% | #^ | | | 07/15/2025 | | | | 452,509 | |
| | 500,000 | | | Series 15A-C | | | 3.73% | #^ | | | 08/25/2024 | | | | 495,933 | |
| | 250,000 | | | Series 16A-D | | | 4.22% | #^ | | | 07/15/2026 | | | | 220,472 | |
| | 767,941 | | | Series 9A-A | | | 1.82% | #^ | | | 07/14/2022 | | | | 769,213 | |
| |
| | | | Limerock Ltd., | |
| | 1,800,000 | | | Series 2014-2A-A | | | 2.12% | #^ | | | 04/18/2026 | | | | 1,792,110 | |
| |
| | | | Madison Park Funding Ltd., | |
| | 2,400,000 | | | Series 2012-10A-A1A | | | 1.99% | #^ | | | 01/20/2025 | | | | 2,390,140 | |
| | 250,000 | | | Series 2014-13A-D | | | 3.97% | #^ | | | 01/19/2025 | | | | 222,678 | |
| | 250,000 | | | Series 2014-14A-C1 | | | 3.72% | #^ | | | 07/20/2026 | | | | 249,099 | |
| | 1,000,000 | | | Series 2014-14A-D | | | 4.22% | #^ | | | 07/20/2026 | | | | 898,930 | |
| | 1,000,000 | | | Series 2014-15A-C | | | 4.32% | #^ | | | 01/27/2026 | | | | 885,047 | |
| | 1,000,000 | | | Series 2015-16A-B | | | 3.62% | #^ | | | 04/20/2026 | | | | 989,213 | |
| |
| | | | Magnetite Ltd., | |
| | 1,000,000 | | | Series 2014-11A-C | | | 4.22% | #^ | | | 01/18/2027 | | | | 877,938 | |
| |
| | | | MAPS Fund Ltd., | |
| | 1,000,000 | | | Series 2007-2A-B | | | 1.52% | #^ | | | 07/20/2022 | | | | 941,649 | |
| |
| | | | Nautique Funding Ltd., | |
| | 500,000 | | | Series 2006-1A-C | | | 2.32% | #^ | | | 04/15/2020 | | | | 465,518 | |
| |
| | | | Navigare Funding Ltd., | |
| | 3,000,000 | | | Series 2007-2A-C | | | 1.37% | #^ | | | 04/17/2021 | | | | 2,834,836 | |
| |
| | | | Neuberger Berman Ltd., | |
| | 2,000,000 | | | Series 2015-20A-X | | | 1.51% | #^ | | | 01/15/2028 | | | | 2,000,862 | |
| |
| | | | North End Ltd., | |
| | 500,000 | | | Series 2013-1A-C | | | 3.37% | #^ | | | 07/17/2025 | | | | 480,712 | |
| | 250,000 | | | Series 2013-1A-D | | | 3.12% | #^ | | | 07/17/2025 | | | | 218,479 | |
| |
| | | | NYLIM Flatiron Ltd., | |
| | 3,000,000 | | | Series 2006-1A-A2B | | | 0.94% | #^ | | | 08/08/2020 | | | | 2,951,826 | |
| |
| | | | Ocean Trails, | |
| | 500,000 | | | Series 2006-1A-A2 | | | 1.07% | #^ | | | 10/12/2020 | | | | 484,050 | |
| | | | | | |
| The accompanying notes are an integral part of these financial statements. | | Annual Report | | March 31, 2016 | | 71 |
| | |
| Schedule of Investments DoubleLine Shiller Enhanced CAPE® (Cont.) | | March 31, 2016 |
| | | | | | | | | | | | | | | | |
PRINCIPAL AMOUNT $ | | | SECURITY DESCRIPTION | | RATE | | | MATURITY | | | VALUE $ | |
| |
| | | | OCP Ltd., | |
| | 230,546 | | | Series 2012-2A-A2 | | | 2.10% | #^ | | | 11/22/2023 | | | | 231,162 | |
| |
| | | | Octagon Investment Partners Ltd., | |
| | 2,474,773 | | | Series 2012-1A-AR | | | 1.89% | #^ | | | 05/05/2023 | | | | 2,475,221 | |
| | 1,000,000 | | | Series 2014-1A-A | | | 2.10% | #^ | | | 11/25/2025 | | | | 993,610 | |
| | 2,500,000 | | | Series 2014-1A-A | | | 2.14% | #^ | | | 04/15/2026 | | | | 2,484,370 | |
| | 500,000 | | | Series 2014-1A-B | | | 3.82% | #^ | | | 11/14/2026 | | | | 491,022 | |
| | 750,000 | | | Series 2014-1A-C | | | 4.27% | #^ | | | 11/14/2026 | | | | 661,678 | |
| |
| | | | OZLM Funding Ltd., | |
| | 1,500,000 | | | Series 2013-5A-A1 | | | 2.12% | #^ | | | 01/17/2026 | | | | 1,491,792 | |
| |
| | | | OZLM Ltd., | |
| | 1,000,000 | | | Series 2015-11A-A1A | | | 2.17% | #^ | | | 01/30/2027 | | | | 996,330 | |
| | 1,000,000 | | | Series 2015-11A-A2A | | | 2.87% | #^ | | | 01/30/2027 | | | | 963,205 | |
| |
| | | | Pinnacle Park Ltd., | |
| | 500,000 | | | Series 2014-1A-C | | | 3.72% | #^ | | | 04/15/2026 | | | | 496,961 | |
| |
| | | | Prospect Park Ltd., | |
| | 2,602,699 | | | Series 2006-1A-A | | | 0.87% | #^ | | | 07/15/2020 | | | | 2,589,356 | |
| |
| | | | Race Point Ltd., | |
| | 2,773,879 | | | Series 2011-5A-AR | | | 1.93% | #^ | | | 12/15/2022 | | | | 2,767,919 | |
| | 250,000 | | | Series 2012-6RA-CR | | | 3.73% | #^ | | | 05/24/2023 | | | | 248,738 | |
| | 250,000 | | | Series 2012-6RA-DR | | | 4.73% | #^ | | | 05/24/2023 | | | | 234,443 | |
| |
| | | | Regatta Funding Ltd., | |
| | 500,000 | | | Series 2014-1A-A1A | | | 2.18% | #^ | | | 10/25/2026 | | | | 494,577 | |
| |
| | | | Silverado Ltd., | |
| | 1,604,181 | | | Series 2006-2A-A1 | | | 0.86% | #^ | | | 10/16/2020 | | | | 1,579,117 | |
| |
| | | | Slater Mill Loan Fund, | |
| | 500,000 | | | Series 2012-1A-B | | | 3.27% | #^ | | | 08/17/2022 | | | | 498,638 | |
| |
| | | | Sound Harbor Loan Fund Ltd., | |
| | 500,000 | | | Series 2014-1A-A1 | | | 2.12% | #^ | | | 10/30/2026 | | | | 496,263 | |
| |
| | | | Steele Creek Ltd., | |
| | 250,000 | | | Series 2014-1A-A1 | | | 2.22% | #^ | | | 08/21/2026 | | | | 246,820 | |
| |
| | | | Symphony Ltd., | |
| | 2,916,091 | | | Series 2012-8AR-AR | | | 1.72% | #^ | | | 01/09/2023 | | | | 2,902,969 | |
| | 2,000,000 | | | Series 2013-11A-A | | | 1.92% | #^ | | | 01/17/2025 | | | | 1,974,102 | |
| | 1,500,000 | | | Series 2013-11A-B1 | | | 2.82% | #^ | | | 01/17/2025 | | | | 1,472,864 | |
| | 1,500,000 | | | Series 2013-11A-C | | | 3.77% | #^ | | | 01/17/2025 | | | | 1,496,720 | |
| |
| | | | Thacher Park Ltd., | |
| | 500,000 | | | Series 2014-1A-C | | | 3.67% | #^ | | | 10/20/2026 | | | | 495,130 | |
| | 500,000 | | | Series 2014-1A-D1 | | | 4.15% | #^ | | | 10/20/2026 | | | | 439,337 | |
| |
| | | | Venture Ltd., | |
| | 784,916 | | | Series 2007-8A-A2A | | | 0.84% | #^ | | | 07/22/2021 | | | | 767,242 | |
| | 500,000 | | | Series 2012-10A-C | | | 3.87% | #^ | | | 07/20/2022 | | | | 496,414 | |
| | 1,000,000 | | | Series 2012-11A-AR | | | 1.92% | #^ | | | 11/14/2022 | | | | 995,697 | |
| | 500,000 | | | Series 2013-14A-B1 | | | 2.49% | #^ | | | 08/28/2025 | | | | 476,860 | |
| | 620,000 | | | Series 2014-16A-A1L | | | 2.12% | #^ | | | 04/15/2026 | | | | 613,117 | |
| | 1,500,000 | | | Series 2014-17A-A | | | 2.10% | #^ | | | 07/15/2026 | | | | 1,490,175 | |
| |
| | | | Washington Mill Ltd., | |
| | 1,000,000 | | | Series 2014-1A-A1 | | | 2.12% | #^ | | | 04/20/2026 | | | | 986,671 | |
| |
| | | | WG Horizons, | |
| | 500,000 | | | Series 2006-1A-C | | | 2.34% | #^ | | | 05/24/2019 | | | | 474,709 | |
| | | | | | | | | | | | | | | | |
| | | | Total Collateralized Loan Obligations
(Cost $145,527,087) | | | | 143,334,699 | |
| | | | | | | | | | | | | | | | |
| | FOREIGN CORPORATE BONDS 10.8% | | | | | | | | | |
| | 600,000 | | | Aeropuerto Internacional de Tocumen S.A. | | | 5.75% | | | | 10/09/2023 | | | | 618,000 | |
| | 200,000 | | | Aeropuertos Dominicanos | | | 9.75% | # | | | 11/13/2019 | | | | 212,000 | |
| | 1,400,000 | | | AES Gener S.A. | | | 5.25% | | | | 08/15/2021 | | | | 1,489,877 | |
| | 1,000,000 | | | Agromercantil Senior Trust | | | 6.25% | | | | 04/10/2019 | | | | 1,035,000 | |
| | 200,000 | | | Agromercantil Senior Trust | | | 6.25% | ^ | | | 04/10/2019 | | | | 207,000 | |
| | 800,000 | | | Avianca Holdings S.A. | | | 8.38% | | | | 05/10/2020 | | | | 632,000 | |
| | | | | | | | | | | | | | | | |
PRINCIPAL AMOUNT $ | | | SECURITY DESCRIPTION | | RATE | | | MATURITY | | | VALUE $ | |
| | 200,000 | | | Avianca Holdings S.A. | | | 8.38% | ^ | | | 05/10/2020 | | | | 158,000 | |
| | 1,100,000 | | | Banco Continental SAECA | | | 8.88% | | | | 10/15/2017 | | | | 1,115,125 | |
| | 200,000 | | | Banco de Bogota S.A. | | | 5.00% | | | | 01/15/2017 | | | | 203,000 | |
| | 500,000 | | | Banco GNB Sudameris S.A. | | | 7.50% | | | | 07/30/2022 | | | | 500,000 | |
| | 1,300,000 | | | Banco Latinoamericano do Comercio Exterior S.A. | | | 3.25% | | | | 05/07/2020 | | | | 1,296,750 | |
| | 1,495,000 | | | Banco Mercantil del Norte | | | 6.86% | # | | | 10/13/2021 | | | | 1,509,950 | |
| | 600,000 | | | Banco Regional SAECA | | | 8.13% | | | | 01/24/2019 | | | | 619,800 | |
| | 1,600,000 | | | Banco Santander | | | 5.95% | # | | | 01/30/2024 | | | | 1,658,400 | |
| | 1,000,000 | | | Bancolombia S.A. | | | 6.13% | | | | 07/26/2020 | | | | 1,059,700 | |
| | 1,245,000 | | | Bank of Montreal | | | 1.80% | | | | 07/31/2018 | | | | 1,250,586 | |
| | 2,200,000 | | | BBVA Bancomer S.A. | | | 6.01% | # | | | 05/17/2022 | | | | 2,238,500 | |
| | 250,000 | | | BP Capital Markets PLC | | | 1.85% | | | | 05/05/2017 | | | | 251,262 | |
| | 937,000 | | | BP Capital Markets PLC | | | 1.67% | | | | 02/13/2018 | | | | 938,489 | |
| | 1,090,000 | | | British Telecommunications PLC | | | 5.95% | | | | 01/15/2018 | | | | 1,176,022 | |
| | 50,000 | | | Camposol S.A. | | | 9.88% | | | | 02/02/2017 | | | | 43,750 | |
| | 200,000 | | | Cementos Progreso Trust | | | 7.13% | | | | 11/06/2023 | | | | 212,500 | |
| | 800,000 | | | Cemex S.A.B. de C.V. | | | 5.37% | # | | | 10/15/2018 | | | | 798,000 | |
| | 1,400,000 | | | Cencosud S.A. | | | 5.50% | | | | 01/20/2021 | | | | 1,497,094 | |
| | 1,000,000 | | | Central American Bottling Corporation | | | 6.75% | | | | 02/09/2022 | | | | 1,057,500 | |
| | 1,500,000 | | | CNOOC Finance Ltd. | | | 2.63% | | | | 05/05/2020 | | | | 1,504,745 | |
| | 300,000 | | | Colbun S.A. | | | 6.00% | | | | 01/21/2020 | | | | 330,050 | |
| | 500,000 | | | Comcel Trust | | | 6.88% | | | | 02/06/2024 | | | | 470,000 | |
| | 900,000 | | | Comision Federal de Electricidad | | | 4.88% | | | | 05/26/2021 | | | | 950,625 | |
| | 1,075,000 | | | Compania Minera Ares S.A.C. | | | 7.75% | | | | 01/23/2021 | | | | 1,069,625 | |
| | 700,000 | | | Corp Nacional del Cobre de Chile | | | 3.88% | | | | 11/03/2021 | | | | 718,272 | |
| | 700,000 | | | Corpbanca S.A. | | | 3.88% | | | | 09/22/2019 | | | | 718,792 | |
| | 500,000 | | | CorpGroup Banking S.A. | | | 6.75% | | | | 03/15/2023 | | | | 468,125 | |
| | 400,000 | | | Corporacion Azucarera del Peru S.A. | | | 6.38% | | | | 08/02/2022 | | | | 346,000 | |
| | 500,000 | | | Corporacion Financiera de Desarrollo S.A. | | | 3.25% | ^ | | | 07/15/2019 | | | | 510,000 | |
| | 700,000 | | | Corporacion Nacional del Cobre de Chile | | | 3.75% | | | | 11/04/2020 | | | | 733,520 | |
| | 700,000 | | | Cosan Overseas Ltd. | | | 8.25% | † | | | 11/29/2049 | | | | 595,000 | |
| | 200,000 | | | Credito Real S.A.B. de C.V. | | | 7.50% | | | | 03/13/2019 | | | | 198,500 | |
| | 200,000 | | | Delek & Avner Tamar Bond Ltd. | | | 3.84% | ^ | | | 12/30/2018 | | | | 200,180 | |
| | 1,800,000 | | | Delek & Avner Tamar Bond Ltd. | | | 4.44% | ^ | | | 12/30/2020 | | | | 1,813,500 | |
| | 200,000 | | | Digicel Ltd. | | | 7.00% | | | | 02/15/2020 | | | | 184,000 | |
| | 900,000 | | | Digicel Ltd. | | | 8.25% | | | | 09/30/2020 | | | | 777,375 | |
| | 800,000 | | | Digicel Ltd. | | | 7.13% | | | | 04/01/2022 | | | | 625,920 | |
| | 500,000 | | | Empresa de Energia de Bogota S.A. | | | 6.13% | | | | 11/10/2021 | | | | 520,500 | |
| | 1,200,000 | | | Empresa Electrica Guacolda S.A. | | | 4.56% | ^ | | | 04/30/2025 | | | | 1,151,586 | |
| | 800,000 | | | Empresas Publicas de Medellin E.S.P. | | | 7.63% | | | | 07/29/2019 | | | | 908,000 | |
| | 2,311,098 | | | ENA Norte Trust | | | 4.95% | | | | 04/25/2023 | | | | 2,368,875 | |
| | 241,727 | | | Fermaca Enterprises S. de R.L. de C.V. | | | 6.38% | | | | 03/30/2038 | | | | 229,037 | |
| | 2,000,000 | | | Fondo Mivivienda S.A. | | | 3.38% | | | | 04/02/2019 | | | | 2,027,500 | |
| | 1,300,000 | | | Freeport-McMoRan Copper & Gold, Inc. | | | 2.38% | | | | 03/15/2018 | | | | 1,157,000 | |
| | 1,100,000 | | | Global Bank Corporation | | | 4.75% | | | | 10/05/2017 | | | | 1,117,875 | |
| | 200,000 | | | Global Bank Corporation | | | 5.13% | ^ | | | 10/30/2019 | | | | 203,500 | |
| | 900,000 | | | Global Bank Corporation | | | 5.13% | | | | 10/30/2019 | | | | 915,750 | |
| | 200,000 | | | Globo Communicacao e Participacoes S.A. | | | 5.31% | # | | | 05/11/2022 | | | | 198,800 | |
| | 1,000,000 | | | Grupo Aval Ltd. | | | 5.25% | | | | 02/01/2017 | | | | 1,023,750 | |
| | 500,000 | | | Grupo Aval Ltd. | | | 4.75% | | | | 09/26/2022 | | | | 467,500 | |
| | 200,000 | | | Grupo Bimbo S.A.B. de C.V. | | | 4.50% | | | | 01/25/2022 | | | | 212,657 | |
| | 900,000 | | | Grupo Cementos de Chihuahua S.A.B de C.V. | | | 8.13% | | | | 02/08/2020 | | | | 936,000 | |
| | | | | | |
| 72 | | DoubleLine Funds Trust | | | | The accompanying notes are an integral part of these financial statements. |
| | | | | | | | | | | | | | | | |
PRINCIPAL AMOUNT $ | | | SECURITY DESCRIPTION | | RATE | | | MATURITY | | | VALUE $ | |
| | 700,000 | | | Grupo Elektra S.A.B. de C.V. | | | 7.25% | | | | 08/06/2018 | | | | 682,500 | |
| | 1,300,000 | | | Grupo Idesa S.A. de C.V. | | | 7.88% | | | | 12/18/2020 | | | | 1,269,125 | |
| | 1,500,000 | | | GrupoSura Finance S.A. | | | 5.70% | | | | 05/18/2021 | | | | 1,559,250 | |
| | 1,196,221 | | | Guanay Finance Ltd. | | | 6.00% | | | | 12/15/2020 | | | | 1,163,325 | |
| | 717,732 | | | Guanay Finance Ltd. | | | 6.00% | ^ | | | 12/15/2020 | | | | 697,995 | |
| | 2,000,000 | | | Hutchison Whampoa International Ltd. | | | 6.00% | #† | | | 05/07/2017 | | | | 2,071,000 | |
| | 300,000 | | | Inkia Energy Ltd. | | | 8.38% | | | | 04/04/2021 | | | | 300,750 | |
| | 200,000 | | | Inkia Energy Ltd. | | | 8.38% | ^ | | | 04/04/2021 | | | | 200,500 | |
| | 1,000,000 | | | Instituto Costarricense de Electricidad | | | 6.95% | | | | 11/10/2021 | | | | 1,002,500 | |
| | 815,729 | | | Interoceanica Finance Ltd. | | | 0.00% | | | | 11/30/2018 | | | | 779,021 | |
| | 600,000 | | | Inversiones CMPC S.A. | | | 4.75% | | | | 01/19/2018 | | | | 621,109 | |
| | 800,000 | | | Israel Electric Corporation Ltd. | | | 2.50% | # | | | 01/17/2018 | | | | 790,000 | |
| | 1,500,000 | | | Israel Electric Corporation Ltd. | | | 5.63% | | | | 06/21/2018 | | | | 1,597,035 | |
| | 600,000 | | | JBS Investments GmbH | | | 7.75% | | | | 10/28/2020 | | | | 597,000 | |
| | 400,000 | | | Latam Airlines Group S.A. | | | 7.25% | ^ | | | 06/09/2020 | | | | 370,000 | |
| | 1,300,000 | | | Marfrig Holdings B.V. | | | 6.88% | | | | 06/24/2019 | | | | 1,239,875 | |
| | 200,000 | | | Marfrig Holdings B.V. | | | 6.88% | ^ | | | 06/24/2019 | | | | 190,750 | |
| | 193,648 | | | Mexico Generadora de Energia | | | 5.50% | | | | 12/06/2032 | | | | 170,168 | |
| | 1,600,000 | | | Minerva Luxembourg S.A. | | | 8.75% | #† | | | 04/03/2019 | | | | 1,510,000 | |
| | 600,000 | | | Nacional Financiera S.N.C. | | | 3.38% | | | | 11/05/2020 | | | | 606,000 | |
| | 200,000 | | | OAS Investments GmbH | | | 8.25% | W | | | 10/19/2019 | | | | 1,240 | |
| | 150,000 | | | Odebrecht Finance Ltd. | | | 7.50% | † | | | 09/29/2049 | | | | 64,800 | |
| | 500,000 | | | Oleoducto Central S.A. | | | 4.00% | | | | 05/07/2021 | | | | 475,625 | |
| | 1,300,000 | | | ONGC Videsh Ltd. | | | 3.25% | | | | 07/15/2019 | | | | 1,321,489 | |
| | 360,000 | | | Orange S.A. | | | 2.75% | | | | 09/14/2016 | | | | 362,722 | |
| | 885,000 | | | Orange S.A. | | | 2.75% | | | | 02/06/2019 | | | | 912,964 | |
| | 2,200,000 | | | Oversea-Chinese Banking Corporation | | | 4.00% | # | | | 10/15/2024 | | | | 2,287,600 | |
| | 850,000 | | | Pacific Rubiales Energy Corporation | | | 5.38% | W | | | 01/26/2019 | | | | 148,750 | |
| | 1,156,536 | | | Peru Enhanced Pass-Through Finance Ltd. | | | 0.00% | | | | 05/31/2018 | | | | 1,114,334 | |
| | 600,000 | | | Petroleos Mexicanos | | | 5.50% | | | | 01/21/2021 | | | | 623,625 | |
| | 357,450 | | | Ras Laffan Liquefied Natural Gas Company | | | 5.30% | | | | 09/30/2020 | | | | 385,018 | |
| | 250,000 | | | Reliance Holdings, Inc. | | | 4.50% | | | | 10/19/2020 | | | | 269,362 | |
| | 1,415,000 | | | Royal Bank of Canada | | | 2.00% | | | | 12/10/2018 | | | | 1,429,563 | |
| | 200,000 | | | Sigma Alimentos S.A. | | | 6.88% | | | | 12/16/2019 | | | | 227,000 | |
| | 500,000 | | | Sinopec Group Overseas Development Ltd. | | | 2.50% | | | | 04/28/2020 | | | | 502,757 | |
| | 500,000 | | | Sinopec Group Overseas Development Ltd. | | | 2.50% | ^ | | | 04/28/2020 | | | | 502,757 | |
| | 1,200,000 | | | Sociedad Quimica y Minera S.A. | | | 6.13% | | | | 04/15/2016 | | | | 1,200,985 | |
| | 300,000 | | | Sociedad Quimica y Minera S.A. | | | 5.50% | | | | 04/21/2020 | | | | 311,475 | |
| | 1,100,000 | | | Southern Copper Corporation | | | 3.50% | | | | 11/08/2022 | | | | 1,061,677 | |
| | 1,200,000 | | | Tanner Servicios Financieros S.A. | | | 4.38% | | | | 03/13/2018 | | | | 1,179,000 | |
| | 1,400,000 | | | Telefonica Celular del Paraguay S.A. | | | 6.75% | | | | 12/13/2022 | | | | 1,379,000 | |
| | 300,000 | | | Tencent Holdings Ltd. | | | 2.88% | ^ | | | 02/11/2020 | | | | 305,357 | |
| | 1,325,000 | | | Thomson Reuters Corporation | | | 1.30% | | | | 02/23/2017 | | | | 1,322,925 | |
| | 1,215,000 | | | Toronto Dominion Bank | | | 1.75% | | | | 07/23/2018 | | | | 1,220,850 | |
| | 2,000,000 | | | Transportadora de Gas Internacional S.A. | | | 5.70% | | | | 03/20/2022 | | | | 2,037,000 | |
| | 200,000 | | | TV Azteca S.A.B. de C.V. | | | 7.50% | | | | 05/25/2018 | | | | 129,500 | |
| | 700,000 | | | TV Azteca S.A.B. de C.V. | | | 7.63% | | | | 09/18/2020 | | | | 413,000 | |
| | 400,000 | | | Unifin Financiera S.A.P.I. de C.V. | | | 6.25% | | | | 07/22/2019 | | | | 382,000 | |
| | 200,000 | | | Unifin Financiera S.A.P.I. de C.V. | | | 6.25% | ^ | | | 07/22/2019 | | | | 191,000 | |
| | 1,150,000 | | | Union Andina de Cementos S.A.A. | | | 5.88% | | | | 10/30/2021 | | | | 1,155,750 | |
| | 2,200,000 | | | United Overseas Bank Ltd. | | | 3.75% | # | | | 09/19/2024 | | | | 2,268,926 | |
| | 400,000 | | | Vedanta Resources PLC | | | 6.00% | | | | 01/31/2019 | | | | 274,500 | |
| | 1,000,000 | | | VTR Finance B.V. | | | 6.88% | | | | 01/15/2024 | | | | 982,800 | |
| | | | | | | | | | | | | | | | |
PRINCIPAL AMOUNT $ | | | SECURITY DESCRIPTION | | RATE | | | MATURITY | | | VALUE $ | |
| | 1,360,000 | | | Westpac Banking Corporation | | | 1.95% | | | | 11/23/2018 | | | | 1,372,271 | |
| | | | | | | | | | | | | | | | |
| | | | Total Foreign Corporate Bonds
(Cost $95,596,755) | | | | 92,666,389 | |
| | | | | | | | | | | | | | | | |
| FOREIGN GOVERNMENT BONDS AND NOTES, SUPRANATIONALS AND
FOREIGN AGENCIES 0.7% |
|
| | 3,500,000 | | | Colombia Government International Bond | | | 4.38% | | | | 07/12/2021 | | | | 3,657,500 | |
| | 1,800,000 | | | Panama Government International Bond | | | 5.20% | | | | 01/30/2020 | | | | 1,989,000 | |
| | | | | | | | | | | | | | | | |
| | | | Total Foreign Government Bonds and Notes, Supranationals and Foreign Agencies
(Cost $5,641,531) | | | | 5,646,500 | |
| | | | | | | | | | | | | | | | |
| | NON-AGENCY COMMERCIAL MORTGAGE BACKED OBLIGATIONS 15.9% | |
| |
| | | | BAMLL Commercial Mortgage Securities Trust, | |
| | 200,000 | | | Series 2014-IP-E | | | 2.72% | #^ | | | 06/15/2028 | | | | 196,292 | |
| | 30,000,000 | | | Series 2015-200P-XA | | | 0.38% | #^ I/O | | | 04/14/2033 | | | | 961,614 | |
| |
| | | | Banc of America Commercial Mortgage Trust, | |
| | 350,000 | | | Series 2006-5-AM | | | 5.45% | | | | 09/10/2047 | | | | 353,994 | |
| | 500,000 | | | Series 2007-1-AMFX | | | 5.48% | # | | | 01/15/2049 | | | | 505,803 | |
| | 500,000 | | | Series 2007-5-AM | | | 5.77% | # | | | 02/10/2051 | | | | 516,320 | |
| |
| | | | Bear Stearns Commercial Mortgage Securities, Inc., | |
| | 68,564 | | | Series 2004-PWR4-D | | | 5.97% | # | | | 06/11/2041 | | | | 68,751 | |
| | 876,741 | | | Series 2006-PW13-A4 | | | 5.54% | | | | 09/11/2041 | | | | 879,434 | |
| | 300,000 | | | Series 2006-PW13-AJ | | | 5.61% | # | | | 09/11/2041 | | | | 298,716 | |
| | 1,903,000 | | | Series 2006-PW13-AM | | | 5.58% | # | | | 09/11/2041 | | | | 1,921,166 | |
| | 500,000 | | | Series 2007-T26-AJ | | | 5.57% | # | | | 01/12/2045 | | | | 492,550 | |
| |
| | | | BXHTL Mortgage Trust, | |
| | 1,055,000 | | | Series 2015-JWRZ-A | | | 1.67% | #^ | | | 05/15/2029 | | | | 1,035,654 | |
| |
| | | | CD Commercial Mortgage Trust, | |
| | 59,644 | | | Series 2006-CD2-AM | | | 5.39% | # | | | 01/15/2046 | | | | 59,573 | |
| | 900,000 | | | Series 2007-CD4-AMFX | | | 5.37% | # | | | 12/11/2049 | | | | 915,476 | |
| |
| | | | CFCRE Commercial Mortgage Trust, | |
| | 22,245,787 | | | Series 2016-C3-XA | | | 1.10% | # I/O | | | 01/10/2048 | | | | 1,742,920 | |
| |
| | | | CGGS Commercial Mortgage Trust, | |
| | 2,023,000 | | | Series 2016-RNDB-AFL | | | 2.10% | #^ | | | 02/15/2033 | | | | 2,025,536 | |
| |
| | | | Citigroup Commercial Mortgage Trust, | |
| | 933,000 | | | Series 2007-C6-AM | | | 5.70% | # | | | 12/10/2049 | | | | 943,495 | |
| | 1,500,000 | | | Series 2007-C6-AMFX | | | 5.70% | #^ | | | 12/10/2049 | | | | 1,516,971 | |
| | 8,237,728 | | | Series 2014-GC25-XA | | | 1.09% | # I/O | | | 10/10/2047 | | | | 553,786 | |
| | 1,430,000 | | | Series 2015-GC27-D | | | 4.43% | #^ | | | 02/10/2048 | | | | 1,099,014 | |
| | 5,952,109 | | | Series 2015-GC27-XA | | | 1.44% | # I/O | | | 02/10/2048 | | | | 550,426 | |
| | 1,750,000 | | | Series 2015-GC31-C | | | 4.06% | # | | | 06/10/2048 | | | | 1,655,213 | |
| | 20,116,687 | | | Series 2016-GC36-XA | | | 1.36% | # I/O | | | 02/10/2049 | | | | 1,901,596 | |
| | 14,502,000 | | | Series 2016-P3-XA | | | 1.72% | # I/O | | | 04/15/2049 | | | | 1,736,340 | |
| |
| | | | COBALT Commercial Mortgage Trust, | |
| | 1,947,000 | | | Series 2006-C1-AM | | | 5.25% | | | | 08/15/2048 | | | | 1,935,071 | |
| | 300,000 | | | Series 2007-C2-AJFX | | | 5.57% | # | | | 04/15/2047 | | | | 293,155 | |
| | 350,000 | | | Series 2007-C3-AM | | | 5.76% | # | | | 05/15/2046 | | | | 360,126 | |
| |
| | | | Commercial Mortgage Pass-Through Certificates, | |
| | 110,000 | | | Series 2006-C7-AM | | | 5.87% | # | | | 06/10/2046 | | | | 110,234 | |
| | 10,323,382 | | | Series 2013-CR10-XA | | | 0.96% | # I/O | | | 08/10/2046 | | | | 438,491 | |
| | 3,199,187 | | | Series 2014-CR17-XA | | | 1.18% | # I/O | | | 05/10/2047 | | | | 195,094 | |
| | 300,000 | | | Series 2014-CR19-C | | | 4.72% | # | | | 08/10/2047 | | | | 299,356 | |
| | 500,000 | | | Series 2014-CR20-C | | | 4.51% | # | | | 11/10/2047 | | | | 497,155 | |
| | 1,768,000 | | | Series 2014-KYO-E | | | 2.79% | #^ | | | 06/11/2027 | | | | 1,733,930 | |
| | 1,500,000 | | | Series 2014-KYO-F | | | 3.94% | #^ | | | 06/11/2027 | | | | 1,486,919 | |
| | 110,000 | | | Series 2014-TWC-C | | | 2.28% | #^ | | | 02/13/2032 | | | | 107,162 | |
| | 1,500,000 | | | Series 2015-CR22-D | | | 4.13% | #^ | | | 03/10/2048 | | | | 1,122,462 | |
| | 22,345,882 | | | Series 2015-CR22-XA | | | 1.03% | # I/O | | | 03/10/2048 | | | | 1,363,266 | |
| | 1,500,000 | | | Series 2015-CR23-D | | | 4.26% | # | | | 05/10/2048 | | | | 1,116,995 | |
| | 1,386,000 | | | Series 2015-CR25-C | | | 4.55% | # | | | 08/10/2048 | | | | 1,276,388 | |
| | 1,000,000 | | | Series 2015-DC1-D | | | 4.35% | #^ | | | 02/10/2048 | | | | 758,916 | |
| | 12,427,880 | | | Series 2015-DC1-XA | | | 1.18% | # I/O | | | 02/10/2048 | | | | 861,919 | |
| | 950,000 | | | Series 2015-LC19-B | | | 3.83% | # | | | 02/10/2048 | | | | 966,831 | |
| | 1,470,000 | | | Series 2015-LC23-C | | | 4.65% | # | | | 10/10/2053 | | | | 1,433,283 | |
| | 1,966,000 | | | Series 2016-CR28-C | | | 4.65% | # | | | 02/10/2049 | | | | 1,940,139 | |
| | | | | | |
| The accompanying notes are an integral part of these financial statements. | | Annual Report | | March 31, 2016 | | 73 |
| | |
| Schedule of Investments DoubleLine Shiller Enhanced CAPE® (Cont.) | | March 31, 2016 |
| | | | | | | | | | | | | | | | |
PRINCIPAL AMOUNT $ | | | SECURITY DESCRIPTION | | RATE | | | MATURITY | | | VALUE $ | |
| |
| | | | Commercial Mortgage Pass-Through Certificates, (Cont.) | |
| | 17,918,000 | | | Series 2016-DC2-XA | | | 1.24% | # I/O | | | 02/10/2049 | | | | 1,337,516 | |
| |
| | | | Countrywide Commercial Mortgage Trust, | |
| | 885,816 | | | Series 2007-MF1-A | | | 6.07% | #^ | | | 11/12/2043 | | | | 914,257 | |
| |
| | | | Credit Suisse Mortgage Capital Certificates, | |
| | 110,000 | | | Series 2006-C4-AM | | | 5.51% | | | | 09/15/2039 | | | | 110,958 | |
| | 190,000 | | | Series 2006-C5-AM | | | 5.34% | | | | 12/15/2039 | | | | 192,333 | |
| | 350,000 | | | Series 2007-C2-AM | | | 5.59% | # | | | 01/15/2049 | | | | 358,362 | |
| | 1,575,000 | | | Series 2007-C2-AMFL | | | 0.67% | # | | | 01/15/2049 | | | | 1,505,118 | |
| | 855,000 | | | Series 2007-C4-A1AM | | | 5.94% | # | | | 09/15/2039 | | | | 855,677 | |
| | 2,735,001 | | | Series 2007-C5-A4 | | | 5.70% | # | | | 09/15/2040 | | | | 2,822,609 | |
| | 1,750,000 | | | Series 2008-C1-AM | | | 6.07% | #^ | | | 02/15/2041 | | | | 1,834,090 | |
| | 10,092,000 | | | Series 2014-USA-X1 | | | 0.55% | #^ I/O | | | 09/15/2037 | | | | 435,308 | |
| | 1,500,000 | | | Series 2015-SAND-D | | | 3.29% | #^ | | | 08/15/2030 | | | | 1,449,062 | |
| |
| | | | CSAIL Commercial Mortgage Trust, | |
| | 16,904,438 | | | Series 2015-C1-XA | | | 0.97% | # I/O | | | 04/15/2050 | | | | 1,006,695 | |
| |
| | | | GE Commercial Mortgage Corporation Trust, | |
| | 1,499,300 | | | Series 2007-C1-AM | | | 5.61% | # | | | 12/10/2049 | | | | 1,485,070 | |
| |
| | | | Grace Mortgage Trust, | |
| | 350,000 | | | Series 2014-GRCE-A | | | 3.37% | ^ | | | 06/10/2028 | | | | 368,911 | |
| |
| | | | Greenwich Capital Commercial Funding Corporation, | |
| | 1,550,000 | | | Series 2007-GG11-AJ | | | 6.03% | # | | | 12/10/2049 | | | | 1,527,755 | |
| | 1,750,000 | | | Series 2007-GG11-AM | | | 5.87% | # | | | 12/10/2049 | | | | 1,800,734 | |
| | 550,000 | | | Series 2007-GG9-AM | | | 5.48% | | | | 03/10/2039 | | | | 558,543 | |
| |
| | | | GS Mortgage Securities Corporation, | |
| | 1,519,839 | | | Series 2007-GG10-A4 | | | 5.79% | # | | | 08/10/2045 | | | | 1,567,316 | |
| | 300,000 | | | Series 2013-KING-C | | | 3.44% | #^ | | | 12/10/2027 | | | | 302,899 | |
| | 13,328,312 | | | Series 2014-GC20-XA | | | 1.18% | # I/O | | | 04/10/2047 | | | | 823,830 | |
| | 4,484,245 | | | Series 2014-GC24-XA | | | 0.88% | # I/O | | | 09/10/2047 | | | | 221,434 | |
| | 37,728,674 | | | Series 2015-GC32-XA | | | 0.90% | # I/O | | | 07/10/2048 | | | | 2,070,142 | |
| | 9,975,292 | | | Series 2015-GC34-XA | | | 1.38% | # I/O | | | 10/10/2048 | | | | 911,621 | |
| | 9,231,868 | | | Series 2015-GS1-XA | | | 0.84% | # I/O | | | 11/10/2048 | | | | 562,237 | |
| | 1,975,000 | | | Series 2016-ICE2-A | | | 2.37% | #^ | | | 02/15/2033 | | | | 1,977,826 | |
| |
| | | | JP Morgan Chase Commercial Mortgage Securities Corporation, | |
| | 1,500,000 | | | Series 2006-LDP9-AM | | | 5.37% | | | | 05/15/2047 | | | | 1,507,091 | |
| | 1,910,000 | | | Series 2007-C1-AM | | | 5.94% | # | | | 02/15/2051 | | | | 1,943,620 | |
| | 900,000 | | | Series 2007-CB20-AM | | | 5.88% | # | | | 02/12/2051 | | | | 941,859 | |
| | 530,000 | | | Series 2007-CIBC19-AM | | | 5.70% | # | | | 02/12/2049 | | | | 541,547 | |
| | 1,600,000 | | | Series 2007-CIBC20-AJ | | | 6.08% | # | | | 02/12/2051 | | | | 1,560,318 | |
| | 1,750,000 | | | Series 2007-LD12-AM | | | 6.01% | # | | | 02/15/2051 | | | | 1,826,053 | |
| | 350,000 | | | Series 2014-DSTY-A | | | 3.43% | ^ | | | 06/10/2027 | | | | 363,099 | |
| | 500,000 | | | Series 2014-PHH-D | | | 2.84% | #^ | | | 08/15/2027 | | | | 494,959 | |
| | 1,550,000 | | | Series 2015-CSMO-C | | | 2.69% | #^ | | | 01/15/2032 | | | | 1,512,045 | |
| | 23,041,517 | | | Series 2015-JP1-XA | | | 1.16% | # I/O | | | 01/15/2049 | | | | 1,594,558 | |
| |
| | | | JP Morgan Chase Commercial Mortgage Securities Trust, | |
| | 1,947,000 | | | Series 2007-LD11-AM | | | 5.74% | # | | | 06/15/2049 | | | | 1,928,521 | |
| | 1,678,228 | | | Series 2008-C2-A4 | | | 6.07% | | | | 02/12/2051 | | | | 1,750,649 | |
| |
| | | | JPMBB Commercial Mortgage Securities Trust, | |
| | 7,318,763 | | | Series 2014-C18-XA | | | 1.13% | # I/O | | | 02/15/2047 | | | | 393,979 | |
| | 500,000 | | | Series 2014-C23-C | | | 4.46% | # | | | 09/15/2047 | | | | 493,189 | |
| | 23,296,243 | | | Series 2014-C25-XA | | | 1.01% | # I/O | | | 11/15/2047 | | | | 1,346,882 | |
| | 1,303,000 | | | Series 2014-C26-C | | | 4.43% | # | | | 01/15/2048 | | | | 1,279,787 | |
| | 7,668,882 | | | Series 2014-C26-XA | | | 1.18% | # I/O | | | 01/15/2048 | | | | 485,874 | |
| | 1,000,000 | | | Series 2015-C27-D | | | 3.84% | #^ | | | 02/15/2048 | | | | 720,724 | |
| | 8,662,207 | | | Series 2015-C27-XA | | | 1.38% | # I/O | | | 02/15/2048 | | | | 666,656 | |
| | 29,812,048 | | | Series 2015-C29-XA | | | 0.96% | # I/O | | | 05/15/2048 | | | | 1,390,822 | |
| | 31,050,951 | | | Series 2015-C30-XA | | | 0.72% | # I/O | | | 07/15/2048 | | | | 1,247,733 | |
| | 13,159,221 | | | Series 2015-C31-XA | | | 1.03% | # I/O | | | 08/15/2048 | | | | 861,609 | |
| | 26,177,042 | | | Series 2015-C32-XA | | | 1.53% | # I/O | | | 11/15/2048 | | | | 2,104,255 | |
| | 580,000 | | | Series 2015-C33-C | | | 4.62% | # | | | 12/15/2048 | | | | 536,920 | |
| |
| | | | LB-UBS Commercial Mortgage Trust, | |
| | 150,000 | | | Series 2006-C7-AM | | | 5.38% | | | | 11/15/2038 | | | | 152,101 | |
| | 1,550,000 | | | Series 2007-C1-AJ | | | 5.48% | | | | 02/15/2040 | | | | 1,548,302 | |
| | 1,268,000 | | | Series 2007-C1-AM | | | 5.46% | | | | 02/15/2040 | | | | 1,287,984 | |
| | 179,000 | | | Series 2007-C2-AM | | | 5.49% | # | | | 02/15/2040 | | | | 181,930 | |
| |
| | | | Madison Avenue Trust, | |
| | 300,000 | | | Series 2013-650M-D | | | 4.03% | #^ | | | 10/12/2032 | | | | 300,583 | |
| |
| | | | Merrill Lynch Mortgage Trust, | |
| | 250,000 | | | Series 2006-C1-AJ | | | 5.76% | # | | | 05/12/2039 | | | | 245,884 | |
| | | | | | | | | | | | | | | | |
PRINCIPAL AMOUNT $ | | | SECURITY DESCRIPTION | | RATE | | | MATURITY | | | VALUE $ | |
| |
| | | | Merrill Lynch Mortgage Trust, (Cont.) | |
| | 150,000 | | | Series 2006-C2-AJ | | | 5.80% | # | | | 08/12/2043 | | | | 147,546 | |
| | 100,000 | | | Series 2006-C2-AM | | | 5.78% | # | | | 08/12/2043 | | | | 100,513 | |
| | 1,947,000 | | | Series 2007-C1-AM | | | 5.84% | # | | | 06/12/2050 | | | | 1,906,829 | |
| |
| | | | Merrill Lynch/Countrywide Commercial Mortgage Trust, | |
| | 63,674 | | | Series 2006-1-AJ | | | 5.74% | # | | | 02/12/2039 | | | | 63,616 | |
| | 750,000 | | | Series 2006-4-AM | | | 5.20% | | | | 12/12/2049 | | | | 762,874 | |
| |
| | | | Morgan Stanley Bank of America Merrill Lynch Trust, | |
| | 5,312,299 | | | Series 2013-C12-XA | | | 0.96% | # I/O | | | 10/15/2046 | | | | 211,064 | |
| | 21,174,089 | | | Series 2013-C7-XA | | | 1.65% | # I/O | | | 02/15/2046 | | | | 1,464,679 | |
| | 9,923,601 | | | Series 2014-C14-XA | | | 1.28% | # I/O | | | 02/15/2047 | | | | 548,470 | |
| | 500,000 | | | Series 2014-C18-C | | | 4.49% | | | | 10/15/2047 | | | | 494,455 | |
| | 620,000 | | | Series 2014-C19-C | | | 4.00% | | | | 12/15/2047 | | | | 554,272 | |
| | 120,000 | | | Series 2015-C20-C | | | 4.46% | # | | | 02/15/2048 | | | | 111,457 | |
| | 2,000,000 | | | Series 2015-C26-D | | | 3.06% | ^ | | | 10/15/2048 | | | | 1,325,303 | |
| | 21,879,376 | | | Series 2016-C28-XA | | | 1.30% | # I/O | | | 01/15/2049 | | | | 1,934,973 | |
| |
| | | | Morgan Stanley Capital, Inc., | |
| | 235,499 | | | Series 2006-HQ8-AJ | | | 5.49% | # | | | 03/12/2044 | | | | 235,021 | |
| | 500,000 | | | Series 2007-1Q16-AMA | | | 6.05% | # | | | 12/12/2049 | | | | 520,094 | |
| | 500,000 | | | Series 2007-HQ11-AJ | | | 5.51% | # | | | 02/12/2044 | | | | 492,017 | |
| | 750,000 | | | Series 2007-IQ16-AM | | | 6.05% | # | | | 12/12/2049 | | | | 784,221 | |
| | 175,000 | | | Series 2014-CPT-E | | | 3.45% | #^ | | | 07/13/2029 | | | | 169,373 | |
| | 175,000 | | | Series 2014-CPT-F | | | 3.45% | #^ | | | 07/13/2029 | | | | 164,682 | |
| | 800,000 | | | Series 2014-CPT-G | | | 3.45% | #^ | | | 07/13/2029 | | | | 715,567 | |
| | 500,000 | | | Series 2014-MP-D | | | 3.69% | #^ | | | 08/11/2029 | | | | 501,374 | |
| | 625,000 | | | Series 2015-XLF1-D | | | 3.44% | #^ | | | 08/14/2031 | | | | 617,670 | |
| |
| | | | Velocity Commercial Capital Loan Trust, | |
| | 3,363,002 | | | Series 2015-1-AFL | | | 2.86% | #^ | | | 06/25/2045 | | | | 3,384,021 | |
| |
| | | | Wachovia Bank Commercial Mortgage Trust, | |
| | 183,273 | | | Series 2006-C24-AJ | | | 5.66% | # | | | 03/15/2045 | | | | 183,014 | |
| | 1,500,000 | | | Series 2006-C28-AJ | | | 5.63% | # | | | 10/15/2048 | | | | 1,466,859 | |
| | 110,000 | | | Series 2006-C28-AM | | | 5.60% | # | | | 10/15/2048 | | | | 111,417 | |
| | 680,000 | | | Series 2007-C30-AJ | | | 5.41% | # | | | 12/15/2043 | | | | 669,413 | |
| | 1,800,000 | | | Series 2007-C30-AM | | | 5.38% | | | | 12/15/2043 | | | | 1,833,050 | |
| | 500,000 | | | Series 2007-C31-AM | | | 5.59% | # | | | 04/15/2047 | | | | 512,772 | |
| | 500,000 | | | Series 2007-C32-AMFX | | | 5.70% | ^ | | | 06/15/2049 | | | | 511,529 | |
| | 1,045,000 | | | Series 2007-C33-AJ | | | 5.95% | # | | | 02/15/2051 | | | | 1,031,478 | |
| | 1,500,000 | | | Series 2007-C33-AM | | | 5.95% | # | | | 02/15/2051 | | | | 1,551,752 | |
| |
| | | | Wells Fargo Commercial Mortgage Trust, | |
| | 1,900,000 | | | Series 2014-LC16-D | | | 3.94% | ^ | | | 08/15/2050 | | | | 1,425,243 | |
| | 540,000 | | | Series 2014-LC18-B | | | 3.96% | | | | 12/15/2047 | | | | 556,176 | |
| | 13,903,918 | | | Series 2015-C27-XA | | | 1.00% | # I/O | | | 02/15/2048 | | | | 908,988 | |
| | 2,000,000 | | | Series 2015-C31-C | | | 4.61% | # | | | 11/15/2048 | | | | 1,918,497 | |
| | 22,194,392 | | | Series 2015-C31-XA | | | 1.12% | #I/O | | | 11/15/2048 | | | | 1,717,111 | |
| | 32,853,489 | | | Series 2015-NXS2-XA | | | 0.81% | # I/O | | | 07/15/2058 | | | | 1,627,276 | |
| | 1,340,000 | | | Series 2015-NXS3-C | | | 4.49% | # | | | 09/15/2057 | | | | 1,229,006 | |
| | 1,443,000 | | | Series 2016-C32-C | | | 4.72% | # | | | 01/15/2059 | | | | 1,373,032 | |
| | 15,404,588 | | | Series 2016-C33-XA | | | 1.99% | # I/O | | | 03/15/2059 | | | | 1,857,947 | |
| |
| | | | WF-RBS Commercial Mortgage Trust, | |
| | 3,877,157 | | | Series 2014-C19-XA | | | 1.27% | # I/O | | | 03/15/2047 | | | | 243,434 | |
| | 9,837,093 | | | Series 2014-C21-XA | | | 1.18% | # I/O | | | 08/15/2047 | | | | 650,118 | |
| | | | | | | | | | | | | | | | |
| | | | Total Non-Agency Commercial Mortgage Backed Obligations
(Cost $141,392,409) | | | | 137,025,571 | |
| | | | | | | | | | | | | | | | |
| NON-AGENCY RESIDENTIAL COLLATERALIZED MORTGAGE
OBLIGATIONS 11.0% |
|
| |
| | | | Ajax Mortgage Loan Trust, | |
| | 2,880,826 | | | Series 2015-B-A | | | 3.88% | #^ | | | 07/25/2060 | | | | 2,892,022 | |
| |
| | | | Banc of America Funding Corporation, | |
| | 1,750,000 | | | Series 2005-B-3M1 | | | 0.88% | # | | | 04/20/2035 | | | | 1,431,111 | |
| | 5,403,825 | | | Series 2006-7-T2A1 | | | 5.88% | # | | | 10/25/2036 | | | | 4,461,624 | |
| |
| | | | Bayview Opportunity Master Fund Trust, | |
| | 7,487,466 | | | Series 2016-A-A | | | 4.46% | #^ | | | 01/28/2036 | | | | 7,512,941 | |
| |
| | | | BCAP LLC Trust, | |
| | 3,386,627 | | | Series 2012-RR1-3A4 | | | 5.89% | #^ | | | 10/26/2035 | | | | 3,034,357 | |
| | | | | | |
| 74 | | DoubleLine Funds Trust | | | | The accompanying notes are an integral part of these financial statements. |
| | | | | | | | | | | | | | | | |
PRINCIPAL AMOUNT $ | | | SECURITY DESCRIPTION | | RATE | | | MATURITY | | | VALUE $ | |
| |
| | | | CAM Mortgage LLC, | |
| | 1,474,557 | | | Series 2015-1-A | | | 3.50% | #^ | | | 07/15/2064 | | | | 1,479,565 | |
| |
| | | | Citicorp Residential Mortgage Securities, Inc., | |
| | 2,337,468 | | | Series 2007-1-A4 | | | 5.80% | # | | | 03/25/2037 | | | | 2,465,027 | |
| |
| | | | CitiMortgage Alternative Loan Trust, | |
| | 2,392,666 | | | Series 2007-A5-1A10 | | | 5.75% | | | | 05/25/2037 | | | | 2,022,245 | |
| |
| | | | Countrywide Alternative Loan Trust, | |
| | 194,427 | | | Series 2004-33-1A1 | | | 3.01% | # | | | 12/25/2034 | | | | 191,254 | |
| | 1,133,720 | | | Series 2005-23CB-A15 | | | 5.50% | | | | 07/25/2035 | | | | 1,097,272 | |
| | 4,004,092 | | | Series 2005-28CB-1A6 | | | 5.50% | | | | 08/25/2035 | | | | 3,791,910 | |
| | 3,548,340 | | | Series 2006-J6-A5 | | | 6.00% | | | | 09/25/2036 | | | | 3,178,146 | |
| | 795,268 | | | Series 2007-15CB-A7 | | | 6.00% | | | | 07/25/2037 | | | | 714,672 | |
| |
| | | | Countrywide Home Loans, | |
| | 2,777,041 | | | Series 2005-10-A2 | | | 5.50% | | | | 05/25/2035 | | | | 2,669,620 | |
| | 1,529,577 | | | Series 2007-14-A15 | | | 6.50% | | | | 09/25/2037 | | | | 1,499,536 | |
| |
| | | | Credit Suisse First Boston Mortgage Securities Corporation, | |
| | 22,742 | | | Series 2004-8-6A1 | | | 4.50% | | | | 12/25/2019 | | | | 22,969 | |
| | 4,479,354 | | | Series 2005-11-2A1 | | | 6.00% | | | | 12/25/2035 | | | | 4,273,516 | |
| | 191,809 | | | Series 2005-11-8A5 | | | 6.00% | | | | 12/25/2035 | | | | 183,879 | |
| | 1,837,635 | | | Series 2005-9-5A9 | | | 5.50% | | | | 10/25/2035 | | | | 1,589,100 | |
| |
| | | | Credit Suisse Mortgage Capital Certificates, | |
| | 1,000,000 | | | Series 2011-12R-3A5 | | | 2.42% | #^ | | | 07/27/2036 | | | | 922,910 | |
| | 1,000,000 | | | Series 2011-5R-6A9 | | | 2.74% | #^ | | | 11/27/2037 | | | | 908,118 | |
| |
| | | | Deutsche ALT-B Securities, Inc. Mortgage Loan Trust, | |
| | 1,469,465 | | | Series 2006-AB4-A1A | | | 6.01% | # | | | 10/25/2036 | | | | 1,191,325 | |
| |
| | | | Deutsche Mortgage & Asset Receiving Corporation, | |
| | 847,059 | | | Series 2014-RS1-1A2 | | | 8.17% | #^ | | | 07/27/2037 | | | | 628,864 | |
| |
| | | | GMACM Mortgage Loan Trust, | |
| | 199,054 | | | Series 2005-J1-A6 | | | 6.00% | | | | 12/25/2035 | | | | 193,327 | |
| |
| | | | GSR Mortgage Loan Trust, | |
| | 39,266 | | | Series 2004-2F-14A1 | | | 5.50% | | | | 09/25/2019 | | | | 40,222 | |
| | 1,079,701 | | | Series 2006-2F-3A4 | | | 6.00% | | | | 02/25/2036 | | | | 877,803 | |
| |
| | | | Home Equity Mortgage Loan Asset-Backed Trust, | |
| | 46,131 | | | Series 2006-D-2A2 | | | 0.54% | # | | | 11/25/2036 | | | | 45,776 | |
| |
| | | | Home Equity Mortgage Trust, | |
| | 259,988 | | | Series 2003-6-M2 | | | 2.63% | # | | | 03/25/2034 | | | | 251,567 | |
| |
| | | | HSI Asset Loan Obligation Trust, | |
| | 399,501 | | | Series 2006-2-1A1 | | | 6.00% | | | | 12/25/2036 | | | | 253,451 | |
| |
| | | | Impac Secured Assets Trust, | |
| | 1,133,134 | | | Series 2006-5-1A1C | | | 0.70% | # | | | 02/25/2037 | | | | 727,933 | |
| |
| | | | IndyMac Mortgage Loan Trust, | |
| | 3,021,805 | | | Series 2006-AR5-2A1 | | | 3.80% | # | | | 05/25/2036 | | | | 2,564,412 | |
| |
| | | | Lehman Mortgage Trust, | |
| | 531,638 | | | Series 2006-1-1A3 | | | 5.50% | | | | 02/25/2036 | | | | 431,771 | |
| |
| | | | Lehman XS Trust, | |
| | 39,505 | | | Series 2005-6-3A2B | | | 5.42% | # | | | 11/25/2035 | | | | 39,290 | |
| |
| | | | MASTR Adjustable Rate Mortgages Trust, | |
| | 394,852 | | | Series 2006-2-2A1 | | | 2.75% | # | | | 04/25/2036 | | | | 364,285 | |
| |
| | | | Merrill Lynch Alternative Note Asset Trust, | |
| | 699,205 | | | Series 2007-F1-2A6 | | | 6.00% | | | | 03/25/2037 | | | | 506,692 | |
| |
| | | | Merrill Lynch Mortgage Investors Trust, | |
| | 2,649,691 | | | Series 2006-AF1-AF2C | | | 6.25% | | | | 08/25/2036 | | | | 2,142,732 | |
| |
| | | | Morgan Stanley Mortgage Loan Trust, | |
| | 645,137 | | | Series 2006-2-7A1 | | | 5.50% | # | | | 02/25/2036 | | | | 592,273 | |
| |
| | | | Residential Accredit Loans, Inc., | |
| | 1,816,595 | | | Series 2006-QS12-2A3 | | | 6.00% | | | | 09/25/2036 | | | | 1,493,380 | |
| | 2,405,759 | | | Series 2007-QS9-A33 | | | 6.50% | | | | 07/25/2037 | | | | 2,040,666 | |
| |
| | | | Residential Asset Mortgage Products, Inc., | |
| | 457,765 | | | Series 2005-EFC7-AI3 | | | 0.68% | # | | | 04/25/2034 | | | | 433,345 | |
| |
| | | | Residential Asset Securitization Trust, | |
| | 1,144,941 | | | Series 2006-A2-A11 | | | 6.00% | | | | 01/25/2046 | | | | 865,297 | |
| |
| | | | Springleaf Mortgage Loan Trust, | |
| | 1,250,000 | | | Series 2013-1A-B2 | | | 6.00% | #^ | | | 06/25/2058 | | | | 1,249,558 | |
| | 1,250,000 | | | Series 2013-2A-B2 | | | 6.00% | #^ | | | 12/25/2065 | | | | 1,255,449 | |
| | | | | | | | | | | | | | | | |
PRINCIPAL AMOUNT $ | | | SECURITY DESCRIPTION | | RATE | | | MATURITY | | | VALUE $ | |
| |
| | | | Structured Asset Securities Corporation, | |
| | 2,497,761 | | | Series 2005-16-1A2 | | | 5.50% | | | | 09/25/2035 | | | | 2,519,336 | |
| |
| | | | Towd Point Mortgage Trust, | |
| | 4,381,260 | | | Series 2015-2-1A13 | | | 2.50% | #^ | | | 11/25/2060 | | | | 4,384,644 | |
| |
| | | | VOLT LLC, | |
| | 10,950,624 | | | Series 2015-NPL11-A1 | | | 3.63% | #^ | | | 07/25/2045 | | | | 10,881,391 | |
| | 2,929,544 | | | Series 2015-NPL1-A1 | | | 3.63% | #^ | | | 10/25/2057 | | | | 2,894,910 | |
| | 6,211,262 | | | Series 2015-NPL3-A1 | | | 3.38% | #^ | | | 10/25/2058 | | | | 6,143,663 | |
| |
| | | | Washington Mutual Mortgage Pass-Through Certificates, | |
| | 239,559 | | | Series 2006-5-1A5 | | | 6.00% | | | | 07/25/2036 | | | | 203,888 | |
| |
| | | | Wells Fargo Alternative Loan Trust, | |
| | 3,114,391 | | | Series 2007-PA5-1A1 | | | 6.25% | | | | 11/25/2037 | | | | 2,997,600 | |
| | | | | | | | | | | | | | | | |
| | | | Total Non-Agency Residential Collateralized Mortgage Obligations
(Cost $96,062,351) | | | | 94,556,644 | |
| | | | | | | | | | | | | | | | |
| | US CORPORATE BONDS 7.9% | |
| | 1,280,000 | | | AbbVie, Inc. | | | 1.80% | | | | 05/14/2018 | | | | 1,289,426 | |
| | 1,240,000 | | | Amazon.com, Inc. | | | 2.60% | | | | 12/05/2019 | | | | 1,291,556 | |
| | 1,260,000 | | | American Express Credit Corporation | | | 1.80% | | | | 07/31/2018 | | | | 1,266,040 | |
| | 1,145,000 | | | American Honda Finance Corporation | | | 1.70% | | | | 02/22/2019 | | | | 1,155,215 | |
| | 1,375,000 | | | Anheuser-Busch InBev Finance, Inc. | | | 1.90% | | | | 02/01/2019 | | | | 1,395,466 | |
| | 490,000 | | | Apple, Inc. | | | 1.70% | | | | 02/22/2019 | | | | 497,776 | |
| | 1,170,000 | | | AT&T, Inc. | | | 2.30% | | | | 03/11/2019 | | | | 1,195,644 | |
| | 1,552,000 | | | Bank of America Corporation | | | 2.00% | | | | 01/11/2018 | | | | 1,559,232 | |
| | 848,000 | | | BB&T Corporation | | | 2.15% | | | | 03/22/2017 | | | | 856,607 | |
| | 300,000 | | | BB&T Corporation | | | 2.25% | | | | 02/01/2019 | | | | 305,279 | |
| | 1,350,000 | | | Berkshire Hathaway Finance Corporation | | | 1.70% | | | | 03/15/2019 | | | | 1,372,622 | |
| | 1,093,000 | | | Boston Properties LP | | | 5.88% | | | | 10/15/2019 | | | | 1,223,696 | |
| | 910,000 | | | Cardinal Health, Inc. | | | 1.95% | | | | 06/15/2018 | | | | 914,861 | |
| | 1,245,000 | | | Caterpillar Financial Services Corporation | | | 1.70% | | | | 06/16/2018 | | | | 1,255,528 | |
| | 1,265,000 | | | Celgene Corporation | | | 2.13% | | | | 08/15/2018 | | | | 1,280,243 | |
| | 620,000 | | | Chevron Corporation | | | 1.37% | | | | 03/02/2018 | | | | 622,455 | |
| | 359,000 | | | Chevron Corporation | | | 1.79% | | | | 11/16/2018 | | | | 363,529 | |
| | 1,295,000 | | | Cisco Systems, Inc. | | | 1.65% | | | | 06/15/2018 | | | | 1,315,088 | |
| | 1,646,000 | | | Citigroup, Inc. | | | 2.05% | | | | 12/07/2018 | | | | 1,654,256 | |
| | 860,000 | | | Comcast Corporation | | | 6.50% | | | | 01/15/2017 | | | | 897,401 | |
| | 945,000 | | | ConocoPhillips Company | | | 1.05% | | | | 12/15/2017 | | | | 931,830 | |
| | 880,000 | | | Covidien International Finance S.A. | | | 6.00% | | | | 10/15/2017 | | | | 944,468 | |
| | 1,147,000 | | | CVS Health Corporation | | | 1.90% | | | | 07/20/2018 | | | | 1,164,551 | |
| | 265,000 | | | Daimler Finance North America LLC | | | 2.25% | ^ | | | 03/02/2020 | | | | 266,885 | |
| | 950,000 | | | Daimler Finance North America LLC | | | 1.65% | ^ | | | 03/02/2018 | | | | 951,516 | |
| | 1,265,000 | | | Duke Energy Corporation | | | 1.63% | | | | 08/15/2017 | | | | 1,267,560 | |
| | 1,025,000 | | | Express Scripts Holding Company | | | 2.65% | | | | 02/15/2017 | | | | 1,038,652 | |
| | 155,000 | | | Express Scripts Holding Company | | | 2.25% | | | | 06/15/2019 | | | | 156,280 | |
| | 611,000 | | | GE Capital International Funding Company | | | 0.96% | ^ | | | 04/15/2016 | | | | 611,036 | |
| | 1,225,000 | | | General Mills, Inc. | | | 2.20% | | | | 10/21/2019 | | | | 1,246,929 | |
| | 1,175,000 | | | Goldman Sachs Group, Inc. | | | 2.90% | | | | 07/19/2018 | | | | 1,203,267 | |
| | 1,620,000 | | | Hewlett-Packard Company | | | 2.85% | ^ | | | 10/05/2018 | | | | 1,648,460 | |
| | 1,195,000 | | | HJ Heinz Company | | | 2.00% | ^ | | | 07/02/2018 | | | | 1,206,881 | |
| | 855,000 | | | Home Depot, Inc. | | | 2.00% | | | | 06/15/2019 | | | | 877,792 | |
| | 1,150,000 | | | John Deere Capital Corporation | | | 1.60% | | | | 07/13/2018 | | | | 1,159,753 | |
| | 1,260,000 | | | JP Morgan Chase & Company | | | 2.25% | | | | 01/23/2020 | | | | 1,271,089 | |
| | | | | | |
| The accompanying notes are an integral part of these financial statements. | | Annual Report | | March 31, 2016 | | 75 |
| | |
| Schedule of Investments DoubleLine Shiller Enhanced CAPE® (Cont.) | | March 31, 2016 |
| | | | | | | | | | | | | | | | |
PRINCIPAL AMOUNT $ | | | SECURITY DESCRIPTION | | RATE | | | MATURITY | | | VALUE $ | |
| | 875,000 | | | Kellogg Company | | | 1.75% | | | | 05/17/2017 | | | | 881,769 | |
| | 1,166,000 | | | Kinder Morgan Energy Partners LP | | | 6.00% | | | | 02/01/2017 | | | | 1,200,753 | |
| | 600,000 | | | Kroger Company | | | 2.20% | | | | 01/15/2017 | | | | 604,635 | |
| | 275,000 | | | Kroger Company | | | 6.40% | | | | 08/15/2017 | | | | 294,021 | |
| | 1,181,000 | | | Laboratory Corporation | | | 2.50% | | | | 11/01/2018 | | | | 1,191,949 | |
| | 135,000 | | | Lockheed Martin Corporation | | | 1.85% | | | | 11/23/2018 | | | | 136,651 | |
| | 1,310,000 | | | McGraw Hill Financial, Inc. | | | 2.50% | | | | 08/15/2018 | | | | 1,328,396 | |
| | 1,197,000 | | | McKesson Corporation | | | 1.29% | | | | 03/10/2017 | | | | 1,199,490 | |
| | 355,000 | | | Medtronic, Inc. | | | 1.50% | | | | 03/15/2018 | | | | 358,201 | |
| | 925,000 | | | Metropolitan Life Global Funding | | | 1.50% | ^ | | | 01/10/2018 | | | | 926,630 | |
| | 1,550,000 | | | Morgan Stanley | | | 2.45% | | | | 02/01/2019 | | | | 1,574,079 | |
| | 1,330,000 | | | MUFG Americas Holdings Corporation | | | 1.63% | | | | 02/09/2018 | | | | 1,326,033 | |
| | 1,000,000 | | | National Rural Utilities Cooperative Finance Corporation | | | 2.30% | | | | 11/15/2019 | | | | 1,022,444 | |
| | 1,170,000 | | | Newell Rubbermaid, Inc. | | | 2.60% | | | | 03/29/2019 | | | | 1,188,091 | |
| | 615,000 | | | Oracle Corporation | | | 2.38% | | | | 01/15/2019 | | | | 637,903 | |
| | 635,000 | | | Oracle Corporation | | | 2.25% | | | | 10/08/2019 | | | | 655,654 | |
| | 240,000 | | | Pepsico, Inc. | | | 1.50% | | | | 02/22/2019 | | | | 243,125 | |
| | 705,000 | | | Pepsico, Inc. | | | 2.15% | | | | 10/14/2020 | | | | 723,527 | |
| | 870,000 | | | Philip Morris International, Inc. | | | 5.65% | | | | 05/16/2018 | | | | 952,362 | |
| | 850,000 | | | Phillips 66 | | | 2.95% | | | | 05/01/2017 | | | | 865,778 | |
| | 1,140,000 | | | Procter & Gamble Company | | | 1.60% | | | | 11/15/2018 | | | | 1,156,858 | |
| | 730,000 | | | Reynolds American, Inc. | | | 3.25% | | | | 06/12/2020 | | | | 764,721 | |
| | 875,000 | | | Simon Property Group LP | | | 2.15% | | | | 09/15/2017 | | | | 884,615 | |
| | 233,000 | | | Simon Property Group LP | | | 2.20% | | | | 02/01/2019 | | | | 236,642 | |
| | 1,215,000 | | | Southern Company | | | 2.45% | | | | 09/01/2018 | | | | 1,235,327 | |
| | 600,000 | | | Thermo Fisher Scientific, Inc. | | | 2.15% | | | | 12/14/2018 | | | | 603,806 | |
| | 850,000 | | | Toyota Motor Credit Corporation | | | 1.55% | | | | 07/13/2018 | | | | 858,139 | |
| | 650,000 | | | Toyota Motor Credit Corporation | | | 1.70% | | | | 02/19/2019 | | | | 656,465 | |
| | 1,290,000 | | | United Technologies Corporation | | | 1.78% | # | | | 05/04/2018 | | | | 1,293,826 | |
| | 325,000 | | | Waste Management, Inc. | | | 2.60% | | | | 09/01/2016 | | | | 327,130 | |
| | 505,000 | | | Waste Management, Inc. | | | 6.10% | | | | 03/15/2018 | | | | 551,947 | |
| | 250,000 | | | WellPoint, Inc. | | | 1.88% | | | | 01/15/2018 | | | | 250,928 | |
| | 1,035,000 | | | WellPoint, Inc. | | | 2.30% | | | | 07/15/2018 | | | | 1,047,370 | |
| | 950,000 | | | Wells Fargo & Company | | | 2.10% | | | | 05/08/2017 | | | | 961,042 | |
| | 225,000 | | | Wells Fargo & Company | | | 1.50% | | | | 01/16/2018 | | | | 226,405 | |
| | 885,000 | | | Xerox Corporation | | | 2.95% | | | | 03/15/2017 | | | | 890,567 | |
| | 842,000 | | | Zimmer Holdings, Inc. | | | 1.45% | | | | 04/01/2017 | | | | 841,965 | |
| | 350,000 | | | Zimmer Holdings, Inc. | | | 2.70% | | | | 04/01/2020 | | | | 355,365 | |
| | | | | | | | | | | | | | | | |
| | | | Total US Corporate Bonds
(Cost $67,679,457) | | | | 68,113,478 | |
| | | | | | | | | | | | | | | | |
| | US GOVERNMENT / AGENCY MORTGAGE BACKED OBLIGATIONS 4.2% | |
| |
| | | | Federal Home Loan Mortgage Corporation, | |
| | 2,798,114 | | | Pool G08626 | | | 3.00% | | | | 02/01/2045 | | | | 2,869,129 | |
| | 2,843,897 | | | Pool G08631 | | | 3.00% | | | | 03/01/2045 | | | | 2,916,074 | |
| | 1,049,720 | | | Series 3417-SM | | | 5.84% | # I/F I/O | | | 02/15/2038 | | | | 212,906 | |
| | 2,552,094 | | | Series 4471-GA | | | 3.00% | | | | 02/15/2044 | | | | 2,637,554 | |
| |
| | | | Federal National Mortgage Association, | |
| | 5,588,723 | | | Series 2015-09-HA | | | 3.00% | | | | 01/25/2045 | | | | 5,842,877 | |
| | 9,594,836 | | | Series 2015-59-A | | | 3.00% | | | | 06/25/2041 | | | | 9,849,863 | |
| | | | | | | | | | | | | | | | |
PRINCIPAL AMOUNT $ / SHARES | | | SECURITY DESCRIPTION | | RATE | | | MATURITY | | | VALUE $ | |
| |
| | | | Federal National Mortgage Association Pass-Thru, | |
| | 3,817,390 | | | Pool AS4645 | | | 3.00% | | | | 03/01/2045 | | | | 3,921,305 | |
| | 834,708 | | | Pool MA1200 | | | 3.00% | | | | 10/01/2032 | | | | 870,514 | |
| | 7,273,798 | | | Pool MA2270 | | | 3.00% | | | | 05/01/2045 | | | | 7,368,989 | |
| | | | | | | | | | | | | | | | |
| | | | Total US Government / Agency Mortgage Backed Obligations
(Cost $36,097,830) | | | | 36,489,211 | |
| | | | | | | | | | | | | | | | |
| | US GOVERNMENT BONDS AND NOTES 17.4% | |
| | 22,200,000 | | | United States Treasury Notes | | | 3.13% | | | | 01/31/2017 | | | | 22,664,823 | |
| | 14,700,000 | | | United States Treasury Notes | | | 0.88% | | | | 07/15/2017 | | | | 14,738,191 | |
| | 22,900,000 | | | United States Treasury Notes | | | 1.00% | | | | 09/15/2017 | | | | 23,001,974 | |
| | 24,000,000 | | | United States Treasury Notes | | | 0.75% | | | | 04/15/2018 | | | | 23,998,128 | |
| | 34,900,000 | | | United States Treasury Notes | | | 0.88% | | | | 07/15/2018 | | | | 34,972,243 | |
| | 30,400,000 | | | United States Treasury Notes | | | 1.00% | | | | 09/15/2018 | | | | 30,554,371 | |
| | | | | | | | | | | | | | | | |
| | | | Total US Government Bonds and Notes
(Cost $149,524,525) | | | | 149,929,730 | |
| | | | | | | | | | | | | | | | |
| | SHORT TERM INVESTMENTS 5.2% | | | | | | | | | |
| | 15,008,715 | | | BlackRock Liquidity Funds FedFund - Institutional Shares | | | 0.24% | ¨ | | | | | | | 15,008,715 | |
| | 15,008,713 | | | Fidelity Institutional Money Market Government Portfolio - Class I | | | 0.23% | ¨ | | | | | | | 15,008,713 | |
| | 15,008,714 | | | Morgan Stanley Institutional Liquidity Funds Government Portfolio - Institutional Share Class | | | 0.25% | ¨ | | | | | | | 15,008,714 | |
| | | | | | | | | | | | | | | | |
| | | | Total Short Term Investments
(Cost $45,026,142) | | | | 45,026,142 | |
| | | | | | | | | | | | | | | | |
| | | | Total Investments 94.1%
(Cost $819,393,273) | | | | 809,529,250 | |
| | | | Other Assets in Excess of Liabilities 5.9% | | | | 50,763,792 | |
| | | | | | | | | | | | | | | | |
| | | | NET ASSETS 100.0% | | | $ | 860,293,042 | |
| | | | | | | | | | | | | | | | |
| | | | | | |
| 76 | | DoubleLine Funds Trust | | | | The accompanying notes are an integral part of these financial statements. |
| | | | |
| SECURITY TYPE BREAKDOWN as a % of Net Assets: | | | | |
US Government Bonds and Notes | | | 17.4% | |
Collateralized Loan Obligations | | | 16.7% | |
Non-Agency Commercial Mortgage Backed Obligations | | | 15.9% | |
Non-Agency Residential Collateralized Mortgage Obligations | | | 11.0% | |
Foreign Corporate Bonds | | | 10.8% | |
US Corporate Bonds | | | 7.9% | |
Short Term Investments | | | 5.2% | |
US Government / Agency Mortgage Backed Obligations | | | 4.2% | |
Bank Loans | | | 2.4% | |
Asset Backed Obligations | | | 1.9% | |
Foreign Government Bonds and Notes, Supranationals and Foreign Agencies | | | 0.7% | |
Other Assets and Liabilities | | | 5.9% | |
| | | | |
| | | 100.0% | |
| | | | |
| | | | |
| COUNTRY BREAKDOWN as a % of Net Assets: | |
United States | | | 82.5% | |
Chile | | | 1.6% | |
Mexico | | | 1.6% | |
Colombia | | | 1.6% | |
Peru | | | 1.0% | |
Panama | | | 1.0% | |
Canada | | | 0.7% | |
Singapore | | | 0.5% | |
Israel | | | 0.5% | |
Brazil | | | 0.5% | |
Paraguay | | | 0.4% | |
Guatemala | | | 0.3% | |
China | | | 0.3% | |
United Kingdom | | | 0.3% | |
Hong Kong | | | 0.2% | |
India | | | 0.2% | |
Jamaica | | | 0.2% | |
Australia | | | 0.2% | |
France | | | 0.2% | |
Indonesia | | | 0.1% | |
Costa Rica | | | 0.1% | |
Luxembourg | | | 0.1% | |
Qatar | | | 0.0% | ~ |
Netherlands | | | 0.0% | ~ |
Dominican Republic | | | 0.0% | ~ |
Germany | | | 0.0% | ~ |
Other Assets and Liabilities | | | 5.9% | |
| | | | |
| | | 100.0% | |
| | | | |
| | | | |
| INVESTMENT BREAKDOWN as a % of Net Assets: | |
US Government Bonds and Notes | | | 17.4% | |
Collateralized Loan Obligations | | | 16.7% | |
Non-Agency Commercial Mortgage Backed Obligations | | | 15.9% | |
Non-Agency Residential Collateralized Mortgage Obligations | | | 11.0% | |
Short Term Investments | | | 5.2% | |
Banking | | | 4.6% | |
US Government / Agency Mortgage Backed Obligations | | | 4.2% | |
Asset Backed Obligations | | | 1.9% | |
Oil & Gas | | | 1.5% | |
Utilities | | | 1.3% | |
Transportation | | | 1.2% | |
Healthcare | | | 1.2% | |
Telecommunications | | | 1.0% | |
Consumer Products | | | 0.8% | |
Technology | | | 0.7% | |
Media | | | 0.7% | |
Foreign Government Bonds and Notes, Supranationals and Foreign Agencies | | | 0.7% | |
Finance | | | 0.6% | |
Beverage and Tobacco | | | 0.6% | |
Mining | | | 0.6% | |
Food Products | | | 0.5% | |
Electronics/Electric | | | 0.5% | |
Food/Drug Retailers | | | 0.5% | |
Automotive | | | 0.5% | |
Building and Development (including Steel/Metals) | | | 0.5% | |
Chemicals/Plastics | | | 0.4% | |
Business Equipment and Services | | | 0.4% | |
Retailers (other than Food/Drug) | | | 0.3% | |
Insurance | | | 0.3% | |
Construction | | | 0.3% | |
Real Estate | | | 0.3% | |
Conglomerates | | | 0.2% | |
Pharmaceuticals | | | 0.2% | |
Aerospace & Defense | | | 0.2% | |
Biotechnology | | | 0.2% | |
Leisure | | | 0.2% | |
Hotels/Motels/Inns and Casinos | | | 0.1% | |
Containers and Glass Products | | | 0.1% | |
Energy | | | 0.1% | |
Financial Intermediaries | | | 0.1% | |
Environmental Control | | | 0.1% | |
Cosmetics/Toiletries | | | 0.1% | |
Pulp & Paper | | | 0.1% | |
Industrial Equipment | | | 0.1% | |
Computers & Electronics | | | 0.0% | ~ |
Other Assets and Liabilities | | | 5.9% | |
| | | | |
| | | 100.0% | |
| | | | |
| ^ | Security exempt from registration under Rule 144A of the Securities Act of 1933. These securities may be resold in transactions exempt from registration to qualified institutional buyers. These securities are determined to be liquid by the Adviser, unless otherwise noted, under procedures established by the Fund’s Board of Trustees. At March 31, 2016, the value of these securities amounted to $245,049,740 or 28.5% of net assets. |
| # | Variable rate security. Rate disclosed as of March 31, 2016. |
| W | Security is in default or has failed to make a scheduled payment. Income is not being accrued. |
| I/O | Interest only security |
| I/F | Inverse floating rate security whose interest rate moves in the opposite direction of reference interest rates |
| ¨ | Seven-day yield as of March 31, 2016 |
| ~ | Represents less than 0.05% of net assets |
| | | | | | |
| The accompanying notes are an integral part of these financial statements. | | Annual Report | | March 31, 2016 | | 77 |
| | |
| Schedule of Investments DoubleLine Shiller Enhanced CAPE® (Cont.) | | March 31, 2016 |
| | | | | | | | | | | | | | | | | | |
| Total Return Swaps - Long | | | | | | | | | | | | |
| Reference Entity | | Counterparty | | Financing Rate | | | Notional Amount | | | Termination Date | | | Unrealized Appreciation (Depreciation) | |
Shiller Barclays CAPE® US Sector ER USD Index « | | Barclays Capital, Inc. | | | 0.47% | | | | 58,500,000 | | | | 04/14/2016 | | | $ | 426,673 | |
Shiller Barclays CAPE® US Sector ER II USD Index ¤ | | Barclays Capital, Inc. | | | 0.40% | | | | 50,000,000 | | | | 04/28/2016 | | | | 2,842,752 | |
Shiller Barclays CAPE® US Sector ER II USD Index ¤ | | Barclays Capital, Inc. | | | 0.40% | | | | 20,000,000 | | | | 05/26/2016 | | | | 1,134,115 | |
Shiller Barclays CAPE® US Sector ER II USD Index ¤ | | Barclays Capital, Inc. | | | 0.40% | | | | 90,000,000 | | | | 06/30/2016 | | | | 3,645,905 | |
Shiller Barclays CAPE® US Sector ER II USD Index ¤ | | Barclays Capital, Inc. | | | 0.40% | | | | 20,000,000 | | | | 07/28/2016 | | | | 592,205 | |
Shiller Barclays CAPE® US Sector ER II USD Index ¤ | | Barclays Capital, Inc. | | | 0.40% | | | | 50,000,000 | | | | 08/25/2016 | | | | 2,045,586 | |
Shiller Barclays CAPE® US Sector ER II USD Index ¤ | | Barclays Capital, Inc. | | | 0.40% | | | | 70,000,000 | | | | 09/29/2016 | | | | 7,921,209 | |
Shiller Barclays CAPE® US Sector ER II USD Index ¤ | | BNP Paribas | | | 0.43% | | | | 25,000,000 | | | | 11/16/2016 | | | | 994,083 | |
Shiller Barclays CAPE® US Sector ER II USD Index ¤ | | Barclays Capital, Inc. | | | 0.40% | | | | 25,000,000 | | | | 11/17/2016 | | | | 808,220 | |
Shiller Barclays CAPE® US Sector ER II USD Index ¤ | | BNP Paribas | | | 0.43% | | | | 25,000,000 | | | | 12/21/2016 | | | | 1,045,303 | |
Shiller Barclays CAPE® US Sector ER II USD Index ¤ | | Barclays Capital, Inc. | | | 0.40% | | | | 50,000,000 | | | | 12/22/2016 | | | | 1,917,930 | |
Shiller Barclays CAPE® US Sector ER II USD Index ¤ | | Barclays Capital, Inc. | | | 0.40% | | | | 50,000,000 | | | | 01/26/2017 | | | | 4,265,286 | |
Shiller Barclays CAPE® US Sector ER II USD Index ¤ | | BNP Paribas | | | 0.43% | | | | 25,000,000 | | | | 02/22/2017 | | | | 2,756,960 | |
Shiller Barclays CAPE® US Sector ER II USD Index ¤ | | Barclays Capital, Inc. | | | 0.40% | | | | 90,000,000 | | | | 02/23/2017 | | | | 9,251,830 | |
Shiller Barclays CAPE® US Sector ER II USD Index ¤ | | Barclays Capital, Inc. | | | 0.40% | | | | 99,000,000 | | | | 03/30/2017 | | | | 5,931,178 | |
Shiller Barclays CAPE® US Sector ER II USD Index ¤ | | Barclays Capital, Inc. | | | 0.40% | | | | 60,000,000 | | | | 04/27/2017 | | | | (13,233 | ) |
| | | | | | | | | | | | | | | | | | |
| | | | | | | | | | | | | | | | $ | 45,566,002 | |
| | | | | | | | | | | | | | | | | | |
| « | Shiller Barclays CAPE® US Sector ER USD Index aims to provide notional long exposure to the top four United States equity sectors that are relatively undervalued, as defined by a modified version of the classic CAPE® Ratio (the “Relative CAPE® Indicator”) and that possess relatively strong price momentum over the prior twelve months. Each U.S. equity sector is represented by an exchange-traded fund that invests primarily in equity securities of companies in the relevant sector. At March 31, 2016, the four sector constituents and their weightings were as follows: Technology 25.4%, Industrial 25.2%, Consumer Discretionary 25.1%, and Healthcare 24.3%. |
| ¤ | Shiller Barclays CAPE® US Sector ER II USD Index aims to provide notional long exposure to the top four United States equity sectors that are relatively undervalued, as defined by a modified version of the classic CAPE® Ratio (the “Relative CAPE® Indicator”) and that possess relatively strong price momentum over the prior twelve months. Each U.S. equity sector is represented by an index that invests primarily in equity securities of companies in the relevant sector. At March 31, 2016, the four sector constituents and their weightings were as follows: Technology 25.5%, Industrial 25.2%, Consumer Discretionary 25.0%, and Healthcare 24.3%. |
| | | | | | |
| 78 | | DoubleLine Funds Trust | | | | The accompanying notes are an integral part of these financial statements. |
| | |
| Schedule of Investments DoubleLine Flexible Income Fund | | March 31, 2016 |
| | | | | | | | | | | | | | | | |
PRINCIPAL
AMOUNT $ | | | SECURITY DESCRIPTION | | RATE | | | MATURITY | | | VALUE $ | |
| | ASSET BACKED OBLIGATIONS 1.5% | |
| |
| | | | Citi Held For Asset Issuance, | |
| | 1,000,000 | | | Series 2015-PM1-C | | | 5.01% | ^ | | | 12/15/2021 | | | | 947,897 | |
| |
| | | | Eaglewood Consumer Loan Trust, | |
| | 1,000,000 | | | Series 2014-1-A | | | 3.50% | ^¥ | | | 10/15/2019 | | | | 994,969 | |
| |
| | | | MarketPlace Loan Trust, | |
| | 1,425,875 | | | Series 2015-CB1-A | | | 4.00% | ^ | | | 07/15/2021 | | | | 1,408,904 | |
| | | | | | | | | | | | | | | | |
| | | | Total Asset Backed Obligations
(Cost $3,425,629) | | | | 3,351,770 | |
| | | | | | | | | | | | | | | | |
| | COLLATERALIZED LOAN OBLIGATIONS 18.6% | |
| |
| | | | Adams Mill Ltd., | |
| | 1,000,000 | | | Series 2014-1A-A1 | | | 2.10% | #^ | | | 07/15/2026 | | | | 990,885 | |
| | 250,000 | | | Series 2014-1A-D1 | | | 4.12% | #^ | | | 07/15/2026 | | | | 211,389 | |
| | 250,000 | | | Series 2014-1A-E1 | | | 5.62% | #^ | | | 07/15/2026 | | | | 147,214 | |
| |
| | | | ALM Loan Funding, | |
| | 1,000,000 | | | Series 2012-7A-A1 | | | 2.04% | #^ | | | 10/19/2024 | | | | 1,000,596 | |
| | 1,000,000 | | | Series 2014-14A-A1 | | | 2.05% | #^ | | | 07/28/2026 | | | | 993,671 | |
| |
| | | | Anchorage Capital Ltd., | |
| | 250,000 | | | Series 2014-3A-A2A | | | 2.87% | #^ | | | 04/28/2026 | | | | 250,243 | |
| |
| | | | Apidos Ltd., | |
| | 500,000 | | | Series 2014-19A-D | | | 4.37% | #^ | | | 10/17/2026 | | | | 443,130 | |
| | 500,000 | | | Series 2015-21A-C | | | 4.17% | #^ | | | 07/18/2027 | | | | 415,598 | |
| | 250,000 | | | Series 2015-21A-D | | | 6.17% | #^ | | | 07/18/2027 | | | | 189,531 | |
| |
| | | | ARES Ltd., | |
| | 473,624 | | | Series 2007-12A-A | | | 1.26% | #^ | | | 11/25/2020 | | | | 466,474 | |
| | 1,000,000 | | | Series 2007-12A-C | | | 2.63% | #^ | | | 11/25/2020 | | | | 972,625 | |
| |
| | | | Atrium Corporation, | |
| | 742,452 | | | Series 5A-A2A | | | 0.84% | #^ | | | 07/20/2020 | | | | 740,106 | |
| |
| | | | Avery Point Ltd., | |
| | 250,000 | | | Series 2013-2A-C | | | 3.37% | #^ | | | 07/17/2025 | | | | 237,624 | |
| | 500,000 | | | Series 2013-2A-D | | | 4.07% | #^ | | | 07/17/2025 | | | | 439,039 | |
| |
| | | | Babson Ltd., | |
| | 272,716 | | | Series 2007-1A-A1 | | | 0.84% | #^ | | | 01/18/2021 | | | | 268,842 | |
| | 500,000 | | | Series 2012-IIR-CR | | | 4.22% | #^ | | | 05/15/2023 | | | | 474,158 | |
| | 500,000 | | | Series 2014-3A-D2 | | | 4.83% | #^ | | | 01/15/2026 | | | | 446,643 | |
| | 250,000 | | | Series 2014-3A-E2 | | | 7.12% | #^ | | | 01/15/2026 | | | | 184,538 | |
| | 1,000,000 | | | Series 2015-2A-D | | | 4.42% | #^ | | | 07/20/2027 | | | | 890,475 | |
| |
| | | | Battalion Ltd., | |
| | 500,000 | | | Series 2007-1A-C | | | 1.42% | #^ | | | 07/14/2022 | | | | 474,530 | |
| |
| | | | Betony Ltd., | |
| | 500,000 | | | Series 2015-1A-D | | | 4.22% | #^ | | | 04/15/2027 | | | | 440,906 | |
| |
| | | | BlueMountain Ltd., | |
| | 500,000 | | | Series 2012-2A-C | | | 3.37% | #^ | | | 11/20/2024 | | | | 496,023 | |
| | 750,000 | | | Series 2015-2A-C | | | 3.32% | #^ | | | 07/18/2027 | | | | 696,828 | |
| | 1,000,000 | | | Series 2015-2A-D | | | 4.17% | #^ | | | 07/18/2027 | | | | 845,506 | |
| | 500,000 | | | Series 2015-2A-E | | | 5.97% | #^ | | | 07/18/2027 | | | | 385,998 | |
| | 1,000,000 | | | Series 2015-3A-B | | | 3.43% | #^ | | | 10/20/2027 | | | | 960,334 | |
| | 500,000 | | | Series 2015-3A-C | | | 3.88% | #^ | | | 10/20/2027 | | | | 435,596 | |
| |
| | | | Carlyle High Yield Partners Ltd., | |
| | 1,447,110 | | | Series 2007-10-A1 | | | 0.84% | #^ | | | 04/19/2022 | | | | 1,404,680 | |
| | 692,344 | | | Series 2007-10A-A2A | | | 0.83% | #^ | | | 04/19/2022 | | | | 677,218 | |
| |
| | | | Catamaran Ltd., | |
| | 250,000 | | | Series 2015-1A-C1 | | | 3.72% | #^ | | | 04/22/2027 | | | | 243,020 | |
| |
| | | | Cent Ltd., | |
| | 645,000 | | | Series 2014-16AR-A1AR | | | 1.87% | #^ | | | 08/01/2024 | | | | 644,510 | |
| | 250,000 | | | Series 2014-22A-B | | | 3.82% | #^ | | | 11/07/2026 | | | | 246,057 | |
| | 500,000 | | | Series 2014-22A-C | | | 4.37% | #^ | | | 11/07/2026 | | | | 415,338 | |
| |
| | | | Cornerstone Ltd., | |
| | 275,886 | | | Series 2007-1A-A1S | | | 0.84% | #^ | | | 07/15/2021 | | | | 273,828 | |
| |
| | | | Dryden Leveraged Loan, | |
| | 500,000 | | | Series 2006-11A-C1 | | | 2.22% | #^ | | | 04/12/2020 | | | | 470,781 | |
| |
| | | | Dryden Senior Loan Fund, | |
| | 500,000 | | | Series 2012-24RA-DR | | | 4.32% | #^ | | | 11/15/2023 | | | | 456,679 | |
| | 250,000 | | | Series 2012-25A-D | | | 4.62% | #^ | | | 01/15/2025 | | | | 232,205 | |
| | | | | | | | | | | | | | | | |
PRINCIPAL
AMOUNT $ | | | SECURITY DESCRIPTION | | RATE | | | MATURITY | | | VALUE $ | |
| |
| | | | Eaton Vance Ltd., | |
| | 1,234,830 | | | Series 2006-8A-A | | | 0.87% | #^ | | | 08/15/2022 | | | | 1,201,927 | |
| | 500,000 | | | Series 2006-8A-B | | | 1.27% | #^ | | | 08/15/2022 | | | | 468,604 | |
| |
| | | | Flatiron Ltd., | |
| | 500,000 | | | Series 2013-1A-B | | | 3.37% | #^ | | | 01/17/2026 | | | | 464,124 | |
| |
| | | | Four Corners Ltd., | |
| | 880,876 | | | Series 2006-2A-A | | | 0.89% | #^ | | | 01/26/2020 | | | | 869,695 | |
| |
| | | | Galaxy Ltd., | |
| | 1,000,000 | | | Series 2014-18A-A | | | 2.09% | #^ | | | 10/15/2026 | | | | 983,068 | |
| | 250,000 | | | Series 2014-18A-D1 | | | 4.32% | #^ | | | 10/15/2026 | | | | 214,789 | |
| |
| | | | GoldenTree Loan Opportunities Ltd., | |
| | 500,000 | | | Series 2012-6A-D | | | 4.82% | #^ | | | 04/17/2022 | | | | 484,615 | |
| | 1,000,000 | | | Series 2015-10A-D | | | 3.97% | #^ | | | 07/20/2027 | | | | 830,730 | |
| |
| | | | Halcyon Loan Advisors Funding Ltd., | |
| | 250,000 | | | Series 2013-2A-C | | | 3.32% | #^ | | | 08/01/2025 | | | | 231,479 | |
| | 250,000 | | | Series 2014-2A-C | | | 4.12% | #^ | | | 04/28/2025 | | | | 206,218 | |
| | 250,000 | | | Series 2014-2A-D | | | 5.62% | #^ | | | 04/28/2025 | | | | 134,538 | |
| |
| | | | ING Ltd., | |
| | 500,000 | | | Series 2013-1A-D | | | 5.62% | #^ | | | 04/15/2024 | | | | 413,438 | |
| |
| | | | LCM LP, | |
| | 500,000 | | | Series 10AR-BR | | | 2.52% | #^ | | | 04/15/2022 | | | | 497,262 | |
| | 500,000 | | | Series 12A-DR | | | 4.32% | #^ | | | 10/19/2022 | | | | 467,372 | |
| | 500,000 | | | Series 14A-D | | | 4.12% | #^ | | | 07/15/2025 | | | | 452,509 | |
| | 250,000 | | | Series 16A-D | | | 4.22% | #^ | | | 07/15/2026 | | | | 220,472 | |
| |
| | | | Limerock Ltd., | |
| | 250,000 | | | Series 2007-1A-B | | | 1.25% | #^ | | | 04/24/2023 | | | | 237,484 | |
| |
| | | | Madison Park Funding Ltd., | |
| | 922,526 | | | Series 2007-4A-A2 | | | 0.85% | #^ | | | 03/22/2021 | | | | 903,134 | |
| | 1,000,000 | | | Series 2007-6A-C | | | 1.62% | #^ | | | 07/26/2021 | | | | 952,636 | |
| | 250,000 | | | Series 2014-13A-D | | | 3.97% | #^ | | | 01/19/2025 | | | | 222,678 | |
| | 250,000 | | | Series 2014-13X-E | | | 5.62% | # | | | 01/19/2025 | | | | 204,909 | |
| | 750,000 | | | Series 2014-14A-D | | | 4.22% | #^ | | | 07/20/2026 | | | | 674,197 | |
| | 500,000 | | | Series 2014-15A-C | | | 4.32% | #^ | | | 01/27/2026 | | | | 442,524 | |
| | 500,000 | | | Series 2015-16A-B | | | 3.62% | #^ | | | 04/20/2026 | | | | 494,606 | |
| | 500,000 | | | Series 2015-18A-D2 | | | 4.57% | #^ | | | 10/21/2026 | | | | 448,677 | |
| |
| | | | Magnetite Ltd., | |
| | 250,000 | | | Series 2014-9A-B | | | 3.62% | #^ | | | 07/25/2026 | | | | 243,460 | |
| |
| | | | Marea Ltd., | |
| | 750,000 | | | Series 2012-1A-DR | | | 4.37% | #^ | | | 10/15/2023 | | | | 696,073 | |
| |
| | | | Ocean Trails, | |
| | 250,000 | | | Series 2006-1A-A2 | | | 1.07% | #^ | | | 10/12/2020 | | | | 242,025 | |
| |
| | | | Octagon Investment Partners Ltd., | |
| | 238,344 | | | Series 2006-10A-A1 | | | 0.86% | #^ | | | 10/18/2020 | | | | 238,300 | |
| | 500,000 | | | Series 2014-1A-C | | | 4.27% | #^ | | | 11/14/2026 | | | | 441,119 | |
| | 500,000 | | | Series 2014-1A-C2 | | | 4.12% | #^ | | | 11/25/2025 | | | | 499,565 | |
| | 250,000 | | | Series 2014-1A-D | | | 7.22% | #^ | | | 11/14/2026 | | | | 207,913 | |
| | 500,000 | | | Series 2014-1A-D2 | | | 5.20% | #^ | | | 11/25/2025 | | | | 452,010 | |
| |
| | | | OZLM Funding Ltd., | |
| | 500,000 | | | Series 2013-5A-A1 | | | 2.12% | #^ | | | 01/17/2026 | | | | 497,264 | |
| |
| | | | Pinnacle Park Ltd., | |
| | 250,000 | | | Series 2014-1A-C | | | 3.72% | #^ | | | 04/15/2026 | | | | 248,480 | |
| |
| | | | Race Point Ltd., | |
| | 250,000 | | | Series 2012-6RA-CR | | | 3.73% | #^ | | | 05/24/2023 | | | | 248,738 | |
| | 250,000 | | | Series 2012-6RA-DR | | | 4.73% | #^ | | | 05/24/2023 | | | | 234,443 | |
| |
| | | | Symphony Ltd., | |
| | 500,000 | | | Series 2013-11A-C | | | 3.77% | #^ | | | 01/17/2025 | | | | 498,907 | |
| | 500,000 | | | Series 2014-14A-D2 | | | 4.22% | #^ | | | 07/14/2026 | | | | 440,170 | |
| |
| | | | Thacher Park Ltd., | |
| | 500,000 | | | Series 2014-1A-D1 | | | 4.15% | #^ | | | 10/20/2026 | | | | 439,337 | |
| |
| | | | Venture Ltd., | |
| | 1,000,000 | | | Series 2006-1A-B | | | 1.26% | #^ | | | 08/03/2020 | | | | 939,657 | |
| | 500,000 | | | Series 2013-15A-C | | | 3.72% | #^ | | | 07/15/2025 | | | | 479,772 | |
| | 500,000 | | | Series 2014-17A-C | | | 3.47% | #^ | | | 07/15/2026 | | | | 457,390 | |
| |
| | | | Washington Mill Ltd., | |
| | 250,000 | | | Series 2014-1A-C | | | 3.62% | #^ | | | 04/20/2026 | | | | 239,322 | |
| | | | | | |
| The accompanying notes are an integral part of these financial statements. | | Annual Report | | March 31, 2016 | | 79 |
| | |
| Schedule of Investments DoubleLine Flexible Income Fund (Cont.) | | March 31, 2016 |
| | | | | | | | | | | | | | | | |
PRINCIPAL
AMOUNT $ | | | SECURITY DESCRIPTION | | RATE | | | MATURITY | | | VALUE $ | |
| |
| | | | WG Horizons, | |
| | 500,000 | | | Series 2006-1A-C | | | 2.34% | #^ | | | 05/24/2019 | | | | 474,709 | |
| |
| | | | Wind River Ltd., | |
| | 1,000,000 | | | Series 2014-1A-A | | | 2.14% | #^ | | | 04/18/2026 | | | | 989,520 | |
| | | | | | | | | | | | | | | | |
| | | | Total Collateralized Loan Obligations
(Cost $43,917,360) | | | | 41,492,677 | |
| | | | | | | | | | | | | | | | |
| | FOREIGN CORPORATE BONDS 14.6% | |
| | 600,000 | | | Abengoa Transmision Sur S.A. | | | 6.88% | ^ | | | 04/30/2043 | | | | 613,500 | |
| | 400,000 | | | Abengoa Transmision Sur S.A. | | | 6.88% | | | | 04/30/2043 | | | | 409,000 | |
| | 500,000 | | | Aeropuerto Internacional de Tocumen S.A. | | | 5.75% | | | | 10/09/2023 | | | | 515,000 | |
| | 200,000 | | | Aeropuertos Dominicanos | | | 9.75% | # | | | 11/13/2019 | | | | 212,000 | |
| | 200,000 | | | AES El Salvador Trust | | | 6.75% | | | | 03/28/2023 | | | | 157,000 | |
| | 300,000 | | | AES Gener S.A. | | | 5.25% | | | | 08/15/2021 | | | | 319,259 | |
| | 500,000 | | | Agromercantil Senior Trust | | | 6.25% | | | | 04/10/2019 | | | | 517,500 | |
| | 200,000 | | | Avianca Holdings S.A. | | | 8.38% | | | | 05/10/2020 | | | | 158,000 | |
| | 200,000 | | | Avianca Holdings S.A. | | | 8.38% | ^ | | | 05/10/2020 | | | | 158,000 | |
| | 700,000 | | | Banco Continental SAECA | | | 8.88% | | | | 10/15/2017 | | | | 709,625 | |
| | 200,000 | | | Banco de Costa Rica | | | 5.25% | | | | 08/12/2018 | | | | 203,500 | |
| | 200,000 | | | Banco do Brasil S.A. | | | 9.00% | #^ † | | | 06/18/2024 | | | | 139,800 | |
| | 200,000 | | | Banco GNB Sudameris S.A. | | | 7.50% | | | | 07/30/2022 | | | | 200,000 | |
| | 400,000 | | | Banco International del Peru S.A.A. | | | 6.63% | # | | | 03/19/2029 | | | | 412,500 | |
| | 400,000 | | | Banco Latinoamericano do Comercio Exterior S.A. | | | 3.25% | | | | 05/07/2020 | | | | 399,000 | |
| | 300,000 | | | Banco Nacional de Costa Rica | | | 4.88% | | | | 11/01/2018 | | | | 299,250 | |
| | 350,000 | | | Banco Regional SAECA | | | 8.13% | | | | 01/24/2019 | | | | 361,550 | |
| | 700,000 | | | Banco Santander | | | 5.95% | # | | | 01/30/2024 | | | | 725,550 | |
| | 400,000 | | | Bancolombia S.A. | | | 6.13% | | | | 07/26/2020 | | | | 423,880 | |
| | 50,000 | | | BBVA Banco Continental S.A. | | | 5.25% | # | | | 09/22/2029 | | | | 50,563 | |
| | 200,000 | | | BBVA Bancomer S.A. | | | 6.01% | # | | | 05/17/2022 | | | | 203,500 | |
| | 400,000 | | | BBVA Bancomer S.A. | | | 5.35% | # | | | 11/12/2029 | | | | 386,000 | |
| | 400,000 | | | BBVA Colombia S.A. | | | 4.88% | | | | 04/21/2025 | | | | 388,000 | |
| | 400,000 | | | Bharti Airtel Ltd. | | | 4.38% | | | | 06/10/2025 | | | | 407,238 | |
| | 100,000 | | | Camposol S.A. | | | 9.88% | | | | 02/02/2017 | | | | 87,500 | |
| | 200,000 | | | Cementos Progreso Trust | | | 7.13% | | | | 11/06/2023 | | | | 212,500 | |
| | 200,000 | | | Central American Bottling Corporation | | | 6.75% | | | | 02/09/2022 | | | | 211,500 | |
| | 400,000 | | | CIMPOR Financial Operations B.V. | | | 5.75% | | | | 07/17/2024 | | | | 294,000 | |
| | 200,000 | | | Colbun S.A. | | | 6.00% | | | | 01/21/2020 | | | | 220,034 | |
| | 200,000 | | | Comcel Trust | | | 6.88% | | | | 02/06/2024 | | | | 188,000 | |
| | 400,000 | | | Compania Minera Ares S.A.C. | | | 7.75% | | | | 01/23/2021 | | | | 398,000 | |
| | 500,000 | | | CorpGroup Banking S.A. | | | 6.75% | | | | 03/15/2023 | | | | 468,125 | |
| | 100,000 | | | Corporacion Azucarera del Peru S.A. | | | 6.38% | | | | 08/02/2022 | | | | 86,500 | |
| | 200,000 | | | Corporacion Financiera de Desarrolo S.A. | | | 4.75% | | | | 02/08/2022 | | | | 210,500 | |
| | 500,000 | | | Cosan Overseas Ltd. | | | 8.25% | † | | | 11/29/2049 | | | | 425,000 | |
| | 600,000 | | | Delek & Avner Tamar Bond Ltd. | | | 4.44% | ^ | | | 12/30/2020 | | | | 604,500 | |
| | 300,000 | | | Delek & Avner Tamar Bond Ltd. | | | 5.41% | ^ | | | 12/30/2025 | | | | 301,125 | |
| | 200,000 | | | Digicel Ltd. | | | 8.25% | | | | 09/30/2020 | | | | 172,750 | |
| | 400,000 | | | Digicel Ltd. | | | 7.13% | | | | 04/01/2022 | | | | 312,960 | |
| | 170,000 | | | Ecopetrol S.A. | | | 7.38% | | | | 09/18/2043 | | | | 156,400 | |
| | 200,000 | | | Ecopetrol S.A. | | | 5.88% | | | | 05/28/2045 | | | | 158,440 | |
| | | | | | | | | | | | | | | | |
PRINCIPAL
AMOUNT $ | | | SECURITY DESCRIPTION | | RATE | | | MATURITY | | | VALUE $ | |
| | 300,000 | | | Empresa de Energia de Bogota S.A. | | | 6.13% | | | | 11/10/2021 | | | | 312,300 | |
| | 1,000,000 | | | Empresa Electrica Angamos S.A. | | | 4.88% | | | | 05/25/2029 | | | | 930,295 | |
| | 400,000 | | | Empresa Electrica Guacolda S.A. | | | 4.56% | ^ | | | 04/30/2025 | | | | 383,862 | |
| | 727,568 | | | ENA Norte Trust | | | 4.95% | | | | 04/25/2023 | | | | 745,757 | |
| | 193,382 | | | Fermaca Enterprises S. de R.L. de C.V. | | | 6.38% | ^ | | | 03/30/2038 | | | | 183,229 | |
| | 100,000 | | | Freeport-McMoRan Copper & Gold, Inc. | | | 4.00% | | | | 11/14/2021 | | | | 71,250 | |
| | 400,000 | | | Freeport-McMoRan Copper & Gold, Inc. | | | 3.88% | | | | 03/15/2023 | | | | 275,648 | |
| | 200,000 | | | Freeport-McMoRan Copper & Gold, Inc. | | | 5.45% | | | | 03/15/2043 | | | | 122,000 | |
| | 400,000 | | | Global Bank Corporation | | | 4.75% | | | | 10/05/2017 | | | | 406,500 | |
| | 400,000 | | | Global Bank Corporation | | | 5.13% | | | | 10/30/2019 | | | | 407,000 | |
| | 200,000 | | | Global Bank Corporation | | | 5.13% | ^ | | | 10/30/2019 | | | | 203,500 | |
| | 500,000 | | | GNL Quintero S.A. | | | 4.63% | | | | 07/31/2029 | | | | 505,617 | |
| | 400,000 | | | Grupo Aval Ltd. | | | 4.75% | | | | 09/26/2022 | | | | 374,000 | |
| | 150,000 | | | Grupo Bimbo S.A.B. de C.V. | | | 4.50% | | | | 01/25/2022 | | | | 159,493 | |
| | 200,000 | | | Grupo Cementos de Chihuahua S.A.B de C.V. | | | 8.13% | | | | 02/08/2020 | | | | 208,000 | |
| | 500,000 | | | Grupo Elektra S.A.B. de C.V. | | | 7.25% | | | | 08/06/2018 | | | | 487,500 | |
| | 400,000 | | | Grupo Idesa S.A. de C.V. | | | 7.88% | | | | 12/18/2020 | | | | 390,500 | |
| | 200,000 | | | Grupo Posadas S.A.B. de C.V. | | | 7.88% | ^ | | | 06/30/2022 | | | | 197,500 | |
| | 400,000 | | | GrupoSura Finance S.A. | | | 5.70% | | | | 05/18/2021 | | | | 415,800 | |
| | 150,000 | | | GTL Trade Finance, Inc. | | | 5.89% | | | | 04/29/2024 | | | | 122,625 | |
| | 717,732 | | | Guanay Finance Ltd. | | | 6.00% | | | | 12/15/2020 | | | | 697,995 | |
| | 500,000 | | | Hutchison Whampoa International Ltd. | | | 6.00% | #† | | | 05/07/2017 | | | | 517,750 | |
| | 500,000 | | | Industrial Senior Trust | | | 5.50% | | | | 11/01/2022 | | | | 481,250 | |
| | 200,000 | | | Inkia Energy Ltd. | | | 8.38% | ^ | | | 04/04/2021 | | | | 200,500 | |
| | 200,000 | | | Instituto Costarricense de Electricidad | | | 6.95% | | | | 11/10/2021 | | | | 200,500 | |
| | 230,000 | | | Intelsat Jackson Holdings S.A. | | | 5.50% | | | | 08/01/2023 | | | | 139,725 | |
| | 25,000 | | | Intelsat Jackson Holdings S.A. | | | 8.00% | ^ | | | 02/15/2024 | | | | 25,812 | |
| | 400,000 | | | Intercorp Peru Ltd. | | | 5.88% | | | | 02/12/2025 | | | | 385,000 | |
| | 450,000 | | | JBS Investments GmbH | | | 7.25% | | | | 04/03/2024 | | | | 415,125 | |
| | 300,000 | | | Latam Airlines Group S.A. | | | 7.25% | ^ | | | 06/09/2020 | | | | 277,500 | |
| | 400,000 | | | Lima Metro Line 2 Finance Ltd. | | | 5.88% | | | | 07/05/2034 | | | | 400,000 | |
| | 200,000 | | | Magnesita Finance Ltd. | | | 8.63% | † | | | 04/05/2017 | | | | 117,000 | |
| | 200,000 | | | Marfrig Holdings B.V. | | | 6.88% | ^ | | | 06/24/2019 | | | | 190,750 | |
| | 387,296 | | | Mexico Generadora de Energia | | | 5.50% | | | | 12/06/2032 | | | | 340,336 | |
| | 380,000 | | | Minerva Luxembourg S.A. | | | 8.75% | #† | | | 04/03/2019 | | | | 358,625 | |
| | 200,000 | | | Minerva Luxembourg S.A. | | | 8.75% | #^† | | | 04/03/2019 | | | | 188,750 | |
| | 100,000 | | | National Gas Company of Trinidad and Tobago Ltd. | | | 6.05% | | | | 01/15/2036 | | | | 101,875 | |
| | 200,000 | | | OAS Financial Ltd. | | | 8.88% | #†W | | | 04/29/2049 | | | | 1,240 | |
| | 200,000 | | | ONGC Videsh Ltd. | | | 3.75% | | | | 05/07/2023 | | | | 200,260 | |
| | 200,000 | | | ONGC Videsh Ltd. | | | 4.63% | | | | 07/15/2024 | | | | 210,174 | |
| | 900,000 | | | Oversea-Chinese Banking Corporation | | | 4.00% | # | | | 10/15/2024 | | | | 935,836 | |
| | 200,000 | | | Pacific Rubiales Energy Corporation | | | 5.13% | W | | | 03/28/2023 | | | | 35,000 | |
| | 100,000 | | | Pacific Rubiales Energy Corporation | | | 5.63% | W | | | 01/19/2025 | | | | 17,500 | |
| | 200,000 | | | Pacific Rubiales Energy Corporation | | | 5.63% | ^W | | | 01/19/2025 | | | | 35,000 | |
| | 800,000 | | | Peru Enhanced Pass-Through Finance Ltd. | | | 0.00% | | | | 06/02/2025 | | | | 619,128 | |
| | 400,000 | | | Petroleos Mexicanos | | | 5.50% | | | | 01/21/2021 | | | | 415,750 | |
| | 600,000 | | | Petroleos Mexicanos | | | 6.38% | | | | 01/23/2045 | | | | 559,200 | |
| | 200,000 | | | Sixsigma Networks Mexico S.A. de C.V. | | | 8.25% | ^ | | | 11/07/2021 | | | | 189,500 | |
| | 200,000 | | | Sociedad Quimica y Minera S.A. | | | 5.50% | | | | 04/21/2020 | | | | 207,650 | |
| | 200,000 | | | Sociedad Quimica y Minera S.A. | | | 4.38% | | | | 01/28/2025 | | | | 189,500 | |
| | | | | | |
| 80 | | DoubleLine Funds Trust | | | | The accompanying notes are an integral part of these financial statements. |
| | | | | | | | | | | | | | | | |
PRINCIPAL
AMOUNT $ | | | SECURITY DESCRIPTION | | RATE | | | MATURITY | | | VALUE $ | |
| | 300,000 | | | Southern Copper Corporation | | | 6.75% | | | | 04/16/2040 | | | | 293,265 | |
| | 200,000 | | | SUAM Finance B.V. | | | 4.88% | | | | 04/17/2024 | | | | 201,500 | |
| | 500,000 | | | Tanner Servicios Financieros S.A. | | | 4.38% | | | | 03/13/2018 | | | | 491,250 | |
| | 200,000 | | | Telefonica Celular del Paraguay S.A. | | | 6.75% | | | | 12/13/2022 | | | | 197,000 | |
| | 900,000 | | | Transportadora de Gas Internacional S.A. | | | 5.70% | | | | 03/20/2022 | | | | 916,650 | |
| | 400,000 | | | TV Azteca S.A.B. de C.V. | | | 7.50% | | | | 05/25/2018 | | | | 259,000 | |
| | 400,000 | | | TV Azteca S.A.B. de C.V. | | | 7.63% | | | | 09/18/2020 | | | | 236,000 | |
| | 800,000 | | | United Overseas Bank Ltd. | | | 3.75% | # | | | 09/19/2024 | | | | 825,064 | |
| | 200,000 | | | Vedanta Resources PLC | | | 8.25% | | | | 06/07/2021 | | | | 120,000 | |
| | 200,000 | | | Vedanta Resources PLC | | | 7.13% | | | | 05/31/2023 | | | | 112,000 | |
| | 600,000 | | | Volcan Cia Minera S.A.A. | | | 5.38% | | | | 02/02/2022 | | | | 459,750 | |
| | 200,000 | | | VTR Finance B.V. | | | 6.88% | | | | 01/15/2024 | | | | 196,560 | |
| | | | | | | | | | | | | | | | |
| | | | Total Foreign Corporate Bonds
(Cost $35,152,628) | | | | 32,741,695 | |
| | | | | | | | | | | | | | | | |
| FOREIGN GOVERNMENT BONDS AND NOTES, SUPRANATIONALS AND
FOREIGN AGENCIES 0.7% |
|
| | 1,500,000 | | | Colombia Government International Bond | | | 4.38% | | | | 07/12/2021 | | | | 1,567,500 | |
| | | | | | | | | | | | | | | | |
| | | | Total Foreign Government Bonds and Notes, Supranationals and Foreign Agencies
(Cost $1,559,702) | | | | 1,567,500 | |
| | | | | | | | | | | | | | | | |
| | NON-AGENCY COMMERCIAL MORTGAGE BACKED OBLIGATIONS 12.1% | |
| |
| | | | Banc of America Commercial Mortgage Trust, | |
| | 150,000 | | | Series 2006-6-AM | | | 5.39% | | | | 10/10/2045 | | | | 151,923 | |
| | 100,000 | | | Series 2007-1-AMFX | | | 5.48% | # | | | 01/15/2049 | | | | 101,161 | |
| | 100,000 | | | Series 2007-5-AM | | | 5.77% | # | | | 02/10/2051 | | | | 103,264 | |
| |
| | | | Bear Stearns Commercial Mortgage Securities, Inc., | |
| | 100,000 | | | Series 2006-PW13-AJ | | | 5.61% | # | | | 09/11/2041 | | | | 99,572 | |
| | 540,000 | | | Series 2006-PW13-AM | | | 5.58% | # | | | 09/11/2041 | | | | 545,155 | |
| | 250,000 | | | Series 2007-T26-AJ | | | 5.57% | # | | | 01/12/2045 | | | | 246,275 | |
| |
| | | | BXHTL Mortgage Trust, | |
| | 550,000 | | | Series 2015-JWRZ-A | | | 1.67% | #^ | | | 05/15/2029 | | | | 539,914 | |
| |
| | | | CD Commercial Mortgage Trust, | |
| | 17,041 | | | Series 2006-CD2-AM | | | 5.39% | # | | | 01/15/2046 | | | | 17,021 | |
| | 100,000 | | | Series 2007-CD4-AMFX | | | 5.37% | # | | | 12/11/2049 | | | | 101,720 | |
| |
| | | | CGBAM Commercial Mortgage Trust, | |
| | 100,000 | | | Series 2014-HD-D | | | 2.44% | #^ | | | 02/15/2031 | | | | 96,752 | |
| |
| | | | Citigroup Commercial Mortgage Trust, | |
| | 210,000 | | | Series 2007-C6-AMFX | | | 5.70% | #^ | | | 12/10/2049 | | | | 212,376 | |
| | 100,000 | | | Series 2014-GC21-D | | | 4.84% | #^ | | | 05/10/2047 | | | | 79,163 | |
| | 1,872,504 | | | Series 2014-GC25-XA | | | 1.09% | # I/O | | | 10/10/2047 | | | | 125,880 | |
| | 200,000 | | | Series 2015-GC27-D | | | 4.43% | #^ | | | 02/10/2048 | | | | 153,708 | |
| |
| | | | COBALT Commercial Mortgage Trust, | |
| | 150,000 | | | Series 2007-C2-AJFX | | | 5.57% | # | | | 04/15/2047 | | | | 146,578 | |
| | 100,000 | | | Series 2007-C3-AM | | | 5.76% | # | | | 05/15/2046 | | | | 102,893 | |
| |
| | | | Commercial Mortgage Pass-Through Certificates, | |
| | 3,176,425 | | | Series 2013-CR10-XA | | | 0.96% | # I/O | | | 08/10/2046 | | | | 134,920 | |
| | 1,328,893 | | | Series 2014-CR17-XA | | | 1.18% | # I/O | | | 05/10/2047 | | | | 81,039 | |
| | 100,000 | | | Series 2014-CR19-C | | | 4.72% | # | | | 08/10/2047 | | | | 99,785 | |
| | 1,472,765 | | | Series 2014-CR19-XA | | | 1.29% | # I/O | | | 08/10/2047 | | | | 97,817 | |
| | 125,000 | | | Series 2014-CR20-C | | | 4.51% | # | | | 11/10/2047 | | | | 124,289 | |
| | 150,000 | | | Series 2014-KYO-E | | | 2.79% | #^ | | | 06/11/2027 | | | | 147,109 | |
| | 425,000 | | | Series 2014-KYO-F | | | 3.94% | #^ | | | 06/11/2027 | | | | 421,294 | |
| | 375,000 | | | Series 2015-CR22-D | | | 4.13% | #^ | | | 03/10/2048 | | | | 280,615 | |
| | 300,000 | | | Series 2015-CR23-D | | | 4.26% | # | | | 05/10/2048 | | | | 223,399 | |
| | 2,485,576 | | | Series 2015-DC1-XA | | | 1.18% | # I/O | | | 02/10/2048 | | | | 172,384 | |
| | 815,000 | | | Series 2015-LC21-C | | | 4.31% | # | | | 07/10/2048 | | | | 748,731 | |
| | 406,000 | | | Series 2015-LC23-C | | | 4.65% | # | | | 10/10/2053 | | | | 395,859 | |
| | 3,646,000 | | | Series 2016-DC2-XA | | | 1.24% | # I/O | | | 02/10/2049 | | | | 272,161 | |
| | | | | | | | | | | | | | | | |
PRINCIPAL
AMOUNT $ | | | SECURITY DESCRIPTION | | RATE | | | MATURITY | | | VALUE $ | |
| |
| | | | Countrywide Commercial Mortgage Trust, | |
| | 173,312 | | | Series 2007-MF1-A | | | 6.07% | #^ | | | 11/12/2043 | | | | 178,876 | |
| |
| | | | Credit Suisse Mortgage Capital Certificates, | |
| | 150,000 | | | Series 2006-C4-AM | | | 5.51% | | | | 09/15/2039 | | | | 151,306 | |
| | 100,000 | | | Series 2007-C2-AM | | | 5.59% | # | | | 01/15/2049 | | | | 102,389 | |
| | 375,000 | | | Series 2007-C4-A1AM | | | 5.94% | # | | | 09/15/2039 | | | | 375,297 | |
| | 297,908 | | | Series 2007-C5-A4 | | | 5.70% | # | | | 09/15/2040 | | | | 307,451 | |
| | 2,018,458 | | | Series 2014-USA-X1 | | | 0.55% | #^ I/O | | | 09/15/2037 | | | | 87,064 | |
| | 875,000 | | | Series 2015-SAND-D | | | 3.29% | #^ | | | 08/15/2030 | | | | 845,286 | |
| |
| | | | CSAIL Commercial Mortgage Trust, | |
| | 2,734,541 | | | Series 2015-C1-XA | | | 0.97% | # I/O | | | 04/15/2050 | | | | 162,848 | |
| |
| | | | GE Commercial Mortgage Corporation Trust, | |
| | 399,200 | | | Series 2007-C1-AM | | | 5.61% | # | | | 12/10/2049 | | | | 395,411 | |
| |
| | | | Grace Mortgage Trust, | |
| | 100,000 | | | Series 2014-GRCE-A | | | 3.37% | ^ | | | 06/10/2028 | | | | 105,403 | |
| |
| | | | Greenwich Capital Commercial Funding Corporation, | |
| | 300,000 | | | Series 2007-GG11-AJ | | | 6.03% | # | | | 12/10/2049 | | | | 295,694 | |
| | 150,000 | | | Series 2007-GG11-AM | | | 5.87% | # | | | 12/10/2049 | | | | 154,349 | |
| | 200,000 | | | Series 2007-GG9-AM | | | 5.48% | | | | 03/10/2039 | | | | 203,106 | |
| | 175,000 | | | Series 2007-GG9-AMFX | | | 5.48% | | | | 03/10/2039 | | | | 177,890 | |
| |
| | | | GS Mortgage Securities Corporation, | |
| | 351,814 | | | Series 2007-GG10-A4 | | | 5.79% | # | | | 08/10/2045 | | | | 362,805 | |
| | 3,206,197 | | | Series 2013-GC10-XA | | | 1.61% | # I/O | | | 02/10/2046 | | | | 258,049 | |
| | 4,154,538 | | | Series 2014-GC20-XA | | | 1.18% | # I/O | | | 04/10/2047 | | | | 256,794 | |
| | 9,227,044 | | | Series 2014-GC24-XA | | | 0.88% | # I/O | | | 09/10/2047 | | | | 455,635 | |
| | 7,485,298 | | | Series 2015-GS1-XA | | | 0.84% | # I/O | | | 11/10/2048 | | | | 455,868 | |
| |
| | | | JP Morgan Chase Commercial Mortgage Securities Corporation, | |
| | 150,000 | | | Series 2006-LDP8-AJ | | | 5.48% | # | | | 05/15/2045 | | | | 149,630 | |
| | 348,533 | | | Series 2006-LDP9-AM | | | 5.37% | | | | 05/15/2047 | | | | 350,181 | |
| | 150,000 | | | Series 2007-CB20-AM | | | 5.88% | # | | | 02/12/2051 | | | | 156,976 | |
| | 550,000 | | | Series 2007-CIBC18-AM | | | 5.47% | # | | | 06/12/2047 | | | | 557,983 | |
| | 385,000 | | | Series 2007-CIBC20-AJ | | | 6.08% | # | | | 02/12/2051 | | | | 375,451 | |
| | 475,000 | | | Series 2007-LD12-AM | | | 6.01% | # | | | 02/15/2051 | | | | 495,643 | |
| | 100,000 | | | Series 2014-DSTY-A | | | 3.43% | ^ | | | 06/10/2027 | | | | 103,743 | |
| | 150,000 | | | Series 2014-PHH-D | | | 2.84% | #^ | | | 08/15/2027 | | | | 148,488 | |
| | 550,000 | | | Series 2015-CSMO-C | | | 2.69% | #^ | | | 01/15/2032 | | | | 536,532 | |
| |
| | | | JPMBB Commercial Mortgage Securities Trust, | |
| | 2,195,629 | | | Series 2014-C18-XA | | | 1.13% | # I/O | | | 02/15/2047 | | | | 118,194 | |
| | 1,235,236 | | | Series 2014-C21-XA | | | 1.11% | # I/O | | | 08/15/2047 | | | | 81,634 | |
| | 100,000 | | | Series 2014-C23-C | | | 4.46% | # | | | 09/15/2047 | | | | 98,638 | |
| | 150,000 | | | Series 2014-C25-C | | | 4.45% | # | | | 11/15/2047 | | | | 148,541 | |
| | 425,000 | | | Series 2014-C26-C | | | 4.43% | # | | | 01/15/2048 | | | | 417,429 | |
| | 6,956,145 | | | Series 2015-C29-XA | | | 0.96% | # I/O | | | 05/15/2048 | | | | 324,525 | |
| | 5,775,436 | | | Series 2015-C31-XA | | | 1.03% | # I/O | | | 08/15/2048 | | | | 378,151 | |
| | 470,000 | | | Series 2015-C33-C | | | 4.62% | # | | | 12/15/2048 | | | | 435,091 | |
| |
| | | | LB-UBS Commercial Mortgage Trust, | |
| | 845,000 | | | Series 2007-C1-AJ | | | 5.48% | | | | 02/15/2040 | | | | 844,074 | |
| | 100,000 | | | Series 2007-C1-AM | | | 5.46% | | | | 02/15/2040 | | | | 101,576 | |
| | 550,000 | | | Series 2007-C2-AM | | | 5.49% | # | | | 02/15/2040 | | | | 559,003 | |
| |
| | | | Merrill Lynch/Countrywide Commercial Mortgage Trust, | |
| | 21,225 | | | Series 2006-1-AJ | | | 5.74% | # | | | 02/12/2039 | | | | 21,205 | |
| | 300,000 | | | Series 2006-2-AJ | | | 5.95% | # | | | 06/12/2046 | | | | 301,470 | |
| |
| | | | Morgan Stanley Bank of America Merrill Lynch Trust, | |
| | 100,000 | | | Series 2014-C18-C | | | 4.49% | | | | 10/15/2047 | | | | 98,891 | |
| | 500,000 | | | Series 2014-C19-C | | | 4.00% | | | | 12/15/2047 | | | | 446,993 | |
| | 500,000 | | | Series 2015-C20-C | | | 4.46% | # | | | 02/15/2048 | | | | 464,405 | |
| | 180,000 | | | Series 2015-C21-C | | | 4.16% | # | | | 03/15/2048 | | | | 160,173 | |
| | 360,000 | | | Series 2015-C23-C | | | 4.14% | # | | | 07/15/2050 | | | | 323,125 | |
| | 550,000 | | | Series 2015-C26-D | | | 3.06% | ^ | | | 10/15/2048 | | | | 364,458 | |
| | 274,000 | | | Series 2015-C27-C | | | 4.54% | # | | | 12/15/2047 | | | | 254,654 | |
| |
| | | | Morgan Stanley Capital, Inc., | |
| | 117,749 | | | Series 2006-HQ8-AJ | | | 5.49% | # | | | 03/12/2044 | | | | 117,511 | |
| | 200,000 | | | Series 2007-HQ11-AJ | | | 5.51% | # | | | 02/12/2044 | | | | 196,807 | |
| | 150,000 | | | Series 2007-IQ16-AM | | | 6.05% | # | | | 12/12/2049 | | | | 156,844 | |
| | 150,000 | | | Series 2014-MP-D | | | 3.69% | #^ | | | 08/11/2029 | | | | 150,412 | |
| |
| | | | Wachovia Bank Commercial Mortgage Trust, | |
| | 360,000 | | | Series 2006-C28-AJ | | | 5.63% | # | | | 10/15/2048 | | | | 352,046 | |
| | 430,000 | | | Series 2007-C30-AJ | | | 5.41% | # | | | 12/15/2043 | | | | 423,305 | |
| | 600,000 | | | Series 2007-C30-AM | | | 5.38% | | | | 12/15/2043 | | | | 611,017 | |
| | | | | | |
| The accompanying notes are an integral part of these financial statements. | | Annual Report | | March 31, 2016 | | 81 |
| | |
| Schedule of Investments DoubleLine Flexible Income Fund (Cont.) | | March 31, 2016 |
| | | | | | | | | | | | | | | | |
PRINCIPAL
AMOUNT $ | | | SECURITY DESCRIPTION | | RATE | | | MATURITY | | | VALUE $ | |
| |
| | | | Wachovia Bank Commercial Mortgage Trust, (Cont.) | |
| | 150,000 | | | Series 2007-C31-AM | | | 5.59% | # | | | 04/15/2047 | | | | 153,832 | |
| | 485,000 | | | Series 2007-C33-AJ | | | 5.95% | # | | | 02/15/2051 | | | | 478,724 | |
| | 407,000 | | | Series 2007-C33-AM | | | 5.95% | # | | | 02/15/2051 | | | | 421,042 | |
| |
| | | | Wells Fargo Commercial Mortgage Trust, | |
| | 500,000 | | | Series 2014-LC16-D | | | 3.94% | ^ | | | 08/15/2050 | | | | 375,064 | |
| | 200,000 | | | Series 2015-C27-C | | | 3.89% | | | | 02/15/2048 | | | | 177,870 | |
| | 400,000 | | | Series 2015-C28-C | | | 4.14% | # | | | 05/15/2048 | | | | 370,728 | |
| | 540,000 | | | Series 2015-C31-C | | | 4.61% | # | | | 11/15/2048 | | | | 517,994 | |
| | 5,985,004 | | | Series 2015-C31-XA | | | 1.12% | # I/O | | | 11/15/2048 | | | | 463,041 | |
| | 2,730,805 | | | Series 2015-NXS1-XA | | | 1.20% | # I/O | | | 05/15/2048 | | | | 200,327 | |
| | 8,960,042 | | | Series 2015-NXS2-XA | | | 0.81% | # I/O | | | 07/15/2058 | | | | 443,803 | |
| | 411,000 | | | Series 2015-NXS4-C | | | 4.60% | # | | | 12/15/2048 | | | | 394,598 | |
| | 2,794,000 | | | Series 2016-C33-XA | | | 1.99% | # I/O | | | 03/15/2059 | | | | 336,984 | |
| |
| | | | WF-RBS Commercial Mortgage Trust, | |
| | 4,180,765 | | | Series 2014-C21-XA | | | 1.18% | # I/O | | | 08/15/2047 | | | | 276,300 | |
| | 2,538,669 | | | Series 2014-C24-XA | | | 0.98% | # I/O | | | 11/15/2047 | | | | 145,111 | |
| | | | | | | | | | | | | | | | |
| | | | Total Non-Agency Commercial Mortgage Backed Obligations
(Cost $28,178,895) | | | | 26,934,495 | |
| | | | | | | | | | | | | | | | |
| | NON-AGENCY RESIDENTIAL COLLATERALIZED MORTGAGE OBLIGATIONS 21.5% | |
| |
| | | | Banc of America Funding Corporation, | |
| | 750,000 | | | Series 2005-B-3M1 | | | 0.88% | # | | | 04/20/2035 | | | | 613,333 | |
| |
| | | | Bayview Opportunity Master Fund Trust, | |
| | 3,755,008 | | | Series 2015-1-A | | | 3.84% | #^ | | | 01/28/2030 | | | | 3,761,745 | |
| |
| | | | Bear Stearns Alt-A Trust, | |
| | 2,156,239 | | | Series 2006-4-22A1 | | | 3.07% | # | | | 08/25/2036 | | | | 1,746,683 | |
| |
| | | | CAM Mortgage LLC, | |
| | 983,038 | | | Series 2015-1-A | | | 3.50% | #^ | | | 07/15/2064 | | | | 986,377 | |
| |
| | | | CitiMortgage Alternative Loan Trust, | |
| | 2,392,666 | | | Series 2007-A5-1A10 | | | 5.75% | | | | 05/25/2037 | | | | 2,022,245 | |
| |
| | | | Countrywide Alternative Loan Trust, | |
| | 927,445 | | | Series 2005-75CB-A3 | | | 5.50% | | | | 01/25/2036 | | | | 860,943 | |
| | 1,009,888 | | | Series 2006-23CB-2A2 | | | 6.50% | | | | 08/25/2036 | | | | 745,285 | |
| | 795,268 | | | Series 2007-15CB-A7 | | | 6.00% | | | | 07/25/2037 | | | | 714,672 | |
| | 1,018,029 | | | Series 2008-1R-2A3 | | | 6.00% | | | | 08/25/2037 | | | | 841,735 | |
| |
| | | | Countrywide Home Loans, | |
| | 1,061,168 | | | Series 2005-HYB9-3A2A | | | 2.59% | # | | | 02/20/2036 | | | | 984,462 | |
| | 699,235 | | | Series 2007-14-A15 | | | 6.50% | | | | 09/25/2037 | | | | 685,502 | |
| | 1,794,390 | | | Series 2007-HY1-1A1 | | | 3.02% | # | | | 04/25/2037 | | | | 1,692,763 | |
| |
| | | | Credit Suisse First Boston Mortgage Backed Trust, | |
| | 557,646 | | | Series 2006-2-A5A | | | 6.08% | # | | | 09/25/2036 | | | | 369,940 | |
| |
| | | | Credit Suisse First Boston Mortgage Securities Corporation, | |
| | 1,101,578 | | | Series 2005-10-6A9 | | | 5.50% | | | | 11/25/2035 | | | | 927,455 | |
| | 660,236 | | | Series 2005-9-5A9 | | | 5.50% | | | | 10/25/2035 | | | | 570,941 | |
| |
| | | | Credit Suisse Mortgage Capital Certificates, | |
| | 1,500,000 | | | Series 2011-12R-3A5 | | | 2.42% | #^ | | | 07/27/2036 | | | | 1,384,365 | |
| | 402,000 | | | Series 2011-5R-6A9 | | | 2.74% | #^ | | | 11/27/2037 | | | | 365,064 | |
| | 3,798,355 | | | Series 2015-RPL3-A1 | | | 3.75% | #^ | | | 12/25/2056 | | | | 3,739,626 | |
| |
| | | | Deutsche ALT-B Securities, Inc. Mortgage Loan Trust, | |
| | 682,456 | | | Series 2006-AB4-A1A | | | 6.01% | # | | | 10/25/2036 | | | | 553,281 | |
| |
| | | | Deutsche Mortgage & Asset Receiving Corporation, | |
| | 259,304 | | | Series 2014-RS1-1A2 | | | 8.17% | #^ | | | 07/27/2037 | | | | 192,509 | |
| |
| | | | Impac Secured Assets Trust, | |
| | 1,133,134 | | | Series 2006-5-1A1C | | | 0.70% | # | | | 02/25/2037 | | | | 727,933 | |
| |
| | | | IndyMac Mortgage Loan Trust, | |
| | 4,860,479 | | | Series 2006-AR19-2A1 | | | 2.86% | # | | | 08/25/2036 | | | | 3,947,830 | |
| |
| | | | JP Morgan Mortgage Trust, | |
| | 988,669 | | | Series 2005-S3-1A2 | | | 5.75% | | | | 01/25/2036 | | | | 849,931 | |
| | 1,699,491 | | | Series 2007-A2-4A1M | | | 4.56% | # | | | 04/25/2037 | | | | 1,506,829 | |
| |
| | | | Lehman Mortgage Trust, | |
| | 303,793 | | | Series 2006-1-1A3 | | | 5.50% | | | | 02/25/2036 | | | | 246,726 | |
| |
| | | | MASTR Adjustable Rate Mortgages Trust, | |
| | 394,852 | | | Series 2006-2-2A1 | | | 2.75% | # | | | 04/25/2036 | | | | 364,285 | |
| | | | | | | | | | | | | | | | |
PRINCIPAL
AMOUNT $ | | | SECURITY DESCRIPTION | | RATE | | | MATURITY | | | VALUE $ | |
| |
| | | | Merrill Lynch Alternative Note Asset Trust, | |
| | 545,233 | | | Series 2007-F1-2A7 | | | 6.00% | | | | 03/25/2037 | | | | 395,114 | |
| |
| | | | Merrill Lynch Mortgage Investors Trust, | |
| | 1,219,183 | | | Series 2006-AF1-AF2C | | | 6.25% | | | | 08/25/2036 | | | | 985,920 | |
| |
| | | | Morgan Stanley Mortgage Loan Trust, | |
| | 256,241 | | | Series 2005-7-4A1 | | | 5.50% | | | | 11/25/2035 | | | | 229,063 | |
| | 248,916 | | | Series 2006-2-2A4 | | | 5.75% | | | | 02/25/2036 | | | | 236,217 | |
| | 806,422 | | | Series 2006-2-7A1 | | | 5.50% | # | | | 02/25/2036 | | | | 740,341 | |
| | 835,592 | | | Series 2007-8XS-A1 | | | 5.75% | # | | | 04/25/2037 | | | | 589,532 | |
| |
| | | | Residential Accredit Loans, Inc., | |
| | 455,408 | | | Series 2006-QS10-A9 | | | 6.50% | | | | 08/25/2036 | | | | 381,286 | |
| | 974,758 | | | Series 2006-QS12-2A3 | | | 6.00% | | | | 09/25/2036 | | | | 801,326 | |
| |
| | | | Residential Asset Securitization Trust, | |
| | 572,471 | | | Series 2006-A2-A11 | | | 6.00% | | | | 01/25/2046 | | | | 432,649 | |
| |
| | | | RMAT LLC, | |
| | 1,392,041 | | | Series 2015-RPL1-A1 | | | 3.97% | #^ | | | 05/26/2020 | | | | 1,381,702 | |
| |
| | | | Springleaf Mortgage Loan Trust, | |
| | 750,000 | | | Series 2013-1A-B2 | | | 6.00% | #^ | | | 06/25/2058 | | | | 749,735 | |
| | 750,000 | | | Series 2013-2A-B2 | | | 6.00% | #^ | | | 12/25/2065 | | | | 753,269 | |
| |
| | | | Towd Point Mortgage Trust, | |
| | 3,505,008 | | | Series 2015-2-1A13 | | | 2.50% | #^ | | | 11/25/2060 | | | | 3,507,715 | |
| |
| | | | VOLT LLC, | |
| | 2,227,514 | | | Series 2015-NPL3-A1 | | | 3.38% | #^ | | | 10/25/2058 | | | | 2,203,271 | |
| |
| | | | Washington Mutual Mortgage Pass-Through Certificates, | |
| | 1,478,729 | | | Series 2006-2-4CB | | | 6.00% | | | | 03/25/2036 | | | | 1,292,972 | |
| |
| | | | Wells Fargo Alternative Loan Trust, | |
| | 1,483,044 | | | Series 2007-PA5-1A1 | | | 6.25% | | | | 11/25/2037 | | | | 1,427,428 | |
| |
| | | | Wells Fargo Mortgage Backed Securities Trust, | |
| | 331,742 | | | Series 2007-2-1A15 | | | 5.75% | | | | 03/25/2037 | | | | 323,419 | |
| | 183,747 | | | Series 2007-3-1A4 | | | 6.00% | | | | 04/25/2037 | | | | 179,918 | |
| | | | | | | | | | | | | | | | |
| | | | Total Non-Agency Residential Collateralized Mortgage Obligations
(Cost $49,387,347) | | | | 48,013,337 | |
| | | | | | | | | | | | | | | | |
| | US CORPORATE BONDS 4.8% | |
| | 170,000 | | | Activision Blizzard, Inc. | | | 5.63% | ^ | | | 09/15/2021 | | | | 179,562 | |
| | 205,000 | | | Air Medical Merger Sub Corporation | | | 6.38% | ^ | | | 05/15/2023 | | | | 193,212 | |
| | 122,000 | | | Alere, Inc. | | | 6.50% | | | | 06/15/2020 | | | | 124,928 | |
| | 165,000 | | | American Axle & Manufacturing, Inc. | | | 6.63% | | | | 10/15/2022 | | | | 172,012 | |
| | 60,000 | | | Argos Merger Sub, Inc. | | | 7.13% | ^ | | | 03/15/2023 | | | | 63,750 | |
| | 85,000 | | | Asbury Automotive Group, Inc. | | | 6.00% | | | | 12/15/2024 | | | | 86,275 | |
| | 175,000 | | | Ashland, Inc. | | | 4.75% | | | | 08/15/2022 | | | | 178,500 | |
| | 120,000 | | | Berry Plastics Corporation | | | 5.50% | | | | 05/15/2022 | | | | 123,450 | |
| | 225,000 | | | CCO Holdings LLC | | | 5.25% | | | | 09/30/2022 | | | | 232,312 | |
| | 45,000 | | | CCO Holdings LLC | | | 5.13% | ^ | | | 05/01/2023 | | | | 45,900 | |
| | 37,000 | | | CDW LLC | | | 6.00% | | | | 08/15/2022 | | | | 39,243 | |
| | 215,000 | | | Centene Escrow Corporation | | | 5.63% | ^ | | | 02/15/2021 | | | | 224,675 | |
| | 250,000 | | | Cequel Communications LLC | | | 6.38% | ^ | | | 09/15/2020 | | | | 248,750 | |
| | 185,000 | | | CommScope, Inc. | | | 5.00% | ^ | | | 06/15/2021 | | | | 187,081 | |
| | 80,000 | | | CSC Holdings LLC | | | 5.25% | | | | 06/01/2024 | | | | 71,500 | |
| | 110,000 | | | Dana Holding Corporation | | | 5.50% | | | | 12/15/2024 | | | | 104,225 | |
| | 45,000 | | | Dollar Tree, Inc. | | | 5.75% | ^ | | | 03/01/2023 | | | | 47,897 | |
| | 40,000 | | | Energy Gulf Coast, Inc. | | | 9.25% | W | | | 12/15/2017 | | | | 1,525 | |
| | 15,000 | | | Energy Gulf Coast, Inc. | | | 11.00% | ^W | | | 03/15/2020 | | | | 2,175 | |
| | 35,000 | | | Energy Gulf Coast, Inc. | | | 7.50% | W | | | 12/15/2021 | | | | 1,312 | |
| | 85,000 | | | Energy Partners Ltd. | | | 8.25% | W | | | 02/15/2018 | | | | 4,303 | |
| | 135,000 | | | Energy Transfer Partners LP | | | 5.20% | | | | 02/01/2022 | | | | 128,325 | |
| | | | | | |
| 82 | | DoubleLine Funds Trust | | | | The accompanying notes are an integral part of these financial statements. |
| | | | | | | | | | | | | | | | |
PRINCIPAL
AMOUNT $ | | | SECURITY DESCRIPTION | | RATE | | | MATURITY | | | VALUE $ | |
| | 245,000 | | | Ensemble S Merger Sub, Inc. | | | 9.00% | ^ | | | 09/30/2023 | | | | 241,019 | |
| | 105,000 | | | Equinix, Inc. | | | 5.88% | | | | 01/15/2026 | | | | 110,827 | |
| | 240,000 | | | ESH Hospitality, Inc. | | | 5.25% | ^ | | | 05/01/2025 | | | | 235,500 | |
| | 90,000 | | | First Data Corporation | | | 7.00% | ^ | | | 12/01/2023 | | | | 91,237 | |
| | 90,000 | | | First Data Corporation | | | 5.75% | ^ | | | 01/15/2024 | | | | 90,328 | |
| | 120,000 | | | Frontier Communications Corporation | | | 10.50% | ^ | | | 09/15/2022 | | | | 123,450 | |
| | 245,000 | | | Gannett Company, Inc. | | | 4.88% | ^ | | | 09/15/2021 | | | | 252,962 | |
| | 315,000 | | | Gates Global LLC | | | 6.00% | ^ | | | 07/15/2022 | | | | 270,900 | |
| | 175,000 | | | Goodyear Tire & Rubber Company | | | 5.13% | | | | 11/15/2023 | | | | 179,812 | |
| | 120,000 | | | Gray Television, Inc. | | | 7.50% | | | | 10/01/2020 | | | | 127,200 | |
| | 145,000 | | | HCA, Inc. | | | 5.38% | | | | 02/01/2025 | | | | 146,768 | |
| | 90,000 | | | HCA, Inc. | | | 5.88% | | | | 02/15/2026 | | | | 92,925 | |
| | 180,000 | | | HD Supply, Inc. | | | 7.50% | | | | 07/15/2020 | | | | 191,925 | |
| | 35,000 | | | HD Supply, Inc. | | | 5.75% | ^ | | | 04/15/2024 | | | | 36,050 | |
| | 225,000 | | | Infor US, Inc. | | | 6.50% | | | | 05/15/2022 | | | | 205,875 | |
| | 205,000 | | | JBS LLC | | | 5.75% | ^ | | | 06/15/2025 | | | | 180,400 | |
| | 175,000 | | | Level 3 Communications, Inc. | | | 5.75% | | | | 12/01/2022 | | | | 181,125 | |
| | 120,000 | | | Levi Strauss & Company | | | 5.00% | | | | 05/01/2025 | | | | 121,800 | |
| | 300,000 | | | Memorial Productions Partners LP | | | 6.88% | | | | 08/01/2022 | | | | 84,000 | |
| | 30,000 | | | Microsemi Corporation | | | 9.13% | ^ | | | 04/15/2023 | | | | 33,075 | |
| | 180,000 | | | Milacron LLC | | | 7.75% | ^ | | | 02/15/2021 | | | | 166,500 | |
| | 130,000 | | | MPLX LP | | | 5.50% | ^ | | | 02/15/2023 | | | | 126,057 | |
| | 170,000 | | | NCL Corporation Ltd. | | | 5.25% | ^ | | | 11/15/2019 | | | | 175,100 | |
| | 125,000 | | | OPE KAG Finance Sub, Inc. | | | 7.88% | ^ | | | 07/31/2023 | | | | 125,313 | |
| | 65,000 | | | Pilgrim’s Pride Corporation | | | 5.75% | ^ | | | 03/15/2025 | | | | 65,569 | |
| | 185,000 | | | Plastipak Holdings, Inc. | | | 6.50% | ^ | | | 10/01/2021 | | | | 182,688 | |
| | 110,000 | | | Post Holdings, Inc. | | | 7.38% | | | | 02/15/2022 | | | | 116,738 | |
| | 125,000 | | | Quintiles Transnational Corporation | | | 4.88% | ^ | | | 05/15/2023 | | | | 128,391 | |
| | 90,000 | | | Regal Entertainment Group | | | 5.75% | | | | 03/15/2022 | | | | 93,600 | |
| | 214,000 | | | Revlon Consumer Products Corporation | | | 5.75% | | | | 02/15/2021 | | | | 220,955 | |
| | 225,000 | | | Reynolds Group Issuer LLC | | | 8.25% | | | | 02/15/2021 | | | | 231,053 | |
| | 115,000 | | | Rite Aid Corporation | | | 6.13% | ^ | | | 04/01/2023 | | | | 122,331 | |
| | 120,000 | | | Sabre GLBL, Inc. | | | 5.25% | ^ | | | 11/15/2023 | | | | 122,688 | |
| | 166,000 | | | Sally Holdings LLC | | | 5.75% | | | | 06/01/2022 | | | | 174,715 | |
| | 85,000 | | | Sanchez Energy Corporation | | | 6.13% | | | | 01/15/2023 | | | | 46,325 | |
| | 35,000 | | | Sandridge Energy, Inc. | | | 8.75% | ^W | | | 06/01/2020 | | | | 8,663 | |
| | 170,000 | | | SBA Communications Corporation | | | 5.63% | | | | 10/01/2019 | | | | 178,075 | |
| | 200,000 | | | Scientific Games International, Inc. | | | 7.00% | ^ | | | 01/01/2022 | | | | 205,000 | |
| | 200,000 | | | Select Medical Corporation | | | 6.38% | | | | 06/01/2021 | | | | 190,000 | |
| | 160,000 | | | Service Corporation International | | | 5.38% | | | | 01/15/2022 | | | | 168,000 | |
| | 275,000 | | | Signode Industrial Group, Inc. | | | 6.38% | ^ | | | 05/01/2022 | | | | 251,281 | |
| | 185,000 | | | Sinclair Television Group, Inc. | | | 5.63% | ^ | | | 08/01/2024 | | | | 186,850 | |
| | 85,000 | | | Solera Finance, Inc. | | | 10.50% | ^ | | | 03/01/2024 | | | | 85,638 | |
| | 175,000 | | | Spectrum Brands, Inc. | | | 5.75% | | | | 07/15/2025 | | | | 186,813 | |
| | 120,000 | | | Station Casinos LLC | | | 7.50% | | | | 03/01/2021 | | | | 127,200 | |
| | 75,000 | | | Team Health, Inc. | | | 7.25% | ^ | | | 12/15/2023 | | | | 80,438 | |
| | 205,000 | | | Tenet Healthcare Corporation | | | 6.75% | | | | 06/15/2023 | | | | 197,313 | |
| | 180,000 | | | Terex Corporation | | | 6.00% | | | | 05/15/2021 | | | | 175,050 | |
| | 240,000 | | | TransDigm, Inc. | | | 6.00% | | | | 07/15/2022 | | | | 240,300 | |
| | 65,000 | | | Treehouse Foods, Inc. | | | 6.00% | ^ | | | 02/15/2024 | | | | 69,225 | |
| | 245,000 | | | Tribune Media Company | | | 5.88% | ^ | | | 07/15/2022 | | | | 239,488 | |
| | 155,000 | | | Ultra Petroleum Corporation | | | 5.75% | ^ | | | 12/15/2018 | | | | 11,625 | |
| | 125,000 | | | Viking Cruises Ltd. | | | 8.50% | ^ | | | 10/15/2022 | | | | 118,750 | |
| | 120,000 | | | Vizient, Inc. | | | 10.38% | ^ | | | 03/01/2024 | | | | 128,700 | |
| | 140,000 | | | WCI Communities, Inc. | | | 6.88% | | | | 08/15/2021 | | | | 139,650 | |
| | 50,000 | | | Western Digital Corporation | | | 7.38% | ^ | | | 04/01/2023 | | | | 51,125 | |
| | | | | | | | | | | | | | | | |
PRINCIPAL
AMOUNT $ / SHARES | | | SECURITY DESCRIPTION | | RATE | | | MATURITY | | | VALUE $ | |
| | 100,000 | | | WMG Acquisition Corporation | | | 6.75% | ^ | | | 04/15/2022 | | | | 99,500 | |
| | | | | | | | | | | | | | | | |
| | | | Total US Corporate Bonds
(Cost $11,134,678) | | | | 10,694,797 | |
| | | | | | | | | | | | | | | | |
| | US GOVERNMENT / AGENCY MORTGAGE BACKED OBLIGATIONS 2.2% | |
| |
| | | | Federal Home Loan Mortgage Corporation, | |
| | 6,152,461 | | | Series 3926-HS | | | 6.01% | # I/F I/O | | | 09/15/2041 | | | | 1,085,001 | |
| | 852,193 | | | Series 4390-NY | | | 3.00% | | | | 06/15/2040 | | | | 890,938 | |
| | 915,928 | | | Series 4471-GA | | | 3.00% | | | | 02/15/2044 | | | | 946,600 | |
| |
| | | | Federal National Mortgage Association, | |
| | 1,918,967 | | | Series 2015-59-A | | | 3.00% | | | | 06/25/2041 | | | | 1,969,972 | |
| | | | | | | | | | | | | | | | |
| | | | Total US Government / Agency Mortgage Backed Obligations
(Cost $4,930,393) | | | | 4,892,511 | |
| | | | | | | | | | | | | | | | |
| | US GOVERNMENT BONDS AND NOTES 6.7% | |
| | 14,650,000 | | | United States Treasury Notes | | | 1.75% | | | | 12/31/2020 | | | | 15,015,679 | |
| | | | | | | | | | | | | | | | |
| | | | Total US Government Bonds and Notes
(Cost $14,823,327) | | | | 15,015,679 | |
| | | | | | | | | | | | | | | | |
| | AFFILIATED MUTUAL FUNDS 9.7% | | | | | |
| | 2,226,764 | | | DoubleLine Floating Rate Fund (Class I) | | | | | | | | | | | 21,755,488 | |
| | | | | | | | | | | | | | | | |
| | | | Total Affiliated Mutual Funds
(Cost $22,540,387) | | | | 21,755,488 | |
| | | | | | | | | | | | | | | | |
| | SHORT TERM INVESTMENTS 2.5% | |
| | 1,898,197 | | | BlackRock Liquidity Funds FedFund - Institutional Shares | | | 0.24% | ¨ | | | | | | | 1,898,197 | |
| | 1,898,197 | | | Fidelity Institutional Money Market Government Portfolio -
Class I | | | 0.23% | ¨ | | | | | | | 1,898,197 | |
| | 1,898,197 | | | Morgan Stanley Institutional Liquidity Funds Government Portfolio - Institutional Share Class | | | 0.25% | ¨ | | | | | | | 1,898,197 | |
| | | | | | | | | | | | | | | | |
| | | | Total Short Term Investments
(Cost $5,694,591) | | | | 5,694,591 | |
| | | | | | | | | | | | | | | | |
| | | | Total Investments 94.9%
(Cost $220,744,937) | | | | | | | | 212,154,540 | |
| | | | Other Assets in Excess of Liabilities 5.1% | | | | 11,315,227 | |
| | | | | | | | | | | | | | | | |
| | | | NET ASSETS 100.0% | | | | | | | $ | 223,469,767 | |
| | | | | | | | | | | | | | | | |
| | | | | | |
| The accompanying notes are an integral part of these financial statements. | | Annual Report | | March 31, 2016 | | 83 |
| | |
| Schedule of Investments DoubleLine Flexible Income Fund (Cont.) | | March 31, 2016 |
| | | | |
| SECURITY TYPE BREAKDOWN as a % of Net Assets: | | | | |
Non-Agency Residential Collateralized Mortgage Obligations | | | 21.5% | |
Collateralized Loan Obligations | | | 18.6% | |
Foreign Corporate Bonds | | | 14.6% | |
Non-Agency Commercial Mortgage Backed Obligations | | | 12.1% | |
Affiliated Mutual Funds | | | 9.7% | |
US Government Bonds and Notes | | | 6.7% | |
US Corporate Bonds | | | 4.8% | |
Short Term Investments | | | 2.5% | |
US Government / Agency Mortgage Backed Obligations | | | 2.2% | |
Asset Backed Obligations | | | 1.5% | |
Foreign Government Bonds and Notes, Supranationals and Foreign Agencies | | | 0.7% | |
Other Assets and Liabilities | | | 5.1% | |
| | | | |
| | | 100.0% | |
| | | | |
| | | | |
| COUNTRY BREAKDOWN as a % of Net Assets: | | | | |
United States | | | 79.6% | |
Chile | | | 2.3% | |
Mexico | | | 2.2% | |
Colombia | | | 2.2% | |
Peru | | | 2.1% | |
Panama | | | 1.2% | |
Brazil | | | 0.9% | |
Singapore | | | 0.8% | |
Guatemala | | | 0.7% | |
Paraguay | | | 0.6% | |
India | | | 0.5% | |
Israel | | | 0.4% | |
Costa Rica | | | 0.3% | |
Hong Kong | | | 0.2% | |
Jamaica | | | 0.2% | |
Indonesia | | | 0.2% | |
Columbia | | | 0.2% | |
Dominican Republic | | | 0.1% | |
Luxembourg | | | 0.1% | |
El Salvador | | | 0.1% | |
Trinidad and Tobago | | | 0.0% | ~ |
Other Assets and Liabilities | | | 5.1% | |
| | | | |
| | | 100.0% | |
| | | | |
| | | | |
| INVESTMENT BREAKDOWN as a % of Net Assets: | | | | |
Non-Agency Residential Collateralized Mortgage Obligations | | | 21.5% | |
Collateralized Loan Obligations | | | 18.6% | |
Non-Agency Commercial Mortgage Backed Obligations | | | 12.1% | |
Affiliated Mutual Funds | | | 9.7% | |
US Government Bonds and Notes | | | 6.7% | |
Banking | | | 4.0% | |
Short Term Investments | | | 2.5% | |
US Government / Agency Mortgage Backed Obligations | | | 2.2% | |
Transportation | | | 2.2% | |
Utilities | | | 1.9% | |
Oil & Gas | | | 1.8% | |
Asset Backed Obligations | | | 1.5% | |
Finance | | | 1.1% | |
Telecommunications | | | 1.0% | |
Consumer Products | | | 0.9% | |
Media | | | 0.9% | |
Mining | | | 0.8% | |
Building and Development (including Steel/Metals) | | | 0.7% | |
Foreign Government Bonds and Notes, Supranationals and Foreign Agencies | | | 0.7% | |
Healthcare | | | 0.5% | |
Retailers (other than Food/Drug) | | | 0.5% | |
Chemicals/Plastics | | | 0.4% | |
Leisure | | | 0.3% | |
Industrial Equipment | | | 0.3% | |
Containers and Glass Products | | | 0.2% | |
Hotels/Motels/Inns and Casinos | | | 0.2% | |
Technology | | | 0.2% | |
Conglomerates | | | 0.2% | |
Automotive | | | 0.2% | |
Electronics/Electric | | | 0.2% | |
Real Estate | | | 0.2% | |
Business Equipment and Services | | | 0.1% | |
Health Care Providers & Services | | | 0.1% | |
Aerospace & Defense | | | 0.1% | |
Beverage and Tobacco | | | 0.1% | |
Energy | | | 0.1% | |
Food Products | | | 0.1% | |
Financial Intermediaries | | | 0.1% | |
Pharmaceuticals | | | 0.0% | ~ |
Construction | | | 0.0% | ~ |
Food/Drug Retailers | | | 0.0% | ~ |
Other Assets and Liabilities | | | 5.1% | |
| | | | |
| | | 100.0% | |
| | | | |
| ^ | Security exempt from registration under Rule 144A of the Securities Act of 1933. These securities may be resold in transactions exempt from registration to qualified institutional buyers. These securities are determined to be liquid by the Adviser, unless otherwise noted, under procedures established by the Fund’s Board of Trustees. At March 31, 2016, the value of these securities amounted to $77,882,884 or 34.9% of net assets. |
| ¥ | Illiquid security. At March 31, 2016, the value of these securities amounted to $994,969 or 0.4% of net assets. |
| # | Variable rate security. Rate disclosed as of March 31, 2016. |
| W | Security is in default or has failed to make a scheduled payment. Income is not being accrued. |
| I/O | Interest only security |
| I/F | Inverse floating rate security whose interest rate moves in the opposite direction of reference interest rates |
| ¨ | Seven-day yield as of March 31, 2016 |
| ~ | Represents less than 0.05% of net assets |
A summary of the DoubleLine Flexible Income Fund’s investments in affiliated mutual funds for the year ended March 31, 2016 is as follows:
| | | | | | | | | | | | | | | | | | | | | | | | | | | | |
| Fund | | Value at
March 31,
2015 | | | Gross
Purchases | | | Gross
Sales | | | Shares
Held at
March 31,
2016 | | | Value at
March 31,
2016 | | | Dividend
Income Earned
in the Year
Ended March 31,
2016 | | | Net Realized
Gain (Loss) in
the Year
Ended March 31,
2016 | |
DoubleLine Floating Rate Fund | | $ | 8,175,333 | | | $ | 14,400,000 | | | $ | — | | | | 2,226,764 | | | $ | 21,755,488 | | | $ | 711,817 | | | $ | — | |
| | | | | | |
| 84 | | DoubleLine Funds Trust | | | | The accompanying notes are an integral part of these financial statements. |
| | |
| Schedule of Investments DoubleLine Low Duration Emerging Markets Fixed Income Fund | | March 31, 2016 |
| | | | | | | | | | | | | | | | |
PRINCIPAL
AMOUNT $ | | | SECURITY DESCRIPTION | | RATE | | | MATURITY | | | VALUE $ | |
| | FOREIGN CORPORATE BONDS 89.5% | |
| | |
| | BRAZIL 6.5% | |
| | 3,000,000 | | | Cosan Overseas Ltd. | | | 8.25% | † | | | 11/29/2049 | | | | 2,550,000 | |
| | 100,000 | | | Globo Communicacao e Participacoes S.A. | | | 5.31% | #^ | | | 05/11/2022 | | | | 99,400 | |
| | 4,400,000 | | | Globo Communicacao e Participacoes S.A. | | | 5.31% | # | | | 05/11/2022 | | | | 4,373,600 | |
| | 200,000 | | | Marfrig Holdings B.V. | | | 8.38% | | | | 05/09/2018 | | | | 202,000 | |
| | 1,500,000 | | | Marfrig Holdings B.V. | | | 6.88% | ^ | | | 06/24/2019 | | | | 1,430,625 | |
| | 1,000,000 | | | Marfrig Holdings B.V. | | | 6.88% | | | | 06/24/2019 | | | | 953,750 | |
| | 600,000 | | | Minerva Luxembourg S.A. | | | 8.75% | #^† | | | 04/03/2019 | | | | 566,250 | |
| | 1,900,000 | | | Minerva Luxembourg S.A. | | | 8.75% | #† | | | 04/03/2019 | | | | 1,793,125 | |
| | 1,000,000 | | | OAS Investments GmbH | | | 8.25% | W | | | 10/19/2019 | | | | 6,200 | |
| | | | | | | | | | | | | | | | |
| | | | | | | | | | | | | | | 11,974,950 | |
| | | | | | | | | | | | | | | | |
| | CHILE 15.0% | |
| | 3,550,000 | | | AES Gener S.A. | | | 5.25% | | | | 08/15/2021 | | | | 3,777,903 | |
| | 3,000,000 | | | Banco Santander | | | 1.52% | # | | | 04/11/2017 | | | | 2,981,250 | |
| | 123,000 | | | Celulosa Arauco y Constitucion S.A. | | | 5.00% | | | | 01/21/2021 | | | | 131,713 | |
| | 4,000,000 | | | Cencosud S.A. | | | 5.50% | | | | 01/20/2021 | | | | 4,277,412 | |
| | 1,600,000 | | | Corp Nacional del Cobre de Chile | | | 3.88% | | | | 11/03/2021 | | | | 1,641,765 | |
| | 1,000,000 | | | Corpbanca S.A. | | | 3.13% | | | | 01/15/2018 | | | | 1,006,690 | |
| | 200,000 | | | Corpbanca S.A. | | | 3.88% | | | | 09/22/2019 | | | | 205,369 | |
| | 1,500,000 | | | Corporacion Nacional del Cobre de Chile | | | 3.75% | | | | 11/04/2020 | | | | 1,571,829 | |
| | 3,827,906 | | | Guanay Finance Ltd. | | | 6.00% | | | | 12/15/2020 | | | | 3,722,638 | |
| | 3,500,000 | | | Inversiones CMPC S.A. | | | 4.75% | | | | 01/19/2018 | | | | 3,623,137 | |
| | 2,300,000 | | | Sociedad Quimica y Minera S.A. | | | 6.13% | | | | 04/15/2016 | | | | 2,301,888 | |
| | 500,000 | | | Sociedad Quimica y Minera S.A. | | | 5.50% | | | | 04/21/2020 | | | | 519,125 | |
| | 1,900,000 | | | Tanner Servicios Financieros S.A. | | | 4.38% | | | | 03/13/2018 | | | | 1,866,750 | |
| | 300,000 | | | VTR Finance B.V. | | | 6.88% | | | | 01/15/2024 | | | | 294,840 | |
| | | | | | | | | | | | | | | | |
| | | | | | | | | | | | | | | 27,922,309 | |
| | | | | | | | | | | | | | | | |
| | CHINA 0.8% | |
| | 400,000 | | | CNPC General Capital Ltd. | | | 1.52% | #^ | | | 05/14/2017 | | | | 400,150 | |
| | 1,000,000 | | | Sinopec Group Overseas Development Ltd. | | | 2.50% | | | | 04/28/2020 | | | | 1,005,514 | |
| | | | | | | | | | | | | | | | |
| | | | | | | | | | | | | | | 1,405,664 | |
| | | | | | | | | | | | | | | | |
| | COLOMBIA 11.7% | |
| | 1,200,000 | | | Avianca Holdings S.A. | | | 8.38% | ^ | | | 05/10/2020 | | | | 948,000 | |
| | 4,500,000 | | | Ecopetrol S.A. | | | 4.25% | | | | 09/18/2018 | | | | 4,567,500 | |
| | 1,500,000 | | | Empresa de Energia de Bogota S.A. | | | 6.13% | | | | 11/10/2021 | | | | 1,561,500 | |
| | 4,000,000 | | | Empresas Publicas de Medellin E.S.P. | | | 7.63% | | | | 07/29/2019 | | | | 4,540,000 | |
| | 3,000,000 | | | Grupo Aval Ltd. | | | 5.25% | | | | 02/01/2017 | | | | 3,071,250 | |
| | 700,000 | | | GrupoSura Finance S.A. | | | 5.70% | | | | 05/18/2021 | | | | 727,650 | |
| | 500,000 | | | Oleoducto Central S.A. | | | 4.00% | | | | 05/07/2021 | | | | 475,625 | |
| | 3,800,000 | | | Pacific Rubiales Energy Corporation | | | 5.38% | W | | | 01/26/2019 | | | | 665,000 | |
| | 5,000,000 | | | Transportadora de Gas Internacional S.A. | | | 5.70% | | | | 03/20/2022 | | | | 5,092,500 | |
| | | | | | | | | | | | | | | | |
| | | | | | | | | | | | | | | 21,649,025 | |
| | | | | | | | | | | | | | | | |
| | COSTA RICA 1.1% | |
| | 1,000,000 | | | Banco Nacional de Costa Rica | | | 4.88% | | | | 11/01/2018 | | | | 997,500 | |
| | 1,000,000 | | | Instituto Costarricense de Electricidad | | | 6.95% | | | | 11/10/2021 | | | | 1,002,500 | |
| | | | | | | | | | | | | | | | |
| | | | | | | | | | | | | | | 2,000,000 | |
| | | | | | | | | | | | | | | | |
| | DOMINICAN REPUBLIC 0.1% | |
| | 200,000 | | | Aeropuertos Dominicanos | | | 9.75% | # | | | 11/13/2019 | | | | 212,000 | |
| | | | | | | | | | | | | | | | |
| | | | | | | | | | | | | | | 212,000 | |
| | | | | | | | | | | | | | | | |
| | | | | | | | | | | | | | | | |
| | | | | | | | | | | | | | | | |
PRINCIPAL
AMOUNT $ | | | SECURITY DESCRIPTION | | RATE | | | MATURITY | | | VALUE $ | |
| | GUATEMALA 4.6% | |
| | 900,000 | | | Agromercantil Senior Trust | | | 6.25% | ^ | | | 04/10/2019 | | | | 931,500 | |
| | 1,600,000 | | | Agromercantil Senior Trust | | | 6.25% | | | | 04/10/2019 | | | | 1,656,000 | |
| | 500,000 | | | Bantrab Senior Trust | | | 9.00% | | | | 11/14/2020 | | | | 483,125 | |
| | 1,250,000 | | | Cementos Progreso Trust | | | 7.13% | | | | 11/06/2023 | | | | 1,328,125 | |
| | 4,000,000 | | | Central American Bottling Corporation | | | 6.75% | | | | 02/09/2022 | | | | 4,230,000 | |
| | | | | | | | | | | | | | | | |
| | | | | | | | | | | | | | | 8,628,750 | |
| | | | | | | | | | | | | | | | |
| | HONG KONG 2.0% | |
| | 3,600,000 | | | Hutchison Whampoa International Ltd. | | | 6.00% | #† | | | 05/07/2017 | | | | 3,727,800 | |
| | | | | | | | | | | | | | | | |
| | | | | | | | | | | | | | | 3,727,800 | |
| | | | | | | | | | | | | | | | |
| | INDIA 2.7% | |
| | 3,500,000 | | | ONGC Videsh Ltd. | | | 3.25% | | | | 07/15/2019 | | | | 3,557,855 | |
| | 2,000,000 | | | Vedanta Resources PLC | | | 6.00% | | | | 01/31/2019 | | | | 1,372,500 | |
| | | | | | | | | | | | | | | | |
| | | | | | | | | | | | | | | 4,930,355 | |
| | | | | | | | | | | | | | | | |
| | INDONESIA 1.9% | |
| | 4,000,000 | | | Freeport-McMoRan Copper & Gold, Inc. | | | 2.38% | | | | 03/15/2018 | | | | 3,560,000 | |
| | | | | | | | | | | | | | | | |
| | | | | | | | | | | | | | | 3,560,000 | |
| | | | | | | | | | | | | | | | |
| | ISRAEL 4.0% | |
| | 1,000,000 | | | Delek & Avner Tamar Bond Ltd. | | | 3.84% | ^ | | | 12/30/2018 | | | | 1,000,900 | |
| | 2,500,000 | | | Delek & Avner Tamar Bond Ltd. | | | 4.44% | ^ | | | 12/30/2020 | | | | 2,518,750 | |
| | 4,000,000 | | | Israel Electric Corporation Ltd. | | | 2.50% | # | | | 01/17/2018 | | | | 3,950,000 | |
| | | | | | | | | | | | | | | | |
| | | | | | | | | | | | | | | 7,469,650 | |
| | | | | | | | | | | | | | | | |
| | JAMAICA 1.3% | |
| | 1,200,000 | | | Digicel Ltd. | | | 7.00% | | | | 02/15/2020 | | | | 1,104,000 | |
| | 1,500,000 | | | Digicel Ltd. | | | 8.25% | | | | 09/30/2020 | | | | 1,295,625 | |
| | | | | | | | | | | | | | | | |
| | | | | | | | | | | | | | | 2,399,625 | |
| | | | | | | | | | | | | | | | |
| | MEXICO 13.8% | |
| | 2,118,000 | | | Banco Mercantil del Norte | | | 6.86% | # | | | 10/13/2021 | | | | 2,139,180 | |
| | 4,000,000 | | | Banco Santander | | | 5.95% | # | | | 01/30/2024 | | | | 4,146,000 | |
| | 5,000,000 | | | BBVA Bancomer S.A. | | | 6.01% | # | | | 05/17/2022 | | | | 5,087,500 | |
| | 500,000 | | | Credito Real S.A.B. de C.V. | | | 7.50% | ^ | | | 03/13/2019 | | | | 496,250 | |
| | 200,000 | | | Credito Real S.A.B. de C.V. | | | 7.50% | | | | 03/13/2019 | | | | 198,500 | |
| | 2,700,000 | | | Grupo Cementos de Chihuahua S.A.B de C.V. | | | 8.13% | | | | 02/08/2020 | | | | 2,808,000 | |
| | 2,500,000 | | | Grupo Elektra S.A.B. de C.V. | | | 7.25% | | | | 08/06/2018 | | | | 2,437,500 | |
| | 1,500,000 | | | Grupo Idesa S.A. de C.V. | | | 7.88% | | | | 12/18/2020 | | | | 1,464,375 | |
| | 3,500,000 | | | Petroleos Mexicanos | | | 3.50% | | | | 07/18/2018 | | | | 3,556,000 | |
| | 2,000,000 | | | Petroleos Mexicanos | | | 5.50% | | | | 01/21/2021 | | | | 2,078,750 | |
| | 400,000 | | | TV Azteca S.A.B. de C.V. | | | 7.50% | | | | 05/25/2018 | | | | 259,000 | |
| | 1,500,000 | | | TV Azteca S.A.B. de C.V. | | | 7.63% | | | | 09/18/2020 | | | | 885,000 | |
| | | | | | | | | | | | | | | | |
| | | | | | | | | | | | | | | 25,556,055 | |
| | | | | | | | | | | | | | | | |
| | PANAMA 6.9% | |
| | 250,000 | | | Banco Latinoamericano de Comercio Exterior S.A. | | | 3.75% | | | | 04/04/2017 | | | | 254,750 | |
| | 2,000,000 | | | Banco Latinoamericano do Comercio Exterior S.A. | | | 3.25% | ^ | | | 05/07/2020 | | | | 1,995,000 | |
| | 1,000,000 | | | Banco Latinoamericano do Comercio Exterior S.A. | | | 3.25% | | | | 05/07/2020 | | | | 997,500 | |
| | 4,622,195 | | | ENA Norte Trust | | | 4.95% | | | | 04/25/2023 | | | | 4,737,750 | |
| | | | | | |
| The accompanying notes are an integral part of these financial statements. | | Annual Report | | March 31, 2016 | | 85 |
| | |
| Schedule of Investments DoubleLine Low Duration Emerging Markets Fixed Income Fund (Cont.) | | March 31, 2016 |
| | | | | | | | | | | | | | | | |
PRINCIPAL
AMOUNT $ | | | SECURITY DESCRIPTION | | RATE | | | MATURITY | | | VALUE $ | |
| | 1,500,000 | | | Global Bank Corporation | | | 4.75% | | | | 10/05/2017 | | | | 1,524,375 | |
| | 1,500,000 | | | Global Bank Corporation | | | 5.13% | ^ | | | 10/30/2019 | | | | 1,526,250 | |
| | 1,800,000 | | | Global Bank Corporation | | | 5.13% | | | | 10/30/2019 | | | | 1,831,500 | |
| | | | | | | | | | | | | | | | |
| | | | | | | | | | | | | | | 12,867,125 | |
| | | | | | | | | | | | | | | | |
| | PARAGUAY 1.6% | |
| | 500,000 | | | Banco Continental SAECA | | | 8.88% | | | | 10/15/2017 | | | | 506,875 | |
| | 1,080,000 | | | Banco Regional SAECA | | | 8.13% | | | | 01/24/2019 | | | | 1,115,640 | |
| | 1,000,000 | | | Telefonica Celular del Paraguay S.A. | | | 6.75% | ^ | | | 12/13/2022 | | | | 985,000 | |
| | 400,000 | | | Telefonica Celular del Paraguay S.A. | | | 6.75% | | | | 12/13/2022 | | | | 394,000 | |
| | | | | | | | | | | | | | | | |
| | | | | | | | | | | | | | | 3,001,515 | |
| | | | | | | | | | | | | | | | |
| | PERU 10.4% | |
| | 1,000,000 | | | Banco de Credito del Peru | | | 2.75% | | | | 01/09/2018 | | | | 1,010,000 | |
| | 600,000 | | | Camposol S.A. | | | 9.88% | | | | 02/02/2017 | | | | 525,000 | |
| | 200,000 | | | Corporacion Azucarera del Peru S.A. | | | 6.38% | | | | 08/02/2022 | | | | 173,000 | |
| | 1,400,000 | | | Corporacion Financiera de Desarrollo S.A. | | | 3.25% | | | | 07/15/2019 | | | | 1,428,000 | |
| | 2,000,000 | | | Fondo Mivivienda S.A. | | | 3.38% | | | | 04/02/2019 | | | | 2,027,500 | |
| | 200,000 | | | Inkia Energy Ltd. | | | 8.38% | ^ | | | 04/04/2021 | | | | 200,500 | |
| | 2,677,000 | | | Inkia Energy Ltd. | | | 8.38% | | | | 04/04/2021 | | | | 2,683,692 | |
| | 1,104,632 | | | Interoceanica Finance Ltd. | | | 0.00% | | | | 11/30/2018 | | | | 1,054,924 | |
| | 2,687,000 | | | Maestro Peru S.A. | | | 6.75% | | | | 09/26/2019 | | | | 2,828,068 | |
| | 3,783,486 | | | Peru Enhanced Pass-Through Finance Ltd. | | | 0.00% | | | | 05/31/2018 | | | | 3,645,426 | |
| | 1,800,000 | | | Southern Copper Corporation | | | 3.50% | | | | 11/08/2022 | | | | 1,737,290 | |
| | 1,500,000 | | | Union Andina de Cementos S.A.A. | | | 5.88% | ^ | | | 10/30/2021 | | | | 1,507,500 | |
| | 500,000 | | | Union Andina de Cementos S.A.A. | | | 5.88% | | | | 10/30/2021 | | | | 502,500 | |
| | | | | | | | | | | | | | | | |
| | | | | | | | | | | | | | | 19,323,400 | |
| | | | | | | | | | | | | | | | |
| | QATAR 1.2% | |
| | 1,000,000 | | | Ooredoo Tamweel Ltd. | | | 3.04% | | | | 12/03/2018 | | | | 1,020,125 | |
| | 1,206,751 | | | Ras Laffan Liquefied Natural Gas Company | | | 5.30% | | | | 09/30/2020 | | | | 1,299,820 | |
| | | | | | | | | | | | | | | | |
| | | | | | | | | | | | | | | 2,319,945 | |
| | | | | | | | | | | | | | | | |
| | SINGAPORE 3.9% | |
| | 1,000,000 | | | DBS Bank Ltd. | | | 3.63% | # | | | 09/21/2022 | | | | 1,025,091 | |
| | 3,000,000 | | | Oversea-Chinese Banking Corporation | | | 4.00% | # | | | 10/15/2024 | | | | 3,119,454 | |
| | 3,000,000 | | | United Overseas Bank Ltd. | | | 3.75% | # | | | 09/19/2024 | | | | 3,093,990 | |
| | | | | | | | | | | | | | | | |
| | | | | | | | | | | | | | | 7,238,535 | |
| | | | | | | | | | | | | | | | |
| | | | Total Foreign Corporate Bonds
(Cost $174,521,726) | | | | 166,186,703 | |
| | | | | | | | | | | | | | | | |
| | | | | | | | | | | | | | | | |
PRINCIPAL
AMOUNT $ / SHARES | | | SECURITY DESCRIPTION | | RATE | | | MATURITY | | | VALUE $ | |
| FOREIGN GOVERNMENT BONDS AND NOTES, SUPRANATIONALS AND
FOREIGN AGENCIES 8.0% |
|
| | |
| | COLOMBIA 3.8% | |
| | 6,700,000 | | | Colombia Government International Bond | | | 4.38% | | | | 07/12/2021 | | | | 7,001,500 | |
| | | | | | | | | | | | | | | | |
| | | | | | | | | | | | | | | 7,001,500 | |
| | | | | | | | | | | | | | | | |
| | MEXICO 1.1% | |
| | 2,050,000 | | | Mexico Government International Bond | | | 3.50% | | | | 01/21/2021 | | | | 2,126,875 | |
| | | | | | | | | | | | | | | | |
| | | | | | | | | | | | | | | 2,126,875 | |
| | | | | | | | | | | | | | | | |
| | PANAMA 3.1% | |
| | 5,200,000 | | | Panama Government International Bond | | | 5.20% | | | | 01/30/2020 | | | | 5,746,000 | |
| | | | | | | | | | | | | | | | |
| | | | | | | | | | | | | | | 5,746,000 | |
| | | | | | | | | | | | | | | | |
| | | | Total Foreign Government Bonds and Notes, Supranationals and Foreign Agencies
(Cost $14,851,613) | | | | 14,874,375 | |
| | | | | | | | | | | | | | | | |
| | SHORT TERM INVESTMENTS 0.6% | |
| | 353,721 | | | BlackRock Liquidity Funds FedFund - Institutional Shares | | | 0.24% | ¨ | | | | | | | 353,721 | |
| | 353,722 | | | Fidelity Institutional Money Market Government Portfolio - Class I | | | 0.23% | �� | | | | | | | 353,722 | |
| | 353,721 | | | Morgan Stanley Institutional Liquidity Funds Government Portfolio - Institutional Share Class | | | 0.25% | ¨ | | | | | | | 353,721 | |
| | | | | | | | | | | | | | | | |
| | | | Total Short Term Investments (Cost $1,061,164) | | | | | | | | 1,061,164 | |
| | | | | | | | | | | | | | | | |
| | | | Total Investments 98.1%
(Cost $190,434,503) | | | | | | | | 182,122,242 | |
| | | | Other Assets in Excess of Liabilities 1.9% | | | | 3,476,876 | |
| | | | | | | | | | | | | | | | |
| | | | NET ASSETS 100.0% | | | | | | | $ | 185,599,118 | |
| | | | | | | | | | | | | | | | |
| | | | |
| SECURITY TYPE BREAKDOWN as a % of Net Assets: | |
Foreign Corporate Bonds | | | 89.5% | |
Foreign Government Bonds and Notes, Supranationals and Foreign Agencies | | | 8.0% | |
Short Term Investments | | | 0.6% | |
Other Assets and Liabilities | | | 1.9% | |
| | | | |
| | | 100.0% | |
| | | | |
| | | | | | |
| 86 | | DoubleLine Funds Trust | | | | The accompanying notes are an integral part of these financial statements. |
| | | | |
| COUNTRY BREAKDOWN as a % of Net Assets: | |
Colombia | | | 15.5% | |
Chile | | | 15.0% | |
Mexico | | | 14.9% | |
Peru | | | 10.4% | |
Panama | | | 10.0% | |
Brazil | | | 6.5% | |
Guatemala | | | 4.6% | |
Israel | | | 4.0% | |
Singapore | | | 3.9% | |
India | | | 2.7% | |
Hong Kong | | | 2.0% | |
Indonesia | | | 1.9% | |
Paraguay | | | 1.6% | |
Jamaica | | | 1.3% | |
Qatar | | | 1.2% | |
Costa Rica | | | 1.1% | |
China | | | 0.8% | |
United States | | | 0.6% | |
Dominican Republic | | | 0.1% | |
Other Assets and Liabilities | | | 1.9% | |
| | | | |
| | | 100.0% | |
| | | | |
| | | | |
| INVESTMENT BREAKDOWN as a % of Net Assets: | | | | |
Banking | | | 22.2% | |
Oil & Gas | | | 12.8% | |
Transportation | | | 10.5% | |
Utilities | | | 9.6% | |
Foreign Government Bonds and Notes, Supranationals and Foreign Agencies | | | 8.0% | |
Mining | | | 5.3% | |
Finance | | | 3.4% | |
Building and Development (including Steel/Metals) | | | 3.3% | |
Consumer Products | | | 3.0% | |
Media | | | 3.0% | |
Retailers (other than Food/Drug) | | | 2.8% | |
Telecommunications | | | 2.7% | |
Beverage and Tobacco | | | 2.3% | |
Chemicals/Plastics | | | 2.3% | |
Food/Drug Retailers | | | 2.3% | |
Conglomerates | | | 2.0% | |
Pulp & Paper | | | 2.0% | |
Short Term Investments | | | 0.6% | |
Construction | | | 0.0% | ~ |
Other Assets and Liabilities | | | 1.9% | |
| | | | |
| | | 100.0% | |
| | | | |
| # | Variable rate security. Rate disclosed as of March 31, 2016. |
| ^ | Security exempt from registration under Rule 144A of the Securities Act of 1933. These securities may be resold in transactions exempt from registration to qualified institutional buyers. These securities are determined to be liquid by the Adviser, unless otherwise noted, under procedures established by the Fund’s Board of Trustees. At March 31, 2016, the value of these securities amounted to $14,606,075 or 7.9% of net assets. |
| W | Security is in default or has failed to make a scheduled payment. Income is not being accrued. |
| ¨ | Seven-day yield as of March 31, 2016 |
| ~ | Represents less than 0.05% of net assets. |
| | | | | | |
| The accompanying notes are an integral part of these financial statements. | | Annual Report | | March 31, 2016 | | 87 |
| | |
| Schedule of Investments DoubleLine Long Duration Total Return Bond Fund | | March 31, 2016 |
| | | | | | | | | | | | | | | | |
PRINCIPAL AMOUNT $ | | | SECURITY DESCRIPTION | | RATE | | | MATURITY | | | VALUE $ | |
| | US GOVERNMENT / AGENCY MORTGAGE BACKED OBLIGATIONS 69.4% | |
| |
| | | | Federal Home Loan Mortgage Corporation, | |
| | 1,596,049 | | | Series 4057-ZB | | | 3.50% | | | | 06/15/2042 | | | | 1,685,120 | |
| | 1,596,049 | | | Series 4057-ZC | | | 3.50% | | | | 06/15/2042 | | | | 1,732,024 | |
| | 2,221,082 | | | Series 4182-ZD | | | 3.50% | | | | 03/15/2043 | | | | 2,326,415 | |
| | 1,091,323 | | | Series 4194-ZL | | | 3.00% | | | | 04/15/2043 | | | | 1,087,431 | |
| | 2,439,701 | | | Series 4204-QZ | | | 3.00% | | | | 05/15/2043 | | | | 2,370,066 | |
| | 1,656,136 | | | Series 4206-LZ | | | 3.50% | | | | 05/15/2043 | | | | 1,720,078 | |
| | 615,100 | | | Series 4210-Z | | | 3.00% | | | | 05/15/2043 | | | | 597,913 | |
| | 324,954 | | | Series 4226-GZ | | | 3.00% | | | | 07/15/2043 | | | | 314,196 | |
| | 2,342,971 | | | Series 4390-NZ | | | 3.00% | | | | 09/15/2044 | | | | 2,301,907 | |
| | 2,076,327 | | | Series 4417-PZ | | | 3.00% | | | | 12/15/2044 | | | | 1,994,687 | |
| | 2,771,595 | | | Series 4420-CZ | | | 3.00% | | | | 12/15/2044 | | | | 2,659,354 | |
| | 4,924,311 | | | Series 4427-XG | | | 3.00% | | | | 01/15/2045 | | | | 4,755,409 | |
| | 2,054,849 | | | Series 4440-ZD | | | 2.50% | | | | 02/15/2045 | | | | 1,835,797 | |
| | 1,061,513 | | | Series 4460-KB | | | 3.50% | | | | 03/15/2045 | | | | 1,079,704 | |
| | 2,055,693 | | | Series 4461-LZ | | | 3.00% | | | | 03/15/2045 | | | | 1,977,660 | |
| |
| | | | Federal National Mortgage Association, | |
| | 2,100,000 | | | Series 2012-128-UC | | | 2.50% | | | | 11/25/2042 | | | | 1,916,498 | |
| | 1,596,049 | | | Series 2012-68-ZA | | | 3.50% | | | | 07/25/2042 | | | | 1,690,811 | |
| | 2,273,439 | | | Series 2012-92-AZ | | | 3.50% | | | | 08/25/2042 | | | | 2,392,541 | |
| | 2,991,894 | | | Series 2013-127-MZ | | | 3.00% | | | | 12/25/2043 | | | | 2,826,513 | |
| | 504,526 | | | Series 2013-66-ZK | | | 3.00% | | | | 07/25/2043 | | | | 470,197 | |
| | 1,651,320 | | | Series 2013-74-ZH | | | 3.50% | | | | 07/25/2043 | | | | 1,724,058 | |
| | 1,218,090 | | | Series 2014-42-BZ | | | 3.00% | | | | 07/25/2044 | | | | 1,172,262 | |
| | 1,500,000 | | | Series 2014-67-HD | | | 3.00% | | | | 10/25/2044 | | | | 1,490,232 | |
| | 904,000 | | | Series 2014-68-TD | | | 3.00% | | | | 11/25/2044 | | | | 900,434 | |
| | 2,427,280 | | | Series 2014-80-DZ | | | 3.00% | | | | 12/25/2044 | | | | 2,291,885 | |
| | 1,108,514 | | | Series 2014-80-KL | | | 2.00% | | | | 05/25/2043 | | | | 887,844 | |
| | 3,075,865 | | | Series 2015-16-ZY | | | 2.50% | | | | 04/25/2045 | | | | 2,773,942 | |
| | 2,693,521 | | | Series 2015-52-GZ | | | 3.00% | | | | 07/25/2045 | | | | 2,553,059 | |
| |
| | | | Government National Mortgage Association, | |
| | 674,291 | | | Series 2013-180-LO | | | 0.00% | P/O | | | 11/16/2043 | | | | 587,168 | |
| | 3,250,490 | | | Series 2015-53-EZ | | | 2.00% | | | | 04/16/2045 | | | | 2,476,557 | |
| | 2,853,060 | | | Series 2015-79-UZ | | | 2.50% | | | | 05/20/2045 | | | | 2,466,039 | |
| | 271,584 | | | Series 2016-12-MZ | | | 3.00% | | | | 01/20/2046 | | | | 237,166 | |
| | | | | | | | | | | | | | | | |
| | | | Total US Government / Agency Mortgage Backed Obligations
(Cost $54,466,880) | | | | 57,294,967 | |
| | | | | | | | | | | | | | | | |
| | | | | | | | | | | | | | | | |
PRINCIPAL
AMOUNT $ / SHARES | | | SECURITY DESCRIPTION | | RATE | | | MATURITY | | | VALUE $ | |
| | US GOVERNMENT BONDS AND NOTES 23.4% | |
| | 2,400,000 | | | United States Treasury Bonds | | | 6.25% | | | | 05/15/2030 | | | | 3,663,235 | |
| | 2,800,000 | | | United States Treasury Bonds | | | 4.25% | | | | 05/15/2039 | | | | 3,708,306 | |
| | 2,500,000 | | | United States Treasury Bonds | | | 3.38% | | | | 05/15/2044 | | | | 2,899,755 | |
| | 3,646,496 | | | United States Treasury Inflation Indexed Bonds | | | 0.38% | | | | 07/15/2025 | | | | 3,729,658 | |
| | 2,600,000 | | | United States Treasury Notes | | | 0.50% | | | | 06/30/2016 | | | | 2,601,316 | |
| | 1,300,000 | | | United States Treasury Notes | | | 1.88% | | | | 05/31/2022 | | | | 1,332,729 | |
| | 1,300,000 | | | United States Treasury Notes | | | 2.50% | | | | 05/15/2024 | | | | 1,383,128 | |
| | | | | | | | | | | | | | | | |
| | | | Total US Government Bonds and Notes
(Cost $18,888,360) | | | | 19,318,127 | |
| | | | | | | | | | | | | | | | |
| | SHORT TERM INVESTMENTS 7.1% | |
| | 1,963,158 | | | BlackRock Liquidity Funds FedFund - Institutional Shares | | | 0.24% | ¨ | | | | | | | 1,963,158 | |
| | 1,963,157 | | | Fidelity Institutional Money Market Government Portfolio - Class I | | | 0.23% | ¨ | | | | | | | 1,963,157 | |
| | 1,963,157 | | | Morgan Stanley Institutional Liquidity Funds Government Portfolio - Institutional Share Class | | | 0.25% | ¨ | | | | | | | 1,963,157 | |
| | | | | | | | | | | | | | | | |
| | | | Total Short Term Investments
(Cost $5,889,472) | | | | 5,889,472 | |
| | | | | | | | | | | | | | | | |
| | | | Total Investments 99.9%
(Cost $79,244,712) | | | | 82,502,566 | |
| | | | Other Assets in Excess of Liabilities 0.1% | | | | 103,190 | |
| | | | | | | | | | | | | | | | |
| | | | NET ASSETS 100.0% | | | $ | 82,605,756 | |
| | | | | | | | | | | | | | | | |
| | | | |
| SECURITY TYPE BREAKDOWN as a % of Net Assets: | |
US Government / Agency Mortgage Backed Obligations | | | 69.4% | |
US Government Bonds and Notes | | | 23.4% | |
Short Term Investments | | | 7.1% | |
Other Assets and Liabilities | | | 0.1% | |
| | | | |
| | | 100.0% | |
| | | | |
| P/O | Principal only security |
| ¨ | Seven-day yield as of March 31, 2016 |
| | | | | | |
| 88 | | DoubleLine Funds Trust | | | | The accompanying notes are an integral part of these financial statements. |
| | |
| Schedule of Investments (Consolidated) DoubleLine Strategic Commodity Fund | | March 31, 2016 |
| | | | | | | | | | | | | | | | |
PRINCIPAL
AMOUNT $ /
SHARES | | | SECURITY DESCRIPTION | | RATE | | | MATURITY | | | VALUE $ | |
| | SHORT TERM INVESTMENTS 99.3% | |
| | 1,618,949 | | | BlackRock Liquidity Funds FedFund - Institutional Shares | | | 0.24% | ¨ | | | | | | | 1,618,949 | |
| | 309,537 | | | Dreyfus Government Cash Management - Institutional Shares | | | 0.20% | ¨ | | | | | | | 309,537 | |
| | 1,309,412 | | | Fidelity Institutional Money Market Government Portfolio - Class I | | | 0.23% | ¨ | | | | | | | 1,309,412 | |
| | 250,000 | | | United States Treasury Bills | | | 0.00% | | | | 04/21/2016 | | | | 249,985 | |
| | 1,140,000 | | | United States Treasury Bills | | | 0.00% | | | | 04/28/2016 | | | | 1,139,860 | |
| | 750,000 | | | United States Treasury Bills | | | 0.00% | | | | 05/12/2016 | | | | 749,921 | |
| | 15,150,000 | | | United States Treasury Bills | | | 0.00% | ‡ | | | 06/23/2016 | | | | 15,142,895 | |
| | | | | | | | | | | | | | | | |
PRINCIPAL
AMOUNT $ /
SHARES | | | SECURITY DESCRIPTION | | RATE | | | MATURITY | | | VALUE $ | |
| | 4,200,000 | | | United States Treasury Bills | | | 0.00% | | | | 07/21/2016 | | | | 4,196,606 | |
| | 4,500,000 | | | United States Treasury Bills | | | 0.00% | | | | 08/18/2016 | | | | 4,494,253 | |
| | | | | | | | | | | | | | | | |
| | | | Total Short Term Investments
(Cost $29,212,644) | | | | 29,211,418 | |
| | | | | | | | | | | | | | | | |
| | | | Total Investments 99.3%
(Cost $29,212,644) | | | | 29,211,418 | |
| | | | Other Assets in Excess of Liabilities 0.7% | | | | 207,046 | |
| | | | | | | | | | | | | | | | |
| | | | NET ASSETS 100.0% | | | $ | 29,418,464 | |
| | | | | | | | | | | | | | | | |
| | | | |
| SECURITY TYPE BREAKDOWN as a % of Net Assets: | |
Short Term Investments | | | 99.3% | |
Other Assets and Liabilities | | | 0.7% | |
| | | | |
| | | 100.0% | |
| | | | |
| ¨ | Seven-day yield as of March 31, 2016 |
| ‡ | All or a portion of security has been pledged as collateral in connection with swaps. |
| | | | | | | | | | | | | | | | |
| Excess Return Swaps - Long | | | | | | | | | | | |
| Reference Entity | | Counterparty | | Financing
Rate | | Notional
Amount | | | Termination
Date | | | Unrealized
Appreciation
(Depreciation) | |
Commodity Beta Basket Swap g | | Morgan Stanley | | 0.28% | | | 17,600,000 | | | | 04/01/2016 | | | $ | 708,969 | |
Long Commodity Basket Swap j | | Morgan Stanley | | 0.22% | | | 5,800,000 | | | | 04/01/2016 | | | | 110,274 | |
| | | | | | | | | | | | | | | | |
| | | | | | | | | | | | | | $ | 819,243 | |
| | | | | | | | | | | | | | | | |
| Excess Return Swaps - Short | | | | | | | | | | | |
| Reference Entity | | Counterparty | | Financing
Rate | | Notional
Amount | | | Termination
Date | | | Unrealized
Appreciation
(Depreciation) | |
Short Commodity Basket Swap y | | Morgan Stanley | | 0.22% | | | 5,800,000 | | | | 04/01/2016 | | | $ | (375,311 | ) |
| | | | | | | | | | | | | | | | |
| | | | | | | | | | | | | | $ | (375,311 | ) |
| | | | | | | | | | | | | | | | |
| All or a portion of this security is owned by DoubleLine Strategic Commodity Ltd., which is a wholly-owned subsidiary of the DoubleLine Strategic Commodity Fund. |
| g | Commodity Beta Basket Swap represents a swap on a basket of commodity indices designed to approximate the broad commodity market. At March 31, 2016, the constituents and their weightings were as follows: Copper 20.1%, Soybeans 19.6%, Nickel 12.1%, Brent Crude 10.3%, Crude Oil 10.2%, Gas Oil 5.5%, Sugar 5.5%, Unleaded Gasoline 5.1%, Live Cattle 4.8%, Cotton 3.6%, Heating Oil 3.2%. |
| j | Long Commodity Basket Swap represents a swap on a basket of commodity sub-indices of the S&P GSCI index. At March 31, 2016, the constituents and their weightings were as follows: Cotton 20.4%, Copper 20.2%, Zinc 19.9%, Cocoa 19.8%, Gold 19.7%. |
| y | Short Commodity Basket Swap represents a swap on a basket of commodity sub-indices of the S&P GSCI index. At March 31, 2016, the constituents and their weightings were as follows: Gasoline 20.1%, Crude Oil 20.1%, Brent Crude 20.1%, Natural Gas 19.9%, Heating Oil 19.8%. |
| | | | | | |
| The accompanying notes are an integral part of these financial statements. | | Annual Report | | March 31, 2016 | | 89 |
| | |
| Schedule of Investments DoubleLine Global Bond Fund | | March 31, 2016 |
| | | | | | | | | | | | | | | | | | |
PRINCIPAL
AMOUNT | | | | | SECURITY DESCRIPTION | | RATE | | | MATURITY | | | VALUE $ | |
| FOREIGN GOVERNMENT BONDS AND NOTES, SUPRANATIONALS AND
FOREIGN AGENCIES 64.5% |
|
| | |
| | AUSTRALIA 3.4% | |
| | 2,650,000 | | | AUD | | Australia Government Bond | | | 1.75% | | | | 11/21/2020 | | | | 2,004,926 | |
| | 3,200,000 | | | AUD | | Australia Government Bond | | | 3.25% | | | | 04/21/2025 | | | | 2,614,068 | |
| | | | | | | | | | | | | | | | | | |
| | | | | | | | | | | | | | | | | 4,618,994 | |
| | | | | | | | | | | | | | | | | | |
| | BELGIUM 1.7% | |
| | 2,000,000 | | | EUR | | Belgium Government Bond | | | 0.80% | ^ | | | 06/22/2025 | | | | 2,362,365 | |
| | | | | | | | | | | | | | | | | | |
| | | | | | | | | | | | | | | | | 2,362,365 | |
| | | | | | | | | | | | | | | | | | |
| | CANADA 3.6% | |
| | 2,600,000 | | | CAD | | Canadian Government Bond | | | 2.75% | | | | 06/01/2022 | | | | 2,228,483 | |
| | 3,240,000 | | | CAD | | Canadian Government Bond | | | 2.25% | | | | 06/01/2025 | | | | 2,715,001 | |
| | | | | | | | | | | | | | | | | | |
| | | | | | | | | | | | | | | | | 4,943,484 | |
| | | | | | | | | | | | | | | | | | |
| | GERMANY 3.8% | |
| | 4,250,000 | | | EUR | | Bundesrepublik Deutschland | | | 1.00% | | | | 08/15/2025 | | | | 5,242,553 | |
| | | | | | | | | | | | | | | | | | |
| | | | | | | | | | | | | | | | | 5,242,553 | |
| | | | | | | | | | | | | | | | | | |
| | HUNGARY 4.2% | |
| | 990,000,000 | | | HUF | | Hungary Government Bond | | | 3.50% | | | | 06/24/2020 | | | | 3,846,149 | |
| | 425,000,000 | | | HUF | | Hungary Government Bond | | | 5.50% | | | | 06/24/2025 | | | | 1,884,386 | |
| | | | | | | | | | | | | | | | | | |
| | | | | | | | | | | | | | | | | 5,730,535 | |
| | | | | | | | | | | | | | | | | | |
| | IRELAND 4.1% | |
| | 1,500,000 | | | EUR | | Ireland Government Bond | | | 3.90% | | | | 03/20/2023 | | | | 2,125,415 | |
| | 2,175,000 | | | EUR | | Ireland Government Bond | | | 5.40% | | | | 03/13/2025 | | | | 3,492,320 | |
| | | | | | | | | | | | | | | | | | |
| | | | | | | | | | | | | | | | | 5,617,735 | |
| | | | | | | | | | | | | | | | | | |
| | ISRAEL 2.7% | |
| | 7,450,000 | | | ILS | | Israel Government Bond | | | 4.25% | | | | 03/31/2023 | | | | 2,363,373 | |
| | 5,175,000 | | | ILS | | Israel Government Bond | | | 1.75% | | | | 08/31/2025 | | | | 1,380,184 | |
| | | | | | | | | | | | | | | | | | |
| | | | | | | | | | | | | | | | | 3,743,557 | |
| | | | | | | | | | | | | | | | | | |
| | ITALY 3.1% | |
| | 700,000 | | | EUR | | Italy Buoni Poliennali Del Tesoro | | | 0.65% | | | | 11/01/2020 | | | | 809,923 | |
| | 2,850,000 | | | EUR | | Italy Buoni Poliennali Del Tesoro | | | 1.50% | | | | 06/01/2025 | | | | 3,345,839 | |
| | | | | | | | | | | | | | | | | | |
| | | | | | | | | | | | | | | | | 4,155,762 | |
| | | | | | | | | | | | | | | | | | |
| | JAPAN 15.0% | |
| | 350,000,000 | | | JPY | | Japan Government Ten Year Bond | | | 0.60% | | | | 06/20/2024 | | | | 3,301,985 | |
| | 550,000,000 | | | JPY | | Japan Government Ten Year Bond | | | 0.40% | | | | 06/20/2025 | | | | 5,110,482 | |
| | 572,500,000 | | | JPY | | Japan Government Ten Year Bond | | | 0.40% | | | | 09/20/2025 | | | | 5,319,862 | |
| | 290,000,000 | | | JPY | | Japan Government Twenty Year Bond | | | 1.50% | | | | 06/20/2034 | | | | 3,099,067 | |
| | 355,000,000 | | | JPY | | Japan Government Twenty Year Bond | | | 1.20% | | | | 09/20/2035 | | | | 3,613,288 | |
| | | | | | | | | | | | | | | | | | |
| | | | | | | | | | | | | | | | | 20,444,684 | |
| | | | | | | | | | | | | | | | | | |
| | | | | | | | | | | | | | | | | | |
PRINCIPAL
AMOUNT | | | | | SECURITY DESCRIPTION | | RATE | | | MATURITY | | | VALUE $ | |
| | MEXICO 1.6% | |
| | 35,000,000 | | | MXN | | Mexican Bonos | | | 8.00% | | | | 06/11/2020 | | | | 2,239,031 | |
| | | | | | | | | | | | | | | | | | |
| | | | | | | | | | | | | | | | | 2,239,031 | |
| | | | | | | | | | | | | | | | | | |
| | NEW ZEALAND 2.6% | |
| | 4,375,000 | | | NZD | | New Zealand Government Bond | | | 5.50% | | | | 04/15/2023 | | | | 3,601,222 | |
| | | | | | | | | | | | | | | | | | |
| | | | | | | | | | | | | | | | | 3,601,222 | |
| | | | | | | | | | | | | | | | | | |
| | POLAND 4.1% | |
| | 7,150,000 | | | PLN | | Poland Government Bond | | | 1.50% | | | | 04/25/2020 | | | | 1,888,829 | |
| | 13,350,000 | | | PLN | | Poland Government Bond | | | 3.25% | | | | 07/25/2025 | | | | 3,734,332 | |
| | | | | | | | | | | | | | | | | | |
| | | | | | | | | | | | | | | | | 5,623,161 | |
| | | | | | | | | | | | | | | | | | |
| | PORTUGAL 3.2% | |
| | 1,250,000 | | | EUR | | Portugal Obrigacoes do Tesouro | | | 2.20% | ^ | | | 10/17/2022 | | | | 1,418,377 | |
| | 2,525,000 | | | EUR | | Portugal Obrigacoes do Tesouro | | | 2.88% | ^ | | | 10/15/2025 | | | | 2,900,528 | |
| | | | | | | | | | | | | | | | | | |
| | | | | | | | | | | | | | | | | 4,318,905 | |
| | | | | | | | | | | | | | | | | | |
| | ROMANIA 1.8% | |
| | 9,000,000 | | | RON | | Romania Government Bond | | | 4.75% | | | | 06/24/2019 | | | | 2,504,345 | |
| | | | | | | | | | | | | | | | | | |
| | | | | | | | | | | | | | | | | 2,504,345 | |
| | | | | | | | | | | | | | | | | | |
| | SPAIN 3.3% | |
| | 625,000 | | | EUR | | Spain Government Bond | | | 5.85% | ^ | | | 01/31/2022 | | | | 924,842 | |
| | 2,800,000 | | | EUR | | Spain Government Bond | | | 2.75% | ^ | | | 10/31/2024 | | | | 3,571,871 | |
| | | | | | | | | | | | | | | | | | |
| | | | | | | | | | | | | | | | | 4,496,713 | |
| | | | | | | | | | | | | | | | | | |
| | UNITED KINGDOM 6.3% | |
| | 1,800,000 | | | GBP | | United Kingdom Gilt | | | 1.25% | | | | 07/22/2018 | | | | 2,633,567 | |
| | 3,900,000 | | | GBP | | United Kingdom Gilt | | | 2.00% | | | | 07/22/2020 | | | | 5,899,118 | |
| | | | | | | | | | | | | | | | | | |
| | | | | | | | | | | | | | | | | 8,532,685 | |
| | | | | | | | | | | | | | | | | | |
| | | | | | Total Foreign Government Bonds and Notes, Supranationals and Foreign Agencies
(Cost $84,180,053) | | | | 88,175,731 | |
| | | | | | | | | | | | | | | | | | |
| | US GOVERNMENT BONDS AND NOTES 31.5% | |
| | |
| | UNITED STATES 31.5% | |
| | 3,500,000 | | | USD | | United States Treasury Notes | | | 1.38% | | | | 04/30/2020 | | | | 3,537,734 | |
| | 3,500,000 | | | USD | | United States Treasury Notes | | | 1.63% | | | | 06/30/2020 | | | | 3,571,232 | |
| | 3,500,000 | | | USD | | United States Treasury Notes | | | 1.75% | | | | 04/30/2022 | | | | 3,562,685 | |
| | 12,500,000 | | | USD | | United States Treasury Notes | | | 1.88% | | | | 08/31/2022 | | | | 12,796,625 | |
| | 4,000,000 | | | USD | | United States Treasury Notes | | | 2.00% | | | | 11/30/2022 | | | | 4,123,360 | |
| | 2,500,000 | | | USD | | United States Treasury Notes | | | 2.38% | | | | 08/15/2024 | | | | 2,634,425 | |
| | 12,500,000 | | | USD | | United States Treasury Notes | | | 2.00% | | | | 02/15/2025 | | | | 12,775,637 | |
| | | | | | | | | | | | | | | | | | |
| | | | | | Total US Government Bonds and Notes
(Cost $41,948,846) | | | | 43,001,698 | |
| | | | | | | | | | | | | | | | | | |
| | | | | | |
| 90 | | DoubleLine Funds Trust | | | | The accompanying notes are an integral part of these financial statements. |
| | | | | | | | | | | | | | | | |
| SHARES | | | | | SECURITY DESCRIPTION | | RATE | | | MATURITY | | VALUE $ | |
| | SHORT TERM INVESTMENTS 3.5% | |
| | 1,577,463 | | | | | BlackRock Liquidity Funds
FedFund - Institutional Shares | | | 0.24% | ¨ | | | | | 1,577,463 | |
| | 1,577,464 | | | | | Fidelity Institutional Money Market Government Portfolio - Class I | | | 0.23% | ¨ | | | | | 1,577,464 | |
| | 1,577,463 | | | | | Morgan Stanley Institutional Liquidity Funds Government Portfolio - Institutional Share Class | | | 0.25% | ¨ | | | | | 1,577,463 | |
| | | | | | | | | | | | | | | | |
| | | | | | Total Short Term Investments
(Cost $4,732,390) | | | | | | 4,732,390 | |
| | | | | | | | | | | | | | | | |
| | | | | | Total Investments 99.5%
(Cost $130,861,289) | | | | | | 135,909,819 | |
| | | | | | Other Assets in Excess of Liabilities 0.5% | | | | | | 658,333 | |
| | | | | | | | | | | | | | | | |
| | | | | | NET ASSETS 100.0% | | | | | $ | 136,568,152 | |
| | | | | | | | | | | | | | | | |
| | | | |
| SECURITY TYPE BREAKDOWN as a % of Net Assets: | |
Foreign Government Bonds and Notes, Supranationals and Foreign Agencies | | | 64.5% | |
US Government Bonds and Notes | | | 31.5% | |
Short Term Investments | | | 3.5% | |
Other Assets and Liabilities | | | 0.5% | |
| | | | |
| | | 100.0% | |
| | | | |
| COUNTRY BREAKDOWN as a % of Net Assets: | |
United States | | | 35.0% | |
Japan | | | 15.0% | |
United Kingdom | | | 6.3% | |
Hungary | | | 4.2% | |
Poland | | | 4.1% | |
Ireland | | | 4.1% | |
Germany | | | 3.8% | |
Canada | | | 3.6% | |
Australia | | | 3.4% | |
Spain | | | 3.3% | |
Portugal | | | 3.2% | |
Italy | | | 3.1% | |
Israel | | | 2.7% | |
New Zealand | | | 2.6% | |
Romania | | | 1.8% | |
Belgium | | | 1.7% | |
Mexico | | | 1.6% | |
Other Assets and Liabilities | | | 0.5% | |
| | | | |
| | | 100.0% | |
| | | | |
| ^ | Security exempt from registration under Rule 144A of the Securities Act of 1933. These securities may be resold in transactions exempt from registration to qualified institutional buyers. These securities are determined to be liquid by the Adviser, unless otherwise noted, under procedures established by the Fund’s Board of Trustees. At March 31, 2016, the value of these securities amounted to $11,177,983 or 8.2% of net assets. |
| ¨ | Seven-day yield as of March 31, 2016 |
| | | | | | |
| The accompanying notes are an integral part of these financial statements. | | Annual Report | | March 31, 2016 | | 91 |
| | |
| Statements of Assets and Liabilities | | March 31, 2016 |
| | | | | | | | | | | | | | | | | | | | | | | | |
| | | DoubleLine
Total Return
Bond Fund | | | DoubleLine
Core Fixed
Income Fund | | | DoubleLine
Emerging Markets
Fixed Income Fund | | | DoubleLine
Multi-Asset
Growth Fund
(Consolidated) | | | DoubleLine
Low Duration
Bond Fund | | | DoubleLine
Floating
Rate Fund | |
| | | | | | |
ASSETS | | | | | | | | | | | | | | | | | | | | | | | | |
Investments in Unaffiliated Securities, at Value* | | $ | 50,598,353,258 | | | $ | 5,466,219,491 | | | $ | 732,220,953 | | | $ | 54,765,496 | | | $ | 2,720,376,729 | | | $ | 264,642,278 | |
Investments in Affiliated Securities, at Value* | | | — | | | | 137,656,164 | | | | — | | | | 37,138,819 | | | | 47,950,000 | | | | — | |
Short Term Investments* | | | 6,949,575,305 | | | | 308,501,997 | | | | 471 | | | | 57,219,814 | | | | 59,350,966 | | | | 40,848,297 | |
Foreign Currency, at Value* | | | — | | | | — | | | | — | | | | 33,624 | | | | — | | | | — | |
Receivable for Fund Shares Sold | | | 282,902,268 | | | | 36,632,155 | | | | 3,825,395 | | | | 589,017 | | | | 7,692,366 | | | | 703,419 | |
Interest and Dividends Receivable | | | 183,971,301 | | | | 35,914,420 | | | | 11,925,353 | | | | 531,708 | | | | 13,789,159 | | | | 2,170,185 | |
Prepaid Expenses and Other Assets | | | 675,295 | | | | 159,773 | | | | 98,100 | | | | 28,096 | | | | 63,961 | | | | 34,315 | |
Receivable for Investments Sold | | | — | | | | 188,853,833 | | | | 10,631,578 | | | | 1,186,748 | | | | 68,255,858 | | | | 13,576,742 | |
Cash | | | — | | | | — | | | | — | | | | 3,280,000 | | | | — | | | | — | |
Deposit at Broker for Futures | | | — | | | | — | | | | — | | | | 2,546,281 | | | | — | | | | — | |
Unrealized Appreciation on Forward Currency Exchange Contracts | | | — | | | | — | | | | — | | | | 126,323 | | | | — | | | | — | |
Total Assets | | | 58,015,477,427 | | | | 6,173,937,833 | | | | 758,701,850 | | | | 157,445,926 | | | | 2,917,479,039 | | | | 321,975,236 | |
| | | | | | |
LIABILITIES | | | | | | | | | | | | | | | | | | | | | | | | |
Payable for Fund Shares Redeemed | | | 67,914,763 | | | | 6,509,807 | | | | 1,927,403 | | | | 118,375 | | | | 4,132,520 | | | | 431,875 | |
Distribution Payable | | | 55,766,657 | | | | 4,328,841 | | | | 579,754 | | | | 747,054 | | | | 1,407,550 | | | | 402,629 | |
Payable for Investments Purchased | | | 29,908,872 | | | | 93,168,283 | | | | 4,636,321 | | | | 108,144 | | | | 25,073,164 | | | | 18,972,476 | |
Investment Advisory Fees Payable | | | 19,205,135 | | | | 1,933,174 | | | | 466,791 | | | | 114,157 | | | | 830,755 | | | | 127,905 | |
Transfer Agent Expenses Payable | | | 3,362,446 | | | | 82,207 | | | | 51,228 | | | | 32,899 | | | | 144,801 | | | | 6,697 | |
Distribution Fees Payable | | | 2,615,397 | | | | 197,313 | | | | 39,155 | | | | 26,756 | | | | 329,818 | | | | 18,953 | |
Administration, Fund Accounting and Custodian Fees Payable | | | 1,295,258 | | | | 157,225 | | | | 22,072 | | | | 11,375 | | | | 125,428 | | | | 31,827 | |
Registration Fees Payable | | | 1,188,072 | | | | 115,140 | | | | 17,389 | | | | 2,515 | | | | 66,778 | | | | 23,540 | |
Accrued Expenses | | | 822,838 | | | | 77,858 | | | | 29,315 | | | | 9,239 | | | | 54,292 | | | | 18,705 | |
Professional Fees Payable | | | 349,967 | | | | 112,773 | | | | 91,534 | | | | 61,328 | | | | 68,082 | | | | 47,569 | |
Loans Payable | | | — | | | | — | | | | 1,330,000 | | | | — | | | | — | | | | — | |
Written Option Contracts, at Value
(Premiums received $279,800) | | | — | | | | — | | | | — | | | | 179,000 | | | | — | | | | — | |
Unrealized Depreciation on Forward Currency Exchange Contracts | | | — | | | | — | | | | — | | | | 37,205 | | | | — | | | | — | |
Variation Margin Payable | | | — | | | | — | | | | — | | | | 116,884 | | | | — | | | | — | |
Total Liabilities | | | 182,429,405 | | | | 106,682,621 | | | | 9,190,962 | | | | 1,564,931 | | | | 32,233,188 | | | | 20,082,176 | |
Net Assets | | $ | 57,833,048,022 | | | $ | 6,067,255,212 | | | $ | 749,510,888 | | | $ | 155,880,995 | | | $ | 2,885,245,851 | | | $ | 301,893,060 | |
| | | | | | |
NET ASSETS CONSIST OF: | | | | | | | | | | | | | | | | | | | | | | | | |
Paid-in Capital | | $ | 59,143,496,686 | | | $ | 6,114,286,867 | | | $ | 857,252,153 | | | $ | 166,980,592 | | | $ | 2,929,899,297 | | | $ | 313,102,946 | |
Undistributed (Accumulated) Net Investment Income (Loss) | | | 5,390,358 | | | | 50,261 | | | | (426,856 | ) | | | 123,468 | | | | (479,167 | ) | | | 58,346 | |
Accumulated Net Realized Gain (Loss) on Investments | | | (1,806,556,739 | ) | | | (55,018,552 | ) | | | (20,799,092 | ) | | | (7,404,721 | ) | | | (15,202,827 | ) | | | (9,871,100 | ) |
Net Unrealized Appreciation (Depreciation) on: | | | | | | | | | | | | | | | | | | | | | | | | |
Investments in Unaffiliated Securities | | | 488,893,746 | | | | 1,780,472 | | | | (86,515,317 | ) | | | (3,039,648 | ) | | | (26,921,452 | ) | | | (1,397,132 | ) |
Investments in Affiliated Securities | | | — | | | | 6,156,164 | | | | — | | | | (1,159,033 | ) | | | (2,050,000 | ) | | | — | |
Short Term Investments | | | 1,823,971 | | | | — | | | | — | | | | — | | | | — | | | | — | |
Foreign Currency | | | — | | | | — | | | | — | | | | 190 | | | | — | | | | — | |
Forwards | | | — | | | | — | | | | — | | | | 89,118 | | | | — | | | | — | |
Futures | | | — | | | | — | | | | — | | | | 190,229 | | | | — | | | | — | |
Swaps | | | — | | | | — | | | | — | | | | — | | | | — | | | | — | |
Written Options | | | — | | | | — | | | | — | | | | 100,800 | | | | — | | | | — | |
Net Assets | | $ | 57,833,048,022 | | | $ | 6,067,255,212 | | | $ | 749,510,888 | | | $ | 155,880,995 | | | $ | 2,885,245,851 | | | $ | 301,893,060 | |
| | | | | | |
*Identified Cost: | | | | | | | | | | | | | | | | | | | | | | | | |
Investments in Unaffiliated Securities | | $ | 50,109,459,512 | | | $ | 5,464,439,019 | | | $ | 818,736,270 | | | $ | 57,805,144 | | | $ | 2,747,298,181 | | | $ | 266,039,410 | |
Investments in Affiliated Securities | | | — | | | | 131,500,000 | | | | — | | | | 38,297,852 | | | | 50,000,000 | | | | — | |
Short Term Investments | | | 6,947,751,334 | | | | 308,501,997 | | | | 471 | | | | 57,219,814 | | | | 59,350,966 | | | | 40,848,297 | |
Foreign Currency | | | — | | | | — | | | | — | | | | 33,434 | | | | — | | | | — | |
| | | | | | |
Class I (unlimited shares authorized): | | | | | | | | | | | | | | | | | | | | | | | | |
Net Assets | | $ | 46,082,293,549 | | | $ | 5,114,336,092 | | | $ | 548,221,357 | | | $ | 42,074,571 | | | $ | 1,722,942,481 | | | $ | 229,612,207 | |
Shares Outstanding | | | 4,238,682,263 | | | | 470,454,842 | | | | 56,626,876 | | | | 4,752,246 | | | | 172,405,594 | | | | 23,510,081 | |
Net Asset Value, Offering and Redemption Price per Share | | $ | 10.87 | | | $ | 10.87 | | | $ | 9.68 | | | $ | 8.85 | | | $ | 9.99 | | | $ | 9.77 | |
| | | | | | |
Class N (unlimited shares authorized): | | | | | | | | | | | | | | | | | | | | | | | | |
Net Assets | | $ | 11,750,754,473 | | | $ | 952,919,120 | | | $ | 201,289,531 | | | $ | — | | | $ | 1,162,303,370 | | | $ | 72,280,853 | |
Shares Outstanding | | | 1,081,312,824 | | | | 87,716,401 | | | | 20,790,622 | | | | — | | | | 116,387,414 | | | | 7,385,580 | |
Net Asset Value, Offering and Redemption Price per Share | | $ | 10.87 | | | $ | 10.86 | | | $ | 9.68 | | | $ | — | | | $ | 9.99 | | | $ | 9.79 | |
| | | | | | |
Class A (unlimited shares authorized): | | | | | | | | | | | | | | | | | | | | | | | | |
Net Assets | | $ | — | | | $ | — | | | $ | — | | | $ | 113,806,424 | | | $ | — | | | $ | — | |
Shares Outstanding | | | — | | | | — | | | | — | | | | 12,889,262 | | | | — | | | | — | |
Net Asset Value, Offering Price per Share | | $ | — | | | $ | — | | | $ | — | | | $ | 9.21 | | | $ | — | | | $ | — | |
Net Asset Value, Redemption Price per Share | | $ | — | | | $ | — | | | $ | — | | | $ | 8.83 | | | $ | — | | | $ | — | |
| | | | | | |
| 92 | | DoubleLine Funds Trust | | | | The accompanying notes are an integral part of these financial statements. |
| | | | | | | | | | | | | | | | | | | | | | | | |
| | | DoubleLine
Shiller
Enhanced
CAPE® | | | DoubleLine
Flexible
Income Fund | | | DoubleLine
Low Duration
Emerging
Markets Fixed
Income Fund | | | DoubleLine
Long Duration
Total Return
Bond Fund | | | DoubleLine
Strategic
Commodity
Fund
(Consolidated) | | | DoubleLine
Global
Bond Fund | |
| | | | | | |
ASSETS | | | | | | | | | | | | | | | | | | | | | | | | |
Investments in Unaffiliated Securities, at Value* | | $ | 764,503,108 | | | $ | 184,704,461 | | | $ | 181,061,078 | | | $ | 76,613,094 | | | $ | — | | | $ | 131,177,429 | |
Investments in Affiliated Securities, at Value* | | | — | | | | 21,755,488 | | | | — | | | | — | | | | — | | | | — | |
Short Term Investments* | | | 45,026,142 | | | | 5,694,591 | | | | 1,061,164 | | | | 5,889,472 | | | | 29,211,418 | | | | 4,732,390 | |
Foreign Currency, at Value* | | | — | | | | — | | | | — | | | | — | | | | — | | | | 386,018 | |
Unrealized Appreciation on Swaps | | | 45,566,002 | | | | — | | | | — | | | | — | | | | 443,932 | | | | — | |
Receivable for Fund Shares Sold | | | 8,450,461 | | | | 1,106,024 | | | | 1,609,738 | | | | 88,521 | | | | 8,308 | | | | 385,274 | |
Receivable for Investments Sold | | | 7,593,702 | | | | 9,908,721 | | | | 602,639 | | | | — | | | | — | | | | — | |
Interest and Dividends Receivable | | | 4,119,190 | | | | 1,473,137 | | | | 2,230,721 | | | | 307,255 | | | | 216 | | | | 937,267 | |
Prepaid Expenses and Other Assets | | | 51,529 | | | | 54,483 | | | | 28,227 | | | | 17,397 | | | | 854 | | | | 1,371 | |
Due from Advisor | | | — | | | | — | | | | — | | | | — | | | | 16,245 | | | | — | |
Total Assets | | | 875,310,134 | | | | 224,696,905 | | | | 186,593,567 | | | | 82,915,739 | | | | 29,680,973 | | | | 137,619,749 | |
| | | | | | |
LIABILITIES | | | | | | | | | | | | | | | | | | | | | | | | |
Payable for Investments Purchased | | | 13,368,182 | | | | 469,779 | �� | | | 528,767 | | | | — | | | | — | | | | 786,356 | |
Payable for Fund Shares Redeemed | | | 758,046 | | | | 325,404 | | | | 127,905 | | | | 50,542 | | | | — | | | | 14,826 | |
Investment Advisory Fees Payable | | | 325,736 | | | | 100,094 | | | | 38,260 | | | | 26,055 | | | | — | | | | 27,096 | |
Distribution Payable | | | 307,457 | | | | 241,604 | | | | 207,775 | | | | 143,267 | | | | — | | | | 59,257 | |
Transfer Agent Expenses Payable | | | 97,650 | | | | 28,097 | | | | 26,206 | | | | 22,545 | | | | 28,343 | | | | 22,070 | |
Professional Fees Payable | | | 59,168 | | | | 26,822 | | | | 15,668 | | | | 41,212 | | | | 193,924 | | | | 37,913 | |
Administration, Fund Accounting and Custodian Fees Payable | | | 41,023 | | | | 16,278 | | | | 10,315 | | | | 7,072 | | | | 3,582 | | | | 21,747 | |
Distribution Fees Payable | | | 35,104 | | | | 13,262 | | | | 22,836 | | | | 5,323 | | | | 475 | | | | 7,423 | |
Registration Fees Payable | | | 15,807 | | | | 4,087 | | | | 3,456 | | | | 1,706 | | | | 492 | | | | 9,095 | |
Accrued Expenses | | | 8,919 | | | | 1,711 | | | | 13,261 | | | | 12,261 | | | | 35,693 | | | | 10,007 | |
Due to Custodian | | | — | | | | — | | | | — | | | | — | | | | — | | | | 55,807 | |
Total Liabilities | | | 15,017,092 | | | | 1,227,138 | | | | 994,449 | | | | 309,983 | | | | 262,509 | | | | 1,051,597 | |
Net Assets | | $ | 860,293,042 | | | $ | 223,469,767 | | | $ | 185,599,118 | | | $ | 82,605,756 | | | $ | 29,418,464 | | | $ | 136,568,152 | |
| | | | | | |
NET ASSETS CONSIST OF: | | | | | | | | | | | | | | | | | | | | | | | | |
Paid-in Capital | | $ | 823,542,547 | | | $ | 234,529,349 | | | $ | 194,214,336 | | | $ | 80,307,520 | | | $ | 28,795,624 | | | $ | 131,101,446 | |
Undistributed (Accumulated) Net Investment Income (Loss) | | | (20,613 | ) | | | 1,237 | | | | (161,981 | ) | | | 7,061 | | | | 180,134 | | | | 159,508 | |
Accumulated Net Realized Gain (Loss) on Investments | | | 1,069,129 | | | | (2,470,422 | ) | | | (140,976 | ) | | | (966,679 | ) | | | — | | | | 223,660 | |
Net Unrealized Appreciation (Depreciation) on: | | | | | | | | | | | | | | | | | | | | | | | | |
Investments in Unaffiliated Securities | | | (9,864,023 | ) | | | (7,805,498 | ) | | | (8,312,261 | ) | | | 3,257,854 | | | | — | | | | 5,048,530 | |
Investments in Affiliated Securities | | | — | | | | (784,899 | ) | | | — | | | | — | | | | — | | | | — | |
Short Term Investments | | | — | | | | — | | | | — | | | | — | | | | (1,226 | ) | | | — | |
Foreign Currency | | | — | | | | — | | | | — | | | | — | | | | — | | | | 4,310 | |
Swaps | | | 45,566,002 | | | | — | | | | — | | | | — | | | | 443,932 | | | | — | |
Translation of Other Assets and Liabilities Denominated in Foreign Currency | | | — | | | | — | | | | — | | | | — | | | | — | | | | 30,698 | |
Net Assets | | $ | 860,293,042 | | | $ | 223,469,767 | | | $ | 185,599,118 | | | $ | 82,605,756 | | | $ | 29,418,464 | | | $ | 136,568,152 | |
| | | | | | |
*Identified Cost: | | | | | | | | | | | | | | | | | | | | | | | | |
Investments in Unaffiliated Securities | | $ | 774,367,131 | | | $ | 192,509,959 | | | $ | 189,373,339 | | | $ | 73,355,240 | | | $ | — | | | $ | 126,128,899 | |
Investments in Affiliated Securities | | | — | | | | 22,540,387 | | | | — | | | | — | | | | — | | | | — | |
Short Term Investments | | | 45,026,142 | | | | 5,694,591 | | | | 1,061,164 | | | | 5,889,472 | | | | 29,212,644 | | | | 4,732,390 | |
Foreign Currency | | | — | | | | — | | | | — | | | | — | | | | — | | | | 381,708 | |
| | | | | | |
Class I (unlimited shares authorized): | | | | | | | | | | | | | | | | | | | | | | | | |
Net Assets | | $ | 673,308,064 | | | $ | 160,590,237 | | | $ | 66,797,269 | | | $ | 56,843,135 | | | $ | 27,997,005 | | | $ | 94,631,148 | |
Shares Outstanding | | | 54,651,069 | | | | 16,813,722 | | | | 6,963,809 | | | | 5,466,268 | | | | 3,221,666 | | | | 9,017,236 | |
Net Asset Value, Offering and Redemption Price per Share | | $ | 12.32 | | | $ | 9.55 | | | $ | 9.59 | | | $ | 10.40 | | | $ | 8.69 | | | $ | 10.49 | |
| | | | | | |
Class N (unlimited shares authorized): | | | | | | | | | | | | | | | | | | | | | | | | |
Net Assets | | $ | 186,984,978 | | | $ | 62,879,530 | | | $ | 118,801,849 | | | $ | 25,762,621 | | | $ | 1,421,459 | | | $ | 41,937,004 | |
Shares Outstanding | | | 15,186,518 | | | | 6,585,366 | | | | 12,375,903 | | | | 2,479,231 | | | | 163,936 | | | | 3,996,645 | |
Net Asset Value, Offering and Redemption Price per Share | | $ | 12.31 | | | $ | 9.55 | | | $ | 9.60 | | | $ | 10.39 | | | $ | 8.67 | | | $ | 10.49 | |
| | | | | | |
| The accompanying notes are an integral part of these financial statements. | | Annual Report | | March 31, 2016 | | 93 |
| | |
| Statements of Operations | | For the Period Ended March 31, 2016 |
| | | | | | | | | | | | | | | | | | | | | | | | |
| | | DoubleLine
Total Return
Bond Fund | | | DoubleLine
Core Fixed
Income Fund | | | DoubleLine
Emerging Markets
Fixed Income Fund | | | DoubleLine
Multi-Asset
Growth Fund
(Consolidated) | | | DoubleLine
Low Duration
Bond Fund | | | DoubleLine
Floating
Rate Fund | |
| | | | | | |
INVESTMENT INCOME | | | | | | | | | | | | | | | | | | | | | | | | |
Income: | | | | | | | | | | | | | | | | | | | | | | | | |
Interest | | $ | 1,873,257,632 | | | $ | 171,561,279 | | | $ | 51,148,579 | | | $ | 2,506,418 | | | $ | 69,852,183 | | | $ | 14,366,358 | |
Dividends from Unaffiliated Securities | | | — | | | | — | | | | — | | | | 1,310,363 | | | | — | | | | — | |
Dividends from Affiliated Securities | | | — | | | | 2,739,626 | | | | — | | | | 1,480,940 | | | | 1,712,019 | | | | — | |
Total Investment Income | | | 1,873,257,632 | | | | 174,300,905 | | | | 51,148,579 | | | | 5,297,721 | | | | 71,564,202 | | | | 14,366,358 | |
Expenses: | | | | | | | | | | | | | | | | | | | | | | | | |
Investment Advisory Fees | | | 199,523,197 | | | | 19,216,037 | | | | 6,595,062 | | | | 1,403,092 | | | | 9,188,763 | | | | 1,652,257 | |
Distribution Fees - Class N | | | 25,222,143 | | | | 1,894,171 | | | | 577,609 | | | | — | | | | 2,882,085 | | | | 163,397 | |
Distribution Fees - Class A | | | — | | | | — | | | | — | | | | 245,458 | | | | — | | | | — | |
Transfer Agent Expenses | | | 20,806,972 | | | | 1,468,772 | | | | 736,993 | | | | 118,573 | | | | 1,058,323 | | | | 157,794 | |
Administration, Fund Accounting and Custodian Fees | | | 7,399,337 | | | | 947,355 | | | | 166,478 | | | | 54,726 | | | | 586,342 | | | | 132,907 | |
Registration Fees | | | 2,569,724 | | | | 247,107 | | | | 147,249 | | | | 65,616 | | | | 212,117 | | | | 55,011 | |
Shareholder Reporting Expenses | | | 1,613,886 | | | | 176,756 | | | | 72,630 | | | | 3,801 | | | | 75,466 | | | | 13,082 | |
Professional Fees | | | 984,038 | | | | 200,035 | | | | 130,087 | | | | 92,337 | | | | 103,896 | | | | 69,068 | |
Insurance Expenses | | | 733,677 | | | | 68,071 | | | | 15,964 | | | | 4,047 | | | | 47,106 | | | | 9,868 | |
Trustees’ Fees | | | 565,266 | | | | 53,812 | | | | 11,023 | | | | 1,417 | | | | 30,022 | | | | 3,693 | |
Miscellaneous Expenses | | | 342,946 | | | | 25,216 | | | | 24,899 | | | | 7,550 | | | | 19,327 | | | | 54,661 | |
Total Expenses | | | 259,761,186 | | | | 24,297,332 | | | | 8,477,994 | | | | 1,996,617 | | | | 14,203,447 | | | | 2,311,738 | |
Less: Investment Advisory Fees (Waived) | | | — | | | | (507,986 | ) | | | — | | | | (180,083 | ) | | | (242,692 | ) | | | — | |
Less: Fees (Reimbursed)/Recouped | | | — | | | | 203,659 | | | | — | | | | (68,149 | ) | | | 228,850 | | | | — | |
Net Expenses | | | 259,761,186 | | | | 23,993,005 | | | | 8,477,994 | | | | 1,748,385 | | | | 14,189,605 | | | | 2,311,738 | |
| | | | | | |
Net Investment Income (Loss) | | | 1,613,496,446 | | | | 150,307,900 | | | | 42,670,585 | | | | 3,549,336 | | | | 57,374,597 | | | | 12,054,620 | |
| | | | | | |
REALIZED & UNREALIZED GAIN (LOSS) ON INVESTMENTS | | | | | | | | | | | | | | | | | | | | | | | | |
Net Realized Gain (Loss) on: | | | | | | | | | | | | | | | | | | | | | | | | |
Investments in Unaffiliated Securities | | | (9,092,364 | ) | | | (16,515,219 | ) | | | (144,365 | ) | | | (964,426 | ) | | | (2,621,104 | ) | | | (8,862,940 | ) |
Investments in Affiliated Securities | | | — | | | | 481,640 | | | | — | | | | (936,455 | ) | | | — | | | | — | |
Foreign Currency | | | — | | | | — | | | | — | | | | (5,581 | ) | | | — | | | | — | |
Forwards | | | — | | | | — | | | | — | | | | (971,121 | ) | | | — | | | | — | |
Futures | | | — | | | | — | | | | — | | | | (4,089,817 | ) | | | — | | | | — | |
Swaps | | | — | | | | — | | | | — | | | | 2,012,261 | | | | — | | | | — | |
Net Change in Unrealized Appreciation (Depreciation) on: | | | | | | | | | | | | | | | | | | | | | | | | |
Investments in Unaffiliated Securities | | | (388,865,347 | ) | | | (53,886,864 | ) | | | (63,306,418 | ) | | | (5,123,139 | ) | | | (28,263,795 | ) | | | (3,455,753 | ) |
Investments in Affiliated Securities | | | — | | | | 2,936,663 | | | | — | | | | (438,683 | ) | | | (1,200,000 | ) | | | — | |
Short Term Investments | | | 1,564,652 | | | | — | | | | — | | | | 12 | | | | — | | | | — | |
Foreign Currency | | | — | | | | — | | | | — | | | | 190 | | | | — | | | | — | |
Forwards | | | — | | | | — | | | | — | | | | 335,340 | | | | — | | | | — | |
Futures | | | — | | | | — | | | | — | | | | 52,555 | | | | — | | | | — | |
Swaps | | | — | | | | — | | | | — | | | | 434,821 | | | | — | | | | — | |
Written Options | | | — | | | | — | | | | — | | | | 100,800 | | | | — | | | | — | |
Net Realized and Unrealized Gain (Loss) on Investments | | | (396,393,059 | ) | | | (66,983,780 | ) | | | (63,450,783 | ) | | | (9,593,243 | ) | | | (32,084,899 | ) | | | (12,318,693 | ) |
| | | | | | |
NET INCREASE (DECREASE) IN NET ASSETS RESULTING FROM OPERATIONS | | $ | 1,217,103,387 | | | $ | 83,324,120 | | | $ | (20,780,198 | ) | | $ | (6,043,907 | ) | | $ | 25,289,698 | | | $ | (264,073 | ) |
| | | | | | |
| 94 | | DoubleLine Funds Trust | | | | The accompanying notes are an integral part of these financial statements. |
| | |
| | | For the Period Ended March 31, 2016 |
| | | | | | | | | | | | | | | | | | | | | | | | |
| | | DoubleLine
Shiller
Enhanced
CAPE® | | | DoubleLine
Flexible
Income Fund | | | DoubleLine
Low Duration
Emerging
Markets Fixed
Income Fund | | | DoubleLine
Long Duration
Total Return
Bond Fund | | | DoubleLine
Strategic
Commodity
Fund
(Consolidated)1 | | | DoubleLine
Global
Bond Fund2 | |
| | | | | | |
INVESTMENT INCOME | | | | | | | | | | | | | | | | | | | | | | | | |
Income: | | | | | | | | | | | | | | | | | | | | | | | | |
Interest | | $ | 18,922,606 | | | $ | 7,813,670 | | | $ | 6,994,846 | | | $ | 2,564,422 | | | $ | 30,923 | | | $ | 364,735 | |
Dividends from Affiliated Securities | | | — | | | | 711,817 | | | | — | | | | — | | | | — | | | | — | |
Foreign Taxes Withheld | | | — | | | | — | | | | — | | | | — | | | | — | | | | 1,257 | |
Total Investment Income | | | 18,922,606 | | | | 8,525,487 | | | | 6,994,846 | | | | 2,564,422 | | | | 30,923 | | | | 365,992 | |
Expenses: | | | | | | | | | | | | | | | | | | | | | | | | |
Investment Advisory Fees | | | 2,589,754 | | | | 1,170,231 | | | | 865,743 | | | | 365,229 | | | | 140,282 | | | | 120,090 | |
Transfer Agent Expenses | | | 430,173 | | | | 170,531 | | | | 355,716 | | | | 91,173 | | | | 71,636 | | | | 30,490 | |
Distribution Fees - Class N | | | 291,350 | | | | 129,331 | | | | 255,106 | | | | 47,503 | | | | 1,232 | | | | 8,783 | |
Administration, Fund Accounting and Custodian Fees | | | 257,492 | | | | 128,816 | | | | 52,753 | | | | 15,472 | | | | 5,978 | | | | 30,929 | |
Professional Fees | | | 147,241 | | | | 55,016 | | | | 49,711 | | | | 39,434 | | | | 362,327 | | | | 52,868 | |
Registration Fees | | | 112,081 | | | | 83,965 | | | | 72,936 | | | | 80,390 | | | | 86,887 | | | | 21,683 | |
Miscellaneous Expenses | | | 48,864 | | | | 6,693 | | | | 16,571 | | | | 5,313 | | | | 17,072 | | | | 8,464 | |
Shareholder Reporting Expenses | | | 34,838 | | | | 11,593 | | | | 34,502 | | | | 9,134 | | | | 34,738 | | | | 35,786 | |
Insurance Expenses | | | 8,325 | | | | 2,706 | | | | 3,940 | | | | 2,571 | | | | 88 | | | | 84 | |
Trustees’ Fees | | | 5,850 | | | | 2,289 | | | | 2,185 | | | | 932 | | | | 566 | | | | 375 | |
Total Expenses | | | 3,925,968 | | | | 1,761,171 | | | | 1,709,163 | | | | 657,151 | | | | 720,806 | | | | 309,552 | |
Less: Investment Advisory Fees (Waived) | | | — | | | | (92,489 | ) | | | — | | | | — | | | | — | | | | — | |
Less: Fees (Reimbursed)/Recouped | | | (22,516 | ) | | | (84,116 | ) | | | (432,477 | ) | | | (134,851 | ) | | | (526,045 | ) | | | (132,643 | ) |
Net Expenses | | | 3,903,452 | | | | 1,584,566 | | | | 1,276,686 | | | | 522,300 | | | | 194,761 | | | | 176,909 | |
| | | | | | |
Net Investment Income (Loss) | | | 15,019,154 | | | | 6,940,921 | | | | 5,718,160 | | | | 2,042,122 | | | | (163,838 | ) | | | 189,083 | |
| | | | | | |
REALIZED & UNREALIZED GAIN (LOSS) ON INVESTMENTS | | | | | | | | | | | | | | | | | | | | | | | | |
Net Realized Gain (Loss) on: | | | | | | | | | | | | | | | | | | | | | | | | |
Investments in Unaffiliated Securities | | | (2,579,272 | ) | | | (1,326,954 | ) | | | 167,007 | | | | (929,778 | ) | | | 9,065 | | | | 223,660 | |
Foreign Currency | | | — | | | | — | | | | — | | | | — | | | | — | | | | 167,690 | |
Swaps | | | 8,923,418 | | | | — | | | | — | | | | — | | | | (534,982 | ) | | | — | |
Net Change in Unrealized Appreciation (Depreciation) on: | | | | | | | | | | | | | | | | | | | | | | | | |
Investments in Unaffiliated Securities | | | (10,145,025 | ) | | | (7,261,825 | ) | | | (5,014,819 | ) | | | 1,032,041 | | | | — | | | | 5,048,530 | |
Investments in Affiliated Securities | | | — | | | | (819,845 | ) | | | — | | | | — | | | | — | | | | — | |
Short Term Investments | | | — | | | | — | | | | — | | | | — | | | | (1,226 | ) | | | — | |
Foreign Currency | | | — | | | | — | | | | — | | | | — | | | | — | | | | 4,310 | |
Swaps | | | 34,931,709 | | | | — | | | | — | | | | — | | | | 443,932 | | | | — | |
Translation of Other Assets and Liabilities Denominated in Foreign Currency | | | — | | | | — | | | | — | | | | — | | | | — | | | | 30,698 | |
Net Realized and Unrealized Gain (Loss) on Investments | | | 31,130,830 | | | | (9,408,624 | ) | | | (4,847,812 | ) | | | 102,263 | | | | (83,211 | ) | | | 5,474,888 | |
| | | | | | |
NET INCREASE (DECREASE) IN NET ASSETS RESULTING FROM OPERATIONS | | $ | 46,149,984 | | | $ | (2,467,703 | ) | | $ | 870,348 | | | $ | 2,144,385 | | | $ | (247,049 | ) | | $ | 5,663,971 | |
| 1 | Commencement of operations on May 18, 2015. |
| 2 | Commencement of operations on December 17, 2015. |
| | | | | | |
| The accompanying notes are an integral part of these financial statements. | | Annual Report | | March 31, 2016 | | 95 |
| | |
| Statements of Changes in Net Assets | | March 31, 2016 |
| | | | | | | | | | | | | | | | |
| | | DoubleLine
Total Return Bond Fund | | | DoubleLine
Core Fixed Income Fund | |
| | | Year Ended
March 31, 2016 | | | Year Ended
March 31, 2015 | | | Year Ended
March 31, 2016 | | | Year Ended
March 31, 2015 | |
| | | | |
OPERATIONS | | | | | | | | | | | | | | | | |
Net Investment Income (Loss) | | $ | 1,613,496,446 | | | $ | 1,372,410,265 | | | $ | 150,307,900 | | | $ | 91,410,507 | |
Net Realized Gain (Loss) on Investments | | | (9,092,364 | ) | | | 3,427,405 | | | | (16,033,579 | ) | | | 16,905,648 | |
Net Change in Unrealized Appreciation (Depreciation) on Investments | | | (387,300,695 | ) | | | 746,039,607 | | | | (50,950,201 | ) | | | 43,651,274 | |
Net Increase (Decrease) in Net Assets Resulting from Operations | | | 1,217,103,387 | | | | 2,121,877,277 | | | | 83,324,120 | | | | 151,967,429 | |
| | | | |
DISTRIBUTIONS TO SHAREHOLDERS | | | | | | | | | | | | | | | | |
From Net Investment Income | | | | | | | | | | | | | | | | |
Class I | | | (1,592,585,033 | ) | | | (1,333,251,287 | ) | | | (138,890,859 | ) | | | (83,191,481 | ) |
Class N | | | (378,136,485 | ) | | | (325,614,446 | ) | | | (24,114,624 | ) | | | (16,874,140 | ) |
| | | | |
Total Distributions to Shareholders | | | (1,970,721,518 | ) | | | (1,658,865,733 | ) | | | (163,005,483 | ) | | | (100,065,621 | ) |
| | | | |
NET SHARE TRANSACTIONS | | | | | | | | | | | | | | | | |
Class I | | | 10,394,862,523 | | | | 11,289,659,328 | | | | 1,775,047,253 | | | | 2,012,382,225 | |
Class N | | | 2,465,195,792 | | | | 2,271,852,073 | | | | 353,195,271 | | | | 218,937,983 | |
Increase (Decrease) in Net Assets Resulting from Net Share Transactions | | | 12,860,058,315 | | | | 13,561,511,401 | | | | 2,128,242,524 | | | | 2,231,320,208 | |
| | | | |
Total Increase (Decrease) in Net Assets | | $ | 12,106,440,184 | | | $ | 14,024,522,945 | | | $ | 2,048,561,161 | | | $ | 2,283,222,016 | |
| | | | |
NET ASSETS | | | | | | | | | | | | | | | | |
Beginning of Period | | $ | 45,726,607,838 | | | $ | 31,702,084,893 | | | $ | 4,018,694,051 | | | $ | 1,735,472,035 | |
End of Period | | $ | 57,833,048,022 | | | $ | 45,726,607,838 | | | $ | 6,067,255,212 | | | $ | 4,018,694,051 | |
| | | | |
Undistributed (Accumulated) Net Investment Income (Loss) (See Note 6) | | $ | 5,390,358 | | | $ | 9,772,655 | | | $ | 50,261 | | | $ | 498,241 | |
| | | | | | |
| 96 | | DoubleLine Funds Trust | | | | The accompanying notes are an integral part of these financial statements. |
| | | | | | | | | | | | | | | | |
| | | DoubleLine
Emerging Markets
Fixed Income Fund | | | DoubleLine
Multi-Asset Growth Fund
(Consolidated) | |
| | | Year Ended
March 31, 2016 | | | Year Ended
March 31, 2015 | | | Year Ended
March 31, 2016 | | | Year Ended
March 31, 2015 | |
| | | | |
OPERATIONS | | | | | | | | | | | | | | | | |
Net Investment Income (Loss) | | $ | 42,670,585 | | | $ | 33,859,605 | | | $ | 3,549,336 | | | $ | 3,753,049 | |
Net Realized Gain (Loss) on Investments | | | (144,365 | ) | | | 910,510 | | | | (4,955,139 | ) | | | 4,618,082 | |
Net Change in Unrealized Appreciation (Depreciation) on Investments | | | (63,306,418 | ) | | | (20,412,635 | ) | | | (4,638,104 | ) | | | (547,185 | ) |
Net Increase (Decrease) in Net Assets Resulting from Operations | | | (20,780,198 | ) | | | 14,357,480 | | | | (6,043,907 | ) | | | 7,823,946 | |
| | | | |
DISTRIBUTIONS TO SHAREHOLDERS | | | | | | | | | | | | | | | | |
From Net Investment Income | | | | | | | | | | | | | | | | |
Class I | | | (32,607,064 | ) | | | (24,679,407 | ) | | | (2,028,228 | ) | | | (1,984,995 | ) |
Class N | | | (10,765,477 | ) | | | (10,288,341 | ) | | | — | | | | — | |
Class A | | | — | | | | — | | | | (4,345,777 | ) | | | (3,186,549 | ) |
From Net Realized Gain | | | | | | | | | | | | | | | | |
Class I | | | — | | | | — | | | | (484,512 | ) | | | (2,245,080 | ) |
Class A | | | — | | | | — | | | | (1,359,935 | ) | | | (3,948,695 | ) |
| | | | |
Total Distributions to Shareholders | | | (43,372,541 | ) | | | (34,967,748 | ) | | | (8,218,452 | ) | | | (11,365,319 | ) |
| | | | |
NET SHARE TRANSACTIONS | | | | | | | | | | | | | | | | |
Class I | | | 58,855,393 | | | | 223,550,943 | | | | 3,592,084 | | | | (22,074,409 | ) |
Class N | | | (18,081,083 | ) | | | 54,182,018 | | | | — | | | | — | |
Class A | | | — | | | | — | | | | 39,447,910 | | | | (10,306,195 | ) |
Increase (Decrease) in Net Assets Resulting from Net Share Transactions | | | 40,774,310 | | | | 277,732,961 | | | | 43,039,994 | | | | (32,380,604 | ) |
| | | | |
Total Increase (Decrease) in Net Assets | | $ | (23,378,429 | ) | | $ | 257,122,693 | | | $ | 28,777,635 | | | $ | (35,921,977 | ) |
| | | | |
NET ASSETS | | | | | | | | | | | | | | | | |
Beginning of Period | | $ | 772,889,317 | | | $ | 515,766,624 | | | $ | 127,103,360 | | | $ | 163,025,337 | |
End of Period | | $ | 749,510,888 | | | $ | 772,889,317 | | | $ | 155,880,995 | | | $ | 127,103,360 | |
| | | | |
Undistributed (Accumulated) Net Investment Income (Loss) (See Note 6) | | $ | (426,856 | ) | | $ | 275,100 | | | $ | 123,468 | | | $ | 2,950,991 | |
| | | | | | |
| The accompanying notes are an integral part of these financial statements. | | Annual Report | | March 31, 2016 | | 97 |
| | |
Statements of Changes in Net Assets (Cont.) | | March 31, 2016 |
| | | | | | | | | | | | | | | | |
| | | DoubleLine
Low Duration Bond Fund | | | DoubleLine
Floating Rate Fund | |
| | | Year Ended
March 31, 2016 | | | Year Ended
March 31, 2015 | | | Year Ended
March 31, 2016 | | | Year Ended
March 31, 2015 | |
| | | | |
OPERATIONS | | | | | | | | | | | | | | | | |
Net Investment Income (Loss) | | $ | 57,374,597 | | | $ | 43,773,895 | | | $ | 12,054,620 | | | $ | 11,989,619 | |
Net Realized Gain (Loss) on Investments | | | (2,621,104 | ) | | | (2,379,603 | ) | | | (8,862,940 | ) | | | (957,215 | ) |
Net Change in Unrealized Appreciation (Depreciation) on Investments | | | (29,463,795 | ) | | | (7,261,258 | ) | | | (3,455,753 | ) | | | 874,963 | |
Net Increase (Decrease) in Net Assets Resulting from Operations | | | 25,289,698 | | | | 34,133,034 | | | | (264,073 | ) | | | 11,907,367 | |
| | | | |
DISTRIBUTIONS TO SHAREHOLDERS | | | | | | | | | | | | | | | | |
From Net Investment Income | | | | | | | | | | | | | | | | |
Class I | | | (37,160,611 | ) | | | (23,936,627 | ) | | | (9,859,110 | ) | | | (10,079,356 | ) |
Class N | | | (25,796,298 | ) | | | (22,121,181 | ) | | | (2,288,730 | ) | | | (1,871,512 | ) |
From Net Realized Gain | | | | | | | | | | | | | | | | |
Class I | | | — | | | | — | | | | — | | | | (224,448 | ) |
Class N | | | — | | | | — | | | | — | | | | (41,580 | ) |
| | | | |
Total Distributions to Shareholders | | | (62,956,909 | ) | | | (46,057,808 | ) | | | (12,147,840 | ) | | | (12,216,896 | ) |
| | | | |
NET SHARE TRANSACTIONS | | | | | | | | | | | | | | | | |
Class I | | | 577,796,275 | | | | 320,882,912 | | | | (71,003,853 | ) | | | 33,787,831 | |
Class N | | | 29,948,738 | | | | 92,351,618 | | | | 23,838,413 | | | | (53,064,447 | ) |
Increase (Decrease) in Net Assets Resulting from Net Share Transactions | | | 607,745,013 | | | | 413,234,530 | | | | (47,165,440 | ) | | | (19,276,616 | ) |
| | | | |
Total Increase (Decrease) in Net Assets | | $ | 570,077,802 | | | $ | 401,309,756 | | | $ | (59,577,353 | ) | | $ | (19,586,145 | ) |
| | | | |
NET ASSETS | | | | | | | | | | | | | | | | |
Beginning of Period | | $ | 2,315,168,049 | | | $ | 1,913,858,293 | | | $ | 361,470,413 | | | $ | 381,056,558 | |
End of Period | | $ | 2,885,245,851 | | | $ | 2,315,168,049 | | | $ | 301,893,060 | | | $ | 361,470,413 | |
| | | | |
Undistributed (Accumulated) Net Investment Income (Loss) (See Note 6) | | $ | (479,167 | ) | | $ | 691,496 | | | $ | 58,346 | | | $ | 151,566 | |
| | | | | | |
| 98 | | DoubleLine Funds Trust | | | | The accompanying notes are an integral part of these financial statements. |
| | | | | | | | | | | | | | | | |
| | | DoubleLine
Shiller Enhanced CAPE® | | | DoubleLine
Flexible Income Fund | |
| | | Year Ended
March 31, 2016 | | | Year Ended
March 31, 2015 | | | Year Ended
March 31, 2016 | | | Period Ended
March 31, 20151 | |
| | | | |
OPERATIONS | | | | | | | | | | | | | | | | |
Net Investment Income (Loss) | | $ | 15,019,154 | | | $ | 4,369,964 | | | $ | 6,940,921 | | | $ | 2,055,344 | |
Net Realized Gain (Loss) on Investments | | | 6,344,146 | | | | 6,152,439 | | | | (1,326,954 | ) | | | (23,570 | ) |
Net Change in Unrealized Appreciation (Depreciation) on Investments | | | 24,786,684 | | | | 9,564,812 | | | | (8,081,670 | ) | | | (508,727 | ) |
Net Increase (Decrease) in Net Assets Resulting from Operations | | | 46,149,984 | | | | 20,087,215 | | | | (2,467,703 | ) | | | 1,523,047 | |
| | | | |
DISTRIBUTIONS TO SHAREHOLDERS | | | | | | | | | | | | | | | | |
From Net Investment Income | | | | | | | | | | | | | | | | |
Class I | | | (13,392,963 | ) | | | (3,813,749 | ) | | | (5,784,363 | ) | | | (1,461,010 | ) |
Class N | | | (3,099,774 | ) | | | (1,031,003 | ) | | | (2,055,590 | ) | | | (813,963 | ) |
From Net Realized Gain | | | | | | | | | | | | | | | | |
Class I | | | (7,556,918 | ) | | | (32,317 | ) | | | — | | | | — | |
Class N | | | (1,947,414 | ) | | | (8,962 | ) | | | — | | | | — | |
| | | | |
Total Distributions to Shareholders | | | (25,997,069 | ) | | | (4,886,031 | ) | | | (7,839,953 | ) | | | (2,274,973 | ) |
| | | | |
NET SHARE TRANSACTIONS | | | | | | | | | | | | | | | | |
Class I | | | 356,497,043 | | | | 259,720,132 | | | | 110,612,477 | | | | 57,939,114 | |
Class N | | | 103,229,298 | | | | 64,717,418 | | | | 38,237,268 | | | | 27,740,490 | |
Increase (Decrease) in Net Assets Resulting from Net Share Transactions | | | 459,726,341 | | | | 324,437,550 | | | | 148,849,745 | | | | 85,679,604 | |
| | | | |
Total Increase (Decrease) in Net Assets | | $ | 479,879,256 | | | $ | 339,638,734 | | | $ | 138,542,089 | | | $ | 84,927,678 | |
| | | | |
NET ASSETS | | | | | | | | | | | | | | | | |
Beginning of Period | | $ | 380,413,786 | | | $ | 40,775,052 | | | $ | 84,927,678 | | | $ | — | |
End of Period | | $ | 860,293,042 | | | $ | 380,413,786 | | | $ | 223,469,767 | | | $ | 84,927,678 | |
| | | | |
Undistributed (Accumulated) Net Investment Income (Loss) (See Note 6) | | $ | (20,613 | ) | | $ | 47,374 | | | $ | 1,237 | | | $ | 20,265 | |
| 1 | Commencement of operations on April 7, 2014. |
| | | | | | |
| The accompanying notes are an integral part of these financial statements. | | Annual Report | | March 31, 2016 | | 99 |
| | |
| Statements of Changes in Net Assets (Cont.) | | March 31, 2016 |
| | | | | | | | | | | | | | | | |
| | | DoubleLine
Low Duration Emerging Markets
Fixed Income Fund | | | DoubleLine
Long Duration Total Return
Bond Fund | |
| | | Year Ended
March 31, 2016 | | | Period Ended
March 31, 20151 | | | Year Ended
March 31, 2016 | | | Period Ended
March 31, 20152 | |
| | | | |
OPERATIONS | | | | | | | | | | | | | | | | |
Net Investment Income (Loss) | | $ | 5,718,160 | | | $ | 3,532,181 | | | $ | 2,042,122 | | | $ | 578,097 | |
Net Realized Gain (Loss) on Investments | | | 167,007 | | | | (183,082 | ) | | | (929,778 | ) | | | 66,314 | |
Net Change in Unrealized Appreciation (Depreciation) on Investments | | | (5,014,819 | ) | | | (3,297,442 | ) | | | 1,032,041 | | | | 2,225,813 | |
Net Increase (Decrease) in Net Assets Resulting from Operations | | | 870,348 | | | | 51,657 | | | | 2,144,385 | | | | 2,870,224 | |
| | | | |
DISTRIBUTIONS TO SHAREHOLDERS | | | | | | | | | | | | | | | | |
From Net Investment Income | | | | | | | | | | | | | | | | |
Class I | | | (2,508,967 | ) | | | (2,105,211 | ) | | | (1,548,525 | ) | | | (445,918 | ) |
Class N | | | (3,421,817 | ) | | | (1,382,171 | ) | | | (503,394 | ) | | | (115,335 | ) |
From Net Realized Gain | | | | | | | | | | | | | | | | |
Class I | | | — | | | | (50,222 | ) | | | (76,976 | ) | | | — | |
Class N | | | — | | | | (63,660 | ) | | | (26,240 | ) | | | — | |
| | | | |
Total Distributions to Shareholders | | | (5,930,784 | ) | | | (3,601,264 | ) | | | (2,155,135 | ) | | | (561,253 | ) |
| | | | |
NET SHARE TRANSACTIONS | | | | | | | | | | | | | | | | |
Class I | | | 4,024,591 | | | | 66,054,608 | | | | 709,097 | | | | 53,980,829 | |
Class N | | | 42,324,640 | | | | 81,805,322 | | | | 6,094,941 | | | | 19,522,668 | |
Increase (Decrease) in Net Assets Resulting from Net Share Transactions | | | 46,349,231 | | | | 147,859,930 | | | | 6,804,038 | | | | 73,503,497 | |
| | | | |
Total Increase (Decrease) in Net Assets | | $ | 41,288,795 | | | $ | 144,310,323 | | | $ | 6,793,288 | | | $ | 75,812,468 | |
| | | | |
NET ASSETS | | | | | | | | | | | | | | | | |
Beginning of Period | | $ | 144,310,323 | | | $ | — | | | $ | 75,812,468 | | | $ | — | |
End of Period | | $ | 185,599,118 | | | $ | 144,310,323 | | | $ | 82,605,756 | | | $ | 75,812,468 | |
| | | | |
Undistributed (Accumulated) Net Investment Income (Loss) (See Note 6) | | $ | (161,981 | ) | | $ | 7,429 | | | $ | 7,061 | | | $ | 16,844 | |
| 1 | Commencement of operations on April 7, 2014. |
| 2 | Commencement of operations on December 15, 2014. |
| | | | | | |
| 100 | | DoubleLine Funds Trust | | | | The accompanying notes are an integral part of these financial statements. |
| | | | | | | | |
| | | DoubleLine
Strategic
Commodity Fund
(Consolidated) | | | DoubleLine
Global Bond
Fund | |
| | | Period Ended
March 31, 20161 | | | Period Ended
March 31, 20162 | |
| | |
OPERATIONS | | | | | | | | |
Net Investment Income (Loss) | | $ | (163,838 | ) | | $ | 189,083 | |
Net Realized Gain (Loss) on Investments | | | (525,917 | ) | | | 391,350 | |
Net Change in Unrealized Appreciation (Depreciation) on Investments | | | 442,706 | | | | 5,083,538 | |
Net Increase (Decrease) in Net Assets Resulting from Operations | | | (247,049 | ) | | | 5,663,971 | |
| | |
DISTRIBUTIONS TO SHAREHOLDERS | | | | | | | | |
From Net Investment Income | | | | | | | | |
Class I | | | — | | | | (169,086 | ) |
Class N | | | — | | | | (28,179 | ) |
From Net Realized Gain | | | | | | | | |
Class I | | | (8,845 | ) | | | — | |
Class N | | | (243 | ) | | | — | |
| | |
Total Distributions to Shareholders | | | (9,088 | ) | | | (197,265 | ) |
| | |
NET SHARE TRANSACTIONS | | | | | | | | |
Class I | | | 28,243,359 | | | | 90,111,915 | |
Class N | | | 1,431,242 | | | | 40,989,531 | |
Increase (Decrease) in Net Assets Resulting from Net Share Transactions | | | 29,674,601 | | | | 131,101,446 | |
| | |
Total Increase (Decrease) in Net Assets | | $ | 29,418,464 | | | $ | 136,568,152 | |
| | |
NET ASSETS | | | | | | | | |
Beginning of Period | | $ | — | | | $ | — | |
End of Period | | $ | 29,418,464 | | | $ | 136,568,152 | |
| | |
Undistributed (Accumulated) Net Investment Income (Loss) (See Note 6) | | $ | 180,134 | | | $ | 159,508 | |
| 1 | Commencement of operations on May 18, 2015. |
| 2 | Commencement of operations on December 17, 2015. |
| | | | | | |
| The accompanying notes are an integral part of these financial statements. | | Annual Report | | March 31, 2016 | | 101 |
| | |
| Financial Highlights | | March 31, 2016 |
| | | | | | | | | | | | | | | | | | | | | | | | | | | | | | | | | | | | | | | | |
| | | DoubleLine Total Return Bond Fund | |
| | | Year Ended
March 31,
2016 | | | Year Ended
March 31,
2015 | | | Year Ended
March 31,
2014 | | | Year Ended
March 31,
2013 | | | Year Ended
March 31,
2012 | | | Year Ended
March 31,
2016 | | | Year Ended
March 31,
2015 | | | Year Ended
March 31,
2014 | | | Year Ended
March 31,
2013 | | | Year Ended
March 31,
2012 | |
| | | Class I | | | Class I | | | Class I | | | Class I | | | Class I | | | Class N | | | Class N | | | Class N | | | Class N | | | Class N | |
| | | | | | | | | | |
Net Asset Value, Beginning of Period | | $ | 11.04 | | | $ | 10.90 | | | $ | 11.34 | | | $ | 11.17 | | | $ | 10.96 | | | $ | 11.04 | | | $ | 10.89 | | | $ | 11.33 | | | $ | 11.16 | | | $ | 10.96 | |
| | | | | | | | | | |
Income (Loss) from Investment Operations: | | | | | | | | | | | | | | | | | | | | | | | | | | | | | | | | | | | | | | | | |
Net Investment Income (Loss)1 | | | 0.35 | | | | 0.41 | | | | 0.42 | | | | 0.46 | | | | 0.77 | | | | 0.33 | | | | 0.40 | | | | 0.39 | | | | 0.44 | | | | 0.73 | |
Net Gain (Loss) on Investments
(Realized and Unrealized) | | | (0.09 | ) | | | 0.22 | | | | (0.30 | ) | | | 0.34 | | | | 0.31 | | | | (0.09 | ) | | | 0.22 | | | | (0.30 | ) | | | 0.34 | | | | 0.31 | |
Total from Investment Operations | | | 0.26 | | | | 0.63 | | | | 0.12 | | | | 0.80 | | | | 1.08 | | | | 0.24 | | | | 0.62 | | | | 0.09 | | | | 0.78 | | | | 1.04 | |
| | | | | | | | | | |
Less Distributions: | | | | | | | | | | | | | | | | | | | | | | | | | | | | | | | | | | | | | | | | |
Distributions from Net Investment Income | | | (0.43 | ) | | | (0.49 | ) | | | (0.56 | ) | | | (0.63 | ) | | | (0.87 | ) | | | (0.41 | ) | | | (0.47 | ) | | | (0.53 | ) | | | (0.61 | ) | | | (0.84 | ) |
Total Distributions | | | (0.43 | ) | | | (0.49 | ) | | | (0.56 | ) | | | (0.63 | ) | | | (0.87 | ) | | | (0.41 | ) | | | (0.47 | ) | | | (0.53 | ) | | | (0.61 | ) | | | (0.84 | ) |
Net Asset Value, End of Period | | $ | 10.87 | | | $ | 11.04 | | | $ | 10.90 | | | $ | 11.34 | | | $ | 11.17 | | | $ | 10.87 | | | $ | 11.04 | | | $ | 10.89 | | | $ | 11.33 | | | $ | 11.16 | |
Total Return | | | 2.45% | | | | 5.93% | | | | 1.13% | | | | 7.37% | | | | 10.18% | | | | 2.20% | | | | 5.76% | | | | 0.88% | | | | 7.11% | | | | 9.83% | |
| | | | | | | | | | |
Supplemental Data: | | | | | | | | | | | | | | | | | | | | | | | | | | | | | | | | | | | | | | | | |
Net Assets, End of Period (000’s) | | $ | 46,082,294 | | | $ | 36,286,609 | | | $ | 24,631,306 | | | $ | 30,398,069 | | | $ | 16,226,569 | | | $ | 11,750,754 | | | $ | 9,439,999 | | | $ | 7,070,779 | | | $ | 9,441,917 | | | $ | 6,115,779 | |
Ratios to Average Net Assets: | | | | | | | | | | | | | | | | | | | | | | | | | | | | | | | | | | | | | | | | |
Expenses Before Advisory Fees (Waived) and Other Fees (Reimbursed)/Recouped | | | 0.47% | | | | 0.47% | | | | 0.47% | | | | 0.48% | | | | 0.50% | | | | 0.72% | | | | 0.72% | | | | 0.72% | | | | 0.73% | | | | 0.75% | |
Expenses After Investment Advisory Fees (Waived) | | | 0.47% | | | | 0.47% | | | | 0.47% | | | | 0.48% | | | | 0.50% | | | | 0.72% | | | | 0.72% | | | | 0.72% | | | | 0.73% | | | | 0.75% | |
Expenses After Advisory Fees (Waived) and Other Fees (Reimbursed)/Recouped | | | 0.47% | | | | 0.47% | | | | 0.48% | | | | 0.48% | | | | 0.49% | | | | 0.72% | | | | 0.72% | | | | 0.73% | | | | 0.73% | | | | 0.74% | |
Net Investment Income (Loss) | | | 3.29% | | | | 3.74% | | | | 3.78% | | | | 4.02% | | | | 6.86% | | | | 3.04% | | | | 3.50% | | | | 3.25% | | | | 3.76% | | | | 6.58% | |
Portfolio Turnover Rate | | | 15% | | | | 13% | | | | 14% | | | | 23% | | | | 15% | | | | 15% | | | | 13% | | | | 14% | | | | 23% | | | | 15% | |
| 1 | Calculated based on average shares outstanding during the period. |
| | | | | | |
| 102 | | DoubleLine Funds Trust | | | | The accompanying notes are an integral part of these financial statements. |
| | | | | | | | | | | | | | | | | | | | | | | | | | | | | | | | | | | | | | | | |
| | | DoubleLine Core Fixed Income Fund | |
| | | Year Ended
March 31,
2016 | | | Year Ended
March 31,
2015 | | | Year Ended
March 31,
2014 | | | Year Ended
March 31,
2013 | | | Year Ended
March 31,
2012 | | | Year Ended
March 31,
2016 | | | Year Ended
March 31,
2015 | | | Year Ended
March 31,
2014 | | | Year Ended
March 31,
2013 | | | Year Ended
March 31,
2012 | |
| | | Class I | | | Class I | | | Class I | | | Class I | | | Class I | | | Class N | | | Class N | | | Class N | | | Class N | | | Class N | |
| | | | | | | | | | |
Net Asset Value, Beginning of Period | | $ | 11.10 | | | $ | 10.88 | | | $ | 11.29 | | | $ | 11.06 | | | $ | 10.46 | | | $ | 11.10 | | | $ | 10.87 | | | $ | 11.28 | | | $ | 11.05 | | | $ | 10.46 | |
| | | | | | | | | | |
Income (Loss) from Investment Operations: | | | | | | | | | | | | | | | | | | | | | | | | | | | | | | | | | | | | | | | | |
Net Investment Income (Loss)1 | | | 0.36 | | | | 0.39 | | | | 0.41 | | | | 0.36 | | | | 0.50 | | | | 0.32 | | | | 0.37 | | | | 0.40 | | | | 0.33 | | | | 0.47 | |
Net Gain (Loss) on Investments
(Realized and Unrealized) | | | (0.22 | ) | | | 0.26 | | | | (0.31 | ) | | | 0.36 | | | | 0.65 | | | | (0.22 | ) | | | 0.26 | | | | (0.31 | ) | | | 0.36 | | | | 0.65 | |
Total from Investment Operations | | | 0.14 | | | | 0.65 | | | | 0.10 | | | | 0.72 | | | | 1.15 | | | | 0.10 | | | | 0.63 | | | | 0.09 | | | | 0.69 | | | | 1.12 | |
| | | | | | | | | | |
Less Distributions: | | | | | | | | | | | | | | | | | | | | | | | | | | | | | | | | | | | | | | | | |
Distributions from Net Investment Income | | | (0.37 | ) | | | (0.43 | ) | | | (0.47 | ) | | | (0.44 | ) | | | (0.52 | ) | | | (0.34 | ) | | | (0.40 | ) | | | (0.46 | ) | | | (0.41 | ) | | | (0.50 | ) |
Distributions from Net Realized Gain | | | — | | | | — | | | | (0.04 | ) | | | (0.05 | ) | | | (0.03 | ) | | | — | | | | — | | | | (0.04 | ) | | | (0.05 | ) | | | (0.03 | ) |
Total Distributions | | | (0.37 | ) | | | (0.43 | ) | | | (0.51 | ) | | | (0.49 | ) | | | (0.55 | ) | | | (0.34 | ) | | | (0.40 | ) | | | (0.50 | ) | | | (0.46 | ) | | | (0.53 | ) |
Net Asset Value, End of Period | | $ | 10.87 | | | $ | 11.10 | | | $ | 10.88 | | | $ | 11.29 | | | $ | 11.06 | | | $ | 10.86 | | | $ | 11.10 | | | $ | 10.87 | | | $ | 11.28 | | | $ | 11.05 | |
Total Return | | | 1.31% | | | | 6.07% | | | | 1.03% | | | | 6.53% | | | | 11.19% | | | | 0.97% | | | | 5.91% | | | | 0.77% | | | | 6.27% | | | | 10.85% | |
| | | | | | | | | | |
Supplemental Data: | | | | | | | | | | | | | | | | | | | | | | | | | | | | | | | | | | | | | | | | |
Net Assets, End of Period (000’s) | | $ | 5,114,336 | | | $ | 3,406,628 | | | $ | 1,351,760 | | | $ | 1,829,092 | | | $ | 1,544,169 | | | $ | 952,919 | | | $ | 612,066 | | | $ | 383,712 | | | $ | 731,957 | | | $ | 539,143 | |
Ratios to Average Net Assets: | | | | | | | | | | | | | | | | | | | | | | | | | | | | | | | | | | | | | | | | |
Expenses Before Advisory Fees (Waived) and Other Fees (Reimbursed)/Recouped | | | 0.47% | | | | 0.48% | | | | 0.51% | | | | 0.51% | | | | 0.54% | | | | 0.72% | | | | 0.73% | | | | 0.76% | | | | 0.76% | | | | 0.79% | |
Expenses After Investment Advisory Fees
(Waived) | | | 0.46% | | | | 0.46% | | | | 0.48% | | | | 0.51% | | | | 0.54% | | | | 0.71% | | | | 0.71% | | | | 0.73% | | | | 0.76% | | | | 0.79% | |
Expenses After Advisory Fees (Waived) and
Other Fees (Reimbursed)/Recouped | | | 0.46% | | | | 0.47% | | | | 0.48% | | | | 0.50% | | | | 0.49% | | | | 0.71% | | | | 0.72% | | | | 0.73% | | | | 0.75% | | | | 0.74% | |
Net Investment Income (Loss) | | | 3.17% | | | | 3.60% | | | | 3.76% | | | | 3.14% | | | | 4.51% | | | | 2.92% | | | | 3.39% | | | | 3.32% | | | | 2.91% | | | | 4.22% | |
Portfolio Turnover Rate | | | 70% | | | | 65% | | | | 53% | | | | 83% | | | | 81% | | | | 70% | | | | 65% | | | | 53% | | | | 83% | | | | 81% | |
| 1 | Calculated based on average shares outstanding during the period. |
| | | | | | |
| The accompanying notes are an integral part of these financial statements. | | Annual Report | | March 31, 2016 | | 103 |
| | |
| Financial Highlights (Cont.) | | March 31, 2016 |
| | | | | | | | | | | | | | | | | | | | | | | | | | | | | | | | | | | | | | | | |
| | | DoubleLine Emerging Markets Fixed Income Fund | |
| | | Year Ended
March 31,
2016 | | | Year Ended
March 31,
2015 | | | Year Ended
March 31,
2014 | | | Year Ended
March 31,
2013 | | | Year Ended
March 31,
2012 | | | Year Ended
March 31,
2016 | | | Year Ended
March 31,
2015 | | | Year Ended
March 31,
2014 | | | Year Ended
March 31,
2013 | | | Year Ended
March 31,
2012 | |
| | | Class I | | | Class I | | | Class I | | | Class I | | | Class I | | | Class N | | | Class N | | | Class N | | | Class N | | | Class N | |
| | | | | | | | | | |
Net Asset Value, Beginning of Period | | $ | 10.23 | | | $ | 10.48 | | | $ | 11.03 | | | $ | 10.70 | | | $ | 10.57 | | | $ | 10.23 | | | $ | 10.48 | | | $ | 11.03 | | | $ | 10.70 | | | $ | 10.57 | |
| | | | | | | | | | |
Income (Loss) from Investment Operations: | | | | | | | | | | | | | | | | | | | | | | | | | | | | | | | | | | | | | | | | |
Net Investment Income (Loss)1 | | | 0.49 | | | | 0.55 | | | | 0.46 | | | | 0.38 | | | | 0.58 | | | | 0.46 | | | | 0.52 | | | | 0.44 | | | | 0.36 | | | | 0.55 | |
Net Gain (Loss) on Investments
(Realized and Unrealized) | | | (0.54 | ) | | | (0.24 | ) | | | (0.38 | ) | | | 0.46 | | | | 0.23 | | | | (0.54 | ) | | | (0.24 | ) | | | (0.38 | ) | | | 0.46 | | | | 0.23 | |
Total from Investment Operations | | | (0.05 | ) | | | 0.31 | | | | 0.08 | | | | 0.84 | | | | 0.81 | | | | (0.08 | ) | | | 0.28 | | | | 0.06 | | | | 0.82 | | | | 0.78 | |
| | | | | | | | | | |
Less Distributions: | | | | | | | | | | | | | | | | | | | | | | | | | | | | | | | | | | | | | | | | |
Distributions from Net Investment Income | | | (0.50 | ) | | | (0.56 | ) | | | (0.48 | ) | | | (0.38 | ) | | | (0.58 | ) | | | (0.47 | ) | | | (0.53 | ) | | | (0.46 | ) | | | (0.36 | ) | | | (0.55 | ) |
Distributions from Net Realized Gain | | | — | | | | — | | | | (0.15 | ) | | | (0.13 | ) | | | (0.10 | ) | | | — | | | | — | | | | (0.15 | ) | | | (0.13 | ) | | | (0.10 | ) |
Total Distributions | | | (0.50 | ) | | | (0.56 | ) | | | (0.63 | ) | | | (0.51 | ) | | | (0.68 | ) | | | (0.47 | ) | | | (0.53 | ) | | | (0.61 | ) | | | (0.49 | ) | | | (0.65 | ) |
Net Asset Value, End of Period | | $ | 9.68 | | | $ | 10.23 | | | $ | 10.48 | | | $ | 11.03 | | | $ | 10.70 | | | $ | 9.68 | | | $ | 10.23 | | | $ | 10.48 | | | $ | 11.03 | | | $ | 10.70 | |
Total Return | | | (0.48)% | | | | 2.90% | | | | 0.95% | | | | 8.04% | | | | 7.96% | | | | (0.73)% | | | | 2.64% | | | | 0.69% | | | | 7.78% | | | | 7.71% | |
| | | | | | | | | | |
Supplemental Data: | | | | | | | | | | | | | | | | | | | | | | | | | | | | | | | | | | | | | | | | |
Net Assets, End of Period (000’s) | | $ | 548,221 | | | $ | 539,542 | | | $ | 331,790 | | | $ | 620,479 | | | $ | 349,926 | | | $ | 201,290 | | | $ | 233,347 | | | $ | 183,977 | | | $ | 167,750 | | | $ | 81,484 | |
Ratios to Average Net Assets: | | | | | | | | | | | | | | | | | | | | | | | | | | | | | | | | | | | | | | | | |
Expenses Before Advisory Fees (Waived) and Other Fees (Reimbursed)/Recouped | | | 0.90% | | | | 0.90% | | | | 0.92% | | | | 0.91% | | | | 0.95% | | | | 1.15% | | | | 1.15% | | | | 1.17% | | | | 1.16% | | | | 1.20% | |
Expenses After Investment Advisory Fees (Waived) | | | 0.90% | | | | 0.90% | | | | 0.92% | | | | 0.91% | | | | 0.95% | | | | 1.15% | | | | 1.15% | | | | 1.17% | | | | 1.16% | | | | 1.20% | |
Expenses After Advisory Fees (Waived) and
Other Fees (Reimbursed)/Recouped | | | 0.90% | | | | 0.90% | | | | 0.92% | | | | 0.91% | | | | 0.95% | | | | 1.15% | | | | 1.15% | | | | 1.17% | | | | 1.16% | | | | 1.20% | |
Net Investment Income (Loss) | | | 4.92% | | | | 5.20% | | | | 4.40% | | | | 3.53% | | | | 5.47% | | | | 4.67% | | | | 4.95% | | | | 4.25% | | | | 3.30% | | | | 5.26% | |
Portfolio Turnover Rate | | | 75% | | | | 67% | | | | 79% | | | | 105% | | | | 177% | | | | 75% | | | | 67% | | | | 79% | | | | 105% | | | | 177% | |
| 1 | Calculated based on average shares outstanding during the period. |
| | | | | | |
| 104 | | DoubleLine Funds Trust | | | | The accompanying notes are an integral part of these financial statements. |
| | | | | | | | | | | | | | | | | | | | | | | | | | | | | | | | | | | | | | | | |
| | | DoubleLine Multi-Asset Growth Fund
(Consolidated) | |
| | | Year Ended
March 31,
2016 | | | Year Ended
March 31,
2015 | | | Year Ended
March 31,
2014 | | | Year Ended
March 31,
2013 | | | Year Ended
March 31,
2012 | | | Year Ended
March 31,
2016 | | | Year Ended
March 31,
2015 | | | Year Ended
March 31,
2014 | | | Year Ended
March 31,
2013 | | | Year Ended
March 31,
2012 | |
| | | Class I | | | Class I | | | Class I | | | Class I | | | Class I | | | Class A | | | Class A | | | Class A | | | Class A | | | Class A | |
| | | | | | | | | | |
Net Asset Value, Beginning of Period | | $ | 9.81 | | | $ | 10.10 | | | $ | 9.96 | | | $ | 10.03 | | | $ | 10.11 | | | $ | 9.78 | | | $ | 10.07 | | | $ | 9.95 | | | $ | 10.02 | | | $ | 10.09 | |
| | | | | | | | | | |
Income (Loss) from Investment Operations: | | | | | | | | | | | | | | | | | | | | | | | | | | | | | | | | | | | | | | | | |
Net Investment Income (Loss)1 | | | 0.24 | | | | 0.28 | | | | 0.18 | | | | 0.31 | | | | 0.42 | | | | 0.22 | | | | 0.26 | | | | 0.12 | | | | 0.29 | | | | 0.41 | |
Net Gain (Loss) on Investments (Realized and Unrealized) | | | (0.65 | ) | | | 0.32 | | | | 0.18 | | | | (0.06 | ) | | | (0.16 | ) | | | (0.65 | ) | | | 0.32 | | | | 0.19 | | | | (0.06 | ) | | | (0.16 | ) |
Total from Investment Operations | | | (0.41 | ) | | | 0.60 | | | | 0.36 | | | | 0.25 | | | | 0.26 | | | | (0.43 | ) | | | 0.58 | | | | 0.31 | | | | 0.23 | | | | 0.25 | |
| | | | | | | | | | |
Less Distributions: | | | | | | | | | | | | | | | | | | | | | | | | | | | | | | | | | | | | | | | | |
Distributions from Net Investment Income | | | (0.44 | ) | | | (0.40 | ) | | | (0.22 | ) | | | (0.32 | ) | | | (0.34 | ) | | | (0.41 | ) | | | (0.38 | ) | | | (0.19 | ) | | | (0.30 | ) | | | (0.32 | ) |
Distributions from Net Realized Gain | | | (0.11 | ) | | | (0.49 | ) | | | — | | | | — | | | | — | | | | (0.11 | ) | | | (0.49 | ) | | | — | | | | — | | | | — | |
Total Distributions | | | (0.55 | ) | | | (0.89 | ) | | | (0.22 | ) | | | (0.32 | ) | | | (0.34 | ) | | | (0.52 | ) | | | (0.87 | ) | | | (0.19 | ) | | | (0.30 | ) | | | (0.32 | ) |
Net Asset Value, End of Period | | $ | 8.85 | | | $ | 9.81 | | | $ | 10.10 | | | $ | 9.96 | | | $ | 10.03 | | | $ | 8.83 | | | $ | 9.78 | | | $ | 10.07 | | | $ | 9.95 | | | $ | 10.02 | |
Total Return2 | | | (4.29)% | | | | 6.22% | | | | 3.65% | | | | 2.49% | | | | 2.67% | | | | (4.42)% | | | | 5.96% | | | | 3.28% | | | | 2.19% | | | | 2.57% | |
| | | | | | | | | | |
Supplemental Data: | | | | | | | | | | | | | | | | | | | | | | | | | | | | | | | | | | | | | | | | |
Net Assets, End of Period (000’s) | | $ | 42,075 | | | $ | 42,796 | | | $ | 66,292 | | | $ | 105,114 | | | $ | 85,073 | | | $ | 113,806 | | | $ | 84,307 | | | $ | 96,734 | | | $ | 159,714 | | | $ | 42,261 | |
Ratios to Average Net Assets: | | | | | | | | | | | | | | | | | | | | | | | | | | | | | | | | | | | | | | | | |
Expenses Before Advisory Fees (Waived) and Other Fees (Reimbursed)/Recouped | | | 1.25% | | | | 1.30% | | | | 1.33% | | | | 1.45% | | | | 1.70% | | | | 1.50% | | | | 1.55% | | | | 1.58% | | | | 1.70% | | | | 1.95% | |
Expenses After Investment Advisory Fees (Waived) | | | 1.12% | | | | 1.09% | | | | 1.26% | | | | 1.35% | | | | 1.59% | | | | 1.37% | | | | 1.34% | | | | 1.51% | | | | 1.60% | | | | 1.84% | |
Expenses After Advisory Fees (Waived) and Other Fees (Reimbursed)/Recouped | | | 1.07% | | | | 0.99% | | | | 1.13% | | | | 1.10% | | | | 1.09% | | | | 1.32% | | | | 1.24% | | | | 1.38% | | | | 1.35% | | | | 1.34% | |
Net Investment Income (Loss) | | | 2.72% | | | | 2.87% | | | | 1.67% | | | | 3.11% | | | | 4.14% | | | | 2.47% | | | | 2.66% | | | | 1.01% | | | | 2.48% | | | | 3.88% | |
Portfolio Turnover Rate | | | 56% | | | | 86% | | | | 150% | | | | 88% | | | | 48% | | | | 56% | | | | 86% | | | | 150% | | | | 88% | | | | 48% | |
| 1 | Calculated based on average shares outstanding during the period. |
| 2 | Total return does not include the effects of sales charges for Class A. |
| | | | | | |
| The accompanying notes are an integral part of these financial statements. | | Annual Report | | March 31, 2016 | | 105 |
| | |
| Financial Highlights (Cont.) | | March 31, 2016 |
| | | | | | | | | | | | | | | | | | | | | | | | | | | | | | | | | | | | | | | | |
| | | DoubleLine Low Duration Bond Fund | |
| | | Year Ended
March 31,
2016 | | | Year Ended
March 31,
2015 | | | Year Ended
March 31,
2014 | | | Year Ended
March 31,
2013 | | | Period Ended
March 31,
20121 | | | Year Ended
March 31,
2016 | | | Year Ended
March 31,
2015 | | | Year Ended
March 31,
2014 | | | Year Ended
March 31,
2013 | | | Period Ended
March 31,
20121 | |
| | | Class I | | | Class I | | | Class I | | | Class I | | | Class I | | | Class N | | | Class N | | | Class N | | | Class N | | | Class N | |
| | | | | | | | | | |
Net Asset Value, Beginning of Period | | $ | 10.14 | | | $ | 10.19 | | | $ | 10.21 | | | $ | 10.16 | | | $ | 10.00 | | | $ | 10.13 | | | $ | 10.18 | | | $ | 10.20 | | | $ | 10.15 | | | $ | 10.00 | |
| | | | | | | | | | |
Income (Loss) from Investment Operations: | | | | | | | | | | | | | | | | | | | | | | | | | | | | | | | | | | | | | | | | |
Net Investment Income (Loss)4 | | | 0.22 | | | | 0.22 | | | | 0.15 | | | | 0.20 | | | | 0.11 | | | | 0.21 | | | | 0.19 | | | | 0.13 | | | | 0.17 | | | | 0.09 | |
Net Gain (Loss) on Investments
(Realized and Unrealized) | | | (0.12 | ) | | | (0.04 | ) | | | — | | | | 0.09 | | | | 0.13 | | | | (0.12 | ) | | | (0.04 | ) | | | — | | | | 0.09 | | | | 0.13 | |
Total from Investment Operations | | | 0.10 | | | | 0.18 | | | | 0.15 | | | | 0.29 | | | | 0.24 | | | | 0.09 | | | | 0.15 | | | | 0.13 | | | | 0.26 | | | | 0.22 | |
| | | | | | | | | | |
Less Distributions: | | | | | | | | | | | | | | | | | | | | | | | | | | | | | | | | | | | | | | | | |
Distributions from Net Investment Income | | | (0.25 | ) | | | (0.23 | ) | | | (0.17 | ) | | | (0.24 | ) | | | (0.08 | ) | | | (0.23 | ) | | | (0.20 | ) | | | (0.15 | ) | | | (0.21 | ) | | | (0.07 | ) |
Total Distributions | | | (0.25 | ) | | | (0.23 | ) | | | (0.17 | ) | | | (0.24 | ) | | | (0.08 | ) | | | (0.23 | ) | | | (0.20 | ) | | | (0.15 | ) | | | (0.21 | ) | | | (0.07 | ) |
Net Asset Value, End of Period | | $ | 9.99 | | | $ | 10.14 | | | $ | 10.19 | | | $ | 10.21 | | | $ | 10.16 | | | $ | 9.99 | | | $ | 10.13 | | | $ | 10.18 | | | $ | 10.20 | | | $ | 10.15 | |
Total Return | | | 1.00% | | | | 1.76% | | | | 1.51% | | | | 2.88% | | | | 2.44% | 2 | | | 0.85% | | | | 1.51% | | | | 1.26% | | | | 2.64% | | | | 2.25% | 2 |
| | | | | | | | | | |
Supplemental Data: | | | | | | | | | | | | | | | | | | | | | | | | | | | | | | | | | | | | | | | | |
Net Assets, End of Period (000’s) | | $ | 1,722,942 | | | $ | 1,166,438 | | | $ | 851,771 | | | $ | 375,840 | | | $ | 132,117 | | | $ | 1,162,303 | | | $ | 1,148,730 | | | $ | 1,062,088 | | | $ | 237,727 | | | $ | 85,343 | |
Ratios to Average Net Assets: | | | | | | | | | | | | | | | | | | | | | | | | | | | | | | | | | | | | | | | | |
Expenses Before Advisory Fees (Waived) and Other Fees (Reimbursed)/Recouped | | | 0.43% | | | | 0.45% | | | | 0.48% | | | | 0.53% | | | | 0.94% | 3 | | | 0.68% | | | | 0.70% | | | | 0.73% | | | | 0.78% | | | | 1.19% | 3 |
Expenses After Investment Advisory Fees (Waived) | | | 0.42% | | | | 0.44% | | | | 0.48% | | | | 0.53% | | | | 0.94% | 3 | | | 0.67% | | | | 0.69% | | | | 0.73% | | | | 0.78% | | | | 1.19% | 3 |
Expenses After Advisory Fees (Waived) and Other Fees (Reimbursed)/Recouped | | | 0.43% | | | | 0.46% | | | | 0.47% | | | | 0.47% | | | | 0.47% | 3 | | | 0.68% | | | | 0.71% | | | | 0.72% | | | | 0.72% | | | | 0.72% | 3 |
Net Investment Income (Loss) | | | 2.30% | | | | 2.16% | | | | 1.46% | | | | 1.98% | | | | 2.10% | 3 | | | 2.05% | | | | 1.90% | | | | 1.30% | | | | 1.70% | | | | 1.74% | 3 |
Portfolio Turnover Rate | | | 66% | | | | 61% | | | | 53% | | | | 71% | | | | 46% | 2 | | | 66% | | | | 61% | | | | 53% | | | | 71% | | | | 46% | 2 |
| 1 | Commencement of operations on September 30, 2011. |
| 4 | Calculated based on average shares outstanding during the period. |
| | | | | | |
| 106 | | DoubleLine Funds Trust | | | | The accompanying notes are an integral part of these financial statements. |
| | | | | | | | | | | | | | | | | | | | | | | | | | | | | | | | |
| | | DoubleLine Floating Rate Fund | |
| | | Year Ended
March 31,
2016 | | | Year Ended
March 31,
2015 | | | Year Ended
March 31,
2014 | | | Period Ended
March 31,
20131 | | | Year Ended
March 31,
2016 | | | Year Ended
March 31,
2015 | | | Year Ended
March 31,
2014 | | | Period Ended
March 31,
20131 | |
| | | Class I | | | Class I | | | Class I | | | Class I | | | Class N | | | Class N | | | Class N | | | Class N | |
| | | | | | | | |
Net Asset Value, Beginning of Period | | $ | 10.14 | | | $ | 10.15 | | | $ | 10.08 | | | $ | 10.00 | | | $ | 10.16 | | | $ | 10.16 | | | $ | 10.08 | | | $ | 10.00 | |
| | | | | | | | |
Income (Loss) from Investment Operations: | | | | | | | | | | | | | | | | | | | | | | | | | | | | | | | | |
Net Investment Income (Loss)4 | | | 0.36 | | | | 0.34 | | | | 0.27 | | | | — | | | | 0.34 | | | | 0.32 | | | | 0.25 | | | | — | |
Net Gain (Loss) on Investments
(Realized and Unrealized) | | | (0.36 | ) | | | — | | | | 0.04 | | | | 0.08 | | | | (0.36 | ) | | | — | | | | 0.05 | | | | 0.08 | |
Total from Investment Operations | | | — | | | | 0.34 | | | | 0.31 | | | | 0.08 | | | | (0.02 | ) | | | 0.32 | | | | 0.30 | | | | 0.08 | |
| | | | | | | | |
Less Distributions: | | | | | | | | | | | | | | | | | | | | | | | | | | | | | | | | |
Distributions from Net Investment Income | | | (0.37 | ) | | | (0.34 | ) | | | (0.24 | ) | | | — | | | | (0.35 | ) | | | (0.31 | ) | | | (0.22 | ) | | | — | |
Distributions from Net Realized Gain | | | — | | | | (0.01 | ) | | | — | | | | — | | | | — | | | | (0.01 | ) | | | — | | | | — | |
Total Distributions | | | (0.37 | ) | | | (0.35 | ) | | | (0.24 | ) | | | — | | | | (0.35 | ) | | | (0.32 | ) | | | (0.22 | ) | | | — | |
Net Asset Value, End of Period | | $ | 9.77 | | | $ | 10.14 | | | $ | 10.15 | | | $ | 10.08 | | | $ | 9.79 | | | $ | 10.16 | | | $ | 10.16 | | | $ | 10.08 | |
Total Return | | | 0.02% | | | | 3.36% | | | | 3.07% | | | | 0.80% | 2 | | | (0.23)% | | | | 3.19% | | | | 2.93% | | | | 0.80% | 2 |
| | | | | | | | |
Supplemental Data: | | | | | | | | | | | | | | | | | | | | | | | | | | | | | | | | |
Net Assets, End of Period (000’s) | | $ | 229,612 | | | $ | 310,368 | | | $ | 276,737 | | | $ | 63,436 | | | $ | 72,281 | | | $ | 51,103 | | | $ | 104,320 | | | $ | 10 | |
Ratios to Average Net Assets: | | | | | | | | | | | | | | | | | | | | | | | | | | | | | | | | |
Expenses Before Advisory Fees (Waived) and Other Fees (Reimbursed)/Recouped | | | 0.65% | | | | 0.67% | | | | 0.73% | | | | 2.01%3 | | | | 0.90% | | | | 0.92% | | | | 0.98% | | | | 2.26%3 | |
Expenses After Investment Advisory Fees (Waived) | | | 0.65% | | | | 0.67% | | | | 0.73% | | | | 2.01%3 | | | | 0.90% | | | | 0.92% | | | | 0.98% | | | | 2.26%3 | |
Expenses After Advisory Fees (Waived) and Other Fees (Reimbursed)/Recouped | | | 0.65% | | | | 0.70% | | | | 0.73% | | | | 0.75%3 | | | | 0.90% | | | | 0.95% | | | | 0.98% | | | | 1.00%3 | |
Net Investment Income (Loss) | | | 3.70% | | | | 3.35% | | | | 2.68% | | | | (0.13)% | 3 | | | 3.45% | | | | 3.06% | | | | 2.68% | | | | (0.13)% | 3 |
Portfolio Turnover Rate | | | 70% | | | | 84% | | | | 66% | | | | 20% | 2 | | | 70% | | | | 84% | | | | 66% | | | | 20% | 2 |
| 1 | Commencement of operations on February 1, 2013. |
| 4 | Calculated based on average shares outstanding during the period. |
| | | | | | |
| The accompanying notes are an integral part of these financial statements. | | Annual Report | | March 31, 2016 | | 107 |
| | |
| Financial Highlights (Cont.) | | March 31, 2016 |
| | | | | | | | | | | | | | | | | | | | | | | | |
| | | DoubleLine Shiller Enhanced CAPE® | |
| | | Year Ended
March 31, 2016 | | | Year Ended
March 31, 2015 | | | Period Ended
March 31, 20141 | | | Year Ended
March 31, 2016 | | | Year Ended
March 31, 2015 | | | Period Ended
March 31, 20141 | |
| | | Class I | | | Class I | | | Class I | | | Class N | | | Class N | | | Class N | |
| | | | | | |
Net Asset Value, Beginning of Period | | $ | 12.13 | | | $ | 10.68 | | | $ | 10.00 | | | $ | 12.12 | | | $ | 10.68 | | | $ | 10.00 | |
| | | | | | |
Income (Loss) from Investment Operations: | | | | | | | | | | | | | | | | | | | | | | | | |
Net Investment Income (Loss)4 | | | 0.32 | | | | 0.34 | | | | 0.11 | | | | 0.29 | | | | 0.30 | | | | 0.10 | |
Net Gain (Loss) on Investments (Realized and Unrealized) | | | 0.40 | | | | 1.45 | | | | 0.67 | | | | 0.40 | | | | 1.45 | | | | 0.67 | |
Total from Investment Operations | | | 0.72 | | | | 1.79 | | | | 0.78 | | | | 0.69 | | | | 1.75 | | | | 0.77 | |
| | | | | | |
Less Distributions: | | | | | | | | | | | | | | | | | | | | | | | | |
Distributions from Net Investment Income | | | (0.34 | ) | | | (0.34 | ) | | | (0.10 | ) | | | (0.31 | ) | | | (0.31 | ) | | | (0.09 | ) |
Distributions from Net Realized Gain | | | (0.19 | ) | | | — | 5 | | | — | | | | (0.19 | ) | | | — | 5 | | | — | |
Total Distributions | | | (0.53 | ) | | | (0.34 | ) | | | (0.10 | ) | | | (0.50 | ) | | | (0.31 | ) | | | (0.09 | ) |
Net Asset Value, End of Period | | $ | 12.32 | | | $ | 12.13 | | | $ | 10.68 | | | $ | 12.31 | | | $ | 12.12 | | | $ | 10.68 | |
Total Return | | | 6.09% | | | | 16.96% | | | | 7.83% | 2 | | | 5.84% | | | | 16.60% | | | | 7.73% | 2 |
| | | | | | |
Supplemental Data: | | | | | | | | | | | | | | | | | | | | | | | | |
Net Assets, End of Period (000’s) | | $ | 673,308 | | | $ | 301,580 | | | $ | 30,061 | | | $ | 186,985 | | | $ | 78,834 | | | $ | 10,714 | |
Ratios to Average Net Assets: | | | | | | | | | | | | | | | | | | | | | | | | |
Expenses Before Advisory Fees (Waived)
and Other Fees (Reimbursed)/Recouped | | | 0.63% | | | | 0.82% | | | | 4.98% | 3 | | | 0.88% | | | | 1.07% | | | | 5.23% | 3 |
Expenses After Investment Advisory Fees (Waived) | | | 0.63% | | | | 0.79% | | | | 4.72% | 3 | | | 0.88% | | | | 1.04% | | | | 4.97% | 3 |
Expenses After Advisory Fees (Waived)
and Other Fees (Reimbursed)/Recouped | | | 0.63% | | | | 0.62% | | | | 0.39% | 3 | | | 0.88% | | | | 0.87% | | | | 0.64% | 3 |
Net Investment Income (Loss) | | | 2.66% | | | | 2.89% | | | | 2.64% | 3 | | | 2.41% | | | | 2.63% | | | | 2.35% | 3 |
Portfolio Turnover Rate | | | 67% | | | | 68% | | | | 120% | 2 | | | 67% | | | | 68% | | | | 120% | 2 |
| 1 | Commencement of operations on October 31, 2013. |
| 4 | Calculated based on average shares outstanding during the period. |
| 5 | Less than $0.005 per share. |
| | | | | | |
| 108 | | DoubleLine Funds Trust | | | | The accompanying notes are an integral part of these financial statements. |
| | | | | | | | | | | | | | | | |
| | | DoubleLine Flexible Income Fund | |
| | | Year Ended
March 31, 2016 | | | Period Ended
March 31, 20151 | | | Year Ended
March 31, 2016 | | | Period Ended
March 31, 20151 | |
| | | Class I | | | Class I | | | Class N | | | Class N | |
| | | | |
Net Asset Value, Beginning of Period | | $ | 9.99 | | | $ | 10.00 | | | $ | 9.99 | | | $ | 10.00 | |
| | | | |
Income (Loss) from Investment Operations: | | | | | | | | | | | | | | | | |
Net Investment Income (Loss)4 | | | 0.36 | | | | 0.42 | | | | 0.34 | | | | 0.40 | |
Net Gain (Loss) on Investments (Realized and Unrealized) | | | (0.40 | ) | | | (0.04 | ) | | | (0.40 | ) | | | (0.04 | ) |
Total from Investment Operations | | | (0.04 | ) | | | 0.38 | | | | (0.06 | ) | | | 0.36 | |
| | | | |
Less Distributions: | | | | | | | | | | | | | | | | |
Distributions from Net Investment Income | | | (0.40 | ) | | | (0.39 | ) | | | (0.38 | ) | | | (0.37 | ) |
Total Distributions | | | (0.40 | ) | | | (0.39 | ) | | | (0.38 | ) | | | (0.37 | ) |
Net Asset Value, End of Period | | $ | 9.55 | | | $ | 9.99 | | | $ | 9.55 | | | $ | 9.99 | |
Total Return | | | (0.43)% | | | | 3.85% | 2 | | | (0.66)% | | | | 3.63% | 2 |
| | | | |
Supplemental Data: | | | | | | | | | | | | | | | | |
Net Assets, End of Period (000’s) | | $ | 160,590 | | | $ | 57,511 | | | $ | 62,880 | | | $ | 27,417 | |
Ratios to Average Net Assets: | | | | | | | | | | | | | | | | |
Expenses Before Advisory Fees (Waived) and Other Fees (Reimbursed)/Recouped | | | 0.87% | | | | 1.33% | 3 | | | 1.12% | | | | 1.58% | 3 |
Expenses After Investment Advisory Fees (Waived) | | | 0.82% | | | | 1.27% | 3 | | | 1.07% | | | | 1.52% | 3 |
Expenses After Advisory Fees (Waived) and Other Fees (Reimbursed)/Recouped | | | 0.77% | | | | 0.76% | 3 | | | 1.02% | | | | 1.01% | 3 |
Net Investment Income (Loss) | | | 3.75% | | | | 4.26% | 3 | | | 3.50% | | | | 4.08% | 3 |
Portfolio Turnover Rate | | | 42% | | | | 55% | 2 | | | 42% | | | | 55% | 2 |
| 1 | Commencement of operations on April 7, 2014. |
| 4 | Calculated based on average shares outstanding during the period. |
| | | | | | |
| The accompanying notes are an integral part of these financial statements. | | Annual Report | | March 31, 2016 | | 109 |
| | |
| Financial Highlights (Cont.) | | March 31, 2016 |
| | | | | | | | | | | | | | | | |
| | | DoubleLine Low Duration Emerging Markets Fixed Income Fund | |
| | | Year Ended March 31, 2016 | | | Period Ended
March 31, 20151 | | | Year Ended March 31, 2016 | | | Period Ended
March 31, 20151 | |
| | | Class I | | | Class I | | | Class N | | | Class N | |
| | | | |
Net Asset Value, Beginning of Period | | $ | 9.83 | | | $ | 10.00 | | | $ | 9.84 | | | $ | 10.00 | |
| | | | |
Income (Loss) from Investment Operations: | | | | | | | | | | | | | | | | |
Net Investment Income (Loss)4 | | | 0.33 | | | | 0.37 | | | | 0.31 | | | | 0.35 | |
Net Gain (Loss) on Investments (Realized and Unrealized) | | | (0.23 | ) | | | (0.17 | ) | | | (0.23 | ) | | | (0.17 | ) |
Total from Investment Operations | | | 0.10 | | | | 0.20 | | | | 0.08 | | | | 0.18 | |
| | | | |
Less Distributions: | | | | | | | | | | | | | | | | |
Distributions from Net Investment Income | | | (0.34 | ) | | | (0.36 | ) | | | (0.32 | ) | | | (0.33 | ) |
Distributions from Net Realized Gain | | | — | | | | (0.01 | ) | | | — | | | | (0.01 | ) |
Total Distributions | | | (0.34 | ) | | | (0.37 | ) | | | (0.32 | ) | | | (0.34 | ) |
Net Asset Value, End of Period | | $ | 9.59 | | | $ | 9.83 | | | $ | 9.60 | | | $ | 9.84 | |
Total Return | | | 1.06% | | | | 1.92% | 2 | | | 0.82% | | | | 1.80% | 2 |
| | | | |
Supplemental Data: | | | | | | | | | | | | | | | | |
Net Assets, End of Period (000’s) | | $ | 66,797 | | | $ | 64,891 | | | $ | 118,802 | | | $ | 79,419 | |
Ratios to Average Net Assets: | | | | | | | | | | | | | | | | |
Expenses Before Advisory Fees (Waived) and Other Fees (Reimbursed)/Recouped | | | 0.84% | | | | 0.91% | 3 | | | 1.09% | | | | 1.16% | 3 |
Expenses After Investment Advisory Fees (Waived) | | | 0.84% | | | | 0.91% | 3 | | | 1.09% | | | | 1.16% | 3 |
Expenses After Advisory Fees (Waived) and Other Fees (Reimbursed)/Recouped | | | 0.59% | | | | 0.59% | 3 | | | 0.84% | | | | 0.84% | 3 |
Net Investment Income (Loss) | | | 3.44% | | | | 3.80% | 3 | | | 3.19% | | | | 3.58% | 3 |
Portfolio Turnover Rate | | | 39% | | | | 21% | 2 | | | 39% | | | | 21% | 2 |
| 1 | Commencement of operations on April 7, 2014. |
| 4 | Calculated based on average shares outstanding during the period. |
| | | | | | |
| 110 | | DoubleLine Funds Trust | | | | The accompanying notes are an integral part of these financial statements. |
| | | | | | | | | | | | | | | | |
| | | DoubleLine Long Duration Total Return Bond Fund | |
| | | Year Ended March 31, 2016 | | | Period Ended
March 31, 20151 | | | Year Ended March 31, 2016 | | | Period Ended
March 31, 20151 | |
| | | Class I | | | Class I | | | Class N | | | Class N | |
| | | | |
Net Asset Value, Beginning of Period | | $ | 10.43 | | | $ | 10.00 | | | $ | 10.42 | | | $ | 10.00 | |
| | | | |
Income (Loss) from Investment Operations: | | | | | | | | | | | | | | | | |
Net Investment Income (Loss)4 | | | 0.29 | | | | 0.10 | | | | 0.26 | | | | 0.09 | |
Net Gain (Loss) on Investments (Realized and Unrealized) | | | (0.02 | ) | | | 0.41 | | | | (0.02 | ) | | | 0.41 | |
Total from Investment Operations | | | 0.27 | | | | 0.51 | | | | 0.24 | | | | 0.50 | |
| | | | |
Less Distributions: | | | | | | | | | | | | | | | | |
Distributions from Net Investment Income | | | (0.29 | ) | | | (0.08 | ) | | | (0.26 | ) | | | (0.08 | ) |
Distributions from Net Realized Gain | | | (0.01 | ) | | | — | | | | (0.01 | ) | | | — | |
Total Distributions | | | (0.30 | ) | | | (0.08 | ) | | | (0.27 | ) | | | (0.08 | ) |
Net Asset Value, End of Period | | $ | 10.40 | | | $ | 10.43 | | | $ | 10.39 | | | $ | 10.42 | |
Total Return | | | 2.76% | | | | 5.15% | 2 | | | 2.51% | | | | 4.99% | 2 |
| | | | |
Supplemental Data: | | | | | | | | | | | | | | | | |
Net Assets, End of Period (000’s) | | $ | 56,843 | | | $ | 56,240 | | | $ | 25,763 | | | $ | 19,572 | |
Ratios to Average Net Assets: | | | | | | | | | | | | | | | | |
Expenses Before Advisory Fees (Waived) and Other Fees (Reimbursed)/Recouped | | | 0.84% | | | | 1.33% | 3 | | | 1.09% | | | | 1.58% | 3 |
Expenses After Investment Advisory Fees (Waived) | | | 0.84% | | | | 1.33% | 3 | | | 1.09% | | | | 1.58% | 3 |
Expenses After Advisory Fees (Waived) and Other Fees (Reimbursed)/Recouped | | | 0.65% | | | | 0.65% | 3 | | | 0.90% | | | | 0.90% | 3 |
Net Investment Income (Loss) | | | 2.87% | | | | 3.02% | 3 | | | 2.62% | | | | 3.00% | 3 |
Portfolio Turnover Rate | | | 52% | | | | 72% | 2 | | | 52% | | | | 72% | 2 |
| 1 | Commencement of operations on December 15, 2014. |
| 4 | Calculated based on average shares outstanding during the period. |
| | | | | | |
| The accompanying notes are an integral part of these financial statements. | | Annual Report | | March 31, 2016 | | 111 |
| | |
| Financial Highlights (Cont.) | | March 31, 2016 |
| | | | | | | | |
| | | DoubleLine Strategic Commodity Fund
(Consolidated) | |
| | | Period Ended
March 31, 20161 | | | Period Ended
March 31, 20161 | |
| | | Class I | | | Class N | |
| | |
Net Asset Value, Beginning of Period | | $ | 10.00 | | | $ | 10.00 | |
| | |
Income (Loss) from Investment Operations: | | | | | | | | |
Net Investment Income (Loss)4 | | | (0.07 | ) | | | (0.09 | ) |
Net Gain (Loss) on Investments (Realized and Unrealized) | | | (1.24 | ) | | | (1.24 | ) |
Total from Investment Operations | | | (1.31 | ) | | | (1.33 | ) |
| | |
Less Distributions: | | | | | | | | |
Distributions from Net Realized Gain | | | — | 5 | | | — | 5 |
Total Distributions | | | — | 5 | | | — | 5 |
Net Asset Value, End of Period | | $ | 8.69 | | | $ | 8.67 | |
Total Return | | | (13.07)% | 2 | | | (13.27)% | 2 |
| | |
Supplemental Data: | | | | | | | | |
Net Assets, End of Period (000’s) | | $ | 27,997 | | | $ | 1,421 | |
Ratios to Average Net Assets: | | | | | | | | |
Expenses Before Advisory Fees (Waived) and Other Fees (Reimbursed)/Recouped | | | 4.42% | 3 | | | 4.67% | 3 |
Expenses After Investment Advisory Fees (Waived) | | | 4.42% | 3 | | | 4.67% | 3 |
Expenses After Advisory Fees (Waived) and Other Fees (Reimbursed)/Recouped | | | 1.06% | 3 | | | 1.31% | 3 |
Net Investment Income (Loss) | | | (1.05)% | 3 | | | (1.30)% | 3 |
Portfolio Turnover Rate | | | 0% | 2 | | | 0% | 2 |
| 1 | Commencement of operations on May 18, 2015. |
| 4 | Calculated based on average shares outstanding during the period. |
| 5 | Less than $0.005 per share. |
| | | | | | |
| 112 | | DoubleLine Funds Trust | | | | The accompanying notes are an integral part of these financial statements. |
| | | | | | | | |
| | | DoubleLine Global Bond Fund | |
| | | Period Ended
March 31, 20161 | | | Period Ended
March 31, 20161 | |
| | | Class I | | | Class N | |
| | |
Net Asset Value, Beginning of Period | | $ | 10.00 | | | $ | 10.00 | |
| | |
Income (Loss) from Investment Operations: | | | | | | | | |
Net Investment Income (Loss)4 | | | 0.02 | | | | 0.02 | |
Net Gain (Loss) on Investments (Realized and Unrealized) | | | 0.49 | | | | 0.49 | |
Total from Investment Operations | | | 0.51 | | | | 0.51 | |
| | |
Less Distributions: | | | | | | | | |
Distributions from Net Investment Income | | | (0.02 | ) | | | (0.02 | ) |
Total Distributions | | | (0.02 | ) | | | (0.02 | ) |
Net Asset Value, End of Period | | $ | 10.49 | | | $ | 10.49 | |
Total Return | | | 5.11% | 2 | | | 5.07% | 2 |
| | |
Supplemental Data: | | | | | | | | |
Net Assets, End of Period (000’s) | | $ | 94,631 | | | $ | 41,937 | |
Ratios to Average Net Assets: | | | | | | | | |
Expenses Before Advisory Fees (Waived) and Other Fees (Reimbursed)/Recouped | | | 1.29% | 3 | | | 1.54% | 3 |
Expenses After Investment Advisory Fees (Waived) | | | 1.29% | 3 | | | 1.54% | 3 |
Expenses After Advisory Fees (Waived) and Other Fees (Reimbursed)/Recouped | | | 0.70% | 3 | | | 0.95% | 3 |
Net Investment Income (Loss) | | | 0.83% | 3 | | | 0.58% | 3 |
Portfolio Turnover Rate | | | 13% | 2 | | | 13% | 2 |
| 1 | Commencement of operations on December 17, 2015. |
| 4 | Calculated based on average shares outstanding during the period. |
| | | | | | |
| The accompanying notes are an integral part of these financial statements. | | Annual Report | | March 31, 2016 | | 113 |
| | |
| Notes to Financial Statements | | March 31, 2016 |
1. Organization
DoubleLine Funds Trust, a Delaware statutory trust (the “Trust”), is an open-end investment management company registered under the Investment Company Act of 1940, as amended (the “1940 Act”). The Trust consists of 13 funds, DoubleLine Total Return Bond Fund, DoubleLine Core Fixed Income Fund, DoubleLine Emerging Markets Fixed Income Fund, DoubleLine Multi-Asset Growth Fund, DoubleLine Low Duration Bond Fund, DoubleLine Floating Rate Fund, DoubleLine Shiller Enhanced CAPE®, DoubleLine Flexible Income Fund, DoubleLine Low Duration Emerging Markets Fixed Income Fund, DoubleLine Selective Credit Fund, Doubleline Long Duration Total Return Bond Fund, DoubleLine Strategic Commodity Fund and DoubleLine Global Bond Fund (each, a “Fund” and, collectively, the “Funds”). For financial information related to the DoubleLine Selective Credit Fund, please refer to the DoubleLine Selective Credit Fund’s separate annual report.
The Funds’ investment objectives and commencement of operations of each share class are as follows:
| | | | | | | | | | | | | | | | | | |
| | | | | | | | | Commencement of Operations | |
| Fund Name | | | | Investment Objective | | | | I Shares | | | N Shares | | | A Shares | |
DoubleLine Total Return Bond Fund | | | | Maximize total return | | | | | 4/6/2010 | | | | 4/6/2010 | | | | — | |
DoubleLine Core Fixed Income Fund | | | | Maximize current income and total return | | | | | 6/1/2010 | | | | 6/1/2010 | | | | — | |
DoubleLine Emerging Markets Fixed Income Fund | | | | Seek high total return from current income and capital appreciation | | | | | 4/6/2010 | | | | 4/6/2010 | | | | — | |
DoubleLine Multi-Asset Growth Fund (Consolidated) | | | | Seek long-term capital appreciation | | | | | 12/20/2010 | | | | — | | | | 12/20/2010 | |
DoubleLine Low Duration Bond Fund | | | | Seek current income | | | | | 9/30/2011 | | | | 9/30/2011 | | | | — | |
DoubleLine Floating Rate Fund | | | | Seek high level of current income | | | | | 2/1/2013 | | | | 2/1/2013 | | | | — | |
DoubleLine Shiller Enhanced CAPE® | | | | Seek total return which exceeds the total return of its benchmark index | | | | | 10/31/2013 | | | | 10/31/2013 | | | | — | |
DoubleLine Flexible Income Fund | | | | Seek long-term total return while striving to generate current income | | | | | 4/7/2014 | | | | 4/7/2014 | | | | — | |
DoubleLine Low Duration Emerging Markets Fixed Income Fund | | | | Seek long-term total return | | | | | 4/7/2014 | | | | 4/7/2014 | | | | — | |
DoubleLine Long Duration Total Return Bond Fund | | | | Seek long-term total return | | | | | 12/15/2014 | | | | 12/15/2014 | | | | — | |
DoubleLine Strategic Commodity Fund (Consolidated) | | | | Seek long-term total return | | | | | 5/18/2015 | | | | 5/18/2015 | | | | — | |
DoubleLine Global Bond Fund | | | | Seek long-term total return | | | | | 12/17/2015 | | | | 12/17/2015 | | | | — | |
2. Significant Accounting Policies
Each Fund is an investment company that applies the accounting and reporting guidance issued in Topic 946, “Financial Services—Investment Companies”, by the Financial Accounting Standards Board (“FASB”). The following is a summary of the significant accounting policies of the Funds. These policies are in conformity with accounting principles generally accepted in the United States of America (“US GAAP”).
A. Security Valuation. The Funds have adopted US GAAP fair value accounting standards which establish a definition of fair value and set out a hierarchy for measuring fair value. These standards require additional disclosures about the various inputs and valuation techniques used to develop the measurements of fair value and a discussion of changes in valuation techniques and related inputs during the period. These inputs are summarized in the three broad levels listed below:
| | • | | Level 1—Unadjusted quoted market prices in active markets for identical securities |
| | • | | Level 2—Quoted prices for identical or similar assets in markets that are not active, or inputs derived from observable market data |
| | • | | Level 3—Significant unobservable inputs (including the reporting entity’s estimates and assumptions) |
Assets and liabilities may be transferred between levels. The Funds use end of period timing recognition to account for any transfers.
Market values for domestic and foreign fixed income securities are normally determined on the basis of valuations provided by independent pricing services. Vendors typically value such securities based on one or more inputs described in the following table which is not intended to be a complete list. The table provides examples of inputs that are commonly relevant for valuing particular classes of fixed income securities in which the Funds are authorized to invest. However, these classifications are not exclusive, and any of the inputs may be used to value any other class of fixed-income securities. Securities that use similar valuation techniques and inputs as described in the following table are categorized as Level 2 of the fair value hierarchy. To the extent the significant inputs are unobservable, the values generally would be categorized as Level 3.
| | | | | | |
| 114 | | DoubleLine Funds Trust | | | | |
| | | | |
| Fixed-income class | | | | Examples of Inputs |
All | | | | Benchmark yields, transactions, bids, offers, quotations from dealers and trading systems, new issues, spreads and other relationships observed in the markets among comparable securities; and pricing models such as yield measures calculated using factors such as cash flows, financial or collateral performance and other reference data (collectively referred to as “standard inputs”) |
Corporate bonds and notes; convertible securities | | | | Standard inputs and underlying equity of the issuer |
US bonds and notes of government and government agencies | | | | Standard inputs |
Residential and commercial mortgage-backed obligations; asset-backed obligations (including collateralized loan obligations) | | | | Standard inputs and cash flows, prepayment information, default rates, delinquency and loss assumptions, collateral characteristics, credit enhancements and specific deal information, trustee reports |
Bank loans | | | | Standard inputs |
Investments in registered open-end management investment companies will be valued based upon the net asset value (“NAV”) of such investments and are categorized as Level 1 of the fair value hierarchy. Investments in private investment funds typically will be valued based upon the NAVs of such investments and are categorized as Level 2 of the fair value hierarchy. As of March 31, 2016, the Funds did not hold any investments in private investment funds.
Common stocks, exchange-traded funds and financial derivative instruments, such as futures contracts or options contracts, that are traded on a national securities or commodities exchange, are typically valued at the last reported sales price, in the case of common stocks and exchange-traded funds, or, in the case of futures contracts or options contracts, the settlement price determined by the relevant exchange. To the extent these securities are actively traded and valuation adjustments are not applied, they are categorized as Level 1 of the fair value hierarchy.
Over-the-counter financial derivative instruments, such as forward currency exchange contracts, options contracts, futures, or swaps agreements, derive their values from underlying asset prices, indices, reference rates, other inputs or a combination of these factors. These instruments are normally valued on the basis of evaluations provided by independent pricing services or broker dealer quotations. Depending on the instrument and the terms of the transaction, the value of the derivative instruments can be estimated by a pricing service provider using a series of techniques, such as simulation pricing models. The pricing models use issuer details and other inputs that are observed from actively quoted markets such as indices, spreads, interest rates, curves, dividends and exchange rates. Derivatives that use similar valuation techniques and inputs as described above are normally categorized as Level 2 of the fair value hierarchy.
Securities may be fair valued in accordance with the fair valuation procedures approved by the Board of Trustees (the “Board”). The Valuation Committee is generally responsible for overseeing the day to day valuation processes and reports periodically to the Board. The Valuation Committee and the Pricing Group are authorized to make all necessary determinations of the fair values of portfolio securities and other assets for which market quotations are not readily available or if it is deemed that the prices obtained from brokers and dealers or independent pricing services are deemed to be unreliable indicators of market or fair value.
| | | | | | |
| | Annual Report | | March 31, 2016 | | 115 |
| | |
| Notes to Financial Statements (Cont.) | | March 31, 2016 |
The following is a summary of the fair valuations according to the inputs used to value the Funds’ investments as of March 31, 20161:
| | | | | | | | | | | | | | | | | | | | | | | | | | |
| Category | | | | DoubleLine
Total Return
Bond Fund | | | DoubleLine
Core Fixed
Income Fund | | | DoubleLine
Emerging
Markets Fixed
Income Fund | | | DoubleLine
Multi-Asset
Growth Fund
(Consolidated) | | | DoubleLine
Low Duration
Bond Fund | | | DoubleLine
Floating
Rate Fund | |
Investments in Securities | | | | | | | | | | | | | | | | | | | | | | | | | | |
Level 1 | | | | | | | | | | | | | | | | | | | | | | | | | | |
Money Market Funds | | | | $ | 660,910,419 | | | $ | 308,501,997 | | | $ | 471 | | | $ | 57,219,814 | | | $ | 59,350,966 | | | $ | 40,848,297 | |
Affiliated Mutual Funds | | | | | — | | | | 137,656,164 | | | | — | | | | 37,138,819 | | | | 47,950,000 | | | | — | |
Exchange Traded Funds and Common Stock | | | | | — | | | | — | | | | — | | | | 22,133,363 | | | | — | | | | — | |
Real Estate Investment Trusts | | | | | — | | | | — | | | | — | | | | 4,483,872 | | | | — | | | | — | |
Purchased Options | | | | | — | | | | — | | | | — | | | | 365,000 | | | | | | | | | |
Total Level 1 | | | | | 660,910,419 | | | | 446,158,161 | | | | 471 | | | | 121,340,868 | | | | 107,300,966 | | | | 40,848,297 | |
Level 2 | | | | | | | | | | | | | | | | | | | | | | | | | | |
US Government / Agency Mortgage Backed Obligations | | | | | 28,199,031,981 | | | | 1,031,594,774 | | | | — | | | | 5,675,840 | | | | 53,779,247 | | | | — | |
Non-Agency Residential Collateralized Mortgage Obligations | | | | | 11,991,462,032 | | | | 462,363,385 | | | | — | | | | 9,537,579 | | | | 332,366,184 | | | | — | |
Other Short Term Investments | | | | | 6,288,664,886 | | | | — | | | | — | | | | — | | | | — | | | | — | |
Non-Agency Commercial Mortgage Backed Obligations | | | | | 4,160,981,697 | | | | 399,917,625 | | | | — | | | | — | | | | 591,112,443 | | | | — | |
Collateralized Loan Obligations | | | | | 2,613,803,650 | | | | 217,425,390 | | | | — | | | | 5,548,047 | | | | 567,864,108 | | | | — | |
US Government Bonds and Notes | | | | | 2,057,177,150 | | | | 1,535,852,249 | | | | — | | | | 1,572,783 | | | | 300,457,504 | | | | — | |
Asset Backed Obligations | | | | | 1,250,671,030 | | | | 72,011,859 | | | | — | | | | 3,724,012 | | | | 69,219,260 | | | | — | |
US Corporate Bonds | | | | | — | | | | 826,666,191 | | | | — | | | | — | | | | 278,228,404 | | | | — | |
Foreign Corporate Bonds | | | | | — | | | | 720,585,576 | | | | 697,910,953 | | | | — | | | | 489,919,812 | | | | — | |
Bank Loans | | | | | — | | | | 151,036,513 | | | | — | | | | — | | | | — | | | | 264,642,278 | |
Foreign Government Bonds and Notes, Supranationals and Foreign Agencies | | | | | — | | | | 33,313,100 | | | | 34,310,000 | | | | — | | | | 21,557,500 | | | | — | |
Municipal Bonds | | | | | — | | | | 10,761,999 | | | | — | | | | 1,725,000 | | | | — | | | | — | |
Total Level 2 | | | | | 56,561,792,426 | | | | 5,461,528,661 | | | | 732,220,953 | | | | 27,783,261 | | | | 2,704,504,462 | | | | 264,642,278 | |
Level 3 | | | | | | | | | | | | | | | | | | | | | | | | | | |
Non-Agency Residential Collateralized Mortgage Obligations | | | | | 180,048,302 | | | | 4,690,830 | | | | — | | | | — | | | | 10,897,422 | | | | — | |
Asset Backed Obligations | | | | | 113,426,466 | | | | — | | | | — | | | | — | | | | 4,974,845 | | | | — | |
Collateralized Loan Obligations | | | | | 31,750,950 | | | | — | | | | — | | | | — | | | | — | | | | — | |
Total Level 3 | | | | | 325,225,718 | | | | 4,690,830 | | | | — | | | | — | | | | 15,872,267 | | | | — | |
Total | | | | $ | 57,547,928,563 | | | $ | 5,912,377,652 | | | $ | 732,221,424 | | | $ | 149,124,129 | | | $ | 2,827,677,695 | | | $ | 305,490,575 | |
Other Financial Instruments | | | | | | | | | | | | | | | | | | | | | | | | | | |
Level 1 | | | | | | | | | | | | | | | | | | | | | | | | | | |
Futures Contracts | | | | $ | — | | | $ | — | | | $ | — | | | $ | 190,229 | | | $ | — | | | $ | — | |
Written Options | | | | | — | | | | — | | | | — | | | | 179,000 | | | | — | | | | — | |
Total Level 1 | | | | | — | | | | — | | | | — | | | | 369,229 | | | | — | | | | — | |
Level 2 | | | | | | | | | | | | | | | | | | | | | | | | | | |
Total Return Swaps | | | | | — | | | | — | | | | — | | | | — | | | | — | | | | — | |
Forward Currency Exchange Contracts | | | | | — | | | | — | | | | — | | | | 89,118 | | | | — | | | | — | |
Total Level 2 | | | | | — | | | | — | | | | — | | | | 89,118 | | | | — | | | | — | |
Level 3 | | | | | — | | | | — | | | | — | | | | — | | | | — | | | | — | |
Total | | | | $ | — | | | $ | — | | | $ | — | | | $ | 458,347 | | | $ | — | | | $ | — | |
| | | | | | |
| 116 | | DoubleLine Funds Trust | | | | |
| | | | | | | | | | | | | | | | | | | | | | | | | | |
| Category | | | | DoubleLine
Shiller
Enhanced
CAPE® | | | DoubleLine
Flexible
Income Fund | | | DoubleLine
Low Duration
Emerging
Markets Fixed
Income Fund | | | DoubleLine
Long Duration
Total Return
Bond Fund | | | DoubleLine
Strategic
Commodity
Fund
(Consolidated) | | | DoubleLine
Global
Bond Fund | |
Investments in Securities | | | | | | | | | | | | | | | | | | | | | | | | | | |
Level 1 | | | | | | | | | | | | | | | | | | | | | | | | | | |
Money Market Funds | | | | $ | 45,026,142 | | | $ | 5,694,591 | | | $ | 1,061,164 | | | $ | 5,889,472 | | | $ | 3,237,898 | | | $ | 4,732,390 | |
Affiliated Mutual Funds | | | | | — | | | | 21,755,488 | | | | — | | | | — | | | | — | | | | — | |
Total Level 1 | | | | | 45,026,142 | | | | 27,450,079 | | | | 1,061,164 | | | | 5,889,472 | | | | 3,237,898 | | | | 4,732,390 | |
Level 2 | | | | | | | | | | | | | | | | | | | | | | | | | | |
US Government Bonds and Notes | | | | | 149,929,730 | | | | 15,015,679 | | | | — | | | | 19,318,127 | | | | — | | | | 43,001,698 | |
Collateralized Loan Obligations | | | | | 143,334,699 | | | | 41,492,677 | | | | — | | | | — | | | | — | | | | — | |
Non-Agency Commercial Mortgage Backed Obligations | | | | | 137,025,571 | | | | 26,934,495 | | | | — | | | | — | | | | — | | | | — | |
Non-Agency Residential Collateralized Mortgage Obligations | | | | | 93,019,662 | | | | 47,455,764 | | | | — | | | | — | | | | — | | | | — | |
Foreign Corporate Bonds | | | | | 92,666,389 | | | | 32,741,695 | | | | 166,186,703 | | | | — | | | | — | | | | — | |
US Corporate Bonds | | | | | 68,113,478 | | | | 10,694,797 | | | | — | | | | — | | | | — | | | | — | |
US Government / Agency Mortgage Backed Obligations | | | | | 36,489,211 | | | | 4,892,511 | | | | — | | | | 57,294,967 | | | | — | | | | — | |
Bank Loans | | | | | 20,558,252 | | | | — | | | | — | | | | — | | | | — | | | | — | |
Asset Backed Obligations | | | | | 16,182,634 | | | | 2,356,801 | | | | — | | | | — | | | | — | | | | — | |
Foreign Government Bonds and Notes, Supranationals and Foreign Agencies | | | | | 5,646,500 | | | | 1,567,500 | | | | 14,874,375 | | | | — | | | | — | | | | 88,175,731 | |
Other Short Term Investments | | | | | — | | | | — | | | | — | | | | — | | | | 25,973,520 | | | | — | |
Total Level 2 | | | | | 762,966,126 | | | | 183,151,919 | | | | 181,061,078 | | | | 76,613,094 | | | | 25,973,520 | | | | 131,177,429 | |
Level 3 | | | | | | | | | | | | | | | | | | | | | | | | | | |
Non-Agency Residential Collateralized Mortgage Obligations | | | | | 1,536,982 | | | | 557,573 | | | | — | | | | — | | | | — | | | | — | |
Asset Backed Obligations | | | | | — | | | | 994,969 | | | | — | | | | — | | | | — | | | | — | |
Total Level 3 | | | | | 1,536,982 | | | | 1,552,542 | | | | — | | | | — | | | | — | | | | — | |
Total | | | | $ | 809,529,250 | | | $ | 212,154,540 | | | $ | 182,122,242 | | | $ | 82,502,566 | | | $ | 29,211,418 | | | $ | 135,909,819 | |
Other Financial Instruments | | | | | | | | | | | | | | | | | | | | | | | | | | |
Level 1 | | | | $ | — | | | $ | — | | | $ | — | | | $ | — | | | $ | — | | | $ | — | |
Total Level 1 | | | | | — | | | | — | | | | — | | | | — | | | | — | | | | — | |
Level 2 | | | | | | | | | | | | | | | | | | | | | | | | | | |
Total Return Swaps | | | | | 45,566,002 | | | | — | | | | — | | | | — | | | | — | | | | — | |
Excess Return Swaps | | | | | — | | | | — | | | | — | | | | — | | | | 443,932 | | | | — | |
Total Level 2 | | | | | 45,566,002 | | | | — | | | | — | | | | — | | | | 443,932 | | | | — | |
Level 3 | | | | | — | | | | — | | | | — | | | | — | | | | — | | | | — | |
Total | | | | $ | 45,566,002 | | | $ | — | | | $ | — | | | $ | — | | | $ | 443,932 | | | $ | — | |
See the Schedules of Investments for further disaggregation of investment categories.
| 1 | There were no transfers into or out of Level 1 during the period ended March 31, 2016. |
B. Federal Income Taxes. Each Fund has elected to be taxed as a “regulated investment company” and intends to distribute substantially all of its taxable income to its shareholders and otherwise comply with the provisions of Subchapter M of the Internal Revenue Code applicable to regulated investment companies. Therefore, no provision for federal income taxes has been made.
The Funds may be subject to a nondeductible 4% excise tax calculated as a percentage of certain undistributed amounts of net investment income and net capital gains.
The Funds have adopted financial reporting rules that require the Funds to analyze all open tax years, as defined by the applicable statute of limitations, for all major jurisdictions. Open tax years, 2015, 2014 and 2013 for the Funds, are those that are open for exam by taxing authorities. As of March 31, 2016 the Funds have no examinations in progress.
Management has analyzed the Funds’ tax positions, and has concluded that no liability should be recorded related to uncertain tax positions expected to be taken on the tax return for the fiscal year-ended March 31, 2016. The Funds identify their major tax jurisdictions as U.S. Federal, the State of Delaware and the State of California. The Funds are not aware of any tax positions for which it is reasonably possible that the total amounts of unrecognized tax benefits will significantly change in the next twelve months.
| | | | | | |
| | Annual Report | | March 31, 2016 | | 117 |
| | |
| Notes to Financial Statements (Cont.) | | March 31, 2016 |
C. Security Transactions, Investment Income. Investment securities transactions are accounted for on trade date. Gains and losses realized on sales of securities are determined on a specific identification basis. Interest income is recorded on an accrual basis. Discounts/premiums on debt securities purchased are accreted/amortized over the life of the respective securities using the effective interest method except for certain deep discount bonds where management does not expect the par value above the bond’s cost to be fully realized. Dividend income and corporate action transactions, if any, are recorded on the ex-date. Non-cash dividends included in dividend income, if any, are recorded at the fair market value of securities received. Paydown gains and losses on mortgage-related and other asset-backed securities are recorded as components of interest income on the Statements of Operations.
D. Foreign Currency Translation. The Funds’ books and records are maintained in U.S. dollars. Investment securities and other assets and liabilities denominated in foreign currencies are translated into U.S. dollars based on the exchange rate of such currencies against U.S. dollars on the date of valuation. Investment securities transactions, income and expense items denominated in foreign currencies are translated into U.S. dollars at the exchange rate in effect on the transaction date. The Funds’ do not isolate changes in the exchange rates from the changes in the market prices of investments held or sold for financial reporting purposes. Accordingly, the effects of changes in exchange rates on investments are not segregated in the Statement of Operations from the effects of changes in market prices of those investments, but are included as a component of net realized and unrealized gain (loss) from investments.
E. Dividends and Distributions to Shareholders. With the exception of the DoubleLine Multi-Asset Growth Fund and the DoubleLine Strategic Commodity Fund, dividends from net investment income will be declared and paid monthly. Dividends from the net investment income of the DoubleLine Multi-Asset Growth Fund will be declared and paid quarterly and of the DoubleLine Strategic Commodity Fund will be declared and paid annually. The Funds will distribute any net realized long or short-term capital gains at least annually. Distributions are recorded on the ex-dividend date.
Income and capital gain distributions are determined in accordance with income tax regulations which may differ from US GAAP. Permanent book and tax basis differences relating to shareholder distributions will result in reclassifications between paid-in capital, undistributed net investment income (loss), and/or undistributed (accumulated) realized gain (loss). Undistributed net investment income or loss may include temporary book and tax basis differences which will reverse in a subsequent period. Any taxable income or capital gain remaining at fiscal year end is distributed in the following year.
Distributions from investment companies will be classified as investment income or realized gains in the Statements of Operations based on the U.S. income tax characteristics of the distribution if such information is available. In cases where the tax characteristics are not available, such distributions are generally classified as investment income.
F. Use of Estimates. The preparation of financial statements in conformity with US GAAP requires management to make estimates and assumptions that affect the reported amounts of assets and liabilities and disclosure of contingent assets and liabilities at the date of the financial statements, as well as the reported amounts of revenues and expenses during the period. Actual results could differ from those estimates.
G. Share Valuation. The NAV per share of a class of shares of a Fund is calculated by dividing the sum of the value of the securities held by the Fund, plus cash and other assets, attributable to that class, minus all liabilities (including estimated accrued expenses) attributable to that class by the total number of shares of that class outstanding, rounded to the nearest cent. The Funds’ NAV is calculated on days when the New York Stock Exchange opens for regular trading (except that the Funds, other than DoubleLine Strategic Commodity Fund, do not calculate their NAV on holidays when the principal U.S. bond markets are closed, such as Columbus Day and Veterans Day).
H. Unfunded Loan Commitments. The Funds may enter into certain credit agreements, of which all or a portion may be unfunded. These commitments are disclosed in the accompanying Schedule of Investments. The Funds are obligated to fund these commitments at the borrower’s discretion. The Funds generally will maintain with their custodian liquid investments having an aggregate value at least equal to the par value of unfunded loan commitments.
I. Guarantees and Indemnifications. Under the Trust’s organizational documents, each Trustee and officer of the Funds is indemnified, to the extent permitted by the 1940 Act, against certain liabilities that may arise out of performance of their duties to the Fund. Additionally, in the normal course of business, the Funds enter into contracts that contain a variety of indemnification clauses. Each Fund’s maximum exposure under these arrangements is unknown as this would involve future claims that may be made against the Funds that have not yet occurred. However, the Funds have not had prior claims or losses pursuant to these contracts.
J. Basis for Consolidation The DoubleLine Multi-Asset Growth Fund and the DoubleLine Strategic Commodity Fund may invest up to 25% of their total assets in the DoubleLine Cayman Multi-Asset Growth Fund I, Ltd. and DoubleLine Strategic Commodity Ltd. (each, a “Subsidiary” and, collectively, the “Subsidiaries”), respectively. The Subsidiaries, which are organized under the laws of the Cayman Islands, are wholly-owned and controlled by each respective Fund. Each Subsidiary invests in commodity-related investments and other investments. The consolidated financial statements include the accounts and balances of each Fund and its respective Subsidiary. Intercompany balances and transactions have been eliminated in consolidation.
| | | | | | |
| 118 | | DoubleLine Funds Trust | | | | |
As of March 31, 2016, the relationship of the Subsidiary to each respective Fund was as follows:
| | | | | | | | | | |
| | | | | DoubleLine
Multi-Asset
Growth Fund
(Consolidated) | | | DoubleLine
Strategic
Commodity
Fund
(Consolidated) | |
Commencement of Operations | | | | | 6/15/2011 | | | | 5/18/2015 | |
Fund Net Assets | | | | | 155,880,995 | | | | 29,418,464 | |
Subsidiary % of Fund Net Assets | | | | | 7.27% | | | | 22.17% | |
Subsidiary Financial Statement Information | | | | | | | | | | |
Net Assets | | | | | 11,337,873 | | | | 6,523,126 | |
Total Income | | | | | 6,493 | | | | 4,979 | |
Net Realized Gain/(Loss) | | | | | 1,126,162 | | | | (541,104 | ) |
K. Other. Each share class of a Fund is charged for those expenses that are directly attributable to that share class. Expenses that are not directly attributable to a Fund are allocated among all appropriate Funds in proportion to their respective net assets or on another reasonable basis. Investment income, expenses which are not class-specific, and realized and unrealized gains and losses are allocated directly to each class based upon the relative net assets of the classes.
3. Related and Other Party Transactions
DoubleLine Capital LP and DoubleLine Commodity LP (each, an “Adviser” and, collectively, the “Advisers”) provide the Funds with investment management services under investment management agreements (the “Agreements”). Under the Agreements, each Adviser manages the investment of the assets of each Fund, places orders for the purchase and sale of its portfolio securities and is responsible for providing certain resources to assist with the day-to-day management of the Trust’s business affairs. As compensation for its services, each Adviser is entitled to a monthly fee at the annual rates of the average daily net assets of the Funds (the “Advisory Fee”) in the following table. Each Adviser has arrangements with DoubleLine Group LP to provide personnel and other resources to the Funds.
Each Adviser has contractually agreed to limit the Funds’ ordinary operating expenses so that its ratio of such expenses to average net assets will not exceed the following ratios (the “Expense Caps”). For the purposes of the expense limitation agreement between each Adviser and the Funds, “ordinary operating expenses” excludes taxes, commissions, mark-ups, litigation expenses, indemnification expenses, interest expenses, acquired fund fees and expenses, and any extraordinary expenses. With the exception of DoubleLine Long Duration Total Return Bond Fund, DoubleLine Strategic Commodity Fund and DoubleLine Global Bond Fund, each Fund’s expense limitation is expected to apply until at least July 31, 2016. DoubleLine Long Duration Total Return Bond Fund’s expense limitation is expected to apply until at least November 20, 2016, DoubleLine Strategic Commodity Fund’s expense limitation is expected to apply until at least May 13, 2017 and DoubleLine Global Bond Fund’s expense limitation is expected to apply until at least November 20, 2017. Each may be terminated during the term only by a majority vote of the disinterested Trustees of the Board.
| | | | | | | | | | | | | | | | | | |
| | | | | | | | Expense Caps | |
| | | | | Advisory Fee | | | I Shares | | | N Shares | | | A Shares | |
DoubleLine Total Return Bond Fund | | | | | 0.40% | | | | N/A | | | | N/A | | | | N/A | |
DoubleLine Core Fixed Income Fund | | | | | 0.40% | | | | N/A | | | | N/A | | | | N/A | |
DoubleLine Emerging Markets Fixed Income Fund | | | | | 0.75% | | | | 0.95% | | | | 1.20% | | | | N/A | |
DoubleLine Multi-Asset Growth Fund (Consolidated) | | | | | 1.00% | | | | 1.20% | | | | N/A | | | | 1.45% | |
DoubleLine Low Duration Bond Fund | | | | | 0.35% | | | | 0.47% | | | | 0.72% | | | | N/A | |
DoubleLine Floating Rate Fund | | | | | 0.50% | | | | 0.75% | | | | 1.00% | | | | N/A | |
DoubleLine Shiller Enhanced CAPE® | | | | | 0.45% | | | | 0.65% | | | | 0.90% | | | | N/A | |
DoubleLine Flexible Income Fund | | | | | 0.62% | | | | 0.82% | | | | 1.07% | | | | N/A | |
DoubleLine Low Duration Emerging Markets Fixed Income Fund | | | | | 0.50% | | | | 0.59% | | | | 0.84% | | | | N/A | |
DoubleLine Long Duration Total Return Bond Fund | | | | | 0.50% | | | | 0.65% | | | | 0.90% | | | | N/A | |
DoubleLine Strategic Commodity Fund (Consolidated) | | | | | 0.90% | | | | 1.10% | | | | 1.35% | | | | N/A | |
DoubleLine Global Bond Fund | | | | | 0.50% | | | | 0.70% | | | | 0.95% | | | | N/A | |
Each Adviser is permitted to be reimbursed for fee waivers and/or expense reimbursements it made to a Fund in the prior three fiscal years. Each Fund must pay its current ordinary operating expenses before each Adviser is entitled to any reimbursement of fees waived and/or expenses reimbursed. Any such reimbursement requested by each Adviser is subject to review by the Board and will be subject to the Fund’s expense limitations in place when the fees were waived or the expenses were reimbursed.
| | | | | | |
| | Annual Report | | March 31, 2016 | | 119 |
| | |
| Notes to Financial Statements (Cont.) | | March 31, 2016 |
Each Adviser contractually waived a portion of its fees or reimbursed certain operating expenses and may recapture a portion of the amounts no later than the dates as stated in the following table:
| | | | | | | | | | | | | | |
| | | | | March 31, | |
| | | | | 2017 | | | 2018 | | | 2019 | |
DoubleLine Multi-Asset Growth Fund (Consolidated) | | | | $ | 283,515 | | | $ | 133,348 | | | $ | 68,149 | |
DoubleLine Shiller Enhanced CAPE® | | | | | 380,834 | | | | 270,166 | | | | 40,888 | |
DoubleLine Flexible Income Fund | | | | | — | | | | 248,339 | | | | 84,116 | |
DoubleLine Low Duration Emerging Markets Fixed Income Fund | | | | | — | | | | 302,278 | | | | 432,477 | |
DoubleLine Long Duration Total Return Bond Fund | | | | | — | | | | 130,444 | | | | 134,851 | |
DoubleLine Strategic Commodity Fund (Consolidated) | | | | | — | | | | — | | | | 526,045 | |
DoubleLine Global Bond Fund | | | | | — | | | | — | | | | 132,643 | |
For the year ended March 31, 2016, each Adviser recouped the amounts shown from the following Funds:
| | | | | | |
DoubleLine Core Fixed Income Fund | | | | $ | 203,659 | |
DoubleLine Low Duration Bond Fund | | | | | 228,850 | |
DoubleLine Shiller Enhanced CAPE® | | | | | 18,372 | |
If a Fund invested in other investment vehicles sponsored by an Adviser (“other DoubleLine Funds”) during the period, such Adviser waived its advisory fee to the Fund in an amount equal to the advisory fees paid to the Adviser by the other DoubleLine Funds in respect of Fund assets so invested. Accordingly, the Adviser waived the following fees for the period ended March 31, 2016.
| | | | | | |
DoubleLine Core Fixed Income Fund | | | | $ | 507,986 | |
DoubleLine Multi-Asset Growth Fund (Consolidated) | | | | | 180,083 | |
DoubleLine Low Duration Bond Fund | | | | | 242,692 | |
DoubleLine Flexible Income Fund | | | | | 92,489 | |
As of March 31, 2016, greater than 5% of the following DoubleLine Funds was held by other DoubleLine Funds as follows:
| | | | | | | | | | |
| Affiliated Fund Held | | | | % Owned | | | Significant Owner | |
DoubleLine Global Bond Fund | | | | | 63% | | | | DoubleLine Core Fixed Income Fund | |
DoubleLine Long Duration Total Return Bond Fund | | | | | 63% | | | | DoubleLine Core Fixed Income Fund | |
DoubleLine Floating Rate Fund | | | | | 7% | | | | DoubleLine Flexible Income Fund | |
DoubleLine Low Duration Emerging Markets Fixed Income Fund | | | | | 26% | | | | DoubleLine Low Duration Bond Fund | |
DoubleLine Capital LP and certain DoubleLine affiliated advisers provide investment advisory, sub-advisory, or consulting services to a variety of investors, including investment program sponsors, separate accounts, and mutual funds sponsored by third parties (collectively “third-party accounts”). Those services may result, directly or indirectly, in investments by the third-party accounts in one or more of the Funds. At times, the third-party accounts’ investments, individually or in the aggregate, may represent material interests in one or more of the Funds. The third-party accounts’ transaction activity in a Fund may cause a Fund to incur material transaction costs, to realize taxable gains distributable to shareholders, and/or to buy or sell assets at a time when the Fund might not otherwise do so, each of which may adversely affect a Fund’s performance. See the description of “large shareholder risk” in the Principal Risks footnote for more information. The Funds’ transfer agent’s register reflects that greater than 25% of the following Funds were held by third-party accounts as of March 31, 2016:
| | | | | | |
| | | | | % Owned | |
DoubleLine Multi-Asset Growth Fund (Consolidated) | | | | | 65% | |
4. Distribution, Sales Charge and Redemption Fees
Class N shares and Class A shares of the Funds make payments under a distribution plan (the “Distribution Plan”) adopted pursuant to Rule 12b-1 under the 1940 Act. Pursuant to the Distribution Plan, each Fund compensates the Fund’s distributor for distribution and related services at an annual rate equal to 0.25% of the average daily net assets of the Fund attributable to its Class N and Class A shares. The fees may be used to pay the Fund’s distributor for distribution services and sales support services provided in connection with Class N and Class A shares.
| | | | | | |
| 120 | | DoubleLine Funds Trust | | | | |
The Class A shares of DoubleLine Multi-Asset Growth Fund have a maximum sales charge imposed on purchases of 4.25% of the offering price and a maximum contingent deferred sales charge of 0.75% that applies to purchases of $1 million or more of Class A shares if the shares are redeemed within 18 months of purchase.
The DoubleLine Multi-Asset Growth Fund and the DoubleLine Floating Rate Fund each impose redemption fees. Redemption fees are paid to and retained by the Funds to limit the opportunity to market time the Funds and to help offset estimated portfolio transaction costs and other related costs incurred by the Funds as a result of short-term trading. Subject to the exceptions discussed in the Funds’ prospectus, the Funds will apply a redemption fee equal to 1% of the value of any shares redeemed within 90 days of purchase.
5. Purchases and Sales of Securities
Investment transactions (excluding short-term investments) for the period ended March 31, 2016 were as follows:
| | | | | | | | | | | | | | | | | | |
| | | | | All Other | | | U.S. Government1 | |
| | | | | Purchases at
Cost | | | Sales or
Maturity
Proceeds | | | Purchases at
Cost | | | Sales or
Maturity
Proceeds | |
DoubleLine Total Return Bond Fund | | | | $ | 15,691,103,559 | | | $ | 7,023,077,080 | | | $ | — | | | $ | — | |
DoubleLine Core Fixed Income Fund | | | | | 2,778,488,652 | | | | 1,769,787,623 | | | | 2,180,025,023 | | | | 1,308,239,192 | |
DoubleLine Emerging Markets Fixed Income Fund | | | | | 683,845,004 | | | | 637,215,505 | | | | — | | | | — | |
DoubleLine Multi-Asset Growth Fund (Consolidated) | | | | | 48,878,108 | | | | 50,495,451 | | | | 1,574,476 | | | | — | |
DoubleLine Low Duration Bond Fund | | | | | 1,668,386,931 | | | | 1,298,409,251 | | | | 497,457,860 | | | | 359,804,313 | |
DoubleLine Floating Rate Fund | | | | | 212,282,608 | | | | 280,909,229 | | | | — | | | | — | |
DoubleLine Shiller Enhanced CAPE ® | | | | | 496,141,001 | | | | 186,306,512 | | | | 283,860,460 | | | | 167,008,443 | |
DoubleLine Flexible Income Fund | | | | | 177,653,457 | | | | 59,078,276 | | | | 29,729,516 | | | | 14,836,305 | |
DoubleLine Low Duration Emerging Markets Fixed Income Fund | | | | | 109,001,581 | | | | 64,968,946 | | | | — | | | | — | |
DoubleLine Long Duration Total Return Bond Fund | | | | | 11,410,716 | | | | 437,893 | | | | 23,567,081 | | | | 34,785,246 | |
DoubleLine Strategic Commodity Fund (Consolidated) | | | | | 6,965,000 | | | | 1,360,872 | | | | — | | | | — | |
DoubleLine Global Bond Fund | | | | | 88,657,369 | | | | 4,525,951 | | | | 46,867,247 | | | | 5,064,209 | |
| 1 | U.S. Government transactions are defined as those involving long-term U.S. Treasury bills, bonds and notes. |
6. Income Tax Information
The tax character of distributions for the Funds were as follows:
| | | | | | | | | | | | | | | | | | |
| | | | | Period Ended March 31, 2016 | | | Period Ended March 31, 2015 | |
| | | | | Ordinary Income | | | Long Term
Capital Gain | | | Ordinary Income | | | Long Term
Capital Gain | |
DoubleLine Total Return Bond Fund | | | | $ | 1,970,721,518 | | | $ | — | | | $ | 1,658,865,733 | | | $ | — | |
DoubleLine Core Fixed Income Fund | | | | | 163,005,483 | | | | — | | | | 100,065,621 | | | | — | |
DoubleLine Emerging Markets Fixed Income Fund | | | | | 43,372,541 | | | | — | | | | 34,967,748 | | | | — | |
DoubleLine Multi-Asset Growth Fund (Consolidated) | | | | | 6,392,116 | | | | 1,826,336 | | | | 8,783,328 | | | | 2,581,991 | |
DoubleLine Low Duration Bond Fund | | | | | 62,956,909 | | | | — | | | | 46,057,808 | | | | — | |
DoubleLine Floating Rate Fund | | | | | 12,147,840 | | | | — | | | | 12,204,973 | | | | 11,923 | |
DoubleLine Shiller Enhanced CAPE® | | | | | 16,492,737 | | | | 9,504,332 | | | | 4,864,087 | | | | 21,944 | |
DoubleLine Flexible Income Fund | | | | | 7,839,953 | | | | — | | | | 2,274,973 | | | | — | |
DoubleLine Low Duration Emerging Markets Fixed Income Fund | | | | | 5,930,784 | | | | — | | | | 3,601,264 | | | | — | |
DoubleLine Long Duration Total Return Bond Fund | | | | | 2,155,135 | | | | — | | | | 561,253 | | | | — | |
DoubleLine Strategic Commodity Fund (Consolidated) | | | | | 9,088 | | | | — | | | | — | | | | — | |
DoubleLine Global Bond Fund | | | | | 197,265 | | | | — | | | | — | | | | — | |
The amount and character of tax-basis distributions and composition of net assets, including undistributed (accumulated) net investment income (loss), are finalized at fiscal year-end; accordingly, tax-basis balances have not been determined as of the date of this report.
| | | | | | |
| | Annual Report | | March 31, 2016 | | 121 |
| | |
| Notes to Financial Statements (Cont.) | | March 31, 2016 |
The Funds designated as long-term capital gain dividend, pursuant to Internal Revenue Code Section 852(b)(3), the amount necessary to reduce the earnings and profits of the Funds related to net capital gain to zero.
The cost basis of investments for federal income tax purposes as of March 31, 2016 was as follows:
| | | | | | | | | | | | | | | | | | | | | | | | | | |
| | | | | DoubleLine Total Return Bond Fund | | | DoubleLine Core Fixed Income Fund | | | DoubleLine Emerging Markets Fixed Income Fund | | | DoubleLine Multi-Asset Growth Fund (Consolidated) | | | DoubleLine Low Duration Bond Fund | | | DoubleLine Floating Rate Fund | |
Tax Cost of Investments | | | | $ | 57,295,013,906 | | | $ | 5,912,618,315 | | | $ | 819,484,603 | | | $ | 155,630,515 | | | $ | 2,857,045,629 | | | $ | 306,892,675 | |
Gross Tax Unrealized Appreciation | | | | | 1,593,268,728 | | | | 131,358,626 | | | | 3,572,209 | | | | 5,984,757 | | | | 12,275,506 | | | | 1,336,839 | |
Gross Tax Unrealized Depreciation | | | | | (1,340,354,071 | ) | | | (131,599,289 | ) | | | (90,835,388 | ) | | | (12,491,143 | ) | | | (41,643,440 | ) | | | (2,738,939 | ) |
Net Tax Unrealized Appreciation (Depreciation) | | | | | 252,914,657 | | | | (240,663 | ) | | | (87,263,179 | ) | | | (6,506,386 | ) | | | (29,367,934 | ) | | | (1,402,100 | ) |
| | | | | | | | | | | | | | | | | | | | | | | | | | |
| | | | | DoubleLine Shiller Enhanced CAPE® | | | DoubleLine Flexible Income Fund | | | DoubleLine Low Duration Emerging Markets Fixed Income Fund | | | DoubleLine Long Duration Total Return Bond Fund | | | DoubleLine Strategic Commodity Fund (Consolidated) | | | DoubleLine Global Bond Fund | |
Tax Cost of Investments | | | | $ | 819,472,816 | | | $ | 220,839,160 | | | $ | 190,660,185 | | | $ | 79,268,752 | | | $ | 29,212,644 | | | $ | 130,875,096 | |
Gross Tax Unrealized Appreciation | | | | | 53,535,413 | | | | 900,282 | | | | 887,461 | | | | 3,367,738 | | | | 150,355 | | | | 5,098,986 | |
Gross Tax Unrealized Depreciation | | | | | (63,478,979 | ) | | | (9,584,902 | ) | | | (9,425,404 | ) | | | (133,924 | ) | | | (151,581 | ) | | | (64,263 | ) |
Net Tax Unrealized Appreciation (Depreciation) | | | | | (9,943,566 | ) | | | (8,684,620 | ) | | | (8,537,943 | ) | | | 3,233,814 | | | | (1,226 | ) | | | 5,034,723 | |
As of March 31, 2016, the components of accumulated earnings (losses) for income tax purposes were as follows:
| | | | | | | | | | | | | | | | | | | | | | | | | | |
| | | | | DoubleLine
Total Return
Bond Fund | | | DoubleLine
Core Fixed
Income Fund | | | DoubleLine
Emerging
Markets Fixed
Income Fund | | | DoubleLine
Multi-Asset
Growth Fund
(Consolidated) | | | DoubleLine
Low Duration
Bond Fund | | | DoubleLine
Floating
Rate Fund | |
Net Tax Unrealized Appreciation (Depreciation) | | | | $ | 252,914,657 | | | $ | (240,663 | ) | | $ | (87,263,179 | ) | | $ | (6,506,386 | ) | | $ | (29,367,934 | ) | | $ | (1,402,100 | ) |
Undistributed Ordinary Income | | | | | 55,967,639 | | | | 5,140,904 | | | | 802,381 | | | | 1,858,738 | | | | 1,289,057 | | | | 462,460 | |
Undistributed Long Term Capital Gain | | | | | — | | | | — | | | | — | | | | — | | | | — | | | | — | |
Total Distributable Earnings | | | | | 55,967,639 | | | | 5,140,904 | | | | 802,381 | | | | 1,858,738 | | | | 1,289,057 | | | | 462,460 | |
Other Accumulated Gains (Losses) | | | | | (1,619,330,960 | ) | | | (51,931,896 | ) | | | (21,280,467 | ) | | | (6,451,949 | ) | | | (16,574,569 | ) | | | (10,270,246 | ) |
Total Accumulated Earnings (Losses) | | | | | (1,310,448,664 | ) | | | (47,031,655 | ) | | | (107,741,265 | ) | | | (11,099,597 | ) | | | (44,653,446 | ) | | | (11,209,886 | ) |
| | | | | | | | | | | | | | | | | | | | | | | | | | |
| | | | | DoubleLine Shiller Enhanced
CAPE® | | | DoubleLine Flexible Income Fund | | | DoubleLine Low Duration Emerging Markets Fixed Income Fund | | | DoubleLine Long Duration Total Return Bond Fund | | | DoubleLine Strategic Commodity Fund
(Consolidated) | | | DoubleLine Global Bond Fund | |
Net Tax Unrealized Appreciation (Depreciation) | | | | $ | (9,943,566 | ) | | $ | (8,684,620 | ) | | $ | (8,537,943 | ) | | $ | 3,233,814 | | | $ | (1,226 | ) | | $ | 5,034,723 | |
Undistributed Ordinary Income | | | | | 342,767 | | | | 266,669 | | | | 253,459 | | | | 169,102 | | | | 182,603 | | | | 456,235 | |
Undistributed Long Term Capital Gain | | | | | 1,093,807 | | | | — | | | | — | | | | — | | | | — | | | | — | |
Total Distributable Earnings | | | | | 1,436,574 | | | | 266,669 | | | | 253,459 | | | | 169,102 | | | | 182,603 | | | | 456,235 | |
Other Accumulated Gains (Losses) | | | | | 45,257,487 | | | | (2,641,631 | ) | | | (330,734 | ) | | | (1,104,680 | ) | | | 441,463 | | | | (24,252 | ) |
Total Accumulated Earnings (Losses) | | | | | 36,750,495 | | | | (11,059,582 | ) | | | (8,615,218 | ) | | | 2,298,236 | | | | 622,840 | | | | 5,466,706 | |
Under the Regulated Investment Company Modernization Act of 2010, capital losses incurred by the Funds after January 1, 2011 will not be subject to expiration. In addition, such losses must be utilized prior to the losses incurred in the years preceding enactment.
| | | | | | |
| 122 | | DoubleLine Funds Trust | | | | |
As of March 31, 2016, the following capital loss carryforwards were available:
| | | | | | | | | | |
| | | | | Capital Loss
Carryforward | | | Expires | |
DoubleLine Total Return Bond Fund | | | | $ | 3,709,758 | | | | 3/31/2019 | |
DoubleLine Total Return Bond Fund | | | | | 1,439,235,578 | | | | Indefinite | |
DoubleLine Core Fixed Income Fund | | | | | 39,908,634 | | | | Indefinite | |
DoubleLine Emerging Markets Fixed Income Fund | | | | | 17,589,919 | | | | Indefinite | |
DoubleLine Multi-Asset Growth Fund (Consolidated) | | | | | 4,032,425 | | | | Indefinite | |
DoubleLine Low Duration Bond Fund | | | | | 11,361,393 | | | | Indefinite | |
DoubleLine Floating Rate Fund | | | | | 2,658,865 | | | | Indefinite | |
DoubleLine Flexible Income Fund | | | | | 1,343,048 | | | | Indefinite | |
DoubleLine Low Duration Emerging Markets Fixed Income Fund | | | | | 122,490 | | | | Indefinite | |
DoubleLine Long Duration Total Return Bond Fund | | | | | 961,222 | | | | Indefinite | |
As of March 31, 2016, the following Funds deferred, on a tax basis, losses of:
| | | | | | | | | | |
| | | | | Post-October Loss | | | Late-Year Loss | |
DoubleLine Total Return Bond Fund | | | | $ | 120,453,276 | | | $ | — | |
DoubleLine Core Fixed Income Fund | | | | | 7,681,763 | | | | — | |
DoubleLine Emerging Markets Fixed Income Fund | | | | | 3,107,712 | | | | — | |
DoubleLine Multi-Asset Growth Fund (Consolidated) | | | | | 1,791,422 | | | | — | |
DoubleLine Low Duration Bond Fund | | | | | 3,796,325 | | | | — | |
DoubleLine Floating Rate Fund | | | | | 7,207,267 | | | | — | |
DoubleLine Flexible Income Fund | | | | | 1,056,635 | | | | — | |
DoubleLine Strategic Commodity Fund (Consolidated) | | | | | — | | | | 2,456 | |
Additionally, US GAAP requires that certain components of net assets relating to permanent differences be reclassified between financial and tax reporting. These reclassifications have no effect on net assets or NAV per share. The permanent differences primarily relate to paydown losses, accretion of discount on certain debt instruments, foreign currency gains (losses) and consent fee income. For the period ended March 31, 2016, the following table shows the reclassifications made:
| | | | | | | | | | | | | | |
| | | | | Undistributed
Net
Investment
Income (Loss) | | | Accumulated
Net Realized
Gain (Loss) | | | Paid In
Capital | |
DoubleLine Total Return Bond Fund | | | | $ | 352,842,775 | | | $ | (352,842,775 | ) | | $ | — | |
DoubleLine Core Fixed Income Fund | | | | | 12,249,603 | | | | (12,249,603 | ) | | | — | |
DoubleLine Emerging Markets Fixed Income Fund | | | | | — | | | | — | | | | — | |
DoubleLine Multi-Asset Growth Fund (Consolidated) | | | | | (2,854 | ) | | | (991,213 | ) | | | 994,067 | |
DoubleLine Low Duration Bond Fund | | | | | 4,411,649 | | | | (4,411,649 | ) | | | — | |
DoubleLine Floating Rate Fund | | | | | — | | | | — | | | | — | |
DoubleLine Shiller Enhanced CAPE® | | | | | 1,405,596 | | | | (1,405,596 | ) | | | — | |
DoubleLine Flexible Income Fund | | | | | 880,004 | | | | (880,004 | ) | | | — | |
DoubleLine Low Duration Emerging Markets Fixed Income Fund | | | | | 43,214 | | | | (53,564 | ) | | | 10,350 | |
DoubleLine Long Duration Total Return Bond Fund | | | | | 14 | | | | 1 | | | | (15 | ) |
DoubleLine Strategic Commodity Fund (Consolidated) | | | | | 343,972 | | | | 535,005 | | | | (878,977 | ) |
DoubleLine Global Bond Fund | | | | | 167,690 | | | | (167,690 | ) | | | — | |
| | | | | | |
| | Annual Report | | March 31, 2016 | | 123 |
| | |
| Notes to Financial Statements (Cont.) | | March 31, 2016 |
7. Share Transactions
Transactions in each Fund’s shares were as follows:
| | | | | | | | | | | | | | | | | | | | | | | | | | | | | | | | | | | | |
| | | | | DoubleLine Total Return Bond Fund | | | | | DoubleLine Core Fixed Income Fund | |
| | | | | Year Ended
March 31, 2016 | | | Year Ended
March 31, 2015 | | | | | Year Ended
March 31, 2016 | | | Year Ended
March 31, 2015 | |
| | | | | Shares | | | Amount | | | Shares | | | Amount | | | | | Shares | | | Amount | | | Shares | | | Amount | |
Shares Sold | | | | | | | | | | | | | | | | | | | | | | | | | | | | | | | | | | | | |
Class I | | | | | 1,762,519,501 | | | $ | 19,220,239,412 | | | | 1,558,010,043 | | | $ | 17,148,705,516 | | | | | | 299,595,407 | | | $ | 3,249,703,452 | | | | 230,438,036 | | | $ | 2,541,026,162 | |
Class N | | | | | 475,211,866 | | | | 5,179,721,681 | | | | 454,573,725 | | | | 5,004,430,061 | | | | | | 54,551,178 | | | | 591,687,811 | | | | 36,562,856 | | | | 402,958,798 | |
Reinvested Dividends | | | | | | | | | | | | | | | | | | | | | | | | | | | | | | | | | | | | |
Class I | | | | | 97,679,661 | | | | 1,064,103,215 | | | | 80,206,318 | | | | 881,703,118 | | | | | | 9,055,797 | | | | 98,353,071 | | | | 5,684,656 | | | | 62,733,460 | |
Class N | | | | | 27,160,833 | | | | 295,814,232 | | | | 22,572,716 | | | | 248,096,489 | | | | | | 2,022,844 | | | | 21,944,431 | | | | 1,328,000 | | | | 14,641,059 | |
Shares Redeemed | | | | | | | | | | | | | | | | | | | | | | | | | | | | | | | | | | | | |
Class I | | | | | (907,208,165 | ) | | | (9,889,480,104 | ) | | | (612,602,713 | ) | | | (6,740,749,306 | ) | | | | | (145,001,023 | ) | | | (1,573,009,270 | ) | | | (53,606,529 | ) | | | (591,377,397 | ) |
Class N | | | | | (276,177,861 | ) | | | (3,010,340,121 | ) | | | (271,054,941 | ) | | | (2,980,674,477 | ) | | | | | (24,013,524 | ) | | | (260,436,971 | ) | | | (18,034,346 | ) | | | (198,661,874 | ) |
Increase (Decrease) in Net Assets Resulting from Net Share Transactions | | | | | 1,179,185,835 | | | $ | 12,860,058,315 | | | | 1,231,705,148 | | | $ | 13,561,511,401 | | | | | | 196,210,679 | | | $ | 2,128,242,524 | | | | 202,372,673 | | | $ | 2,231,320,208 | |
| | | | | | | | | | | | | | | | | | | | | | | | | | | | | | | | |
| | | | | DoubleLine Emerging Markets Fixed Income Fund | | | | | DoubleLine Multi-Asset Growth Fund (Consolidated) | |
| | | | | Year Ended
March 31, 2016 | | | Year Ended
March 31, 2015 | | | | | Year Ended
March 31, 2016 | | | Year Ended
March 31, 2015 | |
| | | | | Shares | | | Amount | | | Shares | | | Amount | | | | | Shares | | | Amount | | | Shares | | | Amount | |
Shares Sold | | | | | | | | | | | | | | | | | | | | | | | | | | | | | | | | | | | | |
Class I | | | | | 55,178,656 | | | $ | 554,648,724 | | | | 48,464,178 | | | $ | 512,367,218 | | | | | | 2,500,752 | | | $ | 22,491,147 | | | | 1,196,955 | | | $ | 11,927,076 | |
Class N | | | | | 21,032,858 | | | | 211,676,846 | | | | 17,993,367 | | | | 189,439,392 | | | | | | — | | | | — | | | | — | | | | — | |
Class A | | | | | — | | | | — | | | | — | | | | — | | | | | | 8,322,576 | | | | 75,994,583 | | | | 3,020,401 | | | | 29,928,377 | |
Reinvested Dividends | | | | | | | | | | | | | | | | | | | | | | | | | | | | | | | | | | | | |
Class I | | | | | 2,858,479 | | | | 28,039,810 | | | | 1,788,406 | | | | 18,901,203 | | | | | | 185,849 | | | | 1,691,777 | | | | 357,528 | | | | 3,500,423 | |
Class N | | | | | 857,976 | | | | 8,459,813 | | | | 735,937 | | | | 7,789,995 | | | | | | — | | | | — | | | | — | | | | — | |
Class A | | | | | — | | | | — | | | | — | | | | — | | | | | | 211,996 | | | | 1,914,682 | | | | 459,846 | | | | 4,465,787 | |
Shares Redeemed | | | | | | | | | | | | | | | | | | | | | | | | | | | | | | | | | | | | |
Class I | | | | | (54,134,807 | ) | | | (523,833,141 | ) | | | (29,176,327 | ) | | | (307,717,478 | ) | | | | | (2,298,221 | ) | | | (20,590,840 | )* | | | (3,756,397 | ) | | | (37,501,908 | )# |
Class N | | | | | (23,900,960 | ) | | | (238,217,742 | ) | | | (13,475,224 | ) | | | (143,047,369 | ) | | | | | — | | | | — | | | | — | | | | — | |
Class A | | | | | — | | | | — | | | | — | | | | — | | | | | | (4,262,149 | ) | | | (38,461,355 | )* | | | (4,464,933 | ) | | | (44,700,359 | )# |
Increase (Decrease) in Net Assets Resulting from Net Share Transactions | | | | | 1,892,202 | | | $ | 40,774,310 | | | | 26,330,337 | | | $ | 277,732,961 | | | | | | 4,660,803 | | | $ | 43,039,994 | | | | (3,186,600 | ) | | $ | (32,380,604 | ) |
| | | | | | | | | | | | | | | | | | | | | | | | | | | | | | | | |
| | | | | DoubleLine Low Duration Bond Fund | | | | | DoubleLine Floating Rate Fund | |
| | | | | Year Ended
March 31, 2016 | | | Year Ended
March 31, 2015 | | | | | Year Ended
March 31, 2016 | | | Year Ended
March 31, 2015 | |
| | | | | Shares | | | Amount | | | Shares | | | Amount | | | | | Shares | | | Amount | | | Shares | | | Amount | |
Shares Sold | | | | | | | | | | | | | | | | | | | | | | | | | | | | | | | | | | | | |
Class I | | | | | 134,933,087 | | | $ | 1,357,710,671 | | | | 106,256,430 | | | $ | 1,080,831,534 | | | | | | 17,393,275 | | | $ | 174,009,480 | | | | 21,835,983 | | | $ | 220,180,224 | |
Class N | | | | | 45,028,340 | | | | 452,716,429 | | | | 50,471,628 | | | | 513,317,544 | | | | | | 4,824,858 | | | | 48,272,154 | | | | 1,986,975 | | | | 20,090,929 | |
Reinvested Dividends | | | | | | | | | | | | | | | | | | | | | | | | | | | | | | | | | | | | |
Class I | | | | | 2,902,515 | | | | 29,164,428 | | | | 1,922,215 | | | | 19,551,236 | | | | | | 445,232 | | | | 4,423,456 | | | | 316,515 | | | | 3,189,878 | |
Class N | | | | | 2,074,916 | | | | 20,849,788 | | | | 1,799,041 | | | | 18,290,065 | | | | | | 147,867 | | | | 1,470,439 | | | | 131,252 | | | | 1,325,930 | |
Shares Redeemed | | | | | | | | | | | | | | | | | | | | | | | | | | | | | | | | | | | | |
Class I | | | | | (80,500,458 | ) | | | (809,078,824 | ) | | | (76,705,087 | ) | | | (779,499,858 | ) | | | | | (24,939,341 | ) | | | (249,436,789 | )^ | | | (18,819,723 | ) | | | (189,582,271 | )~ |
Class N | | | | | (44,109,966 | ) | | | (443,617,479 | ) | | | (43,180,922 | ) | | | (439,255,991 | ) | | | | | (2,616,823 | ) | | | (25,904,180 | )^ | | | (7,357,051 | ) | | | (74,481,306 | )~ |
Increase (Decrease) in Net Assets Resulting from Net Share Transactions | | | | | 60,328,434 | | | $ | 607,745,013 | | | | 40,563,305 | | | $ | 413,234,530 | | | | | | (4,744,932 | ) | | $ | (47,165,440 | ) | | | (1,906,049 | ) | | $ | (19,276,616 | ) |
| | | | | | | | | | | | | | | | | | | | | | | | | | | | | | | | |
| | | | | | |
| 124 | | DoubleLine Funds Trust | | | | |
| | | | | | | | | | | | | | | | | | | | | | | | | | | | | | | | | | | | |
| | | | | DoubleLine Shiller Enhanced CAPE® | | | | | DoubleLine Flexible Income Fund | |
| | | | | Year Ended
March 31, 2016 | | | Year Ended
March 31, 2015 | | | | | Year Ended
March 31, 2016 | | | Period Ended
March 31, 2015 | |
| | | | | Shares | | | Amount | | | Shares | | | Amount | | | | | Shares | | | Amount | | | Shares | | | Amount | |
Shares Sold | | | | | | | | | | | | | | | | | | | | | | | | | | | | | | | | | | | | |
Class I | | | | | 41,453,903 | | | $ | 494,197,119 | | | | 24,010,369 | | | $ | 282,366,924 | | | | | | 21,499,928 | | | $ | 211,974,817 | | | | 8,439,758 | | | $ | 84,838,598 | |
Class N | | | | | 12,189,003 | | | | 144,752,851 | | | | 7,120,050 | | | | 83,477,991 | | | | | | 7,486,460 | | | | 73,646,868 | | | | 3,935,101 | | | | 39,646,317 | |
Reinvested Dividends | | | | | | | | | | | | | | | | | | | | | | | | | | | | | | | | | | | | |
Class I | | | | | 1,476,805 | | | | 17,668,300 | | | | 278,813 | | | | 3,298,566 | | | | | | 447,693 | | | | 4,361,213 | | | | 119,818 | | | | 1,199,839 | |
Class N | | | | | 373,282 | | | | 4,466,707 | | | | 79,425 | | | | 935,897 | | | | | | 184,609 | | | | 1,796,873 | | | | 73,547 | | | | 737,094 | |
Shares Redeemed | | | | | | | | | | | | | | | | | | | | | | | | | | | | | | | | | | | | |
Class I | | | | | (13,146,855 | ) | | | (155,368,376 | ) | | | (2,236,761 | ) | | | (25,945,358 | ) | | | | | (10,890,962 | ) | | | (105,723,553 | ) | | | (2,802,513 | ) | | | (28,099,323 | ) |
Class N | | | | | (3,879,667 | ) | | | (45,990,260 | ) | | | (1,698,935 | ) | | | (19,696,470 | ) | | | | | (3,830,401 | ) | | | (37,206,473 | ) | | | (1,263,950 | ) | | | (12,642,921 | ) |
Increase (Decrease) in Net Assets Resulting from Net Share Transactions | | | | | 38,466,471 | | | $ | 459,726,341 | | | | 27,552,961 | | | $ | 324,437,550 | | | | | | 14,897,327 | | | $ | 148,849,745 | | | | 8,501,761 | | | $ | 85,679,604 | |
| | | | | | | | | | | | | | | | | | | | | | | | | | | | | | | | |
| | | | | DoubleLine Low Duration Emerging Markets Fixed Income Fund | | | | | DoubleLine Long Duration Total Return Bond Fund | |
| | | | | Year Ended
March 31, 2016 | | | Period Ended
March 31, 2015 | | | | | Year Ended
March 31, 2016 | | | Period Ended
March 31, 2015 | |
| | | | | Shares | | | Amount | | | Shares | | | Amount | | | | | Shares | | | Amount | | | Shares | | | Amount | |
Shares Sold | | | | | | | | | | | | | | | | | | | | | | | | | | | | | | | | | | | | |
Class I | | | | | 5,615,248 | | | $ | 55,212,165 | | | | 6,793,837 | | | $ | 68,019,507 | | | | | | 528,232 | | | $ | 5,304,239 | | | | 5,579,541 | | | $ | 55,943,736 | |
Class N | | | | | 7,167,948 | | | | 70,403,717 | | | | 8,771,415 | | | | 88,791,916 | | | | | | 1,704,462 | | | | 17,319,167 | | | | 1,921,385 | | | | 19,969,246 | |
Reinvested Dividends | | | | | | | | | | | | | | | | | | | | | | | | | | | | | | | | | | | | |
Class I | | | | | 67,638 | | | | 656,267 | | | | 29,706 | | | | 295,980 | | | | | | 10,593 | | | | 106,495 | | | | 1,871 | | | | 19,580 | |
Class N | | | | | 313,363 | | | | 3,026,806 | | | | 130,008 | | | | 1,292,322 | | | | | | 46,632 | | | | 467,544 | | | | 10,894 | | | | 114,122 | |
Shares Redeemed | | | | | | | | | | | | | | | | | | | | | | | | | | | | | | | | | | | | |
Class I | | | | | (5,317,565 | ) | | | (51,843,841 | ) | | | (225,055 | ) | | | (2,260,879 | ) | | | | | (464,030 | ) | | | (4,701,637 | ) | | | (189,939 | ) | | | (1,982,487 | ) |
Class N | | | | | (3,175,455 | ) | | | (31,105,883 | ) | | | (831,376 | ) | | | (8,278,916 | ) | | | | | (1,149,451 | ) | | | (11,691,770 | ) | | | (54,691 | ) | | | (560,700 | ) |
Increase (Decrease) in Net Assets Resulting from Net Share Transactions | | | | | 4,671,177 | | | $ | 46,349,231 | | | | 14,668,535 | | | $ | 147,859,930 | | | | | | 676,438 | | | $ | 6,804,038 | | | | 7,269,061 | | | $ | 73,503,497 | |
| | | | | | | | | | | | | | | | | | | | | | | | | | | | | | | | |
| | | | | DoubleLine Strategic Commodity
Fund (Consolidated) | | | | | | | | | | | DoubleLine Global Bond Fund | | | | | | | |
| | | | | Period Ended
March 31, 2016 | | | | | | | | | | | Period Ended
March 31, 2016 | | | | | | | |
| | | | | Shares | | | Amount | | | | | | | | | | | Shares | | | Amount | | | | | | | |
Shares Sold | | | | | | | | | | | | | | | | | | | | | | | | | | | | | | | | | | | | |
Class I | | | | | 3,265,686 | | | $ | 28,623,750 | | | | | | | | | | | | | | 9,507,800 | | | $ | 95,140,112 | | | | | | | | | |
Class N | | | | | 198,077 | | | | 1,720,801 | | | | | | | | | | | | | | 4,028,788 | | | | 41,320,016 | | | | | | | | | |
Reinvested Dividends | | | | | | | | | | | | | | | | | | | | | | | | | | | | | | | | | | | | |
Class I | | | | | 947 | | | | 8,236 | | | | | | | | | | | | | | 774 | | | | 8,045 | | | | | | | | | |
Class N | | | | | 25 | | | | 214 | | | | | | | | | | | | | | 2,585 | | | | 26,935 | | | | | | | | | |
Shares Redeemed | | | | | | | | | | | | | | | | | | | | | | | | | | | | | | | | | | | | |
Class I | | | | | (44,967 | ) | | | (388,627 | ) | | | | | | | | | | | | | (491,338 | ) | | | (5,036,242 | ) | | | | | | | | |
Class N | | | | | (34,166 | ) | | | (289,773 | ) | | | | | | | | | | | | | (34,728 | ) | | | (357,420 | ) | | | | | | | | |
Increase (Decrease) in Net Assets Resulting from Net Share Transactions | | | | | 3,385,602 | | | $ | 29,674,601 | | | | | | | | | | | | | | 13,013,881 | | | $ | 131,101,446 | | | | | | | | | |
| * | Net of redemption fees of $8,639 and $4,093 for Class I and Class A, respectively. |
| ^ | Net of redemption fees of $81,279 and $15,764 for Class I and Class N, respectively. |
| # | Net of redemption fees of $2,358 and $1,411 for Class I and Class A, respectively. |
| ~ | Net of redemption fees of $10,717 and $28,406 for Class I and Class N, respectively. |
8. Trustees’ Fees
Trustees who are not affiliated with each Adviser and its affiliates receive fees from the Trust. These trustees may elect to defer the cash payment of part or all of their compensation. These deferred amounts, which remain as liabilities of the Funds, are treated as if invested in shares of each respective Fund or other funds managed by each Adviser and its affiliates. These amounts represent general, unsecured liabilities of each Fund and vary according to the total returns of the selected funds. Trustees’ Fees in the Statements of Operations include current fees (either paid in cash or deferred) and an increase (decrease) in the value of the deferred amounts. Certain trustees and officers of the Funds are also officers of each Adviser; such trustees and officers are not compensated by the Funds.
| | | | | | |
| | Annual Report | | March 31, 2016 | | 125 |
| | |
| Notes to Financial Statements (Cont.) | | March 31, 2016 |
For the period ended March 31, 2016, the Trustees received, as a group:
| | | | | | | | | | | | | | |
| | | | | Current
Fees | | | Increase/(Decrease) in
Value of Deferred
Amount | | | Trustees’ Fees | |
DoubleLine Total Return Bond Fund | | | | $ | 564,876 | | | $ | 390 | | | $ | 565,266 | |
DoubleLine Core Fixed Income Fund | | | | | 53,780 | | | | 32 | | | | 53,812 | |
DoubleLine Emerging Markets Fixed Income Fund | | | | | 11,008 | | | | 15 | | | | 11,023 | |
DoubleLine Multi-Asset Growth Fund (Consolidated) | | | | | 1,417 | | | | — | | | | 1,417 | |
DoubleLine Low Duration Bond Fund | | | | | 30,009 | | | | 13 | | | | 30,022 | |
DoubleLine Floating Rate Fund | | | | | 3,693 | | | | — | | | | 3,693 | |
DoubleLine Shiller Enhanced CAPE® | | | | | 5,844 | | | | 6 | | | | 5,850 | |
DoubleLine Flexible Income Fund | | | | | 2,288 | | | | 1 | | | | 2,289 | |
DoubleLine Low Duration Emerging Markets Fixed Income Fund | | | | | 2,183 | | | | 2 | | | | 2,185 | |
DoubleLine Long Duration Total Return Bond Fund | | | | | 932 | | | | — | | | | 932 | |
DoubleLine Strategic Commodity Fund (Consolidated) | | | | | 566 | | | | — | | | | 566 | |
DoubleLine Global Bond Fund | | | | | 375 | | | | — | | | | 375 | |
9. Additional Disclosures about Derivative Instruments
The following disclosures provide information on the Funds’ use of derivatives and certain related risks. The location and fair value amounts of these instruments on the Statements of Assets and Liabilities and the realized gains and losses and changes in unrealized gains and losses on the Statements of Operations, each categorized by type of derivative contract, are included in the following tables.
The average volume of derivative activity during the period ended March 31, 2016 is as follows:
| | | | | | | | | | | | | | |
| | | | | DoubleLine Multi-
Asset Growth Fund
(Consolidated) | | | DoubleLine Shiller
Enhanced CAPE® | | | DoubleLine Strategic
Commodity Fund
(Consolidated) | |
Average Market Value | | | | | | | | | | | | | | |
Purchased Options | | | | $ | 365,000 | | | $ | — | | | $ | — | |
Written Options | | | | | 179,000 | | | | — | | | | — | |
Futures Contracts - Long | | | | | (244,219 | ) | | | — | | | | — | |
Futures Contracts - Short | | | | | (24,945 | ) | | | — | | | | — | |
Average Notional Balance | | | | | | | | | | | | | | |
Excess Return Swaps - Long | | | | $ | — | | | $ | — | | | $ | 17,373,750 | |
Excess Return Swaps - Short | | | | | — | | | | — | | | | 4,647,500 | |
Interest Rate Swaps | | | | | 3,900,000 | | | | — | | | | — | |
Total Return Swaps - Long | | | | | 39,078,004 | | | | 578,091,400 | | | | — | |
Total Return Swaps - Short | | | | | 4,379,326 | | | | — | | | | — | |
Forward Currency Exchange Contracts | | | | | 22,134,421 | | | | — | | | | — | |
Options Contracts The Funds may purchase or sell put and call options. When a Fund purchases an option it pays a premium in return for the potential to profit from the change in value of an underlying investment or index during the term of the option. The option premium is included on the Funds’ Statements of Assets and Liabilities as an investment and subsequently marked to market to reflect the current value of the option. Premiums paid for purchasing options which expire are treated as realized losses. Certain options may be purchased with premiums to be determined on a future date. The premiums for these options are based upon implied volatility parameters at specified terms. The risk associated with purchasing options is limited to the loss of the premium paid. Premiums paid for purchasing options which are exercised or closed are added to the amounts paid or offset against the proceeds on the underlying investment transaction to determine the realized gain or loss. When a Fund writes (i.e., sells) an option it receives a premium in return for bearing the risk of the change in value of an underlying instrument during the term off the option. Writing put options tends to increase a Fund��s exposure to the underlying instrument. Writing call options tends to decrease a Fund’s exposure to the underlying instrument. When a Fund writes a call or put, an amount equal to the premium received is recorded as a liability and subsequently marked to market to reflect the current value of the option written. These liabilities are reflected as written options outstanding on the Statements of Assets and Liabilities. Premiums received from writing options which expire are treated as realized gains. Premiums received from writing options which are exercised or closed are added to the proceeds or offset against amounts paid on the underlying instrument to determine the realized gain or loss when the underlying instrument is sold. A Fund as a writer of an option has no control over whether the underlying instrument may be sold (call) or purchased (put) and as a result bears the market risk of an unfavorable change in the price of the instrument underlying the written option. There is the risk that the market for options contracts may be illiquid and that a Fund may not be able to close out or sell an option at a particular time or at an anticipated price.
| | | | | | |
| 126 | | DoubleLine Funds Trust | | | | |
The activity in written options during the year ended March 31, 2016, is as follows:
| | | | | | | | | | |
DoubleLine Multi-Asset Growth Fund
(Consolidated) | | | | Number of
Contracts | | | Premium
Amount | |
Outstanding, Beginning of Period | | | | | — | | | $ | — | |
Options Written | | | | | 100 | | | | 279,800 | |
Options Expired | | | | | — | | | | — | |
Options Exercised | | | | | — | | | | — | |
Options Closed | | | | | — | | | | — | |
Outstanding, End of Period | | | | | 100 | | | $ | 279,800 | |
Futures Contracts Futures contracts typically involve a contractual commitment to buy or sell a particular instrument at a specified price on a future date. Risks associated with the use of futures contracts include the potential for imperfect correlation between the change in market value of the securities held by the Funds and the prices of futures contracts and the possibility of an illiquid market. Futures contracts are valued based upon their quoted daily settlement prices determined by the relevant exchange. Upon entering into a futures contract, a Fund is required to deposit with its futures broker an amount of cash in accordance with the initial margin requirements of the broker or exchange. Futures contracts are marked to market daily and an appropriate payment reflecting the change in value (“variation margin”) is made or received by or for the accounts of the Funds. Gains or losses are recognized but not considered realized until the contracts expire or are closed. Futures contracts involve, to varying degrees, risk of loss in excess of the variation margin disclosed on the Statements of Assets and Liabilities.
Forward Foreign Currency Contracts Forward foreign currency contracts are agreements between two parties to buy and sell a currency at a set exchange rate on a future date. Unless a Fund’s registration statement expressly states otherwise, each Fund may enter into forward foreign currency contracts for any investment purpose. The market value of a forward foreign currency contract fluctuates with the changes in foreign currency exchange rates. The contract is marked-to-market daily and the change in market value is recorded by a Fund as an unrealized gain or loss. When the contract is closed, a Fund records a realized gain or loss equal to the difference between the value at the time it was opened and the value at the time it was closed. The use of foreign currency exchange contracts involves the risk that the value of a foreign currency exchange contract changes unfavorably due to movements in the value of the referenced foreign currencies and the risk that a counterparty to the contract does not perform its obligations under the agreement.
Credit Default Swap Agreements Credit default swap agreements often involve one party making a stream of payments (generally referred to as the buyer of protection) to another party (the seller of protection) in exchange for the right to receive a specified return in the event of a default or other credit event in respect of a referenced entity, obligation or index. As a seller of protection on credit default swap agreements, a Fund generally will receive from the buyer of protection a fixed rate of income throughout the term of the swap. As the seller, a Fund would effectively add leverage to its portfolio because, in addition to its total net assets, the Fund would be subject to investment exposure on the notional amount of the swap.
If a Fund is a seller of protection and a credit event occurs, as defined under the terms of that particular swap agreement, the Fund typically will either (i) pay to the buyer of protection an amount equal to the notional amount of the swap and take delivery of the referenced obligation, other deliverable obligations or the affected securities in the referenced index or (ii) pay a net settlement amount in the form of cash or securities equal to the notional amount of the swap less the recovery value of the referenced obligation or the affected securities in the referenced index. If a Fund is a buyer of protection and a credit event occurs, as defined under the terms of that particular swap agreement, the Fund typically will either (i) receive from the seller of protection an amount equal to the notional amount of the swap and deliver the referenced obligation, other deliverable obligations or the affected securities in the referenced index or (ii) receive a net settlement amount in the form of cash or securities equal to the notional amount of the swap less the recovery value of the referenced obligation or the affected securities in the referenced index. Recovery values are typically estimated by market makers considering either industry standard recovery rates or entity specific factors and considerations until a credit event occurs. An index credit default swap references all the names in the index, and if there is a default with respect to a single name in the index, the credit event is settled based on that name’s weight in the index.
Credit default swaps are considered to have credit risk related contingent features since they require payment by the protection seller to the protection buyer upon occurrence of a defined credit event. A Fund’s maximum risk of loss from counterparty risk, as the protection buyer, is the fair value of the contract, which may be mitigated by the posting of collateral by the counterparty to a Fund to cover a Fund’s exposure to the counterparty.
Total Return Swap Agreements The Funds may enter into total return swaps for investment purposes. Total return swaps are agreements to exchange the return generated by one instrument for the return generated by another instrument. For example, the agreement to pay a predetermined or fixed interest rate in exchange for a market-linked return based on a notional amount. To the extent the total return of a referenced index or instrument exceeds the offsetting interest obligation, a Fund will receive a payment from the counterparty. To the extent it is less, a Fund will make a payment to the counterparty. Payments received or made at the termination of the swap are recorded as realized gain or loss on the Statements of Operations.
| | | | | | |
| | Annual Report | | March 31, 2016 | | 127 |
| | |
| Notes to Financial Statements (Cont.) | | March 31, 2016 |
The Funds’ derivative instrument holdings are summarized in the following tables.
The effect of derivative instruments on the Statements of Assets and Liabilities for the period ended March 31, 2016 was as follows:
| | | | | | | | | | | | | | | | |
| | | | | | | Unrealized Appreciation (Depreciation) | |
Derivatives not accounted
for as hedging instruments | | Statements of Assets and Liabilities Location | | | | DoubleLine Multi-
Asset Growth Fund
(Consolidated) | | | DoubleLine Shiller
Enhanced CAPE® | | | DoubleLine Strategic
Commodity Fund
(Consolidated) | |
| Purchased Options | | | | | | | | | | | | | | | | |
| Index | | Net Unrealized Appreciation (Depreciation) on Investments in Unaffiliated Securities | | | | $ | (156,200 | ) | | $ | — | | | $ | — | |
| Written Options | | | | | | | | | | | | | | | | |
| Index | | Net Unrealized Appreciation (Depreciation) on Written Options | | | | $ | 100,800 | | | $ | — | | | $ | — | |
| Forward Contracts | | | | | | | | | | | | | | | | |
| Currency | | Net Unrealized Appreciation (Depreciation) on Forwards | | | | $ | 89,118 | | | $ | — | | | $ | — | |
| Futures Contracts | | | | | | | | | | | | | | | | |
| Commodity | | | | | | $ | (9,633 | ) | | $ | — | | | $ | — | |
| Index | | | | | | | 199,862 | | | | — | | | | — | |
| | Net Unrealized Appreciation (Depreciation) on Futures | | | | $ | 190,229 | | | $ | — | | | $ | — | |
| Swap Contracts | | | | | | | | | | | | | | | | |
| Excess Return | | | | | | $ | — | | | $ | — | | | $ | 443,932 | |
| Total Return | | | | | | | — | | | | 45,566,002 | | | | — | |
| | Net Unrealized Appreciation (Depreciation) on Swaps | | | | $ | — | | | $ | 45,566,002 | | | $ | 443,932 | |
The effect of derivative instruments on the Statements of Operations for the period ended March 31, 2016 was as follows:
| | | | | | | | | | | | | | | | | | | | | | | | | | | | | | |
| | | | | | | Realized Gain (Loss) on Derivatives | | | | | Change in Unrealized Appreciation
(Depreciation) on Derivatives | |
Derivatives not accounted
for as hedging instruments | | Statements of
Operations Location | | | | DoubleLine Multi-
Asset Growth Fund
(Consolidated) | | | DoubleLine Shiller
Enhanced CAPE® | | | DoubleLine Strategic
Commodity Fund
(Consolidated) | | | | | DoubleLine Multi-
Asset Growth Fund
(Consolidated) | | | DoubleLine Shiller
Enhanced CAPE® | | | DoubleLine Strategic
Commodity Fund
(Consolidated) | |
| Purchased Options | | | | | | | | | | | | | | | | | | | | | | | | | | | | | | |
| Index | | | | | | | | | | | | | | | | | | | | | | | | | | | | | | |
| | Net Realized and Unrealized Gain (Loss) on Investments in Unaffiliated Securities | | | | $ | — | | | $ | — | | | $ | — | | | | | $ | (156,200 | ) | | $ | — | | | $ | — | |
| Written Options | | | | | | | | | | | | | | | | | | | | | | | | | | | | | | |
| Index | | | | | | | | | | | | | | | | | | | | | | | | | | | | | | |
| | Net Realized and Unrealized Gain (Loss) on Written Options | | | | $ | — | | | $ | — | | | $ | — | | | | | $ | 100,800 | | | $ | — | | | $ | — | |
| Forward Contracts | | | | | | | | | | | | | | | | | | | | | | | | | | | | | | |
| Currency | | | | | | | | | | | | | | | | | | | | | | | | | | | | | | |
| | Net Realized and Unrealized Gain (Loss) on Forwards | | | | $ | (971,121 | ) | | $ | — | | | $ | — | | | | | $ | 335,340 | | | $ | — | | | $ | — | |
| Futures Contracts | | | | | | | | | | | | | | | | | | | | | | | | | | | | | | |
| Commodity | | | | | | $ | 183,965 | | | $ | — | | | $ | — | | | | | $ | 34,904 | | | $ | — | | | $ | — | |
| Index | | | | | | | (4,273,782 | ) | | | — | | | | — | | | | | | 44,098 | | | | — | | | | — | |
| Treasury Bond | | | | | | | — | | | | — | | | | — | | | | | | (26,447 | ) | | | — | | | | — | |
| | Net Realized and Unrealized Gain (Loss) on Futures | | | | $ | (4,089,817 | ) | | $ | — | | | $ | — | | | | | $ | 52,555 | | | $ | — | | | $ | — | |
| Swap Contracts | | | | | | | | | | | | | | | | | | | | | | | | | | | | | | |
| Excess Return | | | | | | $ | — | | | $ | — | | | $ | (534,982 | ) | | | | $ | — | | | $ | — | | | $ | 443,932 | |
| Interest Rate | | | | | | | 33,292 | | | | — | | | | — | | | | | | — | | | | — | | | | — | |
| Total Return | | | | | | | 1,978,969 | | | | 8,923,418 | | | | — | | | | | | 434,821 | | | | 34,931,709 | | | | — | |
| | Net Realized and Unrealized Gain (Loss) on Swaps | | | | $ | 2,012,261 | | | $ | 8,923,418 | | | $ | (534,982 | ) | | | | $ | 434,821 | | | $ | 34,931,709 | | | $ | 443,932 | |
| | | | | | |
| 128 | | DoubleLine Funds Trust | | | | |
10. Offsetting Assets and Liabilities
The Funds are subject to various Master Netting Arrangements, which govern the terms of certain transactions with select counterparties. The Master Netting Arrangements allow the Funds to close out and net their total exposure to a counterparty in the event of a default with respect to all the transactions governed under a single agreement with a counterparty. The Master Netting Arrangements also specify collateral posting arrangements at pre-arranged exposure levels. Under the Master Netting Arrangements, collateral is routinely transferred if the total net exposure to certain transactions (net of existing collateral already in place) governed under the relevant Master Netting Arrangement with a counterparty in a given account exceeds a specified threshold depending on the counterparty and the type of Master Netting Arrangement.
As of March 31, 2016 the Trust held the following derivative instruments that were subject to offsetting on the Statements of Assets and Liabilities:
DoubleLine Multi-Asset Growth Fund (Consolidated)
Assets:
| | | | | | | | | | | | | | | | | | | | | | | | |
| Description | | Gross
Amounts of
Recognized
Assets | | | Gross Amounts
Offset in the
Statement of
Assets and
Liabilities | | | Net Amounts
presented in the
Statement of
Assets and
Liabilities | | | Gross Amounts not offset in the
Statement of Assets and Liabilities | | | Net
Amount | |
| | | | | Financial
Instruments | | | Cash
Collateral
Received | | |
Written Options | | $ | — | | | $ | — | | | $ | — | | | $ | — | | | $ | — | | | $ | — | |
Forwards | | | 126,323 | | | | 37,205 | | | | 89,118 | | | | 89,118 | | | | — | | | | — | |
Swap Contracts | | | — | | | | — | | | | — | | | | — | | | | — | | | | — | |
| | $ | 126,323 | | | $ | 37,205 | | | $ | 89,118 | | | $ | 89,118 | | | $ | — | | | $ | — | |
Liabilities:
| | | | | | | | | | | | | | | | | | | | | | | | |
| Description | | Gross
Amounts of
Recognized
Liabilities | | | Gross Amounts
Offset in the
Statement of
Assets and
Liabilities | | | Net Amounts
presented in the
Statement of
Assets and
Liabilities | | | Gross Amounts not offset in the
Statement of Assets and Liabilities | | | Net
Amount | |
| | | | | Financial
Instruments | | | Cash
Collateral
Pledged | | |
Written Options | | $ | 179,000 | | | $ | — | | | $ | 179,000 | | | $ | 179,000 | | | $ | — | | | $ | — | |
Forwards | | | 37,205 | | | | 37,205 | | | | — | | | | — | | | | — | | | | — | |
Swap Contracts | | | — | | | | — | | | | — | | | | — | | | | — | | | | — | |
| | $ | 216,205 | | | $ | 37,205 | | | $ | 179,000 | | | $ | 179,000 | | | $ | — | | | $ | — | |
DoubleLine Shiller Enhanced CAPE®
Assets:
| | | | | | | | | | | | | | | | | | | | | | | | |
| Description | | Gross
Amounts of
Recognized
Assets | | | Gross Amounts
Offset in the
Statement of
Assets and
Liabilities | | | Net Amounts
presented in the
Statement of Assets and
Liabilities | | | Gross Amounts not offset in the
Statement of Assets and Liabilities | | | Net
Amount | |
| | | | | Financial
Instruments | | | Cash
Collateral
Received | | |
Swap Contracts | | $ | 45,580,930 | | | $ | 14,928 | | | $ | 45,566,002 | | | $ | 4,796,346 | | | $ | 40,769,656 | | | $ | — | |
Liabilities:
| | | | | | | | | | | | | | | | | | | | | | | | |
| Description | | Gross
Amounts of
Recognized
Liabilities | | | Gross Amounts
Offset in the
Statement of
Assets and
Liabilities | | | Net Amounts
presented in the
Statement of
Assets and
Liabilities | | | Gross Amounts not offset in the
Statement of Assets and Liabilities | | | Net
Amount | |
| | | | | Financial Instruments | | | Cash
Collateral
Pledged | | |
Swap Contracts | | $ | 14,928 | | | $ | 14,928 | | | $ | — | | | $ | — | | | $ | — | | | $ | — | |
DoubleLine Strategic Commodity Fund (Consolidated)
Assets:
| | | | | | | | | | | | | | | | | | | | | | | | |
| Description | | Gross
Amounts of
Recognized
Assets | | | Gross Amounts
Offset in the
Statement of Assets and Liabilities | | | Net Amounts
presented in the Statement of
Assets and Liabilities | | | Gross Amounts not offset in the
Statement of Assets and Liabilities | | | Net
Amount | |
| | | | | Financial
Instruments | | | Cash
Collateral
Received | | |
Swap Contracts | | $ | 819,736 | | | $ | 375,804 | | | $ | 443,932 | | | $ | 443,932 | | | $ | — | | | $ | — | |
Liabilities:
| | | | | | | | | | | | | | | | | | | | | | | | |
| Description | | Gross
Amounts of
Recognized
Liabilities | | | Gross Amounts
Offset in the
Statement of
Assets and
Liabilities | | | Net Amounts presented in the
Statement of
Assets and
Liabilities | | | Gross Amounts not offset in the
Statement of Assets and Liabilities | | | Net
Amount | |
| | | | | Financial
Instruments | | | Cash
Collateral
Pledged | | |
Swap Contracts | | $ | 375,804 | | | $ | 375,804 | | | $ | — | | | $ | — | | | $ | — | | | $ | — | |
| | | | | | |
| | Annual Report | | March 31, 2016 | | 129 |
| | |
| Notes to Financial Statements (Cont.) | | March 31, 2016 |
11. Bank Loans
The Funds may make loans directly to borrowers and may acquire or invest in loans made by others (“loans”). The Funds may acquire a loan interest directly by acting as a member of the original lending syndicate. Alternatively, the Funds may acquire some or all of the interest of a bank or other lending institution in a loan to a particular borrower by means of a novation, an assignment or a participation. The loans in which the Funds may invest include those that pay fixed rates of interest and those that pay floating rates—i.e., rates that adjust periodically based on a known lending rate, such as a bank’s prime rate. The Funds may purchase and sell interests in bank loans on a when-issued and delayed delivery basis, with payment delivery scheduled for a future date. Securities purchased on a delayed delivery basis are marked to market daily and no income accrues to the Funds prior to the date the Funds actually take delivery of such securities. These transactions are subject to market fluctuations and are subject, among other risks, to the risk that the value at delivery may be more or less than the trade purchase price.
12. Credit Facility
U.S. Bank, N.A. (the “Bank”) has made available to the Trust (the “DoubleLine Funds”), an uncommitted, $600,000,000 credit facility for short term liquidity in connection with shareholder redemptions. Under the terms of the credit facility, borrowings for each DoubleLine Fund are limited to one-third of the total assets (including the amount borrowed) of such DoubleLine Fund. Fifty percent of the credit facility is available to all of the DoubleLine Funds, on a first come, first served basis. The remaining 50% of the credit facility is allocated among the DoubleLine Funds in accordance with procedures adopted by the Board. Borrowings under this credit facility bear interest at the Bank’s prime rate less 0.50% (weighted average rate of 2.81% for the period ended March 31, 2016).
The Bank has also made available to the DoubleLine Floating Rate Fund a committed $40,000,000 credit facility. Borrowings under this credit facility bear interest at the Bank’s prime rate less 0.50% and the credit facility bears an unused commitment fee equal to 0.12% on the unused portion of the credit facility.
For the year ended March 31, 2016, the Funds’ credit facility activity is as follows:
| | | | | | | | | | | | | | | | | | |
| | | | | Average
Borrowings | | | Maximum Amount
Outstanding | | | Interest
Expense | | | Commitment
Fee | |
DoubleLine Emerging Markets Fixed Income Fund | | | | $ | 9,821,408 | | | $ | 39,973,000 | | | $ | 38,058 | | | $ | — | |
DoubleLine Low Duration Bond Fund | | | | | 5,464,000 | | | | 5,464,000 | | | | 417 | | | | — | |
DoubleLine Floating Rate Fund | | | | | — | | | | — | | | | — | | | | 48,800 | |
DoubleLine Flexible Income Fund | | | | | 1,170,167 | | | | 2,735,000 | | | | 1,149 | | | | — | |
DoubleLine Low Duration Emerging Markets Fixed Income Fund | | | | | 4,068,618 | | | | 13,822,000 | | | | 10,567 | | | | — | |
13. Significant Shareholder Holdings
As of March 31, 2016, a single beneficial shareholder held 90% of the outstanding Class I shares of DoubleLine Strategic Commodity Fund and 85% of the DoubleLine Strategic Commodity Fund’s outstanding shares. That shareholder may control the DoubleLine Strategic Commodity Fund and a redemption of all or a substantial portion of that shareholder’s investment in the Fund may adversely affect the Fund and its investment performance. See the description of “large shareholder risk” in the following Principal Risks footnote.
14. Principal Risks:
Below are summaries of some, but not all, of the principal risks of investing in one or more of the Funds, each of which could adversely affect a Fund’s NAV, yield and total return. Each risk listed below does not necessarily apply to each Fund, and you should read each Fund’s prospectus carefully for a description of the principal risks associated with investing in a particular Fund.
| | • | affiliated fund risk: the risk that, due to its own financial interest or other business considerations, each Adviser may have an incentive to invest a portion of a Fund’s assets in investment companies sponsored or managed by each Adviser or its affiliates in lieu of investments by the Fund directly in portfolio securities, or may have an incentive to invest in such investment companies over investment companies sponsored or managed by others. Similarly, each Adviser may have an incentive to delay or decide against the sale of interests held by the Fund in investment companies sponsored or managed by the Adviser or its affiliates. |
| | • | asset allocation risk: the risk that a Fund’s investment performance may depend, at least in part, on how its assets are allocated and reallocated among asset classes, sectors and/or underlying funds and that such allocation will focus on asset classes, sectors, underlying funds, or investments that perform poorly or underperform other asset classes, sectors, underlying funds, or available investments. |
| | • | asset-backed securities investment risk: the risk that borrowers may default on the obligations that underlie the asset-backed security and that, during periods of falling interest rates, asset-backed securities may be called or prepaid, which may result in a Fund having to reinvest proceeds in other investments at a lower interest rate, and the risk that the impairment of the value of the collateral underlying a security in which a Fund invests (due, for example, to non-payment of loans) will result in a reduction in the value of the security. |
| | | | | | |
| 130 | | DoubleLine Funds Trust | | | | |
| | • | cash position risk: to the extent that a Fund holds assets in cash, cash equivalents, and other short-term investments, the ability of the Fund to meet its objective may be limited. |
| | • | collateralized debt obligations risk: the risks of an investment in a collateralized debt obligation (“CDO”) depend largely on the quality and type of the collateral and the tranche of the CDO in which a Fund invests. Normally, collateralized bond obligations (“CBOs”), CLOs and other CDOs are privately offered and sold, and thus are not registered under the securities laws. As a result, investments in CDOs may be characterized by a Fund as illiquid securities; however, an active dealer market, or other relevant measures of liquidity, may exist for CDOs allowing a CDO potentially to be deemed liquid by each Adviser under liquidity policies approved by the Board. In addition to the risks associated with debt instruments (e.g., interest rate risk and credit risk), CDOs carry additional risks including, but not limited to: (i) the possibility that distributions from collateral will not be adequate to make interest or other payments; (ii) the quality of the collateral may decline in value or default; (iii) the possibility that a Fund may invest in CDOs that are subordinate to other classes; and (iv) the complex structure of the security may not be fully understood at the time of investment and may produce disputes with the issuer or unexpected investment results. |
| | • | commodities risk: the risk that the value of a Fund’s shares may be affected by changes in the values of the Fund’s investment exposures to commodities or commodity-related instruments, which may be extremely volatile and the value of which may be difficult to determine. The value of commodities and commodity-related instruments may be affected by market movements, commodity index volatility, changes in interest rates, or factors affecting a particular sector, industry or commodity, such as drought, floods, weather, livestock disease, embargoes, tariffs and international economic, political and regulatory developments. |
| | • | confidential information access risk: the risk that the intentional or unintentional receipt of material, non-public information (“Confidential Information”) by each Adviser could limit a Fund’s ability to sell certain investments held by the Fund or pursue certain investment opportunities on behalf of the Fund, potentially for a substantial period of time. |
| | • | convertible securities risk: investing in convertible bonds and securities includes the risk that the issuer may default in the payment of principal and/or interest and the risk that the value of the investment may decline if interest rates rise. Such events may reduce a Fund’s distributable income and the value of the Fund’s shares. |
| | • | counterparty risk: the risk that a Fund will be subject to credit risk with respect to the counterparties to the derivative contracts and other instruments entered into directly by the Fund or held by special purpose or structured vehicles in which the Fund invests. Subject to certain limitations for U.S. federal income tax purposes, the Fund is not subject to any limit with respect to the number or the value of transactions it can enter into with a single counterparty. To the extent that a Fund enters into multiple transactions with a single or a small set of counterparties, it will be subject to increased counterparty risk. |
| | ° | | credit risk: the risk that an issuer or counterparty will fail to pay its obligations to a Fund when they are due. As a result, a Fund’s income might be reduced, the value of the Fund’s investment might fall, and/or the Fund could lose the entire amount of its investment. Changes in the financial condition of an issuer or counterparty, changes in specific economic, social or political conditions that affect a particular type of security or other instrument or an issuer, and changes in economic, social or political conditions generally can increase the risk of default by an issuer or counterparty, which can affect a security’s or other instrument’s credit quality or value and an issuer’s or counterparty’s ability to pay interest and principal when due. |
| | ° | | extension risk: the risk that if interest rates rise, repayments of principal on certain debt securities may occur at a slower rate than expected and the expected maturity of those securities could lengthen as a result. Securities that are subject to extension risk generally have a greater potential for loss when prevailing interest rates rise, which could cause their values to fall sharply. |
| | ° | | interest rate risk: the risk that debt instruments will change in value because of changes in interest rates. The value of an instrument with a longer duration (whether positive or negative) will be more sensitive to changes in interest rates than a similar instrument with a shorter duration. As of the date of this report, interest rates in the U.S. are at or near historically low levels. As such, bond funds may currently face an increased exposure to the risks associated with rising interest rates. |
| | • | defaulted securities risk: the risk of the uncertainty of repayment of defaulted securities and obligations of distressed issuers. |
| | • | derivatives risk: the risk that an investment in derivatives will not perform as anticipated by each Adviser, cannot be closed out at a favorable time or price, or will increase a Fund’s volatility; that derivatives may create investment leverage; that, when a derivative is used as a substitute for or alternative to a direct cash investment, the transaction may not provide a return that corresponds precisely with that of the cash investment; or that, when used for hedging purposes, derivatives will not provide the anticipated protection, causing a Fund to lose money on both the derivatives transaction and the exposure the Fund sought to hedge. |
| | • | emerging market country risk: the risk that investing in emerging markets will be subject to greater political and economic instability, greater volatility in currency exchange rates, less developed securities markets, possible trade barriers, currency transfer restrictions, a more limited number of potential buyers, an emerging market country’s dependence on revenue from particular commodities or international aid, less governmental supervision and regulation, unavailability of currency hedging techniques, differences in auditing and financial reporting standards, thinner trading markets, different clearing and settlement procedures and custodial services, and less developed legal systems than in many more developed countries. |
| | | | | | |
| | Annual Report | | March 31, 2016 | | 131 |
| | |
| Notes to Financial Statements (Cont.) | | March 31, 2016 |
| | • | equity issuer risk: the risk that the market price of common stocks and other equity securities may go up or down, sometimes rapidly or unpredictably, including due to factors affecting equity securities markets generally, particular industries represented in those markets, or the issuer itself. |
| | • | exchange-traded note risk: the risk that the level of the particular market benchmark or strategy to which the note’s return is linked will fall in value; exchange-traded notes are subject to the credit risk of the issuer. |
| | • | financial services risk: the risk that an investment in issuers in the financial services sector may be adversely affected by, among other things: (i) changes in the regulatory framework or economic conditions that may negatively affect financial service businesses; (ii) exposure of a financial institution to non-diversified or concentrated loan portfolios; (iii) exposure to financial leverage and/or investments or agreements which, under certain circumstances, may lead to losses, for example sub-prime loans; and (iv) the risk that a market shock or other unexpected market, economic, political, regulatory, or other event might lead to a sudden decline in the values of most or all companies in the financial services sector. |
| | • | focused investment risk: a Fund that invests a substantial portion of its assets in a particular market, industry, sector, group of industries or sectors, country, region, group of countries or asset class is subject to greater risk than a Fund that invests in a more diverse investment portfolio. In addition, the value of such a Fund is more susceptible to any single economic, market, political, regulatory or other occurrence affecting, for example, the particular markets, industries, countries, regions, sectors or asset classes in which the Fund is invested. |
| | • | foreign currency risk: the risk that fluctuations in exchange rates may adversely affect the value of a Fund’s investments denominated in foreign currencies. |
| | • | foreign investing risk: the risk that a Fund’s investments will be affected by political, regulatory, and economic risks not present in domestic investments. If a Fund buys securities denominated in a foreign currency, there are special risks such as changes in currency exchange rates and the risk that a foreign government could regulate or restrict foreign exchange transactions. To the extent that investments are made in a limited number of countries, events in those countries will have a more significant impact on a Fund. |
| | • | high yield risk: the risk that debt instruments rated below investment grade or debt instruments that are unrated and determined by each Adviser to be of comparable quality are predominantly speculative. These instruments have a higher degree of default risk and may be less liquid than higher-rated bonds. These instruments may be subject to greater price volatility due to such factors as specific corporate developments, interest rate sensitivity, negative perceptions of high yield investments generally, and less secondary market liquidity. |
| | • | index risk: the risk that a Fund’s return may not match or may underperform the return of an index utilized by the Fund. In addition, a decline in the value of an index used by the Fund should be expected to reduce the overall total return of the Fund. Although each Adviser may license from an index’s sponsor the right to use an index as part of implementing the Fund’s principal investment strategies, there can be no guarantee that an index used by the Fund will be maintained indefinitely or that the Fund will be able to continue to utilize the index to implement the Fund’s principal investment strategies indefinitely. |
| | • | inflation-indexed bond risk: the risk that such bonds will change in value in response to actual or anticipated changes in inflation rates in a manner unanticipated by a Fund’s portfolio management team or investors generally. Inflation-indexed bonds are subject to debt securities risks. |
| | • | investment company and exchange-traded fund risk: the risk that an investment company or other pooled investment vehicle, including any exchange-traded fund (“ETF”), in which a Fund invests will not achieve its investment objective or execute its investment strategies effectively or that significant purchase or redemption activity by shareholders of such an investment company might negatively affect the value of the investment company’s shares. A Fund must pay its pro rata portion of an investment company’s fees and expenses. |
| | • | large shareholder risk: the risk that certain account holders, including funds or accounts over which each Adviser (or an affiliate of an Adviser) has investment discretion, may from time to time own or control a significant percentage of a Fund’s shares. A Fund is subject to the risk that a redemption by those shareholders of all or a portion of their Fund shares, including as a result of an asset allocation decision made by an Adviser (or an affiliate of an Adviser), will adversely affect the Fund’s performance if it is forced to sell portfolio securities or invest cash when each Adviser would not otherwise choose to do so. Redemptions of a large number of shares may affect the liquidity of a Fund’s portfolio, increase a Fund’s transaction costs, and accelerate the realization of taxable income and/or gains to shareholders. |
| | • | leveraging risk: the risk that certain investments by a Fund involving leverage may have the effect of increasing the volatility of the Fund’s portfolio, and the risk of loss in excess of invested capital. |
| | • | limited operating history risk: the risk that a recently formed fund has a limited operating history to evaluate and may not attract sufficient assets to achieve or maximize investment and operational efficiencies. |
| | • | liquidity risk: the risk that a Fund may be unable to sell a portfolio investment at a desirable time or at the value the Fund has placed on the investment. |
| | • | loan risk: includes, among other risks, the risk that (i) if a Fund holds a loan through another financial institution, or relies on a financial institution to administer the loan, its receipt of principal and interest on the loan may be subject to the credit risk of that financial institution; (ii) it is possible that any collateral securing a loan may be insufficient or unavailable to a Fund; (iii) investments in highly leveraged loans or loans of stressed, distressed, or defaulted issuers may be subject to significant credit and liquidity risk; (iv) a bankruptcy or other court proceeding could delay or limit the ability of a Fund to collect the principal and interest payments on that borrower’s loans or adversely affect the Fund’s rights in collateral relating to a loan; (v) if a borrower fails to comply with various restrictive covenants that are typically in loan agreements, the borrower may default in payment of the loan; (vi) transactions in loans may settle on a delayed basis, and the Fund potentially may not receive the proceeds from the sale of |
| | | | | | |
| 132 | | DoubleLine Funds Trust | | | | |
| | a loan for a substantial period of time after the sale; and (vii) loans may be difficult to value and may be illiquid, which may adversely affect an investment in a Fund. It is unclear whether the protections of the securities laws against fraud and misrepresentation extend to loans and other forms of direct indebtedness. In the absence of definitive regulatory guidance, the Fund relies on the Adviser’s research in an attempt to avoid situations where fraud or misrepresentation could adversely affect the Fund. There can be no assurance that the Adviser’s efforts in this regard will be successful. |
| | • | market capitalization risk: the risk that investing substantially in issuers in one market capitalization category (large, medium or small) may adversely affect a Fund because of unfavorable market conditions particular to that category of issuers, such as larger, more established companies being unable to respond quickly to new competitive challenges or attain the high growth rates of successful smaller companies, or, conversely, stocks of smaller companies being more volatile than those of larger companies due to, among other things, narrower product lines, more limited financial resources, fewer experienced managers and there typically being less publicly available information about small capitalization companies. |
| | • | market risk: the risk that markets will perform poorly or that the returns from the securities in which a Fund invests will underperform returns from the general securities markets or other types of investments. Securities markets may, in response to governmental actions or intervention, economic or market developments, or other external factors, experience periods of high volatility and reduced liquidity. During those periods, the Fund may experience high levels of shareholder redemptions, and may have to sell securities at times when the Fund would otherwise not do so, and potentially at unfavorable prices. Certain securities may be difficult to value during such periods. These risks may be heightened for fixed income securities due to the current historically low interest rate environment. |
| | • | mortgage-backed securities risk: the risk that borrowers may default on their mortgage obligations or the guarantees underlying the mortgage-backed securities will default or otherwise fail and that, during periods of falling interest rates, mortgage-backed securities will be called or prepaid, which may result in a Fund having to reinvest proceeds in other investments at a lower interest rate. During periods of rising interest rates, the average life of a mortgage-backed security may extend, which may lock in a below-market interest rate, increase the security’s duration, and reduce the value of the security. Enforcing rights against the underlying assets or collateral may be difficult, or the underlying assets or collateral may be insufficient if the issuer defaults. The values of certain types of mortgage-backed securities, such as inverse floaters and interest-only and principal-only securities, may be extremely sensitive to changes in interest rates and prepayment rates. |
| | • | portfolio management risk: the risk that an investment strategy may fail to produce the intended results or that the securities held by a Fund will underperform other comparable funds because of the portfolio managers’ choice of investments. |
| | • | portfolio turnover risk: the risk that frequent purchases and sales of portfolio securities may result in higher Fund expenses and may result in larger distributions of taxable capital gains to investors as compared to a fund that trades less frequently. |
| | • | preferred securities risk: the risk that: (i) certain preferred stocks contain provisions that allow an issuer under certain conditions to skip or defer distributions; (ii) preferred stocks may be subject to redemption, including at the issuer’s call, and, in the event of redemption, the Fund may not be able to reinvest the proceeds at comparable or favorable rates of return; (iii) preferred stocks are generally subordinated to bonds and other debt securities in an issuer’s capital structure in terms of priority for corporate income and liquidation payments; and (iv) preferred stocks may trade less frequently and in a more limited volume and may be subject to more abrupt or erratic price movements than many other securities. |
| | • | prepayment risk: the risk that the issuer of a debt security, including floating rate loans and mortgage-related securities, repays all or a portion of the principal prior to the security’s maturity. |
| | • | price volatility risk: the risk that the value of a Fund’s investment portfolio will change, potentially frequently and in large amounts, as the prices of its investments go up or down. |
| | • | real estate risk: the risk that real estate-related investments may decline in value as a result of factors affecting the real estate industry, such as the supply of real property in certain markets, changes in zoning laws, delays in completion of construction, changes in real estate values, changes in property taxes, levels of occupancy, and local and regional market conditions. |
| | • | reliance on each adviser: the risk associated with each Fund’s ability to achieve its investment objective being dependent upon each Adviser’s ability to identify profitable investment opportunities for the Fund. While the portfolio managers of a Fund may have considerable experience in managing other portfolios with investment objectives, policies and strategies that are similar, the past experience of the portfolio managers does not guarantee future results for the Fund. |
| | • | securities or sector selection risk: the risk that the securities held by a Fund will underperform securities held in other funds investing in similar asset classes or comparable benchmarks because of the portfolio managers’ choice of securities or sectors for investment. To the extent a Fund focuses or concentrates its investments in a particular sector or related sectors, the Fund will be more susceptible to events or factors affecting companies in that sector or related sectors. |
| | • | short position risk: the risk that an increase in the value of an instrument with respect to which a Fund has established a short position will result in a loss to the Fund. |
| | • | sovereign debt obligations risk: the risk that investments in debt obligations of sovereign governments may lose value due to the government entity’s unwillingness or ability to repay principal and interest. |
| | • | structured products and structured notes risk: the risk that an investment in a structured product may decline in value due to changes in the underlying instruments on which the product is based |
| | | | | | |
| | Annual Report | | March 31, 2016 | | 133 |
| | |
| Notes to Financial Statements (Cont.) | | March 31, 2016 |
| | • | tax risk: in order to qualify as a regulated investment company under the Internal Revenue Code of 1986, as amended (“Code”), a Fund must meet requirements regarding, among other things, the source of its income. It is possible that certain of a Fund’s investments in commodity-linked derivatives, ETFs and other investment pools will not give rise to “qualifying income” for this purpose. Any income a Fund derives from investments in instruments that do not generate qualifying income must be limited to a maximum of 10% of a Fund’s annual gross income. If a Fund were to earn non-qualifying income in excess of 10% of its annual gross income, it could fail to qualify as a regulated investment company for that year. If a Fund were to fail to qualify as a regulated investment company, the Fund would be subject to tax and shareholders of the Fund would be subject to the risk of diminished returns. |
| | • | U.S. Government securities risk: the risk that debt securities issued or guaranteed by certain U.S. Government agencies, instrumentalities, and sponsored enterprises are not supported by the full faith and credit of the U.S. Government, and so investments in their securities or obligations issued by them involve credit risk greater than investments in other types of U.S. Government securities. |
15. Recently Issued Accounting Pronouncements
In May 2015, the FASB issued ASU No. 2015-07, which removes the requirement to categorize within the fair value hierarchy all investments for which fair value is measured using the net asset value per share practical expedient. The guidance is effective for fiscal years beginning after December 15, 2015 and for interim periods within those years and early adoption is permitted.
Management is currently evaluating the implications of these changes and their impact on the financial statements.
16. Subsequent Events
DoubleLine Infrastructure Income Fund, a new series of the Trust, commenced operations on April 1, 2016. Its investment objective is to seek long-term total return while striving to generate current income.
In preparing these financial statements, the Funds have evaluated events and transactions for potential recognition or disclosure through the date the financial statements were issued. The Funds have determined there are no subsequent events that would need to be disclosed in the Funds’ financial statements.
| | | | | | |
| 134 | | DoubleLine Funds Trust | | | | |
| | |
| Report of Independent Registered Public Accounting Firm | | |
To the Board of Trustees and Shareholders of DoubleLine Funds Trust
In our opinion, the accompanying statements of assets and liabilities, including the schedules of investments, and the related statements of operations and of changes in net assets and the financial highlights present fairly, in all material respects, the financial position of DoubleLine Total Return Bond Fund, DoubleLine Core Fixed Income Fund, DoubleLine Emerging Markets Fixed Income Fund, DoubleLine Multi-Asset Growth Fund (Consolidated), DoubleLine Low Duration Bond Fund, DoubleLine Floating Rate Fund, DoubleLine Shiller Enhanced CAPE®, DoubleLine Flexible Income Fund, DoubleLine Low Duration Emerging Markets Fixed Income Fund, DoubleLine Long Duration Total Return Bond Fund, DoubleLine Strategic Commodity Fund (Consolidated) and DoubleLine Global Bond Fund (twelve of the portfolios constituting DoubleLine Funds Trust, hereafter referred to as the “Funds”) at March 31, 2016, the results of each of their operations, the changes in each of their net assets and the financial highlights for each of the periods indicated, in conformity with accounting principles generally accepted in the United States of America. These financial statements and financial highlights (hereafter referred to as “financial statements”) are the responsibility of the Funds’ management. Our responsibility is to express an opinion on these financial statements based on our audits. We conducted our audits of these financial statements in accordance with the standards of the Public Company Accounting Oversight Board (United States). Those standards require that we plan and perform the audit to obtain reasonable assurance about whether the financial statements are free of material misstatement. An audit includes examining, on a test basis, evidence supporting the amounts and disclosures in the financial statements, assessing the accounting principles used and significant estimates made by management, and evaluating the overall financial statement presentation. We believe that our audits, which included confirmation of securities at March 31, 2016 by correspondence with the custodian and brokers, provide a reasonable basis for our opinion.
PricewaterhouseCoopers LLP
Los Angeles, California
May 23, 2016
| | | | | | |
| | Annual Report | | March 31, 2016 | | 135 |
| | |
| Shareholder Expenses | | (Unaudited) March 31, 2016 |
Example
As a shareholder of the Funds, you incur two basic types of costs: (1) transaction costs , including sales charges (loads) on purchase payments, reinvested dividends, or other distributions; redemption fees; and exchange fees; and (2) ongoing costs, including management fees; distribution (12b-1) fees and other Fund expenses.
This Example is intended to help you understand your ongoing costs (in dollars) of investing in each Fund and to compare these costs with the ongoing costs of investing in other mutual funds. The Example is based on an investment of $1,000 invested at the beginning of the period and held for the entire period 10/1/15 through 3/31/16.*
Actual Expenses
The actual return columns in the following table provide information about account values based on actual returns and actual expenses. You may use the information in these columns, together with the amount you invested, to estimate the expenses that you paid over the period. Simply divide your account value by $1,000 (for example, an $8,600 account value divided by $1,000 = 8.6), then multiply the result by the number in the respective line under the heading entitled “Expenses Paid During Period” to estimate the expenses you paid on your account during this period. In addition to the expenses shown below in the table, as a shareholder you will be assessed fees for outgoing wire transfers, returned checks and stop payment orders at prevailing rates charged by U.S. Bancorp Fund Services, LLC, the Fund’s transfer agent. Currently, if you request a redemption be made by wire, a $15.00 fee is charged by the Fund’s transfer agent. You will be charged a redemption fee equal to 1.00% of the net amount of the redemption if you redeem shares that have been held for less than 90 days in the DoubleLine Multi-Asset Growth Fund and the DoubleLine Floating Rate Fund. An Individual Retirement Account (“IRA”) will be charged a $15.00 annual maintenance fee. The transfer agent charges a transaction fee of $25.00 on returned checks and stop payment orders. If you paid a transaction fee, you would add the fee amount to the expenses paid on your account this period to obtain your total expenses paid.
Hypothetical Example for Comparison Purposes
The hypothetical return columns in the following table provide information about hypothetical account values and hypothetical expenses based on a Fund’s actual expense ratio and an assumed rate of return of 5% per year before expenses, which is not a Fund’s actual return. The hypothetical account values and expenses may not be used to estimate the actual ending account balance or expenses you paid for the period. You may use this information to compare the ongoing costs of investing in a Fund and other funds. To do so, compare this 5% hypothetical example with the 5% hypothetical examples that appear in the shareholder reports of the other funds. Please note that the expenses shown in the table are meant to highlight your ongoing costs only and do not reflect the transaction fees discussed above. Therefore, those columns are useful in comparing ongoing costs only, and will not help you determine the relative total costs of owning different funds. In addition, if these transactional costs were included, your costs would have been higher.
| | | | | | | | | | | | | | | | | | | | | | | | | | | | |
| | | | | | | | | | | | | Actual | | | Hypothetical
(5% return
before expenses) | |
| | | | | | | Fund’s
Annualized
Expense Ratio1 | | | Beginning
Account
Value | | | Ending
Account
Value
3/31/16 | | | Expenses
Paid During
Period*1 | | | Ending
Account
Value
3/31/16 | | | Expenses
Paid During
Period*1 | |
DoubleLine Total Return Bond Fund | | | | Class I | | | 0.47% | | | $ | 1,000 | | | $ | 1,013 | | | $ | 2.36 | | | $ | 1,023 | | | $ | 2.38 | |
| | | | | Class N | | | 0.72% | | | $ | 1,000 | | | $ | 1,012 | | | $ | 3.62 | | | $ | 1,021 | | | $ | 3.64 | |
DoubleLine Core Fixed Income Fund | | | | Class I | | | 0.46% | | | $ | 1,000 | | | $ | 1,018 | | | $ | 2.32 | | | $ | 1,023 | | | $ | 2.33 | |
| | | | | Class N | | | 0.71% | | | $ | 1,000 | | | $ | 1,016 | | | $ | 3.58 | | | $ | 1,021 | | | $ | 3.59 | |
DoubleLine Emerging Markets Fixed Income Fund | | | | Class I | | | 0.91% | | | $ | 1,000 | | | $ | 1,025 | | | $ | 4.61 | | | $ | 1,020 | | | $ | 4.60 | |
| | | | | Class N | | | 1.16% | | | $ | 1,000 | | | $ | 1,024 | | | $ | 5.87 | | | $ | 1,019 | | | $ | 5.86 | |
DoubleLine Multi-Asset Growth Fund (Consolidated) | | | | Class I | | | 1.02% | | | $ | 1,000 | | | $ | 1,030 | | | $ | 5.18 | | | $ | 1,020 | | | $ | 5.15 | |
| | | | | Class A | | | 1.27% | | | $ | 1,000 | | | $ | 1,030 | | | $ | 6.45 | | | $ | 1,019 | | | $ | 6.41 | |
DoubleLine Low Duration Bond Fund | | | | Class I | | | 0.42% | | | $ | 1,000 | | | $ | 1,007 | | | $ | 2.11 | | | $ | 1,023 | | | $ | 2.12 | |
| | | | | Class N | | | 0.67% | | | $ | 1,000 | | | $ | 1,005 | | | $ | 3.36 | | | $ | 1,022 | | | $ | 3.39 | |
DoubleLine Floating Rate Fund | | | | Class I | | | 0.66% | | | $ | 1,000 | | | $ | 996 | | | $ | 3.29 | | | $ | 1,022 | | | $ | 3.34 | |
| | | | | Class N | | | 0.91% | | | $ | 1,000 | | | $ | 995 | | | $ | 4.54 | | | $ | 1,020 | | | $ | 4.60 | |
DoubleLine Shiller Enhanced CAPE® | | | | Class I | | | 0.61% | | | $ | 1,000 | | | $ | 1,133 | | | $ | 3.25 | | | $ | 1,022 | | | $ | 3.08 | |
| | | | | Class N | | | 0.86% | | | $ | 1,000 | | | $ | 1,132 | | | $ | 4.58 | | | $ | 1,021 | | | $ | 4.34 | |
DoubleLine Flexible Income Fund | | | | Class I | | | 0.77% | | | $ | 1,000 | | | $ | 997 | | | $ | 3.84 | | | $ | 1,021 | | | $ | 3.89 | |
| | | | | Class N | | | 1.02% | | | $ | 1,000 | | | $ | 996 | | | $ | 5.09 | | | $ | 1,020 | | | $ | 5.15 | |
DoubleLine Low Duration Emerging Markets Fixed Income Fund | | | | Class I | | | 0.59% | | | $ | 1,000 | | | $ | 1,021 | | | $ | 2.98 | | | $ | 1,022 | | | $ | 2.98 | |
| | | | | Class N | | | 0.84% | | | $ | 1,000 | | | $ | 1,020 | | | $ | 4.24 | | | $ | 1,021 | | | $ | 4.24 | |
DoubleLine Long Duration Total Return Bond Fund | | | | Class I | | | 0.65% | | | $ | 1,000 | | | $ | 1,046 | | | $ | 3.32 | | | $ | 1,022 | | | $ | 3.29 | |
| | | | | Class N | | | 0.90% | | | $ | 1,000 | | | $ | 1,045 | | | $ | 4.60 | | | $ | 1,021 | | | $ | 4.55 | |
DoubleLine Strategic Commodity Fund (Consolidated) | | | | Class I | | | 0.92% | | | $ | 1,000 | | | $ | 994 | | | $ | 4.59 | | | $ | 1,020 | | | $ | 4.65 | |
| | | | | Class N | | | 1.17% | | | $ | 1,000 | | | $ | 992 | | | $ | 5.83 | | | $ | 1,019 | | | $ | 5.91 | |
DoubleLine Global Bond Fund | | | | Class I | | | 0.70% | | | $ | 1,000 | | | $ | 1,051 | | | $ | 2.06 | | | $ | 1,022 | | | $ | 3.54 | |
| | | | | Class N | | | 0.95% | | | $ | 1,000 | | | $ | 1,051 | | | $ | 2.79 | | | $ | 1,020 | | | $ | 4.80 | |
* Expenses Paid During Period are equal to the net annualized expense ratio for the class, multiplied by the average account value over the period, multiplied by 183/365 (to reflect the one-half year period). The actual dollar amounts shown as expenses paid during the period for the DoubleLine Global Bond Fund are multiplied by 105/366, which is based on the date of inception (December 17, 2015).
1 Reflects fee waiver and expense limitation arrangements in effect during the period.
| | | | | | |
| 136 | | DoubleLine Funds Trust | | | | |
| | |
| Growth of Investment | | (Unaudited) March 31, 2016 |
DoubleLine Total Return Bond Fund
Value of a $100,000 Investment
Class I Shares1
Average Annual Total Returns1
As of March 31, 2016
| | | | | | | | | | | | | | |
| | | | | 1 Year | | | 5 Year | | | Since
Inception
(4/6/2010) | |
DoubleLine Total Return Bond Fund Class I | | | | | 2.45% | | | | 5.36% | | | | 7.59% | |
Barclays U.S. Aggregate Bond Index | | | | | 1.96% | | | | 3.78% | | | | 4.11% | |
| | | | |
DoubleLine Total Return Bond Fund Class N | | | | | 2.20% | | | | 5.11% | | | | 7.33% | |
| 1 | Past performance is not an indication of future results. Returns represent past performance and reflect changes in share prices, the reinvestment of all dividends and capital gains, expense limitations and the effects of compounding. The prospectus contains more complete information on the investment objectives, risks, charges and expenses of the investment company, which investors should read and consider carefully before investing. To obtain a prospectus, contact a registered representative or visit www.doubleline.com. The Fund’s adviser waived a portion of its management fee and/or reimbursed Fund expenses during the period shown. Had the adviser not done so, the Fund’s total returns would have been lower. The returns shown do not reflect taxes a shareholder would pay on distributions or redemptions. Total investment return and principal value of your investment will fluctuate, and your shares, when redeemed, may be worth more or less than their original cost. Current performance may be higher or lower than the performance data quoted. Call 877-DLine11 or visit www.doubleline.com for performance results current to the most recent month-end. |
| 2 | Performance of other classes will be greater or less than the line shown based on the differences in loads and fees paid by shareholders investing in the different classes. |
| | Barclays U.S. Aggregate Bond Index — This index represents securities that are SEC-registered, taxable, and dollar denominated. The index covers the US investment grade fixed rate bond market, with index components for government and corporate securities, mortgage pass-through securities, and asset-backed securities. These major sectors are subdivided into more specific indices that are calculated and reported on a regular basis. The Fund’s investments likely will diverge widely from the components of the benchmark Index which could lead to performance dispersion between the Fund and the benchmark Index, meaning that the Fund could outperform or underperform the Index at any given time. |
| | | | | | |
| | Annual Report | | March 31, 2016 | | 137 |
| | |
| Growth of Investment (Cont.) | | (Unaudited) March 31, 2016 |
DoubleLine Core Fixed Income Fund
Value of a $100,000 Investment
Class I Shares1
Average Annual Total Returns1
As of March 31, 2016
| | | | | | | | | | | | | | |
| | | | | 1 Year | | | 5 Year | | | Since
Inception
(6/1/2010) | |
DoubleLine Core Fixed Income Fund Class I | | | | | 1.31% | | | | 5.16% | | | | 6.11% | |
Barclays U.S. Aggregate Bond Index | | | | | 1.96% | | | | 3.78% | | | | 3.78% | |
| | | | |
DoubleLine Core Fixed Income Fund Class N | | | | | 0.97% | | | | 4.89% | | | | 5.85% | |
| 1 | Past performance is not an indication of future results. Returns represent past performance and reflect changes in share prices, the reinvestment of all dividends and capital gains, expense limitations and the effects of compounding. The prospectus contains more complete information on the investment objectives, risks, charges and expenses of the investment company, which investors should read and consider carefully before investing. To obtain a prospectus, contact a registered representative or visit www.doubleline.com. The Fund’s adviser waived a portion of its management fee and/or reimbursed Fund expenses during the period shown. Had the adviser not done so, the Fund’s total returns would have been lower. The returns shown do not reflect taxes a shareholder would pay on distributions or redemptions. Total investment return and principal value of your investment will fluctuate, and your shares, when redeemed, may be worth more or less than their original cost. Current performance may be higher or lower than the performance data quoted. Call 877-DLine11 or visit www.doubleline.com for performance results current to the most recent month-end. |
| 2 | Performance of other classes will be greater or less than the line shown based on the differences in loads and fees paid by shareholders investing in the different classes. |
| | Barclays U.S. Aggregate Bond Index — This index represents securities that are SEC-registered, taxable, and dollar denominated. The index covers the US investment grade fixed rate bond market, with index components for government and corporate securities, mortgage pass-through securities, and asset-backed securities. These major sectors are subdivided into more specific indices that are calculated and reported on a regular basis. The Fund’s investments likely will diverge widely from the components of the benchmark Index which could lead to performance dispersion between the Fund and the benchmark Index, meaning that the Fund could outperform or underperform the Index at any given time. |
| | | | | | |
| 138 | | DoubleLine Funds Trust | | | | |
| | |
| | | (Unaudited) March 31, 2016 |
DoubleLine Emerging Markets Fixed Income Fund
Value of a $100,000 Investment
Class I Shares1
Average Annual Total Returns1
As of March 31, 2016
| | | | | | | | | | | | | | |
| | | | | 1 Year | | | 5 Year | | | Since
Inception
(4/6/2010) | |
DoubleLine Emerging Markets Fixed Income Fund Class I | | | | | (0.48)% | | | | 3.81% | | | | 5.07% | |
JP Morgan Emerging Markets Bond Global Diversified Index | | | | | 4.19% | | | | 6.22% | | | | 6.59% | |
| | | | |
DoubleLine Emerging Markets Fixed Income Fund Class N | | | | | (0.73)% | | | | 3.56% | | | | 4.82% | |
| 1 | Past performance is not an indication of future results. Returns represent past performance and reflect changes in share prices, the reinvestment of all dividends and capital gains, expense limitations and the effects of compounding. The prospectus contains more complete information on the investment objectives, risks, charges and expenses of the investment company, which investors should read and consider carefully before investing. To obtain a prospectus, contact a registered representative or visit www.doubleline.com. The Fund’s adviser waived a portion of its management fee and/or reimbursed Fund expenses during the period shown. Had the adviser not done so, the Fund’s total returns would have been lower. The returns shown do not reflect taxes a shareholder would pay on distributions or redemptions. Total investment return and principal value of your investment will fluctuate, and your shares, when redeemed, may be worth more or less than their original cost. Current performance may be higher or lower than the performance data quoted. Call 877-DLine11 or visit www.doubleline.com for performance results current to the most recent month-end. |
| 2 | Performance of other classes will be greater or less than the line shown based on the differences in loads and fees paid by shareholders investing in the different classes. |
| | JP Morgan Emerging Markets Bond Global Diversified Index — This index is an uniquely-weighted version of the EMBI Global. It limits the weights of those index countries with larger debt supplies by only including specified portions of these countries’ eligible current face amounts of debt outstanding. The countries covered in the Emerging Markets Bond Global Diversified are identical to those covered by EMBI Global. The Fund’s investments likely will diverge widely from the components of the benchmark Index which could lead to performance dispersion between the Fund and the benchmark Index, meaning that the Fund could outperform or underperform the Index at any given time. |
| | | | | | |
| | Annual Report | | March 31, 2016 | | 139 |
| | |
| Growth of Investment (Cont.) | | (Unaudited) March 31, 2016 |
DoubleLine Multi-Asset Growth Fund
Value of a $100,000 Investment
Class I Shares1
Average Annual Total Returns1
As of March 31, 2016
| | | | | | | | | | | | | | |
| | | | | 1 Year | | | 5 Year | | | Since
Inception
(12/20/2010) | |
DoubleLine Multi-Asset Growth Fund Class I | | | | | (4.29)% | | | | 2.09% | | | | 2.22% | |
S&P 500® Index | | | | | 1.78% | | | | 11.58% | | | | 12.35% | |
Blended Benchmark | | | | | (4.34)% | | | | 1.04% | | | | 1.77% | |
| | | | |
DoubleLine Multi-Asset Growth Fund (with load) Class A | | | | | (8.49)% | | | | 0.97% | | | | 1.12% | |
| 1 | Past performance is not an indication of future results. Returns represent past performance and reflect changes in share prices, the reinvestment of all dividends and capital gains, expense limitations and the effects of compounding. The prospectus contains more complete information on the investment objectives, risks, charges and expenses of the investment company, which investors should read and consider carefully before investing. To obtain a prospectus, contact a registered representative or visit www.doubleline.com. The Fund’s adviser waived a portion of its management fee and/or reimbursed Fund expenses during the period shown. Had the adviser not done so, the Fund’s total returns would have been lower. The returns shown do not reflect taxes a shareholder would pay on distributions or redemptions. Total investment return and principal value of your investment will fluctuate, and your shares, when redeemed, may be worth more or less than their original cost. Current performance may be higher or lower than the performance data quoted. Call 877-DLine11 or visit www.doubleline.com for performance results current to the most recent month-end. |
| 2 | Performance of other classes will be greater or less than the line shown based on the differences in loads and fees paid by shareholders investing in the different classes. |
| | The S&P 500® Index is an unmanaged capitalization-weighted index of 500 stocks designed to measure performance of the broad domestic economy through changes in the aggregate market value of 500 stocks representing all major industries. |
| | Blended Benchmark: 60% Barclays U.S. Aggregate Bond Index/ 25% Morgan Stanley Capital International All Country World Index/ 15% Standard & Poor’s Goldman Sachs Commodity Index (GSCI) Total Return. The Barclays Capital U.S. Aggregate Bond Index covers the US investment grade fixed rate bond market, with index components for government and corporate securities, mortgage pass-through securities, and asset-backed securities. These major sectors are subdivided into more specific indices that are calculated and reported on a regular basis. The Standard & Poor’s/Goldman Sachs Commodity Total Return Index is a composite index of commodity sector returns which represents a broadly diversified, unleveraged, long-only position in commodity futures. This index’s components qualify for inclusion in the index based on liquidity measures and are weighted in relation to their global production levels, making the index a valuable economic indicator and commodities market benchmark. The Morgan Stanley Capital International All Country World Index is designed to provide a broad measure of stock performance throughout the world, with the exception of U.S.-based companies. The MSCI All Country World Index Ex-U.S. includes both developed and emerging markets. The Fund’s investments likely will diverge widely from the components of the benchmark Index which could lead to performance dispersion between the Fund and the benchmark Index, meaning that the Fund could outperform or underperform the Index at any given time. |
| | | | | | |
| 140 | | DoubleLine Funds Trust | | | | |
| | |
| | | (Unaudited) March 31, 2016 |
DoubleLine Low Duration Bond Fund
Value of a $100,000 Investment
Class I Shares1
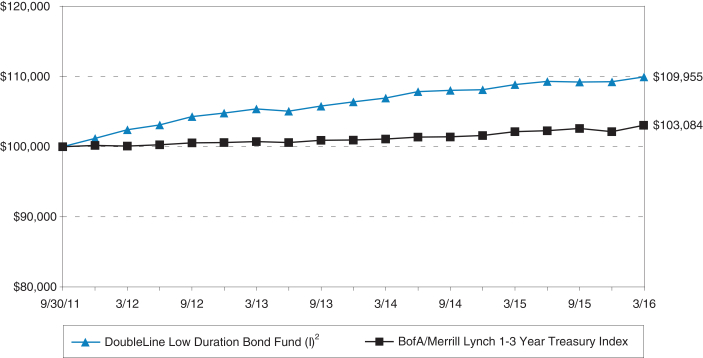
Average Annual Total Returns1
As of March 31, 2016
| | | | | | | | | | |
| | | | | 1 Year | | | Since
Inception
(9/30/2011) | |
DoubleLine Low Duration Bond Fund Class I | | | | | 1.00% | | | | 2.13% | |
BofA/Merrill Lynch 1-3 Year Treasury Index | | | | | 0.92% | | | | 0.68% | |
| | | |
DoubleLine Low Duration Bond Fund Class N | | | | | 0.85% | | | | 1.89% | |
| 1 | Past performance is not an indication of future results. Returns represent past performance and reflect changes in share prices, the reinvestment of all dividends and capital gains, expense limitations and the effects of compounding. The prospectus contains more complete information on the investment objectives, risks, charges and expenses of the investment company, which investors should read and consider carefully before investing. To obtain a prospectus, contact a registered representative or visit www.doubleline.com. The Fund’s adviser waived a portion of its management fee and/or reimbursed Fund expenses during the period shown. Had the adviser not done so, the Fund’s total returns would have been lower. The returns shown do not reflect taxes a shareholder would pay on distributions or redemptions. Total investment return and principal value of your investment will fluctuate, and your shares, when redeemed, may be worth more or less than their original cost. Current performance may be higher or lower than the performance data quoted. Call 877-DLine11 or visit www.doubleline.com for performance results current to the most recent month-end. |
| 2 | Performance of other classes will be greater or less than the line shown based on the differences in loads and fees paid by shareholders investing in the different classes. |
| | The BofA/Merrill Lynch 1-3 Year Treasury Index is an unmanaged index that tracks the performance of the direct sovereign debt of the U.S. Government having a maturity of at least one year and less than three years. The Fund’s investments likely will diverge widely from the components of the benchmark Index which could lead to performance dispersion between the Fund and the benchmark Index, meaning that the Fund could outperform or underperform the Index at any given time. |
| | | | | | |
| | Annual Report | | March 31, 2016 | | 141 |
| | |
| Growth of Investment (Cont.) | | (Unaudited) March 31, 2016 |
DoubleLine Floating Rate Fund
Value of a $100,000 Investment
Class I Shares1
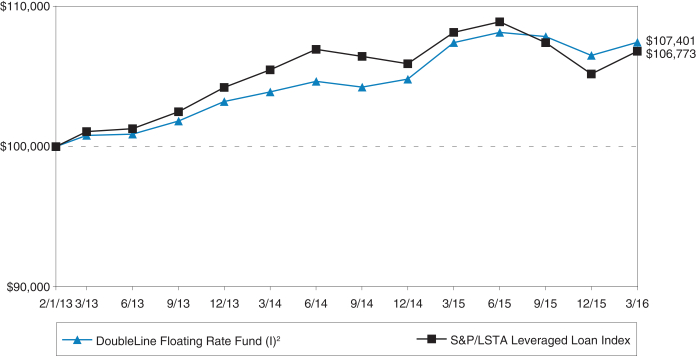
Average Annual Total Returns1
As of March 31, 2016
| | | | | | | | | | |
| | | | | 1 Year | | | Since
Inception
(2/1/2013) | |
DoubleLine Floating Rate Fund Class I | | | | | 0.02% | | | | 2.29% | |
S&P/LSTA Leveraged Loan Index | | | | | (1.25)% | | | | 2.10% | |
| | | |
DoubleLine Floating Rate Fund Class N | | | | | (0.23)% | | | | 2.11% | |
| 1 | Past performance is not an indication of future results. Returns represent past performance and reflect changes in share prices, the reinvestment of all dividends and capital gains, expense limitations and the effects of compounding. The prospectus contains more complete information on the investment objectives, risks, charges and expenses of the investment company, which investors should read and consider carefully before investing. To obtain a prospectus, contact a registered representative or visit www.doubleline.com. The Fund’s adviser waived a portion of its management fee and/or reimbursed Fund expenses during the period shown. Had the adviser not done so, the Fund’s total returns would have been lower. The returns shown do not reflect taxes a shareholder would pay on distributions or redemptions. Total investment return and principal value of your investment will fluctuate, and your shares, when redeemed, may be worth more or less than their original cost. Current performance may be higher or lower than the performance data quoted. Call 877-DLine11 or visit www.doubleline.com for performance results current to the most recent month-end. |
| 2 | Performance of other classes will be greater or less than the line shown based on the differences in loads and fees paid by shareholders investing in the different classes. |
| | S&P/LSTA Leveraged Loan Index — The S&P/LSTA Leveraged Loan Index is a broad index designed to reflect the performance of U.S. dollar facilities in the leverage loan market. The Fund’s investments likely will diverge widely from the components of the benchmark Index which could lead to performance dispersion between the Fund and the benchmark Index, meaning that the Fund could outperform or underperform the Index at any given time. |
| | | | | | |
| 142 | | DoubleLine Funds Trust | | | | |
| | |
| | | (Unaudited) March 31, 2016 |
DoubleLine Shiller Enhanced CAPE®
Value of a $100,000 Investment
Class I Shares1
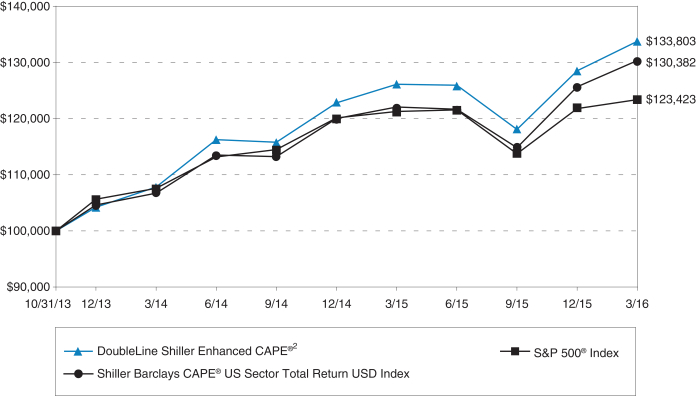
Average Annual Total Returns1
As of March 31, 2016
| | | | | | | | | | |
| | | | | 1 Year | | | Since
Inception
(10/31/2013) | |
DoubleLine Shiller Enhanced CAPE® Class I | | | | | 6.09% | | | | 12.82% | |
S&P 500® Index | | | | | 1.78% | | | | 9.11% | |
Shiller Barclays CAPE® US Sector Total Return USD Index | | | | | 6.81% | | | | 11.61% | |
| | | |
DoubleLine Shiller Enhanced CAPE® Class N | | | | | 5.84% | | | | 12.53% | |
| 1 | Past performance is not an indication of future results. Returns represent past performance and reflect changes in share prices, the reinvestment of all dividends and capital gains, expense limitations and the effects of compounding. The prospectus contains more complete information on the investment objectives, risks, charges and expenses of the investment company, which investors should read and consider carefully before investing. To obtain a prospectus, contact a registered representative or visit www.doubleline.com. The Fund’s adviser waived a portion of its management fee and/or reimbursed Fund expenses during the period shown. Had the adviser not done so, the Fund’s total returns would have been lower. The returns shown do not reflect taxes a shareholder would pay on distributions or redemptions. Total investment return and principal value of your investment will fluctuate, and your shares, when redeemed, may be worth more or less than their original cost. Current performance may be higher or lower than the performance data quoted. Call 877-DLine11 or visit www.doubleline.com for performance results current to the most recent month-end. |
| 2 | Performance of other classes will be greater or less than the line shown based on the differences in loads and fees paid by shareholders investing in the different classes. |
| | Shiller Barclays CAPE® US Sector Total Return USD Index — The Index incorporates the principles of long-term investing distilled by Dr. Robert Shiller and expressed through the CAPE® (Cyclically Adjusted Price Earnings) ratio (the “CAPE® Ratio”). The Index aims to identify undervalued sectors based on a modified CAPE® Ratio, and then uses a momentum factor to seek to reduce the risk of investing in a sector that may appear undervalued, but which may have also had recent relative price underperformance due to fundamental issues with the sector that may negatively affect the sector’s long-term total return. |
| | The S&P 500® Index is an unmanaged capitalization-weighted index of 500 stocks designed to measure performance of the broad domestic economy through changes in the aggregate market value of 500 stocks representing all major industries. |
| | | | | | |
| | Annual Report | | March 31, 2016 | | 143 |
| | |
| Growth of Investment (Cont.) | | (Unaudited) March 31, 2016 |
DoubleLine Flexible Income Fund
Value of a $100,000 Investment
Class I Shares1
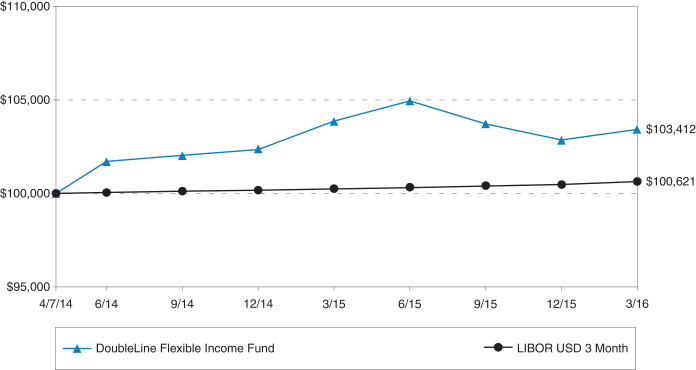
Average Annual Total Returns1
As of March 31, 2016
| | | | | | | | | | |
| | | | | 1 Year | | | Since Inception (4/7/2014) | |
DoubleLine Flexible Income Fund Class I | | | | | (0.43)% | | | | 1.71% | |
LIBOR USD 3 Month | | | | | 0.39% | | | | 0.33% | |
| | | |
DoubleLine Flexible Income Fund Class N | | | | | (0.66)% | | | | 1.48% | |
| 1 | Past performance is not an indication of future results. Returns represent past performance and reflect changes in share prices, the reinvestment of all dividends and capital gains, expense limitations and the effects of compounding. The prospectus contains more complete information on the investment objectives, risks, charges and expenses of the investment company, which investors should read and consider carefully before investing. To obtain a prospectus, contact a registered representative or visit www.doubleline.com. The Fund’s adviser waived a portion of its management fee and/or reimbursed Fund expenses during the period shown. Had the adviser not done so, the Fund’s total returns would have been lower. The returns shown do not reflect taxes a shareholder would pay on distributions or redemptions. Total investment return and principal value of your investment will fluctuate, and your shares, when redeemed, may be worth more or less than their original cost. Current performance may be higher or lower than the performance data quoted. Call 877-DLine11 or visit www.doubleline.com for performance results current to the most recent month-end. |
| 2 | Performance of other classes will be greater or less than the line shown based on the differences in loads and fees paid by shareholders investing in the different classes. |
| | LIBOR USD 3 Month — London Interbank Offering Rate (LIBOR) is an indicative average interest rate at which a selection of banks known as the panel banks are prepared to lend one another unsecured funds on the London money market. |
| | | | | | |
| 144 | | DoubleLine Funds Trust | | | | |
| | |
| | | (Unaudited) March 31, 2016 |
DoubleLine Low Duration Emerging Markets Fixed Income Fund
Value of a $100,000 Investment
Class I Shares1
Average Annual Total Returns1
As of March 31, 2016
| | | | | | | | | | |
| | | | | 1 Year | | | Since Inception (4/7/2014) | |
DoubleLine Low Duration Emerging Markets Fixed Income Fund Class I | | | | | 1.06% | | | | 1.51% | |
JP Morgan CEMBI Broad Diversified 1-3 Year index | | | | | 3.23% | | | | 2.62% | |
| | | |
DoubleLine Low Duration Emerging Markets Fixed Income Fund Class N | | | | | 0.82% | | | | 1.32% | |
| 1 | Past performance is not an indication of future results. Returns represent past performance and reflect changes in share prices, the reinvestment of all dividends and capital gains, expense limitations and the effects of compounding. The prospectus contains more complete information on the investment objectives, risks, charges and expenses of the investment company, which investors should read and consider carefully before investing. To obtain a prospectus, contact a registered representative or visit www.doubleline.com. The Fund’s adviser waived a portion of its management fee and/or reimbursed Fund expenses during the period shown. Had the adviser not done so, the Fund’s total returns would have been lower. The returns shown do not reflect taxes a shareholder would pay on distributions or redemptions. Total investment return and principal value of your investment will fluctuate, and your shares, when redeemed, may be worth more or less than their original cost. Current performance may be higher or lower than the performance data quoted. Call 877-DLine11 or visit www.doubleline.com for performance results current to the most recent month-end. |
| 2 | Performance of other classes will be greater or less than the line shown based on the differences in loads and fees paid by shareholders investing in the different classes. |
| | JP Morgan CEMBI Broad Diversified 1-3 Year Index — This index is a market capitalization weighted index consisting of 1-3 year maturity US-denominated Emerging Market corporate bonds. It is a liquid global corporate benchmark representing Asia, Latin America, Europe and the Middle East/Africa. |
| | | | | | |
| | Annual Report | | March 31, 2016 | | 145 |
| | |
| Growth of Investment (Cont.) | | (Unaudited) March 31, 2016 |
DoubleLine Long Duration Total Return Bond Fund
Value of a $100,000 Investment
Class I Shares1
Average Annual Total Returns1
As of March 31, 2016
| | | | | | | | | | |
| | | | | 1 Year | | | Since Inception (12/15/2014) | |
DoubleLine Long Duration Total Return Bond Fund Class I | | | | | 2.76% | | | | 6.18% | |
Barclays U.S. Long-Term Government/Credit Index | | | | | 0.39% | | | | 3.26% | |
| | | |
DoubleLine Long Duration Total Return Bond Fund Class N | | | | | 2.51% | | | | 5.86% | |
| 1 | Past performance is not an indication of future results. Returns represent past performance and reflect changes in share prices, the reinvestment of all dividends and capital gains, expense limitations and the effects of compounding. The prospectus contains more complete information on the investment objectives, risks, charges and expenses of the investment company, which investors should read and consider carefully before investing. To obtain a prospectus, contact a registered representative or visit www.doubleline.com. The Fund’s adviser waived a portion of its management fee and/or reimbursed Fund expenses during the period shown. Had the adviser not done so, the Fund’s total returns would have been lower. The returns shown do not reflect taxes a shareholder would pay on distributions or redemptions. Total investment return and principal value of your investment will fluctuate, and your shares, when redeemed, may be worth more or less than their original cost. Current performance may be higher or lower than the performance data quoted. Call 877-DLine11 or visit www.doubleline.com for performance results current to the most recent month-end. |
| 2 | Performance of other classes will be greater or less than the line shown based on the differences in loads and fees paid by shareholders investing in the different classes. |
| | Barclays U.S. Long-Term Government/Credit Index — This index includes publicly issued U.S. Treasury debt, taxable debt issued by U.S. states and territories and their political subdivisions, debt issued by U.S. and non-U.S. corporations, non-U.S. government debt and supranational debt. |
| | | | | | |
| 146 | | DoubleLine Funds Trust | | | | |
| | |
| | | (Unaudited) March 31, 2016 |
DoubleLine Strategic Commodity Fund
Value of a $100,000 Investment
Class I Shares1
Total Returns1
As of March 31, 2016
| | | | | | |
| | | | | Since Inception Not Annualized (5/18/2015) | |
DoubleLine Strategic Commodity Fund Class I | | | | | (13.07)% | |
Bloomberg Commodity Index Total Return | | | | | (24.90)% | |
| | |
DoubleLine Strategic Commodity Fund Class N | | | | | (13.27)% | |
| 1 | Past performance is not an indication of future results. Returns represent past performance and reflect changes in share prices, the reinvestment of all dividends and capital gains, expense limitations and the effects of compounding. The prospectus contains more complete information on the investment objectives, risks, charges and expenses of the investment company, which investors should read and consider carefully before investing. To obtain a prospectus, contact a registered representative or visit www.doubleline.com. The Fund’s adviser waived a portion of its management fee and/or reimbursed Fund expenses during the period shown. Had the adviser not done so, the Fund’s total returns would have been lower. The returns shown do not reflect taxes a shareholder would pay on distributions or redemptions. Total investment return and principal value of your investment will fluctuate, and your shares, when redeemed, may be worth more or less than their original cost. Current performance may be higher or lower than the performance data quoted. Call 877-DLine11 or visit www.doubleline.com for performance results current to the most recent month-end. |
| 2 | Performance of other classes will be greater or less than the line shown based on the differences in loads and fees paid by shareholders investing in the different classes. |
| | Bloomberg Commodity Index Total Return—This index is calculated on an excess return basis and reflects commodity futures price movements. The index rebalances annually weighted 2/3 by trading volume and 1/3 by world production and weight-caps are applied at the commodity, sector and group level for diversification. Roll period typically occurs from 6th-10th business day based on the roll schedule. |
| | | | | | |
| | Annual Report | | March 31, 2016 | | 147 |
| | |
| Growth of Investment (Cont.) | | (Unaudited) March 31, 2016 |
DoubleLine Global Bond Fund
Value of a $100,000 Investment
Class I Shares1
Total Returns1
As of March 31, 2016
| | | | | | |
| | | | | Since Inception Not Annualized (12/17/2015) | |
DoubleLine Global Bond Fund Class I | | | | | 5.11% | |
Citi World Government Bond Index | | | | | 7.51% | |
| | |
DoubleLine Global Bond Fund Class N | | | | | 5.07% | |
| 1 | Past performance is not an indication of future results. Returns represent past performance and reflect changes in share prices, the reinvestment of all dividends and capital gains, expense limitations and the effects of compounding. The prospectus contains more complete information on the investment objectives, risks, charges and expenses of the investment company, which investors should read and consider carefully before investing. To obtain a prospectus, contact a registered representative or visit www.doubleline.com. The Fund’s adviser waived a portion of its management fee and/or reimbursed Fund expenses during the period shown. Had the adviser not done so, the Fund’s total returns would have been lower. The returns shown do not reflect taxes a shareholder would pay on distributions or redemptions. Total investment return and principal value of your investment will fluctuate, and your shares, when redeemed, may be worth more or less than their original cost. Current performance may be higher or lower than the performance data quoted. Call 877-DLine11 or visit www.doubleline.com for performance results current to the most recent month-end. |
| 2 | Performance of other classes will be greater or less than the line shown based on the differences in loads and fees paid by shareholders investing in the different classes. |
| | The Citi World Government Bond Index measures the performance of fixed-rate, local currency and investment grade sovereign bonds. |
| | | | | | |
| 148 | | DoubleLine Funds Trust | | | | |
| | |
| Evaluation of Advisory Agreement by the Boards of Trustees | | (Unaudited) March 31, 2016 |
DoubleLine Total Return Bond Fund
DoubleLine Core Fixed Income Fund
DoubleLine Emerging Markets Fixed Income Fund
DoubleLine Multi-Asset Growth Fund
DoubleLine Cayman Multi Asset Growth Fund I Ltd.
DoubleLine Low Duration Bond Fund
DoubleLine Floating Rate Fund
DoubleLine Shiller Enhanced CAPE®
DoubleLine Flexible Income Fund
DoubleLine Low Duration Emerging Markets Fixed Income Fund
DoubleLine Long Duration Total Return Bond Fund
DoubleLine Equities Growth Fund
DoubleLine Opportunistic Credit Fund
DoubleLine Income Solutions Fund
At the February 25, 2016 meeting (the “Meeting”) of the Board of Trustees of DoubleLine Funds Trust (“DFT”), DoubleLine Equity Funds (“DEF”), DoubleLine Opportunistic Credit Fund (“DBL”), and DoubleLine Income Solutions Fund (“DSL” which, together with DBL, are the “Closed-End Funds” and, together with DFT, DEF, and DBL, are the “Trusts”), including in respect of each of DFT’s and DEF’s series of shares of beneficial interest (each, an “Open-End Fund” and, collectively with the Closed-End Funds, the “Funds”), the Board of Trustees, including the Trustees who are not “interested persons” (as defined in the Investment Company Act of 1940, as amended) of the Trusts (“Independent Trustees”) voting separately, approved the renewal of the Investment Advisory and Management Agreements (the “DFT Advisory Agreements”) between DoubleLine Capital LP (“DoubleLine Capital” or an “Adviser”) and DFT, in respect of the DoubleLine Total Return Bond Fund, the DoubleLine Core Fixed Income Fund, the DoubleLine Emerging Markets Fixed Income Fund (“EMFI”), the DoubleLine Multi-Asset Growth Fund (“MAG”), the DoubleLine Cayman Multi Asset Growth Fund I Ltd., the DoubleLine Low Duration Fund, the DoubleLine Floating Rate Fund, the DoubleLine Shiller Enhanced CAPE® (“CAPE”), the DoubleLine Flexible Income Fund, the DoubleLine Low Duration Emerging Markets Fixed Income Fund, and the DoubleLine Long Duration Total Return Bond Fund (the “DFT 15(c) Funds”), for an additional one-year period; the Investment Management Agreement (the “DEF Advisory Agreement”) between DoubleLine Equity LP (“DoubleLine Equity” or an “Adviser”) and DEF, in respect of the DoubleLine Equities Growth Fund, for an additional one-year period; the Investment Management Agreement (the “DBL Advisory Agreement”) between DoubleLine Capital and DBL for an additional one-year period; and the Investment Management Agreement (together with the DFT Advisory Agreements, the DEF Advisory Agreement, and the DBL Advisory Agreement, the “Advisory Agreements”) between DoubleLine Capital and DSL for an additional one-year period.
The Trustees meet over the course of the year with investment advisory personnel from the Advisers and regularly review detailed information, presented both orally and in writing, regarding the investment program, performance and operations of each Fund. The Trustees’ determination to approve the continuance of the Advisory Agreements was made on the basis of each Trustee’s business judgment after an evaluation of all of the information provided to the Trustees, both at the February 25, 2016 meeting and at prior meetings. The Trustees noted that they had recently approved the renewal, through March 25, 2016, of a number of the Funds’ advisory arrangements at the Board’s November 2015 meeting and had considered information similar to that presented at its February 25, 2016 meeting. The Trustees noted that they would consider the proposed renewal of each Fund’s advisory arrangements and any information presented anew, but that their deliberations and conclusions may be informed, at least in part, by their other recent deliberations.
This summary describes a number, but not necessarily all, of the most important factors considered by the Board and the Independent Trustees. Individual Trustees may have given different weights to certain factors and assigned various degrees of materiality to information received in connection with the approval process. No single factor was determined to be decisive. In all of their deliberations, the Board of Trustees and the Independent Trustees were advised by counsel to the Funds and counsel to the Independent Trustees, respectively.
The Trustees considered the nature, extent, and quality of the services provided and expected to be provided by DoubleLine, including the expertise and experience of its investment personnel. In this regard, the Trustees considered that DoubleLine provides a full investment program for each of the Funds, and noted DoubleLine’s representation that it seeks to provide attractive returns with a strong emphasis on risk management. In respect of each Fund other than the DoubleLine Equities Growth Fund, the Board considered the difficulty of managing debt-related funds, noting that managing such funds requires a portfolio management team to balance a number of factors, which may include, among others, varying maturities, prepayments, collateral management, counterparty management, pay-downs, credit events, workouts and net new issuances. The Trustees also considered certain challenges associated with managing DoubleLine Equities Growth Fund and the investment processes that are used by DoubleLine Equity in managing that Fund.
The Trustees reviewed reports (the “Strategic Insight Reports”) provided by Strategic Insight, an Asset International Company (“Strategic Insight”), that compared the DFT 15(c) Funds’ advisory fee rates, total expense ratios (Class I shares), and performance records (Class I shares) for the three-month, six-month and one-year periods ended December 31, 2015 and, where applicable, the performance records (Class I shares) for the three- and five-year periods ended December 31, 2015 against a group of each DFT 15(c) Fund’s peer funds selected by Strategic Insight. The Trustees noted in particular that each DFT 15(c) Fund other than EMFI was in the top performance quartile of its respective peer group over the one-year period ending December 31, 2015, and that each DFT 15(c) Fund was in the first or second performance quartile of its respective peers for the three- and five-year periods ended December 31, 2015 (if applicable) (other than MAG, which was in the second and third performance quartiles for the three- and five-year periods, respectively). In considering MAG’s relative performance, including its recent favorable short-term performance, the Trustees considered DoubleLine’s current and past representations
| | | | | | |
| | Annual Report | | March 31, 2016 | | 149 |
| | |
| Evaluation of Advisory Agreement by the Boards of Trustees (Cont.) | | (Unaudited) March 31, 2016 |
regarding the limited comparability of some of the peers in MAG’s peer group. The Trustees noted that, although EMFI’s performance was in the first and second performance quartiles for the three- and five-year periods, respectively, the Fund’s performance record was in the third performance quartile for the one-year period. The Trustees noted the reasons provided by management for the relative underperformance, including the Fund’s overweight to Latin America, the Fund’s exposure to commodity-related issuers and the Fund’s relative under exposure to certain emerging markets deemed by DoubleLine to be of higher relative risk, including Ukraine, Russia, Venezuela and Argentina, all of which appeared to be decisions that were consistent with DoubleLine’s investment approach generally.
The Trustees considered the portion of the Strategic Insight Reports covering the DFT 15(c) Funds’ expenses and advisory fees, noting that the reports showed that each DFT 15(c) Fund, other than CAPE, had a net total expense ratio in the first or second quartile of its peer group. They noted that CAPE’s net total expense ratio was only slightly above the median of its peer group. The Trustees also noted that each DFT 15(c) Fund, other than EMFI, had a net management fee ratio in the first or second quartile of its respective peer group. They noted that, notwithstanding EMFI’s net management fee ratio falling in the third quartile of that Fund’s peer group, the Fund’s net total expense ratio was below the median of its peer group. The Trustees also evaluated each DFT 15(c) Fund’s net management fee rate in light of its asset size, noting that a number of the DFT 15(c) Funds had achieved significant scale. The Trustees also noted that the net management fee rates of the DFT 15(c) Funds with significant scale were generally attractive or at least highly competitive relative to their peer groups and appeared to be consistent with DoubleLine’s general pricing philosophy of setting a Fund’s initial management fee rate at a level that generally reflects reasonably foreseeable economies of scale instead of relying on breakpoints in a Fund’s management fee rate.
The Trustees considered the relative underperformance of the DoubleLine Equities Growth Fund, noting that it was in the fourth performance quartile for the one-year period ended December 31, 2015. The Trustees noted that the net management fee paid by the DoubleLine Equities Growth Fund was in the first quartile of its peer group but that its net total expenses were in the third quartile. The Trustees noted that the Adviser continues to bear a substantial amount of fee waivers associated with the DoubleLine Equities Growth Fund notwithstanding the Fund’s above-median net total expenses. The Trustees noted, however, that they had approved the liquidation of DoubleLine Equities Growth Fund and therefore were only being asked to approve that Fund’s advisory arrangements to the extent necessary to permit DoubleLine to effect the Fund’s orderly liquidation and distribution of assets to Fund shareholders, which was expected to occur on or about March 28, 2016.
The Trustees considered the Strategic Insight Report regarding DBL that compared the Fund’s management fees (based on managed assets and net assets (i.e., generally not including those assets attributable to leverage)), total expense ratio (both inclusive and exclusive of investment related expenses (“IRE”)) also based on managed assets and net assets, and the performance record based on net asset value for the three-year, one-year, six-month, and three-month periods ended December 31, 2015 against a group of DBL’s peer funds. The Trustees noted that DBL had performed in the top quartile of its Morningstar category as presented by Strategic Insight for each of the six-month, one-year, and three-year periods shown and that DBL was the top performing fund in that category for the six-month and one-year periods ended December 31, 2015, though performance had been less favorable over the very near term. The Trustees noted that that DBL’s management fee rate and net total expense (excluding IRE) ratio were lower than the medians of DBL’s peer group on a net asset basis but were above median on a managed assets basis. In this regard and in evaluating the information presented, the Trustees noted that they had recently received reports from DoubleLine supporting the conclusion that DBL’s performance had generally benefitted from the use of leverage notwithstanding the expenses associated with it. The Trustees noted also DoubleLine’s representations that DBL invests more heavily in mortgage-related investments than other funds included in the peer group, and acknowledged comments from DoubleLine regarding how that made DBL’s portfolio different from a number of its peers and also increased the complexity of managing DBL as compared to a bond fund without such investments.
The Trustees considered the Strategic Insight Report regarding DSL, noting that DSL had performed in the third quartile of its peer funds over the one-year period ended December 31, 2015 and had underperformed its benchmark index during the period. The Trustees considered information and discussions from management relating to the contributors to DSL’s relative underperformance, including its larger relative investments in emerging market high yield corporate debt instruments. The Trustees noted that DSL’s advisory fee was among the highest in its peer group and that DSL’s net operating expense ratio (excluding IREs) was slightly above the median of its peer group. In evaluating DSL’s and DBL’s management fees, the Trustees considered DoubleLine’s statement that the Adviser had attempted to set its fees at each Fund’s inception at rates that reflect competitive market levels, but that also reflect the experience and expertise the Adviser brings to managing the Funds.
The Trustees noted that both DBL and DSL employed leverage during the period ended December 31, 2015. They noted further that the use of such leverage increases total assets and thus the absolute amount of fees received by the Adviser under DBL’s and DSL’s Advisory Agreements (because the fees are calculated based on total managed assets, including assets attributable to borrowings, reverse repurchase agreements and other forms of leverage outstanding). The Trustees noted that, in this regard, the Adviser has a financial incentive for DBL and DSL to continue to use leverage, which may create a conflict of interest between the Adviser, on the one hand, and DBL’s and DSL’s common shareholders, respectively, on the other. The Trustees considered information from DoubleLine, including discussions with management, regarding the reasons why the Adviser believes DBL’s and DSL’s use of leverage continues to be appropriate and in the best interests of each Fund’s common shareholders under current market conditions.
The Trustees considered that DoubleLine provides a variety of other services to the Funds in addition to investment advisory services, including, among others, a number of back-office services, valuation services, compliance services, certain forms of information technology services (such as internal reporting), assistance with accounting and distribution services and supervision and monitoring of the Funds’ other service providers. The Trustees reviewed DoubleLine’s ongoing efforts to keep the Trustees informed about matters relevant to the Trusts and their shareholders. The Trustees also considered the nature, extent, and structure of the Funds’ compliance program, including the policies and procedures of the Funds and their various service providers (including the Advisers). The Trustees considered the quality of those non-investment advisory services and determined that their quality supported the renewal of the Funds’ arrangements with DoubleLine.
| | | | | | |
| 150 | | DoubleLine Funds Trust | | | | |
| | |
| | | (Unaudited) March 31, 2016 |
The Trustees also considered DoubleLine’s reports, provided at the Board’s regular meetings, that it had continued to hire additional resources to support DoubleLine’s ability to provide services. The Trustees concluded that it appeared that DoubleLine continued to have sufficient quality and depth of personnel, resources, and investment methods.
The Trustees considered materials relating to the fees charged by DoubleLine to non-Fund clients, including institutional separate accounts and mutual funds for which DoubleLine serves as sub-adviser, where DoubleLine employs investment strategies substantially similar to one or more Funds’ investment strategies. The Trustees noted the information management provided regarding certain large institutional separate accounts and funds sub-advised by DoubleLine that are subject to fee schedules that differ from, including some that are lower than, the rates paid by a Fund with substantially similar investment strategies. The Trustees noted DoubleLine’s representations that administrative, compliance, operational, legal, and other burdens of providing investment advice to mutual funds exceed in many respects those required to provide advisory services to non-mutual fund clients, such as institutional accounts for retirement or pension plans, which may have differing contractual requirements. The Trustees noted DoubleLine’s representations that there are substantially greater legal and other responsibilities and risks to DoubleLine in managing and sponsoring public mutual funds than in managing private accounts or in sub-advising mutual funds sponsored by others, and that the services and resources required of DoubleLine when it sub-advises mutual funds sponsored by others generally are less than in the case of the Funds because many of the sponsorship, operational, and compliance responsibilities related to the advisory function are retained by the primary adviser.
The Trustees reviewed the financial and profitability information for DoubleLine, including information as to each Adviser’s profitability with respect to each Fund. The Trustees considered information provided by management regarding the methodologies, estimates, and assumptions that had been used in compiling those reports. The Trustees also reviewed information concerning the profitability to DoubleLine of its service arrangements with the Funds and took into account both the direct and indirect benefits to DoubleLine from managing the Funds. The Trustees also noted other benefits received by DoubleLine and its affiliates as a result of DoubleLine’s relationship with the Funds, including possible ancillary benefits to DoubleLine’s institutional investment management business due to the reputation and market penetration of the Funds. In evaluating DoubleLine’s profitability, the Trustees considered that DoubleLine presented profitability information that was reduced by certain distributions made to the DoubleLine’s employee owners that may be comparable to the ordinary compensation expense incurred by investment advisers that are not closely-held by their employees. The Trustees considered DoubleLine’s compensation practices and considered DoubleLine’s representation that those compensation and incentive policies and practices enable DoubleLine to retain, motivate, and attract highly qualified and experienced employees. The Trustees noted that the Advisers’ profitability was shown both before and after certain distribution and shareholder servicing payments made by the Advisers and they considered those profitability margins. The Trustees noted that DoubleLine had significant profitability in respect of certain of the Funds, but noted that in those cases it would be appropriate to weigh that against other considerations they might find relevant, such as the nature and quality of the services provided by DoubleLine, the efficiency and cost structure of DoubleLine, and the competitiveness of the management fees and total operating expenses of the Funds.
The Trustees considered the potential benefits that DoubleLine receives in respect of certain soft dollar credits generated by the brokerage commissions paid by the DoubleLine’s funds, and they noted that soft dollar arrangements are only in place with respect to a small number of Funds (currently MAG and the DoubleLine Equities Growth Fund) and noted their limited use. The Trustees separately considered that DoubleLine was continuing to invest in its business to maintain its ability to provide high quality services for the Funds, and noted DoubleLine’s need to invest in technology, infrastructure and staff to continue to provide services and accommodate rapidly changing regulatory requirements.
The Trustees considered statements from management that DoubleLine did not believe that implementation of breakpoints or fee reductions would be appropriate at this time, for a number of reasons, including DoubleLine’s general approach to investment advisory fees, which was to set a fee from a Fund’s inception at a rate that reflected reasonably foreseeable economies of scale. They noted statements from management that that approach has facilitated the Open-End Funds’ asset raising efforts and allowed the Open-End Funds to compete with peer funds with larger asset bases from inception notwithstanding, in some cases, the Open-End Funds’ smaller asset bases. The Trustees further noted that the Adviser was still subsidizing the expenses of a number of the Funds, including MAG and CAPE. The Trustees also noted the Adviser’s rapid growth and changes to the regulatory environment, which required DoubleLine to re-invest significantly in its business and infrastructure.
With regard to the Closed-End Funds, the Trustees noted that they have not increased in assets significantly from their initial offering due principally to their status as closed-end investment companies. They noted that there were no substantial increases in economies of scale realized with respect to the Closed-End Funds since their inception and that, in the Adviser’s view, the levels of the firm’s profitability in respect of DBL and DSL are appropriate in light of the investment the firm has made in the products, the quality of the investment management and other teams provided by the firm, and the continued investments by the firm in its own business.
The Trustees noted that, due to tax rules applicable to companies seeking to qualify as regulated investment companies, MAG made certain investments through a subsidiary organized as a Cayman Islands exempted company (the “Subsidiary”) in order to obtain certain desired investment exposure without eliminating its ability to qualify as a regulated investment company under the Internal Revenue Code. The Trustees considered the advisory arrangements for the Subsidiary generally in the same manner as they had considered the advisory arrangements for MAG.
On the basis of these considerations as well as others and in the exercise of their business judgment, the Trustees determined that they were satisfied with the nature, extent and the quality of the services provided to each Fund under its Advisory Agreement; that it appeared that the management fees paid by each Fund to DoubleLine were generally within the range of management fees paid by its peer funds, and with respect to some Funds lower than the median management fees paid by their peer funds, and generally reasonable in light of the services provided, the quality of the portfolio management teams and each Fund’s performance to date; that the fees paid by each Fund did not appear inconsistent with the fee schedules charged to DoubleLine’s
| | | | | | |
| | Annual Report | | March 31, 2016 | | 151 |
| | |
| Evaluation of Advisory Agreement by the Boards of Trustees (Cont.) | | (Unaudited) March 31, 2016 |
other clients (where applicable) in light of the nature of the services provided and the risks borne by DoubleLine; that the profitability of each Fund to DoubleLine did not appear excessive or such as to preclude renewal of a Fund’s Advisory Agreement; and that it did not appear that implementation of breakpoints for any of the Funds would be appropriate at this time, although the Trustees would continue to consider the topic over time; and that it would be appropriate to approve each Advisory Agreement for an additional one-year period.
* * * * *
As noted above, at their November 2015 meeting, the Boards of Trustees of DoubleLine Funds Trust, DoubleLine Income Solutions Fund, and DoubleLine Equity Funds approved the renewal through March 25, 2016 of the Advisory Agreements of DoubleLine Flexible Income Fund and DoubleLine Low Duration Emerging Markets Fixed Income Fund, DoubleLine Equities Growth Fund, and DoubleLine Income Solutions Fund (collectively, the “November-Reviewed Funds”). The Trustees noted that they had received, reviewed and considered a universe of information at the November 2015 meeting with respect to the November-Reviewed Funds that was similar to what they received, reviewed and considered at their February 2016 meeting with respect to those same Funds, though certain differences existed and that, in certain cases, the information was presented for different time periods.
In addition to the considerations summarized above, in respect of the DoubleLine Equities Growth Fund, the Trustees also noted that the Fund’s performance was in the fourth performance quartile relative to its peer group over the periods ending September 30, 2015 shown. In this regard, the Trustees considered DoubleLine’s explanation that DoubleLine Equity believed that certain differences between the Fund’s investment strategies and the characteristics of some of the other funds in its peer group contributed to the relative underperformance shown. The Trustees also noted that they had been presented information regarding certain of the issues that had caused the Equities Growth Fund to underperform on a relative basis during the periods shown, as well as certain enhancements DoubleLine Equity had begun to implement to improve the Fund’s performance in the future.
In addition to the considerations summarized above, in respect of DoubleLine Income Solutions Fund (“DSL”), the Trustees considered information regarding the discount to net asset value at which DSL’s shares traded over recent periods. They noted DoubleLine Capital’s representation that it continues to believe DSL represents an attractive investment opportunity and that DSL’s discount was generally consistent with other closed-end funds generally and does not, in DoubleLine Capital’s view, reflect issues unique to DSL. They considered DoubleLine Capital’s view that DSL’s investment strategy is not suited for an open-ended structure and that DoubleLine Capital did not believe that changing DSL’s investment portfolio to seek to increase DSL’s yield was appropriate under current market conditions. The Trustees also considered other measures that DoubleLine Capital could propose in respect of DSL’s discount, such as a share buyback program, and noted DoubleLine Capital’s view that none of those measures were likely to reduce the discount over the longer term. The Trustees also noted DoubleLine Capital’s representations that DSL continues to earn sufficient income on its investments to support its current distribution rate.
Notwithstanding certain differences in the information reviewed and considered, the conclusions the Boards drew in determining to approve the renewal of the November-Reviewed Funds’ Advisory Agreements were based on conclusions similar to those made at the February 2016 meeting with respect to the November-Reviewed Funds and that are summarized above.
DoubleLine Global Bond Fund
At the November 19, 2015 meeting of the Board of Trustees (the “November Meeting”) of DoubleLine Funds Trust (the “Trust”), the Board of Trustees, including the Independent Trustees voting separately, approved the Investment Management Agreement (the “Agreement”) between the Trust, on behalf of DoubleLine Global Bond Fund (the “Global Bond Fund”), and DoubleLine Capital LP (the “Adviser”). This summary describes a number, but not necessarily all, of the most important factors considered by the Board and the Independent Trustees.
The Trustees considered a wide range of materials, including information provided to the Trustees in connection with the approval of other advisory contracts between the Adviser and the other series of the Trust. The Trustees’ determination to approve the Agreement was based on an evaluation of all of the information provided to them. Individual Trustees may have given different weights to certain factors and assigned various degrees of materiality to information received in connection with the approval process. No single factor was determined to be decisive. In all of their deliberations, the Board of Trustees and the Independent Trustees were advised by counsel to the Trust and counsel to the Independent Trustees, respectively.
In the process of considering the approval of the Agreement, the Trustees considered the terms of the proposed Agreement between the Adviser and the Trust, with respect to the Global Bond Fund, and noted that the proposed terms of the Agreement, with the exception of the rate of advisory fees payable and certain provisions relating to the lack of intended third-party beneficiaries, had substantially similar terms as the advisory agreement between DoubleLine Commodity LP and DoubleLine Strategic Commodity Fund, which the Board had previously approved.
The Trustees considered the Adviser’s specific responsibilities in all aspects of day-to-day management of the Global Bond Fund as well as the qualifications, experience, and responsibilities of the proposed portfolio managers of the Global Bond Fund and other key personnel that would be involved in the day-to-day activities of the Global Bond Fund. The Board considered the expected difficulty of managing a debt-related fund, noting that managing such a fund would require a portfolio management team to balance a number of factors, which may include, among others, varying maturities, prepayments, counter-party exposure, credit events, and workouts. The Trustees also considered the additional challenges involved with managing the Global Bond Fund’s currency strategies and in investing in sovereign debt. The Trustees considered generally the performance record of the other series of the Trust advised by DoubleLine. They also considered the possible effects of adding an additional fund to the Trust on the capacities of the Adviser.
| | | | | | |
| 152 | | DoubleLine Funds Trust | | | | |
| | |
| | | (Unaudited) March 31, 2016 |
The Trustees reviewed the proposed services the Adviser would provide to the Global Bond Fund as investment adviser. The Trustees considered that the Adviser would provide a variety of other services to the Global Bond Fund in addition to investment advisory services, including, among others, a number of back-office services, valuation services, compliance services, certain forms of information technology services (such as internal reporting), assistance with accounting and distribution services, and supervision and monitoring of the Global Bond Fund’s other service providers. The Trustees also considered the nature, extent, and structure of the compliance procedures and the trading capabilities of the Adviser. The Trustees concluded that it appeared the Adviser would have, or have available to it, sufficient quality and depth of personnel, resources, and investment methods, and would have compliance policies and procedures essential to performing its duties under the proposed Agreement and that, in the Trustees’ view, the nature, overall quality, and extent of the management services to be provided appeared likely to be satisfactory and reliable and the value of these services.
The Board then turned to the anticipated cost of the proposed services, and the proposed structure and level of the advisory fees to be paid under the Agreement. The Trustees considered that the Adviser anticipated launching the Global Bond Fund with two classes of shares and noted the overall fee structure and expense caps proposed for the Global Bond Fund. The Trustees also considered information provided by Strategic Insight. The Trustees noted that the peer group analysis of global bond funds provided by Strategic Insight indicated that the Global Bond Fund’s expected net total expense ratio for the Global Bond Fund’s Class I shares would be below the expense group median of the peer funds presented for their consideration for the Agreement’s initial period and the proposed management fee was below the median of the peer group’s gross advisory fees and only slightly below the median net management fee. In considering the peer group information presented, the Trustees took into account the information provided by a representative of Strategic Insight who participated in the analysis of the peer funds selected by Strategic Insight.
As part of their evaluation of the proposed advisory fees, the Trustees noted the Adviser’s representation that it does not manage any other accounts with investment strategies substantially similar to the strategies proposed for the Global Bond Fund.
The Trustees discussed information provided by the Adviser as to the estimated profitability of the Adviser from managing the Global Bond Fund. In assessing profitability, the Trustees reviewed the Adviser’s financial information provided both at the November Meeting and at previous meetings of the Trustees and took into account both the likely direct and indirect benefits to the Adviser from managing the Global Bond Fund. The Trustees also considered in this regard the Adviser’s significant investment in forming, registering and promoting the Global Bond Fund during its start-up period. The Trustees noted other potential benefits received by the Adviser and its affiliates as a result of the Adviser’s relationship with the Trust, including possible ancillary benefits to the Adviser’s institutional investment management business due to the reputation and market penetration of the Global Bond Fund. The Trustees concluded that the Adviser’s profitability from managing the Global Bond Fund would likely not be excessive in the start-up period. The Trustees considered that the Adviser was implementing expense caps for the Global Bond Fund that would limit the overall expense ratio of the Global Bond Fund during the proposed term of the Agreement. The Trustees noted the Adviser’s representation that the proposed advisory fee was consistent with the Adviser’s general pricing philosophy of setting a Fund’s initial investment advisory fee rate at a level that generally reflects reasonably foreseeable economies of scale instead of relying on breakpoints in a Fund’s management fee rate. At the conclusion of their review of the issues, the Trustees concluded that it did not appear appropriate at this time to implement breakpoints in the investment advisory fee.
On the basis of these considerations and others and in the exercise of their business judgment, the Trustees determined to approve the Agreement for the proposed initial two-year term.
| | | | | | |
| | Annual Report | | March 31, 2016 | | 153 |
| | |
| Federal Tax Information | | (Unaudited) March 31, 2016 |
For the fiscal year ended March 31, 2016, certain dividends paid by the Funds may be subject to a maximum tax rate of 15% (20% for taxpayers with taxable income greater than $400,000 for single individuals and $450,000 for married couples filing jointly), as provided for by the Jobs and Growth Tax Relief Reconciliation Act of 2003 and The American Taxpayer Relief Act of 2012. The percentage of dividends declared from ordinary income designated as qualified dividend income was as follows:
| | | | | | |
| Qualified Dividend Income | | | | | |
DoubleLine Total Return Bond Fund | | | | | 0.00% | |
DoubleLine Core Fixed Income Fund | | | | | 0.00% | |
DoubleLine Emerging Markets Fixed Income Fund | | | | | 0.00% | |
DoubleLine Multi-Asset Growth Fund (Consolidated) | | | | | 7.99% | |
DoubleLine Low Duration Bond Fund | | | | | 0.00% | |
DoubleLine Floating Rate Fund | | | | | 0.00% | |
DoubleLine Shiller Enhanced CAPE® | | | | | 0.00% | |
DoubleLine Flexible Income Fund | | | | | 0.00% | |
DoubleLine Low Duration Emerging Markets Fixed Income Fund | | | | | 0.00% | |
DoubleLine Long Duration Total Return Bond Fund | | | | | 0.00% | |
DoubleLine Strategic Commodity Fund (Consolidated) | | | | | 0.00% | |
DoubleLine Global Bond Fund | | | | | 0.00% | |
For corporate shareholders, the percent of ordinary income distributions qualifying for the corporate dividends received deduction for the fiscal year ended March 31, 2016 was as follows:
| | | | | | |
| Dividends Received Deduction | | | | | |
DoubleLine Total Return Bond Fund | | | | | 0.00% | |
DoubleLine Core Fixed Income Fund | | | | | 0.00% | |
DoubleLine Emerging Markets Fixed Income Fund | | | | | 0.00% | |
DoubleLine Multi-Asset Growth Fund (Consolidated) | | | | | 3.42% | |
DoubleLine Low Duration Bond Fund | | | | | 0.00% | |
DoubleLine Floating Rate Fund | | | | | 0.00% | |
DoubleLine Shiller Enhanced CAPE® | | | | | 0.00% | |
DoubleLine Flexible Income Fund | | | | | 0.00% | |
DoubleLine Low Duration Emerging Markets Fixed Income Fund | | | | | 0.00% | |
DoubleLine Long Duration Total Return Bond Fund | | | | | 0.00% | |
DoubleLine Strategic Commodity Fund (Consolidated) | | | | | 0.00% | |
DoubleLine Global Bond Fund | | | | | 0.00% | |
The percentage of taxable ordinary income distributions that are designated as short-term capital gain distributions under Internal Revenue Section 871(k)(2)(c) for each Fund was as follows:
| | | | | | |
| Qualified Short-Term Gains | | | | | |
DoubleLine Total Return Bond Fund | | | | | 0.00% | |
DoubleLine Core Fixed Income Fund | | | | | 0.00% | |
DoubleLine Emerging Markets Fixed Income Fund | | | | | 0.00% | |
DoubleLine Multi-Asset Growth Fund (Consolidated) | | | | | 0.28% | |
DoubleLine Low Duration Bond Fund | | | | | 0.00% | |
DoubleLine Floating Rate Fund | | | | | 0.00% | |
DoubleLine Shiller Enhanced CAPE® | | | | | 0.00% | |
DoubleLine Flexible Income Fund | | | | | 0.00% | |
DoubleLine Low Duration Emerging Markets Fixed Income Fund | | | | | 0.00% | |
DoubleLine Long Duration Total Return Bond Fund | | | | | 4.79% | |
DoubleLine Strategic Commodity Fund (Consolidated) | | | | | 100.00% | |
DoubleLine Global Bond Fund | | | | | 0.00% | |
| | | | | | |
| 154 | | DoubleLine Funds Trust | | | | |
| | |
| | | (Unaudited) March 31, 2016 |
The percentage of taxable ordinary income distributions that are designated as interest related dividends under Internal Revenue Section 871(k)(1)(c) for each Fund was as follows:
| | | | | | |
| Qualified Interest Income | | | | | |
DoubleLine Total Return Bond Fund | | | | | 100.00% | |
DoubleLine Core Fixed Income Fund | | | | | 90.57% | |
DoubleLine Emerging Markets Fixed Income Fund | | | | | 0.01% | |
DoubleLine Multi-Asset Growth Fund (Consolidated) | | | | | 34.95% | |
DoubleLine Low Duration Bond Fund | | | | | 99.49% | |
DoubleLine Floating Rate Fund | | | | | 98.52% | |
DoubleLine Shiller Enhanced CAPE® | | | | | 96.46% | |
DoubleLine Flexible Income Fund | | | | | 83.35% | |
DoubleLine Low Duration Emerging Markets Fixed Income Fund | | | | | 68.24% | |
DoubleLine Long Duration Total Return Bond Fund | | | | | 97.10% | |
DoubleLine Strategic Commodity Fund (Consolidated) | | | | | 0.00% | |
DoubleLine Global Bond Fund | | | | | 20.11% | |
Shareholders are advised to consult their own tax adviser with respect to the tax consequences of their investment in the Funds.
| | | | | | |
| | Annual Report | | March 31, 2016 | | 155 |
| | |
| Trustees and Officers | | (Unaudited) March 31, 2016 |
| | | | | | | | | | |
Name, Address, and
Year of Birth(1) | | Position with Trust | | Term of Office
and Length of
Time Served | | Principal Occupation(s) During Past 5 Years | | Number of
Portfolios
Overseen(2) | | Other Directorships
Held by Trustee
During Past 5 years
|
| | | | | |
Independent Trustees | | | | | | | | | | |
| | | | | |
| Joseph J. Ciprari, 1964 | | Trustee | | Indefinite/Since Inception | | President, Remo Consultants, a real estate financial consulting firm. Formerly, Managing Director, UBS AG. Formerly, Managing Director, Ally Securities LLC. | | 16 | | None |
| | | | | |
| John C. Salter, 1957 | | Trustee | | Indefinite/Since Inception | | Stark Municipal Brokers. Formerly, Managing Director, Municipals, Tullet Prebon Financial Services LLC (d/b/a Chapdelaine). Formerly, Partner, Stark, Salter & Smith, a securities brokerage firm specializing in tax exempt bonds. | | 16 | | None |
| | | | | |
| Raymond B. Woolson, 1958 | | Trustee | | Indefinite/Since Inception | | President, Apogee Group, Inc., a company providing financial consulting services. | | 16 | | None |
(1) The address of each Independent Trustee is c/o DoubleLine Funds, 333 South Grand Avenue, Suite 1800, Los Angeles, CA 90071.
(2) Includes each series of DoubleLine Funds Trust, DoubleLine Opportunistic Credit Fund and DoubleLine Income Solutions Fund.
The following Trustees are “interested persons” of the Fund Complex as defined in the 1940 Act because they are officers of the Advisers, and indirect shareholders in the Advisers.
| | | | | | | | | | |
Name, Address, and
Year of Birth(1) | | Position with Trust | | Term of Office
and Length of
Time Served | | Principal Occupation(s) During Past 5 Years | | Number of
Portfolios
Overseen | | Other Directorships
Held by Trustee
During Past 5 years |
| | | | | |
Interested Trustees | | | | | | | | | | |
| | | | | |
| Jeffrey E. Gundlach, 1959 | | Trustee | | Indefinite/Since Inception | | Chief Executive Officer and Chief Investment Officer, DoubleLine Capital (since December 2009). | | 14 | | None |
| | | | | |
| Philip A. Barach, 1952 | | Trustee | | Indefinite/Since Inception | | President, DoubleLine Capital (since December 2009). | | 14 | | None |
(1) The address of each Interested Trustee is c/o DoubleLine Funds, 333 South Grand Avenue, Suite 1800, Los Angeles, CA 90071.
| | | | | | |
| 156 | | DoubleLine Funds Trust | | | | |
| | |
| | | (Unaudited) March 31, 2016 |
Officers
The officers of the Trust who are not also Trustees of the Trust are:
| | | | | | |
Name, Address, and
Year of Birth(1) | | Position(s)
Held with Trust | | Term of Office
and Length of
Time Served | | Principal Occupation(s) During Past 5 Years |
| | | |
| Ronald R. Redell, 1970 | | President | | Indefinite/Since Inception | | Trustee, Chairman, President and Chief Executive Officer, DoubleLine Income Solutions Fund (since January 2013); Executive, DoubleLine Group LP (since January 2013); Trustee, Chairman, President and Chief Executive Officer, DoubleLine Opportunistic Credit Fund (since July 2011); Executive, DoubleLine Capital (since July 2010); President, DoubleLine Funds Trust (since January 2010). |
| | | |
| Susan Nichols, 1962 | | Treasurer and Principal Financial and Accounting Officer | | Indefinite/Since October 2011 | | Treasurer and Principal Financial and Accounting Officer, DoubleLine Income Solutions Fund (since January 2013); Treasurer and Principal Financial and Accounting Officer, DoubleLine Funds Trust (since October 2011); Treasurer and Principal Financial and Accounting Officer, DoubleLine Opportunistic Credit Fund (since July 2011); Director of Mutual Funds Operations, DoubleLine Capital. Formerly, Southern Wholesaler, DoubleLine Capital. Formerly, Assistant Treasurer, DoubleLine Funds Trust. |
| | | |
| Keith T. Kirk, 1963 | | Chief Compliance Officer | | Indefinite/Since May 2012 | | Chief Compliance Officer, DoubleLine Income Solutions Fund (since January 2013); Chief Compliance Officer, DoubleLine Funds Trust (since May 2012); Chief Compliance Officer, DoubleLine Opportunistic Credit Fund (since May 2012); Deputy General Counsel and Chief Compliance Officer, DoubleLine Capital (since January 2012). Formerly, Independent Compliance Consultant (from September 2009 through December 2011). |
| | | |
| Louis C. Lucido, 1948 | | Secretary | | Indefinite/Since Inception | | Member of the Board of Directors, 826LA (since June 2013); Member of the Board of Directors, Junior Achievement of Southern California (since June 2013); Member of the Board of Directors, CASA of Los Angeles (since February 2013) and Vice Chairman (since June 2014); Secretary, DoubleLine Income Solutions Fund (since January 2013); Secretary, DoubleLine Opportunistic Credit Fund (since July 2011); Chief Operating Officer, DoubleLine Capital (since June 2010); Secretary, DoubleLine Funds Trust (since January 2010); Formerly, Executive Vice President, DoubleLine Capital (from December 2009 through May 2010). |
| | | |
| Grace Walker, 1970 | | Assistant Treasurer | | Indefinite/Since March 2012 | | Assistant Treasurer, DoubleLine Income Solutions Fund (since January 2013); Assistant Treasurer, DoubleLine Opportunistic Credit Fund (since March 2012); Assistant Treasurer, DoubleLine Funds Trust (since March 2012). Formerly, Assistant Treasurer of the private funds of Western Asset Management Company (from December 2004 through March 2012). |
| | | |
| Earl A. Lariscy, 1966 | | Vice President | | Indefinite/Since May 2012 | | Vice President and Assistant Secretary, DoubleLine Income Solutions Fund (since January 2013); Vice President, DoubleLine Funds Trust (since May 2012); Vice President and Assistant Secretary, DoubleLine Opportunistic Credit Fund (since May 2012 and inception, respectively); General Counsel, DoubleLine Capital (since April 2010). |
| | | |
| Cris Santa Ana, 1965 | | Vice President | | Indefinite/Since April 2011 | | Vice President, DoubleLine Income Solutions Fund (since January 2013); Vice President, DoubleLine Opportunistic Credit Fund (since July 2011); Vice President, DoubleLine Funds Trust (since April 2011); Chief Risk Officer, DoubleLine Capital (since June 2010). Formerly, Chief Operating Officer, DoubleLine Capital (from December 2009 through May 2010). |
| | | |
| David Kennedy, 1964 | | Vice President | | Indefinite/Since May 2012 | | Vice President, DoubleLine Income Solutions Fund (since January 2013); Vice President, DoubleLine Funds Trust (since May 2012); Vice President, DoubleLine Opportunistic Credit Fund (since May 2012); Manager, Trading and Settlements, DoubleLine Capital (since December 2009). |
| | | |
| Patrick A. Townzen, 1978 | | Vice President | | Indefinite/Since September 2012 | | Vice President, DoubleLine Income Solutions Fund (since January 2013); Vice President, DoubleLine Funds Trust (since September 2012); Vice President, DoubleLine Opportunistic Credit Fund (since September 2012); Manager of Operations, DoubleLine Capital (since September 2012). Formerly, Manager, Western Asset Management Company. |
(1) The address of each officer is c/o DoubleLine Funds, 333 South Grand Avenue, Suite 1800, Los Angeles, CA 90071.
The Statement of Additional Information includes additional information about the Trustees and is available, without charge, upon request, by calling 877-DLine11 (877-354-6311).
| | | | | | |
| | Annual Report | | March 31, 2016 | | 157 |
| | |
| Information About Proxy Voting | | (Unaudited) March 31, 2016 |
Information about how a Fund voted proxies relating to portfolio securities held during the most recent twelve month period ended June 30th is available no later than the following August 31st without charge, upon request, by calling 877-DLine11 (877-354-6311) and on the Securities and Exchange Commission’s (the “SEC”) website at http://www.sec.gov.
A description of the Funds’ proxy voting policies and procedures is available (i) without charge, upon request, by calling 877-DLine11 (877-354-6311); and (ii) on the commission’s website at http://www.sec.gov.
Information About Portfolio Holdings
It is the policy of the Trust to provide certain unaudited information regarding the portfolio composition of the Funds as of month-end to shareholders and others upon request to the Funds, beginning on the 15th calendar day after the end of the month (or, if not a business day, the next business day thereafter).
Shareholders and others who wish to obtain portfolio holdings for a particular month may make a request by contacting the Funds at no charge at 877-DLine11 (877-354-6311) between the hours of 7:00 a.m. and 5:00 p.m. Pacific time, Monday through Friday, beginning on the 15th day following the end of that month (or, if not a business day, the next business day thereafter). Requests for portfolio holdings may be made on a monthly basis pursuant to this procedure, or standing requests for portfolio holdings may be accepted.
The Trust is required to file its complete schedule of portfolio holdings with the SEC for its first and third fiscal quarters on Form N-Q. The Trust’s Forms N-Q are available on the SEC website at www.sec.gov. You can also review and obtain copies of the Forms N-Q at the SEC Public Reference Room in Washington, DC (information on the operation of Public Reference Room may be obtained by calling 1-800-SEC-0330).
Householding — Important Notice Regarding Delivery of Shareholder Documents
In an effort to conserve resources, the Funds intend to reduce the number of duplicate Prospectuses and Annual and Semi-Annual Reports you receive by sending only one copy of each to addresses where we reasonably believe two or more accounts are from the same family. If you would like to discontinue householding of your accounts, please call toll-free 877-DLine11 (877-354-6311) to request individual copies of these documents. We will begin sending individual copies thirty days after receiving your request to stop householding.
| | | | | | |
| 158 | | DoubleLine Funds Trust | | | | |
| | |
| Privacy Notice | | (Unaudited) March 31, 2016 |
What Does DoubleLine Do With Your Personal Information?
Financial companies choose how they share your personal information. This notice provides information about how we collect, share, and protect your personal information, and how you might choose to limit our ability to share certain information about you. Please read this notice carefully.
All financial companies need to share customers’ personal information to run their everyday businesses. Accordingly, information, confidential and proprietary, plays an important role in the success of our business. However, we recognize that you have entrusted us with your personal and financial data, and we recognize our obligation to keep this information secure. Maintaining your privacy is important to us, and we hold ourselves to a high standard in its safekeeping and use. Most importantly, DoubleLine does not sell its customers’ non-public personal information to any third parties. DoubleLine uses its customers’ non-public personal information primarily to complete financial transactions that its customers request or to make its customers aware of other financial products and services offered by a DoubleLine affiliated company.
DoubleLine may collect non-public information about you from the following sources:
| | • | Information we receive about you on applications or other forms; |
| | • | Information you may give us orally; |
| | • | Information about your transactions with us or others; |
| | • | Information you submit to us in correspondence, including emails or other electronic communications; and |
| | • | Information about any bank account you use for transfers between your bank account and any Fund account, including information provided when effecting wire transfers. |
The types of personal information DoubleLine collects and shares depend on the product or service you have with us. This information may include:
| | • | transaction or loss history; |
DoubleLine does not disclose any non-public personal information about our customers or former customers without the customer’s authorization, except that we may disclose the information listed above, as follows:
| | • | to provide information to nonaffiliated third parties in connection with our performance of the services we have agreed to provide you. For example, it might be necessary to do so in order to process transactions and maintain accounts. |
| | • | DoubleLine will release any of the non-public information listed above about a customer if directed to do so by that customer or if DoubleLine is authorized by law to do so, such as in the case of a court order, legal investigation, or other properly executed governmental request. |
| | • | to alert a customer to other financial products and services offered by DoubleLine or an affiliate, DoubleLine may share information with an affiliate, including companies using the DoubleLine name. Such products and services may include, for example, other investment products offered by a DoubleLine company. If you prefer that we not disclose non-public personal information about you to our affiliates for this purpose, you may direct us not to make such disclosures (other than disclosures permitted by law) by calling 877-DLine11 (877-354-6311). If you limit this sharing and you have a joint account, your decision will be applied to all owners of the account. |
We have procedures designed to limit access to your personal account information to those agents and vendors who need to know that information to provide products and services to you. Your information is not provided by us to nonaffiliated third parties for marketing purposes. We seek to maintain physical, electronic, and procedural safeguards to guard your non-public personal information.
Information Collected from Websites. Websites maintained by DoubleLine or its service providers may use a variety of technologies to collect information that help DoubleLine and its service providers understand how the website is used. Information collected from your web browser (including small files stored on your device that are commonly referred to as “cookies”) allow the websites to recognize your web browser and help to personalize and improve your user experience and enhance navigation of the website. You can change your cookie preferences by changing the setting on your web browser to delete or reject cookies. If you delete or reject cookies, some website pages may not function properly. Certain portions of doublelinefunds.com are maintained or controlled by third parties, each of which has privacy policies which may differ, in some cases significantly, from the privacy policies described in this notice. Please contact your DoubleLine representative if you would like to receive more information about the privacy policies of third parties.
As required by federal law, DoubleLine will notify customers of DoubleLine’s Privacy Policy annually. DoubleLine reserves the right to modify this policy at any time, but in the event that there is a change, DoubleLine will promptly inform its customers of that change.
| | | | | | |
| | Annual Report | | March 31, 2016 | | 159 |
| | | | |
DoubleLine Capital LP DoubleLine Commodity LP | | 333 South Grand Avenue 18th Floor Los Angeles, CA 90071 doubleline.com | | fundinfo@doubleline.com 1. 213. 633. 8200 |

Investment Advisers:
DoubleLine Capital LP and
DoubleLine Commodity LP
333 South Grand Avenue
18th Floor
Los Angeles, CA 90071
Distributor:
Quasar Distributors, LLC
615 East Michigan Street
Milwaukee, WI 53202
Administrator and Transfer Agent:
U.S. Bancorp Fund Services, LLC
P.O. Box 701
Milwaukee, WI 53201
Custodian:
U.S. Bank, N.A.
1555 North River Center Drive
Suite 302
Milwaukee, WI 53212
Independent Registered
Public Accounting Firm:
PricewaterhouseCoopers LLP
601 South Figueroa Street
Los Angeles, CA 90017
Legal Counsel:
Ropes & Gray LLP
Prudential Tower
800 Boylston Street
Boston, MA 02199
Contact Information:
doublelinefunds.com
fundinfo@doubleline.com
1-877-DLine11 or
1-877-354-6311
DL-ANNUAL-DFT
Item 2. Code of Ethics.
The registrant has adopted a code of ethics that applies to the registrant’s principal executive officer and principal financial officer. The registrant has not made any amendments to its code of ethics during the period covered by this report. The registrant has not granted any waivers from any provisions of the code of ethics during the period covered by this report. A copy of the registrant’s Code of Ethics is filed herewith.
Item 3. Audit Committee Financial Expert.
The registrant’s board of trustees has determined that there is at least one audit committee financial expert serving on its audit committee. Raymond B. Woolson is the “audit committee financial expert” and is considered to be “independent” as each term is defined in Item 3 of Form N-CSR.
Item 4. Principal Accountant Fees and Services.
The registrant has engaged its principal accountant to perform audit services, audit-related services, tax services and other services during the past two fiscal years. “Audit services” refer to performing an audit of the registrant’s annual financial statements or services that are normally provided by the accountant in connection with statutory and regulatory filings or engagements for those fiscal years. “Audit-related services” refer to the assurance and related services by the principal accountant that are reasonably related to the performance of the audit. “Tax services” refer to professional services rendered by the principal accountant for tax compliance, tax advice, and tax planning. There were no “Other services” provided by the principal accountant. The following table details the aggregate fees billed or expected to be billed for each of the last two fiscal years for audit fees, audit-related fees, tax fees and other fees by the principal accountant.
| | | | |
| | | FYE 3/31/2016 | | FYE 3/31/2015 |
Audit Fees | | $815,230 | | $758,625 |
Audit-Related Fees | | $3,550 | | $3,591 |
Tax Fees | | $145,250 | | $113,390 |
All Other Fees | | N/A | | N/A |
The audit committee has adopted pre-approval policies and procedures that require the audit committee to pre-approve all audit and non-audit services of the registrant, including services provided to any entity affiliated with the registrant.
The percentage of fees billed by PricewaterhouseCoopers LLP applicable to non-audit services pursuant to waiver of pre-approval requirement were as follows:
| | | | |
| | | FYE 3/31/2016 | | FYE 3/31/2015 |
Audit-Related Fees | | 0% | | 0% |
Tax Fees | | 0% | | 0% |
All Other Fees | | 0% | | 0% |
All of the principal accountant’s hours spent on auditing the registrant’s financial statements were attributed to work performed by full-time permanent employees of the principal accountant. (If more than 50 percent of the accountant’s hours were spent to audit the registrant’s financial statements for the most recent fiscal year, state how many hours were attributed to work performed by persons other than the principal accountant’s full-time, permanent employees.)
The following table indicates the non-audit fees billed or expected to be billed by the registrant’s accountant for services to the registrant and to the registrant’s investment adviser (and any other controlling entity, etc.—not sub-adviser) for the last two years. The audit committee of the board of trustees/directors has considered whether the provision of non-audit services that were rendered to the registrant’s investment adviser is compatible with maintaining the principal accountant’s independence and has concluded that the provision of such non-audit services by the accountant has not compromised the accountant’s independence.
| | | | | | | | |
| Non-Audit Related Fees | | FYE 3/31/2016 | | | FYE 3/31/2015 | |
Registrant | | | $145,250 | | | | $113,390 | |
Registrant’s Investment Adviser | | | $854,258 | | | | $705,479 | |
Item 5. Audit Committee of Listed Registrants.
Not applicable to registrants who are not listed issuers (as defined in Rule 10A-3 under the Securities Exchange Act of 1934).
Item 6. Investments.
| (a) | Schedule of Investments is included as part of the report to shareholders filed under Item 1 of this Form. |
Item 7. Disclosure of Proxy Voting Policies and Procedures for Closed-End Management Investment Companies.
Not applicable to open-end investment companies.
Item 8. Portfolio Managers of Closed-End Management Investment Companies.
Not applicable to open-end investment companies.
Item 9. Purchases of Equity Securities by Closed-End Management Investment Company and Affiliated Purchasers.
Not applicable to open-end investment companies.
Item 10. Submission of Matters to a Vote of Security Holders.
There have been no material changes to the procedures by which shareholders may recommend nominees to the registrant’s board of trustees.
Item 11. Controls and Procedures.
| (a) | The Registrant’s principal executive and principal financial officers have reviewed the Registrant’s disclosure controls and procedures (as defined in Rule 30a-3(c) under the Investment Company Act of 1940 (the “Act”)) as of a date within 90 days of the filing of this report, as required by Rule 30a-3(b) under the Act and Rules 13a-15(b) or 15d-15(b) under the Securities Exchange Act of 1934. Based on their review, such officers have concluded that the disclosure controls and procedures are effective in ensuring that information required to be disclosed in this report is appropriately recorded, processed, summarized and reported and made known to them by others within the Registrant and by the Registrant’s service provider. |
| (b) | There were no changes in the Registrant’s internal control over financial reporting (as defined in Rule 30a-3(d) under the Act) that occurred during the last fiscal quarter of the period covered by this report that has materially affected, or is reasonably likely to materially affect, the Registrant’s internal control over financial reporting. |
Item 12. Exhibits.
| (a) | (1) Any code of ethics or amendment thereto, that is the subject of the disclosure required by Item 2, to the extent that the registrant intends to satisfy Item 2 requirements through filing an exhibit. Filed herewith. |
(2) A separate certification for each principal executive and principal financial officer pursuant to Section 302 of the Sarbanes-Oxley Act of 2002. Filed herewith.
(3) Any written solicitation to purchase securities under Rule 23c-1 under the Act sent or given during the period covered by the report by or on behalf of the registrant to 10 or more persons. Not applicable to open-end investment companies.
| (b) | Certifications pursuant to Section 906 of the Sarbanes-Oxley Act of 2002. Furnished herewith. |
SIGNATURES
Pursuant to the requirements of the Securities Exchange Act of 1934 and the Investment Company Act of 1940, the registrant has duly caused this report to be signed on its behalf by the undersigned, thereunto duly authorized.
| | |
| | (Registrant) DoubleLine Funds Trust |
| |
| | By (Signature and Title) /s/ Ronald R. Redell |
| | Ronald R. Redell, President |
| |
| | Date 5/25/2016 |
Pursuant to the requirements of the Securities Exchange Act of 1934 and the Investment Company Act of 1940, this report has been signed below by the following persons on behalf of the registrant and in the capacities and on the dates indicated.
| | |
| | By (Signature and Title) /s/ Ronald R. Redell |
| | Ronald R. Redell, President |
| |
| | Date 5/25/2016 |
| |
| | By (Signature and Title) /s/ Susan Nichols |
| | Susan Nichols, Treasurer and |
| | Principal Financial and Accounting Officer |
| | Date 5/25/2016 |