On behalf of the DoubleLine Funds, I am pleased to deliver the Annual Report for the 12-month period ended March 31, 2021. On the following pages you will find specific information regarding each Fund’s operations and holdings. In addition, we discuss each Fund’s investment performance and the main drivers of that performance during the reporting period.
If you have any questions regarding the DoubleLine Funds please don’t hesitate to call us at 877-DLine11 (877-354-6311), or visit our website www.doublelinefunds.com where our investment management team offers deeper insights and analysis on relevant capital market activity impacting investors today. We value the trust that you have placed with us, and we will continue to strive to offer thoughtful investment solutions to our shareholders.
Ronald R. Redell, CFA
credits rated BB and CCC. Loans rated BB underperformed the index while loans rated B and CCC outperformed. Fund performance benefited from underexposure to BB loans and overexposure to B loans while the underweight position in CCC loans detracted from returns. However, a bias toward higher-quality credits among B names was a headwind for performance given that riskier names had a sharper rally. On a sector basis, the Fund’s relative performance benefited from overweight exposures to healthcare, and business equipment and services while overweight positions in food products and electronics/electrical detracted from performance. Underweight exposures to automotive, and lodging and casinos hurt relative performance while underweight positions in telecom and utilities helped relative performance. The Fund’s exposure to high yield bonds was a performance drag given that these bonds had a higher-quality tilt that lagged the recovering market.
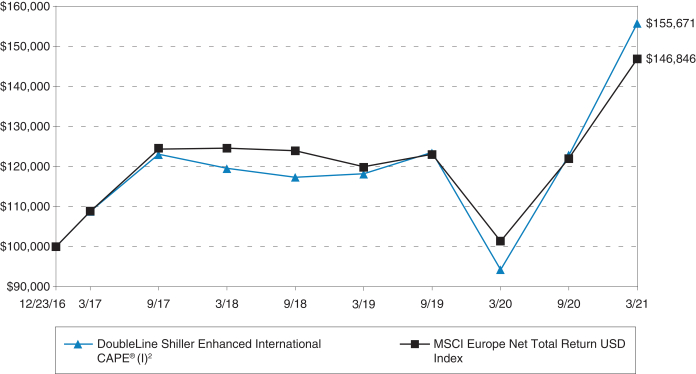
In the 12 months ending March 31, 2021, the DoubleLine Shiller Enhanced International CAPE® outperformed the broad European equity market as measured by the benchmark Morgan Stanley Capital International (MSCI) Europe Net Total Return USD Index return of 44.95%. The Shiller Barclays CAPE® Europe Sector Net TR NoC USD Index (“the CAPE Index”), to which the Fund gained exposure through the use of swap contracts, was allocated to seven sectors: communication services, consumer discretionary, consumer staples, healthcare, industrials,
materials, and financials plus real estate. The fixed income portfolio increased in value, with all sectors contributing positively. The three fixed income sectors with the highest returns were commercial mortgage-backed securities, bank loans and non-Agency mortgage-backed securities.
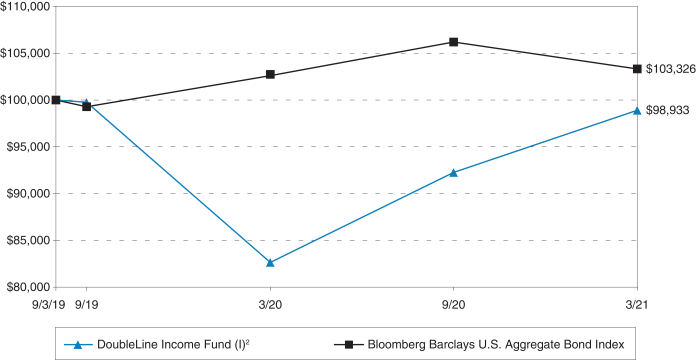
An underweight allocation to Treasuries and Agency mortgage-backed securities relative to the index contributed to the Fund’s outperformance as so-called “safe-haven” assets took a back seat while the market shifted toward riskier credit products.
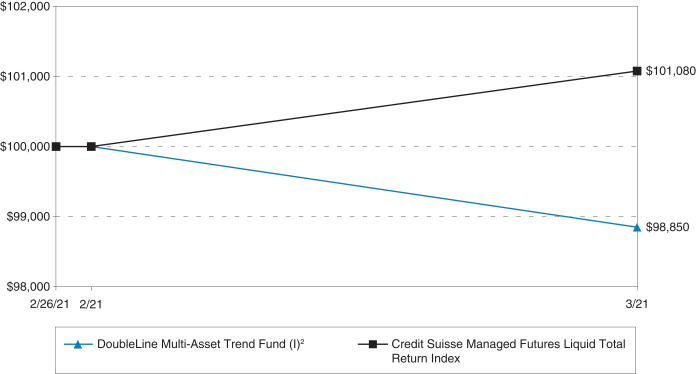
Since the inception date of Feb. 26 to March 31, 2021, the DoubleLine Multi-Asset Trend Fund underperformed the benchmark Credit Suisse Managed Futures Liquid Total Return U.S. Dollar Index return of 1.08%. The underperformance was driven in part by the Fund’s investments in commodities through exposure to the BNP Paribas Multi-Asset Trend Index, which was achieved through the use of swap contracts, as commodities generally ended the period lower. The Fund’s underlying fixed income portfolio generated slightly negative returns as the increase in interest rates across the intermediate-duration component of the U.S. Treasury curve more than offset spread tightening within the Fund’s structured credit exposure.
Opinions expressed herein are as of March 31, 2021, and are subject to change at any time, are not guaranteed and should not be considered investment advice. This report is for the information of shareholders of the Funds. It may also be used as sales literature when preceded or accompanied by the current prospectus.
The performance information shown assumes the reinvestment of all dividends and distributions. Returns over 1 year are average annual returns. Performance data quoted represents past performance; past performance does not guarantee future results and does not reflect the deduction of any taxes a shareholder would pay on fund distributions or the sale of fund shares. The investment return and principal value of an investment will fluctuate so that an investor’s shares, when redeemed, may be worth more or less than the original cost. Current performance of the Fund may be lower or higher than the performance quoted. The Funds’ gross and net expense ratios shown are from the most recent prospectus and may change over time. See the financial highlights section of the financial statements for more recent expense ratios. The Funds’ gross and net expense ratios also include “acquired fund fees and expenses,” which are expenses incurred indirectly as a result of a Fund’s investments in one or more underlying funds, including ETFs and money market funds. Because these costs are indirect, the expense ratios will not correlate to the expense ratios in the Funds’ financial statements, since financial statements only include direct costs of the Funds and not indirect costs of investing in the underlying funds. Performance data current to the most recent month-end may be obtained by calling (213) 633-8200 or by visiting www.doublelinefunds.com.
Fund holdings and sector allocations are subject to change at any time and are not recommendations to buy or sell any security. Please refer to the Schedules of Investments for a complete list of Fund holdings.
Investment strategies may not achieve the desired results due to implementation lag, other timing factors, portfolio management decision-making, economic or market conditions or other unanticipated factors. Additional principal risks for the Funds can be found in the prospectus.
Credit ratings from Moody’s Investor Services, Inc. (“Moody’s”) range from the highest rating of Aaa for bonds of the highest quality that offer the lowest degree of investment risk to the lowest rating of C for the lowest rated class of bonds. Credit ratings from S&P Global Ratings (“S&P”) range from the highest rating of AAA for bonds of the highest quality that offer the lowest degree of investment risk to the lowest rating of D for bonds that are in default. In limited situations when the rating agency has not issued a formal rating, the rating agency will classify the security as nonrated.
Credit ratings are determined by the highest available credit rating from any Nationally Recognized Statistical Rating Organization (“NRSRO”, generally S&P, Moody’s and Fitch Ratings, Inc.). DoubleLine chooses to display credit ratings using S&P’s rating convention, although the rating itself might be sourced from another NRSRO.
Barclays Capital Inc. and its affiliates (“Barclays”) is not the issuer, sponsor or promoter of DoubleLine Shiller Enhanced CAPE® or DoubleLine Shiller Enhanced International CAPE® (together, in this paragraph, the “Funds”) and Barclays has no responsibilities, obligations or duties to investors in the Funds. The Shiller Barclays CAPE® US Sector TR USD Index and Shiller Barclays CAPE® Europe Sector Net TR NoC USD Index (each an “Index” and together the “Indices”) consist of the respective trademarks of Barclays Bank PLC and trademarks owned by or licensed to RSBB-I, LLC and Barclays Bank PLC and that are licensed for use by DoubleLine Funds Trust as the Issuer of the Funds. Barclays’ only relationship with the Issuer in respect of the Indices is the licensing of these trademarks and the Indices which are determined, composed and calculated by Barclays without regard to the Issuer or the Funds or the owners of the Funds. Additionally, DoubleLine Capital LP may for the Funds execute transaction(s) with Barclays in or relating to the Funds’ respective Index in connection with which investors of one of the Funds acquire shares of their respective Fund from DoubleLine Funds Trust and investors neither acquire any interest in that Fund’s respective Index nor enter into any relationship of any kind whatsoever with Barclays upon making an investment in that Fund. The Funds are not sponsored, endorsed, sold or promoted by Barclays. Barclays does not make any representation or warranty, express or implied regarding the advisability of investing in the Funds or the advisability of investing in securities generally or the ability of the Indices to track corresponding or relative market performance. Barclays has not passed on the legality or suitability of the Funds’ names or the Indices with respect to any person or entity. Barclays is not responsible for and has not participated in the determination of the timing of, prices of, or quantities of the shares of the Funds to be issued. Barclays has no obligation to take the needs of the Issuer or the owners of the Funds or any other third party into consideration in determining, composing or calculating the Indices. Barclays has no obligation or liability in connection with administration, marketing or trading of the Funds. The licensing agreement between DoubleLine Funds Trust and Barclays is solely for the benefit of the Funds and Barclays and not for the benefit of the owners of the Funds, investors or other third parties.
BARCLAYS SHALL HAVE NO LIABILITY TO THE ISSUER, INVESTORS OR TO OTHER THIRD PARTIES FOR THE USE OF THE DOUBLELINE SHILLER ENHANCED CAPE® AND DOUBLELINE SHILLER ENHANCED INTERNATIONAL CAPE® NAMES, OR THE QUALITY, ACCURACY AND/OR COMPLETENESS OF THE SHILLER BARCLAYS CAPE® US SECTOR TR USD INDEX OR SHILLER BARCLAYS CAPE® EUROPE SECTOR NET TR NOC USD INDEX OR ANY DATA INCLUDED THEREIN OR FOR INTERRUPTIONS IN THE DELIVERY OF THE SHILLER BARCLAYS CAPE® US SECTOR TR USD INDEX OR SHILLER BARCLAYS CAPE® EUROPE SECTOR NET TR NOC USD INDEX. BARCLAYS MAKES NO WARRANTY, EXPRESS OR IMPLIED, AS TO RESULTS TO BE OBTAINED BY THE ISSUER, THE INVESTORS OR ANY OTHER PERSON OR ENTITY FROM THE USE OF THE SHILLER BARCLAYS CAPE® US SECTOR TR USD INDEX OR SHILLER BARCLAYS CAPE® EUROPE SECTOR NET TR NOC USD INDEX OR ANY DATA INCLUDED THEREIN. BARCLAYS MAKES NO EXPRESS OR IMPLIED WARRANTIES, AND HEREBY EXPRESSLY DISCLAIMS ALL WARRANTIES OF MERCHANTABILITY OR FITNESS FOR A PARTICULAR PURPOSE OR USE WITH RESPECT TO DOUBLELINE SHILLER ENHANCED CAPE® AND DOUBLELINE SHILLER ENHANCED INTERNATIONAL CAPE® NAMES, THE SHILLER BARCLAYS CAPE® US SECTOR TR USD INDEX OR SHILLER BARCLAYS CAPE® EUROPE SECTOR NET TR NOC USD INDEX OR ANY DATA INCLUDED THEREIN. BARCLAYS RESERVES THE RIGHT TO CHANGE THE METHODS OF CALCULATION OR PUBLICATION, OR TO CEASE THE CALCULATION OR PUBLICATION OF THE SHILLER BARCLAYS CAPE® US SECTOR TR USD INDEX AND SHILLER BARCLAYS CAPE® EUROPE SECTOR NET TR NOC USD INDEX, AND BARCLAYS SHALL NOT BE LIABLE FOR ANY MISCALCULATION OF OR ANY INCORRECT, DELAYED OR INTERRUPTED PUBLICATION WITH RESPECT TO ANY OF THE SHILLER BARCLAYS CAPE® US SECTOR TR USD INDEX AND SHILLER BARCLAYS CAPE® EUROPE SECTOR NET TR NOC USD INDEX. BARCLAYS SHALL NOT BE LIABLE FOR ANY DAMAGES, INCLUDING, WITHOUT LIMITATION, ANY SPECIAL, INDIRECT OR CONSEQUENTIAL DAMAGES, OR ANY LOST PROFITS AND EVEN IF ADVISED OF THE POSSIBILITY OF SUCH, RESULTING FROM THE USE OF THE SHILLER BARCLAYS CAPE® US SECTOR TR USD INDEX OR SHILLER BARCLAYS CAPE® EUROPE SECTOR NET TR NOC USD INDEX OR ANY DATA INCLUDED THEREIN OR WITH RESPECT TO THE DOUBLELINE SHILLER ENHANCED CAPE® OR DOUBLELINE SHILLER ENHANCED INTERNATIONAL CAPE®.
None of the information supplied by Barclays Bank PLC and used in this publication may be reproduced in any manner without the prior written permission of Barclays Capital, the investment banking division of Barclays Bank PLC. Barclays Bank PLC is registered in England No. 1026167. Registered office 1 Churchill Place London E14 5HP.
THIS FUND IS NOT SPONSORED, ENDORSED, SOLD OR PROMOTED BY MORGAN STANLEY CAPITAL GROUP INC. (“MORGAN STANLEY”). NEITHER MORGAN STANLEY NOR ANY OF ITS OR ITS AFFILIATES’ AGENTS (INCLUDING CALCULATION AGENTS), DATA PROVIDERS (WHICH FOR PURPOSES OF THIS DISCLAIMER INCLUDES WITHOUT LIMITATION ICE DATA, LLP, CHICAGO MERCANTILE EXCHANGE INC., AND THE LONDON METAL EXCHANGE) OR ANY THIRD PARTY PROVIDING SERVICES IN CONNECTION WITH THE INDEX MAKES ANY REPRESENTATION OR WARRANTY, EXPRESS OR IMPLIED, REGARDING THE ADVISABILITY OF INVESTING IN THIS FUND OR THE ABILITY OF THE MORGAN STANLEY BFMCISM (THE “INDEX”) TO TRACK MARKET PERFORMANCE. THE INDEX IS THE EXCLUSIVE PROPERTY OF MORGAN STANLEY. MORGAN STANLEY AND THE INDEX ARE SERVICE MARKS OF MORGAN STANLEY AND/OR A MORGAN STANLEY AFFILIATE AND HAVE BEEN LICENSED TO DOUBLELINE ALTERNATIVES LP FOR USE FOR CERTAIN PURPOSES BY DOUBLELINE ALTERNATIVES LP (“LICENSEE”). MORGAN STANLEY HAS NO OBLIGATION TO TAKE THE NEEDS OF THE LICENSEE, ISSUER OR OWNERS OF THIS FUND INTO CONSIDERATION IN DETERMINING, COMPOSING OR CALCULATING THE INDEX. NEITHER MORGAN STANLEY NOR ANY OF ITS OR ITS AFFILIATES’ AGENTS (INCLUDING CALCULATION AGENTS), DATA PROVIDERS OR ANY THIRD PARTY PROVIDING SERVICES IN CONNECTION WITH THE INDEX IS RESPONSIBLE FOR AND HAS NOT PARTICIPATED IN THE DETERMINATION OF THE TIMING OF, PRICES AT, OR QUANTITIES OF THIS FUND OR ITS ASSETS OR IN THE DETERMINATION OR CALCULATION OF THE EQUATION BY WHICH THIS FUND IS REDEEMABLE. NEITHER MORGAN STANLEY NOR ANY OF ITS OR ITS AFFILIATES’ AGENTS (INCLUDING CALCULATION AGENTS), DATA PROVIDERS OR ANY THIRD PARTY PROVIDING SERVICES IN CONNECTION WITH THE INDEX HAS OR WILL HAVE ANY OBLIGATION OR LIABILITY TO OWNERS OF THIS FUND IN CONNECTION WITH THE ADMINISTRATION, MARKETING OR TRADING OF THIS FUND.
ALTHOUGH MORGAN STANLEY OR ITS AGENTS OR SERVICE PROVIDERS SHALL OBTAIN INFORMATION FOR INCLUSION IN OR FOR USE IN THE CALCULATION OF THE INDEX FROM SOURCES WHICH MORGAN STANLEY CONSIDERS RELIABLE, NEITHER MORGAN STANLEY NOR ANY OF ITS OR ITS AFFILIATES’ AGENTS (INCLUDING CALCULATION AGENTS), DATA PROVIDERS OR ANY THIRD PARTY PROVIDING SERVICES IN CONNECTION WITH THE INDEX GUARANTEES THE ACCURACY AND/OR THE COMPLETENESS OF THE INDEX OR ANY DATA INCLUDED THEREIN. NEITHER MORGAN STANLEY NOR ANY OF ITS OR ITS AFFILIATES’ AGENTS (INCLUDING CALCULATION AGENTS), DATA PROVIDERS OR ANY THIRD PARTY PROVIDING SERVICES IN CONNECTION WITH THE INDEX MAKES ANY WARRANTY, EXPRESS OR IMPLIED, AS TO RESULTS TO BE OBTAINED BY LICENSEE, LICENSEE’S CUSTOMERS AND COUNTERPARTIES, OWNERS OF OR INVESTORS IN THE FUND, OR ANY OTHER PERSON OR ENTITY FROM THE USE OF THE INDEX OR ANY DATA INCLUDED THEREIN IN CONNECTION WITH THE RIGHTS LICENSED HEREUNDER OR FOR ANY OTHER USE. NEITHER MORGAN STANLEY NOR ANY OF ITS OR ITS AFFILIATES’ AGENTS (INCLUDING CALCULATION AGENTS), DATA PROVIDERS OR ANY THIRD PARTY PROVIDING SERVICES IN CONNECTION WITH THE INDEX MAKES ANY EXPRESS OR IMPLIED WARRANTIES, AND DO HEREBY EXPRESSLY DISCLAIM ALL WARRANTIES OF MERCHANTABILITY OR FITNESS FOR A PARTICULAR PURPOSE WITH RESPECT TO THE INDEX OR ANY DATA INCLUDED THEREIN. WITHOUT LIMITING ANY OF THE FOREGOING, IN NO EVENT SHALL MORGAN STANLEY OR ANY AGENT OF MORGAN STANLEY OR ANY MORGAN STANLEY AFFILIATE (INCLUDING CALCULATION AGENTS), DATA PROVIDERS OR ANY THIRD PARTY PROVIDING SERVICES IN CONNECTION WITH THE INDEX HAVE ANY LIABILITY FOR ANY DIRECT, INDIRECT, SPECIAL, PUNITIVE, CONSEQUENTIAL OR ANY OTHER DAMAGES (INCLUDING LOST PROFITS) EVEN IF NOTIFIED OF THE POSSIBILITY OF SUCH DAMAGES.
NO PURCHASER, SELLER OR HOLDER OF THIS SECURITY, OR ANY OTHER PERSON OR ENTITY, SHOULD USE OR REFER TO ANY MORGAN STANLEY TRADE NAME, TRADEMARK OR SERVICE MARK TO SPONSOR, ENDORSE, MARKET OR PROMOTE THIS PRODUCT WITHOUT FIRST CONTACTING MORGAN STANLEY TO DETERMINE WHETHER MORGAN STANLEY’S PERMISSION IS REQUIRED. UNDER NO CIRCUMSTANCES MAY ANY PERSON OR ENTITY CLAIM ANY AFFILIATION WITH MORGAN STANLEY WITHOUT THE PRIOR WRITTEN PERMISSION OF MORGAN STANLEY.
As part of the license agreements related to the use of the Colony Capital Fundamental US Real Estate Index, the DoubleLine Colony Real Estate and Income Fund is required to include the following disclaimers in its Prospectus. The following disclaimers have been provided by Colony Capital, Inc. and Barclays Bank PLC, respectively. Neither the DoubleLine Colony Real Estate and Income Fund nor the Adviser has verified the information in these disclaimers and both the Fund and the Adviser disclaim responsibility for the content of these disclaimers.
The Colony Capital Fundamental US Real Estate Index (the “Index”) has been licensed by Barclays for use by DoubleLine Alternatives LP. Colony Capital is a registered trademark of Colony Capital QIS, LLC or its affiliates and has been sub-licensed for use for certain purposes by DoubleLine Alternatives LP. DoubleLine Colony Real Estate and Income Fund (the “Fund”) is not sponsored, endorsed, sold, or promoted by Colony Capital QIS, LLC or any of its affiliates. Neither Colony Capital QIS, LLC nor any of its affiliates make any representation or warranty, express or implied, to the owners of the Fund or any member of the public regarding the advisability of investing in securities generally or in the Fund particularly or the ability of the Index to track market performance. Colony Capital QIS, LLC’s and its affiliates’ only relationship to DoubleLine Alternatives LP with respect to the Index is through the sublicensing of certain rules incorporated in the Index and certain trademarks, service marks, and/ or trade names owned by Colony Capital QIS, LLC and its affiliates through Barclays and/or its affiliates to DoubleLine Alternatives LP. The Index is not determined, composed, or calculated by Colony Capital QIS, LLC. Neither Colony Capital QIS, LLC nor its affiliates are responsible for and have not participated in the determination of the prices or amount of shares of the Fund or the timing of the issuance or sale of shares of the Fund or in the determination or calculation of the equation by which shares of the Fund are to be converted into cash, surrendered, or redeemed, as the case may be. Colony Capital QIS, LLC and its affiliates have no obligation or liability in connection with the administration, marketing, or trading of the Fund. There is no assurance that investment products based on the Index shall accurately track index performance or provide positive investment returns. Colony Capital QIS, LLC and its affiliates are not investment advisors with respect to investors in the Fund. Inclusion of a security within an index is not a recommendation by Colony Capital QIS, LLC or its affiliates to buy, sell, or hold such security, nor is it considered to be investment advice.
NEITHER COLONY CAPITAL QIS, LLC NOR ITS AFFILIATES GUARANTEE THE ADEQUACY, ACCURACY, TIMELINESS, AND/OR COMPLETENESS OF THE INDEX, ANY DATA RELATED THERETO, OR ANY COMMUNICATIONS, INCLUDING BUT NOT LIMITED TO, ORAL, WRITTEN, OR ELECTRONIC COMMUNICATIONS WITH RESPECT THERETO AND LICENSOR AND ITS AFFILIATES SHALL NOT BE SUBJECT TO ANY DAMAGES OR LIABILITY FOR ANY ERRORS, OMISSIONS, OR DELAYS THEREIN. COLONY CAPITAL QIS, LLC AND ITS AFFILIATES MAKE NO EXPRESS OR IMPLIED WARRANTIES, AND EXPRESSLY DISCLAIM ALL WARRANTIES OF MERCHANTABILITY, FITNESS FOR A PARTICULAR PURPOSE, OR USE, OR AS TO RESULTS TO BE OBTAINED BY DOUBLELINE ALTERNATIVES LP, INVESTORS IN THE FUND, OR ANY OTHER PERSON OR ENTITY FROM THE USE OF THE INDEX OR WITH RESPECT TO ANY DATA RELATED THERETO. WITHOUT LIMITING ANY OF THE FOREGOING, IN NO EVENT WHATSOEVER SHALL LICENSOR OR ITS AFFILIATES BE LIABLE, WHETHER IN CONTRACT, TORT, STRICT LIABILITY, OR OTHERWISE, FOR ANY INDIRECT, SPECIAL, INCIDENTAL, PUNITIVE, OR CONSEQUENTIAL DAMAGES OR FOR LOSS OF PROFITS, TRADING LOSSES, LOST TIME, OR GOODWILL, EVEN IF THEY HAVE BEEN ADVISED OF THE POSSIBILITY OF SUCH DAMAGES.
BARCLAYS AND THE INDEX SPONSOR DO NOT GUARANTEE, AND SHALL HAVE NO LIABILITY TO THE PURCHASERS OR TRADERS, AS THE CASE MAY BE, OF THE FUND OR TO THIRD PARTIES FOR, THE QUALITY, ACCURACY AND/OR COMPLETENESS OF THE BARCLAYS INDICES, OR ANY DATA INCLUDED THEREIN, OR FOR INTERRUPTIONS IN THE DELIVERY OF THE BARCLAYS INDICES. BARCLAYS AND THE INDEX SPONSOR MAKE NO EXPRESS OR IMPLIED WARRANTIES, AND HEREBY EXPRESSLY DISCLAIM ALL WARRANTIES OF MERCHANTABILITY OR FITNESS FOR A PARTICULAR PURPOSE OR USE WITH RESPECT TO THE BARCLAYS INDICES, INCLUDING WITHOUT LIMITATION, THE INDEX, OR ANY DATA INCLUDED THEREIN. WITHOUT LIMITING ANY OF THE FOREGOING, IN NO EVENT SHALL BARCLAYS OR THE INDEX SPONSOR HAVE ANY LIABILITY FOR ANY SPECIAL, PUNITIVE, INDIRECT, OR CONSEQUENTIAL DAMAGES (INCLUDING LOST PROFITS), EVEN IF NOTIFIED OF THE POSSIBILITY OF SUCH DAMAGES SAVE TO THE EXTENT THAT SUCH EXCLUSION OF LIABILITY IS PROHIBITED BY LAW.
any data included therein, or any data on which it is based, and the Index Sponsor shall have no liability for any errors, omissions, or interruptions therein. The Index Sponsor makes no warranty, express or implied, as to results to be obtained from the use of the Index. The Index Sponsor makes no express or implied warranties, and expressly disclaims all warranties of merchantability or fitness for a particular purpose or use with respect to the Index or any data included therein. Without limiting any of the foregoing, in no event shall the Index Sponsor have any liability for any special, punitive, indirect, or consequential damages (including lost profits), even if notified of the possibility of such damages.
For the avoidance of doubt the Index and/or any account, transaction or product using the information relating to the Index, is not sponsored, endorsed, sold, or promoted by any provider of the underlying data (the “Reference Assets”) comprised in the Index (each a “Reference Asset Sponsor”) and no Reference Asset Sponsor makes any representation whatsoever, whether express or implied, either as to the results to be obtained from the use of the relevant Reference Asset or the index and/or the levels at which the relevant Reference Asset or the Index stands at any particular time on any particular date or otherwise. No Reference Asset Sponsor shall be liable (whether in negligence or otherwise) to any person for any error in a Reference Asset and/or in the Index and a Reference Asset Sponsor is under no obligation to advise any person of any error therein. No Reference Asset Sponsor is making any representation whatsoever, whether express or implied, as to the advisability of purchasing or assuming any risk in connection with the DoubleLine Multi-Asset Trend Fund managed by DoubleLine; or any product or investment strategy referencing the DoubleLine Multi-Asset Trend Fund managed by DoubleLine. No Reference Asset Sponsor shall have any liability for any act or failure to act by the Index Sponsor in connection with the calculation, adjustment or maintenance of the Index. None of the Reference Asset Sponsors or their affiliates have any affiliation with or control over the Index or the Index Sponsor or any control over the computation, composition or dissemination of the Index.
The Index Sponsor and the Index Calculation Agent shall not be held liable for any modification or change in the methodology used in calculating the index or any index components thereof (the “BNP Paribas Indices”). The Index Sponsor and the Index Calculation Agent are under no obligation to continue the calculation, publication or dissemination of the BNP Paribas Indices and shall not be held liable for any suspension or interruption in the calculation of any BNP Paribas Indices. The Index Sponsor and the Index Calculation Agent decline any liability in connection with the level of any BNP Paribas Index at any given time. None of BNP Paribas, the Index Sponsor, the Index Calculation Agent nor any of their affiliates shall be held liable for any loss whatsoever, directly or indirectly related to any BNP Paribas Index.
BNP Paribas, the Index Sponsor and the Index Calculation Agent do not guarantee the accuracy or completeness of the methodology or rules of the BNP Paribas Indices (the “BNP Paribas Index Rules”) or the calculation methods, any errors or omissions in computing or disseminating the BNP Paribas Indices, or for any use thereof, and the Index Sponsor and the Index Calculation Agent shall have no liability for any errors or omissions therein.
The BNP Paribas Index Rules are based on certain assumptions, certain pricing models and calculation methods adopted by the Index Sponsor and have certain inherent limitations. Information prepared on the basis of different models, calculation methods or assumptions may yield different results. Numerous factors may affect the analysis, which may or may not be taken into account. Therefore, the analysis of information may vary significantly from analysis obtained from other sources or market participants.
BNP Paribas, the Index Sponsor and Index Calculation Agent do not make any representation whatsoever, either as to the results to be obtained from the use of the BNP Paribas Indices, the levels of any BNP Paribas Index at any time or any use of any Index Component or the price, level or rate of any Index Component at any time.
The market data used to calculate the level of any BNP Paribas Index may be furnished by third party sources and is believed to be reliable; however, BNP Paribas, the Index Sponsor and the Index Calculation Agent make no representation or guarantee with respect to, and are under no obligation to verify, the accuracy and completeness thereof.
Euro Stoxx 50 Index—This index of 50 eurozone stocks provides a blue-chip representation of supersector leaders in the eurozone.
A direct investment cannot be made in an index. The performance of any index mentioned in this commentary has not been adjusted for ongoing management, distribution and operating expenses applicable to mutual fund investments.
This commentary may include statements that constitute “forward-looking statements” under the U.S. securities laws. Forward-looking statements include, among other things, projections, estimates, and information about possible or future results related to a Fund and market or regulatory developments. The views expressed above are not guarantees of future performance or economic results and involve certain risks, uncertainties and assumptions that could cause actual outcomes and results to differ materially from the views expressed herein.
DoubleLine has no obligation to provide revised assessments in the event of changed circumstances. While we have gathered this information from sources believed to be reliable, DoubleLine cannot guarantee the accuracy of the information provided. Securities discussed are not recommendations and are presented as examples of issue selection or portfolio management processes. They have been picked for comparison or illustration purposes only. No security presented within is either offered for sale or purchase. DoubleLine reserves the right to change its investment perspective and outlook without notice as market conditions dictate or as additional information becomes available.
Investment strategies may not achieve the desired results due to implementation lag, other timing factors, portfolio management decision making, economic or market conditions or other unanticipated factors. The views and forecasts expressed in this material are as of the date indicated, are subject to change without notice, may not come to pass and do not represent a recommendation or offer of any particular security, strategy, or investment. Past performance is no guarantee of future results.
The DoubleLine Funds are distributed by Quasar Distributors, LLC.
Short term performance, in particular, is not a good indication of the fund’s future performance, and an investment should not be made based solely on returns.
A summary of the DoubleLine Total Return Bond Fund’s investments in affiliated mutual funds for the year ended March 31, 2021 is as follows:
A summary of the DoubleLine Core Fixed Income Fund’s investments in affiliated mutual funds for the year ended March 31, 2021 is as follows:
A summary of the DoubleLine Multi-Asset Growth Fund’s (Consolidated) investments in affiliated mutual funds for the year ended March 31, 2021 is as follows:
A summary of the DoubleLine Low Duration Bond Fund’s investments in affiliated mutual funds for the year ended March 31, 2021 is as follows:
A summary of the DoubleLine Flexible Income Fund’s investments in affiliated mutual funds for the year ended March 31, 2021 is as follows:
A summary of the DoubleLine Multi-Asset Trend Fund’s investments in affiliated mutual funds for the year ended March 31, 2021 is as follows:
Each Fund is classified as a diversified fund under the 1940 Act, except the DoubleLine Global Bond Fund, the DoubleLine Emerging Markets Local Currency Bond Fund and the DoubleLine Income Fund, which are classified as non-diversified funds. Currently under the 1940 Act, a diversified fund generally may not, with respect to 75% of its total assets, invest more than 5% of its total assets in the securities of any one issuer or own more than 10% of the outstanding voting securities of such issuer (except, in each case, U.S. Government securities, cash, cash items and the securities of other investment companies). The remaining 25% of a fund’s total assets is not subject to this limitation.
The Funds’ investment objectives and dates each share class commenced operations are as follows:
The fiscal year end for the Funds is March 31, and the period covered by these Financial Statements is for the period ended March 31, 2021 (the “period end”).
Each Fund is an investment company that applies the accounting and reporting guidance issued in Topic 946, “Financial Services—Investment Companies”, by the Financial Accounting Standards Board (“FASB”). The following is a summary of the significant accounting policies of the Funds. These policies are in conformity with accounting principles generally accepted in the United States of America (“US GAAP”).
Market values for domestic and foreign fixed income securities are normally determined on the basis of valuations provided by independent pricing services. Vendors typically value such securities based on one or more inputs described in the following table which is not intended to be a complete list. The table provides examples of inputs that are commonly relevant for valuing particular classes of fixed income securities in which the Funds are authorized to invest. However, these classifications are not exclusive, and any of the inputs may be used to value any other class of fixed-income securities. Securities that use similar valuation techniques and inputs as described in the following table are categorized as Level 2 of the fair value hierarchy. To the extent the significant inputs are unobservable, the values generally would be categorized as Level 3. Assets and liabilities may be transferred between levels.
Investments in registered open-end management investment companies will be valued based upon the net asset value (“NAV”) of such investments and are categorized as Level 1 of the fair value hierarchy.
Common stocks, exchange-traded funds and financial derivative instruments, such as futures contracts or options contracts, that are traded on a national securities or commodities exchange, are typically valued at the last reported sales price, in the case of common stocks and exchange-traded funds, or, in the case of futures contracts or options contracts, the settlement price determined by the relevant exchange. To the extent these securities are actively traded and valuation adjustments are not applied, they are categorized as Level 1 of the fair value hierarchy.
Securities may be fair valued by the Adviser in accordance with the fair valuation procedures approved by the Board of Trustees (the “Board”). The Adviser’s valuation committee is generally responsible for overseeing the day to day valuation processes and reports periodically to the Board. The Adviser’s valuation committee and the pricing group are authorized to make all necessary determinations of the fair values of portfolio securities and other assets for which market quotations or third party vendor prices are not readily available or if it is deemed that the prices obtained from brokers and dealers or independent pricing services are deemed to be unreliable indicators of market or fair value.
The following is a summary of the fair valuations according to the inputs used to value the Funds’ investments as of March 31, 2021:
The following is a reconciliation of investments in which significant unobservable inputs (Level 3) were used in determining fair value:
The following is a summary of quantitative information about Level 3 Fair Value Measurements:
The Funds may be subject to a nondeductible 4% excise tax calculated as a percentage of certain undistributed amounts of net investment income and net capital gains.
The Funds have adopted financial reporting rules that require the Funds to analyze all open tax years, as defined by the applicable statute of limitations, for all major jurisdictions. Open tax years 2018-2020 (Federal) and 2017-2020 (CA) for the Funds, are those that are open for exam by taxing authorities to the extent that each Fund operated within those respective tax years. As of March 31, 2021, the Funds have no examinations in progress.
Management has analyzed the Funds’ tax positions, and has concluded that no liability should be recorded related to uncertain tax positions expected to be taken on the tax return for the period end. The Funds identify their major tax jurisdictions as U.S. Federal, the State of Delaware and the State of California. The Funds are not aware of any tax positions for which it is reasonably possible that the total amounts of unrecognized tax benefits will significantly change in the next twelve months.
Each Fund’s tax returns are subject to examination by relevant tax authorities until expiration of the applicable statute of limitations, which is generally three years after the filing of the tax return but which can be extended to six years in certain circumstances.
Income and capital gain distributions are determined in accordance with income tax regulations which may differ from US GAAP. Permanent book and tax basis differences relating to shareholder distributions will result in reclassifications between paid-in capital, undistributed (accumulated) net investment income (loss), and/or undistributed (accumulated) realized gain (loss). Undistributed (accumulated) net investment income or loss may include temporary book and tax basis differences which will reverse in a subsequent period. Any taxable income or capital gain remaining at fiscal year end is distributed in the following year.
Distributions from investment companies will be classified as investment income or realized gains in the Statements of Operations based on the U.S. income tax characteristics of the distribution if such information is available. In cases where the tax characteristics are not available, such distributions are generally classified as investment income.
may have some exposure to this litigation. At this time, it is anticipated that a material adverse effect on the Multi-Asset Growth Fund as a result of this litigation is remote. As of the period end, no loss contingency has been recorded in the financial statements.
As of March 31, 2021 the relationship of the Subsidiary to each respective Fund was as follows:
The Advisers provide the Funds with investment management services under Investment Management Agreements (the “Agreements”). Under the Agreements, each Adviser manages the investment of the assets of the applicable Fund, places orders for the purchase and sale of its portfolio securities and is responsible for providing certain resources to assist with the day-to-day management of the Trust’s business affairs. As compensation for its services, each Adviser is entitled to a monthly fee at the annual rates of the average daily net assets of the Funds (the “Advisory Fee”) in the following table. Each Adviser has arrangements with DoubleLine Group LP to provide personnel and other resources to the Funds. On December 11, 2018, DoubleLine Alternatives LP, the investment adviser of the DoubleLine Colony Real Estate and Income Fund, engaged DoubleLine Capital LP to serve as sub-adviser to the DoubleLine Colony Real Estate and Income Fund to manage its investment in debt instruments. On February 18, 2021, DoubleLine Alternatives LP, the investment adviser of the DoubleLine Multi-Asset Trend Fund, engaged DoubleLine Capital LP to serve as subadviser to the DoubleLine Multi-Asset Trend Fund to manage its investment in debt instruments.
Each Adviser has contractually agreed to limit certain of the Funds’ ordinary operating expenses so that its ratio of such expenses to average net assets will not exceed the following ratios (the “Expense Caps”). For the purposes of the expense limitation agreement between each Adviser and the Funds, “ordinary operating expenses” excludes taxes, commissions, mark-ups, litigation expenses, indemnification expenses, interest expenses, acquired fund fees and expenses, and any extraordinary expenses. With the exception of the DoubleLine Income Fund and DoubleLine Multi-Asset Trend Fund, each Fund’s expense limitation is expected to apply until at least July 31, 2021. DoubleLine Income Fund’s expense limitation is expected to apply until at least September 2, 2021, and
DoubleLine Multi-Asset Trend Fund’s expense limitation is expected to apply until at least February 26, 2023. Each may be terminated during the term only by a majority vote of the disinterested Trustees of the Board.
Other than as described above, to the extent that an Adviser waives its investment advisory fee and/or reimburses a Fund for other ordinary operating expenses, it may seek reimbursement of a portion or all of such amounts at any time within three fiscal years after the fiscal year in which such amounts were waived or reimbursed. Each Fund must pay its current ordinary operating expenses before each Adviser is entitled to any recoupment. Any such recoupment would be subject to review by the Board and will be subject to the Fund’s expense limitations in place when the fees were waived or the expenses were reimbursed.
Each Adviser, as applicable, contractually waived a portion of its fees or reimbursed certain operating expenses and may recapture a portion of the amounts no later than the dates as stated in the following table:
For the year ended March 31, 2021 each Adviser recouped the amounts shown from the following Funds:
If a Fund invested in other investment vehicles sponsored by an Adviser (“other DoubleLine Funds”) during the period, such Adviser waived its advisory fee to the Fund in an amount equal to the advisory fees paid to the Adviser by the other DoubleLine Funds in respect of Fund assets so invested. Accordingly, the Adviser waived the following fees for the year ended March 31, 2021:
As of March 31, 2021 greater than 5% of the following DoubleLine Funds was held by other DoubleLine Funds as follows:
DoubleLine Capital LP and certain DoubleLine affiliated advisers provide investment advisory, sub-advisory, or consulting services to a variety of investors, including investment program sponsors, separate accounts, and mutual funds sponsored by third parties (collectively “third-party accounts”). Those services may result, directly or indirectly, in investments by the third-party accounts in one or more of the Funds. At times, the third-party accounts’ investments, individually or in the aggregate, may represent material interests in one or more of the Funds. The third-party accounts’ transaction activity in a Fund may cause a Fund to incur material transaction costs, to realize taxable gains distributable to shareholders, and/or to buy or sell assets at a time when the Fund might not otherwise do so, each of which may adversely affect a Fund’s performance. See the description of Large Shareholder Risk in the Principal Risks Note for more information. Records available to the Funds reflect that greater than 25% of the following Funds were held by third-party accounts as of March 31, 2021:
Class N shares and Class A shares of the Funds make payments under a distribution plan (the “Distribution Plan”) adopted pursuant to Rule 12b-1 under the 1940 Act. Pursuant to the Distribution Plan, each Fund compensates the Fund’s distributor for distribution and related services at an annual rate equal to 0.25% of the average daily net assets of the Fund attributable to its Class N and Class A shares. The fees may be used to pay the Fund’s distributor for distribution services and sales support services provided in connection with Class N and Class A shares.
The Class A shares of DoubleLine Multi-Asset Growth Fund have a maximum sales charge imposed on purchases of 4.25% of the offering price and a maximum contingent deferred sales charge of 0.75% that applies to purchases of $1 million or more of Class A shares if the shares are redeemed within 18 months of purchase.
The DoubleLine Floating Rate Fund imposes redemption fees. Redemption fees are paid to and retained by the Fund to limit the opportunity to market time the Fund and to help offset estimated portfolio transaction costs and other related costs incurred by the Fund as a result of short-term trading. Subject to the exceptions discussed in the Fund’s prospectus, the DoubleLine Floating Rate Fund will apply a redemption fee equal to 1% of the value of any shares redeemed within 90 days of purchase.
Investment transactions (excluding short-term investments) for the year ended March 31, 2021 were as follows:
The Funds designated as long-term capital gain dividend, pursuant to Internal Revenue Code Section 852(b)(3), the amount necessary to reduce the earnings and profits of the Funds related to net capital gain to zero.
The cost basis of investments for federal income tax purposes as of March 31, 2021 was as follows:
Under the Regulated Investment Company Modernization Act of 2010, capital losses incurred by the Funds after January 1, 2011 will not be subject to expiration. In addition, such losses must be utilized prior to the losses incurred in the years preceding enactment.
Additionally, US GAAP requires that certain components of net assets relating to permanent differences be reclassified between financial and tax reporting. These reclassifications have no effect on net assets or NAV per share. The permanent differences primarily relate to paydown losses, accretion of discount on certain debt instruments, foreign currency gains (losses), consent fee income and equalization. For the period ended March 31, 2021, the following table shows the reclassifications made:
If a Fund estimates that a portion of its regular distributions to shareholders may be comprised of amounts from sources other than net investment income, as determined in accordance with such Fund’s policies and practices, the Fund will notify shareholders of the estimated composition of such distribution through a Section 19 Notice. For these purposes, and beginning on October 1, 2020, each Fund estimates the source or sources from which a distribution is paid, to the close of the period as of which it is paid, in reference to its expected tax character. It is important to note that differences exist between a Fund’s daily internal accounting records and practices, the Fund’s financial statements presented in accordance with US GAAP, and recordkeeping practices under income tax regulations. It is possible that a Fund may not issue a Section 19 Notice in situations where such Fund’s financial statements prepared later and in accordance with US GAAP might later report that the sources of those distributions included capital gains and/or a return of capital. Please visit www.doublelinefunds.com for the most recent Section 19 Notice, if applicable. Information provided to you on a Section 19 notice is an estimate only and subject to change; final determination of a distribution’s tax character will be reported on Form 1099 DIV sent to shareholders for the calendar year.
Trustees who are not affiliated with each Adviser and its affiliates receive fees from the Trust. These trustees may elect to defer the cash payment of part or all of their compensation. These deferred amounts, which remain as liabilities of the Funds, are treated as if invested in shares of Funds designated by each Trustee or other funds managed by each Adviser and its affiliates. These amounts represent general unsecured liabilities of each Fund and vary according to the total returns of the selected funds. Trustees Fees in the Statements of Operations include current fees (either paid in cash or deferred) and any increase (decrease) in the value of the deferred amounts. Certain trustees and officers of the Funds are also officers of each Adviser; such trustees and officers are not compensated by the Funds.
The following disclosures provide information on the Funds’ use of derivatives and certain related risks. The location and fair value amounts of these instruments on the Statements of Assets and Liabilities and the realized gains and losses and changes in unrealized gains and losses on the Statements of Operations, each categorized by type of derivative contract, are included in the following tables.
The average volume of derivative activity during the year ended March 31, 2021 is as follows:
Statements of Operations. A Fund as a writer of an option has no control over whether the underlying instrument may be sold (call) or purchased (put), and as a result bears the market risk of an unfavorable change in the price of the instrument underlying the written option. There is the risk that the market for options contracts may be illiquid and that a Fund may not be able to close out or sell an option at a particular time or at an anticipated price.
If a Fund is a seller of protection and a credit event occurs, as defined under the terms of that particular swap agreement, the Fund typically will either (i) pay to the buyer of protection an amount equal to the notional amount of the swap and take delivery of the referenced obligation, other deliverable obligations or the affected securities in the referenced index or (ii) pay a net settlement amount in the form of cash or securities equal to the notional amount of the swap less the recovery value of the referenced obligation or the affected securities in the referenced index. If a Fund is a buyer of protection and a credit event occurs, as defined under the terms of that particular swap agreement, the Fund typically will either (i) receive from the seller of protection an amount equal to the notional amount of the swap and deliver the referenced obligation, other deliverable obligations or the affected securities in the referenced index or (ii) receive a net settlement amount in the form of cash or securities equal to the notional amount of the swap less the recovery value of the referenced obligation or the affected securities in the referenced index. Recovery values are typically estimated by market makers considering either industry standard recovery rates or entity specific factors and considerations until a credit event occurs. An index credit default swap references all the names in the index, and if there is a default with respect to a single name in the index, the credit event is generally settled based on that name’s weight in the index.
Credit default swaps are considered to have credit risk related contingent features since they require payment by the protection seller to the protection buyer upon occurrence of a defined credit event. A Fund’s maximum risk of loss from counterparty risk, as the protection buyer, is the fair value of the contract, which may be mitigated by the posting of collateral by the counterparty to a Fund to cover a Fund’s exposure to the counterparty. Upfront premiums (received) paid including accretion (amortization) less any collateral held at the counterparty are reflected in deposit at broker for swaps on the Statements of Assets and Liabilities. The marked-to-market value less a financing rate, if any, is included in net unrealized appreciation (depreciation) on swaps on the Statements of Assets and Liabilities. At termination or maturity of the swap, the cumulative marked-to-market on the value less a financing rate, if any, is recorded in realized gain (loss) on swaps on the Statements of Operations.
The Funds’ derivative instrument holdings are summarized in the following tables.
The effect of derivative instruments on the Statements of Assets and Liabilities for the year ended March 31, 2021 was as follows:
The effect of derivative instruments on the Statements of Operations for the year ended March 31, 2021 was as follows:
The Funds are subject to various Master Netting Arrangements, which govern the terms of certain transactions with select counterparties. The Master Netting Arrangements are intended to allow the Funds to close out and net their total exposure to a counterparty in the event of a default with respect to all the transactions governed under a single agreement with a counterparty. The Master Netting Arrangements also specify collateral posting arrangements at pre-arranged exposure levels. Under the Master Netting Arrangements, collateral is routinely transferred if the total net exposure to certain transactions (net of existing collateral already in place) governed under the relevant Master Netting Arrangement with a counterparty in a given account exceeds a specified threshold depending on the counterparty and the type of Master Netting Arrangement.
As of March 31, 2021, the Funds held the following derivative instruments that were subject to offsetting on the Statements of Assets and Liabilities:
The Funds may make loans directly to borrowers and may acquire or invest in loans made by others (“loans”). The Funds may acquire a loan interest directly by acting as a member of the original lending syndicate. Alternatively, the Funds may acquire some or all of the interest of a bank or other lending institution in a loan to a particular borrower by means of a novation, an assignment or a participation. The loans in which the Funds may invest include those that pay fixed rates of interest and those that pay floating rates—i.e., rates that adjust periodically based on a known lending rate, such as a bank’s prime rate. The Funds may purchase and sell interests in bank loans on a when-issued and delayed delivery basis, with payment delivery scheduled for a future date. Securities purchased on a delayed delivery basis are marked to market daily and no income accrues to the Funds prior to the date the Funds actually take delivery of such securities. These transactions are subject to market fluctuations and are subject, among other risks, to the risk that the value at delivery may be more or less than the trade purchase price.
U.S. Bank, N.A. (the “Bank”) has made available to the Trust, excluding the DoubleLine Emerging Markets Local Currency Bond Fund, (the “DoubleLine Funds”) an uncommitted $725,000,000 credit facility for short term liquidity in connection with shareholder redemptions. Under the terms of the credit facility, borrowings for each DoubleLine Fund are limited to one-third of the total assets (including the amount borrowed) of such DoubleLine Fund. Fifty percent of the credit facility is available to all of the DoubleLine Funds, on a first come, first served basis. The remaining 50% of the credit facility is allocated among the DoubleLine Funds in accordance with procedures adopted by the Board. Effective March 15, 2021, borrowings under this credit facility bear interest at the greater of 0.00% or the Bank’s prime rate less 1.00%. Prior to March 15, 2021, borrowings under this credit facility bore interest at the Bank’s prime rate less 0.50%.
The Bank has also made available to the DoubleLine Floating Rate Fund a committed $50,000,000 credit facility. Borrowings under this credit facility bear interest at the greater of 0.00% or the Bank’s prime rate less 1.00%. Prior to March 15, 2021, borrowings under this credit facility bore interest at the Bank’s prime rate less 0.50%.
Effective December 17, 2020, State Street Bank and Trust Company made available to the DoubleLine Emerging Markets Local Currency Bond Fund an uncommitted $30,000,000 credit facility with an annual non-refundable facility fee of $50,000. Under the terms of the credit facility, borrowings are limited to 15% of the Fund’s total assets. Borrowings under this credit facility bear interest at 0.10% plus 1.25% plus the greater of the Federal Funds Rate or the Overnight Bank Funding Rate as in effect on that day.
For the year ended March 31, 2021, the Funds’ credit facility activity is as follows:
As of March 31, 2021, shareholders affiliated with the Funds and/or Advisers (other than other DoubleLine Funds) owned shares of the Funds as follows:
Investment activities of these shareholders could have a material affect on each Fund. See the description of Large Shareholder Risk in the following Principal Risks Note. For information on greater than 5% holders of certain Funds by other DoubleLine Funds, see Note 3 on Related and Other Party Transactions.
Below are summaries of some, but not all, of the principal risks of investing in one or more of the Funds, each of which could adversely affect a Fund’s NAV, yield and total return. Each risk listed below does not necessarily apply to each Fund, and you should read each Fund’s prospectus carefully for a description of the principal risks associated with investing in a particular Fund.
In March 2020, FASB issued Accounting Standards Update (ASU) 2020-04, Reference Rate Reform (Topic 848)—Facilitation of the Effects of Reference Rate Reform on Financial Reporting. The amendments in ASU 2020-04 provides optional temporary financial reporting relief from the effect of certain types of contract modifications due to the planned discontinuation of LIBOR and other interbank-offered based reference rates as of the end of 2021. ASU 2020-04 is effective for certain reference rate-related contract modifications that occur during the period March 12, 2020 through December 31, 2022. Management is currently evaluating the impact, if any, of applying this ASU.
In preparing these financial statements, the Funds have evaluated events and transactions for potential recognition or disclosure through the date the financial statements were issued. The Funds have determined there are no additional subsequent events that would need to be disclosed in the Funds’ financial statements.
To the Board of Trustees of DoubleLine Funds Trust and Shareholders of DoubleLine Total Return Bond Fund, DoubleLine Core Fixed Income Fund, DoubleLine Emerging Markets Fixed Income Fund, DoubleLine Multi-Asset Growth Fund (Consolidated), DoubleLine Low Duration Bond Fund, DoubleLine Floating Rate Fund, DoubleLine Shiller Enhanced CAPE®, DoubleLine Flexible Income Fund, DoubleLine Low Duration Emerging Markets Fixed Income Fund, DoubleLine Long Duration Total Return Bond Fund, DoubleLine Strategic Commodity Fund (Consolidated), DoubleLine Global Bond Fund, DoubleLine Infrastructure Income Fund, DoubleLine Ultra Short Bond Fund, DoubleLine Shiller Enhanced International CAPE®, DoubleLine Colony Real Estate and Income Fund, DoubleLine Emerging Markets Local Currency Bond Fund, DoubleLine Income Fund and DoubleLine Multi-Asset Trend Fund (Consolidated)
We have audited the accompanying statements of assets and liabilities, including the schedules of investments—summary for DoubleLine Total Return Bond Fund, DoubleLine Core Fixed Income Fund, DoubleLine Shiller Enhanced CAPE®, and DoubleLine Flexible Income Fund, and schedules of investments for DoubleLine Emerging Markets Fixed Income Fund, DoubleLine Multi-Asset Growth Fund (Consolidated), DoubleLine Low Duration Bond Fund, DoubleLine Floating Rate Fund, DoubleLine Low Duration Emerging Markets Fixed Income Fund, DoubleLine Long Duration Total Return Bond Fund, DoubleLine Strategic Commodity Fund (Consolidated), DoubleLine Global Bond Fund, DoubleLine Infrastructure Income Fund, DoubleLine Ultra Short Bond Fund, DoubleLine Shiller Enhanced International CAPE®, DoubleLine Colony Real Estate and Income Fund, DoubleLine Emerging Markets Local Currency Bond Fund, DoubleLine Income Fund, and DoubleLine Multi-Asset Trend Fund (Consolidated) (nineteen of the funds constituting DoubleLine Funds Trust, hereafter collectively referred to as the “Funds”) as of March 31, 2021, the related statements of operations and of changes in net assets for each of the periods indicated in the table below, including the related notes, and the financial highlights for each of the periods indicated therein (collectively referred to as the “financial statements”). In our opinion, the financial statements present fairly, in all material respects, the financial position of each of the Funds as of March 31, 2021, the results of each of their operations and the changes in each of their net assets for each of the periods indicated in the table below and each of the financial highlights for each of the periods indicated therein in conformity with accounting principles generally accepted in the United States of America.
These financial statements are the responsibility of the Funds’ management. Our responsibility is to express an opinion on the Funds’ financial statements based on our audits. We are a public accounting firm registered with the Public Company Accounting Oversight Board (United States) (PCAOB) and are required to be independent with respect to the Funds in accordance with the U.S. federal securities laws and the applicable rules and regulations of the Securities and Exchange Commission and the PCAOB.
We conducted our audits of these financial statements in accordance with the standards of the PCAOB. Those standards require that we plan and perform the audit to obtain reasonable assurance about whether the financial statements are free of material misstatement, whether due to error or fraud.
Our audits included performing procedures to assess the risks of material misstatement of the financial statements, whether due to error or fraud, and performing procedures that respond to those risks. Such procedures included examining, on a test basis, evidence regarding the amounts and disclosures in the financial statements. Our audits also included evaluating the accounting principles used and significant estimates made by management, as well as evaluating the overall presentation of the financial statements. Our procedures included confirmation of securities owned as of March 31, 2021 by correspondence with the custodian and brokers; when replies were not received from brokers, we performed other auditing procedures. We believe that our audits provide a reasonable basis for our opinions.
We have served as the auditor of one or more investment companies in the DoubleLine Investment Company Complex since 2010
As a shareholder of the Funds, you incur two basic types of costs: (1) transaction costs , including sales charges (loads) on purchase payments, reinvested dividends, or other distributions; redemption fees; and exchange fees; and (2) ongoing costs, including management fees; distribution (12b-1) fees and other Fund expenses.
This Example is intended to help you understand your ongoing costs (in dollars) of investing in each Fund and to compare these costs with the ongoing costs of investing in other mutual funds. The Example is based on an investment of $1,000 invested at the beginning of the period and held for the entire period October 1, 2020 through March 31, 2021. Expenses paid during the period are equal to the net annualized expense ratio for the class, multiplied by the average account value over the period, multiplied by 182/365 (to reflect the one-half year period) for all funds except the DoubleLine Multi-Asset Trend Fund. The DoubleLine Multi-Asset Trend actual dollar amounts are multiplied by 33/365 which is based on the inception date of February 26, 2021.
The actual return columns in the following table provide information about account values based on actual returns and actual expenses. You may use the information in these columns, together with the amount you invested, to estimate the expenses that you paid over the period. Simply divide your account value by $1,000 (for example, an $8,600 account value divided by $1,000 = 8.6), then multiply the result by the number in the respective line under the heading entitled “Expenses Paid During Period” to estimate the expenses you paid on your account during this period. In addition to the expenses shown below in the table, as a shareholder you will be assessed fees for outgoing wire transfers, returned checks and stop payment orders at prevailing rates charged by U.S. Bancorp Fund Services, LLC, the Fund’s transfer agent. Currently, if you request a redemption be made by wire, a $15.00 fee is charged by the Fund’s transfer agent. You will be charged a redemption fee equal to 1.00% of the net amount of the redemption if you redeem shares that have been held for less than 90 days in the DoubleLine Floating Rate Fund. An Individual Retirement Account (“IRA”) will be charged a $15.00 annual maintenance fee. The transfer agent charges a transaction fee of $25.00 on returned checks and stop payment orders. If you paid a transaction fee, you would add the fee amount to the expenses paid on your account this period to obtain your total expenses paid.
The hypothetical return columns in the following table provide information about hypothetical account values and hypothetical expenses based on a Fund’s actual expense ratio and an assumed rate of return of 5% per year before expenses, which is not a Fund’s actual return. The hypothetical account values and expenses may not be used to estimate the actual ending account balance or expenses you paid for the period. You may use this information to compare the ongoing costs of investing in a Fund and other funds. To do so, compare this 5% hypothetical example with the 5% hypothetical examples that appear in the shareholder reports of the other funds. Please note that the expenses shown in the table are meant to highlight your ongoing costs only and do not reflect the transaction fees discussed above. Therefore, those columns are useful in comparing ongoing costs only, and will not help you determine the relative total costs of owning different funds. In addition, if these transactional costs were included, your costs would have been higher.
At a meeting in February 2021, the Boards of Trustees (the “Board” or the “Trustees”) of the DoubleLine open-end mutual funds and closed-end funds listed above (the “Funds”) approved the continuation of the investment advisory and sub-advisory agreements (the “Advisory Agreements”) between DoubleLine and those Funds. That included approval by the Trustees who are not “interested persons” (as defined in the Investment Company Act of 1940, as amended (the “1940 Act”)) of the Funds (the “Independent Trustees”) voting separately. When used in this summary, “DoubleLine” refers collectively to DoubleLine Capital LP and/or to DoubleLine Alternatives LP, as appropriate in the context.
The Trustees’ determination to approve the continuation of each Advisory Agreement was made on the basis of each Trustee’s business judgment after an evaluation of all of the information provided to the Trustees, including information provided for their consideration at their February 2021 meeting with management and at meetings held in preparation for that February 2021 meeting, including portions held outside the presence of management, specifically to review and consider materials related to the proposed continuation of each Advisory Agreement. The Trustees meet regularly with investment advisory, compliance, risk management, operational, and other personnel from DoubleLine and regularly review detailed information, presented both orally and in writing, regarding the services performed by DoubleLine for the benefit of the Funds, DoubleLine’s investment program for each Fund, the performance of each Fund, the expense of each Fund, and the operations of each Fund. In considering whether to approve the continuation of the Advisory Agreements, the Trustees took into account information presented to them over the course of the past year.
This summary describes a number, but not necessarily all, of the most important factors considered by the Board and the Independent Trustees. Individual Trustees may have given different weights to certain factors and assigned various degrees of materiality to information received in connection with the approval process. No single factor was determined to be decisive. In all of their deliberations, the Independent Trustees were advised by independent counsel.
The Trustees considered the nature, extent, and quality of the services, including the expertise and experience of investment personnel, provided and expected to be provided by DoubleLine to each Fund. In this regard, the Trustees considered that DoubleLine provides a full investment program for the Funds, and noted DoubleLine’s representation that it seeks to provide attractive returns with a strong emphasis on risk management. The Board considered in particular the difficulty of managing debt-related portfolios, noting that managing such portfolios requires a portfolio management team to balance a number of factors, which may include, among others, securities of varying maturities and durations, actual and anticipated interest rate changes and volatility, prepayments, collateral management, counterparty management, pay-downs, credit events, workouts, and net new issuances. In their evaluation of the services provided by DoubleLine and the Funds’ contractual relationships with DoubleLine, the
Trustees considered generally the long-term performance record of the firm’s portfolio management personnel, including among others Mr. Jeffrey Gundlach, and the strong investor interest in products managed by DoubleLine.
The Trustees reviewed reports prepared by Strategic Insight (the “Strategic Insight Reports”), an Asset International Company (“Strategic Insight”), that compared, among other information, each Fund’s net management fee rate and net total expense ratio (Class I shares with respect to the open-end Funds) against the net management fee rate and net total expense ratio of a group of peers selected by Strategic Insight, and each Fund’s performance records (Class I shares with respect to the open-end Funds) for the one-year, three-year (where applicable), and five-year (where applicable) periods ended December 31, 2020 against the performance records of those funds in each Fund’s Morningstar category and the performance of the Fund’s broad-based benchmark index. The Independent Trustees met with Strategic Insight representatives to review the comparative information set out in the Strategic Insight Reports, the methodologies used by Strategic Insight in compiling those reports and the peer groups used within those reports, and considerations to weigh in evaluating the comparative information presented in those reports.
With respect to the comparative performance information in the Strategic Insight Reports, the Trustees considered, among other things, the specific factors cited by DoubleLine for any relative underperformance of the Funds. In this regard, the Trustees noted that many of the Funds underperformed either the average performance of the funds in their Morningstar categories and/or their benchmark index over one or more of the periods shown. The Independent Trustees considered DoubleLine’s explanation for each Fund’s relative underperformance, and noted DoubleLine’s explanation that the principal drivers of that underperformance included, among other things, some or all of the following: the poor relative performance of the mortgage-backed and other asset-backed securities held by a Fund in parts of 2020, a Fund’s significant underweight exposure to corporate bonds relative to its peers and/or its benchmark index, and a Fund’s shorter duration positioning relative to its peers and/or its benchmark index. The Trustees noted in this regard that those investment positions appeared generally consistent with DoubleLine’s long-term focus on structured products, such as mortgage-backed securities, as an integral component of its approach to fixed income investing and DoubleLine’s historical approach to risk management. The Trustees also considered information Strategic Insight and DoubleLine provided regarding differences in investment mandate, investment focus, and/or investment approach between a Fund and other funds in a Fund’s Morningstar category.
In addition, the Trustees reviewed and considered information that DoubleLine provides to them quarterly regarding each Fund’s relative performance for other measurement periods, including each Fund’s since inception performance. The Trustees noted that in the case of Funds with more than five years of investment operations the information DoubleLine provides quarterly includes performance information for a longer measuring period than the longest period shown in the Strategic Insight Reports. In evaluating that information, the Trustees took into account that that information was not prepared by Strategic Insight, nor was it prepared using the same methodologies as the Strategic Insight Reports, but they noted that the performance information for longer periods of time might better represent a Fund’s performance record over one or more full market cycles. The Trustees noted in this regard that a number of the Funds that had underperformed on a relative basis over one or more shorter periods of time shown in the Strategic Insight Reports had strong relative performance over the longer since-inception periods shown in the information DoubleLine provided to them as part of their regular quarterly materials for their February 2021 meeting.
The Trustees considered the portion of the Strategic Insight Reports covering the open-end Funds’ net management fees and net total expenses. As part of their review, the Trustees considered each open-end Fund’s net management fee rate relative to its expense peer group. The Trustees considered DoubleLine’s pricing policy for its advisory fees and that DoubleLine does not seek to be a lowest cost provider, nor does it have a policy to set its advisory fees below the median of a Fund’s peers. In respect of the three open-end Funds with net management fees that were in the fourth quartile of their expense groups, the Trustees considered, among other things, that significant differences exist between the Fund’s principal investment strategies and those of the bulk of the funds in its peer group, as in the case of DoubleLine Infrastructure Income Fund; DoubleLine’s demonstrated significant expertise and experience running the investment strategy over the long term, as in the case of DoubleLine Total Return Bond Fund; or the Fund’s strong relative long-term performance record as shown in the Strategic Insight Report, as in the case of DoubleLine Emerging Markets Fixed Income Fund. The Trustees noted also that, in each case, there were one or more funds in each of those Funds’ peer groups with higher net management fees and, in some cases, multiple funds with significantly higher net management fees.
The Trustees also considered the portion of the Strategic Insight Reports covering the open-end Funds’ net total expenses, noting that the reports showed that each open-end Fund, other than DoubleLine Emerging Markets Fixed Income Fund, DoubleLine Emerging Markets Local Currency Bond Fund, DoubleLine Floating Rate Fund, DoubleLine Infrastructure Income Fund, DoubleLine Multi-Asset Growth Fund, DoubleLine Strategic Commodity Fund, and DoubleLine Total Return Bond Fund, had a net total expense ratio in the first or second quartile of its expense peer group. The Trustees noted that DoubleLine Floating Rate Fund’s net total expense ratio was at exactly the median of its peer group, that DoubleLine Total Return Bond Fund’s net total expense ratio was
less than 1 basis point above the median of its peer group, and that DoubleLine Emerging Markets Local Currency Bond Fund’s net total expense ratio was 2 basis points above the median of its peer group. The Trustees noted that each of DoubleLine Infrastructure Income Fund, DoubleLine Multi-Asset Growth Fund, and DoubleLine Strategic Commodity Fund had net total expense ratios significantly below the high end of the range of their expense groups and had net total expense ratios below several other funds in their expense peer groups. The Trustees noted that only one Fund, DoubleLine Emerging Markets Fixed Income Fund, had a net total expense ratio that was in the fourth comparative quartile of its expense peer group and, in that respect, they noted that the Fund’s net total expense ratio was below a number of its peers and in line with several others, and they also took into account DoubleLine Emerging Markets Fixed Income Fund’s favorable longer-term performance, which was above the median of its Morningstar category for the three-year and five-year periods shown and above its benchmark index for the five-year period shown (the longest performance period shown for the Fund in the Strategic Insight Report).
As to DoubleLine Income Solutions Fund (“DSL”), the Trustees noted that DSL’s net total expense ratio was below the median of its expense peer group on both a net assets and a total managed assets basis and that its net management fee rate was below the median of its expense peer group on a total managed assets basis and above, though near, the median of its expense group on a net assets basis. In evaluating the comparative net management fee and net total expense ratios of DSL, the Trustees considered DSL’s first quartile relative performance over the longest period shown in the Strategic Insight Report and DoubleLine’s statement that the Fund’s fees reflect the experience and expertise DoubleLine brings to managing the Fund.
As to DoubleLine Yield Opportunities Fund (“DLY”), the Trustees noted that DLY had less than a year of performance history and that it had performed in the third quartile of its Morningstar peer group over the six-month period ended December 31, 2020 and above the median, though below the average, of its peer group for the three-month period ended December 31, 2020.
The Trustees compared DLY’s net management fees and net total expenses to two peer groups assembled by Strategic Insight: (1) a group of closed-end funds that had recently launched with organizational and offering expense arrangements similar to those of DLY (“Group A”) and (2) a group of leveraged closed-end bond funds, which had not necessarily adopted recent structural changes in the closed-end marketplace (or which were launched prior to when those changes began to be adopted) (“Group B”). The Trustees noted that DLY’s net management fee was above the median net management fee of Group A, though below a number of the funds in Group A, and that DLY’s net total expense ratio was equal to the median total expense ratio of Group A, in each case when measured against each fund’s net assets. The Trustees noted that DLY’s net management fee and net total expense ratio compared less favorably against the funds in Group A when measured by reference to total managed assets. In this regard the Strategic Insight Report showed that DLY had utilized lower levels of leverage relative to many of its Group A peers on the measuring date used for the Strategic Insight Report. The Trustees noted also that DLY’s net management fees were generally higher, and in some cases substantially higher, than the fees of the peer funds in Group B, though not unreasonably so in light of the risks that DoubleLine had assumed as DLY’s sponsor in line with recent structural changes in the closed-end marketplace, the complexity of the Fund’s investment strategies, and DoubleLine’s investment experience and expertise. In evaluating the comparative net management fee rate of DLY, the Trustees considered DoubleLine’s representation that it believes that DLY represents good value to shareholders, in light of the expertise and experience of DLY’s portfolio managers, Messrs. Gundlach and Sherman, with whom the Board was familiar.
The Trustees noted that each of DBL, DSL, and DLY had employed leverage during some or all of the period shown in the Strategic Insight Reports, and considered information from DoubleLine intended to show that each Fund’s use of leverage was accretive to the Fund’s investment performance, after taking into account any expenses related to the leverage, including incremental management fees.
The Trustees considered that DoubleLine provides a variety of other services to the Funds in addition to investment advisory services, including, among others, a number of back-office services, valuation services, compliance services, liquidity monitoring
services, certain forms of information technology services (such as internal reporting), assistance with accounting and distribution services, and supervision and monitoring of the Funds’ other service providers. The Trustees considered DoubleLine’s ongoing efforts to keep the Trustees informed about matters relevant to the Funds and their shareholders. The Trustees also considered the nature and structure of the Funds’ compliance program, including the policies and procedures of the Funds and their various service providers (including DoubleLine). The Trustees considered the quality of those non-investment advisory services and determined that their quality appeared to support the continuation of the Funds’ arrangements with DoubleLine.
The Trustees considered information provided by DoubleLine relating to its historical and continuing commitment to hire additional resources and to invest in technology enhancements to support DoubleLine’s ability to provide services to the Funds. The Trustees concluded that it appeared that DoubleLine continued to have sufficient quality and depth of personnel, resources, and investment methods.
The Trustees reviewed information as to general estimates of DoubleLine’s profitability with respect to each Fund, taking into account among other things information about both the direct and the indirect benefits to DoubleLine from managing the Funds. The Trustees considered information provided by DoubleLine as to the methods it uses, and the assumptions it makes, in calculating its profitability. The Trustees considered representations from DoubleLine that its compensation and incentive policies and practices enable DoubleLine to attract, retain, and motivate highly qualified and experienced employees. The Trustees noted that DoubleLine experienced significant profitability in respect of certain of the Funds, but noted that in those cases it would be appropriate to consider that profitability in light of various other considerations such as the nature, extent, and quality of the services provided by DoubleLine, the relative long-term performance of the relevant Funds, the consistency and transparency of the Funds’ investment operations over time, and the competitiveness of the management fees and total operating expenses of the Funds. The Trustees separately considered information regarding DoubleLine’s reinvestment in its business to maintain its ability to provide high-quality services to the Funds, and noted DoubleLine’s need to invest in technology, infrastructure, and staff to continue to provide services and accommodate changing regulatory requirements.
In their evaluation of economies of scale, the Trustees considered, among other things, the pricing of the Funds and DoubleLine’s reported profitability, and that a number of the open-end Funds had achieved significant size. They noted also that none of the Funds has breakpoints in its advisory fee schedule, though the Trustees considered management’s view that the fee schedules for the Funds remained consistent with DoubleLine’s original pricing philosophy of proposing an initial management fee rate that generally, when taking into account expense limitations (where applicable), reflects reasonably foreseeable economies of scale. In this regard, the Trustees noted also that the information provided by Strategic Insight supported the view that the net management fees of the largest open-end Funds remained fairly priced. The Trustees further noted that DoubleLine was subsidizing the expenses of a number of Funds with less scale, with the prospect of recouping those fees at a later date. In evaluating economies of scale more generally, the Trustees also noted ongoing changes to the regulatory environment, which required DoubleLine to re-invest in its business and infrastructure. On the basis of these factors and others, the Trustees concluded that it was not necessary at the present time to implement breakpoints for any of the Funds, although they would continue to consider the question periodically in the future.
With regard to DBL, DSL, and DLY, the Trustees noted that these Funds have not increased in assets significantly from their initial offerings due principally to their status as closed-end investment companies and that there were therefore no substantial increases in economies of scale realized with respect to these Funds since their inception. The Trustees noted DoubleLine’s view that the levels of its profitability in respect of DBL, DSL, and DLY are appropriate in light of the investment it has made in these Funds, the quality of the investment management and other teams provided by it, and its continued investments in its own business.
On the basis of these considerations as well as others and in the exercise of their business judgment, the Trustees determined that they were satisfied with the nature, extent, and quality of the services provided to each Fund under its Advisory Agreement(s); that it appeared that the management fees paid by each Fund to DoubleLine were generally within the range of management fees paid by its peer funds, and generally reasonable in light of the services provided, the quality of the portfolio management teams, and each Fund’s performance to date; that the fees paid by each Fund did not appear inappropriate in light of the fee schedules charged to DoubleLine’s other clients with substantially similar investment strategies (where applicable) in light of the differences in the services provided and the risks borne by DoubleLine; that the profitability of each Fund to DoubleLine did not appear excessive or such as to preclude continuation of the Fund’s Advisory Agreement; that absence of breakpoints in any Fund’s management fee did not render that Fund’s fee unreasonable or inappropriate under the circumstances, although the Trustees would continue to consider the topic over time; and that it would be appropriate to approve each Advisory Agreement for an additional one-year period.
At the February 18, 2021 meeting of the Board of Trustees (the “Trustees”) of DoubleLine Funds Trust (the “Trust”), the Trustees, including the Trustees who are not “interested persons” (as defined in the Investment Company Act of 1940, as amended) of the Trust (the “Independent Trustees”) voting separately, approved the Investment Management Agreement (the “Advisory Agreement”) between the Trust, on behalf of DoubleLine Multi-Asset Trend Fund (the “Fund”), and DoubleLine Alternatives LP (“DoubleLine Alternatives”), and the Investment Sub-Advisory Agreement (the “Sub-Advisory Agreement”) between DoubleLine Capital LP (“DoubleLine Capital”), DoubleLine Alternatives, and, solely with respect to Section 7 thereof, the Trust on behalf of the Fund. This summary describes a number, but not necessarily all, of the most important factors considered by the Trustees and the Independent Trustees. In this summary, the Sub-Advisory Agreement and the Advisory Agreement are sometimes referred to collectively as the “Agreements”; DoubleLine Capital and DoubleLine Alternatives are sometimes referred to collectively as the “Advisers” or “DoubleLine.”
The Trustees considered a wide range of materials, including information provided to the Trustees in connection with their duties as Trustees of the other funds within the Trust and in connection with their consideration of the renewal of the advisory contracts between the Advisers and the other funds within the Trust, which occurred at the same February 2021 meeting. The Trustees noted that their deliberations and conclusions may be informed, at least in part, by their other recent deliberations, as well as the information gathered over the course of the year. Individual Trustees may have given different weights to certain factors and assigned various degrees of materiality to information received in connection with the approval process. No single factor was determined to be decisive. In all of their deliberations, the Independent Trustees were advised by independent counsel.
The Trustees’ determination to approve the Agreements was based on an evaluation of all of the information provided to them. The Trustees noted that the Trust was proposed to be a party to the Sub-Advisory Agreement solely for purposes of providing the same indemnification by the Fund that DoubleLine Capital receives from other funds within the Trust when it serves directly as investment adviser to such funds. The Trustees noted that the non-fee terms of the Agreements were substantially similar to those of the investment management agreements in effect for the most recently launched funds within the Trust. The Trustees considered that, under the Sub-Advisory Agreement, DoubleLine Capital would manage the Fund’s fixed income portfolio as sub-adviser and provide other services related to that portion of the portfolio, and DoubleLine Alternatives would perform all other functions contemplated by the Advisory Agreement. In their evaluation of the services provided by DoubleLine and the Fund’s contractual relationships with DoubleLine, the Trustees considered generally the long-term performance record of the firm’s portfolio management personnel, including among others Mr. Jeffrey Gundlach, and the strong investor interest in products managed by DoubleLine.
The Trustees considered that the strategy of the Fund would be similar to that of DoubleLine Shiller Enhanced CAPE® (“CAPE”), DoubleLine Shiller Enhanced International CAPE® (together with CAPE, the “CAPE Funds”), and DoubleLine Colony Real Estate and Income Fund (the “Colony Fund”), in that the Fund’s investment portfolio would consist of fixed income investments, on the one hand, and exposure to an index – the BNP Paribas Multi-Asset Trend Index (the “Index”) – that DoubleLine Alternatives expected to achieve through swaps, on the other. The Trustees considered DoubleLine’s experience in managing the CAPE Funds and the Colony Fund and noted that the proposed portfolio managers of the Fund were the same as those of the CAPE Funds and the Colony Fund. The Trustees considered the qualifications, experience, and responsibilities of the proposed portfolio management team of the Fund and other key personnel who would be involved in the day-to-day investment activities of the Fund. The Trustees considered DoubleLine Capital’s experience in managing fixed income portfolios generally. They also considered the portfolio management team’s experience managing swaps, including index-based swaps, and DoubleLine’s experience more generally trading and valuing those instruments.
The Trustees considered that DoubleLine Alternatives would provide a variety of services to the Fund in addition to investment advisory services, including, among others, a number of back-office services, valuation services, compliance services, liquidity monitoring services, certain forms of information technology services (such as internal reporting), assistance with accounting and distribution services, and supervision and monitoring of the Fund’s other service providers. The Trustees also considered the nature, extent, and structure of the compliance procedures and the trading capabilities of DoubleLine Alternatives and DoubleLine Capital. The Trustees concluded that it appeared that the Advisers would have, or have available to them, sufficient quality and depth of personnel, resources, investment methods, and compliance policies and procedures to perform their duties under the proposed Agreements and that the nature, overall quality, and extent of the management services to be provided to the Fund appeared likely to be satisfactory and reliable. They also considered the possible effects of adding an additional fund to the Trust on the capacities of the Advisers.
The Trustees considered the proposed structure and level of the advisory fee to be paid under the Advisory Agreement and of the sub-advisory fee to be paid under the Sub-Advisory Agreement. The Trustees noted that the latter would be paid to DoubleLine Capital by DoubleLine Alternatives, not by the Fund directly. The Trustees considered that DoubleLine Alternatives anticipated launching the Fund with two classes of shares and noted the overall fee structure and expense caps proposed for the Fund. The Trustees considered comparative expense information (Class I shares) provided by Strategic Insight, an Asset International Company (“Strategic Insight”). The Independent Trustees met with representatives of Strategic Insight who had participated in the construction and analysis of the comparative expense peer group shown in the Strategic Insight report. In this regard, the Trustees considered Strategic Insight’s comments that it is somewhat difficult to develop an entirely suitable expense peer group for the Fund because of the distinctiveness of the Fund’s proposed principal investment strategy. The Trustees noted that the information provided by Strategic Insight indicated that the Fund’s proposed advisory fee under the Advisory Agreement was, on both a contractual basis and a net basis (after taking into account management fee waivers and/or fund expense reimbursements), the lowest in the peer group. The Trustees also noted that the information showed that the Fund’s anticipated net expense ratio for Class I shares, after taking into account the expense cap DoubleLine Alternatives proposed for the Fund, was the lowest in the peer group. In assessing the Fund’s proposed advisory fee and the expected net expense ratio against the information in the Strategic Insight report, the Trustees considered information that DoubleLine had provided with respect to the fees and expenses that would be incurred by the Fund in connection with the Fund’s swap investments and index exposures, which would reduce the Fund’s return on such investments and exposures but would not be reflected in the Fund’s net expense ratio.
The Trustees reviewed information as to general estimates of the Advisers’ profitability from managing the Fund during the proposed initial term, taking into account among other things information about both the direct and the indirect benefits to the Advisers. The Trustees considered information provided by the Advisers as to the methods they use, and the assumptions they make, in calculating their profitability. The Trustees also considered in this regard DoubleLine Alternatives’ significant investment in sponsoring, forming, registering, and promoting the Fund during its start-up period and the related risks of those activities. The Trustees noted other benefits that could potentially be received by the Advisers and their affiliates as a result of the Advisers’ relationship with the Fund, including possible ancillary benefits to the Advisers’ retail and institutional investment management businesses due to the reputation and potential market penetration of the Fund. The Trustees considered DoubleLine Alternatives’ representation that it had proposed an advisory fee designed to cause the Fund to have a competitive fee structure even at low asset levels and that, in DoubleLine Alternatives’ belief, the proposed advisory fee reflected reasonably foreseeable economies of scale that the Advisers might experience as the Fund’s assets grow at least through the proposed initial term. The Trustees considered that DoubleLine Alternatives was also implementing an expense cap for each share class of the Fund that would limit the overall expense ratio of the Fund during the proposed initial term of the Agreements. In light of all of the information evaluated, including relevant information received from the Advisers in prior meetings concerning other funds within the Trust, the Trustees concluded that the Advisers’ profit from managing the Fund would likely not be excessive during the proposed initial term and that it did not appear appropriate at this time to consider the implementation of breakpoints in the advisory fee.
The Trustees noted that due to tax rules applicable to companies seeking to qualify as regulated investment companies under the Internal Revenue Code of 1986, as amended, the Advisers had formed a subsidiary, DoubleLine Multi-Asset Trend Ltd. (“Multi-Asset Trend Ltd.”), wholly owned by the Fund and organized as a Cayman Islands exempted company, in order to obtain the Fund’s desired investment exposure without eliminating the Fund’s ability to qualify as a regulated investment company. The Trustees evaluated the investment management agreement between Multi-Asset Trend Ltd. and DoubleLine Alternatives in the same manner as they had considered the Advisory Agreement for the Fund.
On the basis of these considerations and others and in the exercise of their business judgment, the Trustees determined to approve the Agreements for the proposed initial term.
The Funds have adopted a liquidity risk management program. The program’s principal objectives include mitigating the risk that a Fund is unable to meet its redemption obligations timely and supporting each Fund’s compliance with its limits on investments in illiquid assets. For the fiscal year ended March 31, 2021, the program administrator determined that the program supported each Fund’s ability to honor redemption requests timely and the Adviser’s management of each Fund’s liquidity profile. The program includes a number of elements that support the assessment and management of liquidity risk, including the periodic classification and re-classification of a Fund’s investments into groupings based on the Adviser’s view of their liquidity. There can be no assurance that the program will achieve its objectives. Please refer to your Fund’s prospectus for more information regarding the Fund’s exposure to liquidity risk and other risks to which an investment in the Fund may be subject.
For the fiscal year ended March 31, 2021, certain dividends paid by the Funds may be subject to a maximum tax rate of 15% (20% for taxpayers with taxable income greater than $425,800 for single individuals and $479,000 for married couples filing jointly), as provided for by the Jobs and Growth Tax Relief Reconciliation Act of 2003 and The Tax Cuts and Jobs Act of 2017. The percentage of dividends declared from ordinary income designated as qualified dividend income was as follows:
For corporate shareholders, the percent of ordinary income distributions qualifying for the corporate dividends received deduction for the fiscal year ended March 31, 2021 was as follows:
The percentage of taxable ordinary income distributions that are designated as short-term capital gain distributions under Internal Revenue Section 871(k)(2)(c) for the fiscal year ended March 31, 2021 for each Fund was as follows:
The percentage of taxable ordinary income distributions that are designated as interest related dividends under Internal Revenue Section 871(k)(1)(c) for the fiscal year ended March 31, 2021 for each Fund was as follows:
For the fiscal year ended March 31, 2021 each fund earned foreign source income and paid foreign taxes, which each intend to pass through to its shareholders pursuant to Section 853 of the Internal Revenue Code as follows:
Shareholders are advised to consult their own tax adviser with respect to the tax consequences of their investment in the Funds.
Each of the following Trustees is an interested person of the Trust as defined in the 1940 Act because they are officers of the Adviser and hold direct or indirect ownership interests in DoubleLine Capital LP and DoubleLine Alternatives LP. Additionally, Mr. Redell is an officer of the Trust.
Information about how a Fund voted proxies relating to portfolio securities held during the most recent twelve month period ended June 30th is available no later than the following August 31st without charge, upon request, by calling 877-DLine11 (877-354-6311) and on the Securities and Exchange Commission’s (the “SEC”) website at www.sec.gov.
A description of the Funds’ proxy voting policies and procedures is available (i) without charge, upon request, by calling 877-DLine11 (877-354-6311); and (ii) on the SEC’s website at www.sec.gov.
It is the policy of the Trust to provide certain unaudited information regarding the portfolio composition of the Funds as of month-end to shareholders and others upon request to the Funds, beginning on the 15th calendar day after the end of the month (or, if not a business day, the next business day thereafter).
Shareholders and others who wish to obtain portfolio holdings for a particular month may make a request by contacting the Funds at no charge at 877-DLine11 (877-354-6311) between the hours of 7:00 a.m. and 5:00 p.m. Pacific time, Monday through Friday, beginning on the 15th day following the end of that month (or, if not a business day, the next business day thereafter). Requests for portfolio holdings may be made on a monthly basis pursuant to this procedure, or standing requests for portfolio holdings may be accepted.
The Trust is required to file its complete schedule of portfolio holdings with the SEC for its first and third fiscal quarters on Part F of Form N-PORT. When available, Part F of Form N-PORT is available on the SEC website at www.sec.gov.
This report includes summary Schedules of Investments for the DoubleLine Total Return Bond Fund, DoubleLine Core Fixed Income Fund, DoubleLine Shiller Enhanced CAPE® and DoubleLine Flexible Income Fund. A complete Schedule of Investments for each Fund may be obtained, without charge, upon request, by calling 877-DLine11 (877-354-6311) and on the SEC website at www.sec.gov.
In an effort to conserve resources, the Funds intend to reduce the number of duplicate Prospectuses and Annual and Semi-Annual Reports you receive by sending only one copy of each to addresses where we reasonably believe two or more accounts are from the same family. If you would like to discontinue householding of your accounts, please call toll-free 877-DLine11 (877-354-6311) to request individual copies of these documents. We will begin sending individual copies thirty days after receiving your request to stop householding.
This notice provides information about how DoubleLine (“we” and “our”) collects, shares, and protects your personal information, and how you might choose to limit our ability to share certain information about you. Please read this notice carefully.
All financial companies need to share customers’ personal information to run their everyday businesses, to appropriately tailor the services offered to you (where applicable), and to comply with our regulatory obligations. Accordingly, information, confidential and proprietary, plays an important role in the success of our business. However, we recognize that you have entrusted us with your personal and financial data, and we recognize our obligation to keep this information secure. Maintaining your privacy is important to us, and we hold ourselves to a high standard in its safekeeping and use. Most importantly, DoubleLine does not sell its customers’ non-public personal information to any third parties. DoubleLine uses its customers’ non-public personal information primarily to complete financial transactions that its customers request (where applicable), to make its customers aware of other financial products and services offered by a DoubleLine affiliated company, and to satisfy obligations we owe to regulatory bodies.
Websites maintained by DoubleLine or its service providers may use a variety of technologies to collect information that help DoubleLine and its service providers understand how the website is used. Information collected from your web browser (including small files stored on your device that are commonly referred to as “cookies”) allow the websites to recognize your web browser and help to personalize and improve your user experience and enhance navigation of the website. You can change your cookie preferences by changing the setting on your web browser to delete or reject cookies. If you delete or reject cookies, some website pages may not function properly. Our websites may contain links that are maintained or controlled by third parties, each of which has privacy policies which may differ, in some cases significantly, from the privacy policies described in this notice. Please read the privacy policies of such third parties and understand that accessing their website is at your own risk. Please contact your DoubleLine representative if you would like to receive more information about the privacy policies of third parties.
We also use web analytics services, which currently include but are not limited to Google Analytics and Adobe Analytics. Such web analytics services use cookies and similar technologies to evaluate visitor’s use of the domain, compile statistical reports on domain activity, and provide other services related to our websites. For more information about Google Analytics, or to opt out of Google Analytics, please go to https://tools.google. com/dlpage/gaoptout. For more information about Adobe Analytics, or to opt out of Adobe Analytics, please go to: http://www.adobe.com/privacy/opt-out.html.
We will limit access to your personal account information to those agents and vendors who need to know that information to provide products and services to you. Your information is not provided by us to nonaffiliated third parties for marketing purposes. We maintain physical, electronic, and procedural safeguards to guard your non-public personal information.
DoubleLine collects and uses information that identifies, describes, references, links or relates to, or is associated with, a particular consumer or device (“Personal Information”). Personal Information we collect from our customers, website visitors and consumers is covered under the Gramm-Leach-Bliley Act and is therefore excluded from the scope of the California Consumer Privacy Act.
If you reside in the EEA, we may transfer your personal information outside the EEA, and will ensure that it is protected and transferred in a manner consistent with legal requirements applicable to the information. This can be done in a number of different ways, for instance:
In other circumstances, the law may permit us to otherwise transfer your personal information outside the EEA. In all cases, however, any transfer of your personal information will be compliant with applicable data protection law.
We will undertake commercially reasonable efforts to protect the personal information that we hold with appropriate security measures.
Depending on your country of domicile, you may have the following rights in respect of the personal information about you that we process:
Although you have the right to request that your personal information be deleted at any time, applicable laws or regulatory requirements may prohibit us from doing so. If you are an investor in the DoubleLine funds, certain of the rights described above that may apply to direct clients of DoubleLine domiciled or resident outside the United States will not apply to you. In addition, if you invest in a DoubleLine fund through a financial intermediary, DoubleLine may not have access to personal information about you.
If you wish to exercise any of the rights set out above, please contact privacy@doubleline.com.
As required by U.S. federal law, DoubleLine will notify customers of DoubleLine’s Privacy Policy annually. DoubleLine reserves the right to modify its privacy policy at any time, but in the event that there is a change, that affects the content of this notice materially, DoubleLine will promptly inform its customers of that change, in accordance with applicable law.
U.S. Bancorp Fund Services, LLC
P.O. Box 701
U.S. Bank, N.A.
(b) Not Applicable.
The registrant has adopted a code of ethics that applies to the registrant’s principal executive officer and principal financial officer. The registrant has not made any substantive amendments to its code of ethics during the period covered by this report. The registrant has not granted any waivers from any provisions of the code of ethics during the period covered by this report. A copy of the registrant’s Code of Ethics is filed herewith.
The registrant’s board of trustees has determined that there is at least one audit committee financial expert serving on its audit committee. Raymond B. Woolson is the “audit committee financial expert” and is considered to be “independent” as each term is defined in Item 3 of Form N-CSR.
The registrant has engaged its principal accountant to perform audit services, audit-related services, tax services and other services during the past two fiscal years. “Audit services” refer to performing an audit of the registrant’s annual financial statements or services that are normally provided by the accountant in connection with statutory and regulatory filings or engagements for those fiscal years. “Audit-related services” refer to the assurance and related services by the principal accountant that are reasonably related to the performance of the audit. “Tax services” refer to professional services rendered by the principal accountant for tax compliance, tax advice, and tax planning. There were no “Other services” provided by the principal accountant. The following table details the aggregate fees billed or expected to be billed for each of the last two fiscal years for audit fees, audit-related fees, tax fees and other fees by the principal accountant.
(f) All of the principal accountant’s hours spent on auditing the registrant’s financial statements were attributed to work performed by full-time permanent employees of the principal accountant.
(h) The audit committee of the board of trustees/directors has considered whether the provision of non-audit services that were rendered to the registrant’s investment adviser is compatible with maintaining the principal accountant’s independence and has concluded that the provision of such non-audit services by the accountant has not compromised the accountant’s independence.
The registrant has not been identified by the U.S. Securities and Exchange Commission as having filed an annual report issued by a registered public accounting firm branch or office that is located in a foreign jurisdiction where the Public Company Accounting Oversight Board is unable to inspect or completely investigate because of a position taken by an authority in that jurisdiction.
The registrant is not a foreign issuer.
The information required by this Item 6 (except with respect to the DoubleLine Total Return Bond Fund, DoubleLine Core Fixed Income Fund, DoubleLine Shiller Enhanced CAPE Fund, and DoubleLine Flexible Income Fund) is included as part of the annual report to shareholders filed under Item 1 of this Form N-CSR.
Please note that the Registrant has included a summary schedule of portfolio securities of the DoubleLine Total Return Bond Fund, DoubleLine Core Fixed Income Fund, DoubleLine Shiller Enhanced CAPE Fund, and DoubleLine Flexible Income Fund in its annual report to shareholders, a copy of which is included under Item 1, for this reporting period. The DoubleLine Total Return Bond Fund’s, DoubleLine Core Fixed Income Fund’s, DoubleLine Shiller Enhanced CAPE Fund’s, and DoubleLine Flexible Income Fund’s complete schedule of investments in securities of unaffiliated issuers as of the close of this period as set forth in Section 210.12-12 of Regulation S-X is set forth below:
| | | | | | | | | | | | | | |
Principal Amount $/Shares | | Security Description | | Rate | | | Maturity | | | Value $ | |
Asset Backed Obligations - 4.9% | | | | | | | | | |
3,596,243 | | AASET Ltd., Series 2018-1A-B | | | 5.44 | % (a) | | | 01/16/2038 | | | | 3,434,448 | |
35,073,570 | | AASET Ltd., Series 2019-2-A | | | 3.38 | % (a) | | | 10/16/2039 | | | | 35,169,216 | |
24,522,865 | | AASET Trust, Series 2020-1A-A | | | 3.35 | % (a) | | | 01/16/2040 | | | | 24,472,078 | |
45,000,000 | | Affirm Asset Securitization Trust, Series 2020-A-A | | | 2.10 | % (a) | | | 02/18/2025 | | | | 45,502,627 | |
9,148,976 | | Affirm Asset Securitization Trust, Series 2020-Z1-A | | | 3.46 | % (a) | | | 10/15/2024 | | | | 9,275,234 | |
12,787,647 | | Affirm Asset Securitization Trust, Series 2020-Z2-A | | | 1.90 | % (a) | | | 01/15/2025 | | | | 12,925,856 | |
7,774,334 | | Aqua Finance Trust, Series 2017-A-A | | | 3.72 | % (a) | | | 11/15/2035 | | | | 8,002,313 | |
21,500,000 | | Bojangles LLC, Series 2020-1A-A2 | | | 3.83 | % (a) | | | 10/20/2050 | | | | 22,542,954 | |
44,030,088 | | Business Jet Securities LLC, Series 2020-1A-A | | | 2.98 | % (a) | | | 11/15/2035 | | | | 44,505,613 | |
45,481,250 | | CAL Funding IV Ltd., Series 2020-1A-A | | | 2.22 | % (a) | | | 09/25/2045 | | | | 45,679,603 | |
35,535,714 | | Castlelake Aircraft Securitization Trust, Series 2016-1-A | | | 4.45 | % | | | 08/15/2041 | | | | 35,665,242 | |
67,194,974 | | Castlelake Aircraft Securitization Trust, Series 2017-1-A | | | 3.97 | % | | | 07/15/2042 | | | | 67,420,615 | |
7,871,157 | | Castlelake Aircraft Securitization Trust, Series 2018-1-A | | | 4.13 | % (a) | | | 06/15/2043 | | | | 7,907,324 | |
26,950,722 | | CLI Funding LLC, Series 2019-1A-A | | | 3.71 | % (a) | | | 05/18/2044 | | | | 27,105,829 | |
19,270,000 | | CLI Funding LLC, Series 2020-1A-A | | | 2.08 | % (a) | | | 09/18/2045 | | | | 19,261,059 | |
4,046,502 | | CLUB Credit Trust, Series 2017-P2-C | | | 4.91 | % (a) | | | 01/15/2024 | | | | 4,078,999 | |
12,315,188 | | Coinstar Funding LLC, Series 2017-1A-A2 | | | 5.22 | % (a) | | | 04/25/2047 | | | | 12,374,532 | |
1,513,817 | | Commonbond Student Loan Trust, Series 2015-A-A | | | 3.20 | % (a) | | | 06/25/2032 | | | | 1,518,862 | |
5,033,971 | | Commonbond Student Loan Trust, Series 2016-A-A1 | | | 3.32 | % (a) | | | 05/25/2040 | | | | 5,173,550 | |
647,327 | | Consumer Installment Loan Trust, Series 2018-6-PT | | | 7.84 | % (a)(b) | | | 06/17/2041 | | | | 629,060 | |
15,543,184 | | Credit Suisse ABS Trust, Series 2020-AT1-A | | | 2.61 | % (a) | | | 10/15/2026 | | | | 15,871,922 | |
39,300,000 | | DataBank Issuer, Series 2021-1A-A2 | | | 2.06 | % (a) | | | 02/27/2051 | | | | 39,169,799 | |
7,880,000 | | DB Master Finance LLC, Series 2019-1A-A2I | | | 3.79 | % (a) | | | 05/20/2049 | | | | 8,078,109 | |
26,322,133 | | Dividend SLR, Series 2019-1-A | | | 3.67 | % (a) | | | 08/22/2039 | | | | 27,847,203 | |
36,877,500 | | Domino’s Pizza Master Issuer LLC, Series 2019-1A-A2 | | | 3.67 | % (a) | | | 10/25/2049 | | | | 38,863,597 | |
2,452,832 | | Earnest Student Loan Program LLC, Series 2016-B-A2 | | | 3.02 | % (a) | | | 05/25/2034 | | | | 2,455,883 | |
3,224,867 | | Earnest Student Loan Program LLC, Series 2016-D-A2 | | | 2.72 | % (a) | | | 01/25/2041 | | | | 3,232,784 | |
34,526,312 | | ECAF Ltd., Series 2015-1A-A2 | | | 4.95 | % (a) | | | 06/15/2040 | | | | 32,818,986 | |
4,339,476 | | Falcon Aerospace Ltd., Series 2017-1-A | | | 4.58 | % (a) | | | 02/15/2042 | | | | 4,411,677 | |
1,066,129 | | Foundation Finance Trust, Series 2016-1A-A | | | 3.96 | % (a) | | | 06/15/2035 | | | | 1,074,660 | |
6,466,639 | | Foundation Finance Trust, Series 2019-1A-A | | | 3.86 | % (a) | | | 11/15/2034 | | | | 6,695,243 | |
24,769,338 | | GAIA Aviation Ltd., Series 2019-1-A | | | 3.97 | % (a)(c) | | | 12/15/2044 | | | | 24,713,830 | |
31,611,368 | | Global SC Finance SRL, Series 2020-1A-A | | | 2.17 | % (a) | | | 10/17/2040 | | | | 31,737,839 | |
23,084,540 | | Harbour Aircraft Investments Ltd., Series 2017-1-A | | | 4.00 | % | | | 11/15/2037 | | | | 22,317,510 | |
4,266,783 | | HERO Funding Trust, Series 2016-3A-A2 | | | 3.91 | % (a) | | | 09/20/2042 | | | | 4,412,831 | |
10,818,503 | | HERO Funding Trust, Series 2016-4A-A2 | | | 4.29 | % (a) | | | 09/20/2047 | | | | 11,290,891 | |
3,150,000 | | Hertz Vehicle Financing II LP, Series 2019-2A-B | | | 3.67 | % (a) | | | 05/25/2025 | | | | 3,158,857 | |
12,226,377 | | Horizon Aircraft Finance Ltd., Series 2018-1-A | | | 4.46 | % (a) | | | 12/15/2038 | | | | 12,433,321 | |
26,487,057 | | Horizon Aircraft Finance Ltd., Series 2019-1-A | | | 3.72 | % (a) | | | 07/15/2039 | | | | 26,363,177 | |
47,640,000 | | JACK, Series 2019-1A-A23 | | | 4.97 | % (a) | | | 08/25/2049 | | | | 51,352,052 | |
10,550,000 | | Jersey Mike’s Funding, Series 2019-1A-A2 | | | 4.43 | % (a) | | | 02/15/2050 | | | | 11,206,713 | |
56,114,750 | | Jimmy Johns Funding LLC, Series 2017-1A-A2II | | | 4.85 | % (a) | | | 07/30/2047 | | | | 59,586,727 | |
21,278,849 | | JOL Air Ltd., Series 2019-1-A | | | 3.97 | % (a) | | | 04/15/2044 | | | | 21,459,144 | |
7,148,098 | | Kestrel Aircraft Funding Ltd., Series 2018-1A-A | | | 4.25 | % (a) | | | 12/15/2038 | | | | 7,178,127 | |
70,971,141 | | Labrador Aviation Finance Ltd., Series 2016-1A-A1 | | | 4.30 | % (a) | | | 01/15/2042 | | | | 70,114,732 | |
11,950,867 | | LendingClub Receivables Trust, Series 2020-3-A | | | 3.50 | % (a) | | | 01/16/2046 | | | | 12,124,632 | |
16,560,251 | | LendingClub Receivables Trust, Series 2020-5A-A | | | 3.50 | % (a) | | | 03/15/2046 | | | | 16,698,036 | |
1,950,000 | | Loanpal Solar Loan Ltd., Series 2021-1GS-B | | | 2.84 | % (a) | | | 01/20/2048 | | | | 1,914,643 | |
15,184,788 | | Lunar Aircraft Ltd., Series 2020-1A-A | | | 3.38 | % (a) | | | 02/15/2045 | | | | 14,932,629 | |
194,050 | | Marlette Funding Trust, Series 2018-4A-A | | | 3.71 | % (a) | | | 12/15/2028 | | | | 194,282 | |
21,836,005 | | Mosaic Solar Loan Trust, Series 2017-2A-A | | | 3.82 | % (a) | | | 06/22/2043 | | | | 23,531,232 | |
12,693,957 | | Mosaic Solar Loan Trust, Series 2018-1A-A | | | 4.01 | % (a) | | | 06/22/2043 | | | | 13,718,836 | |
16,003,424 | | Mosaic Solar Loan Trust, Series 2018-2GS-A | | | 4.20 | % (a) | | | 02/22/2044 | | | | 17,443,940 | |
2,742,055 | | Mosaic Solar Loan Trust, Series 2019-1A-A | | | 4.37 | % (a) | | | 12/21/2043 | | | | 3,004,536 | |
23,000,000 | | Navient Private Education Loan Trust, Series 2017-A-B | | | 3.91 | % (a) | | | 12/16/2058 | | | | 23,513,675 | |
30,000,000 | | Navient Private Education Loan Trust, Series 2018-BA-B | | | 4.13 | % (a) | | | 12/15/2059 | | | | 30,510,816 | |
15,800,000 | | Neighborly Issuer LLC, Series 2021-1A-A2 | | | 3.58 | % (a) | | | 04/30/2051 | | | | 15,934,338 | |
6,308,301 | | Newtek Small Business Loan Trust, Series 2018-1-A (Prime Rate—0.55%) | | | 2.70 | % (a) | | | 02/25/2044 | | | | 6,162,332 | |
5,719,829 | | OneMain Financial Issuance Trust, Series 2017-1A-A1 | | | 2.37 | % (a) | | | 09/14/2032 | | | | 5,729,301 | |
12,500,000 | | Oxford Finance Funding LLC, Series 2019-1A-A2 | | | 4.46 | % (a) | | | 02/15/2027 | | | | 12,952,522 | |
47,452,734 | | Pioneer Aircraft Finance Ltd., Series 2019-1-A | | | 3.97 | % (a) | | | 06/15/2044 | | | | 47,288,073 | |
17,345,438 | | Primose Funding LLC, Series 2019-1A-A2 | | | 4.48 | % (a) | | | 07/30/2049 | | | | 17,757,947 | |
17,658,390 | | Prosper Trust, Series 2019-ST1-A | | | 4.50 | % (a) | | | 07/15/2025 | | | | 17,934,356 | |
19,245,770 | | Raptor Aircraft Finance LLC, Series 2019-1-A | | | 4.21 | % (a) | | | 08/23/2044 | | | | 18,353,306 | |
11,789,466 | | Renew, Series 2017-2A-A | | | 3.22 | % (a) | | | 09/22/2053 | | | | 12,021,459 | |
46,171,285 | | Sapphire Aviation Finance Ltd., Series 2020-1A-A | | | 3.23 | % (a) | | | 03/15/2040 | | | | 45,998,974 | |
16,832,409 | | Sapphire Aviation Finance Ltd., Series 2020-1A-B | | | 4.34 | % (a) | | | 03/15/2040 | | | | 15,868,670 | |
24,000,000 | | SBA Tower Trust | | | 1.88 | % (a) | | | 01/15/2026 | | | | 24,322,562 | |
9,330,000 | | ServiceMaster Funding LLC, Series 2020-1-A2II | | | 3.34 | % (a) | | | 01/30/2051 | | | | 9,583,659 | |
26,900,100 | | Shenton Aircraft Investment Ltd., Series 2015-1A-A | | | 4.75 | % (a) | | | 10/15/2042 | | | | 26,733,589 | |
8,000,493 | | Sierra Timeshare Receivables Funding LLC, Series 2020-2A-B | | | 2.32 | % (a) | | | 07/20/2037 | | | | 8,153,331 | |
4,463,891 | | Sierra Timeshare Receivables Funding LLC, Series 2020-2A-C | | | 3.51 | % (a) | | | 07/20/2037 | | | | 4,605,646 | |
7,575,756 | | SLM Private Credit Student Loan Trust, Series 2006-A-A5 (3 Month LIBOR USD + 0.29%) | | | 0.47 | % | | | 06/15/2039 | | | | 7,409,974 | |
5,857,742 | | SLM Private Credit Student Loan Trust, Series 2006-B-A5 (3 Month LIBOR USD + 0.27%) | | | 0.45 | % | | | 12/15/2039 | | | | 5,743,758 | |
33,710,710 | | SLVRR, Series 2019-1-A | | | 3.97 | % (a) | | | 07/15/2044 | | | | 33,667,156 | |
87,582,683 | | SoFi Alternative Trust, Series 2021-A-PT1 | | | 1.48 | % (a)(b) | | | 03/15/2047 | | | | 87,155,017 | |
70,829,439 | | SoFi Alternative Trust, Series 2021-A-PT2 | | | 1.48 | % (a)(b) | | | 03/15/2047 | | | | 70,483,579 | |
38,895,973 | | SoFi Alternative Trust, Series 2021-B-PT1 | | | 1.76 | % (a)(b) | | | 02/15/2047 | | | | 39,162,060 | |
49,854,031 | | SoFi Alternative Trust, Series 2021-B-PT2 | | | 1.76 | % (a)(b) | | | 02/15/2047 | | | | 50,195,082 | |
432,529 | | SoFi Consumer Loan Program LLC, Series 2016-1-A | | | 3.26 | % (a) | | | 08/25/2025 | | | | 433,349 | |
1,463,330 | | SoFi Consumer Loan Program Trust, Series 2017-5-A2 | | | 2.78 | % (a) | | | 09/25/2026 | | | | 1,471,229 | |
4,146,437 | | SoFi Professional Loan Program, Series 2016-A-A2 | | | 2.76 | % (a) | | | 12/26/2036 | | | | 4,208,502 | |
20,000,000 | | SoFi Professional Loan Program, Series 2017-E-B | | | 3.49 | % (a) | | | 11/26/2040 | | | | 20,734,012 | |
13,000,000 | | SoFi Professional Loan Program, Series 2017-E-C | | | 4.16 | % (a) | | | 11/26/2040 | | | | 13,570,934 | |
22,800,000 | | SoFi Professional Loan Program, Series 2018-A-B | | | 3.61 | % (a) | | | 02/25/2042 | | | | 23,866,502 | |
18,000,000 | | SoFi Professional Loan Program, Series 2018-B-BFX | | | 3.83 | % (a) | | | 08/25/2047 | | | | 18,888,169 | |
29,528,999 | | Springleaf Funding Trust, Series 2017-AA-A | | | 2.68 | % (a) | | | 07/15/2030 | | | | 29,615,962 | |
23,918,358 | | Sprite Ltd., Series 2017-1-A | | | 4.25 | % (a) | | | 12/15/2037 | | | | 24,291,437 | |
218,320 | | Spruce Asset Backed Securities Trust, Series 2016-E1-A | | | 4.32 | % (a) | | | 06/15/2028 | | | | 220,607 | |
19,790,000 | | Stack Infrastructure Issuer LLC, Series 2020-1A-A2 | | | 1.89 | % (a) | | | 08/25/2045 | | | | 19,867,401 | |
22,357,719 | | Start Ltd., Series 2018-1-A | | | 4.09 | % (a) | | | 05/15/2043 | | | | 22,461,481 | |
42,556,273 | | Sunbird Engine Finance LLC, Series 2020-1A-A | | | 3.67 | % (a) | | | 02/15/2045 | | | | 41,442,278 | |
13,602,552 | | Sunnova Helios Issuer LLC, Series 2018-1A-A | | | 4.87 | % (a) | | | 07/20/2048 | | | | 14,635,331 | |
15,670,070 | | Sunnova Helios Issuer LLC, Series 2019-AA-A | | | 3.75 | % (a) | | | 06/20/2046 | | | | 16,841,903 | |
31,172,009 | | Sunnova Sol Issuer LLC, Series 2020-2A-A | | | 2.73 | % (a) | | | 11/01/2055 | | | | 31,253,524 | |
47,382,065 | | Sunnova Sol LLC, Series 2020-1A-A | | | 3.35 | % (a) | | | 02/01/2055 | | | | 48,756,032 | |
32,511,650 | | Taco Bell Funding LLC, Series 2018-1A-A2I | | | 4.32 | % (a) | | | 11/25/2048 | | | | 32,808,114 | |
18,950,000 | | TAL Advantage VII LLC, Series 2020-1A-A | | | 2.05 | % (a) | | | 09/20/2045 | | | | 18,956,077 | |
4,026,875 | | TAL Advantage VII LLC, Series 2020-1A-B | | | 3.82 | % (a) | | | 09/20/2045 | | | | 4,010,217 | |
12,209,711 | | Textainer Marine Containers Ltd., Series 2020-1A-A | | | 2.73 | % (a) | | | 08/21/2045 | | | | 12,441,739 | |
10,247,030 | | Textainer Marine Containers Ltd., Series 2020-2A-A | | | 2.10 | % (a) | | | 09/20/2045 | | | | 10,293,789 | |
3,337,125 | | Textainer Marine Containers Ltd., Series 2020-2A-B | | | 3.34 | % (a) | | | 09/20/2045 | | | | 3,321,269 | |
6,015,350 | | Upgrade Master Pass-Thru Trust, Series 2019-ST2-A | | | 3.90 | % (a) | | | 09/15/2025 | | | | 6,083,118 | |
28,221,061 | | Upgrade Master Pass-Thru Trust, Series 2021-PT1-A | | | 8.12 | % (a) | | | 04/15/2027 | | | | 28,385,392 | |
20,000,000 | | Upgrade Master Pass-Thru Trust, Series 2021-PT3-A | | | 5.72 | % (a) | | | 06/15/2027 | | | | 20,122,780 | |
9,931,286 | | Upgrade Receivables Trust, Series 2019-1A-C | | | 5.15 | % (a) | | | 03/15/2025 | | | | 9,986,066 | |
23,010,753 | | Upstart Pass-Through Trust, Series 2020-ST5-A | | | 3.00 | % (a) | | | 12/20/2026 | | | | 23,124,886 | |
17,936,432 | | Upstart Pass-Through Trust, Series 2021-ST1-A | | | 2.75 | % (a) | | | 02/20/2027 | | | | 18,108,575 | |
14,432,976 | | Upstart Securitization Trust, Series 2020-2-A | | | 2.31 | % (a) | | | 11/20/2030 | | | | 14,547,441 | |
18,453,125 | | Vantage Data Centers Issuer LLC, Series 2019-1A-A2 | | | 3.19 | % (a) | | | 07/15/2044 | | | | 19,245,232 | |
32,425,000 | | Vantage Data Centers Issuer LLC, Series 2020-2A-A2 | | | 1.99 | % (a) | | | 09/15/2045 | | | | 31,928,606 | |
17,997,890 | | Vivint Solar Financing LLC, Series 2018-1A-A | | | 4.73 | % (a) | | | 04/30/2048 | | | | 19,383,734 | |
22,637,440 | | VR Funding LLC, Series 2020-1A-A | | | 2.79 | % (a) | | | 11/15/2050 | | | | 22,231,860 | |
34,965,397 | | Waterfall Commercial Mortgage Trust, Series 2015-SBC5-A | | | 4.10 | % (a)(b) | | | 09/14/2022 | | | | 35,684,380 | |
6,688,748 | | Wave LLC, Series 2019-1-A | | | 3.60 | % (a) | | | 09/15/2044 | | | | 6,722,446 | |
20,107,500 | | Wendy’s Funding LLC, Series 2019-1A-A2II | | | 4.08 | % (a) | | | 06/15/2049 | | | | 21,297,229 | |
1,254,975 | | Westlake Automobile Receivables Trust, Series 2019-2A-A2A | | | 2.57 | % (a) | | | 02/15/2023 | | | | 1,257,944 | |
49,828,887 | | Willis Engine Structured Trust, Series 2020-A-A | | | 3.23 | % (a) | | | 03/15/2045 | | | | 47,964,040 | |
10,500,000 | | Wingstop Funding LLC, Series 2020-1A-A2 | | | 2.84 | % (a) | | | 12/05/2050 | | | | 10,687,618 | |
14,508,312 | | Zephyrus Capital Aviation Partners Ltd., Series 2018-1-A | | | 4.61 | % (a) | | | 10/15/2038 | | | | 14,392,086 | |
| | | | | | | | | | | | | | |
Total Asset Backed Obligations (Cost $2,447,520,430) | | | | | | | | 2,476,837,867 | |
| | | | | | | | | | | | | | |
Bank Loans—0.1% | | | | | | | | | | | | |
11,146,667 | | Aligned Energy LLC | | | 3.33 | % (d)(l) | | | 09/02/2023 | | | | 11,146,667 | |
26,853,333 | | Aligned Energy LLC, Senior Secured First Lien Term Loan (3 Month LIBOR USD + 3.25%, 0.75% Floor) | | | 3.96 | % | | | 09/02/2023 | | | | 26,853,333 | |
| | | | | | | | | | | | | | |
Total Bank Loans (Cost $38,000,000) | | | | | | | | 38,000,000 | |
| | | | | | | | | | | | | | |
Collateralized Loan Obligations—3.0% | | | | | | | | | | | | |
10,000,000 | | AGL Ltd., Series 2020-5A-B (3 Month LIBOR USD + 2.78%, 2.78% Floor) | | | 3.00 | % (a) | | | 07/20/2030 | | | | 10,040,792 | |
2,000,000 | | Anchorage Capital Ltd., Series 2014-3RA-B (3 Month LIBOR USD + 1.50%) | | | 1.72 | % (a) | | | 01/28/2031 | | | | 1,999,437 | |
36,000,000 | | Anchorage Capital Ltd., Series 2018-10A-A1A (3 Month LIBOR USD + 1.20%, 1.20% Floor) | | | 1.44 | % (a) | | | 10/15/2031 | | | | 35,948,966 | |
3,000,000 | | Apidos Ltd., Series 2013-12A-CR (3 Month LIBOR USD + 1.80%) | | | 2.04 | % (a) | | | 04/15/2031 | | | | 2,977,382 | |
35,000,000 | | Assurant Ltd., Series 2018-3A-A (3 Month LIBOR USD + 1.23%, 1.23% Floor) | | | 1.45 | % (a) | | | 10/20/2031 | | | | 35,048,587 | |
10,450,000 | | Bain Capital Credit Ltd., Series 2019-3A-B2 (3 Month LIBOR USD + 1.87%, 1.87% Floor) | | | 2.09 | % (a) | | | 10/21/2032 | | | | 10,465,376 | |
5,000,000 | | BlueMountain Ltd., Series 2018-2A-B (3 Month LIBOR USD + 1.70%, 1.70% Floor) | | | 1.89 | % (a) | | | 08/15/2031 | | | | 5,006,534 | |
5,000,000 | | Broad River BSL Funding , Series 2020-1A-B (3 Month LIBOR USD + 2.38%, 2.38% Floor) | | | 2.60 | % (a) | | | 04/20/2029 | | | | 5,003,613 | |
5,065,000 | | CFIP Ltd., Series 2017-1A-C (3 Month LIBOR USD + 2.10%) | | | 2.32 | % (a) | | | 01/18/2030 | | | | 5,045,351 | |
61,250,000 | | CVP Ltd., Series 2017-2A-A (3 Month LIBOR USD + 1.19%, 1.19% Floor) | | | 1.41 | % (a) | | | 01/20/2031 | | | | 61,331,351 | |
3,500,000 | | Dryden Ltd., Series 2017-53A-B (3 Month LIBOR USD + 1.40%) | | | 1.64 | % (a) | | | 01/15/2031 | | | | 3,482,301 | |
35,250,000 | | Elevation Ltd., Series 2014-2A-A1R (3 Month LIBOR USD + 1.23%) | | | 1.47 | % (a) | | | 10/15/2029 | | | | 35,264,030 | |
25,500,000 | | Elevation Ltd., Series 2018-9A-A1 (3 Month LIBOR USD + 1.12%, 1.12% Floor) | | | 1.36 | % (a) | | | 07/15/2031 | | | | 25,536,035 | |
5,500,000 | | Elmwood Ltd., Series 2019-2A-B (3 Month LIBOR USD + 2.10%, 2.10% Floor) | | | 2.32 | % (a) | | | 04/20/2031 | | | | 5,505,887 | |
20,250,000 | | Fort Washington, Series 2019-1A-A (3 Month LIBOR USD + 1.42%, 1.42% Floor) | | | 1.64 | % (a) | | | 10/20/2032 | | | | 20,295,507 | |
76,100,000 | | Greywolf Ltd., Series 2018-1A-A1 (3 Month LIBOR USD + 1.03%) | | | 1.25 | % (a) | | | 04/26/2031 | | | | 76,160,914 | |
1,855,206 | | Halcyon Loan Advisors Funding Ltd., Series 2014-2A-D (3 Month LIBOR USD + 5.00%) | | | 5.22 | % (a)(e) | | | 04/28/2025 | | | | 369,501 | |
5,000,000 | | Halcyon Loan Advisors Funding Ltd., Series 2014-3A-D (3 Month LIBOR USD + 3.65%) | | | 3.87 | % (a) | | | 10/22/2025 | | | | 4,416,594 | |
28,308,661 | | Halcyon Loan Advisors Funding Ltd., Series 2015-3A-A1R (3 Month LIBOR USD + 0.90%) | | | 1.12 | % (a) | | | 10/18/2027 | | | | 28,264,382 | |
13,000,000 | | Halsey Point Ltd., Series 2019-1A-B1 (3 Month LIBOR USD + 2.20%, 2.20% Floor) | | | 2.42 | % (a) | | | 01/20/2033 | | | | 13,013,630 | |
30,278,826 | | Harbourview Ltd., Series 7RA-A1 (3 Month LIBOR USD + 1.13%, 1.13% Floor) | | | 1.35 | % (a) | | | 07/18/2031 | | | | 30,354,743 | |
10,000,000 | | Highbridge Loan Management Ltd., Series 7A-2015-BR (3 Month LIBOR USD + 1.18%) | | | 1.37 | % (a) | | | 03/15/2027 | | | | 9,950,249 | |
6,000,000 | | Jamestown Ltd., Series 2018-11A-A2 (3 Month LIBOR USD + 1.70%) | | | 1.93 | % (a) | | | 07/14/2031 | | | | 6,019,484 | |
56,695,000 | | Jamestown Ltd., Series 2018-6RA-A1 (3 Month LIBOR USD + 1.15%, 1.15% Floor) | | | 1.37 | % (a) | | | 04/25/2030 | | | | 56,744,962 | |
5,000,000 | | Jamestown Ltd., Series 2018-6RA-A2A (3 Month LIBOR USD + 1.78%, 1.78% Floor) | | | 2.00 | % (a) | | | 04/25/2030 | | | | 5,003,759 | |
9,500,000 | | Jamestown Ltd., Series 2019-14A-A2 (3 Month LIBOR USD + 2.20%, 2.20% Floor) | | | 2.42 | % (a) | | | 10/20/2032 | | | | 9,519,261 | |
4,500,000 | | Jamestown Ltd., Series 2019-1A-A2 (3 Month LIBOR USD + 2.15%, 2.15% Floor) | | | 2.37 | % (a) | | | 04/20/2032 | | | | 4,578,765 | |
12,950,000 | | Kayne Ltd., Series 2019-5A-B1 (3 Month LIBOR USD + 2.00%, 2.00% Floor) | | | 2.22 | % (a) | | | 07/24/2032 | | | | 12,999,386 | |
30,000,000 | | LCM LP, Series 17A-A2RR (3 Month LIBOR USD + 1.15%, 1.15% Floor) | | | 1.39 | % (a) | | | 10/15/2031 | | | | 30,022,890 | |
2,181,000 | | Madison Park Funding Ltd., Series 2014-15A-A2R (3 Month LIBOR USD + 1.50%) | | | 1.71 | % (a) | | | 01/27/2026 | | | | 2,185,314 | |
5,500,000 | | Madison Park Funding Ltd., Series 2014-15A-CR (3 Month LIBOR USD + 3.45%) | | | 3.66 | % (a) | | | 01/27/2026 | | | | 5,496,304 | |
5,000,000 | | Madison Park Funding Ltd., Series 2014-15A-DR (3 Month LIBOR USD + 5.44%) | | | 5.65 | % (a) | | | 01/27/2026 | | | | 4,991,961 | |
12,500,000 | | Marble Point Ltd., Series 2020-2A-A (3 Month LIBOR USD + 1.90%, 1.90% Floor) | | | 2.14 | % (a) | | | 10/15/2031 | | | | 12,572,631 | |
54,500,000 | | Midocean Credit Partners, Series 2018-9A-A1 (3 Month LIBOR USD + 1.15%, 1.15% Floor) | | | 1.37 | % (a) | | | 07/20/2031 | | | | 54,541,251 | |
83,000,000 | | MKS Ltd., Series 2017-1A-AR (3 Month LIBOR USD + 1.00%, 1.00% Floor) | | | 1.22 | % (a) | | | 07/20/2030 | | | | 83,016,327 | |
65,000,000 | | MP Ltd., Series 2013-1A-AR (3 Month LIBOR USD + 1.25%) | | | 1.47 | % (a) | | | 10/20/2030 | | | | 64,964,250 | |
55,000,000 | | MP Ltd., Series 2013-2A-ARR (3 Month LIBOR USD + 1.28%) | | | 1.50 | % (a) | | | 07/25/2029 | | | | 55,064,031 | |
30,000,000 | | Nassau Ltd., Series 2018-IA-A (3 Month LIBOR USD + 1.15%) | | | 1.39 | % (a) | | | 07/15/2031 | | | | 29,896,871 | |
19,280,834 | | Northwoods Capital Ltd., Series 2017-16A-A (3 Month LIBOR USD + 1.27%) | | | 1.46 | % (a) | | | 11/15/2030 | | | | 19,336,015 | |
38,668,291 | | Northwoods Capital Ltd., Series 2018-11BA-A1 (3 Month LIBOR USD + 1.10%, 1.10% Floor) | | | 1.32 | % (a) | | | 04/19/2031 | | | | 38,699,057 | |
2,000,000 | | OCP Ltd., Series 2020-18A-B1 (3 Month LIBOR USD + 2.40%) | | | 2.62 | % (a) | | | 04/20/2030 | | | | 2,001,041 | |
10,000,000 | | Octagon Investment Partners Ltd., Series 2020-1A-B (3 Month LIBOR USD + 2.60%, 2.60% Floor) | | | 2.82 | % (a) | | | 04/20/2031 | | | | 10,045,152 | |
75,000,000 | | OFSI Fund Ltd., Series 2018-1A-A (3 Month LIBOR USD + 1.15%, 1.15% Floor) | | | 1.39 | % (a) | | | 07/15/2031 | | | | 75,096,787 | |
28,000,000 | | Prudential PLC, Series 2018-1A-A (3 Month LIBOR USD + 1.15%) | | | 1.39 | % (a) | | | 07/15/2031 | | | | 28,014,000 | |
2,500,000 | | Regatta Funding Ltd., Series 2018-1A-B (3 Month LIBOR USD + 1.65%) | | | 1.87 | % (a) | | | 07/17/2031 | | | | 2,506,242 | |
20,000,000 | | Regatta Funding Ltd., Series 2018-3A-A (3 Month LIBOR USD + 1.19%) | | | 1.41 | % (a) | | | 10/25/2031 | | | | 20,026,821 | |
39,000,000 | | Rockford Tower Ltd., Series 2018-1A-A (3 Month LIBOR USD + 1.10%) | | | 1.28 | % (a) | | | 05/20/2031 | | | | 39,105,206 | |
50,000,000 | | Sound Point Ltd., Series 2013-3RA-A (3 Month LIBOR USD + 1.15%, 1.15% Floor) | | | 1.37 | % (a) | | | 04/18/2031 | | | | 49,950,000 | |
36,500,000 | | Sound Point Ltd., Series 2015-2A-ARR (3 Month LIBOR USD + 1.39%, 1.39% Floor) | | | 1.61 | % (a) | | | 07/20/2032 | | | | 36,565,361 | |
18,000,000 | | Sound Point Ltd., Series 2018-2A-C (3 Month LIBOR USD + 1.95%) | | | 2.17 | % (a) | | | 07/26/2031 | | | | 17,774,638 | |
28,000,000 | | Sound Point Ltd., Series 2018-3A-A1A (3 Month LIBOR USD + 1.18%, 1.18% Floor) | | | 1.40 | % (a) | | | 10/26/2031 | | | | 28,029,828 | |
30,000,000 | | Steele Creek Ltd., Series 2014-1RA-A (3 Month LIBOR USD + 1.07%, 1.07% Floor) | | | 1.29 | % (a) | | | 04/21/2031 | | | | 29,917,963 | |
34,000,000 | | Steele Creek Ltd., Series 2016-1A-AR (3 Month LIBOR USD + 1.12%, 1.12% Floor) | | | 1.30 | % (a) | | | 06/15/2031 | | | | 33,919,456 | |
10,000,000 | | Steele Creek Ltd., Series 2019-1A-B (3 Month LIBOR USD + 2.20%, 2.20% Floor) | | | 2.44 | % (a) | | | 04/15/2032 | | | | 9,992,583 | |
75,000,000 | | Vibrant Ltd., Series 2018-10A-A1 (3 Month LIBOR USD + 1.20%, 1.20% Floor) | | | 1.42 | % (a) | | | 10/20/2031 | | | | 75,079,674 | |
25,000,000 | | Wellfleet Ltd., Series 2018-1A-A (3 Month LIBOR USD + 1.10%, 1.10% Floor) | | | 1.32 | % (a) | | | 07/17/2031 | | | | 25,014,233 | |
46,000,000 | | Wellfleet Ltd., Series 2018-2A-A1 (3 Month LIBOR USD + 1.20%, 1.20% Floor) | | | 1.42 | % (a) | | | 10/20/2031 | | | | 45,995,486 | |
4,000,000 | | Wind River Ltd., Series 2013-2A-CR (3 Month LIBOR USD + 2.00%) | | | 2.22 | % (a) | | | 10/18/2030 | | | | 3,926,097 | |
6,971,311 | | Wind River Ltd., Series 2014-1A-ARR (3 Month LIBOR USD + 1.05%, 1.05% Floor) | | | 1.27 | % (a) | | | 07/18/2031 | | | | 6,971,294 | |
40,000,000 | | Wind River Ltd., Series 2014-2A-AR (3 Month LIBOR USD + 1.14%, 1.14% Floor) | | | 1.38 | % (a) | | | 01/15/2031 | | | | 40,050,520 | |
| | | | | | | | | | | | | | |
Total Collateralized Loan Obligations (Cost $1,494,692,061) | | | | | | | | 1,501,116,063 | |
| | | | | | | | | | | | | | |
Non-Agency Commercial Mortgage Backed Obligations—9.0% | | | | | | | | | | | | |
850,000 | | 1211 Avenue of the Americas Trust, Series 2015-1211-C | | | 4.14 | % (a)(b) | | | 08/10/2035 | | | | 902,845 | |
7,949,000 | | 20 Times Square Trust, Series 2018-20TS-F | | | 3.10 | % (a)(b) | | | 05/15/2035 | | | | 7,657,264 | |
5,856,000 | | 20 Times Square Trust, Series 2018-20TS-G | | | 3.10 | % (a)(b) | | | 05/15/2035 | | | | 5,376,559 | |
2,010,000 | | ACRE Commercial Mortgage Ltd., Series 2021-FL4-B (1 Month LIBOR USD + 1.40%, 1.40% Floor) | | | 1.51 | % (a) | | | 12/18/2037 | | | | 2,004,951 | |
260,179,093 | | Arbor Multifamily Mortgage Securities Trust, Series 2020-MF1-XA | | | 0.97 | % (a)(b)(f) | | | 05/15/2053 | | | | 18,592,580 | |
3,725,000 | | Arbor Realty Ltd., Series 2019-FL1-B (1 Month LIBOR USD + 1.70%) | | | 1.81 | % (a) | | | 05/15/2037 | | | | 3,733,158 | |
2,531,000 | | Arbor Realty Ltd., Series 2020-FL1-AS (1 Month LIBOR USD + 1.40%, 1.40% Floor) | | | 1.51 | % (a) | | | 02/15/2035 | | | | 2,534,123 | |
6,725,000 | | Arbor Realty Ltd., Series 2020-FL1-B (1 Month LIBOR USD + 1.80%, 1.80% Floor) | | | 1.91 | % (a) | | | 02/15/2035 | | | | 6,742,451 | |
6,300,000 | | Arbor Realty Ltd., Series 2021-FL1-B (1 Month LIBOR USD + 1.50%, 1.50% Floor) | | | 1.63 | % (a) | | | 12/15/2035 | | | | 6,290,550 | |
2,700,000 | | Arbor Realty Ltd., Series 2021-FL1-C (1 Month LIBOR USD + 2.00%, 2.00% Floor) | | | 2.13 | % (a) | | | 12/15/2035 | | | | 2,695,950 | |
2,837,533 | | Ashford Hospitality Trust, Series 2018-ASHF-A (1 Month LIBOR USD + 0.90%, 0.90% Floor) | | | 1.01 | % (a) | | | 04/15/2035 | | | | 2,836,318 | |
11,007,000 | | Atrium Hotel Portfolio Trust, Series 2017-ATRM-E (1 Month LIBOR USD + 3.05%, 3.05% Floor) | | | 3.16 | % (a) | | | 12/15/2036 | | | | 10,466,466 | |
29,257,000 | | Atrium Hotel Portfolio Trust, Series 2018-ATRM-A (1 Month LIBOR USD + 0.95%, 0.95% Floor) | | | 1.06 | % (a) | | | 06/15/2035 | | | | 29,291,494 | |
28,877,000 | | Atrium Hotel Portfolio Trust, Series 2018-ATRM-D (1 Month LIBOR USD + 2.30%, 2.30% Floor) | | | 2.41 | % (a) | | | 06/15/2035 | | | | 28,074,043 | |
13,685,000 | | Atrium Hotel Portfolio Trust, Series 2018-ATRM-E (1 Month LIBOR USD + 3.40%, 3.40% Floor) | | | 3.51 | % (a) | | | 06/15/2035 | | | | 13,270,629 | |
7,469,000 | | BAMLL Commercial Mortgage Securities Trust, Series 2015-200P-F | | | 3.60 | % (a)(b) | | | 04/14/2033 | | | | 7,676,292 | |
35,435,000 | | BAMLL Commercial Mortgage Securities Trust, Series 2020-BOC-D | | | 3.18 | % (a)(b) | | | 01/15/2032 | | | | 35,591,389 | |
7,505,000 | | BAMLL Commercial Mortgage Securities Trust, Series 2020-BOC-E | | | 3.18 | % (a)(b) | | | 01/15/2032 | | | | 7,313,583 | |
12,201,636 | | Banc of America Commercial Mortgage Trust, Series 2007-5-XW | | | (a | )(b)(f) | | | 02/10/2051 | | | | 122 | |
4,000,000 | | Banc of America Commercial Mortgage Trust, Series 2015-UBS7-B | | | 4.36 | % (b) | | | 09/15/2048 | | | | 4,207,252 | |
55,248,470 | | Banc of America Commercial Mortgage Trust, Series 2015-UBS7-XA | | | 0.79 | % (b)(f) | | | 09/15/2048 | | | | 1,641,393 | |
5,018,000 | | Bancorp Commercial Mortgage Trust, Series 2018-CRE4-D (1 Month LIBOR USD + 2.10%, 0.25% Floor) | | | 2.21 | % (a) | | | 09/15/2035 | | | | 4,977,126 | |
6,530,000 | | Bancorp Commercial Mortgage Trust, Series 2019-CRE5-B (1 Month LIBOR USD + 1.50%, 1.50% Floor) | | | 1.61 | % (a) | | | 03/15/2036 | | | | 6,538,045 | |
1,057,000 | | Bancorp Commercial Mortgage Trust, Series 2019-CRE5-D (1 Month LIBOR USD + 2.35%, 2.35% Floor) | | | 2.46 | % (a) | | | 03/15/2036 | | | | 1,047,750 | |
3,026,759 | | Bancorp Commercial Mortgage Trust, Series 2019-CRE6-A (1 Month LIBOR USD + 1.05%, 1.05% Floor) | | | 1.16 | % (a) | | | 09/15/2036 | | | | 3,029,015 | |
1,614,000 | | BANK, Series 2017-BNK4-C | | | 4.37 | % (b) | | | 05/15/2050 | | | | 1,713,038 | |
38,751,500 | | BANK, Series 2017-BNK4-XA | | | 1.40 | % (b)(f) | | | 05/15/2050 | | | | 2,321,908 | |
4,916,000 | | BANK, Series 2017-BNK5-B | | | 3.90 | % (b) | | | 06/15/2060 | | | | 5,346,741 | |
1,960,000 | | BANK, Series 2017-BNK5-C | | | 4.26 | % (b) | | | 06/15/2060 | | | | 2,051,286 | |
87,075,866 | | BANK, Series 2017-BNK5-XA | | | 1.06 | % (b)(f) | | | 06/15/2060 | | | | 3,808,933 | |
1,750,000 | | BANK, Series 2018-BN10-AS | | | 3.90 | % (b) | | | 02/15/2061 | | | | 1,932,834 | |
150,162,056 | | BANK, Series 2018-BN10-XA | | | 0.73 | % (b)(f) | | | 02/15/2061 | | | | 6,264,341 | |
94,268,904 | | BANK, Series 2019-BN16-XA | | | 0.96 | % (b)(f) | | | 02/15/2052 | | | | 5,703,834 | |
43,097,000 | | BANK, Series 2019-BN19-AS | | | 3.45 | % | | | 08/15/2061 | | | | 46,101,887 | |
1,099,000 | | BANK, Series 2019-BN20-AS | | | 3.24 | % (b) | | | 09/15/2062 | | | | 1,153,728 | |
1,704,000 | | BANK, Series 2019-BN20-C | | | 3.65 | % (b) | | | 09/15/2062 | | | | 1,748,701 | |
5,000,000 | | BANK, Series 2019-BN21-C | | | 3.52 | % (b) | | | 10/17/2052 | | | | 5,099,365 | |
10,035,000 | | BANK, Series 2020-BN26-AS | | | 2.69 | % | | | 03/15/2063 | | | | 10,220,325 | |
11,924,000 | | BANK, Series 2020-BN26-ASB | | | 2.31 | % | | | 03/15/2063 | | | | 12,388,900 | |
55,791,603 | | BANK, Series 2020-BN27-XA | | | 1.16 | % (b)(f) | | | 04/15/2063 | | | | 4,840,876 | |
62,007,000 | | BANK, Series 2020-BN30-XB | | | 0.72 | % (b)(f) | | | 12/15/2053 | | | | 3,800,235 | |
12,089,000 | | Barclays Commercial Mortgage Securities LLC, Series 2017-DELC-C (1 Month LIBOR USD + 1.20%, 1.20% Floor) | | | 1.31 | % (a) | | | 08/15/2036 | | | | 12,082,934 | |
13,777,000 | | Barclays Commercial Mortgage Securities LLC, Series 2017-DELC-D (1 Month LIBOR USD + 1.70%, 1.70% Floor) | | | 1.81 | % (a) | | | 08/15/2036 | | | | 13,765,876 | |
28,585,000 | | Barclays Commercial Mortgage Securities LLC, Series 2017-DELC-E (1 Month LIBOR USD + 2.50%, 2.50% Floor) | | | 2.61 | % (a) | | | 08/15/2036 | | | | 28,479,556 | |
30,209,000 | | Barclays Commercial Mortgage Securities LLC, Series 2017-DELC-F (1 Month LIBOR USD + 3.50%, 3.50% Floor) | | | 3.61 | % (a) | | | 08/15/2036 | | | | 27,438,611 | |
186,151,113 | | Barclays Commercial Mortgage Trust, Series 2019-C4-XA | | | 1.59 | % (b)(f) | | | 08/15/2052 | | | | 19,408,748 | |
74,691,949 | | Barclays Commercial Mortgage Trust, Series 2019-C5-XA | | | 0.89 | % (b)(f) | | | 11/15/2052 | | | | 4,221,186 | |
12,406,000 | | BBCMS Mortgage Trust, Series 2017-DELC-A (1 Month LIBOR USD + 0.85%, 0.85% Floor) | | | 0.96 | % (a) | | | 08/15/2036 | | | | 12,412,776 | |
13,279,071 | | BBCMS Mortgage Trust, Series 2018-BXH-A (1 Month LIBOR USD + 1.00%, 1.00% Floor) | | | 1.11 | % (a) | | | 10/15/2037 | | | | 13,310,969 | |
67,548,000 | | BBCMS Mortgage Trust, Series 2018-CBM-A (1 Month LIBOR USD + 1.00%, 1.00% Floor) | | | 1.11 | % (a) | | | 07/15/2037 | | | | 67,572,966 | |
21,385,000 | | BBCMS Mortgage Trust, Series 2018-CBM-E (1 Month LIBOR USD + 3.55%, 3.55% Floor) | | | 3.66 | % (a) | | | 07/15/2037 | | | | 20,846,586 | |
9,135,000 | | BBCMS Mortgage Trust, Series 2018-TALL-A (1 Month LIBOR USD + 0.72%, 0.72% Floor) | | | 0.83 | % (a) | | | 03/15/2037 | | | | 9,056,233 | |
5,775,000 | | BBCMS Mortgage Trust, Series 2018-TALL-F (1 Month LIBOR USD + 3.24%, 3.24% Floor) | | | 3.34 | % (a) | | | 03/15/2037 | | | | 5,223,642 | |
11,799,000 | | BBCMS Mortgage Trust, Series 2020-C6-F5TB | | | 3.69 | % (a)(b) | | | 02/15/2053 | | | | 11,860,355 | |
12,497,250 | | BBCMS Mortgage Trust, Series 2020-C6-F5TC | | | 3.69 | % (a)(b) | | | 02/15/2053 | | | | 12,124,045 | |
189,218,160 | | BBCMS Mortgage Trust, Series 2020-C6-XA | | | 1.06 | % (b)(f) | | | 02/15/2053 | | | | 14,048,143 | |
138,379,000 | | BBCMS Mortgage Trust, Series 2021-C9-XA | | | 1.77 | % (b)(f) | | | 02/15/2054 | | | | 17,484,367 | |
68,467,000 | | BBCMS Mortgage Trust, Series 2021-C9-XB | | | 1.12 | % (b)(f) | | | 02/15/2054 | | | | 5,974,266 | |
4,125,000 | | BDS Ltd., Series 2019-FL4-B (1 Month LIBOR USD + 1.75%, 1.75% Floor) | | | 1.86 | % (a) | | | 08/15/2036 | | | | 4,108,500 | |
12,332,000 | | Benchmark Mortgage Trust, Series 2018-B5-C | | | 4.61 | % (b) | | | 07/15/2051 | | | | 13,464,169 | |
37,481,850 | | Benchmark Mortgage Trust, Series 2018-B7-XA | | | 0.44 | % (b)(f) | | | 05/15/2053 | | | | 952,545 | |
30,640,164 | | Benchmark Mortgage Trust, Series 2018-B8-XA | | | 0.66 | % (b)(f) | | | 01/15/2052 | | | | 1,244,263 | |
133,629,709 | | Benchmark Mortgage Trust, Series 2019-B15-XA | | | 0.83 | % (b)(f) | | | 12/15/2072 | | | | 7,365,750 | |
80,544,329 | | Benchmark Mortgage Trust, Series 2019-B9-XA | | | 1.04 | % (b)(f) | | | 03/15/2052 | | | | 5,472,286 | |
4,585,000 | | Benchmark Mortgage Trust, Series 2020-B16-B | | | 3.18 | % (b) | | | 02/15/2053 | | | | 4,694,316 | |
75,338,488 | | Benchmark Mortgage Trust, Series 2020-B16-XA | | | 0.93 | % (b)(f) | | | 02/15/2053 | | | | 5,225,907 | |
75,508,917 | | Benchmark Mortgage Trust, Series 2020-B17-XA | | | 1.42 | % (b)(f) | | | 03/15/2053 | | | | 6,590,411 | |
13,462,000 | | Benchmark Mortgage Trust, Series 2020-B18-AGND | | | 3.74 | % (a) | | | 07/15/2053 | | | | 14,099,949 | |
2,432,000 | | Benchmark Mortgage Trust, Series 2020-B18-AGNE | | | 3.76 | % (a) | | | 07/15/2053 | | | | 2,483,140 | |
91,485,666 | | Benchmark Mortgage Trust, Series 2020-B18-XA | | | 1.79 | % (b)(f) | | | 07/15/2053 | | | | 10,379,534 | |
239,548,356 | | Benchmark Mortgage Trust, Series 2020-B19-XA | | | 1.78 | % (b)(f) | | | 09/15/2053 | | | | 26,656,175 | |
71,143,349 | | Benchmark Mortgage Trust, Series 2020-B22-XA | | | 1.52 | % (b)(f) | | | 01/15/2054 | | | | 8,534,200 | |
276,099,000 | | Benchmark Mortgage Trust, Series 2020-IG1-XA | | | 0.51 | % (b)(f) | | | 09/15/2043 | | | | 10,035,646 | |
233,398,000 | | Benchmark Mortgage Trust, Series 2021-B24-XA | | | 1.27 | % (b)(f) | | | 03/15/2054 | | | | 20,484,409 | |
672,000 | | BFLD, Series 2019-DPLO-B (1 Month LIBOR USD + 1.34%, 1.34% Floor) | | | 1.45 | % (a) | | | 10/15/2034 | | | | 671,730 | |
3,801,000 | | BFLD, Series 2019-DPLO-E (1 Month LIBOR USD + 2.24%, 2.24% Floor) | | | 2.35 | % (a) | | | 10/15/2034 | | | | 3,776,449 | |
75,399,000 | | BHMS Trust, Series 2018-ATLS-A (1 Month LIBOR USD + 1.25%, 1.25% Floor) | | | 1.36 | % (a) | | | 07/15/2035 | | | | 75,485,287 | |
13,367,000 | | BHMS Trust, Series 2018-ATLS-C (1 Month LIBOR USD + 1.90%, 1.90% Floor) | | | 2.01 | % (a) | | | 07/15/2035 | | | | 13,331,825 | |
27,680,000 | | Bremar Hotels and Resorts Trust, Series 2018-PRME-A (1 Month LIBOR USD + 0.82%, 0.82% Floor) | | | 0.93 | % (a) | | | 06/15/2035 | | | | 27,616,073 | |
2,344,782 | | Bsprt Issuer Ltd., Series 2018-FL4-A (1 Month LIBOR USD + 1.05%, 1.05% Floor) | | | 1.16 | % (a) | | | 09/15/2035 | | | | 2,348,300 | |
3,333,000 | | Bsprt Issuer Ltd., Series 2019-FL5-A (1 Month LIBOR USD + 1.15%, 1.15% Floor) | | | 1.26 | % (a) | | | 05/15/2029 | | | | 3,342,582 | |
9,834,000 | | Bsprt Issuer Ltd., Series 2021-FL6-A (1 Month LIBOR USD + 1.10%, 1.10% Floor) | | | 1.20 | % (a) | | | 03/15/2036 | | | | 9,836,458 | |
18,000,000 | | BX Commercial Mortgage Trust, Series 2018-BIOA-E (1 Month LIBOR USD + 1.95%, 1.98% Floor) | | | 2.06 | % (a) | | | 03/15/2037 | | | | 18,039,550 | |
19,593,226 | | BX Trust, Series 2017-APPL-E (1 Month LIBOR USD + 3.15%, 3.15% Floor) | | | 3.26 | % (a) | | | 07/15/2034 | | | | 19,661,266 | |
23,862,843 | | BX Trust, Series 2017-SLCT-D (1 Month LIBOR USD + 2.05%, 2.05% Floor) | | | 2.16 | % (a) | | | 07/15/2034 | | | | 23,922,297 | |
63,983,750 | | BX Trust, Series 2017-SLCT-E (1 Month LIBOR USD + 3.15%, 3.15% Floor) | | | 3.26 | % (a) | | | 07/15/2034 | | | | 64,246,934 | |
41,318,786 | | BX Trust, Series 2018-EXCL-A (1 Month LIBOR USD + 1.09%, 1.09% Floor) | | | 1.19 | % (a) | | | 09/15/2037 | | | | 40,171,888 | |
2,014,000 | | BX Trust, Series 2019-ATL-E (1 Month LIBOR USD + 2.24%, 2.24% Floor) | | | 2.34 | % (a) | | | 10/15/2036 | | | | 1,939,760 | |
8,600,959 | | BX Trust, Series 2019-MMP-D (1 Month LIBOR USD + 1.60%, 1.60% Floor) | | | 1.71 | % (a) | | | 08/15/2036 | | | | 8,562,228 | |
180,761,000 | | BX Trust, Series 2019-OC11-E | | | 4.08 | % (a)(b) | | | 12/09/2041 | | | | 180,040,920 | |
326,679,000 | | BX Trust, Series 2019-OC11-XB | | | 0.18 | % (a)(b)(f) | | | 12/09/2041 | | | | 5,472,102 | |
47,460,878 | | CD Commercial Mortgage Trust, Series 2017-CD6-XA | | | 0.92 | % (b)(f) | | | 11/13/2050 | | | | 1,872,801 | |
5,175,000 | | CD Mortgage Trust, Series 2017-CD6-C | | | 4.27 | % (b) | | | 11/13/2050 | | | | 5,447,916 | |
5,394,250 | | CF Trust, Series 2019-MF1-A (1 Month LIBOR USD + 1.05%, 2.05% Floor) | | | 2.05 | % (a) | | | 08/21/2032 | | | | 5,453,908 | |
4,517,000 | | CFCRE Commercial Mortgage Trust, Series 2016-C4-AM | | | 3.69 | % | | | 05/10/2058 | | | | 4,842,159 | |
7,155,000 | | CFCRE Commercial Mortgage Trust, Series 2016-C4-C | | | 4.86 | % (b) | | | 05/10/2058 | | | | 7,493,142 | |
85,440,778 | | CFCRE Commercial Mortgage Trust, Series 2016-C4-XA | | | 1.65 | % (b)(f) | | | 05/10/2058 | | | | 5,691,535 | |
43,232,970 | | CFCRE Commercial Mortgage Trust, Series 2017-C8-XA | | | 1.59 | % (b)(f) | | | 06/15/2050 | | | | 2,909,622 | |
5,275,000 | | CHCP Ltd., Series 2021-FL1-B (1 Month LIBOR USD + 1.65%, 1.65% Floor) | | | 1.76 | % (a) | | | 02/15/2038 | | | | 5,286,895 | |
4,125,000 | | CHCP Ltd., Series 2021-FL1-C (1 Month LIBOR USD + 2.10%, 2.10% Floor) | | | 2.21 | % (a) | | | 02/15/2038 | | | | 4,134,302 | |
32,223,000 | | CHT Mortgage Trust, Series 2017-CSMO-E (1 Month LIBOR USD + 3.00%, 3.00% Floor) | | | 3.11 | % (a) | | | 11/15/2036 | | | | 32,338,246 | |
5,414,000 | | CHT Mortgage Trust, Series 2017-CSMO-F (1 Month LIBOR USD + 3.74%, 3.74% Floor) | | | 3.85 | % (a) | | | 11/15/2036 | | | | 5,440,889 | |
173,971,274 | | Citigroup Commercial Mortgage Trust, Series 2012-GC8-XA | | | 1.74 | % (a)(b)(f) | | | 09/10/2045 | | | | 3,129,100 | |
142,849,740 | | Citigroup Commercial Mortgage Trust, Series 2014-GC19-XA | | | 1.14 | % (b)(f) | | | 03/10/2047 | | | | 3,919,611 | |
76,030,105 | | Citigroup Commercial Mortgage Trust, Series 2014-GC21-XA | | | 1.16 | % (b)(f) | | | 05/10/2047 | | | | 2,324,141 | |
181,768,091 | | Citigroup Commercial Mortgage Trust, Series 2014-GC25-XA | | | 0.99 | % (b)(f) | | | 10/10/2047 | | | | 5,243,319 | |
6,265,000 | | Citigroup Commercial Mortgage Trust, Series 2015-GC27-B | | | 3.77 | % | | | 02/10/2048 | | | | 6,675,485 | |
9,978,000 | | Citigroup Commercial Mortgage Trust, Series 2015-GC27-C | | | 4.42 | % (b) | | | 02/10/2048 | | | | 10,586,427 | |
3,685,000 | | Citigroup Commercial Mortgage Trust, Series 2015-GC27-D | | | 4.42 | % (a)(b) | | | 02/10/2048 | | | | 3,591,356 | |
193,005,448 | | Citigroup Commercial Mortgage Trust, Series 2015-GC27-XA | | | 1.34 | % (b)(f) | | | 02/10/2048 | | | | 8,101,076 | |
4,404,000 | | Citigroup Commercial Mortgage Trust, Series 2015-GC29-C | | | 4.15 | % (b) | | | 04/10/2048 | | | | 4,645,995 | |
14,310,000 | | Citigroup Commercial Mortgage Trust, Series 2015-GC33-C | | | 4.57 | % (b) | | | 09/10/2058 | | | | 14,149,360 | |
166,563,178 | | Citigroup Commercial Mortgage Trust, Series 2015-GC33-XA | | | 0.88 | % (b)(f) | | | 09/10/2058 | | | | 5,525,467 | |
103,456,535 | | Citigroup Commercial Mortgage Trust, Series 2016-C1-XA | | | 1.85 | % (b)(f) | | | 05/10/2049 | | | | 7,810,265 | |
202,230,053 | | Citigroup Commercial Mortgage Trust, Series 2016-GC36-XA | | | 1.22 | % (b)(f) | | | 02/10/2049 | | | | 9,811,939 | |
39,417,706 | | Citigroup Commercial Mortgage Trust, Series 2016-GC37-XA | | | 1.70 | % (b)(f) | | | 04/10/2049 | | | | 2,710,326 | |
103,043,927 | | Citigroup Commercial Mortgage Trust, Series 2016-P3-XA | | | 1.70 | % (b)(f) | | | 04/15/2049 | | | | 6,357,316 | |
58,994,152 | | Citigroup Commercial Mortgage Trust, Series 2016-P4-XA | | | 1.95 | % (b)(f) | | | 07/10/2049 | | | | 4,304,479 | |
36,824,175 | | Citigroup Commercial Mortgage Trust, Series 2016-P5-XA | | | 1.49 | % (b)(f) | | | 10/10/2049 | | | | 2,033,969 | |
46,195,510 | | Citigroup Commercial Mortgage Trust, Series 2017-P7-XA | | | 1.11 | % (b)(f) | | | 04/14/2050 | | | | 2,311,281 | |
3,625,000 | | Citigroup Commercial Mortgage Trust, Series 2020-420K-D | | | 3.31 | % (a)(b) | | | 11/10/2042 | | | | 3,456,894 | |
7,800,000 | | Citigroup Commercial Mortgage Trust, Series 2020-420K-E | | | 3.31 | % (a)(b) | | | 11/10/2042 | | | | 7,273,513 | |
23,804,000 | | Citigroup Commercial Mortgage Trust, Series 2020-555-E | | | 3.50 | % (a)(b) | | | 12/10/2041 | | | | 21,185,053 | |
4,175,000 | | Citigroup Commercial Mortgage Trust, Series 2020-555-F | | | 3.50 | % (a)(b) | | | 12/10/2041 | | | | 3,551,774 | |
17,251,000 | | Citigroup Commercial Mortgage Trust, Series 2020-GC46-B | | | 3.15 | % (b) | | | 02/15/2053 | | | | 17,618,388 | |
60,244,000 | | CLNC Ltd., Series 2019-FL1-A (1 Month LIBOR USD + 1.25%, 1.25% Floor) | | | 1.36 | % (a) | | | 08/20/2035 | | | | 60,454,854 | |
32,731,000 | | CLNC Ltd., Series 2019-FL1-AS (1 Month LIBOR USD + 1.55%, 1.55% Floor) | | | 1.66 | % (a) | | | 08/20/2035 | | | | 32,519,100 | |
29,797,989 | | CLNC Ltd., Series 2019-FL1-B (1 Month LIBOR USD + 1.90%, 1.90% Floor) | | | 2.01 | % (a) | | | 08/20/2035 | | | | 29,752,696 | |
3,675,000 | | COMM Mortgage Trust, Series 2014-CR16-C | | | 4.91 | % (b) | | | 04/10/2047 | | | | 3,919,009 | |
905,000 | | COMM Mortgage Trust, Series 2015-CR22-C | | | 4.11 | % (b) | | | 03/10/2048 | | | | 964,939 | |
5,360,000 | | COMM Mortgage Trust, Series 2015-CR23-C | | | 4.29 | % (b) | | | 05/10/2048 | | | | 5,710,873 | |
30,359,468 | | Commercial Mortgage Pass-Through Certificates, Series 2012-CR2-XA | | | 1.62 | % (b)(f) | | | 08/15/2045 | | | | 420,627 | |
135,444,073 | | Commercial Mortgage Pass-Through Certificates, Series 2012-CR3-XA | | | 1.84 | % (b)(f) | | | 10/15/2045 | | | | 2,587,781 | |
102,690,915 | | Commercial Mortgage Pass-Through Certificates, Series 2012-LC4-XA | | | 2.10 | % (a)(b)(f) | | | 12/10/2044 | | | | 761,648 | |
140,425,405 | | Commercial Mortgage Pass-Through Certificates, Series 2013-CR10-XA | | | 0.65 | % (b)(f) | | | 08/10/2046 | | | | 1,975,505 | |
184,226,857 | | Commercial Mortgage Pass-Through Certificates, Series 2013-CR12-XA | | | 1.11 | % (b)(f) | | | 10/10/2046 | | | | 4,430,048 | |
843,000 | | Commercial Mortgage Pass-Through Certificates, Series 2013-CR13-C | | | 4.89 | % (b) | | | 11/10/2046 | | | | 912,806 | |
1,375,279 | | Commercial Mortgage Pass-Through Certificates, Series 2014-CR14-A2 | | | 3.15 | % | | | 02/10/2047 | | | | 1,375,873 | |
7,635,000 | | Commercial Mortgage Pass-Through Certificates, Series 2014-CR19-C | | | 4.71 | % (b) | | | 08/10/2047 | | | | 8,056,137 | |
30,400,000 | | Commercial Mortgage Pass-Through Certificates, Series 2014-CR20-C | | | 4.51 | % (b) | | | 11/10/2047 | | | | 31,938,310 | |
93,676,655 | | Commercial Mortgage Pass-Through Certificates, Series 2014-UBS3-XA | | | 1.07 | % (b)(f) | | | 06/10/2047 | | | | 2,649,166 | |
183,132,169 | | Commercial Mortgage Pass-Through Certificates, Series 2015-CR22-XA | | | 0.89 | % (b)(f) | | | 03/10/2048 | | | | 4,787,185 | |
9,110,000 | | Commercial Mortgage Pass-Through Certificates, Series 2015-CR26-B | | | 4.48 | % (b) | | | 10/10/2048 | | | | 10,069,343 | |
81,835,202 | | Commercial Mortgage Pass-Through Certificates, Series 2015-CR26-XA | | | 0.93 | % (b)(f) | | | 10/10/2048 | | | | 2,810,385 | |
17,822,000 | | Commercial Mortgage Pass-Through Certificates, Series 2015-DC1-C | | | 4.31 | % (b) | | | 02/10/2048 | | | | 17,454,209 | |
332,535,518 | | Commercial Mortgage Pass-Through Certificates, Series 2015-DC1-XA | | | 1.02 | % (b)(f) | | | 02/10/2048 | | | | 9,475,167 | |
26,930,000 | | Commercial Mortgage Pass-Through Certificates, Series 2016-CR28-C | | | 4.64 | % (b) | | | 02/10/2049 | | | | 29,017,444 | |
1,403,000 | | Commercial Mortgage Pass-Through Certificates, Series 2016-DC2-C | | | 4.63 | % (b) | | | 02/10/2049 | | | | 1,485,638 | |
1,617,000 | | Commercial Mortgage Pass-Through Certificates, Series 2017-PANW-D | | | 3.93 | % (a)(b) | | | 10/10/2029 | | | | 1,669,356 | |
5,524,000 | | Commercial Mortgage Pass-Through Certificates, Series 2017-PANW-E | | | 3.81 | % (a)(b) | | | 10/10/2029 | | | | 5,548,671 | |
18,570,000 | | Commercial Mortgage Pass-Through Certificates, Series 2018-HCLV-A (1 Month LIBOR USD + 1.00%, 1.00% Floor) | | | 1.11 | % (a) | | | 09/15/2033 | | | | 18,439,585 | |
833,000 | | Commercial Mortgage Trust, Series 2015-3BP-F | | | 3.24 | % (a)(b) | | | 02/10/2035 | | | | 798,671 | |
5,248,500 | | Commercial Mortgage Trust, Series 2018-COR3-C | | | 4.56 | % (b) | | | 05/10/2051 | | | | 5,663,574 | |
1,719,274 | | Core Mortgage Trust, Series 2019-CORE-E (1 Month LIBOR USD + 1.90%, 1.90% Floor) | | | 2.01 | % (a) | | | 12/15/2031 | | | | 1,711,221 | |
147,561,481 | | Credit Suisse Mortgage Capital Certificates, Series 2014-USA-X1 | | | 0.54 | % (a)(b)(f) | | | 09/15/2037 | | | | 3,160,265 | |
21,821,000 | | Credit Suisse Mortgage Capital Certificates, Series 2019-ICE4-A (1 Month LIBOR USD + 0.98%, 0.98% Floor) | | | 1.09 | % (a) | | | 05/15/2036 | | | | 21,864,878 | |
21,723,000 | | Credit Suisse Mortgage Capital Certificates, Series 2019-ICE4-E (1 Month LIBOR USD + 2.15%, 2.15% Floor) | | | 2.26 | % (a) | | | 05/15/2036 | | | | 21,794,080 | |
4,165,000 | | Credit Suisse Mortgage Capital Certificates, Series 2019-ICE4-F (1 Month LIBOR USD + 2.65%, 2.65% Floor) | | | 2.76 | % (a) | | | 05/15/2036 | | | | 4,174,257 | |
4,606,000 | | CSAIL Commercial Mortgage Trust, Series 2015-C1-C | | | 4.26 | % (b) | | | 04/15/2050 | | | | 4,545,161 | |
13,360,000 | | CSAIL Commercial Mortgage Trust, Series 2015-C2-AS | | | 3.85 | % (b) | | | 06/15/2057 | | | | 14,059,432 | |
9,205,000 | | CSAIL Commercial Mortgage Trust, Series 2015-C3-B | | | 4.13 | % (b) | | | 08/15/2048 | | | | 9,379,935 | |
9,759,000 | | CSAIL Commercial Mortgage Trust, Series 2015-C4-C | | | 4.56 | % (b) | | | 11/15/2048 | | | | 10,480,338 | |
289,197,343 | | CSAIL Commercial Mortgage Trust, Series 2015-C4-XA | | | 0.82 | % (b)(f) | | | 11/15/2048 | | | | 9,582,380 | |
9,425,000 | | CSAIL Commercial Mortgage Trust, Series 2016-C5-C | | | 4.63 | % (b) | | | 11/15/2048 | | | | 10,095,547 | |
2,085,000 | | CSAIL Commercial Mortgage Trust, Series 2016-C7-C | | | 4.39 | % (b) | | | 11/15/2049 | | | | 1,954,747 | |
184,966,932 | | CSAIL Commercial Mortgage Trust, Series 2017-C8-XA | | | 1.22 | % (b)(f) | | | 06/15/2050 | | | | 8,346,448 | |
4,399,000 | | CSAIL Commercial Mortgage Trust, Series 2017-CX10-B | | | 3.89 | % (b) | | | 11/15/2050 | | | | 4,610,837 | |
5,511,000 | | CSAIL Commercial Mortgage Trust, Series 2017-CX10-C | | | 4.11 | % (b) | | | 11/15/2050 | | | | 5,428,021 | |
90,898,548 | | CSAIL Commercial Mortgage Trust, Series 2017-CX10-XA | | | 0.71 | % (b)(f) | | | 11/15/2050 | | | | 3,317,324 | |
1,677,000 | | CSAIL Commercial Mortgage Trust, Series 2018-C14-C | | | 4.89 | % (b) | | | 11/15/2051 | | | | 1,849,684 | |
4,393,000 | | CSAIL Commercial Mortgage Trust, Series 2019-C16-AS | | | 3.61 | % | | | 06/15/2052 | | | | 4,733,244 | |
15,894,000 | | CSAIL Commercial Mortgage Trust, Series 2019-C16-B | | | 3.88 | % | | | 06/15/2052 | | | | 16,625,788 | |
26,505,463 | | CSAIL Commercial Mortgage Trust, Series 2019-C17-XA | | | 1.37 | % (b)(f) | | | 09/15/2052 | | | | 2,312,753 | |
7,924,000 | | CSAIL Commercial Mortgage Trust, Series 2019-C18-B | | | 3.59 | % | | | 12/15/2052 | | | | 8,354,531 | |
254,185,493 | | CSAIL Commercial Mortgage Trust, Series 2019-C18-XA | | | 1.08 | % (b)(f) | | | 12/15/2052 | | | | 16,988,004 | |
3,652,000 | | CSAIL Commercial Mortgage Trust, Series 2020-C19-C | | | 3.61 | % (b) | | | 03/15/2053 | | | | 3,704,756 | |
268,810,491 | | CSAIL Commercial Mortgage Trust, Series 2020-C19-XA | | | 1.12 | % (b)(f) | | | 03/15/2053 | | | | 21,637,954 | |
81,465,000 | | CSAIL Commercial Mortgage Trust, Series 2020-C19-XB | | | 0.08 | % (b)(f) | | | 03/15/2053 | | | | 666,131 | |
7,050,000 | | CSMC Trust, Series 2017-CALI-E | | | 3.78 | % (a)(b) | | | 11/10/2032 | | | | 7,058,758 | |
6,050,000 | | CSMC Trust, Series 2017-CALI-F | | | 3.78 | % (a)(b) | | | 11/10/2032 | | | | 5,885,010 | |
12,164,000 | | CSMC Trust, Series 2017-CHOP-D (1 Month LIBOR USD + 1.90%, 1.90% Floor) | | | 2.01 | % (a) | | | 07/15/2032 | | | | 11,707,939 | |
18,903,000 | | CSMC Trust, Series 2017-CHOP-E (1 Month LIBOR USD + 3.30%, 3.30% Floor) | | | 3.41 | % (a) | | | 07/15/2032 | | | | 17,363,099 | |
3,818,000 | | CSMC Trust, Series 2017-MOON-D | | | 3.20 | % (a)(b) | | | 07/10/2034 | | | | 3,818,995 | |
4,673,000 | | CSMC Trust, Series 2017-MOON-E | | | 3.20 | % (a)(b) | | | 07/10/2034 | | | | 4,546,243 | |
34,600,000 | | CSMC Trust, Series 2020-LOTS-A (1 Month LIBOR USD + 3.97%, 4.73% Floor) | | | 4.72 | % (a) | | | 07/15/2022 | | | | 34,667,345 | |
33,136,000 | | CSMC Trust, Series 2020-NET-A | | | 2.26 | % (a) | | | 08/15/2037 | | | | 33,766,631 | |
12,769,000 | | CSMC Trust, Series 2020-NET-B | | | 2.82 | % (a) | | | 08/15/2037 | | | | 13,096,871 | |
144,920,000 | | CSMC Trust, Series 2020-NET-X | | | 1.26 | % (a)(b)(f) | | | 08/15/2037 | | | | 7,260,593 | |
70,500,000 | | CSMC Trust, Series 2020-WHHQ-A (1 Month LIBOR USD + 3.42%, 4.42% Floor) | | | 4.42 | % (a) | | | 02/10/2023 | | | | 70,904,571 | |
59,959,097 | | DBJPM Mortgage Trust, Series 2020-C9-XA | | | 1.71 | % (b)(f) | | | 09/15/2053 | | | | 6,188,211 | |
28,797,558 | | DBUBS Mortgage Trust, Series 2011-LC2A-XA | | | 1.08 | % (a)(b)(f) | | | 07/10/2044 | | | | 288 | |
2,996,000 | | DBUBS Mortgage Trust, Series 2011-LC3A-PM2 | | | 4.76 | % (a)(b) | | | 05/10/2044 | | | | 2,808,479 | |
9,390,000 | | DBUBS Mortgage Trust, Series 2017-BRBK-E | | | 3.53 | % (a)(b) | | | 10/10/2034 | | | | 9,603,521 | |
17,163,305 | | DBWF Mortgage Trust, Series 2018-GLKS-A (1 Month LIBOR USD + 1.03%, 1.03% Floor) | | | 1.14 | % (a) | | | 12/19/2030 | | | | 17,182,864 | |
112,494,544 | | Deutsche Bank Commercial Mortgage Trust, Series 2016-C1-XA | | | 1.43 | % (b)(f) | | | 05/10/2049 | | | | 6,369,666 | |
18,956,813 | | Exantas Capital Corporation Ltd., Series 2019-RSO7-A (1 Month LIBOR USD + 1.00%, 1.00% Floor) | | | 1.11 | % (a) | | | 04/15/2036 | | | | 18,957,931 | |
6,625,000 | | Exantas Capital Corporation Ltd., Series 2020-RSO8-B (1 Month LIBOR USD + 1.75%, 1.75% Floor) | | | 1.86 | % (a) | | | 03/15/2035 | | | | 6,652,010 | |
22,312,000 | | Fontainebleau Miami Beach Trust, Series 2019-FBLU-E | | | 3.96 | % (a)(b) | | | 12/10/2036 | | | | 23,124,688 | |
7,180,000 | | Fontainebleau Miami Beach Trust, Series 2019-FBLU-F | | | 3.96 | % (a)(b) | | | 12/10/2036 | | | | 7,255,465 | |
8,302,000 | | Fontainebleau Miami Beach Trust, Series 2019-FBLU-G | | | 3.96 | % (a)(b) | | | 12/10/2036 | | | | 8,266,498 | |
1,842,375 | | FREMF Mortgage Trust, Series 2017-KF34-B (1 Month LIBOR USD + 2.70%, 2.55% Floor) | | | 2.82 | % (a) | | | 08/25/2024 | | | | 1,846,796 | |
5,627,943 | | FREMF Mortgage Trust, Series 2017-KF36-B (1 Month LIBOR USD + 2.65%, 2.65% Floor) | | | 2.77 | % (a) | | | 08/25/2024 | | | | 5,641,511 | |
18,328,350 | | FREMF Mortgage Trust, Series 2018-KC02-C | | | | (a)(g) | | | 08/25/2025 | | | | 13,537,567 | |
3,015,000 | | FS Rialto, Series 2019-FL1-A (1 Month LIBOR USD + 1.20%, 1.20% Floor) | | | 1.31 | % (a) | | | 12/16/2036 | | | | 3,009,513 | |
6,053,000 | | GB Trust, Series 2020-FLIX-D (1 Month LIBOR USD + 2.35%, 2.35% Floor) | | | 2.46 | % (a) | | | 08/15/2037 | | | | 6,084,041 | |
3,000,000 | | GPMT Ltd., Series 2019-FL2-A (1 Month LIBOR USD + 1.30%, 1.30% Floor) | | | 1.41 | % (a) | | | 02/22/2036 | | | | 3,008,775 | |
20,365,000 | | Grace Trust, Series 2020-GRCE-D | | | 2.68 | % (a)(b) | | | 12/10/2040 | | | | 19,331,739 | |
68,881,000 | | Great Wolf Trust, Series 2019-WOLF-E (1 Month LIBOR USD + 2.73%, 2.73% Floor) | | | 2.84 | % (a) | | | 12/15/2036 | | | | 67,135,032 | |
75,048,000 | | Great Wolf Trust, Series 2019-WOLF-F (1 Month LIBOR USD + 3.13%, 3.13% Floor) | | | 3.24 | % (a) | | | 12/15/2036 | | | | 71,981,058 | |
25,725,000 | | Greystone Commercial Real Estate Notes, Series 2019-FL2-B (1 Month LIBOR USD + 1.60%, 1.60% Floor) | | | 1.71 | % (a) | | | 09/15/2037 | | | | 25,686,413 | |
14,873,000 | | Greystone Commercial Real Estate Notes, Series 2019-FL2-C (1 Month LIBOR USD + 2.00%, 2.00% Floor) | | | 2.11 | % (a) | | | 09/15/2037 | | | | 14,872,167 | |
9,980,847 | | GS Mortgage Securities Corporation Trust, Series 2012-ALOH-A | | | 3.55 | % (a) | | | 04/10/2034 | | | | 10,128,041 | |
7,968,000 | | GS Mortgage Securities Corporation Trust, Series 2019-BOCA-A (1 Month LIBOR USD + 1.20%, 1.20% Floor) | | | 1.31 | % (a) | | | 06/15/2038 | | | | 7,992,493 | |
7,561,000 | | GS Mortgage Securities Corporation Trust, Series 2020-UPTN-D | | | 3.25 | % (a)(b) | | | 02/10/2037 | | | | 7,415,841 | |
8,967,000 | | GS Mortgage Securities Corporation Trust, Series 2020-UPTN-E | | | 3.25 | % (a)(b) | | | 02/10/2037 | | | | 8,497,000 | |
6,760,500 | | GS Mortgage Securities Corporation Trust, Series 2020-UPTN-F | | | 3.25 | % (a)(b) | | | 02/10/2037 | | | | 6,172,428 | |
5,133,161 | | GS Mortgage Securities Corporation, Series 2011-GC3-X | | | 0.17 | % (a)(b)(f) | | | 03/10/2044 | | | | 51 | |
21,159,027 | | GS Mortgage Securities Corporation, Series 2013-GC10-XA | | | 1.49 | % (b)(f) | | | 02/10/2046 | | | | 475,331 | |
209,853,664 | | GS Mortgage Securities Corporation, Series 2015-GC28-XA | | | 0.99 | % (b)(f) | | | 02/10/2048 | | | | 6,681,930 | |
220,020,613 | | GS Mortgage Securities Corporation, Series 2015-GC32-XA | | | 0.74 | % (b)(f) | | | 07/10/2048 | | | | 5,908,522 | |
157,554,084 | | GS Mortgage Securities Corporation, Series 2015-GC34-XA | | | 1.22 | % (b)(f) | | | 10/10/2048 | | | | 7,143,408 | |
203,774,321 | | GS Mortgage Securities Corporation, Series 2018-GS9-XA | | | 0.44 | % (b)(f) | | | 03/10/2051 | | | | 5,202,195 | |
16,399,000 | | GS Mortgage Securities Corporation, Series 2018-LUAU-A (1 Month LIBOR USD + 1.00%, 1.00% Floor) | | | 1.11 | % (a) | | | 11/15/2032 | | | | 16,421,180 | |
34,121,000 | | GS Mortgage Securities Corporation, Series 2018-TWR-A (1 Month LIBOR USD + 0.90%, 0.90% Floor) | | | 1.01 | % (a) | | | 07/15/2031 | | | | 33,980,360 | |
3,897,000 | | GS Mortgage Securities Corporation, Series 2018-TWR-D (1 Month LIBOR USD + 1.60%, 1.60% Floor) | | | 1.71 | % (a) | | | 07/15/2031 | | | | 3,839,441 | |
11,950,000 | | GS Mortgage Securities Corporation, Series 2018-TWR-E (1 Month LIBOR USD + 2.10%, 2.10% Floor) | | | 2.21 | % (a) | | | 07/15/2031 | | | | 11,481,098 | |
11,242,000 | | GS Mortgage Securities Corporation, Series 2018-TWR-F (1 Month LIBOR USD + 2.80%, 2.80% Floor) | | | 2.91 | % (a) | | | 07/15/2031 | | | | 10,575,844 | |
4,648,000 | | GS Mortgage Securities Corporation, Series 2018-TWR-G (1 Month LIBOR USD + 3.92%, 3.93% Floor) | | | 4.03 | % (a) | | | 07/15/2031 | | | | 4,060,762 | |
23,022,000 | | GS Mortgage Securities Corporation, Series 2019-SOHO-E (1 Month LIBOR USD + 1.87%, 1.88% Floor) | | | 1.98 | % (a) | | | 06/15/2036 | | | | 21,933,034 | |
87,021,737 | | GS Mortgage Securities Trust, Series 2012-GC6-XA | | | 1.92 | % (a)(b)(f) | | | 01/10/2045 | | | | 482,118 | |
14,645,000 | | GS Mortgage Securities Trust, Series 2015-GC28-C | | | 4.32 | % (b) | | | 02/10/2048 | | | | 15,622,152 | |
66,234,986 | | GS Mortgage Securities Trust, Series 2015-GS1-XA | | | 0.76 | % (b)(f) | | | 11/10/2048 | | | | 2,015,431 | |
41,955,167 | | GS Mortgage Securities Trust, Series 2016-GS2-XA | | | 1.75 | % (b)(f) | | | 05/10/2049 | | | | 3,028,261 | |
274,082,123 | | GS Mortgage Securities Trust, Series 2016-GS3-XA | | | 1.22 | % (b)(f) | | | 10/10/2049 | | | | 14,666,518 | |
59,348,627 | | GS Mortgage Securities Trust, Series 2016-GS4-XA | | | 0.50 | % (b)(f) | | | 11/10/2049 | | | | 1,412,806 | |
188,793,560 | | GS Mortgage Securities Trust, Series 2017-GS7-XA | | | 1.12 | % (b)(f) | | | 08/10/2050 | | | | 9,996,015 | |
98,700,000 | | GS Mortgage Securities Trust, Series 2017-GS7-XB | | | 0.35 | % (b)(f) | | | 08/10/2050 | | | | 1,942,150 | |
3,443,000 | | GS Mortgage Securities Trust, Series 2018-GS10-WLSA | | | 4.58 | % (a)(b) | | | 03/10/2033 | | | | 3,734,613 | |
6,834,000 | | GS Mortgage Securities Trust, Series 2018-GS10-WLSB | | | 4.58 | % (a)(b) | | | 03/10/2033 | | | | 7,173,998 | |
9,287,000 | | GS Mortgage Securities Trust, Series 2018-GS10-WLSC | | | 4.58 | % (a)(b) | | | 03/10/2033 | | | | 9,437,048 | |
8,990,000 | | GS Mortgage Securities Trust, Series 2018-GS10-WLSD | | | 4.58 | % (a)(b) | | | 03/10/2033 | | | | 8,859,776 | |
11,236,750 | | GS Mortgage Securities Trust, Series 2018-GS10-WLSE | | | 4.58 | % (a)(b) | | | 03/10/2033 | | | | 10,806,198 | |
9,793,000 | | GS Mortgage Securities Trust, Series 2018-GS9-C | | | 4.36 | % (b) | | | 03/10/2051 | | | | 10,559,118 | |
60,834,999 | | GS Mortgage Securities Trust, Series 2019-GC38-XA | | | 0.96 | % (b)(f) | | | 02/10/2052 | | | | 3,762,091 | |
17,143,547 | | GS Mortgage Securities Trust, Series 2019-GC39-XA | | | 1.14 | % (b)(f) | | | 05/10/2052 | | | | 1,156,355 | |
182,050,907 | | GS Mortgage Securities Trust, Series 2020-GC45-XA | | | 0.67 | % (b)(f) | | | 02/13/2053 | | | | 8,774,544 | |
56,391,932 | | GS Mortgage Securities Trust, Series 2020-GSA2-XA | | | 1.74 | % (a)(b)(f) | | | 12/12/2053 | | | | 7,196,174 | |
4,628,000 | | GS Mortgage-Backed Securities Trust, Series 2015-GC32-C | | | 4.42 | % (b) | | | 07/10/2048 | | | | 4,938,130 | |
5,692,000 | | Hilton USA Trust, Series 2016-SFP-A | | | 2.83 | % (a) | | | 11/05/2035 | | | | 5,705,294 | |
33,600,610 | | HPLY Trust, Series 2019-HIT-F (1 Month LIBOR USD + 3.15%, 3.15% Floor) | | | 3.26 | % (a) | | | 11/15/2036 | | | | 32,250,034 | |
14,080,000 | | Hunt Ltd., Series 2018-FL2-A (1 Month LIBOR USD + 1.08%, 1.08% Floor) | | | 1.19 | % (a) | | | 08/15/2028 | | | | 14,120,480 | |
8,420,221 | | IMT Trust, Series 2017-APTS-BFL (1 Month LIBOR USD + 0.95%, 0.95% Floor) | | | 1.06 | % (a) | | | 06/15/2034 | | | | 8,414,652 | |
2,636,233 | | IMT Trust, Series 2017-APTS-CFL (1 Month LIBOR USD + 1.10%, 1.10% Floor) | | | 1.21 | % (a) | | | 06/15/2034 | | | | 2,637,097 | |
2,365,000 | | J.P. Morgan Chase Commercial Mortgage Securities Trust, Series 2019-MFP-D (1 Month LIBOR USD + 1.66%, 1.66% Floor) | | | 1.77 | % (a) | | | 07/15/2036 | | | | 2,345,330 | |
399,231 | | JP Morgan Chase Commercial Mortgage Securities Corporation, Series 2004-CBX-X1 | | | 0.96 | % (a)(b)(f) | | | 01/12/2037 | | | | 962 | |
1,056,295 | | JP Morgan Chase Commercial Mortgage Securities Corporation, Series 2006-LDP8-X | | | 0.29 | % (b)(f) | | | 05/15/2045 | | | | 11 | |
6,092,177 | | JP Morgan Chase Commercial Mortgage Securities Corporation, Series 2007-CB18-X | | | 0.66 | % (b)(f) | | | 06/12/2047 | | | | 61 | |
46,998,057 | | JP Morgan Chase Commercial Mortgage Securities Corporation, Series 2007-CB20-X1 | | | (a | )(b)(f) | | | 02/12/2051 | | | | 470 | |
120,224,717 | | JP Morgan Chase Commercial Mortgage Securities Corporation, Series 2012-C6-XA | | | 1.54 | % (b)(f) | | | 05/15/2045 | | | | 1,352,949 | |
246,332,899 | | JP Morgan Chase Commercial Mortgage Securities Corporation, Series 2012-C8-XA | | | 1.74 | % (b)(f) | | | 10/15/2045 | | | | 4,859,655 | |
91,892,108 | | JP Morgan Chase Commercial Mortgage Securities Corporation, Series 2012-CBX-XA | | | 1.47 | % (b)(f) | | | 06/15/2045 | | | | 615,172 | |
14,535,000 | | JP Morgan Chase Commercial Mortgage Securities Corporation, Series 2014-C20-B | | | 4.40 | % (b) | | | 07/15/2047 | | | | 15,706,488 | |
59,571,927 | | JP Morgan Chase Commercial Mortgage Securities Corporation, Series 2015-JP1-XA | | | 0.92 | % (b)(f) | | | 01/15/2049 | | | | 2,095,824 | |
1,130,205 | | JP Morgan Chase Commercial Mortgage Securities Corporation, Series 2017-FL10-D (1 Month LIBOR USD + 1.90%, 1.90% Floor) | | | 2.01 | % (a) | | | 06/15/2032 | | | | 1,127,726 | |
2,108,000 | | JP Morgan Chase Commercial Mortgage Securities Corporation, Series 2018-AON-E | | | 4.61 | % (a)(b) | | | 07/05/2031 | | | | 2,184,251 | |
39,198,149 | | JP Morgan Chase Commercial Mortgage Securities Corporation, Series 2018-LAQ-A (1 Month LIBOR USD + 1.00%, 1.00% Floor) | | | 1.11 | % (a) | | | 06/15/2032 | | | | 39,256,914 | |
9,343,000 | | JP Morgan Chase Commercial Mortgage Securities Corporation, Series 2018-MINN-E (1 Month LIBOR USD + 2.50%, 3.50% Floor) | | | 3.50 | % (a) | | | 11/15/2035 | | | | 7,184,135 | |
1,307,000 | | JP Morgan Chase Commercial Mortgage Securities Trust, Series 2011-C4-C | | | 5.42 | % (a)(b) | | | 07/15/2046 | | | | 1,307,312 | |
1,975,000 | | JP Morgan Chase Commercial Mortgage Securities Trust, Series 2011-C5-C | | | 5.42 | % (a)(b) | | | 08/15/2046 | | | | 1,982,440 | |
4,857,000 | | JP Morgan Chase Commercial Mortgage Securities Trust, Series 2016-WIKI-E | | | 4.01 | % (a)(b) | | | 10/05/2031 | | | | 4,707,196 | |
428,000 | | JP Morgan Chase Commercial Mortgage Securities Trust, Series 2017-C5-AS | | | 3.86 | % (b) | | | 03/15/2050 | | | | 466,859 | |
6,954,000 | | JP Morgan Chase Commercial Mortgage Securities Trust, Series 2018-ASH8-B (1 Month LIBOR USD + 1.25%, 1.14% Floor) | | | 1.36 | % (a) | | | 02/15/2035 | | | | 6,977,889 | |
905,000 | | JP Morgan Chase Commercial Mortgage Securities Trust, Series 2018-ASH8-C (1 Month LIBOR USD + 1.45%, 1.34% Floor) | | | 1.56 | % (a) | | | 02/15/2035 | | | | 899,904 | |
1,145,000 | | JP Morgan Chase Commercial Mortgage Securities Trust, Series 2018-BCON-E | | | 3.76 | % (a)(b) | | | 01/05/2031 | | | | 1,127,278 | |
5,831,000 | | JP Morgan Chase Commercial Mortgage Securities Trust, Series 2018-WPT-EFX | | | 5.54 | % (a) | | | 07/05/2033 | | | | 6,013,073 | |
6,097,000 | | JP Morgan Chase Commercial Mortgage Securities Trust, Series 2018-WPT-FFX | | | 5.54 | % (a)(b) | | | 07/05/2033 | | | | 6,154,881 | |
13,604,000 | | JP Morgan Chase Commercial Mortgage Securities Trust, Series 2019-COR6-AS | | | 3.41 | % (b) | | | 11/13/2052 | | | | 14,577,470 | |
7,366,000 | | JP Morgan Chase Commercial Mortgage Securities Trust, Series 2020-ACE-C | | | 3.69 | % (a)(b) | | | 01/10/2037 | | | | 6,935,641 | |
40,424,000 | | JP Morgan Chase Commercial Mortgage Securities Trust, Series 2020-NNN-EFX | | | 3.97 | % (a) | | | 01/16/2037 | | | | 40,477,004 | |
75,256,757 | | JPMBB Commercial Mortgage Securities Trust, Series 2014-C18-XA | | | 0.81 | % (b)(f) | | | 02/15/2047 | | | | 1,445,148 | |
3,396,000 | | JPMBB Commercial Mortgage Securities Trust, Series 2014-C21-C | | | 4.65 | % (b) | | | 08/15/2047 | | | | 3,395,980 | |
171,922,702 | | JPMBB Commercial Mortgage Securities Trust, Series 2014-C25-XA | | | 0.84 | % (b)(f) | | | 11/15/2047 | | | | 4,446,540 | |
6,499,000 | | JPMBB Commercial Mortgage Securities Trust, Series 2014-C26-C | | | 4.38 | % (b) | | | 01/15/2048 | | | | 6,770,788 | |
183,922,884 | | JPMBB Commercial Mortgage Securities Trust, Series 2014-C26-XA | | | 0.96 | % (b)(f) | | | 01/15/2048 | | | | 5,397,143 | |
13,992,000 | | JPMBB Commercial Mortgage Securities Trust, Series 2015-C27-C | | | 4.35 | % (b) | | | 02/15/2048 | | | | 14,234,056 | |
10,425,000 | | JPMBB Commercial Mortgage Securities Trust, Series 2015-C27-D | | | 3.85 | % (a)(b) | | | 02/15/2048 | | | | 9,350,157 | |
305,000 | | JPMBB Commercial Mortgage Securities Trust, Series 2015-C28-B | | | 3.99 | % | | | 10/15/2048 | | | | 316,351 | |
20,569,088 | | JPMBB Commercial Mortgage Securities Trust, Series 2015-C28-C | | | 4.15 | % (b) | | | 10/15/2048 | | | | 21,092,234 | |
33,286,278 | | JPMBB Commercial Mortgage Securities Trust, Series 2015-C28-XA | | | 0.97 | % (b)(f) | | | 10/15/2048 | | | | 1,001,701 | |
40,381,229 | | JPMBB Commercial Mortgage Securities Trust, Series 2015-C29-XA | | | 0.65 | % (b)(f) | | | 05/15/2048 | | | | 930,464 | |
144,683,952 | | JPMBB Commercial Mortgage Securities Trust, Series 2015-C30-XA | | | 0.51 | % (b)(f) | | | 07/15/2048 | | | | 2,716,195 | |
23,865,000 | | JPMBB Commercial Mortgage Securities Trust, Series 2015-C32-C | | | 4.65 | % (b) | | | 11/15/2048 | | | | 20,120,820 | |
69,648,149 | | JPMBB Commercial Mortgage Securities Trust, Series 2015-C32-XA | | | 1.21 | % (b)(f) | | | 11/15/2048 | | | | 2,200,450 | |
17,630,000 | | JPMBB Commercial Mortgage Securities Trust, Series 2015-C33-C | | | 4.61 | % (b) | | | 12/15/2048 | | | | 18,625,520 | |
32,345,000 | | JPMBB Commercial Mortgage Securities Trust, Series 2016-C1-C | | | 4.74 | % (b) | | | 03/15/2049 | | | | 35,483,380 | |
22,220,487 | | JPMBB Commercial Mortgage Securities Trust, Series 2016-C1-XA | | | 1.29 | % (b)(f) | | | 03/15/2049 | | | | 980,717 | |
126,759,570 | | JPMBB Commercial Mortgage Securities Trust, Series 2016-C2-XA | | | 1.56 | % (b)(f) | | | 06/15/2049 | | | | 7,072,259 | |
154,014,829 | | JPMBB Commercial Mortgage Securities Trust, Series 2017-C5-XA | | | 0.95 | % (b)(f) | | | 03/15/2050 | | | | 6,798,846 | |
1,725,000 | | JPMCC Commercial Mortgage Securities Trust, Series 2017-JP5-C | | | 3.87 | % (b) | | | 03/15/2050 | | | | 1,801,192 | |
92,699,447 | | JPMCC Commercial Mortgage Securities Trust, Series 2019-COR5-XA | | | 1.50 | % (b)(f) | | | 06/13/2052 | | | | 8,556,196 | |
1,844,000 | | JPMDB Commercial Mortgage Securities Trust, Series 2018-C8-C | | | 4.74 | % (b) | | | 06/15/2051 | | | | 1,999,672 | |
1,435,000 | | JPMDB Commercial Mortgage Securities Trust, Series 2020-COR7-B | | | 3.29 | % (b) | | | 05/13/2053 | | | | 1,498,009 | |
281,794,197 | | JPMDB Commercial Mortgage Securities Trust, Series 2020-COR7-XA | | | 1.66 | % (b)(f) | | | 05/13/2053 | | | | 30,489,287 | |
11,956,151 | | KKR Industrial Portfolio Trust, Series 2020-AIP-C (1 Month LIBOR USD + 1.63%, 1.63% Floor) | | | 1.74 | % (a) | | | 03/15/2037 | | | | 12,023,415 | |
10,520,449 | | KKR Industrial Portfolio Trust, Series 2020-AIP-F (1 Month LIBOR USD + 3.43%, 3.43% Floor) | | | 3.54 | % (a) | | | 03/15/2037 | | | | 10,573,037 | |
10,500,000 | | KKR Industrial Portfolio Trust, Series 2021-KDIP-F (1 Month LIBOR USD + 2.05%, 2.05% Floor) | | | 2.16 | % (a) | | | 12/15/2037 | | | | 10,530,916 | |
3,500,000 | | KREF Ltd., Series 2018-FL1-AS (1 Month LIBOR USD + 1.35%, 1.35% Floor) | | | 1.46 | % (a) | | | 06/15/2036 | | | | 3,510,063 | |
5,325,200 | | LB-UBS Commercial Mortgage Trust, Series 2006-C7-XCL | | | 0.41 | % (a)(b)(f) | | | 11/15/2038 | | | | 994 | |
23,953,000 | | LMREC, Inc., Series 2019-CRE3-A (1 Month LIBOR USD + 1.40%, 1.40% Floor) | | | 1.51 | % (a) | | | 12/22/2035 | | | | 23,988,930 | |
1,604,494 | | LoanCore Issuer Ltd., Series 2018-CRE1-A (1 Month LIBOR USD + 1.13%, 1.13% Floor) | | | 1.24 | % (a) | | | 05/15/2028 | | | | 1,604,494 | |
24,463,000 | | LoanCore Issuer Ltd., Series 2019-CRE2-A (1 Month LIBOR USD + 1.13%, 1.13% Floor) | | | 1.24 | % (a) | | | 05/15/2036 | | | | 24,492,062 | |
45,101,000 | | LoanCore Issuer Ltd., Series 2019-CRE2-AS (1 Month LIBOR USD + 1.50%, 1.50% Floor) | | | 1.61 | % (a) | | | 05/15/2036 | | | | 45,140,463 | |
12,625,000 | | LoanCore Issuer Ltd., Series 2019-CRE2-B (1 Month LIBOR USD + 1.70%, 1.70% Floor) | | | 1.81 | % (a) | | | 05/15/2036 | | | | 12,648,672 | |
20,439,902 | | LSTAR Commercial Mortgage Trust, Series 2017-5-X | | | 0.99 | % (a)(b)(f) | | | 03/10/2050 | | | | 600,874 | |
5,731,000 | | Manhattan West Mortgage Trust, Series 2020-1MW-C | | | 2.33 | % (a)(b) | | | 09/10/2039 | | | | 5,703,553 | |
3,510,000 | | Manhattan West Mortgage Trust, Series 2020-1MW-D | | | 2.33 | % (a)(b) | | | 09/10/2039 | | | | 3,431,074 | |
3,203,931 | | Marathon CRE, Series 2018-FL1-A (1 Month LIBOR USD + 1.15%, 1.15% Floor) | | | 1.26 | % (a) | | | 06/15/2028 | | | | 3,208,736 | |
3,559,000 | | MBRT, Series 2019-MBR-A (1 Month LIBOR USD + 0.85%, 0.85% Floor) | | | 0.96 | % (a) | | | 11/15/2036 | | | | 3,562,602 | |
10,350,000 | | Merit Commercial mortgage Pass-Through Certificates, Series 2020-HILL-E (1 Month LIBOR USD + 3.10%, 3.10% Floor) | | | 3.21 | % (a) | | | 08/15/2037 | | | | 10,437,373 | |
5,950,000 | | Merit Commercial Mortgage Pass-Through Certificates, Series 2020-HILL-F (1 Month LIBOR USD + 4.10%, 4.10% Floor) | | | 4.21 | % (a) | | | 08/15/2037 | | | | 6,020,981 | |
170,880,000 | | Merit Commercial mortgage Pass-Through Certificates, Series 2020-HILL-XCP | | | 0.74 | % (a)(b)(f) | | | 08/15/2037 | | | | 1,112,959 | |
3,131,327 | | Merrill Lynch Mortgage Investors Trust, Series 1998-C1-IO | | | 1.84 | % (b)(f) | | | 11/15/2026 | | | | 31 | |
11,498,000 | | MF1 Ltd., Series 2020-FL3-A (1 Month LIBOR USD + 2.05%) | | | 2.16 | % (a) | | | 07/15/2035 | | | | 11,659,386 | |
10,000,000 | | MF1 Multifamily Housing Mortgage Loan Trust, Series 2021-FL5-A (1 Month LIBOR USD + 0.85%, 0.85% Floor) | | | 0.96 | % (a) | | | 07/15/2036 | | | | 10,035,000 | |
10,000,000 | | MF1 Multifamily Housing Mortgage Loan Trust, Series 2021-FL5-AS (1 Month LIBOR USD + 1.20%, 1.20% Floor) | | | 1.31 | % (a) | | | 07/15/2036 | | | | 10,035,000 | |
3,600,000 | | MF1 Multifamily Housing Mortgage Loan Trust, Series 2021-FL5-C (1 Month LIBOR USD + 1.70%, 1.70% Floor) | | | 1.81 | % (a) | | | 07/15/2036 | | | | 3,612,600 | |
12,625,000 | | MFT Trust, Series 2020-ABC-A | | | 3.36 | % (a) | | | 02/10/2042 | | | | 12,911,529 | |
5,326,000 | | MFT Trust, Series 2020-ABC-B | | | 3.48 | % (a)(b) | | | 02/10/2042 | | | | 5,396,473 | |
1,000,000 | | MKT Mortgage Trust, Series 2020-525M-F | | | 2.94 | % (a)(b) | | | 02/12/2040 | | | | 888,702 | |
11,401,000 | | Morgan Stanley Bank of America Merrill Lynch Trust, Series 2012-CKSV-CK | | | 4.16 | % (a)(b) | | | 10/15/2030 | | | | 9,568,545 | |
137,434,119 | | Morgan Stanley Bank of America Merrill Lynch Trust, Series 2013-C12-XA | | | 0.59 | % (b)(f) | | | 10/15/2046 | | | | 1,642,681 | |
29,832,592 | | Morgan Stanley Bank of America Merrill Lynch Trust, Series 2013-C7-XA | | | 1.33 | % (b)(f) | | | 02/15/2046 | | | | 563,427 | |
13,450,000 | | Morgan Stanley Bank of America Merrill Lynch Trust, Series 2014-C18-C | | | 4.52 | % (b) | | | 10/15/2047 | | | | 14,300,651 | |
37,950,000 | | Morgan Stanley Bank of America Merrill Lynch Trust, Series 2014-C19-C | | | 4.00 | % | | | 12/15/2047 | | | | 39,647,162 | |
20,087,700 | | Morgan Stanley Bank of America Merrill Lynch Trust, Series 2015-C20-B | | | 4.16 | % | | | 02/15/2048 | | | | 21,636,542 | |
5,457,500 | | Morgan Stanley Bank of America Merrill Lynch Trust, Series 2015-C20-C | | | 4.46 | % (b) | | | 02/15/2048 | | | | 5,825,676 | |
203,558,968 | | Morgan Stanley Bank of America Merrill Lynch Trust, Series 2015-C20-XA | | | 1.28 | % (b)(f) | | | 02/15/2048 | | | | 7,530,562 | |
10,616,000 | | Morgan Stanley Bank of America Merrill Lynch Trust, Series 2015-C23-C | | | 4.14 | % (b) | | | 07/15/2050 | | | | 11,032,748 | |
8,460,000 | | Morgan Stanley Bank of America Merrill Lynch Trust, Series 2015-C25-C | | | 4.53 | % (b) | | | 10/15/2048 | | | | 9,049,312 | |
10,056,000 | | Morgan Stanley Bank of America Merrill Lynch Trust, Series 2015-C27-B | | | 4.52 | % (b) | | | 12/15/2047 | | | | 10,861,972 | |
19,422,000 | | Morgan Stanley Bank of America Merrill Lynch Trust, Series 2015-C27-C | | | 4.52 | % (b) | | | 12/15/2047 | | | | 20,112,394 | |
1,517,000 | | Morgan Stanley Bank of America Merrill Lynch Trust, Series 2015-C27-D | | | 3.24 | % (a)(b) | | | 12/15/2047 | | | | 1,322,429 | |
149,080,459 | | Morgan Stanley Bank of America Merrill Lynch Trust, Series 2016-C28-XA | | | 1.20 | % (b)(f) | | | 01/15/2049 | | | | 6,345,386 | |
7,564,000 | | Morgan Stanley Bank of America Merrill Lynch Trust, Series 2016-C31-C | | | 4.30 | % (b) | | | 11/15/2049 | | | | 7,683,876 | |
50,647,223 | | Morgan Stanley Bank of America Merrill Lynch Trust, Series 2017-C33-XA | | | 1.39 | % (b)(f) | | | 05/15/2050 | | | | 2,674,538 | |
19,618,391 | | Morgan Stanley Capital Trust, Series 2006-HQ10-X1 | | | 0.19 | % (a)(b)(f) | | | 11/12/2041 | | | | 196 | |
9,900,000 | | Morgan Stanley Capital Trust, Series 2007-T27-B | | | 6.02 | % (a)(b) | | | 06/11/2042 | | | | 10,179,487 | |
7,137,000 | | Morgan Stanley Capital Trust, Series 2015-UBS8-B | | | 4.32 | % (b) | | | 12/15/2048 | | | | 7,206,882 | |
26,179,781 | | Morgan Stanley Capital Trust, Series 2015-UBS8-XA | | | 0.87 | % (b)(f) | | | 12/15/2048 | | | | 888,675 | |
12,140,000 | | Morgan Stanley Capital Trust, Series 2017-ASHF-D (1 Month LIBOR USD + 2.20%, 2.20% Floor) | | | 2.31 | % (a) | | | 11/15/2034 | | | | 12,042,054 | |
17,935,000 | | Morgan Stanley Capital Trust, Series 2017-ASHF-E (1 Month LIBOR USD + 3.15%, 3.15% Floor) | | | 3.26 | % (a) | | | 11/15/2034 | | | | 17,533,238 | |
9,187,000 | | Morgan Stanley Capital Trust, Series 2017-ASHF-F (1 Month LIBOR USD + 4.35%, 4.35% Floor) | | | 4.46 | % (a) | | | 11/15/2034 | | | | 8,571,388 | |
158,194,494 | | Morgan Stanley Capital Trust, Series 2017-H1-XA | | | 1.41 | % (b)(f) | | | 06/15/2050 | | | | 9,026,657 | |
8,000,000 | | Morgan Stanley Capital Trust, Series 2018-MP-E | | | 4.28 | % (a)(b) | | | 07/11/2040 | | | | 7,063,613 | |
11,392,000 | | Morgan Stanley Capital Trust, Series 2018-SUN-D (1 Month LIBOR USD + 1.65%, 1.65% Floor) | | | 1.76 | % (a) | | | 07/15/2035 | | | | 11,351,263 | |
20,425,000 | | Morgan Stanley Capital Trust, Series 2018-SUN-F (1 Month LIBOR USD + 2.55%, 2.55% Floor) | | | 2.66 | % (a) | | | 07/15/2035 | | | | 20,253,026 | |
10,748,000 | | Morgan Stanley Capital Trust, Series 2018-SUN-G (1 Month LIBOR USD + 3.05%, 3.05% Floor) | | | 3.16 | % (a) | | | 07/15/2035 | | | | 10,490,833 | |
5,305,000 | | Morgan Stanley Capital Trust, Series 2019-H7-AS | | | 3.52 | % | | | 07/15/2052 | | | | 5,681,186 | |
78,977,034 | | Morgan Stanley Capital Trust, Series 2019-L2-XA | | | 1.03 | % (b)(f) | | | 03/15/2052 | | | | 5,350,615 | |
3,845,000 | | Morgan Stanley Capital Trust, Series 2019-L3-AS | | | 3.49 | % | | | 11/15/2052 | | | | 4,115,372 | |
157,294,340 | | Morgan Stanley Capital Trust, Series 2019-L3-XA | | | 0.64 | % (b)(f) | | | 11/15/2052 | | | | 7,585,315 | |
1,315,000 | | Morgan Stanley Capital Trust, Series 2019-PLND-B (1 Month LIBOR USD + 1.30%, 1.30% Floor) | | | 1.41 | % (a) | | | 05/15/2036 | | | | 1,271,510 | |
6,002,000 | | Morgan Stanley Capital Trust, Series 2019-PLND-E (1 Month LIBOR USD + 2.15%, 2.15% Floor) | | | 2.26 | % (a) | | | 05/15/2036 | | | | 5,374,477 | |
2,200,000 | | Morgan Stanley Capital Trust, Series 2020-HR8-B | | | 2.70 | % | | | 07/15/2053 | | | | 2,222,686 | |
5,650,000 | | Morgan Stanley Capital Trust, Series 2020-HR8-C | | | 3.71 | % (b) | | | 07/15/2053 | | | | 5,945,190 | |
24,004,000 | | Morgan Stanley Capital Trust, Series 2020-L4-B | | | 3.08 | % | | | 02/15/2053 | | | | 24,296,426 | |
288,159,395 | | Morgan Stanley Capital Trust, Series 2020-L4-XA | | | 1.08 | % (b)(f) | | | 02/15/2053 | | | | 22,879,020 | |
4,661,000 | | Morgan Stanley Capital, Series 2017-HR2-C | | | 4.22 | % (b) | | | 12/15/2050 | | | | 4,959,491 | |
7,794,000 | | MRCD Mortgage Trust, Series 2019-PARK-F | | | 2.72 | % (a) | | | 12/15/2036 | | | | 7,472,618 | |
46,459,000 | | MRCD Mortgage Trust, Series 2019-PARK-G | | | 2.72 | % (a) | | | 12/15/2036 | | | | 43,905,302 | |
2,116,000 | | MSCG Trust, Series 2018-SELF-F (1 Month LIBOR USD + 3.05%, 3.05% Floor) | | | 3.16 | % (a) | | | 10/15/2037 | | | | 2,140,042 | |
14,496,298 | | Natixis Commercial Mortgage Securities Trust, Series 2018-FL1-A (1 Month LIBOR USD + 0.95%, 0.95% Floor) | | | 1.06 | % (a) | | | 06/15/2035 | | | | 14,330,310 | |
13,188,800 | | Natixis Commercial Mortgage Securities Trust, Series 2020-2PAC-D | | | 3.75 | % (a) | | | 12/15/2038 | | | | 13,229,749 | |
14,792,000 | | NLY Commercial Mortgage Trust, Series 2019-FL2-AS (1 Month LIBOR USD + 1.60%, 1.60% Floor) | | | 1.71 | % (a) | | | 02/15/2036 | | | | 14,835,370 | |
3,725,000 | | NLY Commercial Mortgage Trust, Series 2019-FL2-B (1 Month LIBOR USD + 1.90%, 1.90% Floor) | | | 2.01 | % (a) | | | 02/15/2036 | | | | 3,729,455 | |
4,425,000 | | NLY Commercial Mortgage Trust, Series 2019-FL2-C (1 Month LIBOR USD + 2.35%, 2.35% Floor) | | | 2.46 | % (a) | | | 02/15/2036 | | | | 4,414,384 | |
6,901,000 | | One Market Plaza Trust, Series 2017-1MKT-C | | | 4.02 | % (a) | | | 02/10/2032 | | | | 7,078,470 | |
2,000,000 | | PFP Ltd., Series 2021-7-A (1 Month LIBOR USD + 0.85%, 0.85% Floor) | | | 0.95 | % (a) | | | 04/14/2038 | | | | 2,000,750 | |
12,079,946 | | Rosslyn Portfolio Trust, Series 2017-ROSS-A (1 Month LIBOR USD + 0.95%, 1.94% Floor) | | | 1.94 | % (a) | | | 06/15/2033 | | | | 12,096,517 | |
13,415,147 | | Rosslyn Portfolio Trust, Series 2017-ROSS-B (1 Month LIBOR USD + 1.25%, 2.24% Floor) | | | 2.24 | % (a) | | | 06/15/2033 | | | | 13,499,247 | |
7,562,909 | | Tharaldson Hotel Portfolio Trust, Series 2018-THL-E (1 Month LIBOR USD + 3.33%, 3.18% Floor) | | | 3.43 | % (a) | | | 11/11/2034 | | | | 7,337,762 | |
12,261,000 | | TPG Real Estate Finance Issuer Ltd., Series 2021-FL4-A (1 Month LIBOR USD + 1.20%, 1.20% Floor) | | | 1.31 | % (a) | | | 03/15/2038 | | | | 12,311,577 | |
3,150,000 | | TRTX Issuer Ltd., Series 2019-FL3-A (1 Month LIBOR USD + 1.15%, 1.15% Floor) | | | 1.26 | % (a) | | | 10/15/2034 | | | | 3,159,056 | |
31,066,000 | | TRTX Issuer Ltd., Series 2019-FL3-AS (1 Month LIBOR USD + 1.45%, 1.45% Floor) | | | 1.56 | % (a) | | | 10/15/2034 | | | | 31,155,315 | |
8,000,000 | | UBS Commercial Mortgage Trust, Series 2017-C1-C | | | 4.44 | % | | | 06/15/2050 | | | | 7,750,932 | |
99,958,892 | | UBS Commercial Mortgage Trust, Series 2017-C1-XA | | | 1.52 | % (b)(f) | | | 06/15/2050 | | | | 7,187,094 | |
1,154,000 | | UBS Commercial Mortgage Trust, Series 2017-C2-C | | | 4.30 | % (b) | | | 08/15/2050 | | | | 1,156,055 | |
6,857,000 | | UBS Commercial Mortgage Trust, Series 2017-C3-B | | | 4.09 | % (b) | | | 08/15/2050 | | | | 7,264,042 | |
12,501,162 | | UBS Commercial Mortgage Trust, Series 2017-C3-XA | | | 1.09 | % (b)(f) | | | 08/15/2050 | | | | 633,069 | |
3,561,000 | | UBS Commercial Mortgage Trust, Series 2017-C4-B | | | 4.24 | % (b) | | | 10/15/2050 | | | | 3,781,463 | |
4,100,000 | | UBS Commercial Mortgage Trust, Series 2017-C5-C | | | 4.31 | % (b) | | | 11/15/2050 | | | | 4,245,855 | |
2,886,000 | | UBS Commercial Mortgage Trust, Series 2017-C6-C | | | 4.45 | % (b) | | | 12/15/2050 | | | | 3,037,263 | |
2,137,000 | | UBS Commercial Mortgage Trust, Series 2018-C12-B | | | 4.79 | % (b) | | | 08/15/2051 | | | | 2,347,646 | |
8,530,000 | | UBS Commercial Mortgage Trust, Series 2018-C8-C | | | 4.70 | % (b) | | | 02/15/2051 | | | | 9,341,292 | |
1,500,000 | | UBS Commercial Mortgage Trust, Series 2018-C9-C | | | 4.88 | % (b) | | | 03/15/2051 | | | | 1,622,993 | |
43,361,535 | | UBS Commercial Mortgage Trust, Series 2018-C9-XA | | | 0.88 | % (b)(f) | | | 03/15/2051 | | | | 2,258,394 | |
5,213,000 | | UBS Commercial Mortgage Trust, Series 2019-C16-AS | | | 3.89 | % | | | 04/15/2052 | | | | 5,794,303 | |
6,114,000 | | UBS Commercial Mortgage Trust, Series 2019-C16-B | | | 4.32 | % (b) | | | 04/15/2052 | | | | 6,673,314 | |
8,350,000 | | UBS Commercial Mortgage Trust, Series 2019-C17-AS | | | 3.20 | % | | | 10/15/2052 | | | | 8,613,544 | |
14,858,000 | | UBS Commercial Mortgage Trust, Series 2019-C18-AS | | | 3.38 | % (b) | | | 12/15/2052 | | | | 15,736,770 | |
9,705,000 | | UBS Commercial Mortgage Trust, Series 2019-C18-B | | | 3.68 | % (b) | | | 12/15/2052 | | | | 10,257,251 | |
68,321,757 | | UBS-Barclays Commercial Mortgage Trust, Series 2012-C3-XA | | | 1.81 | % (a)(b)(f) | | | 08/10/2049 | | | | 1,316,485 | |
4,346,710 | | Wells Fargo Commercial Mortgage Trust, Series 2014-LC18-B | | | 3.96 | % | | | 12/15/2047 | | | | 4,627,140 | |
11,460,000 | | Wells Fargo Commercial Mortgage Trust, Series 2015-C26-C | | | 4.07 | % (b) | | | 02/15/2048 | | | | 11,687,128 | |
374,730,496 | | Wells Fargo Commercial Mortgage Trust, Series 2015-C26-XA | | | 1.21 | % (b)(f) | | | 02/15/2048 | | | | 14,575,030 | |
3,187,500 | | Wells Fargo Commercial Mortgage Trust, Series 2015-C27-C | | | 3.89 | % | | | 02/15/2048 | | | | 3,181,567 | |
219,716,656 | | Wells Fargo Commercial Mortgage Trust, Series 2015-C27-XA | | | 0.89 | % (b)(f) | | | 02/15/2048 | | | | 6,027,157 | |
9,701,000 | | Wells Fargo Commercial Mortgage Trust, Series 2015-C31-C | | | 4.60 | % (b) | | | 11/15/2048 | | | | 10,128,063 | |
127,939,348 | | Wells Fargo Commercial Mortgage Trust, Series 2015-C31-XA | | | 0.97 | % (b)(f) | | | 11/15/2048 | | | | 4,712,505 | |
240,705,295 | | Wells Fargo Commercial Mortgage Trust, Series 2015-LC20-XA | | | 1.31 | % (b)(f) | | | 04/15/2050 | | | | 8,498,341 | |
12,000,000 | | Wells Fargo Commercial Mortgage Trust, Series 2015-LC22-C | | | 4.54 | % (b) | | | 09/15/2058 | | | | 12,626,201 | |
6,657,000 | | Wells Fargo Commercial Mortgage Trust, Series 2015-NXS2-C | | | 4.29 | % (b) | | | 07/15/2058 | | | | 7,065,314 | |
1,794,000 | | Wells Fargo Commercial Mortgage Trust, Series 2015-NXS4-C | | | 4.70 | % (b) | | | 12/15/2048 | | | | 1,936,672 | |
104,301,074 | | Wells Fargo Commercial Mortgage Trust, Series 2015-P2-XA | | | 0.93 | % (b)(f) | | | 12/15/2048 | | | | 3,846,905 | |
14,269,000 | | Wells Fargo Commercial Mortgage Trust, Series 2016-C32-C | | | 4.72 | % (b) | | | 01/15/2059 | | | | 14,987,715 | |
5,888,000 | | Wells Fargo Commercial Mortgage Trust, Series 2016-C34-C | | | 5.01 | % (b) | | | 06/15/2049 | | | | 5,345,571 | |
2,390,000 | | Wells Fargo Commercial Mortgage Trust, Series 2016-C35-B | | | 3.44 | % | | | 07/15/2048 | | | | 2,460,081 | |
10,988,000 | | Wells Fargo Commercial Mortgage Trust, Series 2016-C37-C | | | 4.49 | % (b) | | | 12/15/2049 | | | | 11,786,205 | |
1,640,000 | | Wells Fargo Commercial Mortgage Trust, Series 2016-LC24-C | | | 4.46 | % (b) | | | 10/15/2049 | | | | 1,681,964 | |
2,155,000 | | Wells Fargo Commercial Mortgage Trust, Series 2016-NXS6-C | | | 4.32 | % (b) | | | 11/15/2049 | | | | 2,256,171 | |
133,994,099 | | Wells Fargo Commercial Mortgage Trust, Series 2016-NXS6-XA | | | 1.61 | % (b)(f) | | | 11/15/2049 | | | | 7,266,272 | |
208,529,951 | | Wells Fargo Commercial Mortgage Trust, Series 2017-C39-XA | | | 1.11 | % (b)(f) | | | 09/15/2050 | | | | 11,064,912 | |
1,904,000 | | Wells Fargo Commercial Mortgage Trust, Series 2017-C42-C | | | 4.30 | % (b) | | | 12/15/2050 | | | | 2,021,883 | |
50,136,369 | | Wells Fargo Commercial Mortgage Trust, Series 2017-C42-XA | | | 0.88 | % (b)(f) | | | 12/15/2050 | | | | 2,433,008 | |
162,890,702 | | Wells Fargo Commercial Mortgage Trust, Series 2018-C43-XA | | | 0.67 | % (b)(f) | | | 03/15/2051 | | | | 6,353,552 | |
3,331,000 | | Wells Fargo Commercial Mortgage Trust, Series 2019-C49-C | | | 4.87 | % (b) | | | 03/15/2052 | | | | 3,652,814 | |
136,754,527 | | Wells Fargo Commercial Mortgage Trust, Series 2019-C50-XA | | | 1.42 | % (b)(f) | | | 05/15/2052 | | | | 11,948,899 | |
3,193,000 | | Wells Fargo Commercial Mortgage Trust, Series 2019-C51-B | | | 3.84 | % (b) | | | 06/15/2052 | | | | 3,409,750 | |
50,305,766 | | Wells Fargo Commercial Mortgage Trust, Series 2019-C51-XA | | | 1.37 | % (b)(f) | | | 06/15/2052 | | | | 4,247,638 | |
24,972,000 | | Wells Fargo Commercial Mortgage Trust, Series 2019-C52-AS | | | 3.14 | % | | | 08/15/2052 | | | | 26,028,555 | |
81,885,417 | | Wells Fargo Commercial Mortgage Trust, Series 2019-C52-XA | | | 1.62 | % (b)(f) | | | 08/15/2052 | | | | 8,425,887 | |
5,000,000 | | Wells Fargo Commercial Mortgage Trust, Series 2019-C53-C | | | 3.58 | % (b) | | | 10/15/2052 | | | | 5,099,729 | |
143,459,272 | | Wells Fargo Commercial Mortgage Trust, Series 2019-C54-XA | | | 0.84 | % (b)(f) | | | 12/15/2052 | | | | 8,675,556 | |
28,088,000 | | Wells Fargo Commercial Mortgage Trust, Series 2020-C55-AS | | | 2.94 | % | | | 02/15/2053 | | | | 28,628,278 | |
52,886,315 | | Wells Fargo Commercial Mortgage Trust, Series 2020-C55-XB | | | 0.82 | % (b)(f) | | | 02/15/2053 | | | | 3,406,534 | |
7,034,000 | | Wells Fargo Commercial Mortgage Trust, Series 2020-C56-B | | | 3.75 | % (b) | | | 06/15/2053 | | | | 7,640,352 | |
4,872,000 | | Wells Fargo Commercial Mortgage Trust, Series 2020-C56-C | | | 3.75 | % (b) | | | 06/15/2053 | | | | 5,148,640 | |
163,970,356 | | Wells Fargo Commercial Mortgage Trust, Series 2020-C56-XA | | | 1.43 | % (b)(f) | | | 06/15/2053 | | | | 15,666,597 | |
119,570,150 | | Wells Fargo Commercial Mortgage Trust, Series 2020-C57-XA | | | 2.10 | % (b)(f) | | | 08/15/2053 | | | | 18,082,749 | |
97,668,874 | | Wells Fargo Commercial Mortgage Trust, Series 2020-C58-XA | | | 1.89 | % (b)(f) | | | 07/15/2053 | | | | 13,575,817 | |
2,225,000 | | Wells Fargo Commercial Mortgage Trust, Series 2021-SAVE-C (1 Month LIBOR USD + 1.80%, 1.80% Floor) | | | 1.91 | % (a) | | | 02/15/2040 | | | | 2,239,253 | |
725,000 | | Wells Fargo Commercial Mortgage Trust, Series 2021-SAVE-D (1 Month LIBOR USD + 2.50%, 2.50% Floor) | | | 2.61 | % (a) | | | 02/15/2040 | | | | 732,744 | |
1,825,000 | | Wells Fargo Commercial Mortgage Trust, Series 2021-SAVE-E (1 Month LIBOR USD + 3.65%, 3.65% Floor) | | | 3.76 | % (a) | | | 02/15/2040 | | | | 1,851,623 | |
13,695,967 | | WF-RBS Commercial Mortgage Trust, Series 2011-C4-XA | | | 0.32 | % (a)(b)(f) | | | 06/15/2044 | | | | 137 | |
74,055,989 | | WF-RBS Commercial Mortgage Trust, Series 2012-C6-XA | | | 2.05 | % (a)(b)(f) | | | 04/15/2045 | | | | 381,588 | |
86,100,107 | | WF-RBS Commercial Mortgage Trust, Series 2012-C8-XA | | | 1.78 | % (a)(b)(f) | | | 08/15/2045 | | | | 1,221,132 | |
34,080,307 | | WF-RBS Commercial Mortgage Trust, Series 2012-C9-XA | | | 1.87 | % (a)(b)(f) | | | 11/15/2045 | | | | 710,534 | |
99,680,930 | | WF-RBS Commercial Mortgage Trust, Series 2013-C18-XA | | | 0.80 | % (b)(f) | | | 12/15/2046 | | | | 1,850,706 | |
150,385,804 | | WF-RBS Commercial Mortgage Trust, Series 2014-C19-XA | | | 1.01 | % (b)(f) | | | 03/15/2047 | | | | 3,195,623 | |
10,000,000 | | WF-RBS Commercial Mortgage Trust, Series 2014-C21-B | | | 4.21 | % (b) | | | 08/15/2047 | | | | 10,674,554 | |
8,000,000 | | WF-RBS Commercial Mortgage Trust, Series 2014-C25-C | | | 4.31 | % (b) | | | 11/15/2047 | | | | 7,923,550 | |
178,357,065 | | WF-RBS Commercial Mortgage Trust, Series 2014-C25-XA | | | 0.81 | % (b)(f) | | | 11/15/2047 | | | | 4,247,359 | |
| | | | | | | | | | | | | | |
Total Non-Agency Commercial Mortgage Backed Obligations (Cost $4,918,084,140) | | | | | | | | 4,541,277,017 | |
| | | | | | | | | | | | | | |
Non-Agency Residential Collateralized Mortgage Obligations—26.0% | | | | | |
110,141,368 | | ABFC Trust, Series 2007-WMC1-A1A (1 Month LIBOR USD + 1.25%, 1.25% Floor) | | | 1.36 | % | | | 06/25/2037 | | | | 97,987,841 | |
1,848,917 | | ACE Securities Corporation Home Equity Loan Trust, Series 2007-ASP1-A2C (1 Month LIBOR USD + 0.26%, 0.26% Floor) | | | 0.37 | % | | | 03/25/2037 | | | | 1,109,937 | |
14,452,400 | | ACE Securities Corporation Home Equity Loan Trust, Series 2007-HE1-A2B (1 Month LIBOR USD + 0.12%, 0.12% Floor) | | | 0.23 | % | | | 01/25/2037 | | | | 10,694,325 | |
3,367,749 | | ACE Securities Corporation Home Equity Loan Trust, Series 2007-HE1-A2C (1 Month LIBOR USD + 0.17%, 0.17% Floor) | | | 0.28 | % | | | 01/25/2037 | | | | 2,508,326 | |
3,157,265 | | ACE Securities Corporation Home Equity Loan Trust, Series 2007-HE1-A2D (1 Month LIBOR USD + 0.25%, 0.25% Floor) | | | 0.36 | % | | | 01/25/2037 | | | | 2,374,458 | |
79,859,059 | | ACE Securities Corporation Home Equity Loan Trust, Series 2007-WM1-A1A (1 Month LIBOR USD + 0.14%, 0.14% Floor) | | | 0.25 | % | | | 11/25/2036 | | | | 35,674,447 | |
4,405,436 | | ACE Securities Corporation Home Equity Loan Trust, Series 2007-WM1-A2A (1 Month LIBOR USD + 0.07%, 0.07% Floor) | | | 0.18 | % | | | 11/25/2036 | | | | 2,338,913 | |
4,762,618 | | ACE Securities Corporation Home Equity Loan Trust, Series 2007-WM1-A2D (1 Month LIBOR USD + 0.22%, 0.22% Floor) | | | 0.33 | % | | | 11/25/2036 | | | | 2,610,219 | |
3,224,860 | | ACE Securities Corporation Home Equity Loan Trust, Series 2007-WM2-A2C (1 Month LIBOR USD + 0.28%, 0.28% Floor) | | | 0.39 | % | | | 02/25/2037 | | | | 1,854,431 | |
2,827,108 | | ACE Securities Corporation Home Equity Loan Trust, Series 2007-WM2-A2D (1 Month LIBOR USD + 0.37%, 0.37% Floor) | | | 0.48 | % | | | 02/25/2037 | | | | 1,638,130 | |
1,663,258 | | Adjustable Rate Mortgage Trust, Series 2005-10-3A31 | | | 2.72 | % (b) | | | 01/25/2036 | | | | 1,632,291 | |
25,054,743 | | Adjustable Rate Mortgage Trust, Series 2005-11-4A1 | | | 2.90 | % (b) | | | 02/25/2036 | | | | 19,101,814 | |
2,801,912 | | Adjustable Rate Mortgage Trust, Series 2005-4-2A1 | | | 2.98 | % (b) | | | 08/25/2035 | | | | 2,775,443 | |
463,051 | | Adjustable Rate Mortgage Trust, Series 2005-7-3A1 | | | 3.31 | % (b) | | | 10/25/2035 | | | | 425,380 | |
6,047,838 | | Adjustable Rate Mortgage Trust, Series 2005-8-3A21 | | | 3.06 | % (b) | | | 11/25/2035 | | | | 5,422,440 | |
13,356,894 | | Adjustable Rate Mortgage Trust, Series 2006-1-2A1 | | | 3.54 | % (b) | | | 03/25/2036 | | | | 9,609,464 | |
9,287,553 | | Adjustable Rate Mortgage Trust, Series 2006-2-3A1 | | | 3.30 | % (b) | | | 05/25/2036 | | | | 9,114,072 | |
11,935,746 | | Adjustable Rate Mortgage Trust, Series 2006-2-5A1 | | | 3.77 | % (b) | | | 05/25/2036 | | | | 5,113,313 | |
7,841,904 | | Adjustable Rate Mortgage Trust, Series 2007-1-3A1 | | | 3.39 | % (b) | | | 03/25/2037 | | | | 7,536,117 | |
1,333,718 | | Adjustable Rate Mortgage Trust, Series 2007-3-1A1 | | | 4.19 | % (a)(b) | | | 11/25/2037 | | | | 1,486,757 | |
431,399 | | Aegis Asset Backed Securities Trust, Series 2003-2-M2 (1 Month LIBOR USD + 2.55%, 2.55% Floor) | | | 2.66 | % | | | 11/25/2033 | | | | 430,423 | |
1,432,492 | | Aegis Asset Backed Securities Trust, Series 2004-1-M2 (1 Month LIBOR USD + 2.03%, 2.03% Floor) | | | 2.14 | % | | | 04/25/2034 | | | | 1,339,877 | |
617,792 | | Aegis Asset Backed Securities Trust, Series 2004-2-M2 (1 Month LIBOR USD + 1.95%, 1.95% Floor) | | | 2.06 | % | | | 06/25/2034 | | | | 641,740 | |
8,291,289 | | Aegis Asset Backed Securities Trust, Series 2004-6-M2 (1 Month LIBOR USD + 1.00%, 1.00% Floor, 15.00% Cap) | | | 1.11 | % | | | 03/25/2035 | | | | 8,154,734 | |
51,909,292 | | Ajax Master Trust, Series 2016-1-PC | | | 4.08 | % (a)(b) | | | 01/01/2057 | | | | 47,004,741 | |
56,631,278 | | Ajax Master Trust, Series 2016-2-PC | | | 2.75 | % (a)(b) | | | 10/25/2056 | | | | 51,718,781 | |
64,399,810 | | Ajax Master Trust, Series 2017-1-PC | | | 3.64 | % (a)(b) | | | 06/25/2057 | | | | 60,572,060 | |
6,760,482 | | Ajax Mortgage Loan Trust, Series 2018-E-A | | | 4.38 | % (a)(b) | | | 06/25/2058 | | | | 6,833,264 | |
11,048,504 | | Ajax Mortgage Loan Trust, Series 2019-C-A | | | 3.95 | % (a)(b) | | | 10/25/2058 | | | | 11,075,248 | |
113,684,931 | | Ajax Mortgage Loan Trust, Series 2020-D-A | | | 2.25 | % (a)(c) | | | 06/25/2060 | | | | 114,519,833 | |
20,000,000 | | AlphaFlow Transitional Mortgage Trust, Series 2021-WL1-A1 | | | 3.28 | % (a)(c) | | | 01/25/2026 | | | | 20,007,084 | |
39,505,785 | | Alternative Loan Trust, Series 2005-55CB-1A1 | | | 5.50 | % | | | 11/25/2035 | | | | 35,087,032 | |
3,726,501 | | Alternative Loan Trust, Series 2006-12CB-A8 | | | 6.00 | % | | | 05/25/2036 | | | | 2,825,295 | |
12,035,901 | | Alternative Loan Trust, Series 2006-13T1-A1 | | | 6.00 | % | | | 05/25/2036 | | | | 8,162,443 | |
3,384,513 | | Alternative Loan Trust, Series 2006-16CB-A7 | | | 6.00 | % | | | 06/25/2036 | | | | 2,626,361 | |
2,354,446 | | Alternative Loan Trust, Series 2006-2CB-A9 | | | 6.00 | % | | | 03/25/2036 | | | | 1,605,987 | |
8,668,328 | | Alternative Loan Trust, Series 2006-41CB-1A15 (-1 x 1 Month LIBOR USD + 5.40%, 5.40% Cap) | | | 5.29 | % (f)(i) | | | 01/25/2037 | | | | 1,546,352 | |
8,668,328 | | Alternative Loan Trust, Series 2006-41CB-1A2 (1 Month LIBOR USD + 0.60%, 0.60% Floor, 6.00% Cap) | | | 0.71 | % | | | 01/25/2037 | | | | 4,493,833 | |
4,256,951 | | Alternative Loan Trust, Series 2006-42-1A1 (1 Month LIBOR USD + 0.60%, 0.60% Floor, 6.00% Cap) | | | 0.71 | % | | | 01/25/2047 | | | | 1,944,333 | |
4,256,951 | | Alternative Loan Trust, Series 2006-42-1A2 (-1 x 1 Month LIBOR USD + 5.40%, 5.40% Cap) | | | 5.29 | % (f)(i) | | | 01/25/2047 | | | | 999,681 | |
3,333,957 | | Alternative Loan Trust, Series 2006-43CB-1A12 | | | 5.75 | % | | | 02/25/2037 | | | | 2,563,074 | |
11,588,150 | | Alternative Loan Trust, Series 2006-45T1-1A1 (1 Month LIBOR USD + 0.50%, 6.00% Floor, 6.00% Cap) | | | 6.00 | % | | | 02/25/2037 | | | | 6,903,384 | |
6,868,563 | | Alternative Loan Trust, Series 2006-4CB-1A1 | | | 6.00 | % | | | 04/25/2036 | | | | 5,106,092 | |
6,696,992 | | Alternative Loan Trust, Series 2007-15CB-A2 | | | 5.75 | % | | | 07/25/2037 | | | | 5,506,572 | |
8,033,964 | | Alternative Loan Trust, Series 2007-15CB-A5 | | | 5.75 | % | | | 07/25/2037 | | | | 6,605,892 | |
17,937,610 | | Alternative Loan Trust, Series 2007-5CB-1A31 | | | 5.50 | % | | | 04/25/2037 | | | | 13,368,054 | |
6,754,857 | | Alternative Loan Trust, Series 2007-5CB-2A1 | | | 6.00 | % | | | 04/25/2037 | | | | 4,650,485 | |
5,731,235 | | Alternative Loan Trust, Series 2007-6-A1 | | | 5.75 | % | | | 04/25/2047 | | | | 4,571,577 | |
42,886,153 | | Alternative Loan Trust, Series 2007-HY4-4A1 | | | 3.45 | % (b) | | | 06/25/2037 | | | | 39,519,045 | |
4,305,542 | | American Home Assets, Series 2006-2-2A1 (1 Month LIBOR USD + 0.38%, 0.38% Floor) | | | 0.49 | % | | | 09/25/2046 | | | | 4,187,170 | |
4,562,034 | | American Home Mortgage Investment Trust, Series 2005-4-3A1 (1 Month LIBOR USD + 0.60%, 0.60% Floor, 11.00% Cap) | | | 0.71 | % | | | 11/25/2045 | | | | 4,017,083 | |
17,402,227 | | American Home Mortgage Investment Trust, Series 2005-4-5A (6 Month LIBOR USD + 1.75%, 1.75% Floor, 11.00% Cap) | | | 1.95 | % | | | 11/25/2045 | | | | 11,078,679 | |
2,203,765 | | American Home Mortgage Investment Trust, Series 2006-2-3A4 | | | 7.10 | % (h) | | | 06/25/2036 | | | | 591,107 | |
7,657,024 | | American Home Mortgage Investment Trust, Series 2007-A-13A1 | | | 6.60 | % (a)(h) | | | 01/25/2037 | | | | 2,590,740 | |
129,813,369 | | Ameriquest Mortgage Securities Trust, Series 2006-M3-A1 (1 Month LIBOR USD + 0.18%, 0.18% Floor) | | | 0.28 | % | | | 10/25/2036 | | | | 88,222,087 | |
6,862,903 | | Ameriquest Mortgage Securities, Inc., Series 2004-FR1-M1 | | | 4.18 | % (h) | | | 05/25/2034 | | | | 7,018,779 | |
6,704,383 | | Amortizing Residential Collateral Trust, Series 2002-BC7-M1 (1 Month LIBOR USD + 1.20%, 1.20% Floor) | | | 1.31 | % | | | 10/25/2032 | | | | 5,838,345 | |
41,588,000 | | AMSR Trust, Series 2019-SFR1-E | | | 3.47 | % (a) | | | 01/19/2039 | | | | 42,242,861 | |
30,156,000 | | AMSR Trust, Series 2020-SFR4-G1 | | | 4.00 | % (a) | | | 11/17/2037 | | | | 30,326,216 | |
10,000,000 | | AMSR Trust, Series 2020-SFR5-F | | | 2.69 | % (a) | | | 11/17/2037 | | | | 9,863,178 | |
10,500,000 | | Angel Oak Mortgage Trust LLC, Series 2019-2-M1 | | | 4.07 | % (a)(b) | | | 03/25/2049 | | | | 10,864,699 | |
15,170,378 | | Argent Securities Trust, Series 2006-W5-A1A (1 Month LIBOR USD + 0.30%, 0.30% Floor) | | | 0.41 | % | | | 06/25/2036 | | | | 11,818,817 | |
512,370 | | Asset Backed Securities Corporation Home Equity Loan Trust, Series 2004-HE3-M2 (1 Month LIBOR USD + 1.68%, 1.68% Floor) | | | 1.79 | % | | | 06/25/2034 | | | | 517,452 | |
27,212,101 | | Asset Backed Securities Corporation Home Equity Loan Trust, Series 2006-HE7-A1 (1 Month LIBOR USD + 0.14%, 0.14% Floor) | | | 0.24 | % | | | 11/25/2036 | | | | 25,258,476 | |
1,263,244 | | Banc of America Alternative Loan Trust, Series 2005-10-4A1 | | | 5.75 | % | | | 11/25/2035 | | | | 1,259,653 | |
3,800,543 | | Banc of America Alternative Loan Trust, Series 2005-11-2CB1 | | | 6.00 | % | | | 12/25/2035 | | | | 3,772,180 | |
2,427,430 | | Banc of America Alternative Loan Trust, Series 2006-2-1CB1 | | | 6.00 | % | | | 03/25/2036 | | | | 2,446,557 | |
3,495,530 | | Banc of America Alternative Loan Trust, Series 2006-2-3CB1 | | | 6.50 | % | | | 03/25/2036 | | | | 3,508,876 | |
780,949 | | Banc of America Alternative Loan Trust, Series 2006-5-CB14 (1 Month LIBOR USD + 1.10%, 6.00% Floor, 6.00% Cap) | | | 6.00 | % | | | 06/25/2046 | | | | 773,029 | |
1,689,571 | | Banc of America Alternative Loan Trust, Series 2006-6-CB3 | | | 6.00 | % | | | 07/25/2046 | | | | 1,629,088 | |
9,541,910 | | Banc of America Alternative Loan Trust, Series 2006-7-A4 | | | 6.50 | % (h) | | | 10/25/2036 | | | | 4,339,158 | |
2,391,050 | | Banc of America Alternative Loan Trust, Series 2006-8-1A1 (-1 x 1 Month LIBOR USD + 6.50%, 6.50% Cap) | | | 6.39 | % (f)(i) | | | 11/25/2036 | | | | 436,439 | |
852,156 | | Banc of America Alternative Loan Trust, Series 2006-8-1A2 (1 Month LIBOR USD + 0.45%, 0.45% Floor, 7.00% Cap) | | | 0.56 | % | | | 11/25/2036 | | | | 722,542 | |
3,991,485 | | Banc of America Alternative Loan Trust, Series 2006-9-1CB1 | | | 6.00 | % | | | 01/25/2037 | | | | 3,943,410 | |
684,138 | | Banc of America Alternative Loan Trust, Series 2007-2-2A1 | | | 6.00 | % | | | 06/25/2037 | | | | 672,535 | |
3,477,076 | | Banc of America Funding Corporation, Series 2006-2-3A1 | | | 6.00 | % | | | 03/25/2036 | | | | 3,508,674 | |
117,590 | | Banc of America Funding Corporation, Series 2006-2-4A1 (-3 x 1 Month LIBOR USD + 22.80%, 22.80% Cap) | | | 22.47 | % (i) | | | 03/25/2036 | | | | 157,777 | |
400,087 | | Banc of America Funding Corporation, Series 2006-2-6A2 | | | 5.50 | % | | | 03/25/2036 | | | | 396,529 | |
325,781 | | Banc of America Funding Corporation, Series 2006-3-1A1 | | | 6.00 | % | | | 03/25/2036 | | | | 325,806 | |
270,704 | | Banc of America Funding Corporation, Series 2006-3-6A1 | | | 6.38 | % (b) | | | 03/25/2036 | | | | 282,850 | |
2,071,226 | | Banc of America Funding Corporation, Series 2006-6-1A7 | | | 6.25 | % | | | 08/25/2036 | | | | 2,050,668 | |
761,764 | | Banc of America Funding Corporation, Series 2006-7-T2A5 | | | 6.54 | % (h) | | | 10/25/2036 | | | | 753,583 | |
3,590,428 | | Banc of America Funding Corporation, Series 2006-7-T2A8 | | | 6.41 | % (h) | | | 10/25/2036 | | | | 3,560,830 | |
964,672 | | Banc of America Funding Corporation, Series 2006-8T2-A8 | | | 6.10 | % (h) | | | 10/25/2036 | | | | 949,646 | |
414,240 | | Banc of America Funding Corporation, Series 2006-B-7A1 | | | 2.64 | % (b) | | | 03/20/2036 | | | | 380,804 | |
5,818,890 | | Banc of America Funding Corporation, Series 2006-D-6A1 | | | 2.92 | % (b) | | | 05/20/2036 | | | | 5,923,473 | |
95,842 | | Banc of America Funding Corporation, Series 2006-G-2A1 (1 Month LIBOR USD + 0.44%, 0.44% Floor, 10.50% Cap) | | | 0.55 | % | | | 07/20/2036 | | | | 95,901 | |
199,933 | | Banc of America Funding Corporation, Series 2006-H-3A1 | | | 3.09 | % (b) | | | 09/20/2046 | | | | 185,588 | |
34,844,154 | | Banc of America Funding Corporation, Series 2006-H-5A1 (1 Month LIBOR USD + 0.36%, 0.36% Floor, 10.50% Cap) | | | 0.47 | % | | | 10/20/2036 | | | | 18,031,993 | |
700,857 | | Banc of America Funding Corporation, Series 2007-1-TA10 | | | 5.84 | % (h) | | | 01/25/2037 | | | | 694,011 | |
972,967 | | Banc of America Funding Corporation, Series 2007-3-TA1B | | | 5.83 | % (b) | | | 04/25/2037 | | | | 973,011 | |
1,898,388 | | Banc of America Funding Corporation, Series 2007-5-1A1 | | | 5.50 | % | | | 07/25/2037 | | | | 1,881,943 | |
1,382,262 | | Banc of America Funding Corporation, Series 2009-R14A-3A (-2 x 1 Month LIBOR USD + 16.57%, 5.50% Floor, 16.57% Cap) | | | 15.82 | % (a)(i) | | | 06/26/2035 | | | | 1,787,952 | |
2,261,136 | | Banc of America Funding Corporation, Series 2009-R15A-4A2 | | | 5.75 | % (a)(b) | | | 12/26/2036 | | | | 2,097,527 | |
916,223 | | Banc of America Funding Corporation, Series 2010-R1-3A (-2 x 1 Month LIBOR USD + 14.28%, 6.00% Floor, 14.28% Cap) | | | 14.10 | % (a)(i) | | | 07/26/2036 | | | | 1,150,509 | |
1,852,248 | | Banc of America Mortgage Securities Trust, Series 2006-1-A9 | | | 6.00 | % | | | 05/25/2036 | | | | 1,800,689 | |
195,609 | | Banc of America Mortgage Securities Trust, Series 2007-1-2A5 | | | 5.75 | % | | | 01/25/2037 | | | | 191,908 | |
4,804,099 | | Banc of America Mortgage Trust, Series 2007-3-2A8 | | | 7.00 | % | | | 09/25/2037 | | | | 4,797,458 | |
10,286,390 | | BankUnited Trust, Series 2005-1-2A1 | | | 3.33 | % (b) | | | 09/25/2045 | | | | 10,249,065 | |
1,192,843 | | Bayview Commercial Asset Trust, Series 2007-3-A2 (1 Month LIBOR USD + 0.29%) | | | 0.40 | % (a) | | | 07/25/2037 | | | | 1,130,064 | |
14,836,942 | | Bayview Opportunity Master Fund Trust, Series 2019-SBR1-A1 | | | 3.47 | % (a)(c) | | | 06/28/2034 | | | | 14,919,643 | |
42,665,375 | | BCAP LLC Trust, Series 2007-AA2-11A (1 Month LIBOR USD + 0.19%, 0.19% Floor) | | | 0.30 | % (a) | | | 05/25/2047 | | | | 43,878,642 | |
2,464,707 | | BCAP LLC Trust, Series 2007-AA2-2A7 | | | 6.00 | % | | | 04/25/2037 | | | | 1,761,374 | |
2,668,348 | | BCAP LLC Trust, Series 2007-AA2-2A8 | | | 5.75 | % | | | 04/25/2037 | | | | 1,855,175 | |
10,622,724 | | BCAP LLC Trust, Series 2008-RR3-A1B | | | 6.67 | % (a)(b) | | | 10/25/2036 | | | | 5,353,288 | |
2,171,088 | | BCAP LLC Trust, Series 2009-RR13-18A2 | | | 5.81 | % (a)(b) | | | 07/26/2037 | | | | 1,693,018 | |
3,263,766 | | BCAP LLC Trust, Series 2009-RR4-4A2 | | | 5.75 | % (a)(b) | | | 02/26/2036 | | | | 2,262,300 | |
911,334 | | BCAP LLC Trust, Series 2010-RR10-5A1 | | | 7.00 | % (a)(b) | | | 04/27/2037 | | | | 943,620 | |
1,917,034 | | Bear Stearns Adjustable Rate Mortgage Trust, Series 2005-12-13A1 | | | 3.24 | % (b) | | | 02/25/2036 | | | | 1,856,263 | |
3,639,794 | | Bear Stearns Adjustable Rate Mortgage Trust, Series 2006-4-4A1 | | | 3.10 | % (b) | | | 10/25/2046 | | | | 3,395,570 | |
3,805,023 | | Bear Stearns Adjustable Rate Mortgage Trust, Series 2007-1-2A1 | | | 2.80 | % (b) | | | 02/25/2047 | | | | 3,760,854 | |
1,864,688 | | Bear Stearns Adjustable Rate Mortgage Trust, Series 2007-1-3A1 | | | 3.06 | % (b) | | | 02/25/2047 | | | | 1,842,489 | |
18,028,234 | | Bear Stearns Adjustable Rate Mortgage Trust, Series 2007-2-2A1 (12 Month LIBOR USD + 1.88%, 1.88% Floor, 11.15% Cap) | | | 2.23 | % | | | 12/25/2046 | | | | 16,148,448 | |
1,342,272 | | Bear Stearns Alt-A Trust, Series 2004-11-2A3 | | | 2.61 | % (b) | | | 11/25/2034 | | | | 1,330,465 | |
6,942,883 | | Bear Stearns Alt-A Trust, Series 2006-1-11A1 (1 Month LIBOR USD + 0.48%, 0.48% Floor, 11.50% Cap) | | | 0.59 | % | | | 02/25/2036 | | | | 6,996,975 | |
17,319,481 | | Bear Stearns Alt-A Trust, Series 2006-3-21A1 | | | 2.78 | % (b) | | | 05/25/2036 | | | | 14,844,759 | |
6,058,987 | | Bear Stearns Alt-A Trust, Series 2006-5-1A1 (1 Month LIBOR USD + 0.34%, 0.34% Floor, 11.50% Cap) | | | 0.45 | % | | | 08/25/2036 | | | | 5,673,546 | |
8,059,397 | | Bear Stearns Alt-A Trust, Series 2006-6-2A1 | | | 3.39 | % (b) | | | 11/25/2036 | | | | 5,556,312 | |
3,926,298 | | Bear Stearns Alt-A Trust, Series 2006-8-2A1 | | | 2.95 | % (b) | | | 08/25/2046 | | | | 3,167,167 | |
7,403,883 | | Bear Stearns Alt-A Trust, Series 2007-1-1A1 (1 Month LIBOR USD + 0.32%, 0.32% Floor, 11.50% Cap) | | | 0.43 | % | | | 01/25/2047 | | | | 6,876,841 | |
3,878,692 | | Bear Stearns Asset Backed Securities Trust, Series 2004-AC4-A2 | | | 5.50 | % (h) | | | 08/25/2034 | | | | 4,026,224 | |
9,177,961 | | Bear Stearns Asset Backed Securities Trust, Series 2005-AC2-1A | | | 5.75 | % (h) | | | 04/25/2035 | | | | 8,756,252 | |
2,670,951 | | Bear Stearns Asset Backed Securities Trust, Series 2005-AC2-2A1 | | | 5.75 | % (h) | | | 04/25/2035 | | | | 2,734,972 | |
38,312,955 | | Bear Stearns Asset Backed Securities Trust, Series 2005-AC6-22A | | | 5.31 | % (b) | | | 09/25/2035 | | | | 35,650,043 | |
5,984,118 | | Bear Stearns Asset Backed Securities Trust, Series 2005-AC7-A4 | | | 6.00 | % (h) | | | 10/25/2035 | | | | 5,070,403 | |
10,290,459 | | Bear Stearns Asset Backed Securities Trust, Series 2006-AC1-1A1 | | | 6.25 | % (h) | | | 02/25/2036 | | | | 6,955,948 | |
3,702,825 | | Bear Stearns Asset Backed Securities Trust, Series 2006-AC5-A1 | | | 6.25 | % (h) | | | 12/25/2036 | | | | 3,642,118 | |
10,335,311 | | Bear Stearns Asset Backed Securities Trust, Series 2007-HE2-2A3 (1 Month LIBOR USD + 0.16%, 0.16% Floor) | | | 0.27 | % | | | 02/25/2037 | | | | 10,218,055 | |
36,612,418 | | Bear Stearns Asset Backed Securities Trust, Series 2007-HE4-2A (1 Month LIBOR USD + 0.22%, 0.22% Floor) | | | 0.33 | % | | | 05/25/2037 | | | | 34,462,481 | |
16,956,572 | | Bear Stearns Asset Backed Securities Trust, Series 2007-HE6-2A (1 Month LIBOR USD + 1.05%, 1.05% Floor) | | | 1.16 | % | | | 08/25/2037 | | | | 16,145,552 | |
15,000,000 | | Bear Stearns Asset Backed Securities Trust, Series 2007-HE7-1A2 (1 Month LIBOR USD + 1.60%, 1.60% Floor) | | | 1.71 | % | | | 10/25/2037 | | | | 14,767,794 | |
1,330,157 | | Bear Stearns Asset Backed Securities Trust, Series 2007-SD1-1A2A | | | 6.00 | % | | | 10/25/2036 | | | | 903,446 | |
1,315,453 | | Bear Stearns Asset Backed Securities Trust, Series 2007-SD1-1A3A | | | 6.50 | % | | | 10/25/2036 | | | | 891,374 | |
1,888,475 | | Bear Stearns Asset Backed Securities Trust, Series 2007-SD1-23A1 | | | 2.76 | % (b) | | | 10/25/2036 | | | | 1,444,075 | |
10,289,922 | | Bear Stearns Mortgage Funding Trust, Series 2006-AR3-2A1 (1 Month LIBOR USD + 0.20%, 0.20% Floor, 10.50% Cap) | | | 0.31 | % | | | 11/25/2036 | | | | 9,772,505 | |
4,501,399 | | Bear Stearns Mortgage Funding Trust, Series 2006-AR4-A2 (1 Month LIBOR USD + 0.18%, 0.18% Floor, 10.50% Cap) | | | 0.29 | % | | | 12/25/2037 | | | | 4,244,146 | |
10,332,124 | | Bear Stearns Mortgage Funding Trust, Series 2007-AR3-22A1 (1 Month LIBOR USD + 0.16%, 0.16% Floor, 10.50% Cap) | | | 0.27 | % | | | 04/25/2037 | | | | 11,160,524 | |
13,777,342 | | Bellemeade Ltd., Series 2019-2A-M1B (1 Month LIBOR USD + 1.45%, 1.45% Floor) | | | 1.56 | % (a) | | | 04/25/2029 | | | | 13,794,466 | |
15,296,536 | | BNC Mortgage Loan Trust, Series 2006-2-A4 (1 Month LIBOR USD + 0.32%, 0.32% Floor) | | | 0.43 | % | | | 11/25/2036 | | | | 14,843,324 | |
10,690,347 | | BNC Mortgage Loan Trust, Series 2007-1-A4 (1 Month LIBOR USD + 0.16%, 0.16% Floor) | | | 0.27 | % | | | 03/25/2037 | | | | 10,383,321 | |
7,589,607 | | BNC Mortgage Loan Trust, Series 2007-4-A4 (1 Month LIBOR USD + 1.50%, 1.50% Floor) | | | 1.61 | % | | | 11/25/2037 | | | | 6,744,973 | |
31,360,859 | | BNPP Mortgage Securities LLC Trust, Series 2009-1-B1 | | | 6.00 | % (a) | | | 08/27/2037 | | | | 22,560,974 | |
5,458,363 | | Carrington Mortgage Loan Trust, Series 2006-FRE2-A2 (1 Month LIBOR USD + 0.12%, 0.12% Floor, 12.50% Cap) | | | 0.23 | % | | | 10/25/2036 | | | | 4,748,794 | |
26,319,545 | | Carrington Mortgage Loan Trust, Series 2006-FRE2-A3 (1 Month LIBOR USD + 0.16%, 0.16% Floor, 12.50% Cap) | | | 0.27 | % | | | 10/25/2036 | | | | 23,004,545 | |
8,100,956 | | Carrington Mortgage Loan Trust, Series 2006-FRE2-A4 (1 Month LIBOR USD + 0.25%, 0.25% Floor, 12.50% Cap) | | | 0.36 | % | | | 10/25/2036 | | | | 7,141,937 | |
7,599,192 | | Carrington Mortgage Loan Trust, Series 2006-NC3-A3 (1 Month LIBOR USD + 0.15%, 0.15% Floor, 12.50% Cap) | | | 0.26 | % | | | 08/25/2036 | | | | 7,311,750 | |
78,442,223 | | Carrington Mortgage Loan Trust, Series 2006-NC4-A3 (1 Month LIBOR USD + 0.16%, 0.16% Floor, 12.50% Cap) | | | 0.27 | % | | | 10/25/2036 | | | | 76,048,175 | |
19,106,535 | | Carrington Mortgage Loan Trust, Series 2006-NC5-A3 (1 Month LIBOR USD + 0.15%, 0.15% Floor, 14.50% Cap) | | | 0.26 | % | | | 01/25/2037 | | | | 17,218,588 | |
25,106,197 | | Carrington Mortgage Loan Trust, Series 2007-RFC1-A3 (1 Month LIBOR USD + 0.14%, 0.14% Floor, 14.50% Cap) | | | 0.25 | % | | | 12/25/2036 | | | | 24,109,473 | |
23,062,302 | | Cascade MH Asset Trust, Series 2019-MH1-A | | | 4.00 | % (a)(b) | | | 11/25/2044 | | | | 24,224,012 | |
2,750,000 | | Centex Home Equity, Series 2004-A-AF5 | | | 5.43 | % (h) | | | 01/25/2034 | | | | 2,718,573 | |
437,624 | | Chase Funding Mortgage Loan Asset-Backed Certificates, Series 2003-4-2M1 (1 Month LIBOR USD + 0.90%, 0.90% Floor) | | | 1.01 | % | | | 03/25/2033 | | | | 431,592 | |
3,918,417 | | Chase Mortgage Finance Trust, Series 2005-A1-2A4 | | | 3.05 | % (b) | | | 12/25/2035 | | | | 3,917,118 | |
8,356,162 | | Chase Mortgage Finance Trust, Series 2006-S1-A5 | | | 6.50 | % | | | 05/25/2036 | | | | 6,015,017 | |
8,796,510 | | Chase Mortgage Finance Trust, Series 2006-S2-1A9 | | | 6.25 | % | | | 10/25/2036 | | | | 6,214,680 | |
5,352,061 | | Chase Mortgage Finance Trust, Series 2006-S3-1A2 | | | 6.00 | % | | | 11/25/2036 | | | | 3,651,230 | |
14,726,957 | | Chase Mortgage Finance Trust, Series 2006-S4-A8 | | | 6.00 | % | | | 12/25/2036 | | | | 9,918,857 | |
4,075,753 | | Chase Mortgage Finance Trust, Series 2007-A2-6A4 | | | 2.99 | % (b) | | | 07/25/2037 | | | | 3,951,237 | |
4,493,909 | | Chase Mortgage Finance Trust, Series 2007-S1-A7 | | | 6.00 | % | | | 02/25/2037 | | | | 2,630,201 | |
2,688,577 | | Chase Mortgage Finance Trust, Series 2007-S3-1A5 | | | 6.00 | % | | | 05/25/2037 | | | | 1,889,706 | |
1,250,148 | | Chase Mortgage Finance Trust, Series 2007-S3-2A1 | | | 5.50 | % | | | 05/25/2037 | | | | 410,032 | |
2,616,845 | | Chase Mortgage Finance Trust, Series 2007-S5-1A18 | | | 6.00 | % | | | 07/25/2037 | | | | 1,840,339 | |
2,882,637 | | ChaseFlex Trust, Series 2005-1-3A1 | | | 6.00 | % | | | 02/25/2035 | | | | 2,798,705 | |
287,618 | | ChaseFlex Trust, Series 2006-1-A5 | | | 6.16 | % (b) | | | 06/25/2036 | | | | 286,824 | |
3,564,606 | | ChaseFlex Trust, Series 2006-2-A2B (1 Month LIBOR USD + 0.20%, 0.20% Floor, 11.50% Cap) | | | 0.31 | % | | | 09/25/2036 | | | | 3,017,714 | |
3,584,727 | | ChaseFlex Trust, Series 2007-1-1A1 | | | 6.50 | % | | | 02/25/2037 | | | | 1,947,371 | |
6,996,534 | | ChaseFlex Trust, Series 2007-M1-2F4 | | | 4.13 | % (h) | | | 08/25/2037 | | | | 6,733,162 | |
7,277,017 | | ChaseFlex Trust, Series 2007-M1-2F5 | | | 4.13 | % (h) | | | 08/25/2037 | | | | 7,002,534 | |
18,138,442 | | CHL Mortgage Pass-Through Trust, Series 2005-17-2A1 | | | 5.50 | % | | | 09/25/2035 | | | | 14,082,690 | |
3,005,793 | | CHL Mortgage Pass-Through Trust, Series 2005-18-A1 | | | 5.50 | % | | | 10/25/2035 | | | | 2,355,016 | |
3,220,100 | | CHL Mortgage Pass-Through Trust, Series 2005-26-1A12 | | | 5.50 | % | | | 11/25/2035 | | | | 2,711,617 | |
10,760,837 | | CHL Mortgage Pass-Through Trust, Series 2005-HYB8-4A1 | | | 3.10 | % (b) | | | 12/20/2035 | | | | 10,717,614 | |
6,004,059 | | CHL Mortgage Pass-Through Trust, Series 2006-14-A5 | | | 6.25 | % | | | 09/25/2036 | | | | 4,456,762 | |
24,529,989 | | CHL Mortgage Pass-Through Trust, Series 2006-8-1A3 | | | 6.00 | % | | | 05/25/2036 | | | | 21,251,441 | |
1,844,199 | | CHL Mortgage Pass-Through Trust, Series 2007-15-1A2 | | | 6.25 | % | | | 09/25/2037 | | | | 1,542,814 | |
50,268,950 | | CHL Mortgage Pass-Through Trust, Series 2007-21-1A1 | | | 6.25 | % | | | 02/25/2038 | | | | 38,276,066 | |
1,844,624 | | CHL Mortgage Pass-Through Trust, Series 2007-2-A2 | | | 6.00 | % | | | 03/25/2037 | | | | 1,344,783 | |
2,368,832 | | CHL Mortgage Pass-Through Trust, Series 2007-7-A11 | | | 5.50 | % | | | 06/25/2037 | | | | 1,704,479 | |
4,477,018 | | CHL Mortgage Pass-Through Trust, Series 2007-8-1A8 | | | 6.00 | % | | | 01/25/2038 | | | | 3,174,302 | |
7,656,987 | | CHL Mortgage Pass-Through Trust, Series 2007-9-A1 | | | 5.75 | % | | | 07/25/2037 | | | | 5,964,858 | |
12,932,118 | | CHL Mortgage Pass-Through Trust, Series 2007-HYB1-2A1 | | | 2.84 | % (b) | | | 03/25/2037 | | | | 12,236,869 | |
13,690,000 | | CHL Mortgage Pass-Through Trust, Series 2018-GT1-A (1 Month LIBOR USD + 2.75%) | | | 2.86 | % (a) | | | 05/25/2023 | | | | 13,642,441 | |
55,000,000 | | CIM Trust, Series 2017-5-A3 | | | 4.00 | % (a)(b) | | | 05/25/2057 | | | | 55,054,742 | |
36,015,426 | | CIM Trust, Series 2017-6-A1 | | | 3.02 | % (a)(b) | | | 06/25/2057 | | | | 36,068,891 | |
3,495,593 | | CitiCorporationMortgage Securities, Inc., Series 2005-1-1A4 | | | 5.50 | % | | | 02/25/2035 | | | | 3,573,954 | |
816,091 | | CitiCorporationMortgage Securities, Inc., Series 2006-7-1A1 | | | 6.00 | % | | | 12/25/2036 | | | | 805,145 | |
2,701,381 | | CitiCorporationResidential Mortgage Securities, Inc., Series 2006-2-A5 | | | 5.22 | % (h) | | | 09/25/2036 | | | | 2,764,615 | |
1,672,409 | | Citigroup Mortgage Loan Trust, Inc., Series 2005-5-2A2 | | | 5.75 | % | | | 08/25/2035 | | | | 1,315,739 | |
748,843 | | Citigroup Mortgage Loan Trust, Inc., Series 2005-9-21A1 | | | 5.50 | % | | | 11/25/2035 | | | | 725,940 | |
1,971,366 | | Citigroup Mortgage Loan Trust, Inc., Series 2006-4-2A1A | | | 6.00 | % | | | 12/25/2035 | | | | 1,988,624 | |
26,877,371 | | Citigroup Mortgage Loan Trust, Inc., Series 2006-AMC1-A1 (1 Month LIBOR USD + 0.15%, 0.15% Floor) | | | 0.25 | % (a) | | | 09/25/2036 | | | | 26,017,803 | |
6,394,067 | | Citigroup Mortgage Loan Trust, Inc., Series 2006-AR3-1A1A | | | 3.83 | % (b) | | | 06/25/2036 | | | | 6,507,393 | |
2,906,443 | | Citigroup Mortgage Loan Trust, Inc., Series 2006-FX1-A6 | | | 5.85 | % (h) | | | 10/25/2036 | | | | 2,400,457 | |
1,549,417 | | Citigroup Mortgage Loan Trust, Inc., Series 2006-WF1-A2D | | | 4.82 | % (h) | | | 03/25/2036 | | | | 985,420 | |
10,648,858 | | Citigroup Mortgage Loan Trust, Inc., Series 2006-WF2-A2D | | | 6.66 | % (h) | | | 05/25/2036 | | | | 5,495,472 | |
3,553,027 | | Citigroup Mortgage Loan Trust, Inc., Series 2007-10-1A1A | | | 5.53 | % (b) | | | 04/25/2037 | | | | 3,552,902 | |
633,550 | | Citigroup Mortgage Loan Trust, Inc., Series 2007-12-2A1 | | | 6.50 | % (a)(b) | | | 10/25/2036 | | | | 463,248 | |
75,716 | | Citigroup Mortgage Loan Trust, Inc., Series 2007-2-2A | | | 6.00 | % | | | 11/25/2036 | | | | 76,381 | |
17,839,945 | | Citigroup Mortgage Loan Trust, Inc., Series 2007-9-1A1 | | | 5.75 | % (a) | | | 04/25/2047 | | | | 14,167,296 | |
896,553 | | Citigroup Mortgage Loan Trust, Inc., Series 2007-9-2A2 | | | 6.50 | % (a)(b)(e) | | | 05/25/2037 | | | | 902,418 | |
62,974,879 | | Citigroup Mortgage Loan Trust, Inc., Series 2007-AMC2-A1 (1 Month LIBOR USD + 0.14%, 0.14% Floor) | | | 0.25 | % (a) | | | 01/25/2037 | | | | 59,214,158 | |
2,064,977 | | Citigroup Mortgage Loan Trust, Inc., Series 2007-AMC3-A2D (1 Month LIBOR USD + 0.35%, 0.35% Floor) | | | 0.46 | % | | | 03/25/2037 | | | | 1,915,190 | |
1,256,403 | | Citigroup Mortgage Loan Trust, Inc., Series 2007-AR5-1A3A | | | 2.92 | % (b) | | | 04/25/2037 | | | | 1,218,023 | |
2,943,596 | | Citigroup Mortgage Loan Trust, Inc., Series 2007-AR8-1A1A | | | 3.13 | % (b) | | | 08/25/2047 | | | | 2,805,104 | |
4,240,100 | | Citigroup Mortgage Loan Trust, Inc., Series 2007-OPX1-A3A | | | 5.97 | % (h) | | | 01/25/2037 | | | | 2,632,857 | |
9,346,706 | | Citigroup Mortgage Loan Trust, Inc., Series 2007-OPX1-A5A | | | 5.76 | % (h) | | | 01/25/2037 | | | | 5,802,079 | |
4,791,609 | | Citigroup Mortgage Loan Trust, Inc., Series 2010-7-9A4 | | | 6.00 | % (a)(b) | | | 10/25/2037 | | | | 4,511,816 | |
29,426,955 | | Citigroup Mortgage Loan Trust, Inc., Series 2010-8-7A4 | | | 6.00 | % (a)(b)(e) | | | 06/25/2037 | | | | 29,458,068 | |
153,265,007 | | Citigroup Mortgage Loan Trust, Inc., Series 2017-RP2-A1A | | | 3.93 | % (a)(b) | | | 07/25/2067 | | | | 157,159,011 | |
14,188,102 | | Citigroup Mortgage Loan Trust, Inc., Series 2018-A-A1 | | | 4.00 | % (a)(b) | | | 01/25/2068 | | | | 14,250,064 | |
43,021,234 | | Citigroup Mortgage Loan Trust, Inc., Series 2021-JL1-A | | | 2.75 | % (a)(b) | | | 02/27/2062 | | | | 42,786,708 | |
4,307,610 | | Citigroup Mortgage Loan Trust, Series 2007-OPX1-A2 (1 Month LIBOR USD + 0.20%, 0.20% Floor) | | | 0.31 | % | | | 01/25/2037 | | | | 2,458,095 | |
152,590,839 | | Citigroup Mortgage Loan Trust, Series 2019-A-PT1 | | | 3.92 | % (a) | | | 10/25/2058 | | | | 149,381,518 | |
31,102,123 | | Citigroup Mortgage Loan Trust, Series 2019-B-A1 | | | 3.26 | % (a)(b) | | | 04/25/2066 | | | | 31,413,953 | |
79,184,615 | | Citigroup Mortgage Loan Trust, Series 2019-C-A1 | | | 3.23 | % (a)(c) | | | 09/25/2059 | | | | 79,734,235 | |
229,089,080 | | Citigroup Mortgage Loan Trust, Series 2019-D-PT1 | | | 3.25 | % (a)(b) | | | 04/25/2064 | | | | 223,755,382 | |
341,900,463 | | Citigroup Mortgage Loan Trust, Series 2020-RP1-A1 | | | 1.50 | % (a)(b) | | | 08/25/2064 | | | | 341,790,268 | |
26,293,400 | | Citigroup Mortgage Loan Trust, Series 2020-RP1-M1 | | | 2.00 | % (a)(b) | | | 08/25/2064 | | | | 24,654,835 | |
22,116,950 | | Citigroup Mortgage Loan Trust, Series 2020-RP1-M2 | | | 2.50 | % (a)(b) | | | 08/25/2064 | | | | 20,775,411 | |
18,676,200 | | Citigroup Mortgage Loan Trust, Series 2020-RP1-M3 | | | 2.75 | % (a)(b) | | | 08/25/2064 | | | | 16,775,166 | |
49,327,290 | | Citigroup Mortgage Loan Trust, Series 2020-RP1-PT5 | | | 19.09 | % (a)(b) | | | 08/25/2064 | | | | 45,289,757 | |
2,659,676 | | CitiMortgage Alternative Loan Trust, Series 2006-A1-1A5 | | | 5.50 | % | | | 04/25/2036 | | | | 2,642,969 | |
2,696,719 | | CitiMortgage Alternative Loan Trust, Series 2006-A2-A2 | | | 6.00 | % | | | 05/25/2036 | | | | 2,697,745 | |
2,616,497 | | CitiMortgage Alternative Loan Trust, Series 2006-A3-1A13 | | | 6.00 | % | | | 07/25/2036 | | | | 2,590,631 | |
1,956,796 | | CitiMortgage Alternative Loan Trust, Series 2006-A4-1A8 | | | 6.00 | % | | | 09/25/2036 | | | | 1,908,958 | |
479,239 | | CitiMortgage Alternative Loan Trust, Series 2006-A5-2A1 | | | 5.50 | % | | | 10/25/2021 | | | | 494,458 | |
1,882,893 | | CitiMortgage Alternative Loan Trust, Series 2006-A5-3A3 | | | 6.00 | % | | | 10/25/2036 | | | | 1,771,804 | |
6,262,478 | | CitiMortgage Alternative Loan Trust, Series 2006-A6-1A2 (1 Month LIBOR USD + 0.50%, 6.00% Floor, 6.00% Cap) | | | 6.00 | % | | | 11/25/2036 | | | | 6,256,376 | |
3,102,636 | | CitiMortgage Alternative Loan Trust, Series 2007-A1-1A5 | | | 6.00 | % | | | 01/25/2037 | | | | 3,115,832 | |
1,512,740 | | CitiMortgage Alternative Loan Trust, Series 2007-A1-1A7 | | | 6.00 | % | | | 01/25/2037 | | | | 1,519,174 | |
4,101,838 | | CitiMortgage Alternative Loan Trust, Series 2007-A1-1A8 (1 Month LIBOR USD + 0.60%, 0.60% Floor, 6.00% Cap) | | | 0.71 | % | | | 01/25/2037 | | | | 3,398,915 | |
3,870,540 | | CitiMortgage Alternative Loan Trust, Series 2007-A1-1A9 (-1 x 1 Month LIBOR USD + 5.40%, 5.40% Cap) | | | 5.29 | % (f)(i) | | | 01/25/2037 | | | | 632,623 | |
3,442,958 | | CitiMortgage Alternative Loan Trust, Series 2007-A3-1A1 | | | 6.00 | % (d) | | | 03/25/2037 | | | | 3,518,930 | |
7,923,349 | | CitiMortgage Alternative Loan Trust, Series 2007-A3-1A3 (-1 x 1 Month LIBOR USD + 5.40%, 5.40% Cap) | | | 5.29 | % (f)(i) | | | 03/25/2037 | | | | 1,311,565 | |
3,104,991 | | CitiMortgage Alternative Loan Trust, Series 2007-A3-1A4 | | | 5.75 | % | | | 03/25/2037 | | | | 3,110,297 | |
5,583,401 | | CitiMortgage Alternative Loan Trust, Series 2007-A4-1A3 (1 Month LIBOR USD + 0.33%, 0.33% Floor, 7.00% Cap) | | | 0.44 | % | | | 04/25/2037 | | | | 4,567,504 | |
5,583,401 | | CitiMortgage Alternative Loan Trust, Series 2007-A4-1A4 (-1 x 1 Month LIBOR USD + 6.67%, 6.67% Cap) | | | 6.56 | % (f)(i) | | | 04/25/2037 | | | | 1,041,095 | |
5,913,109 | | CitiMortgage Alternative Loan Trust, Series 2007-A4-1A5 | | | 5.75 | % | | | 04/25/2037 | | | | 5,898,127 | |
777,760 | | CitiMortgage Alternative Loan Trust, Series 2007-A5-1A11 | | | 6.00 | % | | | 05/25/2037 | | | | 779,458 | |
10,254,199 | | CitiMortgage Alternative Loan Trust, Series 2007-A5-1A8 | | | 6.00 | % | | | 05/25/2037 | | | | 10,276,592 | |
338,184 | | CitiMortgage Alternative Loan Trust, Series 2007-A8-A1 | | | 6.00 | % | | | 10/25/2037 | | | | 331,149 | |
80,000,000 | | Connecticut Avenue Securities Trust, Series 2020-R02-2M2 (1 Month LIBOR USD + 2.00%) | | | 2.11 | % (a) | | | 01/25/2040 | | | | 80,117,872 | |
9,000,000 | | CoreVest American Finance Trust, Series 2020-3-D | | | 2.95 | % (a)(b) | | | 08/15/2053 | | | | 8,542,970 | |
35,198,249 | | Countrywide Alternative Loan Trust, Series 2004-36CB-1A1 | | | 6.00 | % | | | 02/25/2035 | | | | 33,114,217 | |
3,840,095 | | Countrywide Alternative Loan Trust, Series 2005-13CB-A3 | | | 5.50 | % | | | 05/25/2035 | | | | 3,890,731 | |
3,007,628 | | Countrywide Alternative Loan Trust, Series 2005-20CB-2A1 (1 Month LIBOR USD + 0.50%, 0.50% Floor, 5.50% Cap) | | | 0.61 | % | | | 07/25/2035 | | | | 2,075,559 | |
6,140,574 | | Countrywide Alternative Loan Trust, Series 2005-20CB-2A2 (-1 x 1 Month LIBOR USD + 5.00%, 5.00% Cap) | | | 4.89 | % (f)(i) | | | 07/25/2035 | | | | 772,667 | |
3,425 | | Countrywide Alternative Loan Trust, Series 2005-20CB-4A1 | | | 5.25 | % | | | 06/25/2022 | | | | 3,420 | |
2,091,641 | | Countrywide Alternative Loan Trust, Series 2005-26CB-A11 (-2 x 1 Month LIBOR USD + 13.05%, 13.05% Cap) | | | 12.85 | % (i) | | | 07/25/2035 | | | | 2,060,214 | |
2,956,363 | | Countrywide Alternative Loan Trust, Series 2005-28CB-1A2 (1 Month LIBOR USD + 0.75%, 0.75% Floor, 5.50% Cap) | | | 0.86 | % | | | 08/25/2035 | | | | 2,542,648 | |
1,267,278 | | Countrywide Alternative Loan Trust, Series 2005-28CB-3A6 | | | 6.00 | % | | | 08/25/2035 | | | | 865,423 | |
1,484,036 | | Countrywide Alternative Loan Trust, Series 2005-46CB-A20 | | | 5.50 | % | | | 10/25/2035 | | | | 1,375,328 | |
4,607,191 | | Countrywide Alternative Loan Trust, Series 2005-48T1-A2 | | | 5.50 | % | | | 11/25/2035 | | | | 3,618,705 | |
1,714,542 | | Countrywide Alternative Loan Trust, Series 2005-54CB-3A4 | | | 5.50 | % | | | 11/25/2035 | | | | 1,330,178 | |
16,435,735 | | Countrywide Alternative Loan Trust, Series 2005-57CB-1A1 | | | 5.50 | % | | | 12/25/2035 | | | | 15,138,129 | |
403,809 | | Countrywide Alternative Loan Trust, Series 2005-60T1-A7 (-7 x 1 Month LIBOR USD + 35.93%, 35.93% Cap) | | | 35.14 | % (i) | | | 12/25/2035 | | | | 561,924 | |
523,420 | | Countrywide Alternative Loan Trust, Series 2005-64CB-1A14 | | | 5.50 | % | | | 12/25/2035 | | | | 521,966 | |
7,596,780 | | Countrywide Alternative Loan Trust, Series 2005-64CB-1A4 | | | 5.50 | % | | | 12/25/2035 | | | | 7,588,589 | |
1,389,688 | | Countrywide Alternative Loan Trust, Series 2005-73CB-1A5 (1 Month LIBOR USD + 0.80%, 0.80% Floor, 5.50% Cap) | | | 0.91 | % | | | 01/25/2036 | | | | 1,279,935 | |
3,496,168 | | Countrywide Alternative Loan Trust, Series 2005-73CB-1A6 (-1 x 1 Month LIBOR USD + 4.70%, 4.70% Cap) | | | 4.59 | % (f)(i) | | | 01/25/2036 | | | | 481,416 | |
35,458,352 | | Countrywide Alternative Loan Trust, Series 2005-77T1-1A1 | | | 6.00 | % | | | 02/25/2036 | | | | 24,944,975 | |
605,641 | | Countrywide Alternative Loan Trust, Series 2005-79CB-A5 | | | 5.50 | % | | | 01/25/2036 | | | | 495,888 | |
23,021,047 | | Countrywide Alternative Loan Trust, Series 2005-85CB-1A1 | | | 6.00 | % | | | 02/25/2036 | | | | 15,455,021 | |
1,754,092 | | Countrywide Alternative Loan Trust, Series 2005-85CB-2A6 (-4 x 1 Month LIBOR USD + 21.63%, 21.63% Cap) | | | 21.24 | % (i) | | | 02/25/2036 | | | | 2,191,226 | |
1,127,575 | | Countrywide Alternative Loan Trust, Series 2005-86CB-A5 | | | 5.50 | % | | | 02/25/2036 | | | | 915,499 | |
1,804,719 | | Countrywide Alternative Loan Trust, Series 2005-J10-1A11 | | | 5.50 | % | | | 10/25/2035 | | | | 1,671,389 | |
410,712 | | Countrywide Alternative Loan Trust, Series 2005-J10-1A13 (1 Month LIBOR USD + 0.70%, 0.70% Floor, 5.50% Cap) | | | 0.81 | % | | | 10/25/2035 | | | | 303,919 | |
192,395 | | Countrywide Alternative Loan Trust, Series 2005-J10-1A15 | | | 5.50 | % | | | 10/25/2035 | | | | 178,181 | |
461,768 | | Countrywide Alternative Loan Trust, Series 2005-J11-1A3 | | | 5.50 | % | | | 11/25/2035 | | | | 363,650 | |
485,428 | | Countrywide Alternative Loan Trust, Series 2005-J11-6A1 | | | 6.50 | % | | | 09/25/2032 | | | | 483,681 | |
566,285 | | Countrywide Alternative Loan Trust, Series 2005-J13-2A5 (1 Month LIBOR USD + 0.48%, 0.48% Floor, 5.50% Cap) | | | 0.59 | % | | | 11/25/2035 | | | | 387,680 | |
1,132,570 | | Countrywide Alternative Loan Trust, Series 2005-J13-2A6 (-1 x 1 Month LIBOR USD + 5.02%, 5.02% Cap) | | | 4.91 | % (f)(i) | | | 11/25/2035 | | | | 178,068 | |
3,891,000 | | Countrywide Alternative Loan Trust, Series 2005-J1-5A3 | | | 5.50 | % | | | 02/25/2035 | | | | 3,903,814 | |
18,779 | | Countrywide Alternative Loan Trust, Series 2005-J1-7A1 | | | 5.50 | % | | | 06/25/2022 | | | | 18,148 | |
656,426 | | Countrywide Alternative Loan Trust, Series 2005-J2-1A5 (1 Month LIBOR USD + 0.50%, 0.50% Floor, 5.50% Cap) | | | 0.61 | % | | | 04/25/2035 | | | | 551,611 | |
2,019,771 | | Countrywide Alternative Loan Trust, Series 2005-J2-1A6 (-1 x 1 Month LIBOR USD + 5.00%, 5.00% Cap) | | | 4.89 | % (f)(i) | | | 04/25/2035 | | | | 188,107 | |
5,090,811 | | Countrywide Alternative Loan Trust, Series 2005-J3-2A8 (1 Month LIBOR USD + 0.30%, 0.30% Floor, 5.50% Cap) | | | 0.41 | % | | | 05/25/2035 | | | | 4,308,840 | |
5,090,811 | | Countrywide Alternative Loan Trust, Series 2005-J3-2A9 (-1 x 1 Month LIBOR USD + 5.20%, 5.20% Cap) | | | 5.09 | % (f)(i) | | | 05/25/2035 | | | | 563,596 | |
3,023,593 | | Countrywide Alternative Loan Trust, Series 2006-12CB-A3 (1 Month LIBOR USD + 5.75%, 5.75% Floor) | | | 5.75 | % | | | 05/25/2036 | | | | 2,234,983 | |
33,017,761 | | Countrywide Alternative Loan Trust, Series 2006-15CB-A1 | | | 6.50 | % | | | 06/25/2036 | | | | 24,627,733 | |
901,768 | | Countrywide Alternative Loan Trust, Series 2006-18CB-A12 (1 Month LIBOR USD + 0.60%, 0.60% Floor, 6.00% Cap) | | | 0.71 | % | | | 07/25/2036 | | | | 423,247 | |
901,768 | | Countrywide Alternative Loan Trust, Series 2006-18CB-A13 (-1 x 1 Month LIBOR USD + 5.50%, 5.50% Cap) | | | 5.39 | % (f)(i) | | | 07/25/2036 | | | | 165,602 | |
4,423,384 | | Countrywide Alternative Loan Trust, Series 2006-19CB-A12 (1 Month LIBOR USD + 0.40%, 0.40% Floor, 6.00% Cap) | | | 0.51 | % | | | 08/25/2036 | | | | 2,393,550 | |
5,998,375 | | Countrywide Alternative Loan Trust, Series 2006-19CB-A13 (-1 x 1 Month LIBOR USD + 5.60%, 5.60% Cap) | | | 5.49 | % (f)(i) | | | 08/25/2036 | | | | 928,166 | |
923,386 | | Countrywide Alternative Loan Trust, Series 2006-19CB-A15 | | | 6.00 | % | | | 08/25/2036 | | | | 745,652 | |
1,636,718 | | Countrywide Alternative Loan Trust, Series 2006-24CB-A11 | | | 5.75 | % | | | 08/25/2036 | | | | 1,286,960 | |
4,790,474 | | Countrywide Alternative Loan Trust, Series 2006-24CB-A14 (-1 x 1 Month LIBOR USD + 7.15%, 7.15% Cap) | | | 7.04 | % (f)(i) | | | 08/25/2036 | | | | 1,207,079 | |
3,841,336 | | Countrywide Alternative Loan Trust, Series 2006-24CB-A22 | | | 6.00 | % | | | 08/25/2036 | | | | 3,089,398 | |
4,122,908 | | Countrywide Alternative Loan Trust, Series 2006-24CB-A5 (1 Month LIBOR USD + 0.60%, 0.06% Floor, 6.00% Cap) | | | 0.71 | % | | | 08/25/2036 | | | | 2,279,589 | |
1,557,439 | | Countrywide Alternative Loan Trust, Series 2006-26CB-A17 | | | 6.25 | % | | | 09/25/2036 | | | | 1,097,829 | |
1,999,106 | | Countrywide Alternative Loan Trust, Series 2006-26CB-A9 | | | 6.50 | % | | | 09/25/2036 | | | | 1,446,903 | |
3,417,182 | | Countrywide Alternative Loan Trust, Series 2006-29T1-1A2 | | | 6.25 | % | | | 10/25/2036 | | | | 2,614,707 | |
491,991 | | Countrywide Alternative Loan Trust, Series 2006-29T1-2A12 (-7 x 1 Month LIBOR USD + 46.15%, 46.15% Cap) | | | 45.44 | % (i) | | | 10/25/2036 | | | | 1,034,770 | |
301,355 | | Countrywide Alternative Loan Trust, Series 2006-29T1-2A23 (-4 x 1 Month LIBOR USD + 33.37%, 33.37% Cap) | | | 32.90 | % (i) | | | 10/25/2036 | | | | 492,651 | |
3,539,741 | | Countrywide Alternative Loan Trust, Series 2006-30T1-1A2 | | | 6.25 | % | | | 11/25/2036 | | | | 3,121,580 | |
2,512,944 | | Countrywide Alternative Loan Trust, Series 2006-32CB-A1 (1 Month LIBOR USD + 0.67%, 0.67% Floor, 6.00% Cap) | | | 0.78 | % | | | 11/25/2036 | | | | 1,388,900 | |
4,191,591 | | Countrywide Alternative Loan Trust, Series 2006-32CB-A2 (-1 x 1 Month LIBOR USD + 5.33%, 5.33% Cap) | | | 5.22 | % (f)(i) | | | 11/25/2036 | | | | 814,256 | |
4,667,433 | | Countrywide Alternative Loan Trust, Series 2006-36T2-2A1 | | | 6.25 | % | | | 12/25/2036 | | | | 3,023,191 | |
1,105,232 | | Countrywide Alternative Loan Trust, Series 2006-39CB-1A10 | | | 6.00 | % | | | 01/25/2037 | | | | 1,105,708 | |
14,259,687 | | Countrywide Alternative Loan Trust, Series 2006-39CB-2A2 (-1 x 1 Month LIBOR USD + 6.55%, 6.55% Cap) | | | 6.44 | % (f)(i) | | | 01/25/2037 | | | | 3,024,666 | |
4,856,096 | | Countrywide Alternative Loan Trust, Series 2006-39CB-2A4 (1 Month LIBOR USD + 0.45%, 0.45% Floor, 7.00% Cap) | | | 0.56 | % | | | 01/25/2037 | | | | 314,420 | |
1,726,437 | | Countrywide Alternative Loan Trust, Series 2006-40T1-1A11 | | | 6.00 | % | | | 01/25/2037 | | | | 1,501,445 | |
2,938,404 | | Countrywide Alternative Loan Trust, Series 2006-40T1-1A4 (-1 x 1 Month LIBOR USD + 5.45%, 5.45% Cap) | | | 5.34 | % (f)(i) | | | 01/25/2037 | | | | 428,398 | |
3,544,346 | | Countrywide Alternative Loan Trust, Series 2006-41CB-1A10 | | | 6.00 | % | | | 01/25/2037 | | | | 2,780,689 | |
3,732,273 | | Countrywide Alternative Loan Trust, Series 2006-41CB-1A9 | | | 6.00 | % | | | 01/25/2037 | | | | 2,928,126 | |
3,738,113 | | Countrywide Alternative Loan Trust, Series 2006-45T1-1A4 (1 Month LIBOR USD + 0.60%, 0.60% Floor, 6.00% Cap) | | | 0.71 | % | | | 02/25/2037 | | | | 1,060,296 | |
3,738,113 | | Countrywide Alternative Loan Trust, Series 2006-45T1-1A5 (-1 x 1 Month LIBOR USD + 5.40%, 5.40% Cap) | | | 5.29 | % (f)(i) | | | 02/25/2037 | | | | 657,955 | |
888,644 | | Countrywide Alternative Loan Trust, Series 2006-6CB-1A4 | | | 5.50 | % | | | 05/25/2036 | | | | 863,468 | |
2,605,751 | | Countrywide Alternative Loan Trust, Series 2006-J1-1A10 | | | 5.50 | % | | | 02/25/2036 | | | | 2,367,258 | |
5,286,969 | | Countrywide Alternative Loan Trust, Series 2006-J1-1A3 | | | 5.50 | % | | | 02/25/2036 | | | | 4,803,076 | |
1,111,310 | | Countrywide Alternative Loan Trust, Series 2006-J4-2A2 | | | 6.00 | % | | | 07/25/2036 | | | | 890,528 | |
720,601 | | Countrywide Alternative Loan Trust, Series 2007-11T1-A24 (-6 x 1 Month LIBOR USD + 39.90%, 39.90% Cap) | | | 39.25 | % (i) | | | 05/25/2037 | | | | 1,323,919 | |
11,233,862 | | Countrywide Alternative Loan Trust, Series 2007-15CB-A1 | | | 6.00 | % | | | 07/25/2037 | | | | 9,654,953 | |
8,847,586 | | Countrywide Alternative Loan Trust, Series 2007-16CB-2A1 (1 Month LIBOR USD + 0.45%, 0.45% Floor, 7.00% Cap) | | | 0.56 | % | | | 08/25/2037 | | | | 3,387,815 | |
2,562,040 | | Countrywide Alternative Loan Trust, Series 2007-16CB-2A2 (-8 x 1 Month LIBOR USD + 54.58%, 54.58% Cap) | | | 53.68 | % (i) | | | 08/25/2037 | | | | 5,747,289 | |
3,715,985 | | Countrywide Alternative Loan Trust, Series 2007-16CB-4A7 | | | 6.00 | % | | | 08/25/2037 | | | | 3,577,940 | |
6,239,423 | | Countrywide Alternative Loan Trust, Series 2007-17CB-1A10 (-5 x 1 Month LIBOR USD + 29.90%, 29.90% Cap) | | | 29.40 | % (i) | | | 08/25/2037 | | | | 8,776,755 | |
960,705 | | Countrywide Alternative Loan Trust, Series 2007-18CB-2A25 | | | 6.00 | % | | | 08/25/2037 | | | | 785,877 | |
702,216 | | Countrywide Alternative Loan Trust, Series 2007-19-1A10 (-6 x 1 Month LIBOR USD + 39.00%, 39.00% Cap) | | | 38.35 | % (i) | | | 08/25/2037 | | | | 1,389,627 | |
10,321,074 | | Countrywide Alternative Loan Trust, Series 2007-19-1A4 | | | 6.00 | % | | | 08/25/2037 | | | | 7,453,033 | |
28,985,550 | | Countrywide Alternative Loan Trust, Series 2007-19-2A1 | | | 6.50 | % | | | 08/25/2037 | | | | 17,921,945 | |
3,274,883 | | Countrywide Alternative Loan Trust, Series 2007-21CB-2A2 (-4 x 1 Month LIBOR USD + 28.40%, 28.40% Cap) | | | 27.97 | % (i) | | | 09/25/2037 | | | | 3,598,064 | |
19,955,871 | | Countrywide Alternative Loan Trust, Series 2007-22-2A16 | | | 6.50 | % | | | 09/25/2037 | | | | 12,082,124 | |
8,189,061 | | Countrywide Alternative Loan Trust, Series 2007-23CB-A3 (1 Month LIBOR USD + 0.50%, 0.50% Floor, 7.00% Cap) | | | 0.61 | % | | | 09/25/2037 | | | | 3,641,766 | |
11,621,975 | | Countrywide Alternative Loan Trust, Series 2007-23CB-A4 (-1 x 1 Month LIBOR USD + 6.50%, 6.50% Cap) | | | 6.39 | % (f)(i) | | | 09/25/2037 | | | | 3,198,149 | |
15,398,993 | | Countrywide Alternative Loan Trust, Series 2007-4CB-2A1 | | | 7.00 | % | | | 03/25/2037 | | | | 2,880,585 | |
4,503,566 | | Countrywide Alternative Loan Trust, Series 2007-5CB-1A18 (-1 x 1 Month LIBOR USD + 5.65%, 5.65% Cap) | | | 5.54 | % (f)(i) | | | 04/25/2037 | | | | 984,492 | |
4,503,566 | | Countrywide Alternative Loan Trust, Series 2007-5CB-1A23 (1 Month LIBOR USD + 0.55%, 0.55% Floor, 6.00% Cap) | | | 0.66 | % | | | 04/25/2037 | | | | 2,245,578 | |
3,782,244 | | Countrywide Alternative Loan Trust, Series 2007-6-A4 | | | 5.75 | % | | | 04/25/2047 | | | | 3,018,130 | |
309,224 | | Countrywide Alternative Loan Trust, Series 2007-8CB-A12 (-6 x 1 Month LIBOR USD + 40.20%, 40.20% Cap) | | | 39.55 | % (i) | | | 05/25/2037 | | | | 617,682 | |
330,092 | | Countrywide Alternative Loan Trust, Series 2007-8CB-A8 (-6 x 1 Month LIBOR USD + 40.08%, 40.08% Cap) | | | 39.43 | % (i) | | | 05/25/2037 | | | | 657,166 | |
483,753 | | Countrywide Alternative Loan Trust, Series 2007-9T1-1A4 (1 Month LIBOR USD + 0.50%, 0.50% Floor, 6.00% Cap) | | | 0.61 | % | | | 05/25/2037 | | | | 181,043 | |
483,753 | | Countrywide Alternative Loan Trust, Series 2007-9T1-1A5 (-1 x 1 Month LIBOR USD + 5.50%, 5.50% Cap) | | | 5.39 | % (f)(i) | | | 05/25/2037 | | | | 97,156 | |
1,542,310 | | Countrywide Alternative Loan Trust, Series 2007-9T1-2A1 | | | 6.00 | % | | | 05/25/2037 | | | | 953,146 | |
30,054,881 | | Countrywide Alternative Loan Trust, Series 2007-HY2-1A | | | 2.80 | % (b) | | | 03/25/2047 | | | | 30,051,843 | |
1,969,212 | | Countrywide Asset Backed Certificates, Series 2003-BC6-M1 (1 Month LIBOR USD + 0.83%, 0.83% Floor) | | | 0.93 | % | | | 11/25/2033 | | | | 1,943,434 | |
9,292,739 | | Countrywide Asset Backed Certificates, Series 2005-4-AF5B | | | 5.65 | % (h) | | | 10/25/2035 | | | | 9,528,915 | |
28,861,702 | | Countrywide Asset Backed Certificates, Series 2006-25-1A (1 Month LIBOR USD + 0.14%, 0.14% Floor) | | | 0.25 | % | | | 06/25/2047 | | | | 26,964,294 | |
7,898,827 | | Countrywide Asset Backed Certificates, Series 2006-26-1A (1 Month LIBOR USD + 0.14%, 0.14% Floor) | | | 0.25 | % | | | 06/25/2037 | | | | 7,474,172 | |
16,209,599 | | Countrywide Asset Backed Certificates, Series 2007-BC1-1A (1 Month LIBOR USD + 0.14%, 0.14% Floor) | | | 0.25 | % | | | 05/25/2037 | | | | 14,997,574 | |
175,840 | | Countrywide Asset-Backed Certificates, Series 2005-13-AF3 | | | 5.43 | % (b) | | | 02/25/2033 | | | | 166,775 | |
22,079,361 | | Countrywide Asset-Backed Certificates, Series 2007-4-A5 | | | 4.66 | % (h) | | | 04/25/2047 | | | | 19,442,215 | |
560,905 | | Countrywide Home Loans, Series 2003-60-4A1 | | | 2.28 | % (b) | | | 02/25/2034 | | | | 591,859 | |
1,480,238 | | Countrywide Home Loans, Series 2004-R2-1AF1 (1 Month LIBOR USD + 0.42%, 0.42% Floor, 9.50% Cap) | | | 0.54 | % (a) | | | 11/25/2034 | | | | 1,361,163 | |
1,440,268 | | Countrywide Home Loans, Series 2004-R2-1AS | | | 6.03 | % (a)(b)(f) | | | 11/25/2034 | | | | 108,088 | |
3,205,685 | | Countrywide Home Loans, Series 2005-20-A5 | | | 5.50 | % | | | 10/25/2035 | | | | 2,740,491 | |
2,372,582 | | Countrywide Home Loans, Series 2005-20-A8 | | | 5.25 | % | | | 10/25/2035 | | | | 2,066,340 | |
8,635,810 | | Countrywide Home Loans, Series 2005-23-A1 | | | 5.50 | % | | | 11/25/2035 | | | | 6,738,838 | |
1,865,859 | | Countrywide Home Loans, Series 2005-24-A8 | | | 5.50 | % | | | 11/25/2035 | | | | 1,453,803 | |
603,086 | | Countrywide Home Loans, Series 2005-27-2A1 | | | 5.50 | % | | | 12/25/2035 | | | | 413,678 | |
1,229,341 | | Countrywide Home Loans, Series 2005-28-A7 | | | 5.25 | % | | | 11/01/2035 | | | | 976,382 | |
10,970,258 | | Countrywide Home Loans, Series 2005-HYB1-4A1 | | | 2.72 | % (b) | | | 03/25/2035 | | | | 11,810,782 | |
821,842 | | Countrywide Home Loans, Series 2005-HYB8-1A1 | | | 2.78 | % (b) | | | 12/20/2035 | | | | 764,958 | |
1,366,634 | | Countrywide Home Loans, Series 2005-J3-2A4 | | | 4.50 | % | | | 09/25/2035 | | | | 1,344,935 | |
923,915 | | Countrywide Home Loans, Series 2005-J4-A5 | | | 5.50 | % | | | 11/25/2035 | | | | 886,233 | |
464,718 | | Countrywide Home Loans, Series 2005-R1-1AF1 (1 Month LIBOR USD + 0.36%, 0.36% Floor, 9.50% Cap) | | | 0.47 | % (a) | | | 03/25/2035 | | | | 439,239 | |
460,717 | | Countrywide Home Loans, Series 2005-R1-1AS | | | 5.99 | % (a)(b)(f) | | | 03/25/2035 | | | | 68,434 | |
4,116,737 | | Countrywide Home Loans, Series 2006-16-2A1 | | | 6.50 | % | | | 11/25/2036 | | | | 2,532,814 | |
3,934,171 | | Countrywide Home Loans, Series 2006-1-A2 | | | 6.00 | % | | | 03/25/2036 | | | | 3,011,638 | |
1,644,394 | | Countrywide Home Loans, Series 2006-20-1A21 | | | 6.00 | % | | | 02/25/2037 | | | | 1,231,753 | |
704,659 | | Countrywide Home Loans, Series 2006-J3-A4 | | | 5.50 | % | | | 05/25/2036 | | | | 728,369 | |
4,924,045 | | Countrywide Home Loans, Series 2007-10-A7 | | | 6.00 | % | | | 07/25/2037 | | | | 3,582,245 | |
14,834,776 | | Countrywide Home Loans, Series 2007-11-A1 | | | 6.00 | % | | | 08/25/2037 | | | | 10,604,864 | |
8,948,507 | | Countrywide Home Loans, Series 2007-12-A9 | | | 5.75 | % | | | 08/25/2037 | | | | 7,060,532 | |
3,768,648 | | Countrywide Home Loans, Series 2007-13-A1 | | | 6.00 | % | | | 08/25/2037 | | | | 2,879,113 | |
6,175,137 | | Countrywide Home Loans, Series 2007-13-A10 | | | 6.00 | % | | | 08/25/2037 | | | | 4,717,584 | |
4,584,467 | | Countrywide Home Loans, Series 2007-15-1A1 | | | 6.25 | % | | | 09/25/2037 | | | | 3,838,681 | |
640,345 | | Countrywide Home Loans, Series 2007-15-1A16 | | | 6.25 | % | | | 09/25/2037 | | | | 536,176 | |
2,252,744 | | Countrywide Home Loans, Series 2007-15-1A29 | | | 6.25 | % | | | 09/25/2037 | | | | 1,886,109 | |
4,766,026 | | Countrywide Home Loans, Series 2007-17-1A2 | | | 6.00 | % | | | 10/25/2037 | | | | 4,357,853 | |
652,513 | | Countrywide Home Loans, Series 2007-18-1A1 | | | 6.00 | % | | | 11/25/2037 | | | | 513,981 | |
4,639,212 | | Countrywide Home Loans, Series 2007-3-A1 | | | 6.00 | % | | | 04/25/2037 | | | | 3,477,541 | |
1,786,724 | | Countrywide Home Loans, Series 2007-3-A12 | | | 6.00 | % | | | 04/25/2037 | | | | 1,339,324 | |
3,843,555 | | Countrywide Home Loans, Series 2007-4-1A39 | | | 6.00 | % | | | 05/25/2037 | | | | 2,627,888 | |
1,526,856 | | Countrywide Home Loans, Series 2007-5-A2 | | | 5.75 | % | | | 05/25/2037 | | | | 1,192,996 | |
5,270,942 | | Countrywide Home Loans, Series 2007-7-A1 | | | 6.00 | % | | | 06/25/2037 | | | | 3,982,728 | |
1,580,048 | | Countrywide Home Loans, Series 2007-7-A2 | | | 5.75 | % | | | 06/25/2037 | | | | 1,165,095 | |
5,263,480 | | Countrywide Home Loans, Series 2007-8-1A4 | | | 6.00 | % | | | 01/25/2038 | | | | 3,731,921 | |
2,762,255 | | Countrywide Home Loans, Series 2007-8-1A5 | | | 5.44 | % | | | 01/25/2038 | | | | 1,856,422 | |
6,413,374 | | Countrywide Home Loans, Series 2007-8-1A9 (1 Month LIBOR USD + 6.00%, 4.00% Floor, 6.00% Cap) | | | 6.00 | % | | | 01/25/2038 | | | | 4,541,030 | |
1,007,719 | | Countrywide Home Loans, Series 2007-9-A11 | | | 5.75 | % | | | 07/25/2037 | | | | 785,023 | |
5,889,142 | | Countrywide Home Loans, Series 2007-HY1-1A1 | | | 2.79 | % (b) | | | 04/25/2037 | | | | 5,752,710 | |
17,273,681 | | Countrywide Home Loans, Series 2007-J1-2A1 | | | 6.00 | % | | | 02/25/2037 | | | | 9,920,227 | |
444,532 | | Countrywide Home Loans, Series 2007-J3-A1 (1 Month LIBOR USD + 0.50%, 0.50% Floor, 6.00% Cap) | | | 0.61 | % | | | 07/25/2037 | | | | 162,788 | |
2,222,660 | | Countrywide Home Loans, Series 2007-J3-A2 (-1 x 1 Month LIBOR USD + 5.50%, 5.50% Cap) | | | 5.39 | % (f)(i) | | | 07/25/2037 | | | | 527,383 | |
4,266,000 | | Credit Suisse First Boston Mortgage Backed Trust, Series 2006-3-A4B | | | 6.61 | % (h) | | | 11/25/2036 | | | | 1,158,932 | |
2,559,928 | | Credit Suisse First Boston Mortgage Backed Trust, Series 2006-4-A6A | | | 6.18 | % (h) | | | 12/25/2036 | | | | 877,962 | |
9,400,110 | | Credit Suisse First Boston Mortgage Backed Trust, Series 2007-1-1A1A | | | 5.90 | % (b) | | | 05/25/2037 | | | | 3,495,284 | |
2,755,584 | | Credit Suisse First Boston Mortgage Securities Corporation, Series 2005-10-5A4 | | | 5.50 | % | | | 11/25/2035 | | | | 2,456,144 | |
580,078 | | Credit Suisse First Boston Mortgage Securities Corporation, Series 2005-10-5A5 | | | 5.50 | % | | | 11/25/2035 | | | | 517,043 | |
7,176,899 | | Credit Suisse First Boston Mortgage Securities Corporation, Series 2005-11-2A1 | | | 6.00 | % | | | 12/25/2035 | | | | 6,893,391 | |
7,481,614 | | Credit Suisse First Boston Mortgage Securities Corporation, Series 2005-12-5A1 | | | 5.25 | % | | | 01/25/2036 | | | | 7,486,285 | |
9,642,560 | | Credit Suisse First Boston Mortgage Securities Corporation, Series 2005-12-7A1 | | | 7.00 | % | | | 01/25/2036 | | | | 2,178,995 | |
3,663,830 | | Credit Suisse First Boston Mortgage Securities Corporation, Series 2005-8-3A10 | | | 5.50 | % | | | 09/25/2035 | | | | 3,632,847 | |
3,761,904 | | Credit Suisse First Boston Mortgage Securities Corporation, Series 2005-8-7A1 | | | 7.00 | % | | | 09/25/2035 | | | | 2,510,707 | |
1,277,307 | | Credit Suisse Mortgage Capital Certificates, Series 2005-1R-2A5 | | | 5.75 | % (a) | | | 12/26/2035 | | | | 1,115,045 | |
13,002,038 | | Credit Suisse Mortgage Capital Certificates, Series 2006-1-2A1 | | | 6.00 | % | | | 02/25/2036 | | | | 6,993,477 | |
2,195,993 | | Credit Suisse Mortgage Capital Certificates, Series 2006-2-3A1 | | | 6.50 | % | | | 03/25/2036 | | | | 842,634 | |
2,627,926 | | Credit Suisse Mortgage Capital Certificates, Series 2006-2-5A1 (1 Month LIBOR USD + 0.70%, 0.70% Floor, 6.00% Cap) | | | 0.81 | % | | | 03/25/2036 | | | | 852,111 | |
14,688,896 | | Credit Suisse Mortgage Capital Certificates, Series 2006-2-5A2 (-1 x 1 Month LIBOR USD + 5.30%, 5.30% Cap) | | | 5.19 | % (f)(i) | | | 03/25/2036 | | | | 2,950,378 | |
3,059,676 | | Credit Suisse Mortgage Capital Certificates, Series 2006-2-5A3 | | | 6.25 | % | | | 03/25/2036 | | | | 2,000,979 | |
8,280,708 | | Credit Suisse Mortgage Capital Certificates, Series 2006-2-5A4 | | | 6.00 | % | | | 03/25/2036 | | | | 5,250,510 | |
1,961,779 | | Credit Suisse Mortgage Capital Certificates, Series 2006-3-4A3 | | | 5.50 | % | | | 04/25/2036 | | | | 1,680,457 | |
1,185,946 | | Credit Suisse Mortgage Capital Certificates, Series 2006-3-4A4 | | | 5.50 | % | | | 04/25/2036 | | | | 1,017,674 | |
3,032,080 | | Credit Suisse Mortgage Capital Certificates, Series 2006-4-1A8 (1 Month LIBOR USD + 1.00%, 6.00% Floor, 6.00% Cap) | | | 6.00 | % | | | 05/25/2036 | | | | 2,383,610 | |
20,283,050 | | Credit Suisse Mortgage Capital Certificates, Series 2006-4-4A1 | | | 7.00 | % | | | 05/25/2036 | | | | 7,329,156 | |
8,261,450 | | Credit Suisse Mortgage Capital Certificates, Series 2006-6-1A4 | | | 6.00 | % | | | 07/25/2036 | | | | 6,368,523 | |
10,176,971 | | Credit Suisse Mortgage Capital Certificates, Series 2006-6-3A1 | | | 7.00 | % | | | 07/25/2036 | | | | 2,096,127 | |
150,319 | | Credit Suisse Mortgage Capital Certificates, Series 2006-7-3A11 | | | 6.00 | % | | | 08/25/2036 | | | | 94,761 | |
2,158,139 | | Credit Suisse Mortgage Capital Certificates, Series 2006-7-7A5 | | | 6.00 | % | | | 08/25/2036 | | | | 1,999,306 | |
3,987,371 | | Credit Suisse Mortgage Capital Certificates, Series 2006-9-2A1 | | | 5.50 | % | | | 11/25/2036 | | | | 3,794,766 | |
15,540,841 | | Credit Suisse Mortgage Capital Certificates, Series 2006-9-3A1 | | | 6.00 | % | | | 11/25/2036 | | | | 14,439,813 | |
4,576,407 | | Credit Suisse Mortgage Capital Certificates, Series 2006-9-4A1 | | | 6.00 | % | | | 11/25/2036 | | | | 3,762,492 | |
2,295,252 | | Credit Suisse Mortgage Capital Certificates, Series 2006-9-6A14 | | | 6.00 | % | | | 11/25/2036 | | | | 2,264,521 | |
372,916 | | Credit Suisse Mortgage Capital Certificates, Series 2006-9-6A15 (-6 x 1 Month LIBOR USD + 39.90%, 39.90% Cap) | | | 39.19 | % (i) | | | 11/25/2036 | | | | 708,639 | |
9,565,751 | | Credit Suisse Mortgage Capital Certificates, Series 2007-1-1A4 | | | 6.13 | % (b) | | | 02/25/2037 | | | | 3,659,131 | |
3,898,188 | | Credit Suisse Mortgage Capital Certificates, Series 2007-1-5A14 | | | 6.00 | % | | | 02/25/2037 | | | | 3,480,263 | |
6,209,422 | | Credit Suisse Mortgage Capital Certificates, Series 2007-3-2A10 | | | 6.00 | % | | | 04/25/2037 | | | | 3,799,702 | |
4,125,688 | | Credit Suisse Mortgage Capital Certificates, Series 2007-5-2A5 | | | 5.00 | % | | | 08/25/2037 | | | | 3,861,776 | |
35,349,603 | | Credit Suisse Mortgage Capital Certificates, Series 2007-5-3A19 | | | 6.00 | % | | | 08/25/2037 | | | | 30,095,298 | |
15,647,520 | | Credit Suisse Mortgage Capital Certificates, Series 2007-5-3A9 | | | 6.00 | % | | | 08/25/2037 | | | | 13,318,987 | |
4,738,412 | | Credit Suisse Mortgage Capital Certificates, Series 2008-2R-1A1 | | | 6.00 | % (a) | | | 07/25/2037 | | | | 3,974,874 | |
525,585 | | Credit Suisse Mortgage Capital Certificates, Series 2009-1R-4A2 | | | 3.08 | % (a)(b) | | | 07/20/2035 | | | | 492,284 | |
2,420,045 | | Credit Suisse Mortgage Capital Certificates, Series 2010-13R-1A2 | | | 5.50 | % (a)(b) | | | 12/26/2035 | | | | 2,352,332 | |
44,384,328 | | Credit Suisse Mortgage Capital Certificates, Series 2010-17R-6A1 | | | 3.17 | % (a)(b) | | | 06/26/2037 | | | | 44,664,153 | |
6,466,061 | | Credit Suisse Mortgage Capital Certificates, Series 2010-4R-8A17 | | | 6.00 | % (a)(b) | | | 06/26/2037 | | | | 6,539,171 | |
9,064,321 | | Credit Suisse Mortgage Capital Certificates, Series 2012-10R-4A2 | | | 2.96 | % (a)(b) | | | 08/26/2046 | | | | 7,580,558 | |
21,963,220 | | Credit Suisse Mortgage Capital Certificates, Series 2013-9R-A1 | | | 3.00 | % (a)(b) | | | 05/27/2043 | | | | 21,013,789 | |
12,140,712 | | Credit Suisse Mortgage Capital Certificates, Series 2020-BPL1-A2 | | | 4.52 | % (a)(c) | | | 02/25/2024 | | | | 12,401,696 | |
10,619,395 | | Credit-Based Asset Servicing and Securitization LLC, Series 2006-CB4-AV3 (1 Month LIBOR USD + 0.30%, 0.30% Floor) | | | 0.41 | % | | | 05/25/2036 | | | | 8,713,007 | |
1,138,621 | | Credit-Based Asset Servicing and Securitization LLC, Series 2007-MX1-A3 | | | 5.83 | % (a)(h) | | | 12/25/2036 | | | | 1,135,310 | |
8,292,120 | | CSMC Mortgage-Backed Trust, Series 2006-4-6A1 | | | 6.00 | % | | | 05/25/2036 | | | | 4,872,100 | |
5,453,663 | | CSMC Mortgage-Backed Trust, Series 2007-1-3A1 | | | 6.00 | % | | | 02/25/2022 | | | | 1,569,611 | |
38,078 | | CSMC Mortgage-Backed Trust, Series 2007-2-2A1 | | | 5.00 | % | | | 03/25/2037 | | | | 36,240 | |
10,756,348 | | CSMC Mortgage-Backed Trust, Series 2019-RPL6-CERT | | | 4.10 | % (a)(b) | | | 11/25/2058 | | | | 10,458,446 | |
250,444,231 | | CSMC Mortgage-Backed Trust, Series 2019-RPL6-PT1 | | | 3.71 | % (a)(b) | | | 11/25/2058 | | | | 249,235,687 | |
22,015,849 | | CSMC Mortgage-Backed Trust, Series 2019-RPL8-A1 | | | 3.32 | % (a)(b) | | | 10/25/2058 | | | | 22,199,613 | |
7,662,016 | | CSMC Trust, Series 2009-12R-5A1 | | | 6.00 | % (a) | | | 06/27/2036 | | | | 6,676,852 | |
13,096,497 | | CSMC Trust, Series 2010-4R-3A17 | | | 6.00 | % (a)(b) | | | 06/26/2037 | | | | 13,001,985 | |
84,598,671 | | CSMC Trust, Series 2019-JR1-A1 | | | 4.10 | % (a)(b) | | | 09/27/2066 | | | | 85,820,258 | |
60,547,879 | | CSMC Trust, Series 2019-RPL2-A1 | | | 3.85 | % (a)(b) | | | 11/25/2058 | | | | 61,988,640 | |
4,227,000 | | CSMC Trust, Series 2020-AFC1-B1 | | | 3.45 | % (a)(b) | | | 02/25/2050 | | | | 4,201,840 | |
12,710,427 | | CSMC Trust, Series 2020-RPL1-CERT | | | 3.23 | % (a)(b) | | | 01/25/2046 | | | | 11,314,263 | |
239,405,000 | | CSMC Trust, Series 2020-RPL1-PT1 | | | 3.44 | % (a)(b) | | | 10/25/2069 | | | | 241,138,532 | |
7,469,850 | | CSMC Trust, Series 2021-NQM1-B1 | | | 2.83 | % (a)(b) | | | 05/25/2065 | | | | 7,475,957 | |
92,974,625 | | CSMCM Trust, Series 2017-RPL2-CERT | | | 0.01 | % (a)(b) | | | 02/25/2056 | | | | 85,179,010 | |
17,544,000 | | CWABS Asset-Backed Certificates Trust, Series 2005-11-MF1 | | | 5.35 | % (b) | | | 02/25/2036 | | | | 17,464,578 | |
10,537,986 | | Deutsche ALT-A Securities, Inc. Mortgage Loan Trust, Series 2005-4-A5 | | | 5.50 | % (b) | | | 09/25/2035 | | | | 10,418,885 | |
536,045 | | Deutsche ALT-A Securities, Inc. Mortgage Loan Trust, Series 2005-5-1A6 (-7 x 1 Month LIBOR USD + 35.93%, 35.93% Cap) | | | 35.14 | % (i) | | | 11/25/2035 | | | | 921,936 | |
664,773 | | Deutsche ALT-A Securities, Inc. Mortgage Loan Trust, Series 2005-5-2A1 (1 Month LIBOR USD + 0.20%, 0.20% Floor, 5.50% Cap) | | | 0.31 | % | | | 11/25/2035 | | | | 271,697 | |
2,006,356 | | Deutsche ALT-A Securities, Inc. Mortgage Loan Trust, Series 2005-5-2A2 (-1 x 1 Month LIBOR USD + 5.30%, 5.30% Cap) | | | 5.19 | % (f)(i) | | | 11/25/2035 | | | | 212,710 | |
18,012,115 | | Deutsche ALT-A Securities, Inc. Mortgage Loan Trust, Series 2007-2-2A1 (1 Month LIBOR USD + 0.30%, 0.30% Floor) | | | 0.41 | % | | | 09/25/2047 | | | | 16,481,737 | |
21,989,495 | | Deutsche AlT-A Securities, Inc. Mortgage Loan Trust, Series 2007-OA3-A2 (1 Month LIBOR USD + 0.25%, 0.25% Floor) | | | 0.36 | % | | | 07/25/2047 | | | | 20,022,603 | |
12,294,104 | | Deutsche ALT-A Securities, Inc. Mortgage Loan Trust, Series 2007-OA5-A1B (1 Month LIBOR USD + 0.22%, 0.22% Floor) | | | 0.33 | % | | | 08/25/2047 | | | | 11,651,093 | |
4,352,537 | | Deutsche ALT-B Securities, Inc. Mortgage Loan Trust, Series 2006-AB1-A1C | | | 5.67 | % (b) | | | 02/25/2036 | | | | 4,327,081 | |
624,880 | | Deutsche ALT-B Securities, Inc. Mortgage Loan Trust, Series 2006-AB2-A2 | | | 4.95 | % (b) | | | 06/25/2036 | | | | 618,171 | |
14,975,669 | | Deutsche ALT-B Securities, Inc. Mortgage Loan Trust, Series 2006-AB4-A2 | | | 5.65 | % (b) | | | 10/25/2036 | | | | 14,720,840 | |
1,066,836 | | Deutsche ALT-B Securities, Inc. Mortgage Loan Trust, Series 2006-AB4-A3 | | | 5.90 | % (b) | | | 10/25/2036 | | | | 1,049,087 | |
1,563,332 | | Deutsche ALT-B Securities, Inc. Mortgage Loan Trust, Series 2006-AB4-A3A1 | | | 5.90 | % (b) | | | 10/25/2036 | | | | 1,530,203 | |
3,100,937 | | Deutsche ALT-B Securities, Inc. Mortgage Loan Trust, Series 2006-AB4-A6A1 | | | 6.37 | % (h) | | | 10/25/2036 | | | | 3,034,126 | |
5,427,015 | | Deutsche Mortgage Securities, Inc., Series 2006-PR1-3A1 (-1 x 1 Month LIBOR USD + 12.12%, 12.12% Cap) | | | 11.98 | % (a)(i) | | | 04/15/2036 | | | | 4,953,566 | |
3,241,091 | | Deutsche Mortgage Securities, Inc., Series 2006-PR1-4AI1 (-1 x 1 Month LIBOR USD + 12.11%, 12.11% Cap) | | | 11.96 | % (a)(i) | | | 04/15/2036 | | | | 3,172,673 | |
5,276,692 | | Deutsche Mortgage Securities, Inc., Series 2006-PR1-4AI2 (-2 x 1 Month LIBOR USD + 14.60%, 14.61% Cap) | | | 14.40 | % (a)(i) | | | 04/15/2036 | | | | 5,366,071 | |
434,181 | | Deutsche Mortgage Securities, Inc., Series 2006-PR1-5AI1 (-3 x 1 Month LIBOR USD + 19.35%, 19.35% Cap) | | | 19.03 | % (a)(i) | | | 04/15/2036 | | | | 484,181 | |
3,801,965 | | Deutsche Mortgage Securities, Inc., Series 2006-PR1-5AI3 (-1 x 1 Month LIBOR USD + 12.57%, 12.57% Cap) | | | 12.42 | % (a)(i) | | | 04/15/2036 | | | | 3,587,760 | |
62,971,258 | | Deutsche Mortgage Securities, Inc., Series 2006-PR1-5AI4 (-1 x 1 Month LIBOR USD + 12.12%, 12.12% Cap) | | | 11.98 | % (a)(i) | | | 04/15/2036 | | | | 59,145,011 | |
6,994,402 | | Deutsche Securities, Inc., Series 2005-6-2A1 | | | 5.50 | % | | | 12/25/2035 | | | | 6,797,977 | |
1,072,435 | | Deutsche Securities, Inc., Series 2006-AB4-A1A | | | 6.01 | % (b) | | | 10/25/2036 | | | | 1,054,412 | |
24,664,155 | | Eagle Ltd., Series 2019-1-M1B (1 Month LIBOR USD + 1.80%) | | | 1.91 | % (a) | | | 04/25/2029 | | | | 24,722,081 | |
14,781,995 | | Equifirst Loan Securitization Trust, Series 2007-1-A2B (1 Month LIBOR USD + 0.19%, 0.19% Floor) | | | 0.30 | % | | | 04/25/2037 | | | | 14,235,911 | |
49,642,629 | | Figure Line of Credit Trust, Series 2020-1-A | | | 4.04 | % (a)(b) | | | 09/25/2049 | | | | 49,635,312 | |
22,795,163 | | First Franklin Mortgage Loan Trust, Series 2007-FF2-A1 (1 Month LIBOR USD + 0.14%, 0.14% Floor) | | | 0.25 | % | | | 03/25/2037 | | | | 15,306,339 | |
25,661,617 | | First Franklin Mortgage Loan Trust, Series 2007-FF2-A2C (1 Month LIBOR USD + 0.15%, 0.15% Floor) | | | 0.26 | % | | | 03/25/2037 | | | | 15,689,813 | |
4,535,669 | | First Horizon Alternative Mortgage Securities Trust, Series 2005-AA4-1A1 | | | 2.51 | % (b) | | | 05/25/2035 | | | | 3,366,539 | |
4,890,165 | | First Horizon Alternative Mortgage Securities Trust, Series 2005-FA8-1A4 | | | 5.50 | % | | | 11/25/2035 | | | | 3,602,147 | |
273,745 | | First Horizon Alternative Mortgage Securities Trust, Series 2005-FA8-2A1 | | | 5.00 | % | | | 05/25/2021 | | | | 273,828 | |
2,077,323 | | First Horizon Alternative Mortgage Securities Trust, Series 2006-AA3-A1 | | | 2.58 | % (b) | | | 06/25/2036 | | | | 1,925,784 | |
2,285,905 | | First Horizon Alternative Mortgage Securities Trust, Series 2006-FA1-1A12 | | | 6.00 | % | | | 04/25/2036 | | | | 1,591,136 | |
7,670,636 | | First Horizon Alternative Mortgage Securities Trust, Series 2006-FA1-1A3 | | | 5.75 | % | | | 04/25/2036 | | | | 5,194,480 | |
1,564,121 | | First Horizon Alternative Mortgage Securities Trust, Series 2006-FA2-1A5 | | | 6.00 | % | | | 05/25/2036 | | | | 1,047,028 | |
2,272,772 | | First Horizon Alternative Mortgage Securities Trust, Series 2006-FA8-1A5 | | | 6.00 | % | | | 02/25/2037 | | | | 1,450,295 | |
4,221,598 | | First Horizon Alternative Mortgage Securities Trust, Series 2006-RE1-A1 | | | 5.50 | % (b) | | | 05/25/2035 | | | | 3,611,341 | |
12,922,155 | | First Horizon Alternative Mortgage Securities Trust, Series 2007-FA3-A3 | | | 6.00 | % | | | 06/25/2037 | | | | 7,899,621 | |
664,911 | | First Horizon Alternative Mortgage Securities Trust, Series 2007-FA3-A4 | | | 6.00 | % | | | 06/25/2037 | | | | 406,476 | |
774,503 | | First Horizon Alternative Mortgage Securities Trust, Series 2007-FA4-1A13 | | | 6.25 | % | | | 08/25/2037 | | | | 513,133 | |
2,390,949 | | First Horizon Alternative Mortgage Securities Trust, Series 2007-FA4-1A4 | | | 6.25 | % | | | 08/25/2037 | | | | 1,585,369 | |
1,123,403 | | First Horizon Alternative Mortgage Securities Trust, Series 2007-FA4-1A5 | | | 6.25 | % | | | 08/25/2037 | | | | 742,891 | |
1,062,829 | | First Horizon Mortgage Pass-Through Trust, Series 2006-1-1A2 | | | 6.00 | % | | | 05/25/2036 | | | | 733,410 | |
3,014,205 | | First Horizon Mortgage Pass-Through Trust, Series 2007-1-A3 | | | 6.00 | % | | | 03/25/2037 | | | | 2,037,289 | |
2,215,925 | | First Horizon Mortgage Pass-Through Trust, Series 2007-4-1A1 | | | 6.00 | % | | | 08/25/2037 | | | | 1,535,451 | |
9,000,000 | | FirstKey Homes Trust, Series 2020-SFR1-E | | | 2.79 | % (a) | | | 08/17/2037 | | | | 9,171,080 | |
18,000,000 | | FirstKey Homes Trust, Series 2020-SFR2-D | | | 1.97 | % (a) | | | 10/19/2037 | | | | 17,800,560 | |
26,225,000 | | FirstKey Homes Trust, Series 2020-SFR2-E | | | 2.67 | % (a) | | | 10/19/2037 | | | | 26,575,279 | |
72,500,000 | | FMC GMSR Issuer Trust, Series 2019-GT1-A | | | 5.07 | % (a)(b) | | | 05/25/2024 | | | | 73,027,916 | |
75,700,000 | | FMC GMSR Issuer Trust, Series 2019-GT2-A | | | 4.23 | % (a)(b) | | | 09/25/2024 | | | | 75,667,631 | |
61,200,000 | | FMC GMSR Issuer Trust, Series 2020-GT1-A | | | 4.45 | % (a)(b) | | | 01/25/2026 | | | | 60,920,573 | |
141,082,056 | | Fremont Home Loan Trust, Series 2006-D-1A1 (1 Month LIBOR USD + 0.14%, 0.14% Floor) | | | 0.25 | % | | | 11/25/2036 | | | | 98,858,044 | |
5,000,000 | | GCAT LLC, Series 2019-NQM2-M1 | | | 3.31 | % (a)(b) | | | 09/25/2059 | | | | 5,029,737 | |
2,751,000 | | GCAT LLC, Series 2019-NQM3-M1 | | | 3.45 | %(a)(b) | | | 11/25/2059 | | | | 2,713,321 | |
22,609,324 | | GCAT LLC, Series 2020-2-A1 | | | 3.72 | % (a)(c) | | | 06/25/2025 | | | | 22,677,998 | |
46,273,000 | | GE-WMC Asset-Backed Pass-Through Certificates, Series 2005-2-A2D (1 Month LIBOR USD + 0.64%, 0.64% Floor) | | | 0.75 | % | | | 12/25/2035 | | | | 45,105,875 | |
37,998,939 | | GE-WMC Mortgage Securities Trust, Series 2006-1-A2B (1 Month LIBOR USD + 0.30%, 0.30% Floor) | | | 0.41 | % | | | 08/25/2036 | | | | 23,496,571 | |
2,865,805 | | GMACM Mortgage Loan Trust, Series 2005-AR5-3A1 | | | 3.57 | % (b) | | | 09/19/2035 | | | | 2,776,156 | |
25,930,440 | | GreenPoint Mortgage Funding Trust, Series 2005-AR3-2A1 (1 Month LIBOR USD + 0.52%, 0.52% Floor, 10.50% Cap) | | | 0.63 | % | | | 08/25/2045 | | | | 15,478,385 | |
25,668,846 | | GreenPoint Mortgage Funding Trust, Series 2007-AR2-1A3 (1 Month LIBOR USD + 0.24%, 0.24% Floor) | | | 0.35 | % | | | 04/25/2047 | | | | 24,382,642 | |
995,427 | | GS Mortgage Securities Corporation, Series 2008-2R-1A1 | | | 3.78 | % (a)(b)(e) | | | 09/25/2036 | | | | 545,912 | |
178,648,722 | | GS Mortgage-Backed Securities Trust, Series 2020-RPL2-A1 | | | 1.75 | % (a)(b) | | | 05/25/2060 | | | | 182,981,311 | |
12,540,000 | | GS Mortgage-Backed Securities Trust, Series 2020-RPL2-M1 | | | 2.25 | % (a)(b) | | | 05/25/2060 | | | | 12,662,666 | |
10,237,000 | | GS Mortgage-Backed Securities Trust, Series 2020-RPL2-M2 | | | 2.75 | % (a)(b) | | | 05/25/2060 | | | | 10,326,113 | |
9,341,000 | | GS Mortgage-Backed Securities Trust, Series 2020-RPL2-M3 | | | 3.00 | % (a)(b) | | | 05/25/2060 | | | | 9,240,313 | |
31,926,991 | | GS Mortgage-Backed Securities Trust, Series 2020-RPL2-PT4 | | | 8.43 | % (a)(d) | | | 05/25/2060 | | | | 34,812,712 | |
148,336 | | GSAA Home Equity Trust, Series 2005-12-AF3 | | | 5.07 | % (b) | | | 09/25/2035 | | | | 125,230 | |
8,771,943 | | GSAA Home Equity Trust, Series 2006-10-AF3 | | | 5.98 | % (b) | | | 06/25/2036 | | | | 3,555,728 | |
6,278,230 | | GSAA Home Equity Trust, Series 2006-10-AF4 | | | 6.30 | % | | | 06/25/2036 | | | | 2,540,638 | |
11,922,662 | | GSAA Home Equity Trust, Series 2006-15-AF4 | | | 5.96 | % | | | 09/25/2036 | | | | 4,926,245 | |
1,926,879 | | GSAA Home Equity Trust, Series 2006-18-AF3A | | | 5.77 | % (b) | | | 11/25/2036 | | | | 868,330 | |
4,375,157 | | GSAA Home Equity Trust, Series 2006-18-AF6 | | | 5.68 | % (h) | | | 11/25/2036 | | | | 1,696,051 | |
8,268,467 | | GSAA Home Equity Trust, Series 2006-19-A1 (1 Month LIBOR USD + 0.18%, 0.18% Floor) | | | 0.29 | % | | | 12/25/2036 | | | | 3,295,072 | |
4,458,388 | | GSAA Home Equity Trust, Series 2007-10-A1A | | | 6.00 | % | | | 11/25/2037 | | | | 3,693,177 | |
2,629,223 | | GSAA Home Equity Trust, Series 2007-10-A2A | | | 6.50 | % | | | 11/25/2037 | | | | 1,744,832 | |
21,295,445 | | GSAMP Trust, Series 2006-HE6-A3 (1 Month LIBOR USD + 0.15%, 0.15% Floor) | | | 0.26 | % | | | 08/25/2036 | | | | 19,041,761 | |
8,335,256 | | GSAMP Trust, Series 2007-H1-A2B (1 Month LIBOR USD + 0.20%, 0.20% Floor) | | | 0.31 | % | | | 01/25/2047 | | | | 5,616,059 | |
9,023,458 | | GSMPS Mortgage Loan Trust, Series 2005-RP2-1AF (1 Month LIBOR USD + 0.35%, 0.35% Floor) | | | 0.46 | % (a) | | | 03/25/2035 | | | | 8,418,982 | |
9,023,458 | | GSMPS Mortgage Loan Trust, Series 2005-RP2-1AS | | | 4.44 | % (a)(b)(f) | | | 03/25/2035 | | | | 1,061,237 | |
5,557,807 | | GSMPS Mortgage Loan Trust, Series 2005-RP3-1AF (1 Month LIBOR USD + 0.35%, 0.35% Floor, 9.50% Cap) | | | 0.46 | % (a) | | | 09/25/2035 | | | | 4,707,832 | |
5,557,807 | | GSMPS Mortgage Loan Trust, Series 2005-RP3-1AS | | | 4.25 | % (a)(b)(f) | | | 09/25/2035 | | | | 638,775 | |
21,036,076 | | GSMPS Mortgage Loan Trust, Series 2006-RP1-1AF1 (1 Month LIBOR USD + 0.35%, 0.35% Floor, 9.15% Cap) | | | 0.46 | % (a) | | | 01/25/2036 | | | | 17,569,546 | |
21,036,076 | | GSMPS Mortgage Loan Trust, Series 2006-RP1-1AS | | | 4.17 | % (a)(b)(f) | | | 01/25/2036 | | | | 2,096,643 | |
22,150,456 | | GSMSC Resecuritization Trust, Series 2014-3R-2B (1 Month LIBOR USD + 0.18%, 0.18% Floor) | | | 0.30 | % (a) | | | 09/26/2036 | | | | 14,624,096 | |
1,176,692 | | GSR Mortgage Loan Trust, Series 2005-1F-1A2 | | | 5.50 | % | | | 02/25/2035 | | | | 1,203,871 | |
2,507,914 | | GSR Mortgage Loan Trust, Series 2005-1F-3A3 | | | 6.00 | % | | | 01/25/2035 | | | | 2,545,708 | |
355,201 | | GSR Mortgage Loan Trust, Series 2005-6F-3A5 | | | 6.00 | % | | | 07/25/2035 | | | | 380,312 | |
3,644,858 | | GSR Mortgage Loan Trust, Series 2005-6F-3A9 (-1 x 1 Month LIBOR USD + 6.90%, 6.90% Cap) | | | 6.79 | % (f)(i) | | | 07/25/2035 | | | | 383,517 | |
314,535 | | GSR Mortgage Loan Trust, Series 2005-6F-4A1 (1 Month LIBOR USD + 0.50%, 0.50% Floor, 6.00% Cap) | | | 0.61 | % | | | 07/25/2035 | | | | 295,365 | |
160,793 | | GSR Mortgage Loan Trust, Series 2005-7F-3A1 (1 Month LIBOR USD + 0.50%, 0.50% Floor, 6.00% Cap) | | | 0.61 | % | | | 09/25/2035 | | | | 154,859 | |
7,913,440 | | GSR Mortgage Loan Trust, Series 2005-8F-3A5 | | | 6.00 | % | | | 11/25/2035 | | | | 4,909,103 | |
2,050,025 | | GSR Mortgage Loan Trust, Series 2005-8F-4A1 | | | 6.00 | % | | | 11/25/2035 | | | | 1,346,971 | |
427,271 | | GSR Mortgage Loan Trust, Series 2006-1F-1A2 | | | 5.50 | % | | | 02/25/2036 | | | | 566,944 | |
492,207 | | GSR Mortgage Loan Trust, Series 2006-2F-2A3 | | | 5.75 | % | | | 02/25/2036 | | | | 497,971 | |
2,062,225 | | GSR Mortgage Loan Trust, Series 2006-2F-3A3 | | | 6.00 | % | | | 02/25/2036 | | | | 1,437,227 | |
2,476,724 | | GSR Mortgage Loan Trust, Series 2006-2F-3A6 | | | 6.00 | % | | | 02/25/2036 | | | | 1,726,107 | |
20,578,062 | | GSR Mortgage Loan Trust, Series 2006-5F-3A1 | | | 6.50 | % | | | 06/25/2036 | | | | 14,064,813 | |
5,725,209 | | GSR Mortgage Loan Trust, Series 2006-6F-2A3 | | | 6.00 | % | | | 07/25/2036 | | | | 4,300,078 | |
4,114,308 | | GSR Mortgage Loan Trust, Series 2006-7F-3A4 | | | 6.25 | % | | | 08/25/2036 | | | | 2,140,830 | |
12,439,445 | | GSR Mortgage Loan Trust, Series 2006-9F-4A1 | | | 6.50 | % | | | 10/25/2036 | | | | 9,181,085 | |
481,248 | | GSR Mortgage Loan Trust, Series 2007-1F-2A2 | | | 5.50 | % | | | 01/25/2037 | | | | 698,443 | |
1,168,086 | | GSR Mortgage Loan Trust, Series 2007-4F-1A1 | | | 5.00 | % | | | 07/25/2037 | | | | 1,465,488 | |
15,084,908 | | GSR Mortgage Loan Trust, Series 2007-4F-3A11 | | | 6.00 | % | | | 07/25/2037 | | | | 13,048,008 | |
728,992 | | HarborView Mortgage Loan Trust, Series 2005-14-3A1A | | | 2.73 | % (b) | | | 12/19/2035 | | | | 708,397 | |
6,087,801 | | HarborView Mortgage Loan Trust, Series 2005-2-1A (1 Month LIBOR USD + 0.52%, 0.52% Floor) | | | 0.63 | % | | | 05/19/2035 | | | | 3,102,069 | |
25,238,123 | | HarborView Mortgage Loan Trust, Series 2005-8-1A1A (1 Month LIBOR USD + 0.62%, 0.62% Floor, 11.00% Cap) | | | 0.73 | % | | | 09/19/2035 | | | | 16,747,890 | |
48,207,978 | | HarborView Mortgage Loan Trust, Series 2005-8-2A1A (12 Month US Treasury Average + 1.55%, 1.55% Floor) | | | 1.81 | % | | | 09/19/2035 | | | | 31,972,379 | |
4,788,283 | | HarborView Mortgage Loan Trust, Series 2006-10-2A1A (1 Month LIBOR USD + 0.18%, 0.18% Floor) | | | 0.29 | % | | | 11/19/2036 | | | | 4,872,230 | |
8,815,213 | | HarborView Mortgage Loan Trust, Series 2006-11-A1A (1 Month LIBOR USD + 0.34%, 0.34% Floor) | | | 0.45 | % | | | 12/19/2036 | | | | 8,292,707 | |
44,665,835 | | HarborView Mortgage Loan Trust, Series 2006-14-1A1A (1 Month LIBOR USD + 0.18%, 0.18% Floor) | | | 0.29 | % | | | 01/25/2047 | | | | 44,100,201 | |
78,804,788 | | HarborView Mortgage Loan Trust, Series 2006-8-1A1 (1 Month LIBOR USD + 0.40%) | | | 0.31 | % | | | 07/21/2036 | | | | 51,676,957 | |
12,553,616 | | HarborView Mortgage Loan Trust, Series 2006-BU1-1A1A (1 Month LIBOR USD + 0.42%, 0.42% Floor, 10.50% Cap) | | | 0.53 | % | | | 02/19/2046 | | | | 11,679,027 | |
18,873,166 | | HarborView Mortgage Loan Trust, Series 2007-7-1A1 (1 Month LIBOR USD + 1.00%, 10.50% Cap) | | | 1.11 | % | | | 10/25/2037 | | | | 17,837,243 | |
6,620,894 | | HMIR, Series 2019-1-M1 (1 Month LIBOR USD + 1.65%) | | | 1.76 | % (a) | | | 05/25/2029 | | | | 6,624,745 | |
712,715 | | Home Equity Asset Trust, Series 2003-3-M1 (1 Month LIBOR USD + 1.29%, 1.29% Floor) | | | 1.40 | % | | | 08/25/2033 | | | | 714,394 | |
825,134 | | Home Equity Asset Trust, Series 2004-7-M2 (1 Month LIBOR USD + 0.99%, 0.99% Floor) | | | 1.10 | % | | | 01/25/2035 | | | | 826,837 | |
12,182,000 | | Home Equity Mortgage Loan Asset Backed Trust, Series 2006-B-2A4 (1 Month LIBOR USD + 0.56%, 0.56% Floor) | | | 0.67 | % | | | 06/25/2036 | | | | 11,193,324 | |
8,886,858 | | Home Equity Mortgage Loan Asset Backed Trust, Series 2006-D-2A4 (1 Month LIBOR USD + 0.24%, 0.24% Floor) | | | 0.35 | % | | | 11/25/2036 | | | | 7,595,597 | |
9,172,681 | | Home Equity Mortgage Loan Asset Backed Trust, Series 2007-B-1A1 (1 Month LIBOR USD + 0.19%, 0.19% Floor) | | | 0.30 | % | | | 07/25/2037 | | | | 5,123,005 | |
9,172,681 | | Home Equity Mortgage Loan Asset Backed Trust, Series 2007-B-1A2 (1 Month LIBOR USD + 0.19%, 0.19% Floor) | | | 0.30 | % | | | 07/25/2037 | | | | 5,123,005 | |
3,901,809 | | Home Partners of America Trust, Series 2019-2-C | | | 3.02 | % (a) | | | 10/19/2039 | | | | 3,881,241 | |
4,150,861 | | Home Partners of America Trust, Series 2019-2-D | | | 3.12 | % (a) | | | 10/19/2039 | | | | 4,048,583 | |
7,813,385 | | Home Partners of America Trust, Series 2019-2-E | | | 3.32 | % (a) | | | 10/19/2039 | | | | 7,654,993 | |
657,640 | | HomeBanc Mortgage Trust, Series 2005-1-M2 (1 Month LIBOR USD + 0.74%, 0.74% Floor, 11.50% Cap) | | | 0.84 | % | | | 03/25/2035 | | | | 598,325 | |
65,500,000 | | Homeward Opportunities Fund Trust, Series 2020-BPL1-A1 | | | 3.23 | % (a)(c) | | | 08/25/2025 | | | | 65,667,863 | |
20,789,845 | | HSI Asset Loan Obligation Trust, Series 2007-2-3A6 | | | 6.00 | % | | | 09/25/2037 | | | | 10,694,049 | |
915,273 | | HSI Asset Loan Obligation Trust, Series 2007-AR1-3A1 | | | 2.61 | % (b) | | | 01/25/2037 | | | | 892,628 | |
15,597,586 | | HSI Asset Loan Obligation Trust, Series 2007-WF1-A3 | | | 4.80 | % (h) | | | 12/25/2036 | | | | 7,420,126 | |
31,479,141 | | HSI Asset Securitization Corporation, Series 2006-HE1-1A1 (1 Month LIBOR USD + 0.14%, 0.14% Floor) | | | 0.25 | % | | | 10/25/2036 | | | | 13,900,014 | |
19,576,070 | | HSI Asset Securitization Corporation, Series 2007-NC1-A3 (1 Month LIBOR USD + 0.18%, 0.18% Floor) | | | 0.29 | % | | | 04/25/2037 | | | | 16,042,650 | |
6,248,960 | | Impac Secured Assets Trust, Series 2007-1-A2 (1 Month LIBOR USD + 0.16%, 0.16% Floor, 11.50% Cap) | | | 0.27 | % | | | 03/25/2037 | | | | 6,178,423 | |
412,536 | | Impac Trust, Series 2002-9F-A1 | | | 5.22 | % (h) | | | 12/25/2032 | | | | 428,111 | |
4,097,722 | | IndyMac IMSC Mortgage Loan Trust, Series 2007-HOA1-A11 (1 Month LIBOR USD + 0.18%, 0.18% Floor) | | | 0.29 | % | | | 07/25/2047 | | | | 3,300,274 | |
7,814,077 | | IndyMac Mortgage Loan Trust , Series 2005-AR15-A1 | | | 2.99 | % (b) | | | 09/25/2035 | | | | 7,514,936 | |
7,233,227 | | IndyMac Mortgage Loan Trust , Series 2007-AR21-8A1 | | | 2.95 | % (b) | | | 09/25/2037 | | | | 7,449,218 | |
1,280,542 | | IndyMac Mortgage Loan Trust, Series 2006-AR2-1A1 | | | 3.07 | % (b) | | | 09/25/2036 | | | | 1,100,416 | |
1,435,891 | | IndyMac Mortgage Loan Trust, Series 2006-AR2-4A1 | | | 2.91 | % (b) | | | 09/25/2036 | | | | 1,329,636 | |
12,470,092 | | IndyMac Mortgage Loan Trust, Series 2006-AR3-1A1 | | | 3.01 | % (b) | | | 12/25/2036 | | | | 12,014,134 | |
3,640,529 | | IndyMac Mortgage Loan Trust, Series 2006-AR7-3A1 | | | 2.90 | % (b) | | | 05/25/2036 | | | | 3,353,471 | |
3,475,527 | | IndyMac Mortgage Loan Trust, Series 2007-A1-A1 | | | 6.00 | % | | | 08/25/2037 | | | | 2,080,943 | |
2,544,357 | | IndyMac Mortgage Loan Trust, Series 2007-A1-A7 | | | 6.00 | % | | | 08/25/2037 | | | | 1,523,413 | |
9,768,759 | | IndyMac Mortgage Loan Trust, Series 2007-A2-1A1 | | | 6.00 | % | | | 10/25/2037 | | | | 7,622,447 | |
12,481,205 | | IndyMac Mortgage Loan Trust, Series 2007-A2-2A3 | | | 6.50 | % | | | 10/25/2037 | | | | 9,608,157 | |
19,421,935 | | IndyMac Mortgage Loan Trust, Series 2007-A2-3A1 | | | 7.00 | % | | | 10/25/2037 | | | | 8,856,223 | |
17,186,157 | | IndyMac Mortgage Loan Trust, Series 2007-A3-A1 | | | 6.25 | % | | | 11/25/2037 | | | | 11,253,370 | |
4,821,151 | | IndyMac Mortgage Loan Trust, Series 2007-AR13-2A1 | | | 3.23 | % (b) | | | 07/25/2037 | | | | 3,941,827 | |
4,315,514 | | IndyMac Mortgage Loan Trust, Series 2007-AR1-3A1 | | | 2.88 | % (b) | | | 03/25/2037 | | | | 4,264,494 | |
3,136,800 | | IndyMac Mortgage Loan Trust, Series 2007-AR3-3A1 | | | 2.88 | % (b) | | | 07/25/2037 | | | | 3,124,253 | |
30,729,127 | | IndyMac Mortgage Loan Trust, Series 2007-F1-2A1 | | | 6.50 | % | | | 06/25/2037 | | | | 13,507,283 | |
347,138 | | IndyMac Mortgage Loan Trust, Series 2007-F2-1A2 | | | 6.00 | % | | | 07/25/2037 | | | | 331,808 | |
25,053,026 | | IndyMac Mortgage Loan Trust, Series 2007-F2-2A1 | | | 6.50 | % | | | 07/25/2037 | | | | 12,948,191 | |
7,324,469 | | JP Morgan Alternative Loan Trust, Series 2005-S1-2A11 | | | 6.00 | % | | | 12/25/2035 | | | | 6,650,926 | |
2,348,069 | | JP Morgan Alternative Loan Trust, Series 2005-S1-2A9 | | | 6.00 | % | | | 12/25/2035 | | | | 2,132,145 | |
4,533,949 | | JP Morgan Alternative Loan Trust, Series 2006-A2-1A1 (1 Month LIBOR USD + 0.36%, 0.36% Floor, 11.50% Cap) | | | 0.47 | % | | | 05/25/2036 | | | | 4,299,292 | |
2,787,142 | | JP Morgan Alternative Loan Trust, Series 2006-S1-1A8 | | | 5.75 | % | | | 03/25/2036 | | | | 2,143,676 | |
9,445,308 | | JP Morgan Alternative Loan Trust, Series 2006-S2-A4 | | | 6.69 | % (h) | | | 05/25/2036 | | | | 9,540,696 | |
15,647,173 | | JP Morgan Alternative Loan Trust, Series 2006-S4-A4 | | | 5.96 | % (h) | | | 12/25/2036 | | | | 15,669,226 | |
2,179,200 | | JP Morgan Mortgage Acquisition Corporation, Series 2005-WMC1-M4 (1 Month LIBOR USD + 0.90%, 0.90% Floor) | | | 1.01 | % | | | 09/25/2035 | | | | 2,076,354 | |
7,886,040 | | JP Morgan Mortgage Acquisition Trust, Series 2006-CH2-AF3 | | | 5.46 | % (h) | | | 09/25/2029 | | | | 6,355,198 | |
14,213,130 | | JP Morgan Mortgage Acquisition Trust, Series 2006-HE3-A1 (1 Month LIBOR USD + 0.14%, 0.14% Floor) | | | 0.25 | % | | | 11/25/2036 | | | | 13,368,205 | |
26,561,730 | | JP Morgan Mortgage Acquisition Trust, Series 2006-RM1-A3 (1 Month LIBOR USD + 0.12%, 0.12% Floor) | | | 0.23 | % | | | 08/25/2036 | | | | 15,088,837 | |
24,549,534 | | JP Morgan Mortgage Acquisition Trust, Series 2006-RM1-A4 (1 Month LIBOR USD + 0.18%, 0.18% Floor) | | | 0.29 | % | | | 08/25/2036 | | | | 14,115,936 | |
3,434,510 | | JP Morgan Mortgage Acquisition Trust, Series 2006-WF1-A5 | | | 6.91 | % (h) | | | 07/25/2036 | | | | 1,550,762 | |
5,282,096 | | JP Morgan Mortgage Acquisition Trust, Series 2006-WMC4-A1A (1 Month LIBOR USD + 0.13%, 0.13% Floor) | | | 0.24 | % | | | 12/25/2036 | | | | 3,949,978 | |
23,000,000 | | JP Morgan Mortgage Acquisition Trust, Series 2007-CH1-AF5 | | | 4.81 | % (h) | | | 11/25/2036 | | | | 24,251,842 | |
9,690,000 | | JP Morgan Mortgage Acquisition Trust, Series 2007-CH3-M2 (1 Month LIBOR USD + 0.32%, 0.32% Floor) | | | 0.43 | % | | | 03/25/2037 | | | | 9,110,541 | |
633,414 | | JP Morgan Mortgage Trust, Series 2005-A6-5A1 | | | 2.85 | % (b) | | | 08/25/2035 | | | | 620,551 | |
5,650,196 | | JP Morgan Mortgage Trust, Series 2005-S1-1A2 | | | 6.50 | % | | | 01/25/2035 | | | | 6,139,197 | |
520,940 | | JP Morgan Mortgage Trust, Series 2005-S2-2A13 | | | 5.50 | % | | | 09/25/2035 | | | | 499,810 | |
1,174,245 | | JP Morgan Mortgage Trust, Series 2006-S2-3A3 | | | 6.00 | % | | | 07/25/2036 | | | | 704,564 | |
3,750,343 | | JP Morgan Mortgage Trust, Series 2006-S2-3A5 | | | 6.25 | % | | | 07/25/2036 | | | | 2,386,704 | |
2,156,982 | | JP Morgan Mortgage Trust, Series 2006-S3-1A2 | | | 6.00 | % | | | 08/25/2036 | | | | 1,427,738 | |
7,853,824 | | JP Morgan Mortgage Trust, Series 2006-S3-1A21 (1 Month LIBOR USD + 0.38%, 0.38% Floor, 7.50% Cap) | | | 0.49 | % | | | 08/25/2036 | | | | 1,450,768 | |
7,853,824 | | JP Morgan Mortgage Trust, Series 2006-S3-1A22 (-1 x 1 Month LIBOR USD + 7.12%, 7.12% Cap) | | | 7.01 | %(f)(i) | | | 08/25/2036 | | | | 2,356,765 | |
1,005,098 | | JP Morgan Mortgage Trust, Series 2006-S3-1A9 | | | 6.00 | % | | | 08/25/2036 | | | | 665,289 | |
6,755,552 | | JP Morgan Mortgage Trust, Series 2006-S4-A3 | | | 6.00 | % | | | 01/25/2037 | | | | 4,288,575 | |
2,813,061 | | JP Morgan Mortgage Trust, Series 2006-S4-A5 | | | 6.00 | % | | | 01/25/2037 | | | | 1,818,843 | |
6,355,643 | | JP Morgan Mortgage Trust, Series 2006-S4-A8 (1 Month LIBOR USD + 0.38%, 0.38% Floor, 7.00% Cap) | | | 0.49 | % | | | 01/25/2037 | | | | 2,059,219 | |
6,355,643 | | JP Morgan Mortgage Trust, Series 2006-S4-A9 (-1 x 1 Month LIBOR USD + 6.62%, 6.62% Cap) | | | 6.51 | % (f)(i) | | | 01/25/2037 | | | | 1,793,166 | |
1,062,469 | | JP Morgan Mortgage Trust, Series 2007-A2-2A1 | | | 3.11 | % (b) | | | 04/25/2037 | | | | 948,808 | |
7,310,765 | | JP Morgan Mortgage Trust, Series 2007-S1-2A6 | | | 6.00 | % | | | 03/25/2037 | | | | 4,909,781 | |
2,125,949 | | JP Morgan Mortgage Trust, Series 2007-S3-1A1 | | | 5.50 | % | | | 08/25/2037 | | | | 1,537,110 | |
4,892,822 | | JP Morgan Mortgage Trust, Series 2007-S3-1A35 | | | 6.00 | % | | | 08/25/2037 | | | | 3,670,411 | |
1,864,480 | | JP Morgan Mortgage Trust, Series 2007-S3-1A64 | | | 7.50 | % | | | 08/25/2037 | | | | 1,058,967 | |
824,257 | | JP Morgan Mortgage Trust, Series 2007-S3-1A9 | | | 6.00 | % | | | 08/25/2037 | | | | 617,996 | |
4,511,417 | | JP Morgan Mortgage Trust, Series 2007-S3-1A96 | | | 6.00 | % | | | 08/25/2037 | | | | 3,383,479 | |
5,141,972 | | JP Morgan Mortgage Trust, Series 2007-S3-1A97 | | | 6.00 | % | | | 08/25/2037 | | | | 3,856,529 | |
96,783 | | JP Morgan Mortgage Trust, Series 2007-S3-2A2 | | | 5.50 | % | | | 08/25/2022 | | | | 97,539 | |
6,046,201 | | JP Morgan Resecuritization Trust, Series 2009-4-3A2 | | | 6.00 | % (a)(b) | | | 02/26/2037 | | | | 4,284,712 | |
16,557,971 | | JP Morgan Resecuritization Trust, Series 2009-7-7A1 | | | 7.00 | % (a)(b)(e) | | | 09/27/2037 | | | | 10,900,317 | |
10,973,827 | | JP Morgan Resecuritization Trust, Series 2010-1-1A4 | | | 6.00 | % (a) | | | 02/26/2037 | | | | 8,084,149 | |
5,847,191 | | JP Morgan Resecuritization Trust, Series 2010-1-2A11 | | | 7.00 | % (a)(b) | | | 01/26/2037 | | | | 3,914,648 | |
34,258,422 | | Legacy Mortgage Asset Trust, Series 2019-GS1-A1 | | | 4.00 | % (a)(c) | | | 01/25/2059 | | | | 35,081,364 | |
34,885,735 | | Legacy Mortgage Asset Trust, Series 2019-GS2-A1 | | | 3.75 | % (a)(c) | | | 01/25/2059 | | | | 34,944,838 | |
23,954,184 | | Legacy Mortgage Asset Trust, Series 2019-GS5-A1 | | | 3.20 | % (a)(c) | | | 05/25/2059 | | | | 24,197,994 | |
29,406,000 | | Legacy Mortgage Asset Trust, Series 2019-GS5-A2 | | | 4.25 | % (a)(c) | | | 05/25/2059 | | | | 29,487,710 | |
171,163,216 | | Legacy Mortgage Asset Trust, Series 2019-RPL3-PT1 | | | 0.00 | % (a) | | | 06/25/2058 | | | | 174,952,428 | |
85,271,880 | | Legacy Mortgage Asset Trust, Series 2019-SL3-A | | | 3.47 | % (a)(c) | | | 11/25/2061 | | | | 85,737,831 | |
26,545,000 | | Legacy Mortgage Asset Trust, Series 2020-GS1-A2 | | | 4.00 | % (a)(c) | | | 10/25/2059 | | | | 26,625,246 | |
38,853,126 | | Legacy Mortgage Asset Trust, Series 2020-GS2-A1 | | | 2.75 | % (a)(c) | | | 03/25/2060 | | | | 39,078,707 | |
26,264,000 | | Legacy Mortgage Asset Trust, Series 2020-GS2-A2 | | | 4.00 | % (a)(c) | | | 03/25/2060 | | | | 26,343,396 | |
1,987,524 | | Lehman Mortgage Trust, Series 2005-2-3A5 | | | 5.50 | % | | | 12/25/2035 | | | | 1,475,447 | |
1,655,375 | | Lehman Mortgage Trust, Series 2005-2-5A5 | | | 5.75 | % | | | 12/25/2035 | | | | 1,478,381 | |
2,313,500 | | Lehman Mortgage Trust, Series 2005-3-2A1 | | | 6.00 | % | | | 01/25/2036 | | | | 2,450,647 | |
197,003 | | Lehman Mortgage Trust, Series 2005-3-2A3 | | | 5.50 | % | | | 01/25/2036 | | | | 205,201 | |
1,058,092 | | Lehman Mortgage Trust, Series 2005-3-2A7 | | | 6.00 | % | | | 01/25/2036 | | | | 1,119,981 | |
1,190,731 | | Lehman Mortgage Trust, Series 2006-1-1A1 (1 Month LIBOR USD + 0.75%, 0.75% Floor, 5.50% Cap) | | | 0.86 | % | | | 02/25/2036 | | | | 617,871 | |
3,572,192 | | Lehman Mortgage Trust, Series 2006-1-1A2 (-1 x 1 Month LIBOR USD + 4.75%, 4.75% Cap) | | | 4.64 | % (f)(i) | | | 02/25/2036 | | | | 618,588 | |
3,400,591 | | Lehman Mortgage Trust, Series 2006-1-3A1 (1 Month LIBOR USD + 0.75%, 0.75% Floor, 5.50% Cap) | | | 0.86 | % | | | 02/25/2036 | | | | 2,823,206 | |
3,400,591 | | Lehman Mortgage Trust, Series 2006-1-3A2 (-1 x 1 Month LIBOR USD + 4.75%, 4.75% Cap) | | | 4.64 | % (f)(i) | | | 02/25/2036 | | | | 394,785 | |
2,190,972 | | Lehman Mortgage Trust, Series 2006-1-3A4 | | | 5.50 | % | | | 02/25/2036 | | | | 2,092,527 | |
2,444,720 | | Lehman Mortgage Trust, Series 2006-4-1A3 (-1 x 1 Month LIBOR USD + 5.40%, 5.40% Cap) | | | 5.29 | % (f)(i) | | | 08/25/2036 | | | | 396,644 | |
1,553,811 | | Lehman Mortgage Trust, Series 2006-4-1A4 | | | 6.00 | % | | | 08/25/2036 | | | | 1,501,987 | |
6,053,892 | | Lehman Mortgage Trust, Series 2006-5-2A1 (1 Month LIBOR USD + 0.35%, 0.35% Floor, 7.50% Cap) | | | 0.46 | % | | | 09/25/2036 | | | | 520,932 | |
12,610,192 | | Lehman Mortgage Trust, Series 2006-5-2A2 (-1 x 1 Month LIBOR USD + 7.15%, 7.15% Cap) | | | 7.04 | % (f)(i) | | | 09/25/2036 | | | | 3,132,259 | |
7,234,026 | | Lehman Mortgage Trust, Series 2006-6-3A9 | | | 5.50 | % | | | 10/25/2036 | | | | 6,260,058 | |
1,121,160 | | Lehman Mortgage Trust, Series 2006-6-4A5 | | | 6.00 | % | | | 12/25/2036 | | | | 1,129,064 | |
3,174,676 | | Lehman Mortgage Trust, Series 2006-7-2A2 (1 Month LIBOR USD + 0.45%, 0.45% Floor, 7.00% Cap) | | | 0.56 | % | | | 11/25/2036 | | | | 605,756 | |
11,392,423 | | Lehman Mortgage Trust, Series 2006-7-2A5 (-1 x 1 Month LIBOR USD + 6.55%, 6.55% Cap) | | | 6.44 | % (f)(i) | | | 11/25/2036 | | | | 3,088,901 | |
2,183,423 | | Lehman Mortgage Trust, Series 2006-9-1A19 (-5 x 1 Month LIBOR USD + 30.68%, 30.68% Cap) | | | 30.18 | % (i) | | | 01/25/2037 | | | | 3,279,879 | |
2,385,220 | | Lehman Mortgage Trust, Series 2006-9-1A5 (1 Month LIBOR USD + 0.60%, 0.60% Floor, 5.75% Cap) | | | 0.71 | % | | | 01/25/2037 | | | | 1,490,885 | |
7,119,685 | | Lehman Mortgage Trust, Series 2006-9-1A6 (-1 x 1 Month LIBOR USD + 5.15%, 5.15% Cap) | | | 5.04 | % (f)(i) | | | 01/25/2037 | | | | 1,105,943 | |
3,784,790 | | Lehman Mortgage Trust, Series 2006-9-2A1 (1 Month LIBOR USD + 0.38%, 0.38% Floor, 7.00% Cap) | | | 0.49 | % | | | 01/25/2037 | | | | 669,414 | |
7,051,808 | | Lehman Mortgage Trust, Series 2006-9-2A2 (-1 x 1 Month LIBOR USD + 6.62%, 6.62% Cap) | | | 6.51 | % (f)(i) | | | 01/25/2037 | | | | 1,771,241 | |
6,669,110 | | Lehman Mortgage Trust, Series 2007-10-2A1 | | | 6.50 | % | | | 01/25/2038 | | | | 3,484,344 | |
23,964,515 | | Lehman Mortgage Trust, Series 2007-1-1A1 (1 Month LIBOR USD + 0.21%, 0.21% Floor) | | | 0.32 | % (a) | | | 06/25/2037 | | | | 20,017,919 | |
1,903,187 | | Lehman Mortgage Trust, Series 2007-2-1A1 | | | 5.75 | % | | | 02/25/2037 | | | | 1,597,672 | |
2,543,555 | | Lehman Mortgage Trust, Series 2007-4-2A11 (1 Month LIBOR USD + 0.33%, 0.33% Floor, 7.00% Cap) | | | 0.44 | % | | | 05/25/2037 | | | | 605,423 | |
11,969,333 | | Lehman Mortgage Trust, Series 2007-4-2A8 (-1 x 1 Month LIBOR USD + 6.67%, 6.67% Cap) | | | 6.56 | % (f)(i) | | | 05/25/2037 | | | | 3,125,865 | |
877,497 | | Lehman Mortgage Trust, Series 2007-4-2A9 (1 Month LIBOR USD + 0.33%, 0.33% Floor, 7.00% Cap) | | | 0.44 | % | | | 05/25/2037 | | | | 210,269 | |
9,393,634 | | Lehman Mortgage Trust, Series 2007-5-11A1 | | | 5.06 | % (b) | | | 06/25/2037 | | | | 7,272,609 | |
35,849 | | Lehman Mortgage Trust, Series 2007-5-3A4 | | | 5.00 | % | | | 12/25/2035 | | | | 35,811 | |
908,263 | | Lehman Mortgage Trust, Series 2007-5-4A3 (-6 x 1 Month LIBOR USD + 40.08%, 40.08% Cap) | | | 39.43 | % (i) | | | 08/25/2036 | | | | 1,323,937 | |
754,394 | | Lehman Mortgage Trust, Series 2007-5-7A3 | | | 7.50 | % | | | 10/25/2036 | | | | 492,053 | |
146,747 | | Lehman Mortgage Trust, Series 2007-6-1A8 | | | 6.00 | % | | | 07/25/2037 | | | | 146,439 | |
6,651,474 | | Lehman Mortgage Trust, Series 2007-9-2A2 | | | 6.50 | % | | | 10/25/2037 | | | | 3,425,130 | |
3,919,576 | | Lehman Mortgage Trust, Series 2008-2-1A6 | | | 6.00 | % | | | 03/25/2038 | | | | 2,192,433 | |
4,072,679 | | Lehman Trust, Series 2005-4-2A3A | | | 5.00 | % (h) | | | 10/25/2035 | | | | 4,531,030 | |
9,825,957 | | Lehman Trust, Series 2005-9N-2A1 (12 Month US Treasury Average + 1.06%, 1.06% Floor) | | | 1.32 | % | | | 02/25/2036 | | | | 9,342,087 | |
849,499 | | Lehman Trust, Series 2006-17-1A2 (1 Month LIBOR USD + 0.34%, 0.34% Floor) | | | 0.45 | % | | | 08/25/2046 | | | | 1,330,324 | |
9,343,516 | | Lehman Trust, Series 2006-5-1A1A (1 Month LIBOR USD + 0.42%, 0.42% Floor) | | | 0.53 | % | | | 04/25/2036 | | | | 9,170,123 | |
138,971 | | Lehman Trust, Series 2006-5-2A4A | | | 6.39 | % (h) | | | 04/25/2036 | | | | 162,751 | |
10,757,711 | | Lehman Trust, Series 2006-GP3-1A1 (1 Month LIBOR USD + 0.40%, 0.40% Floor) | | | 0.51 | % | | | 06/25/2046 | | | | 10,725,218 | |
8,820,411 | | Lehman Trust, Series 2007-1-2A1 | | | 7.00 | % (b) | | | 02/25/2037 | | | | 9,405,104 | |
15,440,374 | | Lehman Trust, Series 2007-12N-1A3A (1 Month LIBOR USD + 0.20%, 0.20% Floor) | | | 0.31 | % | | | 07/25/2047 | | | | 15,349,051 | |
6,854,026 | | Lehman XS Trust, Series 2005-2-2A3B | | | 5.94 | % (h) | | | 08/25/2035 | | | | 6,782,921 | |
9,859,258 | | Lehman XS Trust, Series 2006-3-A3 (1 Month LIBOR USD + 0.60%, 0.60% Floor) | | | 0.71 | % | | | 03/25/2036 | | | | 9,576,601 | |
86,200,000 | | LHOME Mortgage Trust, Series 2019-RTL2-A1 | | | 3.84 | % (a) | | | 03/25/2024 | | | | 86,871,145 | |
19,200,000 | | LHOME Mortgage Trust, Series 2019-RTL3-A1 | | | 3.87 | % (a) | | | 07/25/2024 | | | | 19,408,562 | |
19,200,000 | | LHOME Mortgage Trust, Series 2020-RTL1-A1 | | | 3.23 | % (a) | | | 10/25/2024 | | | | 19,341,377 | |
9,300,000 | | LHOME Mortgage Trust, Series 2021-RTL1-A2 | | | 2.86 | % (a)(b) | | | 09/25/2026 | | | | 9,370,847 | |
33,161,114 | | Long Beach Mortgage Loan Trust, Series 2006-3-2A3 (1 Month LIBOR USD + 0.36%, 0.36% Floor) | | | 0.47 | % | | | 05/25/2046 | | | | 15,097,622 | |
5,400,825 | | Long Beach Mortgage Loan Trust, Series 2006-3-2A4 (1 Month LIBOR USD + 0.54%, 0.54% Floor) | | | 0.65 | % | | | 05/25/2046 | | | | 2,506,358 | |
18,304,485 | | Long Beach Mortgage Loan Trust, Series 2006-5-2A4 (1 Month LIBOR USD + 0.48%, 0.48% Floor) | | | 0.59 | % | | | 06/25/2036 | | | | 11,551,261 | |
33,741,457 | | Long Beach Mortgage Loan Trust, Series 2006-6-1A (1 Month LIBOR USD + 0.15%, 0.15% Floor) | | | 0.25 | % | | | 07/25/2036 | | | | 27,648,935 | |
4,397,406 | | Luminent Mortgage Trust, Series 2005-1-A1 (1 Month LIBOR USD + 0.52%, 0.52% Floor, 11.50% Cap) | | | 0.63 | % | | | 11/25/2035 | | | | 4,303,987 | |
3,516,123 | | MASTR Adjustable Rate Mortgages Trust, Series 2005-2-2A1 | | | 2.80 | % (b) | | | 03/25/2035 | | | | 3,446,644 | |
1,148,320 | | MASTR Adjustable Rate Mortgages Trust, Series 2005-6-5A1 | | | 2.96 | % (b) | | | 07/25/2035 | | | | 1,115,662 | |
7,497,935 | | MASTR Adjustable Rate Mortgages Trust, Series 2007-1-2A1 | | | 3.03 | % (b) | | | 11/25/2036 | | | | 5,881,633 | |
1,251,966 | | MASTR Alternative Loans Trust, Series 2005-2-3A1 | | | 6.00 | % | | | 03/25/2035 | | | | 1,249,417 | |
205,984 | | MASTR Alternative Loans Trust, Series 2005-5-2A3 | | | 5.50 | % | | | 07/25/2025 | | | | 205,966 | |
7,941,097 | | MASTR Alternative Loans Trust, Series 2005-5-3A1 | | | 5.75 | % | | | 08/25/2035 | | | | 5,696,431 | |
2,202,236 | | MASTR Alternative Loans Trust, Series 2005-6-1A5 | | | 5.50 | % | | | 12/25/2035 | | | | 1,982,978 | |
1,504,733 | | MASTR Alternative Loans Trust, Series 2006-3-1A2 | | | 6.25 | % | | | 07/25/2036 | | | | 1,221,755 | |
2,142,889 | | MASTR Alternative Loans Trust, Series 2007-1-1A5 | | | 5.75 | % | | | 10/25/2036 | | | | 2,132,837 | |
4,414,364 | | MASTR Alternative Loans Trust, Series 2007-1-2A7 | | | 6.00 | % | | | 10/25/2036 | | | | 2,198,926 | |
3,553,823 | | MASTR Asset Backed Securities Trust, Series 2003-OPT1-M3 (1 Month LIBOR USD + 4.13%, 4.13% Floor) | | | 4.23 | % | | | 12/25/2032 | | | | 3,604,429 | |
8,877,464 | | MASTR Asset Backed Securities Trust, Series 2006-AM2-A3 (1 Month LIBOR USD + 0.34%, 0.34% Floor) | | | 0.45 | % | | | 06/25/2036 | | | | 8,590,486 | |
17,905,964 | | MASTR Asset Backed Securities Trust, Series 2007-HE1-A3 (1 Month LIBOR USD + 0.21%, 0.21% Floor) | | | 0.32 | % | | | 05/25/2037 | | | | 17,418,734 | |
14,782,274 | | MASTR Asset Backed Securities Trust, Series 2007-WMC1-A1 (1 Month LIBOR USD + 0.15%, 0.15% Floor) | | | 0.25 | % | | | 01/25/2037 | | | | 6,076,289 | |
2,368,602 | | MASTR Asset Securitization Trust, Series 2006-1-1A4 | | | 5.75 | % | | | 05/25/2036 | | | | 2,124,137 | |
1,608,164 | | MASTR Asset Securitization Trust, Series 2006-2-1A11 (1 Month LIBOR USD + 6.00%, 6.00% Floor) | | | 6.00 | % | | | 06/25/2036 | | | | 1,371,829 | |
2,991,001 | | MASTR Asset Securitization Trust, Series 2007-1-1A3 | | | 6.25 | % | | | 11/25/2037 | | | | 2,024,321 | |
18,190,665 | | MASTR Resecuritization Trust, Series 2008-1-A1 | | | 6.00 | % (a)(b)(e) | | | 09/27/2037 | | | | 16,458,542 | |
10,564,172 | | MASTR Resecuritization Trust, Series 2008-4-A1 | | | 6.00 | % (a)(b) | | | 06/27/2036 | | | | 9,612,811 | |
2,118,718 | | MASTR Seasoned Securitization Trust, Series 2005-2-1A4 | | | 6.00 | % | | | 10/25/2032 | | | | 2,216,280 | |
723,314 | | MASTR Seasoned Securitization Trust, Series 2005-2-2A1 (1 Month LIBOR USD + 0.40%, 0.40% Floor, 7.50% Cap) | | | 0.51 | % | | | 10/25/2032 | | | | 673,495 | |
15,211,981 | | Merrill Lynch Alternative Note Asset Trust, Series 2007-F1-2A4 (1 Month LIBOR USD + 0.32%, 0.32% Floor, 7.00% Cap) | | | 0.43 | % | | | 03/25/2037 | | | | 3,823,083 | |
15,211,981 | | Merrill Lynch Alternative Note Asset Trust, Series 2007-F1-2A5 (-1 x 1 Month LIBOR USD + 6.68%, 6.68% Cap) | | | 6.57 | % (f)(i) | | | 03/25/2037 | | | | 4,095,420 | |
32,584,868 | | Merrill Lynch Alternative Note Asset Trust, Series 2007-OAR5-1A1 | | | 2.22 | % (b) | | | 10/25/2047 | | | | 14,160,481 | |
1,135,129 | | Merrill Lynch Mortgage Investors Trust, Series 2006-3-1A | | | 2.23 | % (b) | | | 10/25/2036 | | | | 1,142,858 | |
1,016,340 | | Merrill Lynch Mortgage Investors Trust, Series 2006-F1-1A2 | | | 6.00 | % | | | 04/25/2036 | | | | 722,868 | |
28,151,605 | | Merrill Lynch Mortgage Investors Trust, Series 2006-FM1-A1 (1 Month LIBOR USD + 0.30%, 0.30% Floor) | | | 0.42 | % | | | 04/25/2037 | | | | 21,360,444 | |
8,291,290 | | Merrill Lynch Mortgage Investors Trust, Series 2006-HE4-A2B (1 Month LIBOR USD + 0.20%, 0.20% Floor) | | | 0.31 | % | | | 07/25/2037 | | | | 2,661,646 | |
100,871,524 | | Merrill Lynch Mortgage Investors Trust, Series 2007-HE2-A1 (1 Month LIBOR USD + 0.25%, 0.25% Floor) | | | 0.36 | % | | | 02/25/2037 | | | | 64,291,223 | |
3,377,385 | | Merrill Lynch Mortgage Investors Trust, Series 2007-HE3-A3 (1 Month LIBOR USD + 0.19%, 0.19% Floor) | | | 0.30 | % | | | 04/25/2047 | | | | 2,002,364 | |
1,890,338 | | Merrill Lynch Mortgage Investors Trust, Series 2007-HE3-A4 (1 Month LIBOR USD + 0.27%, 0.27% Floor) | | | 0.38 | % | | | 04/25/2047 | | | | 1,127,152 | |
67,620,123 | | Merrill Lynch Mortgage Investors Trust, Series 2007-MLN1-A1 (1 Month LIBOR USD + 0.25%, 0.25% Floor) | | | 0.36 | % | | | 03/25/2037 | | | | 60,473,352 | |
46,671,000 | | MFA LLC, Series 2021-NPL1-A1 | | | 2.36 | % (a)(c) | | | 03/25/2060 | | | | 47,062,616 | |
13,090,251 | | Morgan Stanley Capital Trust, Series 2006-NC2-M1 (1 Month LIBOR USD + 0.54%, 0.54% Floor) | | | 0.65 | % | | | 02/25/2036 | | | | 13,117,690 | |
30,026,987 | | Morgan Stanley Home Equity Loan Trust, Series 2007-1-A4 (1 Month LIBOR USD + 0.22%, 0.22% Floor) | | | 0.33 | % | | | 12/25/2036 | | | | 18,733,441 | |
5,799,251 | | Morgan Stanley IXIS Real Estate Capital Trust, Series 2006-2-AFPT (1 Month LIBOR USD + 0.07%, 0.07% Floor) | | | 0.18 | % | | | 11/25/2036 | | | | 2,683,194 | |
875,532 | | Morgan Stanley Mortgage Loan Trust, Series 2005-10-1A1 (1 Month LIBOR USD + 0.70%, 0.70% Floor, 5.75% Cap) | | | 0.81 | % | | | 12/25/2035 | | | | 657,404 | |
2,193,612 | | Morgan Stanley Mortgage Loan Trust, Series 2005-10-1A6 | | | 5.75 | % | | | 12/25/2035 | | | | 1,870,362 | |
3,705,730 | | Morgan Stanley Mortgage Loan Trust, Series 2005-10-2A1 | | | 5.47 | % (b) | | | 12/25/2035 | | | | 3,695,609 | |
5,016,198 | | Morgan Stanley Mortgage Loan Trust, Series 2006-11-1A6 | | | 6.73 | % (h) | | | 08/25/2036 | | | | 1,541,622 | |
7,889,148 | | Morgan Stanley Mortgage Loan Trust, Series 2006-11-2A1 | | | 6.00 | % | | | 08/25/2036 | | | | 5,285,211 | |
7,500,042 | | Morgan Stanley Mortgage Loan Trust, Series 2006-16AX-2A2 (1 Month LIBOR USD + 0.17%, 0.17% Floor) | | | 0.28 | % | | | 11/25/2036 | | | | 3,073,251 | |
5,893,271 | | Morgan Stanley Mortgage Loan Trust, Series 2006-17XS-A3A | | | 5.65 | % (h) | | | 10/25/2046 | | | | 2,569,970 | |
1,975,053 | | Morgan Stanley Mortgage Loan Trust, Series 2006-17XS-A6 | | | 5.58 | % (h) | | | 10/25/2046 | | | | 764,755 | |
3,354,475 | | Morgan Stanley Mortgage Loan Trust, Series 2006-2-2A3 | | | 5.75 | % | | | 02/25/2036 | | | | 3,292,828 | |
18,055,854 | | Morgan Stanley Mortgage Loan Trust, Series 2006-7-3A | | | 5.11 | % (b) | | | 06/25/2036 | | | | 14,429,849 | |
1,991,837 | | Morgan Stanley Mortgage Loan Trust, Series 2006-7-4A4 | | | 6.00 | % | | | 06/25/2036 | | | | 1,523,512 | |
2,016,391 | | Morgan Stanley Mortgage Loan Trust, Series 2006-7-4A7 | | | 6.00 | % | | | 06/25/2036 | | | | 1,542,292 | |
3,123,839 | | Morgan Stanley Mortgage Loan Trust, Series 2007-13-6A1 | | | 6.00 | % | | | 10/25/2037 | | | | 2,384,067 | |
6,062,838 | | Morgan Stanley Mortgage Loan Trust, Series 2007-14AR-2A3 | | | 2.51 | % (b) | | | 10/25/2037 | | | | 4,950,246 | |
3,255,616 | | Morgan Stanley Mortgage Loan Trust, Series 2007-1XS-2A3 | | | 5.92 | % (h) | | | 09/25/2046 | | | | 1,267,711 | |
2,233,345 | | Morgan Stanley Mortgage Loan Trust, Series 2007-1XS-2A4A | | | 6.08 | % (h) | | | 09/25/2046 | | | | 1,016,789 | |
618,319 | | Morgan Stanley Mortgage Loan Trust, Series 2007-3XS-1A2A | | | 5.62 | % (h) | | | 01/25/2047 | | | | 614,456 | |
6,130,402 | | Morgan Stanley Mortgage Loan Trust, Series 2007-3XS-2A3S | | | 5.86 | % (h) | | | 01/25/2047 | | | | 3,323,578 | |
3,585,707 | | Morgan Stanley Mortgage Loan Trust, Series 2007-3XS-2A4S | | | 5.96 | % (h) | | | 01/25/2047 | | | | 1,943,666 | |
6,251,982 | | Morgan Stanley Re-Remic Trust, Series 2010-R5-4B | | | 1.55 | % (a)(h) | | | 06/26/2036 | | | | 5,730,485 | |
10,490,164 | | Morgan Stanley Re-Remic Trust, Series 2010-R5-5B | | | 0.94 | % (a)(h) | | | 01/26/2037 | | | | 9,489,915 | |
13,144,946 | | Morgan Stanley Re-Remic Trust, Series 2010-R9-3C | | | 6.00 | % (a)(b) | | | 11/26/2036 | | | | 13,003,152 | |
1,864,991 | | Morgan Stanley Re-Remic Trust, Series 2011-R1-1A | | | 5.94 | % (a)(b) | | | 02/26/2037 | | | | 1,970,331 | |
9,941,718 | | Morgan Stanley Re-Remic Trust, Series 2012-R4-1B | | | 0.27 | % (a)(d) | | | 08/26/2036 | | | | 9,110,608 | |
10,692,322 | | Morgan Stanley Re-Remic Trust, Series 2013-R2-1B | | | 2.68 | % (a)(b) | | | 10/26/2036 | | | | 9,521,213 | |
5,048,809 | | Morgan Stanley Resecuritization Trust, Series 2014-R7-B1 | | | 3.77 | % (a)(b) | | | 01/26/2051 | | | | 5,223,195 | |
38,631,472 | | Morgan Stanley Residential Mortgage Loan Trust, Series 2020-RPL1-A1 | | | 2.69 | % (a)(b) | | | 10/25/2060 | | | | 38,904,867 | |
11,234,527 | | New Century Alternative Mortgage Loan Trust, Series 2006-ALT1-AF3 | | | 6.17 | % (b) | | | 07/25/2036 | | | | 4,359,132 | |
13,936,546 | | New Century Alternative Mortgage Loan Trust, Series 2006-ALT2-AF5 | | | 4.99 | % (h) | | | 10/25/2036 | | | | 5,101,381 | |
12,500,000 | | New Century Home Equity Loan Trust, Series 2006-1-A2C (1 Month LIBOR USD + 0.28%, 0.28% Floor, 12.50% Cap) | | | 0.39 | % | | | 05/25/2036 | | | | 10,604,304 | |
48,366,631 | | New Residential Mortgage Loan Trust, Series 2018-FNT1-A | | | 3.61 | % (a) | | | 05/25/2023 | | | | 48,541,912 | |
16,324,487 | | New Residential Mortgage Loan Trust, Series 2018-FNT2-A | | | 3.79 | % (a) | | | 07/25/2054 | | | | 16,353,303 | |
62,504,400 | | New Residential Mortgage Loan Trust, Series 2020-RPL1-M1 | | | 3.25 | % (a)(b) | | | 11/25/2059 | | | | 63,359,410 | |
16,345,550 | | New Residential Mortgage Loan Trust, Series 2020-RPL1-M2 | | | 3.50 | % (a)(b) | | | 11/25/2059 | | | | 16,470,902 | |
372,934 | | New York Mortgage Trust, Series 2005-2-A (1 Month LIBOR USD + 0.66%, 0.66% Floor, 10.50% Cap) | | | 0.44 | % | | | 08/25/2035 | | | | 364,607 | |
96,261,740 | | New York Mortgage Trust, Series 2020-SP1-A1 | | | 3.96 | % (a) | | | 06/25/2025 | | | | 96,767,788 | |
94,610 | | Nomura Asset Acceptance Corporation, Series 2005-AP1-2A5 | | | 5.36 | % (h) | | | 02/25/2035 | | | | 96,632 | |
14,144,416 | | Nomura Asset Acceptance Corporation, Series 2006-AF1-1A2 | | | 6.16 | % (b) | | | 05/25/2036 | | | | 4,575,816 | |
2,874,398 | | Nomura Asset Acceptance Corporation, Series 2006-AF1-1A3 | | | 6.41 | % (b) | | | 05/25/2036 | | | | 930,806 | |
15,913,464 | | Nomura Asset Acceptance Corporation, Series 2006-AP1-A2 | | | 5.52 | % (b) | | | 01/25/2036 | | | | 6,842,911 | |
2,689,711 | | Nomura Asset Acceptance Corporation, Series 2006-AP1-A3 | | | 5.65 | % (b) | | | 01/25/2036 | | | | 1,156,283 | |
1,336,941 | | Nomura Asset Acceptance Corporation, Series 2006-WF1-A2 | | | 5.76 | % (b) | | | 06/25/2036 | | | | 540,091 | |
16,383,829 | | Nomura Home Equity Loan, Inc., Series 2006-AF1-A2 | | | 5.80 | % (h) | | | 10/25/2036 | | | | 6,344,644 | |
2,838,190 | | Nomura Home Equity Loan, Inc., Series 2007-1-1A1 | | | 6.06 | % (h) | | | 02/25/2037 | | | | 1,123,807 | |
14,146,193 | | Nomura Home Equity Loan, Inc., Series 2007-1-1A3 | | | 5.99 | % (h) | | | 02/25/2037 | | | | 5,602,096 | |
5,723,312 | | Nomura Resecuritization Trust, Series 2014-2R-4A9 | | | 4.38 | % (a)(h) | | | 07/26/2036 | | | | 5,507,702 | |
44,264,541 | | Nomura Resecuritization Trust, Series 2015-4R-1A14 (1 Month LIBOR USD + 0.19%, 0.19% Floor) | | | 0.30 | % (a) | | | 03/26/2047 | | | | 35,738,850 | |
8,893,910 | | NovaStar Mortgage Funding Trust Series, Series 2006-3-A2C (1 Month LIBOR USD + 0.32%, 0.32% Floor) | | | 0.43 | % | | | 10/25/2036 | | | | 7,002,360 | |
18,254,518 | | NRPL Trust, Series 2018-2A-A1 | | | 4.25 | % (a)(c) | | | 07/25/2067 | | | | 18,396,743 | |
100,037,660 | | NRZ Excess Spread-Collateralized Notes, Series 2020-PLS1-A | | | 3.84 | % (a) | | | 12/25/2025 | | | | 101,215,304 | |
730,676 | | Option One Mortgage Loan Trust, Series 2004-3-M3 (1 Month LIBOR USD + 0.98%, 0.98% Floor) | | | 1.08 | % | | | 11/25/2034 | | | | 728,282 | |
7,105,615 | | Option One Mortgage Loan Trust, Series 2007-1-2A3 (1 Month LIBOR USD + 0.14%, 0.14% Floor) | | | 0.25 | % | | | 01/25/2037 | | | | 5,016,635 | |
74,372,376 | | Option One Mortgage Loan Trust, Series 2007-6-1A1 (1 Month LIBOR USD + 0.19%, 0.19% Floor) | | | 0.30 | % | | | 07/25/2037 | | | | 69,069,373 | |
93,908,444 | | OSAT Trust, Series 2020-RPL1-A1 | | | 3.07 | % (a)(c) | | | 12/26/2059 | | | | 94,884,416 | |
4,440,921 | | PHH Alternative Mortgage Trust, Series 2007-1-1A1 (1 Month LIBOR USD + 0.16%, 0.16% Floor, 10.10% Cap) | | | 0.27 | % | | | 02/25/2037 | | | | 3,525,037 | |
11,747,053 | | PHH Alternative Mortgage Trust, Series 2007-2-2A1 | | | 6.00 | % | | | 05/25/2037 | | | | 11,474,183 | |
5,481,366 | | PHH Alternative Mortgage Trust, Series 2007-2-2A2 | | | 6.00 | % | | | 05/25/2037 | | | | 5,353,307 | |
401,177 | | PHH Alternative Mortgage Trust, Series 2007-2-3A1 | | | 6.00 | % | | | 05/25/2037 | | | | 400,405 | |
85,309,063 | | PMT Credit Risk Transfer Trust 2019-2R, Series 2019-2R-A (1 Month LIBOR USD + 2.75%, 2.75% Floor) | | | 2.86 | % (a) | | | 05/27/2023 | | | | 84,495,368 | |
7,501,974 | | PMT Credit Risk Transfer Trust, Series 2019-1R-A (1 Month LIBOR USD + 2.00%, 2.00% Floor) | | | 2.12 | % (a) | | | 03/27/2024 | | | | 7,131,182 | |
26,991,342 | | PMT Credit Risk Transfer Trust, Series 2019-3R-A (1 Month LIBOR USD + 2.70%, 2.70% Floor) | | | 2.81 | % (a) | | | 10/27/2022 | | | | 27,058,450 | |
71,990,193 | | PMT Credit Risk Transfer Trust, Series 2020-1R-A (1 Month LIBOR USD + 2.35%, 2.35% Floor) | | | 2.46 | % (a) | | | 02/27/2023 | | | | 71,598,501 | |
159,700,000 | | PMT Credit Risk Transfer Trust, Series 2021-1R-A (1 Month LIBOR USD + 2.90%, 2.90% Floor) | | | 3.02 | % (a) | | | 02/27/2024 | | | | 160,848,083 | |
67,663,000 | | PMT Credit Risk Transfer Trust, Series 2021-FT1-A (1 Month LIBOR USD + 3.00%, 3.00% Floor) | | | 0.01 | % (a) | | | 03/25/2026 | | | | 67,812,468 | |
167,964,314 | | PR Mortgage Loan Trust, Series 2014-1-APT | | | 5.91 | % (a)(b) | | | 10/25/2049 | | | | 166,713,350 | |
81,506,395 | | Pretium Mortgage Credit Partners LLC, Series 2020-NPL3-A1 | | | 3.10 | % (a)(c) | | | 06/27/2060 | | | | 82,383,355 | |
5,624,887 | | Pretium Mortgage Credit Partners LLC, Series 2020-RPL1-A1 | | | 3.82 | % (a)(c) | | | 05/27/2060 | | | | 5,667,707 | |
96,042,000 | | Pretium Mortgage Credit Partners LLC, Series 2021-NPL1-A1 | | | 2.24 | % (a)(c) | | | 09/27/2060 | | | | 96,812,929 | |
7,586,058 | | Prime Mortgage Trust, Series 2006-DR1-2A1 | | | 5.50 | % (a) | | | 05/25/2035 | | | | 6,940,952 | |
3,821,773 | | Prime Mortgage Trust, Series 2006-DR1-2A2 | | | 6.00 | % (a) | | | 05/25/2035 | | | | 3,439,684 | |
29,000,000 | | Progress Residential Trust, Series 2021-SFR2-E1 | | | 2.55 | % (a) | | | 04/19/2038 | | | | 29,220,864 | |
20,000,000 | | Progress Residential Trust, Series 2021-SFR2-E2 | | | 2.65 | % (a) | | | 04/19/2038 | | | | 20,152,500 | |
62,271,000 | | Progress Residential Trust, Series 2021-SFR2-F | | | 3.40 | % (a) | | | 04/19/2038 | | | | 62,774,897 | |
95,390,337 | | PRPM LLC, Series 2019-GS1-A1 | | | 3.50 | % (a)(b) | | | 10/25/2024 | | | | 96,275,874 | |
97,393,149 | | PRPM LLC, Series 2020-1A-A1 | | | 2.98 | % (a)(c) | | | 02/25/2025 | | | | 97,710,387 | |
24,690,111 | | PRPM LLC, Series 2020-2-A1 | | | 3.67 | % (a)(c) | | | 08/25/2025 | | | | 24,990,521 | |
142,342,496 | | PRPM LLC, Series 2020-3-A1 | | | 2.86 | % (a)(c) | | | 09/25/2025 | | | | 143,501,391 | |
85,310,014 | | PRPM LLC, Series 2020-5-A1 | | | 3.10 | % (a)(c) | | | 11/25/2025 | | | | 85,980,977 | |
137,789,000 | | PRPM LLC, Series 2021-2-A1 | | | 2.12 | % (a)(b) | | | 03/25/2024 | | | | 138,888,694 | |
7,100,000 | | PRPM LLC, Series 2021-2-A2 | | | 3.77 | % (a)(b) | | | 03/25/2024 | | | | 7,156,828 | |
29,040,789 | | RALI Trust, Series 2007-QA5-1A1 | | | 5.26 | % (b) | | | 09/25/2037 | | | | 25,386,706 | |
14,262,835 | | RALI Trust, Series 2007-QH7-2A1 (1 Month LIBOR USD + 0.30%, 0.30% Floor) | | | 0.41 | % | | | 08/25/2037 | | | | 13,389,591 | |
35,069,886 | | RALI Trust, Series 2007-QS10-A1 | | | 6.50 | % | | | 09/25/2037 | | | | 33,925,815 | |
17,804,839 | | RAMP Series Trust, Series 2006-RS3-A4 (1 Month LIBOR USD + 0.30%, 0.30% Floor, 14.00% Cap) | | | 0.71 | % | | | 05/25/2036 | | | | 17,098,867 | |
18,208,308 | | RBSGC Structured Trust, Series 2008-B-A1 | | | 6.00 | % (a) | | | 06/25/2037 | | | | 18,107,600 | |
23,005,880 | | RBSSP Resecuritization Trust , Series 2009-12-20A2 | | | 2.93 | % (a)(b) | | | 12/25/2035 | | | | 21,205,877 | |
4,391,551 | | RBSSP Resecuritization Trust, Series 2009-12-17A2 | | | 2.78 | % (a)(b) | | | 10/25/2035 | | | | 3,822,954 | |
3,743,056 | | RBSSP Resecuritization Trust, Series 2010-4-7A2 | | | 6.00 | % (a) | | | 07/26/2037 | | | | 2,718,023 | |
75,782,048 | | Redwood Funding Trust, Series 2019-1-PT | | | 4.21 | % (a)(c) | | | 09/27/2024 | | | | 76,584,504 | |
3,305,172 | | Renaissance Home Equity Loan Trust, Series 2006-1-AF6 | | | 5.75 | % (h) | | | 05/25/2036 | | | | 2,298,018 | |
2,122,074 | | Renaissance Home Equity Loan Trust, Series 2006-2-AF5 | | | 6.25 | % (h) | | | 08/25/2036 | | | | 1,298,910 | |
6,946,779 | | Renaissance Home Equity Loan Trust, Series 2006-3-AF3 | | | 5.59 | % (h) | | | 11/25/2036 | | | | 3,746,146 | |
18,464,590 | | Renaissance Home Equity Loan Trust, Series 2006-3-AF4 | | | 5.81 | % (h) | | | 11/25/2036 | | | | 10,344,582 | |
10,340,045 | | Renaissance Home Equity Loan Trust, Series 2006-4-AF4 | | | 5.47 | % (h) | | | 01/25/2037 | | | | 5,315,821 | |
20,361,654 | | Renaissance Home Equity Loan Trust, Series 2006-4-AF5 | | | 5.69 | % (h) | | | 01/25/2037 | | | | 10,871,144 | |
8,192,822 | | Renaissance Home Equity Loan Trust, Series 2007-1-AF1 | | | 5.74 | % (h) | | | 04/25/2037 | | | | 3,615,376 | |
5,779,950 | | Renaissance Home Equity Loan Trust, Series 2007-1-AF1Z | | | 5.35 | % (h) | | | 04/25/2037 | | | | 2,391,534 | |
3,486,895 | | Renaissance Home Equity Loan Trust, Series 2007-1-AF2 | | | 5.51 | % (h) | | | 04/25/2037 | | | | 1,475,747 | |
5,072,268 | | Renaissance Home Equity Loan Trust, Series 2007-1-AF3 | | | 5.61 | % (h) | | | 04/25/2037 | | | | 2,186,484 | |
8,232,817 | | Renaissance Home Equity Loan Trust, Series 2007-1-AF5 | | | 5.91 | % (h) | | | 04/25/2037 | | | | 3,741,493 | |
17,696,892 | | Renaissance Home Equity Loan Trust, Series 2007-2-AF2 | | | 5.68 | % (h) | | | 06/25/2037 | | | | 6,976,897 | |
9,571,061 | | Renaissance Home Equity Loan Trust, Series 2007-2-AF5 | | | 6.20 | % (h) | | | 06/25/2037 | | | | 4,171,327 | |
19,983,674 | | Residential Accredit Loans, Inc., Series 2005-QA11-4A1 | | | 3.77 | % (b) | | | 10/25/2035 | | | | 16,616,580 | |
10,578,254 | | Residential Accredit Loans, Inc., Series 2005-QA13-2A1 | | | 3.99 | % (b) | | | 12/25/2035 | | | | 9,781,203 | |
8,791,226 | | Residential Accredit Loans, Inc., Series 2005-QA3-CB1 | | | 3.32 | % (b) | | | 03/25/2035 | | | | 4,573,183 | |
315,766 | | Residential Accredit Loans, Inc., Series 2005-QS12-A11 (-11 x 1 Month LIBOR USD + 51.15%, 51.15% Cap) | | | 49.96 | % (i) | | | 08/25/2035 | | | | 653,045 | |
1,140,204 | | Residential Accredit Loans, Inc., Series 2005-QS13-1A6 | | | 5.50 | % | | | 09/25/2035 | | | | 1,099,947 | |
2,357,027 | | Residential Accredit Loans, Inc., Series 2005-QS13-2A1 (1 Month LIBOR USD + 0.70%, 0.70% Floor, 5.75% Cap) | | | 0.81 | % | | | 09/25/2035 | | | | 1,999,733 | |
9,663,812 | | Residential Accredit Loans, Inc., Series 2005-QS13-2A2 (-1 x 1 Month LIBOR USD + 5.05%, 5.05% Cap) | | | 4.94 | % (f)(i) | | | 09/25/2035 | | | | 1,198,505 | |
5,784,759 | | Residential Accredit Loans, Inc., Series 2005-QS14-2A1 | | | 6.00 | % | | | 09/25/2035 | | | | 3,057,658 | |
1,694,427 | | Residential Accredit Loans, Inc., Series 2005-QS15-2A | | | 6.00 | % | | | 10/25/2035 | | | | 1,683,274 | |
2,234,558 | | Residential Accredit Loans, Inc., Series 2005-QS15-3A | | | 6.00 | % | | | 10/25/2035 | | | | 2,198,432 | |
2,319,185 | | Residential Accredit Loans, Inc., Series 2005-QS16-A1 (1 Month LIBOR USD + 0.70%, 0.70% Floor, 5.50% Cap) | | | 0.81 | % | | | 11/25/2035 | | | | 1,912,146 | |
2,318,784 | | Residential Accredit Loans, Inc., Series 2005-QS16-A2 (-1 x 1 Month LIBOR USD + 4.80%, 4.80% Cap) | | | 4.69 | % (f)(i) | | | 11/25/2035 | | | | 276,052 | |
1,231,018 | | Residential Accredit Loans, Inc., Series 2005-QS17-A1 | | | 6.00 | % | | | 12/25/2035 | | | | 1,230,421 | |
853,032 | | Residential Accredit Loans, Inc., Series 2005-QS17-A10 | | | 6.00 | % | | | 12/25/2035 | | | | 852,618 | |
3,567,752 | | Residential Accredit Loans, Inc., Series 2005-QS17-A11 | | | 6.00 | % | | | 12/25/2035 | | | | 3,566,020 | |
2,535,845 | | Residential Accredit Loans, Inc., Series 2005-QS17-A2 (1 Month LIBOR USD + 0.85%, 0.85% Floor, 6.00% Cap) | | | 0.96 | % | | | 12/25/2035 | | | | 2,072,928 | |
2,535,845 | | Residential Accredit Loans, Inc., Series 2005-QS17-A4 (-1 x 1 Month LIBOR USD + 5.15%, 5.15% Cap) | | | 5.04 | % (f)(i) | | | 12/25/2035 | | | | 329,689 | |
2,040,420 | | Residential Accredit Loans, Inc., Series 2005-QS17-A6 | | | 6.00 | % | | | 12/25/2035 | | | | 2,039,430 | |
950,287 | | Residential Accredit Loans, Inc., Series 2005-QS5-A3 | | | 5.70 | % | | | 04/25/2035 | | | | 952,160 | |
969,524 | | Residential Accredit Loans, Inc., Series 2006-QS10-A4 | | | 5.75 | % | | | 08/25/2036 | | | | 950,484 | |
6,351,539 | | Residential Accredit Loans, Inc., Series 2006-QS11-1A1 | | | 6.50 | % | | | 08/25/2036 | | | | 6,185,354 | |
1,493,141 | | Residential Accredit Loans, Inc., Series 2006-QS12-1A1 | | | 6.50 | % | | | 09/25/2036 | | | | 1,036,927 | |
2,714,366 | | Residential Accredit Loans, Inc., Series 2006-QS12-2A18 | | | 5.75 | % | | | 09/25/2036 | | | | 2,633,432 | |
3,946,173 | | Residential Accredit Loans, Inc., Series 2006-QS14-A18 | | | 6.25 | % | | | 11/25/2036 | | | | 3,810,294 | |
1,816,596 | | Residential Accredit Loans, Inc., Series 2006-QS15-A1 | | | 6.50 | % | | | 10/25/2036 | | | | 1,802,050 | |
791,790 | | Residential Accredit Loans, Inc., Series 2006-QS16-A10 | | | 6.00 | % | | | 11/25/2036 | | | | 756,832 | |
2,815,479 | | Residential Accredit Loans, Inc., Series 2006-QS16-A11 | | | 6.00 | % | | | 11/25/2036 | | | | 2,691,743 | |
821,870 | | Residential Accredit Loans, Inc., Series 2006-QS16-A7 | | | 6.00 | % | | | 11/25/2036 | | | | 785,584 | |
888,127 | | Residential Accredit Loans, Inc., Series 2006-QS16-A8 | | | 6.00 | % | | | 11/25/2036 | | | | 848,916 | |
351,449 | | Residential Accredit Loans, Inc., Series 2006-QS16-A9 | | | 6.00 | % | | | 11/25/2036 | | | | 335,932 | |
1,635,765 | | Residential Accredit Loans, Inc., Series 2006-QS17-A4 | | | 6.00 | % | | | 12/25/2036 | | | | 1,586,370 | |
9,087,602 | | Residential Accredit Loans, Inc., Series 2006-QS17-A5 | | | 6.00 | % | | | 12/25/2036 | | | | 8,813,186 | |
986,826 | | Residential Accredit Loans, Inc., Series 2006-QS1-A6 (-8 x 1 Month LIBOR USD + 42.86%, 42.86% Cap) | | | 42.02 | % (i) | | | 01/25/2036 | | | | 1,863,645 | |
6,720,045 | | Residential Accredit Loans, Inc., Series 2006-QS3-1A11 | | | 6.00 | % | | | 03/25/2036 | | | | 6,684,645 | |
1,491,826 | | Residential Accredit Loans, Inc., Series 2006-QS4-A8 (-8 x 1 Month LIBOR USD + 5143.00%, 1.10% Floor, 8.00% Cap) | | | 8.00 | % | | | 04/25/2036 | | | | 1,417,354 | |
4,041,007 | | Residential Accredit Loans, Inc., Series 2006-QS5-A3 | | | 6.00 | % | | | 05/25/2036 | | | | 3,843,900 | |
12,043,720 | | Residential Accredit Loans, Inc., Series 2006-QS5-A4 | | | 6.00 | % | | | 05/25/2036 | | | | 11,456,269 | |
1,916,592 | | Residential Accredit Loans, Inc., Series 2006-QS6-1A16 | | | 6.00 | % | | | 06/25/2036 | | | | 1,833,128 | |
2,780,558 | | Residential Accredit Loans, Inc., Series 2006-QS6-1A2 | | | 6.00 | % | | | 06/25/2036 | | | | 2,663,096 | |
5,483,018 | | Residential Accredit Loans, Inc., Series 2006-QS8-A1 | | | 6.00 | % | | | 08/25/2036 | | | | 5,355,147 | |
9,508,353 | | Residential Accredit Loans, Inc., Series 2006-QS8-A5 (-1 x 1 Month LIBOR USD + 5.55%, 5.55% Cap) | | | 5.44 | % (f)(i) | | | 08/25/2036 | | | | 1,339,851 | |
3,430,334 | | Residential Accredit Loans, Inc., Series 2006-QS9-1A6 (-1 x 1 Month LIBOR USD + 5.30%, 5.30% Cap) | | | 5.19 | % (f)(i) | | | 07/25/2036 | | | | 524,719 | |
27,335,247 | | Residential Accredit Loans, Inc., Series 2007-QH5-AII (1 Month LIBOR USD + 0.23%, 0.23% Floor) | | | 0.34 | % | | | 06/25/2037 | | | | 13,214,924 | |
3,276,981 | | Residential Accredit Loans, Inc., Series 2007-QS11-A1 | | | 7.00 | % | | | 10/25/2037 | | | | 3,147,505 | |
11,265,164 | | Residential Accredit Loans, Inc., Series 2007-QS1-1A2 (-1 x 1 Month LIBOR USD + 5.45%, 5.45% Cap) | | | 5.34 | % (f)(i) | | | 01/25/2037 | | | | 1,838,391 | |
1,133,958 | | Residential Accredit Loans, Inc., Series 2007-QS1-1A4 | | | 6.00 | % | | | 01/25/2037 | | | | 1,102,060 | |
2,811,928 | | Residential Accredit Loans, Inc., Series 2007-QS1-2A10 | | | 6.00 | % | | | 01/25/2037 | | | | 2,681,265 | |
4,208,598 | | Residential Accredit Loans, Inc., Series 2007-QS2-A6 | | | 6.25 | % | | | 01/25/2037 | | | | 4,007,732 | |
19,175,712 | | Residential Accredit Loans, Inc., Series 2007-QS3-A1 | | | 6.50 | % | | | 02/25/2037 | | | | 18,977,710 | |
3,057,687 | | Residential Accredit Loans, Inc., Series 2007-QS3-A4 | | | 6.25 | % | | | 02/25/2037 | | | | 2,971,908 | |
5,326,955 | | Residential Accredit Loans, Inc., Series 2007-QS4-3A3 | | | 6.00 | % | | | 03/25/2037 | | | | 5,112,091 | |
2,104,083 | | Residential Accredit Loans, Inc., Series 2007-QS5-A1 | | | 5.50 | % | | | 03/25/2037 | | | | 2,022,926 | |
868,020 | | Residential Accredit Loans, Inc., Series 2007-QS5-A5 (1 Month LIBOR USD + 0.30%, 0.30% Floor, 7.00% Cap) | | | 0.41 | % | | | 03/25/2037 | | | | 660,984 | |
2,882,893 | | Residential Accredit Loans, Inc., Series 2007-QS5-A8 (-1 x 1 Month LIBOR USD + 6.70%, 6.70% Cap) | | | 6.59 | % (f)(i) | | | 03/25/2037 | | | | 528,019 | |
2,232,011 | | Residential Accredit Loans, Inc., Series 2007-QS6-A102 | | | 5.75 | % | | | 04/25/2037 | | | | 2,135,863 | |
717,656 | | Residential Accredit Loans, Inc., Series 2007-QS6-A13 (-8 x 1 Month LIBOR USD + 55.00%, 55.00% Cap) | | | 54.09 | % (i) | | | 04/25/2037 | | | | 1,251,042 | |
3,196,065 | | Residential Accredit Loans, Inc., Series 2007-QS6-A45 | | | 5.75 | % | | | 04/25/2037 | | | | 3,058,387 | |
5,093,540 | | Residential Accredit Loans, Inc., Series 2007-QS6-A6 | | | 6.25 | % | | | 04/25/2037 | | | | 4,978,775 | |
351,795 | | Residential Accredit Loans, Inc., Series 2007-QS6-A77 (-8 x 1 Month LIBOR USD + 55.83%, 55.83% Cap) | | | 54.93 | % (i) | | | 04/25/2037 | | | | 622,082 | |
6,347,673 | | Residential Accredit Loans, Inc., Series 2007-QS7-2A1 | | | 6.75 | % | | | 06/25/2037 | | | | 3,857,109 | |
19,180,303 | | Residential Accredit Loans, Inc., Series 2007-QS9-A33 | | | 6.50 | % | | | 07/25/2037 | | | | 18,710,288 | |
2,199,529 | | Residential Asset Mortgage Products, Inc., Series 2004-RS7-A3 | | | 3.12 | % (b) | | | 07/25/2034 | | | | 2,162,198 | |
1,321,869 | | Residential Asset Mortgage Products, Inc., Series 2005-RS1-AI5 | | | 5.41 | % (h) | | | 01/25/2035 | | | | 1,349,156 | |
16,487,564 | | Residential Asset Mortgage Products, Inc., Series 2006-RS2-A3A (1 Month LIBOR USD + 0.30%, 0.60% Floor, 14.00% Cap) | | | 0.71 | % | | | 03/25/2036 | | | | 16,272,852 | |
21,156,792 | | Residential Asset Securities Corporation, Series 2007-EMX1-A13 (1 Month LIBOR USD + 0.20%, 0.20% Floor, 14.00% Cap) | | | 0.31 | % | | | 01/25/2037 | | | | 19,783,414 | |
5,229,040 | | Residential Asset Securitization Trust, Series 2005-A11-2A4 | | | 6.00 | % | | | 10/25/2035 | | | | 3,836,615 | |
1,925,262 | | Residential Asset Securitization Trust, Series 2005-A12-A7 (-1 x 1 Month LIBOR USD + 5.00%, 5.00% Cap) | | | 4.89 | % (f)(i) | | | 11/25/2035 | | | | 365,089 | |
1,921,684 | | Residential Asset Securitization Trust, Series 2005-A12-A8 (1 Month LIBOR USD + 0.55%, 0.55% Floor, 5.50% Cap) | | | 0.66 | % | | | 11/25/2035 | | | | 1,064,106 | |
16,698,859 | | Residential Asset Securitization Trust, Series 2005-A13-2A1 | | | 5.50 | % | | | 10/25/2035 | | | | 9,857,214 | |
2,620,674 | | Residential Asset Securitization Trust, Series 2005-A15-1A7 | | | 6.00 | % | | | 02/25/2036 | | | | 2,689,927 | |
8,091,007 | | Residential Asset Securitization Trust, Series 2005-A15-5A3 | | | 5.75 | % | | | 02/25/2036 | | | | 5,263,492 | |
8,604,102 | | Residential Asset Securitization Trust, Series 2005-A16-A1 | | | 5.00 | % | | | 02/25/2036 | | | | 4,966,242 | |
1,494,634 | | Residential Asset Securitization Trust, Series 2005-A7-A3 | | | 5.50 | % | | | 06/25/2035 | | | | 1,171,551 | |
3,708,203 | | Residential Asset Securitization Trust, Series 2005-A8CB-A11 | | | 6.00 | % | | | 07/25/2035 | | | | 3,339,450 | |
3,733,883 | | Residential Asset Securitization Trust, Series 2005-A8CB-A2 (-1 x 1 Month LIBOR USD + 5.00%, 5.00% Cap) | | | 4.89 | % (f)(i) | | | 07/25/2035 | | | | 524,990 | |
4,907,281 | | Residential Asset Securitization Trust, Series 2006-A10-A5 | | | 6.50 | % | | | 09/25/2036 | | | | 2,801,361 | |
727,885 | | Residential Asset Securitization Trust, Series 2006-A1-1A3 | | | 6.00 | % | | | 04/25/2036 | | | | 507,569 | |
7,440,776 | | Residential Asset Securitization Trust, Series 2006-A12-A1 | | | 6.25 | % | | | 11/25/2036 | | | | 4,269,308 | |
7,482,243 | | Residential Asset Securitization Trust, Series 2006-A13-A1 | | | 6.25 | % | | | 12/25/2036 | | | | 4,153,070 | |
11,997,005 | | Residential Asset Securitization Trust, Series 2006-A1-3A2 | | | 6.00 | % | | | 04/25/2036 | | | | 8,414,320 | |
14,305,867 | | Residential Asset Securitization Trust, Series 2006-A14C-2A6 (1 Month LIBOR USD + 0.45%, 0.45% Floor, 7.00% Cap) | | | 0.56 | % | | | 12/25/2036 | | | | 1,419,388 | |
31,570,902 | | Residential Asset Securitization Trust, Series 2006-A14C-2A7 (-1 x 1 Month LIBOR USD + 6.55%, 6.55% Cap) | | | 6.44 | % (f)(i) | | | 12/25/2036 | | | | 10,297,080 | |
6,043,954 | | Residential Asset Securitization Trust, Series 2006-A2-A11 | | | 6.00 | % | | | 01/25/2046 | | | | 3,764,459 | |
4,184,768 | | Residential Asset Securitization Trust, Series 2006-A2-A4 | | | 6.00 | % | | | 01/25/2046 | | | | 2,569,915 | |
396,575 | | Residential Asset Securitization Trust, Series 2006-A4-2A5 | | | 6.00 | % | | | 05/25/2036 | | | | 398,024 | |
3,020,059 | | Residential Asset Securitization Trust, Series 2006-A4-2A9 | | | 6.00 | % | | | 05/25/2036 | | | | 3,031,090 | |
2,691,336 | | Residential Asset Securitization Trust, Series 2006-A8-1A1 | | | 6.00 | % | | | 08/25/2036 | | | | 2,208,507 | |
5,065,518 | | Residential Asset Securitization Trust, Series 2006-R1-A1 (-4 x 1 Month LIBOR USD + 28.40%, 28.40% Cap) | | | 27.97 | % (e)(i) | | | 01/25/2046 | | | | 6,408,463 | |
23,899,007 | | Residential Asset Securitization Trust, Series 2007-A2-1A2 | | | 6.00 | % | | | 04/25/2037 | | | | 19,506,955 | |
838,120 | | Residential Asset Securitization Trust, Series 2007-A3-1A2 (-8 x 1 Month LIBOR USD + 46.38%, 46.38% Cap) | | | 45.55 | % (i) | | | 04/25/2037 | | | | 1,830,841 | |
22,841,988 | | Residential Asset Securitization Trust, Series 2007-A5-1A4 (-1 x 1 Month LIBOR USD + 6.10%, 6.10% Cap) | | | 5.99 | % (f)(i) | | | 05/25/2037 | | | | 4,115,235 | |
5,879,327 | | Residential Asset Securitization Trust, Series 2007-A5-1A6 (1 Month LIBOR USD + 0.40%, 0.40% Floor, 6.50% Cap) | | | 0.51 | % | | | 05/25/2037 | | | | 458,125 | |
4,960,028 | | Residential Asset Securitization Trust, Series 2007-A5-2A3 | | | 6.00 | % | | | 05/25/2037 | | | | 4,084,514 | |
2,173,727 | | Residential Asset Securitization Trust, Series 2007-A5-2A5 | | | 6.00 | % | | | 05/25/2037 | | | | 1,789,463 | |
9,287,707 | | Residential Asset Securitization Trust, Series 2007-A6-1A2 | | | 6.00 | % | | | 06/25/2037 | | | | 7,666,009 | |
8,100,002 | | Residential Asset Securitization Trust, Series 2007-A7-A1 | | | 6.00 | % | | | 07/25/2037 | | | | 4,492,412 | |
35,629,011 | | Residential Asset Securitization Trust, Series 2007-A7-A2 | | | 6.00 | % | | | 07/25/2037 | | | | 19,818,684 | |
15,786,463 | | Residential Asset Securitization Trust, Series 2007-A7-A6 | | | 6.00 | % | | | 07/25/2037 | | | | 8,781,240 | |
5,943,336 | | Residential Funding Mortgage Securities Trust, Series 2006-S10-1A1 | | | 6.00 | % | | | 10/25/2036 | | | | 5,698,945 | |
2,012,974 | | Residential Funding Mortgage Securities Trust, Series 2006-S5-A12 | | | 6.00 | % | | | 06/25/2036 | | | | 1,993,261 | |
137,817 | | Residential Funding Mortgage Securities Trust, Series 2006-S5-A15 | | | 6.00 | % | | | 06/25/2036 | | | | 136,467 | |
3,403,416 | | Residential Funding Mortgage Securities Trust, Series 2006-S9-A1 | | | 6.25 | % | | | 09/25/2036 | | | | 3,326,273 | |
3,997,317 | | Residential Funding Mortgage Securities Trust, Series 2007-S1-A7 | | | 6.00 | % | | | 01/25/2037 | | | | 3,965,032 | |
2,141,491 | | Residential Funding Mortgage Securities Trust, Series 2007-S2-A1 | | | 6.00 | % | | | 02/25/2037 | | | | 2,027,037 | |
2,412,625 | | Residential Funding Mortgage Securities Trust, Series 2007-S2-A4 | | | 6.00 | % | | | 02/25/2037 | | | | 2,283,680 | |
4,504,095 | | Residential Funding Mortgage Securities Trust, Series 2007-S2-A5 | | | 6.00 | % | | | 02/25/2037 | | | | 4,263,370 | |
703,840 | | Residential Funding Mortgage Securities Trust, Series 2007-S2-A9 | | | 6.00 | % | | | 02/25/2037 | | | | 666,223 | |
2,111,537 | | Residential Funding Mortgage Securities Trust, Series 2007-S3-1A4 | | | 6.00 | % | | | 03/25/2037 | | | | 1,891,991 | |
2,205,417 | | Residential Funding Mortgage Securities Trust, Series 2007-S4-A1 | | | 6.00 | % | | | 04/25/2037 | | | | 2,119,431 | |
1,235,099 | | Residential Funding Mortgage Securities Trust, Series 2007-S4-A2 | | | 6.00 | % | | | 04/25/2037 | | | | 1,191,231 | |
14,723,093 | | Residential Funding Mortgage Securities Trust, Series 2007-S5-A1 | | | 6.00 | % | | | 05/25/2037 | | | | 14,739,468 | |
4,266,810 | | Residential Funding Mortgage Securities Trust, Series 2007-S5-A8 | | | 6.00 | % | | | 05/25/2037 | | | | 4,285,614 | |
2,188,724 | | Residential Funding Mortgage Securities Trust, Series 2007-S6-2A4 | | | 6.00 | % | | | 06/25/2037 | | | | 2,201,613 | |
11,960,485 | | Residential Funding Mortgage Securities Trust, Series 2007-S7-A20 | | | 6.00 | % | | | 07/25/2037 | | | | 11,517,961 | |
6,086,309 | | Residential Funding Mortgage Securities Trust, Series 2007-S8-1A1 | | | 6.00 | % | | | 09/25/2037 | | | | 5,448,117 | |
365,856 | | Residential Funding Mortgage Securities Trust, Series 2007-SA1-4A | | | 5.31 | % (b) | | | 02/25/2037 | | | | 289,553 | |
4,570,570 | | Residential Funding Mortgage Securities Trust, Series 2007-SA2-2A1 | | | 3.47 | % (b) | | | 04/25/2037 | | | | 4,204,778 | |
7,710,908 | | RMAT LLC, Series 2015-PR2-A1 | | | 9.85 | % (a)(c) | | | 11/25/2035 | | | | 7,714,349 | |
38,385,656 | | RSFR, Series 2020-1-PT | | | 4.21 | % (a)(c) | | | 02/17/2025 | | | | 37,672,681 | |
250,949,286 | | Securitized Mortgage Asset Loan Trust, Series 2015-1-PC | | | 2.26 | % (a)(b) | | | 02/25/2054 | | | | 213,269,752 | |
44,548,296 | | Securitized Mortgage Asset Loan Trust, Series 2015-2-PC | | | 2.55 | % (a)(b) | | | 12/26/2059 | | | | 40,724,587 | |
49,733,372 | | Securitized Mortgage Asset Loan Trust, Series 2015-3-PC | | | 3.38 | % (a)(b) | | | 10/25/2044 | | | | 47,010,002 | |
117,019 | | Sequoia Mortgage Trust, Series 2003-4-2A1 (1 Month LIBOR USD + 0.70%, 0.70% Floor, 11.50% Cap) | | | 0.81 | % | | | 07/20/2033 | | | | 116,901 | |
9,505,173 | | SG Mortgage Securities Trust, Series 2006-FRE1-A1A (1 Month LIBOR USD + 0.34%, 0.34% Floor) | | | 0.45 | % | | | 02/25/2036 | | | | 9,277,593 | |
2,821,735 | | SG Mortgage Securities Trust, Series 2006-FRE1-A2C (1 Month LIBOR USD + 0.54%, 0.54% Floor) | | | 0.65 | % | | | 02/25/2036 | | | | 1,991,594 | |
4,302,487 | | Soundview Home Loan Trust, Series 2007-OPT1-2A2 (1 Month LIBOR USD + 0.15%, 0.15% Floor) | | | 0.26 | % | | | 06/25/2037 | | | | 3,493,761 | |
7,844,022 | | Soundview Home Loan Trust, Series 2007-OPT3-1A1 (1 Month LIBOR USD + 0.17%, 0.17% Floor) | | | 0.28 | % | | | 08/25/2037 | | | | 7,284,339 | |
24,047,880 | | Soundview Home Loan Trust, Series 2007-OPT4-1A1 (1 Month LIBOR USD + 1.00%, 1.00% Floor) | | | 1.11 | % | | | 09/25/2037 | | | | 19,373,343 | |
45,607,566 | | Soundview Home Loan Trust, Series 2007-WM1W-2A1 (1 Month LIBOR USD + 0.18%, 0.18% Floor) | | | 0.33 | % | | | 02/25/2037 | | | | 40,659,264 | |
4,553,429 | | Specialty Underwriting & Residential Finance Trust, Series 2006-BC2-A2B | | | 4.06 | % (h) | | | 02/25/2037 | | | | 2,462,033 | |
9,826,000 | | Spruce Hill Mortgage Loan Trust, Series 2020-SH1-M1 | | | 3.22 | % (a)(b) | | | 01/28/2050 | | | | 9,851,461 | |
89,619,643 | | Stanwich Mortgage Loan Company, Series 2019-NPB1-A1 | | | 3.38 | % (a)(c) | | | 08/15/2024 | | | | 90,149,295 | |
55,560,747 | | Stanwich Mortgage Loan Company, Series 2019-RPL1-A | | | 3.72 | % (a)(c) | | | 02/15/2049 | | | | 56,818,742 | |
4,755,795 | | STARM Mortgage Loan Trust, Series 2007-2-1A1 | | | 2.55 | % (b) | | | 04/25/2037 | | | | 2,832,564 | |
1,943,689 | | STARM Mortgage Loan Trust, Series 2007-3-1A1 | | | 3.79 | % (b) | | | 06/25/2037 | | | | 1,618,807 | |
164,750,000 | | Structured Adjustable Rate Mortgage Loan Trust | | | 2.50 | % | | | 03/30/2051 | | | | 170,799,414 | |
967,889 | | Structured Adjustable Rate Mortgage Loan Trust, Series 2004-12-8A | | | 2.89 | % (b) | | | 09/25/2034 | | | | 982,835 | |
2,440,799 | | Structured Adjustable Rate Mortgage Loan Trust, Series 2005-22-4A1 | | | 3.14 | % (b) | | | 12/25/2035 | | | | 2,367,074 | |
3,155,522 | | Structured Adjustable Rate Mortgage Loan Trust, Series 2006-12-2A1 | | | 3.57 | % (b) | | | 01/25/2037 | | | | 2,908,263 | |
1,733,439 | | Structured Adjustable Rate Mortgage Loan Trust, Series 2006-1-8A1 | | | 2.86 | % (b) | | | 02/25/2036 | | | | 1,285,833 | |
5,231,407 | | Structured Adjustable Rate Mortgage Loan Trust, Series 2006-8-4A4 | | | 3.57 | % (b) | | | 09/25/2036 | | | | 4,963,879 | |
10,399,277 | | Structured Adjustable Rate Mortgage Loan Trust, Series 2007-7-1A1 (1 Month LIBOR USD + 0.30%, 0.30% Floor) | | | 0.41 | % | | | 08/25/2037 | | | | 10,394,539 | |
91,968,396 | | Structured Asset Investment Loan Trust, Series 2006-3-A1 (1 Month LIBOR USD + 0.16%, 0.16% Floor) | | | 0.27 | % | | | 06/25/2036 | | | | 71,165,587 | |
10,591,799 | | Structured Asset Investment Loan Trust, Series 2006-4-A1 (1 Month LIBOR USD + 0.17%, 0.17% Floor) | | | 0.28 | % | | | 07/25/2036 | | | | 7,810,860 | |
11,529,253 | | Structured Asset Mortgage Investments Trust, Series 2006-AR3-12A2 (1 Month LIBOR USD + 0.40%, 0.40% Floor, 10.50% Cap) | | | 0.51 | % | | | 05/25/2036 | | | | 11,164,170 | |
88,115,896 | | Structured Asset Securities Corporation Mortgage Loan Trust, Series 2006-BC4-A1 (1 Month LIBOR USD + 0.16%, 0.16% Floor) | | | 0.27 | % | | | 12/25/2036 | | | | 65,366,301 | |
1,551,761 | | Structured Asset Securities Corporation, Series 2003-24A-1A3 | | | 2.34 | % (b) | | | 07/25/2033 | | | | 1,577,852 | |
10,400,391 | | Structured Asset Securities Corporation, Series 2005-5-3A1 | | | 6.00 | % | | | 04/25/2035 | | | | 8,134,288 | |
26,218,577 | | Structured Asset Securities Corporation, Series 2006-BC4-A4 (1 Month LIBOR USD + 0.17%, 0.17% Floor) | | | 0.28 | % | | | 12/25/2036 | | | | 25,787,761 | |
70,119,207 | | Structured Asset Securities Corporation, Series 2007-4-1A3 (-1 x 1 Month LIBOR USD + 6.25%, 6.25% Cap) | | | 6.14 | % (a)(e)(f)(i) | | | 03/28/2045 | | | | 7,008,804 | |
19,500,669 | | Structured Asset Securities Corporation, Series 2007-RF1-1A (1 Month LIBOR USD + 0.19%, 0.19% Floor) | | | 0.31 | % (a) | | | 03/25/2037 | | | | 16,056,443 | |
378,603 | | Suntrust Alternative Loan Trust, Series 2005-1F-2A3 | | | 5.75 | % | | | 12/25/2035 | | | | 376,047 | |
670,944 | | Suntrust Alternative Loan Trust, Series 2006-1F-1A3 | | | 6.00 | % | | | 04/25/2036 | | | | 543,938 | |
12,849,057 | | Terwin Mortgage Trust, Series 2006-7-2A3 (1 Month LIBOR USD + 0.27%, 0.27% Floor) | | | 0.38 | % (a) | | | 08/25/2037 | | | | 7,639,908 | |
228,311 | | Thornburg Mortgage Securities Trust, Series 2003-6-A2 (1 Month LIBOR USD + 1.00%, 1.00% Floor, 11.50% Cap) | | | 1.11 | % | | | 12/25/2033 | | | | 231,041 | |
3,500,099 | | Thornburg Mortgage Securities Trust, Series 2004-4-5A | | | 2.61 | % (b) | | | 12/25/2044 | | | | 3,478,148 | |
9,159,552 | | Thornburg Mortgage Securities Trust, Series 2007-1-A1 (12 Month LIBOR USD + 1.30%, 0.11% Floor, 10.75% Cap) | | | 1.58 | % | | | 03/25/2037 | | | | 9,020,553 | |
2,143,941 | | Thornburg Mortgage Securities Trust, Series 2007-1-A2A (12 Month LIBOR USD + 1.30%, 0.11% Floor, 10.75% Cap) | | | 1.58 | % | | | 03/25/2037 | | | | 2,022,269 | |
65,000,000 | | Toorak Mortgage Corporation Ltd., Series 2019-1-A1 | | | 4.54 | % (a)(c) | | | 03/25/2022 | | | | 65,774,150 | |
70,000,000 | | Toorak Mortgage Corporation Ltd., Series 2019-2-A1 | | | 3.72 | % (c) | | | 09/25/2022 | | | | 71,081,150 | |
4,100,000 | | Toorak Mortgage Corporation Ltd., Series 2020-1-A2 | | | 3.23 | % (a)(c) | | | 03/25/2023 | | | | 4,063,236 | |
5,000,000 | | Tricon American Homes Trust, Series 2019-SFR1-E | | | 3.40 | % (a) | | | 03/17/2038 | | | | 5,092,078 | |
8,900,000 | | Tricon American Homes Trust, Series 2020-SFR1-D | | | 2.55 | % (a) | | | 07/17/2038 | | | | 8,909,203 | |
1,600,000 | | Tricon American Homes Trust, Series 2020-SFR1-E | | | 3.54 | % (a) | | | 07/17/2038 | | | | 1,646,306 | |
20,800,000 | | TVC Mortgage Trust, Series 2020-RTL1-A1 | | | 3.47 | % (a) | | | 09/25/2024 | | | | 20,964,574 | |
7,254,527 | | VCAT LLC, Series 2020-NPL1-A1 | | | 3.67 | % (a)(c) | | | 08/25/2050 | | | | 7,334,594 | |
18,488,708 | | Velocity Commercial Capital Loan Trust, Series 2017-2-AFX | | | 3.07 | % (a)(b) | | | 11/25/2047 | | | | 19,051,139 | |
22,815,881 | | Velocity Commercial Capital Loan Trust, Series 2018-2-A | | | 4.05 | % (a)(b) | | | 10/26/2048 | | | | 23,897,069 | |
57,415,220 | | Velocity Commercial Capital Loan Trust, Series 2019-1-A | | | 3.76 | % (a)(b) | | | 03/25/2049 | | | | 59,608,303 | |
4,961,588 | | Velocity Commercial Capital Loan Trust, Series 2019-1-M4 | | | 4.61 | %(a)(b) | | | 03/25/2049 | | | | 5,016,167 | |
19,018,780 | | Velocity Commercial Capital Loan Trust, Series 2019-2-A | | | 3.13 | % (a)(b) | | | 07/25/2049 | | | | 19,300,908 | |
7,066,177 | | Velocity Commercial Capital Loan Trust, Series 2019-2-M1 | | | 3.26 | % (a)(b) | | | 07/25/2049 | | | | 7,163,371 | |
3,231,611 | | Velocity Commercial Capital Loan Trust, Series 2020-1-M4 | | | 3.54 | % (a)(b) | | | 02/25/2050 | | | | 3,130,491 | |
58,570,602 | | Vericrest Opportunity Loan Trust, Series 2020-NPL2-A1A | | | 2.98 | % (a)(c) | | | 02/25/2050 | | | | 58,828,254 | |
18,280,152 | | Vericrest Opportunity Loan Trust, Series 2020-NPL5-A1A | | | 2.98 | % (a)(c) | | | 03/25/2050 | | | | 18,367,736 | |
32,321,281 | | VOLT LLC, Series 2021-NPL1-A1 | | | 1.89 | % (a)(c) | | | 02/27/2051 | | | | 32,348,916 | |
95,628,552 | | VOLT LLC, Series 2021-NPL3-A1 | | | 2.24 | % (a)(c) | | | 02/27/2051 | | | | 95,650,298 | |
13,539,384 | | VOLT LLC, Series 2021-NPL5-A1 | | | 2.12 | % (a)(c) | | | 03/27/2051 | | | | 13,538,032 | |
42,277,000 | | VOLT LLC, Series 2021-NPL6-A1 | | | 2.24 | % (a)(c) | | | 04/25/2051 | | | | 42,302,671 | |
7,848,650 | | Voyager Trust, Series 2009-1-SAC3 | | | 3.29 | % (a)(b) | | | 02/25/2038 | | | | 5,727,524 | |
9,406,601 | | WaMu Asset-Backed Certificates Trust, Series 2007-HE1-2A2 (1 Month LIBOR USD + 0.11%, 0.11% Floor) | | | 0.22 | % | | | 01/25/2037 | | | | 5,951,950 | |
14,663,138 | | WaMu Asset-Backed Certificates Trust, Series 2007-HE4-1A (1 Month LIBOR USD + 0.17%, 0.17% Floor) | | | 0.28 | % | | | 07/25/2047 | | | | 12,368,816 | |
5,196,479 | | Washington Mutual Mortgage Pass-Through Certificates, Series 2005-1-2A | | | 6.00 | % | | | 03/25/2035 | | | | 5,126,683 | |
1,456,426 | | Washington Mutual Mortgage Pass-Through Certificates, Series 2005-4-5A1 | | | 5.50 | % | | | 06/25/2035 | | | | 1,438,112 | |
588,463 | | Washington Mutual Mortgage Pass-Through Certificates, Series 2005-5-CB12 (-11 x 1 Month LIBOR USD + 50.60%, 50.60% Cap) | | | 49.41 | % (i) | | | 07/25/2035 | | | | 1,187,199 | |
1,905,587 | | Washington Mutual Mortgage Pass-Through Certificates, Series 2005-5-CB6 (1 Month LIBOR USD + 0.60%, 0.60% Floor, 7.50% Cap) | | | 0.71 | % | | | 07/25/2035 | | | | 1,684,701 | |
494,812 | | Washington Mutual Mortgage Pass-Through Certificates, Series 2005-6-2A7 | | | 5.50 | % | | | 08/25/2035 | | | | 488,610 | |
6,624,743 | | Washington Mutual Mortgage Pass-Through Certificates, Series 2005-7-2CB6 (1 Month LIBOR USD + 1.45%, 1.45% Floor, 6.00% Cap) | | | 1.56 | % | | | 08/25/2035 | | | | 6,130,484 | |
602,249 | | Washington Mutual Mortgage Pass-Through Certificates, Series 2005-7-2CB7 (-11 x 1 Month LIBOR USD + 50.05%, 50.05% Cap) | | | 48.86 | % (i) | | | 08/25/2035 | | | | 1,135,126 | |
2,740,512 | | Washington Mutual Mortgage Pass-Through Certificates, Series 2005-7-3CB | | | 6.50 | % | | | 08/25/2035 | | | | 2,599,472 | |
7,390,460 | | Washington Mutual Mortgage Pass-Through Certificates, Series 2005-8-1A2 | | | 5.50 | % | | | 10/25/2035 | | | | 7,401,755 | |
5,963,389 | | Washington Mutual Mortgage Pass-Through Certificates, Series 2005-9-2A2 | | | 5.50 | % | | | 11/25/2035 | | | | 6,037,547 | |
1,675,693 | | Washington Mutual Mortgage Pass-Through Certificates, Series 2005-9-CX | | | 5.50 | % (f) | | | 11/25/2035 | | | | 309,914 | |
2,346,127 | | Washington Mutual Mortgage Pass-Through Certificates, Series 2006-1-3A1 | | | 5.75 | % | | | 02/25/2036 | | | | 2,257,903 | |
1,187,841 | | Washington Mutual Mortgage Pass-Through Certificates, Series 2006-1-3A2 | | | 5.75 | % | | | 02/25/2036 | | | | 1,141,888 | |
1,008,955 | | Washington Mutual Mortgage Pass-Through Certificates, Series 2006-1-3A7 | | | 5.75 | % | | | 02/25/2036 | | | | 970,312 | |
2,928,112 | | Washington Mutual Mortgage Pass-Through Certificates, Series 2006-3-3CB4 | | | 6.00 | % | | | 04/25/2036 | | | | 2,874,604 | |
1,690,059 | | Washington Mutual Mortgage Pass-Through Certificates, Series 2006-5-1A8 | | | 5.75 | % | | | 07/25/2036 | | | | 1,535,619 | |
3,257,330 | | Washington Mutual Mortgage Pass-Through Certificates, Series 2006-5-2CB1 | | | 6.00 | % | | | 07/25/2036 | | | | 2,812,886 | |
5,916,682 | | Washington Mutual Mortgage Pass-Through Certificates, Series 2006-5-2CB6 | | | 6.00 | % | | | 07/25/2036 | | | | 5,109,385 | |
14,665,296 | | Washington Mutual Mortgage Pass-Through Certificates, Series 2006-5-3A3 | | | 6.22 | % (h) | | | 07/25/2036 | | | | 5,401,185 | |
6,111,386 | | Washington Mutual Mortgage Pass-Through Certificates, Series 2006-5-3A5 | | | 6.45 | % (h) | | | 07/25/2036 | | | | 2,249,640 | |
9,084,559 | | Washington Mutual Mortgage Pass-Through Certificates, Series 2006-8-A4 | | | 4.24 | % (h) | | | 10/25/2036 | | | | 4,722,962 | |
3,177,034 | | Washington Mutual Mortgage Pass-Through Certificates, Series 2006-9-A7 | | | 4.54 | % (h) | | | 10/25/2036 | | | | 1,432,722 | |
5,572,423 | | Washington Mutual Mortgage Pass-Through Certificates, Series 2006-AR10-1A1 | | | 3.01 | % (b) | | | 09/25/2036 | | | | 5,442,048 | |
5,162,238 | | Washington Mutual Mortgage Pass-Through Certificates, Series 2006-AR10-A1 (1 Month LIBOR USD + 0.10%, 0.10% Floor) | | | 0.21 | % | | | 12/25/2036 | | | | 3,502,632 | |
9,105,119 | | Washington Mutual Mortgage Pass-Through Certificates, Series 2006-AR15-1A (12 Month US Treasury Average + 0.84%, 0.84% Floor) | | | 1.10 | % | | | 11/25/2046 | | | | 8,549,598 | |
6,954,609 | | Washington Mutual Mortgage Pass-Through Certificates, Series 2006-AR4-2A (12 Month US Treasury Average + 0.95%, 0.95% Floor) | | | 1.21 | % | | | 06/25/2046 | | | | 5,793,519 | |
6,049,010 | | Washington Mutual Mortgage Pass-Through Certificates, Series 2006-AR5-4A (12 Month US Treasury Average + 0.99%, 0.99% Floor) | | | 1.25 | % | | | 06/25/2046 | | | | 5,326,134 | |
689,981 | | Washington Mutual Mortgage Pass-Through Certificates, Series 2006-AR6-2A3 | | | 3.16 | % (b) | | | 08/25/2036 | | | | 657,147 | |
1,606,888 | | Washington Mutual Mortgage Pass-Through Certificates, Series 2006-HE2-A4 (1 Month LIBOR USD + 0.48%, 0.48% Floor) | | | 0.59 | % | | | 05/25/2036 | | | | 1,395,601 | |
9,448,179 | | Washington Mutual Mortgage Pass-Through Certificates, Series 2007-2-1A6 | | | 6.00 | % | | | 04/25/2037 | | | | 9,249,222 | |
3,811,395 | | Washington Mutual Mortgage Pass-Through Certificates, Series 2007-3-A2 | | | 6.00 | % | | | 04/25/2037 | | | | 3,799,936 | |
5,213,499 | | Washington Mutual Mortgage Pass-Through Certificates, Series 2007-3-A3 | | | 6.00 | % | | | 04/25/2037 | | | | 5,197,812 | |
3,615,097 | | Washington Mutual Mortgage Pass-Through Certificates, Series 2007-4-1A1 | | | 5.50 | % | | | 06/25/2037 | | | | 3,665,733 | |
246,826 | | Washington Mutual Mortgage Pass-Through Certificates, Series 2007-5-A11 (-6 x 1 Month LIBOR USD + 39.48%, 39.48% Cap) | | | 38.83 | % (i) | | | 06/25/2037 | | | | 470,509 | |
6,170,661 | | Washington Mutual Mortgage Pass-Through Certificates, Series 2007-5-A6 | | | 6.00 | % | | | 06/25/2037 | | | | 6,262,813 | |
8,141,541 | | Washington Mutual Mortgage Pass-Through Certificates, Series 2007-HY3-4A1 | | | 3.14 | % (b) | | | 03/25/2037 | | | | 8,316,786 | |
10,226,135 | | Washington Mutual Mortgage Pass-Through Certificates, Series 2007-HY5-1A1 | | | 3.26 | % (b) | | | 05/25/2037 | | | | 10,015,370 | |
7,682,023 | | Washington Mutual Mortgage Pass-Through Certificates, Series 2007-OC1-A2 (1 Month LIBOR USD + 0.12%, 0.12% Floor) | | | 0.23 | % | | | 01/25/2047 | | | | 7,673,356 | |
907,770 | | Wells Fargo Alternative Loan Trust, Series 2007-PA1-A10 | | | 6.00 | % | | | 03/25/2037 | | | | 906,762 | |
3,985,817 | | Wells Fargo Alternative Loan Trust, Series 2007-PA1-A3 | | | 6.00 | % | | | 03/25/2037 | | | | 3,981,390 | |
3,436,646 | | Wells Fargo Alternative Loan Trust, Series 2007-PA1-A5 | | | 6.00 | % | | | 03/25/2037 | | | | 3,432,829 | |
5,632,490 | | Wells Fargo Alternative Loan Trust, Series 2007-PA1-A6 | | | 6.00 | % | | | 03/25/2037 | | | | 5,626,235 | |
22,297,911 | | Wells Fargo Alternative Loan Trust, Series 2007-PA2-1A1 | | | 6.00 | % | | | 06/25/2037 | | | | 22,084,664 | |
3,518,798 | | Wells Fargo Alternative Loan Trust, Series 2007-PA2-3A1 (1 Month LIBOR USD + 0.35%, 0.35% Floor, 7.00% Cap) | | | 0.46 | % | | | 06/25/2037 | | | | 3,025,731 | |
5,183,734 | | Wells Fargo Alternative Loan Trust, Series 2007-PA2-3A2 (-1 x 1 Month LIBOR USD + 6.65%, 6.65% Cap) | | | 6.54 | % (f)(i) | | | 06/25/2037 | | | | 744,491 | |
360,461 | | Wells Fargo Alternative Loan Trust, Series 2007-PA3-1A4 | | | 5.75 | % | | | 07/25/2037 | | | | 360,340 | |
6,634,758 | | Wells Fargo Alternative Loan Trust, Series 2007-PA3-2A1 | | | 6.00 | % | | | 07/25/2037 | | | | 6,653,709 | |
2,636,032 | | Wells Fargo Alternative Loan Trust, Series 2007-PA3-2A4 | | | 6.00 | % | | | 07/25/2037 | | | | 2,643,561 | |
5,949,628 | | Wells Fargo Alternative Loan Trust, Series 2007-PA3-3A1 | | | 6.25 | % | | | 07/25/2037 | | | | 5,938,003 | |
38,333,745 | | Wells Fargo Alternative Loan Trust, Series 2007-PA5-1A1 | | | 6.25 | % | | | 11/25/2037 | | | | 38,100,511 | |
7,208,082 | | Wells Fargo Alternative Loan Trust, Series 2007-PA6-A1 | | | 3.15 | % (b) | | | 12/28/2037 | | | | 7,128,961 | |
2,872,598 | | Wells Fargo Mortgage Backed Securities Trust, Series 2006-AR12-1A1 | | | 2.95 | % (b) | | | 09/25/2036 | | | | 2,785,011 | |
1,387,826 | | Wells Fargo Mortgage Backed Securities Trust, Series 2006-AR13-A2 | | | 3.03 | % (b) | | | 09/25/2036 | | | | 1,376,389 | |
1,444,817 | | Wells Fargo Mortgage Backed Securities Trust, Series 2006-AR4-2A1 | | | 2.91 | % (b) | | | 04/25/2036 | | | | 1,417,407 | |
2,338,413 | | Wells Fargo Mortgage Backed Securities Trust, Series 2007-7-A1 | | | 6.00 | % | | | 06/25/2037 | | | | 2,361,969 | |
162,632 | | Wells Fargo Mortgage Backed Securities Trust, Series 2007-7-A32 | | | 5.75 | % | | | 06/25/2037 | | | | 162,858 | |
5,265,934 | | Wells Fargo Mortgage Backed Securities Trust, Series 2007-7-A34 | | | 6.00 | % | | | 06/25/2037 | | | | 5,318,979 | |
1,426,271 | | Wells Fargo Mortgage Backed Securities Trust, Series 2007-7-A36 | | | 6.00 | % | | | 06/25/2037 | | | | 1,438,203 | |
485,052 | | Wells Fargo Mortgage Backed Securities Trust, Series 2007-7-A43 (1 Month LIBOR USD + 0.50%, 0.50% Floor, 7.00% Cap) | | | 0.61 | % | | | 06/25/2037 | | | | 417,565 | |
1,325,153 | | Wells Fargo Mortgage Backed Securities Trust, Series 2007-7-A49 | | | 6.00 | % | | | 06/25/2037 | | | | 1,338,501 | |
561,000 | | Wells Fargo Mortgage Backed Securities Trust, Series 2007-7-A8 (1 Month LIBOR USD + 0.50%, 0.50% Floor, 7.00% Cap) | | | 0.61 | % | | | 06/25/2037 | | | | 482,945 | |
253,077 | | Wells Fargo Mortgage Backed Securities Trust, Series 2007-7-A9 (-6 x 1 Month LIBOR USD + 39.00%, 39.00% Cap) | | | 38.35 | % (i) | | | 06/25/2037 | | | | 389,533 | |
21,960,510 | | Wells Fargo Mortgage Backed Securities Trust, Series 2007-AR9-A1 | | | 2.93 | % (b) | | | 12/28/2037 | | | | 21,425,996 | |
| | | | | | | | | | | | | | |
Total Non-Agency Residential Collateralized Mortgage Obligations (Cost $13,473,450,129) | | | | | | | | 13,054,960,800 | |
| | | | | | | | | | | | | | |
US Government and Agency Mortgage Backed Obligations—47.6% | |
29,218,367 | | Federal Home Loan Mortgage Corporation Pool RA4218 | | | 2.50 | % | | | 12/01/2050 | | | | 30,064,927 | |
20,000,000 | | Federal Home Loan Mortgage Corporation Pool RA4968 | | | 2.50 | % | | | 04/01/2046 | | | | 20,663,167 | |
11,566,702 | | Federal Home Loan Mortgage Corporation Pool RB5106 | | | 2.50 | % | | | 03/01/2041 | | | | 11,985,914 | |
80,945,095 | | Federal Home Loan Mortgage Corporation Pool SD8128 | | | 2.00 | % | | | 02/01/2051 | | | | 80,873,883 | |
3,709,740 | | Federal Home Loan Mortgage Corporation, Pool C03490 | | | 4.50 | % | | | 08/01/2040 | | | | 4,141,384 | |
26,428,289 | | Federal Home Loan Mortgage Corporation, Pool C91388 | | | 3.50 | % | | | 02/01/2032 | | | | 28,291,030 | |
13,725,947 | | Federal Home Loan Mortgage Corporation, Pool C91403 | | | 3.50 | % | | | 03/01/2032 | | | | 14,693,459 | |
13,807,184 | | Federal Home Loan Mortgage Corporation, Pool C91413 | | | 3.50 | % | | | 12/01/2031 | | | | 14,778,185 | |
7,009,682 | | Federal Home Loan Mortgage Corporation, Pool C91417 | | | 3.50 | % | | | 01/01/2032 | | | | 7,503,749 | |
28,787,384 | | Federal Home Loan Mortgage Corporation, Pool C91447 | | | 3.50 | % | | | 05/01/2032 | | | | 30,816,936 | |
34,223,833 | | Federal Home Loan Mortgage Corporation, Pool C91594 | | | 3.00 | % | | | 01/01/2033 | | | | 36,113,666 | |
10,077,712 | | Federal Home Loan Mortgage Corporation, Pool C91596 | | | 3.00 | % | | | 02/01/2033 | | | | 10,634,278 | |
5,142,004 | | Federal Home Loan Mortgage Corporation, Pool D98901 | | | 3.50 | % | | | 01/01/2032 | | | | 5,504,386 | |
13,470,645 | | Federal Home Loan Mortgage Corporation, Pool D98923 | | | 3.50 | % | | | 01/01/2032 | | | | 14,419,915 | |
13,535,729 | | Federal Home Loan Mortgage Corporation, Pool D99724 | | | 3.00 | % | | | 11/01/2032 | | | | 14,283,133 | |
11,358,895 | | Federal Home Loan Mortgage Corporation, Pool G01840 | | | 5.00 | % | | | 07/01/2035 | | | | 13,230,247 | |
2,293,012 | | Federal Home Loan Mortgage Corporation, Pool G04817 | | | 5.00 | % | | | 09/01/2038 | | | | 2,669,432 | |
9,701,592 | | Federal Home Loan Mortgage Corporation, Pool G07801 | | | 4.00 | % | | | 10/01/2044 | | | | 10,697,609 | |
21,040,654 | | Federal Home Loan Mortgage Corporation, Pool G07862 | | | 4.00 | % | | | 01/01/2044 | | | | 23,308,531 | |
22,326,962 | | Federal Home Loan Mortgage Corporation, Pool G07905 | | | 4.00 | % | | | 01/01/2042 | | | | 24,576,245 | |
41,872,282 | | Federal Home Loan Mortgage Corporation, Pool G08534 | | | 3.00 | % | | | 06/01/2043 | | | | 44,552,594 | |
13,437,868 | | Federal Home Loan Mortgage Corporation, Pool G08537 | | | 3.00 | % | | | 07/01/2043 | | | | 14,240,365 | |
25,732,422 | | Federal Home Loan Mortgage Corporation, Pool G08614 | | | 3.00 | % | | | 11/01/2044 | | | | 27,005,397 | |
29,949,906 | | Federal Home Loan Mortgage Corporation, Pool G08619 | | | 3.00 | % | | | 12/01/2044 | | | | 31,431,188 | |
40,669,032 | | Federal Home Loan Mortgage Corporation, Pool G08622 | | | 3.00 | % | | | 01/01/2045 | | | | 42,827,963 | |
76,454,372 | | Federal Home Loan Mortgage Corporation, Pool G08626 | | | 3.00 | % | | | 02/01/2045 | | | | 80,515,061 | |
39,398,813 | | Federal Home Loan Mortgage Corporation, Pool G08631 | | | 3.00 | % | | | 03/01/2045 | | | | 41,350,360 | |
110,053,882 | | Federal Home Loan Mortgage Corporation, Pool G08635 | | | 3.00 | % | | | 04/01/2045 | | | | 115,908,593 | |
32,775,626 | | Federal Home Loan Mortgage Corporation, Pool G08640 | | | 3.00 | % | | | 05/01/2045 | | | | 34,519,632 | |
176,402,128 | | Federal Home Loan Mortgage Corporation, Pool G08648 | | | 3.00 | % | | | 06/01/2045 | | | | 185,784,056 | |
34,073,903 | | Federal Home Loan Mortgage Corporation, Pool G08653 | | | 3.00 | % | | | 07/01/2045 | | | | 35,917,373 | |
19,445,016 | | Federal Home Loan Mortgage Corporation, Pool G08658 | | | 3.00 | % | | | 08/01/2045 | | | | 20,478,046 | |
21,827,394 | | Federal Home Loan Mortgage Corporation, Pool G08670 | | | 3.00 | % | | | 10/01/2045 | | | | 22,985,337 | |
262,655,243 | | Federal Home Loan Mortgage Corporation, Pool G08675 | | | 3.00 | % | | | 11/01/2045 | | | | 276,600,513 | |
108,771,349 | | Federal Home Loan Mortgage Corporation, Pool G08680 | | | 3.00 | % | | | 12/01/2045 | | | | 114,543,982 | |
46,050,266 | | Federal Home Loan Mortgage Corporation, Pool G08686 | | | 3.00 | % | | | 01/01/2046 | | | | 48,466,266 | |
102,833,191 | | Federal Home Loan Mortgage Corporation, Pool G08692 | | | 3.00 | % | | | 02/01/2046 | | | | 108,288,618 | |
32,955,506 | | Federal Home Loan Mortgage Corporation, Pool G08705 | | | 3.00 | % | | | 05/01/2046 | | | | 34,700,838 | |
37,911,314 | | Federal Home Loan Mortgage Corporation, Pool G08715 | | | 3.00 | % | | | 08/01/2046 | | | | 39,907,275 | |
2,406,968 | | Federal Home Loan Mortgage Corporation, Pool G08800 | | | 3.50 | % | | | 02/01/2048 | | | | 2,556,402 | |
20,999,737 | | Federal Home Loan Mortgage Corporation, Pool G16072 | | | 3.00 | % | | | 02/01/2032 | | | | 22,483,695 | |
40,651,376 | | Federal Home Loan Mortgage Corporation, Pool G60251 | | | 3.50 | % | | | 10/01/2045 | | | | 43,804,470 | |
111,283,353 | | Federal Home Loan Mortgage Corporation, Pool G60393 | | | 3.50 | % | | | 01/01/2046 | | | | 119,769,269 | |
18,380,524 | | Federal Home Loan Mortgage Corporation, Pool J22834 | | | 2.50 | % | | | 03/01/2028 | | | | 19,203,146 | |
35,076,330 | | Federal Home Loan Mortgage Corporation, Pool Q13637 | | | 3.00 | % | | | 11/01/2042 | | | | 37,170,568 | |
37,434,470 | | Federal Home Loan Mortgage Corporation, Pool Q13638 | | | 3.00 | % | | | 11/01/2042 | | | | 39,830,248 | |
61,803,164 | | Federal Home Loan Mortgage Corporation, Pool Q16672 | | | 3.00 | % | | | 03/01/2043 | | | | 65,759,250 | |
3,853,282 | | Federal Home Loan Mortgage Corporation, Pool Q23595 | | | 4.00 | % | | | 12/01/2043 | | | | 4,269,929 | |
5,106,844 | | Federal Home Loan Mortgage Corporation, Pool Q24052 | | | 4.00 | % | | | 01/01/2044 | | | | 5,659,079 | |
3,920,527 | | Federal Home Loan Mortgage Corporation, Pool Q24172 | | | 4.00 | % | | | 01/01/2044 | | | | 4,333,156 | |
3,558,437 | | Federal Home Loan Mortgage Corporation, Pool Q24979 | | | 4.00 | % | | | 02/01/2044 | | | | 3,942,053 | |
18,682,887 | | Federal Home Loan Mortgage Corporation, Pool Q31596 | | | 3.50 | % | | | 02/01/2045 | | | | 20,018,978 | |
7,501,931 | | Federal Home Loan Mortgage Corporation, Pool Q32861 | | | 3.50 | % | | | 04/01/2045 | | | | 8,062,831 | |
21,230,680 | | Federal Home Loan Mortgage Corporation, Pool Q32921 | | | 3.50 | % | | | 04/01/2045 | | | | 22,818,716 | |
16,901,454 | | Federal Home Loan Mortgage Corporation, Pool Q39502 | | | 3.50 | % | | | 03/01/2046 | | | | 18,228,765 | |
49,842,433 | | Federal Home Loan Mortgage Corporation, Pool Q44073 | | | 3.00 | % | | | 09/01/2046 | | | | 52,436,797 | |
13,111,675 | | Federal Home Loan Mortgage Corporation, Pool RA2854 | | | 2.50 | % | | | 06/01/2050 | | | | 13,544,359 | |
98,085,020 | | Federal Home Loan Mortgage Corporation, Pool RB5089 | | | 1.50 | % | | | 12/01/2040 | | | | 96,326,866 | |
157,571,230 | | Federal Home Loan Mortgage Corporation, Pool RB5094 | | | 1.50 | % | | | 01/01/2041 | | | | 155,432,262 | |
48,602,805 | | Federal Home Loan Mortgage Corporation, Pool RE6066 | | | 2.00 | % | | | 10/01/2050 | | | | 48,182,949 | |
11,040,242 | | Federal Home Loan Mortgage Corporation, Pool SB0039 | | | 2.50 | % | | | 04/01/2033 | | | | 11,568,794 | |
140,714,398 | | Federal Home Loan Mortgage Corporation, Pool SB8092 | | | 1.50 | % | | | 03/01/2036 | | | | 141,483,275 | |
30,115,724 | | Federal Home Loan Mortgage Corporation, Pool SD0035 | | | 3.00 | % | | | 04/01/2047 | | | | 31,785,321 | |
575,853,506 | | Federal Home Loan Mortgage Corporation, Pool SD8104 | | | 1.50 | % | | | 11/01/2050 | | | | 556,978,894 | |
74,045,409 | | Federal Home Loan Mortgage Corporation, Pool SD8107 | | | 2.50 | % | | | 11/01/2050 | | | | 76,077,023 | |
2,132,171 | | Federal Home Loan Mortgage Corporation, Pool T60392 | | | 4.00 | % | | | 10/01/2041 | | | | 2,282,214 | |
3,471,907 | | Federal Home Loan Mortgage Corporation, Pool T60681 | | | 4.00 | % | | | 05/01/2042 | | | | 3,727,999 | |
9,344,589 | | Federal Home Loan Mortgage Corporation, Pool T60782 | | | 3.50 | % | | | 07/01/2042 | | | | 9,765,804 | |
13,228,333 | | Federal Home Loan Mortgage Corporation, Pool T60853 | | | 3.50 | % | | | 09/01/2042 | | | | 13,824,157 | |
12,641,356 | | Federal Home Loan Mortgage Corporation, Pool T60854 | | | 3.50 | % | | | 09/01/2042 | | | | 13,210,124 | |
1,365,315 | | Federal Home Loan Mortgage Corporation, Pool T65110 | | | 3.50 | % | | | 10/01/2042 | | | | 1,428,856 | |
15,824,127 | | Federal Home Loan Mortgage Corporation, Pool T65492 | | | 3.00 | % | | | 06/01/2048 | | | | 16,248,597 | |
1,200,044 | | Federal Home Loan Mortgage Corporation, Pool T69016 | | | 5.00 | % | | | 06/01/2041 | | | | 1,328,554 | |
16,662,592 | | Federal Home Loan Mortgage Corporation, Pool T69050 | | | 3.50 | % | | | 05/01/2046 | | | | 17,772,897 | |
316,775 | | Federal Home Loan Mortgage Corporation, Pool U60299 | | | 4.00 | % | | | 11/01/2040 | | | | 345,295 | |
2,277,955 | | Federal Home Loan Mortgage Corporation, Pool U99125 | | | 3.00 | % | | | 01/01/2043 | | | | 2,432,482 | |
39,830,809 | | Federal Home Loan Mortgage Corporation, Pool U99193 | | | 3.50 | % | | | 03/01/2044 | | | | 43,508,625 | |
86,523,090 | | Federal Home Loan Mortgage Corporation, Pool V81821 | | | 3.00 | % | | | 08/01/2045 | | | | 91,740,033 | |
23,636,261 | | Federal Home Loan Mortgage Corporation, Pool V82117 | | | 3.00 | % | | | 12/01/2045 | | | | 25,061,553 | |
22,873,048 | | Federal Home Loan Mortgage Corporation, Pool V82209 | | | 3.50 | % | | | 02/01/2046 | | | | 24,620,044 | |
10,292,031 | | Federal Home Loan Mortgage Corporation, Pool V82248 | | | 3.50 | % | | | 03/01/2046 | | | | 11,114,300 | |
131,622,229 | | Federal Home Loan Mortgage Corporation, Pool Z40117 | | | 3.00 | % | | | 04/01/2045 | | | | 139,100,151 | |
13,110,466 | | Federal Home Loan Mortgage Corporation, Pool ZS4750 | | | 3.00 | % | | | 01/01/2048 | | | | 13,684,785 | |
26,636,132 | | Federal Home Loan Mortgage Corporation, Pool ZT1827 | | | 3.00 | % | | | 07/01/2047 | | | | 27,996,502 | |
20,747,094 | | Federal Home Loan Mortgage Corporation, Series 2015-SC02-1A | | | 3.00 | % | | | 09/25/2045 | | | | 20,854,767 | |
11,942,589 | | Federal Home Loan Mortgage Corporation, Series 2016-SC01-1A | | | 3.00 | % | | | 07/25/2046 | | | | 12,030,790 | |
65,800,000 | | Federal Home Loan Mortgage Corporation, Series 2020-DNA2-M2 (1 Month LIBOR USD + 1.85%, 1.85% Floor) | | | 1.96 | % (a) | | | 02/25/2050 | | | | 65,897,831 | |
2,746,823 | | Federal Home Loan Mortgage Corporation, Series 2021-MN1-M1 (Secured Overnight Financing Rate 30 Day Average + 2.00%) | | | 2.02 | % (a) | | | 01/25/2051 | | | | 2,760,500 | |
1,250,000 | | Federal Home Loan Mortgage Corporation, Series 2021-MN1-M2 (Secured Overnight Financing Rate 30 Day Average + 3.75%) | | | 3.77 | % (a) | | | 01/25/2051 | | | | 1,309,919 | |
725,687 | | Federal Home Loan Mortgage Corporation, Series 2519-ZD | | | 5.50 | % | | | 11/15/2032 | | | | 825,857 | |
405,236 | | Federal Home Loan Mortgage Corporation, Series 2596-ZL | | | 5.00 | % | | | 04/15/2033 | | | | 460,979 | |
23,059,866 | | Federal Home Loan Mortgage Corporation, Series 267-30 | | | 3.00 | % | | | 08/15/2042 | | | | 23,581,285 | |
267,288 | | Federal Home Loan Mortgage Corporation, Series 2684-ZN | | | 4.00 | % | | | 10/15/2033 | | | | 294,186 | |
46,832,806 | | Federal Home Loan Mortgage Corporation, Series 269-30 | | | 3.00 | % | | | 08/15/2042 | | | | 47,900,526 | |
17,680,188 | | Federal Home Loan Mortgage Corporation, Series 274-30 | | | 3.00 | % | | | 08/15/2042 | | | | 18,095,668 | |
1,793,768 | | Federal Home Loan Mortgage Corporation, Series 2750-ZT | | | 5.00 | % | | | 02/15/2034 | | | | 2,040,618 | |
61,985,729 | | Federal Home Loan Mortgage Corporation, Series 280-30 | | | 3.00 | % | | | 09/15/2042 | | | | 63,440,416 | |
4,658,756 | | Federal Home Loan Mortgage Corporation, Series 2825-PZ | | | 5.50 | % | | | 07/15/2034 | | | | 5,401,512 | |
12,929,157 | | Federal Home Loan Mortgage Corporation, Series 284-300 | | | 3.00 | % | | | 10/15/2042 | | | | 13,369,526 | |
2,838,222 | | Federal Home Loan Mortgage Corporation, Series 2898-JZ | | | 5.00 | % | | | 12/15/2034 | | | | 3,213,377 | |
6,736,964 | | Federal Home Loan Mortgage Corporation, Series 2899-AZ | | | 5.00 | % | | | 12/15/2034 | | | | 7,639,185 | |
4,010,879 | | Federal Home Loan Mortgage Corporation, Series 2909-Z | | | 5.00 | % | | | 12/15/2034 | | | | 4,554,505 | |
7,472,118 | | Federal Home Loan Mortgage Corporation, Series 2932-Z | | | 5.00 | % | | | 02/15/2035 | | | | 8,507,358 | |
404,765 | | Federal Home Loan Mortgage Corporation, Series 2990-JL (-1 x 1 Month LIBOR USD + 6.65%, 6.65% Cap) | | | 6.54 | % (f)(i) | | | 03/15/2035 | | | | 26,950 | |
3,003,816 | | Federal Home Loan Mortgage Corporation, Series 3002-SN (-1 x 1 Month LIBOR USD + 6.50%, 6.50% Cap) | | | 6.39 | % (f)(i) | | | 07/15/2035 | | | | 548,531 | |
2,135,726 | | Federal Home Loan Mortgage Corporation, Series 3030-SL (-1 x 1 Month LIBOR USD + 6.10%, 6.10% Cap) | | | 5.99 | % (f)(i) | | | 09/15/2035 | | | | 283,716 | |
642,999 | | Federal Home Loan Mortgage Corporation, Series 3045-DI (-1 x 1 Month LIBOR USD + 6.73%, 6.73% Cap) | | | 6.62 | % (f)(i) | | | 10/15/2035 | | | | 100,312 | |
4,571,733 | | Federal Home Loan Mortgage Corporation, Series 3116-Z | | | 5.50 | % | | | 02/15/2036 | | | | 5,226,898 | |
893,453 | | Federal Home Loan Mortgage Corporation, Series 3117-ZN | | | 4.50 | % | | | 02/15/2036 | | | | 967,429 | |
2,302,308 | | Federal Home Loan Mortgage Corporation, Series 3174-PZ | | | 5.00 | % | | | 01/15/2036 | | | | 2,626,288 | |
589,940 | | Federal Home Loan Mortgage Corporation, Series 3187-JZ | | | 5.00 | % | | | 07/15/2036 | | | | 667,957 | |
1,552,000 | | Federal Home Loan Mortgage Corporation, Series 3188-ZK | | | 5.00 | % | | | 07/15/2036 | | | | 1,765,730 | |
2,784,423 | | Federal Home Loan Mortgage Corporation, Series 3203-SE (-1 x 1 Month LIBOR USD + 6.50%, 6.50% Cap) | | | 6.39 | % (f)(i) | | | 08/15/2036 | | | | 482,663 | |
3,475,012 | | Federal Home Loan Mortgage Corporation, Series 3203-Z | | | 5.00 | % | | | 07/15/2036 | | | | 3,968,231 | |
5,506,181 | | Federal Home Loan Mortgage Corporation, Series 3203-ZC | | | 5.00 | % | | | 07/15/2036 | | | | 6,287,690 | |
3,271,963 | | Federal Home Loan Mortgage Corporation, Series 3261-SA (-1 x 1 Month LIBOR USD + 6.43%, 6.43% Cap) | | | 6.32 | % (f)(i) | | | 01/15/2037 | | | | 657,264 | |
10,570,986 | | Federal Home Loan Mortgage Corporation, Series 326-300 | | | 3.00 | % | | | 03/15/2044 | | | | 10,922,869 | |
3,702,124 | | Federal Home Loan Mortgage Corporation, Series 3275-SC (-1 x 1 Month LIBOR USD + 6.08%, 6.08% Cap) | | | 5.97 | % (f)(i) | | | 02/15/2037 | | | | 528,071 | |
960,807 | | Federal Home Loan Mortgage Corporation, Series 3315-HZ | | | 6.00 | % | | | 05/15/2037 | | | | 1,099,264 | |
2,618,638 | | Federal Home Loan Mortgage Corporation, Series 3326-GS (-1 x 1 Month LIBOR USD + 6.65%, 6.65% Cap) | | | 6.54 | % (f)(i) | | | 06/15/2037 | | | | 471,546 | |
565,309 | | Federal Home Loan Mortgage Corporation, Series 3351-ZC | | | 5.50 | % | | | 07/15/2037 | | | | 656,580 | |
7,036,904 | | Federal Home Loan Mortgage Corporation, Series 3355-BI (-1 x 1 Month LIBOR USD + 6.05%, 6.05% Cap) | | | 5.94 | % (f)(i) | | | 08/15/2037 | | | | 1,194,398 | |
272,309 | | Federal Home Loan Mortgage Corporation, Series 3369-Z | | | 6.00 | % | | | 09/15/2037 | | | | 312,823 | |
725,665 | | Federal Home Loan Mortgage Corporation, Series 3405-ZG | | | 5.50 | % | | | 01/15/2038 | | | | 820,336 | |
1,073,884 | | Federal Home Loan Mortgage Corporation, Series 3417-SI (-1 x 1 Month LIBOR USD + 6.18%, 6.18% Cap) | | | 6.07 | % (f)(i) | | | 02/15/2038 | | | | 141,178 | |
1,776,034 | | Federal Home Loan Mortgage Corporation, Series 3423-GS (-1 x 1 Month LIBOR USD + 5.65%, 5.65% Cap) | | | 5.54 | % (f)(i) | | | 03/15/2038 | | | | 229,390 | |
291,644 | | Federal Home Loan Mortgage Corporation, Series 3423-SG (-1 x 1 Month LIBOR USD + 5.65%, 5.65% Cap) | | | 5.54 | % (f)(i) | | | 03/15/2038 | | | | 36,680 | |
252,633 | | Federal Home Loan Mortgage Corporation, Series 3451-S (-1 x 1 Month LIBOR USD + 6.03%, 6.03% Cap) | | | 5.92 | % (f)(i) | | | 02/15/2037 | | | | 42,242 | |
420,852 | | Federal Home Loan Mortgage Corporation, Series 3455-SC (-1 x 1 Month LIBOR USD + 6.06%, 6.06% Cap) | | | 5.95 | % (f)(i) | | | 06/15/2038 | | | | 57,080 | |
163,587 | | Federal Home Loan Mortgage Corporation, Series 3473-SM (-1 x 1 Month LIBOR USD + 6.07%, 6.07% Cap) | | | 5.96 | % (f)(i) | | | 07/15/2038 | | | | 21,448 | |
2,788,614 | | Federal Home Loan Mortgage Corporation, Series 3484-SE (-1 x 1 Month LIBOR USD + 5.85%, 5.85% Cap) | | | 5.74 | % (f)(i) | | | 08/15/2038 | | | | 415,561 | |
3,623,884 | | Federal Home Loan Mortgage Corporation, Series 3519-SD (-1 x 1 Month LIBOR USD + 5.55%, 5.55% Cap) | | | 5.44 | % (f)(i) | | | 02/15/2038 | | | | 562,829 | |
1,161,007 | | Federal Home Loan Mortgage Corporation, Series 3524-LB | | | 3.54 | %(g)(f) | | | 06/15/2038 | | | | 1,244,663 | |
78,901 | | Federal Home Loan Mortgage Corporation, Series 3530-GZ | | | 4.50 | % (j) | | | 05/15/2039 | | | | 78,741 | |
4,066,838 | | Federal Home Loan Mortgage Corporation, Series 3541-EI (-1 x 1 Month LIBOR USD + 6.75%, 6.75% Cap) | | | 6.64 | % (f)(i) | | | 06/15/2039 | | | | 781,979 | |
423,464 | | Federal Home Loan Mortgage Corporation, Series 3545-SA (-1 x 1 Month LIBOR USD + 6.15%, 6.15% Cap) | | | 6.04 | % (f)(i) | | | 06/15/2039 | | | | 77,979 | |
176,160 | | Federal Home Loan Mortgage Corporation, Series 3549-SA (-1 x 1 Month LIBOR USD + 5.80%, 5.80% Cap) | | | 5.69 | % (f)(i) | | | 07/15/2039 | | | | 24,691 | |
4,437,356 | | Federal Home Loan Mortgage Corporation, Series 3577-LS (-1 x 1 Month LIBOR USD + 7.20%, 7.20% Cap) | | | 7.09 | % (f)(i) | | | 08/15/2035 | | | | 818,254 | |
1,150,721 | | Federal Home Loan Mortgage Corporation, Series 3582-SA (-1 x 1 Month LIBOR USD + 6.00%, 6.00% Cap) | | | 5.89 | % (f)(i) | | | 10/15/2049 | | | | 165,697 | |
25,310,099 | | Federal Home Loan Mortgage Corporation, Series 358-300 | | | 3.00 | % | | | 10/15/2047 | | | | 26,510,247 | |
1,385,633 | | Federal Home Loan Mortgage Corporation, Series 3583-GB | | | 4.50 | % | | | 10/15/2039 | | | | 1,524,951 | |
2,860,584 | | Federal Home Loan Mortgage Corporation, Series 3616-SG (-1 x 1 Month LIBOR USD + 6.35%, 6.35% Cap) | | | 6.24 | % (f)(i) | | | 03/15/2032 | | | | 439,320 | |
3,923,466 | | Federal Home Loan Mortgage Corporation, Series 3626-AZ | | | 5.50 | % | | | 08/15/2036 | | | | 4,522,889 | |
5,526,206 | | Federal Home Loan Mortgage Corporation, Series 3641-Z | | | 5.50 | % | | | 02/15/2036 | | | | 6,373,897 | |
5,390,380 | | Federal Home Loan Mortgage Corporation, Series 3654-ZB | | | 5.50 | % | | | 11/15/2037 | | | | 6,116,625 | |
12,562,674 | | Federal Home Loan Mortgage Corporation, Series 3666-VZ | | | 5.50 | % | | | 08/15/2036 | | | | 14,382,395 | |
723,182 | | Federal Home Loan Mortgage Corporation, Series 3667-SB (-1 x 1 Month LIBOR USD + 6.45%, 6.45% Cap) | | | 6.34 | % (f)(i) | | | 05/15/2040 | | | | 119,680 | |
4,961,708 | | Federal Home Loan Mortgage Corporation, Series 3702-SG (-1 x 1 Month LIBOR USD + 6.05%, 6.05% Cap) | | | 5.94 | % (f)(i) | | | 08/15/2032 | | | | 684,971 | |
1,457,423 | | Federal Home Loan Mortgage Corporation, Series 3704-EI | | | 5.00 | % (f) | | | 12/15/2036 | | | | 332,870 | |
2,272,548 | | Federal Home Loan Mortgage Corporation, Series 3712-SG (-5 x 1 Month LIBOR USD + 25.00%, 25.00% Cap) | | | 24.42 | % (i) | | | 08/15/2040 | | | | 3,176,663 | |
3,098,944 | | Federal Home Loan Mortgage Corporation, Series 3724-CM | | | 5.50 | % | | | 06/15/2037 | | | | 3,518,661 | |
10,372,812 | | Federal Home Loan Mortgage Corporation, Series 3726-SA (-1 x 1 Month LIBOR USD + 6.05%, 6.05% Cap) | | | 5.94 | % (f)(i) | | | 09/15/2040 | | | | 1,812,567 | |
1,218,075 | | Federal Home Loan Mortgage Corporation, Series 3741-SC (-2 x 1 Month LIBOR USD + 10.00%, 10.00% Cap) | | | 9.79 | % (i) | | | 10/15/2040 | | | | 1,271,130 | |
9,736,580 | | Federal Home Loan Mortgage Corporation, Series 3752-BS (-2 x 1 Month LIBOR USD + 10.00%, 10.00% Cap) | | | 9.77 | % (i) | | | 11/15/2040 | | | | 10,479,183 | |
20,012,196 | | Federal Home Loan Mortgage Corporation, Series 3768-ZX | | | 5.00 | % (j) | | | 12/15/2040 | | | | 22,833,111 | |
3,333,735 | | Federal Home Loan Mortgage Corporation, Series 3771-AL | | | 4.00 | % | | | 12/15/2030 | | | | 3,621,812 | |
9,636,816 | | Federal Home Loan Mortgage Corporation, Series 3779-BY | | | 3.50 | % | | | 12/15/2030 | | | | 10,416,857 | |
21,467,783 | | Federal Home Loan Mortgage Corporation, Series 3779-DZ | | | 4.50 | % | | | 12/15/2040 | | | | 23,323,702 | |
10,442,297 | | Federal Home Loan Mortgage Corporation, Series 3779-LB | | | 4.00 | % | | | 12/15/2030 | | | | 11,466,515 | |
2,607,293 | | Federal Home Loan Mortgage Corporation, Series 3779-YA | | | 3.50 | % | | | 12/15/2030 | | | | 2,825,153 | |
8,918,099 | | Federal Home Loan Mortgage Corporation, Series 3783-AC | | | 4.00 | % | | | 01/15/2031 | | | | 9,838,575 | |
6,096,041 | | Federal Home Loan Mortgage Corporation, Series 3786-SG (-2 x 1 Month LIBOR USD + 9.50%, 9.50% Cap) | | | 9.29 | % (i) | | | 01/15/2041 | | | | 6,148,284 | |
7,633,602 | | Federal Home Loan Mortgage Corporation, Series 3788-AY | | | 3.50 | % | | | 01/15/2031 | | | | 8,261,502 | |
1,535,433 | | Federal Home Loan Mortgage Corporation, Series 3790-Z | | | 4.00 | % | | | 01/15/2041 | | | | 1,673,943 | |
99,506 | | Federal Home Loan Mortgage Corporation, Series 3798-SD (-2 x 1 Month LIBOR USD + 9.60%, 9.60% Cap) | | | 9.39 | % (i) | | | 12/15/2040 | | | | 95,746 | |
24,429,801 | | Federal Home Loan Mortgage Corporation, Series 3800-VZ | | | 4.50 | % (j) | | | 02/15/2041 | | | | 27,164,732 | |
2,268,027 | | Federal Home Loan Mortgage Corporation, Series 3803-ZM | | | 4.00 | % | | | 02/15/2041 | | | | 2,465,739 | |
27,103,703 | | Federal Home Loan Mortgage Corporation, Series 3806-CZ | | | 5.50 | % | | | 07/15/2034 | | | | 31,280,671 | |
10,664,287 | | Federal Home Loan Mortgage Corporation, Series 3808-DB | | | 3.50 | % | | | 02/15/2031 | | | | 11,483,312 | |
8,923,221 | | Federal Home Loan Mortgage Corporation, Series 3812-EY | | | 3.50 | % | | | 02/15/2031 | | | | 9,652,632 | |
3,671,407 | | Federal Home Loan Mortgage Corporation, Series 3818-CZ | | | 4.50 | % | | | 03/15/2041 | | | | 4,137,281 | |
3,640,708 | | Federal Home Loan Mortgage Corporation, Series 3819-MS (-1 x 1 Month LIBOR USD + 6.47%, 6.47% Cap) | | | 6.36 | % (f)(i) | | | 06/15/2040 | | | | 317,621 | |
5,984,251 | | Federal Home Loan Mortgage Corporation, Series 3819-ZU | | | 5.50 | % | | | 07/15/2034 | | | | 6,916,906 | |
20,941,664 | | Federal Home Loan Mortgage Corporation, Series 3824-EY | | | 3.50 | % | | | 03/15/2031 | | | | 22,681,636 | |
3,350,433 | | Federal Home Loan Mortgage Corporation, Series 3828-SW (-3 x 1 Month LIBOR USD + 13.20%, 13.20% Cap) | | | 12.88 | % (i) | | | 02/15/2041 | | | | 4,542,363 | |
7,499,955 | | Federal Home Loan Mortgage Corporation, Series 3829-VZ | | | 4.00 | % | | | 03/15/2041 | | | | 8,098,730 | |
8,200,877 | | Federal Home Loan Mortgage Corporation, Series 3843-PZ | | | 5.00 | % (j) | | | 04/15/2041 | | | | 9,555,326 | |
17,285,103 | | Federal Home Loan Mortgage Corporation, Series 3863-ZA | | | 5.50 | % | | | 08/15/2034 | | | | 19,665,614 | |
6,415,881 | | Federal Home Loan Mortgage Corporation, Series 3870-PB | | | 4.50 | % | | | 06/15/2041 | | | | 7,079,331 | |
28,699,300 | | Federal Home Loan Mortgage Corporation, Series 3871-LZ | | | 5.50 | % | | | 06/15/2041 | | | | 33,298,934 | |
8,921,955 | | Federal Home Loan Mortgage Corporation, Series 3872-BA | | | 4.00 | % | | | 06/15/2041 | | | | 9,601,819 | |
6,066,813 | | Federal Home Loan Mortgage Corporation, Series 3877-EY | | | 4.50 | % | | | 06/15/2041 | | | | 6,455,145 | |
2,464,881 | | Federal Home Loan Mortgage Corporation, Series 3877-GY | | | 4.50 | % | | | 06/15/2041 | | | | 2,595,287 | |
12,770,650 | | Federal Home Loan Mortgage Corporation, Series 3877-ZU | | | 4.50 | % | | | 06/15/2041 | | | | 13,446,056 | |
24,699,306 | | Federal Home Loan Mortgage Corporation, Series 3888-ZU | | | 4.50 | % (j) | | | 06/15/2041 | | | | 27,601,192 | |
3,818,945 | | Federal Home Loan Mortgage Corporation, Series 3900-SB (-1 x 1 Month LIBOR USD + 5.97%, 5.97% Cap) | | | 5.86 | % (f)(i) | | | 07/15/2041 | | | | 593,196 | |
17,536,898 | | Federal Home Loan Mortgage Corporation, Series 3901-VZ | | | 4.00 | % | | | 07/15/2041 | | | | 18,961,701 | |
25,236,710 | | Federal Home Loan Mortgage Corporation, Series 3910-GZ | | | 5.00 | % | | | 08/15/2041 | | | | 28,879,859 | |
3,905,710 | | Federal Home Loan Mortgage Corporation, Series 3910-ZE | | | 5.00 | % | | | 10/15/2034 | | | | 4,444,544 | |
5,290,150 | | Federal Home Loan Mortgage Corporation, Series 3919-KL | | | 4.50 | % | | | 09/15/2041 | | | | 5,613,337 | |
21,477,912 | | Federal Home Loan Mortgage Corporation, Series 3919-ZJ | | | 4.00 | % | | | 09/15/2041 | | | | 23,823,678 | |
1,626,407 | | Federal Home Loan Mortgage Corporation, Series 3942-JZ | | | 4.00 | % | | | 10/15/2041 | | | | 1,739,804 | |
6,041,440 | | Federal Home Loan Mortgage Corporation, Series 3944-AZ | | | 4.00 | % | | | 10/15/2041 | | | | 6,583,968 | |
2,966,324 | | Federal Home Loan Mortgage Corporation, Series 3946-SM (-3 x 1 Month LIBOR USD + 14.70%, 14.70% Cap) | | | 14.38 | % (i) | | | 10/15/2041 | | | | 3,957,594 | |
17,650,828 | | Federal Home Loan Mortgage Corporation, Series 3969-AB | | | 4.00 | % | | | 10/15/2033 | | | | 19,176,406 | |
4,708,668 | | Federal Home Loan Mortgage Corporation, Series 3982-AZ | | | 3.50 | % | | | 01/15/2042 | | | | 5,116,791 | |
69,217,761 | | Federal Home Loan Mortgage Corporation, Series 3990-ZA | | | 3.50 | % (j) | | | 01/15/2042 | | | | 74,620,041 | |
5,735,378 | | Federal Home Loan Mortgage Corporation, Series 3999-EZ | | | 4.00 | % | | | 02/15/2042 | | | | 6,208,289 | |
38,255,129 | | Federal Home Loan Mortgage Corporation, Series 3999-ZB | | | 4.00 | % | | | 02/15/2042 | | | | 41,401,361 | |
34,226,485 | | Federal Home Loan Mortgage Corporation, Series 4016-KZ | | | 4.00 | % (j) | | | 03/15/2042 | | | | 38,341,302 | |
3,791,350 | | Federal Home Loan Mortgage Corporation, Series 4050-BC | | | 2.00 | % | | | 05/15/2041 | | | | 3,838,734 | |
2,721,468 | | Federal Home Loan Mortgage Corporation, Series 4050-ND | | | 2.50 | % | | | 09/15/2041 | | | | 2,779,931 | |
85,094,510 | | Federal Home Loan Mortgage Corporation, Series 4057-ZA | | | 4.00 | % (j) | | | 06/15/2042 | | | | 94,983,649 | |
84,783,534 | | Federal Home Loan Mortgage Corporation, Series 4084-TZ | | | 4.00 | % (j) | | | 07/15/2042 | | | | 94,523,856 | |
1,241,104 | | Federal Home Loan Mortgage Corporation, Series 4097-TG | | | 2.00 | % | | | 05/15/2039 | | | | 1,247,014 | |
46,495,773 | | Federal Home Loan Mortgage Corporation, Series 4097-ZA | | | 3.50 | % (j) | | | 08/15/2042 | | | | 50,426,637 | |
71,798,333 | | Federal Home Loan Mortgage Corporation, Series 4109-GE | | | 4.50 | % | | | 10/15/2041 | | | | 78,934,836 | |
24,485,690 | | Federal Home Loan Mortgage Corporation, Series 4116-AP | | | 1.35 | % | | | 08/15/2042 | | | | 24,621,037 | |
4,278,996 | | Federal Home Loan Mortgage Corporation, Series 4121-AV | | | 3.00 | % | | | 12/15/2035 | | | | 4,561,686 | |
26,029,922 | | Federal Home Loan Mortgage Corporation, Series 4160-HP | | | 2.50 | % | | | 01/15/2033 | | | | 27,349,165 | |
25,954,891 | | Federal Home Loan Mortgage Corporation, Series 4162-ZJ | | | 3.00 | % | | | 02/15/2033 | | | | 27,645,079 | |
3,677,761 | | Federal Home Loan Mortgage Corporation, Series 4165-ZT | | | 3.00 | % | | | 02/15/2043 | | | | 3,762,083 | |
47,686,728 | | Federal Home Loan Mortgage Corporation, Series 4174-Z | | | 3.50 | % (j) | | | 03/15/2043 | | | | 51,614,274 | |
121,537,712 | | Federal Home Loan Mortgage Corporation, Series 4179-AZ | | | 4.00 | % (j) | | | 01/15/2041 | | | | 133,016,074 | |
24,900,138 | | Federal Home Loan Mortgage Corporation, Series 4183-ZB | | | 3.00 | % | | | 03/15/2043 | | | | 24,404,862 | |
9,341,845 | | Federal Home Loan Mortgage Corporation, Series 4186-ZJ | | | 3.00 | % | | | 03/15/2033 | | | | 9,777,179 | |
13,000,000 | | Federal Home Loan Mortgage Corporation, Series 4189-ML | | | 3.00 | % | | | 04/15/2038 | | | | 13,756,085 | |
76,919,262 | | Federal Home Loan Mortgage Corporation, Series 4212-US (-1 x 1 Month LIBOR USD + 5.40%, 5.40% Cap) | | | 5.26 | % (i) | | | 06/15/2043 | | | | 75,913,412 | |
36,485,196 | | Federal Home Loan Mortgage Corporation, Series 4223-US (-1 x 1 Month LIBOR USD + 5.43%, 5.43% Cap) | | | 5.29 | % (i) | | | 07/15/2043 | | | | 36,585,399 | |
27,163,902 | | Federal Home Loan Mortgage Corporation, Series 4223-ZV | | | 4.00 | % (j) | | | 07/15/2043 | | | | 30,266,780 | |
11,450,385 | | Federal Home Loan Mortgage Corporation, Series 4229-TZ | | | 3.00 | % | | | 06/15/2043 | | | | 11,655,697 | |
33,954,878 | | Federal Home Loan Mortgage Corporation, Series 4229-ZA | | | 4.00 | % (j) | | | 07/15/2043 | | | | 37,824,532 | |
13,030,880 | | Federal Home Loan Mortgage Corporation, Series 4249-CS (-1 x 1 Month LIBOR USD + 4.65%, 4.65% Cap) | | | 4.56 | % | | | 09/15/2043 | | | | 12,377,896 | |
23,897,129 | | Federal Home Loan Mortgage Corporation, Series 4250-BZ | | | 3.00 | % (j) | | | 09/15/2033 | | | | 25,623,883 | |
18,745,104 | | Federal Home Loan Mortgage Corporation, Series 4267-BZ | | | 4.00 | % | | | 10/15/2040 | | | | 20,451,990 | |
23,609,934 | | Federal Home Loan Mortgage Corporation, Series 4283-ZL | | | 3.00 | % (j) | | | 08/15/2033 | | | | 25,425,439 | |
2,313,117 | | Federal Home Loan Mortgage Corporation, Series 4323-GA | | | 3.00 | % | | | 06/15/2040 | | | | 2,317,232 | |
20,950,022 | | Federal Home Loan Mortgage Corporation, Series 4355-ZX | | | 4.00 | % (j) | | | 05/15/2044 | | | | 23,457,220 | |
6,885,801 | | Federal Home Loan Mortgage Corporation, Series 4360-KA | | | 3.00 | % | | | 05/15/2040 | | | | 6,959,922 | |
7,642,475 | | Federal Home Loan Mortgage Corporation, Series 4375-CG | | | 3.00 | % | | | 04/15/2039 | | | | 7,698,005 | |
16,443,713 | | Federal Home Loan Mortgage Corporation, Series 4376-GZ | | | 3.00 | % (j) | | | 08/15/2044 | | | | 17,247,515 | |
52,278,540 | | Federal Home Loan Mortgage Corporation, Series 4377-LZ | | | 3.00 | % (j) | | | 08/15/2044 | | | | 54,811,858 | |
28,474,136 | | Federal Home Loan Mortgage Corporation, Series 4377-UZ | | | 3.00 | % | | | 08/15/2044 | | | | 28,986,724 | |
2,862,301 | | Federal Home Loan Mortgage Corporation, Series 4379-KA | | | 3.00 | % | | | 08/15/2044 | | | | 3,053,413 | |
6,937,034 | | Federal Home Loan Mortgage Corporation, Series 4384-A | | | 3.00 | % | | | 12/15/2040 | | | | 7,049,279 | |
28,576,317 | | Federal Home Loan Mortgage Corporation, Series 4384-ZY | | | 3.00 | % (j) | | | 09/15/2044 | | | | 30,010,420 | |
55,078,842 | | Federal Home Loan Mortgage Corporation, Series 4390-NY | | | 3.00 | % | | | 06/15/2040 | | | | 55,935,329 | |
144,829,821 | | Federal Home Loan Mortgage Corporation, Series 4390-NZ | | | 3.00 | % (j) | | | 09/15/2044 | | | | 151,814,674 | |
13,061,816 | | Federal Home Loan Mortgage Corporation, Series 4391-MA | | | 3.00 | % | | | 07/15/2040 | | | | 13,254,086 | |
28,165,477 | | Federal Home Loan Mortgage Corporation, Series 4408-PB | | | 3.00 | % | | | 04/15/2044 | | | | 29,140,161 | |
38,300,975 | | Federal Home Loan Mortgage Corporation, Series 4427-CE | | | 3.00 | % | | | 02/15/2034 | | | | 40,269,646 | |
28,263,641 | | Federal Home Loan Mortgage Corporation, Series 4427-MA | | | 3.00 | % | | | 02/15/2034 | | | | 29,891,022 | |
15,352,355 | | Federal Home Loan Mortgage Corporation, Series 4427-PS (-1 x 1 Month LIBOR USD + 5.60%, 5.60% Cap) | | | 5.49 | % (f)(i) | | | 07/15/2044 | | | | 1,711,740 | |
18,985,241 | | Federal Home Loan Mortgage Corporation, Series 4429-HA | | | 3.00 | % | | | 04/15/2034 | | | | 19,513,870 | |
27,598,639 | | Federal Home Loan Mortgage Corporation, Series 4434-LZ | | | 3.00 | % (j) | | | 02/15/2045 | | | | 29,083,443 | |
3,993,442 | | Federal Home Loan Mortgage Corporation, Series 4438-B | | | 3.00 | % | | | 10/15/2043 | | | | 4,121,655 | |
10,319,491 | | Federal Home Loan Mortgage Corporation, Series 4441-VZ | | | 3.00 | % (j) | | | 02/15/2045 | | | | 10,888,541 | |
17,108,123 | | Federal Home Loan Mortgage Corporation, Series 4444-CH | | | 3.00 | % | | | 01/15/2041 | | | | 17,405,278 | |
29,998,521 | | Federal Home Loan Mortgage Corporation, Series 4444-CZ | | | 3.00 | % (j) | | | 02/15/2045 | | | | 31,467,519 | |
14,170,897 | | Federal Home Loan Mortgage Corporation, Series 4447-A | | | 3.00 | % | | | 06/15/2041 | | | | 14,399,771 | |
29,227,063 | | Federal Home Loan Mortgage Corporation, Series 4447-YZ | | | 4.00 | % (j) | | | 08/15/2043 | | | | 32,456,367 | |
8,977,114 | | Federal Home Loan Mortgage Corporation, Series 4450-JZ | | | 3.00 | % (j) | | | 03/15/2045 | | | | 9,249,373 | |
9,207,847 | | Federal Home Loan Mortgage Corporation, Series 4462-ZA | | | 3.00 | % (j) | | | 04/15/2045 | | | | 9,685,588 | |
53,728,360 | | Federal Home Loan Mortgage Corporation, Series 4463-ZC | | | 3.00 | % (j) | | | 04/15/2045 | | | | 56,484,099 | |
29,849,089 | | Federal Home Loan Mortgage Corporation, Series 4467-ZA | | | 3.00 | % (j) | | | 04/15/2045 | | | | 31,248,498 | |
52,225,751 | | Federal Home Loan Mortgage Corporation, Series 4471-BA | | | 3.00 | % | | | 12/15/2041 | | | | 53,849,042 | |
45,413,187 | | Federal Home Loan Mortgage Corporation, Series 4471-BC | | | 3.00 | % | | | 12/15/2041 | | | | 46,864,870 | |
69,407,655 | | Federal Home Loan Mortgage Corporation, Series 4471-GA | | | 3.00 | % | | | 02/15/2044 | | | | 72,808,602 | |
20,490,910 | | Federal Home Loan Mortgage Corporation, Series 4481-B | | | 3.00 | % | | | 12/15/2042 | | | | 21,001,703 | |
105,744,273 | | Federal Home Loan Mortgage Corporation, Series 4483-CA | | | 3.00 | % | | | 06/15/2044 | | | | 110,918,689 | |
53,009,723 | | Federal Home Loan Mortgage Corporation, Series 4483-PA | | | 2.50 | % | | | 06/15/2045 | | | | 55,251,387 | |
9,752,135 | | Federal Home Loan Mortgage Corporation, Series 4492-GZ | | | 3.50 | % (j) | �� | | 07/15/2045 | | | | 10,123,669 | |
9,807,702 | | Federal Home Loan Mortgage Corporation, Series 4498-PD | | | 2.50 | % | | | 08/15/2042 | | | | 9,990,619 | |
10,963,017 | | Federal Home Loan Mortgage Corporation, Series 4499-AB | | | 3.00 | % | | | 06/15/2042 | | | | 11,230,901 | |
23,215,818 | | Federal Home Loan Mortgage Corporation, Series 4504-CA | | | 3.00 | % | | | 04/15/2044 | | | | 24,300,215 | |
71,999,371 | | Federal Home Loan Mortgage Corporation, Series 4527-CA | | | 3.00 | % | | | 02/15/2044 | | | | 75,191,838 | |
33,510,414 | | Federal Home Loan Mortgage Corporation, Series 4527-GA | | | 3.00 | % | | | 02/15/2044 | | | | 35,296,894 | |
73,560,799 | | Federal Home Loan Mortgage Corporation, Series 4533-AB | | | 3.00 | % | | | 06/15/2044 | | | | 75,426,272 | |
67,872,870 | | Federal Home Loan Mortgage Corporation, Series 4543-HG | | | 2.70 | % | | | 04/15/2044 | | | | 71,107,949 | |
104,424,914 | | Federal Home Loan Mortgage Corporation, Series 4573-CA | | | 3.00 | % | | | 11/15/2044 | | | | 107,344,613 | |
24,847,049 | | Federal Home Loan Mortgage Corporation, Series 4573-DA | | | 3.00 | % | | | 03/15/2045 | | | | 25,570,814 | |
72,009,259 | | Federal Home Loan Mortgage Corporation, Series 4582-HA | | | 3.00 | % | | | 09/15/2045 | | | | 75,896,455 | |
28,453,112 | | Federal Home Loan Mortgage Corporation, Series 4588-DA | | | 3.00 | % | | | 02/15/2044 | | | | 29,479,239 | |
25,465,179 | | Federal Home Loan Mortgage Corporation, Series 4629-KA | | | 3.00 | % | | | 03/15/2045 | | | | 26,041,364 | |
3,671,482 | | Federal Home Loan Mortgage Corporation, Series 4738-LA | | | 3.00 | % | | | 11/15/2043 | | | | 3,681,929 | |
17,800,243 | | Federal Home Loan Mortgage Corporation, Series 4744-KA | | | 3.00 | % | | | 08/15/2046 | | | | 18,534,917 | |
23,433,306 | | Federal Home Loan Mortgage Corporation, Series 4750-PA | | | 3.00 | % | | | 07/15/2046 | | | | 24,251,252 | |
36,149,319 | | Federal Home Loan Mortgage Corporation, Series 4752-PL | | | 3.00 | % | | | 09/15/2046 | | | | 37,685,821 | |
5,537,215 | | Federal Home Loan Mortgage Corporation, Series 4763-QA | | | 3.00 | % | | | 06/15/2043 | | | | 5,555,017 | |
15,286,182 | | Federal Home Loan Mortgage Corporation, Series 4766-JA | | | 3.00 | % | | | 07/15/2044 | | | | 15,511,484 | |
3,382,110 | | Federal Home Loan Mortgage Corporation, Series 4778-NA | | | 4.50 | % | | | 06/15/2044 | | | | 3,399,732 | |
11,288,258 | | Federal Home Loan Mortgage Corporation, Series 4791-IO | | | 3.00 | % (f) | | | 05/15/2048 | | | | 1,282,596 | |
85,175,114 | | Federal Home Loan Mortgage Corporation, Series 4791-JT | | | 3.00 | % | | | 05/15/2048 | | | | 89,128,568 | |
10,033,390 | | Federal Home Loan Mortgage Corporation, Series 4791-LI | | | 3.00 | % (f) | | | 05/15/2048 | | | | 597,187 | |
10,033,390 | | Federal Home Loan Mortgage Corporation, Series 4791-LO | | | 0.00 | % (g) | | | 05/15/2048 | | | | 8,682,220 | |
36,413,736 | | Federal Home Loan Mortgage Corporation, Series 4791-PO | | | 0.00 | % (g) | | | 05/15/2048 | | | | 31,315,383 | |
32,023,138 | | Federal Home Loan Mortgage Corporation, Series 4792-A | | | 3.00 | % | | | 05/15/2048 | | | | 33,490,489 | |
18,120,403 | | Federal Home Loan Mortgage Corporation, Series 4793-C | | | 3.00 | % | | | 06/15/2048 | | | | 19,052,886 | |
17,478,201 | | Federal Home Loan Mortgage Corporation, Series 4795-AO | | | 0.00 | % (g) | | | 05/15/2048 | | | | 15,844,248 | |
28,723,469 | | Federal Home Loan Mortgage Corporation, Series 4800-MZ | | | 4.00 | % (j) | | | 06/15/2048 | | | | 30,865,378 | |
14,501,863 | | Federal Home Loan Mortgage Corporation, Series 4801-OG | | | 0.00 | % (g) | | | 06/15/2048 | | | | 12,495,745 | |
4,163,600 | | Federal Home Loan Mortgage Corporation, Series 4868-Z | | | 4.00 | % (j) | | | 03/15/2049 | | | | 4,471,041 | |
20,424,005 | | Federal Home Loan Mortgage Corporation, Series 4901-BD | | | 3.00 | % | | | 07/25/2049 | | | | 21,686,441 | |
48,003,883 | | Federal Home Loan Mortgage Corporation, Series 4924-ST (-1 x 1 Month LIBOR USD + 6.00%, 6.00% Cap) | | | 5.89 | % (f)(i) | | | 08/25/2048 | | | | 9,431,145 | |
18,215,657 | | Federal Home Loan Mortgage Corporation, Series -5004-LS (-1 x 1 Month LIBOR USD + 6.15%, 6.15% Cap) | | | 6.04 | % (f)(i) | | | 07/25/2050 | | | | 4,334,966 | |
33,303,756 | | Federal Home Loan Mortgage Corporation, Series -5092-GT | | | 1.25 | % | | | 12/25/2038 | | | | 33,413,034 | |
95,000,000 | | Federal Home Loan Mortgage Corporation, Series K-1517-A2 | | | 1.72 | % | | | 07/25/2035 | | | | 88,604,021 | |
39,601,883 | | Federal Home Loan Mortgage Corporation, Series R003-ZA | | | 5.50 | % | | | 10/15/2035 | | | | 45,784,699 | |
800,000,000 | | Federal National Mortgage Association, TBA | | | 2.00 | % (m) | | | 05/15/2050 | | | | 797,093,760 | |
150,000,000 | | Federal National Mortgage Association, TBA | | | 1.50 | % (m) | | | 09/25/2050 | | | | 144,673,830 | |
505,000,000 | | Federal National Mortgage Association, TBA | | | 2.50 | % (m) | | | 05/15/2051 | | | | 517,171,293 | |
5,706,069 | | Federal National Mortgage Association Pass-Thru, Pool 555743 | | | 5.00 | % | | | 09/01/2033 | | | | 6,581,210 | |
4,278,211 | | Federal National Mortgage Association Pass-Thru, Pool 735382 | | | 5.00 | % | | | 04/01/2035 | | | | 4,972,068 | |
6,928,157 | | Federal National Mortgage Association Pass-Thru, Pool 735402 | | | 5.00 | % | | | 04/01/2035 | | | | 8,047,069 | |
4,743,083 | | Federal National Mortgage Association Pass-Thru, Pool 735484 | | | 5.00 | % | | | 05/01/2035 | | | | 5,509,868 | |
1,917,005 | | Federal National Mortgage Association Pass-Thru, Pool 735667 | | | 5.00 | % | | | 07/01/2035 | | | | 2,220,120 | |
1,591,960 | | Federal National Mortgage Association Pass-Thru, Pool 735893 | | | 5.00 | % | | | 10/01/2035 | | | | 1,852,203 | |
3,875,908 | | Federal National Mortgage Association Pass-Thru, Pool 745275 | | | 5.00 | % | | | 02/01/2036 | | | | 4,512,417 | |
160,912 | | Federal National Mortgage Association Pass-Thru, Pool 888695 | | | 5.00 | % | | | 08/01/2037 | | | | 187,025 | |
951,703 | | Federal National Mortgage Association Pass-Thru, Pool 888968 | | | 5.00 | % | | | 08/01/2035 | | | | 1,106,198 | |
7,749,111 | | Federal National Mortgage Association Pass-Thru, Pool 890549 | | | 4.00 | % | | | 11/01/2043 | | | | 8,583,859 | |
8,895,726 | | Federal National Mortgage Association Pass-Thru, Pool 890565 | | | 3.00 | % | | | 11/01/2043 | | | | 9,455,001 | |
552,709 | | Federal National Mortgage Association Pass-Thru, Pool 931104 | | | 5.00 | % | | | 05/01/2039 | | | | 608,163 | |
125,966 | | Federal National Mortgage Association Pass-Thru, Pool 975116 | | | 5.00 | % | | | 05/01/2038 | | | | 146,692 | |
1,085,448 | | Federal National Mortgage Association Pass-Thru, Pool 986864 | | | 6.50 | % | | | 08/01/2038 | | | | 1,308,769 | |
717,546 | | Federal National Mortgage Association Pass-Thru, Pool 987316 | | | 6.50 | % | | | 09/01/2038 | | | | 854,758 | |
7,638,247 | | Federal National Mortgage Association Pass-Thru, Pool 995203 | | | 5.00 | % | | | 07/01/2035 | | | | 8,857,460 | |
12,671,913 | | Federal National Mortgage Association Pass-Thru, Pool 995849 | | | 5.00 | % | | | 08/01/2036 | | | | 14,723,887 | |
10,863,518 | | Federal National Mortgage Association Pass-Thru, Pool AB2123 | | | 4.00 | % | | | 01/01/2031 | | | | 11,764,524 | |
179,283 | | Federal National Mortgage Association Pass-Thru, Pool AB2370 | | | 4.50 | % | | | 09/01/2035 | | | | 192,048 | |
865,968 | | Federal National Mortgage Association Pass-Thru, Pool AB3713 | | | 4.00 | % | | | 10/01/2031 | | | | 937,240 | |
5,472,407 | | Federal National Mortgage Association Pass-Thru, Pool AB3796 | | | 3.50 | % | | | 11/01/2031 | | | | 5,916,421 | |
1,330,855 | | Federal National Mortgage Association Pass-Thru, Pool AB3850 | | | 4.00 | % | | | 11/01/2041 | | | | 1,405,205 | |
3,286,973 | | Federal National Mortgage Association Pass-Thru, Pool AB3923 | | | 4.00 | % | | | 11/01/2041 | | | | 3,479,469 | |
19,908,348 | | Federal National Mortgage Association Pass-Thru, Pool AB4167 | | | 3.50 | % | | | 01/01/2032 | | | | 21,551,772 | |
18,079,814 | | Federal National Mortgage Association Pass-Thru, Pool AB4261 | | | 3.50 | % | | | 01/01/2032 | | | | 19,344,411 | |
2,863,100 | | Federal National Mortgage Association Pass-Thru, Pool AB5084 | | | 3.50 | % | | | 05/01/2032 | | | | 3,043,677 | |
6,272,746 | | Federal National Mortgage Association Pass-Thru, Pool AB5156 | | | 3.50 | % | | | 05/01/2032 | | | | 6,693,550 | |
10,660,165 | | Federal National Mortgage Association Pass-Thru, Pool AB5212 | | | 3.50 | % | | | 05/01/2032 | | | | 11,378,846 | |
5,501,208 | | Federal National Mortgage Association Pass-Thru, Pool AB5243 | | | 4.00 | % | | | 05/01/2042 | | | | 5,826,036 | |
16,446,454 | | Federal National Mortgage Association Pass-Thru, Pool AB5911 | | | 3.00 | % | | | 08/01/2032 | | | | 17,336,579 | |
5,263,365 | | Federal National Mortgage Association Pass-Thru, Pool AB6280 | | | 3.00 | % | | | 09/01/2042 | | | | 5,591,461 | |
7,126,637 | | Federal National Mortgage Association Pass-Thru, Pool AB6349 | | | 3.00 | % | | | 10/01/2032 | | | | 7,515,204 | |
20,913,276 | | Federal National Mortgage Association Pass-Thru, Pool AB6750 | | | 3.00 | % | | | 10/01/2032 | | | | 22,044,938 | |
10,028,535 | | Federal National Mortgage Association Pass-Thru, Pool AB6751 | | | 3.00 | % | | | 10/01/2032 | | | | 10,534,416 | |
57,000,550 | | Federal National Mortgage Association Pass-Thru, Pool AB6854 | | | 3.00 | % | | | 11/01/2042 | | | | 60,320,100 | |
42,619,206 | | Federal National Mortgage Association Pass-Thru, Pool AB7077 | | | 3.00 | % | | | 11/01/2042 | | | | 45,099,825 | |
34,314,189 | | Federal National Mortgage Association Pass-Thru, Pool AB7344 | | | 3.00 | % | | | 12/01/2032 | | | | 36,173,634 | |
18,643,122 | | Federal National Mortgage Association Pass-Thru, Pool AB7776 | | | 3.00 | % | | | 02/01/2043 | | | | 19,785,331 | |
22,734,965 | | Federal National Mortgage Association Pass-Thru, Pool AB7877 | | | 3.00 | % | | | 02/01/2043 | | | | 24,264,721 | |
9,527,627 | | Federal National Mortgage Association Pass-Thru, Pool AB8418 | | | 3.00 | % | | | 02/01/2033 | | | | 10,050,147 | |
13,299,662 | | Federal National Mortgage Association Pass-Thru, Pool AB8520 | | | 3.00 | % | | | 02/01/2033 | | | | 14,028,768 | |
17,103,071 | | Federal National Mortgage Association Pass-Thru, Pool AB8703 | | | 3.00 | % | | | 03/01/2038 | | | | 17,990,756 | |
7,478,097 | | Federal National Mortgage Association Pass-Thru, Pool AB8858 | | | 3.00 | % | | | 04/01/2033 | | | | 7,886,077 | |
14,314,137 | | Federal National Mortgage Association Pass-Thru, Pool AB9020 | | | 3.00 | % | | | 04/01/2038 | | | | 15,054,074 | |
12,073,894 | | Federal National Mortgage Association Pass-Thru, Pool AB9197 | | | 3.00 | % | | | 05/01/2033 | | | | 12,735,897 | |
37,400,453 | | Federal National Mortgage Association Pass-Thru, Pool AB9406 | | | 3.00 | % | | | 05/01/2033 | | | | 39,451,263 | |
6,663,582 | | Federal National Mortgage Association Pass-Thru, Pool AB9409 | | | 3.00 | % | | | 05/01/2033 | | | | 7,027,021 | |
452,918 | | Federal National Mortgage Association Pass-Thru, Pool AD2177 | | | 4.50 | % | | | 06/01/2030 | | | | 493,685 | |
560,314 | | Federal National Mortgage Association Pass-Thru, Pool AD6438 | | | 5.00 | % | | | 06/01/2040 | | | | 646,558 | |
411,680 | | Federal National Mortgage Association Pass-Thru, Pool AD7859 | | | 5.00 | % | | | 06/01/2040 | | | | 476,428 | |
4,732,153 | | Federal National Mortgage Association Pass-Thru, Pool AH0607 | | | 4.00 | % | | | 12/01/2040 | | | | 5,241,425 | |
467,115 | | Federal National Mortgage Association Pass-Thru, Pool AH1140 | | | 4.50 | % | | | 12/01/2040 | | | | 503,196 | |
3,544,188 | | Federal National Mortgage Association Pass-Thru, Pool AH4437 | | | 4.00 | % | | | 01/01/2041 | | | | 3,741,317 | |
1,326,658 | | Federal National Mortgage Association Pass-Thru, Pool AH7309 | | | 4.00 | % | | | 02/01/2031 | | | | 1,435,977 | |
3,315,531 | | Federal National Mortgage Association Pass-Thru, Pool AH9323 | | | 4.00 | % | | | 04/01/2026 | | | | 3,538,282 | |
523,863 | | Federal National Mortgage Association Pass-Thru, Pool AI9831 | | | 4.00 | % | | | 09/01/2041 | | | | 552,657 | |
859,010 | | Federal National Mortgage Association Pass-Thru, Pool AJ1265 | | | 4.00 | % | | | 09/01/2041 | | | | 931,801 | |
820,332 | | Federal National Mortgage Association Pass-Thru, Pool AJ1399 | | | 4.00 | % | | | 09/01/2041 | | | | 866,256 | |
2,266,011 | | Federal National Mortgage Association Pass-Thru, Pool AJ1467 | | | 4.00 | % | | | 10/01/2041 | | | | 2,395,817 | |
2,251,396 | | Federal National Mortgage Association Pass-Thru, Pool AJ3392 | | | 4.00 | % | | | 10/01/2041 | | | | 2,379,566 | |
1,180,128 | | Federal National Mortgage Association Pass-Thru, Pool AJ3854 | | | 4.00 | % | | | 10/01/2041 | | | | 1,249,357 | |
11,049,615 | | Federal National Mortgage Association Pass-Thru, Pool AJ4118 | | | 4.00 | % | | | 11/01/2041 | | | | 11,698,761 | |
1,992,182 | | Federal National Mortgage Association Pass-Thru, Pool AJ4131 | | | 4.00 | % | | | 10/01/2041 | | | | 2,102,887 | |
1,133,712 | | Federal National Mortgage Association Pass-Thru, Pool AJ5172 | | | 4.00 | % | | | 11/01/2041 | | | | 1,199,766 | |
14,476,114 | | Federal National Mortgage Association Pass-Thru, Pool AJ5322 | | | 4.00 | % | | | 11/01/2041 | | | | 15,932,618 | |
6,526,901 | | Federal National Mortgage Association Pass-Thru, Pool AJ7677 | | | 3.50 | % | | | 12/01/2041 | | | | 6,816,811 | |
1,657,621 | | Federal National Mortgage Association Pass-Thru, Pool AJ8334 | | | 4.00 | % | | | 12/01/2041 | | | | 1,754,974 | |
17,433,605 | | Federal National Mortgage Association Pass-Thru, Pool AK0713 | | | 3.50 | % | | | 01/01/2032 | | | | 18,608,507 | |
3,063,570 | | Federal National Mortgage Association Pass-Thru, Pool AK4039 | | | 4.00 | % | | | 02/01/2042 | | | | 3,234,111 | |
3,682,555 | | Federal National Mortgage Association Pass-Thru, Pool AK4763 | | | 4.00 | % | | | 02/01/2042 | | | | 3,892,561 | |
3,049,391 | | Federal National Mortgage Association Pass-Thru, Pool AK9438 | | | 4.00 | % | | | 03/01/2042 | | | | 3,221,450 | |
3,592,996 | | Federal National Mortgage Association Pass-Thru, Pool AK9439 | | | 4.00 | % | | | 03/01/2042 | | | | 3,795,967 | |
568,173 | | Federal National Mortgage Association Pass-Thru, Pool AK9446 | | | 4.50 | % | | | 03/01/2042 | | | | 625,396 | |
80,161,618 | | Federal National Mortgage Association Pass-Thru, Pool AL3699 | | | 3.00 | % | | | 06/01/2043 | | | | 85,549,852 | |
40,208,363 | | Federal National Mortgage Association Pass-Thru, Pool AL3883 | | | 3.00 | % | | | 07/01/2043 | | | | 42,909,521 | |
1,501,988 | | Federal National Mortgage Association Pass-Thru, Pool AL4292 | | | 4.50 | % | | | 04/01/2026 | | | | 1,594,032 | |
6,786,398 | | Federal National Mortgage Association Pass-Thru, Pool AL4312 | | | 4.00 | % | | | 10/01/2043 | | | | 7,517,568 | |
15,382,293 | | Federal National Mortgage Association Pass-Thru, Pool AL6075 | | | 3.50 | % | | | 09/01/2053 | | | | 16,027,803 | |
23,780,168 | | Federal National Mortgage Association Pass-Thru, Pool AL6076 | | | 3.00 | % | | | 06/01/2053 | | | | 24,409,068 | |
43,156,769 | | Federal National Mortgage Association Pass-Thru, Pool AL6141 | | | 4.00 | % | | | 04/01/2042 | | | | 47,494,613 | |
36,925,632 | | Federal National Mortgage Association Pass-Thru, Pool AL6325 | | | 3.00 | % | | | 10/01/2044 | | | | 39,240,101 | |
13,735,880 | | Federal National Mortgage Association Pass-Thru, Pool AL6486 | | | 4.50 | % | | | 02/01/2045 | | | | 15,336,701 | |
39,277,804 | | Federal National Mortgage Association Pass-Thru, Pool AL6538 | | | 4.50 | % | | | 06/01/2044 | | | | 44,074,890 | |
36,009,494 | | Federal National Mortgage Association Pass-Thru, Pool AL8304 | | | 3.50 | % | | | 03/01/2046 | | | | 38,767,724 | |
13,009,579 | | Federal National Mortgage Association Pass-Thru, Pool AO2980 | | | 4.00 | % | | | 05/01/2042 | | | | 13,744,148 | |
23,487,887 | | Federal National Mortgage Association Pass-Thru, Pool AP4787 | | | 3.50 | % | | | 09/01/2042 | | | | 24,530,890 | |
26,892,798 | | Federal National Mortgage Association Pass-Thru, Pool AP4789 | | | 3.50 | % | | | 09/01/2042 | | | | 28,085,608 | |
8,887,336 | | Federal National Mortgage Association Pass-Thru, Pool AQ5541 | | | 3.00 | % | | | 12/01/2042 | | | | 9,403,440 | |
11,051,458 | | Federal National Mortgage Association Pass-Thru, Pool AR9856 | | | 3.00 | % | | | 04/01/2043 | | | | 11,706,498 | |
13,281,938 | | Federal National Mortgage Association Pass-Thru, Pool AS1927 | | | 4.50 | % | | | 03/01/2044 | | | | 14,868,784 | |
12,565,016 | | Federal National Mortgage Association Pass-Thru, Pool AS2038 | | | 4.50 | % | | | 03/01/2044 | | | | 14,146,038 | |
8,753,788 | | Federal National Mortgage Association Pass-Thru, Pool AS2517 | | | 4.50 | % | | | 05/01/2044 | | | | 9,686,918 | |
4,229,546 | | Federal National Mortgage Association Pass-Thru, Pool AS2551 | | | 4.50 | % | | | 06/01/2044 | | | | 4,721,702 | |
3,936,099 | | Federal National Mortgage Association Pass-Thru, Pool AS2765 | | | 4.50 | % | | | 07/01/2044 | | | | 4,352,894 | |
18,561,091 | | Federal National Mortgage Association Pass-Thru, Pool AS3201 | | | 3.00 | % | | | 08/01/2034 | | | | 19,574,231 | |
8,956,452 | | Federal National Mortgage Association Pass-Thru, Pool AS3456 | | | 3.00 | % | | | 10/01/2034 | | | | 9,439,710 | |
14,492,047 | | Federal National Mortgage Association Pass-Thru, Pool AS3666 | | | 3.00 | % | | | 10/01/2034 | | | | 15,275,095 | |
57,911,228 | | Federal National Mortgage Association Pass-Thru, Pool AS3961 | | | 3.00 | % | | | 12/01/2044 | | | | 60,754,458 | |
20,150,365 | | Federal National Mortgage Association Pass-Thru, Pool AS4154 | | | 3.00 | % | | | 12/01/2044 | | | | 21,228,414 | |
13,746,179 | | Federal National Mortgage Association Pass-Thru, Pool AS4212 | | | 3.00 | % | | | 01/01/2035 | | | | 14,487,786 | |
18,538,741 | | Federal National Mortgage Association Pass-Thru, Pool AS4281 | | | 3.00 | % | | | 01/01/2035 | | | | 19,432,135 | |
16,941,651 | | Federal National Mortgage Association Pass-Thru, Pool AS4345 | | | 3.50 | % | | | 01/01/2045 | | | | 18,268,245 | |
18,076,447 | | Federal National Mortgage Association Pass-Thru, Pool AS4360 | | | 3.00 | % | | | 01/01/2035 | | | | 19,061,577 | |
121,865,721 | | Federal National Mortgage Association Pass-Thru, Pool AS4625 | | | 3.00 | % | | | 03/01/2045 | | | | 127,847,711 | |
50,015,774 | | Federal National Mortgage Association Pass-Thru, Pool AS4645 | | | 3.00 | % | | | 03/01/2045 | | | | 52,472,293 | |
21,505,464 | | Federal National Mortgage Association Pass-Thru, Pool AS4779 | | | 3.00 | % | | | 04/01/2035 | | | | 22,665,658 | |
17,555,026 | | Federal National Mortgage Association Pass-Thru, Pool AS4780 | | | 3.00 | % | | | 04/01/2035 | | | | 18,502,106 | |
21,681,665 | | Federal National Mortgage Association Pass-Thru, Pool AS4840 | | | 3.00 | % | | | 04/01/2035 | | | | 22,728,117 | |
13,390,190 | | Federal National Mortgage Association Pass-Thru, Pool AS4881 | | | 3.00 | % | | | 05/01/2035 | | | | 14,113,050 | |
14,535,683 | | Federal National Mortgage Association Pass-Thru, Pool AS4882 | | | 3.00 | % | | | 05/01/2035 | | | | 15,319,729 | |
25,170,930 | | Federal National Mortgage Association Pass-Thru, Pool AX9696 | | | 3.00 | % | | | 07/01/2045 | | | | 25,922,195 | |
29,418,366 | | Federal National Mortgage Association Pass-Thru, Pool AY3974 | | | 3.00 | % | | | 03/01/2045 | | | | 30,863,150 | |
7,867,679 | | Federal National Mortgage Association Pass-Thru, Pool AY4295 | | | 3.00 | % | | | 02/01/2045 | | | | 8,101,987 | |
1,820,141 | | Federal National Mortgage Association Pass-Thru, Pool AY4296 | | | 3.00 | % | | | 01/01/2045 | | | | 1,874,292 | |
5,951,815 | | Federal National Mortgage Association Pass-Thru, Pool AY5471 | | | 3.00 | % | | | 03/01/2045 | | | | 6,129,105 | |
14,229,485 | | Federal National Mortgage Association Pass-Thru, Pool BC0785 | | | 3.50 | % | | | 04/01/2046 | | | | 15,359,125 | |
27,812,203 | | Federal National Mortgage Association Pass-Thru, Pool BC9003 | | | 3.00 | % | | | 11/01/2046 | | | | 29,408,985 | |
1,308,081 | | Federal National Mortgage Association Pass-Thru, Pool MA0264 | | | 4.50 | % | | | 12/01/2029 | | | | 1,436,259 | |
5,070,179 | | Federal National Mortgage Association Pass-Thru, Pool MA0353 | | | 4.50 | % | | | 03/01/2030 | | | | 5,567,228 | |
1,088,482 | | Federal National Mortgage Association Pass-Thru, Pool MA0406 | | | 4.50 | % | | | 05/01/2030 | | | | 1,195,212 | |
83,628 | | Federal National Mortgage Association Pass-Thru, Pool MA0445 | | | 5.00 | % | | | 06/01/2040 | | | | 91,006 | |
147,259 | | Federal National Mortgage Association Pass-Thru, Pool MA0468 | | | 5.00 | % | | | 07/01/2040 | | | | 160,222 | |
1,557,525 | | Federal National Mortgage Association Pass-Thru, Pool MA0534 | | | 4.00 | % | | | 10/01/2030 | | | | 1,686,551 | |
348,197 | | Federal National Mortgage Association Pass-Thru, Pool MA0587 | | | 4.00 | % | | | 12/01/2030 | | | | 377,061 | |
8,724,800 | | Federal National Mortgage Association Pass-Thru, Pool MA0616 | | | 4.00 | % | | | 01/01/2031 | | | | 9,448,088 | |
2,541,017 | | Federal National Mortgage Association Pass-Thru, Pool MA0896 | | | 4.00 | % | | | 11/01/2041 | | | | 2,682,850 | |
65,457,678 | | Federal National Mortgage Association Pass-Thru, Pool MA0919 | | | 3.50 | % | | | 12/01/2031 | | | | 70,035,491 | |
27,491,601 | | Federal National Mortgage Association Pass-Thru, Pool MA0949 | | | 3.50 | % | | | 01/01/2032 | | | | 29,414,269 | |
33,363,480 | | Federal National Mortgage Association Pass-Thru, Pool MA0976 | | | 3.50 | % | | | 02/01/2032 | | | | 35,701,738 | |
16,608,443 | | Federal National Mortgage Association Pass-Thru, Pool MA1010 | | | 3.50 | % | | | 03/01/2032 | | | | 17,889,297 | |
4,001,672 | | Federal National Mortgage Association Pass-Thru, Pool MA1039 | | | 3.50 | % | | | 04/01/2042 | | | | 4,184,226 | |
22,525,271 | | Federal National Mortgage Association Pass-Thru, Pool MA1059 | | | 3.50 | % | | | 05/01/2032 | | | | 24,104,271 | |
2,344,928 | | Federal National Mortgage Association Pass-Thru, Pool MA1068 | | | 3.50 | % | | | 05/01/2042 | | | | 2,448,982 | |
47,953,121 | | Federal National Mortgage Association Pass-Thru, Pool MA1084 | | | 3.50 | % | | | 06/01/2032 | | | | 51,490,789 | |
5,944,994 | | Federal National Mortgage Association Pass-Thru, Pool MA1093 | | | 3.50 | % | | | 06/01/2042 | | | | 6,214,663 | |
4,293,927 | | Federal National Mortgage Association Pass-Thru, Pool MA1094 | | | 4.00 | % | | | 06/01/2042 | | | | 4,535,785 | |
29,923,582 | | Federal National Mortgage Association Pass-Thru, Pool MA1107 | | | 3.50 | % | | | 07/01/2032 | | | | 32,021,651 | |
59,365,450 | | Federal National Mortgage Association Pass-Thru, Pool MA1117 | | | 3.50 | % | | | 07/01/2042 | | | | 62,060,937 | |
65,000,730 | | Federal National Mortgage Association Pass-Thru, Pool MA1136 | | | 3.50 | % | | | 08/01/2042 | | | | 67,909,387 | |
20,208,045 | | Federal National Mortgage Association Pass-Thru, Pool MA1138 | | | 3.50 | % | | | 08/01/2032 | | | | 21,847,477 | |
16,266,945 | | Federal National Mortgage Association Pass-Thru, Pool MA1179 | | | 3.50 | % | | | 09/01/2042 | | | | 16,995,391 | |
3,889,839 | | Federal National Mortgage Association Pass-Thru, Pool MA1201 | | | 3.50 | % | | | 10/01/2032 | | | | 4,205,455 | |
32,740,504 | | Federal National Mortgage Association Pass-Thru, Pool MA1209 | | | 3.50 | % | | | 10/01/2042 | | | | 34,207,366 | |
25,715,097 | | Federal National Mortgage Association Pass-Thru, Pool MA1237 | | | 3.00 | % | | | 11/01/2032 | | | | 26,936,321 | |
2,733,392 | | Federal National Mortgage Association Pass-Thru, Pool MA1242 | | | 3.50 | % | | | 11/01/2042 | | | | 2,860,002 | |
14,480,817 | | Federal National Mortgage Association Pass-Thru, Pool MA1338 | | | 3.00 | % | | | 02/01/2033 | | | | 15,274,825 | |
57,201,963 | | Federal National Mortgage Association Pass-Thru, Pool MA1366 | | | 3.00 | % | | | 03/01/2033 | | | | 59,884,400 | |
35,367,718 | | Federal National Mortgage Association Pass-Thru, Pool MA1401 | | | 3.00 | % | | | 04/01/2033 | | | | 37,307,434 | |
61,307,010 | | Federal National Mortgage Association Pass-Thru, Pool MA1459 | | | 3.00 | % | | | 06/01/2033 | | | | 64,443,165 | |
7,795,216 | | Federal National Mortgage Association Pass-Thru, Pool MA1490 | | | 3.00 | % | | | 07/01/2033 | | | | 8,222,825 | |
39,896,877 | | Federal National Mortgage Association Pass-Thru, Pool MA2018 | | | 3.50 | % | | | 09/01/2034 | | | | 43,118,865 | |
10,743,198 | | Federal National Mortgage Association Pass-Thru, Pool MA2114 | | | 3.50 | % | | | 12/01/2044 | | | | 11,218,330 | |
8,289,831 | | Federal National Mortgage Association Pass-Thru, Pool MA2151 | | | 3.50 | % | | | 01/01/2045 | | | | 8,656,388 | |
23,462,192 | | Federal National Mortgage Association Pass-Thru, Pool MA2164 | | | 3.50 | % | | | 02/01/2035 | | | | 25,199,690 | |
26,688,463 | | Federal National Mortgage Association Pass-Thru, Pool MA2166 | | | 3.50 | % | | | 02/01/2045 | | | | 27,867,512 | |
25,551,612 | | Federal National Mortgage Association Pass-Thru, Pool MA2248 | | | 3.00 | % | | | 04/01/2045 | | | | 26,311,653 | |
33,094,034 | | Federal National Mortgage Association Pass-Thru, Pool MA2270 | | | 3.00 | % | | | 05/01/2045 | | | | 34,079,281 | |
41,157,336 | | Federal National Mortgage Association Pass-Thru, Pool MA2650 | | | 3.50 | % | | | 06/01/2046 | | | | 42,931,471 | |
23,580,021 | | Federal National Mortgage Association Pass-Thru, Pool MA2833 | | | 3.00 | % | | | 12/01/2046 | | | | 24,934,449 | |
4,318,461 | | Federal National Mortgage Association Pass-Thru, Pool MA3894 | | | 4.00 | % | | | 09/01/2031 | | | | 4,725,922 | |
181,242,535 | | Federal National Mortgage Association Pool CA8933 | | | 2.00 | % | | | 02/01/2051 | | | | 181,362,763 | |
86,645,098 | | Federal National Mortgage Association Pool CA9223 | | | 2.00 | % | | | 02/01/2051 | | | | 86,705,795 | |
42,851,631 | | Federal National Mortgage Association Pool CA9417 | | | 1.50 | % | | | 03/01/2036 | | | | 43,201,850 | |
76,179,505 | | Federal National Mortgage Association Pool FM4245 | | | 2.50 | % | | | 09/01/2050 | | | | 78,269,673 | |
37,825,085 | | Federal National Mortgage Association Pool FM4347 | | | 2.50 | % | | | 09/01/2050 | | | | 38,862,907 | |
31,481,878 | | Federal National Mortgage Association Pool FM4870 | | | 2.00 | % | | | 11/01/2050 | | | | 31,473,560 | |
24,124,022 | | Federal National Mortgage Association Pool FM5021 | | | 2.00 | % | | | 11/01/2050 | | | | 24,194,241 | |
44,447,474 | | Federal National Mortgage Association Pool FM5150 | | | 2.00 | % | | | 12/01/2050 | | | | 44,476,914 | |
29,246,040 | | Federal National Mortgage Association Pool FM5151 | | | 2.00 | % | | | 12/01/2050 | | | | 29,238,312 | |
11,161,515 | | Federal National Mortgage Association Pool FM6277 | | | 1.50 | % | | | 02/01/2036 | | | | 11,256,874 | |
18,524,444 | | Federal National Mortgage Association Pool FM6278 | | | 1.50 | % | | | 02/01/2036 | | | | 18,659,718 | |
428,013,509 | | Federal National Mortgage Association Pool MA4237 | | | 2.00 | % | | | 01/01/2051 | | | | 427,640,260 | |
210,487,829 | | Federal National Mortgage Association Pool MA4281 | | | 2.00 | % | | | 03/01/2051 | | | | 210,302,650 | |
59,000,000 | | Federal National Mortgage Association Pool MA4340 | | | 2.00 | % | | | 04/01/2051 | | | | 58,196,666 | |
16,500,000 | | Federal National Mortgage Association, Pool 387898 | | | 3.71 | % | | | 08/01/2030 | | | | 18,669,361 | |
17,716,472 | | Federal National Mortgage Association, Pool AL9220 | | | 3.00 | % | | | 06/01/2045 | | | | 18,751,596 | |
33,127,183 | | Federal National Mortgage Association, Pool AL9445 | | | 3.00 | % | | | 07/01/2031 | | | | 35,330,199 | |
26,451,961 | | Federal National Mortgage Association, Pool AM8510 | | | 3.15 | % | | | 05/01/2035 | | | | 27,475,076 | |
30,390,585 | | Federal National Mortgage Association, Pool AM8950 | | | 3.14 | % | | | 06/01/2040 | | | | 31,973,139 | |
7,837,971 | | Federal National Mortgage Association, Pool AN0091 | | | 3.46 | % | | | 10/01/2030 | | | | 8,491,123 | |
14,371,249 | | Federal National Mortgage Association, Pool AN1210 | | | 2.85 | % | | | 05/01/2031 | | | | 15,330,889 | |
14,000,000 | | Federal National Mortgage Association, Pool AN4764 | | | 3.40 | % | | | 02/01/2029 | | | | 15,420,322 | |
5,035,799 | | Federal National Mortgage Association, Pool AN5480 | | | 3.43 | % | | | 06/01/2037 | | | | 5,447,668 | |
217,500,000 | | Federal National Mortgage Association, Pool AN6680 | | | 3.37 | % | | | 11/01/2047 | | | | 229,257,624 | |
5,500,000 | | Federal National Mortgage Association, Pool AN7330 | | | 3.26 | % | | | 12/01/2037 | | | | 6,035,933 | |
10,026,000 | | Federal National Mortgage Association, Pool AN7452 | | | 3.12 | % | | | 11/01/2032 | | | | 10,890,904 | |
13,500,000 | | Federal National Mortgage Association, Pool AN8121 | | | 3.16 | % | | | 01/01/2035 | | | | 14,497,929 | |
31,625,925 | | Federal National Mortgage Association, Pool AS7473 | | | 3.00 | % | | | 07/01/2046 | | | | 32,569,412 | |
55,630,901 | | Federal National Mortgage Association, Pool AS7661 | | | 3.00 | % | | | 08/01/2046 | | | | 57,352,658 | |
34,285,898 | | Federal National Mortgage Association, Pool AS8056 | | | 3.00 | % | | | 10/01/2046 | | | | 36,056,581 | |
44,425,933 | | Federal National Mortgage Association, Pool AS8111 | | | 3.00 | % | | | 10/01/2041 | | | | 46,464,908 | |
29,579,171 | | Federal National Mortgage Association, Pool AS8269 | | | 3.00 | % | | | 11/01/2046 | | | | 31,025,061 | |
25,751,858 | | Federal National Mortgage Association, Pool AS8306 | | | 3.00 | % | | | 11/01/2041 | | | | 26,867,475 | |
34,480,921 | | Federal National Mortgage Association, Pool AS8356 | | | 3.00 | % | | | 11/01/2046 | | | | 35,404,734 | |
11,194,611 | | Federal National Mortgage Association, Pool AZ0576 | | | 3.50 | % | | | 04/01/2042 | | | | 11,916,084 | |
11,658,014 | | Federal National Mortgage Association, Pool BC9081 | | | 3.00 | % | | | 12/01/2046 | | | | 12,375,458 | |
107,604,044 | | Federal National Mortgage Association, Pool BF0314 | | | 3.00 | % | | | 01/01/2053 | | | | 115,619,428 | |
92,218,196 | | Federal National Mortgage Association, Pool BF0353 | | | 3.00 | % | | | 05/01/2053 | | | | 99,087,990 | |
51,357,192 | | Federal National Mortgage Association, Pool BF0391 | | | 3.00 | % | | | 09/01/2053 | | | | 55,182,840 | |
24,134,380 | | Federal National Mortgage Association, Pool BK8257 | | | 1.50 | % | | | 12/01/2050 | | | | 23,127,534 | |
23,372,156 | | Federal National Mortgage Association, Pool BK8267 | | | 2.50 | % | | | 12/01/2050 | | | | 24,272,651 | |
63,578,000 | | Federal National Mortgage Association, Pool BL1276 | | | 3.79 | % | | | 01/01/2029 | | | | 70,399,488 | |
33,500,000 | | Federal National Mortgage Association, Pool BL1300 | | | 4.20 | % | | | 01/01/2029 | | | | 37,827,606 | |
20,000,000 | | Federal National Mortgage Association, Pool BL1752 | | | 3.68 | % | | | 03/01/2029 | | | | 22,065,955 | |
5,000,000 | | Federal National Mortgage Association, Pool BL2303 | | | 3.36 | % | | | 05/01/2031 | | | | 5,447,127 | |
28,950,500 | | Federal National Mortgage Association, Pool BL2643 | | | 3.39 | % | | | 07/01/2034 | | | | 31,855,630 | |
8,250,000 | | Federal National Mortgage Association, Pool BL2998 | | | 2.97 | % | | | 07/01/2029 | | | | 8,955,781 | |
41,755,800 | | Federal National Mortgage Association, Pool BL3480 | | | 2.75 | % | | | 08/01/2029 | | | | 44,691,966 | |
30,506,812 | | Federal National Mortgage Association, Pool BL3647 | | | 2.69 | % | | | 08/01/2030 | | | | 32,306,712 | |
50,173,000 | | Federal National Mortgage Association, Pool BL4008 | | | 2.37 | % | | | 10/01/2031 | | | | 51,887,576 | |
8,860,000 | | Federal National Mortgage Association, Pool BL4038 | | | 2.98 | % | | | 09/01/2034 | | | | 9,439,289 | |
27,690,000 | | Federal National Mortgage Association, Pool BL4098 | | | 2.27 | % | | | 09/01/2029 | | | | 28,759,458 | |
13,075,000 | | Federal National Mortgage Association, Pool BL4198 | | | 2.31 | % | | | 10/01/2031 | | | | 13,461,980 | |
25,800,000 | | Federal National Mortgage Association, Pool BL4214 | | | 2.37 | % | | | 10/01/2031 | | | | 26,682,070 | |
3,206,000 | | Federal National Mortgage Association, Pool BL4339 | | | 2.29 | % | | | 10/01/2031 | | | | 3,294,804 | |
6,496,000 | | Federal National Mortgage Association, Pool BL4354 | | | 2.37 | % | | | 10/01/2031 | | | | 6,715,958 | |
107,000,000 | | Federal National Mortgage Association, Pool BL4468 | | | 2.41 | % | | | 10/01/2029 | | | | 111,852,986 | |
24,380,000 | | Federal National Mortgage Association, Pool BL4656 | | | 2.29 | % | | | 10/01/2029 | | | | 25,372,415 | |
63,966,000 | | Federal National Mortgage Association, Pool BL4808 | | | 2.80 | % | | | 11/01/2039 | | | | 64,863,870 | |
75,725,000 | | Federal National Mortgage Association, Pool BL4881 | | | 2.31 | % | | | 12/01/2029 | | | | 78,875,667 | |
73,850,000 | | Federal National Mortgage Association, Pool BL4937 | | | 2.32 | % | | | 12/01/2029 | | | | 76,882,457 | |
34,160,000 | | Federal National Mortgage Association, Pool BL4938 | | | 2.32 | % | | | 12/01/2029 | | | | 35,562,691 | |
14,220,000 | | Federal National Mortgage Association, Pool BL4939 | | | 2.32 | % | | | 12/01/2029 | | | | 14,803,907 | |
65,121,000 | | Federal National Mortgage Association, Pool BL4969 | | | 2.35 | % | | | 11/01/2029 | | | | 68,005,048 | |
21,686,000 | | Federal National Mortgage Association, Pool BL5111 | | | 2.41 | % | | | 01/01/2030 | | | | 22,668,376 | |
17,125,000 | | Federal National Mortgage Association, Pool BL5256 | | | 2.28 | % | | | 02/01/2032 | | | | 17,562,538 | |
30,200,000 | | Federal National Mortgage Association, Pool BL5315 | | | 2.44 | % | | | 01/01/2032 | | | | 31,042,199 | |
8,500,000 | | Federal National Mortgage Association, Pool BL5322 | | | 2.43 | % | | | 01/01/2030 | | | | 8,880,061 | |
46,800,000 | | Federal National Mortgage Association, Pool BL5400 | | | 2.54 | % | | | 02/01/2030 | | | | 49,020,172 | |
103,889,000 | | Federal National Mortgage Association, Pool BL5401 | | | 2.54 | % | | | 02/01/2030 | | | | 108,817,451 | |
24,557,000 | | Federal National Mortgage Association, Pool BL5833 | | | 2.60 | % | | | 03/01/2030 | | | | 25,924,745 | |
8,190,000 | | Federal National Mortgage Association, Pool BL5840 | | | 2.73 | % | | | 02/01/2035 | | | | 8,525,294 | |
22,828,000 | | Federal National Mortgage Association, Pool BL5870 | | | 2.30 | % | | | 02/01/2032 | | | | 23,465,743 | |
60,000,000 | | Federal National Mortgage Association, Pool BL5953 | | | 2.15 | % | | | 03/01/2030 | | | | 61,561,628 | |
20,570,000 | | Federal National Mortgage Association, Pool BL6297 | | | 2.08 | % | | | 05/01/2030 | | | | 20,932,078 | |
6,808,784 | | Federal National Mortgage Association, Pool BL6639 | | | 2.66 | % | | | 05/01/2050 | | | | 6,906,826 | |
28,785,015 | | Federal National Mortgage Association, Pool BL6913 | | | 1.96 | % | | | 05/01/2035 | | | | 27,968,637 | |
36,488,000 | | Federal National Mortgage Association, Pool BL7110 | | | 1.76 | % | | | 07/01/2035 | | | | 34,572,169 | |
3,568,101 | | Federal National Mortgage Association, Pool BL7331 | | | 2.23 | % | | | 07/01/2040 | | | | 3,427,610 | |
20,400,000 | | Federal National Mortgage Association, Pool BL7424 | | | 1.65 | % | | | 08/01/2035 | | | | 18,982,459 | |
40,000,000 | | Federal National Mortgage Association, Pool BL8165 | | | 1.35 | % | | | 09/01/2032 | | | | 37,458,024 | |
49,000,000 | | Federal National Mortgage Association, Pool BL8177 | | | 1.10 | % | | | 09/01/2030 | | | | 45,925,701 | |
122,500,000 | | Federal National Mortgage Association, Pool BL8237 | | | 1.17 | % | | | 10/01/2030 | | | | 115,066,846 | |
32,000,000 | | Federal National Mortgage Association, Pool BL8269 | | | 1.51 | % | | | 09/01/2035 | | | | 29,449,677 | |
146,000,000 | | Federal National Mortgage Association, Pool BL8708 | | | 1.40 | % | | | 11/01/2032 | | | | 136,735,685 | |
97,000,000 | | Federal National Mortgage Association, Pool BL8977 | | | 1.20 | % | | | 11/01/2030 | | | | 91,266,660 | |
48,643,000 | | Federal National Mortgage Association, Pool BL9056 | | | 1.78 | % | | | 11/01/2035 | | | | 44,902,141 | |
13,313,000 | | Federal National Mortgage Association, Pool BL9362 | | | 1.54 | % | | | 11/01/2030 | | | | 12,844,555 | |
34,735,000 | | Federal National Mortgage Association, Pool BL9367 | | | 1.41 | % | | | 12/01/2030 | | | | 33,146,849 | |
53,000,000 | | Federal National Mortgage Association, Pool BL9576 | | | 2.24 | % | | | 12/01/2050 | | | | 47,742,982 | |
69,358,157 | | Federal National Mortgage Association, Pool BM5112 | | | 3.00 | % | | | 11/01/2033 | | | | 74,193,883 | |
32,027,808 | | Federal National Mortgage Association, Pool BM5299 | | | 3.00 | % | | | 12/01/2046 | | | | 33,640,301 | |
48,339,785 | | Federal National Mortgage Association, Pool BM5633 | | | 3.00 | % | | | 07/01/2047 | | | | 50,770,372 | |
9,541,595 | | Federal National Mortgage Association, Pool BM5834 | | | 3.00 | % | | | 04/01/2048 | | | | 9,790,331 | |
17,106,741 | | Federal National Mortgage Association, Pool CA0862 | | | 3.50 | % | | | 09/01/2047 | | | | 18,155,781 | |
10,366,518 | | Federal National Mortgage Association, Pool CA3898 | | | 3.00 | % | | | 07/01/2034 | | | | 11,146,436 | |
7,143,209 | | Federal National Mortgage Association, Pool CA4413 | | | 3.00 | % | | | 10/01/2049 | | | | 7,468,046 | |
54,901,434 | | Federal National Mortgage Association, Pool CA7235 | | | 2.50 | % | | | 10/01/2050 | | | | 56,645,820 | |
16,273,073 | | Federal National Mortgage Association, Pool CA7671 | | | 2.50 | % | | | 11/01/2040 | | | | 16,929,148 | |
109,120,275 | | Federal National Mortgage Association, Pool CA7743 | | | 2.50 | % | | | 11/01/2050 | | | | 112,721,357 | |
28,545,142 | | Federal National Mortgage Association, Pool CA7789 | | | 2.50 | % | | | 11/01/2040 | | | | 29,625,947 | |
85,083,254 | | Federal National Mortgage Association, Pool FM1000 | | | 3.00 | % | | | 04/01/2047 | | | | 89,161,561 | |
232,679,060 | | Federal National Mortgage Association, Pool FM4623 | | | 2.50 | % | | | 11/01/2050 | | | | 240,071,909 | |
109,415,669 | | Federal National Mortgage Association, Pool FM4637 | | | 2.50 | % | | | 11/01/2050 | | | | 112,620,191 | |
58,275,029 | | Federal National Mortgage Association, Pool FM4684 | | | 2.50 | % | | | 10/01/2050 | | | | 59,966,004 | |
59,865,678 | | Federal National Mortgage Association, Pool FM4752 | | | 2.50 | % | | | 11/01/2050 | | | | 62,172,182 | |
70,734,875 | | Federal National Mortgage Association, Pool FM4792 | | | 2.50 | % | | | 11/01/2050 | | | | 72,982,322 | |
38,206,170 | | Federal National Mortgage Association, Pool FM4913 | | | 2.50 | % | | | 11/01/2050 | | | | 39,254,448 | |
61,427,450 | | Federal National Mortgage Association, Pool MA2259 | | | 3.00 | % | | | 05/01/2035 | | | | 64,368,346 | |
40,101,047 | | Federal National Mortgage Association, Pool MA2621 | | | 3.50 | % | | | 05/01/2046 | | | | 41,831,901 | |
33,271,858 | | Federal National Mortgage Association, Pool MA2649 | | | 3.00 | % | | | 06/01/2046 | | | | 34,161,086 | |
12,291,271 | | Federal National Mortgage Association, Pool MA2673 | | | 3.00 | % | | | 07/01/2046 | | | | 12,619,403 | |
40,842,456 | | Federal National Mortgage Association, Pool MA2711 | | | 3.00 | % | | | 08/01/2046 | | | | 41,932,236 | |
3,731,890 | | Federal National Mortgage Association, Pool MA2743 | | | 3.00 | % | | | 09/01/2046 | | | | 3,831,515 | |
75,061,630 | | Federal National Mortgage Association, Pool MA2806 | | | 3.00 | % | | | 11/01/2046 | | | | 79,324,912 | |
28,593,813 | | Federal National Mortgage Association, Pool MA2895 | | | 3.00 | % | | | 02/01/2047 | | | | 30,237,810 | |
97,056,869 | | Federal National Mortgage Association, Pool MA4157 | | | 1.50 | % | | | 10/01/2050 | | | | 93,875,814 | |
36,501,170 | | Federal National Mortgage Association, Pool MA4160 | | | 3.00 | % | | | 10/01/2050 | | | | 38,111,588 | |
161,044,411 | | Federal National Mortgage Association, Pool MA4165 | | | 2.00 | % | | | 10/01/2050 | | | | 159,660,372 | |
194,238,918 | | Federal National Mortgage Association, Pool MA4176 | | | 2.00 | % | | | 11/01/2040 | | | | 196,943,507 | |
461,834,163 | | Federal National Mortgage Association, Pool MA4181 | | | 1.50 | % | | | 11/01/2050 | | | | 446,696,846 | |
96,929,442 | | Federal National Mortgage Association, Pool MA4191 | | | 2.00 | % | | | 11/01/2050 | | | | 96,095,515 | |
391,095,694 | | Federal National Mortgage Association, Pool MA4209 | | | 1.50 | % | | | 12/01/2050 | | | | 378,276,805 | |
24,734,000 | | Federal National Mortgage Association, Pool MA4236 | | | 1.50 | % | | | 01/01/2051 | | | | 23,923,289 | |
512,724 | | Federal National Mortgage Association, Series 2002-70-QZ | | | 5.50 | % | | | 11/25/2032 | | | | 591,222 | |
709,103 | | Federal National Mortgage Association, Series 2002-75-ZG | | | 5.50 | % | | | 11/25/2032 | | | | 796,882 | |
10,554,956 | | Federal National Mortgage Association, Series 2003-129-ZT | | | 5.50 | % | | | 01/25/2034 | | | | 12,025,500 | |
1,914,521 | | Federal National Mortgage Association, Series 2003-29-ZL | | | 5.00 | % | | | 04/25/2033 | | | | 2,170,979 | |
967,890 | | Federal National Mortgage Association, Series 2003-64-ZG | | | 5.50 | % | | | 07/25/2033 | | | | 1,096,181 | |
7,429,315 | | Federal National Mortgage Association, Series 2003-84-PZ | | | 5.00 | % | | | 09/25/2033 | | | | 8,500,163 | |
7,619,518 | | Federal National Mortgage Association, Series 2003-W17-1A7 | | | 5.75 | % | | | 08/25/2033 | | | | 8,724,384 | |
1,770,884 | | Federal National Mortgage Association, Series 2004-46-PJ (-1 x 1 Month LIBOR USD + 6.00%, 6.00% Cap) | | | 5.89 | % (f)(i) | | | 03/25/2034 | | | | 169,388 | |
1,995,659 | | Federal National Mortgage Association, Series 2004-51-XP (-1 x 1 Month LIBOR USD + 7.70%, 7.70% Cap) | | | 7.59 | % (f)(i) | | | 07/25/2034 | | | | 368,112 | |
2,893,527 | | Federal National Mortgage Association, Series 2004-W10-A6 | | | 5.75 | % | | | 08/25/2034 | | | | 3,171,455 | |
119,581 | | Federal National Mortgage Association, Series 2005-107-EG | | | 4.50 | % | | | 01/25/2026 | | | | 126,810 | |
410,153 | | Federal National Mortgage Association, Series 2005-37-ZK | | | 4.50 | % | | | 05/25/2035 | | | | 454,002 | |
3,575,189 | | Federal National Mortgage Association, Series 2005-87-SG (-1 x 1 Month LIBOR USD + 6.70%, 6.70% Cap) | | | 6.59 | % (f)(i) | | | 10/25/2035 | | | | 642,748 | |
3,150,973 | | Federal National Mortgage Association, Series 2006-101-SA (-1 x 1 Month LIBOR USD + 6.58%, 6.58% Cap) | | | 6.47 | % (f)(i) | | | 10/25/2036 | | | | 609,401 | |
1,257,054 | | Federal National Mortgage Association, Series 2006-123-LI (-1 x 1 Month LIBOR USD + 6.32%, 6.32% Cap) | | | 6.21 | % (f)(i) | | | 01/25/2037 | | | | 251,931 | |
638,945 | | Federal National Mortgage Association, Series 2006-16-HZ | | | 5.50 | % | | | 03/25/2036 | | | | 733,228 | |
5,204,192 | | Federal National Mortgage Association, Series 2006-56-SM (-1 x 1 Month LIBOR USD + 6.75%, 6.75% Cap) | | | 6.64 | % (f)(i) | | | 07/25/2036 | | | | 916,527 | |
788,789 | | Federal National Mortgage Association, Series 2006-93-SN (-1 x 1 Month LIBOR USD + 6.60%, 6.60% Cap) | | | 6.49 | % (f)(i) | | | 10/25/2036 | | | | 89,768 | |
6,991,253 | | Federal National Mortgage Association, Series 2007-109-VZ | | | 5.00 | % | | | 10/25/2035 | | | | 7,938,014 | |
777,828 | | Federal National Mortgage Association, Series 2007-116-BI (-1 x 1 Month LIBOR USD + 6.25%, 6.25% Cap) | | | 6.14 | % (f)(i) | | | 05/25/2037 | | | | 106,916 | |
4,834,911 | | Federal National Mortgage Association, Series 2007-14-PS (-1 x 1 Month LIBOR USD + 6.81%, 6.81% Cap) | | | 6.70 | % (f)(i) | | | 03/25/2037 | | | | 835,070 | |
2,335,162 | | Federal National Mortgage Association, Series 2007-30-OI (-1 x 1 Month LIBOR USD + 6.44%, 6.44% Cap) | | | 6.33 | % (f)(i) | | | 04/25/2037 | | | | 464,875 | |
338,586 | | Federal National Mortgage Association, Series 2007-30-SI (-1 x 1 Month LIBOR USD + 6.11%, 6.11% Cap) | | | 6.00 | % (f)(i) | | | 04/25/2037 | | | | 48,246 | |
2,460,447 | | Federal National Mortgage Association, Series 2007-32-SG (-1 x 1 Month LIBOR USD + 6.10%, 6.10% Cap) | | | 5.99 | % (f)(i) | | | 04/25/2037 | | | | 378,983 | |
2,013,970 | | Federal National Mortgage Association, Series 2007-57-SX (-1 x 1 Month LIBOR USD + 6.62%, 6.62% Cap) | | | 6.51 | % (f)(i) | | | 10/25/2036 | | | | 358,067 | |
3,001,190 | | Federal National Mortgage Association, Series 2007-60-VZ | | | 6.00 | % | | | 07/25/2037 | | | | 3,472,608 | |
1,645,741 | | Federal National Mortgage Association, Series 2007-71-GZ | | | 6.00 | % | | | 07/25/2047 | | | | 1,803,215 | |
2,525,936 | | Federal National Mortgage Association, Series 2007-75-ID (-1 x 1 Month LIBOR USD + 5.87% , 5.87% Cap) | | | 5.76 | % (f)(i) | | | 08/25/2037 | | | | 435,460 | |
776,431 | | Federal National Mortgage Association, Series 2007-9-SD (-1 x 1 Month LIBOR USD + 6.65% , 6.65% Cap) | | | 6.54 | % (f)(i) | | | 03/25/2037 | | | | 114,367 | |
475,032 | | Federal National Mortgage Association, Series 2008-27-B | | | 5.50 | % | | | 04/25/2038 | | | | 542,075 | |
2,782,530 | | Federal National Mortgage Association, Series 2008-29-ZA | | | 4.50 | % | | | 04/25/2038 | | | | 3,086,992 | |
5,478,208 | | Federal National Mortgage Association, Series 2008-48-BE | | | 5.00 | % | | | 06/25/2034 | | | | 6,287,944 | |
502,723 | | Federal National Mortgage Association, Series 2008-48-SD (-1 x 1 Month LIBOR USD + 6.00% , 6.00% Cap) | | | 5.89 | % (f)(i) | | | 06/25/2037 | | | | 67,873 | |
870,532 | | Federal National Mortgage Association, Series 2008-53-LI (-1 x 1 Month LIBOR USD + 6.15% , 6.15% Cap) | | | 6.04 | % (f)(i) | | | 07/25/2038 | | | | 120,650 | |
559,732 | | Federal National Mortgage Association, Series 2008-57-SE (-1 x 1 Month LIBOR USD + 6.00% , 6.00% Cap) | | | 5.89 | % (f)(i) | | | 02/25/2037 | | | | 77,958 | |
983,476 | | Federal National Mortgage Association, Series 2008-5-MS (-1 x 1 Month LIBOR USD + 6.25% , 6.25% Cap) | | | 6.14 | % (f)(i) | | | 02/25/2038 | | | | 160,009 | |
636,484 | | Federal National Mortgage Association, Series 2008-61-SC (-1 x 1 Month LIBOR USD + 6.00% , 6.00% Cap) | | | 5.89 | % (f)(i) | | | 07/25/2038 | | | | 82,085 | |
492,503 | | Federal National Mortgage Association, Series 2008-62-SC (-1 x 1 Month LIBOR USD + 6.00% , 6.00% Cap) | | | 5.89 | % (f)(i) | | | 07/25/2038 | | | | 60,046 | |
1,286,621 | | Federal National Mortgage Association, Series 2008-65-SA (-1 x 1 Month LIBOR USD + 6.00% , 6.00% Cap) | | | 5.89 | % (f)(i) | | | 08/25/2038 | | | | 238,504 | |
408,386 | | Federal National Mortgage Association, Series 2008-81-LP | | | 5.50 | % | | | 09/25/2038 | | | | 461,028 | |
3,259,921 | | Federal National Mortgage Association, Series 2009-106-EZ | | | 4.50 | % | | | 01/25/2040 | | | | 3,566,928 | |
537,004 | | Federal National Mortgage Association, Series 2009-111-SE (-1 x 1 Month LIBOR USD + 6.25% , 6.25% Cap) | | | 6.14 | % (f)(i) | | | 01/25/2040 | | | | 97,930 | |
392,277 | | Federal National Mortgage Association, Series 2009-16-MZ | | | 5.00 | % | | | 03/25/2029 | | | | 436,706 | |
1,408,415 | | Federal National Mortgage Association, Series 2009-42-SI (-1 x 1 Month LIBOR USD + 6.00% , 6.00% Cap) | | | 5.89 | % (f)(i) | | | 06/25/2039 | | | | 196,373 | |
860,984 | | Federal National Mortgage Association, Series 2009-42-SX (-1 x 1 Month LIBOR USD + 6.00% , 6.00% Cap) | | | 5.89 | % (f)(i) | | | 06/25/2039 | | | | 99,831 | |
532,977 | | Federal National Mortgage Association, Series 2009-47-SA (-1 x 1 Month LIBOR USD + 6.10% , 6.10% Cap) | | | 5.99 | % (f)(i) | | | 07/25/2039 | | | | 65,297 | |
323,620 | | Federal National Mortgage Association, Series 2009-48-WS (-1 x 1 Month LIBOR USD + 5.95% , 5.95% Cap) | | | 5.84 | % (f)(i) | | | 07/25/2039 | | | | 50,477 | |
3,784,444 | | Federal National Mortgage Association, Series 2009-49-S (-1 x 1 Month LIBOR USD + 6.75% , 6.75% Cap) | | | 6.64 | % (f)(i) | | | 07/25/2039 | | | | 589,657 | |
486,201 | | Federal National Mortgage Association, Series 2009-51-BZ | | | 4.50 | % | | | 07/25/2039 | | | | 541,713 | |
1,041,045 | | Federal National Mortgage Association, Series 2009-54-EZ | | | 5.00 | % | | | 07/25/2039 | | | | 1,161,629 | |
547,767 | | Federal National Mortgage Association, Series 2009-70-SA (-1 x 1 Month LIBOR USD + 5.80% , 5.80% Cap) | | | 5.69 | % (f)(i) | | | 09/25/2039 | | | | 70,646 | |
2,188,181 | | Federal National Mortgage Association, Series 2009-80-PM | | | 4.50 | % | | | 10/25/2039 | | | | 2,311,144 | |
2,075,199 | | Federal National Mortgage Association, Series 2009-83-Z | | | 4.50 | % | | | 10/25/2039 | | | | 2,283,723 | |
8,618,725 | | Federal National Mortgage Association, Series 2009-85-ES (-1 x 1 Month LIBOR USD + 7.23% , 7.23% Cap) | | | 7.12 | % (f)(i) | | | 01/25/2036 | | | | 1,623,677 | |
11,731,628 | | Federal National Mortgage Association, Series 2009-85-JS (-1 x 1 Month LIBOR USD + 6.75% , 6.75% Cap) | | | 6.64 | % (f)(i) | | | 10/25/2039 | | | | 2,547,290 | |
830,706 | | Federal National Mortgage Association, Series 2009-90-IB (-1 x 1 Month LIBOR USD + 5.72% , 5.72% Cap) | | | 5.61 | % (f)(i) | | | 04/25/2037 | | | | 113,226 | |
718,115 | | Federal National Mortgage Association, Series 2009-94-BC | | | 5.00 | % | | | 11/25/2039 | | | | 782,041 | |
10,787,779 | | Federal National Mortgage Association, Series 2010-101-SA (-1 x 1 Month LIBOR USD + 4.48% , 4.48% Cap) | | | 4.37 | % (f)(i) | | | 09/25/2040 | | | | 1,521,241 | |
4,249,927 | | Federal National Mortgage Association, Series 2010-101-ZC | | | 4.50 | % | | | 09/25/2040 | | | | 4,779,549 | |
11,004,035 | | Federal National Mortgage Association, Series 2010-101-ZH | | | 4.50 | % | | | 07/25/2040 | | | | 11,618,055 | |
3,258,838 | | Federal National Mortgage Association, Series 2010-10-SA (-1 x 1 Month LIBOR USD + 6.35% , 6.35% Cap) | | | 6.24 | % (f)(i) | | | 02/25/2040 | | | | 553,853 | |
1,084,296 | | Federal National Mortgage Association, Series 2010-10-ZA | | | 4.50 | % | | | 02/25/2040 | | | | 1,181,828 | |
910,102 | | Federal National Mortgage Association, Series 2010-111-S (-1 x 1 Month LIBOR USD + 5.95% , 5.95% Cap) | | | 5.84 | % (f)(i) | | | 10/25/2050 | | | | 95,668 | |
1,617,965 | | Federal National Mortgage Association, Series 2010-116-Z | | | 4.00 | % | | | 10/25/2040 | | | | 1,737,957 | |
697,030 | | Federal National Mortgage Association, Series 2010-117-SA (-1 x 1 Month LIBOR USD + 4.50% , 4.50% Cap) | | | 4.39 | % (f)(i) | | | 10/25/2040 | | | | 48,653 | |
1,283,118 | | Federal National Mortgage Association, Series 2010-120-KD | | | 4.00 | % | | | 10/25/2040 | | | | 1,376,895 | |
14,747,913 | | Federal National Mortgage Association, Series 2010-121-SD (-1 x 1 Month LIBOR USD + 4.50% , 4.50% Cap) | | | 4.39 | % (f)(i) | | | 10/25/2040 | | | | 1,887,112 | |
242,685 | | Federal National Mortgage Association, Series 2010-126-SU (-11 x 1 Month LIBOR USD + 55.00% , 55.00% Cap) | | | 53.73 | % (i) | | | 11/25/2040 | | | | 826,731 | |
178,693 | | Federal National Mortgage Association, Series 2010-126-SX (-3 x 1 Month LIBOR USD + 15.00% , 15.00% Cap) | | | 14.65 | % (i) | | | 11/25/2040 | | | | 256,663 | |
2,750,111 | | Federal National Mortgage Association, Series 2010-128-HZ | | | 4.00 | % | | | 11/25/2040 | | | | 2,998,859 | |
1,740,404 | | Federal National Mortgage Association, Series 2010-132-Z | | | 4.50 | % | | | 11/25/2040 | | | | 1,865,521 | |
88,008 | | Federal National Mortgage Association, Series 2010-137-VS (-3 x 1 Month LIBOR USD + 15.00% , 15.00% Cap) | | | 14.65 | % (i) | | | 12/25/2040 | | | | 120,511 | |
6,425,098 | | Federal National Mortgage Association, Series 2010-142-AZ | | | 4.00 | % | | | 12/25/2040 | | | | 7,006,737 | |
5,355,080 | | Federal National Mortgage Association, Series 2010-148-SA (-1 x 1 Month LIBOR USD + 6.65% , 6.65% Cap) | | | 6.54 | % (f)(i) | | | 01/25/2026 | | | | 460,695 | |
7,827,088 | | Federal National Mortgage Association, Series 2010-150-FD (1 Month LIBOR USD + 0.51% , 0.51% Floor, 7.00% Cap) | | | 0.62 | % | | | 01/25/2041 | | | | 7,927,111 | |
14,506,117 | | Federal National Mortgage Association, Series 2010-150-ZA | | | 4.00 | % | | | 01/25/2041 | | | | 15,528,113 | |
5,861,200 | | Federal National Mortgage Association, Series 2010-16-SA (-1 x 1 Month LIBOR USD + 5.45% , 5.45% Cap) | | | 5.34 | % (f)(i) | | | 03/25/2040 | | | | 890,272 | |
2,072,911 | | Federal National Mortgage Association, Series 2010-21-DZ | | | 5.00 | % | | | 03/25/2040 | | | | 2,370,986 | |
995,496 | | Federal National Mortgage Association, Series 2010-21-KS (-1 x 1 Month LIBOR USD + 4.95% , 4.95% Cap) | | | 4.84 | % (f)(i) | | | 03/25/2040 | | | | 84,873 | |
270,140 | | Federal National Mortgage Association, Series 2010-2-GS (-1 x 1 Month LIBOR USD + 6.45% , 6.45% Cap) | | | 6.34 | % (f)(i) | | | 12/25/2049 | | | | 21,473 | |
1,479,081 | | Federal National Mortgage Association, Series 2010-2-MS (-1 x 1 Month LIBOR USD + 6.25% , 6.25% Cap) | | | 6.14 | % (f)(i) | | | 02/25/2050 | | | | 337,597 | |
1,137,867 | | Federal National Mortgage Association, Series 2010-31-SA (-1 x 1 Month LIBOR USD + 5.00% , 5.00% Cap) | | | 4.89 | % (f)(i) | | | 04/25/2040 | | | | 107,417 | |
3,285,077 | | Federal National Mortgage Association, Series 2010-31-VZ | | | 4.00 | % | | | 04/25/2040 | | | | 3,489,471 | |
1,595,790 | | Federal National Mortgage Association, Series 2010-34-PS (-1 x 1 Month LIBOR USD + 4.93% , 4.93% Cap) | | | 4.82 | % (f)(i) | | | 04/25/2040 | | | | 190,244 | |
356,737 | | Federal National Mortgage Association, Series 2010-35-ES (-1 x 1 Month LIBOR USD + 6.45% , 6.45% Cap) | | | 6.34 | % (f)(i) | | | 04/25/2040 | | | | 10,007 | |
422,069 | | Federal National Mortgage Association, Series 2010-35-SV (-1 x 1 Month LIBOR USD + 6.45% , 6.45% Cap) | | | 6.34 | % (f)(i) | | | 04/25/2040 | | | | 67,788 | |
732,236 | | Federal National Mortgage Association, Series 2010-46-MS (-1 x 1 Month LIBOR USD + 4.95% , 4.95% Cap) | | | 4.84 | % (f)(i) | | | 05/25/2040 | | | | 110,387 | |
5,368,211 | | Federal National Mortgage Association, Series 2010-49-ZW | | | 4.50 | % | | | 05/25/2040 | | | | 5,661,306 | |
1,559,719 | | Federal National Mortgage Association, Series 2010-4-SK (-1 x 1 Month LIBOR USD + 6.23%, 6.23% Cap) | | | 6.12 | % (f)(i) | | | 02/25/2040 | | | | 247,612 | |
633,145 | | Federal National Mortgage Association, Series 2010-58-ES (-3 x 1 Month LIBOR USD + 12.47%, 12.47% Cap) | | | 12.19 | % (i) | | | 06/25/2040 | | | | 771,883 | |
4,483,487 | | Federal National Mortgage Association, Series 2010-59-MS (-1 x 1 Month LIBOR USD + 5.77%, 5.77% Cap) | | | 5.66 | % (f)(i) | | | 06/25/2040 | | | | 902,334 | |
4,938,253 | | Federal National Mortgage Association, Series 2010-59-SC (-1 x 1 Month LIBOR USD + 5.00%, 5.00% Cap) | | | 4.89 | % (f)(i) | | | 01/25/2040 | | | | 738,057 | |
468,364 | | Federal National Mortgage Association, Series 2010-60-VZ | | | 5.00 | % | | | 10/25/2039 | | | | 530,296 | |
387,099 | | Federal National Mortgage Association, Series 2010-61-EL | | | 4.50 | % | | | 06/25/2040 | | | | 411,650 | |
5,002,022 | | Federal National Mortgage Association, Series 2010-64-EZ | | | 5.00 | % | | | 06/25/2040 | | | | 5,704,267 | |
11,551,700 | | Federal National Mortgage Association, Series 2010-64-FC (1 Month LIBOR USD + 0.50%, 0.50% Floor, 7.00% Cap) | | | 0.61 | % | | | 06/25/2040 | | | | 11,707,354 | |
14,950,834 | | Federal National Mortgage Association, Series 2010-76-ZK | | | 4.50 | % | | | 07/25/2040 | | | | 16,625,369 | |
3,573,897 | | Federal National Mortgage Association, Series 2010-79-CZ | | | 4.00 | % | | | 07/25/2040 | | | | 3,845,660 | |
13,381,059 | | Federal National Mortgage Association, Series 2010-79-VZ | | | 4.50 | % | | | 07/25/2040 | | | | 14,950,617 | |
1,596,800 | | Federal National Mortgage Association, Series 2010-84-ZC | | | 4.50 | % | | | 08/25/2040 | | | | 1,725,297 | |
3,193,594 | | Federal National Mortgage Association, Series 2010-84-ZD | | | 4.50 | % | | | 08/25/2040 | | | | 3,450,587 | |
5,316,405 | | Federal National Mortgage Association, Series 2010-84-ZG | | | 4.50 | % | | | 08/25/2040 | | | | 5,818,020 | |
355,050 | | Federal National Mortgage Association, Series 2010-90-SA (-1 x 1 Month LIBOR USD + 5.85%, 5.85% Cap) | | | 5.74 | % (f)(i) | | | 08/25/2040 | | | | 42,354 | |
1,199,896 | | Federal National Mortgage Association, Series 2010-94-Z | | | 4.50 | % | | | 08/25/2040 | | | | 1,308,139 | |
6,744,117 | | Federal National Mortgage Association, Series 2010-99-SG (-5 x 1 Month LIBOR USD + 25.00%, 25.00% Cap) | | | 24.42 | % (i) | | | 09/25/2040 | | | | 11,035,233 | |
1,025,288 | | Federal National Mortgage Association, Series 2010-9-DS (-1 x 1 Month LIBOR USD + 5.30%, 0.50% Floor, 5.30% Cap) | | | 5.19 | % (f)(i) | | | 02/25/2040 | | | | 126,037 | |
24,671,569 | | Federal National Mortgage Association, Series 2011-106-LZ | | | 3.50 | % | | | 10/25/2041 | | | | 26,832,547 | |
520,021 | | Federal National Mortgage Association, Series 2011-110-LS (-2 x 1 Month LIBOR USD + 10.10%, 10.10% Cap) | | | 9.87 | % (i) | | | 11/25/2041 | | | | 620,397 | |
3,515,669 | | Federal National Mortgage Association, Series 2011-111-CZ | | | 4.00 | % | | | 11/25/2041 | | | | 3,838,686 | |
7,187,891 | | Federal National Mortgage Association, Series 2011-111-EZ | | | 5.00 | % | | | 11/25/2041 | | | | 8,242,514 | |
2,051,644 | | Federal National Mortgage Association, Series 2011-111-VZ | | | 4.00 | % | | | 11/25/2041 | | | | 2,268,082 | |
30,000,000 | | Federal National Mortgage Association, Series 2011-131-PB | | | 4.50 | % | | | 12/25/2041 | | | | 34,242,618 | |
16,435,839 | | Federal National Mortgage Association, Series 2011-16-AL | | | 3.50 | % | | | 03/25/2031 | | | | 17,783,706 | |
32,530,784 | | Federal National Mortgage Association, Series 2011-17-NY | | | 3.50 | % | | | 03/25/2031 | | | | 35,014,347 | |
645,215 | | Federal National Mortgage Association, Series 2011-17-SA (-1 x 1 Month LIBOR USD + 6.47%, 6.47% Cap) | | | 6.36 | % (f)(i) | | | 03/25/2041 | | | | 96,779 | |
4,497,811 | | Federal National Mortgage Association, Series 2011-25-KY | | | 3.00 | % | | | 04/25/2026 | | | | 4,698,190 | |
3,272,610 | | Federal National Mortgage Association, Series 2011-27-BS (-2 x 1 Month LIBOR USD + 9.00%, 9.00% Cap) | | | 8.77 | % (i) | | | 04/25/2041 | | | | 3,568,601 | |
34,680,225 | | Federal National Mortgage Association, Series 2011-29-AL | | | 3.50 | % | | | 04/25/2031 | | | | 37,213,307 | |
5,798,181 | | Federal National Mortgage Association, Series 2011-2-GZ | | | 4.00 | % | | | 02/25/2041 | | | | 6,368,692 | |
12,825,146 | | Federal National Mortgage Association, Series 2011-32-ZG | | | 4.00 | % | | | 04/25/2041 | | | | 13,615,851 | |
2,819,656 | | Federal National Mortgage Association, Series 2011-36-VZ | | | 4.50 | % | | | 05/25/2041 | | | | 2,994,158 | |
6,681,920 | | Federal National Mortgage Association, Series 2011-37-Z | | | 4.50 | % | | | 05/25/2041 | | | | 7,543,602 | |
7,009,136 | | Federal National Mortgage Association, Series 2011-38-BZ | | | 4.00 | % | | | 05/25/2041 | | | | 7,632,306 | |
4,000,274 | | Federal National Mortgage Association, Series 2011-39-CB | | | 3.00 | % | | | 05/25/2026 | | | | 4,179,433 | |
7,228,700 | | Federal National Mortgage Association, Series 2011-39-ZD | | | 4.00 | % | | | 02/25/2041 | | | | 7,939,147 | |
2,558,985 | | Federal National Mortgage Association, Series 2011-40-LZ | | | 4.50 | % | | | 05/25/2041 | | | | 2,793,100 | |
3,467,399 | | Federal National Mortgage Association, Series 2011-42-MZ | | | 4.50 | % | | | 05/25/2041 | | | | 3,727,696 | |
19,974,895 | | Federal National Mortgage Association, Series 2011-45-ZA | | | 4.00 | % | | | 05/25/2031 | | | | 21,678,062 | |
4,676,519 | | Federal National Mortgage Association, Series 2011-45-ZB | | | 4.50 | % | | | 05/25/2041 | | | | 4,918,211 | |
15,579,798 | | Federal National Mortgage Association, Series 2011-51-FJ (1 Month LIBOR USD + 0.45%, 0.45% Floor, 7.00% Cap) | | | 0.56 | % | | | 06/25/2041 | | | | 15,745,287 | |
1,037,833 | | Federal National Mortgage Association, Series 2011-59-MA | | | 4.50 | % | | | 07/25/2041 | | | | 1,147,719 | |
7,252,241 | | Federal National Mortgage Association, Series 2011-60-EL | | | 3.00 | % | | | 07/25/2026 | | | | 7,577,967 | |
10,935,848 | | Federal National Mortgage Association, Series 2011-64-DB | | | 4.00 | % | | | 07/25/2041 | | | | 12,102,336 | |
11,503,751 | | Federal National Mortgage Association, Series 2011-77-Z | | | 3.50 | % | | | 08/25/2041 | | | | 12,514,397 | |
30,643,872 | | Federal National Mortgage Association, Series 2011-99-CZ | | | 4.50 | % (j) | | | 10/25/2041 | | | | 35,609,895 | |
56,646,159 | | Federal National Mortgage Association, Series 2011-99-DZ | | | 5.00 | % | | | 10/25/2041 | | | | 64,448,998 | |
13,905,114 | | Federal National Mortgage Association, Series 2012-104-Z | | | 3.50 | % (j) | | | 09/25/2042 | | | | 14,969,229 | |
3,606,719 | | Federal National Mortgage Association, Series 2012-111-LB | | | 3.50 | % | | | 05/25/2041 | | | | 3,883,186 | |
20,416,731 | | Federal National Mortgage Association, Series 2012-111-MJ | | | 4.00 | % | | | 04/25/2042 | | | | 22,768,367 | |
19,205,439 | | Federal National Mortgage Association, Series 2012-122-AD | | | 2.00 | % | | | 02/25/2040 | | | | 19,369,861 | |
31,639,955 | | Federal National Mortgage Association, Series 2012-122-DB | | | 3.00 | % | | | 11/25/2042 | | | | 33,103,340 | |
37,543,756 | | Federal National Mortgage Association, Series 2012-125-LA | | | 3.00 | % | | | 11/25/2042 | | | | 40,085,686 | |
22,377,477 | | Federal National Mortgage Association, Series 2012-132-KH | | | 1.75 | % | | | 12/25/2032 | | | | 23,170,910 | |
22,414,017 | | Federal National Mortgage Association, Series 2012-144-PT | | | 4.17 | % (b) | | | 11/25/2049 | | | | 24,784,460 | |
9,158,892 | | Federal National Mortgage Association, Series 2012-14-BZ | | | 4.00 | % | | | 03/25/2042 | | | | 10,060,843 | |
27,919,702 | | Federal National Mortgage Association, Series 2012-15-PZ | | | 4.00 | % (j) | | | 03/25/2042 | | | | 30,952,848 | |
20,593,066 | | Federal National Mortgage Association, Series 2012-20-ZT | | | 3.50 | % (j) | | | 03/25/2042 | | | | 21,893,755 | |
64,461,221 | | Federal National Mortgage Association, Series 2012-30-DZ | | | 4.00 | % (j) | | | 04/25/2042 | | | | 69,946,123 | |
37,389,066 | | Federal National Mortgage Association, Series 2012-31-Z | | | 4.00 | % | | | 04/25/2042 | | | | 41,173,677 | |
285,841 | | Federal National Mortgage Association, Series 2012-63-EB | | | 2.00 | % | | | 08/25/2040 | | | | 285,903 | |
14,509,650 | | Federal National Mortgage Association, Series 2012-70-FY (1 Month LIBOR USD + 0.45%, 0.45% Floor, 7.00% Cap) | | | 0.56 | % | | | 07/25/2042 | | | | 14,647,683 | |
38,079,057 | | Federal National Mortgage Association, Series 2012-74-Z | | | 4.00 | % (j) | | | 07/25/2042 | | | | 42,396,461 | |
2,056,408 | | Federal National Mortgage Association, Series 2012-80-EA | | | 2.00 | % | | | 04/25/2042 | | | | 2,091,152 | |
27,356,944 | | Federal National Mortgage Association, Series 2012-86-ZC | | | 3.50 | % (j) | | | 08/25/2042 | | | | 29,324,844 | |
38,115,390 | | Federal National Mortgage Association, Series 2012-96-VZ | | | 3.50 | % (j) | | | 09/25/2042 | | | | 41,006,271 | |
14,033,909 | | Federal National Mortgage Association, Series 2012-98-BG | | | 4.50 | % | | | 08/25/2040 | | | | 15,706,553 | |
27,279,722 | | Federal National Mortgage Association, Series 2012-99-QE | | | 3.00 | % | | | 09/25/2042 | | | | 29,387,383 | |
16,050,272 | | Federal National Mortgage Association, Series 2013-100-PJ | | | 3.00 | % | | | 03/25/2043 | | | | 17,145,195 | |
27,887,060 | | Federal National Mortgage Association, Series 2013-130-ZE | | | 3.00 | % (j) | | | 01/25/2044 | | | | 28,963,846 | |
25,056,353 | | Federal National Mortgage Association, Series 2013-133-ZT | | | 3.00 | % (j) | | | 01/25/2039 | | | | 26,192,017 | |
13,344,119 | | Federal National Mortgage Association, Series 2013-36-Z | | | 3.00 | % (j) | | | 04/25/2043 | | | | 14,338,452 | |
12,009,911 | | Federal National Mortgage Association, Series 2013-41-ZH | | | 3.00 | % | | | 05/25/2033 | | | | 12,695,458 | |
11,908,298 | | Federal National Mortgage Association, Series 2013-51-HS (-1 x 1 Month LIBOR USD + 5.40%, 5.40% Cap) | | | 5.27 | % (i) | | | 04/25/2043 | | | | 11,842,226 | |
2,344,472 | | Federal National Mortgage Association, Series 2013-53-AB | | | 1.50 | % | | | 03/25/2028 | | | | 2,399,906 | |
2,567,901 | | Federal National Mortgage Association, Series 2013-58-SC (-2 x 1 Month LIBOR USD + 6.00%, 6.00% Cap) | | | 5.84 | % (i) | | | 06/25/2043 | | | | 2,411,579 | |
35,258,887 | | Federal National Mortgage Association, Series 2013-81-ZQ | | | 3.00 | % | | | 08/25/2043 | | | | 33,973,461 | |
12,534,303 | | Federal National Mortgage Association, Series 2013-82-SH (-1 x 1 Month LIBOR USD + 6.05%, 6.05% Cap) | | | 5.94 | % (f)(i) | | | 12/25/2042 | | | | 1,484,206 | |
6,198,373 | | Federal National Mortgage Association, Series 2013-8-Z | | | 3.00 | % | | | 02/25/2043 | | | | 6,027,210 | |
25,617,817 | | Federal National Mortgage Association, Series 2014-12-GZ | | | 3.50 | % (j) | | | 03/25/2044 | | | | 27,658,399 | |
27,133,806 | | Federal National Mortgage Association, Series 2014-21-GZ | | | 3.00 | % (j) | | | 04/25/2044 | | | | 28,009,169 | |
31,587,170 | | Federal National Mortgage Association, Series 2014-37-ZY | | | 2.50 | % (j) | | | 07/25/2044 | | | | 31,928,441 | |
44,973,803 | | Federal National Mortgage Association, Series 2014-39-ZA | | | 3.00 | % | | | 07/25/2044 | | | | 46,405,742 | |
1,255,893 | | Federal National Mortgage Association, Series 2014-46-NZ | | | 3.00 | % | | | 06/25/2043 | | | | 1,268,771 | |
9,474,718 | | Federal National Mortgage Association, Series 2014-55-MA | | | 3.00 | % | | | 10/25/2039 | | | | 9,562,464 | |
61,621,929 | | Federal National Mortgage Association, Series 2014-60-EZ | | | 3.00 | % (j) | | | 10/25/2044 | | | | 65,160,907 | |
43,498,054 | | Federal National Mortgage Association, Series 2014-61-ZV | | | 3.00 | % (j) | | | 10/25/2044 | | | | 45,755,568 | |
36,681,919 | | Federal National Mortgage Association, Series 2014-64-NZ | | | 3.00 | % (j) | | | 10/25/2044 | | | | 38,477,352 | |
26,305,874 | | Federal National Mortgage Association, Series 2014-65-CD | | | 3.00 | % | | | 06/25/2040 | | | | 26,642,889 | |
12,916,374 | | Federal National Mortgage Association, Series 2014-67-DZ | | | 3.00 | % (j) | | | 10/25/2044 | | | | 13,507,967 | |
27,402,298 | | Federal National Mortgage Association, Series 2014-68-MA | | | 3.00 | % | | | 11/25/2040 | | | | 27,807,995 | |
41,291,584 | | Federal National Mortgage Association, Series 2014-68-MZ | | | 3.00 | % (j) | | | 11/25/2044 | | | | 43,284,258 | |
28,703,932 | | Federal National Mortgage Association, Series 2014-6-Z | | | 2.50 | % (j) | | | 02/25/2044 | | | | 29,266,725 | |
11,891,944 | | Federal National Mortgage Association, Series 2014-73-CQ | | | 3.00 | % | | | 06/25/2040 | | | | 12,056,641 | |
23,309,532 | | Federal National Mortgage Association, Series 2014-77-VZ | | | 3.00 | % (j) | | | 11/25/2044 | | | | 24,391,791 | |
8,429,686 | | Federal National Mortgage Association, Series 2014-82-YA | | | 3.00 | % | | | 04/25/2041 | | | | 8,589,036 | |
29,935,559 | | Federal National Mortgage Association, Series 2014-84-KZ | | | 3.00 | % (j) | | | 12/25/2044 | | | | 31,366,418 | |
34,512,339 | | Federal National Mortgage Association, Series 2014-95-NA | | | 3.00 | % | | | 04/25/2041 | | | | 35,050,939 | |
123,706,223 | | Federal National Mortgage Association, Series 2014-M11-1A | | | 3.12 | % (b) | | | 08/25/2024 | | | | 131,371,432 | |
14,517,321 | | Federal National Mortgage Association, Series 2015-11-A | | | 3.00 | % | | | 05/25/2034 | | | | 15,189,669 | |
35,215,134 | | Federal National Mortgage Association, Series 2015-21-G | | | 3.00 | % | | | 02/25/2042 | | | | 36,001,383 | |
9,681,873 | | Federal National Mortgage Association, Series 2015-42-CA | | | 3.00 | % | | | 03/25/2044 | | | | 9,931,964 | |
34,685,788 | | Federal National Mortgage Association, Series 2015-49-A | | | 3.00 | % | | | 03/25/2044 | | | | 35,596,491 | |
19,433,796 | | Federal National Mortgage Association, Series 2015-88-AC | | | 3.00 | % | | | 04/25/2043 | | | | 19,839,869 | |
80,883,117 | | Federal National Mortgage Association, Series 2015-88-BA | | | 3.00 | % | | | 04/25/2044 | | | | 82,982,503 | |
24,747,021 | | Federal National Mortgage Association, Series 2015-8-AP | | | 2.00 | % | | | 03/25/2045 | | | | 25,424,634 | |
8,777,225 | | Federal National Mortgage Association, Series 2015-94-MA | | | 3.00 | % | | | 01/25/2046 | | | | 9,257,941 | |
39,525,412 | | Federal National Mortgage Association, Series 2015-9-HA | | | 3.00 | % | | | 01/25/2045 | | | | 42,356,487 | |
24,295,641 | | Federal National Mortgage Association, Series 2016-2-JA | | | 2.50 | % | | | 02/25/2046 | | | | 25,526,737 | |
55,900,013 | | Federal National Mortgage Association, Series 2016-32-LA | | | 3.00 | % | | | 10/25/2044 | | | | 57,450,064 | |
41,453,376 | | Federal National Mortgage Association, Series 2016-72-PA | | | 3.00 | % | | | 07/25/2046 | | | | 42,591,810 | |
23,947,955 | | Federal National Mortgage Association, Series 2016-74-PA | | | 3.00 | % | | | 12/25/2044 | | | | 24,382,829 | |
12,365,530 | | Federal National Mortgage Association, Series 2016-79-EP | | | 3.00 | % | | | 01/25/2044 | | | | 12,719,265 | |
32,522,906 | | Federal National Mortgage Association, Series 2016-81-PA | | | 3.00 | % | | | 02/25/2044 | | | | 33,548,873 | |
17,898,893 | | Federal National Mortgage Association, Series 2016-94-PA | | | 3.00 | % | | | 03/25/2044 | | | | 18,272,782 | |
8,198,277 | | Federal National Mortgage Association, Series 2017-13-ML | | | 3.00 | % | | | 08/25/2041 | | | | 8,235,152 | |
114,766 | | Federal National Mortgage Association, Series 2017-2-HA | | | 3.00 | % | | | 09/25/2041 | | | | 114,615 | |
4,594,341 | | Federal National Mortgage Association, Series 2017-51-EA | | | 3.00 | % | | | 11/25/2042 | | | | 4,656,987 | |
2,995,607 | | Federal National Mortgage Association, Series 2017-61-TA | | | 3.00 | % | | | 02/25/2043 | | | | 3,010,538 | |
22,142,082 | | Federal National Mortgage Association, Series 2018-21-IO | | | 3.00 | % (f) | | | 04/25/2048 | | | | 2,315,659 | |
36,571,283 | | Federal National Mortgage Association, Series 2018-21-PO | | | 0.00 | % (g) | | | 04/25/2048 | | | | 32,256,844 | |
74,705,796 | | Federal National Mortgage Association, Series 2018-27-AO | | | 0.00 | % (g) | | | 05/25/2048 | | | | 67,534,622 | |
23,214,689 | | Federal National Mortgage Association, Series 2018-27-JA | | | 3.00 | % | | | 12/25/2047 | | | | 24,118,344 | |
28,394,195 | | Federal National Mortgage Association, Series 2018-33-A | | | 3.00 | % | | | 05/25/2048 | | | | 30,085,674 | |
10,907,862 | | Federal National Mortgage Association, Series 2018-33-C | | | 3.00 | % | | | 05/25/2048 | | | | 11,375,919 | |
89,200,209 | | Federal National Mortgage Association, Series 2018-36-A | | | 3.00 | % | | | 06/25/2048 | | | | 92,880,663 | |
32,588,153 | | Federal National Mortgage Association, Series 2018-38-JB | | | 3.00 | % | | | 06/25/2048 | | | | 34,388,867 | |
101,926,981 | | Federal National Mortgage Association, Series 2018-39-AB | | | 3.00 | % | | | 06/25/2048 | | | | 107,559,129 | |
40,200,996 | | Federal National Mortgage Association, Series 2018-44-PZ | | | 3.50 | % (j) | | | 06/25/2048 | | | | 43,974,173 | |
17,320,151 | | Federal National Mortgage Association, Series 2018-64-A | | | 3.00 | % | | | 09/25/2048 | | | | 18,212,059 | |
44,799,838 | | Federal National Mortgage Association, Series 2018-85-PO | | | 0.00 | % (g) | | | 12/25/2048 | | | | 39,452,888 | |
40,334,461 | | Federal National Mortgage Association, Series 2019-12-BA | | | 3.00 | % | | | 04/25/2049 | | | | 42,482,287 | |
8,455,165 | | Federal National Mortgage Association, Series 2019-48-AZ | | | 3.50 | % (j) | | | 09/25/2049 | | | | 9,081,373 | |
12,153,395 | | Federal National Mortgage Association, Series 2019-64-D | | | 2.50 | % | | | 11/25/2049 | | | | 12,656,120 | |
27,726,532 | | Federal National Mortgage Association, Series 2019-69-DS (-1 x 1 Month LIBOR USD + 6.00%, 6.00% Cap) | | | 5.89 | % (f)(i) | | | 12/25/2049 | | | | 5,590,082 | |
231,718,665 | | Federal National Mortgage Association, Series 2019-M16-X | | | 1.19 | % (b)(f) | | | 07/25/2031 | | | | 20,541,234 | |
498,400,646 | | Federal National Mortgage Association, Series 2019-M18-X | | | 0.72 | % (b)(f) | | | 08/25/2029 | | | | 26,207,202 | |
255,658,464 | | Federal National Mortgage Association, Series 2019-M24-2XA | | | 1.15 | % (b)(f) | | | 03/25/2031 | | | | 23,780,686 | |
319,567,304 | | Federal National Mortgage Association, Series 2019-M24-XA | | | 1.28 | % (b)(f) | | | 03/25/2029 | | | | 28,343,159 | |
16,000,000 | | Federal National Mortgage Association, Series 2020-13-HB | | | 3.00 | % | | | 03/25/2050 | | | | 16,763,046 | |
10,000,000 | | Federal National Mortgage Association, Series 2020-2-MB | | | 2.00 | % | | | 11/25/2059 | | | | 9,265,019 | |
24,209,499 | | Federal National Mortgage Association, Series 2020-2-MT | | | 2.00 | % | | | 11/25/2059 | | | | 24,256,563 | |
40,000,000 | | Federal National Mortgage Association, Series 2020-47-GL | | | 2.00 | % | | | 05/25/2046 | | | | 41,092,164 | |
48,500,000 | | Federal National Mortgage Association, Series 2020-47-KM | | | 2.00 | % | | | 12/25/2045 | | | | 49,826,945 | |
19,702,139 | | Federal National Mortgage Association, Series 2020-54-AS (-1 x 1 Month LIBOR USD + 6.15%, 6.15% Cap) | | | 6.04 | % (f)(i) | | | 08/25/2050 | | | | 4,543,790 | |
505,923,333 | | Federal National Mortgage Association, Series 2020-M10-X2 | | | 1.70 | % (b)(f) | | | 12/25/2030 | | | | 65,722,780 | |
266,417,253 | | Federal National Mortgage Association, Series 2020-M10-X8 | | | 0.72 | % (b)(f) | | | 12/25/2027 | | | | 10,186,464 | |
101,618,583 | | Federal National Mortgage Association, Series 2020-M13-X2 | | | 1.30 | % (b)(f) | | | 09/25/2030 | | | | 8,874,320 | |
607,977,720 | | Federal National Mortgage Association, Series 2020-M15-X1 | | | 1.58 | % (b)(f) | | | 09/25/2031 | | | | 79,288,320 | |
31,133,917 | | Federal National Mortgage Association, Series 2020-M17-X1 | | | 1.44 | % (b)(f) | | | 01/25/2028 | | | | 2,240,907 | |
141,911,152 | | Federal National Mortgage Association, Series 2020-M27-X1 | | | 0.91 | % (b)(f) | | | 03/25/2031 | | | | 8,515,648 | |
174,181,566 | | Federal National Mortgage Association, Series 2020-M54-X | | | 1.54 | % (b)(f) | | | 12/25/2033 | | | | 19,279,861 | |
53,634,059 | | Federal National Mortgage Association, Series 2020-M7-X2 | | | 1.24 | % (b)(f) | | | 03/25/2031 | | | | 4,961,976 | |
32,281,776 | | Federal National Mortgage Association, Series 2021-13-AK | | | 2.00 | % | | | 01/25/2049 | | | | 33,174,809 | |
22,098,379 | | Federal National Mortgage Association, Series 2021-21-DK | | | 2.00 | % | | | 07/25/2043 | | | | 22,679,902 | |
27,920,892 | | Federal National Mortgage Association, Series 2021-21-GI | | | 4.00 | % (f) | | | 07/25/2043 | | | | 4,861,840 | |
60,281,785 | | Federal National Mortgage Association, Series 2021-21-GL | | | 2.00 | % | | | 07/25/2043 | | | | 61,867,081 | |
188,384,290 | | Federal National Mortgage Association, Series 2021-M3-X2 | | | 1.02 | % (b)(f) | | | 08/25/2033 | | | | 14,582,941 | |
23,761,601 | | Federal National Mortgage Association, Series 2021-M5-A1 | | | 1.46 | % (b) | | | 01/25/2033 | | | | 23,821,012 | |
5,121,153 | | Federal National Mortgage Association, Series 400-S4 (-1 x 1 Month LIBOR USD + 5.45%, 5.45% Cap) | | | 5.34 | % (f)(i) | | | 11/25/2039 | | | | 1,058,193 | |
56,545,402 | | Federal National Mortgage Association, Series 412-A3 | | | 3.00 | % | | | 08/25/2042 | | | | 57,862,553 | |
37,921,887 | | Government National Mortgage Association Pool 785310 | | | 2.50 | % | | | 02/20/2051 | | | | 39,416,959 | |
51,775,963 | | Government National Mortgage Association Pool 785346 | | | 2.00 | % | | | 03/20/2051 | | | | 52,345,617 | |
16,567,589 | | Government National Mortgage Association Pool 785350 | | | 2.00 | % | | | 01/20/2051 | | | | 16,749,203 | |
33,779,928 | | Government National Mortgage Association Pool 785374 | | | 2.50 | % | | | 03/20/2051 | | | | 35,510,395 | |
61,345,804 | | Government National Mortgage Association Pool 785378 | | | 2.50 | % | | | 03/20/2051 | | | | 64,034,976 | |
87,255,069 | | Government National Mortgage Association Pool 785379 | | | 2.50 | % | | | 03/20/2051 | | | | 90,911,922 | |
3,631,166 | | Government National Mortgage Association Pool CB5487 | | | 2.50 | % | | | 03/20/2051 | | | | 3,751,777 | |
1,362,405 | | Government National Mortgage Association, Pool MA2511 | | | 3.50 | % | | | 01/20/2045 | | | | 1,419,686 | |
8,033,437 | | Government National Mortgage Association, Series 2003-67-SP (-1 x 1 Month LIBOR USD + 7.10%, 7.10% Cap) | | | 6.99 | % (f)(i) | | | 08/20/2033 | | | | 1,379,509 | |
3,327,058 | | Government National Mortgage Association, Series 2003-86-ZK | | | 5.00 | % | | | 10/20/2033 | | | | 3,694,687 | |
1,849,981 | | Government National Mortgage Association, Series 2004-49-Z | | | 6.00 | % | | | 06/20/2034 | | | | 2,102,432 | |
3,619,211 | | Government National Mortgage Association, Series 2004-83-CS (-1 x 1 Month LIBOR USD + 6.08%, 6.08% Cap) | | | 5.97 | % (f)(i) | | | 10/20/2034 | | | | 599,598 | |
885,772 | | Government National Mortgage Association, Series 2005-21-Z | | | 5.00 | % | | | 03/20/2035 | | | | 1,001,157 | |
9,721,859 | | Government National Mortgage Association, Series 2005-39-ZB | | | 5.00 | % | | | 07/20/2034 | | | | 10,968,272 | |
682,679 | | Government National Mortgage Association, Series 2006-24-CX (-7 x 1 Month LIBOR USD + 39.97%, 39.97% Cap) | | | 39.15 | % (i) | | | 05/20/2036 | | | | 1,231,305 | |
3,990,861 | | Government National Mortgage Association, Series 2007-26-SJ (-1 x 1 Month LIBOR USD + 4.69%, 4.69% Cap) | | | 4.58 | % (f)(i) | | | 04/20/2037 | | | | 416,292 | |
3,199,752 | | Government National Mortgage Association, Series 2008-2-SM (-1 x 1 Month LIBOR USD + 6.50%, 6.50% Cap) | | | 6.39 | % (f)(i) | | | 01/16/2038 | | | | 618,517 | |
5,578,919 | | Government National Mortgage Association, Series 2008-42-AI (-1 x 1 Month LIBOR USD + 7.69%, 7.69% Cap) | | | 7.58 | %(f)(i) | | | 05/16/2038 | | | | 1,408,688 | |
2,222,323 | | Government National Mortgage Association, Series 2008-43-SH (-1 x 1 Month LIBOR USD + 6.34%, 6.34% Cap) | | | 6.23 | % (f)(i) | | | 05/20/2038 | | | | 273,647 | |
2,494,385 | | Government National Mortgage Association, Series 2008-51-SC (-1 x 1 Month LIBOR USD + 6.25%, 6.25% Cap) | | | 6.14 | % (f)(i) | | | 06/20/2038 | | | | 485,180 | |
1,780,698 | | Government National Mortgage Association, Series 2008-51-SE (-1 x 1 Month LIBOR USD + 6.25%, 6.25% Cap) | | | 6.14 | % (f)(i) | | | 06/16/2038 | | | | 298,908 | |
773,559 | | Government National Mortgage Association, Series 2008-82-SM (-1 x 1 Month LIBOR USD + 6.05%, 6.05% Cap) | | | 5.94 | % (f)(i) | | | 09/20/2038 | | | | 97,272 | |
1,719,038 | | Government National Mortgage Association, Series 2008-83-SD (-1 x 1 Month LIBOR USD + 6.56%, 6.56% Cap) | | | 6.45 | % (f)(i) | | | 11/16/2036 | | | | 221,776 | |
5,679,534 | | Government National Mortgage Association, Series 2009-106-VZ | | | 4.50 | % | | | 11/20/2039 | | | | 6,257,140 | |
4,131,423 | | Government National Mortgage Association, Series 2009-10-NS (-1 x 1 Month LIBOR USD + 6.65%, 6.65% Cap) | | | 6.54 | % (f)(i) | | | 02/16/2039 | | | | 795,733 | |
1,156,404 | | Government National Mortgage Association, Series 2009-24-SN (-1 x 1 Month LIBOR USD + 6.10%, 6.10% Cap) | | | 5.99 | % (f)(i) | | | 09/20/2038 | | | | 150,305 | |
3,182,241 | | Government National Mortgage Association, Series 2009-32-ZE | | | 4.50 | % | | | 05/16/2039 | | | | 3,496,578 | |
18,680,434 | | Government National Mortgage Association, Series 2009-35-DZ | | | 4.50 | % | | | 05/20/2039 | | | | 20,366,746 | |
8,301 | | Government National Mortgage Association, Series 2009-41-ZQ | | | 4.50 | % (j) | | | 06/16/2039 | | | | 9,879 | |
2,208,706 | | Government National Mortgage Association, Series 2009-48-Z | | | 5.00 | % | | | 06/16/2039 | | | | 2,439,372 | |
349,561 | | Government National Mortgage Association, Series 2009-50-KP | | | 4.50 | % | | | 06/20/2039 | | | | 373,393 | |
1,680,136 | | Government National Mortgage Association, Series 2009-69-TS (-1 x 1 Month LIBOR USD + 6.20%, 6.20% Cap) | | | 6.09 | % (f)(i) | | | 04/16/2039 | | | | 202,966 | |
2,631,947 | | Government National Mortgage Association, Series 2009-75-GZ | | | 4.50 | % | | | 09/20/2039 | | | | 2,869,267 | |
1,830,853 | | Government National Mortgage Association, Series 2009-87-IG (-1 x 1 Month LIBOR USD + 6.74%, 6.74% Cap) | | | 6.63 | % (f)(i) | | | 03/20/2037 | | | | 149,850 | |
14,402,267 | | Government National Mortgage Association, Series 2010-106-PS (-1 x 1 Month LIBOR USD + 6.05%, 6.05% Cap) | | | 5.94 | % (f)(i) | | | 03/20/2040 | | | | 1,744,018 | |
4,458,376 | | Government National Mortgage Association, Series 2010-1-SA (-1 x 1 Month LIBOR USD + 5.75%, 5.75% Cap) | | | 5.64 | % (f)(i) | | | 01/16/2040 | | | | 724,822 | |
4,149,974 | | Government National Mortgage Association, Series 2010-25-ZB | | | 4.50 | % | | | 02/16/2040 | | | | 4,605,664 | |
37,309,241 | | Government National Mortgage Association, Series 2010-26-QS (-1 x 1 Month LIBOR USD + 6.25%, 6.25% Cap) | | | 6.14 | % (f)(i) | | | 02/20/2040 | | | | 7,391,696 | |
3,243,543 | | Government National Mortgage Association, Series 2010-42-AY | | | 5.00 | % | | | 11/20/2039 | | | | 3,700,392 | |
3,109,502 | | Government National Mortgage Association, Series 2010-42-ES (-1 x 1 Month LIBOR USD + 5.68%, 5.68% Cap) | | | 5.57 | % (f)(i) | | | 04/20/2040 | | | | 604,636 | |
994,003 | | Government National Mortgage Association, Series 2010-61-AS (-1 x 1 Month LIBOR USD + 6.55%, 6.55% Cap) | | | 6.44 | % (f)(i) | | | 09/20/2039 | | | | 168,029 | |
9,720,855 | | Government National Mortgage Association, Series 2010-62-SB (-1 x 1 Month LIBOR USD + 5.75%, 5.75% Cap) | | | 5.64 | % (f)(i) | | | 05/20/2040 | | | | 1,730,927 | |
8,763,518 | | Government National Mortgage Association, Series 2010-62-ZG | | | 5.50 | % | | | 05/16/2040 | | | | 10,106,312 | |
4,865,597 | | Government National Mortgage Association, Series 2011-18-SN (-2 x 1 Month LIBOR USD + 9.50%, 9.50% Cap) | | | 9.28 | % (i) | | | 12/20/2040 | | | | 5,215,941 | |
4,870,501 | | Government National Mortgage Association, Series 2011-18-YS (-2 x 1 Month LIBOR USD + 9.50%, 9.50% Cap) | | | 9.28 | % (i) | | | 12/20/2040 | | | | 5,182,014 | |
1,874,887 | | Government National Mortgage Association, Series 2011-51-UZ | | | 4.50 | % | | | 04/20/2041 | | | | 2,088,241 | |
1,429,147 | | Government National Mortgage Association, Series 2011-69-OC | | | 0.00 | % (g) | | | 05/20/2041 | | | | 1,318,785 | |
13,650,862 | | Government National Mortgage Association, Series 2011-69-SB (-1 x 1 Month LIBOR USD + 5.35%, 5.35% Cap) | | | 5.24 | % (f)(i) | | | 05/20/2041 | | | | 2,439,184 | |
13,332,725 | | Government National Mortgage Association, Series 2011-71-ZA | | | 4.50 | % | | | 02/20/2041 | | | | 14,858,095 | |
5,149,329 | | Government National Mortgage Association, Series 2011-72-AS (-1 x 1 Month LIBOR USD + 5.38%, 5.38% Cap) | | | 5.27 | % (f)(i) | | | 05/20/2041 | | | | 939,148 | |
4,167,068 | | Government National Mortgage Association, Series 2011-72-SK (-1 x 1 Month LIBOR USD + 6.15%, 6.15% Cap) | | | 6.04 | % (f)(i) | | | 05/20/2041 | | | | 853,868 | |
753,365 | | Government National Mortgage Association, Series 2012-52-PN | | | 2.00 | % | | | 12/20/2039 | | | | 754,348 | |
13,430,127 | | Government National Mortgage Association, Series 2013-116-LS (-1 x 1 Month LIBOR USD + 6.15%, 6.15% Cap) | | | 6.04 | % (f)(i) | | | 08/20/2043 | | | | 2,943,572 | |
17,777,105 | | Government National Mortgage Association, Series 2013-136-CS (-1 x 1 Month LIBOR USD + 6.20%, 6.20% Cap) | | | 6.09 | % (f)(i) | | | 09/16/2043 | | | | 2,941,138 | |
20,374,310 | | Government National Mortgage Association, Series 2013-182-WZ | | | 2.50 | % (j) | | | 12/20/2043 | | | | 21,360,745 | |
62,804,869 | | Government National Mortgage Association, Series 2013-182-ZW | | | 2.50 | % (j) | | | 12/20/2043 | | | | 65,845,605 | |
9,135,322 | | Government National Mortgage Association, Series 2013-186-SG (-1 x 1 Month LIBOR USD + 6.25%, 6.25% Cap) | | | 6.14 | % (f)(i) | | | 02/16/2043 | | | | 1,294,896 | |
9,266,657 | | Government National Mortgage Association, Series 2013-26-MS (-1 x 1 Month LIBOR USD + 6.25%, 6.25% Cap) | | | 6.14 | % (f)(i) | | | 02/20/2043 | | | | 1,997,654 | |
14,364,781 | | Government National Mortgage Association, Series 2013-34-PL | | | 3.00 | % | | | 03/20/2042 | | | | 14,906,509 | |
17,195,311 | | Government National Mortgage Association, Series 2014-163-PS (-1 x 1 Month LIBOR USD + 5.60%, 5.60% Cap) | | | 5.49 | % (f)(i) | | | 11/20/2044 | | | | 2,794,486 | |
17,853,646 | | Government National Mortgage Association, Series 2014-167-SA (-1 x 1 Month LIBOR USD + 5.60%, 5.60% Cap) | | | 5.49 | % (f)(i) | | | 11/20/2044 | | | | 3,414,753 | |
28,896,695 | | Government National Mortgage Association, Series 2014-21-SE (-1 x 1 Month LIBOR USD + 5.55%, 5.55% Cap) | | | 5.44 | % (f)(i) | | | 02/20/2044 | | | | 5,766,717 | |
17,022,433 | | Government National Mortgage Association, Series 2014-39-SK (-1 x 1 Month LIBOR USD + 6.20%, 6.20% Cap) | | | 6.09 | % (f)(i) | | | 03/20/2044 | | | | 3,406,834 | |
16,819,902 | | Government National Mortgage Association, Series 2014-59-DS (-1 x 1 Month LIBOR USD + 6.25%, 6.25% Cap) | | | 6.14 | % (f)(i) | | | 04/16/2044 | | | | 3,344,829 | |
17,211,261 | | Government National Mortgage Association, Series 2016-108-SM (-1 x 1 Month LIBOR USD + 6.10%, 6.10% Cap) | | | 5.99 | % (f)(i) | | | 08/20/2046 | | | | 3,642,528 | |
9,070,053 | | Government National Mortgage Association, Series 2016-99-TL | | | 2.00 | % | | | 04/16/2044 | | | | 8,732,777 | |
14,802,389 | | Government National Mortgage Association, Series 2020-112-LS (-1 x Secured Overnight Financing Rate 30 Day Average + 6.20%, 6.20% Cap) | | | 6.18 | % (f)(i) | | | 08/20/2050 | | | | 3,486,472 | |
35,505,599 | | Government National Mortgage Association, Series 2020-112-MS (-1 x 1 Month LIBOR USD + 6.30%, 6.30% Cap) | | | 6.19 | % (f)(i) | | | 08/20/2050 | | | | 8,106,493 | |
214,907,569 | | Government National Mortgage Association, Series 2020-140-ES (-1 x 1 Month LIBOR USD + 6.30%, 6.30% Cap) | | | 6.19 | % (f)(i) | | | 09/20/2050 | | | | 55,494,937 | |
60,626,600 | | Government National Mortgage Association, Series 2020-140-SG (-1 x 1 Month LIBOR USD + 6.35%, 6.35% Cap) | | | 6.24 | % (f)(i) | | | 09/20/2050 | | | | 13,798,578 | |
55,471,193 | | Government National Mortgage Association, Series 2020-162-QS (-1 x 1 Month LIBOR USD + 6.30%, 6.30% Cap) | | | 6.19 | % (f)(i) | | | 10/20/2050 | | | | 13,375,758 | |
75,457,089 | | Government National Mortgage Association, Series 2020-166-SM (-1 x 1 Month LIBOR USD + 6.30%, 6.30% Cap) | | | 6.19 | % (f)(i) | | | 11/20/2050 | | | | 16,724,679 | |
21,143,709 | | Government National Mortgage Association, Series 2020-167-NS (-1 x 1 Month LIBOR USD + 6.30%, 6.30% Cap) | | | 6.19 | % (f)(i) | | | 11/20/2050 | | | | 4,938,084 | |
44,187,226 | | Government National Mortgage Association, Series 2020-181-SA (-1 x 1 Month LIBOR USD + 6.30%, 6.30% Cap) | | | 6.19 | % (f)(i) | | | 12/20/2050 | | | | 10,497,506 | |
52,738,368 | | Government National Mortgage Association, Series 2020-188-NS (-1 x 1 Month LIBOR USD + 6.30%, 6.30% Cap) | | | 6.19 | % (f)(i) | | | 12/20/2050 | | | | 12,609,680 | |
27,149,091 | | Government National Mortgage Association, Series 2020-98-SA (-1 x 1 Month LIBOR USD + 6.15%, 6.15% Cap) | | | 6.04 | % (f)(i) | | | 07/20/2050 | | | | 5,835,140 | |
295,982,494 | | Government National Mortgage Association, Series 2021-12-IO | | | 0.98 | % (b)(f) | | | 03/16/2063 | | | | 26,249,385 | |
39,375,565 | | Government National Mortgage Association, Series 2021-20-IO | | | 1.12 | % (b)(f) | | | 08/16/2062 | | | | 3,769,950 | |
15,864,105 | | Government National Mortgage Association, Series 2021-25-EI | | | 2.50 | % (f) | | | 02/20/2051 | | | | 2,103,503 | |
74,019,138 | | Government National Mortgage Association, Series 2021-2-IO | | | 0.92 | % (b)(f) | | | 06/16/2063 | | | | 6,288,200 | |
26,956,577 | | Government National Mortgage Association, Series 2021-30-IB | | | 2.50 | % (f) | | | 02/20/2051 | | | | 4,319,061 | |
659,680,501 | | Government National Mortgage Association, Series 2021-45-IO | | | 0.84 | % (b)(f) | | | 04/16/2063 | | | | 54,599,908 | |
30,075,000 | | Government National Mortgage Association, Series 2021-52-IO | | | 0.85 | % (b)(f) | | | 04/16/2063 | | | | 2,465,335 | |
68,569,070 | | Government National Mortgage Association, Series 2021-7-MI | | | 2.50 | % (f) | | | 01/20/2051 | | | | 10,805,025 | |
| | | | | | | | | | | | | | |
Total US Government and Agency Mortgage Backed Obligations (Cost $23,319,124,346) | | | | | | | | 23,903,776,707 | |
| | | | | | | | | | | | | | |
US Government and Agency Obligations—7.3% | |
54,900,000 | | Tennessee Valley Authority | | | 4.25 | % | | | 09/15/2065 | | | | 70,647,844 | |
100,000,000 | | United States Treasury Notes | | | 0.38 | % | | | 12/31/2025 | | | | 97,675,781 | |
320,000,000 | | United States Treasury Notes | | | 0.63 | % | | | 08/15/2030 | | | | 290,050,000 | |
390,000,000 | | United States Treasury Notes | | | 1.88 | % | | | 02/15/2041 | | | | 363,248,437 | |
400,000,000 | | United States Treasury Notes | | | 1.38 | % | | | 08/15/2050 | | | | 312,250,000 | |
1,827,000,000 | | United States Treasury Notes | | | 1.63 | % | | | 11/15/2050 | | | | 1,522,975,781 | |
1,143,000,000 | | United States Treasury Notes | | | 1.88 | % | | | 02/15/2051 | | | | 1,014,591,093 | |
| | | | | | | | | | | | | | |
Total US Government and Agency Obligations (Cost $4,070,401,164) | | | | | | | | 3,671,438,936 | |
| | | | | | | | | | | | | | |
Repurchase Agreements—0.7% | | | | | |
378,000,000 | | Credit Suisse Freedom Mortgage (1 Month LIBOR USD + 2.75%, 0.5% LIBOR Floor) (Collateralized by Residential Mortgage Backed Obligations, Value $1,707,654,161) | | | 3.25 | % (e) | | | 03/01/2023 | | | | 378,000,000 | |
| | | | | | | | | | | | | | |
Total Repurchase Agreements (Cost $378,011,842) | | | | | | | | 378,000,000 | |
| | | | | | | | | | | | | | |
Short Term Investments—4.8% | |
789,392,949 | | First American Government Obligations Fund—Class U | | | 0.04 | % (k) | | | | | | | 789,392,949 | |
789,392,948 | | JP Morgan U.S. Government Money Market Fund—Institutional Share Class | | | 0.04 | % (k) | | | | | | | 789,392,948 | |
789,392,948 | | Morgan Stanley Institutional Liquidity Funds Government Portfolio—Institutional Share Class | | | 0.03 | % (k) | | | | | | | 789,392,948 | |
| | | | | | | | | | | | | | |
Total Short Term Investments (Cost $2,368,178,845) | | | | | | | | 2,368,178,845 | |
| | | | | | | | | | | | | | |
Total Investments—103.4% (Cost $52,507,462,957) | | | | | | | | 51,933,586,235 | |
Liabilities in Excess of Other Assets—(3.4)% | | | | | | | | (1,713,268,729 | ) |
| | | | | | | | | | | | | | |
NET ASSETS—100.0% | | | | | | | $ | 50,220,317,506 | |
| | | | | | | | | | | | | | |
| | | | | | | | | | | | | | |
Principal Amount $/Shares | | Security Description | | Rate | | | Maturity | | | Value $ | |
Asset Backed Obligations - 3.6% | | | | | | | | | |
5,699,455 | | AASET Ltd., Series 2019-2-A | | | 3.38 | % (a) | | | 10/16/2039 | | | | 5,714,998 | |
13,605,297 | | Business Jet Securities LLC, Series 2020-1A-A | | | 2.98 | % (a) | | | 11/15/2035 | | | | 13,752,234 | |
17,019,737 | | Castlelake Aircraft Securitization Trust, Series 2016-1-A | | | 4.45 | % | | | 08/15/2041 | | | | 17,081,774 | |
17,803,797 | | Castlelake Aircraft Securitization Trust, Series 2017-1-A | | | 3.97 | % | | | 07/15/2042 | | | | 17,863,582 | |
3,577,798 | | Castlelake Aircraft Securitization Trust, Series 2018-1-A | | | 4.13 | % (a) | | | 06/15/2043 | | | | 3,594,238 | |
6,342,564 | | Castlelake Aircraft Structured Trust, Series 2019-1A-A | | | 3.97 | % (a) | | | 04/15/2039 | | | | 6,384,279 | |
13,592,043 | | Castlelake Aircraft Structured Trust, Series 2021-1A-A | | | 3.47 | % (a) | | | 01/15/2046 | | | | 13,861,668 | |
6,941,853 | | CLI Funding LLC, Series 2019-1A-A | | | 3.71 | % (a) | | | 05/18/2044 | | | | 6,981,804 | |
1,880,000 | | CLI Funding LLC, Series 2020-1A-A | | | 2.08 | % (a) | | | 09/18/2045 | | | | 1,879,128 | |
110,159 | | CLUB Credit Trust, Series 2018-P3-A | | | 3.82 | % (a) | | | 01/15/2026 | | | | 110,409 | |
7,480,493 | | College Ave Student Loans LLC, Series 2018-A-A1 (1 Month LIBOR USD + 1.20% ) | | | 1.31 | % (a) | | | 12/26/2047 | | | | 7,539,164 | |
1,477,500 | | DB Master Finance LLC, Series 2019-1A-A2I | | | 3.79 | % (a) | | | 05/20/2049 | | | | 1,514,645 | |
7,000,000 | | Exeter Automobile Receivables Trust, Series 2021-1A-D | | | 1.08 | % | | | 11/16/2026 | | | | 6,946,475 | |
8,500,000 | | Exeter Automobile Receivables Trust, Series 2021-1A-E | | | 2.21 | % (a) | | | 02/15/2028 | | | | 8,402,509 | |
3,513,381 | | GAIA Aviation Ltd., Series 2019-1-A | | | 3.97 | % (a)(b) | | | 12/15/2044 | | | | 3,505,508 | |
7,694,847 | | Harbour Aircraft Investments Ltd., Series 2017-1-A | | | 4.00 | % | | | 11/15/2037 | | | | 7,439,170 | |
8,305,435 | | Helios Issuer LLC, Series 2017-1A-A | | | 4.94 | % (a) | | | 09/20/2049 | | | | 8,821,127 | |
2,669,678 | | HERO Funding Trust, Series 2016-1A-A | | | 4.05 | % (a) | | | 09/20/2041 | | | | 2,796,823 | |
13,491,760 | | Horizon Aircraft Finance Ltd., Series 2019-2-A | | | 3.43 | % (a) | | | 11/15/2039 | | | | 13,130,342 | |
15,682,011 | | ITE Rail Fund Levered LP, Series 2021-1A-A | | | 2.25 | % (a) | | | 02/28/2051 | | | | 15,702,855 | |
4,825,000 | | Jimmy Johns Funding LLC, Series 2017-1A-A2II | | | 4.85 | % (a) | | | 07/30/2047 | | | | 5,123,536 | |
2,605,573 | | JOL Air Ltd., Series 2019-1-A | | | 3.97 | % (a) | | | 04/15/2044 | | | | 2,627,650 | |
14,602,087 | | MACH 1 Cayman Ltd., Series 2019-1-A | | | 3.47 | % (a) | | | 10/15/2039 | | | | 14,754,664 | |
1,620,505 | | Mosaic Solar Loan Trust, Series 2018-1A-A | | | 4.01 | % (a) | | | 06/22/2043 | | | | 1,751,341 | |
2,607,758 | | Mosaic Solar Loan Trust, Series 2019-2A-B | | | 3.28 | % (a) | | | 09/20/2040 | | | | 2,710,072 | |
7,500,000 | | Navient Private Education Loan Trust, Series 2018-A-B | | | 3.68 | % (a) | | | 02/18/2042 | | | | 7,646,332 | |
7,810,393 | | NP SPE LLC, Series 2016-1A-A1 | | | 4.16 | % (a) | | | 04/20/2046 | | | | 8,188,534 | |
5,000,000 | | NP SPE LLC, Series 2019-1A-A2 | | | 3.24 | % (a) | | | 09/20/2049 | | | | 5,097,655 | |
4,519,308 | | Pioneer Aircraft Finance Ltd., Series 2019-1-A | | | 3.97 | % (a) | | | 06/15/2044 | | | | 4,503,626 | |
19,750,000 | | Primose Funding LLC, Series 2019-1A-A2 | | | 4.48 | % (a) | | | 07/30/2049 | | | | 20,219,695 | |
4,439,547 | | Sapphire Aviation Finance Ltd., Series 2020-1A-A | | | 3.23 | % (a) | | | 03/15/2040 | | | | 4,422,978 | |
6,000,000 | | SBA Tower Trust | | | 3.17 | % (a) | | | 04/11/2022 | | | | 6,016,068 | |
2,468,750 | | SERVPRO Master Issuer LLC, Series 2019-1A-A2 | | | 3.88 | % (a) | | | 10/25/2049 | | | | 2,557,407 | |
4,976,431 | | Shenton Aircraft Investment Ltd., Series 2015-1A-A | | | 4.75 | % (a) | | | 10/15/2042 | | | | 4,945,627 | |
28,414,728 | | SoFi Alternative Trust, Series 2021-A-PT1 | | | 1.48 | % (a)(c) | | | 03/15/2047 | | | | 28,275,979 | |
23,000,000 | | SoFi Alternative Trust, Series 2021-B-PT1 | | | 1.76 | % (a)(c) | | | 02/15/2047 | | | | 23,157,343 | |
248,775 | | SoFi Consumer Loan Program Trust, Series 2017-1-B | | | 4.73 | % (a)(c) | | | 01/26/2026 | | | | 250,624 | |
731,665 | | SoFi Consumer Loan Program Trust, Series 2017-5-A2 | | | 2.78 | % (a) | | | 09/25/2026 | | | | 735,614 | |
1,480,870 | | SoFi Professional Loan Program, Series 2016-A-A2 | | | 2.76 | % (a) | | | 12/26/2036 | | | | 1,503,036 | |
5,000,000 | | SoFi Professional Loan Program, Series 2017-B-BFX | | | 3.70 | % (a)(c) | | | 05/25/2040 | | | | 5,184,721 | |
2,000,000 | | SoFi Professional Loan Program, Series 2017-C-C | | | 4.21 | % (a)(c) | | | 07/25/2040 | | | | 2,088,133 | |
72,773 | | Spruce Asset Backed Securities Trust, Series 2016-E1-A | | | 4.32 | % (a) | | | 06/15/2028 | | | | 73,536 | |
3,000,000 | | Stack Infrastructure Issuer LLC, Series 2019-2A-A2 | | | 3.08 | % (a) | | | 10/25/2044 | | | | 3,096,272 | |
2,467,823 | | START Ireland, Series 2019-1-A | | | 4.09 | % (a) | | | 03/15/2044 | | | | 2,457,154 | |
3,493,394 | | Start Ltd., Series 2018-1-A | | | 4.09 | % (a) | | | 05/15/2043 | | | | 3,509,606 | |
569,035 | | Start Ltd., Series 2019-2-A | | | 3.54 | % (a) | | | 11/15/2044 | | | | 559,494 | |
4,534,184 | | Sunnova Helios Issuer LLC, Series 2018-1A-A | | | 4.87 | % (a) | | | 07/20/2048 | | | | 4,878,444 | |
5,373,224 | | Sunnova Sol LLC, Series 2020-1A-A | | | 3.35 | % (a) | | | 02/01/2055 | | | | 5,529,035 | |
4,841,983 | | Sunrun Atlas Issuer LLC, Series 2019-2-A | | | 3.61 | % (a) | | | 02/01/2055 | | | | 5,126,382 | |
14,662,500 | | Taco Bell Funding LLC, Series 2018-1A-A2I | | | 4.32 | % (a) | | | 11/25/2048 | | | | 14,796,203 | |
211,667 | | Textainer Marine Containers Ltd., Series 2019-1A-A | | | 3.96 | % (a) | | | 04/20/2044 | | | | 212,077 | |
5,000,000 | | Upgrade Master Pass-Thru Trust, Series 2021-PT3-A | | | 5.72 | % (a) | | | 06/15/2027 | | | | 5,030,695 | |
8,500,000 | | Upstart Pass-Through Trust Series, Series 2021-ST2-A | | | 2.50 | % (a) | | | 04/20/2027 | | | | 8,586,741 | |
2,680,410 | | Upstart Securitization Trust, Series 2020-2-A | | | 2.31 | % (a) | | | 11/20/2030 | | | | 2,701,668 | |
8,000,000 | | Vantage Data Centers Issuer LLC, Series 2020-2A-A2 | | | 1.99 | % (a) | | | 09/15/2045 | | | | 7,877,528 | |
5,000,000 | | VB-S1 Issuer LLC, Series 2018-1A-C | | | 3.41 | % (a) | | | 02/15/2048 | | | | 5,152,195 | |
2,500,000 | | VB-S1 Issuer LLC, Series 2020-1A-C2 | | | 3.03 | % (a) | | | 06/15/2050 | | | | 2,620,525 | |
11,752,653 | | Vivint Solar Financing LLC, Series 2020-1A-A | | | 2.21 | % (a) | | | 07/31/2051 | | | | 11,615,417 | |
12,454,910 | | Wave LLC, Series 2019-1-A | | | 3.60 | % (a) | | | 09/15/2044 | | | | 12,517,658 | |
| | | | | | | | | | | | | | |
Total Asset Backed Obligations (Cost $407,677,251) | | | | | | | | 411,123,997 | |
| | | | | | | | | | | | | | |
Bank Loans—3.8% | | | | | | | | | | | | |
1,265,389 | | 1011778 B.C. Unlimited Liability Company, Senior Secured First Lien Term Loan (1 Month LIBOR USD + 1.75% ) | | | 1.86 | % | | | 11/19/2026 | | | | 1,244,435 | |
1,315,000 | | AAdvantage Loyalty IP, Ltd., Senior Secured First Lien Term Loan | | | 5.50 | % (d) | | | 03/24/2028 | | | | 1,348,907 | |
2,110,628 | | Access CIG LLC, Senior Secured First Lien Term Loan (1 Month LIBOR USD + 3.75% ) | | | 3.87 | % | | | 02/27/2025 | | | | 2,096,676 | |
1,918,834 | | Acrisure LLC, Senior Secured First Lien Term Loan (3 Month LIBOR USD + 3.50% ) | | | 3.70 | % | | | 02/16/2027 | | | | 1,899,453 | |
1,000,000 | | Acuris Finance US, Inc., Senior Secured First Lien Term Loan (3 Month LIBOR USD + 4.00%, 0.50% Floor) | | | 4.50 | % | | | 02/16/2028 | | | | 993,750 | |
2,703,541 | | Agiliti Health, Inc., Senior Secured First Lien Term Loan (1 Month LIBOR USD + 2.75% ) | | | 2.88 | % | | | 01/05/2026 | | | | 2,666,367 | |
1,553,222 | | Air Methods Corporation, Senior Secured First Lien Term Loan (3 Month LIBOR USD + 3.50%, 1.00% Floor) | | | 4.50 | % | | | 04/22/2024 | | | | 1,507,115 | |
1,698,064 | | Aldevron LLC, Senior Secured First Lien Term Loan (1 Month LIBOR USD + 3.25%, 1.00% Floor) | | | 4.25 | % | | | 10/12/2026 | | | | 1,699,125 | |
2,484,648 | | Alera Group Intermediate Holdings, Inc., Senior Secured First Lien Term Loan (1 Month LIBOR USD + 4.00%, 0.50% Floor) | | | 4.50 | % | | | 08/01/2025 | | | | 2,487,753 | |
1,760,000 | | Aligned Energy LLC | | | 3.36 | % (d)(g) | | | 09/02/2023 | | | | 1,760,000 | |
4,240,000 | | Aligned Energy LLC, Senior Secured First Lien Term Loan (3 Month LIBOR USD + 3.25%, 0.75% Floor) | | | 4.00 | % | | | 09/02/2023 | | | | 4,240,000 | |
1,840,000 | | AlixPartners LLP, Senior Secured First Lien Term Loan (1 Month LIBOR USD + 2.75%, 0.50% Floor) | | | 3.25 | % | | | 02/04/2028 | | | | 1,835,400 | |
503,738 | | Alliance Laundry Systems LLC, Senior Secured First Lien Term Loan (3 Month LIBOR USD + 3.50%, 0.75% Floor) | | | 4.25 | % | | | 10/08/2027 | | | | 503,657 | |
1,750,315 | | Alliant Holdings Intermediate LLC, Senior Secured First Lien Term Loan (1 Month LIBOR USD + 3.25% ) | | | 3.36 | % | | | 05/09/2025 | | | | 1,730,423 | |
2,686,000 | | Allied Universal Holdco LLC, Senior Secured First Lien Term Loan (1 Month LIBOR USD + 4.25% ) | | | 4.36 | % | | | 07/10/2026 | | | | 2,681,810 | |
1,301,252 | | Almonde, Inc., Senior Secured First Lien Term Loan (6 Month LIBOR USD + 3.50%, 1.00% Floor) | | | 4.50 | % | | | 06/13/2024 | | | | 1,277,166 | |
450,000 | | Almonde, Inc., Senior Secured Second Lien Term Loan (6 Month LIBOR USD + 7.25%, 1.00% Floor) | | | 8.25 | % | | | 06/16/2025 | | | | 453,431 | |
280,000 | | Alpha 3 B.V., Senior Secured First Lien Term Loan (3 Month LIBOR USD + 2.50%, 0.50% Floor) | | | 3.00 | % | | | 03/17/2028 | | | | 279,518 | |
2,140,906 | | Alterra Mountain Company, Senior Secured First Lien Term Loan (1 Month LIBOR USD + 2.75% ) | | | 2.86 | % | | | 07/31/2024 | | | | 2,108,803 | |
1,230,251 | | Amentum Government Services Holdings LLC, Senior Secured First Lien Term Loan (1 Month LIBOR USD + 3.50% ) | | | 3.61 | % | | | 02/01/2027 | | | | 1,223,079 | |
926,650 | | American Airlines, Inc., Senior Secured First Lien Term Loan (1 Month LIBOR USD + 1.75% ) | | | 1.86 | % | | | 01/29/2027 | | | | 848,200 | |
450,000 | | American Airlines, Inc., Senior Secured First Lien Term Loan (1 Month LIBOR USD + 2.00% ) | | | 2.11 | % | | | 04/28/2023 | | | | 430,243 | |
448,293 | | American Airlines, Inc., Senior Secured First Lien Term Loan (1 Month LIBOR USD + 2.00% ) | | | 2.11 | % | | | 12/15/2023 | | | | 429,552 | |
458,850 | | American Residential Services LLC, Senior Secured First Lien Term Loan (3 Month LIBOR USD + 3.50%, 0.75% Floor) | | | 4.25 | % | | | 10/15/2027 | | | | 458,276 | |
| | American Tire Distributors, Inc., Senior Secured First Lien Term Loan | | | | | | | | | | | | |
805,357 | | (1MonthLIBORUSD+7.50%,1.00% Floor)(1MonthLIBORUSD+5.50% +1.50% PIK) | | | 8.50 | % | | | 09/02/2024 | | | | 789,251 | |
92,477 | | (3MonthLIBORUSD+7.50%,1.00% Floor)(3MonthLIBORUSD+5.50% +1.50% PIK) | | | 8.50 | % | | | 09/02/2024 | | | | 90,627 | |
980,000 | | American Trailer World Corporation, Senior Secured First Lien Term Loan (1 Month LIBOR USD + 3.75%, 0.75% Floor) | | | 4.50 | % | | | 03/03/2028 | | | | 975,105 | |
134,663 | | AmWINS Group LLC, Senior Secured First Lien Term Loan (1 Month LIBOR USD + 2.25%, 0.75% Floor) | | | 3.00 | % | | | 02/22/2028 | | | | 133,853 | |
| | Applied Systems, Inc., Senior Secured First Lien Term Loan | | | | | | | | | | | | |
53,465 | | (PrimeRate+2.00%,0.50% Floor) | | | 5.25 | % | | | 09/19/2024 | | | | 53,334 | |
3,849,065 | | (3MonthLIBORUSD+2.00%,0.50% Floor) | | | 3.50 | % | | | 09/19/2024 | | | | 3,839,694 | |
2,014,950 | | Arches Buyer, Inc., Senior Secured First Lien Term Loan (1 Month LIBOR USD + 3.25%, 0.50% Floor) | | | 3.75 | % | | | 12/06/2027 | | | | 2,004,372 | |
653,175 | | Arctic Glacier U.S.A., Inc., Senior Secured First Lien Term Loan (3 Month LIBOR USD + 3.50%, 1.00% Floor) | | | 4.50 | % | | | 03/20/2024 | | | | 619,158 | |
2,508,446 | | Ascend Learning LLC, Senior Secured First Lien Term Loan (1 Month LIBOR USD + 3.00%, 1.00% Floor) | | | 4.00 | % | | | 07/12/2024 | | | | 2,502,175 | |
2,526,776 | | AssuredPartners, Inc., Senior Secured First Lien Term Loan (1 Month LIBOR USD + 3.50% ) | | | 3.61 | % | | | 02/12/2027 | | | | 2,501,509 | |
2,131,209 | | Asurion LLC, Senior Secured First Lien Term Loan (1 Month LIBOR USD + 3.00% ) | | | 3.11 | % | | | 11/03/2023 | | | | 2,127,000 | |
1,958,106 | | Asurion LLC, Senior Secured First Lien Term Loan (1 Month LIBOR USD + 3.25% ) | | | 3.36 | % | | | 12/23/2026 | | | | 1,948,149 | |
75,000 | | Asurion LLC, Senior Secured First Lien Term Loan (1 Month LIBOR USD + 3.25% ) | | | 3.36 | % | | | 07/30/2027 | | | | 74,555 | |
295,000 | | Asurion LLC, Senior Secured Second Lien Term Loan (1 Month LIBOR USD + 5.25% ) | | | 5.36 | % | | | 01/31/2028 | | | | 300,863 | |
1,664,773 | | Athenahealth, Inc., Senior Secured First Lien Term Loan (3 Month LIBOR USD + 4.25% ) | | | 4.45 | % | | | 02/11/2026 | | | | 1,671,016 | |
600,000 | | Autokiniton US Holdings, Inc., Senior Secured First Lien Term Loan | | | 5.00 | % (d) | | | 03/29/2028 | | | | 602,625 | |
587,988 | | Avantor Funding, Inc., Senior Secured First Lien Term Loan (1 Month LIBOR USD + 2.25%, 1.00% Floor) | | | 3.25 | % | | | 11/21/2024 | | | | 589,090 | |
857,850 | | Avantor Funding, Inc., Senior Secured First Lien Term Loan (1 Month LIBOR USD + 2.25%, 1.00% Floor) | | | 3.25 | % | | | 11/08/2027 | | | | 859,244 | |
1,505,000 | | Avaya, Inc., Senior Secured First Lien Term Loan (1 Month LIBOR USD + 4.00% ) | | | 4.11 | % | | | 12/15/2027 | | | | 1,506,618 | |
1,047,606 | | Avaya, Inc., Senior Secured First Lien Term Loan (1 Month LIBOR USD + 4.25% ) | | | 4.36 | % | | | 12/15/2027 | | | | 1,049,816 | |
1,278,636 | | Azalea TopCo, Inc., Senior Secured First Lien Term Loan (3 Month LIBOR USD + 3.50% ) | | | 3.71 | % | | | 07/24/2026 | | | | 1,269,046 | |
1,256,250 | | Bausch Health Companies, Inc., Senior Secured First Lien Term Loan (1 Month LIBOR USD + 2.75% ) | | | 2.86 | % | | | 11/27/2025 | | | | 1,250,836 | |
960,389 | | Bausch Health Companies, Inc., Senior Secured First Lien Term Loan (1 Month LIBOR USD + 3.00% ) | | | 3.11 | % | | | 06/02/2025 | | | | 958,478 | |
811,203 | | BellRing Brands LLC, Senior Secured First Lien Term Loan (1 Month LIBOR USD + 4.00%, 0.75% Floor) | | | 4.75 | % | | | 10/21/2024 | | | | 817,624 | |
2,866,077 | | BioScrip, Inc., Senior Secured First Lien Term Loan (1 Month LIBOR USD + 3.75% ) | | | 3.86 | % | | | 08/06/2026 | | | | 2,858,467 | |
2,093,977 | | Blackhawk Network Holdings, Inc., Senior Secured First Lien Term Loan (1 Month LIBOR USD + 3.00% ) | | | 3.11 | % | | | 06/16/2025 | | | | 2,068,357 | |
1,629,419 | | Blackstone CQP Holdco LP, Senior Secured First Lien Term Loan (3 Month LIBOR USD + 3.50% ) | | | 3.69 | % | | | 09/30/2024 | | | | 1,628,026 | |
1,639,155 | | Boxer Parent Company, Inc., Senior Secured First Lien Term Loan (1 Month LIBOR USD + 3.75% ) | | | 3.86 | % | | | 10/02/2025 | | | | 1,634,221 | |
1,884,395 | | Brand Industrial Services, Inc., Senior Secured First Lien Term Loan (3 Month LIBOR USD + 4.25%, 1.00% Floor) | | | 5.25 | % | | | 06/21/2024 | | | | 1,859,201 | |
1,332,976 | | Brazos Delaware LLC, Senior Secured First Lien Term Loan (1 Month LIBOR USD + 4.00% ) | | | 4.11 | % | | | 05/21/2025 | | | | 1,248,831 | |
1,452,468 | | Bright Bidco B.V., Senior Secured First Lien Term Loan (6 Month LIBOR USD + 3.50%, 1.00% Floor) | | | 4.50 | % | | | 06/28/2024 | | | | 1,114,769 | |
1,162,735 | | Brookfield WEC Holdings, Inc., Senior Secured First Lien Term Loan (1 Month LIBOR USD + 2.75%, 0.50% Floor) | | | 3.25 | % | | | 08/01/2025 | | | | 1,154,381 | |
1,126,488 | | BY Crown Parent LLC, Senior Secured First Lien Term Loan (1 Month LIBOR USD + 3.00%, 1.00% Floor) | | | 4.00 | % | | | 02/02/2026 | | | | 1,129,129 | |
827,925 | | Cablevision Lightpath LLC, Senior Secured First Lien Term Loan (1 Month LIBOR USD + 3.25%, 0.50% Floor) | | | 3.75 | % | | | 11/30/2027 | | | | 827,838 | |
2,565,229 | | Caesars Resort Collection LLC, Senior Secured First Lien Term Loan (1 Month LIBOR USD + 2.75% ) | | | 2.86 | % | | | 12/23/2024 | | | | 2,531,201 | |
1,014,900 | | Caesars Resort Collection LLC, Senior Secured First Lien Term Loan (1 Month LIBOR USD + 4.50% ) | | | 4.61 | % | | | 07/21/2025 | | | | 1,018,244 | |
216,700 | | Calpine Corporation, Senior Secured First Lien Term Loan (1 Month LIBOR USD + 2.00% ) | | | 2.11 | % | | | 08/12/2026 | | | | 214,571 | |
836,505 | | Cambium Learning Group, Inc., Senior Secured First Lien Term Loan (3 Month LIBOR USD + 4.50% ) | | | 5.25 | % | | | 12/18/2025 | | | | 838,546 | |
2,494,690 | | Camelot U.S. Acquisition 1 Company, Senior Secured First Lien Term Loan (1 Month LIBOR USD + 3.00% ) | | | 3.11 | % | | | 10/30/2026 | | | | 2,477,926 | |
615,350 | | Carnival Corporation, Senior Secured First Lien Term Loan (1 Month LIBOR USD + 7.50%, 1.00% Floor) | | | 8.50 | % | | | 06/30/2025 | | | | 636,669 | |
2,564,245 | | Castle US Holding Corporation, Senior Secured First Lien Term Loan (3 Month LIBOR USD + 3.75% ) | | | 3.95 | % | | | 01/29/2027 | | | | 2,537,000 | |
2,106,723 | | Cengage Learning, Inc., Senior Secured First Lien Term Loan (6 Month LIBOR USD + 4.25%, 1.00% Floor) | | | 5.25 | % | | | 06/07/2023 | | | | 2,088,732 | |
| | Change Healthcare Holdings, Inc., Senior Secured First Lien Term Loan | | | | | | | | | | | | |
1,188,978 | | (1MonthLIBORUSD+2.50%,1.00% Floor) | | | 3.50 | % | | | 03/01/2024 | | | | 1,189,044 | |
1,296,864 | | (3MonthLIBORUSD+2.50%,1.00% Floor) | | | 3.50 | % | | | 03/01/2024 | | | | 1,296,935 | |
1,260,000 | | Charter NEX US, Inc., Senior Secured First Lien Term Loan (1 Month LIBOR USD + 4.25%, 0.75% Floor) | | | 5.00 | % | | | 12/01/2027 | | | | 1,264,164 | |
2,506,000 | | CHG Healthcare Services, Inc., Senior Secured First Lien Term Loan (6 Month LIBOR USD + 3.00%, 1.00% Floor) | | | 4.00 | % | | | 06/07/2023 | | | | 2,501,302 | |
2,277,642 | | CHG PPC Parent LLC, Senior Secured First Lien Term Loan (1 Month LIBOR USD + 2.75% ) | | | 2.86 | % | | | 03/31/2025 | | | | 2,249,172 | |
794,622 | | Cincinnati Bell, Inc., Senior Secured First Lien Term Loan (1 Month LIBOR USD + 3.25%, 1.00% Floor) | | | 4.25 | % | | | 10/02/2024 | | | | 795,206 | |
2,496,402 | | Clarios Global LP, Senior Secured First Lien Term Loan (1 Month LIBOR USD + 3.25% ) | | | 3.36 | % | | | 04/30/2026 | | | | 2,474,558 | |
1,285,276 | | Clear Channel Outdoor Holdings, Inc. Senior Secured First Lien Term Loan (1 Month LIBOR USD + 3.50% ) | | | 3.71 | % | | | 08/21/2026 | | | | 1,238,331 | |
1,973,518 | | ClubCorp Holdings, Inc., Senior Secured First Lien Term Loan (3 Month LIBOR USD + 2.75% ) | | | 2.95 | % | | | 09/18/2024 | | | | 1,860,346 | |
915,000 | | CNT Holdings I Corporation, Senior Secured First Lien Term Loan (6 Month LIBOR USD + 3.75%, 0.75% Floor) | | | 4.50 | % | | | 11/08/2027 | | | | 914,286 | |
573,563 | | CommerceHub, Inc., Senior Secured First Lien Term Loan (1 Month LIBOR USD + 4.00%, 0.75% Floor) | | | 4.75 | % | | | 12/29/2027 | | | | 574,819 | |
2,050,393 | | Compass Power Generation LLC, Senior Secured First Lien Term Loan (1 Month LIBOR USD + 3.50%, 1.00% Floor) | | | 4.50 | % | | | 12/20/2024 | | | | 2,040,653 | |
663,300 | | Connect U.S. Finco LLC, Senior Secured First Lien Term Loan (1 Month LIBOR USD + 3.50%, 1.00% Floor) | | | 4.50 | % | | | 12/11/2026 | | | | 661,987 | |
1,019,875 | | Conservice Midco LLC, Senior Secured First Lien Term Loan (3 Month LIBOR USD + 4.25% ) | | | 4.45 | % | | | 05/13/2027 | | | | 1,020,640 | |
278,462 | | Consolidated Communications, Inc., Senior Secured First Lien Term Loan (1 Month LIBOR USD + 4.75%, 1.00% Floor) | | | 5.75 | % | | | 10/04/2027 | | | | 279,201 | |
450,000 | | Constant Contact, Inc. | | | 4.75 | % (d)(g) | | | 02/10/2028 | | | | 447,750 | |
1,675,000 | | Constant Contact, Inc., Senior Secured First Lien Term Loan (1 Month LIBOR USD + 4.00%, 0.75% Floor) | | | 4.75 | % | | | 02/10/2028 | | | | 1,666,625 | |
1,441,943 | | Cornerstone OnDemand, Inc., Senior Secured First Lien Term Loan (1 Month LIBOR USD + 4.25% ) | | | 4.36 | % | | | 04/22/2027 | | | | 1,445,101 | |
2,040,000 | | CP Atlas Buyer, Inc., Senior Secured First Lien Term Loan (3 Month LIBOR USD + 3.75%, 0.50% Floor) | | | 4.25 | % | | | 11/23/2027 | | | | 2,029,647 | |
1,163,988 | | CSC Holdings LLC, Senior Secured First Lien Term Loan (1 Month LIBOR USD + 2.25% ) | | | 2.36 | % | | | 07/17/2025 | | | | 1,150,666 | |
519,400 | | CSC Holdings LLC, Senior Secured First Lien Term Loan (1 Month LIBOR USD + 2.25% ) | | | 2.36 | % | | | 01/15/2026 | | | | 513,071 | |
1,351,971 | | CSM Bakery Solutions LLC, Senior Secured First Lien Term Loan (3 Month LIBOR USD + 6.25%, 1.00% Floor) | | | 7.25 | % | | | 01/04/2022 | | | | 1,347,090 | |
2,537,858 | | Cvent, Inc., Senior Secured First Lien Term Loan (1 Month LIBOR USD + 3.75% ) | | | 3.90 | % | | | 11/29/2024 | | | | 2,476,530 | |
482,375 | | Cyanco Intermediate 2 Corporation, Senior Secured First Lien Term Loan (1 Month LIBOR USD + 3.50% ) | | | 3.61 | % | | | 03/17/2025 | | | | 480,747 | |
1,318,742 | | Cyxtera DC Holdings, Inc., Senior Secured First Lien Term Loan (6 Month LIBOR USD + 3.00%, 1.00% Floor) | | | 4.00 | % | | | 05/01/2024 | | | | 1,268,689 | |
1,646,430 | | DCert Buyer, Inc., Senior Secured First Lien Term Loan (1 Month LIBOR USD + 4.00% ) | | | 4.11 | % | | | 10/16/2026 | | | | 1,645,631 | |
2,005,260 | | Deerfield Dakota Holding LLC, Senior Secured First Lien Term Loan (1 Month LIBOR USD + 3.75%, 1.00% Floor) | | | 4.75 | % | | | 04/09/2027 | | | | 2,010,274 | |
2,378,258 | | Delta 2 (Lux) SARL, Senior Secured First Lien Term Loan (1 Month LIBOR USD + 2.50%, 1.00% Floor) | | | 3.50 | % | | | 02/01/2024 | | | | 2,359,493 | |
1,130,000 | | Delta Topco, Inc., Senior Secured First Lien Term Loan (3 Month LIBOR USD + 3.75%, 0.75% Floor) | | | 4.50 | % | | | 12/01/2027 | | | | 1,130,203 | |
2,263,217 | | Dentalcorp Perfect Smile ULC, Senior Secured First Lien Term Loan (1 Month LIBOR USD + 3.75%, 1.00% Floor) | | | 4.75 | % | | | 06/06/2025 | | | | 2,249,072 | |
2,315,152 | | DG Investment Intermediate Holdings 2, Inc., Senior Secured First Lien | | | 4.50 | % (d) | | | 03/18/2028 | | | | 2,307,199 | |
484,848 | | DG Investment Intermediate Holdings 2, Inc., Senior Secured First Lien | | | 4.50 | % (d) | | | 03/18/2028 | | | | 483,183 | |
250,000 | | DG Investment Intermediate Holdings 2, Inc., Senior Secured Second Lien | | | 7.50 | % (d) | | | 03/18/2029 | | | | 251,250 | |
2,149,432 | | Diamond (BC) B.V., Senior Secured First Lien Term Loan (1 Month LIBOR USD + 3.00% ) | | | 3.11 | % | | | 09/06/2024 | | | | 2,142,070 | |
721,555 | | Diamond Sports Group LLC, Senior Secured First Lien Term Loan (1 Month LIBOR USD + 3.25% ) | | | 3.36 | % | | | 08/24/2026 | | | | 500,878 | |
336,054 | | Dynasty Acquisition Company, Inc., Senior Secured First Lien Term Loan (3 Month LIBOR USD + 3.50% ) | | | 3.75 | % | | | 04/06/2026 | | | | 326,660 | |
625,061 | | Dynasty Acquisition Company, Inc., Senior Secured First Lien Term Loan (3 Month LIBOR USD + 3.50% ) | | | 3.75 | % | | | 04/06/2026 | | | | 607,588 | |
2,143,410 | | EAB Global, Inc., Senior Secured First Lien Term Loan (6 Month LIBOR USD + 3.75%, 1.00% Floor) | | | 4.75 | % | | | 11/15/2024 | | | | 2,138,051 | |
720,000 | | Edelman Financial Center LLC, Senior Secured First Lien | | | 4.50 | % (d) | | | 04/05/2028 | | | | 717,077 | |
2,569,059 | | Edelman Financial Center LLC, Senior Secured First Lien Term Loan (1 Month LIBOR USD + 3.00% ) | | | 3.11 | % | | | 07/21/2025 | | | | 2,559,836 | |
655,000 | | EG America LLC, Senior Secured First Lien | | | 4.75 | % (d) | | | 03/12/2026 | | | | 649,269 | |
818,304 | | EG Group, Ltd., Senior Secured First Lien Term Loan (3 Month LIBOR USD + 4.00% ) | | | 4.20 | % | | | 02/06/2025 | | | | 806,614 | |
1,170,000 | | Endo Luxembourg Finance Company I SARL, Senior Secured First Lien | | | 5.75 | % (d) | | | 03/25/2028 | | | | 1,160,248 | |
2,535,000 | | Endurance International Group, Inc., The, Senior Secured First Lien Term Loan (6 Month LIBOR USD + 3.50%, 0.75% Floor) | | | 4.25 | % | | | 02/10/2028 | | | | 2,512,819 | |
1,090,000 | | Energizer Holdings, Inc., Senior Secured First Lien Term Loan (1 Month LIBOR USD + 2.25%, 0.50% Floor) | | | 2.75 | % | | | 12/22/2027 | | | | 1,087,727 | |
2,789,526 | | Envision Healthcare Corporation, Senior Secured First Lien Term Loan (1 Month LIBOR USD + 3.75% ) | | | 3.86 | % | | | 10/10/2025 | | | | 2,415,855 | |
120,000 | | eResearchTechnology, Inc., Senior Secured First Lien | | | 5.50 | % (d) | | | 02/04/2027 | | | | 120,300 | |
840,220 | | ESH Hospitality, Inc., Senior Secured First Lien Term Loan (1 Month LIBOR USD + 2.00% ) | | | 2.11 | % | | | 09/18/2026 | | | | 835,645 | |
1,024,172 | | EW Scripps Company, Senior Secured First Lien Term Loan (1 Month LIBOR USD + 2.56%, 0.75% Floor) | | | 3.31 | % | | | 05/01/2026 | | | | 1,020,972 | |
1,855,666 | | Excelitas Technologies Corporation, Senior Secured First Lien Term Loan (3 Month LIBOR USD + 3.50%, 1.00% Floor) | | | 4.50 | % | | | 12/02/2024 | | | | 1,857,929 | |
877,800 | | Exgen Renewables LLC, Senior Secured First Lien Term Loan (3 Month LIBOR USD + 2.75%, 1.00% Floor) | | | 3.75 | % | | | 12/15/2027 | | | | 879,995 | |
2,072,859 | | Filtration Group Corporation, Senior Secured First Lien Term Loan (1 Month LIBOR USD + 3.00% ) | | | 3.11 | % | | | 03/31/2025 | | | | 2,046,046 | |
1,527,185 | | First Advantage Holdings LLC, Senior Secured First Lien Term Loan (1 Month LIBOR USD + 3.00% ) | | | 3.11 | % | | | 01/29/2027 | | | | 1,518,022 | |
1,101,948 | | Flex Acquisition Company, Inc., Senior Secured First Lien Term Loan (3 Month LIBOR USD + 3.25% ) | | | 3.45 | % | | | 06/30/2025 | | | | 1,085,490 | |
1,967,889 | | Flexential Intermediate Corporation, Senior Secured First Lien Term Loan (3 Month LIBOR USD + 3.50% ) | | | 3.70 | % | | | 08/01/2024 | | | | 1,843,666 | |
2,203,560 | | Flexera Software LLC, Senior Secured First Lien Term Loan (3 Month LIBOR USD + 3.75%, 0.75% Floor) | | | 4.50 | % | | | 03/03/2028 | | | | 2,210,446 | |
603,019 | | Foresight Energy LLC, Senior Secured First Lien Term Loan (1 Month LIBOR USD + 8.00%, 1.50% Floor) | | | 9.50 | % (e) | | | 06/30/2027 | | | | 603,019 | |
500,825 | | Forterra Finance LLC, Senior Secured First Lien Term Loan (1 Month LIBOR USD + 3.00%, 1.00% Floor) | | | 4.00 | % | | | 10/25/2023 | | | | 502,328 | |
1,270,000 | | Foundation Building Materials, Inc., Senior Secured First Lien Term Loan (1 Month LIBOR USD + 3.25%, 0.50% Floor) | | | 3.75 | % | | | 01/31/2028 | | | | 1,259,999 | |
548,107 | | Frontdoor, Inc., Senior Secured First Lien Term Loan (1 Month LIBOR USD + 2.50% ) | | | 2.63 | % | | | 08/18/2025 | | | | 547,764 | |
797,535 | | Frontera Generation Holdings LLC, Senior Secured First Lien Term Loan (3 Month LIBOR USD + 4.25%, 1.00% Floor) | | | 5.25 | % (f) | | | 05/02/2025 | | | | 57,821 | |
590,000 | | Frontier Communications Corporation, Senior Secured First Lien Term Loan (1 Month LIBOR USD + 4.75%, 1.00% Floor) | | | 5.75 | % | | | 10/08/2021 | | | | 589,262 | |
2,640,000 | | Garda World Security Corporation, Senior Secured First Lien | | | 4.36 | % (d) | | | 10/30/2026 | | | | 2,646,046 | |
549,450 | | Gardner Denver, Inc., Senior Secured First Lien Term Loan (1 Month LIBOR USD + 1.75% ) | | | 1.86 | % | | | 03/01/2027 | | | | 543,269 | |
1,420,000 | | Gemini HDPE LLC, Senior Secured First Lien Term Loan (3 Month LIBOR USD + 3.00%, 0.50% Floor) | | | 3.50 | % | | | 12/31/2027 | | | | 1,415,570 | |
2,383,652 | | Gentiva Health Services, Inc., Senior Secured First Lien Term Loan (1 Month LIBOR USD + 2.75% ) | | | 2.88 | % | | | 07/02/2025 | | | | 2,373,724 | |
1,375,186 | | Getty Images, Inc., Senior Secured First Lien Term Loan (1 Month LIBOR USD + 4.50% ) | | | 4.63 | % | | | 02/19/2026 | | | | 1,365,016 | |
| | Global Medical Response, Inc., Senior Secured First Lien Term Loan | | | | | | | | | | | | |
1,179,055 | | (3MonthLIBORUSD+4.75%,1.00% Floor) | | | 5.75 | % | | | 10/02/2025 | | | | 1,177,138 | |
252,358 | | (6MonthLIBORUSD+4.75%,1.00% Floor) | | | 5.75 | % | | | 10/02/2025 | | | | 251,948 | |
1,674,645 | | Golden Nugget, Inc., Senior Secured First Lien Term Loan | | | 3.70 | % | | | 10/04/2023 | | | | 1,651,476 | |
2,488,259 | | GoodRX, Inc., Senior Secured First Lien Term Loan (1 Month LIBOR USD + 2.75% ) | | | 2.86 | % | | | 10/10/2025 | | | | 2,483,145 | |
1,275,000 | | Grab Holdings, Inc., Senior Secured First Lien Term Loan (6 Month LIBOR USD + 4.50%, 1.00% Floor) | | | 5.50 | % | | | 01/29/2026 | | | | 1,302,094 | |
1,332,339 | | Graham Packaging Company, Inc., Senior Secured First Lien Term Loan (1 Month LIBOR USD + 3.00%, 0.75% Floor) | | | 3.75 | % | | | 08/04/2027 | | | | 1,325,757 | |
1,512,772 | | Granite US Holdings Corporation, Senior Secured First Lien Term Loan (1 Month LIBOR USD + 4.00% ) | | | 4.17 | % | | | 09/30/2026 | | | | 1,510,881 | |
2,420,332 | | Gray Television, Inc., Senior Secured First Lien Term Loan (1 Month LIBOR USD + 2.50% ) | | | 2.62 | % | | | 01/02/2026 | | | | 2,408,618 | |
1,930,163 | | Great Outdoors Group LLC, Senior Secured First Lien Term Loan (1 Month LIBOR USD + 4.25%, 0.75% Floor) | | | 5.00 | % | | | 03/06/2028 | | | | 1,935,712 | |
2,720,067 | | Greeneden U.S. Holdings II LLC, Senior Secured First Lien Term Loan (1 Month LIBOR USD + 4.00%, 0.75% Floor) | | | 4.75 | % | | | 12/01/2027 | | | | 2,722,787 | |
529,103 | | GTT Communications, Inc., Senior Secured First Lien Term Loan (3 Month LIBOR USD + 2.75% ) | | | 3.00 | % | | | 06/02/2025 | | | | 448,827 | |
932,542 | | Gulf Finance LLC, Senior Secured First Lien Term Loan (1 Month LIBOR USD + 5.25%, 1.00% Floor) | | | 6.25 | % | | | 08/25/2023 | | | | 776,173 | |
1,685,775 | | Harbor Freight Tools USA, Inc., Senior Secured First Lien Term Loan (1 Month LIBOR USD + 3.00%, 0.75% Floor) | | | 3.75 | % | | | 10/19/2027 | | | | 1,686,154 | |
1,242,833 | | Hayward Industries, Inc., Senior Secured First Lien Term Loan (1 Month LIBOR USD + 3.50% ) | | | 3.61 | % | | | 08/05/2024 | | | | 1,244,647 | |
2,600,000 | | Helios Software Holdings, Inc., Senior Secured First Lien Term Loan (3 Month LIBOR USD + 3.75% ) | | | 3.93 | % | | | 03/13/2028 | | | | 2,585,388 | |
766,350 | | Hexion, Inc., Senior Secured First Lien Term Loan (3 Month LIBOR USD + 3.50% ) | | | 3.71 | % | | | 07/01/2026 | | | | 767,312 | |
2,103,294 | | H-Food Holdings LLC, Senior Secured First Lien Term Loan (1 Month LIBOR USD + 3.69% ) | | | 3.80 | % | | | 05/23/2025 | | | | 2,085,774 | |
1,090,000 | | Horizon Therapeutics USA, Inc., Senior Secured First Lien Term Loan (1 Month LIBOR USD + 2.00%, 0.50% Floor) | | | 2.50 | % | | | 03/15/2028 | | | | 1,088,365 | |
822,317 | | Houston Foods, Inc., Senior Secured First Lien Term Loan (1 Month LIBOR USD + 3.75% ) | | | 3.86 | % | | | 07/21/2025 | | | | 814,607 | |
2,077,278 | | Hyland Software, Inc., Senior Secured First Lien Term Loan (1 Month LIBOR USD + 3.50%, 0.75% Floor) | | | 4.25 | % | | | 07/01/2024 | | | | 2,078,795 | |
190,000 | | Hyland Software, Inc., Senior Secured Second Lien | | | 7.00 | % (d) | | | 07/10/2025 | | | | 190,791 | |
429,663 | | Hyland Software, Inc., Senior Secured Second Lien Term Loan (1 Month LIBOR USD + 7.00%, 0.75% Floor) | | | 7.75 | % | | | 07/07/2025 | | | | 431,453 | |
437,938 | | IAA, Inc., Senior Secured First Lien Term Loan (1 Month LIBOR USD + 2.25% ) | | | 2.36 | % | | | 06/29/2026 | | | | 436,295 | |
1,112,922 | | IHeartCommunications, Inc., Senior Secured First Lien Term Loan (1 Month LIBOR USD + 3.00% ) | | | 3.11 | % | | | 05/01/2026 | | | | 1,101,098 | |
2,070,000 | | INEOS US Petrochem LLC, Senior Secured First Lien Term Loan (3 Month LIBOR USD + 2.75%, 0.50% Floor) | | | 3.25 | % | | | 01/29/2026 | | | | 2,067,092 | |
1,777,050 | | Informatica LLC, Senior Secured First Lien Term Loan (1 Month LIBOR USD + 3.25% ) | | | 3.36 | % | | | 02/25/2027 | | | | 1,766,388 | |
411,928 | | Intelsat Jackson Holdings S.A., Senior Secured First Lien Delayed-Draw Term Loan (3 Month LIBOR USD + 5.50%, 1.00% Floor) | | | 6.50 | % | | | 07/13/2022 | | | | 417,901 | |
2,739,533 | | Intelsat Jackson Holdings S.A., Senior Secured First Lien Term Loan (Prime Rate + 4.75%, 1.00% Floor) | | | 8.00 | % | | | 11/27/2023 | | | | 2,791,214 | |
2,490,000 | | ION Trading Finance Limited, Senior Secured First Lien | | | 4.86 | % (d) | | | 03/26/2028 | | | | 2,493,113 | |
1,742,711 | | ION Trading Technologies SARL | | | 5.00 | % (d) | | | 11/21/2024 | | | | 1,745,891 | |
| | IRB Holding Corporation, Senior Secured First Lien Term Loan | | | | | | | | | | | | |
3,400 | | (1MonthLIBORUSD+2.75%,1.00% Floor) | | | 3.75 | % | | | 02/05/2025 | | | | 3,377 | |
1,304,373 | | | | | 3.75 | % | | | 02/05/2025 | | | | 1,295,627 | |
1,152,113 | | IRB Holding Corporation, Senior Secured First Lien Term Loan (3 Month LIBOR USD + 3.25%, 1.00% Floor) | | | 4.25 | % | | | 12/15/2027 | | | | 1,149,411 | |
2,486,267 | | IRI Holdings, Inc., Senior Secured First Lien Term Loan (1 Month LIBOR USD + 4.25% ) | | | 4.36 | % | | | 12/01/2025 | | | | 2,490,929 | |
2,545,635 | | Iron Mountain Information Management LLC, Senior Secured First Lien Term Loan (1 Month LIBOR USD + 1.75% ) | | | 1.86 | % | | | 01/02/2026 | | | | 2,518,053 | |
1,100,000 | | Ivanti Software, Inc., Senior Secured First Lien Term Loan (1 Month LIBOR USD + 4.75%, 1.00% Floor) | | | 5.75 | % | | | 12/01/2027 | | | | 1,105,847 | |
325,084 | | Jo-Ann Stores LLC, Senior Secured First Lien Term Loan (6 Month LIBOR USD + 5.00%, 1.00% Floor) | | | 6.00 | % | | | 10/20/2023 | | | | 324,475 | |
962,704 | | KBR, Inc., Senior Secured First Lien Term Loan (1 Month LIBOR USD + 2.75% ) | | | 2.86 | % | | | 02/05/2027 | | | | 962,704 | |
175,000 | | Kenan Advantage Group, Inc., Senior Secured First Lien | | | 4.50 | % (d) | | | 03/18/2026 | | | | 174,344 | |
1,412,125 | | Kestrel Bidco, Inc., Senior Secured First Lien Term Loan (6 Month LIBOR USD + 3.00%, 1.00% Floor) | | | 4.00 | % | | | 12/11/2026 | | | | 1,372,381 | |
1,237,556 | | Kindred Healthcare, Inc., Senior Secured First Lien Term Loan (1 Month LIBOR USD + 4.50% ) | | | 4.63 | % | | | 07/02/2025 | | | | 1,242,197 | |
1,955,000 | | Kleopatra Finco SARL, Senior Secured First Lien | | | 5.25 | % (d) | | | 02/09/2026 | | | | 1,952,556 | |
580,000 | | Kodiak Building Partners, Inc., Senior Secured First Lien Term Loan (3 Month LIBOR USD + 3.25%, 0.75% Floor) | | | 4.00 | % | | | 03/10/2028 | | | | 577,100 | |
1,735,650 | | Kronos Acquisition Holdings, Inc., Senior Secured First Lien Term Loan (3 Month LIBOR USD + 3.75%, 0.50% Floor) | | | 4.25 | % | | | 12/22/2026 | | | | 1,713,173 | |
191,515 | | LBM Acquisition LLC, Senior Secured First Lien | | | 4.50 | % (d) | | | 12/17/2027 | | | | 191,031 | |
861,818 | | LBM Acquisition LLC, Senior Secured First Lien Term Loan (3 Month LIBOR USD + 3.75%, 0.75% Floor) | | | 4.50 | % | | | 12/17/2027 | | | | 859,638 | |
91,521 | | Lealand Finance Company B.V., Senior Secured First Lien Term Loan (1 Month LIBOR USD + 1.00% ) | | | 1.11 | % | | | 06/30/2025 | | | | 51,862 | |
439,249 | | Lions Gate Capital Holdings LLC, Senior Secured First Lien Term Loan (1 Month LIBOR USD + 2.25% ) | | | 2.36 | % | | | 03/24/2025 | | | | 433,574 | |
2,054,850 | | LogMeIn, Inc., Senior Secured First Lien Term Loan (1 Month LIBOR USD + 4.75% ) | | | 4.85 | % | | | 08/31/2027 | | | | 2,051,963 | |
1,552,566 | | Lower Cadence Holdings LLC, Senior Secured First Lien Term Loan (1 Month LIBOR USD + 4.00% ) | | | 4.11 | % | | | 05/22/2026 | | | | 1,518,930 | |
1,607,627 | | Lucid Energy Group II Borrower LLC, Senior Secured First Lien Term Loan (1 Month LIBOR USD + 3.00%, 1.00% Floor) | | | 4.00 | % | | | 02/18/2025 | | | | 1,560,065 | |
1,496,250 | | Lummus Technology Holdings V LLC, Senior Secured First Lien Term Loan (1 Month LIBOR USD + 3.50% ) | | | 3.61 | % | | | 06/30/2027 | | | | 1,491,574 | |
365,667 | | Maravai Intermediate Holdings LLC, Senior Secured First Lien Term Loan (3 Month LIBOR USD + 4.25%, 1.00% Floor) | | | 5.25 | % | | | 10/19/2027 | | | | 367,952 | |
875,821 | | Marriott Ownership Resorts, Inc., Senior Secured First Lien Term Loan (1 Month LIBOR USD + 1.75% ) | | | 1.86 | % | | | 08/29/2025 | | | | 855,787 | |
1,839,328 | | Mavis Tire Express Services Corporation, Senior Secured First Lien Term Loan (3 Month LIBOR USD + 3.25% ) | | | 3.50 | % | | | 03/20/2025 | | | | 1,835,879 | |
1,067,325 | | Mavis Tire Express Services Corporation, Senior Secured First Lien Term Loan (3 Month LIBOR USD + 4.00%, 1.00% Floor) | | | 5.00 | % | | | 03/20/2025 | | | | 1,066,994 | |
273,024 | | MED ParentCo LP, Senior Secured First Lien Delayed-Draw Term Loan (1 Month LIBOR USD + 4.25% ) | | | 4.36 | % | | | 08/31/2026 | | | | 271,296 | |
1,888,738 | | MED ParentCo LP, Senior Secured First Lien Term Loan (1 Month LIBOR USD + 4.25% ) | | | 4.36 | % | | | 08/31/2026 | | | | 1,876,782 | |
621,779 | | Messer Industries GMBH, Senior Secured First Lien Term Loan (3 Month LIBOR USD + 2.50% ) | | | 2.70 | % | | | 03/02/2026 | | | | 617,818 | |
4,134,825 | | Milano Acquisition Corporation, Senior Secured First Lien Term Loan (3 Month LIBOR USD + 4.00%, 0.75% Floor) | | | 4.75 | % | | | 10/01/2027 | | | | 4,124,488 | |
1,085,000 | | Mileage Plus Holdings LLC, Senior Secured First Lien Term Loan (3 Month LIBOR USD + 5.25%, 1.00% Floor) | | | 6.25 | % | | | 06/21/2027 | | | | 1,154,597 | |
2,265,537 | | Minotaur Acquisition, Inc., Senior Secured First Lien Term Loan (1 Month LIBOR USD + 5.00% ) | | | 5.11 | % | | | 03/27/2026 | | | | 2,266,488 | |
| | Mirion Technologies, Inc., Senior Secured First Lien Term Loan | | | | | | | | | | | | |
83,166 | | (3MonthLIBORUSD+4.00% ) | | | 4.23 | % | | | 03/06/2026 | | | | 83,405 | |
200,387 | | (6 Month LIBOR USD + 4.00%) | | | 4.27 | % | | | 03/06/2026 | | | | 200,964 | |
2,159,679 | | Mister Car Wash Holdings, Inc., Senior Secured First Lien Term Loan (1 Month LIBOR USD + 3.25%) | | | 3.36 | % | | | 05/14/2026 | | | | 2,138,384 | |
1,872,552 | | Mitchell International, Inc., Senior Secured First Lien Term Loan (1 Month LIBOR USD + 3.25%) | | | 3.36 | % | | | 11/29/2024 | | | | 1,845,896 | |
335,000 | | Mitchell International, Inc., Senior Secured Second Lien Term Loan (1 Month LIBOR USD + 7.25%) | | | 7.36 | % | | | 12/01/2025 | | | | 335,209 | |
443,132 | | MLN US HoldCo LLC, Senior Secured First Lien Term Loan (1 Month LIBOR USD + 4.50%) | | | 4.60 | % | | | 11/28/2025 | | | | 392,847 | |
57,932 | | Motion Acquisition Ltd., Senior Secured First Lien Term Loan (3 Month LIBOR USD + 3.25%) | | | 3.45 | % | | | 11/12/2026 | | | | 56,096 | |
440,787 | | Motion Acquisition Ltd., Senior Secured First Lien Term Loan (3 Month LIBOR USD + 3.25%) | | | 3.45 | % | | | 11/12/2026 | | | | 426,816 | |
1,185,911 | | MPH Acquisition Holdings LLC, Senior Secured First Lien Term Loan (3 Month LIBOR USD + 2.75%, 1.00% Floor) | | | 3.75 | % | | | 06/07/2023 | | | | 1,180,859 | |
684,600 | | Nascar Holdings LLC, Senior Secured First Lien Term Loan (1 Month LIBOR USD + 2.75%) | | | 2.86 | % | | | 10/19/2026 | | | | 680,965 | |
527,850 | | NCR Corporation, Senior Secured First Lien Term Loan (1 Month LIBOR USD + 2.50%) | | | 2.72 | % | | | 08/28/2026 | | | | 523,231 | |
2,490,366 | | Numericable U.S. LLC, Senior Secured First Lien Term Loan (3 Month LIBOR USD + 4.00%) | | | 4.20 | % | | | 08/14/2026 | | | | 2,487,876 | |
125,684 | | OneDigital Borrower LLC, Senior Secured First Lien Delayed-Draw Term Loan (Prime Rate + 3.50%, 0.75% Floor) | | | 5.25 | %(g) | | | 11/16/2027 | | | | 125,893 | |
2,349,316 | | OneDigital Borrower LLC, Senior Secured First Lien Term Loan (3 Month LIBOR USD + 4.50%, 0.75% Floor) | | | 5.25 | % | | | 11/16/2027 | | | | 2,353,240 | |
605,267 | | Ortho-Clinical Diagnostics, Inc., Senior Secured First Lien Term Loan (1 Month LIBOR USD + 3.25%) | | | 3.36 | % | | | 06/30/2025 | | | | 604,965 | |
391,000 | | Outcomes Group Holdings, Inc., Senior Secured First Lien Term Loan (3 Month LIBOR USD + 3.25%) | | | 3.45 | % | | | 10/24/2025 | | | | 387,581 | |
635,000 | | Packaging Coordinators Midco, Inc., Senior Secured First Lien Term Loan (6 Month LIBOR USD + 3.75%, 0.75% Floor) | | | 4.50 | % | | | 11/30/2027 | | | | 635,495 | |
1,185,000 | | Packers Holdings LLC, Senior Secured First Lien Term Loan (3 Month LIBOR USD + 3.25%, 0.75% Floor) | | | 4.00 | % | | | 03/06/2028 | | | | 1,173,648 | |
600,000 | | PAI HoldCo, Inc., Senior Secured First Lien Term Loan (6 Month LIBOR USD + 4.00%, 1.00% Floor) | | | 5.00 | % | | | 10/26/2027 | | | | 602,814 | |
2,507,602 | | Parexel International Corporation, Senior Secured First Lien Term Loan (1 Month LIBOR USD + 2.75%) | | | 2.86 | % | | | 09/27/2024 | | | | 2,481,222 | |
1,240,000 | | Park River Holdings, Inc., Senior Secured First Lien Term Loan (3 Month LIBOR USD + 3.25%, 0.75% Floor) | | | 4.00 | % | | | 12/28/2027 | | | | 1,234,866 | |
2,379,075 | | Pathway Vet Alliance LLC, Senior Secured First Lien Term Loan (1 Month LIBOR USD + 3.75%) | | | 3.86 | % | | | 03/31/2027 | | | | 2,368,417 | |
500,613 | | PCI Gaming Authority, Senior Secured First Lien Term Loan (1 Month LIBOR USD + 2.50%) | | | 2.61 | % | | | 05/29/2026 | | | | 497,893 | |
1,374,177 | | Peraton Corporation, Senior Secured First Lien | | | 4.50 | %(d) | | | 02/01/2028 | | | | 1,376,471 | |
780,823 | | Peraton Corporation, Senior Secured First Lien Term Loan (1 Month LIBOR USD + 3.75%, 0.75% Floor) | | | 4.50 | % | | | 02/01/2028 | | | | 782,127 | |
2,470,000 | | Petco Health and Wellness Company, Inc., Senior Secured First Lien Term Loan (3 Month LIBOR USD + 3.25%, 0.75% Floor) | | | 4.00 | % | | | 02/25/2028 | | | | 2,464,208 | |
1,260,000 | | PetSmart, Inc., Senior Secured First Lien Term Loan (6 Month LIBOR USD + 3.75%, 0.75% Floor) | | | 4.50 | % | | | 02/11/2028 | | | | 1,259,811 | |
64,835 | | PetVet Care Centers LLC, Senior Secured First Lien Term Loan (1 Month LIBOR USD + 3.50%, 0.75% Floor) | | | 4.25 | % | | | 02/14/2025 | | | | 64,779 | |
1,305,138 | | PG&E Corporation, Senior Secured First Lien Term Loan (3 Month LIBOR USD + 3.00%, 0.50% Floor) | | | 3.50 | % | | | 06/23/2025 | | | | 1,305,542 | |
488,702 | | Phoenix Services International LLC, Senior Secured First Lien Term Loan (1 Month LIBOR USD + 3.75%, 1.00% Floor) | | | 4.75 | % | | | 03/03/2025 | | | | 485,496 | |
510,000 | | Pike Corporation, Senior Secured First Lien Term Loan (1 Month LIBOR USD + 3.00%) | | | 3.12 | % | | | 01/21/2028 | | | | 509,363 | |
800,136 | | Pisces Midco, Inc., Senior Secured First Lien Term Loan (1 Month LIBOR USD + 3.75%) | | | 3.86 | % | | | 04/12/2025 | | | | 800,836 | |
650,000 | | Playa Resorts Holding BV, Senior Secured First Lien Term Loan (1 Month LIBOR USD + 2.75%, 1.00% Floor) | | | 3.75 | % | | | 04/29/2024 | | | | 626,366 | |
1,600,000 | | Playtika Holding Corporation, Senior Secured First Lien | | | 2.86 | %(d) | | | 03/11/2028 | | | | 1,593,000 | |
2,435,000 | | PODS LLC, Senior Secured First Lien | | | 3.75 | %(d) | | | 03/19/2028 | | | | 2,426,173 | |
590,000 | | PointClickCare Technologies, Inc., Senior Secured First Lien Term Loan (6 Month LIBOR USD + 3.00%, 0.75% Floor) | | | 3.75 | % | | | 12/29/2027 | | | | 590,738 | |
| | Polar US Borrower LLC, Senior Secured First Lien Term Loan | | | | | | | | | | | | |
1,227,808 | | (1MonthLIBORUSD+4.75%) | | | 4.86 | % | | | 10/15/2025 | | | | 1,221,669 | |
9,029 | | (1MonthLIBORUSD+4.75%) | | | 5.00 | % | | | 10/15/2025 | | | | 8,984 | |
957,120 | | PowerTeam Services LLC, Senior Secured First Lien Term Loan (3 Month LIBOR USD + 3.25%, 1.00% Floor) | | | 4.25 | % | | | 03/06/2025 | | | | 951,291 | |
661,586 | | Prairie ECI Acquiror LP, Senior Secured First Lien Term Loan (1 Month LIBOR USD + 4.75%) | | | 4.86 | % | | | 03/11/2026 | | | | 643,270 | |
1,604,688 | | Pregis Topco LLC, Senior Secured First Lien Term Loan (1 Month LIBOR USD + 3.75%) | | | 3.86 | % | | | 07/31/2026 | | | | 1,594,490 | |
282,863 | | Presidio Holdings, Inc., Senior Secured First Lien Term Loan (3 Month LIBOR USD + 3.50%) | | | 3.72 | % | | | 01/22/2027 | | | | 282,686 | |
| | Prime Security Services Borrower LLC, Senior Secured First Lien Term Loan | | | | | | | | | | | | |
626,525 | | (1MonthLIBORUSD+2.75%,0.75%Floor) | | | 3.50 | % | | | 09/23/2026 | | | | 624,761 | |
402,111 | | (3MonthLIBORUSD+2.75%,0.75%Floor) | | | 3.50 | % | | | 09/23/2026 | | | | 400,979 | |
804,446 | | (6MonthLIBORUSD+2.75%,0.75%Floor) | | �� | 3.50 | % | | | 09/23/2026 | | | | 802,182 | |
402,111 | | (12MonthLIBORUSD+2.75%,0.75%Floor) | | | 3.50 | % | | | 09/23/2026 | | | | 400,979 | |
961,585 | | Pro Mach Group, Inc., Senior Secured First Lien Term Loan (1 Month LIBOR USD + 2.75%) | | | 2.86 | % | | | 03/07/2025 | | | | 945,824 | |
2,478,952 | | Project Alpha Intermediate Holding, Inc., Senior Secured First Lien Term Loan (1 Month LIBOR USD + 4.00%) | | | 4.15 | % | | | 04/26/2024 | | | | 2,475,543 | |
1,289,757 | | Pug LLC, Senior Secured First Lien Term Loan (1 Month LIBOR USD + 3.50%) | | | 3.61 | % | | | 02/12/2027 | | | | 1,249,452 | |
2,645,000 | | Rackspace Technology Global, Inc., Senior Secured First Lien Term Loan (3 Month LIBOR USD + 2.75%, 0.75% Floor) | | | 3.50 | % | | | 02/03/2028 | | | | 2,625,017 | |
2,194,370 | | Radiate Holdco LLC, Senior Secured First Lien Term Loan (1 Month LIBOR USD + 3.50%, 0.75% Floor) | | | 4.25 | % | | | 09/25/2026 | | | | 2,196,115 | |
| | Radiology Partners, Inc., Senior Secured First Lien Term Loan | | | | | | | | | | | | |
1,382,886 | | (1MonthLIBORUSD+4.25%) | | | 4.36 | % | | | 07/09/2025 | | | | 1,374,389 | |
1,185,625 | | (3MonthLIBORUSD+4.25%) | | | 4.47 | % | | | 07/09/2025 | | | | 1,178,339 | |
2,285,000 | | RealPage, Inc., Senior Secured First Lien | | | 3.75 | %(d) | | | 02/18/2028 | | | | 2,277,380 | |
937,650 | | Redstone Buyer LLC, Senior Secured First Lien Term Loan (3 Month LIBOR USD + 5.00%, 1.00% Floor) | | | 6.00 | % | | | 09/01/2027 | | | | 942,141 | |
1,876,491 | | RegionalCare Hospital Partners Holdings, Inc., Senior Secured First Lien Term Loan (1 Month LIBOR USD + 3.75%) | | | 3.86 | % | | | 11/14/2025 | | | | 1,874,896 | |
2,058,358 | | Renaissance Holding Corporation, Senior Secured First Lien Term Loan (1 Month LIBOR USD + 3.25%) | | | 3.36 | % | | | 05/30/2025 | | | | 2,012,261 | |
720,000 | | Rent-A-Center, Inc., Senior Secured First Lien Term Loan (1 Month LIBOR USD + 4.00%, 0.75% Floor) | | | 4.75 | % | | | 02/17/2028 | | | | 725,101 | |
282,896 | | RentPath, Inc., Senior Secured First Lien Term Loan (1 Month LIBOR USD + 7.00%, 1.00% Floor) | | | 8.00 | % | | | 06/30/2021 | | | | 285,725 | |
1,629,122 | | RentPath, Inc., Senior Secured First Lien Term Loan (Prime Rate + 3.75%, 1.00% Floor) | | | 7.00 | %(f) | | | 12/17/2021 | | | | 1,469,411 | |
797,799 | | Reynolds Group Holdings, Inc., Senior Secured First Lien Term Loan (1 Month LIBOR USD + 2.75%) | | | 2.86 | % | | | 02/06/2023 | | | | 795,370 | |
| | Riverbed Technology, Inc., Senior Secured First Lien Term Loan | | | | | | | | | | | | |
644,964 | | (1MonthLIBORUSD+6.00%,1.00%Floor) | | | 7.00 | % | | | 12/31/2025 | | | | 621,122 | |
1,065 | | (2MonthLIBORUSD+6.00%,1.00%Floor) | | | 7.00 | % | | | 12/31/2025 | | | | 1,026 | |
418,971 | | (3MonthLIBORUSD+6.00%,1.00%Floor) | | | 7.00 | % | | | 12/31/2025 | | | | 403,484 | |
863,308 | | Sabre GLBL, Inc., Senior Secured First Lien Term Loan (1 Month LIBOR USD + 2.00%) | | | 2.11 | % | | | 02/22/2024 | | | | 853,233 | |
329,175 | | Sabre GLBL, Inc., Senior Secured First Lien Term Loan (1 Month LIBOR USD + 4.00%, 0.75% Floor) | | | 4.75 | % | | | 12/17/2027 | | | | 333,086 | |
1,876,740 | | Scientific Games International, Inc., Senior Secured First Lien Term Loan (1 Month LIBOR USD + 2.75%) | | | 2.86 | % | | | 08/14/2024 | | | | 1,844,320 | |
1,461,830 | | Securus Technologies Holdings, Inc., Senior Secured First Lien Term Loan (6 Month LIBOR USD + 4.50%, 1.00% Floor) | | | 5.50 | % | | | 11/01/2024 | | | | 1,357,594 | |
1,745,553 | | Sedgwick Claims Management Services, Inc., Senior Secured First Lien Term Loan (1 Month LIBOR USD + 3.25%) | | | 3.36 | % | | | 12/31/2025 | | | | 1,724,580 | |
2,545,689 | | Severin Acquisition LLC, Senior Secured First Lien Term Loan (1 Month LIBOR USD + 3.25%) | | | 3.36 | % | | | 08/01/2025 | | | | 2,519,595 | |
2,531,450 | | Sinclair Television Group, Inc., Senior Secured First Lien Term Loan (1 Month LIBOR USD + 2.50%) | | | 2.61 | % | | | 09/30/2026 | | | | 2,496,643 | |
1,727,123 | | SIWF Holdings, Inc., Senior Secured First Lien Term Loan (1 Month LIBOR USD + 4.25%) | | | 4.36 | % | | | 06/13/2025 | | | | 1,724,239 | |
937,044 | | Six Flags Theme Parks, Inc., Senior Secured First Lien Term Loan (1 Month LIBOR USD + 1.75%) | | | 1.86 | % | | | 04/17/2026 | | | | 917,572 | |
905,000 | | SkyMiles IP Ltd., Senior Secured First Lien Term Loan (3 Month LIBOR USD + 3.75%, 1.00% Floor) | | | 4.75 | % | | | 10/20/2027 | | | | 951,607 | |
| | SMG US Midco 2, Inc., Senior Secured First Lien Term Loan | | | | | | | | | | | | |
415,637 | | (1MonthLIBORUSD+2.50%) | | | 2.61 | % | | | 01/23/2025 | | | | 396,934 | |
1,009,731 | | (3MonthLIBORUSD+2.50%) | | | 2.71 | % | | | 01/23/2025 | | | | 964,292 | |
1,261,546 | | SolarWinds Holdings, Inc., Senior Secured First Lien Term Loan (1 Month LIBOR USD + 2.75%) | | | 2.86 | % | | | 02/05/2024 | | | | 1,239,955 | |
| | Solenis International LP, Senior Secured First Lien Term Loan | | | | | | | | | | | | |
1,272,340 | | (3MonthLIBORUSD+4.00%) | | | 4.19 | % | | | 06/26/2025 | | | | 1,270,749 | |
196,535 | | (3MonthLIBORUSD+4.00%) | | | 4.23 | % | | | 06/26/2025 | | | | 196,290 | |
80,000 | | Solenis International LP, Senior Secured Second Lien Term Loan (3 Month LIBOR USD + 8.50%) | | | 8.69 | % | | | 06/26/2026 | | | | 80,306 | |
2,463,825 | | Sophia LP, Senior Secured First Lien Term Loan (3 Month LIBOR USD + 3.75%, 0.75% Floor) | | | 4.50 | % | | | 10/07/2027 | | | | 2,466,141 | |
1,590,000 | | Sotera Health Holdings LLC, Senior Secured First Lien Term Loan (3 Month LIBOR USD + 2.75%, 0.50% Floor) | | | 3.25 | % | | | 12/11/2026 | | | | 1,588,013 | |
2,734,984 | | Sound Inpatient Physicians, Inc., Senior Secured First Lien Term Loan (1 Month LIBOR USD + 2.75%) | | | 2.86 | % | | | 06/27/2025 | | | | 2,724,727 | |
554,750 | | Southern Graphics, Inc., Senior Secured First Lien Term Loan (1 Month LIBOR USD + 3.25%) | | | 3.36 | % | | | 12/30/2022 | | | | 418,373 | |
189,697 | | Southern Veterinary Partners LLC, Senior Secured First Lien Term Loan | | | 5.00 | %(d)(g) | | | 10/01/2027 | | | | 190,468 | |
1,371,865 | | Southern Veterinary Partners LLC, Senior Secured First Lien Term Loan (6 Month LIBOR USD + 4.00%, 1.00% Floor) | | | 5.00 | % | | | 10/01/2027 | | | | 1,377,441 | |
1,585,000 | | Spin Holdco, Inc., Senior Secured First Lien Term Loan (3 Month LIBOR USD + 4.00%, 0.75% Floor) | | | 4.75 | % | | | 03/06/2028 | | | | 1,573,533 | |
1,617,106 | | SS&C Technologies, Inc., Senior Secured First Lien Term Loan (1 Month LIBOR USD + 1.75%) | | | 1.86 | % | | | 04/16/2025 | | | | 1,603,296 | |
885,154 | | Staples, Inc., Senior Secured First Lien Term Loan (3 Month LIBOR USD + 5.00%) | | | 5.21 | % | | | 04/16/2026 | | | | 864,995 | |
774,231 | | Starfruit US Holdco LLC, Senior Secured First Lien Term Loan (1 Month LIBOR USD + 2.75%) | | | 2.86 | % | | | 10/01/2025 | | | | 763,504 | |
917,522 | | Stars Group Holdings B.V., Senior Secured First Lien Term Loan (3 Month LIBOR USD + 3.50%) | | | 3.75 | % | | | 07/10/2025 | | | | 920,201 | |
455,400 | | Sunshine Luxembourg VII SARL, Senior Secured First Lien Term Loan (3 Month LIBOR USD + 4.00%, 1.00% Floor) | | | 5.25 | % | | | 10/02/2026 | | | | 455,514 | |
2,287,716 | | Surf Holdings LLC, Senior Secured First Lien Term Loan (3 Month LIBOR USD + 3.50%) | | | 3.68 | % | | | 03/05/2027 | | | | 2,268,476 | |
257,738 | | Syncreon Group Holdings B.V., Senior Secured First Lien Term Loan (1 Month LIBOR USD + 5.00%, 1.00% Floor) | | | 6.00 | % | | | 10/01/2024 | | | | 258,060 | |
| | TAMKO Building Products LLC, Senior Secured First Lien Term Loan | | | | | | | | | | | | |
1,402,089 | | (1MonthLIBORUSD+3.00%) | | | 3.11 | % | | | 05/29/2026 | | | | 1,399,467 | |
481,933 | | (2MonthLIBORUSD+3.00%) | | | 3.14 | % | | | 05/29/2026 | | | | 481,032 | |
18,726 | | Tapstone Energy Holdings III LLC, Unsecured First Lien Term Loan (1 Month LIBOR USD + 4.00%, 1.00% Floor) | | | 5.00 | %(e) | | | 04/17/2024 | | | | 18,726 | |
803,385 | | Team Health Holdings, Inc., Senior Secured First Lien Term Loan (1 Month LIBOR USD + 2.75%, 1.00% Floor) | | | 3.75 | % | | | 02/06/2024 | | | | 749,434 | |
1,825,825 | | Tech Data Corporation, Senior Secured First Lien Term Loan (1 Month LIBOR USD + 3.50%) | | | 3.61 | % | | | 06/30/2025 | | | | 1,833,320 | |
781,075 | | Tech Data Corporation, Senior Secured First Lien Term Loan (1 Month LIBOR USD + 5.50%) | | | 5.61 | % | | | 06/30/2025 | | | | 786,281 | |
1,460,468 | | Telesat Canada, Senior Secured First Lien Term Loan (1 Month LIBOR USD + 2.75%) | | | 2.86 | % | | | 12/07/2026 | | | | 1,409,498 | |
2,396,880 | | Tempo Acquisition LLC, Senior Secured First Lien Term Loan (1 Month LIBOR USD + 3.25%, 0.50% Floor) | | | 3.75 | % | | | 11/02/2026 | | | | 2,399,133 | |
1,584,978 | | Terrier Media Buyer, Inc., Senior Secured First Lien Term Loan (1 Month LIBOR USD + 3.50%) | | | 3.61 | % | | | 12/17/2026 | | | | 1,572,979 | |
3,042,801 | | The Dun & Bradstreet Corporation, Senior Secured First Lien Term Loan (1 Month LIBOR USD + 3.25%) | | | 3.36 | % | | | 02/06/2026 | | | | 3,030,448 | |
120,675 | | The Hillman Group, Inc., Senior Secured First Lien | | | 3.25 | %(d) | | | 02/24/2028 | | | | 120,248 | |
594,325 | | The Hillman Group, Inc., Senior Secured First Lien | | | 3.25 | %(d) | | | 02/24/2028 | | | | 592,221 | |
2,545,141 | | TIBCO Software, Inc., Senior Secured First Lien Term Loan (1 Month LIBOR USD + 3.75%) | | | 3.86 | % | | | 06/30/2026 | | | | 2,518,099 | |
155,000 | | TIBCO Software, Inc., Senior Secured Second Lien Term Loan (1 Month LIBOR USD + 7.25%) | | | 7.36 | % | | | 03/03/2028 | | | | 157,044 | |
2,083,705 | | Titan Acquisition, Ltd., Senior Secured First Lien Term Loan (6 Month LIBOR USD + 3.00%) | | | 3.27 | % | | | 03/28/2025 | | | | 2,044,958 | |
1,896,282 | | TKC Holdings, Inc., Senior Secured First Lien Term Loan (6 Month LIBOR USD + 3.75%, 1.00% Floor) | | | 4.75 | % | | | 02/01/2023 | | | | 1,856,148 | |
2,513,817 | | TransDigm, Inc., Senior Secured First Lien Term Loan (1 Month LIBOR USD + 2.25%) | | | 2.36 | % | | | 12/09/2025 | | | | 2,465,112 | |
1,890 | | TransDigm, Inc., Senior Secured First Lien Term Loan (1 Month LIBOR USD + 2.25%) | | | 2.36 | % | | | 05/30/2025 | | | | 1,855 | |
773,076 | | Travel Leaders Group LLC, Senior Secured First Lien Term Loan (1 Month LIBOR USD + 4.00%) | | | 4.11 | % | | | 01/25/2024 | | | | 726,923 | |
1,058,378 | | Travelport Finance (Luxembourg) SARL, Senior Secured First Lien Term Loan (3 Month LIBOR USD + 1.50%, 1.00% Floor) | | | 2.50 | % | | | 02/28/2025 | | | | 1,079,985 | |
431,847 | | Travelport Finance (Luxembourg) SARL, Senior Secured First Lien Term Loan (3 Month LIBOR USD + 5.00%) | | | 5.25 | % | | | 05/29/2026 | | | | 352,698 | |
231,370 | | TricorBraun Holdings, Inc., Senior Secured First Lien Delayed-Draw Term Loan (6 Month LIBOR USD + 3.25%, 0.50% Floor) | | | 3.75 | %(g) | | | 03/03/2028 | | | | 229,490 | |
1,028,630 | | TricorBraun Holdings, Inc., Senior Secured First Lien Term Loan (6 Month LIBOR USD + 3.25%, 0.50% Floor) | | | 3.75 | % | | | 03/03/2028 | | | | 1,020,273 | |
2,076,469 | | Trident TPI Holdings, Inc., Senior Secured First Lien Term Loan (3 Month LIBOR USD + 3.00%, 1.00% Floor) | | | 4.00 | % | | | 10/17/2024 | | | | 2,060,574 | |
2,345,000 | | Triton Water Holdings, Inc., Senior Secured First Lien | | | 4.00 | %(d) | | | 03/29/2028 | | | | 2,338,950 | |
635,000 | | Truck Hero, Inc., Senior Secured First Lien Term Loan (1 Month LIBOR USD + 3.75%, 0.75% Floor) | | | 4.50 | % | | | 01/31/2028 | | | | 634,429 | |
784,004 | | U.S. Silica Company, Senior Secured First Lien Term Loan (1 Month LIBOR USD + 4.00%, 1.00% Floor) | | | 5.00 | % | | | 05/01/2025 | | | | 758,916 | |
2,124,538 | | Uber Technologies, Inc., Senior Secured First Lien Term Loan (1 Month LIBOR USD + 3.50%) | | | 3.61 | % | | | 04/04/2025 | | | | 2,117,676 | |
63,830 | | Uber Technologies, Inc., Senior Secured First Lien Term Loan (1 Month LIBOR USD + 3.50%) | | | 3.61 | % | | | 02/25/2027 | | | | 63,666 | |
2,520,227 | | UFC Holdings LLC, Senior Secured First Lien Term Loan (6 Month LIBOR USD + 3.00%, 0.75% Floor) | | | 3.75 | % | | | 04/29/2026 | | | | 2,514,116 | |
785,618 | | UGI Energy Services LLC, Senior Secured First Lien Term Loan (1 Month LIBOR USD + 3.75%) | | | 3.86 | % | | | 08/13/2026 | | | | 785,127 | |
94,553 | | UKG, Inc., Senior Secured First Lien Term Loan (1 Month LIBOR USD + 3.75%) | | | 3.86 | % | | | 05/04/2026 | | | | 94,585 | |
2,379,324 | | UKG, Inc., Senior Secured First Lien Term Loan (3 Month LIBOR USD + 3.25%, 0.75% Floor) | | | 4.00 | % | | | 05/04/2026 | | | | 2,382,858 | |
210,000 | | UKG, Inc., Senior Secured Second Lien Term Loan (3 Month LIBOR USD + 6.75%, 0.75% Floor) | | | 7.50 | % | | | 05/03/2027 | | | | 215,950 | |
700,000 | | Ultra Clean Holdings, Inc., Senior Secured First Lien | | | 0.00 | %(d) | | | 08/27/2025 | | | | 702,625 | |
436,009 | | United Natural Foods, Inc., Senior Secured First Lien Term Loan (1 Month LIBOR USD + 3.50%) | | | 3.61 | % | | | 10/22/2025436,339 | | | | | |
330,813 | | Univar Solutions USA, Inc., Senior Secured First Lien Term Loan (1 Month LIBOR USD + 2.00%) | | | 2.11 | % | | | 07/01/2026 | | | | 329,602 | |
447,694 | | Univision Communications, Inc., Senior Secured First Lien Term Loan (1 Month LIBOR USD + 3.75%, 1.00% Floor) | | | 4.75 | % | | | 03/13/2026 | | | | 448,102 | |
673,200 | | Upstream Newco, Inc., Senior Secured First Lien Term Loan (1 Month LIBOR USD + 4.50%) | | | 4.61 | % | | | 11/20/2026 | | | | 672,783 | |
2,531,450 | | US Foods, Inc., Senior Secured First Lien Term Loan (1 Month LIBOR USD + 2.00%) | | | 2.11 | % | | | 09/14/2026 | | | | 2,486,542 | |
1,136,792 | | USIC Holdings, Inc., Senior Secured First Lien Term Loan (1 Month LIBOR USD + 3.00%, 1.00% Floor) | | | 4.00 | % | | | 12/08/2023 | | | | 1,132,529 | |
119,700 | | Utz Quality Foods LLC, Senior Secured First Lien Term Loan (1 Month LIBOR USD + 3.00%) | | | 3.11 | % | | | 01/20/2028 | | | | 119,750 | |
895,602 | | Vantage Specialty Chemicals, Inc., Senior Secured First Lien Term Loan (3 Month LIBOR USD + 3.50%, 1.00% Floor) | | | 4.50 | % | | | 10/28/2024 | | | | 847,840 | |
125,000 | | Verscend Holding Corporation (1 Month LIBOR USD + 0.00%) | | | 4.11 | % | | | 08/27/2025 | | | | 125,174 | |
2,702,174 | | Verscend Holding Corporation, Senior Secured First Lien Term Loan (1 Month LIBOR USD + 4.50%) | | | 4.61 | % | | | 08/27/2025 | | | | 2,705,930 | |
2,482,541 | | Vertical U.S. Newco, Inc., Senior Secured First Lien Term Loan (6 Month LIBOR USD + 4.25%) | | | 4.48 | % | | | 07/30/2027 | | | | 2,491,701 | |
280,000 | | Virtusa Corporation, Senior Secured First Lien Term Loan (1 Month LIBOR USD + 4.25%, 0.75% Floor) | | | 5.00 | % | | | 02/11/2028 | | | | 280,701 | |
2,470,534 | | VS Buyer LLC, Senior Secured First Lien Term Loan (1 Month LIBOR USD + 3.00%) | | | 3.11 | % | | | 02/26/2027 | | | | 2,466,420 | |
1,703,173 | | Wand NewCo 3, Inc., Senior Secured First Lien Term Loan (1 Month LIBOR USD + 3.00%) | | | 3.11 | % | | | 02/05/2026 | | | | 1,685,971 | |
713,190 | | WaterBridge Midstream Operating LLC, Senior Secured First Lien Term Loan (6 Month LIBOR USD + 5.75%, 1.00% Floor) | | | 6.75 | % | | | 06/22/2026 | | | | 678,422 | |
1,233,390 | | Whatabrands LLC, Senior Secured First Lien Term Loan (1 Month LIBOR USD + 2.75%) | | | 2.86 | % | | | 07/31/2026 | | | | 1,227,223 | |
1,825,000 | | WIN Waste Innovations Holdings, Inc., Senior Secured First Lien Term Loan (1 Month LIBOR USD + 2.75%, 0.50% Floor) | | | 3.25 | % | | | 03/31/2028 | | | | 1,821,961 | |
692,145 | | Zayo Group Holdings, Inc., Senior Secured First Lien Term Loan (1 Month LIBOR USD + 3.00%) | | | 3.11 | % | | | 03/09/2027 | | | | 687,490 | |
2,476,303 | | Zelis Cost Management Buyer, Inc., Senior Secured First Lien Term Loan (1 Month LIBOR USD + 3.50%) | | | 3.62 | % | | | 09/30/2026 | | | | 2,470,112 | |
230,000 | | Ziggo Financing Partnership, Senior Secured First Lien Term Loan (1 Month LIBOR USD + 2.50%) | | | 2.61 | % | | | 04/28/2028 | | | | 228,009 | |
| | | | | | | | | | | | | | |
Total Bank Loans (Cost $433,013,415) | | | | | | | | 433,127,459 | |
| | | | | | | | | | | | | | |
Collateralized Loan Obligations—3.4% | | | | | | | | | |
875,000 | | Adams Mill Ltd., Series 2014-1A-D1 (3 Month LIBOR USD + 3.50%) | | | 3.74 | %(a) | | | 07/15/2026 | | | | 868,461 | |
1,000,000 | | AIMCO, Series 2018-AA-D (3 Month LIBOR USD + 2.55%) | | | 2.77 | %(a) | | | 04/17/2031 | | | | 983,525 | |
7,500,000 | | Anchorage Capital Ltd., Series 2019-13A-B (3 Month LIBOR USD + 2.00%, 2.00% Floor) | | | 2.24 | %(a) | | | 04/15/2032 | | | | 7,502,934 | |
1,000,000 | | Apidos Ltd., Series 2013-12A-DR (3 Month LIBOR USD + 2.60%) | | | 2.84 | %(a) | | | 04/15/2031 | | | | 960,569 | |
1,500,000 | | Apidos Ltd., Series 2015-20A-CR (3 Month LIBOR USD + 2.95%) | | | 3.17 | %(a) | | | 07/16/2031 | | | | 1,484,259 | |
2,500,000 | | Apidos Ltd., Series 2020-33A-B (3 Month LIBOR USD + 2.20%, 2.20% Floor) | | | 2.42 | %(a) | | | 07/24/2031 | | | | 2,505,383 | |
5,000,000 | | Atrium Corporation, Series 9A-DR (3 Month LIBOR USD + 3.60%) | | | 3.79 | %(a) | | | 05/28/2030 | | | | 4,971,296 | |
4,500,000 | | Avery Point Ltd., Series 2015-7A-DR (3 Month LIBOR USD + 3.60%) | | | 3.84 | %(a) | | | 01/15/2028 | | | | 4,501,363 | |
5,000,000 | | Babson Ltd., Series 2015-2A-DR (3 Month LIBOR USD + 2.95%) | | | 3.17 | %(a) | | | 10/20/2030 | | | | 4,924,334 | |
3,400,000 | | Babson Ltd., Series 2015-IA-DR (3 Month LIBOR USD + 2.60%, 2.60% Floor) | | | 2.82 | %(a) | | | 01/20/2031 | | | | 3,278,173 | |
3,250,000 | | Babson Ltd., Series 2017-1A-D (3 Month LIBOR USD + 3.60%) | | | 3.82 | %(a) | | | 07/18/2029 | | | | 3,248,573 | |
6,455,000 | | Bain Capital Credit Ltd., Series 2016-2A-DRR (3 Month LIBOR USD + 3.85%, 3.85% Floor) | | | 0.01 | %(a) | | | 01/15/2029 | | | | 6,483,206 | |
2,000,000 | | Barings Ltd., Series 2018-1A-C (3 Month LIBOR USD + 2.60%) | | | 2.84 | %(a) | | | 04/15/2031 | | | | 1,912,418 | |
5,100,000 | | Barings Ltd., Series 2018-3A-D (3 Month LIBOR USD + 2.90%) | | | 3.12 | %(a) | | | 07/20/2029 | | | | 4,899,797 | |
2,000,000 | | Barings Ltd., Series 2018-4A-D (3 Month LIBOR USD + 2.90%, 2.90% Floor) | | | 3.14 | %(a) | | | 10/15/2030 | | | | 1,966,918 | |
3,000,000 | | Barings Ltd., Series 2019-1A-D (3 Month LIBOR USD + 3.85%, 3.85% Floor) | | | 4.09 | %(a) | | | 04/15/2031 | | | | 2,997,856 | |
2,250,000 | | Barings Ltd., Series 2019-2A-C (3 Month LIBOR USD + 3.85%, 3.85% Floor) | | | 4.09 | %(a) | | | 04/15/2031 | | | | 2,251,459 | |
3,000,000 | | BlueMountain Ltd., Series 2013-1A-CR (3 Month LIBOR USD + 4.15%, 4.15% Floor) | | | 4.37 | %(a) | | | 01/20/2029 | | | | 2,953,677 | |
4,000,000 | | BlueMountain Ltd., Series 2015-3A-CR (3 Month LIBOR USD + 2.60%) | | | 2.82 | %(a) | | | 04/20/2031 | | | | 3,759,001 | |
2,000,000 | | BlueMountain Ltd., Series 2016-3A-DR (3 Month LIBOR USD + 3.10%, 3.10% Floor) | | | 3.29 | %(a) | | | 11/15/2030 | | | | 1,915,299 | |
4,500,000 | | Canyon Capital Ltd., Series 2012-1RA-D (3 Month LIBOR USD + 3.00%) | | | 3.24 | %(a) | | | 07/15/2030 | | | | 4,435,045 | |
2,750,000 | | Canyon Capital Ltd., Series 2014-1A-CR (3 Month LIBOR USD + 2.75%, 2.75% Floor) | | | 2.96 | %(a) | | | 01/30/2031 | | | | 2,626,390 | |
2,500,000 | | Canyon Capital Ltd., Series 2014-2A-DR (3 Month LIBOR USD + 3.65%) | | | 3.89 | %(a) | | | 04/15/2029 | | | | 2,502,017 | |
3,000,000 | | Canyon Capital Ltd., Series 2016-1A-DR (3 Month LIBOR USD + 2.80%) | | | 3.04 | %(a) | | | 07/15/2031 | | | | 2,943,782 | |
1,500,000 | | Canyon Capital Ltd., Series 2017-1A-D (3 Month LIBOR USD + 3.60%) | | | 3.84 | %(a) | | | 07/15/2030 | | | | 1,498,524 | |
4,000,000 | | Canyon Capital Ltd., Series 2018-1A-D (3 Month LIBOR USD + 2.90%, 2.90% Floor) | | | 3.14 | %(a) | | | 07/15/2031 | | | | 3,898,730 | |
2,500,000 | | Canyon Capital Ltd., Series 2021-1A-D (3 Month LIBOR USD + 3.10%, 3.10% Floor) | | | 0.01 | %(a) | | | 04/15/2034 | | | | 2,500,000 | |
2,500,000 | | Carlyle US Ltd., Series 2016-4A-CR (3 Month LIBOR USD + 2.80%, 2.80% Floor) | | | 3.02 | %(a) | | | 10/20/2027 | | | | 2,383,790 | |
10,000,000 | | Catamaran Ltd., Series 2016-1A-CR (3 Month LIBOR USD + 3.75%, 3.75% Floor) | | | 0.01 | %(a) | | | 01/18/2029 | | | | 9,836,625 | |
1,000,000 | | Catamaran Ltd., Series 2018-1A-C (3 Month LIBOR USD + 2.50%, 2.50% Floor) | | | 2.72 | %(a) | | | 10/25/2031 | | | | 1,000,502 | |
5,000,000 | | CIFC Funding Ltd., Series 2015-4A-CR2 (3 Month LIBOR USD + 3.00%, 3.00% Floor) | | | 3.11 | %(a) | | | 04/20/2034 | | | | 4,900,444 | |
4,500,000 | | CIFC Funding Ltd., Series 2017-1A-D (3 Month LIBOR USD + 3.50%) | | | 3.72 | %(a) | | | 04/23/2029 | | | | 4,480,060 | |
1,000,000 | | CIFC Funding Ltd., Series 2020-1A-B (3 Month LIBOR USD + 2.30%, 2.30% Floor) | | | 2.54 | %(a) | | | 07/15/2032 | | | | 1,002,918 | |
1,000,000 | | CIFC Funding Ltd., Series 2020-2A-B (3 Month LIBOR USD + 2.20%, 2.20% Floor) | | | 2.42 | %(a) | | | 08/24/2032 | | | | 1,004,901 | |
4,500,000 | | Columbia Cent Ltd., Series 2020-29A-B1 (3 Month LIBOR USD + 2.46%, 2.46% Floor) | | | 2.68 | %(a) | | | 07/20/2031 | | | | 4,532,022 | |
3,250,000 | | Cook Park Ltd., Series 2018-1A-D (3 Month LIBOR USD + 2.60%) | | | 2.82 | %(a) | | | 04/17/2030 | | | | 3,194,482 | |
1,000,000 | | Crown Point Ltd., Series 2020-9A-C (3 Month LIBOR USD + 3.60%, 3.60% Floor) | | | 3.83 | %(a) | | | 07/14/2032 | | | | 1,002,788 | |
2,200,000 | | Dryden Ltd., Series 2016-43A-DR3 (3 Month LIBOR USD + 3.25%, 3.25% Floor) | | | 0.01 | %(a) | | | 04/20/2034 | | | | 2,200,000 | |
10,000,000 | | Dryden Senior Loan Fund, Series 2014-33A-DR3 (3 Month LIBOR USD + 3.65%, 3.65% Floor) | | | 3.89 | %(a) | | | 04/15/2029 | | | | 10,009,112 | |
3,000,000 | | Dryden Senior Loan Fund, Series 2015-40A-DR (3 Month LIBOR USD + 3.10%, 3.10% Floor) | | | 3.29 | %(a) | | | 08/15/2031 | | | | 2,997,093 | |
2,200,000 | | Dryden Senior Loan Fund, Series 2016-43A-DRR (3 Month LIBOR USD + 3.55%, 3.55% Floor) | | | 3.77 | %(a) | | | 07/20/2029 | | | | 2,208,611 | |
2,000,000 | | Dryden Senior Loan Fund, Series 2018-57A-D (3 Month LIBOR USD + 2.55%, 2.55% Floor) | | | 2.74 | %(a) | | | 05/15/2031 | | | | 1,947,634 | |
5,000,000 | | Elmwood Ltd., Series 2019-2A-B (3 Month LIBOR USD + 2.10%, 2.10% Floor) | | | 2.32 | %(a) | | | 04/20/2031 | | | | 5,005,352 | |
2,250,000 | | Fillmore Park Ltd., Series 2018-1A-D (3 Month LIBOR USD + 2.90%) | | | 3.14 | %(a) | | | 07/15/2030 | | | | 2,206,534 | |
2,000,000 | | Gilbert Park Ltd., Series 2017-1A-D (3 Month LIBOR USD + 2.95%) | | | 3.19 | %(a) | | | 10/15/2030 | | | | 1,985,392 | |
4,000,000 | | Gilbert Park Ltd., Series 2017-1A-E (3 Month LIBOR USD + 6.40%) | | | 6.64 | %(a) | | | 10/15/2030 | | | | 3,978,212 | |
5,000,000 | | GoldenTree Loan Management Ltd., Series 2018-3A-D (3 Month LIBOR USD + 2.85%) | | | 3.07 | %(a) | | | 04/20/2030 | | | | 4,954,275 | |
3,500,000 | | GoldenTree Loan Opportunities Ltd., Series 2015-11A-DR2 (3 Month LIBOR USD + 2.40%) | | | 2.62 | %(a) | | | 01/18/2031 | | | | 3,372,176 | |
2,000,000 | | Grippen Park Ltd., Series 2017-1A-D (3 Month LIBOR USD + 3.30%) | | | 3.52 | %(a) | | | 01/20/2030 | | | | 1,999,434 | |
740,000 | | Halcyon Loan Advisors Funding Ltd., Series 2013-2A-C (3 Month LIBOR USD + 2.70%) | | | 2.91 | %(a) | | | 08/01/2025 | | | | 740,098 | |
1,500,000 | | Halcyon Loan Advisors Funding Ltd., Series 2014-3A-D (3 Month LIBOR USD + 3.65%) | | | 3.87 | %(a) | | | 10/22/2025 | | | | 1,324,978 | |
5,000,000 | | Hayfin Kingsland Ltd., Series 2018-9A-BR (3 Month LIBOR USD + 1.80%) | | | 2.02 | %(a) | | | 04/28/2031 | | | | 5,006,599 | |
1,000,000 | | Hayfin Kingsland Ltd., Series 2019-1A-B1 (3 Month LIBOR USD + 2.25%, 2.25% Floor) | | | 2.47 | %(a) | | | 04/28/2031 | | | | 1,002,177 | |
1,481,500 | | Highbridge Loan Management Ltd., Series 4A-2014-A2R (3 Month LIBOR USD + 1.50%) | | | 1.72 | %(a) | | | 01/28/2030 | | | | 1,478,380 | |
2,500,000 | | Highbridge Loan Management Ltd., Series 8A-2016-DR (3 Month LIBOR USD + 2.90%, 2.90% Floor) | | | 3.12 | %(a) | | | 07/20/2030 | | | | 2,487,523 | |
1,500,000 | | HPS Loan Management Ltd., Series 13A-18-D (3 Month LIBOR USD + 3.00%, 3.00% Floor) | | | 3.24 | %(a) | | | 10/15/2030 | | | | 1,447,457 | |
4,000,000 | | LCM LP, Series 14A-DR (3 Month LIBOR USD + 2.75%) | | | 2.97 | %(a) | | | 07/20/2031 | | | | 3,840,473 | |
2,000,000 | | LCM LP, Series 19A-D (3 Month LIBOR USD + 3.45%, 3.45% Floor) | | | 3.69 | %(a) | | | 07/15/2027 | | | | 1,986,079 | |
2,000,000 | | LCM LP, Series 20A-DR (3 Month LIBOR USD + 2.80%) | | | 3.02 | %(a) | | | 10/20/2027 | | | | 1,978,984 | |
2,000,000 | | LCM Ltd., Series 25A-D (3 Month LIBOR USD + 3.45%) | | | 3.67 | %(a) | | | 07/20/2030 | | | | 1,949,763 | |
3,250,000 | | LCM Ltd., Series 28A-D (3 Month LIBOR USD + 2.95%, 2.95% Floor) | | | 3.17 | %(a) | | | 10/20/2030 | | | | 3,124,420 | |
4,000,000 | | LCM Ltd., Series 30A-D (3 Month LIBOR USD + 3.75%, 3.75% Floor) | | | 3.97 | %(a) | | | 04/20/2031 | | | | 4,005,038 | |
2,455,896 | | Longfellow Place Ltd., Series 2013-1A-ARR (3 Month LIBOR USD + 1.34%) | | | 1.58 | %(a) | | | 04/15/2029 | | | | 2,459,016 | |
4,000,000 | | Madison Park Funding Ltd., Series 2014-14A-DRR (3 Month LIBOR USD + 2.95%, 2.95% Floor) | | | 3.17 | %(a) | | | 10/22/2030 | | | | 3,955,200 | |
2,000,000 | | Madison Park Funding Ltd., Series 2014-15A-CR (3 Month LIBOR USD + 3.45%) | | | 3.66 | %(a) | | | 01/27/2026 | | | | 1,998,656 | |
1,250,000 | | Madison Park Funding Ltd., Series 2014-15A-DR (3 Month LIBOR USD + 5.44%) | | | 5.65 | %(a) | | | 01/27/2026 | | | | 1,247,990 | |
1,000,000 | | Madison Park Funding Ltd., Series 2015-16A-D (3 Month LIBOR USD + 5.50%) | | | 5.72 | %(a) | | | 04/20/2026 | | | | 996,876 | |
5,000,000 | | Madison Park Funding Ltd., Series 2015-18A-DR (3 Month LIBOR USD + 2.95%) | | | 3.17 | %(a) | | | 10/21/2030 | | | | 4,937,085 | |
3,750,000 | | Madison Park Funding Ltd., Series 2019-34A-D (3 Month LIBOR USD + 3.70%, 3.70% Floor) | | | 3.92 | %(a) | | | 04/25/2031 | | | | 3,752,625 | |
4,000,000 | | Magnetite Ltd., Series 2015-14RA-D (3 Month LIBOR USD + 2.85%) | | | 3.07 | %(a) | | | 10/18/2031 | | | | 3,957,915 | |
1,500,000 | | Magnetite Ltd., Series 2016-18A-DR (3 Month LIBOR USD + 2.70%) | | | 2.89 | %(a) | | | 11/15/2028 | | | | 1,496,250 | |
2,500,000 | | Marble Point Ltd., Series 2017-1A-B (3 Month LIBOR USD + 1.80%) | | | 2.04 | %(a) | | | 10/15/2030 | | | | 2,503,189 | |
3,900,000 | | Marble Point Ltd., Series 2020-2A-B1 (3 Month LIBOR USD + 2.60%, 2.60% Floor) | | | 2.84 | %(a) | | | 10/15/2031 | | | | 3,921,229 | |
1,000,000 | | Myers Park Ltd., Series 2018-1A-D (3 Month LIBOR USD + 3.05%, 3.05% Floor) | | | 3.27 | %(a) | | | 10/20/2030 | | | | 1,000,511 | |
3,500,000 | | Neuberger Berman Loan Advisers Ltd., Series 2016-23A-DR (3 Month LIBOR USD + 2.90%, 2.90% Floor) | | | 3.12 | %(a) | | | 10/17/2027 | | | | 3,442,006 | |
2,500,000 | | Neuberger Berman Loan Advisers Ltd., Series 2018-29A-D (3 Month LIBOR USD + 3.10%, 3.10% Floor) | | | 3.32 | %(a) | | | 10/19/2031 | | | | 2,474,884 | |
2,000,000 | | Neuberger Berman Loan Advisers Ltd., Series 2019-32A-DR (3 Month LIBOR USD + 2.70%, 2.70% Floor) | | | 2.89 | %(a) | | | 01/20/2032 | | | | 1,963,990 | |
6,000,000 | | Oak Hill Credit Partners Ltd., Series 2014-10RA-D (3 Month LIBOR USD + 3.15%, 3.15% Floor) | | | 3.37 | %(a) | | | 12/12/2030 | | | | 6,001,204 | |
6,000,000 | | Oak Hill Credit Partners Ltd., Series 2014-10RA-D1R (3 Month LIBOR USD + 3.05%, 3.05% Floor) | | | 0.01 | %(a) | | | 04/20/2034 | | | | 6,000,000 | |
3,500,000 | | Ocean Trails, Series 2020-8A-B (3 Month LIBOR USD + 2.50%, 2.50% Floor) | | | 2.74 | %(a) | | | 07/15/2029 | | | | 3,509,701 | |
5,600,000 | | Octagon Investment Partners Ltd., Series 2012-1A-CRR (3 Month LIBOR USD + 3.90%, 3.90% Floor) | | | 4.01 | %(a) | | | 07/15/2029 | | | | 5,606,003 | |
2,000,000 | | Octagon Investment Partners Ltd., Series 2013-1A-DR (3 Month LIBOR USD + 3.00%, 3.00% Floor) | | | 3.22 | %(a) | | | 07/17/2030 | | | | 1,957,048 | |
6,900,000 | | Octagon Investment Partners Ltd., Series 2013-1A-DR (3 Month LIBOR USD + 3.70%) | | | 3.92 | %(a) | | | 07/19/2030 | | | | 6,857,939 | |
2,250,000 | | Octagon Investment Partners Ltd., Series 2014-1A-CR3 (3 Month LIBOR USD + 2.75%, 2.75% Floor) | | | 2.94 | %(a) | | | 02/14/2031 | | | | 2,206,737 | |
2,500,000 | | Octagon Investment Partners Ltd., Series 2014-1A-ERR (3 Month LIBOR USD + 5.45%, 5.45% Floor) | | | 5.67 | %(a) | | | 01/22/2030 | | | | 2,307,422 | |
10,000,000 | | Octagon Investment Partners Ltd., Series 2016-1A-DR (3 Month LIBOR USD + 2.95%) | | | 3.19 | %(a) | | | 07/15/2030 | | | | 9,800,947 | |
5,460,000 | | Octagon Investment Partners Ltd., Series 2017-1A-CR (3 Month LIBOR USD + 3.30%) | | | 3.52 | %(a) | | | 03/17/2030 | | | | 5,441,120 | |
1,760,000 | | Octagon Investment Partners Ltd., Series 2017-1A-D (3 Month LIBOR USD + 6.20%) | | | 6.42 | %(a) | | | 03/17/2030 | | | | 1,679,803 | |
2,500,000 | | Octagon Investment Partners Ltd., Series 2018-2A-C (3 Month LIBOR USD + 2.85%) | | | 3.07 | %(a) | | | 07/25/2030 | | | | 2,443,497 | |
1,000,000 | | Octagon Investment Partners Ltd., Series 2020-5A-D (3 Month LIBOR USD + 3.40%, 3.40% Floor) | | | 3.61 | %(a) | | | 01/15/2033 | | | | 1,000,068 | |
2,000,000 | | OHA Credit Funding Ltd., Series 2018-1A-D (3 Month LIBOR USD + 3.05%, 3.05% Floor) | | | 3.27 | %(a) | | | 10/20/2030 | | | | 1,991,015 | |
3,500,000 | | Sound Point Ltd., Series 2016-2A-DR (3 Month LIBOR USD + 3.85%, 3.85% Floor) | | | 4.07 | %(a) | | | 10/20/2028 | | | | 3,506,676 | |
9,000,000 | | Sound Point Ltd., Series 2016-3A-DR (3 Month LIBOR USD + 3.65%, 3.65% Floor) | | | 3.82 | %(a) | | | 01/23/2029 | | | | 9,015,991 | |
4,000,000 | | Sound Point Ltd., Series 2020-1A-C (3 Month LIBOR USD + 3.30%, 3.30% Floor) | | | 3.52 | %(a) | | | 07/20/2030 | | | | 4,019,834 | |
1,000,000 | | Sound Point Ltd., Series 2020-1A-D (3 Month LIBOR USD + 4.70%, 4.70% Floor) | | | 4.92 | %(a) | | | 07/20/2030 | | | | 1,005,394 | |
4,000,000 | | Sound Point Ltd., Series 2020-3A-D (3 Month LIBOR USD + 3.65%, 3.65% Floor) | | | 3.90 | %(a) | | | 01/25/2032 | | | | 4,002,822 | |
10,000,000 | | Stewart Park Ltd., Series 2015-1A-DR (3 Month LIBOR USD + 2.60%, 2.60% Floor) | | | 2.84 | %(a) | | | 01/15/2030 | | | | 9,779,124 | |
3,000,000 | | Symphony Ltd., Series 2015-16A-DR (3 Month LIBOR USD + 3.05%, 3.05% Floor) | | | 3.29 | %(a) | | | 10/15/2031 | | | | 2,968,464 | |
2,500,000 | | Symphony Ltd., Series 2016-17A-DR (3 Month LIBOR USD + 2.65%) | | | 2.89 | %(a) | | | 04/15/2028 | | | | 2,478,689 | |
2,000,000 | | Venture Ltd., Series 2013-14A-BRR (3 Month LIBOR USD + 1.55%, 1.55% Floor) | | | 1.74 | %(a) | | | 08/28/2029 | | | | 2,000,972 | |
2,000,000 | | Venture Ltd., Series 2014-18A-BR (3 Month LIBOR USD + 1.65%) | | | 1.89 | %(a) | | | 10/15/2029 | | | | 2,002,444 | |
1,000,000 | | VERDE, Series 2019-1A-D (3 Month LIBOR USD + 3.80%, 3.80% Floor) | | | 4.04 | %(a) | | | 04/15/2032 | | | | 1,001,237 | |
3,000,000 | | Voya Ltd., Series 2014-1A-CR2 (3 Month LIBOR USD + 2.80%) | | | 3.02 | %(a) | | | 04/18/2031 | | | | 2,842,945 | |
2,000,000 | | Voya Ltd., Series 2015-2A-DR (3 Month LIBOR USD + 2.95%) | | | 3.17 | %(a) | | | 07/23/2027 | | | | 1,972,574 | |
3,000,000 | | Voya Ltd., Series 2017-3A-C (3 Month LIBOR USD + 3.55%) | | | 3.77 | %(a) | | | 07/20/2030 | | | | 2,991,161 | |
3,000,000 | | Voya Ltd., Series 2017-3A-CR (3 Month LIBOR USD + 3.15%) | | | 0.01 | %(a) | | | 04/20/2034 | | | | 3,000,000 | |
4,000,000 | | Voya Ltd., Series 2018-2A-D (3 Month LIBOR USD + 2.75%, 2.75% Floor) | | | 2.99 | %(a) | | | 07/15/2031 | | | | 3,869,239 | |
2,250,000 | | Wind River Ltd., Series 2014-1A-DRR (3 Month LIBOR USD + 3.00%, 3.00% Floor) | | | 3.22 | %(a) | | | 07/18/2031 | | | | 2,123,187 | |
1,000,000 | | Wind River Ltd., Series 2014-2A-ER (3 Month LIBOR USD + 5.75%, 5.75% Floor) | | | 5.99 | %(a) | | | 01/15/2031 | | | | 881,383 | |
3,000,000 | | Wind River Ltd., Series 2016-1A-DR (3 Month LIBOR USD + 2.85%) | | | 3.09 | %(a) | | | 07/15/2028 | | | | 2,929,505 | |
6,500,000 | | Wind River Ltd., Series 2017-1A-C (3 Month LIBOR USD + 2.30%) | | | 2.52 | %(a) | | | 04/18/2029 | | | | 6,510,200 | |
3,000,000 | | Wind River Ltd., Series 2017-1A-D (3 Month LIBOR USD + 3.75%) | | | 3.97 | %(a) | | | 04/18/2029 | | | | 3,004,442 | |
3,000,000 | | Wind River Ltd., Series 2017-1A-DR (3 Month LIBOR USD + 3.72%, 3.72% Floor) | | | 0.01 | %(a) | | | 04/18/20362,970,000 | | | | | |
3,000,000 | | Wind River Ltd., Series 2017-3A-D (3 Month LIBOR USD + 3.15%) | | | 3.39 | %(a) | | | 10/15/2030 | | | | 2,970,408 | |
4,000,000 | | Wind River Ltd., Series 2018-1A-D (3 Month LIBOR USD + 2.90%) | | | 3.14 | %(a) | | | 07/15/2030 | | | | 3,871,491 | |
2,500,000 | | Wind River Ltd., Series 2018-2A-D (3 Month LIBOR USD + 3.00%) | | | 3.24 | %(a) | | | 07/15/2030 | | | | 2,434,425 | |
3,000,000 | | Wind River Ltd., Series 2018-3A-D (3 Month LIBOR USD + 2.95%, 2.95% Floor) | | | 3.17 | %(a) | | | 01/20/2031 | | | | 2,939,347 | |
10,000,000 | | Wind River Ltd., Series 2019-3A-B (3 Month LIBOR USD + 2.10%) | | | 2.34 | %(a) | | | 04/15/2031 | | | | 10,003,124 | |
| | | | | | | | | | | | | | |
Total Collateralized Loan Obligations (Cost $388,955,291) | | | | | | | | 385,352,319 | |
| | | | | | | | | | | | | | |
Foreign Corporate Bonds—7.4% | | | | | | | | | |
1,500,000 | | Adani International Container Terminal Pvt Ltd. | | | 3.00 | %(a) | | | 02/16/2031 | | | | 1,437,697 | |
6,455,000 | | AerCap Global Aviation Trust | | | 3.50 | % | | | 01/15/2025 | | | | 6,773,549 | |
6,200,000 | | AES Andres B.V. | | | 7.95 | %(a) | | | 05/11/2026 | | | | 6,457,796 | |
5,500,000 | | AES Dominicana | | | 7.95 | % | | | 05/11/2026 | | | | 5,728,690 | |
1,700,000 | | AES Gener S.A. | | | 5.00 | % | | | 07/14/2025 | | | | 1,780,750 | |
2,600,000 | | AES Gener S.A. (5 Year CMT Rate + 4.92%) | | | 6.35 | %(a) | | | 10/07/2079 | | | | 2,790,931 | |
3,700,000 | | AES Gener S.A. (5 Year CMT Rate + 4.92%) | | | 6.35 | % | | | 10/07/2079 | | | | 3,971,710 | |
1,703,000 | | AES Gener S.A. (5 Year Swap Rate USD + 4.64%) | | | 7.13 | % | | | 03/26/2079 | | | | 1,832,198 | |
8,800,000 | | AES Gener S.A. (5 Year Swap Rate USD + 4.64%) | | | 7.13 | %(a) | | | 03/26/2079 | | | | 9,467,612 | |
3,775,000 | | AES Panama Generation Holdings SRL | | | 4.38 | %(a) | | | 05/31/2030 | | | | 3,912,976 | |
800,000 | | Altice Financing S.A. | | | 5.00 | %(a) | | | 01/15/2028 | | | | 791,000 | |
2,275,000 | | Altice France S.A. | | | 7.38 | %(a) | | | 05/01/2026 | | | | 2,369,071 | |
1,305,000 | | Altice France S.A. | | | 6.00 | %(a) | | | 02/15/2028 | | | | 1,288,224 | |
12,070,000 | | Anglo American Capital PLC | | | 4.50 | %(a) | | | 03/15/2028 | | | | 13,562,919 | |
4,060,000 | | Anheuser-Busch InBev Worldwide, Inc. | | | 4.90 | % | | | 02/01/2046 | | | | 4,860,833 | |
8,205,000 | | Anheuser-Busch InBev Worldwide, Inc. | | | 4.60 | % | | | 04/15/2048 | | | | 9,415,554 | |
540,000 | | ARD Finance S.A. (7.25% PIK) | | | 6.50 | %(a) | | | 06/30/2027 | | | | 567,675 | |
1,775,000 | | Avation Capital S.A. (9.00% PIK) | | | 8.25 | %(a) | | | 10/31/2026 | | | | 1,435,309 | |
12,170,000 | | Avolon Holdings Funding Ltd. | | | 3.25 | %(a) | | | 02/15/2027 | | | | 12,092,675 | |
200,000 | | Baidu, Inc. | | | 3.43 | % | | | 04/07/2030 | | | | 210,013 | |
5,400,000 | | Banco BTG Pactual S.A. (5 Year CMT Rate + 5.26%) | | | 7.75 | %(a) | | | 02/15/2029 | | | | 5,729,400 | |
2,600,000 | | Banco Continental SAECA | | | 2.75 | %(a) | | | 12/10/2025 | | | | 2,563,782 | |
3,450,000 | | Banco de Credito del Peru (5 Year CMT Rate + 3.00%) | | | 3.13 | % | | | 07/01/2030 | | | | 3,463,420 | |
1,500,000 | | Banco de Credito del Peru (5 Year CMT Rate + 3.00%) | | | 3.13 | %(a) | | | 07/01/2030 | | | | 1,505,835 | |
1,000,000 | | Banco de Reservas de la Republica Dominicana | | | 7.00 | %(a) | | | 02/01/2023 | | | | 1,044,625 | |
4,100,000 | | Banco de Reservas de la Republica Dominicana | | | 7.00 | % | | | 02/01/2023 | | | | 4,282,963 | |
200,000 | | Banco do Estado do Rio Grande do Sul SA (5 Year CMT Rate + 4.93%) | | | 5.38 | %(a) | | | 01/28/2031 | | | | 196,509 | |
2,660,000 | | Banco Internacional del Peru S.A.A. (3 Month LIBOR USD + 5.76%) | | | 6.63 | % | | | 03/19/2029 | | | | 2,945,751 | |
3,800,000 | | Banco Internacional del Peru S.A.A. Interbank (1 Year CMT Rate + 3.71%) | | | 4.00 | % | | | 07/08/2030 | | | | 3,889,680 | |
2,247,000 | | Banco Macro S.A. (5 Year Swap Rate USD + 5.46%) | | | 6.75 | %(a) | | | 11/04/2026 | | | | 1,808,857 | |
7,603,000 | | Banco Macro S.A. (5 Year Swap Rate USD + 5.46%) | | | 6.75 | % | | | 11/04/2026 | | | | 6,120,491 | |
9,723,000 | | Banco Mercantil del Norte S.A. (10 Year CMT Rate + 5.35%) | | | 7.63 | %(h) | | | 01/10/2028 | | | | 10,673,083 | |
2,521,000 | | Banco Mercantil del Norte S.A. (10 Year CMT Rate + 5.47%) | | | 7.50 | %(a)(h) | | | 06/27/2029 | | | | 2,763,457 | |
500,000 | | Banco Mercantil del Norte S.A. (10 Year CMT Rate + 5.47%) | | | 7.50 | %(h) | | | 06/27/2029 | | | | 548,088 | |
13,400,000 | | Banco Santander (3 Month LIBOR USD + 1.09%) | | | 1.27 | % | | | 02/23/2023 | | | | 13,558,590 | |
1,000,000 | | Bancolombia S.A. (5 Year CMT Rate + 2.94%) | | | 4.63 | % | | | 12/18/2029 | | | | 1,013,625 | |
4,400,000 | | Bangkok Bank PCL (5 Year CMT Rate + 4.73%) | | | 5.00 | %(h) | | | 09/23/2025 | | | | 4,640,592 | |
1,800,000 | | Banistmo S.A. | | | 3.65 | %(a) | | | 09/19/2022 | | | | 1,838,196 | |
4,350,000 | | Bank of Montreal (5 Year Swap Rate USD + 1.43%) | | | 3.80 | % | | | 12/15/2032 | | | | 4,784,000 | |
13,220,000 | | Bank of New Zealand | | | 3.50 | %(a) | | | 02/20/2024 | | | | 14,238,755 | |
580,000 | | Bank of Nova Scotia | | | 1.63 | % | | | 05/01/2023 | | | | 594,822 | |
9,675,000 | | Bank of Nova Scotia | | | 3.40 | % | | | 02/11/2024 | | | | 10,418,821 | |
14,360,000 | | Barclays PLC (3 Month LIBOR USD + 1.38%) | | | 1.57 | % | | | 05/16/2024 | | | | 14,569,698 | |
20,150,000 | | BAT Capital Corporation | | | 3.46 | % | | | 09/06/2029 | | | | 21,056,671 | |
7,108,000 | | BBVA Bancomer S.A. (5 Year CMT Rate + 2.65%) | | | 5.13 | % | | | 01/18/2033 | | | | 7,330,445 | |
300,000 | | BBVA Bancomer S.A. (5 Year CMT Rate + 3.00%) | | | 5.35 | % | | | 11/12/2029 | | | | 309,663 | |
800,000 | | BDO Unibank, Inc. | | | 2.63 | % | | | 10/24/2021 | | | | 809,500 | |
10,000,000 | | BDO Unibank, Inc. | | | 2.95 | % | | | 03/06/2023 | | | | 10,375,000 | |
7,650,000 | | Bell Canada | | | 0.75 | % | | | 03/17/2024 | | | | 7,643,220 | |
13,455,000 | | BNP Paribas S.A. (Secured Overnight Financing Rate + 15.07%) | | | 3.05 | %(a) | | | 01/13/2031 | | | | 13,803,119 | |
1,010,000 | | Bombardier, Inc. | | | 6.00 | %(a) | | | 10/15/2022 | | | | 1,011,894 | |
1,120,000 | | Bombardier, Inc. | | | 7.88 | %(a) | | | 04/15/2027 | | | | 1,100,086 | |
7,805,000 | | BPCE S.A. | | | 1.00 | %(a) | | | 01/20/2026 | | | | 7,621,456 | |
5,800,000 | | Braskem Finance Company (5 Year CMT Rate + 8.22%) | | | 8.50 | %(a) | | | 01/23/2081 | | | | 6,583,348 | |
1,500,000 | | Braskem Idesa S.A.P.I. | | | 7.45 | %(a) | | | 11/15/2029 | | | | 1,492,500 | |
700,000 | | Canacol Energy Ltd. | | | 7.25 | %(a) | | | 05/03/2025 | | | | 743,288 | |
7,500,000 | | Canacol Energy Ltd. | | | 7.25 | % | | | 05/03/2025 | | | | 7,963,800 | |
5,840,000 | | CCL Industries, Inc. | | | 3.05 | %(a) | | | 06/01/2030 | | | | 5,926,641 | |
6,000,000 | | Chile Electricity PEC SpA | | | 0.00 | %(a) | | | 01/25/2028 | | | | 4,911,330 | |
200,000 | | CIMB Bank BHD | | | 3.26 | % | | | 03/15/2022 | | | | 204,820 | |
1,185,000 | | CIMB Bank BHD (3 Month LIBOR USD + 0.78%) | | | 1.00 | % | | | 10/09/2024 | | | | 1,189,130 | |
3,500,000 | | CK Hutchison International Ltd. | | | 2.50 | %(a) | | | 05/08/2030 | | | | 3,481,726 | |
500,000 | | CNPC Global Capital Ltd. | | | 1.13 | % | | | 06/23/2023 | | | | 500,834 | |
937,000 | | Cometa Energia S.A. de C.V. | | | 6.38 | % | | | 04/24/2035 | | | | 1,049,182 | |
11,855,000 | | Commonwealth Bank of Australia | | | 4.32 | %(a) | | | 01/10/2048 | | | | 13,155,547 | |
6,610,000 | | Cosan Overseas Ltd. | | | 8.25 | % | | | 11/29/2049 | | | | 6,775,250 | |
13,395,000 | | Credit Agricole S.A. | | | 3.75 | %(a) | | | 04/24/2023 | | | | 14,246,960 | |
13,805,000 | | Credit Suisse Group AG (Secured Overnight Financing Rate + 0.98%) | | | 1.31 | %(a) | | | 02/02/2027 | | | | 13,380,335 | |
6,800,000 | | Credito Real S.A.B. de C.V. | | | 9.50 | %(a) | | | 02/07/2026 | | | | 7,240,300 | |
6,550,000 | | Credito Real S.A.B. de C.V. (5 Year CMT Rate + 7.03%) | | | 9.13 | %(h) | | | 11/29/2022 | | | | 5,885,666 | |
6,793,000 | | CSN Islands Corporation | | | 7.00 | %(h) | | | 06/23/2021 | | | | 6,823,433 | |
2,000,000 | | CSN Resources S.A. | | | 7.63 | %(a) | | | 04/17/2026 | | | | 2,129,790 | |
2,000,000 | | DBS Group Holdings Ltd. (5 Year Mid Swap Rate USD + 1.59%) | | | 4.52 | % | | | 12/11/2028 | | | | 2,169,839 | |
8,100,000 | | DBS Group Holdings Ltd. (5 Year Swap Rate USD + 2.39%) | | | 3.60 | %(h) | | | 09/07/2021 | | | | 8,176,018 | |
785,000 | | Delek & Avner Tamar Bond Ltd. | | | 5.08 | %(a) | | | 12/30/2023 | | | | 812,846 | |
1,760,000 | | Delek & Avner Tamar Bond Ltd. | | | 5.41 | %(a) | | | 12/30/2025 | | | | 1,846,944 | |
1,716,891 | | Digicel Group Ltd. (7.00% PIK) | | | 7.00 | %(a)(h) | | | 04/16/2021 | | | | 1,261,400 | |
1,151,452 | | Digicel Group Ltd. (5.00% + 3.00% PIK or 8.00% PIK) | | | 8.00 | %(a) | | | 04/01/2025 | | | | 951,865 | |
5,400,000 | | Docuformas SAPI de C.V. | | | 10.25 | %(a) | | | 07/24/2024 | | | | 5,356,800 | |
2,060,000 | | eG Global Finance PLC | | | 8.50 | %(a) | | | 10/30/2025 | | | | 2,198,473 | |
2,347,280 | | Empresa Electrica Cochrane SpA | | | 5.50 | % | | | 05/14/2027 | | | | 2,457,107 | |
8,500,000 | | Empresa Electrica Guacolda S.A. | | | 4.56 | % | | | 04/30/2025 | | | | 7,156,912 | |
4,942,903 | | ENA Norte Trust | | | 4.95 | % | | | 04/25/2023 | | | | 5,081,748 | |
1,682,000 | | Export Import Bank of Thailand (3 Month LIBOR USD + 0.90%) | | | 1.08 | % | | | 11/20/2023 | | | | 1,701,360 | |
430,882 | | Fenix Power Peru S.A. | | | 4.32 | % | | | 09/20/2027 | | | | 452,502 | |
900,000 | | Fideicomiso P.A. Pacifico Tres | | | 8.25 | % | | | 01/15/2035 | | | | 1,076,625 | |
5,400,000 | | Galaxy Pipeline Assets Bidco Ltd. | | | 2.16 | %(a) | | | 03/31/2034 | | | | 5,244,742 | |
1,761,000 | | Garda World Security Corporation | | | 8.75 | %(a) | | | 05/15/2025 | | | | 1,847,932 | |
2,050,000 | | Garda World Security Corporation | | | 4.63 | %(a) | | | 02/15/2027 | | | | 2,055,125 | |
6,300,000 | | Geopark Ltd. | | | 6.50 | % | | | 09/21/2024 | | | | 6,532,123 | |
860,000 | | GFL Environmental, Inc. | | | 3.75 | %(a) | | | 08/01/2025 | | | | 874,512 | |
1,830,000 | | GFL Environmental, Inc. | | | 4.00 | %(a) | | | 08/01/2028 | | | | 1,773,956 | |
1,275,000 | | GFL Environmental, Inc. | | | 3.50 | %(a) | | | 09/01/2028 | | | | 1,238,344 | |
1,600,000 | | Gilex Holding SARL | | | 8.50 | %(a) | | | 05/02/2023 | | | | 1,662,880 | |
4,000,000 | | Gilex Holding SARL | | | 8.50 | % | | | 05/02/2023 | | | | 4,157,200 | |
800,000 | | Global Bank Corporation | | | 4.50 | %(a) | | | 10/20/2021 | | | | 812,332 | |
3,715,000 | | Global Bank Corporation (3 Month LIBOR USD + 3.30%) | | | 5.25 | %(a) | | | 04/16/2029 | | | | 3,871,903 | |
872,000 | | Globo Comunicacao e Participacoes S.A. | | | 4.88 | %(a) | | | 01/22/2030 | | | | 881,095 | |
2,000,000 | | Gohl Capital Ltd. | | | 4.25 | % | | | 01/24/2027 | | | | 2,125,108 | |
300,000 | | Gran Tierra Energy International Holdings Ltd. | | | 6.25 | %(a) | | | 02/15/2025 | | | | 249,235 | |
10,498,000 | | Gran Tierra Energy International Holdings Ltd. | | | 6.25 | % | | | 02/15/2025 | | | | 8,721,581 | |
3,500,000 | | Gran Tierra Energy, Inc. | | | 7.75 | %(a) | | | 05/23/2027 | | | | 2,845,500 | |
1,400,000 | | Grupo Aval Ltd. | | | 4.38 | %(a) | | | 02/04/2030 | | | | 1,416,156 | |
6,394,052 | | Grupo Idesa S.A. de C.V. (10.38% PIK) | | | 10.13 | %(a) | | | 05/22/2026 | | | | 3,868,401 | |
17,430,000 | | HSBC Holdings PLC (3 Month LIBOR USD + 1.38%) | | | 1.56 | % | | | 09/12/2026 | | | | 17,954,596 | |
1,000,000 | | Hutchison Whampoa International Ltd. | | | 3.25 | % | | | 11/08/2022 | | | | 1,042,569 | |
6,600,000 | | Imperial Brands Finance PLC | | | 3.50 | %(a) | | | 07/26/2026 | | | | 7,062,335 | |
1,000,000 | | Indian Oil Corporation Ltd. | | | 5.75 | % | | | 08/01/2023 | | | | 1,095,338 | |
710,000 | | Intelligent Packaging Ltd. | | | 6.00 | %(a) | | | 09/15/2028 | | | | 734,406 | |
1,585,000 | | Intelsat Jackson Holdings S.A. | | | 5.50 | %(f) | | | 08/01/2023 | | | | 974,775 | |
2,914,736 | | Interoceanica Finance Ltd. | | | 0.00 | % | | | 11/30/2025 | | | | 2,790,860 | |
1,192,690 | | Invepar Holdings | | | 0.00 | %(e)(f) | | | 12/30/2028 | | | | 51,002 | |
3,223,000 | | Itau Unibanco Holding S.A. (5 Year CMT Rate + 3.22%) | | | 4.63 | %(h) | | | 02/27/2025 | | | | 3,023,819 | |
1,800,000 | | Itau Unibanco Holding S.A. (5 Year CMT Rate + 3.22%) | | | 4.63 | %(a)(h) | | | 02/27/2025 | | | | 1,688,760 | |
6,700,000 | | JD.com, Inc. | | | 3.38 | % | | | 01/14/2030 | | | | 6,918,026 | |
5,644,000 | | Kasikornbank PCL (5 Year CMT Rate + 4.94%) | | | 5.28 | %(h) | | | 10/14/2025 | | | | 5,947,365 | |
900,000 | | Korea Development Bank | | | 1.00 | % | | | 09/09/2026 | | | | 887,550 | |
1,000,000 | | Korea East-West Power Company Ltd. | | | 1.75 | % | | | 05/06/2025 | | | | 1,014,897 | |
1,400,000 | | Korea East-West Power Company Ltd. | | | 1.75 | %(a) | | | 05/06/2025 | | | | 1,420,856 | |
3,000,000 | | Korea Electric Power Corporation | | | 1.13 | %(a) | | | 06/15/2025 | | | | 2,981,701 | |
3,045,000 | | Kronos Acquisition Holdings, Inc. | | | 5.00 | %(a) | | | 12/31/2026 | | | | 3,048,806 | |
1,595,000 | | Kronos Acquisition Holdings, Inc. | | | 7.00 | %(a) | | | 12/31/2027 | | | | 1,530,594 | |
2,078,957 | | Lima Metro Finance Ltd. | | | 5.88 | % | | | 07/05/2034 | | | | 2,445,363 | |
12,925,000 | | Lloyds Banking Group PLC (3 Month LIBOR USD + 1.21%) | | | 3.57 | % | | | 11/07/2028 | | | | 13,964,990 | |
6,566,400 | | LLPL Capital Pte Ltd. | | | 6.88 | %(a) | | | 02/04/2039 | | | | 7,681,342 | |
5,475,000 | | Macquarie Group Ltd. (3 Month LIBOR USD + 1.02%) | | | 3.19 | %(a) | | | 11/28/2023 | | | | 5,702,486 | |
7,884,000 | | Macquarie Group Ltd. (3 Month LIBOR USD + 1.33% ) | | | 4.15 | % (a) | | | 03/27/2024 | | | | 8,406,050 | |
8,600,000 | | Malayan Banking BHD (5 Year Swap Rate USD + 2.54% ) | | | 3.91 | % | | | 10/29/2026 | | | | 8,746,716 | |
1,340,000 | | Mattamy Group Corporation | | | 4.63 | % (a) | | | 03/01/2030 | | | | 1,333,300 | |
1,400,000 | | Medco Bell Pte Ltd. | | | 6.38 | % (a) | | | 01/30/2027 | | | | 1,409,660 | |
1,450,000 | | MEG Energy Corporation | | | 7.13 | % (a) | | | 02/01/2027 | | | | 1,521,594 | |
280,000 | | MEG Energy Corporation | | | 5.88 | % (a) | | | 02/01/2029 | | | | 281,400 | |
1,500,000 | | MEGlobal Canada ULC | | | 5.00 | % (a) | | | 05/18/2025 | | | | 1,671,352 | |
6,100,000 | | Minejesa Capital B.V. | | | 4.63 | % | | | 08/10/2030 | | | | 6,373,341 | |
5,400,000 | | Minejesa Capital B.V. | | | 5.63 | % | | | 08/10/2037 | | | | 5,670,000 | |
9,000,000 | | Minerva Luxembourg S.A. | | | 4.38 | % (a) | | | 03/18/2031 | | | | 8,809,875 | |
14,475,000 | | Mitsubishi UFJ Financial Group, Inc. | | | 1.41 | % | | | 07/17/2025 | | | | 14,474,059 | |
800,000 | | Multibank, Inc. | | | 4.38 | % | | | 11/09/2022 | | | | 822,464 | |
2,000,000 | | Network i2i Ltd. (5 Year CMT Rate + 4.28% ) | | | 5.65 | % (a)(h) | | | 01/15/2025 | | | | 2,120,810 | |
900,000 | | NongHyup Bank | | | 1.25 | % (a) | | | 07/20/2025 | | | | 896,553 | |
10,969,000 | | Nutrien Ltd. | | | 4.20 | % | | | 04/01/2029 | | | | 12,352,118 | |
6,365,000 | | NXP Funding LLC | | | 3.88 | % (a) | | | 06/18/2026 | | | | 7,015,533 | |
6,300,000 | | ONGC Videsh Ltd. | | | 3.75 | % | | | 07/27/2026 | | | | 6,686,411 | |
2,000,000 | | Ooredoo International Finance Ltd. | | | 3.25 | % | | | 02/21/2023 | | | | 2,092,680 | |
500,000 | | Ooredoo International Finance Ltd. | | | 3.75 | % | | | 06/22/2026 | | | | 550,200 | |
4,400,000 | | Operadora de Servicios Mega S.A. de C.V. | | | 8.25 | % (a) | | | 02/11/2025 | | | | 4,447,652 | |
500,000 | | Oversea-Chinese Banking Corporation Ltd. | | | 4.25 | % | | | 06/19/2024 | | | | 548,539 | |
5,100,000 | | Oversea-Chinese Banking Corporation Ltd. (5 Year CMT Rate + 1.58% ) | | | 1.83 | % (a) | | | 09/10/2030 | | | | 5,058,741 | |
300,000 | | Oversea-Chinese Banking Corporation Ltd. (5 Year CMT Rate + 1.58% ) | | | 1.83 | % | | | 09/10/2030 | | | | 297,573 | |
7,900,000 | | Pampa Energia S.A. | | | 7.50 | % | | | 01/24/2027 | | | | 6,454,300 | |
150,000 | | Pampa Energia S.A. | | | 9.13 | % | | | 04/15/2029 | | | | 126,000 | |
3,778,369 | | Panama Metro Line SP | | | 0.00 | % | | | 12/05/2022 | | | | 3,693,394 | |
2,688,513 | | Panama Metro Line SP | | | 0.00 | % (a) | | | 12/05/2022 | | | | 2,628,048 | |
1,300,000 | | Parkland Corporation | | | 4.50 | % (a) | | | 10/01/2029 | | | | 1,304,875 | |
7,600,000 | | Peru LNG SRL | | | 5.38 | % | | | 03/22/2030 | | | | 6,833,806 | |
3,600,000 | | Petrobras Global Finance B.V. | | | 6.75 | % | | | 06/03/2050 | | | | 3,849,390 | |
5,800,000 | | POSCO | | | 2.38 | % | | | 01/17/2023 | | | | 5,955,545 | |
1,900,000 | | POSCO | | | 2.75 | % | | | 07/15/2024 | | | | 2,007,062 | |
4,100,000 | | PSA Treasury Pte Ltd. | | | 2.13 | % | | | 09/05/2029 | | | | 4,071,870 | |
800,000 | | PTTEP Treasury Center Company Ltd. | | | 2.59 | % (a) | | | 06/10/2027 | | | | 823,848 | |
4,500,000 | | Reliance Industries Ltd. | | | 5.40 | % | | | 02/14/2022 | | | | 4,676,669 | |
2,800,000 | | Sinopec Group Overseas Development Ltd. | | | 2.70 | % (a) | | | 05/13/2030 | | | | 2,786,381 | |
4,398,950 | | Star Energy Geothermal Wayang Windu Ltd. | | | 6.75 | % | | | 04/24/2033 | | | | 4,966,107 | |
181,400 | | Star Energy Geothermal Wayang Windu Ltd. | | | 6.75 | % (a) | | | 04/24/2033 | | | | 204,788 | |
530,000 | | Starfruit Finco B.V. | | | 8.00 | % (a) | | | 10/01/2026 | | | | 564,781 | |
2,165,000 | | Stars Group Holdings B.V. | | | 7.00 | % (a) | | | 07/15/2026 | | | | 2,266,484 | |
2,000,000 | | State Grid Overseas Investment Ltd. | | | 3.13 | % | | | 05/22/2023 | | | | 2,092,283 | |
1,200,000 | | State Grid Overseas Investment Ltd. | | | 1.00 | % | | | 08/05/2025 | | | | 1,169,298 | |
9,829,971 | | Stoneway Capital Corporation | | | 10.00 | % (f) | | | 03/01/2027 | | | | 3,735,389 | |
20,760,000 | | Sumitomo Mitsui Financial Group, Inc. (3 Month LIBOR USD + 0.74% ) | | | 0.96 | % | | | 01/17/2023 | | | | 20,910,494 | |
1,840,000 | | Superior Plus LP | | | 4.50 | % (a) | | | 03/15/2029 | | | | 1,863,368 | |
350,000 | | Sydney Airport Finance Company Pty Ltd. | | | 3.63 | % (a) | | | 04/28/2026 | | | | 377,693 | |
1,230,000 | | Telesat LLC | | | 4.88 | % (a) | | | 06/01/2027 | | | | 1,233,075 | |
934,000 | | Telesat LLC | | | 6.50 | % (a) | | | 10/15/2027 | | | | 936,914 | |
1,600,000 | | Temasek Financial Ltd. | | | 1.00 | % | | | 10/06/2030 | | | | 1,471,517 | |
8,800,000 | | Temasek Financial Ltd. | | | 1.00 | % (a) | | | 10/06/2030 | | | | 8,093,346 | |
9,200,000 | | Tencent Holdings Ltd. | | | 2.39 | % (a) | | | 06/03/2030 | | | | 8,896,101 | |
1,230,000 | | Tervita Corporation | | | 11.00 | % (a) | | | 12/01/2025 | | | | 1,399,125 | |
500,000 | | Titan Acquisition Ltd. | | | 7.75 | % (a) | | | 04/15/2026 | | | | 520,600 | |
5,000,000 | | TransCanada PipeLines Ltd. | | | 4.25 | % | | | 05/15/2028 | | | | 5,625,305 | |
1,000,000 | | Transelec S.A. | | | 4.63 | % | | | 07/26/2023 | | | | 1,083,165 | |
500,000 | | Transelec S.A. | | | 3.88 | % | | | 01/12/2029 | | | | 546,775 | |
1,000,000 | | UEP Penonome S.A. | | | 6.50 | % | | | 10/01/2038 | | | | 1,011,890 | |
5,500,000 | | UEP Penonome S.A. | | | 6.50 | % (a) | | | 10/01/2038 | | | | 5,565,395 | |
2,500,000 | | Unifin Financiera S.A.B. de C.V. | | | 7.38 | % | | | 02/12/2026 | | | | 2,425,000 | |
13,900,000 | | Unifin Financiera S.A.B. de C.V. (5 Year CMT Rate + 6.31% ) | | | 8.88 | % (h) | | | 01/29/2025 | | | | 11,458,604 | |
1,200,000 | | Union Bank of the Philippines | | | 3.37 | % | | | 11/29/2022 | | | | 1,245,925 | |
6,600,000 | | United Overseas Bank Ltd. (5 Year Swap Rate USD + 1.79% ) | | | 3.88 | % (h) | | | 10/19/2023 | | | | 6,850,800 | |
5,000,000 | | United Overseas Bank Ltd. (5 Year Swap Rate USD + 2.24% ) | | | 3.50 | % | | | 09/16/2026 | | | | 5,068,675 | |
5,600,000 | | Vedanta Resources Finance PLC | | | 9.25 | % (a) | | | 04/23/2026 | | | | 4,738,832 | |
2,000,000 | | Vedanta Resources Ltd. | | | 7.13 | % | | | 05/31/2023 | | | | 1,785,610 | |
14,800,000 | | Vedanta Resources Ltd. | | | 6.13 | % | | | 08/09/2024 | | | | 11,934,054 | |
2,300,000 | | Vertical Newco, Inc. | | | 5.25 | % (a) | | | 07/15/2027 | | | | 2,412,125 | |
685,000 | | Virgin Media Finance PLC | | | 5.00 | % (a)�� | | | 07/15/2030 | | | | 685,000 | |
7,430,000 | | Volkswagen Group of America Finance LLC | | | 4.25 | % (a) | | | 11/13/2023 | | | | 8,081,884 | |
3,000,000 | | Woori Bank (5 Year CMT Rate + 2.66% ) | | | 4.25 | % (h) | | | 10/04/2024 | | | | 3,140,550 | |
| | | | | | | | | | | | | | |
Total Foreign Corporate Bonds (Cost $831,903,158) | | | | | | | | 840,684,917 | |
| | | | | | | | | | | | | | |
Foreign Government Bonds, Foreign Agencies and Foreign Government Sponsored Corporations—2.2% | | | | | | | | | |
3,100,000 | | Abu Dhabi Government International Bond | | | 3.13 | % (a) | | | 04/16/2030 | | | | 3,328,910 | |
8,850,000 | | Abu Dhabi Government International Bond | | | 3.13 | % | | | 09/30/2049 | | | | 8,456,972 | |
2,200,000 | | Abu Dhabi Government International Bond | | | 3.88 | % | | | 04/16/2050 | | | | 2,396,218 | |
13,405,000 | | BOC Aviation Ltd. (3 Month LIBOR USD + 1.13% ) | | | 1.32 | % (a) | | | 09/26/2023 | | | | 13,400,010 | |
4,000,000 | | Brazilian Government International Bond | | | 2.88 | % | | | 06/06/2025 | | | | 4,044,800 | |
5,000,000 | | Brazilian Government International Bond | | | 5.00 | % | | | 01/27/2045 | | | | 4,771,775 | |
5,700,000 | | Brazilian Government International Bond | | | 5.63 | % | | | 02/21/2047 | | | | 5,829,190 | |
3,000,000 | | Chile Government International Bond | | | 3.50 | % | | | 01/25/2050 | | | | 3,062,100 | |
19,400,000 | | Chile Government International Bond | | | 3.10 | % | | | 01/22/2061 | | | | 18,067,026 | |
2,500,000 | | Colombia Government International Bond | | | 5.00 | % | | | 06/15/2045 | | | | 2,672,900 | |
11,150,000 | | Colombia Government International Bond | | | 4.13 | % | | | 05/15/2051 | | | | 10,635,316 | |
4,100,000 | | Dominican Republic International Bond | | | 4.88 | % (a) | | | 09/23/2032 | | | | 4,192,250 | |
800,000 | | Dominican Republic International Bond | | | 5.30 | % (a) | | | 01/21/2041 | | | | 789,000 | |
5,800,000 | | Dominican Republic International Bond | | | 5.88 | % | | | 01/30/2060 | | | | 5,576,700 | |
2,000,000 | | Indonesia Government International Bond | | | 3.38 | % | | | 04/15/2023 | | | | 2,102,940 | |
2,700,000 | | Indonesia Government International Bond | | | 4.35 | % | | | 01/11/2048 | | | | 2,941,311 | |
8,100,000 | | Indonesia Government International Bond | | | 3.70 | % | | | 10/30/2049 | | | | 8,259,547 | |
3,000,000 | | Malaysia Sovereign Sukuk BHD | | | 3.04 | % | | | 04/22/2025 | | | | 3,209,569 | |
500,000 | | Malaysia Sukuk Global BHD | | | 3.18 | % | | | 04/27/2026 | | | | 545,243 | |
5,114,000 | | Mexico Government International Bond | | | 4.15 | % | | | 03/28/2027 | | | | 5,680,043 | |
14,415,000 | | Mexico Government International Bond | | | 3.75 | % | | | 01/11/2028 | | | | 15,445,168 | |
8,887,000 | | Mexico Government International Bond | | | 4.60 | % | | | 02/10/2048 | | | | 9,135,436 | |
5,400,000 | | Mexico Government International Bond | | | 4.50 | % | | | 01/31/2050 | | | | 5,484,942 | |
6,600,000 | | Mexico Government International Bond | | | 3.77 | % | | | 05/24/2061 | | | | 5,856,675 | |
2,300,000 | | Panama Government International Bond | | | 4.30 | % | | | 04/29/2053 | | | | 2,477,882 | |
8,800,000 | | Panama Government International Bond | | | 3.87 | % | | | 07/23/2060 | | | | 8,730,216 | |
2,600,000 | | Perusahaan Penerbit | | | 4.15 | % | | | 03/29/2027 | | | | 2,873,130 | |
3,000,000 | | Perusahaan Penerbit | | | 3.80 | % | | | 06/23/2050 | | | | 3,048,480 | |
10,250,000 | | Peruvian Government International Bond | | | 2.78 | % | | | 01/23/2031 | | | | 10,285,465 | |
3,850,000 | | Peruvian Government International Bond | | | 3.30 | % | | | 03/11/2041 | | | | 3,761,566 | |
10,300,000 | | Peruvian Government International Bond | | | 3.55 | % | | | 03/10/2051 | | | | 10,067,941 | |
1,550,000 | | Peruvian Government International Bond | | | 2.78 | % | | | 12/01/2060 | | | | 1,283,431 | |
3,800,000 | | Philippine Government International Bond | | | 2.46 | % | | | 05/05/2030 | | | | 3,850,352 | |
4,950,000 | | Philippine Government International Bond | | | 1.65 | % | | | 06/10/2031 | | | | 4,688,066 | |
3,088,000 | | Philippine Government International Bond | | | 3.70 | % | | | 03/01/2041 | | | | 3,235,361 | |
8,562,000 | | Philippine Government International Bond | | | 3.70 | % | | | 02/02/2042 | | | | 8,968,880 | |
3,100,000 | | Philippine Government International Bond | | | 2.95 | % | | | 05/05/2045 | | | | 2,908,645 | |
1,800,000 | | Philippine Government International Bond | | | 2.65 | % | | | 12/10/2045 | | | | 1,622,427 | |
4,800,000 | | Qatar Government International Bond | | | 3.38 | % | | | 03/14/2024 | | | | 5,157,941 | |
2,000,000 | | Saudi Government International Bond | | | 2.38 | % | | | 10/26/2021 | | | | 2,022,200 | |
4,700,000 | | Saudi Government International Bond | | | 2.88 | % | | | 03/04/2023 | | | | 4,891,572 | |
7,000,000 | | Saudi Government International Bond | | | 2.90 | % (a) | | | 10/22/2025 | | | | 7,432,607 | |
200,000 | | Saudi Government International Bond | | | 3.75 | % | | | 01/21/2055 | | | | 196,512 | |
18,400,000 | | Saudi Government International Bond | | | 3.45 | % | | | 02/02/2061 | | | | 16,972,252 | |
6,200,000 | | State of Israel | | | 3.38 | % | | | 01/15/2050 | | | | 6,277,500 | |
| | | | | | | | | | | | | | |
Total Foreign Government Bonds, Foreign Agencies and Foreign Government Sponsored Corporations (Cost $254,708,060) | | | | | | | | 256,636,467 | |
| | | | | | | | | | | | | | |
Municipal Bonds—0.1% | | | | | | | | | | | | |
3,290,000 | | Missouri Highway & Transportation Commission | | | 5.06 | % | | | 05/01/2024 | | | | 3,735,014 | |
4,430,000 | | State of California | | | 7.55 | % | | | 04/01/2039 | | | | 7,164,797 | |
| | | | | | | | | | | | | | |
Total Municipal Bonds (Cost $9,825,435) | | | | | | | | 10,899,811 | |
| | | | | | | | | | | | | | |
Non-Agency Commercial Mortgage Backed Obligations—8.1% | | | | | | | | | |
5,000,000 | | Alen Mortgage Trust, Series 2021-ACEN-D (1 Month LIBOR USD + 3.10%, 3.10% Floor) | | | 3.21 | % (a) | | | 04/15/2034 | | | | 5,021,907 | |
2,000,000 | | Arbor Multifamily Mortgage Securities Trust, Series 2020-MF1-C | | | 3.60 | % (a)(c) | | | 05/15/2053 | | | | 2,074,507 | |
12,071,000 | | Atrium Hotel Portfolio Trust, Series 2018-ATRM-D (1 Month LIBOR USD + 2.30%, 2.30% Floor) | | | 2.41 | % (a) | | | 06/15/2035 | | | | 11,735,353 | |
2,638,666 | | BAMLL Commercial Mortgage Securities Trust, Series 2016-ISQ-C | | | 3.61 | % (a)(c) | | | 08/14/2034 | | | | 2,772,707 | |
1,790,000 | | Banc of America Commercial Mortgage Trust, Series 2015-UBS7-B | | | 4.36 | % (c) | | | 09/15/2048 | | | | 1,882,745 | |
1,045,000 | | Bancorp Commercial Mortgage Trust, Series 2019-CRE5-B (1 Month LIBOR USD + 1.50%, 1.50% Floor) | | | 1.61 | % (a) | | | 03/15/2036 | | | | 1,046,287 | |
4,259,000 | | Bancorp Commercial Mortgage Trust, Series 2019-CRE5-D (1 Month LIBOR USD + 2.35%, 2.35% Floor) | | | 2.46 | % (a) | | | 03/15/2036 | | | | 4,221,728 | |
4,961,380 | | BANK, Series 2017-BNK8-XA | | | 0.73 | % (c)(i) | | | 11/15/2050 | | | | 198,158 | |
1,821,000 | | BANK, Series 2018-BN10-B | | | 4.08 | % (c) | | | 02/15/2061 | | | | 2,003,259 | |
1,857,000 | | BANK, Series 2018-BN10-C | | | 4.16 | % (c) | | | 02/15/206 | | | | 11,956,030 | |
405,000 | | BANK, Series 2018-BN13-B | | | 4.56 | % (c) | | | 08/15/2061 | | | | 455,344 | |
1,005,000 | | BANK, Series 2020-BN28-AS | | | 2.14 | % | | | 03/15/2063 | | | | 956,234 | |
5,927,000 | | BANK, Series 2020-BN28-B | | | 2.34 | % | | | 03/15/2063 | | | | 5,720,814 | |
2,906,000 | | BANK, Series 2020-BN28-C | | | 3.15 | % (c) | | | 03/15/2063 | | | | 2,885,337 | |
1,508,000 | | Barclays Commercial Mortgage Securities LLC, Series 2017-DELC-C (1 Month LIBOR USD + 1.20%, 1.20% Floor) | | | 1.31 | % (a) | | | 08/15/2036 | | | | 1,507,243 | |
1,719,000 | | Barclays Commercial Mortgage Securities LLC, Series 2017-DELC-D (1 Month LIBOR USD + 1.70%, 1.70% Floor) | | | 1.81 | % (a) | | | 08/15/2036 | | | | 1,717,612 | |
1,355,000 | | Barclays Commercial Mortgage Securities LLC, Series 2017-DELC-E (1 Month LIBOR USD + 2.50%, 2.50% Floor) | | | 2.61 | % (a) | | | 08/15/2036 | | | | 1,350,002 | |
3,451,000 | | Barclays Commercial Mortgage Securities LLC, Series 2017-DELC-F (1 Month LIBOR USD + 3.50%, 3.50% Floor) | | | 3.61 | % (a) | | | 08/15/2036 | | | | 3,134,518 | |
13,951,000 | | Barclays Commercial Mortgage Trust, Series 2019-C3-B | | | 4.10 | % | | | 05/15/2052 | | | | 15,211,311 | |
62,986,320 | | BBCMS Mortgage Trust, Series 2020-C7-XA | | | 1.63 | % (c)(i) | | | 04/15/2053 | | | | 6,716,603 | |
5,670,000 | | BBCMS Mortgage Trust, Series 2020-C8-C | | | 3.36 | % (c) | | | 10/15/2053 | | | | 5,635,238 | |
77,225,000 | | BBCMS Mortgage Trust, Series 2021-C9-XA | | | 1.77 | % (c)(i) | | | 02/15/2054 | | | | 9,757,479 | |
3,318,000 | | Benchmark Mortgage Trust, Series 2019-B10-C | | | 3.75 | % | | | 03/15/2062 | | | | 3,419,283 | |
3,983,000 | | Benchmark Mortgage Trust, Series 2020-B18-AGNF | | | 4.14 | % (a) | | | 07/15/2053 | | | | 4,029,342 | |
11,563,000 | | Benchmark Mortgage Trust, Series 2020-B18-C | | | 3.65 | % (c) | | | 07/15/2053 | | | | 11,882,935 | |
4,549,000 | | Benchmark Mortgage Trust, Series 2020-B19-AS | | | 2.15 | % | | | 09/15/2053 | | | | 4,394,097 | |
3,193,000 | | Benchmark Mortgage Trust, Series 2020-B19-B | | | 2.35 | % | | | 09/15/2053 | | | | 3,078,721 | |
1,091,000 | | Benchmark Mortgage Trust, Series 2020-B19-C | | | 3.21 | % | | | 09/15/2053 | | | | 1,072,952 | |
9,385,000 | | BFLD, Series 2019-DPLO-E (1 Month LIBOR USD + 2.24%, 2.24% Floor) | | | 2.35 | % (a) | | | 10/15/2034 | | | | 9,324,381 | |
10,076,000 | | BHMS Trust, Series 2018-ATLS-C (1 Month LIBOR USD + 1.90%, 1.90% Floor) | | | 2.01 | % (a) | | | 07/15/2035 | | | | 10,049,485 | |
3,283,000 | | BX Commercial Mortgage Trust, Series 2018-BIOA-D (1 Month LIBOR USD + 1.32%, 1.35% Floor) | | | 1.43 | % (a) | | | 03/15/2037 | | | | 3,287,658 | |
8,207,000 | | BX Commercial Mortgage Trust, Series 2018-BIOA-E (1 Month LIBOR USD + 1.95%, 1.98% Floor) | | | 2.06 | % (a) | | | 03/15/2037 | | | | 8,225,032 | |
2,187,893 | | BX Trust, Series 2017-SLCT-D (1 Month LIBOR USD + 2.05%, 2.05% Floor) | | | 2.16 | % (a) | | | 07/15/2034 | | | | 2,193,344 | |
5,361,800 | | BX Trust, Series 2017-SLCT-E (1 Month LIBOR USD + 3.15%, 3.15% Floor) | | | 3.26 | % (a) | | | 07/15/2034 | | | | 5,383,855 | |
3,400,000 | | BX Trust, Series 2017-SLCT-F (1 Month LIBOR USD + 4.25%, 4.25% Floor) | | | 4.36 | % (a) | | | 07/15/2034 | | | | 3,413,926 | |
12,349,000 | | BX Trust, Series 2019-OC11-E | | | 4.08 | % (a)(c) | | | 12/09/2041 | | | | 12,299,807 | |
3,275,000 | | CD Mortgage Trust, Series 2017-CD4-C | | | 4.35 | % (c) | | | 05/10/2050 | | | | 3,426,141 | |
71,191,173 | | CFCRE Commercial Mortgage Trust, Series 2016-C3-XA | | | 0.99 | % (c)(i) | | | 01/10/2048 | | | | 2,910,658 | |
3,267,000 | | CFCRE Commercial Mortgage Trust, Series 2017-C8-B | | | 4.20 | % (c) | | | 06/15/2050 | | | | 3,555,335 | |
3,053,000 | | CHT Mortgage Trust, Series 2017-CSMO-B (1 Month LIBOR USD + 1.40%, 1.40% Floor) | | | 1.51 | % (a) | | | 11/15/2036 | | | | 3,059,643 | |
5,198,000 | | CHT Mortgage Trust, Series 2017-CSMO-E (1 Month LIBOR USD + 3.00%, 3.00% Floor) | | | 3.11 | % (a) | | | 11/15/2036 | | | | 5,216,591 | |
1,628,000 | | CHT Mortgage Trust, Series 2017-CSMO-F (1 Month LIBOR USD + 3.74%, 3.74% Floor) | | | 3.85 | % (a) | | | 11/15/2036 | | | | 1,636,086 | |
6,779,231 | | Citigroup Commercial Mortgage Trust, Series 2012-GC8-XA | | | 1.74 | % (a)(c)(i) | | | 09/10/2045 | | | | 121,933 | |
1,898,500 | | Citigroup Commercial Mortgage Trust, Series 2015-GC27-D | | | 4.42 | % (a)(c) | | | 02/10/2048 | | | | 1,850,255 | |
3,683,655 | | Citigroup Commercial Mortgage Trust, Series 2015-GC27-XA | | | 1.34 | % (c)(i) | | | 02/10/2048 | | | | 154,615 | |
4,470,000 | | Citigroup Commercial Mortgage Trust, Series 2016-GC36-D | | | 2.85 | % (a) | | | 02/10/2049 | | | | 3,318,526 | |
41,366,580 | | Citigroup Commercial Mortgage Trust, Series 2016-P3-XA | | | 1.70 | % (c)(i) | | | 04/15/2049 | | | | 2,552,119 | |
43,631,111 | | Citigroup Commercial Mortgage Trust, Series 2016-P4-XA | | | 1.95 | % (c)(i) | | | 07/10/2049 | | | | 3,183,522 | |
80,844,809 | | Citigroup Commercial Mortgage Trust, Series 2016-P5-XA | | | 1.49 | % (c)(i) | | | 10/10/2049 | | | | 4,465,431 | |
13,720,000 | | Citigroup Commercial Mortgage Trust, Series 2017-C4-B | | | 4.10 | % (c) | | | 10/12/2050 | | | | 14,548,522 | |
321,000 | | Citigroup Commercial Mortgage Trust, Series 2018-B2-B | | | 4.28 | % (c) | | | 03/10/2051 | | | | 352,727 | |
1,977,000 | | Citigroup Commercial Mortgage Trust, Series 2018-C5-C | | | 4.72 | % (c) | | | 06/10/2051 | | | | 2,162,794 | |
9,344,000 | | Citigroup Commercial Mortgage Trust, Series 2019-GC41-B | | | 3.20 | % | | | 08/10/2056 | | | | 9,576,193 | |
8,478,000 | | Citigroup Commercial Mortgage Trust, Series 2020-555-F | | | 3.50 | % (a)(c) | | | 12/10/2041 | | | | 7,212,440 | |
7,003,000 | | Citigroup Commercial Mortgage Trust, Series 2020-555-G | | | 3.50 | % (a)(c) | | | 12/10/2041 | | | | 5,388,326 | |
1,815,000 | | COMM Mortgage Trust, Series 2014-CR16-B | | | 4.58 | % | | | 04/10/2047 | | | | 1,950,577 | |
3,325,000 | | COMM Mortgage Trust, Series 2015-CR25-B | | | 4.53 | % (c) | | | 08/10/2048 | | | | 3,653,116 | |
21,229,811 | | Commercial Mortgage Pass-Through Certificates, Series 2012-CR3-XA | | | 1.84 | % (c)(i) | | | 10/15/2045 | | | | 405,615 | |
3,152,658 | | Commercial Mortgage Pass-Through Certificates, Series 2012-LC4-XA | | | 2.10 | % (a)(c)(i) | | | 12/10/2044 | | | | 23,383 | |
7,335,783 | | Commercial Mortgage Pass-Through Certificates, Series 2014-CR20-C | | | 4.51 | % (c) | | | 11/10/2047 | | | | 7,706,990 | |
55,011,372 | | Commercial Mortgage Pass-Through Certificates, Series 2015-CR26-XA | | | 0.93 | % (c)(i) | | | 10/10/2048 | | | | 1,889,201 | |
4,310,000 | | Commercial Mortgage Pass-Through Certificates, Series 2015-LC21-C | | | 4.34 | % (c) | | | 07/10/2048 | | | | 4,418,003 | |
5,579,000 | | Commercial Mortgage Pass-Through Certificates, Series 2015-LC23-C | | | 4.62 | % (c) | | | 10/10/2048 | | | | 6,006,425 | |
5,997,000 | | Commercial Mortgage Pass-Through Certificates, Series 2016-CR28-C | | | 4.64 | % (c) | | | 02/10/2049 | | | | 6,461,850 | |
56,037,410 | | Commercial Mortgage Pass-Through Certificates, Series 2016-DC2-XA | | | 0.96 | % (c)(i) | | | 02/10/2049 | | | | 2,112,947 | |
8,416,000 | | Commercial Mortgage Pass-Through Certificates, Series 2018-HCLV-C (1 Month LIBOR USD + 1.70%, 1.70% Floor) | | | 1.81 | % (a) | | | 09/15/2033 | | | | 8,320,780 | |
8,166,067 | | Core Mortgage Trust, Series 2019-CORE-E (1 Month LIBOR USD + 1.90%, 1.90% Floor) | | | 2.01 | % (a) | | | 12/15/2031 | | | | 8,127,821 | |
1,991,347 | | Core Mortgage Trust, Series 2019-CORE-F (1 Month LIBOR USD + 2.35%, 2.35% Floor) | | | 2.46 | % (a) | | | 12/15/2031 | | | | 1,971,854 | |
5,597,000 | | CSAIL Commercial Mortgage Trust, Series 2015-C4-C | | | 4.56 | % (c) | | | 11/15/2048 | | | | 6,010,703 | |
3,461,000 | | CSAIL Commercial Mortgage Trust, Series 2016-C6-D | | | 4.95 | % (a)(c) | | | 01/15/2049 | | | | 3,027,248 | |
41,039,041 | | CSAIL Commercial Mortgage Trust, Series 2016-C6-XA | | | 1.92 | % (c)(i) | | | 01/15/2049 | | | | 2,919,329 | |
11,488,000 | | CSAIL Commercial Mortgage Trust, Series 2018-C14-C | | | 4.89 | % (c) | | | 11/15/2051 | | | | 12,670,945 | |
400,000 | | CSAIL Commercial Mortgage Trust, Series 2018-CX12-B | | | 4.61 | % (c) | | | 08/15/2051 | | | | 441,607 | |
3,800,000 | | CSAIL Commercial Mortgage Trust, Series 2018-CX12-C | | | 4.76 | % (c) | | | 08/15/2051 | | | | 3,909,328 | |
9,269,000 | | CSAIL Commercial Mortgage Trust, Series 2019-C16-AS | | | 3.61 | % | | | 06/15/2052 | | | | 9,986,897 | |
9,269,000 | | CSAIL Commercial Mortgage Trust, Series 2019-C16-B | | | 3.88 | % | | | 06/15/2052 | | | | 9,695,761 | |
6,238,000 | | CSAIL Commercial Mortgage Trust, Series 2020-C19-C | | | 3.61 | % (c) | | | 03/15/2053 | | | | 6,328,112 | |
126,943,875 | | CSAIL Commercial Mortgage Trust, Series 2020-C19-XA | | | 1.12 | % (c)(i) | | | 03/15/2053 | | | | 10,218,373 | |
798,000 | | CSMC Trust, Series 2017-CALI-D | | | 3.78 | % (a)(c) | | | 11/10/2032 | | | | 824,678 | |
4,944,000 | | CSMC Trust, Series 2017-CHOP-D (1 Month LIBOR USD + 1.90%, 1.90% Floor) | | | 2.01 | % (a) | | | 07/15/2032 | | | | 4,758,636 | |
4,359,000 | | CSMC Trust, Series 2017-CHOP-E (1 Month LIBOR USD + 3.30%, 3.30% Floor) | | | 3.41 | % (a) | | | 07/15/2032 | | | | 4,003,901 | |
6,269,000 | | CSMC Trust, Series 2020-NET-C | | | 3.53 | % (a) | | | 08/15/2037 | | | | 6,497,328 | |
4,503,000 | | DBGS Mortgage Trust, Series 2018-5BP-D (1 Month LIBOR USD + 1.35%, 1.35% Floor) | | | 1.46 | % (a) | | | 06/15/2033 | | | | 4,469,583 | |
186,000 | | DBGS Mortgage Trust, Series 2018-5BP-F (1 Month LIBOR USD + 2.45%, 2.45% Floor) | | | 2.56 | % (a) | | | 06/15/2033 | | | | 177,449 | |
834,072 | | DBUBS Mortgage Trust, Series 2011-LC2A-XA | | | 1.08 | % (a)(c)(i) | | | 07/10/2044 | | | | 8 | |
4,475,000 | | Deutsche Bank Commercial Mortgage Trust, Series 2016-C1-C | | | 3.35 | % (c) | | | 05/10/2049 | | | | 4,302,156 | |
55,713,340 | | Deutsche Bank Commercial Mortgage Trust, Series 2016-C1-XA | | | 1.43 | % (c)(i) | | | 05/10/2049 | | | | 3,154,601 | |
1,500,000 | | Exantas Capital Corporation Ltd., Series 2020-RSO8-D (1 Month LIBOR USD + 2.50%, 2.50% Floor) | | | 2.61 | % (a) | | | 03/15/2035 | | | | 1,500,080 | |
6,281,000 | | Fontainebleau Miami Beach Trust, Series 2019-FBLU-E | | | 3.96 | % (a)(c) | | | 12/10/2036 | | | | 6,509,778 | |
6,410,000 | | Fontainebleau Miami Beach Trust, Series 2019-FBLU-F | | | 3.96 | % (a)(c) | | | 12/10/2036 | | | | 6,477,372 | |
7,412,000 | | Fontainebleau Miami Beach Trust, Series 2019-FBLU-G | | | 3.96 | % (a)(c) | | | 12/10/2036 | | | | 7,380,304 | |
1,014,301 | | FREMF Mortgage Trust, Series 2016-KF22-B (1 Month LIBOR USD + 5.05%, 5.05% Floor) | | | 5.17 | % (a) | | | 07/25/2023 | | | | 1,029,349 | |
9,365,000 | | FREMF Mortgage Trust, Series 2018-KC02-C | | | 0.00 | % (a)(j) | | | 08/25/2025 | | | | 6,917,115 | |
5,000,000 | | FS Rialto, Series 2019-FL1-B (1 Month LIBOR USD + 1.90%, 1.90% Floor) | | | 2.01 | % (a) | | | 12/16/2036 | | | | 4,985,085 | |
12,000,000 | | Grace Trust, Series 2020-GRCE-D | | | 2.68 | % (a)(c) | | | 12/10/2040 | | | | 11,391,155 | |
4,000,000 | | Great Wolf Trust, Series 2019-WOLF-F (1 Month LIBOR USD + 3.13%, 3.13% Floor) | | | 3.24 | % (a) | | | 12/15/2036 | | | | 3,836,534 | |
2,588,000 | | GS Mortgage Securities Corporation Trust, Series 2018-RIVR-C (1 Month LIBOR USD + 1.25%, 1.25% Floor) | | | 1.36 | % (a) | | | 07/15/2035 | | | | 2,519,271 | |
7,055,000 | | GS Mortgage Securities Corporation, Series 2015-GC32-B | | | 4.41 | % (c) | | | 07/10/2048 | | | | 7,751,340 | |
4,256,000 | | GS Mortgage Securities Corporation, Series 2019-SOHO-E (1 Month LIBOR USD + 1.87%, 1.88% Floor) | | | 1.98 | % (a) | | | 06/15/2036 | | | | 4,054,687 | |
1,509,865 | | GS Mortgage Securities Trust, Series 2011-GC5-XA | | | 1.20 | % (a)(c)(i) | | | 08/10/2044 | | | | 382 | |
4,398,367 | | GS Mortgage Securities Trust, Series 2012-GC6-XA | | | 1.92 | % (a)(c)(i) | | | 01/10/2045 | | | | 24,368 | |
8,569,000 | | GS Mortgage Securities Trust, Series 2014-GC26-D | | | 4.51 | % (a)(c) | | | 11/10/2047 | | | | 5,960,938 | |
94,840,897 | | GS Mortgage Securities Trust, Series 2015-GS1-XA | | | 0.76 | % (c)(i) | | | 11/10/2048 | | | | 2,885,866 | |
4,854,000 | | GS Mortgage Securities Trust, Series 2016-GS2-B | | | 3.76 | % (c) | | | 05/10/2049 | | | | 5,207,666 | |
1,825,000 | | GS Mortgage Securities Trust, Series 2016-GS2-C | | | 4.71 | % (c) | | | 05/10/2049 | | | | 2,002,534 | |
46,497,916 | | GS Mortgage Securities Trust, Series 2016-GS2-XA | | | 1.75 | % (c)(i) | | | 05/10/2049 | | | | 3,356,150 | |
5,801,000 | | GS Mortgage Securities Trust, Series 2017-GS6-B | | | 3.87 | % | | | 05/10/2050 | | | | 6,301,786 | |
10,779,000 | | GS Mortgage Securities Trust, Series 2019-GC39-B | | | 3.97 | % | | | 05/10/2052 | | | | 11,558,518 | |
9,879,000 | | GSCG Trust, Series 2019-600C-D | | | 3.76 | % (a) | | | 09/06/2034 | | | | 9,869,765 | |
791,000 | | GSCG Trust, Series 2019-600C-E | | | 3.99 | % (a)(c) | | | 09/06/2034 | | | | 780,473 | |
11,087,664 | | HPLY Trust, Series 2019-HIT-F (1 Month LIBOR USD + 3.15%, 3.15% Floor) | | | 3.26 | % (a) | | | 11/15/2036 | | | | 10,641,996 | |
290,240 | | JP Morgan Chase Commercial Mortgage Securities Corporation, Series 2006-LDP8-X | | | 0.29 | % (c)(i) | | | 05/15/2045 | | | | 3 | |
17,357,935 | | JP Morgan Chase Commercial Mortgage Securities Corporation, Series 2012-C8-XA | | | 1.74 | % (c)(i) | | | 10/15/2045 | | | | 342,437 | |
4,074,233 | | JP Morgan Chase Commercial Mortgage Securities Corporation, Series 2012-CBX-XA | | | 1.47 | % (c)(i) | | | 06/15/2045 | | | | 27,275 | |
58,898,162 | | JP Morgan Chase Commercial Mortgage Securities Corporation, Series 2015-JP1-XA | | | 0.92 | % (c)(i) | | | 01/15/2049 | | | | 2,072,120 | |
2,976,800 | | JP Morgan Chase Commercial Mortgage Securities Corporation, Series 2018-LAQ-D (1 Month LIBOR USD + 2.10%, 2.10% Floor) | | | 2.21 | % (a) | | | 06/15/2032 | | | | 2,984,877 | |
2,837,000 | | JP Morgan Chase Commercial Mortgage Securities Trust, Series 2016-JP2-B | | | 3.46 | % | | | 08/15/2049 | | | | 2,942,446 | |
1,000,000 | | JP Morgan Chase Commercial Mortgage Securities Trust, Series 2019-COR4-C | | | 4.94 | % (c) | | | 03/10/2052 | | | | 1,102,106 | |
7,958,000 | | JP Morgan Chase Commercial Mortgage Securities Trust, Series 2020-LOOP-E | | | 3.86 | % (a)(c) | | | 12/05/2038 | | | | 7,722,162 | |
41,142,646 | | JPMBB Commercial Mortgage Securities Trust, Series 2014-C18-XA | | | 0.81 | % (c)(i) | | | 02/15/2047 | | | | 790,058 | |
3,000,000 | | JPMBB Commercial Mortgage Securities Trust, Series 2014-C21-C | | | 4.65 | % (c) | | | 08/15/2047 | | | | 2,999,982 | |
2,766,125 | | JPMBB Commercial Mortgage Securities Trust, Series 2014-C23-C | | | 4.47 | % (c) | | | 09/15/2047 | | | | 2,862,425 | |
3,766,500 | | JPMBB Commercial Mortgage Securities Trust, Series 2014-C25-C | | | 4.45 | % (c) | | | 11/15/2047 | | | | 3,752,129 | |
45,303,826 | | JPMBB Commercial Mortgage Securities Trust, Series 2014-C25-XA | | | 0.84 | % (c)(i) | | | 11/15/2047 | | | | 1,171,720 | |
12,131,110 | | JPMBB Commercial Mortgage Securities Trust, Series 2015-C27-D | | | 3.85 | % (a)(c) | | | 02/15/2048 | | | | 10,880,363 | |
1,846,000 | | JPMBB Commercial Mortgage Securities Trust, Series 2015-C28-B | | | 3.99 | % | | | 10/15/2048 | | | | 1,914,699 | |
4,987,000 | | JPMBB Commercial Mortgage Securities Trust, Series 2015-C29-C | | | 4.20 | % (c) | | | 05/15/2048 | | | | 4,900,559 | |
55,902,189 | | JPMBB Commercial Mortgage Securities Trust, Series 2015-C30-XA | | | 0.51 | % (c)(i) | | | 07/15/2048 | | | | 1,049,469 | |
44,337,189 | | JPMBB Commercial Mortgage Securities Trust, Series 2015-C31-XA | | | 0.83 | % (c)(i) | | | 08/15/2048 | | | | 1,375,007 | |
4,138,000 | | JPMBB Commercial Mortgage Securities Trust, Series 2015-C32-C | | | 4.65 | % (c) | | | 11/15/2048 | | | | 3,488,789 | |
6,470,000 | | JPMBB Commercial Mortgage Securities Trust, Series 2015-C33-C | | | 4.61 | % (c) | | | 12/15/2048 | | | | 6,835,344 | |
1,447,000 | | JPMBB Commercial Mortgage Securities Trust, Series 2016-C1-C | | | 4.74 | % (c) | | | 03/15/2049 | | | | 1,587,400 | |
53,953,445 | | JPMBB Commercial Mortgage Securities Trust, Series 2016-C2-XA | | | 1.56 | % (c)(i) | | | 06/15/2049 | | | | 3,010,208 | |
1,638,000 | | JPMCC Commercial Mortgage Securities Trust, Series 2019-COR4-B | | | 4.44 | % | | | 03/10/2052 | | | | 1,801,974 | |
7,675,000 | | JPMDB Commercial Mortgage Securities Trust, Series 2016-C2-AS | | | 3.48 | % | | | 06/15/2049 | | | | 8,098,615 | |
9,960,000 | | JPMDB Commercial Mortgage Securities Trust, Series 2020-COR7-C | | | 3.73 | % (c) | | | 05/13/2053 | | | | 10,224,667 | |
319,127 | | LB-UBS Commercial Mortgage Trust, Series 2006-C7-XCL | | | 0.41 | % (a)(c)(i) | | | 11/15/2038 | | | | 60 | |
257,371 | | LB-UBS Commercial Mortgage Trust, Series 2006-C7-XW | | | 0.41 | % (a)(c)(i) | | | 11/15/2038 | | | | 48 | |
5,425,000 | | LSTAR Commercial Mortgage Trust, Series 2016-4-C | | | 4.59 | % (a)(c) | | | 03/10/2049 | | | | 5,204,037 | |
13,184,000 | | MBRT, Series 2019-MBR-F (1 Month LIBOR USD + 2.55%, 2.55% Floor) | | | 2.66 | % (a) | | | 11/15/2036 | | | | 13,044,058 | |
4,500,000 | | MKT Mortgage Trust, Series 2020-525M-F | | | 2.94 | % (a)(c) | | | 02/12/2040 | | | | 3,999,158 | |
1,785,727 | | Morgan Stanley Bank of America Merrill Lynch Trust, Series 2012-C5-XA | | | 1.41 | % (a)(c)(i) | | | 08/15/2045 | | | | 21,852 | |
2,500,000 | | Morgan Stanley Bank of America Merrill Lynch Trust, Series 2014-C17-C | | | 4.47 | % (c) | | | 08/15/2047 | | | | 2,659,775 | |
3,000,000 | | Morgan Stanley Bank of America Merrill Lynch Trust, Series 2014-C18-C | | | 4.52 | % (c) | | | 10/15/2047 | | | | 3,189,736 | |
1,508,500 | | Morgan Stanley Bank of America Merrill Lynch Trust, Series 2014-C19-C | | | 4.00 | % | | | 12/15/2047 | | | | 1,575,962 | |
1,406,000 | | Morgan Stanley Bank of America Merrill Lynch Trust, Series 2015-C20-B | | | 4.16 | % | | | 02/15/2048 | | | | 1,514,408 | |
3,620,000 | | Morgan Stanley Bank of America Merrill Lynch Trust, Series 2015-C20-C | | | 4.46 | % (c) | | | 02/15/2048 | | | | 3,864,214 | |
32,226,256 | | Morgan Stanley Bank of America Merrill Lynch Trust, Series 2015-C20-XA | | | 1.28 | % (c)(i) | | | 02/15/2048 | | | | 1,192,194 | |
75,089,000 | | Morgan Stanley Bank of America Merrill Lynch Trust, Series 2015-C23-XB | | | 0.14 | % (a)(c)(i) | | | 07/15/2050 | | | | 578,748 | |
2,957,000 | | Morgan Stanley Bank of America Merrill Lynch Trust, Series 2015-C25-C | | | 4.53 | % (c) | | | 10/15/2048 | | | | 3,162,980 | |
4,674,000 | | Morgan Stanley Bank of America Merrill Lynch Trust, Series 2015-C27-C | | | 4.52 | % (c) | | | 12/15/2047 | | | | 4,840,147 | |
6,710,000 | | Morgan Stanley Bank of America Merrill Lynch Trust, Series 2015-C27-D | | | 3.24 | % (a)(c) | | | 12/15/2047 | | | | 5,849,373 | |
47,453,950 | | Morgan Stanley Bank of America Merrill Lynch Trust, Series 2016-C30-XA | | | 1.39 | % (c)(i) | | | 09/15/2049 | | | | 2,750,834 | |
6,364,000 | | Morgan Stanley Bank of America Merrill Lynch Trust, Series 2017-C33-B | | | 4.11 | % | | | 05/15/2050 | | | | 6,823,256 | |
3,194,000 | | Morgan Stanley Capital Trust , Series 2018-H3-C | | | 4.85 | % (c) | | | 07/15/2051 | | | | 3,479,784 | |
28,434,956 | | Morgan Stanley Capital Trust, Series 2016-UB11-XA | | | 1.51 | % (c)(i) | | | 08/15/2049 | | | | 1,630,327 | |
3,022,000 | | Morgan Stanley Capital Trust, Series 2017-ASHF-D (1 Month LIBOR USD + 2.20%, 2.20% Floor) | | | 2.31 | % (a) | | | 11/15/2034 | | | | 2,997,619 | |
4,533,000 | | Morgan Stanley Capital Trust, Series 2017-ASHF-E (1 Month LIBOR USD + 3.15%, 3.15% Floor) | | | 3.26 | % (a) | | | 11/15/2034 | | | | 4,431,456 | |
2,183,000 | | Morgan Stanley Capital Trust, Series 2017-ASHF-F (1 Month LIBOR USD + 4.35%, 4.35% Floor) | | | 4.46 | % (a) | | | 11/15/2034 | | | | 2,036,719 | |
3,232,260 | | Motel 6 Trust, Series 2017-MTL6-E (1 Month LIBOR USD + 3.25%, 3.25% Floor) | | | 3.36 | % (a) | | | 08/15/2034 | | | | 3,245,906 | |
11,179,000 | | MSCG Trust, Series 2018-SELF-F (1 Month LIBOR USD + 3.05%, 3.05% Floor) | | | 3.16 | % (a) | | | 10/15/2037 | | | | 11,306,018 | |
2,108,000 | | Natixis Commercial Mortgage Securities Trust, Series 2018-FL1-C (1 Month LIBOR USD + 2.20%, 2.20% Floor) | | | 2.31 | % (a) | | | 06/15/2035 | | | | 1,871,701 | |
5,158,000 | | PFP Ltd., Series 2019-5-C (1 Month LIBOR USD + 2.00%, 2.00% Floor) | | | 2.11 | % (a) | | | 04/14/2036 | | | | 5,156,035 | |
52,420,649 | | SG Commercial Mortgage Securities Trust, Series 2016-C5-XA | | | 1.95 | % (c)(i) | | | 10/10/2048 | | | | 3,438,606 | |
1,374,000 | | UBS Commercial Mortgage Trust, Series 2013-C5-D | | | 4.08 | % (a)(c) | | | 03/10/2046 | | | | 1,145,569 | |
8,911,000 | | UBS Commercial Mortgage Trust, Series 2017-C1-B | | | 4.04 | % | | | 06/15/2050 | | | | 9,306,199 | |
11,933,000 | | UBS Commercial Mortgage Trust, Series 2017-C2-B | | | 3.99 | % (c) | | | 08/15/2050 | | | | 12,781,899 | |
2,491,000 | | UBS Commercial Mortgage Trust, Series 2017-C6-B | | | 4.15 | % (c) | | | 12/15/2050 | | | | 2,658,742 | |
1,450,000 | | UBS Commercial Mortgage Trust, Series 2017-C7-B | | | 4.29 | % (c) | | | 12/15/2050 | | | | 1,572,121 | |
6,958,000 | | UBS Commercial Mortgage Trust, Series 2017-C7-C | | | 4.58 | % (c) | | | 12/15/2050 | | | | 7,340,799 | |
559,000 | | UBS Commercial Mortgage Trust, Series 2018-C10-C | | | 5.09 | % (c) | | | 05/15/2051 | | | | 604,759 | |
7,293,000 | | UBS Commercial Mortgage Trust, Series 2018-C11-C | | | 4.89 | % (c) | | | 06/15/2051 | | | | 7,219,966 | |
2,896,000 | | UBS Commercial Mortgage Trust, Series 2018-C12-C | | | 4.96 | % (c) | | | 08/15/2051 | | | | 2,837,671 | |
5,698,000 | | UBS Commercial Mortgage Trust, Series 2018-C8-C | | | 4.70 | % (c) | | | 02/15/2051 | | | | 6,239,939 | |
9,316,603 | | UBS-Barclays Commercial Mortgage Trust, Series 2012-C3-XA | | | 1.81 | % (a)(c)(i) | | | 08/10/2049 | | | | 179,521 | |
3,513,520 | | UBS-Barclays Commercial Mortgage Trust, Series 2013-C5-B | | | 3.65 | % (a)(c) | | | 03/10/2046 | | | | 3,571,600 | |
397,938 | | Wachovia Bank Commercial Mortgage Trust, Series 2006-C29-IO | | | 0.00 | % (c)(i) | | | 11/15/2048 | | | | 4 | |
2,031,000 | | Wells Fargo Commercial Mortgage Trust, Series 2014-LC16-D | | | 3.94 | % (a) | | | 08/15/2050 | | | | 533,144 | |
8,809,000 | | Wells Fargo Commercial Mortgage Trust, Series 2015-C28-C | | | 4.09 | % (c) | | | 05/15/2048 | | | | 9,234,964 | |
4,891,000 | | Wells Fargo Commercial Mortgage Trust, Series 2015-C31-C | | | 4.60 | % (c) | | | 11/15/2048 | | | | 5,106,315 | |
41,765,272 | | Wells Fargo Commercial Mortgage Trust, Series 2015-NXS1-XA | | | 1.09 | % (c)(i) | | | 05/15/2048 | | | | 1,443,562 | |
4,207,000 | | Wells Fargo Commercial Mortgage Trust, Series 2015-NXS3-C | | | 4.50 | % (c) | | | 09/15/2057 | | | | 4,453,422 | |
7,353,000 | | Wells Fargo Commercial Mortgage Trust, Series 2015-NXS4-C | | | 4.70 | % (c) | | | 12/15/2048 | | | | 7,937,763 | |
62,732,883 | | Wells Fargo Commercial Mortgage Trust, Series 2015-P2-XA | | | 0.93 | % (c)(i) | | | 12/15/2048 | | | | 2,313,758 | |
4,650,000 | | Wells Fargo Commercial Mortgage Trust, Series 2016-C32-C | | | 4.72 | % (c) | | | 01/15/2059 | | | | 4,884,216 | |
4,483,000 | | Wells Fargo Commercial Mortgage Trust, Series 2016-C33-C | | | 3.90 | % | | | 03/15/2059 | | | | 4,668,711 | |
7,687,000 | | Wells Fargo Commercial Mortgage Trust, Series 2016-C35-B | | | 3.44 | % | | | 07/15/2048 | | | | 7,912,403 | |
2,518,000 | | Wells Fargo Commercial Mortgage Trust, Series 2016-C37-C | | | 4.49 | % (c) | | | 12/15/2049 | | | | 2,700,916 | |
2,574,000 | | Wells Fargo Commercial Mortgage Trust, Series 2016-LC25-B | | | 4.42 | % (c) | | | 12/15/2059 | | | | 2,825,877 | |
7,224,000 | | Wells Fargo Commercial Mortgage Trust, Series 2016-NXS6-B | | | 3.81 | % | | | 11/15/2049 | | | | 7,607,652 | |
78,638,646 | | Wells Fargo Commercial Mortgage Trust, Series 2016-NXS6-XA | | | 1.61 | % (c)(i) | | | 11/15/2049 | | | | 4,264,440 | |
2,638,000 | | Wells Fargo Commercial Mortgage Trust, Series 2018-C45-C | | | 4.73 | % | | | 06/15/2051 | | | | 2,782,947 | |
7,228,000 | | Wells Fargo Commercial Mortgage Trust, Series 2018-C46-C | | | 4.98 | % (c) | | | 08/15/2051 | | | | 7,912,575 | |
12,408,000 | | Wells Fargo Commercial Mortgage Trust, Series 2018-C47-C | | | 4.93 | % (c) | | | 09/15/2061 | | | | 13,205,347 | |
6,546,000 | | Wells Fargo Commercial Mortgage Trust, Series 2018-C48-C | | | 5.12 | % (c) | | | 01/15/2052 | | | | 7,222,795 | |
2,558,000 | | Wells Fargo Commercial Mortgage Trust, Series 2019-C49-B | | | 4.55 | % | | | 03/15/2052 | | | | 2,869,198 | |
8,421,000 | | Wells Fargo Commercial Mortgage Trust, Series 2019-C49-C | | | 4.87 | % (c) | | | 03/15/2052 | | | | 9,234,568 | |
21,128,452 | | Wells Fargo Commercial Mortgage Trust, Series 2019-C49-XA | | | 1.27 | % (c)(i) | | | 03/15/2052 | | | | 1,673,430 | |
10,776,000 | | Wells Fargo Commercial Mortgage Trust, Series 2019-C50-B | | | 4.19 | % | | | 05/15/2052 | | | | 11,798,152 | |
10,776,000 | | Wells Fargo Commercial Mortgage Trust, Series 2019-C50-C | | | 4.35 | % | | | 05/15/2052 | | | | 11,280,263 | |
9,344,000 | | Wells Fargo Commercial Mortgage Trust, Series 2019-C51-B | | | 3.84 | % (c) | | | 06/15/2052 | | | | 9,978,299 | |
11,727,000 | | Wells Fargo Commercial Mortgage Trust, Series 2020-C55-B | | | 3.14 | % | | | 02/15/2053 | | | | 12,125,589 | |
5,510,000 | | Wells Fargo Commercial Mortgage Trust, Series 2020-C58-B | | | 2.70 | % | | | 07/15/2053 | | | | 5,419,130 | |
3,800,000 | | Wells Fargo Commercial Mortgage Trust, Series 2020-C58-C | | | 3.16 | % | | | 07/15/2053 | | | | 3,801,786 | |
12,280,307 | | WF-RBS Commercial Mortgage Trust, Series 2012-C9-XA | | | 1.87 | % (a)(c)(i) | | | 11/15/2045 | | | | 256,030 | |
68,231,950 | | WF-RBS Commercial Mortgage Trust, Series 2014-C21-XA | | | 1.03 | % (c)(i) | | | 08/15/2047 | | | | 1,828,957 | |
48,137,884 | | WF-RBS Commercial Mortgage Trust, Series 2014-C22-XA | | | 0.80 | % (c)(i) | | | 09/15/2057 | | | | 1,040,062 | |
| | | | | | | | | | | | | | |
Total Non-Agency Commercial Mortgage Backed Obligations (Cost $957,045,230) | | | | | | | | 921,671,713 | |
| | | | | | | | | | | | | | |
Non-Agency Residential Collateralized Mortgage Obligations—10.1% | | | | | | | | | |
7,445,612 | | Adjustable Rate Mortgage Trust, Series 2007-1-4A1 | | | 4.43 | % (c) | | | 03/25/2037 | | | | 6,151,805 | |
29,989 | | Adjustable Rate Mortgage Trust, Series 2007-3-1A1 | | | 4.19 | % (a)(c) | | | 11/25/2037 | | | | 33,431 | |
5,629,733 | | Ajax Mortgage Loan Trust, Series 2020-D-A | | | 2.25 | % (a)(b) | | | 06/25/2060 | | | | 5,671,077 | |
5,000,000 | | AlphaFlow Transitional Mortgage Trust, Series 2021-WL1-A1 | | | 3.28 | % (a)(b) | | | 01/25/2026 | | | | 5,001,771 | |
10,468,182 | | Alternative Loan Trust, Series 2005-49CB-A2 | | | 5.50 | % | | | 11/25/2035 | | | | 9,341,130 | |
7,593,849 | | Alternative Loan Trust, Series 2007-8CB-A1 | | | 5.50 | % | | | 05/25/2037 | | | | 6,031,224 | |
7,888,491 | | Alternative Loan Trust, Series 2007-OA8-2A1 (1 Month LIBOR USD + 0.18%, 0.18% Floor) | | | 0.29 | % | | | 06/25/2047 | | | | 6,393,716 | |
3,100,000 | | AMSR Trust, Series 2019-SFR1-E | | | 3.47 | % (a) | | | 01/19/2039 | | | | 3,148,814 | |
2,614,630 | | Angel Oak Mortgage Trust LLC, Series 2018-3-A1 | | | 3.65 | % (a)(c) | | | 09/25/2048 | | | | 2,642,287 | |
3,715,315 | | Angel Oak Mortgage Trust LLC, Series 2018-3-A2 | | | 3.75 | % (a)(c) | | | 09/25/2048 | | | | 3,750,090 | |
3,535,238 | | Angel Oak Mortgage Trust LLC, Series 2018-3-A3 | | | 3.85 | % (a)(c) | | | 09/25/2048 | | | | 3,564,010 | |
223,415 | | Banc of America Funding Corporation, Series 2005-G-A3 | | | 3.01 | % (c) | | | 10/20/2035 | | | | 216,057 | |
261,837 | | Banc of America Funding Corporation, Series 2006-2-6A2 | | | 5.50 | % | | | 03/25/2036 | | | | 259,508 | |
135,448 | | Banc of America Funding Corporation, Series 2006-6-1A2 | | | 6.25 | % | | | 08/25/2036 | | | | 134,104 | |
1,229,581 | | Bayview Opportunity Master Fund Trust, Series 2019-SBR1-A1 | | | 3.47 | % (a)(b) | | | 06/28/2034 | | | | 1,236,435 | |
254,604 | | Bear Stearns Asset Backed Securities Trust, Series 2007-SD1-1A3A | | | 6.50 | % | | | 10/25/2036 | | | | 172,524 | |
29,767,221 | | BRAVO Residential Funding Trust, Series 2021-A-A1 | | | 1.99 | % (a)(b) | | | 01/25/2024 | | | | 29,771,734 | |
1,815,175 | | Chase Mortgage Finance Trust, Series 2007-A2-6A4 | | | 2.99 | % (c) | | | 07/25/2037 | | | | 1,759,721 | |
925,033 | | Chase Mortgage Finance Trust, Series 2007-S3-2A1 | | | 5.50 | % | | | 05/25/2037 | | | | 303,399 | |
20,220,089 | | CIM Trust, Series 2017-6-A1 | | | 3.02 | % (a)(c) | | | 06/25/2057 | | | | 20,250,106 | |
6,953,000 | | CIM Trust, Series 2020-R2-M2 | | | 3.00 | % (a)(c) | | | 10/25/2059 | | | | 6,862,147 | |
42,231 | | CitiCorporationMortgage Securities, Inc., Series 2005-1-1A4 | | | 5.50 | % | | | 02/25/2035 | | | | 43,178 | |
737,411 | | CitiCorporationResidential Mortgage Securities, Inc., Series 2006-2-A5 | | | 5.22 | % (k) | | | 09/25/2036 | | | | 754,672 | |
229,098 | | Citigroup Mortgage Loan Trust, Series 2006-WF2-A2C | | | 6.35 | % (k) | | | 05/25/2036 | | | | 118,288 | |
418,048 | | Citigroup Mortgage Loan Trust, Series 2008-AR4-2A1B | | | 3.45 | % (a)(c) | | | 11/25/2038 | | | | 422,655 | |
4,864,365 | | Citigroup Mortgage Loan Trust, Series 2007-OPX1-A1A (1 Month LIBOR USD + 0.07%, 0.07% Floor) | | | 0.18 | % | | | 01/25/2037 | | | | 2,841,308 | |
10,014,259 | | Citigroup Mortgage Loan Trust, Series 2009-3-5A3 | | | 6.00 | % (a)(c) | | | 02/25/2037 | | | | 9,291,747 | |
3,794,500 | | Citigroup Mortgage Loan Trust, Series 2018-RP1-M3 | | | 3.00 | % (a)(c) | | | 09/25/2064 | | | | 3,743,315 | |
36,144,552 | | Citigroup Mortgage Loan Trust, Series 2019-A-PT1 | | | 3.92 | % (a) | | | 10/25/2058 | | | | 35,384,352 | |
4,243,548 | | Citigroup Mortgage Loan Trust, Series 2019-C-A1 | | | 3.23 | % (a)(b) | | | 09/25/2059 | | | | 4,273,003 | |
88,318 | | CitiMortgage Alternative Loan Trust, Series 2006-A2-A2 | | | 6.00 | % | | | 05/25/2036 | | | | 88,351 | |
42,742 | | CitiMortgage Alternative Loan Trust, Series 2006-A5-3A3 | | | 6.00 | % | | | 10/25/2036 | | | | 40,220 | |
339,595 | | CitiMortgage Alternative Loan Trust, Series 2007-A1-1A7 | | | 6.00 | % | | | 01/25/2037 | | | | 341,039 | |
5,341,880 | | CitiMortgage Alternative Loan Trust, Series 2007-A5-1A10 | | | 5.75 | % | | | 05/25/2037 | | | | 5,289,931 | |
1,000,000 | | CoreVest American Finance Trust, Series 2020-4-E | | | 3.38 | % (a) | | | 12/15/2052 | | | | 961,998 | |
956,467 | | Countrywide Alternative Loan Trust, Series 2004-22CB-1A1 | | | 6.00 | % | | | 10/25/2034 | | | | 988,444 | |
105,902 | | Countrywide Alternative Loan Trust, Series 2005-20CB-1A1 | | | 5.50 | % | | | 07/25/2035 | | | | 100,930 | |
166,556 | | Countrywide Alternative Loan Trust, Series 2005-28CB-3A6 | | | 6.00 | % | | | 08/25/2035 | | | | 113,741 | |
645,412 | | Countrywide Alternative Loan Trust, Series 2005-46CB-A22 | | | 5.25 | % | | | 10/25/2035 | | | | 587,816 | |
102,678 | | Countrywide Alternative Loan Trust, Series 2005-J10-1A13 (1 Month LIBOR USD + 0.70%, 0.70% Floor, 5.50% Cap) | | | 0.81 | % | | | 10/25/2035 | | | | 75,980 | |
273,611 | | Countrywide Alternative Loan Trust, Series 2006-26CB-A9 | | | 6.50 | % | | | 09/25/2036 | | | | 198,033 | |
7,202,660 | | Countrywide Alternative Loan Trust, Series 2006-42-1A8 | | | 6.00 | % | | | 01/25/2047 | | | | 5,655,882 | |
1,128,370 | | Countrywide Alternative Loan Trust, Series 2007-12T1-A1 | | | 6.00 | % | | | 06/25/2037 | | | | 809,200 | |
1,234,547 | | Countrywide Alternative Loan Trust, Series 2007-16CB-2A1 (1 Month LIBOR USD + 0.45%, 0.45% Floor, 7.00% Cap) | | | 0.56 | % | | | 08/25/2037 | | | | 472,718 | |
357,494 | | Countrywide Alternative Loan Trust, Series 2007-16CB-2A2 (-8 x 1 Month LIBOR USD + 54.58%, 54.58% Cap) | | | 53.68 | % (l) | | | 08/25/2037 | | | | 801,947 | |
70,903 | | Countrywide Alternative Loan Trust, Series 2007-17CB-1A10 (-5 x 1 Month LIBOR USD + 29.90%, 29.90% Cap) | | | 29.40 | % (l) | | | 08/25/2037 | | | | 99,736 | |
335,082 | | Countrywide Alternative Loan Trust, Series 2007-18CB-2A17 | | | 6.00 | % | | | 08/25/2037 | | | | 274,104 | |
1,603,366 | | Countrywide Alternative Loan Trust, Series 2007-23CB-A3 (1 Month LIBOR USD + 0.50%, 0.50% Floor, 7.00% Cap) | | | 0.61 | % | | | 09/25/2037 | | | | 713,035 | |
1,575,035 | | Countrywide Alternative Loan Trust, Series 2007-23CB-A4 (-1 x 1 Month LIBOR USD + 6.50%, 6.50% Cap) | | | 6.39 | % (i)(l) | | | 09/25/2037 | | | | 433,420 | |
721,028 | | Countrywide Alternative Loan Trust, Series 2007-4CB-2A1 | | | 7.00 | % | | | 03/25/2037 | | | | 134,878 | |
11,224 | | Countrywide Asset-Backed Certificates, Series 2005-13-AF3 | | | 5.43 | % (c) | | | 02/25/2033 | | | | 10,645 | |
232,513 | | Countrywide Home Loans, Series 2005-28-A7 | | | 5.25 | % | | | 11/01/2035 | | | | 184,669 | |
521,685 | | Countrywide Home Loans, Series 2007-10-A5 | | | 6.00 | % | | | 07/25/2037 | | | | 379,526 | |
209,797 | | Countrywide Home Loans, Series 2007-15-1A16 | | | 6.25 | % | | | 09/25/2037 | | | | 175,668 | |
558,184 | | Countrywide Home Loans, Series 2007-3-A17 | | | 6.00 | % | | | 04/25/2037 | | | | 418,413 | |
78,765 | | Credit Suisse First Boston Mortgage Securities Corporation, Series 2005-10-5A5 | | | 5.50 | % | | | 11/25/2035 | | | | 70,206 | |
875,858 | | Credit Suisse First Boston Mortgage Securities Corporation, Series 2005-8-1A3 | | | 5.25 | % | | | 09/25/2035 | | | | 851,226 | |
3,701,760 | | Credit Suisse Mortgage Capital Certificates, Series 2009-3R-19A2 | | | 6.00 | % (a) | | | 01/27/2038 | | | | 2,612,463 | |
8,573,211 | | Credit-Based Asset Servicing and Securitization LLC, Series 2007-RP1-A (1 Month LIBOR USD + 0.31%, 0.31% Floor) | | | 8.00 | % (a) | | | 05/25/2046 | | | | 8,048,301 | |
2,764,040 | | CSMC Mortgage-Backed Trust, Series 2006-4-6A1 | | | 6.00 | % | | | 05/25/2036 | | | | 1,624,033 | |
33,657 | | CSMC Mortgage-Backed Trust, Series 2006-4-7A1 | | | 5.50 | % | | | 05/25/2021 | | | | 28,818 | |
61,763 | | CSMC Mortgage-Backed Trust, Series 2007-1-3A1 | | | 6.00 | % | | | 02/25/2022 | | | | 17,776 | |
14,988 | | CSMC Mortgage-Backed Trust, Series 2007-2-2A1 | | | 5.00 | % | | | 03/25/2037 | | | | 14,264 | |
10,483,287 | | CSMC Mortgage-Backed Trust, Series 2019-RPL8-A1 | | | 3.32 | % (a)(c) | | | 10/25/2058 | | | | 10,570,790 | |
1,344,610 | | CSMC Trust, Series 2010-4R-3A17 | | | 6.00 | % (a)(c) | | | 06/26/2037 | | | | 1,334,906 | |
17,305,397 | | CSMC Trust, Series 2019-JR1-A1 | | | 4.10 | % (a)(c) | | | 09/27/2066 | | | | 17,555,284 | |
41,350,696 | | CSMC Trust, Series 2020-RPL1-PT1 | | | 3.44 | % (a)(c) | | | 10/25/2069 | | | | 41,650,116 | |
9,035,400 | | CSMC Trust, Series 2020-RPL4-M1 | | | 2.50 | % (a) | | | 01/25/2060 | | | | 9,040,079 | |
501,409 | | Deutsche Mortgage Securities, Inc., Series 2006-PR1-3A1 (-1 x 1 Month LIBOR USD + 12.12%, 12.12% Cap) | | | 11.98 | % (a)(l) | | | 04/15/2036 | | | | 457,666 | |
91,883 | | Deutsche Mortgage Securities, Inc., Series 2006-PR1-4AI2 (-2 x 1 Month LIBOR USD + 14.60%, 14.61% Cap) | | | 14.40 | %(a)(l) | | | 04/15/2036 | | | | 93,439 | |
1,026,307 | | Deutsche Mortgage Securities, Inc., Series 2006-PR1-5AI4 (-1 x 1 Month LIBOR USD + 12.12%, 12.12% Cap) | | | 11.98 | % (a)(l) | | | 04/15/2036 | | | | 963,947 | |
6,578,478 | | Deutsche Securities, Inc., Series 2005-6-2A1 | | | 5.50 | % | | | 12/25/2035 | | | | 6,393,734 | |
13,653,676 | | First Franklin Mortgage Loan Trust, Series 2007-FF2-A1 (1 Month LIBOR USD + 0.14%, 0.14% Floor) | | | 0.25 | % | | | 03/25/2037 | | | | 9,168,076 | |
254,952 | | First Horizon Alternative Mortgage Securities Trust, Series 2006-FA2-1A5 | | | 6.00 | % | | | 05/25/2036 | | | | 170,666 | |
3,109,224 | | First Horizon Alternative Mortgage Securities Trust, Series 2006-FA8-1A1 | | | 6.25 | % | | | 02/25/2037 | | | | 2,036,154 | |
54,091 | | First Horizon Alternative Mortgage Securities Trust, Series 2006-RE1-A1 | | | 5.50 | % (c) | | | 05/25/2035 | | | | 46,272 | |
19,200,000 | | FMC GMSR Issuer Trust, Series 2019-GT2-A | | | 4.23 | % (a)(c) | | | 09/25/2024 | | | | 19,191,790 | |
11,860,094 | | GCAT LLC, Series 2020-2-A1 | | | 3.72 | % (a)(b) | | | 06/25/2025 | | | | 11,896,118 | |
2,077,642 | | GMACM Mortgage Loan Trust, Series 2006-J1-A6 | | | 5.75 | % | | | 04/25/2036 | | | | 2,068,036 | |
7,546,000 | | GS Mortgage-Backed Securities Trust, Series 2020-NQM1-M1 | | | 3.29 | % (a)(c) | | | 09/27/2060 | | | | 7,649,185 | |
26,766 | | GSAA Home Equity Trust, Series 2005-7-AF5 | | | 5.11 | % (k) | | | 05/25/2035 | | | | 27,099 | |
1,065,982 | | GSAA Home Equity Trust, Series 2007-10-A1A | | | 6.00 | % | | | 11/25/2037 | | | | 883,023 | |
987,502 | | GSAA Home Equity Trust, Series 2007-10-A2A | | | 6.50 | % | | | 11/25/2037 | | | | 655,336 | |
2,028,807 | | GSR Mortgage Loan Trust, Series 2006-3F-4A1 | | | 6.00 | % | | | 03/25/2036 | | | | 2,023,163 | |
24,889,547 | | GSR Mortgage Loan Trust, Series 2006-OA1-1A1 (1 Month LIBOR USD + 0.44%, 0.44% Floor) | | | 0.55 | % | | | 08/25/2046 | | | | 8,941,555 | |
199,718 | | GSR Mortgage Loan Trust, Series 2007-1F-2A2 | | | 5.50 | % | | | 01/25/2037 | | | | 289,854 | |
19,200,000 | | Headlands Residential LLC, Series 2019-RPL1-NOTE | | | 3.97 | % (a)(b) | | | 06/25/2024 | | | | 19,293,938 | |
5,250,000 | | Homeward Opportunities Fund Trust, Series 2020-2-M1 | | | 3.90 | % (a)(c) | | | 05/25/2065 | | | | 5,421,936 | |
9,000,000 | | Homeward Opportunities Fund Trust, Series 2020-BPL1-A1 | | | 3.23 | % (a)(b) | | | 08/25/2025 | | | | 9,023,065 | |
25,183,313 | | HSI Asset Securitization Corporation, Series 2006-HE1-1A1 (1 Month LIBOR USD + 0.14%, 0.14% Floor) | | | 0.25 | % | | | 10/25/2036 | | | | 11,120,012 | |
34,256,422 | | Impac Secured Assets Trust, Series 2006-5-1A1C (1 Month LIBOR USD + 0.27%, 0.27% Floor, 11.50% Cap) | | | 0.38 | % | | | 02/25/2037 | | | | 32,169,216 | |
242,187 | | JP Morgan Alternative Loan Trust, Series 2006-S2-A4 | | | 6.69 | % (k) | | | 05/25/2036 | | | | 244,633 | |
5,477,630 | | JP Morgan Alternative Loan Trust, Series 2006-S3-A4 | | | 6.31 | % | | | 08/25/2036 | | | | 5,349,398 | |
115,082 | | JP Morgan Alternative Loan Trust, Series 2006-S3-A6 | | | 6.12 | % | | | 08/25/2036 | | | | 114,514 | |
116,401 | | JP Morgan Alternative Loan Trust, Series 2006-S4-A6 | | | 5.71 | % (k) | | | 12/25/2036 | | | | 117,427 | |
16,443,755 | | JP Morgan Mortgage Acquisition Trust, Series 2006-WMC2-A5 (1 Month LIBOR USD + 0.50%, 0.50% Floor) | | | 0.61 | % | | | 07/25/2036 | | | | 9,938,870 | |
20,901,335 | | JP Morgan Mortgage Acquisition Trust, Series 2006-WMC3-A4 (1 Month LIBOR USD + 0.15%, 0.15% Floor) | | | 0.26 | % | | | 08/25/2036 | | | | 16,549,894 | |
15,688,836 | | JP Morgan Mortgage Acquisition Trust, Series 2006-WMC4-A5 (1 Month LIBOR USD + 0.21%, 0.21% Floor) | | | 0.32 | % | | | 12/25/2036 | | | | 10,330,268 | |
3,549,520 | | JP Morgan Mortgage Trust, Series 2006-S1-2A9 | | | 6.50 | % | | | 04/25/2036 | | | | 3,661,917 | |
200,970 | | JP Morgan Mortgage Trust, Series 2007-S3-1A7 | | | 6.00 | % | | | 08/25/2037 | | | | 150,679 | |
1,250,744 | | Legacy Mortgage Asset Trust, Series 2019-GS5-A1 | | | 3.20 | % (a)(b) | | | 05/25/2059 | | | | 1,263,474 | |
32,522,257 | | Legacy Mortgage Asset Trust, Series 2019-RPL3-PT1 | | | 4.30 | % (a) | | | 06/25/2058 | | | | 33,242,235 | |
4,025,393 | | Legacy Mortgage Asset Trust, Series 2019-SL3-A | | | 3.47 | % (a)(b) | | | 11/25/2061 | | | | 4,047,389 | |
35,482,734 | | Legacy Mortgage Asset Trust, Series 2020-GS2-A1 | | | 2.75 | % (a)(b) | | | 03/25/2060 | | | | 35,688,747 | |
448,262 | | Lehman Mortgage Trust, Series 2006-3-1A5 | | | 6.00 | % | | | 07/25/2036 | | | | 316,022 | |
33,020 | | Lehman Mortgage Trust, Series 2006-9-1A19 (-5 x 1 Month LIBOR USD + 30.68%, 30.68% Cap) | | | 30.18 | % (l) | | | 01/25/2037 | | | | 49,601 | |
579,923 | | Lehman Mortgage Trust, Series 2007-10-2A1 | | | 6.50 | % | | | 01/25/2038 | | | | 302,986 | |
119,727 | | Lehman Mortgage Trust, Series 2007-2-1A1 | | | 5.75 | % | | | 02/25/2037 | | | | 100,508 | |
4,619,531 | | Lehman Trust, Series 2005-9N-1A1 (1 Month LIBOR USD + 0.27%, 0.27% Floor) | | | 0.38 | % | | | 02/25/2036 | | | | 4,511,233 | |
6,300,300 | | Lehman XS Trust, Series 2007-1-1A2 (1 Month LIBOR USD + 0.32%, 0.32% Floor) | | | 0.43 | % | | | 02/25/2037 | | | | 6,291,648 | |
12,806,170 | | Lehman XS Trust, Series 2007-3-2A3 (1 Month LIBOR USD + 0.48%, 0.48% Floor) | | | 0.59 | % | | | 03/25/2037 | | | | 12,588,365 | |
4,200,000 | | LHOME Mortgage Trust, Series 2021-RTL1-A2 | | | 2.86 | % (a)(c) | | | 09/25/2026 | | | | 4,231,996 | |
9,000,000 | | LoanDepot GMSR Master Trust, Series 2018-GT1-A (1 Month LIBOR USD + 2.80%, 2.80% Floor) | | | 2.91 | % (a) | | | 10/16/2023 | | | | 8,986,693 | |
37,986,896 | | Long Beach Mortgage Loan Trust, Series 2006-2-2A3 (1 Month LIBOR USD + 0.38%, 0.38% Floor) | | | 0.49 | % | | | 03/25/2046 | | | | 17,807,113 | |
14,864,946 | | Long Beach Mortgage Loan Trust, Series 2006-3-2A3 (1 Month LIBOR USD + 0.36%, 0.36% Floor) | | | 0.47 | % | | | 05/25/2046 | | | | 6,767,726 | |
17,684,243 | | Long Beach Mortgage Loan Trust, Series 2006-6-2A3 (1 Month LIBOR USD + 0.15%, 0.15% Floor) | | | 0.26 | % | | | 07/25/2036 | | | | 9,326,219 | |
83,074 | | MASTR Alternative Loans Trust, Series 2005-2-3A1 | | | 6.00 | % | | | 03/25/2035 | | | | 82,905 | |
5,484,713 | | MASTR Alternative Loans Trust, Series 2006-1-A5 | | | 6.00 | % | | | 02/25/2036 | | | | 3,754,343 | |
38,560 | | MASTR Alternative Loans Trust, Series 2007-1-2A7 | | | 6.00 | % | | | 10/25/2036 | | | | 19,208 | |
1,128,536 | | MASTR Asset Securitization Trust, Series 2006-2-1A11 (1 Month LIBOR USD + 6.00%, 6.00% Floor) | | | 6.00 | % | | | 06/25/2036 | | | | 962,687 | |
12,570,254 | | Merrill Lynch Alternative Asset Trust, Series 2007-OAR4-A1 (1 Month LIBOR USD + 0.25%, 0.25% Floor) | | | 0.36 | % | | | 08/25/2037 | | | | 12,424,997 | |
1,929,862 | | Merrill Lynch Alternative Note Asset Trust, Series 2007-F1-2A8 | | | 6.00 | % | | | 03/25/2037 | | | | 1,134,548 | |
7,350,782 | | Merrill Lynch Mortgage Investors Trust, Series 2007-MLN1-A1 (1 Month LIBOR USD + 0.25%, 0.25% Floor) | | | 0.36 | % | | | 03/25/2037 | | | | 6,573,878 | |
7,007,000 | | MFA LLC, Series 2021-NPL1-A1 | | | 2.36 | % (a)(b) | | | 03/25/2060 | | | | 7,065,796 | |
9,192,442 | | Morgan Stanley Capital Trust, Series 2006-HE5-A2C (1 Month LIBOR USD + 0.14%, 0.14% Floor) | | | 0.25 | % | | | 08/25/2036 | | | | 5,886,025 | |
19,820 | | Morgan Stanley Mortgage Loan Trust, Series 2004-1-1A1 | | | 5.00 | % | | | 11/25/2033 | | | | 19,785 | |
652,116 | | Morgan Stanley Mortgage Loan Trust, Series 2005-7-7A4 | | | 5.50 | % | | | 11/25/2035 | | | | 680,990 | |
1,925,958 | | Morgan Stanley Mortgage Loan Trust, Series 2006-7-3A | | | 5.11 | % (c) | | | 06/25/2036 | | | | 1,539,184 | |
486,980 | | Morgan Stanley Re-Remic Trust, Series 2010-R6-5C | | | 5.75 | % (a)(c) | | | 05/26/2037 | | | | 478,298 | |
3,987,253 | | Morgan Stanley Residential Mortgage Loan Trust, Series 2020-RPL1-A1 | | | 2.69 | % (a)(c) | | | 10/25/2060 | | | | 4,015,470 | |
34,322,708 | | New Residential Mortgage Loan Trust, Series 2020-NPL2-A1 | | | 3.23 | % (a)(b) | | | 08/25/2060 | | | | 34,632,192 | |
11,169,994 | | New York Mortgage Trust, Series 2020-SP1-A1 | | | 3.96 | % (a) | | | 06/25/2025 | | | | 11,228,715 | |
183,343 | | Nomura Asset Acceptance Corporation, Series 2006-AP1-A2 | | | 5.52 | % (c) | | | 01/25/2036 | | | | 78,839 | |
553,481 | | Nomura Home Equity Loan, Inc., Series 2006-AF1-A2 | | | 5.80 | % (k) | | | 10/25/2036 | | | | 214,336 | |
946,063 | | Nomura Home Equity Loan, Inc., Series 2007-1-1A1 | | | 6.06 | % (k) | | | 02/25/2037 | | | | 374,603 | |
10,402,902 | | NRPL Trust, Series 2019-3A-A1 | | | 3.00 | % (a)(b) | | | 07/25/2059 | | | | 10,471,226 | |
7,912,070 | | NRZ Excess Spread-Collateralized Notes, Series 2020-PLS1-A | | | 3.84 | % (a) | | | 12/25/2025 | | | | 8,005,210 | |
43,440 | | Option One Mortgage Loan Trust, Series 2004-3-M3 (1 Month LIBOR USD + 0.98%, 0.98% Floor) | | | 1.08 | % | | | 11/25/2034 | | | | 43,297 | |
24,427,100 | | Option One Mortgage Loan Trust, Series 2007-6-1A1 (1 Month LIBOR USD + 0.19%, 0.19% Floor) | | | 0.30 | % | | | 07/25/2037 | | | | 22,685,364 | |
4,555,799 | | PMT Credit Risk Transfer Trust, Series 2019-3R-A (1 Month LIBOR USD + 2.70%, 2.70% Floor) | | | 2.81 | % (a) | | | 10/27/2022 | | | | 4,567,126 | |
11,143,993 | | PMT Credit Risk Transfer Trust, Series 2020-1R-A (1 Month LIBOR USD + 2.35%, 2.35% Floor) | | | 2.46 | % (a) | | | 02/27/2023 | | | | 11,083,359 | |
15,000,000 | | PMT Credit Risk Transfer Trust, Series 2021-FT1-A (1 Month LIBOR USD + 3.00%, 3.00% Floor) | | | 0.01 | % (a) | | | 03/25/2026 | | | | 15,033,135 | |
7,626,724 | | PR Mortgage Loan Trust, Series 2014-1-APT | | | 5.91 | % (a)(c) | | | 10/25/2049 | | | | 7,569,922 | |
3,048,208 | | Pretium Mortgage Credit Partners LLC, Series 2020-NPL3-A1 | | | 3.10 | % (a)(b) | | | 06/27/2060 | | | | 3,081,005 | |
1,587,000 | | Pretium Mortgage Credit Partners LLC, Series 2021-NPL1-A1 | | | 2.24 | % (a)(b) | | | 09/27/2060 | | | | 1,599,739 | |
13,277,894 | | PRPM LLC, Series 2019-GS1-A1 | | | 3.50 | % (a)(c) | | | 10/25/2024 | | | | 13,401,157 | |
11,157,994 | | PRPM LLC, Series 2020-3-A1 | | | 2.86 | % (a)(b) | | | 09/25/2025 | | | | 11,248,838 | |
25,331,000 | | PRPM LLC, Series 2021-2-A1 | | | 2.12 | % (a)(c) | | | 03/25/2024 | | | | 25,533,167 | |
7,610,823 | | RBSGC Mortgage Loan Trust, Series 2005-A-3A | | | 6.00 | % | | | 04/25/2035 | | | | 4,933,795 | |
27,901,395 | | Redwood Funding Trust, Series 2019-1-PT | | | 4.21 | % (a)(b) | | | 09/27/2024 | | | | 28,196,843 | |
205,226 | | Residential Accredit Loans, Inc., Series 2005-QS14-3A3 | | | 6.00 | % | | | 09/25/2035 | | | | 200,251 | |
256,262 | | Residential Accredit Loans, Inc., Series 2006-QS10-A4 | | | 5.75 | % | | | 08/25/2036 | | | | 251,229 | |
2,796,325 | | Residential Accredit Loans, Inc., Series 2006-QS10-A9 | | | 6.50 | % | | | 08/25/2036 | | | | 2,788,103 | |
2,629,377 | | Residential Accredit Loans, Inc., Series 2006-QS4-A10 | | | 6.00 | % | | | 04/25/2036 | | | | 2,524,626 | |
540,699 | | Residential Accredit Loans, Inc., Series 2006-QS6-1A15 | | | 6.00 | % | | | 06/25/2036 | | | | 517,857 | |
18,736 | | Residential Accredit Loans, Inc., Series 2006-QS6-2A1 | | | 6.00 | % | | | 06/25/2021 | | | | 18,051 | |
21,686,628 | | Residential Accredit Loans, Inc., Series 2007-QH5-AII (1 Month LIBOR USD + 0.23%, 0.23% Floor) | | | 0.34 | % | | | 06/25/2037 | | | | 10,484,162 | |
910,026 | | Residential Accredit Loans, Inc., Series 2007-QS3-A4 | | | 6.25 | % | | | 02/25/2037 | | | | 884,496 | |
3,223,580 | | Residential Accredit Loans, Inc., Series 2007-QS9-A33 | | | 6.50 | % | | | 07/25/2037 | | | | 3,144,586 | |
96,295 | | Residential Asset Mortgage Products, Inc., Series 2005-RS1-AI5 | | | 5.41 | % (k) | | | 01/25/2035 | | | | 98,283 | |
191,148 | | Residential Asset Securitization Trust, Series 2005-A10-A3 | | | 5.50 | % | | | 09/25/2035 | | | | 138,812 | |
261,452 | | Residential Asset Securitization Trust, Series 2005-A11-2A4 | | | 6.00 | % | | | 10/25/2035 | | | | 191,831 | |
46,226 | | Residential Asset Securitization Trust, Series 2005-A7-A3 | | | 5.50 | % | | | 06/25/2035 | | | | 36,234 | |
1,592,977 | | Residential Asset Securitization Trust, Series 2006-A6-1A1 | | | 6.50 | % | | | 07/25/2036 | | | | 799,981 | |
124,562 | | Residential Asset Securitization Trust, Series 2006-R1-A1 (-4 x 1 Month LIBOR USD + 28.40%, 28.40% Cap) | | | 27.97 | % (e)(l) | | | 01/25/2046 | | | | 157,585 | |
63,359 | | Residential Funding Mortgage Securities Trust, Series 2006-S10-1A2 | | | 6.00 | % | | | 10/25/2036 | | | | 60,753 | |
603,156 | | Residential Funding Mortgage Securities Trust, Series 2007-S2-A4 | | | 6.00 | % | | | 02/25/2037 | | | | 570,920 | |
422,307 | | Residential Funding Mortgage Securities Trust, Series 2007-S3-1A4 | | | 6.00 | % | | | 03/25/2037 | | | | 378,398 | |
5,154,000 | | Residential Mortgage Loan Trust, Series 2020-1-M1 | | | 3.24 | % (a)(c) | | | 02/25/2024 | | | | 5,157,851 | |
8,447,980 | | Seasoned Credit Risk Transfer Trust, Series 2018-2-HV | | | 3.00 | % (c) | | | 11/25/2057 | | | | 8,959,461 | |
21,466,702 | | Seasoned Credit Risk Transfer Trust, Series 2019-4-M55D | | | 4.00 | % | | | 02/25/2059 | | | | 23,613,565 | |
21,566,183 | | Securitized Asset Backed Receivables LLC Trust, Series 2007-HE1-A2C (1 Month LIBOR USD + 0.16%, 0.16% Floor) | | | 0.27 | % | | | 12/25/2036 | | | | 7,470,455 | |
31,471,978 | | Securitized Mortgage Asset Loan Trust, Series 2015-1-PC | | | 2.26 | % (a)(c) | | | 02/25/2054 | | | | 26,746,523 | |
5,230,628 | | Securitized Mortgage Asset Loan Trust, Series 2015-2-PC | | | 2.55 | % (a)(c) | | | 12/26/2059 | | | | 4,781,668 | |
5,489,682 | | Securitized Mortgage Asset Loan Trust, Series 2015-3-PC | | | 3.38 | % (a)(c) | | | 10/25/2044 | | | | 5,189,071 | |
5,762,086 | | Sequoia Mortgage Trust, Series 2007-3-2AA1 | | | 3.21 | % (c) | | | 07/20/2037 | | | | 5,350,545 | |
8,503,636 | | Soundview Home Loan Trust, Series 2007-OPT4-1A1 (1 Month LIBOR USD + 1.00%, 1.00% Floor) | | | 1.11 | % | | | 09/25/2037 | | | | 6,850,660 | |
5,910,000 | | Starwood Mortgage Residential Trust, Series 2020-1-B1 | | | 3.73 | % (a)(c) | | | 02/25/2050 | | | | 5,970,859 | |
3,918,790 | | Structured Asset Investment Loan Trust, Series 2006-BNC3-A1 (1 Month LIBOR USD + 0.18%, 0.18% Floor) | | | 0.29 | % | | | 09/25/2036 | | | | 3,004,173 | |
1,011,002 | | Structured Asset Securities Corporation, Series 2005-RF1-A (1 Month LIBOR USD + 0.35%, 0.35% Floor) | | | 0.46 | % (a) | | | 03/25/2035 | | | | 917,106 | |
1,011,002 | | Structured Asset Securities Corporation, Series 2005-RF1-AIO | | | 4.68 | % (a)(c)(i) | | | 03/25/2035 | | | | 138,863 | |
14,000,000 | | Toorak Mortgage Corporation Ltd., Series 2019-2-A1 | | | 3.72 | % (b) | | | 09/25/2022 | | | | 14,216,230 | |
16,442,163 | | Velocity Commercial Capital Loan Trust, Series 2018-1-A | | | 3.59 | % (a) | | | 04/25/2048 | | | | 17,190,283 | |
2,549,984 | | Velocity Commercial Capital Loan Trust, Series 2018-1-M1 | | | 3.91 | % (a) | | | 04/25/2048 | | | | 2,680,391 | |
1,450,142 | | Velocity Commercial Capital Loan Trust, Series 2018-1-M2 | | | 4.26 | % (a) | | | 04/25/2048 | | | | 1,498,836 | |
867,360 | | Velocity Commercial Capital Loan Trust, Series 2018-1-M3 | | | 4.41 | % (a) | | | 04/25/2048 | | | | 890,764 | |
11,093,172 | | Velocity Commercial Capital Loan Trust, Series 2018-2-A | | | 4.05 | % (a)(c) | | | 10/26/2048 | | | | 11,618,850 | |
3,959,584 | | Velocity Commercial Capital Loan Trust, Series 2019-1-M1 | | | 3.94 | % (a)(c) | | | 03/25/2049 | | | | 4,112,091 | |
1,309,464 | | Velocity Commercial Capital Loan Trust, Series 2019-1-M2 | | | 4.01 | % (a)(c) | | | 03/25/2049 | | | | 1,338,815 | |
1,478,948 | | Velocity Commercial Capital Loan Trust, Series 2019-1-M3 | | | 4.12 | % (a)(c) | | | 03/25/2049 | | | | 1,505,840 | |
5,609,311 | | Vericrest Opportunity Loan Trust, Series 2020-NPL5-A1A | | | 2.98 | % (a)(b) | | | 03/25/2050 | | | | 5,636,186 | |
7,151,000 | | Verus Securitization Trust, Series 2020-3-M1 | | | 3.97 | % (a)(c) | | | 04/25/2060 | | | | 7,176,036 | |
7,471,000 | | Verus Securitization Trust, Series 2020-5-M1 | | | 2.60 | % (a)(c) | | | 05/25/2065 | | | | 7,499,911 | |
11,070,947 | | Verus Securitization Trust, Series 2020-NPL1-A1 | | | 3.60 | % (a)(b) | | | 08/25/2050 | | | | 11,125,232 | |
1,788,922 | | VOLT LLC, Series 2021-NPL1-A1 | | | 1.89 | % (a)(b) | | | 02/27/2051 | | | | 1,790,452 | |
6,971,149 | | VOLT LLC, Series 2021-NPL3-A1 | | | 2.24 | % (a)(b) | | | 02/27/2051 | | | | 6,972,735 | |
6,664,227 | | VOLT LLC, Series 2021-NPL5-A1 | | | 2.12 | % (a)(b) | | | 03/27/2051 | | | | 6,663,561 | |
6,515,000 | | VOLT LLC, Series 2021-NPL6-A1 | | | 2.24 | % (a)(b) | | | 04/25/2051 | | | | 6,518,956 | |
6,587,487 | | WaMu Mortgage Pass Through Certificates Trust, Series 2007-HY7-2A1 | | | 3.09 | % (c) | | | 07/25/2037 | | | | 6,528,586 | |
9,232,417 | | Washington Mutual Mortgage Pass-Through Certificates, Series 2007-2-1A2 | | | 6.00 | % | | | 04/25/2037 | | | | 9,036,665 | |
8,430,058 | | Washington Mutual Mortgage Pass-Through Certificates, Series 2006-8-A5 | | | 4.24 | % (k) | | | 10/25/2036 | | | | 4,384,136 | |
103,172 | | Washington Mutual Mortgage Pass-Through Certificates, Series 2005-1-2A | | | 6.00 | % | | | 03/25/2035 | | | | 101,787 | |
603,342 | | Washington Mutual Mortgage Pass-Through Certificates, Series 2006-1-3A1 | | | 5.75 | % | | | 02/25/2036 | | | | 580,654 | |
1,739,373 | | Washington Mutual Mortgage Pass-Through Certificates, Series 2006-2-4CB | | | 6.00 | % | | | 03/25/2036 | | | | 1,777,475 | |
3,746,394 | | Washington Mutual Mortgage Pass-Through Certificates, Series 2006-8-A6 | | | 4.24 | % (k) | | | 10/25/2036 | | | | 1,947,398 | |
2,170,587 | | Washington Mutual Mortgage Pass-Through Certificates, Series 2006-AR19-2A (11th District Cost of Funds Index + 1.25%, 1.25% Floor) | | | 1.71 | % | | | 01/25/2047 | | | | 2,155,955 | |
6,475,056 | | Washington Mutual Mortgage Pass-Through Certificates, Series 2007-2-1A3 | | | 6.00 | % | | | 04/25/2037 | | | | 6,337,767 | |
1,116,643 | | Washington Mutual Mortgage Pass-Through Certificates, Series 2007-3-A6 | | | 6.00 | % | | | 04/25/2037 | | | | 1,109,578 | |
79,437 | | Washington Mutual Mortgage Pass-Through Certificates, Series 2007-5-A11 (-6 x 1 Month LIBOR USD + 39.48%, 39.48% Cap) | | | 38.83 | % (l) | | | 06/25/2037 | | | | 151,425 | |
7,901,394 | | Washington Mutual Mortgage Pass-Through Certificates, Series 2007-5-A3 | | | 7.00 | % | | | 06/25/2037 | | | | 5,527,783 | |
567,225 | | Wells Fargo Alternative Loan Trust, Series 2007-PA5-1A1 | | | 6.25 | % | | | 11/25/2037 | | | | 563,774 | |
17,183 | | Wells Fargo Mortgage Backed Securities Trust, Series 2005-AR14-A6 | | | 3.01 | % (c) | | | 08/25/2035 | | | | 17,338 | |
567,207 | | Wells Fargo Mortgage Backed Securities Trust, Series 2006-7-2A1 | | | 6.00 | % | | | 06/25/2036 | | | | 564,919 | |
38,255 | | Wells Fargo Mortgage Backed Securities Trust, Series 2007-7-A1 | | | 6.00 | % | | | 06/25/2037 | | | | 38,640 | |
| | | | | | | | | | | | | | |
Total Non-Agency Residential Collateralized Mortgage Obligations (Cost $1,163,274,621) | | | | | | | | 1,159,575,018 | |
| | | | | | | | | | | | | | |
US Corporate Bonds—13.9% | | | | | | | | | |
11,981,000 | | AbbVie, Inc. | | | 4.70 | % | | | 05/14/2045 | | | | 14,222,005 | |
1,195,000 | | Academy Ltd. | | | 6.00 | % (a) | | | 11/15/2027 | | | | 1,260,725 | |
1,330,000 | | Acrisure LLC | | | 4.25 | % (a) | | | 02/15/2029 | | | | 1,309,651 | |
7,975,000 | | Activision Blizzard, Inc. | | | 1.35 | % | | | 09/15/2030 | | | | 7,217,148 | |
1,235,000 | | Advanced Drainage Systems, Inc. | | | 5.00 | % (a) | | | 09/30/2027 | | | | 1,298,146 | |
245,000 | | Aethon United Finance Corporation | | | 8.25 | % (a) | | | 02/15/2026 | | | | 254,034 | |
4,618,000 | | Air Lease Corporation | | | 3.75 | % | | | 02/01/2022 | | | | 4,715,394 | |
1,126,000 | | Air Methods Corporation | | | 8.00 | % (a) | | | 05/15/2025 | | | | 1,061,255 | |
7,825,000 | | Aircastle Ltd. | | | 2.85 | % (a) | | | 01/26/2028 | | | | 7,490,930 | |
1,215,000 | | Albertsons LLC | | | 3.50 | % (a) | | | 03/15/2029 | | | | 1,157,761 | |
4,755,000 | | Alexandria Real Estate Equities, Inc. | | | 3.00 | % | | | 05/18/2051 | | | | 4,337,357 | |
1,285,000 | | Alliant Holdings Intermediate LLC | | | 6.75 | % (a) | | | 10/15/2027 | | | | 1,369,887 | |
1,120,000 | | Allied Universal Holding Company | | | 6.63 | % (a) | | | 07/15/2026 | | | | 1,189,838 | |
2,155,000 | | Allied Universal Holding Company | | | 9.75 | % (a) | | | 07/15/2027 | | | | 2,368,216 | |
2,457,000 | | Altria Group, Inc. | | | 4.80 | % | | | 02/14/2029 | | | | 2,824,939 | |
1,925,000 | | American Airlines, Inc. | | | 5.75 | % (a) | | | 04/20/2029 | | | | 2,049,932 | |
1,085,000 | | American Axle & Manufacturing, Inc. | | | 6.25 | % | | | 03/15/2026 | | | | 1,112,667 | |
4,433,000 | | American Tower Corporation | | | 3.38 | % | | | 10/15/2026 | | | | 4,797,539 | |
14,172,000 | | American Tower Corporation | | | 3.60 | % | | | 01/15/2028 | | | | 15,320,053 | |
989,000 | | Antero Midstream Partners LP | | | 5.75 | % (a) | | | 03/01/2027 | | | | 991,072 | |
4,135,000 | | Anthem, Inc. | | | 2.38 | % | | | 01/15/2025 | | | | 4,323,882 | |
650,000 | | Apache Corporation | | | 4.63 | % | | | 11/15/2025 | | | | 670,507 | |
1,165,000 | | Apache Corporation | | | 4.38 | % | | | 10/15/2028 | | | | 1,163,252 | |
405,000 | | Arches Buyer, Inc. | | | 4.25 | % (a) | | | 06/01/2028 | | | | 405,030 | |
2,385,000 | | Arconic Corporation | | | 6.13 | % (a) | | | 02/15/2028 | | | | 2,544,497 | |
398,000 | | Ardagh Packaging Finance, Inc. | | | 6.00 | % (a) | | | 02/15/2025 | | | | 410,537 | |
300,000 | | Ardagh Packaging Finance, Inc. | | | 5.25 | % (a) | | | 04/30/2025 | | | | 315,699 | |
975,000 | | Ardagh Packaging Finance, Inc. | | | 5.25 | % (a) | | | 08/15/2027 | | | | 995,553 | |
2,500,000 | | Ardagh Packaging Finance, Inc. | | | 4.00 | % (a) | | | 09/01/2029 | | | | 2,499,050 | |
7,560,000 | | Ares Capital Corporation | | | 2.15 | % | | | 07/15/2026 | | | | 7,367,575 | |
4,590,000 | | Arizona Public Service Company | | | 3.35 | % | | | 05/15/2050 | | | | 4,561,116 | |
6,320,000 | | Arrow Electronics, Inc. | | | 3.88 | % | | | 01/12/2028 | | | | 6,862,298 | |
340,000 | | Asbury Automotive Group, Inc. | | | 4.50 | % | | | 03/01/2028 | | | | 348,639 | |
340,000 | | Asbury Automotive Group, Inc. | | | 4.75 | % | | | 03/01/2030 | | | | 351,645 | |
2,655,000 | | Ascend Learning LLC | | | 6.88 | % (a) | | | 08/01/2025 | | | | 2,731,052 | |
690,000 | | Ascend Learning LLC | | | 6.88 | % (a) | | | 08/01/2025 | | | | 709,765 | |
1,000,000 | | ASGN, Inc. | | | 4.63 | % (a) | | | 05/15/2028 | | | | 1,033,370 | |
2,980,000 | | AssuredPartners, Inc. | | | 7.00 | % (a) | | | 08/15/2025 | | | | 3,089,411 | |
190,000 | | AssuredPartners, Inc. | | | 5.63 | % (a) | | | 01/15/2029 | | | | 193,847 | |
23,410,000 | | AT&T, Inc. | | | 3.50 | % (a) | | | 09/15/2053 | | | | 21,674,582 | |
13,989,000 | | Athene Global Funding | | | 3.00 | % (a) | | | 07/01/2022 | | | | 14,424,237 | |
475,000 | | Austin BidCo, Inc. | | | 7.13 | % (a) | | | 12/15/2028 | | | | 484,203 | |
885,000 | | Avantor, Inc. | | | 4.63 | % (a) | | | 07/15/2028 | | | | 925,365 | |
1,285,000 | | Avaya, Inc. | | | 6.13 | % (a) | | | 09/15/2028 | | | | 1,366,520 | |
7,375,000 | | Aviation Capital Group LLC | | | 5.50 | % (a) | | | 12/15/2024 | | | | 8,253,107 | |
685,000 | | Axalta Coating Systems LLC | | | 4.75 | % (a) | | | 06/15/2027 | | | | 716,887 | |
785,000 | | B&G Foods, Inc. | | | 5.25 | % | | | 09/15/2027 | | | | 817,625 | |
535,000 | | Banff Merger Sub, Inc. | | | 9.75 | % (a) | | | 09/01/2026 | | | | 570,524 | |
12,495,000 | | Bank of America Corporation (3 Month LIBOR USD + 1.21% ) | | | 3.97 | % | | | 02/07/2030 | | | | 13,882,161 | |
982,000 | | Bausch Health Companies, Inc. | | | 7.00 | % (a) | | | 03/15/2024 | | | | 1,005,568 | |
2,355,000 | | Bausch Health Companies, Inc. | | | 7.00 | % (a) | | | 01/15/2028 | | | | 2,560,450 | |
1,040,000 | | Bausch Health Companies, Inc. | | | 6.25 | % (a) | | | 02/15/2029 | | | | 1,106,977 | |
1,315,000 | | Bausch Health Companies, Inc. | | | 5.25 | % (a) | | | 01/30/2030 | | | | 1,323,311 | |
2,045,000 | | Beacon Roofing Supply, Inc. | | | 4.88 | % (a) | | | 11/01/2025 | | | | 2,094,724 | |
18,052,000 | | Becton Dickinson and Company | | | 2.89 | % | | | 06/06/2022 | | | | 18,522,836 | |
4,725,000 | | Berkshire Hathaway Finance Corporation | | | 2.85 | % | | | 10/15/2050 | | | | 4,363,453 | |
695,000 | | Blue Racer Midstream LLC | | | 7.63 | % (a) | | | 12/15/2025 | | | | 750,319 | |
8,169,000 | | Boeing Company | | | 2.95 | % | | | 02/01/2030 | | | | 8,152,553 | |
13,015,000 | | Boston Properties LP | | | 3.40 | % | | | 06/21/2029 | | | | 13,691,775 | |
125,000 | | Boxer Parent Company, Inc. | | | 7.13 | % (a) | | | 10/02/2025 | | | | 134,242 | |
2,065,000 | | Boyd Gaming Corporation | | | 4.75 | % | | | 12/01/2027 | | | | 2,108,582 | |
3,465,000 | | Boyne USA, Inc. | | | 7.25 | % (a) | | | 05/01/2025 | | | | 3,612,696 | |
5,040,000 | | BP Capital Markets America, Inc. | | | 2.94 | % | | | 06/04/2051 | | | | 4,503,745 | |
12,260,000 | | Bristol-Myers Squibb Company | | | 4.35 | % | | | 11/15/2047 | | | | 14,621,592 | |
2,677,000 | | Broadcom, Inc. | | | 3.15 | % | | | 11/15/2025 | | | | 2,855,046 | |
8,830,000 | | Broadcom, Inc. | | | 3.42 | % (a) | | | 04/15/2033 | | | | 8,898,605 | |
11,625,000 | | Brooklyn Union Gas Company | | | 4.49 | % (a) | | | 03/04/2049 | | | | 13,340,653 | |
535,000 | | Builders FirstSource, Inc. | | | 6.75 | % (a) | | | 06/01/2027 | | | | 576,462 | |
900,000 | | Cablevision Lightpath LLC | | | 3.88 | % (a) | | | 09/15/2027 | | | | 892,125 | |
500,000 | | Cablevision Lightpath LLC | | | 5.63 | % (a) | | | 09/15/2028 | | | | 508,287 | |
890,000 | | Calpine Corporation | | | 4.50 | % (a) | | | 02/15/2028 | | | | 898,811 | |
555,000 | | Calpine Corporation | | | 5.13 | % (a) | | | 03/15/2028 | | | | 558,366 | |
600,000 | | Calpine Corporation | | | 4.63 | % (a) | | | 02/01/2029 | | | | 585,474 | |
4,070,000 | | Campbell Soup Company | | | 2.38 | % | | | 04/24/2030 | | | | 3,987,140 | |
4,050,000 | | Capital One Financial Corporation (3 Month LIBOR USD + 0.72%) | | | 0.93 | % | | | 01/30/2023 | | | | 4,080,353 | |
595,000 | | Carnival Corporation | | | 11.50 | % (a) | | | 04/01/2023 | | | | 682,884 | |
1,150,000 | | Carnival Corporation | | | 5.75 | % (a) | | | 03/01/2027 | | | | 1,181,625 | |
8,420,000 | | Carrier Global Corporation | | | 3.38 | % | | | 04/05/2040 | | | | 8,421,004 | |
525,000 | | Carvana Corporation | | | 5.63 | % (a) | | | 10/01/2025 | | | | 539,227 | |
1,754,000 | | Castle US Holding Corporation | | | 9.50 | % (a) | | | 02/15/2028 | | | | 1,792,369 | |
1,395,000 | | Catalent Pharma Solutions, Inc. | | | 5.00 | % (a) | | | 07/15/2027 | | | | 1,463,620 | |
1,255,000 | | CCO Holdings LLC | | | 5.00 | % (a) | | | 02/01/2028 | | | | 1,328,606 | |
2,520,000 | | CCO Holdings LLC | | | 4.75 | % (a) | | | 03/01/2030 | | | | 2,614,500 | |
1,275,000 | | CCO Holdings LLC | | | 4.50 | % (a) | | | 08/15/2030 | | | | 1,301,080 | |
1,830,000 | | Cedar Fair LP | | | 5.25 | % | | | 07/15/2029 | | | | 1,884,131 | |
1,520,000 | | Cengage Learning, Inc. | | | 9.50 | % (a) | | | 06/15/2024 | | | | 1,551,350 | |
1,580,000 | | Centene Corporation | | | 4.25 | % | | | 12/15/2027 | | | | 1,663,940 | |
660,000 | | Centene Corporation | | | 3.00 | % | | | 10/15/2030 | | | | 659,729 | |
8,970,000 | | Centene Corporation | | | 2.50 | % | | | 03/01/2031 | | | | 8,577,742 | |
1,165,000 | | Century Communities, Inc. | | | 6.75 | % | | | 06/01/2027 | | | | 1,241,709 | |
1,305,000 | | CenturyLink, Inc. | | | 5.13 | % (a) | | | 12/15/2026 | | | | 1,376,292 | |
1,170,000 | | CenturyLink, Inc. | | | 4.00 | % (a) | | | 02/15/2027 | | | | 1,196,676 | |
12,990,000 | | Charles Schwab Corporation | | | 3.55 | % | | | 02/01/2024 | | | | 14,045,190 | |
920,000 | | Charles Schwab Corporation | | | 0.75 | % | | | 03/18/2024 | | | | 925,347 | |
12,776,000 | | Charter Communications Operating LLC | | | 4.91 | % | | | 07/23/2025 | | | | 14,491,551 | |
390,000 | | Cheniere Energy Partners LP | | | 5.63 | % | | | 10/01/2026 | | | | 408,486 | |
1,219,000 | | Chesapeake Energy Corporation | | | 5.88 | % (a) | | | 02/01/2029 | | | | 1,294,426 | |
1,375,000 | | CHS/Community Health Systems, Inc. | | | 6.00 | % (a) | | | 01/15/2029 | | | | 1,455,781 | |
975,000 | | CHS/Community Health Systems, Inc. | | | 6.88 | % (a) | | | 04/15/2029 | | | | 1,021,917 | |
1,205,000 | | CHS/Community Health Systems, Inc. | | | 4.75 | % (a) | | | 02/15/2031 | | | | 1,178,671 | |
8,755,000 | | Cigna Corporation | | | 4.90 | % | | | 12/15/2048 | | | | 10,749,731 | |
7,655,000 | | Cigna Corporation (3 Month LIBOR USD + 0.89% ) | | | 1.13 | % | | | 07/15/2023 | | | | 7,750,769 | |
1,765,000 | | Cincinnati Bell, Inc. | | | 7.00 | % (a) | | | 07/15/2024 | | | | 1,824,569 | |
21,555,000 | | Citigroup, Inc. (3 Month LIBOR USD + 1.10% ) | | | 1.29 | % | | | 05/17/2024 | | | | 21,872,262 | |
2,140,000 | | Clean Harbors, Inc. | | | 4.88 | % (a) | | | 07/15/2027 | | | | 2,261,317 | |
460,000 | | Clean Harbors, Inc. | | | 5.13 | % (a) | | | 07/15/2029 | | | | 489,700 | |
240,000 | | Clear Channel Outdoor Holdings, Inc. | | | 7.75 | % (a) | | | 04/15/2028 | | | | 237,810 | |
396,000 | | Clear Channel Worldwide Holdings, Inc. | | | 9.25 | % | | | 02/15/2024 | | | | 412,701 | |
1,265,000 | | Clearway Energy Operating LLC | | | 4.75 | % (a) | | | 03/15/2028 | | | | 1,317,282 | |
1,710,000 | | CNX Midstream Partners LP | | | 6.50 | % (a) | | | 03/15/2026 | | | | 1,744,200 | |
600,000 | | CNX Resources Corporation | | | 6.00 | % (a) | | | 01/15/2029 | | | | 624,633 | |
5,155,000 | | Comcast Corporation | | | 3.95 | % | | | 10/15/2025 | | | | 5,761,187 | |
7,085,000 | | Comcast Corporation | | | 3.40 | % | | | 04/01/2030 | | | | 7,676,937 | |
725,000 | | CommScope Technologies LLC | | | 5.00 | % (a) | | | 03/15/2027 | | | | 719,566 | |
1,215,000 | | Consolidated Communications, Inc. | | | 5.00 | % (a) | | | 10/01/2028 | | | | 1,227,514 | |
6,495,000 | | Constellation Brands, Inc. | | | 3.15 | % | | | 08/01/2029 | | | | 6,810,311 | |
815,000 | | Constellation Brands, Inc. | | | 2.88 | % | | | 05/01/2030 | | | | 833,717 | |
1,030,000 | | Constellation Merger Sub, Inc. | | | 8.50 | % (a) | | | 09/15/2025 | | | | 974,529 | |
1,388,000 | | Cornerstone Building Brands, Inc. | | | 6.13 | % (a) | | | 01/15/2029 | | | | 1,480,822 | |
1,750,000 | | Corporate Office Properties LP | | | 2.75 | % | | | 04/15/2031 | | | | 1,695,885 | |
1,810,000 | | CRC Issuer LLC | | | 5.25 | % (a) | | | 10/15/2025 | | | | 1,819,050 | |
1,945,000 | | Credit Acceptance Corporation | | | 6.63 | % | | | 03/15/2026 | | | | 2,051,975 | |
12,965,000 | | Crown Castle International Corporation | | | 3.65 | % | | | 09/01/2027 | | | | 14,148,005 | |
815,000 | | Crown Castle International Corporation | | | 3.80 | % | | | 02/15/2028 | | | | 888,891 | |
2,940,000 | | CSC Holdings LLC | | | 5.75 | % (a) | | | 01/15/2030 | | | | 3,100,230 | |
1,200,000 | | CSC Holdings LLC | | | 4.63 | % (a) | | | 12/01/2030 | | | | 1,182,000 | |
2,325,000 | | CSI Compressco LP | | | 7.50 | % (a) | | | 04/01/2025 | | | | 2,367,141 | |
13,890,000 | | CSX Corporation | | | 3.80 | % | | | 11/01/2046 | | | | 14,744,969 | |
5,420,000 | | CVS Health Corporation | | | 5.05 | % | | | 03/25/2048 | | | | 6,664,302 | |
2,200,000 | | Dana Financing Ltd. | | | 5.75 | % (a) | | | 04/15/2025 | | | | 2,270,125 | |
410,000 | | Dana, Inc. | | | 5.38 | % | | | 11/15/2027 | | | | 431,269 | |
965,000 | | Dana, Inc. | | | 5.63 | % | | | 06/15/2028 | | | | 1,034,128 | |
950,000 | | DaVita, Inc. | | | 4.63 | % (a) | | | 06/01/2030 | | | | 969,104 | |
920,000 | | Dealer Tire LLC | | | 8.00 | % (a) | | | 02/01/2028 | | | | 972,900 | |
14,025,000 | | Dell International LLC | | | 5.30 | % (a) | | | 10/01/2029 | | | | 16,417,088 | |
1,215,000 | | Diamond Sports Group LLC | | | 5.38 | % (a) | | | 08/15/2026 | | | | 876,319 | |
4,425,000 | | Diamondback Energy, Inc. | | | 0.90 | % | | | 03/24/2023 | | | | 4,428,354 | |
3,690,000 | | Diamondback Energy, Inc. | | | 2.88 | % | | | 12/01/2024 | | | | 3,894,563 | |
3,500,000 | | Digital Realty Trust | | | 3.70 | % | | | 08/15/2027 | | | | 3,861,578 | |
3,000,000 | | Digital Realty Trust | | | 3.60 | % | | | 07/01/2029 | | | | 3,226,930 | |
15,975,000 | | Discover Financial Services | | | 4.10 | % | | | 02/09/2027 | | | | 17,742,592 | |
1,330,000 | | DISH DBS Corporation | | | 5.88 | % | | | 11/15/2024 | | | | 1,392,889 | |
5,040,000 | | Dollar Tree, Inc. | | | 4.00 | % | | | 05/15/2025 | | | | 5,566,745 | |
4,400,000 | | DTE Energy Company | | | 2.95 | % | | | 03/01/2030 | | | | 4,492,809 | |
2,095,000 | | Duke Energy Corporation | | | 3.75 | % | | | 09/01/2046 | | | | 2,111,996 | |
7,615,000 | | Duke Energy Corporation | | | 3.95 | % | | | 08/15/2047 | | | | 7,881,770 | |
9,090,000 | | Duke Energy Progress, Inc. | | | 4.15 | % | | | 12/01/2044 | | | | 10,313,026 | |
564,000 | | Dun & Bradstreet Corporation | | | 6.88 | % (a) | | | 08/15/2026 | | | | 603,240 | |
852,000 | | Dun & Bradstreet Corporation | | | 10.25 | % (a) | | | 02/15/2027 | | | | 953,017 | |
5,315,000 | | DuPont de Nemours, Inc. | | | 5.42 | % | | | 11/15/2048 | | | | 6,867,544 | |
8,228,000 | | East Ohio Gas Company | | | 3.00 | % (a) | | | 06/15/2050 | | | | 7,620,632 | |
1,180,000 | | EES Finance Corporation | | | 8.13 | % | | | 05/01/2025 | | | | 1,089,901 | |
1,425,000 | | Eldorado Resorts, Inc. | | | 6.25 | % (a) | | | 07/01/2025 | | | | 1,520,860 | |
1,256,000 | | Embarq Corporation | | | 8.00 | % | | | 06/01/2036 | | | | 1,448,746 | |
535,000 | | Emergent BioSolutions, Inc. | | | 3.88 | % (a) | | | 08/15/2028 | | | | 523,966 | |
5,525,000 | | Enable Midstream Partners LP | | | 4.40 | % | | | 03/15/2027 | | | | 5,979,497 | |
620,000 | | Encompass Health Corporation | | | 4.50 | % | | | 02/01/2028 | | | | 636,002 | |
215,000 | | Encompass Health Corporation | | | 4.75 | % | | | 02/01/2030 | | | | 221,534 | |
1,430,000 | | Encompass Health Corporation | | | 4.63 | % | | | 04/01/2031 | | | | 1,481,837 | |
790,000 | | Endeavor Energy Resources LP | | | 6.63 | % (a) | | | 07/15/2025 | | | | 845,537 | |
500,000 | | Endo Finance LLC | | | 6.00 | % (a) | | | 07/15/2023 | | | | 450,307 | |
1,040,000 | | Endo Finance LLC | | | 6.13 | % (a) | | | 04/01/2029 | | | | 1,050,400 | |
1,460,000 | | Endure Digital, Inc. | | | 6.00 | % (a) | | | 02/15/2029 | | | | 1,428,829 | |
13,325,000 | | Energy Transfer Operating LP | | | 4.75 | % | | | 01/15/2026 | | | | 14,804,496 | |
1,250,000 | | Energy Transfer Operating LP | | | 4.20 | % | | | 04/15/2027 | | | | 1,363,973 | |
3,785,000 | | Entergy Corporation | | | 2.80 | % | | | 06/15/2030 | | | | 3,817,317 | |
705,000 | | Envision Healthcare Corporation | | | 8.75 | % (a) | | | 10/15/2026 | | | | 524,210 | |
1,235,000 | | EQM Midstream Partners LP | | | 4.75 | % (a) | | | 01/15/2031 | | | | 1,199,494 | |
1,100,000 | | EQT Corporation | | | 8.50 | % | | | 02/01/2030 | | | | 1,404,205 | |
6,010,000 | | Equinix, Inc. | | | 1.80 | % | | | 07/15/2027 | | | | 5,906,393 | |
1,651,000 | | ESH Hospitality, Inc. | | | 5.25 | % (a) | | | 05/01/2025 | | | | 1,686,455 | |
7,850,000 | | Essential Utilities, Inc. | | | 2.70 | % | | | 04/15/2030 | | | | 7,927,891 | |
8,130,000 | | Eversource Energy | | | 1.65 | % | | | 08/15/2030 | | | | 7,549,755 | |
3,954,000 | | Exelon Corporation | | | 3.40 | % | | | 04/15/2026 | | | | 4,280,486 | |
6,720,000 | | Expedia Group, Inc. | | | 3.80 | % | | | 02/15/2028 | | | | 7,121,818 | |
3,175,000 | | Expedia Group, Inc. | | | 2.95 | % (a) | | | 03/15/2031 | | | | 3,134,181 | |
5,840,000 | | Exxon Mobil Corporation | | | 2.61 | % | | | 10/15/2030 | | | | 5,958,566 | |
6,320,000 | | Exxon Mobil Corporation | | | 4.23 | % | | | 03/19/2040 | | | | 7,119,349 | |
6,367,000 | | FedEx Corporation | | | 4.75 | % | | | 11/15/2045 | | | | 7,465,986 | |
990,000 | | Ferrellgas Escrow LLC | | | 5.38 | % (a) | | | 04/01/2026 | | | | 985,842 | |
3,535,000 | | Flowers Foods, Inc. | | | 2.40 | % | | | 03/15/2031 | | | | 3,452,835 | |
605,000 | | Ford Motor Company | | | 9.00 | % | | | 04/22/2025 | | | | 733,502 | |
1,535,000 | | Ford Motor Company | | | 7.45 | % | | | 07/16/2031 | | | | 1,938,252 | |
2,175,000 | | Ford Motor Credit Company LLC | | | 3.38 | % | | | 11/13/2025 | | | | 2,214,694 | |
2,900,000 | | Ford Motor Credit Company LLC | | | 4.39 | % | | | 01/08/2026 | | | | 3,052,192 | |
2,555,000 | | Ford Motor Credit Company LLC (3 Month LIBOR USD + 1.24% ) | | | 1.43 | % | | | 02/15/2023 | | | | 2,530,526 | |
7,870,000 | | Fortinet, Inc. | | | 1.00 | % | | | 03/15/2026 | | | | 7,703,758 | |
1,535,000 | | Front Range BidCo, Inc. | | | 4.00 | % (a) | | | 03/01/2027 | | | | 1,510,141 | |
720,000 | | Front Range BidCo, Inc. | | | 6.13 | % (a) | | | 03/01/2028 | | | | 740,138 | |
2,535,000 | | Frontdoor, Inc. | | | 6.75 | % (a) | | | 08/15/2026 | | | | 2,702,944 | |
525,000 | | Frontier Communications Corporation | | | 8.50 | % (f) | | | 04/15/2021 | | | | 347,812 | |
945,000 | | Frontier Communications Corporation | | | 7.13 | % (f) | | | 01/15/2023 | | | | 613,659 | |
390,000 | | Frontier Communications Corporation | | | 5.88 | % (a) | | | 10/15/2027 | | | | 414,131 | |
800,000 | | Frontier Communications Corporation | | | 5.00 | % (a) | | | 05/01/2028 | | | | 816,204 | |
450,000 | | Frontier Communications Corporation | | | 6.75 | % (a) | | | 05/01/2029 | | | | 475,459 | |
490,000 | | Full House Resorts, Inc. | | | 8.25 | % (a) | | | 02/15/2028 | | | | 523,222 | |
1,455,000 | | Gates Global LLC | | | 6.25 | % (a) | | | 01/15/2026 | | | | 1,526,542 | |
1,140,000 | | GCI LLC | | | 4.75 | % (a) | | | 10/15/2028 | | | | 1,169,212 | |
6,335,000 | | General Electric Company | | | 5.88 | % | | | 01/14/2038 | | | | 8,212,025 | |
4,830,000 | | General Electric Company | | | 6.88 | % | | | 01/10/2039 | | | | 6,804,441 | |
6,205,000 | | General Motors Financial Company | | | 3.95 | % | | | 04/13/2024 | | | | 6,680,782 | |
13,645,000 | | General Motors Financial Company (3 Month LIBOR USD + 0.99% ) | | | 1.19 | % | | | 01/05/2023 | | | | 13,765,786 | |
1,955,000 | | Genting New York LLC | | | 3.30 | % (a) | | | 02/15/2026 | | | | 1,955,979 | |
13,980,000 | | Georgia Power Company | | | 2.20 | % | | | 09/15/2024 | | | | 14,592,061 | |
12,700,000 | | Georgia Power Company | | | 3.25 | % | | | 03/15/2051 | | | | 12,180,614 | |
1,846,960 | | Global Aircraft Leasing Company (7.25% PIK) | | | 6.50 | % (a) | | | 09/15/2024 | | | | 1,773,544 | |
1,660,000 | | Gogo Intermediate Holdings LLC | | | 9.88 | % (a) | | | 05/01/2024 | | | | 1,750,262 | |
1,035,000 | | Golden Entertainment, Inc. | | | 7.63 | % (a) | | | 04/15/2026 | | | | 1,104,050 | |
2,445,000 | | Golden Nugget, Inc. | | | 6.75 | % (a) | | | 10/15/2024 | | | | 2,475,367 | |
500,000 | | Golden Nugget, Inc. | | | 8.75 | % (a) | | | 10/01/2025 | | | | 529,375 | |
18,188,000 | | Goldman Sachs Group, Inc. (3 Month LIBOR USD + 1.17% ) | | | 1.36 | % | | | 05/15/2026 | | | | 18,436,556 | |
615,000 | | GrafTech Finance, Inc. | | | 4.63 | % (a) | | | 12/15/2028 | | | | 620,381 | |
1,510,000 | | Gray Television, Inc. | | | 7.00 | % (a) | | | 05/15/2027 | | | | 1,644,012 | |
1,295,000 | | Griffon Corporation | | | 5.75 | % | | | 03/01/2028 | | | | 1,379,175 | |
420,000 | | Group 1 Automotive, Inc. | | | 4.00 | % (a) | | | 08/15/2028 | | | | 417,900 | |
1,090,000 | | GTT Communications, Inc. | | | 7.88 | % (a) | | | 12/31/2024 | | | | 183,937 | |
1,695,000 | | Gulfport Energy Corporation | | | 6.38 | % (f) | | | 05/15/2025 | | | | 1,530,797 | |
4,305,000 | | Halliburton Company | | | 2.92 | % | | | 03/01/2030 | | | | 4,303,212 | |
388,000 | | Halliburton Company | | | 5.00 | % | | | 11/15/2045 | | | | 432,210 | |
5,240,000 | | HCA, Inc. | | | 4.13 | % | | | 06/15/2029 | | | | 5,812,844 | |
1,805,000 | | Health Care Service Corporation and Mutual Legal Reserve Company | | | 3.20 | % (a) | | | 06/01/2050 | | | | 1,712,422 | |
1,540,000 | | Hess Midstream Operations LP | | | 5.63 | % (a) | | | 02/15/2026 | | | | 1,589,087 | |
1,075,000 | | Hess Midstream Operations LP | | | 5.13 | % (a) | | | 06/15/2028 | | | | 1,089,512 | |
985,000 | | Hexion, Inc. | | | 7.88 | % (a) | | | 07/15/2027 | | | | 1,060,968 | |
1,797,000 | | HilCorporationEnergy LP | | | 6.25 | % (a) | | | 11/01/2028 | | | | 1,854,279 | |
315,000 | | HilCorporationEnergy LP | | | 5.75 | % (a) | | | 02/01/2029 | | | | 318,347 | |
930,000 | | Hillman Group, Inc. | | | 6.38 | % (a) | | | 07/15/2022 | | | | 931,744 | |
975,000 | | Hill-Rom Holdings, Inc. | | | 4.38 | % (a) | | | 09/15/2027 | | | | 1,006,687 | |
80,000 | | Hilton Domestic Operating Company, Inc. | | | 5.38 | % (a) | | | 05/01/2025 | | | | 84,400 | |
90,000 | | Hilton Domestic Operating Company, Inc. | | | 5.75 | % (a) | | | 05/01/2028 | | | | 97,033 | |
5,830,000 | | Home Depot, Inc. | | | 3.90 | % | | | 06/15/2047 | | | | 6,568,786 | |
2,410,000 | | Horizon Pharma USA, Inc. | | | 5.50 | % (a) | | | 08/01/2027 | | | | 2,576,748 | |
14,325,000 | | Hyundai Capital America | | | 2.65 | % (a) | | | 02/10/2025 | | | | 14,824,266 | |
660,000 | | Hyundai Capital America | | | 1.80 | % (a) | | | 10/15/2025 | | | | 660,044 | |
1,890,000 | | IAA, Inc. | | | 5.50 | % (a) | | | 06/15/2027 | | | | 1,985,681 | |
2,405,000 | | Icahn Enterprises LP | | | 6.25 | % | | | 05/15/2026 | | | | 2,524,865 | |
1,300,000 | | Icahn Enterprises LP | | | 5.25 | % | | | 05/15/2027 | | | | 1,345,500 | |
230,000 | | iHeartCommunications, Inc. | | | 8.38 | % | | | 05/01/2027 | | | | 246,962 | |
960,000 | | iHeartCommunications, Inc. | | | 5.25 | % (a) | | | 08/15/2027 | | | | 989,088 | |
5,170,000 | | Illumina, Inc. | | | 0.55 | % | | | 03/23/2023 | | | | 5,168,171 | |
1,115,000 | | Illuminate Buyer LLC | | | 9.00 | % (a) | | | 07/01/2028 | | | | 1,256,103 | |
1,215,000 | | Indigo Natural Resources LLC | | | 5.38 | % (a) | | | 02/01/2029 | | | | 1,199,308 | |
1,435,000 | | Installed Building Products, Inc. | | | 5.75 | % (a) | | | 02/01/2028 | | | | 1,504,684 | |
2,054,000 | | IRB Holding Corporation | | | 6.75 | % (a) | | | 02/15/2026 | | | | 2,128,457 | |
1,380,000 | | Iron Mountain, Inc. | | | 4.88 | % (a) | | | 09/15/2029 | | | | 1,398,561 | |
850,000 | | Iron Mountain, Inc. | | | 4.50 | % (a) | | | 02/15/2031 | | | | 841,372 | |
1,000,000 | | iStar, Inc. | | | 4.75 | % | | | 10/01/2024 | | | | 1,042,180 | |
625,000 | | Jaguar Holding Company | | | 5.00 | % (a) | | | 06/15/2028 | | | | 651,719 | |
600,000 | | JBS Finance, Inc. | | | 5.50 | % (a) | | | 01/15/2030 | | | | 665,250 | |
2,160,000 | | JELD-WEN, Inc. | | | 4.63 | % (a) | | | 12/15/2025 | | | | 2,194,873 | |
9,885,000 | | JP Morgan Chase & Company (Secured Overnight Financing Rate + 2.04% ) | | | 2.52 | % | | | 04/22/2031 | | | | 9,872,122 | |
1,415,000 | | KAR Auction Services, Inc. | | | 5.13 | % (a) | | | 06/01/2025 | | | | 1,442,309 | |
6,777,000 | | Keurig Dr Pepper, Inc. | | | 3.80 | % | | | 05/01/2050 | | | | 7,228,556 | |
10,619,000 | | Kinder Morgan Energy Partners LP | | | 6.95 | % | | | 01/15/2038 | | | | 14,277,913 | |
1,445,000 | | Kraft Heinz Foods Company | | | 5.00 | % | | | 07/15/2035 | | | | 1,665,675 | |
4,000,000 | | Kraft Heinz Foods Company | | | 5.20 | % | | | 07/15/2045 | | | | 4,636,187 | |
2,385,000 | | Kraton Polymers LLC | | | 4.25 | % (a) | | | 12/15/2025 | | | | 2,396,925 | |
1,475,000 | | Kratos Defense & Security Solutions, Inc. | | | 6.50 | % (a) | | | 11/30/2025 | | | | 1,555,041 | |
1,225,000 | | Lamar Media Corporation | | | 3.63 | % (a) | | | 01/15/2031 | | | | 1,184,942 | |
1,415,000 | | LBM Acquisition LLC | | | 6.25 | % (a) | | | 01/15/2029 | | | | 1,459,219 | |
730,000 | | LD Holdings Group LLC | | | 6.50 | % (a) | | | 11/01/2025 | | | | 766,500 | |
185,000 | | LD Holdings Group LLC | | | 6.13 | % (a) | | | 04/01/2028 | | | | 187,756 | |
1,015,000 | | Legends Hospitality Holding Company LLC | | | 5.00 | % (a) | | | 02/01/2026 | | | | 1,034,031 | |
530,000 | | Level 3 Financing, Inc. | | | 3.75 | % (a) | | | 07/15/2029 | | | | 519,347 | |
1,320,000 | | LifePoint Health, Inc. | | | 4.38 | % (a) | | | 02/15/2027 | | | | 1,296,900 | |
895,000 | | LifePoint Health, Inc. | | | 5.38 | % (a) | | | 01/15/2029 | | | | 882,694 | |
1,480,000 | | Lions Gate Capital Holdings LLC | | | 6.38 | % (a) | | | 02/01/2024 | | | | 1,527,182 | |
1,360,000 | | Lions Gate Capital Holdings LLC | | | 5.50 | % (a) | | | 04/15/2029 | | | | 1,363,550 | |
2,990,000 | | Live Nation Entertainment, Inc. | | | 5.63 | % (a) | | | 03/15/2026 | | | | 3,109,899 | |
650,000 | | Live Nation Entertainment, Inc. | | | 6.50 | % (a) | | | 05/15/2027 | | | | 722,332 | |
560,000 | | Logan Merger Sub, Inc. | | | 5.50 | % (a) | | | 09/01/2027 | | | | 586,953 | |
1,100,000 | | LSF9 Atlantis Holdings LLC | | | 7.75 | % (a) | | | 02/15/2026 | | | | 1,128,413 | |
1,235,000 | | M/I Homes, Inc. | | | 4.95 | % | | | 02/01/2028 | | | | 1,281,312 | |
12,569,000 | | Marathon Petroleum Corporation | | | 5.13 | % | | | 12/15/2026 | | | | 14,677,876 | |
7,250,000 | | Marriott International, Inc. | | | 3.13 | % | | | 06/15/2026 | | | | 7,612,746 | |
1,925,000 | | Marriott Ownership Resorts, Inc. | | | 6.50 | % | | | 09/15/2026 | | | | 2,013,733 | |
13,510,000 | | Marvell Technology Group Ltd. | | | 4.20 | % | | | 06/22/2023 | | | | 14,461,455 | |
2,250,000 | | Masonite International Corporation | | | 5.75 | % (a) | | | 09/15/2026 | | | | 2,348,010 | |
1,085,000 | | Match Group, Inc. | | | 5.00 | % (a) | | | 12/15/2027 | | | | 1,140,400 | |
590,000 | | Match Group, Inc. | | | 4.63 | % (a) | | | 06/01/2028 | | | | 603,945 | |
1,520,000 | | Matterhorn Merger Sub LLC | | | 8.50 | % (a) | | | 06/01/2026 | | | | 1,560,318 | |
6,880,000 | | McDonald’s Corporation | | | 3.60 | % | | | 07/01/2030 | | | | 7,513,119 | |
5,880,000 | | McDonald’s Corporation | | | 4.45 | % | | | 03/01/2047 | | | | 6,844,742 | |
13,650,000 | | Merck & Company, Inc. | | | 3.40 | % | | | 03/07/2029 | | | | 15,086,852 | |
50,000 | | Metropolitan Edison Company | | | 4.00 | % (a) | | | 04/15/2025 | | | | 52,937 | |
1,710,000 | | MGM Growth Properties Operating Partnership LP | | | 5.75 | % | | | 02/01/2027 | | | | 1,887,840 | |
1,495,000 | | MGM Resorts International | | | 6.75 | % | | | 05/01/2025 | | | | 1,613,105 | |
755,000 | | MGM Resorts International | | | 5.75 | % | | | 06/15/2025 | | | | 824,366 | |
6,665,000 | | Micron Technology, Inc. | | | 2.50 | % | | | 04/24/2023 | | | | 6,923,369 | |
1,385,000 | | Mileage Plus Holdings LLC | | | 6.50 | % (a) | | | 06/20/2027 | | | | 1,520,037 | |
4,785,000 | | Mondelez International, Inc. | | | 1.88 | % | | | 10/15/2032 | | | | 4,470,095 | |
6,255,000 | | Monongahela Power Company | | | 5.40 | % (a) | | | 12/15/2043 | | | | 7,724,381 | |
12,769,000 | | Morgan Stanley (3 Month LIBOR USD + 1.34% ) | | | 3.59 | % | | | 07/22/2028 | | | | 13,932,418 | |
1,272,000 | | Moss Creek Resources Holdings, Inc. | | | 7.50 | % (a) | | | 01/15/2026 | | | | 1,026,599 | |
2,050,000 | | MPH Acquisition Holdings LLC | | | 5.75 | % (a) | | | 11/01/2028 | | | | 2,001,312 | |
1,250,000 | | MPLX LP | | | 4.00 | % | | | 03/15/2028 | | | | 1,381,279 | |
3,720,000 | | MPT Operating Partnership LP | | | 5.00 | % | | | 10/15/2027 | | | | 3,920,062 | |
940,000 | | Murphy Oil USA, Inc. | | | 4.75 | % | | | 09/15/2029 | | | | 989,176 | |
1,020,000 | | Nabors Industries Ltd. | | | 7.25 | % (a) | | | 01/15/2026 | | | | 848,512 | |
1,160,000 | | National FINL Partners Corporation | | | 6.88 | % (a) | | | 08/15/2028 | | | | 1,204,950 | |
3,675,000 | | National Retail Properties, Inc. | | | 2.50 | % | | | 04/15/2030 | | | | 3,612,264 | |
235,000 | | Nationstar Mortgage Holdings, Inc. | | | 6.00 | % (a) | | | 01/15/2027 | | | | 244,217 | |
1,325,000 | | Nationstar Mortgage Holdings, Inc. | | | 5.50 | % (a) | | | 08/15/2028 | | | | 1,332,851 | |
2,795,000 | | Navient Corporation | | | 6.50 | % | | | 06/15/2022 | | | | 2,938,579 | |
955,000 | | Navient Corporation | | | 5.00 | % | | | 03/15/2027 | | | | 958,705 | |
1,935,000 | | NCL Corporation, Ltd. | | | 3.63 | % (a) | | | 12/15/2024 | | | | 1,829,784 | |
1,185,000 | | NCL Corporation, Ltd. | | | 5.88 | % (a) | | | 03/15/2026 | | | | 1,198,627 | |
345,000 | | NESCO Holdings II, Inc. | | | 5.50 | % (a) | | | 04/15/2029 | | | | 354,332 | |
7,668,000 | | NetApp, Inc. | | | 1.88 | % | | | 06/22/2025 | | | | 7,833,398 | |
860,000 | | Netflix, Inc. | | | 5.88 | % | | | 02/15/2025 | | | | 987,387 | |
765,000 | | Netflix, Inc. | | | 5.38 | % (a) | | | 11/15/2029 | | | | 905,607 | |
550,000 | | Netflix, Inc. | | | 4.88 | % (a) | | | 06/15/2030 | | | | 634,035 | |
3,435,000 | | Newfield Exploration Company | | | 5.63 | % | | | 07/01/2024 | | | | 3,779,002 | |
1,025,000 | | Nexstar Broadcasting, Inc. | | | 5.63 | % (a) | | | 07/15/2027 | | | | 1,075,927 | |
7,092,000 | | NextEra Energy Capital Holdings, Inc. | | | 3.55 | % | | | 05/01/2027 | | | | 7,793,951 | |
3,500,000 | | NextEra Energy Capital Holdings, Inc. | | | 2.25 | % | | | 06/01/2030 | | | | 3,427,229 | |
175,000 | | NFP Corporation | | | 7.00 | % (a) | | | 05/15/2025 | | | | 188,344 | |
1,950,000 | | NGL Energy Operating LLC | | | 7.50 | % (a) | | | 02/01/2026 | | | | 2,007,281 | |
1,170,000 | | NGL Energy Partners LP | | | 7.50 | % | | | 04/15/2026 | | | | 999,619 | |
3,865,000 | | NiSource, Inc. | | | 3.60 | % | | | 05/01/2030 | | | | 4,195,488 | |
8,815,000 | | Northrop Grumman Corporation | | | 5.15 | % | | | 05/01/2040 | | | | 11,093,183 | |
775,000 | | Novelis Corporation | | | 4.75 | % (a) | | | 01/30/2030 | | | | 800,246 | |
5,000,000 | | NRG Energy, Inc. | | | 2.00 | % (a) | | | 12/02/2025 | | | | 5,001,378 | |
1,715,000 | | NRG Energy, Inc. | | | 3.63 | % (a) | | | 02/15/2031 | | | | 1,675,341 | |
1,650,000 | | NuStar Logistics LP | | | 6.00 | % | | | 06/01/2026 | | | | 1,781,670 | |
820,000 | | Occidental Petroleum Corporation | | | 8.00 | % | | | 07/15/2025 | | | | 942,840 | |
2,480,000 | | Occidental Petroleum Corporation | | | 3.50 | % | | | 08/15/2029 | | | | 2,330,084 | |
1,920,000 | | Occidental Petroleum Corporation | | | 6.63 | % | | | 09/01/2030 | | | | 2,160,576 | |
1,675,000 | | Occidental Petroleum Corporation | | | 6.13 | % | | | 01/01/2031 | | | | 1,852,676 | |
1,750,000 | | Omega Healthcare Investors, Inc. | | | 3.25 | % | | | 04/15/2033 | | | | 1,680,614 | |
4,060,000 | | ONEOK, Inc. | | | 3.40 | % | | | 09/01/2029 | | | | 4,187,830 | |
265,000 | | OPE KAG Finance Sub, Inc. | | | 7.88 | % (a) | | | 07/31/2023 | | | | 265,000 | |
8,065,000 | | Oracle Corporation | | | 3.85 | % | | | 04/01/2060 | | | | 7,929,374 | |
136,000 | | Ortho Clinical Diagnostics, Inc. | | | 7.38 | % (a) | | | 06/01/2025 | | | | 146,469 | |
1,116,000 | | Ortho-Clinical Diagnostics, Inc. | | | 7.25 | % (a) | | | 02/01/2028 | | | | 1,224,849 | |
1,145,000 | | Ovintiv, Inc. | | | 7.38 | % | | | 11/01/2031 | | | | 1,458,128 | |
6,315,000 | | Owens Corning | | | 4.40 | % | | | 01/30/2048 | | | | 6,905,177 | |
8,595,000 | | Pacific Gas and Electric Company | | | 1.37 | % | | | 03/10/2023 | | | | 8,598,414 | |
7,853,000 | | Pacific Gas and Electric Company | | | 2.50 | % | | | 02/01/2031 | | | | 7,415,691 | |
6,235,000 | | Packaging Corporation of America | | | 3.40 | % | | | 12/15/2027 | | | | 6,809,202 | |
1,445,000 | | Panther BF Aggregator LP | | | 6.25 | % (a) | | | 05/15/2026 | | | | 1,536,454 | |
745,000 | | Panther BF Aggregator LP | | | 8.50 | % (a) | | | 05/15/2027 | | | | 803,036 | |
2,235,000 | | Par Petroleum Finance Corporation | | | 7.75 | % (a) | | | 12/15/2025 | | | | 2,271,319 | |
1,985,000 | | Parsley Energy LLC | | | 5.63 | % (a) | | | 10/15/2027 | | | | 2,156,206 | |
565,000 | | PBF Holding Company LLC | | | 6.00 | % | | | 02/15/2028 | | | | 418,453 | |
544,000 | | Peabody Energy Corporation (6.00% + 2.50% PIK) | | | 8.50 | % (a) | | | 12/31/2024 | | | | 228,480 | |
2,085,000 | | Penn National Gaming, Inc. | | | 5.63 | % (a) | | | 01/15/2027 | | | | 2,162,937 | |
1,385,000 | | PennyMac Financial Services, Inc. | | | 5.38 | % (a) | | | 10/15/2025 | | | | 1,437,353 | |
745,000 | | PennyMac Financial Services, Inc. | | | 4.25 | % (a) | | | 02/15/2029 | | | | 714,269 | |
6,620,000 | | Penske Truck Leasing Company | | | 4.20 | % (a) | | | 04/01/2027 | | | | 7,418,830 | |
1,915,000 | | Performance Food Group, Inc. | | | 5.50 | % (a) | | | 10/15/2027 | | | | 2,006,135 | |
1,975,000 | | PetSmart, Inc. | | | 4.75 | % (a) | | | 02/15/2028 | | | | 2,022,321 | |
1,545,000 | | PetSmart, Inc. | | | 7.75 | % (a) | | | 02/15/2029 | | | | 1,674,317 | |
650,000 | | PG&E Corporation | | | 5.00 | % | | | 07/01/2028 | | | | 687,570 | |
613,000 | | PIC AU Holdings LLC | | | 10.00 | % (a) | | | 12/31/2024 | | | | 565,493 | |
1,200,000 | | Pike Corporation | | | 5.50 | % (a) | | | 09/01/2028 | | | | 1,224,000 | |
1,435,000 | | Pilgrim’s Pride Corporation | | | 5.88 | % (a) | | | 09/30/2027 | | | | 1,539,683 | |
10,462,000 | | Pioneer Natural Resources Corporation | | | 1.90 | % | | | 08/15/2030 | | | | 9,717,624 | |
430,000 | | Post Holdings, Inc. | | | 5.50 | % (a) | | | 12/15/2029 | | | | 460,992 | |
1,785,000 | | Post Holdings, Inc. | | | 4.63 | % (a) | | | 04/15/2030 | | | | 1,791,694 | |
715,000 | | Prime Security Services Borrower LLC | | | 3.38 | % (a) | | | 08/31/2027 | | | | 694,444 | |
1,095,000 | | Prime Security Services Borrower LLC | | | 6.25 | % (a) | | | 01/15/2028 | | | | 1,141,428 | |
810,000 | | Providence Service Corporation | | | 5.88 | % (a) | | | 11/15/2025 | | | | 854,044 | |
5,905,000 | | Prudential Financial, Inc. | | | 3.91 | % | | | 12/07/2047 | | | | 6,404,904 | |
10,235,000 | | PSEG Power LLC | | | 3.85 | % | | | 06/01/2023 | | | | 10,918,153 | |
105,000 | | Rackspace Technology Global, Inc. | | | 5.38 | % (a) | | | 12/01/2028 | | | | 106,964 | |
950,000 | | Radiate Finance, Inc. | | | 4.50 | % (a) | | | 09/15/2026 | | | | 963,063 | |
355,000 | | Radiate Finance, Inc. | | | 6.50 | % (a) | | | 09/15/2028 | | | | 375,528 | |
1,520,000 | | Radiology Partners, Inc. | | | 9.25 | % (a) | | | 02/01/2028 | | | | 1,658,700 | |
940,000 | | Rattler Midstream LP | | | 5.63 | % (a) | | | 07/15/2025 | | | | 983,235 | |
490,000 | | Real Hero Merger Sub 2, Inc. | | | 6.25 | % (a) | | | 02/01/2029 | | | | 506,538 | |
895,000 | | Realogy Group LLC | | | 7.63 | % (a) | | | 06/15/2025 | | | | 978,517 | |
915,000 | | Realogy Group LLC | | | 5.75 | % (a) | | | 01/15/2029 | | | | 903,563 | |
975,000 | | Rent-A-Center, Inc. | | | 6.38 | % (a) | | | 02/15/2029 | | | | 1,035,938 | |
1,241,000 | | Resideo Funding, Inc. | | | 6.13 | % (a) | | | 11/01/2026 | | | | 1,310,384 | |
16,420,000 | | Roper Technologies, Inc. | | | 1.75 | % | | | 02/15/2031 | | | | 15,261,148 | |
8,145,000 | | Royalty Pharma PLC | | | 3.30 | % (a) | | | 09/02/2040 | | | | 7,874,003 | |
1,410,000 | | RP Escrow Issuer LLC | | | 5.25 | % (a) | | | 12/15/2025 | | | | 1,462,875 | |
6,428,000 | | Sabine Pass Liquefaction LLC | | | 5.00 | % | | | 03/15/2027 | | | | 7,321,950 | |
655,000 | | Sabre Global, Inc. | | | 9.25 | % (a) | | | 04/15/2025 | | | | 781,906 | |
3,520,000 | | Schlumberger Investment S.A. | | | 2.65 | % | | | 06/26/2030 | | | | 3,548,301 | |
1,580,000 | | Schweitzer-Mauduit International, Inc. | | | 6.88 | % (a) | | | 10/01/2026 | | | | 1,680,425 | |
590,000 | | Science Applications International Corporation | | | 4.88 | % (a) | | | 04/01/2028 | | | | 610,927 | |
1,820,000 | | Scientific Games International, Inc. | | | 5.00 | % (a) | | | 10/15/2025 | | | | 1,887,249 | |
735,000 | | Scientific Games International, Inc. | | | 8.25 | % (a) | | | 03/15/2026 | | | | 789,541 | |
1,450,000 | | Scotts Miracle-Gro Company | | | 4.50 | % | | | 10/15/2029 | | | | 1,499,452 | |
1,145,000 | | Scripps Escrow, Inc. | | | 5.88 | % (a) | | | 07/15/2027 | | | | 1,186,506 | |
440,000 | | Scripps Escrow, Inc. | | | 3.88 | % (a) | | | 01/15/2029 | | | | 433,125 | |
600,000 | | Seagate HDD Cayman | | | 3.38 | % (a) | | | 07/15/2031 | | | | 577,620 | |
1,900,000 | | SEG Holding LLC | | | 5.63 | % (a) | | | 10/15/2028 | | | | 1,992,625 | |
2,895,000 | | Select Medical Corporation | | | 6.25 | % (a) | | | 08/15/2026 | | | | 3,081,149 | |
2,022,000 | | Silgan Holdings, Inc. | | | 4.13 | % | | | 02/01/2028 | | | | 2,082,296 | |
6,770,000 | | Simon Property Group LP | | | 2.45 | % | | | 09/13/2029 | | | | 6,709,569 | |
1,395,000 | | Sirius XM Radio, Inc. | | | 5.38 | % (a) | | | 07/15/2026 | | | | 1,443,825 | |
1,100,000 | | Sirius XM Radio, Inc. | | | 5.50 | % (a) | | | 07/01/2029 | | | | 1,191,438 | |
690,000 | | Sirius XM Radio, Inc. | | | 4.13 | % (a) | | | 07/01/2030 | | | | 691,656 | |
2,520,000 | | Six Flags Entertainment Corporation | | | 4.88 | % (a) | | | 07/31/2024 | | | | 2,548,350 | |
840,000 | | Six Flags Theme Parks, Inc. | | | 7.00 | % (a) | | | 07/01/2025 | | | | 909,825 | |
12,656,000 | | Smithfield Foods, Inc. | | | 4.25 | % (a) | | | 02/01/2027 | | | | 13,972,623 | |
7,820,000 | | Southwest Airlines Company | | | 4.75 | % | | | 05/04/2023 | | | | 8,445,752 | |
1,230,000 | | Spectrum Brands, Inc. | | | 5.00 | % (a) | | | 10/01/2029 | | | | 1,300,725 | |
1,225,000 | | Spectrum Brands, Inc. | | | 3.88 | % (a) | | | 03/15/2031 | | | | 1,202,031 | |
850,000 | | Springleaf Finance Corporation | | | 6.88 | % | | | 03/15/2025 | | | | 968,405 | |
280,000 | | Springleaf Finance Corporation | | | 7.13 | % | | | 03/15/2026 | | | | 323,289 | |
390,000 | | Springleaf Finance Corporation | | | 6.63 | % | | | 01/15/2028 | | | | 442,650 | |
825,000 | | Springleaf Finance Corporation | | | 5.38 | % | | | 11/15/2029 | | | | 879,656 | |
3,965,000 | | Sprint Capital Corporation | | | 6.88 | % | | | 11/15/2028 | | | | 5,007,180 | |
1,175,000 | | Staples, Inc. | | | 7.50 | % (a) | | | 04/15/2026 | | | | 1,241,094 | |
500,000 | | Staples, Inc. | | | 10.75 | % (a) | | | 04/15/2027 | | | | 494,375 | |
1,745,000 | | Stevens Holding Company, Inc. | | | 6.13 | % (a) | | | 10/01/2026 | | | | 1,877,725 | |
2,608,000 | | SunCoke Energy Partners Finance Corporation | | | 7.50 | % (a) | | | 06/15/2025 | | | | 2,713,950 | |
1,910,000 | | Sunoco LP | | | 5.50 | % | | | 02/15/2026 | | | | 1,966,899 | |
1,010,000 | | Sunoco LP | | | 6.00 | % | | | 04/15/2027 | | | | 1,057,975 | |
475,000 | | Sunoco LP | | | 4.50 | % (a) | | | 05/15/2029 | | | | 474,109 | |
12,810,000 | | Synchrony Financial | | | 3.95 | % | | | 12/01/2027 | | | | 13,810,045 | |
11,135,000 | | Sysco Corporation | | | 3.30 | % | | | 02/15/2050 | | | | 10,447,851 | |
800,000 | | Targa Resources Partners Finance Corporation | | | 6.50 | % | | | 07/15/2027 | | | | 871,344 | |
2,090,000 | | Targa Resources Partners Finance Corporation | | | 4.88 | % (a) | | | 02/01/2031 | | | | 2,120,828 | |
7,335,000 | | Teledyne Technologies, Inc. | | | 2.25 | % | | | 04/01/2028 | | | | 7,304,341 | |
3,600,000 | | Tempo Acquisition LLC | | | 6.75 | % (a) | | | 06/01/2025 | | | | 3,683,250 | |
3,115,000 | | Tempur Sealy International, Inc. | | | 5.50 | % | | | 06/15/2026 | | | | 3,231,813 | |
735,000 | | Tempur Sealy International, Inc. | | | 4.00 | % (a) | | | 04/15/2029 | | | | 733,163 | |
1,800,000 | | Tenet Healthcare Corporation | | | 4.88 | % (a) | | | 01/01/2026 | | | | 1,873,800 | |
1,930,000 | | Tenet Healthcare Corporation | | | 6.25 | % (a) | | | 02/01/2027 | | | | 2,040,512 | |
750,000 | | Tenet Healthcare Corporation | | | 5.13 | % (a) | | | 11/01/2027 | | | | 786,150 | |
2,200,000 | | Tenet Healthcare Corporation | | | 6.13 | % (a) | | | 10/01/2028 | | | | 2,299,000 | |
1,215,000 | | Tenneco, Inc. | | | 5.13 | % (a) | | | 04/15/2029 | | | | 1,201,331 | |
520,000 | | Terrier Media Buyer, Inc. | | | 8.88 | % (a) | | | 12/15/2027 | | | | 560,521 | |
3,715,000 | | Texas Instruments, Inc. | | | 1.75 | % | | | 05/04/2030 | | | | 3,579,335 | |
9,425,000 | | The Interpublic Group of Companies, Inc. | | | 5.40 | % | | | 10/01/2048 | | | | 11,636,158 | |
4,425,000 | | T-Mobile USA, Inc. | | | 3.50 | % (a) | | | 04/15/2025 | | | | 4,778,469 | |
4,980,000 | | T-Mobile USA, Inc. | | | 2.25 | % | | | 02/15/2026 | | | | 5,022,031 | |
640,000 | | T-Mobile USA, Inc. | | | 3.38 | % | | | 04/15/2029 | | | | 646,000 | |
555,000 | | T-Mobile USA, Inc. | | | 2.88 | % | | | 02/15/2031 | | | | 537,101 | |
460,000 | | Townsquare Media, Inc. | | | 6.88 | % (a) | | | 02/01/2026 | | | | 490,763 | |
340,000 | | TransDigm, Inc. | | | 8.00 | % (a) | | | 12/15/2025 | | | | 370,600 | |
2,205,000 | | TransDigm, Inc. | | | 6.25 | % (a) | | | 03/15/2026 | | | | 2,340,508 | |
1,365,000 | | TransDigm, Inc. | | | 6.38 | % | | | 06/15/2026 | | | | 1,413,628 | |
1,190,000 | | TransDigm, Inc. | | | 5.50 | % | | | 11/15/2027 | | | | 1,233,590 | |
2,120,000 | | Transocean Poseidon Ltd. | | | 6.88 | % (a) | | | 02/01/2027 | | | | 1,963,512 | |
1,284,000 | | Transocean Proteus Ltd. | | | 6.25 | % (a) | | | 12/01/2024 | | | | 1,223,010 | |
475,000 | | Transocean, Inc. | | | 11.50 | % (a) | | | 01/30/2027 | | | | 408,130 | |
1,320,000 | | Trident TPI Holdings, Inc. | | | 6.63 | % (a) | | | 11/01/2025 | | | | 1,347,911 | |
1,155,000 | | Triton Water Holdings, Inc. | | | 6.25 | % (a) | | | 04/01/2029 | | | | 1,178,822 | |
495,000 | | Triumph Group, Inc. | | | 6.25 | % (a) | | | 09/15/2024 | | | | 504,133 | |
992,000 | | Triumph Group, Inc. | | | 7.75 | % | | | 08/15/2025 | | | | 999,440 | |
310,000 | | Tronox, Inc. | | | 4.63 | % (a) | | | 03/15/2029 | | | | 310,775 | |
2,355,000 | | Twin River Worldwide Holdings, Inc. | | | 6.75 | % (a) | | | 06/01/2027 | | | | 2,530,165 | |
1,265,000 | | Uber Technologies, Inc. | | | 8.00 | % (a) | | | 11/01/2026 | | | | 1,371,734 | |
700,000 | | Uber Technologies, Inc. | | | 7.50 | % (a) | | | 09/15/2027 | | | | 774,081 | |
1,365,000 | | United Natural Foods, Inc. | | | 6.75 | % (a) | | | 10/15/2028 | | | | 1,460,550 | |
1,270,000 | | United Rentals North America, Inc. | | | 4.00 | % | | | 07/15/2030 | | | | 1,294,130 | |
215,000 | | United Rentals North America, Inc. | | | 3.88 | % | | | 02/15/2031 | | | | 216,478 | |
950,000 | | Uniti Group LP | | | 6.50 | % (a) | | | 02/15/2029 | | | | 939,313 | |
1,185,000 | | Univision Communications, Inc. | | | 6.63 | % (a) | | | 06/01/2027 | | | | 1,267,713 | |
4,490,000 | | Upjohn, Inc. | | | 1.65 | % (a) | | | 06/22/2025 | | | | 4,510,345 | |
130,000 | | US Foods, Inc. | | | 6.25 | % (a) | | | 04/15/2025 | | | | 139,534 | |
1,020,000 | | US Foods, Inc. | | | 4.75 | % (a) | | | 02/15/2029 | | | | 1,021,275 | |
3,040,000 | | USA Compression Partners LP | | | 6.88 | % | | | 09/01/2027 | | | | 3,136,338 | |
1,000,000 | | Verizon Communications, Inc. | | | 3.15 | % | | | 03/22/2030 | | | | 1,055,531 | |
12,882,000 | | Verizon Communications, Inc. | | | 4.40 | % | | | 11/01/2034 | | | | 14,747,730 | |
2,365,000 | | Verscend Escrow Corporation | | | 9.75 | % (a) | | | 08/15/2026 | | | | 2,540,235 | |
1,400,000 | | ViaSat, Inc. | | | 6.50 | % (a) | | | 07/15/2028 | | | | 1,476,447 | |
220,000 | | VICI Properties LP | | | 3.75 | % (a) | | | 02/15/2027 | | | | 220,378 | |
1,110,000 | | VICI Properties LP | | | 4.13 | % (a) | | | 08/15/2030 | | | | 1,121,045 | |
440,000 | | Viking Cruises Ltd. | | | 13.00 | % (a) | | | 05/15/2025 | | | | 518,100 | |
3,150,000 | | Viking Cruises Ltd. | | | 5.88 | % (a) | | | 09/15/2027 | | | | 3,085,031 | |
570,000 | | Vine Oil & Gas Finance Corporation | | | 8.75 | % (a) | | | 04/15/2023 | | | | 609,615 | |
1,215,000 | | Viper Energy Partners LP | | | 5.38 | % (a) | | | 11/01/2027 | | | | 1,265,878 | |
1,320,000 | | Vizient, Inc. | | | 6.25 | % (a) | | | 05/15/2027 | | | | 1,405,549 | |
4,235,000 | | Vontier Corporation | | | 2.40 | % (a) | | | 04/01/2028 | | | | 4,171,433 | |
1,255,000 | | Waste Pro, Inc. | | | 5.50 | % (a) | | | 02/15/2026 | | | | 1,288,452 | |
68,000 | | Weatherford International Ltd. | | | 11.00 | % (a) | | | 12/01/2024 | | | | 65,408 | |
6,905,000 | | Wells Fargo & Company (3 Month LIBOR USD + 1.17% ) | | | 3.20 | % | | | 06/17/2027 | | | | 7,406,253 | |
5,900,000 | | Wells Fargo & Company (3 Month LIBOR USD + 1.17% ) | | | 2.88 | % | | | 10/30/2030 | | | | 6,082,266 | |
7,635,000 | | Welltower, Inc. | | | 2.80 | % | | | 06/01/2031 | | | | 7,605,321 | |
1,340,000 | | Western Midstream Operating LP | | | 4.35 | % | | | 02/01/2025 | | | | 1,389,031 | |
1,400,000 | | Western Midstream Operating LP | | | 5.30 | % | | | 02/01/2030 | | | | 1,522,101 | |
15,170,000 | | Western Union Company | | | 2.75 | % | | | 03/15/2031 | | | | 14,494,784 | |
725,000 | | WeWork Companies, Inc. | | | 7.88 | % (a) | | | 05/01/2025 | | | | 719,563 | |
1,600,000 | | William Carter Company | | | 5.63 | % (a) | | | 03/15/2027 | | | | 1,693,000 | |
11,740,000 | | Willis North America, Inc. | | | 4.50 | % | | | 09/15/2028 | | | | 13,367,435 | |
1,040,000 | | Wolverine Escrow LLC | | | 9.00 | % (a) | | | 11/15/2026 | | | | 1,040,962 | |
13,095,000 | | WRKCo, Inc. | | | 3.75 | % | | | 03/15/2025 | | | | 14,297,288 | |
1,215,000 | | Wyndham Hotels & Resorts | | | 4.38 | % (a) | | | 08/15/2028 | | | | 1,231,251 | |
845,000 | | XHR LP | | | 6.38 | % (a) | | | 08/15/2025 | | | | 894,116 | |
610,000 | | Yum! Brands, Inc. | | | 7.75 | % (a) | | | 04/01/2025 | | | | 667,950 | |
1,245,000 | | Yum! Brands, Inc. | | | 4.75 | % (a) | | | 01/15/2030 | | | | 1,318,206 | |
1,125,000 | | Yum! Brands, Inc. | | | 3.63 | % | | | 03/15/2031 | | | | 1,082,813 | |
| | | | | | | | | | | | | | |
Total US Corporate Bonds (Cost $1,533,203,320) | | | | | | | | 1,593,392,791 | |
| | | | | | | | | | | | | | |
US Government and Agency Mortgage Backed Obligations—15.2% | | | | | | | | | |
425,259 | | Federal Home Loan Mortgage Corporation, Pool G01840 | | | 5.00 | % | | | 07/01/2035 | | | | 495,320 | |
227,145 | | Federal Home Loan Mortgage Corporation, Pool G04817 | | | 5.00 | % | | | 09/01/2038 | | | | 264,434 | |
8,840,703 | | Federal Home Loan Mortgage Corporation, Pool G08537 | | | 3.00 | % | | | 07/01/2043 | | | | 9,368,661 | |
5,329,046 | | Federal Home Loan Mortgage Corporation, Pool G08622 | | | 3.00 | % | | | 01/01/2045 | | | | 5,611,940 | |
5,241,494 | | Federal Home Loan Mortgage Corporation, Pool G08686 | | | 3.00 | % | | | 01/01/2046 | | | | 5,516,486 | |
20,099,993 | | Federal Home Loan Mortgage Corporation, Pool G08701 | | | 3.00 | % | | | 04/01/2046 | | | | 21,093,902 | |
1,251,711 | | Federal Home Loan Mortgage Corporation, Pool G08737 | | | 3.00 | % | | | 12/01/2046 | | | | 1,316,564 | |
17,576,814 | | Federal Home Loan Mortgage Corporation, Pool G61645 | | | 4.00 | % | | | 10/01/2048 | | | | 18,869,360 | |
1,517,354 | | Federal Home Loan Mortgage Corporation, Pool N70081 | | | 5.50 | % | | | 07/01/2038 | | | | 1,694,768 | |
6,758,793 | | Federal Home Loan Mortgage Corporation, Pool Q33789 | | | 3.50 | % | | | 06/01/2045 | | | | 7,299,752 | |
29,526,152 | | Federal Home Loan Mortgage Corporation, Pool RB5094 | | | 1.50 | % | | | 01/01/2041 | | | | 29,125,346 | |
7,416,115 | | Federal Home Loan Mortgage Corporation, Pool RC1060 | | | 2.50 | % | | | 09/01/2034 | | | | 7,820,240 | |
10,305,062 | | Federal Home Loan Mortgage Corporation, Pool SB0048 | | | 3.00 | % | | | 08/01/2034 | | | | 10,962,030 | |
11,933,376 | | Federal Home Loan Mortgage Corporation, Pool SB8092 | | | 1.50 | % | | | 03/01/2036 | | | | 11,998,582 | |
28,225,757 | | Federal Home Loan Mortgage Corporation, Pool SD0035 | | | 3.00 | % | | | 04/01/2047 | | | | 29,790,576 | |
53,558,851 | | Federal Home Loan Mortgage Corporation, Pool SD8107 | | | 2.50 | % | | | 11/01/2050 | | | | 55,028,366 | |
1,577,802 | | Federal Home Loan Mortgage Corporation, Pool T60854 | | | 3.50 | % | | | 09/01/2042 | | | | 1,648,792 | |
325,897 | | Federal Home Loan Mortgage Corporation, Pool U60299 | | | 4.00 | % | | | 11/01/2040 | | | | 355,238 | |
7,689,832 | | Federal Home Loan Mortgage Corporation, Pool V83144 | | | 4.00 | % | | | 04/01/2047 | | | | 8,318,642 | |
19,977,099 | | Federal Home Loan Mortgage Corporation, Pool ZT1827 | | | 3.00 | % | | | 07/01/2047 | | | | 20,997,376 | |
45,281 | | Federal Home Loan Mortgage Corporation, Series 2692-SC (-2 x 1 Month LIBOR USD + 13.29%, 13.29% Cap) | | | 13.07 | % (l) | | | 07/15/2033 | | | | 59,174 | |
1,272,885 | | Federal Home Loan Mortgage Corporation, Series 2722-PS (-1 x 1 Month LIBOR USD + 9.89%, 9.89% Cap) | | | 9.77 | % (l) | | | 12/15/2033 | | | | 1,567,091 | |
61,854 | | Federal Home Loan Mortgage Corporation, Series 2750-ZT | | | 5.00 | % | | | 02/15/2034 | | | | 70,366 | |
136,537 | | Federal Home Loan Mortgage Corporation, Series 3002-SN (-1 x 1 Month LIBOR USD + 6.50%, 6.50% Cap) | | | 6.39 | % (i)(l) | | | 07/15/2035 | | | | 24,933 | |
63,175 | | Federal Home Loan Mortgage Corporation, Series 3045-DI (-1 x 1 Month LIBOR USD + 6.73%, 6.73% Cap) | | | 6.62 | % (i)(l) | | | 10/15/2035 | | | | 9,856 | |
205,728 | | Federal Home Loan Mortgage Corporation, Series 3116-Z | | | 5.50 | % | | | 02/15/2036 | | | | 235,210 | |
19,222 | | Federal Home Loan Mortgage Corporation, Series 3117-ZN | | | 4.50 | % | | | 02/15/2036 | | | | 20,814 | |
244,719 | | Federal Home Loan Mortgage Corporation, Series 3203-ZC | | | 5.00 | % | | | 07/15/2036 | | | | 279,453 | |
75,554 | | Federal Home Loan Mortgage Corporation, Series 3275-SC (-1 x 1 Month LIBOR USD + 6.08%, 6.08% Cap) | | | 5.97 | % (i)(l) | | | 02/15/2037 | | | | 10,777 | |
177,606 | | Federal Home Loan Mortgage Corporation, Series 3382-SB (-1 x 1 Month LIBOR USD + 6.00%, 6.00% Cap) | | | 5.89 | % (i)(l) | | | 11/15/2037 | | | | 24,667 | |
172,225 | | Federal Home Loan Mortgage Corporation, Series 3384-S (-1 x 1 Month LIBOR USD + 6.39%, 6.39% Cap) | | | 6.28 | % (i)(l) | | | 11/15/2037 | | | | 21,873 | |
230,885 | | Federal Home Loan Mortgage Corporation, Series 3417-SX (-1 x 1 Month LIBOR USD + 6.18%, 6.18% Cap) | | | 6.07 | % (i)(l) | | | 02/15/2038 | | | | 30,644 | |
29,912 | | Federal Home Loan Mortgage Corporation, Series 3423-GS (-1 x 1 Month LIBOR USD + 5.65%, 5.65% Cap) | | | 5.54 | % (i)(l) | | | 03/15/2038 | | | | 3,863 | |
29,912 | | Federal Home Loan Mortgage Corporation, Series 3423-SG (-1 x 1 Month LIBOR USD + 5.65%, 5.65% Cap) | | | 5.54 | % (i)(l) | | | 03/15/2038 | | | | 3,762 | |
95,685 | | Federal Home Loan Mortgage Corporation, Series 3524-LB | | | 3.54 | % (i)(j) | | | 06/15/2038 | | | | 102,579 | |
13,078,665 | | Federal Home Loan Mortgage Corporation, Series 355-300 | | | 3.00 | % | | | 08/15/2047 | | | | 13,620,082 | |
91,110 | | Federal Home Loan Mortgage Corporation, Series 3562-WS (-1 x 1 Month LIBOR USD + 4.95%, 4.95% Cap) | | | 4.84 | % (i)(l) | | | 08/15/2039 | | | | 10,098 | |
150,094 | | Federal Home Loan Mortgage Corporation, Series 3582-SA (-1 x 1 Month LIBOR USD + 6.00%, 6.00% Cap) | | | 5.89 | % (i)(l) | | | 10/15/2049 | | | | 21,613 | |
40,822,740 | | Federal Home Loan Mortgage Corporation, Series 358-300 | | | 3.00 | % | | | 10/15/2047 | | | | 42,758,463 | |
174,692 | | Federal Home Loan Mortgage Corporation, Series 3616-SG (-1 x 1 Month LIBOR USD + 6.35%, 6.35% Cap) | | | 6.24 | % (i)(l) | | | 03/15/2032 | | | | 26,829 | |
706,224 | | Federal Home Loan Mortgage Corporation, Series 3626-AZ | | | 5.50 | % | | | 08/15/2036 | | | | 814,120 | |
226,871 | | Federal Home Loan Mortgage Corporation, Series 3666-SC (-1 x 1 Month LIBOR USD + 5.77%, 5.77% Cap) | | | 5.66 | % (i)(l) | | | 05/15/2040 | | | | 42,773 | |
181,157 | | Federal Home Loan Mortgage Corporation, Series 3666-VZ | | | 5.50 | % | | | 08/15/2036 | | | | 207,398 | |
1,929,605 | | Federal Home Loan Mortgage Corporation, Series 3779-DZ | | | 4.50 | % | | | 12/15/2040 | | | | 2,096,422 | |
1,042,917 | | Federal Home Loan Mortgage Corporation, Series 3779-YA | | | 3.50 | % | | | 12/15/2030 | | | | 1,130,061 | |
332,511 | | Federal Home Loan Mortgage Corporation, Series 3786-SG (-2 x 1 Month LIBOR USD + 9.50%, 9.50% Cap) | | | 9.29 | % (l) | | | 01/15/2041 | | | | 335,361 | |
3,380,107 | | Federal Home Loan Mortgage Corporation, Series 3792-SE (-2 x 1 Month LIBOR USD + 9.86%, 9.86% Cap) | | | 9.65 | % (l) | | | 01/15/2041 | | | | 3,201,299 | |
12,438 | | Federal Home Loan Mortgage Corporation, Series 3798-SD (-2 x 1 Month LIBOR USD + 9.60%, 9.60% Cap) | | | 9.39 | % (l) | | | 12/15/2040 | | | | 11,968 | |
713,255 | | Federal Home Loan Mortgage Corporation, Series 3806-CZ | | | 5.50 | % | | | 07/15/2034 | | | | 823,176 | |
685,260 | | Federal Home Loan Mortgage Corporation, Series 3808-DB | | | 3.50 | % | | | 02/15/2031 | | | | 737,889 | |
1,335,057 | | Federal Home Loan Mortgage Corporation, Series 3818-CZ | | | 4.50 | % | | | 03/15/2041 | | | | 1,504,466 | |
742,408 | | Federal Home Loan Mortgage Corporation, Series 3819-ZU | | | 5.50 | % | | | 07/15/2034 | | | | 858,113 | |
2,204,350 | | Federal Home Loan Mortgage Corporation, Series 3824-EY | | | 3.50 | % | | | 03/15/2031 | | | | 2,387,502 | |
251,282 | | Federal Home Loan Mortgage Corporation, Series 3828-SW (-3 x 1 Month LIBOR USD + 13.20%, 13.20% Cap) | | | 12.88 | % (l) | | | 02/15/2041 | | | | 340,677 | |
1,115,168 | | Federal Home Loan Mortgage Corporation, Series 3863-ZA | | | 5.50 | % | | | 08/15/2034 | | | | 1,268,749 | |
5,040,898 | | Federal Home Loan Mortgage Corporation, Series 3889-VZ | | | 4.00 | % | | | 07/15/2041 | | | | 5,429,632 | |
3,047,442 | | Federal Home Loan Mortgage Corporation, Series 3910-GZ | | | 5.00 | % | | | 08/15/2041 | | | | 3,487,368 | |
24,778,245 | | Federal Home Loan Mortgage Corporation, Series 3967-ZP | | | 4.00 | % (m) | | | 09/15/2041 | | | | 27,792,450 | |
2,039,468 | | Federal Home Loan Mortgage Corporation, Series 3972-AZ | | | 3.50 | % | | | 12/15/2041 | | | | 2,216,489 | |
10,084,953 | | Federal Home Loan Mortgage Corporation, Series 4096-DZ | | | 3.50 | % (m) | | | 08/15/2042 | | | | 10,631,977 | |
16,795,110 | | Federal Home Loan Mortgage Corporation, Series 4165-ZT | | | 3.00 | % | | | 02/15/2043 | | | | 17,180,176 | |
3,860,993 | | Federal Home Loan Mortgage Corporation, Series 4291-MS (-1 x 1 Month LIBOR USD + 5.90%, 5.90% Cap) | | | 5.79 | % (i)(l) | | | 01/15/2054 | | | | 705,531 | |
20,211,969 | | Federal Home Loan Mortgage Corporation, Series 4341-AZ | | | 3.00 | % (m) | | | 05/15/2044 | | | | 20,558,960 | |
2,198,783 | | Federal Home Loan Mortgage Corporation, Series 4377-A | | | 3.00 | % | | | 06/15/2039 | | | | 2,205,865 | |
3,038,868 | | Federal Home Loan Mortgage Corporation, Series 4391-MA | | | 3.00 | % | | | 07/15/2040 | | | | 3,083,601 | |
14,465,387 | | Federal Home Loan Mortgage Corporation, Series 4413-AZ | | | 3.50 | % | | | 11/15/2044 | | | | 15,092,731 | |
12,071,743 | | Federal Home Loan Mortgage Corporation, Series 4423-Z | | | 3.50 | % | | | 12/15/2044 | | | | 12,612,697 | |
7,913,819 | | Federal Home Loan Mortgage Corporation, Series 4427-MA | | | 3.00 | % | | | 02/15/2034 | | | | 8,369,486 | |
8,148,102 | | Federal Home Loan Mortgage Corporation, Series 4471-BA | | | 3.00 | % | | | 12/15/2041 | | | | 8,401,363 | |
19,830,759 | | Federal Home Loan Mortgage Corporation, Series 4471-GA | | | 3.00 | % | | | 02/15/2044 | | | | 20,802,458 | |
7,881,119 | | Federal Home Loan Mortgage Corporation, Series 4481-B | | | 3.00 | % | | | 12/15/2042 | | | | 8,077,578 | |
29,627,944 | | Federal Home Loan Mortgage Corporation, Series 4542-AC | | | 2.70 | % | | | 01/15/2045 | | | | 31,194,569 | |
35,180,399 | | Federal Home Loan Mortgage Corporation, Series 4750-PA | | | 3.00 | % | | | 07/15/2046 | | | | 36,408,381 | |
26,833,458 | | Federal Home Loan Mortgage Corporation, Series 4752-PL | | | 3.00 | % | | | 09/15/2046 | | | | 27,973,995 | |
1,955,507 | | Federal Home Loan Mortgage Corporation, Series 4951-EA | | | 2.50 | % | | | 09/15/2044 | | | | 2,037,924 | |
273,305 | | Federal Home Loan Mortgage Corporation, Series R003-ZA | | | 5.50 | % | | | 10/15/2035 | | | | 315,974 | |
50,000,000 | | Federal National Mortgage Association TBA | | | 2.00 | % (q) | | | 05/15/2050 | | | | 49,818,360 | |
50,000,000 | | Federal National Mortgage Association TBA | | | 2.50 | % (q) | | | 05/15/2051 | | | | 51,205,079 | |
83,667 | | Federal National Mortgage Association Pass-Thru, Pool 555743 | | | 5.00 | % | | | 09/01/2033 | | | | 96,499 | |
71,304 | | Federal National Mortgage Association Pass-Thru, Pool 735382 | | | 5.00 | % | | | 04/01/2035 | | | | 82,868 | |
581,618 | | Federal National Mortgage Association Pass-Thru, Pool 735383 | | | 5.00 | % | | | 04/01/2035 | | | | 675,368 | |
288,673 | | Federal National Mortgage Association Pass-Thru, Pool 735402 | | | 5.00 | % | | | 04/01/2035 | | | | 335,295 | |
403,633 | | Federal National Mortgage Association Pass-Thru, Pool 735484 | | | 5.00 | % | | | 05/01/2035 | | | | 468,885 | |
92,118 | | Federal National Mortgage Association Pass-Thru, Pool 931104 | | | 5.00 | % | | | 05/01/2039 | | | | 101,361 | |
490,192 | | Federal National Mortgage Association Pass-Thru, Pool 995203 | | | 5.00 | % | | | 07/01/2035 | | | | 568,437 | |
448,855 | | Federal National Mortgage Association Pass-Thru, Pool AB2123 | | | 4.00 | % | | | 01/01/2031 | | | | 486,083 | |
34,613 | | Federal National Mortgage Association Pass-Thru, Pool AB2370 | | | 4.50 | % | | | 09/01/2035 | | | | 37,077 | |
12,792 | | Federal National Mortgage Association Pass-Thru, Pool AD2177 | | | 4.50 | % | | | 06/01/2030 | | | | 13,943 | |
795,995 | | Federal National Mortgage Association Pass-Thru, Pool AH7309 | | | 4.00 | % | | | 02/01/2031 | | | | 861,586 | |
11,716,446 | | Federal National Mortgage Association Pass-Thru, Pool AS4645 | | | 3.00 | % | | | 03/01/2045 | | | | 12,291,898 | |
8,322,823 | | Federal National Mortgage Association Pass-Thru, Pool BC0785 | | | 3.50 | % | | | 04/01/2046 | | | | 8,983,549 | |
313,939 | | Federal National Mortgage Association Pass-Thru, Pool MA0264 | | | 4.50 | % | | | 12/01/2029 | | | | 344,702 | |
230,328 | | Federal National Mortgage Association Pass-Thru, Pool MA0353 | | | 4.50 | % | | | 03/01/2030 | | | | 252,907 | |
9,425 | | Federal National Mortgage Association Pass-Thru, Pool MA0468 | | | 5.00 | % | | | 07/01/2040 | | | | 10,255 | |
4,741,234 | | Federal National Mortgage Association Pass-Thru, Pool MA2151 | | | 3.50 | % | | | 01/01/2045 | | | | 4,950,880 | |
2,555,161 | | Federal National Mortgage Association Pass-Thru, Pool MA2248 | | | 3.00 | % | | | 04/01/2045 | | | | 2,631,165 | |
13,769,518 | | Federal National Mortgage Association Pool FM6061 | | | 2.00 | % | | | 02/01/2051 | | | | 13,779,334 | |
34,636,931 | | Federal National Mortgage Association Pool MA4237 | | | 2.00 | % | | | 01/01/2051 | | | | 34,606,726 | |
13,467,231 | | Federal National Mortgage Association Pool MA4281 | | | 2.00 | % | | | 03/01/2051 | | | | 13,455,383 | |
7,721,013 | | Federal National Mortgage Association, Pool AL9238 | | | 3.00 | % | | | 10/01/2041 | | | | 8,145,097 | |
1,992,314 | | Federal National Mortgage Association, Pool AL9445 | | | 3.00 | % | | | 07/01/2031 | | | | 2,124,806 | |
15,271,737 | | Federal National Mortgage Association, Pool AS7661 | | | 3.00 | % | | | 08/01/2046 | | | | 15,744,392 | |
5,018,814 | | Federal National Mortgage Association, Pool AS7724 | | | 2.50 | % | | | 08/01/2046 | | | | 5,171,277 | |
16,629,814 | | Federal National Mortgage Association, Pool BC9081 | | | 3.00 | % | | | 12/01/2046 | | | | 17,653,226 | |
12,791,792 | | Federal National Mortgage Association, Pool BD8013 | | | 2.50 | % | | | 09/01/2046 | | | | 13,189,089 | |
4,800,000 | | Federal National Mortgage Association, Pool BL3973 | | | 2.32 | % | | | 10/01/2031 | | | | 4,947,870 | |
3,036,042 | | Federal National Mortgage Association, Pool BL4357 | | | 2.31 | % | | | 10/01/2029 | | | | 3,170,684 | |
12,425,000 | | Federal National Mortgage Association, Pool BL4409 | | | 2.39 | % | | | 10/01/2031 | | | | 12,874,682 | |
15,640,000 | | Federal National Mortgage Association, Pool BL4419 | | | 2.14 | % | | | 10/01/2029 | | | | 16,095,048 | |
39,950,000 | | Federal National Mortgage Association, Pool BL4421 | | | 2.14 | % | | | 10/01/2029 | | | | 41,112,350 | |
25,972,000 | | Federal National Mortgage Association, Pool BL4424 | | | 2.14 | % | | | 10/01/2029 | | | | 26,727,658 | |
28,707,000 | | Federal National Mortgage Association, Pool BL4425 | | | 2.14 | % | | | 10/01/2029 | | | | 29,542,233 | |
32,930,000 | | Federal National Mortgage Association, Pool BL4592 | | | 2.28 | % | | | 11/01/2029 | | | | 34,202,726 | |
49,345,000 | | Federal National Mortgage Association, Pool BL5156 | | | 2.37 | % | | | 12/01/2029 | | | | 51,591,661 | |
18,090,000 | | Federal National Mortgage Association, Pool BL5484 | | | 2.26 | % | | | 01/01/2030 | | | | 18,744,706 | |
4,900,000 | | Federal National Mortgage Association, Pool BL9284 | | | 2.23 | % | | | 12/01/2050 | | | | 4,550,771 | |
3,684,752 | | Federal National Mortgage Association, Pool BM4094 | | | 3.00 | % | | | 03/01/2043 | | | | 3,894,648 | |
21,581,015 | | Federal National Mortgage Association, Pool BM6089 | | | 3.50 | % | | | 12/01/2044 | | | | 23,572,006 | |
11,335,958 | | Federal National Mortgage Association, Pool BN7712 | | | 2.50 | % | | | 08/01/2034 | | | | 11,929,326 | |
14,788,563 | | Federal National Mortgage Association, Pool CA3903 | | | 3.00 | % | | | 07/01/2034 | | | | 15,719,018 | |
11,251,503 | | Federal National Mortgage Association, Pool CA4508 | | | 2.50 | % | | | 11/01/2034 | | | | 11,827,659 | |
108,472,333 | | Federal National Mortgage Association, Pool CA7743 | | | 2.50 | % | | | 11/01/2050 | | | | 112,052,033 | |
19,265,163 | | Federal National Mortgage Association, Pool FM1000 | | | 3.00 | % | | | 04/01/2047 | | | | 20,188,602 | |
5,011,395 | | Federal National Mortgage Association, Pool MA2621 | | | 3.50 | % | | | 05/01/2046 | | | | 5,227,698 | |
8,088,763 | | Federal National Mortgage Association, Pool MA2649 | | | 3.00 | % | | | 06/01/2046 | | | | 8,304,944 | |
3,551,181 | | Federal National Mortgage Association, Pool MA2711 | | | 3.00 | % | | | 08/01/2046 | | | | 3,645,936 | |
18,809,828 | | Federal National Mortgage Association, Pool MA2806 | | | 3.00 | % | | | 11/01/2046 | | | | 19,878,172 | |
73,849,194 | | Federal National Mortgage Association, Pool MA4165 | | | 2.00 | % | | | 10/01/2050 | | | | 73,214,524 | |
195,372 | | Federal National Mortgage Association, Series 2003-W17-1A7 | | | 5.75 | % | | | 08/25/2033 | | | | 223,702 | |
1,415,870 | | Federal National Mortgage Association, Series 2005-20-QH | | | 5.00 | % | | | 03/25/2035 | | | | 1,610,803 | |
262,754 | | Federal National Mortgage Association, Series 2006-101-SA (-1 x 1 Month LIBOR USD + 6.58%, 6.58% Cap) | | | 6.47 | % (i)(l) | | | 10/25/2036 | | | | 50,817 | |
111,122 | | Federal National Mortgage Association, Series 2006-56-SM (-1 x 1 Month LIBOR USD + 6.75%, 6.75% Cap) | | | 6.64 | % (i)(l) | | | 07/25/2036 | | | | 19,570 | |
83,763 | | Federal National Mortgage Association, Series 2007-116-BI (-1 x 1 Month LIBOR USD + 6.25%, 6.25% Cap) | | | 6.14 | % (i)(l) | | | 05/25/2037 | | | | 11,514 | |
1,029,526 | | Federal National Mortgage Association, Series 2007-30-FS (-5 x 1 Month LIBOR USD + 29.83%, 29.83% Cap) | | | 29.32 | % (l) | | | 04/25/2037 | | | | 1,651,263 | |
400,314 | | Federal National Mortgage Association, Series 2007-30-OI (-1 x 1 Month LIBOR USD + 6.44%, 6.44% Cap) | | | 6.33 | % (i)(l) | | | 04/25/2037 | | | | 79,693 | |
67,631 | | Federal National Mortgage Association, Series 2008-29-ZA | | | 4.50 | % | | | 04/25/2038 | | | | 75,031 | |
32,834 | | Federal National Mortgage Association, Series 2008-62-SC (-1 x 1 Month LIBOR USD + 6.00%, 6.00% Cap) | | | 5.89 | % (i)(l) | | | 07/25/2038 | | | | 4,003 | |
327,253 | | Federal National Mortgage Association, Series 2009-111-EZ | | | 5.00 | % | | | 01/25/2040 | | | | 372,465 | |
9,477 | | Federal National Mortgage Association, Series 2009-111-SE (-1 x 1 Month LIBOR USD + 6.25%, 6.25% Cap) | | | 6.14 | % (i)(l) | | | 01/25/2040 | | | | 1,728 | |
45,128 | | Federal National Mortgage Association, Series 2009-16-MZ | | | 5.00 | % | | | 03/25/2029 | | | | 50,240 | |
38,073 | | Federal National Mortgage Association, Series 2009-48-WS (-1 x 1 Month LIBOR USD + 5.95%, 5.95% Cap) | | | 5.84 | % (i)(l) | | | 07/25/2039 | | | | 5,938 | |
131,872 | | Federal National Mortgage Association, Series 2009-62-PS (-1 x 1 Month LIBOR USD + 6.10%, 6.10% Cap) | | | 5.99 | % (i)(l) | | | 08/25/2039 | | | | 15,604 | |
713,838 | | Federal National Mortgage Association, Series 2009-77-ZA | | | 4.50 | % | | | 10/25/2039 | | | | 794,287 | |
184,462 | | Federal National Mortgage Association, Series 2009-83-Z | | | 4.50 | % | | | 10/25/2039 | | | | 202,998 | |
59,688 | | Federal National Mortgage Association, Series 2010-101-ZH | | | 4.50 | % | | | 07/25/2040 | | | | 63,019 | |
202,595 | | Federal National Mortgage Association, Series 2010-112-ZA | | | 4.00 | % | | | 10/25/2040 | | | | 212,483 | |
148,298 | | Federal National Mortgage Association, Series 2010-121-SD (-1 x 1 Month LIBOR USD + 4.50%, 4.50% Cap) | | | 4.39 | % (i)(l) | | | 10/25/2040 | | | | 18,976 | |
29,336 | | Federal National Mortgage Association, Series 2010-137-VS (-3 x 1 Month LIBOR USD + 15.00%, 15.00% Cap) | | | 14.65 | % (l) | | | 12/25/2040 | | | | 40,170 | |
33,467 | | Federal National Mortgage Association, Series 2010-31-SA (-1 x 1 Month LIBOR USD + 5.00%, 5.00% Cap) | | | 4.89 | % (i)(l) | | | 04/25/2040 | | | | 3,159 | |
30,886 | | Federal National Mortgage Association, Series 2010-34-PS (-1 x 1 Month LIBOR USD + 4.93%, 4.93% Cap) | | | 4.82 | % (i)(l) | | | 04/25/2040 | | | | 3,682 | |
130,963 | | Federal National Mortgage Association, Series 2010-35-SP (-1 x 1 Month LIBOR USD + 6.35%, 6.35% Cap) | | | 6.24 | % (i)(l) | | | 04/25/2050 | | | | 20,324 | |
19,441 | | Federal National Mortgage Association, Series 2010-35-SV (-1 x 1 Month LIBOR USD + 6.45%, 6.45% Cap) | | | 6.34 | % (i)(l) | | | 04/25/2040 | | | | 3,122 | |
1,239,331 | | Federal National Mortgage Association, Series 2010-37-MY | | | 4.50 | % | | | 04/25/2040 | | | | 1,317,718 | |
165,713 | | Federal National Mortgage Association, Series 2010-59-SC (-1 x 1 Month LIBOR USD + 5.00%, 5.00% Cap) | | | 4.89 | % (i)(l) | | | 01/25/2040 | | | | 24,767 | |
418,716 | | Federal National Mortgage Association, Series 2010-60-VZ | | | 5.00 | % | | | 10/25/2039 | | | | 474,083 | |
137,840 | | Federal National Mortgage Association, Series 2010-64-EZ | | | 5.00 | % | | | 06/25/2040 | | | | 157,192 | |
138,223 | | Federal National Mortgage Association, Series 2010-7-PE | | | 5.00 | % | | | 02/25/2040 | | | | 156,971 | |
67,867 | | Federal National Mortgage Association, Series 2010-90-GS (-1 x 1 Month LIBOR USD + 6.00%, 6.00% Cap) | | | 5.89 | % (i)(l) | | | 08/25/2040 | | | | 8,339 | |
44,961 | | Federal National Mortgage Association, Series 2010-99-SG (-5 x 1 Month LIBOR USD + 25.00%, 25.00% Cap) | | | 24.42 | % (l) | | | 09/25/2040 | | | | 73,568 | |
2,684,291 | | Federal National Mortgage Association, Series 2011-141-PZ | | | 4.00 | % | | | 01/25/2042 | | | | 2,939,580 | |
627,207 | | Federal National Mortgage Association, Series 2011-25-KY | | | 3.00 | % | | | 04/25/2026 | | | | 655,149 | |
619,290 | | Federal National Mortgage Association, Series 2011-29-AL | | | 3.50 | % | | | 04/25/2031 | | | | 664,523 | |
719,804 | | Federal National Mortgage Association, Series 2011-59-MA | | | 4.50 | % | | | 07/25/2041 | | | | 796,018 | |
27,191,464 | | Federal National Mortgage Association, Series 2013-45-LZ | | | 3.00 | % (m) | | | 05/25/2043 | | | | 29,163,448 | |
33,885,239 | | Federal National Mortgage Association, Series 2013-6-ZB | | | 3.00 | % | | | 02/25/2043 | | | | 33,776,759 | |
1,994,677 | | Federal National Mortgage Association, Series 2014-55-MA | | | 3.00 | % | | | 10/25/2039 | | | | 2,013,150 | |
27,976,257 | | Federal National Mortgage Association, Series 2014-70-VZ | | | 3.00 | % (m) | | | 11/25/2044 | | | | 29,284,970 | |
9,364,688 | | Federal National Mortgage Association, Series 2014-73-CZ | | | 3.00 | % (m) | | | 11/25/2044 | | | | 9,856,604 | |
13,794,103 | | Federal National Mortgage Association, Series 2015-9-HA | | | 3.00 | % | | | 01/25/2045 | | | | 14,782,130 | |
6,188,033 | | Federal National Mortgage Association, Series 2016-55-EA | | | 1.75 | % | | | 07/25/2043 | | | | 6,183,930 | |
5,364,646 | | Federal National Mortgage Association, Series 2017-46-ZL | | | 3.50 | % (m) | | | 06/25/2057 | | | | 5,878,102 | |
2,113,748 | | Federal National Mortgage Association, Series 2017-86-MA | | | 3.00 | % | | | 04/25/2046 | | | | 2,201,029 | |
22,142,082 | | Federal National Mortgage Association, Series 2018-21-IO | | | 3.00 | % (i) | | | 04/25/2048 | | | | 2,315,659 | |
34,836,858 | | Federal National Mortgage Association, Series 2018-21-PO | | | 0.00 | % (j) | | | 04/25/2048 | | | | 30,727,035 | |
24,492,675 | | Federal National Mortgage Association, Series 2018-27-JA | | | 3.00 | % | | | 12/25/2047 | | | | 25,446,077 | |
16,154,220 | | Federal National Mortgage Association, Series 2018-35-IO | | | 3.00 | % (i) | | | 05/25/2048 | | | | 1,512,201 | |
61,971,717 | | Federal National Mortgage Association, Series 2018-35-PO | | | 0.00 | % (j) | | | 05/25/2048 | | | | 55,024,737 | |
25,949,152 | | Federal National Mortgage Association, Series 2018-36-A | | | 3.00 | % | | | 06/25/2048 | | | | 27,019,829 | |
16,869,162 | | Federal National Mortgage Association, Series 2018-39-AB | | | 3.00 | % | | | 06/25/2048 | | | | 17,801,296 | |
5,315,410 | | Federal National Mortgage Association, Series 2019-67-GA | | | 3.00 | % | | | 02/25/2045 | | | | 5,509,953 | |
174,585 | | Federal National Mortgage Association, Series 400-S4 (-1 x 1 Month LIBOR USD + 5.45%, 5.45% Cap) | | | 5.34 | % (i)(l) | | | 11/25/2039 | | | | 36,075 | |
97,941 | | Government National Mortgage Association, Pool 752494 | | | 5.50 | % | | | 09/20/2039 | | | | 108,089 | |
148,578 | | Government National Mortgage Association, Series 2003-67-SP (-1 x 1 Month LIBOR USD + 7.10%, 7.10% Cap) | | | 6.99 | % (i)(l) | | | 08/20/2033 | | | | 25,514 | |
77,356 | | Government National Mortgage Association, Series 2008-82-SM (-1 x 1 Month LIBOR USD + 6.05%, 6.05% Cap) | | | 5.94 | % (i)(l) | | | 09/20/2038 | | | | 9,727 | |
1,012,531 | | Government National Mortgage Association, Series 2009-32-ZE | | | 4.50 | % | | | 05/16/2039 | | | | 1,112,548 | |
1,188,755 | | Government National Mortgage Association, Series 2009-35-DZ | | | 4.50 | % | | | 05/20/2039 | | | | 1,296,066 | |
1,151,477 | | Government National Mortgage Association, Series 2009-75-GZ | | | 4.50 | % | | | 09/20/2039 | | | | 1,255,304 | |
1,462,775 | | Government National Mortgage Association, Series 2009-75-HZ | | | 5.00 | % | | | 09/20/2039 | | | | 1,666,695 | |
3,715,698 | | Government National Mortgage Association, Series 2010-113-SM (-1 x 1 Month LIBOR USD + 6.05%, 6.05% Cap) | | | 5.94 | % (i)(l) | | | 09/20/2040 | | | | 768,111 | |
143,460 | | Government National Mortgage Association, Series 2010-25-ZB | | | 4.50 | % | | | 02/16/2040 | | | | 159,212 | |
2,479,553 | | Government National Mortgage Association, Series 2011-45-GZ | | | 4.50 | % | | | 03/20/2041 | | | | 2,660,580 | |
6,389,383 | | Government National Mortgage Association, Series 2011-71-ZA | | | 4.50 | % | | | 02/20/2041 | | | | 7,120,380 | |
5,725,131 | | Government National Mortgage Association, Series 2013-117-MS (-1 x 1 Month LIBOR USD + 6.15%, 6.15% Cap) | | | 6.04 | % (i)(l) | | | 02/20/2043 | | | | 608,133 | |
3,455,240 | | Government National Mortgage Association, Series 2013-122-SB (-1 x 1 Month LIBOR USD + 6.10%, 6.10% Cap) | | | 5.99 | % (i)(l) | | | 08/16/2043 | | | | 569,345 | |
14,566,527 | | Government National Mortgage Association, Series 2013-169-SE (-1 x 1 Month LIBOR USD + 6.05%, 6.05% Cap) | | | 5.94 | % (i)(l) | | | 11/16/2043 | | | | 2,969,710 | |
5,120,307 | | Government National Mortgage Association, Series 2014-102-TS (-1 x 1 Month LIBOR USD + 5.60%, 5.60% Cap) | | | 5.49 | % (i)(l) | | | 07/20/2044 | | | | 958,307 | |
4,404,604 | | Government National Mortgage Association, Series 2014-118-PS (-1 x 1 Month LIBOR USD + 6.20%, 6.20% Cap) | | | 6.09 | % (i)(l) | | | 08/20/2044 | | | | 796,596 | |
3,854,029 | | Government National Mortgage Association, Series 2014-118-SA (-1 x 1 Month LIBOR USD + 6.20%, 6.20% Cap) | | | 6.09 | % (i)(l) | | | 08/20/2044 | | | | 697,022 | |
| | | | | | | | | | | | | | |
Total US Government and Agency Mortgage Backed Obligations (Cost $1,681,818,645) | | | | | | | | | | | 1,732,035,005 | |
| | | | | | | | | | | | | | |
US Government and Agency Obligations—18.9% | | | | | | | | | | | | |
213,500,000 | | United States Treasury Notes | | | 0.13 | % | | | 06/30/2022 | | | | 213,575,058 | |
14,300,000 | | United States Treasury Notes | | | 0.25 | % | | | 11/15/2023 | | | | 14,294,414 | |
419,000,000 | | United States Treasury Notes | | | 0.25 | % | | | 03/15/2024 | | | | 417,903,397 | |
76,300,000 | | United States Treasury Notes | | | 2.13 | % | | | 09/30/2024 | | | | 80,614,229 | |
94,900,000 | | United States Treasury Notes | | | 2.25 | % | | | 10/31/2024 | | | | 100,712,625 | |
57,400,000 | | United States Treasury Notes | | | 2.75 | % | | | 02/28/2025 | | | | 62,138,863 | |
92,850,000 | | United States Treasury Notes | | | 3.00 | % | | | 09/30/2025 | | | | 101,955,466 | |
15,750,000 | | United States Treasury Notes | | | 0.38 | % | | | 11/30/2025 | | | | 15,408,545 | |
18,300,000 | | United States Treasury Notes | | | 2.63 | % | | | 01/31/2026 | | | | 19,815,111 | |
187,800,000 | | United States Treasury Notes | | | 0.75 | % | | | 03/31/2026 | | | | 186,090,644 | |
58,100,000 | | United States Treasury Notes | | | 1.63 | % | | | 10/31/2026 | | | | 59,798,744 | |
104,500,000 | | United States Treasury Notes | | | 0.50 | % | | | 06/30/2027 | | | | 99,750,557 | |
17,550,000 | | United States Treasury Notes | | | 0.50 | % | | | 10/31/2027 | | | | 16,625,197 | |
198,500,000 | | United States Treasury Notes | | | 1.25 | % | | | 03/31/2028 | | | | 196,313,324 | |
15,300,000 | | United States Treasury Notes | | | 0.88 | % | | | 11/15/2030 | | | | 14,152,500 | |
58,400,000 | | United States Treasury Notes | | | 1.13 | % | | | 02/15/2031 | | | | 55,183,438 | |
59,600,000 | | United States Treasury Notes | | | 4.75 | % | | | 02/15/2037 | | | | 81,537,922 | |
134,500,000 | | United States Treasury Notes | | | 1.88 | % | | | 02/15/2041 | | | | 125,274,141 | |
8,600,000 | | United States Treasury Notes | | | 2.75 | % | | | 11/15/2042 | | | | 9,220,141 | |
65,600,000 | | United States Treasury Notes | | | 2.75 | % | | | 11/15/2047 | | | | 70,165,093 | |
137,900,000 | | United States Treasury Notes | | | 1.25 | % | | | 05/15/2050 | | | | 104,109,114 | |
125,200,000 | | United States Treasury Notes | | | 1.88 | % | | | 02/15/2051 | | | | 111,134,564 | |
| | | | | | | | | | | | | | |
Total US Government and Agency Obligations (Cost $2,179,701,904) | | | | | | | | | | | 2,155,773,087 | |
| | | | | | | | | | | | | | |
Affiliated Mutual Funds—10.0% | | | | | | | | | | | | |
60,545,035 | | DoubleLine Global Bond Fund (Class I) | | | | | | | | | | | 618,164,812 | |
45,674,545 | | DoubleLine Infrastructure Income Fund (Class I) | | | | | | | | | | | 477,755,738 | |
5,000,000 | | DoubleLine Long Duration Total Return Bond Fund (Class I) | | | | | | | | | | | 46,850,000 | |
| | | | | | | | | | | | | | |
Total Affiliated Mutual Funds (Cost $1,122,958,174) | | | | | | | | | | | 1,142,770,550 | |
| | | | | | | | | | | | | | |
Common Stocks—0.0% | | | | | | | | | | | | |
72,582 | | Foresight Equity (e) (n) | | | | | | | | | | | 1,285,421 | |
135,690 | | Frontera Energy Corporation (n) | | | | | | | | | | | 692,019 | |
39,969 | | McDermott International Ltd. (n) | | | | | | | | | | | 31,975 | |
8,387 | | Oasis Petroleum, Inc. | | | | | | | | | | | 498,104 | |
24,339 | | Tapstone Energy Holdings III LLC (e) (n) | | | | | | | | | | | 55,980 | |
18,590 | | Whiting Petroleum Corporation (n) | | | | | | | | | | | 659,015 | |
| | | | | | | | | | | | | | |
Total Common Stocks (Cost $13,542,122) | | | | | | | | | | | 3,222,514 | |
| | | | | | | | | | | | | | |
Warrants—0.0% | | | | | | | | | | | | | | |
995,158 | | OAS S.A., Expiration 5/16/2039, Strike Price BRL 1.00 (e)(n) | | | | | | | | | | | — | |
| | | | | | | | | | | | | | |
Total Warrants (Cost $–) | | | | | | | | | | | — | |
Repurchase Agreements—0.3% | | | | | | | | | | | | |
31,500,000 | | Credit Suisse Freedom Mortgage (1 Month LIBOR USD + 2.75%, 0.5% LIBOR Floor) (Collateralized by Residential Mortgage Backed Obligations, Value $142,304,513) | | | 3.25 | % (e) | | | 03/01/2023 | | | | 31,500,000 | |
| | | | | | | | | | | | | | |
Total Repurchase Agreements (Cost $31,500,987) | | | | | | | | | | | 31,500,000 | |
| | | | | | | | | | | | | | |
Short Term Investments—4.0% | | | | | | | | | | | | |
92,292,643 | | First American Government Obligations Fund—Class U | | | 0.04 | % (o) | | | | | | | 92,292,643 | |
92,292,643 | | JP Morgan U.S. Government Money Market Fund—Institutional Share Class | | | 0.04 | % (o) | | | | | | | 92,292,643 | |
92,292,643 | | Morgan Stanley Institutional Liquidity Funds Government Portfolio—Institutional Share Class | | | 0.03 | % (o) | | | | | | | 92,292,643 | |
176,450,000 | | United States Treasury Bills | | | 0.00 | % | | | 05/06/2021 | | | | 176,448,713 | |
| | | | | | | | | | | | | | |
Total Short Term Investments (Cost $453,323,500) | | | | | | | | | | | 453,326,642 | |
| | | | | | | | | | | | | | |
Total Investments—101.0% (Cost $11,462,451,113) | | | | | | | | | | | 11,531,092,290 | |
Liabilities in Excess of Other Assets—(1.0)% | | | | | | | | | | | (109,629,467 | ) |
| | | | | | | | | | | | | | |
NET ASSETS—100.0% | | | | | | | | | | $ | 11,421,462,823 | |
| | | | | | | | | | | | | | |
| | | | | | | | | | | | | | |
A summary of the DoubleLine Core Fixed Income Fund’s investments in affiliated mutual funds for the year ended March 31, 2021 is as follows:
| | | | | | | | | | | | | | |
Principal Amount $/Shares | | Security Description | | Rate | | | Maturity | | | Value $ | |
Asset Backed Obligations - 6.2% | | | | | | | | | |
2,954,057 | | AASET Ltd., Series 2018-1A-A | | | 3.84 | % (a) | | | 01/16/2038 | | | | 2,817,186 | |
9,645,232 | | AASET Ltd., Series 2019-2-A | | | 3.38 | % (a) | | | 10/16/2039 | | | | 9,671,534 | |
19,650,000 | | Affirm Asset Securitization Trust, Series 2020-A-A | | | 2.10 | % (a) | | | 02/18/2025 | | | | 19,869,481 | |
19,375,223 | | Affirm Asset Securitization Trust, Series 2020-Z2-A | | | 1.90 | % (a) | | | 01/15/2025 | | | | 19,584,631 | |
1,000,000 | | Affirm Asset Securitization Trust, Series 2021-A-B | | | 1.06 | % (a) | | | 08/15/2025 | | | | 1,001,974 | |
7,881,215 | | Arivo Acceptance Auto Loan Receivables Trust, Series 2021-1A-A | | | 1.19 | % (a) | | | 01/15/2027 | | | | 7,915,347 | |
1,120,192 | | Avant Loans Funding Trust, Series 2019-B-A | | | 2.72 | % (a) | | | 10/15/2026 | | | | 1,122,081 | |
5,750,000 | | Business Jet Securities LLC, Series 2021-1A-A | | | 2.16 | % (a) | | | 04/15/2036 | | | | 5,726,402 | |
11,609,688 | | CAL Funding IV Ltd., Series 2020-1A-A | | | 2.22 | % (a) | | | 09/25/2045 | | | | 11,660,320 | |
3,964,102 | | Castlelake Aircraft Structured Trust, Series 2019-1A-A | | | 3.97 | % (a) | | | 04/15/2039 | | | | 3,990,174 | |
4,900,131 | | CLI Funding LLC, Series 2019-1A-A | | | 3.71 | % (a) | | | 05/18/2044 | | | | 4,928,332 | |
2,250,000 | | College Ave Student Loans LLC, Series 2017-A-B | | | 4.50 | % (a) | | | 11/26/2046 | | | | 2,372,231 | |
8,506,220 | | Credit Suisse ABS Trust, Series 2020-AT1-A | | | 2.61 | % (a) | | | 10/15/2026 | | | | 8,686,126 | |
1,494,236 | | DRB Prime Student Loan Trust, Series 2017-A-B | | | 3.10 | % (a)(b) | | | 05/27/2042 | | | | 1,528,983 | |
1,437,046 | | Earnest Student Loan Program, Series 2017-A-A2 | | | 2.65 | % (a) | | | 01/25/2041 | | | | 1,447,425 | |
5,000,000 | | Exeter Automobile Receivables Trust, Series 2021-1A-D | | | 1.08 | % | | | 11/16/2026 | | | | 4,961,768 | |
10,000,000 | | Exeter Automobile Receivables Trust, Series 2021-1A-E | | | 2.21 | % (a) | | | 02/15/2028 | | | | 9,885,305 | |
2,490,000 | | ExteNet Issuer LLC, Series 2019-1A-A2 | | | 3.20 | % (a) | | | 07/26/2049 | | | | 2,572,067 | |
4,703,010 | | Foundation Finance Trust, Series 2019-1A-A | | | 3.86 | % (a) | | | 11/15/2034 | | | | 4,869,267 | |
7,026,762 | | GAIA Aviation Ltd., Series 2019-1-A | | | 3.97 | % (a)(c) | | | 12/15/2044 | | | | 7,011,015 | |
4,739,336 | | Global SC Finance SRL, Series 2020-1A-A | | | 2.17 | % (a) | | | 10/17/2040 | | | | 4,758,297 | |
1,119,999 | | GLS Auto Receivables Issuer Trust, Series 2019-2A-A | | | 3.06 | % (a) | | | 04/17/2023 | | | | 1,123,969 | |
5,837,517 | | GLS Auto Receivables Issuer Trust, Series 2020-2A-A | | | 1.58 | % (a) | | | 08/15/2024 | | | | 5,887,634 | |
4,775,625 | | Helios Issuer LLC, Series 2017-1A-A | | | 4.94 | % (a) | | | 09/20/2049 | | | | 5,072,148 | |
1,601,807 | | HERO Funding Trust, Series 2016-1A-A | | | 4.05 | % (a) | | | 09/20/2041 | | | | 1,678,094 | |
4,366,563 | | Horizon Aircraft Finance Ltd., Series 2018-1-A | | | 4.46 | % (a) | | | 12/15/2038 | | | | 4,440,472 | |
20,023,106 | | Horizon Aircraft Finance Ltd., Series 2019-2-A | | | 3.43 | % (a) | | | 11/15/2039 | | | | 19,486,727 | |
18,383,250 | | Jimmy Johns Funding LLC, Series 2017-1A-A2II | | | 4.85 | % (a) | | | 07/30/2047 | | | | 19,520,673 | |
515,396 | | Laurel Road Prime Student Loan Trust, Series 2017-B-CFX | | | 3.61 | % (a) | | | 08/25/2042 | | | | 526,085 | |
9,553,247 | | LendingClub Receivables Trust, Series 2020-3-A | | | 3.50 | % (a) | | | 01/16/2046 | | | | 9,692,151 | |
7,987,773 | | LendingClub Receivables Trust, Series 2020-5A-A | | | 3.50 | % (a) | | | 03/15/2046 | | | | 8,054,233 | |
9,876,138 | | Loanpal Solar Loan Ltd., Series 2020-3GS-A | | | 2.47 | % (a) | | | 12/20/2047 | | | | 9,938,011 | |
6,373,471 | | Loanpal Solar Loan Ltd., Series 2021-1GS-A | | | 2.29 | % (a) | | | 01/20/2048 | | | | 6,392,824 | |
4,978,619 | | Lunar Aircraft Ltd., Series 2020-1A-A | | | 3.38 | % (a) | | | 02/15/2045 | | | | 4,895,944 | |
116,430 | | Marlette Funding Trust, Series 2018-4A-A | | | 3.71 | % (a) | | | 12/15/2028 | | | | 116,569 | |
1,245,734 | | Marlette Funding Trust, Series 2019-3A-A | | | 2.69 | % (a) | | | 09/17/2029 | | | | 1,253,968 | |
1,245,782 | | Mosaic Solar Loan Trust, Series 2017-1A-A | | | 4.45 | % (a) | | | 06/20/2042 | | | | 1,360,604 | |
9,384,106 | | Mosaic Solar Loan Trust, Series 2020-2A-B | | | 2.21 | % (a) | | | 08/20/2046 | | | | 9,374,275 | |
4,500,000 | | Navient Private Education Loan Trust, Series 2018-A-B | | | 3.68 | % (a) | | | 02/18/2042 | | | | 4,587,800 | |
16,000,000 | | Oxford Finance Funding LLC, Series 2020-1A-A2 | | | 3.10 | % (a) | | | 02/15/2028 | | | | 16,544,496 | |
3,869,569 | | Pagaya AI Debt Selection Trust, Series 2019-2-A1 | | | 3.93 | % (a) | | | 09/15/2026 | | | | 3,890,077 | |
6,696,168 | | Pagaya AI Debt Selection Trust, Series 2019-3-A | | | 3.82 | % (a) | | | 11/16/2026 | | | | 6,798,681 | |
12,309,447 | | Pagaya AI Debt Selection Trust, Series 2020-3-A | | | 2.10 | % (a) | | | 05/17/2027 | | | | 12,397,754 | |
6,220,000 | | Pagaya AI Debt Selection Trust, Series 2021-1-A | | | 1.18 | % (a) | | | 11/15/2027 | | | | 6,242,516 | |
7,000,000 | | Santander Drive Auto Receivables Trust, Series 2020-4-D | | | 1.48 | % | | | 01/15/2027 | | | | 7,049,748 | |
19,977,960 | | Sapphire Aviation Finance Ltd., Series 2020-1A-A | | | 3.23 | % (a) | | | 03/15/2040 | | | | 19,903,402 | |
20,000,000 | | SBA Tower Trust | | | 3.17 | % (a) | | | 04/11/2022 | | | | 20,053,560 | |
1,257,772 | | Sierra Timeshare Receivables Funding LLC, Series 2016-3A-A | | | 2.43 | % (a) | | | 10/20/2033 | | | | 1,267,281 | |
28,414,728 | | SoFi Alternative Trust, Series 2021-A-PT1 | | | 1.48 | % (a)(b) | | | 03/15/2047 | | | | 28,275,979 | |
17,000,000 | | SoFi Alternative Trust, Series 2021-B-PT1 | | | 1.76 | % (a)(b) | | | 02/15/2047 | | | | 17,116,297 | |
199,629 | | SoFi Consumer Loan Program LLC, Series 2016-1-A | | | 3.26 | % (a) | | | 08/25/2025 | | | | 200,007 | |
73,166 | | SoFi Consumer Loan Program Trust, Series 2017-5-A2 | | | 2.78 | % (a) | | | 09/25/2026 | | | | 73,561 | |
501,919 | | SoFi Consumer Loan Program Trust, Series 2019-1-A | | | 3.24 | % (a) | | | 02/25/2028 | | | | 504,004 | |
6,471,947 | | SoFi Consumer Loan Program Trust, Series 2019-F-PT1 | | | 3.93 | % (a)(b) | | | 02/15/2045 | | | | 6,633,306 | |
1,738,558 | | SoFi Professional Loan Program, Series 2017-A-A2B | | | 2.40 | % (a) | | | 03/26/2040 | | | | 1,760,536 | |
8,847,640 | | Springleaf Funding Trust, Series 2017-AA-A | | | 2.68 | % (a) | | | 07/15/2030 | | | | 8,873,696 | |
87,328 | | Spruce Asset Backed Securities Trust, Series 2016-E1-A | | | 4.32 | % (a) | | | 06/15/2028 | | | | 88,243 | |
1,696,628 | | START Ireland, Series 2019-1-A | | | 4.09 | % (a) | | | 03/15/2044 | | | | 1,689,294 | |
3,493,394 | | Start Ltd., Series 2018-1-A | | | 4.09 | % (a) | | | 05/15/2043 | | | | 3,509,606 | |
7,820,000 | | Taco Bell Funding LLC, Series 2018-1A-A2I | | | 4.32 | % (a) | | | 11/25/2048 | | | | 7,891,308 | |
6,111,375 | | TAL Advantage VII LLC, Series 2020-1A-A | | | 2.05 | % (a) | | | 09/20/2045 | | | | 6,113,335 | |
3,200,000 | | Tesla Auto Lease Trust, Series 2019-A-D | | | 3.37 | % (a) | | | 01/20/2023 | | | | 3,321,872 | |
12,622,649 | | Thunderbolt Aircraft Lease Ltd., Series 2018-A-A | | | 4.15 | % (a)(c) | | | 09/15/2038 | | | | 12,682,720 | |
1,339,286 | | Thunderbolt Aircraft Lease Ltd., Series 2018-A-B | | | 5.07 | % (a)(c) | | | 09/15/2038 | | | | 1,303,978 | |
7,403,125 | | TIF Funding LLC, Series 2021-1A-A | | | 1.65 | % (a) | | | 02/20/2046 | | | | 7,152,397 | |
12,500,000 | | Upgrade Master Pass-Thru Trust, Series 2021-PT3-A | | | 5.72 | % (a) | | | 06/15/2027 | | | | 12,576,738 | |
2,851,116 | | Upgrade Receivables Trust, Series 2019-1A-C | | | 5.15 | % (a) | | | 03/15/2025 | | | | 2,866,843 | |
9,788,768 | | Upstart Pass-Through Trust Series, Series 2020-ST2-A | | | 3.50 | % (a) | | | 03/20/2028 | | | | 9,980,422 | |
5,000,000 | | Upstart Pass-Through Trust Series, Series 2021-ST3-A | | | 2.00 | % (a) | | | 05/20/2027 | | | | 5,008,240 | |
7,363,441 | | Upstart Pass-Through Trust, Series 2020-ST5-A | | | 3.00 | % (a) | | | 12/20/2026 | | | | 7,399,964 | |
12,855,580 | | Upstart Pass-Through Trust, Series 2020-ST6-A | | | 3.00 | % (a) | | | 01/20/2027 | | | | 13,043,089 | |
164,071 | | Upstart Securitization Trust, Series 2019-1-B | | | 4.19 | % (a) | | | 04/20/2026 | | | | 164,319 | |
5,250,000 | | Upstart Securitization Trust, Series 2020-1-B | | | 3.09 | % (a) | | | 04/22/2030 | | | | 5,368,544 | |
2,750,000 | | Upstart Securitization Trust, Series 2020-3-B | | | 3.01 | % (a) | | | 11/20/2030 | | | | 2,820,485 | |
3,866,640 | | Upstart Securitization Trust, Series 2021-1-A | | | 0.87 | % (a) | | | 03/20/2031 | | | | 3,871,101 | |
1,900,000 | | Upstart Securitization Trust, Series 2021-1-B | | | 1.89 | % (a) | | | 03/20/2031 | | | | 1,900,194 | |
7,873,333 | | Vantage Data Centers Issuer LLC, Series 2019-1A-A2 | | | 3.19 | % (a) | | | 07/15/2044 | | | | 8,211,299 | |
16,606,547 | | Wave LLC, Series 2019-1-A | | | 3.60 | % (a) | | | 09/15/2044 | | | | 16,690,211 | |
7,018,153 | | Willis Engine Structured Trust, Series 2020-A-A | | | 3.23 | % (a) | | | 03/15/2045 | | | | 6,755,499 | |
| | | | | | | | | | | | | | |
Total Asset Backed Obligations (Cost $543,902,299) | | | | | | | | 547,776,729 | |
| | | | | | | | | | | | | | |
Bank Loans - 5.2% | | | | | | | | | | | | | | |
13,802,777 | | 1011778 B.C. Unlimited Liability Company, Senior Secured First Lien Term Loan (1 Month LIBOR USD + 1.75%) | | | 1.86 | % | | | 11/19/2026 | | | | 13,574,203 | |
1,503,304 | | Access CIG LLC, Senior Secured First Lien Term Loan (1 Month LIBOR USD + 3.75%) | | | 3.87 | % | | | 02/27/2025 | | | | 1,493,367 | |
986,270 | | Agiliti Health, Inc., Senior Secured First Lien Term Loan (1 Month LIBOR USD + 2.75%) | | | 2.88 | % | | | 01/05/2026 | | | | 972,709 | |
1,136,266 | | Air Methods Corporation, Senior Secured First Lien Term Loan (3 Month LIBOR USD + 3.50%, 1.00% Floor) | | | 4.50 | % | | | 04/22/2024 | | | | 1,102,536 | |
1,824,710 | | Alera Group Intermediate Holdings, Inc., Senior Secured First Lien Term Loan (1 Month LIBOR USD + 4.00%, 0.50% Floor) | | | 4.50 | % | | | 08/01/2025 | | | | 1,826,991 | |
374,063 | | Alliance Laundry Systems LLC, Senior Secured First Lien Term Loan (3 Month LIBOR USD + 3.50%, 0.75% Floor) | | | 4.25 | % | | | 10/08/2027 | | | | 374,003 | |
1,789,578 | | Alliant Holdings Intermediate LLC, Senior Secured First Lien Term Loan (1 Month LIBOR USD + 3.25%) | | | 3.36 | % | | | 05/09/2025 | | | | 1,769,240 | |
1,347,938 | | Allied Universal Holdco LLC, Senior Secured First Lien Term Loan (1 Month LIBOR USD + 4.25%) | | | 4.36 | % | | | 07/10/2026 | | | | 1,345,835 | |
923,605 | | Almonde, Inc., Senior Secured First Lien Term Loan (6 Month LIBOR USD + 3.50%, 1.00% Floor) | | | 4.50 | % | | | 06/13/2024 | | | | 906,509 | |
315,000 | | Almonde, Inc., Senior Secured Second Lien Term Loan (6 Month LIBOR USD + 7.25%, 1.00% Floor) | | | 8.25 | % | | | 06/16/2025 | | | | 317,402 | |
1,681,832 | | Alterra Mountain Company, Senior Secured First Lien Term Loan (1 Month LIBOR USD + 2.75%) | | | 2.86 | % | | | 07/31/2024 | | | | 1,656,613 | |
342,413 | | Amentum Government Services Holdings LLC, Senior Secured First Lien Term Loan (1 Month LIBOR USD + 3.50%) | | | 3.61 | % | | | 02/01/2027 | | | | 340,416 | |
346,500 | | American Airlines, Inc., Senior Secured First Lien Term Loan (1 Month LIBOR USD + 1.75%) | | | 1.86 | % | | | 01/29/2027 | | | | 317,165 | |
244,948 | | American Airlines, Inc., Senior Secured First Lien Term Loan (1 Month LIBOR USD + 2.00%) | | | 2.11 | % | | | 04/28/2023 | | | | 234,194 | |
320,943 | | American Airlines, Inc., Senior Secured First Lien Term Loan (1 Month LIBOR USD + 2.00%) | | | 2.11 | % | | | 12/15/2023 | | | | 307,526 | |
334,163 | | American Residential Services LLC, Senior Secured First Lien Term Loan (3 Month LIBOR USD + 3.50%, 0.75% Floor) | | | 4.25 | % | | | 10/15/2027 | | | | 333,745 | |
| | American Tire Distributors, Inc., Senior Secured First Lien Term Loan | | | | | | | | | | | | |
773,072 | | (1 Month LIBOR USD + 7.50%, 1.00% Floor) (1 Month LIBOR USD + 5.50% + 1.50% PIK) | | | 8.50 | % | | | 09/02/2024 | | | | 757,611 | |
88,770 | | (3 Month LIBOR USD + 7.50%, 1.00% Floor) (3 Month LIBOR USD + 5.50% + 1.50% PIK) | | | 8.50 | % | | | 09/02/2024 | | | | 86,994 | |
| | Applied Systems, Inc., Senior Secured First Lien Term Loan | | | | | | | | | | | | |
22,839 | | (Prime Rate + 2.00%, 0.50% Floor) | | | 5.25 | % | | | 09/19/2024 | | | | 22,783 | |
1,644,242 | | (3 Month LIBOR USD + 3.00%, 0.50% Floor) | | | 3.50 | % | | | 09/19/2024 | | | | 1,640,238 | |
1,725,000 | | Aramark Services, Inc., Senior Secured First Lien Term Loan (1 Month LIBOR USD + 1.75%) | | | 1.86 | % | | | 03/11/2025 | | | | 1,710,182 | |
737,550 | | Aramark Services, Inc., Senior Secured First Lien Term Loan (1 Month LIBOR USD + 1.75%) | | | 1.86 | % | | | 01/15/2027 | | | | 728,102 | |
1,526,175 | | Arches Buyer, Inc., Senior Secured First Lien Term Loan (1 Month LIBOR USD + 3.25%, 0.50% Floor) | | | 3.75 | % | | | 12/06/2027 | | | | 1,518,163 | |
539,033 | | Arctic Glacier U.S.A., Inc., Senior Secured First Lien Term Loan (3 Month LIBOR USD + 3.50%, 1.00% Floor) | | | 4.50 | % | | | 03/20/2024 | | | | 510,960 | |
1,766,272 | | Ascend Learning LLC, Senior Secured First Lien Term Loan (1 Month LIBOR USD + 3.00%, 1.00% Floor) | | | 4.00 | % | | | 07/12/2024 | | | | 1,761,857 | |
9,765,638 | | Asplundh Tree Expert LLC, Senior Secured First Lien Term Loan (1 Month LIBOR USD + 1.75%) | | | 1.86 | % | | | 09/07/2027 | | | | 9,749,622 | |
1,692,857 | | AssuredPartners, Inc., Senior Secured First Lien Term Loan (1 Month LIBOR USD + 3.50%) | | | 3.61 | % | | | 02/12/2027 | | | | 1,675,929 | |
532,066 | | Asurion LLC, Senior Secured First Lien Term Loan (1 Month LIBOR USD + 3.00%) | | | 3.11 | % | | | 11/03/2023 | | | | 531,015 | |
892,763 | | Asurion LLC, Senior Secured First Lien Term Loan (1 Month LIBOR USD + 3.25%) | | | 3.36 | % | | | 12/23/2026 | | | | 888,223 | |
794,565 | | Athenahealth, Inc., Senior Secured First Lien Term Loan (3 Month LIBOR USD + 4.25%) | | | 4.45 | % | | | 02/11/2026 | | | | 797,545 | |
600,124 | | Avantor Funding, Inc., Senior Secured First Lien Term Loan (1 Month LIBOR USD + 2.25%, 1.00% Floor) | | | 3.25 | % | | | 11/21/2024 | | | | 601,249 | |
4,309,200 | | Avantor Funding, Inc., Senior Secured First Lien Term Loan (1 Month LIBOR USD + 2.25%, 1.00% Floor) | | | 3.25 | % | | | 11/08/2027 | | | | 4,316,202 | |
665,690 | | Avaya, Inc., Senior Secured First Lien Term Loan (1 Month LIBOR USD + 4.25%) | | | 4.36 | % | | | 12/15/2027 | | | | 667,095 | |
4,490,212 | | Axalta Coating Systems Dutch Holding B B.V., Senior Secured First Lien Term Loan (3 Month LIBOR USD + 1.75%) | | | 1.95 | % | | | 05/31/2024 | | | | 4,475,551 | |
787,979 | | Azalea TopCo, Inc., Senior Secured First Lien Term Loan (3 Month LIBOR USD + 3.50%) | | | 3.71 | % | | | 07/24/2026 | | | | 782,069 | |
310,000 | | B&G Foods, Inc., Senior Secured First Lien Term Loan (1 Month LIBOR USD + 2.50%) | | | 2.61 | % | | | 10/10/2026 | | | | 310,039 | |
1,136,250 | | Bausch Health Companies, Inc., Senior Secured First Lien Term Loan (1 Month LIBOR USD + 2.75%) | | | 2.86 | % | | | 11/27/2025 | | | | 1,131,353 | |
335,928 | | Bausch Health Companies, Inc. Senior Secured First Lien Term Loan (1 Month LIBOR USD + 3.00%) | | | 3.11 | % | | | 06/02/2025 | | | | 335,260 | |
7,423,508 | | Berry Global, Inc., Senior Secured First Lien Term Loan (1 Month LIBOR USD + 1.75%) | | | 1.90 | % | | | 07/01/2026 | | | | 7,374,772 | |
1,861,438 | | BioScrip, Inc., Senior Secured First Lien Term Loan (1 Month LIBOR USD + 3.75%) | | | 3.86 | % | | | 08/06/2026 | | | | 1,856,495 | |
2,304,212 | | Blackhawk Network Holdings, Inc., Senior Secured First Lien Term Loan (1 Month LIBOR USD + 3.00%) | | | 3.11 | % | | | 06/16/2025 | | | | 2,276,020 | |
1,732,705 | | Blackstone CQP Holdco LP, Senior Secured First Lien Term Loan (3 Month LIBOR USD + 3.50%) | | | 3.69 | % | | | 09/30/2024 | | | | 1,731,224 | |
1,066,076 | | Boxer Parent Company, Inc., Senior Secured First Lien Term Loan (1 Month LIBOR USD + 3.75%) | | | 3.86 | % | | | 10/02/2025 | | | | 1,062,867 | |
2,038,289 | | Brand Industrial Services, Inc., Senior Secured First Lien Term Loan (3 Month LIBOR USD + 4.25%, 1.00% Floor) | | | 5.25 | % | | | 06/21/2024 | | | | 2,011,037 | |
1,096,398 | | Bright Bidco B.V., Senior Secured First Lien Term Loan (6 Month LIBOR USD + 3.50%, 1.00% Floor) | | | 4.50 | % | | | 06/28/2024 | | | | 841,486 | |
1,059,320 | | Buckeye Partners LP, Senior Secured First Lien Term Loan (1 Month LIBOR USD + 2.25%) | | | 2.36 | % | | | 11/02/2026 | | | | 1,055,898 | |
798,963 | | BY Crown Parent LLC, Senior Secured First Lien Term Loan (1 Month LIBOR USD + 3.00%, 1.00% Floor) | | | 4.00 | % | | | 02/02/2026 | | | | 800,836 | |
588,525 | | Cablevision Lightpath LLC, Senior Secured First Lien Term Loan (1 Month LIBOR USD + 3.25%, 0.50% Floor) | | | 3.75 | % | | | 11/30/2027 | | | | 588,463 | |
686,550 | | Caesars Resort Collection LLC, Senior Secured First Lien Term Loan (1 Month LIBOR USD + 4.50%) | | | 4.61 | % | | | 07/21/2025 | | | | 688,812 | |
2,963,721 | | Calpine Corporation, Senior Secured First Lien Term Loan (1 Month LIBOR USD + 2.00%) | | | 2.11 | % | | | 04/06/2026 | | | | 2,935,433 | |
157,600 | | Calpine Corporation, Senior Secured First Lien Term Loan (1 Month LIBOR USD + 2.00%) | | | 2.11 | % | | | 08/12/2026 | | | | 156,052 | |
5,862,263 | | Calpine Corporation, Senior Secured First Lien Term Loan (1 Month LIBOR USD + 2.50%) | | | 2.61 | % | | | 12/16/2027 | | | | 5,833,743 | |
611,292 | | Cambium Learning Group, Inc., Senior Secured First Lien Term Loan (3 Month LIBOR USD + 4.50%) | | | 5.25 | % | | | 12/18/2025 | | | | 612,784 | |
1,660,562 | | Camelot U.S. Acquisition 1 Company, Senior Secured First Lien Term Loan (1 Month LIBOR USD + 3.00%) | | | 3.11 | % | | | 10/30/2026 | | | | 1,649,404 | |
164,588 | | Camelot U.S. Acquisition 1 Company, Senior Secured First Lien Term Loan (1 Month LIBOR USD + 3.00%, 1.00% Floor) | | | 4.00 | % | | | 10/30/2026 | | | | 164,711 | |
436,700 | | Carnival Corporation, Senior Secured First Lien Term Loan (1 Month LIBOR USD + 7.50%, 1.00% Floor) | | | 8.50 | % | | | 06/30/2025 | | | | 451,829 | |
1,848,351 | | Castle US Holding Corporation, Senior Secured First Lien Term Loan (3 Month LIBOR USD + 3.75%) | | | 3.95 | % | | | 01/29/2027 | | | | 1,828,712 | |
2,586,461 | | Catalent Pharma Solutions, Inc., Senior Secured First Lien Term Loan (1 Month LIBOR USD + 2.00%, 0.50% Floor) | | | 2.50 | % | | | 02/22/2028 | | | | 2,594,000 | |
1,153,462 | | Cengage Learning, Inc., Senior Secured First Lien Term Loan (6 Month LIBOR USD + 4.25%, 1.00% Floor) | | | 5.25 | % | | | 06/07/2023 | | | | 1,143,612 | |
10,758,570 | | Charter Communications Operating LLC Senior Secured First Lien Term Loan (1 Month LIBOR USD + 1.75%) | | | 1.87 | % | | | 02/01/2027 | | | | 10,720,269 | |
930,000 | | Charter NEX US, Inc., Senior Secured First Lien Term Loan (1 Month LIBOR USD + 4.25%, 0.75% Floor) | | | 5.00 | % | | | 12/01/2027 | | | | 933,074 | |
823,062 | | CHG Healthcare Services, Inc., Senior Secured First Lien Term Loan (6 Month LIBOR USD + 3.00%, 1.00% Floor) | | | 4.00 | % | | | 06/07/2023 | | | | 821,519 | |
1,686,160 | | CHG PPC Parent LLC, Senior Secured First Lien Term Loan (1 Month LIBOR USD + 2.75%) | | | 2.86 | % | | | 03/31/2025 | | | | 1,665,083 | |
728,871 | | Cincinnati Bell, Inc., Senior Secured First Lien Term Loan (1 Month LIBOR USD + 3.25%, 1.00% Floor) | | | 4.25 | % | | | 10/02/2024 | | | | 729,407 | |
1,865,804 | | Clarios Global LP, Senior Secured First Lien Term Loan (1 Month LIBOR USD + 3.25%) | | | 3.36 | % | | | 04/30/2026 | | | | 1,849,478 | |
991,766 | | Clear Channel Outdoor Holdings, Inc., Senior Secured First Lien Term Loan (1 Month LIBOR USD + 3.50%) | | | 3.71 | % | | | 08/21/2026 | | | | 955,541 | |
2,132,296 | | ClubCorp Holdings, Inc., Senior Secured First Lien Term Loan (3 Month LIBOR USD + 2.75%) | | | 2.95 | % | | | 09/18/2024 | | | | 2,010,019 | |
665,000 | | CNT Holdings I Corporation, Senior Secured First Lien Term Loan (6 Month LIBOR USD + 3.75%, 0.75% Floor) | | | 4.50 | % | | | 11/08/2027 | | | | 664,481 | |
443,888 | | CommerceHub, Inc., Senior Secured First Lien Term Loan (1 Month LIBOR USD + 4.00%, 0.75% Floor) | | | 4.75 | % | | | 12/29/2027 | | | | 444,860 | |
1,369,128 | | Compass Power Generation LLC, Senior Secured First Lien Term Loan (1 Month LIBOR USD + 3.50%, 1.00% Floor) | | | 4.50 | % | | | 12/20/2024 | | | | 1,362,625 | |
440,550 | | Connect U.S. Finco LLC, Senior Secured First Lien Term Loan (1 Month LIBOR USD + 3.50%, 1.00% Floor) | | | 4.50 | % | | | 12/11/2026 | | | | 439,678 | |
686,550 | | Conservice Midco LLC, Senior Secured First Lien Term Loan (3 Month LIBOR USD + 4.25%) | | | 4.45 | % | | | 05/13/2027 | | | | 687,065 | |
196,351 | | Consolidated Communications, Inc., Senior Secured First Lien Term Loan (1 Month LIBOR USD + 4.75%, 1.00% Floor) | | | 5.75 | % | | | 10/04/2027 | | | | 196,873 | |
1,280,785 | | Cornerstone OnDemand, Inc., Senior Secured First Lien Term Loan (1 Month LIBOR USD + 4.25%) | | | 4.36 | % | | | 04/22/2027 | | | | 1,283,589 | |
1,550,000 | | CP Atlas Buyer, Inc., Senior Secured First Lien Term Loan (3 Month LIBOR USD + 3.75%, 0.50% Floor) | | | 4.25 | % | | | 11/23/2027 | | | | 1,542,134 | |
10,033,144 | | CSC Holdings LLC, Senior Secured First Lien Term Loan (1 Month LIBOR USD + 2.25%) | | | 2.36 | % | | | 07/17/2025 | | | | 9,918,315 | |
455,700 | | CSC Holdings LLC, Senior Secured First Lien Term Loan (1 Month LIBOR USD + 2.25%) | | | 2.36 | % | | | 01/15/2026 | | | | 450,147 | |
1,075,040 | | CSM Bakery Solutions LLC, Senior Secured First Lien Term Loan (3 Month LIBOR USD + 6.25%, 1.00% Floor) | | | 7.25 | % | | | 01/04/2022 | | | | 1,071,159 | |
1,789,263 | | Cvent, Inc., Senior Secured First Lien Term Loan (1 Month LIBOR USD + 3.75%) | | | 3.90 | % | | | 11/29/2024 | | | | 1,746,025 | |
506,986 | | Cyanco Intermediate 2 Corporation, Senior Secured First Lien Term Loan (1 Month LIBOR USD + 3.50%) | | | 3.61 | % | | | 03/17/2025 | | | | 505,275 | |
1,180,675 | | Cyxtera DC Holdings, Inc., Senior Secured First Lien Term Loan (6 Month LIBOR USD + 3.00%, 1.00% Floor) | | | 4.00 | % | | | 05/01/2024 | | | | 1,135,863 | |
851,400 | | DCert Buyer, Inc., Senior Secured First Lien Term Loan (1 Month LIBOR USD + 4.00%) | | | 4.11 | % | | | 10/16/2026 | | | | 850,987 | |
1,538,686 | | Deerfield Dakota Holding LLC, Senior Secured First Lien Term Loan (1 Month LIBOR USD + 3.75%, 1.00% Floor) | | | 4.75 | % | | | 04/09/2027 | | | | 1,542,533 | |
5,234,541 | | Dell International LLC, Senior Secured First Lien Term Loan (1 Month LIBOR USD + 1.75%, 0.25% Floor) | | | 2.00 | % | | | 09/19/2025 | | | | 5,235,954 | |
830,000 | | Delta Topco, Inc., Senior Secured First Lien Term Loan (3 Month LIBOR USD + 3.75%, 0.75% Floor) | | | 4.50 | % | | | 12/01/2027 | | | | 830,149 | |
1,659,157 | | Dentalcorp Perfect Smile ULC, Senior Secured First Lien Term Loan (1 Month LIBOR USD + 3.75%, 1.00% Floor) | | | 4.75 | % | | | 06/06/2025 | | | | 1,648,788 | |
1,528,987 | | Diamond (BC) B.V., Senior Secured First Lien Term Loan (1 Month LIBOR USD + 3.00%) | | | 3.11 | % | | | 09/06/2024 | | | | 1,523,750 | |
413,668 | | Diamond Sports Group LLC, Senior Secured First Lien Term Loan (1 Month LIBOR USD + 3.25%) | | | 3.36 | % | | | 08/24/2026 | | | | 287,154 | |
274,014 | | Dynasty Acquisition Company, Inc., Senior Secured First Lien Term Loan (3 Month LIBOR USD + 3.50%) | | | 3.75 | % | | | 04/06/2026 | | | | 266,354 | |
509,666 | | Dynasty Acquisition Company, Inc., Senior Secured First Lien Term Loan (3 Month LIBOR USD + 3.50%) | | | 3.75 | % | | | 04/06/2026 | | | | 495,418 | |
1,416,915 | | EAB Global, Inc., Senior Secured First Lien Term Loan (6 Month LIBOR USD + 3.75%, 1.00% Floor) | | | 4.75 | % | | | 11/15/2024 | | | | 1,413,373 | |
1,627,550 | | Edelman Financial Center LLC, Senior Secured First Lien Term Loan (1 Month LIBOR USD + 3.00%) | | | 3.11 | % | | | 07/21/2025 | | | | 1,621,707 | |
833,711 | | EG Group, Ltd. Senior Secured First Lien Term Loan (3 Month LIBOR USD + 4.00%) | | | 4.20 | % | | | 02/06/2025 | | | | 821,802 | |
4,475,208 | | Elanco Animal Health, Inc., Senior Secured First Lien Term Loan (1 Month LIBOR USD + 1.75%) | | | 1.87 | % | | | 07/30/2027 | | | | 4,423,251 | |
6,705,664 | | Energizer Holdings, Inc., Senior Secured First Lien Term Loan (1 Month LIBOR USD + 2.25%, 0.50% Floor) | | | 2.75 | % | | | 12/22/2027 | | | | 6,691,683 | |
1,595,263 | | Envision Healthcare Corporation, Senior Secured First Lien Term Loan (1 Month LIBOR USD + 3.75%) | | | 3.86 | % | | | 10/10/2025 | | | | 1,381,570 | |
130,000 | | eResearchTechnology, Inc., Senior Secured First Lien | | | 5.50 | % (d) | | | 02/04/2027 | | | | 130,325 | |
1,732,583 | | ESH Hospitality, Inc., Senior Secured First Lien Term Loan (1 Month LIBOR USD + 2.00%) | | | 2.11 | % | | | 09/18/2026 | | | | 1,723,149 | |
1,351,613 | | EW Scripps Company, Senior Secured First Lien Term Loan (1 Month LIBOR USD + 2.56%, 0.75% Floor) | | | 3.75 | % | | | 01/07/2028 | | | | 1,348,977 | |
1,628,833 | | Excelitas Technologies Corporation, Senior Secured First Lien Term Loan (3 Month LIBOR USD + 3.50%, 1.00% Floor) | | | 4.50 | % | | | 12/02/2024 | | | | 1,630,820 | |
673,313 | | Exgen Renewables LLC, Senior Secured First Lien Term Loan (3 Month LIBOR USD + 2.75%, 1.00% Floor) | | | 3.75 | % | | | 12/15/2027 | | | | 674,996 | |
1,527,717 | | Filtration Group Corporation, Senior Secured First Lien Term Loan (1 Month LIBOR USD + 3.00%) | | | 3.11 | % | | | 03/31/2025 | | | | 1,507,956 | |
944,343 | | First Advantage Holdings LLC, Senior Secured First Lien Term Loan (1 Month LIBOR USD + 3.00%) | | | 3.11 | % | | | 01/29/2027 | | | | 938,677 | |
775,811 | | Flex Acquisition Company, Inc., Senior Secured First Lien Term Loan (3 Month LIBOR USD + 3.25%) | | | 3.45 | % | | | 06/30/2025 | | | | 764,224 | |
1,320,003 | | Flexential Intermediate Corporation, Senior Secured First Lien Term Loan (3 Month LIBOR USD + 3.50%) | | | 3.70 | % | | | 08/01/2024 | | | | 1,236,678 | |
2,080,706 | | Flexera Software LLC, Senior Secured First Lien Term Loan (3 Month LIBOR USD + 3.75%, 0.75% Floor) | | | 4.50 | % | | | 03/03/2028 | | | | 2,087,208 | |
491,827 | | Foresight Energy LLC, Senior Secured First Lien Term Loan (1 Month LIBOR USD + 8.00%, 1.50% Floor) | | | 9.50 | % (e) | | | 06/30/2027 | | | | 491,827 | |
394,571 | | Forterra Finance LLC, Senior Secured First Lien Term Loan (1 Month LIBOR USD + 3.00%, 1.00% Floor) | | | 4.00 | % | | | 10/25/2023 | | | | 395,754 | |
1,751,763 | | Froneri US, Inc., Senior Secured First Lien Term Loan (1 Month LIBOR USD + 2.25%) | | | 2.36 | % | | | 01/29/2027 | | | | 1,730,365 | |
570,764 | | Frontdoor, Inc., Senior Secured First Lien Term Loan (1 Month LIBOR USD + 2.50%) | | | 2.63 | % | | | 08/18/2025 | | | | 570,407 | |
435,000 | | Frontier Communications Corporation, Senior Secured First Lien Term Loan (1 Month LIBOR USD + 4.75%, 1.00% Floor) | | | 5.75 | % | | | 10/08/2021 | | | | 434,456 | |
584,100 | | Gardner Denver, Inc., Senior Secured First Lien Term Loan (1 Month LIBOR USD + 1.75%) | | | 1.86 | % | | | 03/01/2027 | | | | 577,529 | |
1,095,000 | | Gemini HDPE LLC, Senior Secured First Lien Term Loan (3 Month LIBOR USD + 3.00%, 0.50% Floor) | | | 3.50 | % | | | 12/31/2027 | | | | 1,091,584 | |
600,000 | | Generac Power Systems, Inc., Senior Secured First Lien Term Loan (1 Month LIBOR USD + 1.75%) | | | 1.86 | % | | | 12/11/2026 | | | | 601,782 | |
1,500,073 | | Gentiva Health Services, Inc., Senior Secured First Lien Term Loan (1 Month LIBOR USD + 2.75%) | | | 2.88 | % | | | 07/02/2025 | | | | 1,493,825 | |
1,173,041 | | Getty Images, Inc., Senior Secured First Lien Term Loan (1 Month LIBOR USD + 4.50%) | | | 4.63 | % | | | 02/19/2026 | | | | 1,164,366 | |
957,308 | | GFL Environmental, Inc., Senior Secured First Lien Term Loan (3 Month LIBOR USD + 3.00%, 0.50% Floor) | | | 3.50 | % | | | 05/30/2025 | | | | 959,103 | |
| | Global Medical Response, Inc., Senior Secured First Lien Term Loan | | | | | | | | | | | | |
907,913 | | (3 Month LIBOR USD + 4.75%, 1.00% Floor) | | | 5.75 | % | | | 10/02/2025 | | | | 906,437 | |
194,325 | | (6 Month LIBOR USD + 4.75%, 1.00% Floor) | | | 5.75 | % | | | 10/02/2025 | | | | 194,009 | |
7,746,943 | | Go Daddy Operating Company LLC, Senior Secured First Lien Term Loan (1 Month LIBOR USD + 1.75%) | | | 1.86 | % | | | 02/15/2024 | | | | 7,696,123 | |
1,012,350 | | Go Daddy Operating Company LLC, Senior Secured First Lien Term Loan (1 Month LIBOR USD + 2.00%) | | | 2.11 | % | | | 08/10/2027 | | | | 1,007,708 | |
2,131,552 | | GOBP Holdings, Inc., Senior Secured First Lien Term Loan (1 Month LIBOR USD + 2.75%) | | | 2.86 | % | | | 10/22/2025 | | | | 2,131,552 | |
1,772,877 | | GoodRX, Inc., Senior Secured First Lien Term Loan (1 Month LIBOR USD + 2.75%) | | | 2.86 | % | | | 10/10/2025 | | | | 1,769,234 | |
950,271 | | Graham Packaging Company, Inc., Senior Secured First Lien Term Loan (1 Month LIBOR USD + 3.00%, 0.75% Floor) | | | 3.75 | % | | | 08/04/2027 | | | | 945,577 | |
1,116,339 | | Granite US Holdings Corporation, Senior Secured First Lien Term Loan (1 Month LIBOR USD + 4.00%) | | | 4.17 | % | | | 09/30/2026 | | | | 1,114,943 | |
2,378,074 | | Gray Television, Inc., Senior Secured First Lien Term Loan (1 Month LIBOR USD + 2.50%) | | | 2.62 | % | | | 01/02/2026 | | | | 2,366,564 | |
2,086,838 | | Greeneden U.S. Holdings II LLC, Senior Secured First Lien Term Loan (1 Month LIBOR USD + 4.00%, 0.75% Floor) | | | 4.75 | % | | | 12/01/2027 | | | | 2,088,924 | |
4,488,636 | | Grifols Worldwide Operations USA, Inc., Senior Secured First Lien Term Loan (1 Week LIBOR USD + 2.00%) | | | 0.00 | % | | | 11/15/2027 | | | | 4,444,019 | |
659,211 | | Gulf Finance LLC, Senior Secured First Lien Term Loan (1 Month LIBOR USD + 5.25%, 1.00% Floor) | | | 6.25 | % | | | 08/25/2023 | | | | 548,674 | |
1,226,925 | | Harbor Freight Tools USA, Inc., Senior Secured First Lien Term Loan (1 Month LIBOR USD + 3.00%, 0.75% Floor) | | | 3.75 | % | | | 10/19/2027 | | | | 1,227,201 | |
919,191 | | Hayward Industries, Inc., Senior Secured First Lien Term Loan (1 Month LIBOR USD + 3.50%) | | | 3.61 | % | | | 08/05/2024 | | | | 920,533 | |
3,012,354 | | HCA, Inc., Senior Secured First Lien Term Loan (1 Month LIBOR USD + 1.75%) | | | 1.86 | % | | | 03/18/2026 | | | | 3,014,945 | |
668,100 | | Hexion, Inc., Senior Secured First Lien Term Loan (3 Month LIBOR USD + 3.50%) | | | 3.71 | % | | | 07/01/2026 | | | | 668,938 | |
1,420,142 | | H-Food Holdings LLC, Senior Secured First Lien Term Loan (1 Month LIBOR USD + 3.69%) | | | 3.80 | % | | | 05/23/2025 | | | | 1,408,312 | |
1,420,886 | | Hilton Worldwide Finance LLC, Senior Secured First Lien Term Loan (1 Month LIBOR USD + 1.75%) | | | 1.95 | % | | | 06/22/2026 | | | | 1,409,931 | |
4,565,000 | | Horizon Therapeutics USA, Inc., Senior Secured First Lien Term Loan (1 Month LIBOR USD + 2.00%, 0.50% Floor) | | | 2.50 | % | | | 03/15/2028 | | | | 4,558,152 | |
842,013 | | Houston Foods, Inc., Senior Secured First Lien Term Loan (1 Month LIBOR USD + 3.75%) | | | 3.86 | % | | | 07/21/2025 | | | | 834,119 | |
1,519,468 | | Hyland Software, Inc., Senior Secured First Lien Term Loan (1 Month LIBOR USD + 3.50%, 0.75% Floor) | | | 4.25 | % | | | 07/01/2024 | | | | 1,520,577 | |
451,053 | | Hyland Software, Inc., Senior Secured Second Lien Term Loan (1 Month LIBOR USD + 7.00%, 0.75% Floor) | | | 7.75 | % | | | 07/07/2025 | | | | 452,931 | |
452,375 | | IAA, Inc., Senior Secured First Lien Term Loan (1 Month LIBOR USD + 2.25%) | | | 2.36 | % | | | 06/29/2026 | | | | 450,679 | |
739,076 | | IHeartCommunications, Inc., Senior Secured First Lien Term Loan (1 Month LIBOR USD + 3.00%) | | | 3.11 | % | | | 05/01/2026 | | | | 731,223 | |
658,350 | | Informatica LLC, Senior Secured First Lien Term Loan (1 Month LIBOR USD + 3.25%) | | | 3.36 | % | | | 02/25/2027 | | | | 654,400 | |
159,468 | | Intelsat Jackson Holdings S.A., Senior Secured First Lien Delayed-Draw Term Loan (3 Month LIBOR USD + 5.50%, 1.00% Floor) | | | 6.50 | % | | | 07/13/2022 | | | | 161,780 | |
1,060,545 | | Intelsat Jackson Holdings S.A., Senior Secured First Lien Term Loan (Prime Rate + 4.75%, 1.00% Floor) | | | 8.00 | % | | | 11/27/2023 | | | | 1,080,552 | |
1,216,478 | | ION Trading Technologies SARL | | | 5.00 | % (d) | | | 11/21/2024 | | | | 1,218,698 | |
1,773,646 | | IQVIA, Inc., Senior Secured First Lien Term Loan (1 Month LIBOR USD + 1.75%) | | | 1.86 | % | | | 01/17/2025 | | | | 1,766,773 | |
2,032,516 | | IQVIA, Inc., Senior Secured First Lien Term Loan (3 Month LIBOR USD + 1.75%) | | | 1.86 | % | | | 06/11/2025 | | | | 2,024,894 | |
| | IRB Holding Corporation, Senior Secured First Lien Term Loan | | | | | | | | | | | | |
2,735 | | (1 Month LIBOR USD + 2.75%, 1.00% Floor) | | | 3.75 | % | | | 02/05/2025 | | | | 2,716 | |
1,049,108 | | (3 Month LIBOR USD + 2.75%, 1.00% Floor) | | | 3.75 | % | | | 02/05/2025 | | | | 1,042,074 | |
847,875 | | IRB Holding Corporation, Senior Secured First Lien Term Loan (3 Month LIBOR USD + 3.25%, 1.00% Floor) | | | 4.25 | % | | | 12/15/2027 | | | | 845,887 | |
1,797,515 | | IRI Holdings, Inc., Senior Secured First Lien Term Loan (1 Month LIBOR USD + 4.25%) | | | 4.36 | % | | | 12/01/2025 | | | | 1,800,885 | |
6,933,004 | | Iron Mountain Information Management LLC, Senior Secured First Lien Term Loan (1 Month LIBOR USD + 1.75%) | | | 1.86 | % | | | 01/02/2026 | | | | 6,857,885 | |
810,000 | | Ivanti Software, Inc., Senior Secured First Lien Term Loan (1 Month LIBOR USD + 4.75%, 1.00% Floor) | | | 5.75 | % | | | 12/01/2027 | | | | 814,305 | |
1,422,793 | | Jacobs Douwe Egberts International B.V., Senior Secured First Lien | | | 2.20 | % | | | 11/01/2025 | | | | 1,422,195 | |
11,550,357 | | JBS USA Lux S.A., Senior Secured First Lien Term Loan (1 Month LIBOR USD + 2.00%) | | | 2.11 | % | | | 05/01/2026 | | | | 11,498,669 | |
308,897 | | Jo-Ann Stores LLC, Senior Secured First Lien Term Loan (6 Month LIBOR USD + 5.00%, 1.00% Floor) | | | 6.00 | % | | | 10/20/2023 | | | | 308,317 | |
7,517,523 | | KAR Auction Services, Inc., Senior Secured First Lien Term Loan (1 Month LIBOR USD + 2.25%) | | | 2.36 | % | | | 09/21/2026 | | | | 7,381,268 | |
894,053 | | KBR, Inc., Senior Secured First Lien Term Loan (1 Month LIBOR USD + 2.75%) | | | 2.86 | % | | | 02/05/2027 | | | | 894,053 | |
1,278,813 | | Kestrel Bidco, Inc., Senior Secured First Lien Term Loan (6 Month LIBOR USD + 3.00%, 1.00% Floor) | | | 4.00 | % | | | 12/11/2026 | | | | 1,242,820 | |
4,728,793 | | KFC Holding Company, Senior Secured First Lien Term Loan (3 Month LIBOR USD + 1.75%) | | | 1.86 | % | | | 03/15/2028 | | | | 4,737,660 | |
1,191,933 | | Kindred Healthcare, Inc., Senior Secured First Lien Term Loan (1 Month LIBOR USD + 4.50%) | | | 4.63 | % | | | 07/02/2025 | | | | 1,196,402 | |
145,455 | | LBM Acquisition LLC, Senior Secured First Lien | | | 4.50 | % (d) | | | 12/17/2027 | | | | 145,087 | |
654,545 | | LBM Acquisition LLC, Senior Secured First Lien Term Loan (3 Month LIBOR USD + 3.75%, 0.75% Floor) | | | 4.50 | % | | | 12/17/2027 | | | | 652,889 | |
90,404 | | Lealand Finance Company B.V., Senior Secured First Lien Term Loan (1 Month LIBOR USD + 1.00%) | | | 1.11 | % | | | 06/30/2025 | | | | 51,229 | |
14,099,245 | | Level 3 Financing, Inc., Senior Secured First Lien Term Loan (1 Month LIBOR USD + 1.75%) | | | 1.86 | % | | | 03/01/2027 | | | | 13,934,777 | |
439,704 | | Lions Gate Capital Holdings LLC, Senior Secured First Lien Term Loan (1 Month LIBOR USD + 2.25%) | | | 2.36 | % | | | 03/24/2025 | | | | 434,023 | |
628,425 | | LogMeIn, Inc., Senior Secured First Lien Term Loan (1 Month LIBOR USD + 4.75%) | | | 4.85 | % | | | 08/31/2027 | | | | 627,542 | |
1,400,658 | | Lower Cadence Holdings LLC, Senior Secured First Lien Term Loan (1 Month LIBOR USD + 4.00%) | | | 4.11 | % | | | 05/22/2026 | | | | 1,370,312 | |
1,453,213 | | Lucid Energy Group II Borrower LLC, Senior Secured First Lien Term Loan (1 Month LIBOR USD + 3.00%, 1.00% Floor) | | | 4.00 | % | | | 02/18/2025 | | | | 1,410,220 | |
1,690,234 | | Lumen Technologies, Inc., Senior Secured First Lien Term Loan (1 Month LIBOR USD + 2.25%) | | | 0.00 | % | | | 03/15/2027 | | | | 1,675,148 | |
1,012,463 | | Lummus Technology Holdings V LLC, Senior Secured First Lien Term Loan (1 Month LIBOR USD + 3.50%) | | | 3.61 | % | | | 06/30/2027 | | | | 1,009,299 | |
269,679 | | Maravai Intermediate Holdings LLC, Senior Secured First Lien Term Loan (3 Month LIBOR USD + 4.25%, 1.00% Floor) | | | 5.25 | % | | | 10/19/2027 | | | | 271,365 | |
2,048,872 | | Marriott Ownership Resorts, Inc., Senior Secured First Lien Term Loan (1 Month LIBOR USD + 1.75%) | | | 1.86 | % | | | 08/29/2025 | | | | 2,002,004 | |
1,209,514 | | Mavis Tire Express Services Corporation, Senior Secured First Lien Term Loan (3 Month LIBOR USD + 3.25%) | | | 3.50 | % | | | 03/20/2025 | | | | 1,207,246 | |
783,038 | | Mavis Tire Express Services Corporation, Senior Secured First Lien Term Loan (3 Month LIBOR USD + 4.00%, 1.00% Floor) | | | 5.00 | % | | | 03/20/2025 | | | | 782,795 | |
208,676 | | MED ParentCo LP, Senior Secured First Lien Delayed-Draw Term Loan (1 Month LIBOR USD + 4.25%) | | | 4.36 | % | | | 08/31/2026 | | | | 207,355 | |
832,136 | | MED ParentCo LP, Senior Secured First Lien Term Loan (1 Month LIBOR USD + 4.25%) | | | 4.36 | % | | | 08/31/2026 | | | | 826,868 | |
1,008,659 | | Messer Industries GMBH, Senior Secured First Lien Term Loan (3 Month LIBOR USD + 2.50%) | | | 2.70 | % | | | 03/02/2026 | | | | 1,002,234 | |
1,511,213 | | Milano Acquisition Corporation, Senior Secured First Lien Term Loan (3 Month LIBOR USD + 4.00%, 0.75% Floor) | | | 4.75 | % | | | 10/01/2027 | | | | 1,507,434 | |
735,000 | | Mileage Plus Holdings LLC, Senior Secured First Lien Term Loan (3 Month LIBOR USD + 5.25%, 1.00% Floor) | | | 6.25 | % | | | 06/21/2027 | | | | 782,147 | |
1,748,977 | | Minotaur Acquisition, Inc., Senior Secured First Lien Term Loan (1 Month LIBOR USD + 5.00%) | | | 5.11 | % | | | 03/27/2026 | | | | 1,749,711 | |
| | Mirion Technologies, Inc., Senior Secured First Lien Term Loan | | | | | | | | | | | | |
62,740 | | (3 Month LIBOR USD + 4.00%) | | | 4.27 | % | | | 03/06/2026 | | | | 62,920 | |
151,169 | | (6 Month LIBOR USD + 4.00%) | | | 4.27 | % | | | 03/06/2026 | | | | 151,604 | |
1,603,726 | | Mister Car Wash Holdings, Inc., Senior Secured First Lien Term Loan (1 Month LIBOR USD + 3.25%) | | | 3.36 | % | | | 05/14/2026 | | | | 1,587,913 | |
360,000 | | Mitchell International, Inc., Senior Secured Second Lien Term Loan (1 Month LIBOR USD + 7.25%) | | | 7.36 | % | | | 12/01/2025 | | | | 360,225 | |
432,059 | | Motion Acquisition Ltd., Senior Secured First Lien Term Loan (3 Month LIBOR USD + 3.25%) | | | 3.45 | % | | | 11/12/2026 | | | | 418,364 | |
56,785 | | Motion Acquisition Ltd., Senior Secured First Lien Term Loan (3 Month LIBOR USD + 3.25%) | | | 3.45 | % | | | 11/12/2026 | | | | 54,985 | |
1,204,367 | | MPH Acquisition Holdings LLC, Senior Secured First Lien Term Loan (3 Month LIBOR USD + 2.75%, 1.00% Floor) | | | 3.75 | % | | | 06/07/2023 | | | | 1,199,236 | |
617,400 | | Nascar Holdings LLC, Senior Secured First Lien Term Loan (1 Month LIBOR USD + 2.75%) | | | 2.86 | % | | | 10/19/2026 | | | | 614,122 | |
474,088 | | NCR Corporation, Senior Secured First Lien Term Loan (1 Month LIBOR USD + 2.50%) | | | 2.72 | % | | | 08/28/2026 | | | | 469,939 | |
171,381 | | Nexstar Broadcasting, Inc., Senior Secured First Lien Term Loan (1 Month LIBOR USD + 2.25%) | | | 2.47 | % | | | 01/17/2024 | | | | 170,634 | |
765,000 | | Nexstar Broadcasting, Inc., Senior Secured First Lien Term Loan (1 Month LIBOR USD + 2.50%) | | | 2.86 | % | | | 09/18/2026 | | | | 760,460 | |
1,795,387 | | Numericable U.S. LLC, Senior Secured First Lien Term Loan (3 Month LIBOR USD + 4.00%) | | | 4.20 | % | | | 08/14/2026 | | | | 1,793,591 | |
| | OneDigital Borrower LLC, Senior Secured First Lien Delayed-Draw Term Loan | | | | | | | | | | | | |
45,592 | | (Prime Rate + 3.50%, 0.75% Floor) | | | 0.00 | % (h) | | | 11/16/2027 | | | | 45,669 | |
48,607 | | (1 Month LIBOR USD + 4.50%, 0.75% Floor) | | | 5.25 | % (h) | | | 11/16/2027 | | | | 48,688 | |
1,760,801 | | OneDigital Borrower LLC, Senior Secured First Lien Term Loan (3 Month LIBOR USD + 4.50%, 0.75% Floor) | | | 5.25 | % | | | 11/16/2027 | | | | 1,763,741 | |
461,296 | �� | Ortho-Clinical Diagnostics, Inc., Senior Secured First Lien Term Loan (1 Month LIBOR USD + 3.25%) | | | 3.36 | % | | | 06/30/2025 | | | | 461,065 | |
347,013 | | Outcomes Group Holdings, Inc., Senior Secured First Lien Term Loan (3 Month LIBOR USD + 3.25%) | | | 3.45 | % | | | 10/24/2025 | | | | 343,978 | |
465,000 | | Packaging Coordinators Midco, Inc., Senior Secured First Lien Term Loan (6 Month LIBOR USD + 3.75%, 0.75% Floor) | | | 4.50 | % | | | 11/30/2027 | | | | 465,363 | |
440,000 | | PAI HoldCo, Inc., Senior Secured First Lien Term Loan (6 Month LIBOR USD + 4.00%, 1.00% Floor) | | | 5.00 | % | | | 10/26/2027 | | | | 442,064 | |
1,777,865 | | Parexel International Corporation, Senior Secured First Lien Term Loan (1 Month LIBOR USD + 2.75%) | | | 2.86 | % | | | 09/27/2024 | | | | 1,759,162 | |
1,388,008 | | Pathway Vet Alliance LLC, Senior Secured First Lien Term Loan (1 Month LIBOR USD + 3.75%) | | | 3.86 | % | | | 03/31/2027 | | | | 1,381,790 | |
522,570 | | PCI Gaming Authority, Senior Secured First Lien Term Loan (1 Month LIBOR USD + 2.50%) | | | 2.61 | % | | | 05/29/2026 | | | | 519,730 | |
1,025,164 | | Penn National Gaming, Inc., Senior Secured First Lien Term Loan (1 Month LIBOR USD + 2.25%, 0.75% Floor) | | | 3.00 | % | | | 10/15/2025 | | | | 1,022,703 | |
878,363 | | PG&E Corporation, Senior Secured First Lien Term Loan (3 Month LIBOR USD + 3.00%, 0.50% Floor) | | | 3.50 | % | | | 06/23/2025 | | | | 878,635 | |
523,257 | | Phoenix Services International LLC, Senior Secured First Lien Term Loan (1 Month LIBOR USD + 3.75%, 1.00% Floor) | | | 4.75 | % | | | 03/03/2025 | | | | 519,824 | |
731,251 | | Pisces Midco, Inc., Senior Secured First Lien Term Loan (1 Month LIBOR USD + 3.75%) | | | 3.86 | % | | | 04/12/2025 | | | | 731,890 | |
455,000 | | PointClickCare Technologies, Inc., Senior Secured First Lien Term Loan (6 Month LIBOR USD + 3.00%, 0.75% Floor) | | | 3.75 | % | | | 12/29/2027 | | | | 455,569 | |
913,712 | | PowerTeam Services LLC, Senior Secured First Lien Term Loan (3 Month LIBOR USD + 3.25%, 1.00% Floor) | | | 4.25 | % | | | 03/06/2025 | | | | 908,147 | |
880,000 | | PPD, Inc., Senior Secured First Lien Term Loan (1 Month LIBOR USD + 2.25%, 0.50% Floor) | | | 2.75 | % | | | 01/13/2028 | | | | 876,938 | |
696,782 | | Prairie ECI Acquiror LP, Senior Secured First Lien Term Loan (1 Month LIBOR USD + 4.75%) | | | 4.86 | % | | | 03/11/2026 | | | | 677,492 | |
1,239,313 | | Pregis Topco LLC, Senior Secured First Lien Term Loan (1 Month LIBOR USD + 3.75%) | | | 3.86 | % | | | 07/31/2026 | | | | 1,231,437 | |
292,788 | | Presidio Holdings, Inc., Senior Secured First Lien Term Loan (3 Month LIBOR USD + 3.50%) | | | 3.72 | % | | | 01/22/2027 | | | | 292,605 | |
| | Prime Security Services Borrower LLC, Senior Secured First Lien Term Loan | | | | | | | | | | | | |
463,013 | | (1 Month LIBOR USD + 2.75%, 0.75% Floor) | | | 3.50 | % | | | 09/23/2026 | | | | 461,710 | |
297,228 | | (3 Month LIBOR USD + 2.75%, 0.75% Floor) | | | 3.50 | % | | | 09/23/2026 | | | | 296,391 | |
594,439 | | (6 Month LIBOR USD + 2.75%, 0.75% Floor) | | | 3.50 | % | | | 09/23/2026 | | | | 592,766 | |
297,228 | | (12 Month LIBOR USD + 2.75%, 0.75% Floor) | | | 3.50 | % | | | 09/23/2026 | | | | 296,391 | |
868,998 | | Pro Mach Group, Inc., Senior Secured First Lien Term Loan (1 Month LIBOR USD + 2.75%) | | | 2.86 | % | | | 03/07/2025 | | | | 854,756 | |
1,806,092 | | Project Alpha Intermediate Holding, Inc., Senior Secured First Lien Term Loan (1 Month LIBOR USD + 4.00%) | | | 4.15 | % | | | 04/26/2024 | | | | 1,803,609 | |
991,082 | | Pug LLC, Senior Secured First Lien Term Loan (1 Month LIBOR USD + 3.50%) | | | 3.61 | % | | | 02/12/2027 | | | | 960,111 | |
1,561,088 | | Radiate Holdco LLC, Senior Secured First Lien Term Loan (1 Month LIBOR USD + 3.50%, 0.75% Floor) | | | 4.25 | % | | | 09/25/2026 | | | | 1,562,329 | |
| | Radiology Partners, Inc., Senior Secured First Lien Term Loan | | | | | | | | | | | | |
985,076 | | (1 Month LIBOR USD + 4.25%) | | | 4.36 | % | | | 07/09/2025 | | | | 979,023 | |
844,560 | | (3 Month LIBOR USD + 4.25%) | | | 4.47 | % | | | 07/09/2025 | | | | 839,370 | |
633,413 | | Redstone Buyer LLC, Senior Secured First Lien Term Loan (3 Month LIBOR USD + 5.00%, 1.00% Floor) | | | 6.00 | % | | | 09/01/2027 | | | | 636,447 | |
1,232,121 | | RegionalCare Hospital Partners Holdings, Inc., Senior Secured First Lien Term Loan (1 Month LIBOR USD + 3.75%) | | | 3.86 | % | | | 11/14/2025 | | | | 1,231,073 | |
1,686,946 | | Renaissance Holding Corporation, Senior Secured First Lien Term Loan (1 Month LIBOR USD + 3.25%) | | | 3.36 | % | | | 05/30/2025 | | | | 1,649,167 | |
301,756 | | RentPath, Inc., Senior Secured First Lien Term Loan (1 Month LIBOR USD + 7.00%, 1.00% Floor) | | | 8.00 | % | | | 06/30/2021 | | | | 304,774 | |
1,662,730 | | RentPath, Inc., Senior Secured First Lien Term Loan (Prime Rate + 3.75%, 1.00% Floor) | | | 7.00 | % (f) | | | 12/17/2021 | | | | 1,499,724 | |
6,225,000 | | Resideo Funding, Inc., Senior Secured First Lien Term Loan (2 Month LIBOR USD + 2.25%, 0.50% Floor) | | | 2.75 | % | | | 02/11/2028 | | | | 6,217,219 | |
8,676,521 | | Reynolds Consumer Products LLC, Senior Secured First Lien Term Loan (1 Month LIBOR USD + 1.75%) | | | 1.86 | % | | | 02/04/2027 | | | | 8,645,632 | |
642,011 | | Reynolds Group Holdings, Inc., Senior Secured First Lien Term Loan (1 Month LIBOR USD + 2.75%) | | | 2.86 | % | | | 02/06/2023 | | | | 640,056 | |
1,962,195 | | RPI Intermediate Finance Trust, Senior Secured First Lien Term Loan (1 Month LIBOR USD + 1.75%) | | | 1.86 | % | | | 02/11/2027 | | | | 1,960,968 | |
625,154 | | Sabre GLBL, Inc., Senior Secured First Lien Term Loan (1 Month LIBOR USD + 2.00%) | | | 2.11 | % | | | 02/22/2024 | | | | 617,858 | |
254,363 | | Sabre GLBL, Inc. Senior Secured First Lien Term Loan (1 Month LIBOR USD + 4.00%, 0.75% Floor) | | | 4.75 | % | | | 12/17/2027 | | | | 257,384 | |
1,422,263 | | Science Applications International Corporation, Senior Secured First Lien Term Loan (1 Month LIBOR USD + 1.88%) | | | 1.98 | % | | | 10/31/2025 | | | | 1,423,279 | |
1,235,448 | | Scientific Games International, Inc., Senior Secured First Lien Term Loan (1 Month LIBOR USD + 2.75%) | | | 2.86 | % | | | 08/14/2024 | | | | 1,214,105 | |
1,245,108 | | Securus Technologies Holdings, Inc., Senior Secured First Lien Term Loan (6 Month LIBOR USD + 4.50%, 1.00% Floor) | | | 5.50 | % | | | 11/01/2024 | | | | 1,156,326 | |
1,069,025 | | Sedgwick Claims Management Services, Inc., Senior Secured First Lien Term Loan (1 Month LIBOR USD + 3.25%) | | | 3.36 | % | | | 12/31/2025 | | | | 1,056,181 | |
1,824,034 | | Select Medical Corporation, Senior Secured First Lien Term Loan (1 Month LIBOR USD + 2.25%) | | | 2.72 | % | | | 03/06/2025 | | | | 1,817,248 | |
1,702,286 | | Severin Acquisition LLC, Senior Secured First Lien Term Loan (1 Month LIBOR USD + 3.25%) | | | 3.36 | % | | | 08/01/2025 | | | | 1,684,838 | |
2,590,550 | | Sinclair Television Group, Inc., Senior Secured First Lien Term Loan (1 Month LIBOR USD + 2.50%) | | | 2.61 | % | | | 09/30/2026 | | | | 2,554,930 | |
1,230,875 | | SIWF Holdings, Inc., Senior Secured First Lien Term Loan (1 Month LIBOR USD + 4.25%) | | | 4.36 | % | | | 06/13/2025 | | | | 1,228,819 | |
928,063 | | Six Flags Theme Parks, Inc., Senior Secured First Lien Term Loan (1 Month LIBOR USD + 1.75%) | | | 1.86 | % | | | 04/17/2026 | | | | 908,777 | |
645,000 | | SkyMiles IP Ltd., Senior Secured First Lien Term Loan (3 Month LIBOR USD + 3.75%, 1.00% Floor) | | | 4.75 | % | | | 10/20/2027 | | | | 678,217 | |
| | SMG US Midco 2, Inc., Senior Secured First Lien Term Loan | | | 2.61 | % | | | 01/23/2025 | | | | | |
413,320 | | (1 Month LIBOR USD + 2.50%) | | | 2.61 | % | | | 01/23/2025 | | | | 394,720 | |
1,004,100 | | (3 Month LIBOR USD + 2.50%) | | | 2.71 | % | | | 01/23/2025 | | | | 958,916 | |
| | Solenis International LP, Senior Secured First Lien Term Loan | | | | | | | | | | | | |
205,721 | | (3 Month LIBOR USD + 4.00%) | | | 4.23 | % | | | 06/26/2025 | | | | 205,464 | |
1,331,805 | | (3 Month LIBOR USD + 4.00%) | | | 4.19 | % | | | 06/26/2025 | | | | 1,330,140 | |
85,000 | | Solenis International LP, Senior Secured Second Lien Term Loan (3 Month LIBOR USD + 8.50%) | | | 8.69 | % | | | 06/26/2026 | | | | 85,326 | |
1,538,802 | | Solera LLC, Senior Secured First Lien Term Loan (1 Month LIBOR USD + 2.75%) | | | 2.94 | % | | | 03/03/2023 | | | | 1,532,139 | |
1,795,500 | | Sophia LP, Senior Secured First Lien Term Loan (3 Month LIBOR USD + 3.75%, 0.75% Floor) | | | 4.50 | % | | | 10/07/2027 | | | | 1,797,188 | |
1,917,057 | | Sound Inpatient Physicians, Inc., Senior Secured First Lien Term Loan (1 Month LIBOR USD + 2.75%) | | | 2.86 | % | | | 06/27/2025 | | | | 1,909,868 | |
138,788 | | Southern Veterinary Partners LLC, Senior Secured First Lien Term Loan | | | 5.00 | % (d)(h) | | | 10/01/2027 | | | | 139,352 | |
1,003,697 | | Southern Veterinary Partners LLC, Senior Secured First Lien Term Loan (6 Month LIBOR USD + 4.00%, 1.00% Floor) | | | 5.00 | % | | | 10/01/2027 | | | | 1,007,777 | |
1,593,306 | | SS&C Technologies, Inc., Senior Secured First Lien Term Loan (1 Month LIBOR USD + 1.75%) | | | 1.86 | % | | | 04/16/2025 | | | | 1,579,699 | |
634,972 | | Staples, Inc., Senior Secured First Lien Term Loan (3 Month LIBOR USD + 5.00%) | | | 5.21 | % | | | 04/16/2026 | | | | 620,510 | |
810,382 | | Starfruit US Holdco LLC, Senior Secured First Lien Term Loan (1 Month LIBOR USD + 2.75%) | | | 2.86 | % | | | 10/01/2025 | | | | 799,154 | |
628,344 | | Stars Group Holdings B.V., Senior Secured First Lien Term Loan (3 Month LIBOR USD + 3.50%) | | | 3.75 | % | | | 07/10/2025 | | | | 630,179 | |
1,726,953 | | Surf Holdings LLC, Senior Secured First Lien Term Loan (3 Month LIBOR USD + 3.50%) | | | 3.68 | % | | | 03/05/2027 | | | | 1,712,429 | |
282,013 | | Syncreon Group Holdings B.V., Senior Secured First Lien Term Loan (1 Month LIBOR USD + 5.00%, 1.00% Floor) | | | 6.00 | % | | | 10/01/2024 | | | | 282,365 | |
965,275 | | Syneos Health, Inc., Senior Secured First Lien Term Loan (1 Month LIBOR USD + 1.75%) | | | 2.19 | % | | | 08/01/2024 | | | | 962,258 | |
| | TAMKO Building Products LLC, Senior Secured First Lien Term Loan | | | | | | | | | | | | |
645,440 | | (1 Month LIBOR USD + 3.00%) | | | 3.11 | % | | | 05/29/2026 | | | | 644,233 | |
221,854 | | (2 Month LIBOR USD + 3.00%) | | | 3.14 | % | | | 05/29/2026 | | | | 221,439 | |
832,962 | | Team Health Holdings, Inc., Senior Secured First Lien Term Loan (1 Month LIBOR USD + 2.75%, 1.00% Floor) | | | 3.75 | % | | | 02/06/2024 | | | | 777,024 | |
1,228,825 | | Tech Data Corporation, Senior Secured First Lien Term Loan (1 Month LIBOR USD + 3.50%) | | | 3.61 | % | | | 06/30/2025 | | | | 1,233,869 | |
527,350 | | Tech Data Corporation, Senior Secured First Lien Term Loan (1 Month LIBOR USD + 5.50%) | | | 5.61 | % | | | 06/30/2025 | | | | 530,865 | |
720,064 | | Telesat Canada, Senior Secured First Lien Term Loan (1 Month LIBOR USD + 2.75%) | | | 2.86 | % | | | 12/07/2026 | | | | 694,933 | |
562,889 | | Terrier Media Buyer, Inc., Senior Secured First Lien Term Loan (1 Month LIBOR USD + 3.50%) | | | 3.61 | % | | | 12/17/2026 | | | | 558,628 | |
1,944,407 | | The Dun & Bradstreet Corporation, Senior Secured First Lien Term Loan (1 Month LIBOR USD + 3.25%) | | | 3.36 | % | | | 02/06/2026 | | | | 1,936,512 | |
1,339,154 | | TIBCO Software, Inc., Senior Secured First Lien Term Loan (1 Month LIBOR USD + 3.75%) | | | 3.86 | % | | | 06/30/2026 | | | | 1,324,925 | |
165,000 | | TIBCO Software, Inc. Senior Secured Second Lien Term Loan (1 Month LIBOR USD + 7.25%) | | | 7.36 | % | | | 03/03/2028 | | | | 167,176 | |
1,389,382 | | Titan Acquisition, Ltd. Senior Secured First Lien Term Loan (6 Month LIBOR USD + 3.00%) | | | 3.27 | % | | | 03/28/2025 | | | | 1,363,546 | |
1,455,353 | | TKC Holdings, Inc., Senior Secured First Lien Term Loan (6 Month LIBOR USD + 3.75%, 1.00% Floor) | | | 4.75 | % | | | 02/01/2023 | | | | 1,424,550 | |
4,317,888 | | Trans Union LLC, Senior Secured First Lien Term Loan (1 Month LIBOR USD + 1.75%) | | | 1.86 | % | | | 11/13/2026 | | | | 4,292,996 | |
2,216,995 | | TransDigm, Inc., Senior Secured First Lien Term Loan (1 Month LIBOR USD + 2.25%) | | | 2.36 | % | | | 05/30/2025 | | | | 2,174,994 | |
812,711 | | Travel Leaders Group LLC, Senior Secured First Lien Term Loan (1 Month LIBOR USD + 4.00%) | | | 4.11 | % | | | 01/25/2024 | | | | 764,192 | |
571,893 | | Travelport Finance (Luxembourg) SARL, Senior Secured First Lien Term Loan (3 Month LIBOR USD + 1.50%, 1.00% Floor) | | | 2.50 | % | | | 02/28/2025 | | | | 583,568 | |
1,563,320 | | Trident TPI Holdings, Inc., Senior Secured First Lien Term Loan (3 Month LIBOR USD + 3.00%, 1.00% Floor) | | | 4.00 | % | | | 10/17/2024 | | | | 1,551,353 | |
1,790,824 | | UFC Holdings LLC, Senior Secured First Lien Term Loan (6 Month LIBOR USD + 3.00%, 0.75% Floor) | | | 3.75 | % | | | 04/29/2026 | | | | 1,786,481 | |
771,066 | | UGI Energy Services LLC, Senior Secured First Lien Term Loan (1 Month LIBOR USD + 3.75%) | | | 3.86 | % | | | 08/13/2026 | | | | 770,584 | |
922,421 | | UKG, Inc., Senior Secured First Lien Term Loan (1 Month LIBOR USD + 3.75%) | | | 3.86 | % | | | 05/04/2026 | | | | 922,739 | |
1,258,683 | | UKG, Inc. Senior Secured First Lien Term Loan (3 Month LIBOR USD + 3.25%, 0.75% Floor) | | | 4.00 | % | | | 05/04/2026 | | | | 1,260,552 | |
140,000 | | UKG, Inc., Senior Secured Second Lien Term Loan (3 Month LIBOR USD + 6.75%, 0.75% Floor) | | | 7.50 | % | | | 05/03/2027 | | | | 143,967 | |
444,342 | | United Natural Foods, Inc., Senior Secured First Lien Term Loan (1 Month LIBOR USD + 3.50%) | | | 3.61 | % | | | 10/22/2025 | | | | 444,678 | |
340,688 | | Univar Solutions USA, Inc., Senior Secured First Lien Term Loan (1 Month LIBOR USD + 2.00%) | | | 2.11 | % | | | 07/01/2026 | | | | 339,441 | |
456,739 | | Univision Communications, Inc. Senior Secured First Lien Term Loan (1 Month LIBOR USD + 3.75%, 1.00% Floor) | | | 4.75 | % | | | 03/13/2026 | | | | 457,154 | |
658,350 | | Upstream Newco, Inc., Senior Secured First Lien Term Loan (1 Month LIBOR USD + 4.50%) | | | 4.61 | % | | | 11/20/2026 | | | | 657,942 | |
2,585,625 | | US Foods, Inc., Senior Secured First Lien Term Loan (1 Month LIBOR USD + 2.00%) | | | 2.11 | % | | | 09/14/2026 | | | | 2,539,756 | |
770,717 | | USIC Holdings, Inc., Senior Secured First Lien Term Loan (1 Month LIBOR USD + 3.00%, 1.00% Floor) | | | 4.00 | % | | | 12/08/2023 | | | | 767,827 | |
129,675 | | Utz Quality Foods LLC, Senior Secured First Lien Term Loan (1 Month LIBOR USD + 3.00%) | | | 3.11 | % | | | 01/20/2028 | | | | 129,729 | |
656,775 | | Vantage Specialty Chemicals, Inc., Senior Secured First Lien Term Loan (3 Month LIBOR USD + 3.50%, 1.00% Floor) | | | 4.50 | % | | | 10/28/2024 | | | | 621,749 | |
1,828,994 | | Verscend Holding Corporation, Senior Secured First Lien Term Loan (1 Month LIBOR USD + 4.50%) | | | 4.61 | % | | | 08/27/2025 | | | | 1,831,537 | |
1,756,186 | | Vertical U.S. Newco, Inc., Senior Secured First Lien Term Loan (6 Month LIBOR USD + 4.25%) | | | 4.48 | % | | | 07/30/2027 | | | | 1,762,666 | |
2,625,000 | | VICI Properties 1 LLC, Senior Secured First Lien Term Loan (1 Month LIBOR USD + 1.75%) | | | 1.86 | % | | | 12/20/2024 | | | | 2,599,039 | |
526,799 | | Victory Capital Holdings, Inc., Senior Secured First Lien Term Loan (3 Month LIBOR USD + 2.25%) | | | 2.36 | % | | | 07/01/2026 | | | | 522,519 | |
2,694,290 | | Virgin Media Bristol LLC, Senior Secured First Lien Term Loan (1 Month LIBOR USD + 2.50%) | | | 2.63 | % | | | 01/31/2028 | | | | 2,673,934 | |
220,000 | | Virtusa Corporation, Senior Secured First Lien Term Loan (1 Month LIBOR USD + 4.25%, 0.75% Floor) | | | 5.00 | % | | | 02/11/2028 | | | | 220,551 | |
9,816,039 | | Vistra Operations Company LLC, Senior Secured First Lien Term Loan (1 Month LIBOR USD + 1.75%) | | | 1.86 | % | | | 12/31/2025 | | | | 9,759,941 | |
1,769,792 | | VS Buyer LLC, Senior Secured First Lien Term Loan (1 Month LIBOR USD + 3.00%) | | | 3.11 | % | | | 02/26/2027 | | | | 1,766,846 | |
1,204,702 | | Wand NewCo 3, Inc., Senior Secured First Lien Term Loan (1 Month LIBOR USD + 3.00%) | | | 3.11 | % | | | 02/05/2026 | | | | 1,192,535 | |
1,252,439 | | Whatabrands LLC, Senior Secured First Lien Term Loan (1 Month LIBOR USD + 2.75%) | | | 2.86 | % | | | 07/31/2026 | | | | 1,246,176 | |
2,400,000 | | WMG Acquisition Corporation | | | 0.00 | % (d)(h) | | | 01/20/2028 | | | | 2,391,000 | |
10,365,000 | | WMG Acquisition Corporation, Senior Secured First Lien Term Loan (1 Month LIBOR USD + 2.13%) | | | 2.23 | % | | | 01/20/2028 | | | | 10,340,694 | |
1,500,980 | | Zayo Group Holdings, Inc., Senior Secured First Lien Term Loan (1 Month LIBOR USD + 3.00%) | | | 3.11 | % | | | 03/09/2027 | | | | 1,490,886 | |
900,732 | | Zelis Cost Management Buyer, Inc., Senior Secured First Lien Term Loan (1 Month LIBOR USD + 3.50%) | | | 3.62 | % | | | 09/30/2026 | | | | 898,480 | |
235,000 | | Ziggo Financing Partnership, Senior Secured First Lien Term Loan (1 Month LIBOR USD + 2.50%) | | | 2.61 | % | | | 04/28/2028 | | | | 232,966 | |
| | | | | | | | | | | | | | |
Total Bank Loans (Cost $467,968,572) | | | | | | | | 466,727,486 | |
| | | | | | | | | | | | | | |
Collateralized Loan Obligations - 11.5% | | | | | | | | | | | | |
6,500,000 | | 522 Funding Ltd., Series 2019-5A-A1 (3 Month LIBOR USD + 1.39%, 1.39% Floor) | | | 1.63 | % (a) | | | 01/15/2033 | | | | 6,525,861 | |
250,000 | | Adams Mill Ltd., Series 2014-1A-D1 (3 Month LIBOR USD + 3.50%) | | | 3.74 | % (a) | | | 07/15/2026 | | | | 248,132 | |
14,000,000 | | AGL Ltd., Series 2020-3A-A (3 Month LIBOR USD + 1.30%, 1.30% Floor) | | | 1.54 | % (a) | | | 01/15/2033 | | | | 14,072,098 | |
12,250,000 | | Allegro Ltd., Series 2018-1A-A (3 Month LIBOR USD + 1.10%, 1.10% Floor) | | | 1.34 | % (a) | | | 06/13/2031 | | | | 12,250,018 | |
2,250,000 | | Anchorage Capital Ltd., Series 2014-3RA-A (3 Month LIBOR USD + 1.05%) | | | 1.27 | % (a) | | | 01/28/2031 | | | | 2,245,124 | |
7,165,000 | | Anchorage Capital Ltd., Series 2015-6A-AR (3 Month LIBOR USD + 1.27%) | | | 1.51 | % (a) | | | 07/15/2030 | | | | 7,173,939 | |
25,000,000 | | Anchorage Capital Ltd., Series 2016-9A-AR (3 Month LIBOR USD + 1.37%) | | | 1.61 | % (a) | | | 07/15/2032 | | | | 25,037,998 | |
7,500,000 | | Anchorage Capital Ltd., Series 2018-1RA-A1 (3 Month LIBOR USD + 0.99%, 0.99% Floor) | | | 1.21 | % (a) | | | 04/13/2031 | | | | 7,500,000 | |
8,800,000 | | Anchorage Capital Ltd., Series 2020-16A-B (3 Month LIBOR USD + 2.20%, 2.20% Floor) | | | 2.40 | % (a) | | | 10/20/2031 | | | | 8,827,417 | |
5,000,000 | | Apidos Ltd., Series 2021-35A-A (3 Month LIBOR USD + 1.05%, 1.05% Floor) | | | 0.01 | % (a) | | | 04/20/2034 | | | | 5,000,000 | |
12,500,000 | | Assurant Ltd., Series 2018-3A-A (3 Month LIBOR USD + 1.23%, 1.23% Floor) | | | 1.45 | % (a) | | | 10/20/2031 | | | | 12,517,353 | |
12,514,065 | | Atlas Senior Loan Fund Ltd., Series 2013-1A-AR (3 Month LIBOR USD + 0.83%) | | | 1.02 | % (a) | | | 11/17/2027 | | | | 12,498,832 | |
2,799,276 | | Atlas Senior Loan Fund Ltd., Series 2018-10A-A (3 Month LIBOR USD + 1.09%) | | | 1.33 | % (a) | | | 01/15/2031 | | | | 2,793,776 | |
2,000,000 | | Atlas Senior Loan Fund XI Ltd., Series 2018-11A-B (3 Month LIBOR USD + 1.65%) | | | 1.87 | % (a) | | | 07/26/2031 | | | | 2,005,563 | |
2,500,000 | | Babson Ltd., Series 2015-2A-DR (3 Month LIBOR USD + 2.95%) | | | 3.17 | % (a) | | | 10/20/2030 | | | | 2,462,167 | |
5,000,000 | | Battalion Ltd., Series 2019-16A-B (3 Month LIBOR USD + 2.00%, 2.00% Floor) | | | 2.22 | % (a) | | | 12/19/2032 | | | | 5,016,584 | |
18,000,000 | | Battalion Ltd., Series 2020-15A-A1 (3 Month LIBOR USD + 1.35%, 1.35% Floor) | | | 1.57 | % (a) | | | 01/17/2033 | | | | 18,055,072 | |
6,993,698 | | Benefit Street Partners Ltd., Series 2013-IIIA-A1R (3 Month LIBOR USD + 1.25%) | | | 1.47 | % (a) | | | 07/20/2029 | | | | 6,996,132 | |
10,000,000 | | Birch Grove Ltd., Series 19A-A (3 Month LIBOR USD + 1.49%) | | | 1.67 | % (a) | | | 06/15/2031 | | | | 10,014,634 | |
10,000,000 | | Carbone Ltd., Series 2017-1A-A1 (3 Month LIBOR USD + 1.14%) | | | 1.36 | % (a) | | | 01/20/2031 | | | | 10,005,512 | |
5,965,555 | | Carlyle Global Market Strategies Ltd., Series 2017-1A-A1A (3 Month LIBOR USD + 1.30%) | | | 1.52 | % (a) | | | 04/20/2031 | | | | 5,966,153 | |
30,000,000 | | CarVal Ltd., Series 2019-2A-A (3 Month LIBOR USD + 1.35%, 1.35% Floor) | | | 1.57 | % (a) | | | 07/20/2032 | | | | 30,034,602 | |
10,000,000 | | Cathedral Lake Ltd., Series 2013-1A-A1RR (3 Month LIBOR USD + 1.20%) | | | 1.44 | % (a) | | | 10/15/2029 | | | | 10,012,484 | |
8,350,000 | | Cathedral Lake Ltd., Series 2015-2A-A1R (3 Month LIBOR USD + 1.31%) | | | 1.55 | % (a) | | | 07/16/2029 | | | | 8,358,750 | |
9,850,000 | | Cathedral Lake Ltd., Series 2021-7RA-A (3 Month LIBOR USD + 1.31%, 1.31% Floor) | | | 1.50 | % (a) | | | 01/15/2032 | | | | 9,850,835 | |
2,500,000 | | CBAM Ltd., Series 2019-10A-B (3 Month LIBOR USD + 2.05%, 2.05% Floor) | | | 2.27 | % (a) | | | 04/20/2032 | | | | 2,500,299 | |
22,000,000 | | CFIP Ltd., Series 2014-1A-AR (3 Month LIBOR USD + 1.32%) | | | 1.54 | % (a) | | | 07/13/2029 | | | | 21,985,767 | |
10,350,000 | | CFIP Ltd., Series 2017-1A-A (3 Month LIBOR USD + 1.22%) | | | 1.44 | % (a) | | | 01/18/2030 | | | | 10,375,401 | |
2,000,000 | | CFIP Ltd., Series 2017-1A-B (3 Month LIBOR USD + 1.65%) | | | 1.87 | % (a) | | | 01/18/2030 | | | | 2,004,993 | |
1,800,000 | | CIFC Funding Ltd., Series 2014-5A-BR2 (3 Month LIBOR USD + 1.80%, 1.80% Floor) | | | 2.02 | % (a) | | | 10/17/2031 | | | | 1,801,416 | |
13,478,785 | | Crown Point Ltd., Series 2018-6A-A1 (3 Month LIBOR USD + 1.17%, 1.17% Floor) | | | 1.39 | % (a) | | | 10/20/2028 | | | | 13,512,591 | |
10,000,000 | | Crown Point Ltd., Series 2020-9A-A (3 Month LIBOR USD + 2.05%, 2.05% Floor) | | | 2.28 | % (a) | | | 07/14/2032 | | | | 10,040,204 | |
5,000,000 | | Crown Point Ltd., Series 2020-9A-B (3 Month LIBOR USD + 2.69%, 2.69% Floor) | | | 2.92 | % (a) | | | 07/14/2032 | | | | 5,013,090 | |
6,500,000 | | CVP Ltd., Series 2017-2A-A (3 Month LIBOR USD + 1.19%, 1.19% Floor) | | | 1.41 | % (a) | | | 01/20/2031 | | | | 6,508,633 | |
10,000,000 | | Dryden Ltd., Series 2019-75A-AR2 (3 Month LIBOR USD + 1.04%, 1.04% Floor) | | | 0.01 | % (a) | | | 04/15/2034 | | | | 10,000,000 | |
5,000,000 | | Dryden Senior Loan Fund, Series 2013-28A-A1LR (3 Month LIBOR USD + 1.20%, 1.20% Floor) | | | 1.39 | % (a) | | | 08/15/2030 | | | | 5,004,173 | |
20,000,000 | | Elevation Ltd., Series 2018-9A-A1 (3 Month LIBOR USD + 1.12%, 1.12% Floor) | | | 1.36 | % (a) | | | 07/15/2031 | | | | 20,028,263 | |
9,000,000 | | Elmwood Ltd., Series 2019-2A-B (3 Month LIBOR USD + 2.10%, 2.10% Floor) | | | 2.32 | % (a) | | | 04/20/2031 | | | | 9,009,633 | |
6,000,000 | | Elmwood Ltd., Series 2020-1A-A (3 Month LIBOR USD + 1.24%, 1.24% Floor) | | | 1.48 | % (a) | | | 04/15/2033 | | | | 6,025,500 | |
7,592,582 | | Galaxy Ltd., Series 2016-22A-A2R (3 Month LIBOR USD + 0.85%, 0.85% Floor) | | | 1.07 | % (a) | | | 07/16/2028 | | | | 7,599,501 | |
12,000,000 | | Greywolf Ltd., Series 2018-2A-A1 (3 Month LIBOR USD + 1.18%, 1.18% Floor) | | | 1.40 | % (a) | | | 10/20/2031 | | | | 12,006,000 | |
5,000,000 | | Gulf Stream Meridian Ltd., Series 2020-IIA-A2A (3 Month LIBOR USD + 2.75%, 2.75% Floor) | | | 2.99 | % (a) | | | 10/15/2029 | | | | 5,025,986 | |
13,500,000 | | Gulf Stream Meridian Ltd., Series 2021-IIIA-A1 (3 Month LIBOR USD + 1.32%, 1.32% Floor) | | | 1.48 | % (a) | | | 04/15/2034 | | | | 13,513,395 | |
500,000 | | Halcyon Loan Advisors Funding Ltd., Series 2013-2A-C (3 Month LIBOR USD + 2.70%) | | | 2.91 | % (a) | | | 08/01/2025 | | | | 500,066 | |
250,000 | | Halcyon Loan Advisors Funding Ltd., Series 2013-2A-D (3 Month LIBOR USD + 3.80%) | | | 4.01 | % (a) | | | 08/01/2025 | | | | 215,885 | |
11,697,794 | | Halcyon Loan Advisors Funding Ltd., Series 2015-3A-A1R (3 Month LIBOR USD + 0.90%) | | | 1.12 | % (a) | | | 10/18/2027 | | | | 11,679,497 | |
6,500,000 | | Hayfin Kingsland Ltd., Series 2018-8A-B (3 Month LIBOR USD + 1.48%, 1.48% Floor) | | | 1.70 | % (a) | | | 04/20/2031 | | | | 6,457,165 | |
1,755,000 | | Jamestown Ltd., Series 2018-6RA-A1 (3 Month LIBOR USD + 1.15%, 1.15% Floor) | | | 1.37 | % (a) | | | 04/25/2030 | | | | 1,756,547 | |
16,000,000 | | Kayne Ltd., Series 2019-5A-A (3 Month LIBOR USD + 1.35%, 1.35% Floor) | | | 1.57 | % (a) | | | 07/24/2032 | | | | 16,041,076 | |
10,000,000 | | Kayne Ltd., Series 2020-7A-A1 (3 Month LIBOR USD + 1.20%, 1.20% Floor) | | | 1.42 | % (a) | | | 04/17/2033 | | | | 10,042,238 | |
9,500,000 | | Kingsland Ltd., Series 2018-8A-A (3 Month LIBOR USD + 1.12%, 1.12% Floor) | | | 1.34 | % (a) | | | 04/20/2031 | | | | 9,519,433 | |
2,610,828 | | KVK Ltd., Series 2018-1A-A (3 Month LIBOR USD + 0.93%) | | | 1.11 | % (a) | | | 05/20/2029 | | | | 2,609,556 | |
20,000,000 | | LCM LP, Series 17A-A2RR (3 Month LIBOR USD + 1.15%, 1.15% Floor) | | | 1.39 | % (a) | | | 10/15/2031 | | | | 20,015,260 | |
1,000,000 | | Madison Park Funding Ltd., Series 2014-15A-CR (3 Month LIBOR USD + 3.45%) | | | 3.66 | % (a) | | | 01/27/2026 | | | | 999,328 | |
3,000,000 | | Madison Park Funding Ltd., Series 2017-26A-BR (3 Month LIBOR USD + 1.60%) | | | 1.81 | % (a) | | | 07/29/2030 | | | | 2,989,825 | |
14,568,407 | | Marathon Ltd., Series 2013-5A-A1R (3 Month LIBOR USD + 0.87%) | | | 1.05 | % (a) | | | 11/21/2027 | | | | 14,577,407 | |
2,080,762 | | Marathon Ltd., Series 2014-7A-A1R (3 Month LIBOR USD + 1.32%) | | | 1.54 | % (a) | | | 10/28/2025 | | | | 2,082,353 | |
8,625,000 | | Marathon Ltd., Series 2017-9A-A2 (3 Month LIBOR USD + 1.75%) | | | 1.99 | % (a) | | | 04/15/2029 | | | | 8,598,130 | |
4,500,000 | | Marble Point Ltd., Series 2017-2A-A (3 Month LIBOR USD + 1.18%, 1.18% Floor) | | | 1.40 | % (a) | | | 12/18/2030 | | | | 4,497,744 | |
25,000,000 | | Marble Point Ltd., Series 2018-2A-A1R (3 Month LIBOR USD + 1.28%, 1.28% Floor) | | | 1.50 | % (a) | | | 01/20/2032 | | | | 25,004,559 | |
29,500,000 | | Marble Point Ltd., Series 2020-1A-A (3 Month LIBOR USD + 1.30%, 1.30% Floor) | | | 1.52 | % (a) | | | 04/20/2033 | | | | 29,505,897 | |
25,000,000 | | MKS Ltd., Series 2017-1A-AR (3 Month LIBOR USD + 1.00%, 1.00% Floor) | | | 1.22 | % (a) | | | 07/20/2030 | | | | 25,004,918 | |
2,000,000 | | MP Ltd., Series 2013-1A-AR (3 Month LIBOR USD + 1.25%) | | | 1.47 | % (a) | | | 10/20/2030 | | | | 1,998,900 | |
25,000,000 | | MP Ltd., Series 2013-2A-ARR (3 Month LIBOR USD + 1.28%) | | | 1.50 | % (a) | | | 07/25/2029 | | | | 25,029,105 | |
7,846,659 | | MP Ltd., Series 2015-2A-AR (3 Month LIBOR USD + 0.91%) | | | 1.13 | % (a) | | | 10/28/2027 | | | | 7,847,678 | |
22,600,000 | | Nassau Ltd., Series 2018-IA-A (3 Month LIBOR USD + 1.15%) | | | 1.39 | % (a) | | | 07/15/2031 | | | | 22,522,309 | |
12,000,000 | | New Mountain Ltd., Series CLO-2A-A (3 Month LIBOR USD + 1.19%, 1.19% Floor) | | | 0.01 | % (a) | | | 04/15/2034 | | | | 12,000,000 | |
8,898,846 | | Northwoods Capital Ltd., Series 2017-16A-A (3 Month LIBOR USD + 1.27%) | | | 1.46 | % (a) | | | 11/15/2030 | | | | 8,924,315 | |
4,914,578 | | Ocean Trails, Series 2014-5A-ARR (3 Month LIBOR USD + 1.28%, 1.28% Floor) | | | 1.50 | % (a) | | | 10/13/2031 | | | | 4,917,035 | |
10,000,000 | | Ocean Trails, Series 2020-10A-B1 (3 Month LIBOR USD + 2.10%, 2.10% Floor) | | | 2.29 | % (a) | | | 10/15/2031 | | | | 10,023,980 | |
15,000,000 | | OFSI Fund Ltd., Series 2018-1A-A (3 Month LIBOR USD + 1.15%, 1.15% Floor) | | | 1.39 | % (a) | | | 07/15/2031 | | | | 15,019,357 | |
8,500,000 | | OHA Credit Funding Ltd., Series 2012-7A-AR3 (3 Month LIBOR USD + 1.07%, 1.07% Floor) | | | 1.24 | % (a) | | | 02/20/2034 | | | | 8,500,939 | |
15,000,000 | | Park Avenue Institutional Advisers Ltd., Series 2016-1A-A1R (3 Month LIBOR USD + 1.20%) | | | 1.38 | % (a) | | | 08/23/2031 | | | | 15,018,732 | |
9,947,266 | | Race Point Ltd., Series 2015-9A-A1AR (3 Month LIBOR USD + 1.21%) | | | 1.45 | % (a) | | | 10/15/2030 | | | | 9,951,184 | |
18,875,000 | | RR Ltd., Series 2021-14A-A1 (3 Month LIBOR USD + 1.12%, 1.12% Floor) | | | 0.01 | % (a) | | | 04/15/2036 | | | | 18,865,722 | |
3,000,000 | | Sound Point Ltd., Series 2013-3RA-A (3 Month LIBOR USD + 1.15%, 1.15% Floor) | | | 1.37 | % (a) | | | 04/18/2031 | | | | 2,997,000 | |
10,100,000 | | Sound Point Ltd., Series 2018-3A-A1A (3 Month LIBOR USD + 1.18%, 1.18% Floor) | | | 1.40 | % (a) | | | 10/26/2031 | | | | 10,110,759 | |
10,500,000 | | Sound Point Ltd., Series 2019-1A-A (3 Month LIBOR USD + 1.37%, 1.37% Floor) | | | 1.59 | % (a) | | | 01/20/2032 | | | | 10,531,402 | |
29,000,000 | | Sound Point Ltd., Series 2020-3A-A1 (3 Month LIBOR USD + 1.28%, 1.28% Floor) | | | 1.53 | % (a) | | | 01/25/2032 | | | | 29,037,729 | |
10,000,000 | | Steele Creek Ltd., Series 2014-1RA-A (3 Month LIBOR USD + 1.07%, 1.07% Floor) | | | 1.29 | % (a) | | | 04/21/2031 | | | | 9,972,654 | |
8,000,000 | | Steele Creek Ltd., Series 2016-1A-AR (3 Month LIBOR USD + 1.12%, 1.12% Floor) | | | 1.30 | % (a) | | | 06/15/2031 | | | | 7,981,049 | |
10,000,000 | | Steele Creek Ltd., Series 2017-1A-A (3 Month LIBOR USD + 1.25%) | | | 1.49 | % (a) | | | 10/15/2030 | | | | 9,977,890 | |
6,000,000 | | Steele Creek Ltd., Series 2018-2A-A (3 Month LIBOR USD + 1.20%, 1.20% Floor) | | | 1.39 | % (a) | | | 08/18/2031 | | | | 6,001,952 | |
10,000,000 | | Steele Creek Ltd., Series 2019-1A-B (3 Month LIBOR USD + 2.20%, 2.20% Floor) | | | 2.44 | % (a) | | | 04/15/2032 | | | | 9,992,583 | |
18,000,000 | | Steele Creek Ltd., Series 2019-2A-A1 (3 Month LIBOR USD + 1.36%, 1.36% Floor) | | | 1.60 | % (a) | | | 07/15/2032 | | | | 18,033,352 | |
9,000,000 | | Steele Creek Ltd., Series 2019-2A-B (3 Month LIBOR USD + 2.25%, 2.25% Floor) | | | 2.49 | % (a) | | | 07/15/2032 | | | | 9,013,122 | |
25,000,000 | | Symphony Ltd., Series 2014-15A-AR3 (3 Month LIBOR USD + 1.08%, 1.08% Floor) | | | 1.21 | % (a) | | | 01/17/2032 | | | | 24,975,000 | |
10,000,000 | | Venture Ltd., Series 2014-19A-ARR (3 Month LIBOR USD + 1.26%, 1.26% Floor) | | | 1.50 | % (a) | | | 01/15/2032 | | | | 10,013,605 | |
9,809,311 | | Venture Ltd., Series 2015-20A-AR (3 Month LIBOR USD + 0.82%) | | | 1.06 | % (a) | | | 04/15/2027 | | | | 9,809,368 | |
8,500,000 | | Venture Ltd., Series 2017-29A-AR (3 Month LIBOR USD + 0.99%) | | | 0.01 | % (a) | | | 09/07/2030 | | | | 8,500,000 | |
10,000,000 | | Venture Ltd., Series 2018-34A-A (3 Month LIBOR USD + 1.23%, 1.23% Floor) | | | 1.47 | % (a) | | | 10/15/2031 | | | | 10,013,503 | |
3,948,182 | | Vibrant Ltd., Series 2015-3A-A1RR (3 Month LIBOR USD + 1.25%) | | | 1.47 | % (a) | | | 10/20/2031 | | | | 3,946,243 | |
3,500,000 | | Vibrant Ltd., Series 2016-5A-B (3 Month LIBOR USD + 2.10%) | | | 2.32 | % (a) | | | 01/20/2029 | | | | 3,509,346 | |
10,000,000 | | Vibrant Ltd., Series 2018-10A-A1 (3 Month LIBOR USD + 1.20%, 1.20% Floor) | | | 1.42 | % (a) | | | 10/20/2031 | | | | 10,010,623 | |
15,000,000 | | Wellfleet Ltd., Series 2018-2A-A1 (3 Month LIBOR USD + 1.20%, 1.20% Floor) | | | 1.42 | % (a) | | | 10/20/2031 | | | | 14,998,528 | |
10,000,000 | | Wellfleet Ltd., Series 2018-3A-A1A (3 Month LIBOR USD + 1.25%, 1.25% Floor) | | | 1.47 | % (a) | | | 01/20/2032 | | | | 10,005,982 | |
17,500,000 | | Wellfleet Ltd., Series 2020-1A-A1A (3 Month LIBOR USD + 1.31%, 1.31% Floor) | | | 1.55 | % (a) | | | 04/15/2033 | | | | 17,578,812 | |
3,000,000 | | Whitebox Ltd., Series 2020-2A-B (3 Month LIBOR USD + 2.25%, 2.25% Floor) | | | 2.49 | % (a) | | | 10/24/2031 | | | | 2,967,511 | |
6,000,000 | | Whitehorse Ltd., Series 2018-12A-A (3 Month LIBOR USD + 1.25%, 1.25% Floor) | | | 1.49 | % (a) | | | 10/15/2031 | | | | 5,989,591 | |
14,500,000 | | Wind River Ltd., Series 2014-2A-AR (3 Month LIBOR USD + 1.14%, 1.14% Floor) | | | 1.38 | % (a) | | | 01/15/2031 | | | | 14,518,314 | |
4,000,000 | | Wind River Ltd., Series 2019-3A-B (3 Month LIBOR USD + 2.10%) | | | 2.34 | % (a) | | | 04/15/2031 | | | | 4,001,250 | |
| | | | | | | | | | | | | | |
Total Collateralized Loan Obligations (Cost $1,022,704,393) | | | | | | | | 1,024,627,189 | |
| | | | | | | | | | | | | | |
Foreign Corporate Bonds - 6.2% | | | | | | | | | | | | |
1,400,000 | | Adani Ports & Special Economic Zone Ltd. | | | 3.38 | % | | | 07/24/2024 | | | | 1,468,249 | |
1,900,000 | | AES Dominicana | | | 7.95 | % | | | 05/11/2026 | | | | 1,979,002 | |
400,000 | | AES Gener S.A. | | | 5.00 | % | | | 07/14/2025 | | | | 419,000 | |
1,400,000 | | AES Gener S.A. (5 Year Swap Rate USD + 4.64%) | | | 7.13 | % | | | 03/26/2079 | | | | 1,506,211 | |
1,200,000 | | AES Gener S.A. (5 Year Swap Rate USD + 4.64%) | | | 7.13 | % (a) | | | 03/26/2079 | | | | 1,291,038 | |
5,300,000 | | Alibaba Group Holding Ltd. | | | 2.80 | % | | | 06/06/2023 | | | | 5,531,546 | |
5,455,000 | | ANZ New Zealand International Ltd. | | | 1.90 | % (a) | | | 02/13/2023 | | | | 5,602,876 | |
1,325,000 | | AstraZeneca PLC | | | 2.38 | % | | | 06/12/2022 | | | | 1,354,361 | |
9,050,000 | | AstraZeneca PLC | | | 3.50 | % | | | 08/17/2023 | | | | 9,651,958 | |
5,926,000 | | Avolon Holdings Funding Ltd. | | | 3.63 | % (a) | | | 05/01/2022 | | | | 6,044,223 | |
1,100,000 | | Axiata SPV2 BHD | | | 4.36 | % | | | 03/24/2026 | | | | 1,232,286 | |
1,600,000 | | Baidu, Inc. | | | 3.50 | % | | | 11/28/2022 | | | | 1,670,166 | |
4,300,000 | | Baidu, Inc. | | | 3.88 | % | | | 09/29/2023 | | | | 4,603,127 | |
1,500,000 | | Banco Bradesco S.A. | | | 2.85 | % (a) | | | 01/27/2023 | | | | 1,534,582 | |
1,600,000 | | Banco BTG Pactual S.A. (5 Year CMT Rate + 5.26%) | | | 7.75 | % (a) | | | 02/15/2029 | | | | 1,697,600 | |
1,850,000 | | Banco Continental SAECA | | | 2.75 | % (a) | | | 12/10/2025 | | | | 1,824,229 | |
1,500,000 | | Banco de Reservas de la Republica Dominicana | | | 7.00 | % | | | 02/01/2023 | | | | 1,566,938 | |
500,000 | | Banco Latinoamericano de Comercio Exterior S.A. | | | 2.38 | % (a) | | | 09/14/2025 | | | | 511,445 | |
6,300,000 | | Banco Mercantil del Norte S.A. (5 Year CMT Rate + 5.04%) | | | 6.88 | % (g) | | | 07/06/2022 | | | | 6,446,286 | |
11,200,000 | | Banco Nacional de Comercio Exterior S.N.C. (5 Year CMT Rate + 3.00%) | | | 3.80 | % | | | 08/11/2026 | | | | 11,220,888 | |
2,900,000 | | Bangkok Bank PCL | | | 3.88 | % | | | 09/27/2022 | | | | 3,031,920 | |
10,200,000 | | Banistmo S.A. | | | 3.65 | % | | | 09/19/2022 | | | | 10,416,444 | |
800,000 | | Banistmo S.A. | | | 3.65 | % (a) | | | 09/19/2022 | | | | 816,976 | |
4,125,000 | | Bank of Nova Scotia | | | 0.55 | % | | | 09/15/2023 | | | | 4,127,346 | |
2,870,000 | | Bank of the Philippine Islands | | | 2.50 | % | | | 09/10/2024 | | | | 2,992,693 | |
5,330,000 | | Barclays PLC (1 Year CMT Rate + 0.80%) | | | 1.01 | % | | | 12/10/2024 | | | | 5,327,722 | |
5,150,000 | | BAT International Finance PLC | | | 1.67 | % | | | 03/25/2026 | | | | 5,100,986 | |
2,600,000 | | BBVA Banco Continental S.A. | | | 5.00 | % | | | 08/26/2022 | | | | 2,742,701 | |
2,330,000 | | BBVA Bancomer S.A. (5 Year CMT Rate + 3.00%) | | | 5.35 | % | | | 11/12/2029 | | | | 2,405,049 | |
3,100,000 | | BBVA Colombia S.A. | | | 4.88 | % | | | 04/21/2025 | | | | 3,298,044 | |
2,000,000 | | BDO Unibank, Inc. | | | 2.63 | % | | | 10/24/2021 | | | | 2,023,750 | |
4,000,000 | | BDO Unibank, Inc. | | | 2.95 | % | | | 03/06/2023 | | | | 4,150,000 | |
4,910,000 | | BNP Paribas S.A. (3 Month LIBOR USD + 2.24%) | | | 4.71 | % (a) | | | 01/10/2025 | | | | 5,402,445 | |
5,175,000 | | BPCE S.A. | | | 2.38 | % (a) | | | 01/14/2025 | | | | 5,349,334 | |
2,100,000 | | C&W Senior Financing DAC | | | 7.50 | % | | | 10/15/2026 | | | | 2,229,476 | |
5,600,000 | | Chile Electricity PEC SpA | | | 0.00 | % (a) | | | 01/25/2028 | | | | 4,583,908 | |
2,600,000 | | CIMB Bank BHD (3 Month LIBOR USD + 0.78%) | | | 1.00 | % | | | 10/09/2024 | | | | 2,609,062 | |
1,100,000 | | Credicorp Ltd. | | | 2.75 | % (a) | | | 06/17/2025 | | | | 1,123,765 | |
6,800,000 | | Credit Suisse Group AG (3 Month LIBOR USD + 1.24%) | | | 1.42 | % (a) | | | 06/12/2024 | | | | 6,871,577 | |
750,000 | | DBS Group Holdings Ltd. | | | 2.85 | % | | | 04/16/2022 | | | | 768,889 | |
700,000 | | DBS Group Holdings Ltd. (3 Month LIBOR USD + 0.62%) | | | 0.84 | % | | | 07/25/2022 | | | | 704,037 | |
900,000 | | DBS Group Holdings Ltd. (5 Year Mid Swap Rate USD + 1.59%) | | | 4.52 | % | | | 12/11/2028 | | | | 976,427 | |
9,500,000 | | DBS Group Holdings Ltd. (5 Year Swap Rate USD + 2.39%) | | | 3.60 | % (g) | | | 09/07/2021 | | | | 9,589,158 | |
189,677 | | Digicel Group Ltd. (7.00% PIK) | | | 7.00 | % (a)(g) | | | 04/16/2021 | | | | 139,356 | |
476,105 | | Digicel Group Ltd. (5.00% + 3.00% PIK or 8.00% PIK) | | | 8.00 | % (a) | | | 04/01/2025 | | | | 393,579 | |
1,632,451 | | Empresa Electrica Angamos S.A. | | | 4.88 | % | | | 05/25/2029 | | | | 1,638,899 | |
2,552,000 | | Empresa Electrica Guacolda S.A. | | | 4.56 | % | | | 04/30/2025 | | | | 2,148,757 | |
3,867,687 | | ENA Norte Trust | | | 4.95 | % | | | 04/25/2023 | | | | 3,976,328 | |
10,854,000 | | Enel Generacion Chile S.A. | | | 4.25 | % | | | 04/15/2024 | | | | 11,677,401 | |
200,000 | | ENN Energy Holdings Ltd. | | | 3.25 | % | | | 07/24/2022 | | | | 204,994 | |
500,000 | | Export Import Bank of Thailand (3 Month LIBOR USD + 0.85%) | | | 1.03 | % | | | 05/23/2024 | | | | 505,248 | |
3,100,000 | | Export Import Bank of Thailand (3 Month LIBOR USD + 0.90%) | | | 1.08 | % | | | 11/20/2023 | | | | 3,135,681 | |
4,153,000 | | Falabella S.A. | | | 3.75 | % | | | 04/30/2023 | | | | 4,362,693 | |
5,903,088 | | Fenix Power Peru S.A. | | | 4.32 | % | | | 09/20/2027 | | | | 6,199,276 | |
5,500,000 | | Galaxy Pipeline Assets Bidco Ltd. | | | 1.75 | % | | | 09/30/2027 | | | | 5,505,963 | |
1,000,000 | | Geopark Ltd. | | | 6.50 | % | | | 09/21/2024 | | | | 1,036,845 | |
11,350,000 | | GlaxoSmithKline Capital PLC | | | 0.53 | % | | | 10/01/2023 | | | | 11,367,853 | |
8,000,000 | | Global Bank Corporation | | | 4.50 | % | | | 10/20/2021 | | | | 8,123,320 | |
300,000 | | Global Bank Corporation | | | 4.50 | % (a) | | | 10/20/2021 | | | | 304,624 | |
4,200,000 | | Grupo Aval Ltd. | | | 4.75 | % | | | 09/26/2022 | | | | 4,387,950 | |
3,700,000 | | Grupo Bimbo S.A.B. de C.V. | | | 4.50 | % | | | 01/25/2022 | | | | 3,811,784 | |
7,510,000 | | Grupo de Inversiones Suramericana S.A. | | | 5.70 | % | | | 05/18/2021 | | | | 7,574,774 | |
8,100,000 | | HPHT Finance Ltd. | | | 2.88 | % | | | 11/05/2024 | | | | 8,530,420 | |
350,000 | | Indian Oil Corporation Ltd. | | | 5.63 | % | | | 08/02/2021 | | | | 355,179 | |
2,200,000 | | Indian Oil Corporation Ltd. | | | 5.75 | % | | | 08/01/2023 | | | | 2,409,743 | |
1,249,173 | | Interoceanica Finance Ltd. | | | 0.00 | % | | | 11/30/2025 | | | | 1,196,083 | |
35,034 | | Invepar Holdings | | | 0.00 | % (e)(f) | | | 12/30/2028 | | | | 1,498 | |
5,500,000 | | Inversiones CMPC S.A. | | | 4.50 | % | | | 04/25/2022 | | | | 5,663,708 | |
700,000 | | Israel Electric Corporation Ltd. | | | 6.88 | % | | | 06/21/2023 | | | | 789,250 | |
4,250,000 | | JD.com, Inc. | | | 3.13 | % | | | 04/29/2021 | | | | 4,256,868 | |
3,600,000 | | Korea Development Bank | | | 1.25 | % | | | 06/03/2025 | | | | 3,614,748 | |
4,500,000 | | Korea Development Bank | | | 0.80 | % | | | 04/27/2026 | | | | 4,404,014 | |
| 4,000,000 | | Korea Development Bank | | | 1.00 | % | | | 09/09/2026 | | | | 3,944,666 | |
| 3,400,000 | | Korea East-West Power Company Ltd. | | | 1.75 | % | | | 05/06/2025 | | | | 3,450,649 | |
| 4,000,000 | | Korea East-West Power Company Ltd. | | | 1.75 | % (a) | | | 05/06/2025 | | | | 4,059,588 | |
| 6,200,000 | | Korea Electric Power Corporation | | | 1.13 | % | | | 06/15/2025 | | | | 6,162,181 | |
| 3,550,000 | | Korea Electric Power Corporation | | | 1.13 | % (a) | | | 06/15/2025 | | | | 3,528,346 | |
| 4,200,000 | | Korea Southern Power Company Ltd. | | | 0.75 | % (a) | | | 01/27/2026 | | | | 4,070,778 | |
| 10,115,000 | | KT Corporation | | | 1.00 | % | | | 09/01/2025 | | | | 9,956,303 | |
| 6,300,000 | | LG Chem Ltd. | | | 3.25 | % | | | 10/15/2024 | | | | 6,827,101 | |
| 4,070,000 | | Lloyds Banking Group PLC (1 Year CMT Rate + .55%) | | | 0.70 | % | | | 05/11/2024 | | | | 4,070,353 | |
| 4,920,000 | | Macquarie Bank Ltd. | | | 2.10 | % (a) | | | 10/17/2022 | | | | 5,048,260 | |
| 3,000,000 | | Malayan Banking BHD (3 Month LIBOR USD + 0.80%) | | | 0.99 | % | | | 08/16/2024 | | | | 3,023,008 | |
| 8,700,000 | | Malayan Banking BHD (5 Year Swap Rate USD + 2.54%) | | | 3.91 | % | | | 10/29/2026 | | | | 8,848,422 | |
| 6,400,000 | | MEGlobal Canada ULC | | | 5.00 | % (a) | | | 05/18/2025 | | | | 7,131,104 | |
| 10,851,000 | | Mitsubishi UFJ Financial Group, Inc. (3 Month LIBOR USD + 0.86%) | | | 1.08 | % | | | 07/26/2023 | | | | 10,985,866 | |
| 11,113,000 | | Mizuho Financial Group, Inc. (3 Month LIBOR USD + 0.79%) | | | 0.98 | % | | | 03/05/2023 | | | | 11,239,102 | |
| 5,200,000 | | Multibank, Inc. | | | 4.38 | % | | | 11/09/2022 | | | | 5,346,016 | |
| 4,000,000 | | NongHyup Bank | | | 1.25 | % (a) | | | 07/20/2025 | | | | 3,984,680 | |
| 5,000,000 | | NongHyup Bank | | | 1.25 | % | | | 07/20/2025 | | | | 4,981,150 | |
| 8,961,000 | | ONGC Videsh Ltd. | | | 2.88 | % | | | 01/27/2022 | | | | 9,075,629 | |
| 1,400,000 | | ONGC Videsh Ltd. | | | 3.75 | % | | | 05/07/2023 | | | | 1,467,327 | |
| 1,000,000 | | Oversea-Chinese Banking Corporation Ltd. | | | 4.25 | % | | | 06/19/2024 | | | | 1,097,077 | |
| 8,900,000 | | Oversea-Chinese Banking Corporation Ltd. (5 Year CMT Rate + 1.58%) | | | 1.83 | % | | | 09/10/2030 | | | | 8,827,999 | |
| 1,900,000 | | Oversea-Chinese Banking Corporation Ltd. (5 Year CMT Rate + 1.58%) | | | 1.83 | % (a) | | | 09/10/2030 | | | | 1,884,629 | |
| 1,075,405 | | Panama Metro Line SP | | | 0.00 | % (a) | | | 12/05/2022 | | | | 1,051,219 | |
| 4,090,237 | | Panama Metro Line SP | | | 0.00 | % | | | 12/05/2022 | | | | 3,998,247 | |
| 1,966,257 | | Peru Enhanced Pass-Through Finance Ltd. | | | 0.00 | % | | | 06/02/2025 | | | | 1,887,607 | |
| 1,766,000 | | Perusahaan Listrik Negara PT | | | 5.50 | % | | | 11/22/2021 | | | | 1,823,174 | |
| 3,800,000 | | Petrobras Global Finance B.V. | | | 4.38 | % | | | 05/20/2023 | | | | 3,985,820 | |
| 2,700,000 | | Petronas Capital Ltd. | | | 3.13 | % | | | 03/18/2022 | | | | 2,766,758 | |
| 2,500,000 | | PNC Funding Corporation | | | 3.30 | % | | | 03/08/2022 | | | | 2,563,773 | |
| 4,105,000 | | POSCO | | | 2.38 | % | | | 11/12/2022 | | | | 4,208,750 | |
| 3,300,000 | | POSCO | | | 2.38 | % | | | 01/17/2023 | | | | 3,388,500 | |
| 1,000,000 | | POSCO | | | 2.75 | % | | | 07/15/2024 | | | | 1,056,348 | |
| 1,550,000 | | PSA Treasury Pte Ltd. | | | 2.50 | % | | | 04/12/2026 | | | | 1,619,779 | |
| 10,250,000 | | Reliance Industries Ltd. | | | 5.40 | % | | | 02/14/2022 | | | | 10,652,412 | |
| 7,335,000 | | Royal Bank of Canada (Secured Overnight Financing Rate + 0.53%) | | | 0.55 | % | | | 01/20/2026 | | | | 7,327,943 | |
| 5,520,000 | | Royal Bank of Scotland Group PLC (3 Month LIBOR USD + 1.55%) | | | 1.75 | % | | | 06/25/2024 | | | | 5,641,315 | |
| 8,478,000 | | Santander UK PLC | | | 2.10 | % | | | 01/13/2023 | | | | 8,717,164 | |
| 4,000,000 | | Saudi Arabian Oil Company | | | 2.75 | % | | | 04/16/2022 | | | | 4,100,767 | |
| 200,000 | | Saudi Arabian Oil Company | | | 1.25 | % (a) | | | 11/24/2023 | | | | 201,453 | |
| 8,000,000 | | Scotiabank Peru S.A. (3 Month LIBOR USD + 3.86%) | | | 4.50 | % | | | 12/13/2027 | | | | 8,354,280 | |
| 1,400,000 | | SingTel Group Treasury Pte Ltd. | | | 3.25 | % | | | 06/30/2025 | | | | 1,502,349 | |
| 2,355,000 | | SingTel Group Treasury Pte Ltd. | | | 2.38 | % | | | 10/03/2026 | | | | 2,467,465 | |
| 1,950,000 | | State Grid Overseas Investment Ltd. | | | 3.13 | % | | | 05/22/2023 | | | | 2,039,975 | |
| 1,867,000 | | State Grid Overseas Investment Ltd. | | | 1.00 | % | | | 08/05/2025 | | | | 1,819,233 | |
| 6,080,000 | | Sumitomo Mitsui Trust Bank Ltd. | | | 0.80 | % (a) | | | 09/12/2023 | | | | 6,100,601 | |
| 7,250,000 | | Telefonica Chile S.A. | | | 3.88 | % | | | 10/12/2022 | | | | 7,587,451 | |
| 2,000,000 | | Temasek Financial Ltd. | | | 2.38 | % | | | 01/23/2023 | | | | 2,072,223 | |
| 5,000,000 | | Tencent Holdings Ltd. | | | 1.81 | % (a) | | | 01/26/2026 | | | | 5,023,401 | |
| 7,950,000 | | TNB Global Ventures Capital BHD | | | 3.24 | % | | | 10/19/2026 | | | | 8,462,617 | |
| 6,105,000 | | Toronto-Dominion Bank (Secured Overnight Financing Rate + 0.36%) | | | 0.37 | % | | | 03/04/2024 | | | | 6,110,017 | |
| 5,350,000 | | Toronto-Dominion Bank (Secured Overnight Financing Rate + 0.48%) | | | 0.50 | % | | | 01/27/2023 | | | | 5,373,945 | |
| 8,290,000 | | UBS Group Funding Switzerland AG (1 Year CMT Rate + 0.83%) | | | 1.01 | % (a) | | | 07/30/2024 | | | | 8,342,974 | |
| 4,150,000 | | Unifin Financiera S.A.B. de C.V. | | | 7.25 | % | | | 09/27/2023 | | | | 4,195,650 | |
| 2,750,000 | | Unifin Financiera S.A.B. de C.V. | | | 7.00 | % | | | 01/15/2025 | | | | 2,720,259 | |
| 1,900,000 | | Union Bank of the Philippines | | | 3.37 | % | | | 11/29/2022 | | | | 1,972,715 | |
| 200,000 | | United Overseas Bank Ltd. (3 Month LIBOR USD + 0.48%) | | | 0.70 | % | | | 04/23/2021 | | | | 200,049 | |
| 2,750,000 | | United Overseas Bank Ltd. (5 Year CMT Rate + 1.50%) | | | 3.75 | % | | | 04/15/2029 | | | | 2,943,627 | |
| 600,000 | | United Overseas Bank Ltd. (5 Year CMT Rate + 1.52%) | | | 1.75 | % | | | 03/16/2031 | | | | 592,311 | |
| 2,493,000 | | United Overseas Bank Ltd. (5 Year Swap Rate USD + 1.65%) | | | 2.88 | % | | | 03/08/2027 | | | | 2,541,190 | |
| 5,700,000 | | United Overseas Bank Ltd. (5 Year Swap Rate USD + 2.24%) | | | 3.50 | % | | | 09/16/2026 | | | | 5,778,290 | |
| 1,500,000 | | Vedanta Resources Ltd. | | | 7.13 | % | | | 05/31/2023 | | | | 1,339,208 | |
| 200,000 | | Vedanta Resources Ltd. | | | 6.13 | % | | | 08/09/2024 | | | | 161,271 | |
| 5,500,000 | | Volkswagen Group of America Finance LLC | | | 0.88 | % (a) | | | 11/22/2023 | | | | 5,524,906 | |
| | | | | | | | | | | | | | |
Total Foreign Corporate Bonds (Cost $543,611,155) | | | | | | | | 548,741,826 | |
| | | | | | | | | | | | | | |
Foreign Government Bonds, Foreign Agencies and Foreign Government Sponsored Corporations - 0.9% | | | | | | | | | | | | |
| 2,600,000 | | Abu Dhabi Government International Bond | | | 0.75 | % (a) | | | 09/02/2023 | | | | 2,611,648 | |
| 3,000,000 | | Abu Dhabi Government International Bond | | | 2.50 | % (a) | | | 04/16/2025 | | | | 3,168,876 | |
| 11,600,000 | | Brazilian Government International Bond | | | 2.88 | % | | | 06/06/2025 | | | | 11,729,920 | |
| 3,500,000 | | Colombia Government International Bond | | | 2.63 | % | | | 03/15/2023 | | | | 3,608,448 | |
| 1,759,000 | | Indonesia Government International Bond | | | 3.75 | % | | | 04/25/2022 | | | | 1,817,197 | |
| 500,000 | | Indonesia Government International Bond | | | 2.95 | % | | | 01/11/2023 | | | | 518,607 | |
| 2,130,000 | | Indonesia Government International Bond | | | 3.38 | % | | | 04/15/2023 | | | | 2,239,631 | |
| 300,000 | | Malaysia Sovereign Sukuk BHD | | | 3.04 | % | | | 04/22/2025 | | | | 320,957 | |
| 300,000 | | Mexico Government International Bond | | | 3.90 | % | | | 04/27/2025 | | | | 330,459 | |
| 7,350,000 | | Panama Government International Bond | | | 4.00 | % | | | 09/22/2024 | | | | 8,020,981 | |
| 3,300,000 | | Panama Government International Bond | | | 3.75 | % | | | 03/16/2025 | | | | 3,608,699 | |
| 800,000 | | Perusahaan Penerbit | | | 3.30 | % | | | 11/21/2022 | | | | 834,844 | |
| 2,000,000 | | Perusahaan Penerbit | | | 3.75 | % | | | 03/01/2023 | | | | 2,110,850 | |
| 6,600,000 | | Perusahaan Penerbit | | | 2.30 | % | | | 06/23/2025 | | | | 6,781,830 | |
| 11,800,000 | | Peruvian Government International Bond | | | 2.39 | % | | | 01/23/2026 | | | | 12,168,396 | |
| 4,300,000 | | Qatar Government International Bond | | | 2.38 | % | | | 06/02/2021 | | | | 4,316,228 | |
| 1,600,000 | | Qatar Government International Bond | | | 4.50 | % | | | 01/20/2022 | | | | 1,653,696 | |
| 6,000,000 | | Saudi Government International Bond | | | 2.38 | % | | | 10/26/2021 | | | | 6,066,600 | |
| 4,500,000 | | Saudi Government International Bond | | | 2.88 | % | | | 03/04/2023 | | | | 4,683,420 | |
| 1,700,000 | | Wakala Global Sukuk BHD | | | 4.65 | % | | | 07/06/2021 | | | | 1,718,550 | |
| | | | | | | | | | | | | | |
Total Foreign Government Bonds, Foreign Agencies and Foreign Government Sponsored Corporations (Cost $76,588,340) | | | | | | | | 78,309,837 | |
| | | | | | | | | | | | | | |
Non-Agency Commercial Mortgage Backed Obligations - 11.0% | | | | | | | | | | | | |
| 3,553,000 | | 20 Times Square Trust, Series 2018-20TS-F | | | 3.10 | % (a)(b) | | | 05/15/2035 | | | | 3,422,601 | |
| 3,392,000 | | 20 Times Square Trust, Series 2018-20TS-G | | | 3.10 | % (a)(b) | | | 05/15/2035 | | | | 3,114,291 | |
| 8,415,000 | | Alen Mortgage Trust, Series 2021-ACEN-D (1 Month LIBOR USD + 3.10%, 3.10% Floor) | | | 3.21 | % (a) | | | 04/15/2034 | | | | 8,451,869 | |
| 2,000,000 | | Arbor Realty Ltd., Series 2019-FL1-B (1 Month LIBOR USD + 1.70%) | | | 1.81 | % (a) | | | 05/15/2037 | | | | 2,004,380 | |
| 2,000,000 | | Arbor Realty Ltd., Series 2020-FL1-B (1 Month LIBOR USD + 1.80%, 1.80% Floor) | | | 1.91 | % (a) | | | 02/15/2035 | | | | 2,005,190 | |
| 2,830,000 | | Arbor Realty Ltd., Series 2020-FL1-D (1 Month LIBOR USD + 2.45%, 2.45% Floor) | | | 2.56 | % (a) | | | 02/15/2035 | | | | 2,795,519 | |
| 12,000,000 | | AREIT Trust, Series 2019-CRE3-C (1 Month LIBOR USD + 1.90%, 1.90% Floor) | | | 2.01 | % (a) | | | 09/14/2036 | | | | 11,954,448 | |
| 1,251,000 | | AREIT Trust, Series 2019-CRE3-D (1 Month LIBOR USD + 2.65%, 2.65% Floor) | | | 2.76 | % (a) | | | 09/14/2036 | | | | 1,237,115 | |
| 9,763,000 | | Atrium Hotel Portfolio Trust, Series 2018-ATRM-E (1 Month LIBOR USD + 3.40%, 3.40% Floor) | | | 3.51 | % (a) | | | 06/15/2035 | | | | 9,467,384 | |
| 7,231,000 | | BAMLL Commercial Mortgage Securities Trust, Series 2019-AHT-D (1 Month LIBOR USD + 2.50%, 2.50% Floor) | | | 2.61 | % (a) | | | 03/15/2034 | | | | 7,163,667 | |
| 4,952,000 | | Bancorp Commercial Mortgage Trust, Series 2018-CRE4-D (1 Month LIBOR USD + 2.10%, 0.25% Floor) | | | 2.21 | % (a) | | | 09/15/2035 | | | | 4,911,664 | |
| 3,711,000 | | Bancorp Commercial Mortgage Trust, Series 2019-CRE5-D (1 Month LIBOR USD + 2.35%, 2.35% Floor) | | | 2.46 | % (a) | | | 03/15/2036 | | | | 3,678,524 | |
| 3,705,000 | | Bancorp Commercial Mortgage Trust, Series 2019-CRE6-E (1 Month LIBOR USD + 2.85%, 2.85% Floor) | | | 2.96 | % (a) | | | 09/15/2036 | | | | 3,543,603 | |
| 1,174,000 | | Barclays Commercial Mortgage Securities LLC, Series 2017-DELC-C (1 Month LIBOR USD + 1.20%, 1.20% Floor) | | | 1.31 | % (a) | | | 08/15/2036 | | | | 1,173,411 | |
| 1,338,000 | | Barclays Commercial Mortgage Securities LLC, Series 2017-DELC-D (1 Month LIBOR USD + 1.70%, 1.70% Floor) | | | 1.81 | % (a) | | | 08/15/2036 | | | | 1,336,920 | |
| 17,543,000 | | Barclays Commercial Mortgage Securities LLC, Series 2017-DELC-F (1 Month LIBOR USD + 3.50%, 3.50% Floor) | | | 3.61 | % (a) | | | 08/15/2036 | | | | 15,934,177 | |
| 4,779,000 | | BBCMS Mortgage Trust, Series 2018-BXH-C (1 Month LIBOR USD + 1.50%, 1.50% Floor) | | | 1.61 | % (a) | | | 10/15/2037 | | | | 4,746,454 | |
| 10,250,000 | | BBCMS Mortgage Trust, Series 2018-CBM-E (1 Month LIBOR USD + 3.55%, 3.55% Floor) | | | 3.66 | % (a) | | | 07/15/2037 | | | | 9,991,934 | |
| 15,176,000 | | BBCMS Mortgage Trust, Series 2018-TALL-F (1 Month LIBOR USD + 3.24%, 3.24% Floor) | | | 3.34 | % (a) | | | 03/15/2037 | | | | 13,727,099 | |
| 1,160,000 | | BBCMS Mortgage Trust, Series 2019-BWAY-D (1 Month LIBOR USD + 2.16%, 2.16% Floor) | | | 2.27 | % (a) | | | 11/15/2034 | | | | 1,145,925 | |
| 11,001,000 | | BBCMS Mortgage Trust, Series 2019-BWAY-E (1 Month LIBOR USD + 2.85%, 2.85% Floor) | | | 2.96 | % (a) | | | 11/15/2034 | | | | 10,264,179 | |
| 7,538,000 | | BB-UBS Trust, Series 2012-TFT-TE | | | 3.56 | % (a)(b)(e) | | | 06/05/2030 | | | | 6,210,941 | |
| 2,000,000 | | BDS Ltd., Series 2019-FL4-B (1 Month LIBOR USD + 1.75%, 1.75% Floor) | | | 1.86 | % (a) | | | 08/15/2036 | | | | 1,992,000 | |
| 14,962,000 | | BFLD, Series 2019-DPLO-F (1 Month LIBOR USD + 2.54%, 2.54% Floor) | | | 2.65 | % (a) | | | 10/15/2034 | | | | 14,633,448 | |
| 9,345,000 | | BHMS Trust, Series 2018-ATLS-C (1 Month LIBOR USD + 1.90%, 1.90% Floor) | | | 2.01 | % (a) | | | 07/15/2035 | | | | 9,320,409 | |
| 165,041,500 | | BHMS Trust, Series 2018-ATLS-XCP | | | 0.00 | % (a)(b)(i) | | | 07/15/2035 | | | | 1,650 | |
| 4,571,700 | | BHP Trust, Series 2019-BXHP-D (1 Month LIBOR USD + 1.77%, 1.77% Floor) | | | 1.88 | % (a) | | | 08/15/2036 | | | | 4,576,530 | |
| 7,491,000 | | Braemar Hotels & Resorts Trust, Series 2018-PRME-E (1 Month LIBOR USD + 2.40%, 2.40% Floor) | | | 2.51 | % (a) | | | 06/15/2035 | | | | 7,177,086 | |
| 2,608,000 | | BX Commercial Mortgage Trust, Series 2018-BIOA-D (1 Month LIBOR USD + 1.32%, 1.35% Floor) | | | 1.43 | % (a) | | | 03/15/2037 | | | | 2,611,700 | |
| 12,515,000 | | BX Commercial Mortgage Trust, Series 2019-IMC-D (1 Month LIBOR USD + 1.90%, 1.90% Floor) | | | 2.01 | % (a) | | | 04/15/2034 | | | | 12,381,913 | |
| 6,882,000 | | BX Commercial Mortgage Trust, Series 2019-IMC-F (1 Month LIBOR USD + 2.90%, 2.90% Floor) | | | 3.01 | % (a) | | | 04/15/2034 | | | | 6,713,868 | |
| 5,700,000 | | BX Commercial Mortgage Trust, Series 2021-MFM1-E (1 Month LIBOR USD + 2.25%, 2.25% Floor) | | | 2.36 | % (a) | | | 01/15/2034 | | | | 5,709,386 | |
| 2,665,589 | | BX Trust, Series 2017-APPL-E (1 Month LIBOR USD + 3.15%, 3.15% Floor) | | | 3.26 | % (a) | | | 07/15/2034 | | | | 2,674,846 | |
| 1,680,598 | | BX Trust, Series 2017-SLCT-D (1 Month LIBOR USD + 2.05%, 2.05% Floor) | | | 2.16 | % (a) | | | 07/15/2034 | | | | 1,684,785 | |
| 4,119,100 | | BX Trust, Series 2017-SLCT-E (1 Month LIBOR USD + 3.15%, 3.15% Floor) | | | 3.26 | % (a) | | | 07/15/2034 | | | | 4,136,043 | |
| 3,159,000 | | BX Trust, Series 2018-GW-E (1 Month LIBOR USD + 1.97%, 1.97% Floor) | | | 2.08 | % (a) | | | 05/15/2035 | | | | 3,158,387 | |
| 3,434,000 | | BX Trust, Series 2018-GW-F (1 Month LIBOR USD + 2.42%, 2.42% Floor) | | | 2.53 | % (a) | | | 05/15/2035 | | | | 3,428,729 | |
| 1,414,000 | | BX Trust, Series 2018-GW-G (1 Month LIBOR USD + 2.92%, 2.92% Floor) | | | 3.03 | % (a) | | | 05/15/2035 | | | | 1,404,993 | |
| 14,384,020 | | BX Trust, Series 2019-MMP-E (1 Month LIBOR USD + 1.90%, 1.90% Floor) | | | 2.01 | % (a) | | | 08/15/2036 | | | | 14,165,344 | |
| 9,594,000 | | BX Trust, Series 2019-OC11-E | | | 4.08 | % (a)(b) | | | 12/09/2041 | | | | 9,555,781 | |
| 11,389,000 | | Carbon Capital Commercial Mortgage Trust, Series 2019-FL2-B (1 Month LIBOR USD + 2.85%, 2.85% Floor) | | | 2.96 | % (a) | | | 10/15/2035 | | | | 10,890,273 | |
| 48,260,900 | | CD Commercial Mortgage Trust, Series 2017-CD3-XA | | | 1.01 | % (b)(i) | | | 02/10/2050 | | | | 2,220,083 | |
| 66,032,713 | | CD Commercial Mortgage Trust, Series 2017-CD4-XA | | | 1.29 | % (b)(i) | | | 05/10/2050 | | | | 3,656,093 | |
| 3,553,000 | | CF Trust, Series 2019-MF1-E (1 Month LIBOR USD + 2.20%, 3.20% Floor) | | | 3.20 | % (a) | | | 08/21/2032 | | | | 3,563,336 | |
| 20,988,186 | | CFCRE Commercial Mortgage Trust, Series 2016-C3-XA | | | 0.99 | % (b)(i) | | | 01/10/2048 | | | | 858,104 | |
| 21,602,405 | | CFCRE Commercial Mortgage Trust, Series 2016-C4-XA | | | 1.65 | % (b)(i) | | | 05/10/2058 | | | | 1,439,018 | |
| 56,195,006 | | CFCRE Commercial Mortgage Trust, Series 2017-C8-XA | | | 1.59 | % (b)(i) | | | 06/15/2050 | | | | 3,781,980 | |
| 16,201,000 | | CFCRE Commercial Mortgage Trust, Series 2017-C8-XB | | | 0.95 | % (b)(i) | | | 06/15/2050 | | | | 823,241 | |
| 39,410,000 | | CFCRE Commercial Mortgage Trust, Series 2018-TAN-X | | | 1.63 | % (a)(b)(i) | | | 02/15/2033 | | | | 995,910 | |
| 4,532,000 | | CHT Mortgage Trust, Series 2017-CSMO-E (1 Month LIBOR USD + 3.00%, 3.00% Floor) | | | 3.11 | % (a) | | | 11/15/2036 | | | | 4,548,209 | |
| 441,000 | | CHT Mortgage Trust, Series 2017-CSMO-F (1 Month LIBOR USD + 3.74%, 3.74% Floor) | | | 3.85 | % (a) | | | 11/15/2036 | | | | 443,190 | |
| 7,543,571 | | Citigroup Commercial Mortgage Trust, Series 2014-GC25-XA | | | 0.99 | % (b)(i) | | | 10/10/2047 | | | | 217,603 | |
| 641,000 | | Citigroup Commercial Mortgage Trust, Series 2015-GC27-D | | | 4.42 | % (a)(b) | | | 02/10/2048 | | | | 624,711 | |
| 5,157,976 | | Citigroup Commercial Mortgage Trust, Series 2015-GC27-XA | | | 1.34 | % (b)(i) | | | 02/10/2048 | | | | 216,497 | |
| 1,750,000 | | Citigroup Commercial Mortgage Trust, Series 2015-GC31-C | | | 4.05 | % (b) | | | 06/10/2048 | | | | 1,823,334 | |
| 18,386,959 | | Citigroup Commercial Mortgage Trust, Series 2016-GC36-XA | | | 1.22 | % (b)(i) | | | 02/10/2049 | | | | 892,111 | |
| 13,001,975 | | Citigroup Commercial Mortgage Trust, Series 2016-P3-XA | | | 1.70 | % (b)(i) | | | 04/15/2049 | | | | 802,159 | |
| 13,358,375 | | Citigroup Commercial Mortgage Trust, Series 2016-P4-XA | | | 1.95 | % (b)(i) | | | 07/10/2049 | | | | 974,687 | |
| 13,491,860 | | Citigroup Commercial Mortgage Trust, Series 2017-P7-XA | | | 1.11 | % (b)(i) | | | 04/14/2050 | | | | 675,033 | |
| 4,865,000 | | Citigroup Commercial Mortgage Trust, Series 2019-SST2-D (1 Month LIBOR USD + 1.60%, 1.60% Floor) | | | 1.71 | % (a) | | | 12/15/2036 | | | | 4,872,933 | |
| 7,736,000 | | Citigroup Commercial Mortgage Trust, Series 2019-SST2-E (1 Month LIBOR USD + 2.00%, 2.00% Floor) | | | 2.11 | % (a) | | | 12/15/2036 | | | | 7,750,283 | |
| 2,000,000 | | CLNC Ltd., Series 2019-FL1-B (1 Month LIBOR USD + 1.90%, 1.90% Floor) | | | 2.01 | % (a) | | | 08/20/2035 | | | | 1,996,960 | |
| 19,958,000 | | CLNC Ltd., Series 2019-FL1-D (1 Month LIBOR USD + 2.90%, 2.90% Floor) | | | 3.01 | % (a) | | | 08/20/2035 | | | | 19,440,130 | |
| 7,958,500 | | Commercial Mortgage Pass-Through Certificates, Series 2013-CR10-XA | | | 0.65 | % (b)(i) | | | 08/10/2046 | | | | 111,960 | |
| 24,179,239 | | Commercial Mortgage Pass-Through Certificates, Series 2013-CR12-XA | | | 1.11 | % (b)(i) | | | 10/10/2046 | | | | 581,431 | |
| 2,371,970 | | Commercial Mortgage Pass-Through Certificates, Series 2014-CR17-XA | | | 0.97 | % (b)(i) | | | 05/10/2047 | | | | 56,255 | |
| 233,000 | | Commercial Mortgage Pass-Through Certificates, Series 2014-CR19-C | | | 4.71 | % (b) | | | 08/10/2047 | | | | 245,852 | |
| 1,876,000 | | Commercial Mortgage Pass-Through Certificates, Series 2014-FL5-D (1 Month LIBOR USD + 4.00%, 4.00% Floor) | | | 1.50 | % (a) | | | 10/15/2031 | | | | 1,756,539 | |
| 18,171,479 | | Commercial Mortgage Pass-Through Certificates, Series 2015-CR22-XA | | | 0.89 | % (b)(i) | | | 03/10/2048 | | | | 475,013 | |
| 33,660,126 | | Commercial Mortgage Pass-Through Certificates, Series 2015-CR25-XA | | | 0.83 | % (b)(i) | | | 08/10/2048 | | | | 1,037,119 | |
| 36,492,669 | | Commercial Mortgage Pass-Through Certificates, Series 2015-CR27-XA | | | 0.92 | % (b)(i) | | | 10/10/2048 | | | | 1,297,285 | |
| 5,373,000 | | Commercial Mortgage Pass-Through Certificates, Series 2015-DC1-C | | | 4.31 | % (b) | | | 02/10/2048 | | | | 5,262,118 | |
| 10,088,549 | | Commercial Mortgage Pass-Through Certificates, Series 2015-DC1-XA | | | 1.02 | % (b)(i) | | | 02/10/2048 | | | | 287,460 | |
| 46,896,567 | | Commercial Mortgage Pass-Through Certificates, Series 2015-LC21-XA | | | 0.69 | % (b)(i) | | | 07/10/2048 | | | | 1,145,360 | |
| 1,470,000 | | Commercial Mortgage Pass-Through Certificates, Series 2015-LC23-C | | | 4.62 | % (b) | | | 10/10/2048 | | | | 1,582,621 | |
| 1,769,000 | | Commercial Mortgage Pass-Through Certificates, Series 2016-CR28-C | | | 4.64 | % (b) | | | 02/10/2049 | | | | 1,906,122 | |
| 16,691,519 | | Commercial Mortgage Pass-Through Certificates, Series 2016-DC2-XA | | | 0.96 | % (b)(i) | | | 02/10/2049 | | | | 629,370 | |
| 11,396,000 | | Commercial Mortgage Pass-Through Certificates, Series 2018-HCLV-D (1 Month LIBOR USD + 2.18%, 2.18% Floor) | | | 2.28 | % (a) | | | 09/15/2033 | | | | 11,204,739 | |
| 944,000 | | Commercial Mortgage Pass-Through Certificates, Series 2021-LBA-G (1 Month LIBOR USD + 2.65%, 2.65% Floor) | | | 2.80 | % (a) | | | 03/15/2038 | | | | 947,244 | |
| 12,389 | | Credit Suisse Commercial Mortgage Trust, Series 2007-C1-AM | | | 5.42 | % | | | 02/15/2040 | | | | 13,018 | |
| 9,873,828 | | Credit Suisse Mortgage Capital Certificates, Series 2014-USA-X1 | | | 0.54 | % (a)(b)(i) | | | 09/15/2037 | | | | 211,464 | |
| 26,822,601 | | CSAIL Commercial Mortgage Trust, Series 2015-C1-XA | | | 0.83 | % (b)(i) | | | 04/15/2050 | | | | 700,317 | |
| 3,329,892 | | CSAIL Commercial Mortgage Trust, Series 2016-C6-XA | | | 1.92 | % (b)(i) | | | 01/15/2049 | | | | 236,873 | |
| 1,538,000 | | CSAIL Commercial Mortgage Trust, Series 2020-C19-C | | | 3.61 | % (b) | | | 03/15/2053 | | | | 1,560,217 | |
| 126,742,000 | | CSAIL Commercial Mortgage Trust, Series 2021-C20-XA | | | 1.17 | % (b)(i) | | | 03/15/2054 | | | | 10,495,125 | |
| 6,499,000 | | CSMC Trust, Series 2017-CHOP-E (1 Month LIBOR USD + 3.30%, 3.30% Floor) | | | 3.41 | % (a) | | | 07/15/2032 | | | | 5,969,570 | |
| 2,979,000 | | CSMC Trust, Series 2020-FACT-C (1 Month LIBOR USD + 2.60%, 2.60% Floor) | | | 2.71 | % (a) | | | 10/15/2037 | | | | 3,015,467 | |
| 8,697,000 | | CSMC Trust, Series 2020-FACT-D (1 Month LIBOR USD + 3.71%, 3.71% Floor) | | | 3.82 | % (a) | | | 10/15/2037 | | | | 8,835,528 | |
| 6,295,000 | | CSMC Trust, Series 2020-NET-D | | | 3.70 | % (a)(b) | | | 08/15/2037 | | | | 6,432,287 | |
| 3,750,000 | | DBCG Mortgage Trust, Series 2017-BBG-C (1 Month LIBOR USD + 1.00%, 1.10% Floor) | | | 1.11 | % (a) | | | 06/15/2034 | | | | 3,731,239 | |
| 9,876,000 | | DBGS Mortgage Trust, Series 2018-5BP-F (1 Month LIBOR USD + 2.45%, 2.45% Floor) | | | 2.56 | % (a) | | | 06/15/2033 | | | | 9,421,961 | |
| 17,615,734 | | Deutsche Bank Commercial Mortgage Trust, Series 2016-C1-XA | | | 1.43 | % (b)(i) | | | 05/10/2049 | | | | 997,438 | |
| 2,000,000 | | Exantas Capital Corporation Ltd., Series 2020-RSO8-B (1 Month LIBOR USD + 1.75%, 1.75% Floor) | | | 1.86 | % (a) | | | 03/15/2035 | | | | 2,008,154 | |
| 13,253,000 | | Fontainebleau Miami Beach Trust, Series 2019-FBLU-F | | | 3.96 | % (a)(b) | | | 12/10/2036 | | | | 13,392,294 | |
| 14,992,000 | | Fontainebleau Miami Beach Trust, Series 2019-FBLU-G | | | 3.96 | % (a)(b) | | | 12/10/2036 | | | | 14,927,890 | |
| 3,348,616 | | FREMF Mortgage Trust, Series 2015-KF08-B (1 Month LIBOR USD + 4.85%, 4.85% Floor) | | | 4.97 | % (a) | | | 02/25/2022 | | | | 3,352,367 | |
| 2,663,200 | | FREMF Mortgage Trust, Series 2016-KF18-B (1 Month LIBOR USD + 5.50%, 5.50% Floor) | | | 5.62 | % (a) | | | 05/25/2026 | | | | 2,666,962 | |
| 3,185,210 | | FREMF Mortgage Trust, Series 2016-KF20-B (1 Month LIBOR USD + 5.05%) | | | 5.17 | % | | | 07/25/2023 | | | | 3,257,385 | |
| 640,681 | | FREMF Mortgage Trust, Series 2016-KF22-B (1 Month LIBOR USD + 5.05%, 5.05% Floor) | | | 5.17 | % (a) | | | 07/25/2023 | | | | 650,186 | |
| 2,149,440 | | FREMF Mortgage Trust, Series 2017-KF27-B (1 Month LIBOR USD + 4.35%, 4.35% Floor) | | | 4.47 | % (a) | | | 12/25/2026 | | | | 2,147,443 | |
| 5,907,608 | | FREMF Mortgage Trust, Series 2017-KF28-B (1 Month LIBOR USD + 4.00%, 4.00% Floor) | | | 4.12 | % (a) | | | 01/25/2024 | | | | 5,916,119 | |
| 2,481,119 | | FREMF Mortgage Trust, Series 2017-KF30-B (1 Month LIBOR USD + 3.25%, 3.25% Floor) | | | 3.37 | % (a) | | | 03/25/2027 | | | | 2,479,966 | |
| 6,210,069 | | FREMF Mortgage Trust, Series 2017-KSW2-B (1 Month LIBOR USD + 2.65%, 2.65% Floor) | | | 2.77 | % (a) | | | 05/25/2027 | | | | 6,287,557 | |
| 9,365,000 | | FREMF Mortgage Trust, Series 2018-KC02-C | | | 0.00 | % (a)(j) | | | 08/25/2025 | | | | 6,917,115 | |
| 2,453,978 | | FREMF Mortgage Trust, Series 2018-KF49-B (1 Month LIBOR USD + 1.90%, 1.90% Floor) | | | 2.02 | % (a) | | | 06/25/2025 | | | | 2,416,062 | |
| 3,492,117 | | FREMF Mortgage Trust, Series 2019-KF69-B (1 Month LIBOR USD + 2.30%, 2.30% Floor) | | | 2.42 | % (a) | | | 08/25/2029 | | | | 3,513,420 | |
| 4,250,000 | | GPMT Ltd., Series 2018-FL1-C (1 Month LIBOR USD + 2.15%, 2.15% Floor) | | | 2.26 | % (a) | | | 11/19/2035 | | | | 4,246,579 | |
| 13,636,000 | | Great Wolf Trust, Series 2019-WOLF-F (1 Month LIBOR USD + 3.13%, 3.13% Floor) | | | 3.24 | % (a) | | | 12/15/2036 | | | | 13,078,746 | |
| 2,000,000 | | Greystone Commercial Real Estate Notes, Series 2019-FL2-B (1 Month LIBOR USD + 1.60%, 1.60% Floor) | | | 1.71 | % (a) | | | 09/15/2037 | | | | 1,997,000 | |
| 7,810,000 | | Greystone Commercial Real Estate Notes, Series 2019-FL2-C (1 Month LIBOR USD + 2.00%, 2.00% Floor) | | | 2.11 | % (a) | | | 09/15/2037 | | | | 7,809,563 | |
| 3,903,000 | | Greystone Commercial Real Estate Notes, Series 2019-FL2-D (1 Month LIBOR USD + 2.40%, 2.40% Floor) | | | 2.51 | % (a) | | | 09/15/2037 | | | | 3,838,600 | |
| 12,469,000 | | GS Mortgage Securities Corporation Trust, Series 2012-ALOH-A | | | 3.55 | % (a) | | | 04/10/2034 | | | | 12,652,888 | |
| 3,840,292 | | GS Mortgage Securities Corporation, Series 2014-GC24-XA | | | 0.73 | % (b)(i) | | | 09/10/2047 | | | | 79,172 | |
| 32,535,522 | | GS Mortgage Securities Corporation, Series 2015-GC32-XA | | | 0.74 | % (b)(i) | | | 07/10/2048 | | | | 873,722 | |
| 1,518,000 | | GS Mortgage Securities Corporation, Series 2018-LUAU-E (1 Month LIBOR USD + 2.55%, 2.55% Floor) | | | 2.66 | % (a) | | | 11/15/2032 | | | | 1,507,086 | |
| 5,000,000 | | GS Mortgage Securities Corporation, Series 2018-TWR-E (1 Month LIBOR USD + 2.10%, 2.10% Floor) | | | 2.21 | % (a) | | | 07/15/2031 | | | | 4,803,806 | |
| 5,000,000 | | GS Mortgage Securities Corporation, Series 2018-TWR-F (1 Month LIBOR USD + 2.80%, 2.80% Floor) | | | 2.91 | % (a) | | | 07/15/2031 | | | | 4,703,720 | |
| 5,000,000 | | GS Mortgage Securities Corporation, Series 2018-TWR-G (1 Month LIBOR USD + 3.92%, 3.93% Floor) | | | 4.03 | % (a) | | | 07/15/2031 | | | | 4,368,289 | |
| 13,059,000 | | GS Mortgage Securities Corporation, Series 2019-SOHO-E (1 Month LIBOR USD + 1.87%, 1.88% Floor) | | | 1.98 | % (a) | | | 06/15/2036 | | | | 12,441,295 | |
| 8,000,000 | | GS Mortgage Securities Corporation, Series 2019-SOHO-F (1 Month LIBOR USD + 2.20%, 2.20% Floor) | | | 2.31 | % (a) | | | 06/15/2036 | | | | 7,086,742 | |
| 1,802,000 | | GS Mortgage Securities Trust, Series 2014-GC26-D | | | 4.51 | % (a)(b) | | | 11/10/2047 | | | | 1,253,543 | |
| 8,772,783 | | GS Mortgage Securities Trust, Series 2015-GS1-XA | | | 0.76 | % (b)(i) | | | 11/10/2048 | | | | 266,943 | |
| 14,871,952 | | GS Mortgage Securities Trust, Series 2016-GS2-XA | | | 1.75 | % (b)(i) | | | 05/10/2049 | | | | 1,073,435 | |
| 26,199,142 | | GS Mortgage Securities Trust, Series 2016-GS3-XA | | | 1.22 | % (b)(i) | | | 10/10/2049 | | | | 1,401,953 | |
| 887,000 | | GS Mortgage Securities Trust, Series 2018-GS10-WLSA | | | 4.58 | % (a)(b) | | | 03/10/2033 | | | | 962,127 | |
| 1,760,000 | | GS Mortgage Securities Trust, Series 2018-GS10-WLSB | | | 4.58 | % (a)(b) | | | 03/10/2033 | | | | 1,847,562 | |
| 2,391,000 | | GS Mortgage Securities Trust, Series 2018-GS10-WLSC | | | 4.58 | % (a)(b) | | | 03/10/2033 | | | | 2,429,631 | |
| 2,314,000 | | GS Mortgage Securities Trust, Series 2018-GS10-WLSD | | | 4.58 | % (a)(b) | | | 03/10/2033 | | | | 2,280,481 | |
| 2,893,000 | | GS Mortgage Securities Trust, Series 2018-GS10-WLSE | | | 4.58 | % (a)(b) | | | 03/10/2033 | | | | 2,782,151 | |
| 12,284,000 | | GS Mortgage Securities Trust, Series 2019-SMP-E (1 Month LIBOR USD + 2.60%, 2.60% Floor) | | | 2.71 | % (a) | | | 08/15/2032 | | | | 11,414,164 | |
| 6,838,000 | | GS Mortgage Securities Trust, Series 2019-SMP-F (1 Month LIBOR USD + 3.10%, 3.10% Floor) | | | 3.21 | % (a) | | | 08/15/2032 | | | | 6,042,217 | |
| 14,505,000 | | GSCG Trust, Series 2019-600C-E | | | 3.99 | % (a)(b) | | | 09/06/2034 | | | | 14,311,969 | |
| 15,347,000 | | Hawaii Hotel Trust, Series 2019-MAUI-G (1 Month LIBOR USD + 3.15%, 3.15% Floor) | | | 3.26 | % (a) | | | 05/15/2038 | | | | 15,004,165 | |
| 1,056,782 | | HPLY Trust, Series 2019-HIT-D (1 Month LIBOR USD + 2.00%, 2.00% Floor) | | | 2.11 | % (a) | | | 11/15/2036 | | | | 1,052,787 | |
| 1,930,518 | | HPLY Trust, Series 2019-HIT-E (1 Month LIBOR USD + 2.35%, 2.35% Floor) | | | 2.46 | % (a) | | | 11/15/2036 | | | | 1,918,373 | |
| 10,531,207 | | HPLY Trust, Series 2019-HIT-F (1 Month LIBOR USD + 3.15%, 3.15% Floor) | | | 3.26 | % (a) | | | 11/15/2036 | | | | 10,107,905 | |
| 8,000,000 | | Hunt Ltd., Series 2017-FL1-C (1 Month LIBOR USD + 2.40%) | | | 2.51 | % (a) | | | 08/15/2034 | | | | 8,039,424 | |
| 4,916,390 | | IMT Trust, Series 2017-APTS-EFL (1 Month LIBOR USD + 2.15%, 2.15% Floor) | | | 2.26 | % (a) | | | 06/15/2034 | | | | 4,885,446 | |
| 275,643 | | IMT Trust, Series 2017-APTS-FFL (1 Month LIBOR USD + 2.85%, 2.85% Floor) | | | 2.96 | % (a) | | | 06/15/2034 | | | | 273,269 | |
| 6,339,000 | | JP Morgan Chase Commercial Mortgage Securities Corporation, Series 2014-C20-B | | | 4.40 | % (b) | | | 07/15/2047 | | | | 6,849,909 | |
| 16,992,885 | | JP Morgan Chase Commercial Mortgage Securities Corporation, Series 2015-JP1-XA | | | 0.92 | % (b)(i) | | | 01/15/2049 | | | | 597,833 | |
| 291,022 | | JP Morgan Chase Commercial Mortgage Securities Corporation, Series 2017-FL10-D (1 Month LIBOR USD + 1.90%, 1.90% Floor) | | | 2.01 | % (a) | | | 06/15/2032 | | | | 290,384 | |
| 4,932,000 | | JP Morgan Chase Commercial Mortgage Securities Corporation, Series 2018-LAQ-C (1 Month LIBOR USD + 1.60%, 1.60% Floor) | | | 1.71 | % (a) | | | 06/15/2032 | | | | 4,943,190 | |
| 690,400 | | JP Morgan Chase Commercial Mortgage Securities Corporation, Series 2018-LAQ-D (1 Month LIBOR USD + 2.10%, 2.10% Floor) | | | 2.21 | % (a) | | | 06/15/2032 | | | | 692,273 | |
| 1,826,400 | | JP Morgan Chase Commercial Mortgage Securities Corporation, Series 2018-LAQ-E (1 Month LIBOR USD + 3.00%, 3.00% Floor) | | | 3.11 | % (a) | | | 06/15/2035 | | | | 1,833,751 | |
| 928,053 | | JP Morgan Chase Commercial Mortgage Securities Trust, Series 2006-LDP9-AMS | | | 5.34 | % | | | 05/15/2047 | | | | 751,723 | |
| 35,785,316 | | JP Morgan Chase Commercial Mortgage Securities Trust, Series 2016-JP4-XA | | | 0.68 | % (b)(i) | | | 12/15/2049 | | | | 881,825 | |
| 3,776,000 | | JP Morgan Chase Commercial Mortgage Securities Trust, Series 2016-WIKI-E | | | 4.01 | % (a)(b) | | | 10/05/2031 | | | | 3,659,537 | |
| 336,000 | | JP Morgan Chase Commercial Mortgage Securities Trust, Series 2018-WPT-CFX | | | 4.95 | % (a) | | | 07/05/2033 | | | | 354,797 | |
| 5,245,000 | | JP Morgan Chase Commercial Mortgage Securities Trust, Series 2018-WPT-EFX | | | 5.54 | % (a) | | | 07/05/2033 | | | | 5,408,775 | |
| 4,216,000 | | JP Morgan Chase Commercial Mortgage Securities Trust, Series 2019-UES-C | | | 4.34 | % (a) | | | 05/05/2032 | | | | 4,284,131 | |
| 4,314,000 | | JP Morgan Chase Commercial Mortgage Securities Trust, Series 2019-UES-D | | | 4.45 | % (a)(b) | | | 05/05/2032 | | | | 4,396,743 | |
| 5,040,000 | | JP Morgan Chase Commercial Mortgage Securities Trust, Series 2019-UES-E | | | 4.45 | % (a)(b) | | | 05/05/2032 | | | | 4,982,065 | |
| 5,287,000 | | JP Morgan Chase Commercial Mortgage Securities Trust, Series 2019-UES-F | | | 4.45 | % (a)(b) | | | 05/05/2032 | | | | 5,081,500 | |
| 5,775,000 | | JP Morgan Chase Commercial Mortgage Securities Trust, Series 2019-UES-G | | | 4.45 | % (a)(b) | | | 05/05/2032 | | | | 5,249,741 | |
| 11,575,000 | | JP Morgan Chase Commercial Mortgage Securities Trust, Series 2020-NNN-EFX | | | 3.97 | % (a) | | | 01/16/2037 | | | | 11,590,177 | |
| 5,142,831 | | JPMBB Commercial Mortgage Securities Trust, Series 2014-C18-XA | | | 0.81 | % (b)(i) | | | 02/15/2047 | | | | 98,757 | |
| 500,000 | | JPMBB Commercial Mortgage Securities Trust, Series 2014-C23-C | | | 4.47 | % (b) | | | 09/15/2047 | | | | 517,407 | |
| 4,240,000 | | JPMBB Commercial Mortgage Securities Trust, Series 2014-C23-D | | | 3.97 | % (a)(b) | | | 09/15/2047 | | | | 4,243,324 | |
| 18,029,042 | | JPMBB Commercial Mortgage Securities Trust, Series 2014-C25-XA | | | 0.84 | % (b)(i) | | | 11/15/2047 | | | | 466,296 | |
| 1,303,000 | | JPMBB Commercial Mortgage Securities Trust, Series 2014-C26-C | | | 4.38 | % (b) | | | 01/15/2048 | | | | 1,357,491 | |
| 5,287,890 | | JPMBB Commercial Mortgage Securities Trust, Series 2015-C27-D | | | 3.85 | % (a)(b) | | | 02/15/2048 | | | | 4,742,696 | |
| 18,529,166 | | JPMBB Commercial Mortgage Securities Trust, Series 2015-C29-XA | | | 0.65 | % (b)(i) | | | 05/15/2048 | | | | 426,949 | |
| 25,757,633 | | JPMBB Commercial Mortgage Securities Trust, Series 2015-C30-XA | | | 0.51 | % (b)(i) | | | 07/15/2048 | | | | 483,556 | |
| 11,177,443 | | JPMBB Commercial Mortgage Securities Trust, Series 2015-C31-XA | | | 0.83 | % (b)(i) | | | 08/15/2048 | | | | 346,640 | |
| 17,972,271 | | JPMBB Commercial Mortgage Securities Trust, Series 2015-C32-XA | | | 1.21 | % (b)(i) | | | 11/15/2048 | | | | 567,812 | |
| 580,000 | | JPMBB Commercial Mortgage Securities Trust, Series 2015-C33-C | | | 4.61 | % (b) | | | 12/15/2048 | | | | 612,751 | |
| 9,040,000 | | JPMCC Commercial Mortgage Securities Trust, Series 2019-MFP-E (1 Month LIBOR USD + 2.16%, 2.16% Floor) | | | 2.27 | % (a) | | | 07/15/2036 | | | | 8,949,562 | |
| 1,712,000 | | JPMCC Commercial Mortgage Securities Trust, Series 2019-MFP-F (1 Month LIBOR USD + 3.00%, 3.00% Floor) | | | 3.11 | % (a) | | | 07/15/2036 | | | | 1,686,057 | |
| 10,895,525 | | KKR Industrial Portfolio Trust, Series 2020-AIP E | | | 2.73 | % (a)(d) | | | 03/15/2037 | | | | 10,963,661 | |
| 10,000,000 | | LCCM, Series 2017-LC26-C | | | 4.71 | % (a) | | | 07/12/2050 | | | | 9,816,536 | |
| 1,000,000 | | LoanCore Issuer Ltd., Series 2018-CRE1-C (1 Month LIBOR USD + 2.55%, 2.55% Floor) | | | 2.66 | % (a) | | | 05/15/2028 | | | | 999,392 | |
| 1,000,000 | | LoanCore Issuer Ltd., Series 2018-CRE1-D (1 Month LIBOR USD + 2.95%, 2.95% Floor) | | | 3.06 | % (a) | | | 05/15/2028 | | | | 1,003,169 | |
| 2,000,000 | | LoanCore Issuer Ltd., Series 2019-CRE2-B (1 Month LIBOR USD + 1.70%, 1.70% Floor) | | | 1.81 | % (a) | | | 05/15/2036 | | | | 2,003,750 | |
| 8,818,284 | | LSTAR Commercial Mortgage Trust, Series 2016-4-XA | | | 1.77 | % (a)(b)(i) | | | 03/10/2049 | | | | 415,917 | |
| 80,508,448 | | LSTAR Commercial Mortgage Trust, Series 2017-5-X | | | 0.99 | % (a)(b)(i) | | | 03/10/2050 | | | | 2,366,715 | |
| 2,512,000 | | Marathon CRE, Series 2018-FL1-C (1 Month LIBOR USD + 2.60%, 2.60% Floor) | | | 2.71 | % (a) | | | 06/15/2028 | | | | 2,488,199 | |
| 15,958,000 | | MBRT, Series 2019-MBR-F (1 Month LIBOR USD + 2.55%, 2.55% Floor) | | | 2.66 | % (a) | | | 11/15/2036 | | | | 15,788,614 | |
| 11,933,000 | | MFT Trust, Series 2020-ABC-D | | | 3.48 | % (a)(b) | | | 02/10/2042 | | | | 11,087,804 | |
| 3,575,000 | | MKT Mortgage Trust, Series 2020-525M-F | | | 2.94 | % (a)(b) | | | 02/12/2040 | | | | 3,177,109 | |
| 10,600,000 | | Morgan Stanley Bank of America Merrill Lynch Trust, Series 2012-CKSV-CK | | | 4.16 | % (a)(b) | | | 10/15/2030 | | | | 8,896,287 | |
| 3,435,853 | | Morgan Stanley Bank of America Merrill Lynch Trust, Series 2013-C12-XA | | | 0.59 | % (b)(i) | | | 10/15/2046 | | | | 41,067 | |
| 14,673,370 | | Morgan Stanley Bank of America Merrill Lynch Trust, Series 2013-C7-XA | | | 1.33 | % (b)(i) | | | 02/15/2046 | | | | 277,126 | |
| 4,198,385 | | Morgan Stanley Bank of America Merrill Lynch Trust, Series 2014-C14-XA | | | 1.00 | % (b)(i) | | | 02/15/2047 | | | | 94,363 | |
| 500,000 | | Morgan Stanley Bank of America Merrill Lynch Trust, Series 2014-C18-C | | | 4.52 | % (b) | | | 10/15/2047 | | | | 531,623 | |
| 120,000 | | Morgan Stanley Bank of America Merrill Lynch Trust, Series 2015-C20-C | | | 4.46 | % (b) | | | 02/15/2048 | | | | 128,095 | |
| 18,464,546 | | Morgan Stanley Bank of America Merrill Lynch Trust, Series 2016-C28-XA | | | 1.20 | % (b)(i) | | | 01/15/2049 | | | | 785,916 | |
| 5,250,000 | | Morgan Stanley Capital Trust, Series 2007-T27-C | | | 6.02 | % (a)(b) | | | 06/11/2042 | | | | 5,366,373 | |
| 2,330,000 | | Morgan Stanley Capital Trust, Series 2017-ASHF-D (1 Month LIBOR USD + 2.20%, 2.20% Floor) | | | 2.31 | % (a) | | | 11/15/2034 | | | | 2,311,202 | |
| 8,494,000 | | Morgan Stanley Capital Trust, Series 2017-ASHF-E (1 Month LIBOR USD + 3.15%, 3.15% Floor) | | | 3.26 | % (a) | | | 11/15/2034 | | | | 8,303,726 | |
| 1,683,000 | | Morgan Stanley Capital Trust, Series 2017-ASHF-F (1 Month LIBOR USD + 4.35%, 4.35% Floor) | | | 4.46 | % (a) | | | 11/15/2034 | | | | 1,570,224 | |
| 2,935,000 | | Morgan Stanley Capital Trust, Series 2018-SUN-D (1 Month LIBOR USD + 1.65%, 1.65% Floor) | | | 1.76 | % (a) | | | 07/15/2035 | | | | 2,924,505 | |
| 4,380,000 | | Morgan Stanley Capital Trust, Series 2018-SUN-F (1 Month LIBOR USD + 2.55%, 2.55% Floor) | | | 2.66 | % (a) | | | 07/15/2035 | | | | 4,343,121 | |
| 2,935,000 | | Morgan Stanley Capital Trust, Series 2018-SUN-G (1 Month LIBOR USD + 3.05%, 3.05% Floor) | | | 3.16 | % (a) | | | 07/15/2035 | | | | 2,864,774 | |
| 711,000 | | Morgan Stanley Capital Trust, Series 2019-NUGS-F (1 Month LIBOR USD + 2.84%, 4.34% Floor) | | | 4.34 | % (a) | | | 12/15/2036 | | | | 667,691 | |
| 13,327,000 | | Morgan Stanley Capital Trust, Series 2019-PLND-E (1 Month LIBOR USD + 2.15%, 2.15% Floor) | | | 2.26 | % (a) | | | 05/15/2036 | | | | 11,933,631 | |
| 1,331,000 | | Morgan Stanley Capital Trust, Series 2019-PLND-F (1 Month LIBOR USD + 2.80%, 2.80% Floor) | | | 2.91 | % (a) | | | 05/15/2036 | | | | 1,148,626 | |
| 4,342,683 | | Motel 6 Trust, Series 2017-MTL6-D (1 Month LIBOR USD + 2.15%, 2.15% Floor) | | | 2.26 | % (a) | | | 08/15/2034 | | | | 4,354,013 | |
| 5,336,278 | | Motel 6 Trust, Series 2017-MTL6-F (1 Month LIBOR USD + 4.25%, 4.25% Floor) | | | 4.36 | % (a) | | | 08/15/2034 | | | | 5,366,865 | |
| 9,940,000 | | Natixis Commercial Mortgage Securities Trust, Series 2018-FL1-C (1 Month LIBOR USD + 2.20%, 2.20% Floor) | | | 2.31 | % (a) | | | 06/15/2035 | | | | 8,825,763 | |
| 8,191,000 | | Natixis Commercial Mortgage Securities Trust, Series 2020-2PAC-AMZ1 | | | 3.50 | % (a)(b) | | | 01/15/2037 | | | | 8,522,013 | |
| 4,742,000 | | Natixis Commercial Mortgage Securities Trust, Series 2020-2PAC-AMZ2 | | | 3.50 | % (a)(b) | | | 01/15/2037 | | | | 4,849,747 | |
| 4,426,000 | | Natixis Commercial Mortgage Securities Trust, Series 2020-2PAC-AMZ3 | | | 3.50 | % (a)(b) | | | 01/15/2037 | | | | 4,427,669 | |
| 4,665,000 | | Natixis Commercial Mortgage Securities Trust, Series 2020-2PAC-MSK1 | | | 3.25 | % (a)(b) | | | 12/15/2036 | | | | 4,632,669 | |
| 4,414,000 | | Natixis Commercial Mortgage Securities Trust, Series 2020-2PAC-MSK2 | | | 3.25 | % (a)(b) | | | 12/15/2036 | | | | 4,343,983 | |
| 2,623,000 | | Natixis Commercial Mortgage Securities Trust, Series 2020-2PAC-MSK3 | | | 3.25 | % (a)(b) | | | 12/15/2036 | | | | 2,538,927 | |
| 12,315,000 | | New York Mortgage Trust, Series 2019-NYT-D (1 Month LIBOR USD + 2.00%, 2.00% Floor) | | | 2.11 | % (a) | | | 12/15/2035 | | | | 12,173,332 | |
| 11,000,000 | | NLY Commercial Mortgage Trust, Series 2019-FL2-B (1 Month LIBOR USD + 1.90%, 1.90% Floor) | | | 2.01 | % (a) | | | 02/15/2036 | | | | 11,013,156 | |
| 12,692,899 | | One Market Plaza Trust, Series 2017-1MKT-E | | | 4.14 | % (a) | | | 02/10/2032 | | | | 12,901,357 | |
| 139,919 | | Rosslyn Portfolio Trust, Series 2017-ROSS-B (1 Month LIBOR USD + 1.25%, 2.24% Floor) | | | 2.24 | % (a) | | | 06/15/2033 | | | | 140,796 | |
| 33,352,687 | | SLIDE, Series 2018-FUN-XCP | | | 0.00 | % (a)(b)(i) | | | 06/15/2021 | | | | 334 | |
| 459,000 | | STWD Ltd., Series 2019-FL1-C (1 Month LIBOR USD + 1.95%, 1.95% Floor) | | | 2.06 | % (a) | | | 07/15/2038 | | | | 456,017 | |
| 14,307,000 | | STWD Ltd., Series 2019-FL1-D (1 Month LIBOR USD + 2.35%, 2.35% Floor) | | | 2.46 | % (a) | | | 07/15/2038 | | | | 14,070,935 | |
| 8,426,455 | | Tharaldson Hotel Portfolio Trust, Series 2018-THL-E (1 Month LIBOR USD + 3.33%, 3.18% Floor) | | | 3.43 | % (a) | | | 11/11/2034 | | | | 8,175,599 | |
| 2,034,000 | | UBS Commercial Mortgage Trust, Series 2017-C1-XB | | | 0.92 | % (b)(i) | | | 06/15/2050 | | | | 109,102 | |
| 1,500,000 | | UBS Commercial Mortgage Trust, Series 2017-C4-C | | | 4.45 | % (b) | | | 10/15/2050 | | | | 1,493,555 | |
| 79,425,614 | | UBS Commercial Mortgage Trust, Series 2018-C13-XA | | | 0.76 | % (b)(i) | | | 10/15/2051 | | | | 3,450,821 | |
| 6,009,000 | | UBS Commercial Mortgage Trust, Series 2018-C8-C | | | 4.70 | % (b) | | | 02/15/2051 | | | | 6,580,518 | |
| 1,067,000 | | UBS Commercial Mortgage Trust, Series 2018-C9-C | | | 4.88 | % (b) | | | 03/15/2051 | | | | 1,154,489 | |
| 187,000 | | UBS Commercial Mortgage Trust, Series 2018-NYCH-G (1 Month LIBOR USD + 4.84%, 4.84% Floor) | | | 4.94 | % (a) | | | 02/15/2032 | | | | 164,285 | |
| 5,893,630 | | VMC Finance LLC, Series 2019-FL3-D (1 Month LIBOR USD + 2.65%, 2.65% Floor) | | | 2.76 | % (a) | | | 09/15/2036 | | | | 5,864,209 | |
| 572,000 | | Wells Fargo Commercial Mortgage Trust, Series 2014-LC16-D | | | 3.94 | % (a) | | | 08/15/2050 | | | | 150,152 | |
| 540,000 | | Wells Fargo Commercial Mortgage Trust, Series 2014-LC18-B | | | 3.96 | % | | | 12/15/2047 | | | | 574,838 | |
| 11,448,033 | | Wells Fargo Commercial Mortgage Trust, Series 2015-C27-XA | | | 0.89 | % (b)(i) | | | 02/15/2048 | | | | 314,037 | |
| 52,058,353 | | Wells Fargo Commercial Mortgage Trust, Series 2015-C30-XA | | | 0.89 | % (b)(i) | | | 09/15/2058 | | | | 1,750,150 | |
| 25,680,985 | | Wells Fargo Commercial Mortgage Trust, Series 2015-NXS2-XA | | | 0.66 | % (b)(i) | | | 07/15/2058 | | | | 617,070 | |
| 954,000 | | Wells Fargo Commercial Mortgage Trust, Series 2016-C32-C | | | 4.72 | % (b) | | | 01/15/2059 | | | | 1,002,052 | |
| 4,381,000 | | Wells Fargo Commercial Mortgage Trust, Series 2016-C33-D | | | 3.12 | % (a) | | | 03/15/2059 | | | | 4,136,811 | |
| 11,685,113 | | Wells Fargo Commercial Mortgage Trust, Series 2016-C33-XA | | | 1.62 | % (b)(i) | | | 03/15/2059 | | | | 756,458 | |
| 28,245,127 | | Wells Fargo Commercial Mortgage Trust, Series 2016-NXS6-XA | | | 1.61 | % (b)(i) | | | 11/15/2049 | | | | 1,531,685 | |
| 74,045,879 | | Wells Fargo Commercial Mortgage Trust, Series 2017-C38-XA | | | 1.02 | % (b)(i) | | | 07/15/2050 | | | | 3,600,688 | |
| 4,020,000 | | Wells Fargo Commercial Mortgage Trust, Series 2018-C48-C | | | 5.12 | % (b) | | | 01/15/2052 | | | | 4,435,630 | |
| 71,439,469 | | Wells Fargo Commercial Mortgage Trust, Series 2020-C57-XA | | | 2.10 | % (b)(i) | | | 08/15/2053 | | | | 10,803,884 | |
| 300,000 | | Wells Fargo Commercial Mortgage Trust, Series 2021-SAVE-D (1 Month LIBOR USD + 2.50%, 2.50% Floor) | | | 2.61 | % (a) | | | 02/15/2040 | | | | 303,205 | |
| 3,136,223 | | WF-RBS Commercial Mortgage Trust, Series 2014-C19-XA | | | 1.01 | % (b)(i) | | | 03/15/2047 | | | | 66,643 | |
| 7,619,595 | | WF-RBS Commercial Mortgage Trust, Series 2014-C21-XA | | | 1.03 | % (b)(i) | | | 08/15/2047 | | | | 204,243 | |
| | | | | | | | | | | | | | |
Total Non-Agency Commercial Mortgage Backed Obligations (Cost $1,025,915,848) | | | | | | | | 978,533,304 | |
| | | | | | | | | | | | | | |
Non-Agency Residential Collateralized Mortgage Obligations - 10.9% | | | | | | | | | | | | |
| 7,961,192 | | ACE Securities Corporation Home Equity Loan Trust, Series 2007-WM1-A2B (1 Month LIBOR USD + 0.12%, 0.12% Floor) | | | 0.23 | % | | | 11/25/2036 | | | | 4,272,213 | |
| 17,056,226 | | Ajax Mortgage Loan Trust, Series 2019-C-A | | | 3.95 | % (a)(b) | | | 10/25/2058 | | | | 17,097,512 | |
| 5,964,443 | | Alternative Loan Trust, Series 2005-49CB-A6 | | | 5.50 | % | | | 11/25/2035 | | | | 5,322,284 | |
| 9,254,536 | | Alternative Loan Trust, Series 2005-62-1A1 (1 Month LIBOR USD + 0.60%, 0.60% Floor) | | | 0.71 | % | | | 12/25/2035 | | | | 8,160,443 | |
| 2,738,854 | | Alternative Loan Trust, Series 2006-34-A6 | | | 6.25 | % | | | 11/25/2046 | | | | 2,094,553 | |
| 7,240,137 | | Alternative Loan Trust, Series 2006-36T2-1A3 | | | 5.75 | % | | | 12/25/2036 | | | | 4,697,680 | |
| 8,600,741 | | Alternative Loan Trust, Series 2007-12T1-A5 | | | 6.00 | % | | | 06/25/2037 | | | | 6,167,941 | |
| 5,584,811 | | Alternative Loan Trust, Series 2007-8CB-A1 | | | 5.50 | % | | | 05/25/2037 | | | | 4,435,596 | |
| 2,572,288 | | American Home Mortgage Investment Trust, Series 2004-2-M1 (1 Month LIBOR USD + 0.90%, 0.90% Floor, 11.00% Cap) | | | 1.01 | % | | | 02/25/2044 | | | | 2,463,152 | |
| 1,304,535 | | Angel Oak Mortgage Trust LLC, Series 2020-6-A3 | | | 1.78 | % (a)(b) | | | 05/25/2065 | | | | 1,315,722 | |
| 7,574,942 | | Angel Oak Mortgage Trust, Series 2020-2-A1A | | | 2.53 | % (a)(b) | | | 01/26/2065 | | | | 7,733,075 | |
| 8,830,245 | | Angel Oak Mortgage Trust, Series 2020-4-A1 | | | 1.47 | % (a)(b) | | | 06/25/2065 | | | | 8,870,399 | |
| 2,810,706 | | Arroyo Mortgage Trust, Series 2019-1-A1 | | | 3.81 | % (a)(b) | | | 01/25/2049 | | | | 2,884,343 | |
| 1,758,217 | | Arroyo Mortgage Trust, Series 2019-2-A2 | | | 3.50 | % (a)(b) | | | 04/25/2049 | | | | 1,795,244 | |
| 12,480,046 | | Arroyo Mortgage Trust, Series 2019-3-A3 | | | 3.42 | % (a)(b) | | | 10/25/2048 | | | | 12,729,658 | |
| 1,580,882 | | Banc of America Funding Corporation, Series 2006-7-T2A1 | | | 5.88 | % (b) | | | 10/25/2036 | | | | 1,560,113 | |
| 3,032,189 | | Banc of America Funding Corporation, Series 2015-R2-9A2 | | | 0.40 | % (a) | | | 03/27/2036 | | | | 2,990,057 | |
| 1,686,783 | | Banc of America Mortgage Securities Trust, Series 2005-I-2A5 | | | 3.02 | % (b) | | | 10/25/2035 | | | | 1,728,158 | |
| 4,328,678 | | Banc of America Mortgage Securities Trust, Series 2007-3-1A1 | | | 6.00 | % | | | 09/25/2037 | | | | 4,323,807 | |
| 10,308,027 | | Bayview Opportunity Master Fund Trust, Series 2019-SBR2-A1 | | | 3.43 | % (a)(c) | | | 06/28/2034 | | | | 10,512,044 | |
| 2,139,550 | | Bayview Opportunity Master Fund Trust, Series 2020-RN1-A1 | | | 3.23 | % (a)(c) | | | 02/28/2035 | | | | 2,133,769 | |
| 1,753,069 | | BCAP LLC Trust, Series 2012-RR1-3A4 | | | 5.50 | % (a)(b) | | | 10/26/2035 | | | | 1,531,789 | |
| 1,064,157 | | Bellemeade Ltd., Series 2018-3A-M1B (1 Month LIBOR USD + 1.85%, 1.85% Floor) | | | 1.96 | % (a) | | | 10/25/2028 | | | | 1,070,619 | |
| 2,105,811 | | BRAVO Residential Funding Trust, Series 2019-NQM1-A2 | | | 2.89 | % (a)(b) | | | 07/25/2059 | | | | 2,139,908 | |
| 11,994,701 | | CHL Mortgage Pass-Through Trust, Series 2006-20-1A18 (1 Month LIBOR USD + 0.65%, 0.65% Floor, 6.00%Cap) | | | 0.76 | % | | | 02/25/2037 | | | | 5,869,044 | |
| 24,203,232 | | Citigroup Mortgage Loan Trust, Series 2018-A-A1 | | | 4.00 | % (a)(b) | | | 01/25/2068 | | | | 24,308,932 | |
| 4,202,990 | | Citigroup Mortgage Loan Trust, Series 2019-B-A1 | | | 3.26 | % (a)(b) | | | 04/25/2066 | | | | 4,245,129 | |
| 8,843,555 | | Citigroup Mortgage Loan Trust, Series 2019-C-A1 | | | 3.23 | % (a)(c) | | | 09/25/2059 | | | | 8,904,938 | |
| 30,010,899 | | Citigroup Mortgage Loan Trust, Series 2019-E-A1 | | | 3.23 | % (a)(c) | | | 11/25/2070 | | | | 30,188,474 | |
| 10,262,014 | | Citigroup Mortgage Loan Trust, Series 2020-EXP1-A1A | | | 1.80 | % (a)(b) | | | 05/25/2060 | | | | 10,351,820 | |
| 971,251 | | CitiMortgage Alternative Loan Trust, Series 2007-A5-1A10 | | | 5.75 | % | | | 05/25/2037 | | | | 961,806 | |
| 941,684 | | COLT Mortgage Loan Trust, Series 2020-3-A3 | | | 2.38 | % (a)(b) | | | 04/27/2065 | | | | 953,330 | |
| 10,451,055 | | COLT Mortgage Loan Trust, Series 2021-1R-A1 | | | 0.86 | % (a)(b) | | | 05/25/2065 | | | | 10,433,671 | |
| 446,289 | | Countrywide Alternative Loan Trust, Series 2005-23CB-A15 | | | 5.50 | % | | | 07/25/2035 | | | | 428,998 | |
| 1,571,015 | | Countrywide Alternative Loan Trust, Series 2005-28CB-1A6 | | | 5.50 | % | | | 08/25/2035 | | | | 1,565,608 | |
| 1,811,968 | �� | Countrywide Alternative Loan Trust, Series 2006-J6-A5 | | | 6.00 | % | | | 09/25/2036 | | | | 1,361,047 | |
| 381,481 | | Countrywide Alternative Loan Trust, Series 2007-15CB-A7 | | | 6.00 | % | | | 07/25/2037 | | | | 320,823 | |
| 13,250,650 | | Countrywide Alternative Loan Trust, Series 2007-9T1-1A6 | | | 6.00 | % | | | 05/25/2037 | | | | 8,762,484 | |
| 1,036,919 | | Countrywide Home Loans, Series 2005-10-A2 | | | 5.50 | % | | | 05/25/2035 | | | | 996,724 | |
| 664,091 | | Countrywide Home Loans, Series 2007-14-A15 | | | 6.50 | % | | | 09/25/2037 | | | | 528,361 | |
| 2,452 | | Credit Suisse First Boston Mortgage Securities Corporation, Series 2004-8-6A1 | | | 4.50 | % | | | 04/25/2021 | | | | 2,218 | |
| 1,963,893 | | Credit Suisse First Boston Mortgage Securities Corporation, Series 2005-11-2A1 | | | 6.00 | % | | | 12/25/2035 | | | | 1,886,314 | |
| 60,162 | | Credit Suisse First Boston Mortgage Securities Corporation, Series 2005-11-8A5 | | | 6.00 | % | | | 12/25/2035 | | | | 58,126 | |
| 725,778 | | Credit Suisse First Boston Mortgage Securities Corporation, Series 2005-9-5A9 | | | 5.50 | % | | | 10/25/2035 | | | | 580,985 | |
| 912,029 | | Credit Suisse Mortgage Capital Certificates, Series 2011-12R-3A5 | | | 2.53 | % (a)(b) | | | 07/27/2036 | | | | 882,697 | |
| 192,806 | | Credit Suisse Mortgage Capital Certificates, Series 2011-5R-6A9 | | | 3.20 | % (a)(b) | | | 11/27/2037 | | | | 194,350 | |
| 19,300,048 | | Credit Suisse Mortgage Capital Certificates, Series 2019-RPL4-A1 | | | 3.48 | % (a)(b) | | | 08/26/2058 | | | | 19,323,865 | |
| 13,533,999 | | Credit Suisse Mortgage Capital Certificates, Series 2020-BPL1-A1 | | | 3.39 | % (a)(c) | | | 02/25/2024 | | | | 13,591,302 | |
| 2,521,644 | | CSMC Trust, Series 2019-JR1-A1 | | | 4.10 | % (a)(b) | | | 09/27/2066 | | | | 2,558,056 | |
| 58,593,112 | | CSMC Trust, Series 2019-RP10-A1 | | | 3.05 | % (a)(b) | | | 12/26/2059 | | | | 58,998,624 | |
| 16,716,629 | | CSMC Trust, Series 2019-RPL2-A1 | | | 3.85 | % (a)(b) | | | 11/25/2058 | | | | 17,114,407 | |
| 22,681,591 | | CSMC Trust, Series 2019-RPL9-A1 | | | 3.01 | % (a)(b) | | | 10/27/2059 | | | | 22,898,658 | |
| 7,264,575 | | CSMC Trust, Series 2020-BPL2-A1 | | | 3.45 | % (a) | | | 03/25/2026 | | | | 7,261,922 | |
| 9,787,833 | | CSMC Trust, Series 2020-RPL2-A12 | | | 3.46 | % (a)(b) | | | 02/25/2060 | | | | 9,912,670 | |
| 7,510,686 | | CSMC Trust, Series 2020-RPL3-A1 | | | 2.69 | % (a)(b) | | | 03/25/2060 | | | | 7,608,272 | |
| 15,163,196 | | CSMC Trust, Series 2020-SPT1-A1 | | | 1.62 | % (a)(c) | | | 04/25/2065 | | | | 15,269,650 | |
| 313,932 | | Deephaven Residential Mortgage Trust, Series 2017-1A-A1 | | | 2.73 | % (a)(b) | | | 12/26/2046 | | | | 314,225 | |
| 499,229 | | Deutsche Mortgage & Asset Receiving Corporation, Series 2014-RS1-1A2 | | | 6.49 | % (a)(b) | | | 07/27/2037 | | | | 460,862 | |
| 597,456 | | Deutsche Securities, Inc., Series 2006-AB4-A1A | | | 6.01 | % (b) | | | 10/25/2036 | | | | 587,415 | |
| 2,352,415 | | GCAT LLC, Series 2020-2-A1 | | | 3.72 | % (a)(c) | | | 06/25/2025 | | | | 2,359,560 | |
| 12,556,698 | | GCAT LLC, Series 2020-3-A1 | | | 2.98 | % (a)(c) | | | 09/25/2025 | | | | 12,703,696 | |
| 24,496,807 | | GCAT LLC, Series 2020-4-A1 | | | 2.61 | % (a)(c) | | | 12/25/2025 | | | | 24,642,279 | |
| 12,071,004 | | GCAT LLC, Series 2020-NQM2-A1 | | | 1.56 | % (a)(c) | | | 04/25/2065 | | | | 12,170,618 | |
| 3,930,846 | | GS Mortgage-Backed Securities Trust, Series 2019-SL1-A1 | | | 2.63 | % (a)(b) | | | 01/25/2059 | | | | 3,994,384 | |
| 439,344 | | GSR Mortgage Loan Trust, Series 2006-2F-3A4 | | | 6.00 | % | | | 02/25/2036 | | | | 306,193 | |
| 3,166,138 | | HarborView Mortgage Loan Trust, Series 2006-1-2A1A (1 Month LIBOR USD + 0.48%, 0.48% Floor) | | | 0.59 | % | | | 03/19/2036 | | | | 3,146,788 | |
| 1,054,044 | | Impac Secured Assets Trust, Series 2006-5-1A1C (1 Month LIBOR USD + 0.27%, 0.27% Floor, 11.50% Cap) | | | 0.38 | % | | | 02/25/2037 | | | | 989,822 | |
| 1,163,156 | | IndyMac Mortgage Loan Trust, Series 2006-AR5-2A1 | | | 3.39 | % (b) | | | 05/25/2036 | | | | 1,182,278 | |
| 6,400,026 | | JP Morgan Alternative Loan Trust, Series 2007-S1-A2 (1 Month LIBOR USD + 0.34%, 0.34% Floor, 11.50% Cap) | | | 0.45 | % | | | 04/25/2047 | | | | 6,257,741 | |
| 13,595,697 | | JP Morgan Mortgage Acquisition Trust, Series 2006-WMC2-A5 (1 Month LIBOR USD + 0.50%, 0.50% Floor) | | | 0.61 | % | | | 07/25/2036 | | | | 8,217,458 | |
| 17,671,075 | | Legacy Mortgage Asset Trust, Series 2019-GS3-A1 | | | 3.75 | % (a)(c) | | | 04/25/2059 | | | | 17,844,096 | |
| 11,878,665 | | Legacy Mortgage Asset Trust, Series 2019-GS4-A1 | | | 3.44 | % (a)(c) | | | 05/25/2059 | | | | 11,936,990 | |
| 1,069,630 | | Legacy Mortgage Asset Trust, Series 2019-GS5-A1 | | | 3.20 | % (a)(c) | | | 05/25/2059 | | | | 1,080,517 | |
| 4,735,344 | | Legacy Mortgage Asset Trust, Series 2019-GS6-A1 | | | 3.00 | % (a)(c) | | | 06/25/2059 | | | | 4,768,050 | |
| 23,728,557 | | Legacy Mortgage Asset Trust, Series 2020-GS3-A1 | | | 3.25 | % (a)(c) | | | 05/25/2060 | | | | 23,996,851 | |
| 8,870,997 | | Legacy Mortgage Asset Trust, Series 2020-GS4-A1 | | | 3.25 | % (a)(c) | | | 02/25/2060 | | | | 8,980,640 | |
| 5,898,990 | | Legacy Mortgage Asset Trust, Series 2020-SL1-A | | | 2.73 | % (a)(c) | | | 01/25/2060 | | | | 5,947,593 | |
| 239,764 | | Lehman Mortgage Trust, Series 2006-1-1A3 | | | 5.50 | % | | | 02/25/2036 | | | | 191,777 | |
| 10,000,000 | | LHOME Mortgage Trust, Series 2021-RTL1-A1 | | | 2.09 | % (a)(b) | | | 09/25/2026 | | | | 10,075,940 | |
| 19,144,673 | | Long Beach Mortgage Loan Trust, Series 2006-11-2A2 (1 Month LIBOR USD + 0.10%, 0.10% Floor) | | | 0.21 | % | | | 12/25/2036 | | | | 9,835,444 | |
| 10,716,336 | | Long Beach Mortgage Loan Trust, Series 2006-2-2A3 (1 Month LIBOR USD + 0.38%, 0.38% Floor) | | | 0.49 | % | | | 03/25/2046 | | | | 5,023,496 | |
| 97,094 | | MASTR Adjustable Rate Mortgages Trust, Series 2006-2-2A1 | | | 2.62 | % (b) | | | 04/25/2036 | | | | 74,949 | |
| 394,893 | | Merrill Lynch Alternative Note Asset Trust, Series 2007-F1-2A6 | | | 6.00 | % | | | 03/25/2037 | | | | 232,154 | |
| 1,363,881 | | Merrill Lynch Mortgage Investors Trust, Series 2006-AF1-AF2C | | | 6.25 | % | | | 08/25/2036 | | | | 848,383 | |
| 39,577,859 | | Merrill Lynch Mortgage Investors Trust, Series 2006-RM2-A1A (1 Month LIBOR USD + 0.37%, 0.37% Floor) | | | 0.48 | % | | | 05/25/2037 | | | | 16,313,606 | |
| 5,006,945 | | Merrill Lynch Mortgage Investors Trust, Series 2007-HE2-A2A (1 Month LIBOR USD + 0.12%, 0.12% Floor) | | | 0.23 | % | | | 02/25/2037 | | | | 2,058,152 | |
| 7,742,220 | | Merrill Lynch Mortgage Investors Trust, Series 2007-HE2-A2B (1 Month LIBOR USD + 0.21%, 0.21% Floor) | | | 0.32 | % | | | 02/25/2037 | | | | 3,253,095 | |
| 275,078 | | Morgan Stanley Mortgage Loan Trust, Series 2006-2-7A1 | | | 5.52 | % (b) | | | 02/25/2036 | | | | 218,115 | |
| 886,056 | | Morgan Stanley Residential Mortgage Loan Trust, Series 2020-RPL1-A1 | | | 2.69 | % (a)(b) | | | 10/25/2060 | | | | 892,327 | |
| 18,841,154 | | New Residential Mortgage Loan Trust, Series 2020-RPL2-A1 | | | 3.58 | % (a)(b) | | | 08/25/2025 | | | | 19,227,797 | |
| 25,463,796 | | NYMT Loan Trust, Series 2020-SP2-A1 | | | 2.94 | % (a)(b) | | | 10/25/2060 | | | | 25,587,336 | |
| 1,241,118 | | OBX Trust, Series 2020-EXP2-A3 | | | 2.50 | % (a)(b) | | | 05/25/2060 | | | | 1,262,453 | |
| 7,986,110 | | Pretium Mortgage Credit Partners LLC, Series 2020-NPL2-A1 | | | 3.72 | % (a)(c) | | | 02/27/2060 | | | | 8,063,434 | |
| 13,799,417 | | Pretium Mortgage Credit Partners LLC, Series 2020-NPL3-A1 | | | 3.10 | % (a)(c) | | | 06/27/2060 | | | | 13,947,891 | |
| 4,583,000 | | Pretium Mortgage Credit Partners LLC, Series 2021-NPL1-A1 | | | 2.24 | % (a)(c) | | | 09/27/2060 | | | | 4,619,788 | |
| 4,938,729 | | PRPM LLC, Series 2019-GS1-A1 | | | 3.50 | % (a)(b) | | | 10/25/2024 | | | | 4,984,577 | |
| 11,180,328 | | PRPM LLC, Series 2020-1A-A1 | | | 2.98 | % (a)(c) | | | 02/25/2025 | | | | 11,216,745 | |
| 8,887,041 | | PRPM LLC, Series 2020-3-A1 | | | 2.86 | % (a)(c) | | | 09/25/2025 | | | | 8,959,396 | |
| 29,780,000 | | PRPM LLC, Series 2021-2-A1 | | | 2.12 | % (a)(b) | | | 03/25/2024 | | | | 30,017,674 | |
| 1,837,421 | | Radnor Ltd., Series 2019-2-M1A (1 Month LIBOR USD + 1.20%, 1.20% Floor) | | | 1.31 | % (a) | | | 06/25/2029 | | | | 1,837,165 | |
| 2,119,692 | | RALI Trust, Series 2007-QS4-3A4 | | | 6.00 | % | | | 03/25/2037 | | | | 2,034,194 | |
| 2,639,536 | | RALI Trust, Series 2007-QS4-3A9 | | | 6.00 | % | | | 03/25/2037 | | | | 2,532,844 | |
| 1,712,413 | | RALI Trust, Series 2007-QS8-A3 (1 Month LIBOR USD + 0.60%, 0.60% Floor, 6.00% Cap) | | | 0.71 | % | | | 06/25/2037 | | | | 1,282,517 | |
| 944,861 | | RBSSP Resecuritization Trust , Series 2009-2-3A2 (1 Month LIBOR USD + 0.50%, 0.50% Floor) | | | 0.62 | % (a) | | | 04/26/2035 | | | | 833,449 | |
| 784,603 | | Residential Accredit Loans, Inc., Series 2006-QS12-2A3 | | | 6.00 | % | | | 09/25/2036 | | | | 770,186 | |
| 1,062,653 | | Residential Accredit Loans, Inc., Series 2007-QS9-A33 | | | 6.50 | % | | | 07/25/2037 | | | | 1,036,613 | |
| 761,971 | | Residential Asset Securitization Trust, Series 2006-A2-A11 | | | 6.00 | % | | | 01/25/2046 | | | | 474,591 | |
| 6,148,594 | | Residential Mortgage Loan Trust, Series 2007-S1-A1 (1 Month LIBOR USD + 0.60%, 0.60% Floor, 6.00%Cap) | | | 0.71 | % | | | 01/25/2037 | | | | 4,885,223 | |
| 6,727,099 | | Securitized Asset Backed Receivables LLC Trust, Series 2006-WM3-A1 (1 Month LIBOR USD + 0.05%, 0.05% Floor) | | | 0.16 | % | | | 10/25/2036 | | | | 3,094,552 | |
| 2,990,177 | | Soundview Home Loan Trust, Series 2007-OPT3-2A3 (1 Month LIBOR USD + 0.18%, 0.18% Floor) | | | 0.29 | % | | | 08/25/2037 | | | | 2,921,675 | |
| 18,010,343 | | Specialty Underwriting & Residential Finance Trust, Series 2006-BC4-A1 (1 Month LIBOR USD + 0.28%, 0.28% Floor) | | | 0.40 | % | | | 09/25/2037 | | | | 16,975,166 | |
| 2,325,988 | | Structured Adjustable Rate Mortgage Loan Trust, Series 2005-22-4A1 | | | 3.14 | % (b) | | | 12/25/2035 | | | | 2,255,731 | |
| 40,000,000 | | Toorak Mortgage Corporation Ltd., Series 2020-1-A1 | | | 2.73 | % (a)(c) | | | 03/25/2023 | | | | 40,542,320 | |
| 10,552,040 | | VCAT LLC, Series 2020-NPL1-A1 | | | 3.67 | % (a)(c) | | | 08/25/2050 | | | | 10,668,501 | |
| 26,178,283 | | VCAT LLC, Series 2021-NPL1-A1 | | | 2.29 | % (a)(c) | | | 12/26/2050 | | | | 26,249,022 | |
| 7,210,562 | | Velocity Commercial Capital Loan Trust, Series 2018-2-A | | | 4.05 | % (a)(b) | | | 10/26/2048 | | | | 7,552,252 | |
| 4,573,972 | | Velocity Commercial Capital Loan Trust, Series 2020-1-M2 | | | 2.98 | % (a)(b) | | | 02/25/2050 | | | | 4,624,060 | |
| 19,685,200 | | Vericrest Opportunity Loan Trust, Series 2020-NPL2-A1A | | | 2.98 | % (a)(c) | | | 02/25/2050 | | | | 19,771,795 | |
| 8,248,033 | | Verus Securitization Trust, Series 2020-4-A1 | | | 1.50 | % (a)(c) | | | 05/25/2065 | | | | 8,325,562 | |
| 907,357 | | Verus Securitization Trust, Series 2020-4-A3 | | | 2.32 | % (a)(c) | | | 05/25/2065 | | | | 923,670 | |
| 1,500,000 | | Verus Securitization Trust, Series 2020-INV1-A2 | | | 3.04 | % (a)(b) | | | 03/25/2060 | | | | 1,555,541 | |
| 11,861,728 | | Verus Securitization Trust, Series 2020-NPL1-A1 | | | 3.60 | % (a)(c) | | | 08/25/2050 | | | | 11,919,891 | |
| 9,264,606 | | Verus Securitization Trust, Series 2021-R1-A3 | | | 1.26 | % (a)(b) | | | 10/25/2063 | | | | 9,274,042 | |
| 13,515,874 | | VOLT LLC, Series 2021-NPL1-A1 | | | 1.89 | % (a)(c) | | | 02/27/2051 | | | | 13,527,430 | |
| 5,566,807 | | VOLT LLC, Series 2021-NPL5-A1 | | | 2.12 | % (a)(c) | | | 03/27/2051 | | | | 5,566,251 | |
| 4,549,000 | | VOLT LLC, Series 2021-NPL6-A1 | | | 2.24 | % (a)(c) | | | 04/25/2051 | | | | 4,551,762 | |
| 5,228,815 | | WaMu Mortgage Pass-Through Certificates Trust, Series 2005-AR4-A5 | | | 3.27 | % (b) | | | 04/25/2035 | | | | 5,283,279 | |
| 1,668,668 | | Washington Mutual Mortgage Pass-Through Certificates, Series 2005-8-2CB3 (1 Month LIBOR USD + 0.41%, 0.41% Floor, 5.50% Cap) | | | 0.52 | % | | | 10/25/2035 | | | | 1,545,491 | |
| 109,219 | | Washington Mutual Mortgage Pass-Through Certificates, Series 2006-5-1A5 | | | 6.00 | % | | | 07/25/2036 | | | | 100,957 | |
| 4,266,768 | | Washington Mutual Mortgage Pass-Through Certificates, Series 2006-AR10-2A1 | | | 3.07 | % (b) | | | 09/25/2036 | | | | 4,090,541 | |
| 860,052 | | Wells Fargo Alternative Loan Trust, Series 2007-PA5-1A1 | | | 6.25 | % | | | 11/25/2037 | | | | 854,819 | |
| 3,839,606 | | Wells Fargo Mortgage Backed Securities Trust, Series 2007-15-A1 | | | 6.00 | % | | | 11/25/2037 | | | | 3,794,090 | |
| 13,248,124 | | Wells Fargo Mortgage Backed Securities Trust, Series 2007-AR6-A2 | | | 3.00 | % (b) | | | 10/25/2037 | | | | 13,017,770 | |
| | | | | | | | | | | | | | |
Total Non-Agency Residential Collateralized Mortgage Obligations (Cost $966,167,399) | | | | | | | | 969,818,921 | |
| | | | | | | | | | | | | | |
US Corporate Bonds - 4.4% | | | | | | | | | | | | |
| 8,270,000 | | AbbVie, Inc. | | | 2.30 | % | | | 11/21/2022 | | | | 8,511,846 | |
| 5,934,000 | | American Express Company (3 Month LIBOR USD + 0.65%) | | | 0.84 | % | | | 02/27/2023 | | | | 5,982,887 | |
| 5,595,000 | | American Tower Corporation | | | 2.40 | % | | | 03/15/2025 | | | | 5,841,379 | |
| 270,000 | | Amgen, Inc. | | | 2.70 | % | | | 05/01/2022 | | | | 274,728 | |
| 3,875,000 | | Amgen, Inc. | | | 2.65 | % | | | 05/11/2022 | | | | 3,965,869 | |
| 3,705,000 | | Amgen, Inc. | | | 3.63 | % | | | 05/15/2022 | | | | 3,795,445 | |
| 3,330,000 | | Anthem, Inc. | | | 3.30 | % | | | 01/15/2023 | | | | 3,496,220 | |
| 4,530,000 | | Anthem, Inc. | | | 3.50 | % | | | 08/15/2024 | | | | 4,900,307 | |
| 5,495,000 | | AT&T, Inc. | | | 4.45 | % | | | 04/01/2024 | | | | 6,030,356 | |
| 2,450,000 | | Atmos Energy Corporation | | | 0.63 | % | | | 03/09/2023 | | | | 2,451,084 | |
| 11,565,000 | | Bank of America Corporation (3 Month LIBOR USD + 0.79%) | | | 0.98 | % | | | 03/05/2024 | | | | 11,680,983 | |
| 5,670,000 | | BB&T Corporation | | | 2.20 | % | | | 03/16/2023 | | | | 5,860,568 | |
| 5,270,000 | | Boeing Company | | | 4.51 | % | | | 05/01/2023 | | | | 5,642,546 | |
| 1,887,000 | | Capital One Financial Corporation | | | 3.20 | % | | | 01/30/2023 | | | | 1,976,471 | |
| 3,775,000 | | Capital One Financial Corporation | | | 3.90 | % | | | 01/29/2024 | | | | 4,083,582 | |
| 10,310,000 | | Cardinal Health, Inc. | | | 2.62 | % | | | 06/15/2022 | | | | 10,556,018 | |
| 5,061,000 | | Carrier Global Corporation | | | 2.24 | % | | | 02/15/2025 | | | | 5,243,252 | |
| 2,035,000 | | Cigna Corporation | | | 0.61 | % | | | 03/15/2024 | | | | 2,027,262 | |
| 5,355,000 | | Cintas Corporation | | | 2.90 | % | | | 04/01/2022 | | | | 5,480,098 | |
| 3,965,000 | | Citigroup, Inc. | | | 2.75 | % | | | 04/25/2022 | | | | 4,059,702 | |
| 5,982,000 | | Citigroup, Inc. (3 Month LIBOR USD + 1.02%) | | | 1.21 | % | | | 06/01/2024 | | | | 6,060,714 | |
| 1,845,000 | | Citigroup, Inc. (Secured Overnight Financing Rate + 0.87%) | | | 2.31 | % | | | 11/04/2022 | | | | 1,864,850 | |
| 4,635,000 | | Conagra Brands, Inc. | | | 4.30 | % | | | 05/01/2024 | | | | 5,113,213 | |
| 4,835,000 | | Dell International LLC | | | 5.45 | % (a) | | | 06/15/2023 | | | | 5,286,016 | |
| 3,060,000 | | Dollar Tree, Inc. | | | 4.00 | % | | | 05/15/2025 | | | | 3,379,810 | |
| 1,525,000 | | Dollar Tree, Inc. | | | 3.70 | % | | | 05/15/2023 | | | | 1,619,575 | |
| 590,000 | | DTE Energy Company | | | 2.25 | % | | | 11/01/2022 | | | | 605,295 | |
| 2,375,000 | | DTE Energy Company | | | 2.53 | % | | | 10/01/2024 | | | | 2,490,776 | |
| 2,920,000 | | DTE Energy Company | | | 1.05 | % | | | 06/01/2025 | | | | 2,884,260 | |
| 4,555,000 | | DuPont de Nemours, Inc. | | | 4.49 | % | | | 11/15/2025 | | | | 5,150,997 | |
| 5,250,000 | | eBay, Inc. | | | 2.75 | % | | | 01/30/2023 | | | | 5,468,781 | |
| 6,115,000 | | Entergy Corporation | | | 0.90 | % | | | 09/15/2025 | | | | 5,976,554 | |
| 5,075,000 | | Equinix, Inc. | | | 1.25 | % | | | 07/15/2025 | | | | 5,035,629 | |
| 5,245,000 | | Exxon Mobil Corporation | | | 1.57 | % | | | 04/15/2023 | | | | 5,375,704 | |
| 5,064,000 | | GE Capital International Funding Company Unlimited Company | | | 3.37 | % | | | 11/15/2025 | | | | 5,494,407 | |
| 1,930,000 | | General Mills, Inc. | | | 3.20 | % | | | 04/16/2021 | | | | 1,931,686 | |
| 4,195,000 | | General Mills, Inc. | | | 3.15 | % | | | 12/15/2021 | | | | 4,248,721 | |
| 4,573,000 | | General Motors Financial Company, Inc. | | | 5.25 | % | | | 03/01/2026 | | | | 5,242,025 | |
| 5,345,000 | | Global Payments, Inc. | | | 1.20 | % | | | 03/01/2026 | | | | 5,265,486 | |
| 5,005,000 | | Goldman Sachs Group, Inc. | | | 3.50 | % | | | 04/01/2025 | | | | 5,424,471 | |
| 4,805,000 | | HCA, Inc. | | | 5.00 | % | | | 03/15/2024 | | | | 5,348,523 | |
| 5,250,000 | | Hyundai Capital America | | | 2.85 | % (a) | | | 11/01/2022 | | | | 5,416,866 | |
| 3,210,000 | | JPMorgan Chase & Company | | | 3.90 | % | | | 07/15/2025 | | | | 3,545,481 | |
| 1,850,000 | | JPMorgan Chase & Company (3 Month LIBOR USD + 0.70%) | | | 3.21 | % | | | 04/01/2023 | | | | 1,900,485 | |
| 5,420,000 | | Keurig Dr Pepper, Inc. | | | 0.75 | % | | | 03/15/2024 | | | | 5,422,753 | |
| 4,790,000 | | Kinder Morgan Energy Partners LP | | | 3.95 | % | | | 09/01/2022 | | | | 4,984,212 | |
| 5,580,000 | | Marsh & McLennan Companies, Inc. | | | 3.88 | % | | | 03/15/2024 | | | | 6,099,070 | |
| 5,085,000 | | McDonald’s Corporation | | | 2.63 | % | | | 01/15/2022 | | | | 5,177,342 | |
| 5,225,000 | | Microchip Technology, Inc. | | | 0.97 | % (a) | | | 02/15/2024 | | | | 5,218,222 | |
| 5,175,000 | | Micron Technology, Inc. | | | 2.50 | % | | | 04/24/2023 | | | | 5,375,609 | |
| 4,130,000 | | Mondelez International, Inc. | | | 0.63 | % | | | 07/01/2022 | | | | 4,143,234 | |
| 5,478,000 | | Morgan Stanley (3 Month LIBOR USD + 0.93%) | | | 1.15 | % | | | 07/22/2022 | | | | 5,490,591 | |
| 5,370,000 | | Morgan Stanley (Secured Overnight Financing Rate + 0.46%) | | | 0.53 | % | | | 01/25/2024 | | | | 5,361,654 | |
| 4,190,000 | | NextEra Energy Capital Holdings, Inc. | | | 0.65 | % | | | 03/01/2023 | | | | 4,204,192 | |
| 4,645,000 | | Northrop Grumman Corporation | | | 3.25 | % | | | 08/01/2023 | | | | 4,956,406 | |
| 503,000 | | Northrop Grumman Corporation | | | 2.93 | % | | | 01/15/2025 | | | | 535,557 | |
| 3,865,000 | | Omnicom Capital, Inc. | | | 3.63 | % | | | 05/01/2022 | | | | 3,999,152 | |
| 5,440,000 | | Pacific Gas and Electric Company | | | 1.75 | % | | | 06/16/2022 | | | | 5,448,472 | |
| 4,970,000 | | PayPal Holdings, Inc. | | | 2.20 | % | | | 09/26/2022 | | | | 5,101,350 | |
| 165,000 | | PayPal Holdings, Inc. | | | 1.35 | % | | | 06/01/2023 | | | | 168,007 | |
| 4,845,000 | | Penske Truck Leasing Company | | | 2.70 | % (a) | | | 11/01/2024 | | | | 5,104,196 | |
| 5,255,000 | | PepsiCo, Inc. | | | 0.75 | % | | | 05/01/2023 | | | | 5,307,208 | |
| 315,000 | | Phillips 66 | | | 3.85 | % | | | 04/09/2025 | | | | 345,480 | |
| 2,270,000 | | Phillips 66 | | | 1.30 | % | | | 02/15/2026 | | | | 2,246,759 | |
| 2,550,000 | | Pioneer Natural Resources Corporation | | | 0.75 | % | | | 01/15/2024 | | | | 2,542,399 | |
| 1,775,000 | | PNC Bank N.A. (3 Month LIBOR USD + 0.42%) | | | 2.03 | % | | | 12/09/2022 | | | | 1,795,021 | |
| 1,690,000 | | PNC Bank N.A. | | | 3.25 | % | | | 06/01/2025 | | | | 1,827,820 | |
| 4,985,000 | | Prudential Financial, Inc. | | | 3.50 | % | | | 05/15/2024 | | | | 5,434,864 | |
| 5,765,000 | | PSEG Power LLC | | | 3.85 | % | | | 06/01/2023 | | | | 6,149,795 | |
| 5,155,000 | | Republic Services, Inc. | | | 2.50 | % | | | 08/15/2024 | | | | 5,426,465 | |
| 5,395,000 | | Royalty Pharma PLC | | | 0.75 | % (a) | | | 09/02/2023 | | | | 5,392,852 | |
| 5,015,000 | | Schlumberger Holdings Corporation | | | 3.75 | % (a) | | | 05/01/2024 | | | | 5,412,469 | |
| 5,390,000 | | Shire Acquisitions Investments Ireland DAC | | | 2.88 | % | | | 09/23/2023 | | | | 5,666,131 | |
| 5,050,000 | | Simon Property Group LP | | | 2.00 | % | | | 09/13/2024 | | | | 5,229,817 | |
| 5,990,000 | | Southern California Edison Company (Secured Overnight Financing Rate + 0.83%) | | | 0.84 | % | | | 04/01/2024 | | | | 6,001,142 | |
| 5,000,000 | | Synchrony Financial | | | 3.75 | % | | | 08/15/2021 | | | | 5,033,063 | |
| 755,000 | | Synchrony Financial | | | 2.85 | % | | | 07/25/2022 | | | | 775,498 | |
| 4,924,000 | | Target Corporation | | | 2.90 | % | | | 01/15/2022 | | | | 5,022,569 | |
| 5,100,000 | | Union Pacific Corporation | | | 3.20 | % | | | 06/08/2021 | | | | 5,126,494 | |
| 500,000 | | Union Pacific Corporation | | | 3.15 | % | | | 03/01/2024 | | | | 535,245 | |
| 1,560,000 | | Upjohn, Inc. | | | 1.13 | % (a) | | | 06/22/2022 | | | | 1,568,944 | |
| 2,500,000 | | Valero Energy Corporation | | | 1.20 | % | | | 03/15/2024 | | | | 2,509,342 | |
| 5,300,000 | | Verizon Communications, Inc. (3 Month LIBOR USD + 1.10%) | | | 1.30 | % | | | 05/15/2025 | | | | 5,421,332 | |
| 5,380,000 | | Wells Fargo & Company (Secured Overnight Financing Rate + 1.60%) | | | 1.65 | % | | | 06/02/2024 | | | | 5,497,657 | |
| 5,575,000 | | Welltower, Inc. | | | 3.63 | % | | | 03/15/2024 | | | | 6,016,651 | |
| 8,560,000 | | Western Union Company | | | 1.35 | % | | | 03/15/2026 | | | | 8,349,562 | |
| 2,215,000 | | Williams Companies, Inc. | | | 4.30 | % | | | 03/04/2024 | | | | 2,412,330 | |
| 2,700,000 | | Williams Companies, Inc. | | | 4.55 | % | | | 06/24/2024 | | | | 2,977,200 | |
| | | | | | | | | | | | | | |
Total US Corporate Bonds (Cost $385,793,918) | | | | | | | | 388,805,056 | |
| | | | | | | | | | | | | | |
US Government and Agency Mortgage Backed Obligations - 4.1% | | | | | | | | | | | | |
| 30,724,540 | | Federal Home Loan Mortgage Corporation, Pass-Thru, Series K722-X1 | | | 1.31 | % (b)(i) | | | 03/25/2023 | | | | 565,368 | |
| 2,411,516 | | Federal Home Loan Mortgage Corporation, Pool 2B1122 (12 Month LIBOR USD + 1.65%, 1.65% Floor, 7.14% Cap) | | | 2.02 | % | | | 02/01/2043 | | | | 2,526,093 | |
| 860,043 | | Federal Home Loan Mortgage Corporation, Pool G08626 | | | 3.00 | % | | | 02/01/2045 | | | | 905,722 | |
| 862,748 | | Federal Home Loan Mortgage Corporation, Pool G08631 | | | 3.00 | % | | | 03/01/2045 | | | | 905,482 | |
| 16,217,643 | | Federal Home Loan Mortgage Corporation, Pool RB5085 | | | 2.00 | % | | | 11/01/2040 | | | | 16,483,477 | |
| 94,472,564 | | Federal Home Loan Mortgage Corporation, Pool SB8092 | | | 1.50 | % | | | 03/01/2036 | | | | 94,988,771 | |
| 48,707,142 | | Federal Home Loan Mortgage Corporation, Pool SB8093 | | | 2.00 | % | | | 03/01/2036 | | | | 50,272,775 | |
| 10,000,000 | | Federal Home Loan Mortgage Corporation, Series 2021-21-GL | | | 2.00 | % | | | 07/25/2043 | | | | 10,262,981 | |
| 421,049 | | Federal Home Loan Mortgage Corporation, Series 3417-SM (-1 x 1 Month LIBOR USD + 6.28%, 6.28% Cap) | | | 6.17 | % (i)(k) | | | 02/15/2038 | | | | 81,106 | |
| 3,800,677 | | Federal Home Loan Mortgage Corporation, Series 4060-QA | | | 1.50 | % | | | 09/15/2026 | | | | 3,837,118 | |
| 1,105,107 | | Federal Home Loan Mortgage Corporation, Series 4471-GA | | | 3.00 | % | | | 02/15/2044 | | | | 1,159,257 | |
| 1,297,004 | | Federal Home Loan Mortgage Corporation, Series 4738-LA | | | 3.00 | % | | | 11/15/2043 | | | | 1,300,694 | |
| 318,904 | | Federal Home Loan Mortgage Corporation, Series 4771-NA | | | 4.00 | % | | | 11/15/2042 | | | | 318,887 | |
| 577,834 | | Federal Home Loan Mortgage Corporation, Series 4773-EA | | | 4.00 | % | | | 10/15/2042 | | | | 578,666 | |
| 1,052,538 | | Federal Home Loan Mortgage Corporation, Series 4824-EA | | | 4.50 | % | | | 02/15/2045 | | | | 1,059,548 | |
| 12,766,209 | | Federal Home Loan Mortgage Corporation, Series 4941-SW | | | 5.81 | % (d)(i) | | | 12/15/2048 | | | | 2,224,567 | |
| 2,294,464 | | Federal National Mortgage Association Pass-Thru, Pool AL2987 (12 Month LIBOR USD + 1.63%, 1.63% Floor, 7.39% Cap) | | | 2.24 | % | | | 11/01/2042 | | | | 2,413,541 | |
| 4,856,778 | | Federal National Mortgage Association Pass-Thru, Pool AP7870 (12 Month LIBOR USD + 1.70%, 1.70% Floor, 7.54% Cap) | | | 2.44 | % | | | 07/01/2042 | | | | 5,120,265 | |
| 1,171,645 | | Federal National Mortgage Association Pass-Thru, Pool AS4645 | | | 3.00 | % | | | 03/01/2045 | | | | 1,229,190 | |
| 307,978 | | Federal National Mortgage Association Pass-Thru, Pool MA1200 | | | 3.00 | % | | | 10/01/2032 | | | | 322,042 | |
| 1,688,475 | | Federal National Mortgage Association Pass-Thru, Pool MA2270 | | | 3.00 | % | | | 05/01/2045 | | | | 1,738,743 | |
| 27,376,666 | | Federal National Mortgage Association Pool FM5470 | | | 2.00 | % | | | 01/01/2036 | | | | 28,219,416 | |
| 1,471,913 | | Federal National Mortgage Association, Pool BM3520 (12 Month LIBOR USD + 1.56%, 1.56% Floor, 7.00% Cap) | | | 2.64 | % | | | 05/01/2045 | | | | 1,537,425 | |
| 8,242,264 | | Federal National Mortgage Association, Pool BM4513 (12 Month LIBOR USD + 1.67%, 1.67% Floor, 7.69% Cap) | | | 2.65 | % | | | 05/01/2044 | | | | 8,738,027 | |
| 19,423,892 | | Federal National Mortgage Association, Pool MA4176 | | | 2.00 | % | | | 11/01/2040 | | | | 19,694,351 | |
| 1,649,002 | | Federal National Mortgage Association, Series 2012-32-DA | | | 2.00 | % | | | 11/25/2026 | | | | 1,688,169 | |
| 1,569,565 | | Federal National Mortgage Association, Series 2013-40-KP | | | 3.50 | % | | | 04/25/2042 | | | | 1,610,914 | |
| 648,058 | | Federal National Mortgage Association, Series 2015-59-A | | | 3.00 | % | | | 06/25/2041 | | | | 650,837 | |
| 1,856,899 | | Federal National Mortgage Association, Series 2015-9-HA | | | 3.00 | % | | | 01/25/2045 | | | | 1,989,902 | |
| 3,169,906 | | Federal National Mortgage Association, Series 2016-72-PA | | | 3.00 | % | | | 07/25/2046 | | | | 3,256,961 | |
| 1,252,441 | | Federal National Mortgage Association, Series 2017-13-ML | | | 3.00 | % | | | 08/25/2041 | | | | 1,258,074 | |
| 32,395 | | Federal National Mortgage Association, Series 2017-2-HA | | | 3.00 | % | | | 09/25/2041 | | | | 32,353 | |
| 11,720,338 | | Federal National Mortgage Association, Series 2019-25-SB (-1 x 1 Month LIBOR USD + 6.05%, 6.05% Cap) | | | 5.94 | % (i)(k) | | | 06/25/2049 | | | | 2,191,888 | |
| 8,238,676 | | Federal National Mortgage Association, Series 2020-39-MH | | | 3.00 | % | | | 06/25/2040 | | | | 8,636,222 | |
| 27,935,585 | | Federal National Mortgage Association, Series 2020-45-JL | | | 3.00 | % | | | 07/25/2040 | | | | 29,322,084 | |
| 11,293,545 | | Federal National Mortgage Association, Series 2020-59-MK | | | 3.00 | % | | | 08/25/2040 | | | | 11,842,007 | |
| 23,294,200 | | Federal National Mortgage Association, Series 2020-M49-1A1 | | | 1.26 | % (b) | | | 11/25/2030 | | | | 23,075,616 | |
| 10,500,000 | | Federal National Mortgage Association, Series 2021-21-HG | | | 2.00 | % | | | 11/25/2047 | | | | 10,775,792 | |
| 5,692,301 | | Government National Mortgage Association, Series 2016-136-UD | | | 3.00 | % | | | 04/20/2045 | | | | 5,771,829 | |
| 782,837 | | Government National Mortgage Association, Series 2017-4-NC | | | 3.00 | % | | | 10/20/2045 | | | | 793,007 | |
| 8,811,295 | | Government National Mortgage Association, Series 2019-56-SE (-1 x 1 Month LIBOR USD + 6.10%, 6.10% Cap) | | | 5.99 | % (i)(k) | | | 05/20/2049 | | | | 1,576,865 | |
| | | | | | | | | | | | | | |
Total US Government and Agency Mortgage Backed Obligations (Cost $364,762,009) | | | | | | | | 360,956,032 | |
| | | | | | | | | | | | | | |
US Government and Agency Obligations—14.7% | | | | | | | | | | | | |
| 236,400,000 | | United States Treasury Notes | | | 1.50 | % | | | 09/30/2021 | | | | 238,129,434 | |
| 252,700,000 | | United States Treasury Notes | | | 0.38 | % | | | 03/31/2022 | | | | 253,475,450 | |
| 353,050,000 | | United States Treasury Notes | | | 0.13 | % | | | 05/15/2023 | | | | 352,636,268 | |
| 325,710,000 | | United States Treasury Notes | | | 0.13 | % | | | 12/15/2023 | | | | 324,310,463 | |
| 141,830,000 | | United States Treasury Notes | | | 0.13 | % | | | 02/15/2024 | | | | 141,076,528 | |
| | | | | | | | | | | | | | |
Total US Government and Agency Obligations (Cost $1,310,548,406) | | | | | | | | 1,309,628,143 | |
| | | | | | | | | | | | | | |
Affiliated Mutual Funds - 2.2% | | | | | | | | | | | | |
| 19,895,522 | | DoubleLine Ultra Short Bond Fund (Class I) | | | | | | | | | | | 199,949,999 | |
| | | | | | | | | | | | | | |
Total Affiliated Mutual Funds (Cost $199,501,692) | | | | | | | | 199,949,999 | |
| | | | | | | | | | | | | | |
Common Stocks - 0.0% | | | | | | | | | | | | |
| 58,790 | | Foresight Equity (e) (l) | | | | | | | | | | | 1,041,173 | |
| 39,482 | | McDermott International Ltd. (l) | | | | | | | | | | | 31,585 | |
| | | | | | | | | | | | | | |
Total Common Stocks (Cost $989,313) | | | | | | | | 1,072,758 | |
| | | | | | | | | | | | | | |
Warrants - 0.0% | | | | | | | | | | | | |
| 29,232 | | OAS S.A., Expiration 5/16/2039, Strike Price BRL 1.00 (e)(l) | | | | | | | | | | | — | |
| | | | | | | | | | | | | | |
Total Warrants (Cost $–) | | | | | | | | — | |
| | | | | | | | | | | | | | |
Repurchase Agreements - 0.5% | | | | | | | | | | | | |
| 40,500,000 | | Credit Suisse Freedom Mortgage (1 Month LIBOR USD + 2.75%, 0.5% LIBOR Floor) (Collateralized by Residential Mortgage Backed Obligations, Value $182,962,946) | | | 3.25 | % (e) | | | 03/01/2023 | | | | 40,500,000 | |
| | | | | | | | | | | | | | |
Total Repurchase Agreements (Cost $40,501,269) | | | | | | | | 40,500,000 | |
| | | | | | | | | | | | | | |
Short Term Investments - 7.4% | | | | | | | | | | | | |
| 191,837,998 | | First American Government Obligations Fund - Class U | | | 0.04 | % (m) | | | | | | | 191,837,998 | |
| 191,837,998 | | JP Morgan U.S. Government Money Market Fund - Institutional Share Class | | | 0.04 | % (m) | | | | | | | 191,837,998 | |
| 191,837,998 | | Morgan Stanley Institutional Liquidity Funds Government Portfolio - Institutional Share Class | | | 0.03 | % (m) | | | | | | | 191,837,998 | |
| 84,660,000 | | United States Treasury Bills | | | 0.00 | % | | | 07/08/2021 | | | | 84,656,830 | |
| | | | | | | | | | | | | | |
Total Short Term Investments (Cost $660,158,322) | | | | | | | | 660,170,824 | |
| | | | | | | | | | | | | | |
Total Investments - 85.2% (Cost $7,609,112,935) | | | | | | | | 7,575,618,104 | |
Other Assets in Excess of Liabilities—14.8% | | | | | | | | 1,311,493,543 | |
| | | | | | | | | | | | | | |
NET ASSETS - 100.0% | | | | | | | $ | 8,887,111,647 | |
| | | | | | | | | | | | | | |
| | | | | | | | | | | | | | |
Principal Amount $/Shares | | Security Description | | Rate | | | Maturity | | | Value $ | |
Asset Backed Obligations—6.9% | | | | | | | | | | | | |
1,250,000 | | Affirm Asset Securitization Trust, Series 2020-A-C | | | 6.23 | % (a) | | | 02/18/2025 | | | | 1,291,415 | |
513,000 | | Arivo Acceptance Auto Loan Receivables Trust, Series 2021-1A-C | | | 3.77 | % (a) | | | 03/15/2027 | | | | 516,254 | |
2,154,375 | | CAL Funding IV Ltd., Series 2020-1A-A | | | 2.22 | % (a) | | | 09/25/2045 | | | | 2,163,771 | |
1,436,250 | | CAL Funding IV Ltd., Series 2020-1A-B | | | 3.50 | % (a) | | | 09/25/2045 | | | | 1,449,030 | |
2,711,720 | | Castlelake Aircraft Securitization Trust, Series 2018-1-B | | | 5.30 | % (a) | | | 06/15/2043 | | | | 2,663,297 | |
2,629,768 | | Castlelake Aircraft Securitization Trust, Series 2019-1A-C | | | 6.90 | % (a)(b) | | | 04/15/2039 | | | | 2,063,382 | |
2,027,174 | | CPS Auto Receivables Trust, Series 2016-A-E | | | 7.65 | % (a) | | | 12/15/2021 | | | | 2,032,265 | |
6,250,000 | | ExteNet Issuer LLC, Series 2019-1A-C | | | 5.22 | % (a) | | | 07/26/2049 | | | | 6,541,918 | |
1,548,699 | | GAIA Aviation Ltd., Series 2019-1-C | | | 7.00 | % (a)(b)(c) | | | 12/15/2044 | | | | 1,172,544 | |
2,574,685 | | Helios Issuer LLC, Series 2017-1A-A | | | 4.94 | % (a) | | | 09/20/2049 | | | | 2,734,549 | |
4,350,000 | | Hertz Vehicle Financing LP, Series 2019-2A-B | | | 3.67 | % (a) | | | 05/25/2025 | | | | 4,362,231 | |
950,000 | | Hertz Vehicle Financing LP, Series 2018-1A-B | | | 3.60 | % (a) | | | 02/25/2024 | | | | 953,762 | |
1,937,403 | | Horizon Aircraft Finance Ltd., Series 2019-1-C | | | 6.90 | % (a)(b) | | | 07/15/2039 | | | | 1,703,713 | |
5,096,154 | | Jersey Mike’s Funding LLC, Series 2019-1A-A2 | | | 4.43 | % (a) | | | 02/15/2050 | | | | 5,413,378 | |
1,930,000 | | Jimmy Johns Funding LLC, Series 2017-1A-A2II | | | 4.85 | % (a) | | | 07/30/2047 | | | | 2,049,414 | |
1,134,247 | | JOL Air Ltd., Series 2019-1-B | | | 4.95 | % (a) | | | 04/15/2044 | | | | 1,099,804 | |
1,400,000 | | Loanpal Solar Loan Ltd., Series 2021-1GS-C | | | 3.50 | % (a) | | | 01/20/2048 | | | | 1,301,794 | |
3,781,144 | | Mosaic Solar Loan Trust, Series 2018-1A-C | | | 0.00 | % (a)(d) | | | 06/22/2043 | | | | 3,507,264 | |
1,875,000 | | Mosaic Solar Loan Trust, Series 2020-1A-C | | | 4.47 | % (a) | | | 04/20/2046 | | | | 1,931,032 | |
1,400,000 | | Neighborly Issuer LLC, Series 2021-1A-A2 | | | 3.58 | % (a) | | | 04/30/2051 | | | | 1,411,903 | |
500,000 | | SoFi Consumer Loan Program LLC, Series 2019-3-C | | | 3.35 | % (a) | | | 05/25/2028 | | | | 514,916 | |
248,775 | | SoFi Consumer Loan Program Trust, Series 2017-1-B | | | 4.73 | % (a)(e) | | | 01/26/2026 | | | | 250,624 | |
146,333 | | SoFi Consumer Loan Program Trust, Series 2017-5-A2 | | | 2.78 | % (a) | | | 09/25/2026 | | | | 147,123 | |
92,000 | | SoFi Professional Loan Program, Series 2018-C-R1 | | | 0.00 | % (a)(b)(o) | | | 01/25/2048 | | | | 2,592,875 | |
884,764 | | Springleaf Funding Trust, Series 2017-AA-A | | | 2.68 | % (a) | | | 07/15/2030 | | | | 887,370 | |
2,887,500 | | Taco Bell Funding LLC, Series 2016-1A-A2II | | | 4.38 | % (a) | | | 05/25/2046 | | | | 2,912,749 | |
6,672,485 | | Textainer Marine Containers Ltd., Series 2020-2A-A | | | 2.10 | % (a) | | | 09/20/2045 | | | | 6,702,933 | |
2,383,661 | | Textainer Marine Containers Ltd., Series 2020-2A-B | | | 3.34 | % (a) | | | 09/20/2045 | | | | 2,372,335 | |
4,836,000 | | US Auto Funding LLC, Series 2019-1A-D | | | 8.06 | % (a) | | | 11/15/2025 | | | | 5,073,854 | |
4,799,437 | | Vivint Solar Financing LLC, Series 2018-1A-A | | | 4.73 | % (a) | | | 04/30/2048 | | | | 5,168,996 | |
8,744,352 | | Wave LLC, Series 2019-1-C | | | 6.41 | % (a)(b) | | | 09/15/2044 | | | | 7,308,110 | |
1,262,591 | | Willis Engine Structured Trust, Series 2018-A-A | | | 4.75 | % (a)(c) | | | 09/15/2043 | | | | 1,266,380 | |
3,989,786 | | Zephyrus Capital Aviation Partners Ltd., Series 2018-1-A | | | 4.61 | % (a) | | | 10/15/2038 | | | | 3,957,824 | |
| | | | | | | | | | | | | | |
Total Asset Backed Obligations (Cost $86,651,331) | | | | | | | | | | | 85,518,809 | |
| | | | | | | | | | | | | | |
Bank Loans—5.8% | | | | | | | | | | | | |
297,739 | | 1011778 B.C. Unlimited Liability Company, Senior Secured First Lien Term Loan (1 Month LIBOR USD + 1.75%) | | | 1.86 | % | | | 11/19/2026 | | | | 292,808 | |
225,000 | | AAdvantage Loyalty IP Ltd., Senior Secured First Lien Term Loan | | | 5.50 | % (f) | | | 03/24/2028 | | | | 230,802 | |
296,974 | | Access CIG LLC, Senior Secured First Lien Term Loan (1 Month LIBOR USD + 3.75%) | | | 3.87 | % | | | 02/27/2025 | | | | 295,011 | |
173,684 | | Acrisure LLC, Senior Secured First Lien Term Loan (3 Month LIBOR USD + 3.50%) | | | 3.70 | % | | | 02/16/2027 | | | | 171,930 | |
170,000 | | Acuris Finance US, Inc., Senior Secured First Lien Term Loan (3 Month LIBOR USD + 4.00%, 0.50% Floor) | | | 4.50 | % | | | 02/16/2028 | | | | 168,938 | |
225,363 | | Agiliti Health, Inc., Senior Secured First Lien Term Loan (1 Month LIBOR USD + 2.75%) | | | 2.88 | % | | | 01/05/2026 | | | | 222,264 | |
255,731 | | Air Methods Corporation, Senior Secured First Lien Term Loan (3 Month LIBOR USD + 3.50%, 1.00% Floor) | | | 4.50 | % | | | 04/22/2024 | | | | 248,139 | |
422,966 | | Alera Group Intermediate Holdings, Inc., Senior Secured First Lien Term Loan (1 Month LIBOR USD + 4.00%, 0.50% Floor) | | | 4.50 | % | | | 08/01/2025 | | | | 423,494 | |
300,000 | | AlixPartners LLP, Senior Secured First Lien Term Loan (1 Month LIBOR USD + 2.75%, 0.50% Floor) | | | 3.25 | % | | | 02/04/2028 | | | | 299,250 | |
84,788 | | Alliance Laundry Systems LLC, Senior Secured First Lien Term Loan (3 Month LIBOR USD + 3.50%, 0.75% Floor) | | | 4.25 | % | | | 10/08/2027 | | | | 84,774 | |
403,194 | | Alliant Holdings Intermediate LLC, Senior Secured First Lien Term Loan (1 Month LIBOR USD + 3.25%) | | | 3.36 | % | | | 05/09/2025 | | | | 398,612 | |
345,625 | | Allied Universal Holdco LLC, Senior Secured First Lien Term Loan (1 Month LIBOR USD + 4.25%) | | | 4.36 | % | | | 07/10/2026 | | | | 345,086 | |
172,709 | | Almonde, Inc., Senior Secured First Lien Term Loan (6 Month LIBOR USD + 3.50%, 1.00% Floor) | | | 4.50 | % | | | 06/13/2024 | | | | 169,512 | |
60,000 | | Almonde, Inc., Senior Secured Second Lien Term Loan (6 Month LIBOR USD + 7.25%, 1.00% Floor) | | | 8.25 | % | | | 06/16/2025 | | | | 60,457 | |
50,000 | | Alpha 3 B.V., Senior Secured First Lien Term Loan (3 Month LIBOR USD + 2.50%, 0.50% Floor) | | | 3.00 | % | | | 03/17/2028 | | | | 49,914 | |
346,498 | | Alterra Mountain Company, Senior Secured First Lien Term Loan (1 Month LIBOR USD + 2.75%) | | | 2.86 | % | | | 07/31/2024 | | | | 341,303 | |
204,111 | | Amentum Government Services Holdings LLC, Senior Secured First Lien Term Loan (1 Month LIBOR USD + 3.50%) | | | 3.61 | % | | | 02/01/2027 | | | | 202,921 | |
154,250 | | American Airlines, Inc., Senior Secured First Lien Term Loan (1 Month LIBOR USD + 1.75%) | | | 1.86 | % | | | 01/29/2027 | | | | 141,191 | |
75,000 | | American Airlines, Inc., Senior Secured First Lien Term Loan (1 Month LIBOR USD + 2.00%) | | | 2.11 | % | | | 04/28/2023 | | | | 71,707 | |
74,631 | | American Airlines, Inc., Senior Secured First Lien Term Loan (1 Month LIBOR USD + 2.00%) | | | 2.11 | % | | | 12/15/2023 | | | | 71,511 | |
74,813 | | American Residential Services LLC, Senior Secured First Lien Term Loan (3 Month LIBOR USD + 3.50%, 0.75% Floor) | | | 4.25 | % | | | 10/15/2027 | | | | 74,719 | |
| | American Tire Distributors, Inc., Senior Secured First Lien Term Loan | | | | | | | | | | | | |
179,977 | | (1 Month LIBOR USD + 7.50%, 1.00% Floor) (1 Month LIBOR USD + 5.50% + 1.50% PIK) | | | 8.50 | % | | | 09/02/2024 | | | | 176,377 | |
20,666 | | (3 Month LIBOR USD + 7.50%, 1.00% Floor) (3 Month LIBOR USD + 5.50% + 1.50% PIK) | | | 8.50 | % | | | 09/02/2024 | | | | 20,253 | |
165,000 | | American Trailer World Corporation, Senior Secured First Lien Term Loan (1 Month LIBOR USD + 3.75%, 0.75% Floor) | | | 4.50 | % | | | 03/03/2028 | | | | 164,176 | |
24,938 | | AmWINS Group LLC, Senior Secured First Lien Term Loan (1 Month LIBOR USD + 2.25%, 0.75% Floor) | | | 3.00 | % | | | 02/22/2028 | | | | 24,788 | |
| | Applied Systems, Inc., Senior Secured First Lien Term Loan | | | | | | | | | | | | |
8,192 | | (Prime Rate + 2.00%, 0.50% Floor) | | | 5.25 | % | | | 09/19/2024 | | | | 8,172 | |
589,778 | | (3 Month LIBOR USD + 3.00%, 0.50% Floor) | | | 3.50 | % | | | 09/19/2024 | | | | 588,342 | |
334,163 | | Arches Buyer, Inc. Senior Secured First Lien Term Loan (1 Month LIBOR USD + 3.25%, 0.50% Floor) | | | 3.75 | % | | | 12/06/2027 | | | | 332,408 | |
144,885 | | Arctic Glacier U.S.A., Inc., Senior Secured First Lien Term Loan (3 Month LIBOR USD + 3.50%, 1.00% Floor) | | | 4.50 | % | | | 03/20/2024 | | | | 137,339 | |
401,877 | | Ascend Learning LLC, Senior Secured First Lien Term Loan (1 Month LIBOR USD + 3.00%, 1.00% Floor) | | | 4.00 | % | | | 07/12/2024 | | | | 400,872 | |
346,491 | | AssuredPartners, Inc., Senior Secured First Lien Term Loan (1 Month LIBOR USD + 3.50%) | | | 3.61 | % | | | 02/12/2027 | | | | 343,026 | |
268,414 | | Asurion LLC, Senior Secured First Lien Term Loan (1 Month LIBOR USD + 3.00%) | | | 3.11 | % | | | 11/03/2023 | | | | 267,883 | |
20,744 | | Asurion LLC, Senior Secured First Lien Term Loan (1 Month LIBOR USD + 3.00%) | | | 3.11 | % | | | 11/04/2024 | | | | 20,685 | |
279,300 | | Asurion LLC, Senior Secured First Lien Term Loan (1 Month LIBOR USD + 3.25%) | | | 3.36 | % | | | 12/23/2026 | | | | 277,880 | |
145,000 | | Asurion LLC, Senior Secured First Lien Term Loan (1 Month LIBOR USD + 3.25%) | | | 3.36 | % | | | 07/30/2027 | | | | 144,139 | |
50,000 | | Asurion LLC, Senior Secured Second Lien Term Loan (1 Month LIBOR USD + 5.25%) | | | 5.36 | % | | | 01/31/2028 | | | | 50,994 | |
245,499 | | Athenahealth, Inc., Senior Secured First Lien Term Loan (3 Month LIBOR USD + 4.25%) | | | 4.45 | % | | | 02/11/2026 | | | | 246,420 | |
105,000 | | Autokiniton US Holdings, Inc., Senior Secured First Lien Term Loan | | | 5.00 | % (f) | | | 03/29/2028 | | | | 105,459 | |
136,376 | | Avantor Funding, Inc., Senior Secured First Lien Term Loan (1 Month LIBOR USD + 2.25%, 1.00% Floor) | | | 3.25 | % | | | 11/21/2024 | | | | 136,632 | |
144,638 | | Avantor Funding, Inc., Senior Secured First Lien Term Loan (1 Month LIBOR USD + 2.25%, 1.00% Floor) | | | 3.25 | % | | | 11/08/2027 | | | | 144,873 | |
255,000 | | Avaya, Inc. Senior Secured First Lien Term Loan (1 Month LIBOR USD + 4.00%) | | | 4.11 | % | | | 12/15/2027 | | | | 255,274 | |
147,992 | | Avaya, Inc. Senior Secured First Lien Term Loan (1 Month LIBOR USD + 4.25%) | | | 4.36 | % | | | 12/15/2027 | | | | 148,304 | |
179,319 | | Azalea TopCo, Inc., Senior Secured First Lien Term Loan (3 Month LIBOR USD + 3.50%) | | | 3.71 | % | | | 07/24/2026 | | | | 177,974 | |
296,250 | | Bausch Health Companies, Inc., Senior Secured First Lien Term Loan (1 Month LIBOR USD + 2.75%) | | | 2.86 | % | | | 11/27/2025 | | | | 294,973 | |
101,140 | | Bausch Health Companies, Inc., Senior Secured First Lien Term Loan (1 Month LIBOR USD + 3.00%) | | | 3.11 | % | | | 06/02/2025 | | | | 100,938 | |
469,661 | | BioScrip, Inc., Senior Secured First Lien Term Loan (1 Month LIBOR USD + 3.75%) | | | 3.86 | % | | | 08/06/2026 | | | | 468,414 | |
343,505 | | Blackhawk Network Holdings, Inc., Senior Secured First Lien Term Loan (1 Month LIBOR USD + 3.00%) | | | 3.11 | % | | | 06/16/2025 | | | | 339,302 | |
373,078 | | Blackstone CQP Holdco LP, Senior Secured First Lien Term Loan (3 Month LIBOR USD + 3.50%) | | | 3.69 | % | | | 09/30/2024 | | | | 372,759 | |
238,872 | | Boxer Parent Company, Inc., Senior Secured First Lien Term Loan (1 Month LIBOR USD + 3.75%) | | | 3.86 | % | | | 10/02/2025 | | | | 238,153 | |
311,817 | | Brand Industrial Services, Inc., Senior Secured First Lien Term Loan (3 Month LIBOR USD + 4.25%, 1.00% Floor) | | | 5.25 | % | | | 06/21/2024 | | | | 307,648 | |
227,554 | | Brazos Delaware LLC, Senior Secured First Lien Term Loan (1 Month LIBOR USD + 4.00%) | | | 4.11 | % | | | 05/21/2025 | | | | 213,190 | |
248,933 | | Bright Bidco B.V., Senior Secured First Lien Term Loan (6 Month LIBOR USD + 3.50%, 1.00% Floor) | | | 4.50 | % | | | 06/28/2024 | | | | 191,056 | |
148,875 | | BY Crown Parent LLC, Senior Secured First Lien Term Loan (1 Month LIBOR USD + 3.00%, 1.00% Floor) | | | 4.00 | % | | | 02/02/2026 | | | | 149,224 | |
129,675 | | Cablevision Lightpath LLC, Senior Secured First Lien Term Loan (1 Month LIBOR USD + 3.25%, 0.50% Floor) | | | 3.75 | % | | | 11/30/2027 | | | | 129,661 | |
272,885 | | Caesars Resort Collection LLC, Senior Secured First Lien Term Loan (1 Month LIBOR USD + 2.75%) | | | 2.86 | % | | | 12/23/2024 | | | | 269,265 | |
139,300 | | Caesars Resort Collection LLC, Senior Secured First Lien Term Loan (1 Month LIBOR USD + 4.50%) | | | 4.61 | % | | | 07/21/2025 | | | | 139,759 | |
49,250 | | Calpine Corporation, Senior Secured First Lien Term Loan (1 Month LIBOR USD + 2.00%) | | | 2.11 | % | | | 08/12/2026 | | | | 48,766 | |
142,482 | | Cambium Learning Group, Inc., Senior Secured First Lien Term Loan (3 Month LIBOR USD + 4.50%) | | | 5.25 | % | | | 12/18/2025 | | | | 142,829 | |
339,374 | | Camelot U.S. Acquisition 1 Company, Senior Secured First Lien Term Loan (1 Month LIBOR USD + 3.00%) | | | 3.11 | % | | | 10/30/2026 | | | | 337,094 | |
74,813 | | Camelot U.S. Acquisition 1 Company, Senior Secured First Lien Term Loan (1 Month LIBOR USD + 3.00%, 1.00% Floor) | | | 4.00 | % | | | 10/30/2026 | | | | 74,869 | |
84,363 | | Carnival Corporation, Senior Secured First Lien Term Loan (1 Month LIBOR USD + 7.50%, 1.00% Floor) | | | 8.50 | % | | | 06/30/2025 | | | | 87,285 | |
432,473 | | Castle US Holding Corporation, Senior Secured First Lien Term Loan (3 Month LIBOR USD + 3.75%) | | | 3.95 | % | | | 01/29/2027 | | | | 427,878 | |
359,679 | | Cengage Learning, Inc., Senior Secured First Lien Term Loan (6 Month LIBOR USD + 4.25%, 1.00% Floor) | | | 5.25 | % | | | 06/07/2023 | | | | 356,607 | |
| | Change Healthcare Holdings, Inc., Senior Secured First Lien Term Loan | | | | | | | | | | | | |
186,463 | | (1 Month LIBOR USD + 2.50%, 1.00% Floor) | | | 3.50 | % | | | 03/01/2024 | | | | 186,473 | |
203,383 | | (3 Month LIBOR USD + 2.50%, 1.00% Floor) | | | 3.50 | % | | | 03/01/2024 | | | | 203,394 | |
200,000 | | Charter NEX US, Inc., Senior Secured First Lien Term Loan (1 Month LIBOR USD + 4.25%, 0.75% Floor) | | | 5.00 | % | | | 12/01/2027 | | | | 200,661 | |
424,701 | | CHG Healthcare Services, Inc., Senior Secured First Lien Term Loan (6 Month LIBOR USD + 3.00%, 1.00% Floor) | | | 4.00 | % | | | 06/07/2023 | | | | 423,905 | |
343,910 | | CHG PPC Parent LLC, Senior Secured First Lien Term Loan (1 Month LIBOR USD + 2.75%) | | | 2.86 | % | | | 03/31/2025 | | | | 339,611 | |
175,893 | | Cincinnati Bell, Inc., Senior Secured First Lien Term Loan (1 Month LIBOR USD + 3.25%, 1.00% Floor) | | | 4.25 | % | | | 10/02/2024 | | | | 176,022 | |
404,398 | | Clarios Global LP, Senior Secured First Lien Term Loan (1 Month LIBOR USD + 3.25%) | | | 3.36 | % | | | 04/30/2026 | | | | 400,859 | |
213,168 | | Clear Channel Outdoor Holdings, Inc., Senior Secured First Lien Term Loan (1 Month LIBOR USD + 3.50%) | | | 3.71 | % | | | 08/21/2026 | | | | 205,382 | |
326,150 | | ClubCorp Holdings, Inc., Senior Secured First Lien Term Loan (3 Month LIBOR USD + 2.75%) | | | 2.95 | % | | | 09/18/2024 | | | | 307,447 | |
150,000 | | CNT Holdings I Corporation, Senior Secured First Lien Term Loan (6 Month LIBOR USD + 3.75%, 0.75% Floor) | | | 4.50 | % | | | 11/08/2027 | | | | 149,883 | |
94,763 | | CommerceHub, Inc., Senior Secured First Lien Term Loan (1 Month LIBOR USD + 4.00%, 0.75% Floor) | | | 4.75 | % | | | 12/29/2027 | | | | 94,970 | |
281,267 | | Compass Power Generation LLC, Senior Secured First Lien Term Loan (1 Month LIBOR USD + 3.50%, 1.00% Floor) | | | 4.50 | % | | | 12/20/2024 | | | | 279,931 | |
89,100 | | Connect U.S. Finco LLC, Senior Secured First Lien Term Loan (1 Month LIBOR USD + 3.50%, 1.00% Floor) | | | 4.50 | % | | | 12/11/2026 | | | | 88,924 | |
139,300 | | Conservice Midco LLC, Senior Secured First Lien Term Loan (3 Month LIBOR USD + 4.25%) | | | 4.45 | % | | | 05/13/2027 | | | | 139,404 | |
42,840 | | Consolidated Communications, Inc., Senior Secured First Lien Term Loan (1 Month LIBOR USD + 4.75%, 1.00% Floor) | | | 5.75 | % | | | 10/04/2027 | | | | 42,954 | |
77,294 | | Constant Contact, Inc. | | | 4.75 | % (f)(h) | | | 02/10/2028 | | | | 76,908 | |
287,706 | | Constant Contact, Inc., Senior Secured First Lien Term Loan (1 Month LIBOR USD + 4.00%, 0.75% Floor) | | | 4.75 | % | | | 02/10/2028 | | | | 286,267 | |
296,871 | | Cornerstone OnDemand, Inc., Senior Secured First Lien Term Loan (1 Month LIBOR USD + 4.25%) | | | 4.36 | % | | | 04/22/2027 | | | | 297,521 | |
340,000 | | CP Atlas Buyer, Inc., Senior Secured First Lien Term Loan (3 Month LIBOR USD + 3.75%, 0.50% Floor) | | | 4.25 | % | | | 11/23/2027 | | | | 338,275 | |
250,516 | | CSC Holdings LLC, Senior Secured First Lien Term Loan (1 Month LIBOR USD + 2.25%) | | | 2.36 | % | | | 07/17/2025 | | | | 247,649 | |
132,300 | | CSC Holdings LLC, Senior Secured First Lien Term Loan (1 Month LIBOR USD + 2.25%) | | | 2.36 | % | | | 01/15/2026 | | | | 130,688 | |
200,350 | | CSM Bakery Solutions LLC, Senior Secured First Lien Term Loan (3 Month LIBOR USD + 6.25%, 1.00% Floor) | | | 7.25 | % | | | 01/04/2022 | | | | 199,627 | |
358,193 | | Cvent, Inc., Senior Secured First Lien Term Loan (1 Month LIBOR USD + 3.75%) | | | 3.90 | % | | | 11/29/2024 | | | | 349,537 | |
113,211 | | Cyanco Intermediate 2 Corporation, Senior Secured First Lien Term Loan (1 Month LIBOR USD + 3.50%) | | | 3.61 | % | | | 03/17/2025 | | | | 112,828 | |
293,698 | | Cyxtera DC Holdings, Inc., Senior Secured First Lien Term Loan (6 Month LIBOR USD + 3.00%, 1.00% Floor) | | | 4.00 | % | | | 05/01/2024 | | | | 282,551 | |
243,074 | | DCert Buyer, Inc., Senior Secured First Lien Term Loan (1 Month LIBOR USD + 4.00%) | | | 4.11 | % | | | 10/16/2026 | | | | 242,956 | |
442,011 | | Deerfield Dakota Holding LLC, Senior Secured First Lien Term Loan (1 Month LIBOR USD + 3.75%, 1.00% Floor) | | | 4.75 | % | | | 04/09/2027 | | | | 443,116 | |
420,000 | | Delta 2 (Lux) SARL, Senior Secured First Lien Term Loan (1 Month LIBOR USD + 2.50%, 1.00% Floor) | | | 3.50 | % | | | 02/01/2024 | | | | 416,686 | |
190,000 | | Delta Topco, Inc., Senior Secured First Lien Term Loan (3 Month LIBOR USD + 3.75%, 0.75% Floor) | | | 4.50 | % | | | 12/01/2027 | | | | 190,034 | |
315,898 | | Dentalcorp Perfect Smile ULC, Senior Secured First Lien Term Loan (1 Month LIBOR USD + 3.75%, 1.00% Floor) | | | 4.75 | % | | | 06/06/2025 | | | | 313,923 | |
83,983 | | DG Investment Intermediate Holdings 2, Inc., Senior Secured First Lien | | | 4.50 | % (f) | | | 03/18/2028 | | | | 83,694 | |
401,017 | | DG Investment Intermediate Holdings 2, Inc., Senior Secured First Lien | | | 4.50 | % (f) | | | 03/18/2028 | | | | 399,640 | |
45,000 | | DG Investment Intermediate Holdings 2, Inc., Senior Secured Second Lien | | | 7.50 | % (f) | | | 03/18/2029 | | | | 45,225 | |
285,724 | | Diamond (BC) B.V., Senior Secured First Lien Term Loan (1 Month LIBOR USD + 3.00%) | | | 3.11 | % | | | 09/06/2024 | | | | 284,745 | |
123,510 | | Diamond Sports Group LLC, Senior Secured First Lien Term Loan (1 Month LIBOR USD + 3.25%) | | | 3.36 | % | | | 08/24/2026 | | | | 85,737 | |
77,552 | | Dynasty Acquisition Company, Inc., Senior Secured First Lien Term Loan (3 Month LIBOR USD + 3.50%) | | | 3.75 | % | | | 04/06/2026 | | | | 75,384 | |
144,246 | | Dynasty Acquisition Company, Inc., Senior Secured First Lien Term Loan (3 Month LIBOR USD + 3.50%) | | | 3.75 | % | | | 04/06/2026 | | | | 140,214 | |
293,564 | | EAB Global, Inc., Senior Secured First Lien Term Loan (6 Month LIBOR USD + 3.75%, 1.00% Floor) | | | 4.75 | % | | | 11/15/2024 | | | | 292,830 | |
125,000 | | Edelman Financial Center LLC, Senior Secured First Lien | | | 4.50 | % (f) | | | 04/05/2028 | | | | 124,493 | |
318,276 | | Edelman Financial Center LLC, Senior Secured First Lien Term Loan (1 Month LIBOR USD + 3.00%) | | | 3.11 | % | | | 07/21/2025 | | | | 317,133 | |
110,000 | | EG America LLC, Senior Secured First Lien | | | 4.75 | % (f) | | | 03/12/2026 | | | | 109,038 | |
188,226 | | EG Group, Ltd., Senior Secured First Lien Term Loan (3 Month LIBOR USD + 4.00%) | | | 4.20 | % | | | 02/06/2025 | | | | 185,537 | |
200,000 | | Endo Luxembourg Finance Company I SARL, Senior Secured First Lien | | | 5.75 | % (f) | | | 03/25/2028 | | | | 198,333 | |
415,000 | | Endurance International Group, Inc., Senior Secured First Lien Term Loan (6 Month LIBOR USD + 3.50%, 0.75% Floor) | | | 4.25 | % | | | 02/10/2028 | | | | 411,369 | |
175,000 | | Energizer Holdings, Inc., Senior Secured First Lien Term Loan (1 Month LIBOR USD + 2.25%, 0.50% Floor) | | | 2.75 | % | | | 12/22/2027 | | | | 174,635 | |
462,282 | | Envision Healthcare Corporation, Senior Secured First Lien Term Loan (1 Month LIBOR USD + 3.75%) | | | 3.86 | % | | | 10/10/2025 | | | | 400,357 | |
20,000 | | eResearchTechnology, Inc., Senior Secured First Lien | | | 5.50 | % (f) | | | 02/04/2027 | | | | 20,050 | |
181,373 | | ESH Hospitality, Inc., Senior Secured First Lien Term Loan (1 Month LIBOR USD + 2.00%) | | | 2.11 | % | | | 09/18/2026 | | | | 180,386 | |
152,547 | | EW Scripps Company, Senior Secured First Lien Term Loan (1 Month LIBOR USD + 2.56%, 0.75% Floor) | | | 3.31 | % | | | 05/01/2026 | | | | 152,071 | |
410,365 | | Excelitas Technologies Corporation, Senior Secured First Lien Term Loan (3 Month LIBOR USD + 3.50%, 1.00% Floor) | | | 4.50 | % | | | 12/02/2024 | | | | 410,866 | |
144,638 | | Exgen Renewables LLC, Senior Secured First Lien Term Loan (3 Month LIBOR USD + 2.75%, 1.00% Floor) | | | 3.75 | % | | | 12/15/2027 | | | | 144,999 | |
401,770 | | Filtration Group Corporation, Senior Secured First Lien Term Loan (1 Month LIBOR USD + 3.00%) | | | 3.11 | % | | | 03/31/2025 | | | | 396,573 | |
253,648 | | First Advantage Holdings LLC, Senior Secured First Lien Term Loan (1 Month LIBOR USD + 3.00%) | | | 3.11 | % | | | 01/29/2027 | | | | 252,126 | |
182,834 | | Flex Acquisition Company, Inc., Senior Secured First Lien Term Loan (3 Month LIBOR USD + 3.25%) | | | 3.45 | % | | | 06/30/2025 | | | | 180,104 | |
272,057 | | Flexential Intermediate Corporation, Senior Secured First Lien Term Loan (3 Month LIBOR USD + 3.50%) | | | 3.70 | % | | | 08/01/2024 | | | | 254,884 | |
| | Flexera Software LLC, Senior Secured First Lien Term Loan | | | | | | | | | | | | |
1,143 | | (1 Month LIBOR USD + 3.25%, 0.75% Floor) | | | 4.25 | % | | | 03/03/2028 | | | | 1,147 | |
1,143 | | (3 Month LIBOR USD + 3.25%, 0.75% Floor) | | | 4.25 | % | | | 03/03/2028 | | | | 1,147 | |
442,527 | | (6 Month LIBOR USD + 3.25%, 0.75% Floor) | | | 4.25 | % | | | 03/03/2028 | | | | 443,909 | |
131,853 | | Foresight Energy LLC, Senior Secured First Lien Term Loan (1 Month LIBOR USD + 8.00%, 1.50% Floor) | | | 9.50 | % (b) | | | 06/30/2027 | | | | 131,853 | |
97,060 | | Forterra Finance LLC, Senior Secured First Lien Term Loan (1 Month LIBOR USD + 3.00%, 1.00% Floor) | | | 4.00 | % | | | 10/25/2023 | | | | 97,351 | |
215,000 | | Foundation Building Materials, Inc., Senior Secured First Lien Term Loan (1 Month LIBOR USD + 3.25%, 0.50% Floor) | | | 3.75 | % | | | 01/31/2028 | | | | 213,307 | |
123,889 | | Frontdoor, Inc., Senior Secured First Lien Term Loan (1 Month LIBOR USD + 2.50%) | | | 2.63 | % | | | 08/18/2025 | | | | 123,812 | |
177,413 | | Frontera Generation Holdings LLC, Senior Secured First Lien Term Loan (3 Month LIBOR USD + 4.25%, 1.00% Floor) | | | 5.25 | % (g) | | | 05/02/2025 | | | | 12,862 | |
100,000 | | Frontier Communications Corporation, Senior Secured First Lien Term Loan (1 Month LIBOR USD + 4.75%, 1.00% Floor) | | | 5.75 | % | | | 10/08/2021 | | | | 99,875 | |
455,000 | | Garda World Security Corporation, Senior Secured First Lien | | | 4.36 | % (f) | | | 10/30/2026 | | | | 456,042 | |
123,750 | | Gardner Denver, Inc., Senior Secured First Lien Term Loan (1 Month LIBOR USD + 1.75%) | | | 1.86 | % | | | 03/01/2027 | | | | 122,358 | |
235,000 | | Gemini HDPE LLC, Senior Secured First Lien Term Loan (3 Month LIBOR USD + 3.00%, 0.50% Floor) | | | 3.50 | % | | | 12/31/2027 | | | | 234,267 | |
373,785 | | Gentiva Health Services, Inc., Senior Secured First Lien Term Loan (1 Month LIBOR USD + 2.75%) | | | 2.88 | % | | | 07/02/2025 | | | | 372,228 | |
252,082 | | Getty Images, Inc., Senior Secured First Lien Term Loan (1 Month LIBOR USD + 4.50%) | | | 4.63 | % | | | 02/19/2026 | | | | 250,217 | |
| | Global Medical Response, Inc., Senior Secured First Lien Term Loan | | | | | | | | | | | | |
193,086 | | (3 Month LIBOR USD + 4.75%, 1.00% Floor) | | | 5.75 | % | | | 10/02/2025 | | | | 192,772 | |
41,327 | | (6 Month LIBOR USD + 4.75%, 1.00% Floor) | | | 5.75 | % | | | 10/02/2025 | | | | 41,260 | |
287,739 | | Golden Nugget, Inc., Senior Secured First Lien Term Loan (3 Month LIBOR USD + 2.50%, 0.75% Floor) | | | 3.70 | % | | | 10/04/2023 | | | | 283,758 | |
366,810 | | GoodRX, Inc., Senior Secured First Lien Term Loan (1 Month LIBOR USD + 2.75%) | | | 2.86 | % | | | 10/10/2025 | | | | 366,056 | |
210,000 | | Grab Holdings, Inc., Senior Secured First Lien Term Loan (6 Month LIBOR USD + 4.50%, 1.00% Floor) | | | 5.50 | % | | | 01/29/2026 | | | | 214,463 | |
181,237 | | Graham Packaging Company, Inc., Senior Secured First Lien Term Loan (1 Month LIBOR USD + 3.00%, 0.75% Floor) | | | 3.75 | % | | | 08/04/2027 | | | | 180,342 | |
243,161 | | Granite US Holdings Corporation, Senior Secured First Lien Term Loan (1 Month LIBOR USD + 4.00%) | | | 4.17 | % | | | 09/30/2026 | | | | 242,857 | |
601,856 | | Gray Television, Inc., Senior Secured First Lien Term Loan (1 Month LIBOR USD + 2.50%) | | | 2.62 | % | | | 01/02/2026 | | | | 598,943 | |
329,175 | | Great Outdoors Group LLC, Senior Secured First Lien Term Loan (1 Month LIBOR USD + 4.25%, 0.75% Floor) | | | 5.00 | % | | | 03/06/2028 | | | | 330,121 | |
459,536 | | Greeneden U.S. Holdings II LLC, Senior Secured First Lien Term Loan (1 Month LIBOR USD + 4.00%, 0.75% Floor) | | | 4.75 | % | | | 12/01/2027 | | | | 459,995 | |
90,911 | | GTT Communications, Inc., Senior Secured First Lien Term Loan (3 Month LIBOR USD + 2.75%) | | | 3.00 | % | | | 06/02/2025 | | | | 77,118 | |
122,444 | | Gulf Finance LLC, Senior Secured First Lien Term Loan (1 Month LIBOR USD + 5.25%, 1.00% Floor) | | | 6.25 | % | | | 08/25/2023 | | | | 101,913 | |
274,313 | | Harbor Freight Tools USA, Inc., Senior Secured First Lien Term Loan (1 Month LIBOR USD + 3.00%, 0.75% Floor) | | | 3.75 | % | | | 10/19/2027 | | | | 274,374 | |
203,881 | | Hayward Industries, Inc., Senior Secured First Lien Term Loan (1 Month LIBOR USD + 3.50%) | | | 3.61 | % | | | 08/05/2024 | | | | 204,179 | |
445,000 | | Helios Software Holdings, Inc., Senior Secured First Lien Term Loan (3 Month LIBOR USD + 3.75%) | | | 3.93 | % | | | 03/13/2028 | | | | 442,499 | |
171,938 | | Hexion, Inc., Senior Secured First Lien Term Loan (3 Month LIBOR USD + 3.50%) | | | 3.71 | % | | | 07/01/2026 | | | | 172,153 | |
290,844 | | H-Food Holdings LLC, Senior Secured First Lien Term Loan (1 Month LIBOR USD + 3.69%) | | | 3.80 | % | | | 05/23/2025 | | | | 288,422 | |
185,000 | | Horizon Therapeutics USA, Inc., Senior Secured First Lien Term Loan (1 Month LIBOR USD + 2.00%, 0.50% Floor) | | | 2.50 | % | | | 03/15/2028 | | | | 184,723 | |
187,114 | | Houston Foods, Inc., Senior Secured First Lien Term Loan (1 Month LIBOR USD + 3.75%) | | | 3.86 | % | | | 07/21/2025 | | | | 185,360 | |
342,751 | | Hyland Software, Inc., Senior Secured First Lien Term Loan (1 Month LIBOR USD + 3.50%, 0.75% Floor) | | | 4.25 | % | | | 07/01/2024 | | | | 343,001 | |
35,000 | | Hyland Software, Inc., Senior Secured Second Lien | | | 7.00 | % (f) | | | 07/10/2025 | | | | 35,146 | |
93,959 | | Hyland Software, Inc., Senior Secured Second Lien Term Loan (1 Month LIBOR USD + 7.00%, 0.75% Floor) | | | 7.75 | % | | | 07/07/2025 | | | | 94,350 | |
96,250 | | IAA, Inc., Senior Secured First Lien Term Loan (1 Month LIBOR USD + 2.25%) | | | 2.36 | % | | | 06/29/2026 | | | | 95,889 | |
151,136 | | IHeartCommunications, Inc., Senior Secured First Lien Term Loan (1 Month LIBOR USD + 3.00%) | | | 3.11 | % | | | 05/01/2026 | | | | 149,530 | |
340,000 | | INEOS US Petrochem LLC, Senior Secured First Lien Term Loan (3 Month LIBOR USD + 2.75%, 0.50% Floor) | | | 3.25 | % | | | 01/29/2026 | | | | 339,522 | |
138,600 | | Informatica LLC, Senior Secured First Lien Term Loan (1 Month LIBOR USD + 3.25%) | | | 3.36 | % | | | 02/25/2027 | | | | 137,768 | |
34,204 | | Intelsat Jackson Holdings S.A., Senior Secured First Lien Delayed-Draw Term Loan (3 Month LIBOR USD + 5.50%, 1.00% Floor) | | | 6.50 | % | | | 07/13/2022 | | | | 34,700 | |
227,473 | | Intelsat Jackson Holdings S.A., Senior Secured First Lien Term Loan (Prime Rate + 4.75%, 1.00% Floor) | | | 8.00 | % | | | 11/27/2023 | | | | 231,764 | |
435,000 | | ION Trading Finance Ltd., Senior Secured First Lien | | | 4.86 | % (f) | | | 03/26/2028 | | | | 435,544 | |
284,285 | | ION Trading Technologies SARL | | | 5.00 | % (f) | | | 11/21/2024 | | | | 284,804 | |
| | IRB Holding Corporation, Senior Secured First Lien Term Loan | | | | | | | | | | | | |
547 | | (1 Month LIBOR USD + 2.75%, 1.00% Floor) | | | 3.75 | % | | | 02/05/2025 | | | | 543 | |
209,659 | | (3 Month LIBOR USD + 2.75%, 1.00% Floor) | | | 3.75 | % | | | 02/05/2025 | | | | 208,253 | |
189,525 | | IRB Holding Corporation, Senior Secured First Lien Term Loan (3 Month LIBOR USD + 3.25%, 1.00% Floor) | | | 4.25 | % | | | 12/15/2027 | | | | 189,081 | |
326,356 | | IRI Holdings, Inc., Senior Secured First Lien Term Loan (1 Month LIBOR USD + 4.25%) | | | 4.36 | % | | | 12/01/2025 | | | | 326,968 | |
595,787 | | Iron Mountain Information Management LLC, Senior Secured First Lien Term Loan (1 Month LIBOR USD + 1.75%) | | | 1.86 | % | | | 01/02/2026 | | | | 589,331 | |
180,000 | | Ivanti Software, Inc., Senior Secured First Lien Term Loan (1 Month LIBOR USD + 4.75%, 1.00% Floor) | | | 5.75 | % | | | 12/01/2027 | | | | 180,957 | |
76,176 | | Jo-Ann Stores LLC, Senior Secured First Lien Term Loan (6 Month LIBOR USD + 5.00%, 1.00% Floor) | | | 6.00 | % | | | 10/20/2023 | | | | 76,033 | |
212,408 | | KBR, Inc., Senior Secured First Lien Term Loan (1 Month LIBOR USD + 2.75%) | | | 2.86 | % | | | 02/05/2027 | | | | 212,408 | |
30,000 | | Kenan Advantage Group, Inc., Senior Secured First Lien | | | 4.50 | % (f) | | | 03/18/2026 | | | | 29,888 | |
316,000 | | Kestrel Bidco, Inc., Senior Secured First Lien Term Loan (6 Month LIBOR USD + 3.00%, 1.00% Floor) | | | 4.00 | % | | | 12/11/2026 | | | | 307,106 | |
279,042 | | Kindred Healthcare, Inc., Senior Secured First Lien Term Loan (1 Month LIBOR USD + 4.50%) | | | 4.63 | % | | | 07/02/2025 | | | | 280,089 | |
335,000 | | Kleopatra Finco SARL, Senior Secured First Lien | | | 5.25 | % (f) | | | 02/09/2026 | | | | 334,581 | |
100,000 | | Kodiak Building Partners, Inc., Senior Secured First Lien Term Loan (3 Month LIBOR USD + 3.25%, 0.75% Floor) | | | 4.00 | % | | | 03/10/2028 | | | | 99,500 | |
284,288 | | Kronos Acquisition Holdings, Inc., Senior Secured First Lien Term Loan (3 Month LIBOR USD + 3.75%, 0.50% Floor) | | | 4.25 | % | | | 12/22/2026 | | | | 280,606 | |
30,909 | | LBM Acquisition LLC, Senior Secured First Lien | | | 4.50 | % (f) | | | 12/17/2027 | | | | 30,831 | |
139,091 | | LBM Acquisition LLC, Senior Secured First Lien Term Loan (3 Month LIBOR USD + 3.75%, 0.75% Floor) | | | 4.50 | % | | | 12/17/2027 | | | | 138,739 | |
20,809 | | Lealand Finance Company B.V., Senior Secured First Lien Term Loan (1 Month LIBOR USD + 1.00%) | | | 1.11 | % | | | 06/30/2025 | | | | 11,792 | |
105,236 | | Lions Gate Capital Holdings LLC, Senior Secured First Lien Term Loan (1 Month LIBOR USD + 2.25%) | | | 2.36 | % | | | 03/24/2025 | | | | 103,876 | |
319,200 | | LogMeIn, Inc., Senior Secured First Lien Term Loan (1 Month LIBOR USD + 4.75%) | | | 4.85 | % | | | 08/31/2027 | | | | 318,752 | |
343,429 | | Lower Cadence Holdings LLC, Senior Secured First Lien Term Loan (1 Month LIBOR USD + 4.00%) | | | 4.11 | % | | | 05/22/2026 | | | | 335,989 | |
355,603 | | Lucid Energy Group II Borrower LLC, Senior Secured First Lien Term Loan (1 Month LIBOR USD + 3.00%, 1.00% Floor) | | | 4.00 | % | | | 02/18/2025 | | | | 345,083 | |
423,938 | | Lummus Technology Holdings V LLC, Senior Secured First Lien Term Loan (1 Month LIBOR USD + 3.50%) | | | 3.61 | % | | | 06/30/2027 | | | | 422,613 | |
59,421 | | Maravai Intermediate Holdings LLC, Senior Secured First Lien Term Loan (3 Month LIBOR USD + 4.25%, 1.00% Floor) | | | 5.25 | % | | | 10/19/2027 | | | | 59,792 | |
281,777 | | Mavis Tire Express Services Corporation, Senior Secured First Lien Term Loan (3 Month LIBOR USD + 3.25%) | | | 3.50 | % | | | 03/20/2025 | | | | 281,249 | |
174,563 | | Mavis Tire Express Services Corporation, Senior Secured First Lien Term Loan (3 Month LIBOR USD + 4.00%, 1.00% Floor) | | | 5.00 | % | | | 03/20/2025 | | | | 174,508 | |
45,486 | | MED ParentCo LP, Senior Secured First Lien Delayed-Draw Term Loan (1 Month LIBOR USD + 4.25%) | | | 4.36 | % | | | 08/31/2026 | | | | 45,198 | |
321,383 | | MED ParentCo LP, Senior Secured First Lien Term Loan (1 Month LIBOR USD + 4.25%) | | | 4.36 | % | | | 08/31/2026 | | | | 319,348 | |
341,768 | | Messer Industries GMBH, Senior Secured First Lien Term Loan (3 Month LIBOR USD + 2.50%) | | | 2.70 | % | | | 03/02/2026 | | | | 339,591 | |
709,113 | | Milano Acquisition Corporation, Senior Secured First Lien Term Loan (3 Month LIBOR USD + 4.00%, 0.75% Floor) | | | 4.75 | % | | | 10/01/2027 | | | | 707,340 | |
150,000 | | Mileage Plus Holdings LLC, Senior Secured First Lien Term Loan (3 Month LIBOR USD + 5.25%, 1.00% Floor) | | | 6.25 | % | | | 06/21/2027 | | | | 159,622 | |
358,611 | | Minotaur Acquisition, Inc., Senior Secured First Lien Term Loan (1 Month LIBOR USD + 5.00%) Mirion Technologies, Inc., Senior Secured First Lien Term Loan | | | 5.11 | % | | | 03/27/2026 | | | | 358,761 | |
13,132 | | (3 Month LIBOR USD + 4.00%) | | | 4.23 | % | | | 03/06/2026 | | | | 13,169 | |
31,640 | | (6 Month LIBOR USD + 4.00%) | | | 4.27 | % | | | 03/06/2026 | | | | 31,731 | |
299,104 | | Mister Car Wash Holdings, Inc., Senior Secured First Lien Term Loan (1 Month LIBOR USD + 3.25%) | | | 3.36 | % | | | 05/14/2026 | | | | 296,155 | |
332,430 | | Mitchell International, Inc., Senior Secured First Lien Term Loan (1 Month LIBOR USD + 3.25%) | | | 3.36 | % | | | 11/29/2024 | | | | 327,698 | |
75,000 | | Mitchell International, Inc., Senior Secured Second Lien Term Loan (1 Month LIBOR USD + 7.25%) | | | 7.36 | % | | | 12/01/2025 | | | | 75,047 | |
75,550 | | MLN US HoldCo LLC, Senior Secured First Lien Term Loan (1 Month LIBOR USD + 4.50%) | | | 4.60 | % | | | 11/28/2025 | | | | 66,977 | |
100,377 | | Motion Acquisition Ltd., Senior Secured First Lien Term Loan (3 Month LIBOR USD + 3.25%) | | | 3.45 | % | | | 11/12/2026 | | | | 97,196 | |
13,192 | | Motion Acquisition Ltd., Senior Secured First Lien Term Loan (3 Month LIBOR USD + 3.25%) | | | 3.45 | % | | | 11/12/2026 | | | | 12,774 | |
366,380 | | MPH Acquisition Holdings LLC, Senior Secured First Lien Term Loan (3 Month LIBOR USD + 2.75%, 1.00% Floor) | | | 3.75 | % | | | 06/07/2023 | | | | 364,819 | |
151,200 | | Nascar Holdings LLC, Senior Secured First Lien Term Loan (1 Month LIBOR USD + 2.75%) | | | 2.86 | % | | | 10/19/2026 | | | | 150,397 | |
117,300 | | NCR Corporation, Senior Secured First Lien Term Loan (1 Month LIBOR USD + 2.50%) | | | 2.72 | % | | | 08/28/2026 | | | | 116,274 | |
328,428 | | Numericable U.S. LLC, Senior Secured First Lien Term Loan (3 Month LIBOR USD + 4.00%) | | | 4.20 | % | | | 08/14/2026 | | | | 328,100 | |
| | OneDigital Borrower LLC, Senior Secured First Lien Delayed-Draw Term Loan | | | | | | | | | | | | |
10,400 | | (Prime Rate + 3.50%, 0.75% Floor) | | | 0.00 | % (h) | | | 11/16/2027 | | | | 10,418 | |
10,166 | | (1 Month LIBOR USD + 4.50%, 0.75% Floor) | | | 5.25 | % (h) | | | 11/16/2027 | | | | 10,183 | |
384,434 | | OneDigital Borrower LLC, Senior Secured First Lien Term Loan (3 Month LIBOR USD + 4.50%, 0.75% Floor) | | | 5.25 | % | | | 11/16/2027 | | | | 385,076 | |
99,898 | | Ortho-Clinical Diagnostics, Inc., Senior Secured First Lien Term Loan (1 Month LIBOR USD + 3.25%) | | | 3.36 | % | | | 06/30/2025 | | | | 99,849 | |
97,750 | | Outcomes Group Holdings, Inc., Senior Secured First Lien Term Loan (3 Month LIBOR USD + 3.25%) | | | 3.45 | % | | | 10/24/2025 | | | | 96,895 | |
110,000 | | Packaging Coordinators Midco, Inc., Senior Secured First Lien Term Loan (6 Month LIBOR USD + 3.75%, 0.75% Floor) | | | 4.50 | % | | | 11/30/2027 | | | | 110,086 | |
205,000 | | Packers Holdings LLC, Senior Secured First Lien Term Loan (3 Month LIBOR USD + 3.25%, 0.75% Floor) | | | 4.00 | % | | | 03/06/2028 | | | | 203,036 | |
100,000 | | PAI HoldCo, Inc., Senior Secured First Lien Term Loan (6 Month LIBOR USD + 4.00%, 1.00% Floor) | | | 5.00 | % | | | 10/26/2027 | | | | 100,469 | |
414,202 | | Parexel International Corporation, Senior Secured First Lien Term Loan (1 Month LIBOR USD + 2.75%) | | | 2.86 | % | | | 09/27/2024 | | | | 409,844 | |
205,000 | | Park River Holdings, Inc., Senior Secured First Lien Term Loan (3 Month LIBOR USD + 3.25%, 0.75% Floor) | | | 4.00 | % | | | 12/28/2027 | | | | 204,151 | |
337,089 | | Pathway Vet Alliance LLC, Senior Secured First Lien Term Loan (1 Month LIBOR USD + 3.75%) | | | 3.86 | % | | | 03/31/2027 | | | | 335,579 | |
109,784 | | PCI Gaming Authority, Senior Secured First Lien Term Loan (1 Month LIBOR USD + 2.50%) | | | 2.61 | % | | | 05/29/2026 | | | | 109,187 | |
232,749 | | Peraton Corporation, Senior Secured First Lien | | | 4.50 | % (f) | | | 02/01/2028 | | | | 233,138 | |
132,251 | | Peraton Corporation, Senior Secured First Lien Term Loan (1 Month LIBOR USD + 3.75%, 0.75% Floor) | | | 4.50 | % | | | 02/01/2028 | | | | 132,472 | |
430,000 | | Petco Health and Wellness Company, Inc., Senior Secured First Lien Term Loan (3 Month LIBOR USD + 3.25%, 0.75% Floor) | | | 4.00 | % | | | 02/25/2028 | | | | 428,992 | |
210,000 | | PetSmart, Inc., Senior Secured First Lien Term Loan (6 Month LIBOR USD + 3.75%, 0.75% Floor) | | | 4.50 | % | | | 02/11/2028 | | | | 209,969 | |
9,975 | | PetVet Care Centers LLC, Senior Secured First Lien Term Loan (1 Month LIBOR USD + 3.50%, 0.75% Floor) | | | 4.25 | % | | | 02/14/2025 | | | | 9,966 | |
342,413 | | PG&E Corporation, Senior Secured First Lien Term Loan (3 Month LIBOR USD + 3.00%, 0.50% Floor) | | | 3.50 | % | | | 06/23/2025 | | | | 342,519 | |
108,601 | | Phoenix Services International LLC, Senior Secured First Lien Term Loan (1 Month LIBOR USD + 3.75%, 1.00% Floor) | | | 4.75 | % | | | 03/03/2025 | | | | 107,888 | |
85,000 | | Pike Corporation, Senior Secured First Lien Term Loan (1 Month LIBOR USD + 3.00%) | | | 3.12 | % | | | 01/21/2028 | | | | 84,894 | |
402,146 | | Pisces Midco, Inc., Senior Secured First Lien Term Loan (1 Month LIBOR USD + 3.75%) | | | 3.86 | % | | | 04/12/2025 | | | | 402,498 | |
109,716 | | Playa Resorts Holding BV, Senior Secured First Lien Term Loan (1 Month LIBOR USD + 2.75%, 1.00% Floor) | | | 3.75 | % | | | 04/29/2024 | | | | 105,726 | |
275,000 | | Playtika Holding Corporation, Senior Secured First Lien | | | 2.86 | % (f) | | | 03/11/2028 | | | | 273,797 | |
425,000 | | PODS LLC, Senior Secured First Lien | | | 3.75 | % (f) | | | 03/19/2028 | | | | 423,459 | |
95,000 | | PointClickCare Technologies, Inc., Senior Secured First Lien Term Loan (6 Month LIBOR USD + 3.00%, 0.75% Floor) | | | 3.75 | % | | | 12/29/2027 | | | | 95,119 | |
| | Polar US Borrower LLC, Senior Secured First Lien Term Loan | | | | | | | | | | | | |
202,984 | | (1 Month LIBOR USD + 4.75%) | | | 4.86 | % | | | 10/15/2025 | | | | 201,970 | |
1,493 | | (1 Month LIBOR USD + 4.75%) | | | 5.00 | % | | | 10/15/2025 | | | | 1,485 | |
211,983 | | PowerTeam Services LLC, Senior Secured First Lien Term Loan (3 Month LIBOR USD + 3.25%, 1.00% Floor) | | | 4.25 | % | | | 03/06/2025 | | | | 210,692 | |
150,500 | | Prairie ECI Acquiror LP, Senior Secured First Lien Term Loan (1 Month LIBOR USD + 4.75%) | | | 4.86 | % | | | 03/11/2026 | | | | 146,334 | |
271,563 | | Pregis Topco LLC, Senior Secured First Lien Term Loan (1 Month LIBOR USD + 3.75%) | | | 3.86 | % | | | 07/31/2026 | | | | 269,837 | |
64,513 | | Presidio Holdings, Inc., Senior Secured First Lien Term Loan (3 Month LIBOR USD + 3.50%) | | | 3.72 | % | | | 01/22/2027 | | | | 64,472 | |
| | Prime Security Services Borrower LLC, Senior Secured First Lien Term Loan | | | | | | | | | | | | |
102,853 | | (1 Month LIBOR USD + 2.75%, 0.75% Floor) | | | 3.50 | % | | | 09/23/2026 | | | | 102,563 | |
66,012 | | (3 Month LIBOR USD + 2.75%, 0.75% Floor) | | | 3.50 | % | | | 09/23/2026 | | | | 65,826 | |
132,062 | | (6 Month LIBOR USD + 2.75%, 0.75% Floor) | | | 3.50 | % | | | 09/23/2026 | | | | 131,690 | |
66,012 | | (12 Month LIBOR USD + 2.75%, 0.75% Floor) | | | 3.50 | % | | | 09/23/2026 | | | | 65,827 | |
213,754 | | Pro Mach Group, Inc., Senior Secured First Lien Term Loan (1 Month LIBOR USD + 2.75%) | | | 2.86 | % | | | 03/07/2025 | | | | 210,250 | |
421,752 | | Project Alpha Intermediate Holding, Inc., Senior Secured First Lien Term Loan (1 Month LIBOR USD + 4.00%) | | | 4.15 | % | | | 04/26/2024 | | | | 421,172 | |
213,096 | | Pug LLC, Senior Secured First Lien Term Loan (1 Month LIBOR USD + 3.50%) | | | 3.61 | % | | | 02/12/2027 | | | | 206,437 | |
450,000 | | Rackspace Technology Global, Inc., Senior Secured First Lien Term Loan (3 Month LIBOR USD + 2.75%, 0.75% Floor) | | | 3.50 | % | | | 02/03/2028 | | | | 446,600 | |
349,125 | | Radiate Holdco LLC, Senior Secured First Lien Term Loan (1 Month LIBOR USD + 3.50%, 0.75% Floor) | | | 4.25 | % | | | 09/25/2026 | | | | 349,403 | |
| | Radiology Partners, Inc., Senior Secured First Lien Term Loan | | | | | | | | | | | | |
221,888 | | (1 Month LIBOR USD + 4.25%) | | | 4.36 | % | | | 07/09/2025 | | | | 220,524 | |
190,236 | | (3 Month LIBOR USD + 4.25%) | | | 4.47 | % | | | 07/09/2025 | | | | 189,067 | |
390,000 | | RealPage, Inc., Senior Secured First Lien | | | 3.75 | % (f) | | | 02/18/2028 | | | | 388,699 | |
129,675 | | Redstone Buyer LLC, Senior Secured First Lien Term Loan (3 Month LIBOR USD + 5.00%, 1.00% Floor) | | | 6.00 | % | | | 09/01/2027 | | | | 130,296 | |
308,046 | | RegionalCare Hospital Partners Holdings, Inc., Senior Secured First Lien Term Loan (1 Month LIBOR USD + 3.75%) | | | 3.86 | % | | | 11/14/2025 | | | | 307,784 | |
340,986 | | Renaissance Holding Corporation, Senior Secured First Lien Term Loan (1 Month LIBOR USD + 3.25%) | | | 3.36 | % | | | 05/30/2025 | | | | 333,349 | |
125,000 | | Rent-A-Center, Inc., Senior Secured First Lien Term Loan (1 Month LIBOR USD + 4.00%, 0.75% Floor) | | | 4.75 | % | | | 02/17/2028 | | | | 125,886 | |
66,566 | | RentPath, Inc., Senior Secured First Lien Term Loan (1 Month LIBOR USD + 7.00%, 1.00% Floor) | | | 8.00 | % | | | 06/30/2021 | | | | 67,232 | |
378,336 | | RentPath, Inc., Senior Secured First Lien Term Loan (Prime Rate + 3.75%, 1.00% Floor) | | | 7.00 | % (g) | | | 12/17/2021 | | | | 341,246 | |
125,974 | | Reynolds Consumer Products LLC, Senior Secured First Lien Term Loan (1 Month LIBOR USD + 1.75%) | | | 1.86 | % | | | 02/04/2027 | | | | 125,526 | |
194,091 | | Reynolds Group Holdings, Inc., Senior Secured First Lien Term Loan (1 Month LIBOR USD + 2.75%) Riverbed Technology, Inc., Senior Secured First Lien Term Loan | | | 2.86 | % | | | 02/06/2023 | | | | 193,500 | |
110,000 | | (1 Month LIBOR USD + 6.00%, 1.00% Floor) | | | 7.00 | % | | | 12/31/2025 | | | | 105,934 | |
175 | | (2 Month LIBOR USD + 6.00%, 1.00% Floor) | | | 7.00 | % | | | 12/31/2025 | | | | 168 | |
69,825 | | (3 Month LIBOR USD + 6.00%, 1.00% Floor) | | | 7.00 | % | | | 12/31/2025 | | | | 67,244 | |
114,115 | | Sabre GLBL, Inc., Senior Secured First Lien Term Loan (1 Month LIBOR USD + 2.00%) | | | 2.11 | % | | | 02/22/2024 | | | | 112,784 | |
54,863 | | Sabre GLBL, Inc., Senior Secured First Lien Term Loan (1 Month LIBOR USD + 4.00%, 0.75% Floor) | | | 4.75 | % | | | 12/17/2027 | | | | 55,514 | |
277,852 | | Scientific Games International, Inc., Senior Secured First Lien Term Loan (1 Month LIBOR USD + 2.75%) | | | 2.86 | % | | | 08/14/2024 | | | | 273,052 | |
284,599 | | Securus Technologies Holdings, Inc., Senior Secured First Lien Term Loan (6 Month LIBOR USD + 4.50%, 1.00% Floor) | | | 5.50 | % | | | 11/01/2024 | | | | 264,305 | |
241,776 | | Sedgwick Claims Management Services, Inc., Senior Secured First Lien Term Loan (1 Month LIBOR USD + 3.25%) | | | 3.36 | % | | | 12/31/2025 | | | | 238,871 | |
350,433 | | Severin Acquisition LLC, Senior Secured First Lien Term Loan (1 Month LIBOR USD + 3.25%) | | | 3.36 | % | | | 08/01/2025 | | | | 346,841 | |
581,150 | | Sinclair Television Group, Inc., Senior Secured First Lien Term Loan (1 Month LIBOR USD + 2.50%) | | | 2.61 | % | | | 09/30/2026 | | | | 573,159 | |
276,802 | | SIWF Holdings, Inc., Senior Secured First Lien Term Loan (1 Month LIBOR USD + 4.25%) | | | 4.36 | % | | | 06/13/2025 | | | | 276,340 | |
203,575 | | Six Flags Theme Parks, Inc., Senior Secured First Lien Term Loan (1 Month LIBOR USD + 1.75%) | | | 1.86 | % | | | 04/17/2026 | | | | 199,345 | |
145,000 | | SkyMiles IP Ltd., Senior Secured First Lien Term Loan (3 Month LIBOR USD + 3.75%, 1.00% Floor) | | | 4.75 | % | | | 10/20/2027 | | | | 152,468 | |
| | SMG US Midco 2, Inc., Senior Secured First Lien Term Loan | | | | | | | | | | | | |
90,551 | | (1 Month LIBOR USD + 2.50%) | | | 2.61 | % | | | 01/23/2025 | | | | 86,476 | |
219,980 | | (3 Month LIBOR USD + 2.50%) | | | 2.71 | % | | | 01/23/2025 | | | | 210,081 | |
216,760 | | SolarWinds Holdings, Inc., Senior Secured First Lien Term Loan (1 Month LIBOR USD + 2.75%) | | | 2.86 | % | | | 02/05/2024 | | | | 213,050 | |
| | Solenis International LP, Senior Secured First Lien Term Loan | | | | | | | | | | | | |
289,195 | | (3 Month LIBOR USD + 4.00%) | | | 4.19 | % | | | 06/26/2025 | | | | 288,833 | |
44,671 | | (3 Month LIBOR USD + 4.00%) | | | 4.23 | % | | | 06/26/2025 | | | | 44,615 | |
20,000 | | Solenis International LP, Senior Secured Second Lien Term Loan (3 Month LIBOR USD + 8.50%) | | | 8.69 | % | | | 06/26/2026 | | | | 20,077 | |
418,950 | | Sophia LP, Senior Secured First Lien Term Loan (3 Month LIBOR USD + 3.75%, 0.75% Floor) | | | 4.50 | % | | | 10/07/2027 | | | | 419,344 | |
260,000 | | Sotera Health Holdings LLC, Senior Secured First Lien Term Loan (3 Month LIBOR USD + 2.75%, 0.50% Floor) | | | 3.25 | % | | | 12/11/2026 | | | | 259,675 | |
479,411 | | Sound Inpatient Physicians, Inc., Senior Secured First Lien Term Loan (1 Month LIBOR USD + 2.75%) | | | 2.86 | % | | | 06/27/2025 | | | | 477,613 | |
94,599 | | Southern Graphics, Inc., Senior Secured First Lien Term Loan (1 Month LIBOR USD + 3.25%) | | | 3.36 | % | | | 12/30/2022 | | | | 71,343 | |
32,121 | | Southern Veterinary Partners LLC, Senior Secured First Lien Term Loan | | | 5.00 | % (f)(h) | | | 10/01/2027 | | | | 32,252 | |
232,297 | | Southern Veterinary Partners LLC, Senior Secured First Lien Term Loan (6 Month LIBOR USD + 4.00%, 1.00% Floor) | | | 5.00 | % | | | 10/01/2027 | | | | 233,241 | |
270,000 | | Spin Holdco, Inc., Senior Secured First Lien Term Loan (3 Month LIBOR USD + 4.00%, 0.75% Floor) | | | 4.75 | % | | | 03/06/2028 | | | | 268,047 | |
365,355 | | SS&C Technologies, Inc., Senior Secured First Lien Term Loan (1 Month LIBOR USD + 1.75%) | | | 1.86 | % | | | 04/16/2025 | | | | 362,235 | |
145,513 | | Staples, Inc., Senior Secured First Lien Term Loan (3 Month LIBOR USD + 5.00%) | | | 5.21 | % | | | 04/16/2026 | | | | 142,199 | |
336,537 | | Starfruit US Holdco LLC, Senior Secured First Lien Term Loan (1 Month LIBOR USD + 2.75%) | | | 2.86 | % | | | 10/01/2025 | | | | 331,874 | |
163,331 | | Stars Group Holdings B.V., Senior Secured First Lien Term Loan (3 Month LIBOR USD + 3.50%) | | | 3.75 | % | | | 07/10/2025 | | | | 163,808 | |
421,813 | | Surf Holdings LLC, Senior Secured First Lien Term Loan (3 Month LIBOR USD + 3.50%) | | | 3.68 | % | | | 03/05/2027 | | | | 418,266 | |
79,969 | | Syncreon Group Holdings B.V., Senior Secured First Lien Term Loan (1 Month LIBOR USD + 5.00%, 1.00% Floor) | | | 6.00 | % | | | 10/01/2024 | | | | 80,069 | |
| | TAMKO Building Products LLC, Senior Secured First Lien Term Loan | | | | | | | | | | | | |
239,780 | | (1 Month LIBOR USD + 3.00%) | | | 3.11 | % | | | 05/29/2026 | | | | 239,332 | |
82,418 | | (2 Month LIBOR USD + 3.00%) | | | 3.14 | % | | | 05/29/2026 | | | | 82,264 | |
4,454 | | Tapstone Energy Holdings III LLC, Unsecured First Lien Term Loan (1 Month LIBOR USD + 4.00%, 1.00% Floor) | | | 5.00 | % (b) | | | 04/17/2024 | | | | 4,454 | |
182,356 | | Team Health Holdings, Inc., Senior Secured First Lien Term Loan (1 Month LIBOR USD + 2.75%, 1.00% Floor) | | | 3.75 | % | | | 02/06/2024 | | | | 170,110 | |
248,750 | | Tech Data Corporation, Senior Secured First Lien Term Loan (1 Month LIBOR USD + 3.50%) | | | 3.61 | % | | | 06/30/2025 | | | | 249,771 | |
109,450 | | Tech Data Corporation, Senior Secured First Lien Term Loan (1 Month LIBOR USD + 5.50%) | | | 5.61 | % | | | 06/30/2025 | | | | 110,179 | |
178,999 | | Telesat Canada, Senior Secured First Lien Term Loan (1 Month LIBOR USD + 2.75%) | | | 2.86 | % | | | 12/07/2026 | | | | 172,752 | |
397,000 | | Tempo Acquisition LLC, Senior Secured First Lien Term Loan (1 Month LIBOR USD + 3.25%, 0.50% Floor) | | | 3.75 | % | | | 11/02/2026 | | | | 397,373 | |
123,441 | | Terrier Media Buyer, Inc., Senior Secured First Lien Term Loan (1 Month LIBOR USD + 3.50%) | | | 3.61 | % | | | 12/17/2026 | | | | 122,506 | |
463,647 | | The Dun & Bradstreet Corporation, Senior Secured First Lien Term Loan (1 Month LIBOR USD + 3.25%) | | | 3.36 | % | | | 02/06/2026 | | | | 461,764 | |
20,253 | | The Hillman Group, Inc., Senior Secured First Lien | | | 3.25 | % (f) | | | 02/24/2028 | | | | 20,181 | |
99,747 | | The Hillman Group, Inc., Senior Secured First Lien | | | 3.25 | % (f) | | | 02/24/2028 | | | | 99,394 | |
347,338 | | TIBCO Software, Inc., Senior Secured First Lien Term Loan (1 Month LIBOR USD + 3.75%) | | | 3.86 | % | | | 06/30/2026 | | | | 343,647 | |
35,000 | | TIBCO Software, Inc., Senior Secured Second Lien Term Loan (1 Month LIBOR USD + 7.25%) | | | 7.36 | % | | | 03/03/2028 | | | | 35,462 | |
287,917 | | Titan Acquisition, Ltd., Senior Secured First Lien Term Loan (6 Month LIBOR USD + 3.00%) | | | 3.27 | % | | | 03/28/2025 | | | | 282,563 | |
293,846 | | TKC Holdings, Inc., Senior Secured First Lien Term Loan (6 Month LIBOR USD + 3.75%, 1.00% Floor) | | | 4.75 | % | | | 02/01/2023 | | | | 287,627 | |
95,785 | | Trans Union LLC, Senior Secured First Lien Term Loan (1 Month LIBOR USD + 1.75%) | | | 1.86 | % | | | 11/13/2026 | | | | 95,232 | |
165,958 | | Travel Leaders Group LLC, Senior Secured First Lien Term Loan (1 Month LIBOR USD + 4.00%) | | | 4.11 | % | | | 01/25/2024 | | | | 156,050 | |
183,058 | | Travelport Finance (Luxembourg) SARL, Senior Secured First Lien Term Loan (3 Month LIBOR USD + 1.50%, 1.00% Floor) | | | 2.50 | % | | | 02/28/2025 | | | | 186,795 | |
59,471 | | Travelport Finance (Luxembourg) SARL, Senior Secured First Lien Term Loan (3 Month LIBOR USD + 5.00%) | | | 5.25 | % | | | 05/29/2026 | | | | 48,571 | |
38,562 | | TricorBraun Holdings, Inc., Senior Secured First Lien Delayed-Draw Term Loan (6 Month LIBOR USD + 3.25%, 0.50% Floor) | | | 3.75 | % (h) | | | 03/03/2028 | | | | 38,248 | |
171,438 | | TricorBraun Holdings, Inc., Senior Secured First Lien Term Loan (6 Month LIBOR USD + 3.25%, 0.50% Floor) | | | 3.75 | % | | | 03/03/2028 | | | | 170,045 | |
341,252 | | Trident TPI Holdings, Inc., Senior Secured First Lien Term Loan (3 Month LIBOR USD + 3.00%, 1.00% Floor) | | | 4.00 | % | | | 10/17/2024 | | | | 338,639 | |
410,000 | | Triton Water Holdings, Inc., Senior Secured First Lien | | | 4.00 | % (f) | | | 03/29/2028 | | | | 408,942 | |
105,000 | | Truck Hero, Inc., Senior Secured First Lien Term Loan (1 Month LIBOR USD + 3.75%, 0.75% Floor) | | | 4.50 | % | | | 01/31/2028 | | | | 104,906 | |
134,650 | | U.S. Silica Company, Senior Secured First Lien Term Loan (1 Month LIBOR USD + 4.00%, 1.00% Floor) | | | 5.00 | % | | | 05/01/2025 | | | | 130,341 | |
364,064 | | Uber Technologies, Inc., Senior Secured First Lien Term Loan (1 Month LIBOR USD + 3.50%) | | | 3.61 | % | | | 04/04/2025 | | | | 362,888 | |
396,927 | | UFC Holdings LLC, Senior Secured First Lien Term Loan (6 Month LIBOR USD + 3.00%, 0.75% Floor) | | | 3.75 | % | | | 04/29/2026 | | | | 395,965 | |
181,689 | | UGI Energy Services LLC, Senior Secured First Lien Term Loan (1 Month LIBOR USD + 3.75%) | | | 3.86 | % | | | 08/13/2026 | | | | 181,575 | |
76,835 | | UKG, Inc., Senior Secured First Lien Term Loan (1 Month LIBOR USD + 3.75%) | | | 3.86 | % | | | 05/04/2026 | | | | 76,861 | |
343,489 | | UKG, Inc., Senior Secured First Lien Term Loan (3 Month LIBOR USD + 3.25%, 0.75% Floor) | | | 4.00 | % | | | 05/04/2026 | | | | 343,999 | |
30,000 | | UKG, Inc., Senior Secured Second Lien Term Loan (3 Month LIBOR USD + 6.75%, 0.75% Floor) | | | 7.50 | % | | | 05/03/2027 | | | | 30,850 | |
120,000 | | Ultra Clean Holdings, Inc., Senior Secured First Lien | | | 0.00 | % (f) | | | 08/27/2025 | | | | 120,450 | |
102,754 | | United Natural Foods, Inc., Senior Secured First Lien Term Loan (1 Month LIBOR USD + 3.50%) | | | 3.61 | % | | | 10/22/2025 | | | | 102,832 | |
79,000 | | Univar Solutions USA, Inc., Senior Secured First Lien Term Loan (1 Month LIBOR USD + 2.00%) | | | 2.11 | % | | | 07/01/2026 | | | | 78,711 | |
104,010 | | Univision Communications, Inc., Senior Secured First Lien Term Loan (1 Month LIBOR USD + 3.75%, 1.00% Floor) | | | 4.75 | % | | | 03/13/2026 | | | | 104,104 | |
153,450 | | Upstream Newco, Inc., Senior Secured First Lien Term Loan (1 Month LIBOR USD + 4.50%) | | | 4.61 | % | | | 11/20/2026 | | | | 153,355 | |
586,075 | | US Foods, Inc., Senior Secured First Lien Term Loan (1 Month LIBOR USD + 2.00%) | | | 2.11 | % | | | 09/14/2026 | | | | 575,678 | |
154,699 | | USIC Holdings, Inc., Senior Secured First Lien Term Loan (1 Month LIBOR USD + 3.00%, 1.00% Floor) | | | 4.00 | % | | | 12/08/2023 | | | | 154,118 | |
19,950 | | Utz Quality Foods LLC, Senior Secured First Lien Term Loan (1 Month LIBOR USD + 3.00%) | | | 3.11 | % | | | 01/20/2028 | | | | 19,958 | |
144,291 | | Vantage Specialty Chemicals, Inc., Senior Secured First Lien Term Loan (3 Month LIBOR USD + 3.50%, 1.00% Floor) | | | 4.50 | % | | | 10/28/2024 | | | | 136,596 | |
20,000 | | Verscend Holding Corporation (1 Month LIBOR USD + 0.00%) | | | 4.11 | % | | | 08/27/2025 | | | | 20,028 | |
449,873 | | Verscend Holding Corporation, Senior Secured First Lien Term Loan (1 Month LIBOR USD + 4.50%) | | | 4.61 | % | | | 08/27/2025 | | | | 450,498 | |
407,953 | | Vertical U.S. Newco, Inc., Senior Secured First Lien Term Loan (6 Month LIBOR USD + 4.25%) | | | 4.48 | % | | | 07/30/2027 | | | | 409,458 | |
140,000 | | Virgin Media Bristol LLC, Senior Secured First Lien Term Loan | | | 3.36 | % (f) | | | 01/31/2029 | | | | 139,933 | |
45,000 | | Virtusa Corporation, Senior Secured First Lien Term Loan (1 Month LIBOR USD + 4.25%, 0.75% Floor) | | | 5.00 | % | | | 02/11/2028 | | | | 45,113 | |
401,570 | | VS Buyer LLC, Senior Secured First Lien Term Loan (1 Month LIBOR USD + 3.00%) | | | 3.11 | % | | | 02/26/2027 | | | | 400,902 | |
319,432 | | Wand NewCo 3, Inc., Senior Secured First Lien Term Loan (1 Month LIBOR USD + 3.00%) | | | 3.11 | % | | | 02/05/2026 | | | | 316,205 | |
124,684 | | WaterBridge Midstream Operating LLC, Senior Secured First Lien Term Loan (6 Month LIBOR USD + 5.75%, 1.00% Floor) | | | 6.75 | % | | | 06/22/2026 | | | | 118,605 | |
410,477 | | Whatabrands LLC, Senior Secured First Lien Term Loan (1 Month LIBOR USD + 2.75%) | | | 2.86 | % | | | 07/31/2026 | | | | 408,424 | |
310,000 | | WIN Waste Innovations Holdings, Inc., Senior Secured First Lien Term Loan (1 Month LIBOR USD + 2.75%, 0.50% Floor) | | | 3.25 | % | | | 03/31/2028 | | | | 309,484 | |
114,441 | | Zayo Group Holdings, Inc., Senior Secured First Lien Term Loan (1 Month LIBOR USD + 3.00%) | | | 3.11 | % | | | 03/09/2027 | | | | 113,671 | |
432,551 | | Zelis Cost Management Buyer, Inc., Senior Secured First Lien Term Loan (1 Month LIBOR USD + 3.50%) | | | 3.62 | % | | | 09/30/2026 | | | | 431,470 | |
50,000 | | Ziggo Financing Partnership, Senior Secured First Lien Term Loan (1 Month LIBOR USD + 2.50%) | | | 2.61 | % | | | 04/28/2028 | | | | 49,567 | |
| | | | | | | | | | | | | | |
Total Bank Loans (Cost $72,379,390) | | | | | | | | | | | 72,288,004 | |
| | | | | | | | | | | | | | |
Collateralized Loan Obligations—18.5% | | | | | | | | | | | | |
250,000 | | Adams Mill Ltd., Series 2014-1A-D1 (3 Month LIBOR USD + 3.50%) | | | 3.74 | % (a) | | | 07/15/2026 | | | | 248,132 | |
2,500,000 | | AIMCO, Series 2015-AA-DR (3 Month LIBOR USD + 2.45%, 2.45% Floor) | | | 2.69 | % (a) | | | 01/15/2028 | | | | 2,462,040 | |
2,000,000 | | Apidos Ltd., Series 2013-12A-DR (3 Month LIBOR USD + 2.60%) | | | 2.84 | % (a) | | | 04/15/2031 | | | | 1,921,138 | |
1,500,000 | | Apidos Ltd., Series 2015-21A-CR (3 Month LIBOR USD + 2.45%, 2.45% Floor) | | | 2.67 | % (a) | | | 07/18/2027 | | | | 1,467,917 | |
2,500,000 | | Apidos Ltd., Series 2018-29A-C (3 Month LIBOR USD + 2.75%) | | | 2.97 | % (a) | | | 07/25/2030 | | | | 2,450,161 | |
1,000,000 | | Apidos Ltd., Series 2020-33A-B (3 Month LIBOR USD + 2.20%, 2.20% Floor) | | | 2.42 | % (a) | | | 07/24/2031 | | | | 1,002,153 | |
2,500,000 | | Atrium Corporation, Series 13A-D (3 Month LIBOR USD + 2.70%) | | | 2.92 | % (a) | | | 11/21/2030 | | | | 2,456,861 | |
1,000,000 | | Atrium Corporation, Series 14A-D (3 Month LIBOR USD + 2.95%, 2.95% Floor) | | | 3.17 | % (a) | | | 08/23/2030 | | | | 983,952 | |
3,000,000 | | Atrium Corporation, Series 9A-DR (3 Month LIBOR USD + 3.60%) | | | 3.79 | % (a) | | | 05/28/2030 | | | | 2,982,777 | |
1,500,000 | | Babson Ltd., Series 2015-2A-DR (3 Month LIBOR USD + 2.95%) | | | 3.17 | % (a) | | | 10/20/2030 | | | | 1,477,300 | |
1,737,500 | | Babson Ltd., Series 2015-2A-ER (3 Month LIBOR USD + 6.45%) | | | 6.67 | % (a) | | | 10/20/2030 | | | | 1,682,251 | |
1,250,000 | | Bain Capital Credit Ltd., Series 2020-2A-B1 (3 Month LIBOR USD + 2.50%, 2.50% Floor) | | | 2.72 | % (a) | | | 07/21/2031 | | | | 1,255,846 | |
4,000,000 | | Barings Ltd., Series 2018-3A-D (3 Month LIBOR USD + 2.90%) | | | 3.12 | % (a) | | | 07/20/2029 | | | | 3,842,978 | |
2,000,000 | | Barings Ltd., Series 2019-2A-C (3 Month LIBOR USD + 3.85%, 3.85% Floor) | | | 4.09 | % (a) | | | 04/15/2031 | | | | 2,001,297 | |
2,000,000 | | Barings Ltd., Series 2020-1A-D (3 Month LIBOR USD + 3.75%, 3.75% Floor) | | | 3.99 | % (a) | | | 10/15/2032 | | | | 2,009,296 | |
1,000,000 | | Barings Ltd., Series 2021-1A-E (3 Month LIBOR USD + 6.30%, 6.30% Floor) | | | 0.01 | % (a) | | | 04/25/2034 | | | | 1,000,000 | |
3,770,000 | | BlueMountain Ltd., Series 2013-2A-DR (3 Month LIBOR USD + 2.90%) | | | 3.12 | % (a) | | | 10/22/2030 | | | | 3,550,803 | |
1,750,000 | | BlueMountain Ltd., Series 2015-2A-DR (3 Month LIBOR USD + 2.75%, 2.75% Floor) | | | 2.97 | % (a) | | | 07/18/2027 | | | | 1,711,544 | |
500,000 | | BlueMountain Ltd., Series 2015-3A-CR (3 Month LIBOR USD + 2.60%) | | | 2.82 | % (a) | | | 04/20/2031 | | | | 469,875 | |
1,000,000 | | BlueMountain Ltd., Series 2016-3A-DR (3 Month LIBOR USD + 3.10%, 3.10% Floor) | | | 3.29 | % (a) | | | 11/15/2030 | | | | 957,650 | |
1,000,000 | | BlueMountain Ltd., Series 2017-2A-C (3 Month LIBOR USD + 3.00%) | | | 3.22 | % (a) | | | 10/20/2030 | | | | 962,707 | |
2,000,000 | | Canyon Capital Ltd., Series 2012-1RA-D (3 Month LIBOR USD + 3.00%) | | | 3.24 | % (a) | | | 07/15/2030 | | | | 1,971,131 | |
2,000,000 | | Canyon Capital Ltd., Series 2014-1A-CR (3 Month LIBOR USD + 2.75%, 2.75% Floor) | | | 2.96 | % (a) | | | 01/30/2031 | | | | 1,910,102 | |
2,000,000 | | Canyon Capital Ltd., Series 2014-2A-DR (3 Month LIBOR USD + 3.65%) | | | 3.89 | % (a) | | | 04/15/2029 | | | | 2,001,614 | |
10,000,000 | | Canyon Capital Ltd., Series 2017-1A-B (3 Month LIBOR USD + 1.70%) | | | 1.94 | % (a) | | | 07/15/2030 | | | | 10,006,148 | |
2,500,000 | | Canyon Capital Ltd., Series 2018-1A-D (3 Month LIBOR USD + 2.90%, 2.90% Floor) | | | 3.14 | % (a) | | | 07/15/2031 | | | | 2,436,706 | |
3,000,000 | | Canyon Capital Ltd., Series 2020-2A-D (3 Month LIBOR USD + 3.85%, 3.85% Floor) | | | 4.06 | % (a) | | | 10/15/2031 | | | | 3,004,210 | |
2,000,000 | | Canyon Capital Ltd., Series 2021-1A-D (3 Month LIBOR USD + 3.10%, 3.10% Floor) | | | 0.01 | % (a) | | | 04/15/2034 | | | | 2,000,000 | |
1,250,000 | | Carlyle Global Market Strategies Ltd., Series 2013-2A-DR (3 Month LIBOR USD + 2.40%) | | | 2.62 | % (a) | | | 01/18/2029 | | | | 1,201,844 | |
1,500,000 | | Chenango Park Ltd., Series 2018-1A-C (3 Month LIBOR USD + 3.00%, 3.00% Floor) | | | 3.24 | % (a) | | | 04/15/2030 | | | | 1,451,315 | |
1,000,000 | | Crown Point Ltd., Series 2020-9A-B (3 Month LIBOR USD + 2.69%, 2.69% Floor) | | | 2.92 | % (a) | | | 07/14/2032 | | | | 1,002,618 | |
1,750,000 | | Dryden Senior Loan Fund, Series 2012-25A-CRR (3 Month LIBOR USD + 1.85%) | | | 2.09 | % (a) | | | 10/15/2027 | | | | 1,744,528 | |
2,500,000 | | Dryden Senior Loan Fund, Series 2013-28A-B1LR (3 Month LIBOR USD + 3.15%) | | | 3.34 | % (a) | | | 08/15/2030 | | | | 2,478,149 | |
3,900,000 | | Dryden Senior Loan Fund, Series 2014-33A-DR3 (3 Month LIBOR USD + 3.65%, 3.65% Floor) | | | 3.89 | % (a) | | | 04/15/2029 | | | | 3,903,554 | |
3,000,000 | | Dryden Senior Loan Fund, Series 2015-37A-DR (3 Month LIBOR USD + 2.50%, 2.50% Floor) | | | 2.74 | % (a) | | | 01/15/2031 | | | | 2,901,955 | |
1,000,000 | | Dryden Senior Loan Fund, Series 2016-45A-DR (3 Month LIBOR USD + 3.15%, 3.15% Floor) | | | 3.39 | % (a) | | | 10/15/2030 | | | | 1,001,150 | |
1,000,000 | | Dryden Senior Loan Fund, Series 2017-50A-D (3 Month LIBOR USD + 3.25%, 3.25% Floor) | | | 3.49 | % (a) | | | 07/15/2030 | | | | 1,001,186 | |
5,500,000 | | GoldenTree Loan Management Ltd., Series 2017-2A-D (3 Month LIBOR USD + 2.65%) | | | 2.87 | % (a) | | | 11/28/2030 | | | | 5,419,874 | |
2,500,000 | | GoldenTree Loan Opportunities Ltd., Series 2016-12A-DR (3 Month LIBOR USD + 2.90%) | | | 3.12 | % (a) | | | 07/21/2030 | | | | 2,451,281 | |
1,500,000 | | Greenwood Park Ltd., Series 2018-1A-D (3 Month LIBOR USD + 2.50%) | | | 2.74 | % (a) | | | 04/15/2031 | | | | 1,464,952 | |
250,000 | | Halcyon Loan Advisors Funding Ltd., Series 2013-2A-C (3 Month LIBOR USD + 2.70%) | | | 2.91 | % (a) | | | 08/01/2025 | | | | 250,033 | |
265,029 | | Halcyon Loan Advisors Funding Ltd., Series 2014-2A-D (3 Month LIBOR USD + 5.00%) | | | 5.22 | % (a)(b) | | | 04/28/2025 | | | | 52,786 | |
500,000 | | Halcyon Loan Advisors Funding Ltd., Series 2018-1A-A2 (3 Month LIBOR USD + 1.80%, 1.80% Floor) | | | 2.02 | % (a) | | | 07/21/2031 | | | | 494,477 | |
2,000,000 | | Hayfin Kingsland Ltd., Series 2018-8A-B (3 Month LIBOR USD + 1.48%, 1.48% Floor) | | | 1.70 | % (a) | | | 04/20/2031 | | | | 1,986,820 | |
2,000,000 | | Highbridge Loan Management Ltd., Series 2013-2A-CR (3 Month LIBOR USD + 2.90%) | | | 3.12 | % (a) | | | 10/20/2029 | | | | 1,918,964 | |
1,500,000 | | HPS Loan Management Ltd., Series 13A-18-D (3 Month LIBOR USD + 3.00%, 3.00% Floor) | | | 3.24 | % (a) | | | 10/15/2030 | | | | 1,447,457 | |
3,175,000 | | LCM LP, Series 14A-DR (3 Month LIBOR USD + 2.75%) | | | 2.97 | % (a) | | | 07/20/2031 | | | | 3,048,376 | |
1,250,000 | | LCM LP, Series 19A-E2 (3 Month LIBOR USD + 5.70%, 5.70% Floor) | | | 5.94 | % (a)(b) | | | 07/15/2027 | | | | 1,174,702 | |
2,000,000 | | LCM LP, Series 20A-DR (3 Month LIBOR USD + 2.80%) | | | 3.02 | % (a) | | | 10/20/2027 | | | | 1,978,984 | |
5,000,000 | | LCM Ltd., Series 26A-D (3 Month LIBOR USD + 2.50%, 2.50% Floor) | | | 2.72 | % (a) | | | 01/20/2031 | | | | 4,622,769 | |
1,500,000 | | LCM Ltd., Series 27A-D (3 Month LIBOR USD + 2.95%) | | | 3.17 | % (a) | | | 07/16/2031 | | | | 1,421,883 | |
1,000,000 | | Madison Park Funding Ltd., Series 2014-15A-CR (3 Month LIBOR USD + 3.45%) | | | 3.66 | % (a) | | | 01/27/2026 | | | | 999,328 | |
2,500,000 | | Madison Park Funding Ltd., Series 2014-15A-DR (3 Month LIBOR USD + 5.44%) | | | 5.65 | % (a) | | | 01/27/2026 | | | | 2,495,980 | |
1,000,000 | | Madison Park Funding Ltd., Series 2015-16A-D (3 Month LIBOR USD + 5.50%) | | | 5.72 | % (a) | | | 04/20/2026 | | | | 996,876 | |
4,500,000 | | Madison Park Funding Ltd., Series 2015-18A-BR (3 Month LIBOR USD + 1.60%) | | | 1.82 | % (a) | | | 10/21/2030 | | | | 4,501,348 | |
500,000 | | Madison Park Funding Ltd., Series 2015-18A-DR (3 Month LIBOR USD + 2.95%) | | | 3.17 | % (a) | | | 10/21/2030 | | | | 493,709 | |
3,000,000 | | Madison Park Funding Ltd., Series 2017-25A-C (3 Month LIBOR USD + 3.60%) | | | 3.82 | % (a) | | | 04/25/2029 | | | | 3,000,897 | |
1,000,000 | | Madison Park Funding Ltd., Series 2018-30A-D (3 Month LIBOR USD + 2.50%, 2.50% Floor) | | | 2.74 | % (a) | | | 04/15/2029 | | | | 958,934 | |
3,500,000 | | Magnetite Ltd., Series 2018-20A-D (3 Month LIBOR USD + 2.50%) | | | 2.72 | % (a) | | | 04/20/2031 | | | | 3,399,551 | |
1,000,000 | | Marathon Ltd., Series 2017-9A-A2 (3 Month LIBOR USD + 1.75%) | | | 1.99 | % (a) | | | 04/15/2029 | | | | 996,885 | |
6,500,000 | | Marble Point Ltd., Series 2019-1A-B (3 Month LIBOR USD + 2.15%) | | | 2.37 | % (a) | | | 07/23/2032 | | | | 6,516,037 | |
1,550,000 | | Midocean Credit, Series 2016-5A-B1R (3 Month LIBOR USD + 1.60%) | | | 1.82 | % (a) | | | 07/19/2028 | | | | 1,553,225 | |
1,000,000 | | Myers Park Ltd., Series 2018-1A-D (3 Month LIBOR USD + 3.05%, 3.05% Floor) | | | 3.27 | % (a) | | | 10/20/2030 | | | | 1,000,511 | |
1,000,000 | | Neuberger Berman Loan Advisers Ltd., Series 2016-21A-DR (3 Month LIBOR USD + 2.40%, 2.40% Floor) | | | 2.62 | % (a) | | | 04/20/2027 | | | | 1,000,162 | |
4,000,000 | | Neuberger Berman Loan Advisers Ltd., Series 2017-16SA-DR (3 Month LIBOR USD + 2.90%, 2.90% Floor) | | | 3.10 | % (a) | | | 04/15/2034 | | | | 4,000,000 | |
1,500,000 | | Neuberger Berman Loan Advisers Ltd., Series 2017-25A-DR (3 Month LIBOR USD + 2.85%, 2.85% Floor) | | | 2.96 | % (a) | | | 10/18/2029 | | | | 1,500,604 | |
1,000,000 | | Neuberger Berman Loan Advisers Ltd., Series 2017-26A-D (3 Month LIBOR USD + 2.65%, 2.65% Floor) | | | 2.87 | % (a) | | | 10/18/2030 | | | | 979,225 | |
1,500,000 | | Neuberger Berman Loan Advisers Ltd., Series 2018-28A-D (3 Month LIBOR USD + 2.85%) | | | 3.07 | % (a) | | | 04/20/2030 | | | | 1,481,169 | |
1,000,000 | | Neuberger Berman Loan Advisers Ltd., Series 2020-38A-D (3 Month LIBOR USD + 3.75%, 3.75% Floor) | | | 3.97 | % (a) | | | 10/20/2032 | | | | 1,003,162 | |
1,500,000 | | Ocean Trails, Series 2020-10A-C (3 Month LIBOR USD + 3.20%, 3.20% Floor) | | | 3.39 | % (a) | | | 10/15/2031 | | | | 1,507,623 | |
4,500,000 | | Octagon Investment Partners Ltd., Series 2012-1A-CRR (3 Month LIBOR USD + 3.90%, 3.90% Floor) | | | 4.01 | % (a) | | | 07/15/2029 | | | | 4,504,823 | |
500,000 | | Octagon Investment Partners Ltd., Series 2014-1A-CR3 (3 Month LIBOR USD + 2.75%, 2.75% Floor) | | | 2.94 | % (a) | | | 02/14/2031 | | | | 490,386 | |
1,250,000 | | Octagon Investment Partners Ltd., Series 2017-1A-D (3 Month LIBOR USD + 6.20%) | | | 6.42 | % (a) | | | 03/17/2030 | | | | 1,193,042 | |
2,000,000 | | Octagon Investment Partners Ltd., Series 2017-1A-DR (3 Month LIBOR USD + 3.40%, 3.40% Floor) | | | 3.62 | % (a) | | | 07/20/2030 | | | | 2,007,104 | |
4,000,000 | | Octagon Investment Partners Ltd., Series 2018-1A-C (3 Month LIBOR USD + 2.60%, 2.60% Floor) | | | 2.82 | % (a) | | | 01/20/2031 | | | | 3,798,206 | |
3,000,000 | | Octagon Investment Partners Ltd., Series 2018-2A-C (3 Month LIBOR USD + 2.85%) | | | 3.07 | % (a) | | | 07/25/2030 | | | | 2,932,196 | |
1,000,000 | | OHA Credit Funding Ltd., Series 2018-1A-D (3 Month LIBOR USD + 3.05%, 3.05% Floor) | | | 3.27 | % (a) | | | 10/20/2030 | | | | 995,507 | |
3,000,000 | | RRAM Ltd., Series 2018-4A-C (3 Month LIBOR USD + 2.95%) | | | 3.19 | % (a) | | | 04/15/2030 | | | | 2,977,238 | |
5,000,000 | | Sound Point Ltd., Series 2020-2A-D (3 Month LIBOR USD + 4.00%, 4.00% Floor) | | | 4.24 | % (a) | | | 10/25/2031 | | | | 5,020,068 | |
5,000,000 | | Steele Creek Ltd., Series 2019-2A-B (3 Month LIBOR USD + 2.25%, 2.25% Floor) | | | 2.49 | % (a) | | | 07/15/2032 | | | | 5,007,290 | |
3,500,000 | | Stewart Park Ltd., Series 2015-1A-DR (3 Month LIBOR USD + 2.60%, 2.60% Floor) | | | 2.84 | % (a) | | | 01/15/2030 | | | | 3,422,693 | |
1,500,000 | | Symphony Ltd., Series 2015-16A-DR (3 Month LIBOR USD + 3.05%, 3.05% Floor) | | | 3.29 | % (a) | | | 10/15/2031 | | | | 1,484,232 | |
1,000,000 | | Symphony Ltd., Series 2016-17A-DR (3 Month LIBOR USD + 2.65%) | | | 2.89 | % (a) | | | 04/15/2028 | | | | 991,475 | |
1,500,000 | | TIAA Ltd., Series 2017-2A-B (3 Month LIBOR USD + 1.50%) | | | 1.72 | % (a) | | | 01/16/2031 | | | | 1,502,534 | |
6,000,000 | | Trimaran CAVU LLC, Series 2019-1A-B (3 Month LIBOR USD + 2.20%, 2.20% Floor) | | | 2.42 | % (a) | | | 07/20/2032 | | | | 6,052,270 | |
500,000 | | Vibrant Ltd., Series 2015-3A-A2RR (3 Month LIBOR USD + 1.85%) | | | 2.07 | % (a) | | | 10/20/2031 | | | | 499,223 | |
3,900,000 | | Voya Ltd., Series 2013-1A-CR (3 Month LIBOR USD + 2.95%) | | | 3.19 | % (a) | | | 10/15/2030 | | | | 3,688,900 | |
1,500,000 | | Voya Ltd., Series 2017-3A-C (3 Month LIBOR USD + 3.55%) | | | 3.77 | % (a) | | | 07/20/2030 | | | | 1,495,581 | |
1,500,000 | | Voya Ltd., Series 2017-3A-CR (3 Month LIBOR USD + 3.15%) | | | 0.01 | % (a) | | | 04/20/2034 | | | | 1,500,000 | |
1,000,000 | | Westcott Park Ltd., Series 2016-1A-DR (3 Month LIBOR USD + 3.25%) | | | 3.47 | % (a) | | | 07/20/2028 | | | | 1,001,164 | |
2,000,000 | | Wind River Ltd., Series 2013-2A-E1R (3 Month LIBOR USD + 6.75%) | | | 6.97 | % (a) | | | 10/18/2030 | | | | 1,904,708 | |
2,000,000 | | Wind River Ltd., Series 2014-1A-DRR (3 Month LIBOR USD + 3.00%, 3.00% Floor) | | | 3.22 | % (a) | | | 07/18/2031 | | | | 1,887,278 | |
4,000,000 | | Wind River Ltd., Series 2014-2A-DR (3 Month LIBOR USD + 2.90%, 2.90% Floor) | | | 3.14 | % (a) | | | 01/15/2031 | | | | 3,707,993 | |
2,000,000 | | Wind River Ltd., Series 2014-2A-ER (3 Month LIBOR USD + 5.75%, 5.75% Floor) | | | 5.99 | % (a) | | | 01/15/2031 | | | | 1,762,767 | |
7,975,000 | | Wind River Ltd., Series 2015-2A-ER (3 Month LIBOR USD + 5.55%) | | | 5.79 | % (a) | | | 10/15/2027 | | | | 7,711,900 | |
3,500,000 | | Wind River Ltd., Series 2016-1A-DR (3 Month LIBOR USD + 2.85%) | | | 3.09 | % (a) | | | 07/15/2028 | | | | 3,417,756 | |
2,000,000 | | Wind River Ltd., Series 2017-1A-D (3 Month LIBOR USD + 3.75%) | | | 3.97 | % (a) | | | 04/18/2029 | | | | 2,002,961 | |
2,000,000 | | Wind River Ltd., Series 2017-1A-DR (3 Month LIBOR USD + 3.72%, 3.72% Floor) | | | 0.01 | % (a) | | | 04/18/2036 | | | | 1,980,000 | |
1,750,000 | | Wind River Ltd., Series 2017-1A-E (3 Month LIBOR USD + 6.42%) | | | 6.64 | % (a) | | | 04/18/2029 | | | | 1,739,967 | |
1,750,000 | | Wind River Ltd., Series 2017-1A-ER (3 Month LIBOR USD + 7.06%, 7.06% Floor) | | | 0.01 | % (a) | | | 04/18/2036 | | | | 1,715,000 | |
1,500,000 | | Wind River Ltd., Series 2017-4A-D (3 Month LIBOR USD + 2.65%) | | | 2.83 | % (a) | | | 11/20/2030 | | | | 1,463,353 | |
1,500,000 | | Wind River Ltd., Series 2018-1A-D (3 Month LIBOR USD + 2.90%) | | | 3.14 | % (a) | | | 07/15/2030 | | | | 1,451,809 | |
3,500,000 | | Wind River Ltd., Series 2018-2A-D (3 Month LIBOR USD + 3.00%) | | | 3.24 | % (a) | | | 07/15/2030 | | | | 3,408,195 | |
2,500,000 | | York Ltd., Series 2019-1A-B (3 Month LIBOR USD + 2.05%) | | | 2.27 | % (a) | | | 07/22/2032 | | | | 2,506,470 | |
| | | | | | | | | | | | | | |
Total Collateralized Loan Obligations (Cost $234,080,930) | | | | | | | | | | | 230,255,561 | |
| | | | | | | | | | | | | | |
Foreign Corporate Bonds—9.0% | | | | | | | | | | | | |
500,000 | | AES Andres B.V. | | | 7.95 | % (a) | | | 05/11/2026 | | | | 520,790 | |
2,000,000 | | AES Dominicana | | | 7.95 | % | | | 05/11/2026 | | | | 2,083,160 | |
600,000 | | AES Gener S.A. | | | 5.00 | % | | | 07/14/2025 | | | | 628,500 | |
200,000 | | AES Gener S.A. (5 Year CMT Rate + 4.92%) | | | 6.35 | % (a) | | | 10/07/2079 | | | | 214,687 | |
600,000 | | AES Gener S.A. (5 Year CMT Rate + 4.92%) | | | 6.35 | % | | | 10/07/2079 | | | | 644,061 | |
1,500,000 | | AES Gener S.A. (5 Year Swap Rate USD + 4.64%) | | | 7.13 | % (a) | | | 03/26/2079 | | | | 1,613,797 | |
500,000 | | AES Gener S.A. (5 Year Swap Rate USD + 4.64%) | | | 7.13 | % | | | 03/26/2079 | | | | 537,933 | |
400,000 | | AES Panama Generation Holdings SRL | | | 4.38 | % (a) | | | 05/31/2030 | | | | 414,620 | |
400,000 | | Altice Financing S.A. | | | 5.00 | % (a) | | | 01/15/2028 | | | | 395,500 | |
415,000 | | Altice France S.A. | | | 7.38 | % (a) | | | 05/01/2026 | | | | 432,160 | |
200,000 | | Altice France S.A. | | | 6.00 | % (a) | | | 02/15/2028 | | | | 197,429 | |
400,000 | | ARD Finance S.A. (7.25% PIK) | | | 6.50 | % (a) | | | 06/30/2027 | | | | 420,500 | |
200,000 | | Avation Capital S.A. (9.00% PIK) | | | 8.25 | % (a) | | | 10/31/2026 | | | | 161,725 | |
200,000 | | Baidu, Inc. | | | 3.43 | % | | | 04/07/2030 | | | | 210,013 | |
800,000 | | Banco BTG Pactual S.A. (5 Year CMT Rate + 5.26%) | | | 7.75 | % (a) | | | 02/15/2029 | | | | 848,800 | |
550,000 | | Banco Continental SAECA | | | 2.75 | % (a) | | | 12/10/2025 | | | | 542,338 | |
400,000 | | Banco de Credito del Peru (5 Year CMT Rate + 3.00%) | | | 3.13 | % (a) | | | 07/01/2030 | | | | 401,556 | |
600,000 | | Banco de Credito del Peru (5 Year CMT Rate + 3.00%) | | | 3.13 | % | | | 07/01/2030 | | | | 602,334 | |
200,000 | | Banco de Reservas de la Republica Dominicana | | | 7.00 | % (a) | | | 02/01/2023 | | | | 208,925 | |
650,000 | | Banco de Reservas de la Republica Dominicana | | | 7.00 | % | | | 02/01/2023 | | | | 679,006 | |
600,000 | | Banco do Estado do Rio Grande do Sul SA (5 Year CMT Rate + 4.93%) | | | 5.38 | % (a) | | | 01/28/2031 | | | | 589,527 | |
300,000 | | Banco GNB Sudameris S.A. (5 Year CMT Rate + 4.56%) | | | 6.50 | % | | | 04/03/2027 | | | | 305,805 | |
1,600,000 | | Banco Internacional del Peru SAA Interbank (1 Year CMT Rate + 3.71%) | | | 4.00 | % | | | 07/08/2030 | | | | 1,637,760 | |
500,000 | | Banco Latinoamericano de Comercio Exterior S.A. | | | 2.38 | % (a) | | | 09/14/2025 | | | | 511,445 | |
1,500,000 | | Banco Macro S.A. (5 Year Swap Rate USD + 5.46%) | | | 6.75 | % | | | 11/04/2026 | | | | 1,207,515 | |
200,000 | | Banco Macro S.A. (5 Year Swap Rate USD + 5.46%) | | | 6.75 | % (a) | | | 11/04/2026 | | | | 161,002 | |
1,400,000 | | Banco Mercantil del Norte S.A. (10 Year CMT Rate + 5.35%) | | | 7.63 | % (i) | | | 01/10/2028 | | | | 1,536,801 | |
200,000 | | Banco Mercantil del Norte S.A. (10 Year CMT Rate + 5.47%) | | | 7.50 | % (a)(i) | | | 06/27/2029 | | | | 219,235 | |
200,000 | | Banco Mercantil del Norte S.A. (10 Year CMT Rate + 5.47%) | | | 7.50 | % (i) | | | 06/27/2029 | | | | 219,235 | |
200,000 | | Banco Nacional de Panama | | | 2.50 | % (a) | | | 08/11/2030 | | | | 185,960 | |
400,000 | | Bancolombia S.A. (5 Year CMT Rate + 2.94%) | | | 4.63 | % | | | 12/18/2029 | | | | 405,450 | |
1,300,000 | | Bangkok Bank PCL (5 Year CMT Rate + 4.73%) | | | 5.00 | % (i) | | | 09/23/2025 | | | | 1,371,084 | |
500,000 | | Banistmo S.A. | | | 3.65 | % | | | 09/19/2022 | | | | 510,610 | |
300,000 | | BBVA Banco Continental S.A. (5 Year CMT Rate + 2.75%) | | | 5.25 | % | | | 09/22/2029 | | | | 325,629 | |
200,000 | | BBVA Bancomer S.A. (5 Year CMT Rate + 3.00%) | | | 5.35 | % | | | 11/12/2029 | | | | 206,442 | |
1,500,000 | | BBVA Colombia S.A. | | | 4.88 | % | | | 04/21/2025 | | | | 1,595,828 | |
2,000,000 | | BDO Unibank, Inc. | | | 2.95 | % | | | 03/06/2023 | | | | 2,075,000 | |
220,000 | | Bombardier, Inc. | | | 6.00 | % (a) | | | 10/15/2022 | | | | 220,412 | |
265,000 | | Bombardier, Inc. | | | 7.88 | % (a) | | | 04/15/2027 | | | | 260,288 | |
1,200,000 | | Braskem Finance Company (5 Year CMT Rate + 8.22%) | | | 8.50 | % (a) | | | 01/23/2081 | | | | 1,362,072 | |
500,000 | | Braskem Idesa S.A.P.I. | | | 7.45 | % (a) | | | 11/15/2029 | | | | 497,500 | |
1,100,000 | | Canacol Energy Ltd. | | | 7.25 | % | | | 05/03/2025 | | | | 1,168,024 | |
2,200,000 | | Chile Electricity PEC SPA | | | 0.00 | % (a) | | | 01/25/2028 | | | | 1,800,821 | |
300,000 | | CIMB Bank BHD | | | 3.26 | % | | | 03/15/2022 | | | | 307,230 | |
1,000,000 | | CK Hutchison International Ltd. | | | 2.50 | % (a) | | | 05/08/2030 | | | | 994,779 | |
300,000 | | CNPC Global Capital Ltd. | | | 1.13 | % | | | 06/23/2023 | | | | 300,500 | |
400,000 | | Cosan Overseas Ltd. | | | 8.25 | % | | | 11/29/2049 | | | | 410,000 | |
800,000 | | Credito Real S.A.B. de C.V. | | | 9.50 | % (a) | | | 02/07/2026 | | | | 851,800 | |
1,650,000 | | Credito Real S.A.B. de C.V. (5 Year CMT Rate + 7.03%) | | | 9.13 | % (i) | | | 11/29/2022 | | | | 1,482,649 | |
1,550,000 | | CSN Islands Corporation | | | 7.00 | % (i) | | | 06/23/2021 | | | | 1,556,944 | |
400,000 | | DBS Group Holdings Ltd. (5 Year Mid Swap Rate USD + 1.59%) | | | 4.52 | % | | | 12/11/2028 | | | | 433,968 | |
2,400,000 | | DBS Group Holdings Ltd. (5 Year Swap Rate USD + 2.39%) | | | 3.60 | % (i) | | | 09/07/2021 | | | | 2,422,524 | |
328,365 | | Digicel Group Ltd. (7.00% PIK) | | | 7.00 | % (a)(i) | | | 04/16/2021 | | | | 241,250 | |
307,445 | | Digicel Group Ltd. ((5.00% + 3.00% PIK or 8.00% PIK) | | | 8.00 | % (a) | | | 04/01/2025 | | | | 254,154 | |
1,000,000 | | Docuformas SAPI de C.V. | | | 10.25 | % (a) | | | 07/24/2024 | | | | 992,000 | |
450,000 | | eG Global Finance PLC | | | 8.50 | % (a) | | | 10/30/2025 | | | | 480,249 | |
812,900 | | Empresa Electrica Angamos S.A. | | | 4.88 | % | | | 05/25/2029 | | | | 816,111 | |
722,240 | | Empresa Electrica Cochrane SpA | | | 5.50 | % | | | 05/14/2027 | | | | 756,033 | |
1,600,000 | | Empresa Electrica Guacolda S.A. | | | 4.56 | % | | | 04/30/2025 | | | | 1,347,183 | |
939,295 | | ENA Norte Trust | | | 4.95 | % | | | 04/25/2023 | | | | 965,680 | |
200,000 | | ENN Energy Holdings Ltd. | | | 3.25 | % | | | 07/24/2022 | | | | 204,994 | |
344,706 | | Fenix Power Peru S.A. | | | 4.32 | % | | | 09/20/2027 | | | | 362,001 | |
200,000 | | Fideicomiso P.A. Pacifico Tres | | | 8.25 | % | | | 01/15/2035 | | | | 239,250 | |
200,000 | | Fomento Economico Mexicano S.A.B. de C.V. | | | 2.88 | % | | | 05/10/2023 | | | | 208,881 | |
2,600,000 | | Galaxy Pipeline Assets Bidco Ltd. | | | 2.16 | % (a) | | | 03/31/2034 | | | | 2,525,246 | |
385,000 | | Garda World Security Corporation | | | 8.75 | % (a) | | | 05/15/2025 | | | | 404,006 | |
475,000 | | Garda World Security Corporation | | | 4.63 | % (a) | | | 02/15/2027 | | | | 476,187 | |
1,300,000 | | Geopark Ltd. | | | 6.50 | % | | | 09/21/2024 | | | | 1,347,899 | |
155,000 | | GFL Environmental, Inc. | | | 3.75 | % (a) | | | 08/01/2025 | | | | 157,616 | |
385,000 | | GFL Environmental, Inc. | | | 4.00 | % (a) | | | 08/01/2028 | | | | 373,209 | |
265,000 | | GFL Environmental, Inc. | | | 3.50 | % (a) | | | 09/01/2028 | | | | 257,381 | |
400,000 | | Gilex Holding SARL | | | 8.50 | % (a) | | | 05/02/2023 | | | | 415,720 | |
450,000 | | Gilex Holding SARL | | | 8.50 | % | | | 05/02/2023 | | | | 467,685 | |
700,000 | | Globo Comunicacao e Participacoes S.A. | | | 4.88 | % (a) | | | 01/22/2030 | | | | 707,301 | |
2,600,000 | | Gran Tierra Energy International Holdings Ltd. | | | 6.25 | % | | | 02/15/2025 | | | | 2,160,041 | |
200,000 | | Gran Tierra Energy, Inc. | | | 7.75 | % (a) | | | 05/23/2027 | | | | 162,600 | |
209,986 | | Grupo Idesa S.A. de C.V. (10.38% PIK) | | | 10.13 | % (a) | | | 05/22/2026 | | | | 127,042 | |
400,000 | | Inkia Energy Ltd. | | | 5.88 | % | | | 11/09/2027 | | | | 421,068 | |
380,000 | | Intelligent Packaging Ltd. | | | 6.00 | % (a) | | | 09/15/2028 | | | | 393,062 | |
380,000 | | Intelsat Jackson Holdings S.A. | | | 5.50 | % (g) | | | 08/01/2023 | | | | 233,700 | |
35,079 | | Invepar Holdings | | | 0.00 | % (b)(g) | | | 12/30/2028 | | | | 1,500 | |
1,500,000 | | Itau Unibanco Holding S.A. (5 Year CMT Rate + 3.22%) | | | 4.63 | % (i) | | | 02/27/2025 | | | | 1,407,300 | |
900,000 | | Itau Unibanco Holding S.A. (5 Year CMT Rate + 3.22%) | | | 4.63 | % (a)(i) | | | 02/27/2025 | | | | 844,380 | |
1,700,000 | | JD.com, Inc. | | | 3.38 | % | | | 01/14/2030 | | | | 1,755,320 | |
1,200,000 | | Kasikornbank PCL (5 Year CMT Rate + 4.94%) | | | 5.28 | % (i) | | | 10/14/2025 | | | | 1,264,500 | |
400,000 | | Korea Development Bank | | | 1.00 | % | | | 09/09/2026 | | | | 394,467 | |
1,300,000 | | Korea East-West Power Company Ltd. | | | 1.75 | % | | | 05/06/2025 | | | | 1,319,366 | |
300,000 | | Korea East-West Power Company Ltd. | | | 1.75 | % (a) | | | 05/06/2025 | | | | 304,469 | |
600,000 | | Korea Electric Power Corporation | | | 1.13 | % (a) | | | 06/15/2025 | | | | 596,340 | |
500,000 | | Kronos Acquisition Holdings, Inc. | | | 5.00 | % (a) | | | 12/31/2026 | | | | 500,625 | |
195,000 | | Kronos Acquisition Holdings, Inc. | | | 7.00 | % (a) | | | 12/31/2027 | | | | 187,126 | |
1,003,200 | | LLPL Capital Pte Ltd. | | | 6.88 | % (a) | | | 02/04/2039 | | | | 1,173,538 | |
2,600,000 | | Malayan Banking BHD (5 Year Swap Rate USD + 2.54%) | | | 3.91 | % | | | 10/29/2026 | | | | 2,644,356 | |
330,000 | | Mattamy Group Corporation | | | 4.63 | % (a) | | | 03/01/2030 | | | | 328,350 | |
310,000 | | MEG Energy Corporation | | | 7.13 | % (a) | | | 02/01/2027 | | | | 325,306 | |
60,000 | | MEG Energy Corporation | | | 5.88 | % (a) | | | 02/01/2029 | | | | 60,300 | |
500,000 | | MEGlobal Canada ULC | | | 5.00 | % (a) | | | 05/18/2025 | | | | 557,117 | |
900,000 | | Minejesa Capital B.V. | | | 4.63 | % | | | 08/10/2030 | | | | 940,329 | |
1,400,000 | | Minejesa Capital B.V. | | | 5.63 | % | | | 08/10/2037 | | | | 1,470,000 | |
1,400,000 | | Minerva Luxembourg S.A. | | | 4.38 | % (a) | | | 03/18/2031 | | | | 1,370,425 | |
400,000 | | Multibank, Inc. | | | 4.38 | % | | | 11/09/2022 | | | | 411,232 | |
500,000 | | NongHyup Bank | | | 1.25 | % (a) | | | 07/20/2025 | | | | 498,085 | |
400,000 | | Ooredoo International Finance Ltd. | | | 3.25 | % | | | 02/21/2023 | | | | 418,536 | |
200,000 | | Ooredoo International Finance Ltd. | | | 3.75 | % | | | 06/22/2026 | | | | 220,080 | |
700,000 | | Operadora de Servicios Mega S.A. de C.V. | | | 8.25 | % (a) | | | 02/11/2025 | | | | 707,581 | |
400,000 | | Oversea-Chinese Banking Corporation Ltd. | | | 4.25 | % | | | 06/19/2024 | | | | 438,831 | |
800,000 | | Oversea-Chinese Banking Corporation Ltd. (5 Year CMT Rate + 1.58%) | | | 1.83 | % | | | 09/10/2030 | | | | 793,528 | |
600,000 | | Oversea-Chinese Banking Corporation Ltd. (5 Year CMT Rate + 1.58%) | | | 1.83 | % (a) | | | 09/10/2030 | | | | 595,146 | |
1,700,000 | | Pampa Energia S.A. | | | 7.50 | % | | | 01/24/2027 | | | | 1,388,900 | |
150,000 | | Pampa Energia S.A. | | | 9.13 | % | | | 04/15/2029 | | | | 126,000 | |
705,735 | | Panama Metro Line SP | | | 0.00 | % | | | 12/05/2022 | | | | 689,863 | |
707,415 | | Panama Metro Line SP | | | 0.00 | % (a) | | | 12/05/2022 | | | | 691,505 | |
300,000 | | Parkland Corporation | | | 4.50 | % (a) | | | 10/01/2029 | | | | 301,125 | |
415,000 | | Parkland Fuel Corporation | | | 5.88 | % (a) | | | 07/15/2027 | | | | 443,272 | |
1,500,000 | | Peru LNG SRL | | | 5.38 | % | | | 03/22/2030 | | | | 1,348,778 | |
2,350,000 | | Petrobras Global Finance B.V. | | | 6.75 | % | | | 06/03/2050 | | | | 2,512,796 | |
600,000 | | POSCO | | | 2.38 | % | | | 01/17/2023 | | | | 616,091 | |
1,700,000 | | POSCO | | | 2.75 | % | | | 07/15/2024 | | | | 1,795,792 | |
800,000 | | PSA Treasury Pte Ltd. | | | 2.13 | % | | | 09/05/2029 | | | | 794,511 | |
200,000 | | PTTEP Treasury Center Company Ltd. | | | 2.59 | % (a) | | | 06/10/2027 | | | | 205,962 | |
500,000 | | Reliance Industries Ltd. | | | 5.40 | % | | | 02/14/2022 | | | | 519,630 | |
700,000 | | Sinopec Group Overseas Development Ltd. | | | 2.70 | % (a) | | | 05/13/2030 | | | | 696,595 | |
272,100 | | Star Energy Geothermal Wayang Windu Ltd. | | | 6.75 | % | | | 04/24/2033 | | | | 307,182 | |
150,000 | | Starfruit Finco B.V. | | | 8.00 | % (a) | | | 10/01/2026 | | | | 159,844 | |
500,000 | | Stars Group Holdings B.V. | | | 7.00 | % (a) | | | 07/15/2026 | | | | 523,437 | |
400,000 | | State Grid Overseas Investment Ltd. | | | 3.13 | % | | | 05/22/2023 | | | | 418,457 | |
400,000 | | State Grid Overseas Investment Ltd. | | | 1.00 | % | | | 08/05/2025 | | | | 389,766 | |
1,726,887 | | Stoneway Capital Corporation | | | 10.00 | % (g) | | | 03/01/2027 | | | | 656,217 | |
675,000 | | Superior Plus LP | | | 4.50 | % (a) | | | 03/15/2029 | | | | 683,572 | |
300,000 | | Telesat LLC | | | 4.88 | % (a) | | | 06/01/2027 | | | | 300,750 | |
3,300,000 | | Temasek Financial Ltd. | | | 1.00 | % (a) | | | 10/06/2030 | | | | 3,035,005 | |
1,900,000 | | Tencent Holdings Ltd. | | | 2.39 | % (a) | | | 06/03/2030 | | | | 1,837,238 | |
255,000 | | Tervita Corporation | | | 11.00 | % (a) | | | 12/01/2025 | | | | 290,063 | |
275,000 | | Titan Acquisition Ltd. | | | 7.75 | % (a) | | | 04/15/2026 | | | | 286,330 | |
800,000 | | UEP Penonome S.A. | | | 6.50 | % | | | 10/01/2038 | | | | 809,512 | |
1,050,000 | | UEP Penonome S.A. | | | 6.50 | % (a) | | | 10/01/2038 | | | | 1,062,485 | |
3,200,000 | | Unifin Financiera S.A.B. de C.V. (5 Year CMT Rate + 6.31%) | | | 8.88 | % (i) | | | 01/29/2025 | | | | 2,637,952 | |
1,100,000 | | United Overseas Bank Ltd. (5 Year Swap Rate USD + 1.65%) | | | 2.88 | % | | | 03/08/2027 | | | | 1,121,263 | |
2,200,000 | | United Overseas Bank Ltd. (5 Year Swap Rate USD + 1.79%) | | | 3.88 | % (i) | | | 10/19/2023 | | | | 2,283,600 | |
1,100,000 | | Vedanta Resources Finance PLC | | | 9.25 | % (a) | | | 04/23/2026 | | | | 930,842 | |
2,700,000 | | Vedanta Resources Ltd. | | | 6.13 | % | | | 08/09/2024 | | | | 2,177,159 | |
200,000 | | Vertical Holding Company GMBH | | | 7.63 | % (a) | | | 07/15/2028 | | | | 215,425 | |
450,000 | | Vertical Newco, Inc. | | | 5.25 | % (a) | | | 07/15/2027 | | | | 471,938 | |
400,000 | | Virgin Media Finance PLC | | | 5.00 | % (a) | | | 07/15/2030 | | | | 400,000 | |
800,000 | | Woori Bank (5 Year CMT Rate + 2.66%) | | | 4.25 | % (i) | | | 10/04/2024 | | | | 837,480 | |
| | | | | | | | | | | | | | |
Total Foreign Corporate Bonds (Cost $112,780,989) | | | | | | | | | | | 111,883,692 | |
| | | | | | | | | | | | | | |
Foreign Government Bonds, Foreign Agencies and Foreign Government Sponsored Corporations—3.4% | | | | | | | | | | | | |
700,000 | | Abu Dhabi Government International Bond | | | 3.13 | % (a) | | | 04/16/2030 | | | | 751,689 | |
2,050,000 | | Abu Dhabi Government International Bond | | | 3.13 | % | | | 09/30/2049 | | | | 1,958,960 | |
300,000 | | Abu Dhabi Government International Bond | | | 3.88 | % | | | 04/16/2050 | | | | 326,757 | |
400,000 | | Brazilian Government International Bond | | | 5.00 | % | | | 01/27/2045 | | | | 381,742 | |
1,200,000 | | Brazilian Government International Bond | | | 5.63 | % | | | 02/21/2047 | | | | 1,227,198 | |
1,000,000 | | Chile Government International Bond | | | 3.50 | % | | | 01/25/2050 | | | | 1,020,700 | |
3,100,000 | | Chile Government International Bond | | | 3.10 | % | | | 01/22/2061 | | | | 2,886,999 | |
500,000 | | Colombia Government International Bond | | | 5.00 | % | | | 06/15/2045 | | | | 534,580 | |
1,600,000 | | Colombia Government International Bond | | | 4.13 | % | | | 05/15/2051 | | | | 1,526,144 | |
1,400,000 | | Dominican Republic International Bond | | | 5.30 | % (a) | | | 01/21/2041 | | | | 1,380,750 | |
900,000 | | Dominican Republic International Bond | | | 5.88 | % | | | 01/30/2060 | | | | 865,350 | |
400,000 | | Indonesia Government International Bond | | | 3.38 | % | | | 04/15/2023 | | | | 420,588 | |
700,000 | | Indonesia Government International Bond | | | 4.35 | % | | | 01/11/2048 | | | | 762,562 | |
1,500,000 | | Indonesia Government International Bond | | | 3.70 | % | | | 10/30/2049 | | | | 1,529,546 | |
1,700,000 | | Mexico Government International Bond | | | 4.60 | % | | | 02/10/2048 | | | | 1,747,524 | |
900,000 | | Mexico Government International Bond | | | 4.50 | % | | | 01/31/2050 | | | | 914,157 | |
1,800,000 | | Mexico Government International Bond | | | 3.77 | % | | | 05/24/2061 | | | | 1,597,275 | |
500,000 | | Panama Government International Bond | | | 4.30 | % | | | 04/29/2053 | | | | 538,670 | |
1,900,000 | | Panama Government International Bond | | | 3.87 | % | | | 07/23/2060 | | | | 1,884,933 | |
800,000 | | Perusahaan Penerbit | | | 3.80 | % | | | 06/23/2050 | | | | 812,928 | |
2,250,000 | | Peruvian Government International Bond | | | 2.78 | % | | | 01/23/2031 | | | | 2,257,785 | |
850,000 | | Peruvian Government International Bond | | | 3.30 | % | | | 03/11/2041 | | | | 830,475 | |
2,250,000 | | Peruvian Government International Bond | | | 3.55 | % | | | 03/10/2051 | | | | 2,199,308 | |
350,000 | | Peruvian Government International Bond | | | 2.78 | % | | | 12/01/2060 | | | | 289,807 | |
800,000 | | Philippine Government International Bond | | | 2.46 | % | | | 05/05/2030 | | | | 810,600 | |
1,100,000 | | Philippine Government International Bond | | | 1.65 | % | | | 06/10/2031 | | | | 1,041,792 | |
1,100,000 | | Philippine Government International Bond | | | 3.70 | % | | | 03/01/2041 | | | | 1,152,493 | |
1,700,000 | | Philippine Government International Bond | | | 3.70 | % | | | 02/02/2042 | | | | 1,780,787 | |
400,000 | | Philippine Government International Bond | | | 2.95 | % | | | 05/05/2045 | | | | 375,309 | |
400,000 | | Philippine Government International Bond | | | 2.65 | % | | | 12/10/2045 | | | | 360,539 | |
800,000 | | Qatar Government International Bond | | | 3.38 | % | | | 03/14/2024 | | | | 859,657 | |
500,000 | | Saudi Government International Bond | | | 2.38 | % | | | 10/26/2021 | | | | 505,550 | |
800,000 | | Saudi Government International Bond | | | 2.88 | % | | | 03/04/2023 | | | | 832,608 | |
1,000,000 | | Saudi Government International Bond | | | 2.90 | % (a) | | | 10/22/2025 | | | | 1,061,801 | |
200,000 | | Saudi Government International Bond | | | 3.75 | % | | | 01/21/2055 | | | | 196,512 | |
3,650,000 | | Saudi Government International Bond | | | 3.45 | % | | | 02/02/2061 | | | | 3,366,778 | |
1,550,000 | | State of Israel | | | 3.38 | % | | | 01/15/2050 | | | | 1,569,375 | |
| | | | | | | | | | | | | | |
Total Foreign Government Bonds, Foreign Agencies and Foreign Government Sponsored Corporations (Cost $42,635,723) | | | | | | | | 42,560,228 | |
| | | | | | | | | | | | | | |
Non-Agency Commercial Mortgage Backed Obligations—14.4% | | | | | | | | | | | | |
689,000 | | 20 Times Square Trust, Series 2018-20TS-F | | | 3.10 | % (a)(e) | | | 05/15/2035 | | | | 663,713 | |
658,000 | | 20 Times Square Trust, Series 2018-20TS-G | | | 3.10 | % (a)(e) | | | 05/15/2035 | | | | 604,128 | |
30,919,820 | | Arbor Multifamily Mortgage Securities Trust, Series 2020-MF1-XA | | | 0.97 | % (a)(e)(j) | | | 05/15/2053 | | | | 2,209,552 | |
1,000,000 | | Arbor Realty Ltd., Series 2019-FL1-B (1 Month LIBOR USD + 1.70%) | | | 1.81 | % (a) | | | 05/15/2037 | | | | 1,002,190 | |
1,216,000 | | Arbor Realty Ltd., Series 2020-FL1-B (1 Month LIBOR USD + 1.80%, 1.80% Floor) | | | 1.91 | % (a) | | | 02/15/2035 | | | | 1,219,156 | |
1,017,000 | | AREIT Trust, Series 2019-CRE3-D (1 Month LIBOR USD + 2.65%, 2.65% Floor) | | | 2.76 | % (a) | | | 09/14/2036 | | | | 1,005,712 | |
1,532,000 | | Atrium Hotel Portfolio Trust, Series 2017-ATRM-E (1 Month LIBOR USD + 3.05%, 3.05% Floor) | | | 3.16 | % (a) | | | 12/15/2036 | | | | 1,456,766 | |
1,898,000 | | Atrium Hotel Portfolio Trust, Series 2018-ATRM-E (1 Month LIBOR USD + 3.40%, 3.40% Floor) | | | 3.51 | % (a) | | | 06/15/2035 | | | | 1,840,530 | |
1,399,000 | | Bancorp Commercial Mortgage Trust, Series 2019-CRE5-D (1 Month LIBOR USD + 2.35%, 2.35% Floor) | | | 2.46 | % (a) | | | 03/15/2036 | | | | 1,386,757 | |
11,616,220 | | BANK, Series 2017-BNK5-XA | | | 1.06 | % (e)(j) | | | 06/15/2060 | | | | 508,125 | |
60,714,754 | | BANK, Series 2018-BN11-XA | | | 0.48 | % (e)(j) | | | 03/15/2061 | | | | 1,749,326 | |
465,000 | | Barclays Commercial Mortgage Securities LLC, Series 2017-DELC-F (1 Month LIBOR USD + 3.50%, 3.50% Floor) | | | 3.61 | % (a) | | | 08/15/2036 | | | | 422,356 | |
240,000 | | BBCMS Mortgage Trust, Series 2018-CBM-D (1 Month LIBOR USD + 2.39%, 2.39% Floor) | | | 2.50 | % (a) | | | 07/15/2037 | | | | 237,450 | |
1,958,000 | | BBCMS Mortgage Trust, Series 2018-CBM-E (1 Month LIBOR USD + 3.55%, 3.55% Floor) | | | 3.66 | % (a) | | | 07/15/2037 | | | | 1,908,703 | |
956,000 | | BBCMS Mortgage Trust, Series 2018-TALL-E (1 Month LIBOR USD + 2.44%, 2.44% Floor) | | | 2.54 | % (a) | | | 03/15/2037 | | | | 919,399 | |
1,675,000 | | BBCMS Mortgage Trust, Series 2019-BWAY-E (1 Month LIBOR USD + 2.85%, 2.85% Floor) | | | 2.96 | % (a) | | | 11/15/2034 | | | | 1,562,813 | |
1,430,000 | | BB-UBS Trust, Series 2012-TFT-TE | | | 3.56 | % (a)(b)(e) | | | 06/05/2030 | | | | 1,178,250 | |
1,216,000 | | BDS Ltd., Series 2019-FL4-B (1 Month LIBOR USD + 1.75%, 1.75% Floor) | | | 1.86 | % (a) | | | 08/15/2036 | | | | 1,211,136 | |
1,678,000 | | BFLD, Series 2019-DPLO-F (1 Month LIBOR USD + 2.54%, 2.54% Floor) | | | 2.65 | % (a) | | | 10/15/2034 | | | | 1,641,153 | |
1,781,000 | | BHMS Trust, Series 2018-ATLS-C (1 Month LIBOR USD + 1.90%, 1.90% Floor) | | | 2.01 | % (a) | | | 07/15/2035 | | | | 1,776,313 | |
1,661,100 | | BHP Trust, Series 2019-BXHP-D (1 Month LIBOR USD + 1.77%, 1.77% Floor) | | | 1.88 | % (a) | | | 08/15/2036 | | | | 1,662,855 | |
925,000 | | Bsprt Issuer Ltd., Series 2018-FL4-D (1 Month LIBOR USD + 2.75%, 2.75% Floor) | | | 2.86 | % (a) | | | 09/15/2035 | | | | 918,224 | |
487,000 | | BX Commercial Mortgage Trust, Series 2018-BIOA-D (1 Month LIBOR USD + 1.32%, 1.35% Floor) | | | 1.43 | % (a) | | | 03/15/2037 | | | | 487,691 | |
2,000,000 | | BX Commercial Mortgage Trust, Series 2019-IMC-D (1 Month LIBOR USD + 1.90%, 1.90% Floor) | | | 2.01 | % (a) | | | 04/15/2034 | | | | 1,978,732 | |
2,229,000 | | BX Commercial Mortgage Trust, Series 2019-IMC-F (1 Month LIBOR USD + 2.90%, 2.90% Floor) | | | 3.01 | % (a) | | | 04/15/2034 | | | | 2,174,544 | |
458,122 | | BX Trust, Series 2017-APPL-E (1 Month LIBOR USD + 3.15%, 3.15% Floor) | | | 3.26 | % (a) | | | 07/15/2034 | | | | 459,713 | |
289,799 | | BX Trust, Series 2017-SLCT-D (1 Month LIBOR USD + 2.05%, 2.05% Floor) | | | 2.16 | % (a) | | | 07/15/2034 | | | | 290,521 | |
710,600 | | BX Trust, Series 2017-SLCT-E (1 Month LIBOR USD + 3.15%, 3.15% Floor) | | | 3.26 | % (a) | | | 07/15/2034 | | | | 713,523 | |
1,685,550 | | BX Trust, Series 2017-SLCT-F (1 Month LIBOR USD + 4.25%, 4.25% Floor) | | | 4.36 | % (a) | | | 07/15/2034 | | | | 1,692,454 | |
611,000 | | BX Trust, Series 2018-GW-E (1 Month LIBOR USD + 1.97%, 1.97% Floor) | | | 2.08 | % (a) | | | 05/15/2035 | | | | 610,881 | |
530,000 | | BX Trust, Series 2018-GW-F (1 Month LIBOR USD + 2.42%, 2.42% Floor) | | | 2.53 | % (a) | | | 05/15/2035 | | | | 529,187 | |
367,000 | | BX Trust, Series 2018-GW-G (1 Month LIBOR USD + 2.92%, 2.92% Floor) | | | 3.03 | % (a) | | | 05/15/2035 | | | | 364,662 | |
2,250,000 | | BX Trust, Series 2019-CALM-E (1 Month LIBOR USD + 2.00%, 2.00% Floor) | | | 2.11 | % (a) | | | 11/15/2032 | | | | 2,248,847 | |
2,360,189 | | BX Trust, Series 2019-MMP-E (1 Month LIBOR USD + 1.90%, 1.90% Floor) | | | 2.01 | % (a) | | | 08/15/2036 | | | | 2,324,308 | |
2,115,000 | | Carbon Capital Commercial Mortgage Trust, Series 2019-FL2-B (1 Month LIBOR USD + 2.85%, 2.85% Floor) | | | 2.96 | % (a) | | | 10/15/2035 | | | | 2,022,384 | |
9,358,993 | | CD Commercial Mortgage Trust, Series 2017-CD3-XA | | | 1.01 | % (e)(j) | | | 02/10/2050 | | | | 430,530 | |
4,236,501 | | CFCRE Commercial Mortgage Trust, Series 2016-C4-XA | | | 1.65 | % (e)(j) | | | 05/10/2058 | | | | 282,209 | |
9,187,751 | | CFCRE Commercial Mortgage Trust, Series 2017-C8-XA | | | 1.59 | % (e)(j) | | | 06/15/2050 | | | | 618,345 | |
22,058,000 | | CFCRE Commercial Mortgage Trust, Series 2018-TAN-X | | | 1.63 | % (a)(e)(j) | | | 02/15/2033 | | | | 557,417 | |
212,000 | | CHT Mortgage Trust, Series 2017-CSMO-F (1 Month LIBOR USD + 3.74%, 3.74% Floor) | | | 3.85 | % (a) | | | 11/15/2036 | | | | 213,053 | |
1,714,716 | | Citigroup Commercial Mortgage Trust, Series 2014-GC25-XA | | | 0.99 | % (e)(j) | | | 10/10/2047 | | | | 49,463 | |
90,000 | | Citigroup Commercial Mortgage Trust, Series 2015-GC27-D | | | 4.42 | % (a)(e) | | | 02/10/2048 | | | | 87,713 | |
2,470,443 | | Citigroup Commercial Mortgage Trust, Series 2016-P4-XA | | | 1.95 | % (e)(j) | | | 07/10/2049 | | | | 180,255 | |
530,000 | | Citigroup Commercial Mortgage Trust, Series 2018-TBR-E (1 Month LIBOR USD + 2.80%, 2.80% Floor) | | | 2.91 | % (a) | | | 12/15/2036 | | | | 510,844 | |
1,040,000 | | Citigroup Commercial Mortgage Trust, Series 2018-TBR-F (1 Month LIBOR USD + 3.65%, 3.65% Floor) | | | 3.76 | % (a) | | | 12/15/2036 | | | | 993,434 | |
2,051,000 | | Citigroup Commercial Mortgage Trust, Series 2019-SST2-E (1 Month LIBOR USD + 2.00%, 2.00% Floor) | | | 2.11 | % (a) | | | 12/15/2036 | | | | 2,054,787 | |
1,216,000 | | CLNC Ltd., Series 2019-FL1-B (1 Month LIBOR USD + 1.90%, 1.90% Floor) | | | 2.01 | % (a) | | | 08/20/2035 | | | | 1,214,152 | |
2,448,769 | | Commercial Mortgage Pass-Through Certificates, Series 2013-CR10-XA | | | 0.65 | % (e)(j) | | | 08/10/2046 | | | | 34,449 | |
985,280 | | Commercial Mortgage Pass-Through Certificates, Series 2014-CR17-XA | | | 0.97 | % (e)(j) | | | 05/10/2047 | | | | 23,368 | |
11,744,816 | | Commercial Mortgage Pass-Through Certificates, Series 2015-CR25-XA | | | 0.83 | % (e)(j) | | | 08/10/2048 | | | | 361,875 | |
6,962,324 | | Commercial Mortgage Pass-Through Certificates, Series 2015-CR27-XA | | | 0.92 | % (e)(j) | | | 10/10/2048 | | | | 247,505 | |
1,227,000 | | Commercial Mortgage Pass-Through Certificates, Series 2015-DC1-C | | | 4.31 | % (e) | | | 02/10/2048 | | | | 1,201,679 | |
2,017,710 | | Commercial Mortgage Pass-Through Certificates, Series 2015-DC1-XA | | | 1.02 | % (e)(j) | | | 02/10/2048 | | | | 57,492 | |
815,000 | | Commercial Mortgage Pass-Through Certificates, Series 2015-LC21-C | | | 4.34 | % (e) | | | 07/10/2048 | | | | 835,423 | |
10,508,217 | | Commercial Mortgage Pass-Through Certificates, Series 2015-LC21-XA | | | 0.69 | % (e)(j) | | | 07/10/2048 | | | | 256,643 | |
406,000 | | Commercial Mortgage Pass-Through Certificates, Series 2015-LC23-C | | | 4.62 | % (e) | | | 10/10/2048 | | | | 437,105 | |
3,396,433 | | Commercial Mortgage Pass-Through Certificates, Series 2016-DC2-XA | | | 0.96 | % (e)(j) | | | 02/10/2049 | | | | 128,066 | |
2,228,000 | | Commercial Mortgage Pass-Through Certificates, Series 2018-HCLV-D (1 Month LIBOR USD + 2.18%, 2.18% Floor) | | | 2.28 | % (a) | | | 09/15/2033 | | | | 2,190,607 | |
900,000 | | Commercial Mortgage Pass-Through Certificates, Series 2021-LBA-G (1 Month LIBOR USD + 2.65%, 2.65% Floor) | | | 2.80 | % (a) | | | 03/15/2038 | | | | 903,093 | |
2,692 | | Credit Suisse Commercial Mortgage Trust, Series 2007-C1-AM | | | 5.42 | % | | | 02/15/2040 | | | | 2,829 | |
1,974,822 | | Credit Suisse Mortgage Capital Certificates, Series 2014-USA-X1 | | | 0.54 | % (a)(e)(j) | | | 09/15/2037 | | | | 42,294 | |
2,134,000 | | Credit Suisse Mortgage Capital Certificates, Series 2019-ICE4-F (1 Month LIBOR USD + 2.65%, 2.65% Floor) | | | 2.76 | % (a) | | | 05/15/2036 | | | | 2,138,743 | |
2,376,281 | | CSAIL Commercial Mortgage Trust, Series 2015-C1-XA | | | 0.83 | % (e)(j) | | | 04/15/2050 | | | | 62,043 | |
45,143,957 | | CSAIL Commercial Mortgage Trust, Series 2018-CX12-XA | | | 0.61 | % (e)(j) | | | 08/15/2051 | | | | 1,598,606 | |
32,972,000 | | CSAIL Commercial Mortgage Trust, Series 2021-C20-XA | | | 1.17 | % (e)(j) | | | 03/15/2054 | | | | 2,730,312 | |
18,269,000 | | CSAIL Commercial Mortgage Trust, Series 2021-C20-XD | | | 1.60 | % (a)(e)(j) | | | 03/15/2054 | | | | 2,230,097 | |
1,084,000 | | CSMC Trust, Series 2017-CHOP-E (1 Month LIBOR USD + 3.30%, 3.30% Floor) | | | 3.41 | % (a) | | | 07/15/2032 | | | | 995,694 | |
2,477,000 | | CSMC Trust, Series 2020-FACT-D (1 Month LIBOR USD + 3.71%, 3.71% Floor) | | | 3.82 | % (a) | | | 10/15/2037 | | | | 2,516,454 | |
1,898,000 | | DBGS Mortgage Trust, Series 2018-5BP-F (1 Month LIBOR USD + 2.45%, 2.45% Floor) | | | 2.56 | % (a) | | | 06/15/2033 | | | | 1,810,741 | |
1,980,649 | | DBGS Mortgage Trust, Series 2018-BIOD-F (1 Month LIBOR USD + 2.00%, 2.00% Floor) | | | 2.11 | % (a) | | | 05/15/2035 | | | | 1,979,282 | |
1,216,000 | | Exantas Capital Corporation Ltd., Series 2020-RSO8-B (1 Month LIBOR USD + 1.75%, 1.75% Floor) | | | 1.86 | % (a) | | | 03/15/2035 | | | | 1,220,958 | |
2,264,000 | | Fontainebleau Miami Beach Trust, Series 2019-FBLU-G | | | 3.96 | % (a)(e) | | | 12/10/2036 | | | | 2,254,318 | |
699,936 | | FREMF Mortgage Trust, Series 2015-KF08-B (1 Month LIBOR USD + 4.85%, 4.85% Floor) | | | 4.97 | % (a) | | | 02/25/2022 | | | | 700,719 | |
699,992 | | FREMF Mortgage Trust, Series 2016-KF18-B (1 Month LIBOR USD + 5.50%, 5.50% Floor) | | | 5.62 | % (a) | | | 05/25/2026 | | | | 700,981 | |
107,692 | | FREMF Mortgage Trust, Series 2016-KF22-B (1 Month LIBOR USD + 5.05%, 5.05% Floor) | | | 5.17 | % (a) | | | 07/25/2023 | | | | 109,289 | |
571,425 | | FREMF Mortgage Trust, Series 2017-KF27-B (1 Month LIBOR USD + 4.35%, 4.35% Floor) | | | 4.47 | % (a) | | | 12/25/2026 | | | | 570,894 | |
700,003 | | FREMF Mortgage Trust, Series 2017-KF28-B (1 Month LIBOR USD + 4.00%, 4.00% Floor) | | | 4.12 | % (a) | | | 01/25/2024 | | | | 701,011 | |
700,066 | | FREMF Mortgage Trust, Series 2017-KF30-B (1 Month LIBOR USD + 3.25%, 3.25% Floor) | | | 3.37 | % (a) | | | 03/25/2027 | | | | 699,740 | |
1,842,375 | | FREMF Mortgage Trust, Series 2017-KF34-B (1 Month LIBOR USD + 2.70%, 2.55% Floor) | | | 2.82 | % (a) | | | 08/25/2024 | | | | 1,846,796 | |
853,215 | | FREMF Mortgage Trust, Series 2018-KF44-B (1 Month LIBOR USD + 2.15%, 2.15% Floor) | | | 2.27 | % (a) | | | 02/25/2025 | | | | 853,432 | |
1,181,393 | | FREMF Mortgage Trust, Series 2018-KF49-B (1 Month LIBOR USD + 1.90%, 1.90% Floor) | | | 2.02 | % (a) | | | 06/25/2025 | | | | 1,163,139 | |
439,254 | | FREMF Mortgage Trust, Series 2019-KF61-B (1 Month LIBOR USD + 2.20%, 2.20% Floor) | | | 2.32 | % (a) | | | 04/25/2029 | | | | 439,625 | |
2,488,000 | | Great Wolf Trust, Series 2019-WOLF-F (1 Month LIBOR USD + 3.13%, 3.13% Floor) | | | 3.24 | % (a) | | | 12/15/2036 | | | | 2,386,324 | |
1,216,000 | | Greystone Commercial Real Estate Notes, Series 2019-FL2-B (1 Month LIBOR USD + 1.60%, 1.60% Floor) | | | 1.71 | % (a) | | | 09/15/2037 | | | | 1,214,176 | |
2,500,000 | | Greystone Commercial Real Estate Notes, Series 2019-FL2-C (1 Month LIBOR USD + 2.00%, 2.00% Floor) | | | 2.11 | % (a) | | | 09/15/2037 | | | | 2,499,860 | |
2,370,000 | | Greystone Commercial Real Estate Notes, Series 2019-FL2-D (1 Month LIBOR USD + 2.40%, 2.40% Floor) | | | 2.51 | % (a) | | | 09/15/2037 | | | | 2,330,895 | |
1,509,000 | | GS Mortgage Securities Corporation Trust, Series 2018-RIVR-E (1 Month LIBOR USD + 1.55%, 1.55% Floor) | | | 1.66 | % (a) | | | 07/15/2035 | | | | 1,419,734 | |
2,435,271 | | GS Mortgage Securities Corporation, Series 2013-GC10-XA | | | 1.49 | % (e)(j) | | | 02/10/2046 | | | | 54,708 | |
7,902,009 | | GS Mortgage Securities Corporation, Series 2014-GC24-XA | | | 0.73 | % (e)(j) | | | 09/10/2047 | | | | 162,909 | |
850,000 | | GS Mortgage Securities Corporation, Series 2018-TWR-E (1 Month LIBOR USD + 2.10%, 2.10% Floor) | | | 2.21 | % (a) | | | 07/15/2031 | | | | 816,647 | |
850,000 | | GS Mortgage Securities Corporation, Series 2018-TWR-F (1 Month LIBOR USD + 2.80%, 2.80% Floor) | | | 2.91 | % (a) | | | 07/15/2031 | | | | 799,632 | |
850,000 | | GS Mortgage Securities Corporation, Series 2018-TWR-G (1 Month LIBOR USD + 3.92%, 3.93% Floor) | | | 4.03 | % (a) | | | 07/15/2031 | | | | 742,609 | |
2,302,000 | | GS Mortgage Securities Corporation, Series 2019-SOHO-E (1 Month LIBOR USD + 1.87%, 1.88% Floor) | | | 1.98 | % (a) | | | 06/15/2036 | | | | 2,193,113 | |
146,000 | | GS Mortgage Securities Trust, Series 2014-GC26-D | | | 4.51 | % (a)(e) | | | 11/10/2047 | | | | 101,563 | |
7,113,067 | | GS Mortgage Securities Trust, Series 2015-GS1-XA | | | 0.76 | % (e)(j) | | | 11/10/2048 | | | | 216,440 | |
5,568,918 | | GS Mortgage Securities Trust, Series 2016-GS2-XA | | | 1.75 | % (e)(j) | | | 05/10/2049 | | | | 401,956 | |
169,000 | | GS Mortgage Securities Trust, Series 2018-GS10-WLSA | | | 4.58 | % (a)(e) | | | 03/10/2033 | | | | 183,314 | |
336,000 | | GS Mortgage Securities Trust, Series 2018-GS10-WLSB | | | 4.58 | % (a)(e) | | | 03/10/2033 | | | | 352,716 | |
457,000 | | GS Mortgage Securities Trust, Series 2018-GS10-WLSC | | | 4.58 | % (a)(e) | | | 03/10/2033 | | | | 464,384 | |
442,000 | | GS Mortgage Securities Trust, Series 2018-GS10-WLSD | | | 4.58 | % (a)(e) | | | 03/10/2033 | | | | 435,597 | |
553,000 | | GS Mortgage Securities Trust, Series 2018-GS10-WLSE | | | 4.58 | % (a)(e) | | | 03/10/2033 | | | | 531,811 | |
725,000 | | GS Mortgage Securities Trust, Series 2019-SMP-E (1 Month LIBOR USD + 2.60%, 2.60% Floor) | | | 2.71 | % (a) | | | 08/15/2032 | | | | 673,662 | |
2,377,000 | | GSCG Trust, Series 2019-600C-E | | | 3.99 | % (a)(e) | | | 09/06/2034 | | | | 2,345,367 | |
433,000 | | Hilton Orlando Trust, Series 2018-ORL-E (1 Month LIBOR USD + 2.80%, 2.65% Floor) | | | 2.91 | % (a) | | | 12/15/2034 | | | | 432,914 | |
1,853,232 | | HPLY Trust, Series 2019-HIT-F (1 Month LIBOR USD + 3.15%, 3.15% Floor) | | | 3.26 | % (a) | | | 11/15/2036 | | | | 1,778,741 | |
1,263,000 | | Hunt Ltd., Series 2017-FL1-C (1 Month LIBOR USD + 2.40%) | | | 2.51 | % (a) | | | 08/15/2034 | | | | 1,269,224 | |
502,484 | | IMT Trust, Series 2017-APTS-EFL (1 Month LIBOR USD + 2.15%, 2.15% Floor) | | | 2.26 | % (a) | | | 06/15/2034 | | | | 499,321 | |
502,484 | | IMT Trust, Series 2017-APTS-FFL (1 Month LIBOR USD + 2.85%, 2.85% Floor) | | | 2.96 | % (a) | | | 06/15/2034 | | | | 498,155 | |
2,427,000 | | JP Morgan Chase Commercial Mortgage Securities Corporation, Series 2014-C20-B | | | 4.40 | % (e) | | | 07/15/2047 | | | | 2,622,611 | |
49,966 | | JP Morgan Chase Commercial Mortgage Securities Corporation, Series 2017-FL10-D (1 Month LIBOR USD + 1.90%, 1.90% Floor) | | | 2.01 | % (a) | | | 06/15/2032 | | | | 49,856 | |
504,000 | | JP Morgan Chase Commercial Mortgage Securities Corporation, Series 2018-LAQ-C (1 Month LIBOR USD + 1.60%, 1.60% Floor) | | | 1.71 | % (a) | | | 06/15/2032 | | | | 505,144 | |
200,000 | | JP Morgan Chase Commercial Mortgage Securities Corporation, Series 2018-LAQ-D (1 Month LIBOR USD + 2.10%, 2.10% Floor) | | | 2.21 | % (a) | | | 06/15/2032 | | | | 200,543 | |
64,000 | | JP Morgan Chase Commercial Mortgage Securities Corporation, Series 2018-LAQ-E (1 Month LIBOR USD + 3.00%, 3.00% Floor) | | | 3.11 | % (a) | | | 06/15/2035 | | | | 64,258 | |
123,057 | | JP Morgan Chase Commercial Mortgage Securities Trust, Series 2006-LDP9-AMS | | | 5.34 | % | | | 05/15/2047 | | | | 99,676 | |
5,750,036 | | JP Morgan Chase Commercial Mortgage Securities Trust, Series 2016-JP4-XA | | | 0.68 | % (e)(j) | | | 12/15/2049 | | | | 141,693 | |
1,431,000 | | JP Morgan Chase Commercial Mortgage Securities Trust, Series 2016-WIKI-E | | | 4.01 | % (a)(e) | | | 10/05/2031 | | | | 1,386,864 | |
1,957,000 | | JP Morgan Chase Commercial Mortgage Securities Trust, Series 2018-WPT-EFX | | | 5.54 | % (a) | | | 07/05/2033 | | | | 2,018,107 | |
766,000 | | JP Morgan Chase Commercial Mortgage Securities Trust, Series 2019-UES-C | | | 4.34 | % (a) | | | 05/05/2032 | | | | 778,379 | |
784,000 | | JP Morgan Chase Commercial Mortgage Securities Trust, Series 2019-UES-D | | | 4.45 | % (a)(e) | | | 05/05/2032 | | | | 799,037 | |
915,000 | | JP Morgan Chase Commercial Mortgage Securities Trust, Series 2019-UES-E | | | 4.45 | % (a)(e) | | | 05/05/2032 | | | | 904,482 | |
960,000 | | JP Morgan Chase Commercial Mortgage Securities Trust, Series 2019-UES-F | | | 4.45 | % (a)(e) | | | 05/05/2032 | | | | 922,686 | |
1,049,000 | | JP Morgan Chase Commercial Mortgage Securities Trust, Series 2019-UES-G | | | 4.45 | % (a)(e) | | | 05/05/2032 | | | | 953,589 | |
1,685,000 | | JP Morgan Chase Commercial Mortgage Securities Trust, Series 2020-NNN-EFX | | | 3.97 | % (a) | | | 01/16/2037 | | | | 1,687,209 | |
1,542,849 | | JPMBB Commercial Mortgage Securities Trust, Series 2014-C18-XA | | | 0.81 | % (e)(j) | | | 02/15/2047 | | | | 29,627 | |
100,000 | | JPMBB Commercial Mortgage Securities Trust, Series 2014-C23-C | | | 4.47 | % (e) | | | 09/15/2047 | | | | 103,481 | |
150,000 | | JPMBB Commercial Mortgage Securities Trust, Series 2014-C25-C | | | 4.45 | % (e) | | | 11/15/2047 | | | | 149,428 | |
425,000 | | JPMBB Commercial Mortgage Securities Trust, Series 2014-C26-C | | | 4.38 | % (e) | | | 01/15/2048 | | | | 442,774 | |
2,134,000 | | JPMBB Commercial Mortgage Securities Trust, Series 2015-C28-B | | | 3.99 | % | | | 10/15/2048 | | | | 2,213,417 | |
1,115,000 | | JPMBB Commercial Mortgage Securities Trust, Series 2015-C29-C | | | 4.20 | % (e) | | | 05/15/2048 | | | | 1,095,674 | |
4,323,472 | | JPMBB Commercial Mortgage Securities Trust, Series 2015-C29-XA | | | 0.65 | % (e)(j) | | | 05/15/2048 | | | | 99,621 | |
4,905,655 | | JPMBB Commercial Mortgage Securities Trust, Series 2015-C31-XA | | | 0.83 | % (e)(j) | | | 08/15/2048 | | | | 152,137 | |
470,000 | | JPMBB Commercial Mortgage Securities Trust, Series 2015-C33-C | | | 4.61 | % (e) | | | 12/15/2048 | | | | 496,540 | |
2,555,000 | | JPMCC Commercial Mortgage Securities Trust, Series 2019-MFP-F (1 Month LIBOR USD + 3.00%, 3.00% Floor) | | | 3.11 | % (a) | | | 07/15/2036 | | | | 2,516,282 | |
2,532,000 | | LCCM, Series 2017-LC26-C | | | 4.71 | % (a) | | | 07/12/2050 | | | | 2,485,547 | |
1,216,000 | | LoanCore Issuer Ltd., Series 2019-CRE2-B (1 Month LIBOR USD + 1.70%, 1.70% Floor) | | | 1.81 | % (a) | | | 05/15/2036 | | | | 1,218,280 | |
3,427,518 | | LSTAR Commercial Mortgage Trust, Series 2016-4-XA | | | 1.77 | % (a)(e)(j) | | | 03/10/2049 | | | | 161,660 | |
15,184,956 | | LSTAR Commercial Mortgage Trust, Series 2017-5-X | | | 0.99 | % (a)(e)(j) | | | 03/10/2050 | | | | 446,394 | |
2,538,000 | | MFT Trust, Series 2020-ABC-D | | | 3.48 | % (a)(e) | | | 02/10/2042 | | | | 2,358,237 | |
2,500,000 | | MKT Mortgage Trust, Series 2020-525M-F | | | 2.94 | % (a)(e) | | | 02/12/2040 | | | | 2,221,755 | |
100,000 | | Morgan Stanley Bank of America Merrill Lynch Trust, Series 2014-C18-C | | | 4.52 | % (e) | | | 10/15/2047 | | | | 106,325 | |
360,000 | | Morgan Stanley Bank of America Merrill Lynch Trust, Series 2015-C23-C | | | 4.14 | % (e) | | | 07/15/2050 | | | | 374,132 | |
274,000 | | Morgan Stanley Bank of America Merrill Lynch Trust, Series 2015-C27-C | | | 4.52 | % (e) | | | 12/15/2047 | | | | 283,740 | |
393,000 | | Morgan Stanley Capital Trust, Series 2017-ASHF-D (1 Month LIBOR USD + 2.20%, 2.20% Floor) | | | 2.31 | % (a) | | | 11/15/2034 | | | | 389,829 | |
590,000 | | Morgan Stanley Capital Trust, Series 2017-ASHF-E (1 Month LIBOR USD + 3.15%, 3.15% Floor) | | | 3.26 | % (a) | | | 11/15/2034 | | | | 576,783 | |
284,000 | | Morgan Stanley Capital Trust, Series 2017-ASHF-F (1 Month LIBOR USD + 4.35%, 4.35% Floor) | | | 4.46 | % (a) | | | 11/15/2034 | | | | 264,969 | |
561,000 | | Morgan Stanley Capital Trust, Series 2018-SUN-D (1 Month LIBOR USD + 1.65%, 1.65% Floor) | | | 1.76 | % (a) | | | 07/15/2035 | | | | 558,994 | |
837,000 | | Morgan Stanley Capital Trust, Series 2018-SUN-F (1 Month LIBOR USD + 2.55%, 2.55% Floor) | | | 2.66 | % (a) | | | 07/15/2035 | | | | 829,953 | |
561,000 | | Morgan Stanley Capital Trust, Series 2018-SUN-G (1 Month LIBOR USD + 3.05%, 3.05% Floor) | | | 3.16 | % (a) | | | 07/15/2035 | | | | 547,577 | |
2,489,000 | | Morgan Stanley Capital Trust, Series 2019-NUGS-F (1 Month LIBOR USD + 2.84%, 4.34% Floor) | | | 4.34 | % (a) | | | 12/15/2036 | | | | 2,337,388 | |
786,391 | | Motel 6 Trust, Series 2017-MTL6-D (1 Month LIBOR USD + 2.15%, 2.15% Floor) | | | 2.26 | % (a) | | | 08/15/2034 | | | | 788,442 | |
1,957,170 | | Motel 6 Trust, Series 2017-MTL6-F (1 Month LIBOR USD + 4.25%, 4.25% Floor) | | | 4.36 | % (a) | | | 08/15/2034 | | | | 1,968,389 | |
2,500,000 | | MSCG Trust, Series 2018-SELF-F (1 Month LIBOR USD + 3.05%, 3.05% Floor) | | | 3.16 | % (a) | | | 10/15/2037 | | | | 2,528,406 | |
1,919,000 | | Natixis Commercial Mortgage Securities Trust, Series 2018-FL1-C (1 Month LIBOR USD + 2.20%, 2.20% Floor) | | | 2.31 | % (a) | | | 06/15/2035 | | | | 1,703,887 | |
24,816,848 | | Natixis Commercial Mortgage Securities Trust, Series 2018-FL1-XCP | | | 0.00 | % (a)(e)(j) | | | 06/15/2021 | | | | 248 | |
1,183,000 | | Natixis Commercial Mortgage Securities Trust, Series 2020-2PAC-AMZ1 | | | 3.50 | % (a)(e) | | | 01/15/2037 | | | | 1,230,807 | |
685,000 | | Natixis Commercial Mortgage Securities Trust, Series 2020-2PAC-AMZ2 | | | 3.50 | % (a)(e) | | | 01/15/2037 | | | | 700,564 | |
639,000 | | Natixis Commercial Mortgage Securities Trust, Series 2020-2PAC-AMZ3 | | | 3.50 | % (a)(e) | | | 01/15/2037 | | | | 639,241 | |
1,611,300 | | Natixis Commercial Mortgage Securities Trust, Series 2020-2PAC-MSK1 | | | 3.25 | % (a)(e) | | | 12/15/2036 | | | | 1,600,133 | |
1,216,000 | | NLY Commercial Mortgage Trust, Series 2019-FL2-B (1 Month LIBOR USD + 1.90%, 1.90% Floor) | | | 2.01 | % (a) | | | 02/15/2036 | | | | 1,217,454 | |
2,521,000 | | One Market Plaza Trust, Series 2017-1MKT-E | | | 4.14 | % (a) | | | 02/10/2032 | | | | 2,562,403 | |
1,500,000 | | One New York Plaza Trust, Series 2020-1NYP-C (1 Month LIBOR USD + 2.20%, 2.20% Floor) | | | 2.31 | % (a) | | | 01/15/2026 | | | | 1,519,454 | |
1,573,000 | | STWD Ltd., Series 2019-FL1-D (1 Month LIBOR USD + 2.35%, 2.35% Floor) | | | 2.46 | % (a) | | | 07/15/2038 | | | | 1,547,046 | |
1,283,167 | | Tharaldson Hotel Portfolio Trust, Series 2018-THL-E (1 Month LIBOR USD + 3.33%, 3.18% Floor) | | | 3.43 | % (a) | | | 11/11/2034 | | | | 1,244,967 | |
1,097,000 | | UBS Commercial Mortgage Trust, Series 2018-C8-C | | | 4.70 | % (e) | | | 02/15/2051 | | | | 1,201,336 | |
15,744,749 | | UBS Commercial Mortgage Trust, Series 2018-C8-XA | | | 0.87 | % (e)(j) | | | 02/15/2051 | | | | 753,167 | |
1,321,442 | | VMC Finance LLC, Series 2019-FL3-D (1 Month LIBOR USD + 2.65%, 2.65% Floor) | | | 2.76 | % (a) | | | 09/15/2036 | | | | 1,314,845 | |
150,000 | | Wells Fargo Commercial Mortgage Trust, Series 2014-LC16-D | | | 3.94 | % (a) | | | 08/15/2050 | | | | 39,376 | |
100,000 | | Wells Fargo Commercial Mortgage Trust, Series 2015-C27-C | | | 3.89 | % | | | 02/15/2048 | | | | 99,814 | |
400,000 | | Wells Fargo Commercial Mortgage Trust, Series 2015-C28-C | | | 4.09 | % (e) | | | 05/15/2048 | | | | 419,342 | |
9,994,748 | | Wells Fargo Commercial Mortgage Trust, Series 2015-C30-XA | | | 0.89 | % (e)(j) | | | 09/15/2058 | | | | 336,013 | |
5,273,798 | | Wells Fargo Commercial Mortgage Trust, Series 2015-C31-XA | | | 0.97 | % (e)(j) | | | 11/15/2048 | | | | 194,255 | |
2,143,000 | | Wells Fargo Commercial Mortgage Trust, Series 2015-LC20-B | | | 3.72 | % | | | 04/15/2050 | | | | 2,268,642 | |
2,032,160 | | Wells Fargo Commercial Mortgage Trust, Series 2015-NXS1-XA | | | 1.09 | % (e)(j) | | | 05/15/2048 | | | | 70,239 | |
7,003,905 | | Wells Fargo Commercial Mortgage Trust, Series 2015-NXS2-XA | | | 0.66 | % (e)(j) | | | 07/15/2058 | | | | 168,292 | |
2,119,382 | | Wells Fargo Commercial Mortgage Trust, Series 2016-C33-XA | | | 1.62 | % (e)(j) | | | 03/15/2059 | | | | 137,202 | |
4,832,255 | | Wells Fargo Commercial Mortgage Trust, Series 2016-NXS6-XA | | | 1.61 | % (e)(j) | | | 11/15/2049 | | | | 262,045 | |
14,946,250 | | Wells Fargo Commercial Mortgage Trust, Series 2017-C38-XA | | | 1.02 | % (e)(j) | | | 07/15/2050 | | | | 726,803 | |
2,423,000 | | Wells Fargo Commercial Mortgage Trust, Series 2017-C41-C | | | 4.51 | % (e) | | | 11/15/2050 | | | | 2,340,893 | |
2,980,862 | | Wells Fargo Commercial Mortgage Trust, Series 2017-RC1-XA | | | 1.49 | % (e)(j) | | | 01/15/2060 | | | | 178,511 | |
2,267,000 | | Wells Fargo Commercial Mortgage Trust, Series 2018-C47-C | | | 4.93 | % (e) | | | 09/15/2061 | | | | 2,412,679 | |
1,250,000 | | Wells Fargo Commercial Mortgage Trust, Series 2021-SAVE-D (1 Month LIBOR USD + 2.50%, 2.50% Floor) | | | 2.61 | % (a) | | | 02/15/2040 | | | | 1,263,352 | |
1,250,000 | | Wells Fargo Commercial Mortgage Trust, Series 2021-SAVE-E (1 Month LIBOR USD + 3.65%, 3.65% Floor) | | | 3.76 | % (a) | | | 02/15/2040 | | | | 1,268,235 | |
3,238,328 | | WF-RBS Commercial Mortgage Trust, Series 2014-C21-XA | | | 1.03 | % (e)(j) | | | 08/15/2047 | | | | 86,803 | |
| | | | | | | | | | | | | | |
Total Non-Agency Commercial Mortgage Backed Obligations (Cost $185,856,958) | | | | | | | | 179,413,293 | |
| | | | | | | | | | | | | | |
Non-Agency Residential Collateralized Mortgage Obligations—21.9% | | | | | | | | | | | | |
3,889,279 | | ACE Securities Corporation Home Equity Loan Trust, Series 2007-HE1-A2A (1 Month LIBOR USD + 0.09%, 0.09% Floor) | | | 0.20 | % | | | 01/25/2037 | | | | 2,866,071 | |
1,578,633 | | ACE Securities Corporation Home Equity Loan Trust, Series 2007-HE1-A2D (1 Month LIBOR USD + 0.25%, 0.25% Floor) | | | 0.36 | % | | | 01/25/2037 | | | | 1,187,229 | |
2,950,579 | | Alternative Loan Trust, Series 2006-OA6-1A1A (1 Month LIBOR USD + 0.42%, 0.42% Floor) | | | 0.53 | % | | | 07/25/2046 | | | | 2,762,473 | |
1,000,000 | | AMSR Trust, Series 2020-SFR4-E1 | | | 2.21 | % (a) | | | 11/17/2037 | | | | 990,774 | |
8,388,653 | | APS Resecuritization Trust, Series 2015-3-1MZ (12 Month US Treasury Average + 0.96%, 0.96% Floor) | | | 1.05 | % (a) | | | 10/27/2046 | | | | 7,062,888 | |
2,398,412 | | Bayview Koitere Fund Trust, Series 2018-SBR4-A1 | | | 4.38 | % (a)(c) | | | 06/28/2033 | | | | 2,435,709 | |
1,485,285 | | Bear Stearns Adjustable Rate Mortgage Trust, Series 2006-2-2A1 | | | 3.22 | % (e) | | | 07/25/2036 | | | | 1,434,462 | |
949,026 | | Bear Stearns Alt-A Trust, Series 2006-4-22A1 | | | 3.43 | % (e) | | | 08/25/2036 | | | | 835,485 | |
2,313,286 | | Chase Mortgage Finance Trust, Series 2007-S4-A4 (1 Month LIBOR USD + 0.60%, 0.60% Floor, 6.00% Cap) | | | 0.71 | % | | | 06/25/2037 | | | | 804,998 | |
5,945,079 | | CHL Mortgage Pass-Through Trust, Series 2007-14-A19 | | | 6.00 | % | | | 09/25/2037 | | | | 4,509,336 | |
4,468,471 | | CHL Mortgage Pass-Through Trust, Series 2007-9-A13 | | | 5.75 | % | | | 07/25/2037 | | | | 3,480,975 | |
8,688,000 | | CHL Mortgage Pass-Through Trust, Series 2018-GT1-A (1 Month LIBOR USD + 2.75%) | | | 2.86 | % (a) | | | 05/25/2023 | | | | 8,657,818 | |
971,251 | | CitiMortgage Alternative Loan Trust, Series 2007-A5-1A10 | | | 5.75 | % | | | 05/25/2037 | | | | 961,806 | |
348,214 | | Countrywide Alternative Loan Trust, Series 2005-75CB-A3 | | | 5.50 | % | | | 01/25/2036 | | | | 303,046 | |
577,492 | | Countrywide Alternative Loan Trust, Series 2006-23CB-2A2 | | | 6.50 | % | | | 08/25/2036 | | | | 305,664 | |
381,481 | | Countrywide Alternative Loan Trust, Series 2007-15CB-A7 | | | 6.00 | % | | | 07/25/2037 | | | | 320,823 | |
560,270 | | Countrywide Alternative Loan Trust, Series 2008-1R-2A3 | | | 6.00 | % | | | 08/25/2037 | | | | 390,708 | |
280,638 | | Countrywide Home Loans, Series 2005-HYB9-3A2A (12 Month LIBOR USD + 1.75%, 11.00% Cap) | | | 2.20 | % | | | 02/20/2036 | | | | 249,673 | |
303,585 | | Countrywide Home Loans, Series 2007-14-A15 | | | 6.50 | % | | | 09/25/2037 | | | | 241,536 | |
603,413 | | Countrywide Home Loans, Series 2007-HY1-1A1 | | | 2.79 | % (e) | | | 04/25/2037 | | | | 589,434 | |
321,483 | | Credit Suisse First Boston Mortgage Backed Trust, Series 2006-2-A5A | | | 6.58 | % (k) | | | 09/25/2036 | | | | 153,346 | |
482,329 | | Credit Suisse First Boston Mortgage Securities Corporation, Series 2005-10-6A9 | | | 5.50 | % | | | 11/25/2035 | | | | 310,806 | |
260,762 | | Credit Suisse First Boston Mortgage Securities Corporation, Series 2005-9-5A9 | | | 5.50 | % | | | 10/25/2035 | | | | 208,739 | |
1,368,044 | | Credit Suisse Mortgage Capital Certificates, Series 2011-12R-3A5 | | | 2.53 | % (a)(e) | | | 07/27/2036 | | | | 1,324,046 | |
77,508 | | Credit Suisse Mortgage Capital Certificates, Series 2011-5R-6A9 | | | 3.20 | %(a)(e) | | | 11/27/2037 | | | | 78,129 | |
7,700,000 | | CSMC Trust | | | 3.27 | % (a)(e) | | | 03/25/2059 | | | | 7,627,963 | |
152,825 | | Deutsche Mortgage & Asset Receiving Corporation, Series 2014-RS1-1A2 | | | 6.49 | % (a)(e) | | | 07/27/2037 | | | | 141,080 | |
277,474 | | Deutsche Securities, Inc., Series 2006-AB4-A1A | | | 6.01 | % (e) | | | 10/25/2036 | | | | 272,810 | |
15,000,000 | | FMC GMSR Issuer Trust, Series 2019-GT1-A | | | 5.07 | % (a)(e) | | | 05/25/2024 | | | | 15,109,225 | |
500,000 | | GCAT LLC, Series 2019-NQM3-B1 | | | 3.95 | % (a)(e) | | | 11/25/2059 | | | | 506,923 | |
13,673,427 | | Home Partners of America Trust, Series 2019-2-F | | | 3.87 | % (a) | | | 10/19/2039 | | | | 13,414,598 | |
1,054,044 | | Impac Secured Assets Trust, Series 2006-5-1A1C (1 Month LIBOR USD + 0.27%, 0.27% Floor, 11.50% Cap) | | | 0.38 | % | | | 02/25/2037 | | | | 989,822 | |
1,732,294 | | IndyMac Mortgage Loan Trust, Series 2006-AR19-2A1 | | | 3.33 | % (e) | | | 08/25/2036 | | | | 1,622,375 | |
482,460 | | JP Morgan Mortgage Trust, Series 2005-S3-1A2 | | | 5.75 | % | | | 01/25/2036 | | | | 331,043 | |
499,059 | | JP Morgan Mortgage Trust, Series 2007-A2-4A1M | | | 3.10 | % (e) | | | 04/25/2037 | | | | 461,633 | |
3,300,000 | | Legacy Mortgage Asset Trust, Series 2021-GS1-A2 | | | 3.84 | % (a)(c) | | | 10/25/2066 | | | | 3,323,618 | |
137,008 | | Lehman Mortgage Trust, Series 2006-1-1A3 | | | 5.50 | % | | | 02/25/2036 | | | | 109,587 | |
7,124,066 | | Lehman Trust, Series 2006-GP3-1A1 (1 Month LIBOR USD + 0.40%, 0.40% Floor) | | | 0.51 | % | | | 06/25/2046 | | | | 7,102,549 | |
3,000,000 | | loanDepot GMSR Master Trust, Series 2018-GT1-A (1 Month LIBOR USD + 2.80%, 2.80% Floor) | | | 2.91 | % (a) | | | 10/16/2023 | | | | 2,995,564 | |
97,094 | | MASTR Adjustable Rate Mortgages Trust, Series 2006-2-2A1 | | | 2.62 | % (e) | | | 04/25/2036 | | | | 74,949 | |
307,934 | | Merrill Lynch Alternative Note Asset Trust, Series 2007-F1-2A7 | | | 6.00 | % | | | 03/25/2037 | | | | 181,031 | |
627,553 | | Merrill Lynch Mortgage Investors Trust, Series 2006-AF1-AF2C | | | 6.25 | % | | | 08/25/2036 | | | | 390,360 | |
20,444,132 | | Merrill Lynch Mortgage Investors Trust, Series 2006-HE6-A1 (1 Month LIBOR USD + 0.28%, 0.28% Floor) | | | 0.39 | % | | | 11/25/2037 | | | | 14,131,941 | |
6,062,085 | | Morgan Stanley Mortgage Loan Trust, Series 2005-7-3A1 | | | 4.91 | % (e) | | | 11/25/2035 | | | | 5,021,821 | |
101,563 | | Morgan Stanley Mortgage Loan Trust, Series 2005-7-4A1 | | | 5.50 | % | | | 11/25/2035 | | | | 84,651 | |
343,847 | | Morgan Stanley Mortgage Loan Trust, Series 2006-2-7A1 | | | 5.52 | % (e) | | | 02/25/2036 | | | | 272,644 | |
541,037 | | Morgan Stanley Mortgage Loan Trust, Series 2007-8XS-A1 | | | 5.75 | % (e) | | | 04/25/2037 | | | | 348,035 | |
10,603,450 | | Morgan Stanley Resecuritization Trust, Series 2013-R7-8B (12 Month US Treasury Average + 0.96%, 0.96% Floor) | | | 1.34 | % (a)(b) | | | 12/26/2046 | | | | 10,060,931 | |
3,004,806 | | New Century Home Equity Loan Trust, Series 2006-1-A2B (1 Month LIBOR USD + 0.18%, 0.18% Floor, 12.50% Cap) | | | 0.29 | % | | | 05/25/2036 | | | | 2,921,979 | |
4,612,885 | | New Residential Mortgage Loan Trust, Series 2018-FNT2-B | | | 4.09 | % (a) | | | 07/25/2054 | | | | 4,621,673 | |
11,614,040 | | NovaStar Mortgage Funding Trust Series, Series 2006-3-A2C (1 Month LIBOR USD + 0.32%, 0.32% Floor) | | | 0.43 | % | | | 10/25/2036 | | | | 9,143,976 | |
12,853,914 | | PMT Credit Risk Transfer Trust, Series 2019-2R-A (1 Month LIBOR USD + 2.75%, 2.75% Floor) | | | 2.86 | % (a) | | | 05/27/2023 | | | | 12,731,311 | |
1,212,186 | | PMT Credit Risk Transfer Trust, Series 2019-3R-A (1 Month LIBOR USD + 2.70%, 2.70% Floor) | | | 2.81 | % (a) | | | 10/27/2022 | | | | 1,215,200 | |
500,000 | | PMT Credit Risk Transfer Trust, Series 2021-FT1-A (1 Month LIBOR USD + 3.00%, 3.00% Floor) | | | 0.01 | % (a) | | | 03/25/2026 | | | | 501,104 | |
17,600,000 | | PNMAC GMSR Trust, Series 2018-FT1-A (1 Month LIBOR USD + 2.35%) | | | 2.46 | % (a) | | | 04/25/2023 | | | | 17,459,013 | |
3,100,000 | | Progress Residential Trust, Series 2019-SFR4-F | | | 3.68 | % (a) | | | 10/17/2036 | | | | 3,158,320 | |
1,100,000 | | Progress Residential Trust, Series 2021-SFR1-G | | | 3.86 | % (a) | | | 04/17/2038 | | | | 1,098,112 | |
7,500,000 | | Progress Residential Trust, Series 2021-SFR2-F | | | 3.40 | % (a) | | | 04/19/2038 | | | | 7,560,690 | |
6,638,947 | | PRPM LLC, Series 2019-GS1-A2 | | | 4.75 | % (a)(e) | | | 10/25/2024 | | | | 6,661,757 | |
3,000,000 | | PRPM LLC, Series 2021-2-A2 | | | 3.77 | % (a)(e) | | | 03/25/2024 | | | | 3,024,012 | |
421,007 | | Residential Accredit Loans, Inc., Series 2006-QS12-2A3 | | | 6.00 | % | | | 09/25/2036 | | | | 413,270 | |
1,738,942 | | Residential Asset Securitization Trust, Series 2005-A15-5A2 | | | 5.75 | % | | | 02/25/2036 | | | | 1,131,245 | |
380,985 | | Residential Asset Securitization Trust, Series 2006-A2-A11 | | | 6.00 | % | | | 01/25/2046 | | | | 237,296 | |
4,154,655 | | Residential Funding Mortgage Securities Trust, Series 2006-S8-A10 | | | 6.00 | % | | | 09/25/2036 | | | | 3,877,988 | |
5,750,000 | | Residential Mortgage Loan Trust, Series 2020-1-B1 | | | 3.95 | % (a)(e) | | | 02/25/2024 | | | | 5,792,606 | |
5,859,305 | | Soundview Home Loan Trust, Series 2007-OPT1-2A2 (1 Month LIBOR USD + 0.15%, 0.15% Floor) | | | 0.26 | % | | | 06/25/2037 | | | | 4,757,948 | |
8,259,000 | | Spruce Hill Mortgage Loan Trust, Series 2020-SH2-M1 | | | 4.33 | % (a)(e) | | | 06/25/2055 | | | | 8,289,864 | |
1,000,000 | | Stanwich Mortgage Loan Company, Series 2019-NPB1-A2 | | | 4.50 | % (a)(c) | | | 08/15/2024 | | | | 1,000,229 | |
1,147,487 | | Structured Adjustable Rate Mortgage Loan Trust, Series 2005-22-4A1 | | | 3.14 | % (e) | | | 12/25/2035 | | | | 1,112,827 | |
9,217,200 | | Structured Asset Securities Corporation Mortgage Loan Trust, Series 2007-OSI-A4 (1 Month LIBOR USD + 0.20%, 0.20% Floor) | | | 0.31 | % | | | 06/25/2037 | | | | 7,345,533 | |
6,798,922 | | Structured Asset Securities Corporation, Series 2007-RF1-1A (1 Month LIBOR USD + 0.19%, 0.19% Floor) | | | 0.31 | % (a) | | | 03/25/2037 | | | | 5,598,090 | |
13,554,246 | | TBW Mortgage Backed Pass Through, Series 2006-3-4A1 (1 Month LIBOR USD + 0.40%, 0.40% Floor, 7.50% Cap) | | | 0.51 | % | | | 07/25/2036 | | | | 619,172 | |
13,554,334 | | TBW Mortgage Backed Pass Through, Series 2006-3-4A3 (-1 x 1 Month LIBOR USD + 7.10%, 7.10% Cap) | | | 6.99 | % (j)(l) | | | 07/25/2036 | | | | 2,266,207 | |
5,000,000 | | Tricon American Homes Trust, Series 2019-SFR1-F | | | 3.75 | % (a) | | | 03/17/2038 | | | | 5,086,829 | |
3,123,809 | | Velocity Commercial Capital Loan Trust, Series 2018-2-M2 | | | 4.51 | % (a)(e) | | | 10/26/2048 | | | | 3,227,407 | |
782,779 | | Velocity Commercial Capital Loan Trust, Series 2018-2-M3 | | | 4.72 | % (a)(e) | | | 10/26/2048 | | | | 802,599 | |
1,615,702 | | Velocity Commercial Capital Loan Trust, Series 2019-1-M5 | | | 5.70 | % (a)(e) | | | 03/25/2049 | | | | 1,639,613 | |
3,258,906 | | Velocity Commercial Capital Loan Trust, Series 2019-2-M4 | | | 3.99 | % (a)(e) | | | 07/25/2049 | | | | 3,229,762 | |
3,100,000 | | Verus Securitization Trust, Series 2019-INV3-B1 | | | 3.73 | % (a)(e) | | | 11/25/2059 | | | | 3,105,352 | |
7,907,819 | | Verus Securitization Trust, Series 2020-NPL1-A1 | | | 3.60 | % (a)(c) | | | 08/25/2050 | | | | 7,946,594 | |
3,000,000 | | Verus Securitization Trust, Series 2021-R2-B1 | | | 3.25 | % (a)(e) | | | 02/25/2064 | | | | 3,022,788 | |
790,624 | | Washington Mutual Mortgage Pass-Through Certificates, Series 2006-2-4CB | | | 6.00 | % | | | 03/25/2036 | | | | 807,943 | |
409,549 | | Wells Fargo Alternative Loan Trust, Series 2007-PA5-1A1 | | | 6.25 | % | | | 11/25/2037 | | | | 407,057 | |
4,534,286 | | Wells Fargo Home Equity Asset-Backed Securities Trust, Series 2007-2-A4 (1 Month LIBOR USD + 0.30%, 0.30% Floor) | | | 0.41 | % | | | 04/25/2037 | | | | 3,844,490 | |
| | | | | | | | | | | | | | |
Total Non-Agency Residential Collateralized Mortgage Obligations (Cost $278,886,427) | | | | | | | | 272,700,983 | |
| | | | | | | | | | | | | | |
US Corporate Bonds—7.8% | | | | | | | | | | | | |
250,000 | | Academy Ltd. | | | 6.00 | % (a) | | | 11/15/2027 | | | | 263,750 | |
690,000 | | Acrisure LLC | | | 4.25 | % (a) | | | 02/15/2029 | | | | 679,443 | |
435,000 | | Advanced Drainage Systems, Inc. | | | 5.00 | % (a) | | | 09/30/2027 | | | | 457,242 | |
50,000 | | Aethon United Finance Corporation | | | 8.25 | % (a) | | | 02/15/2026 | | | | 51,844 | |
230,000 | | Air Methods Corporation | | | 8.00 | % (a) | | | 05/15/2025 | | | | 216,775 | |
220,000 | | Albertsons LLC | | | 3.50 | % (a) | | | 03/15/2029 | | | | 209,636 | |
400,000 | | Alliant Holdings Intermediate LLC | | | 6.75 | % (a) | | | 10/15/2027 | | | | 426,424 | |
205,000 | | Allied Universal Holding Company | | | 6.63 | % (a) | | | 07/15/2026 | | | | 217,783 | |
475,000 | | Allied Universal Holding Company | | | 9.75 | % (a) | | | 07/15/2027 | | | | 521,996 | |
680,000 | | American Airlines, Inc. | | | 5.75 | % (a) | | | 04/20/2029 | | | | 724,132 | |
250,000 | | American Axle & Manufacturing, Inc. | | | 6.25 | % | | | 03/15/2026 | | | | 256,375 | |
239,000 | | Antero Midstream Partners LP | | | 5.75 | % (a) | | | 03/01/2027 | | | | 239,501 | |
120,000 | | Apache Corporation | | | 4.63 | % | | | 11/15/2025 | | | | 123,786 | |
225,000 | | Apache Corporation | | | 4.38 | % | | | 10/15/2028 | | | | 224,662 | |
85,000 | | Arches Buyer, Inc. | | | 4.25 | % (a) | | | 06/01/2028 | | | | 85,006 | |
590,000 | | Arconic Corporation | | | 6.13 | % (a) | | | 02/15/2028 | | | | 629,456 | |
555,000 | | Ardagh Packaging Finance, Inc. | | | 4.00 | % (a) | | | 09/01/2029 | | | | 554,789 | |
476,000 | | Asbury Automotive Group, Inc. | | | 4.50 | % | | | 03/01/2028 | | | | 488,095 | |
86,000 | | Asbury Automotive Group, Inc. | | | 4.75 | % | | | 03/01/2030 | | | | 88,945 | |
185,000 | | Ascend Learning LLC | | | 6.88 | % (a) | | | 08/01/2025 | | | | 190,299 | |
580,000 | | Ascend Learning LLC | | | 6.88 | % (a) | | | 08/01/2025 | | | | 596,614 | |
250,000 | | ASGN, Inc. | | | 4.63 | % (a) | | | 05/15/2028 | | | | 258,342 | |
675,000 | | AssuredPartners, Inc. | | | 7.00 | % (a) | | | 08/15/2025 | | | | 699,783 | |
40,000 | | AssuredPartners, Inc. | | | 5.63 | % (a) | | | 01/15/2029 | | | | 40,810 | |
105,000 | | Austin BidCo, Inc. | | | 7.13 | % (a) | | | 12/15/2028 | | | | 107,034 | |
165,000 | | Avantor, Inc. | | | 4.63 | % (a) | | | 07/15/2028 | | | | 172,526 | |
445,000 | | Avaya, Inc. | | | 6.13 | % (a) | | | 09/15/2028 | | | | 473,231 | |
385,000 | | Axalta Coating Systems LLC | | | 4.75 | % (a) | | | 06/15/2027 | | | | 402,922 | |
185,000 | | B&G Foods, Inc. | | | 5.25 | % | | | 09/15/2027 | | | | 192,689 | |
110,000 | | Banff Merger Sub, Inc. | | | 9.75 | % (a) | | | 09/01/2026 | | | | 117,304 | |
545,000 | | Bausch Health Companies, Inc. | | | 7.00 | % (a) | | | 01/15/2028 | | | | 592,546 | |
210,000 | | Bausch Health Companies, Inc. | | | 6.25 | % (a) | | | 02/15/2029 | | | | 223,524 | |
315,000 | | Bausch Health Companies, Inc. | | | 5.25 | % (a) | | | 01/30/2030 | | | | 316,991 | |
570,000 | | Beacon Roofing Supply, Inc. | | | 4.88 | % (a) | | | 11/01/2025 | | | | 583,860 | |
150,000 | | Blue Racer Midstream LLC | | | 7.63 | % (a) | | | 12/15/2025 | | | | 161,939 | |
25,000 | | Boxer Parent Company, Inc. | | | 7.13 | % (a) | | | 10/02/2025 | | | | 26,848 | |
515,000 | | Boyd Gaming Corporation | | | 4.75 | % | | | 12/01/2027 | | | | 525,869 | |
360,000 | | Boyne USA, Inc. | | | 7.25 | % (a) | | | 05/01/2025 | | | | 375,345 | |
125,000 | | Builders FirstSource, Inc. | | | 6.75 | % (a) | | | 06/01/2027 | | | | 134,687 | |
125,000 | | BY Crown Parent LLC | | | 4.25 | % (a) | | | 01/31/2026 | | | | 129,960 | |
400,000 | | Cablevision Lightpath LLC | | | 3.88 | % (a) | | | 09/15/2027 | | | | 396,500 | |
400,000 | | Cablevision Lightpath LLC | | | 5.63 | % (a) | | | 09/15/2028 | | | | 406,630 | |
210,000 | | Calpine Corporation | | | 4.50 | % (a) | | | 02/15/2028 | | | | 212,079 | |
130,000 | | Calpine Corporation | | | 5.13 | % (a) | | | 03/15/2028 | | | | 130,788 | |
210,000 | | Calpine Corporation | | | 4.63 | % (a) | | | 02/01/2029 | | | | 204,916 | |
225,000 | | Carnival Corporation | | | 11.50 | % (a) | | | 04/01/2023 | | | | 258,234 | |
250,000 | | Carnival Corporation | | | 5.75 | % (a) | | | 03/01/2027 | | | | 256,875 | |
220,000 | | Carvana Corporation | | | 5.63 | % (a) | | | 10/01/2025 | | | | 225,962 | |
385,000 | | Castle US Holding Corporation | | | 9.50 | % (a) | | | 02/15/2028 | | | | 393,422 | |
305,000 | | Catalent Pharma Solutions, Inc. | | | 5.00 | % (a) | | | 07/15/2027 | | | | 320,003 | |
245,000 | | Catalent Pharma Solutions, Inc. | | | 3.13 | % (a) | | | 02/15/2029 | | | | 235,506 | |
1,005,000 | | CCO Holdings LLC | | | 4.75 | % (a) | | | 03/01/2030 | | | | 1,042,687 | |
295,000 | | CCO Holdings LLC | | | 4.50 | % (a) | | | 08/15/2030 | | | | 301,034 | |
420,000 | | Cedar Fair LP | | | 5.25 | % | | | 07/15/2029 | | | | 432,424 | |
350,000 | | Cengage Learning, Inc. | | | 9.50 | % (a) | | | 06/15/2024 | | | | 357,219 | |
500,000 | | Centene Corporation | | | 5.38 | % (a) | | | 08/15/2026 | | | | 528,700 | |
140,000 | | Centene Corporation | | | 3.00 | % | | | 10/15/2030 | | | | 139,943 | |
265,000 | | Centene Corporation | | | 2.50 | % | | | 03/01/2031 | | | | 253,412 | |
270,000 | | Century Communities, Inc. | | | 6.75 | % | | | 06/01/2027 | | | | 287,778 | |
310,000 | | CenturyLink, Inc. | | | 5.13 | % (a) | | | 12/15/2026 | | | | 326,935 | |
280,000 | | CenturyLink, Inc. | | | 4.00 | % (a) | | | 02/15/2027 | | | | 286,384 | |
595,000 | | Cheniere Energy Partners LP | | | 5.63 | % | | | 10/01/2026 | | | | 623,203 | |
270,000 | | Chesapeake Energy Corporation | | | 5.88 | % (a) | | | 02/01/2029 | | | | 286,706 | |
290,000 | | CHS/Community Health Systems, Inc. | | | 6.00 | % (a) | | | 01/15/2029 | | | | 307,037 | |
205,000 | | CHS/Community Health Systems, Inc. | | | 6.88 | % (a) | | | 04/15/2029 | | | | 214,865 | |
270,000 | | CHS/Community Health Systems, Inc. | | | 4.75 | % (a) | | | 02/15/2031 | | | | 264,100 | |
490,000 | | Clean Harbors, Inc. | | | 4.88 | % (a) | | | 07/15/2027 | | | | 517,778 | |
110,000 | | Clean Harbors, Inc. | | | 5.13 | % (a) | | | 07/15/2029 | | | | 117,102 | |
55,000 | | Clear Channel Outdoor Holdings, Inc. | | | 7.75 | % (a) | | | 04/15/2028 | | | | 54,498 | |
80,000 | | Clear Channel Worldwide Holdings, Inc. | | | 9.25 | % | | | 02/15/2024 | | | | 83,374 | |
305,000 | | Clearway Energy Operating LLC | | | 4.75 | % (a) | | | 03/15/2028 | | | | 317,606 | |
407,000 | | CNX Midstream Partners LP | | | 6.50 | % (a) | | | 03/15/2026 | | | | 415,140 | |
125,000 | | CNX Resources Corporation | | | 6.00 | % (a) | | | 01/15/2029 | | | | 130,132 | |
150,000 | | CommScope Technologies LLC | | | 5.00 | % (a) | | | 03/15/2027 | | | | 148,876 | |
270,000 | | Consolidated Communications, Inc. | | | 5.00 | % (a) | | | 10/01/2028 | | | | 272,781 | |
230,000 | | Constellation Merger Sub, Inc. | | | 8.50 | % (a) | | | 09/15/2025 | | | | 217,613 | |
480,000 | | Cornerstone Building Brands, Inc. | | | 6.13 | % (a) | | | 01/15/2029 | | | | 512,100 | |
380,000 | | CRC Issuer LLC | | | 5.25 | % (a) | | | 10/15/2025 | | | | 381,900 | |
375,000 | | Credit Acceptance Corporation | | | 6.63 | % | | | 03/15/2026 | | | | 395,625 | |
100,000 | | Crowdstrike Holdings, Inc. | | | 3.00 | % | | | 02/15/2029 | | | | 97,895 | |
645,000 | | CSC Holdings LLC | | | 5.75 | % (a) | | | 01/15/2030 | | | | 680,152 | |
200,000 | | CSC Holdings LLC | | | 4.63 | % (a) | | | 12/01/2030 | | | | 197,000 | |
495,000 | | CSI Compressco LP | | | 7.50 | % (a) | | | 04/01/2025 | | | | 503,972 | |
230,000 | | Dana Financing Ltd. | | | 5.75 | % (a) | | | 04/15/2025 | | | | 237,331 | |
100,000 | | Dana, Inc. | | | 5.38 | % | | | 11/15/2027 | | | | 105,187 | |
205,000 | | DaVita, Inc. | | | 4.63 | % (a) | | | 06/01/2030 | | | | 209,123 | |
195,000 | | Dealer Tire LLC | | | 8.00 | % (a) | | | 02/01/2028 | | | | 206,212 | |
95,000 | | Delta Air Lines, Inc. | | | 7.00 | % (a) | | | 05/01/2025 | | | | 109,515 | |
305,000 | | Delta Air Lines, Inc. | | | 4.75 | % (a) | | | 10/20/2028 | | | | 331,923 | |
250,000 | | Diamond Sports Group LLC | | | 5.38 | % (a) | | | 08/15/2026 | | | | 180,312 | |
300,000 | | DISH DBS Corporation | | | 5.88 | % | | | 11/15/2024 | | | | 314,185 | |
138,000 | | Dun & Bradstreet Corporation | | | 6.88 | % (a) | | | 08/15/2026 | | | | 147,601 | |
96,000 | | Dun & Bradstreet Corporation | | | 10.25 | % (a) | | | 02/15/2027 | | | | 107,382 | |
295,000 | | EES Finance Corporation | | | 8.13 | % | | | 05/01/2025 | | | | 272,475 | |
270,000 | | Eldorado Resorts, Inc. | | | 6.25 | % (a) | | | 07/01/2025 | | | | 288,163 | |
295,000 | | Embarq Corporation | | | 8.00 | % | | | 06/01/2036 | | | | 340,271 | |
95,000 | | Emergent BioSolutions, Inc. | | | 3.88 | % (a) | | | 08/15/2028 | | | | 93,041 | |
140,000 | | Encompass Health Corporation | | | 4.50 | % | | | 02/01/2028 | | | | 143,613 | |
45,000 | | Encompass Health Corporation | | | 4.75 | % | | | 02/01/2030 | | | | 46,368 | |
310,000 | | Encompass Health Corporation | | | 4.63 | % | | | 04/01/2031 | | | | 321,237 | |
150,000 | | Endeavor Energy Resources LP | | | 6.63 | % (a) | | | 07/15/2025 | | | | 160,545 | |
230,000 | | Endo Finance LLC | | | 6.13 | % (a) | | | 04/01/2029 | | | | 232,300 | |
325,000 | | Endure Digital, Inc. | | | 6.00 | % (a) | | | 02/15/2029 | | | | 318,061 | |
145,000 | | Envision Healthcare Corporation | | | 8.75 | % (a) | | | 10/15/2026 | | | | 107,816 | |
255,000 | | EQM Midstream Partners LP | | | 4.75 | % (a) | | | 01/15/2031 | | | | 247,669 | |
245,000 | | EQT Corporation | | | 8.50 | % | | | 02/01/2030 | | | | 312,755 | |
301,000 | | ESH Hospitality, Inc. | | | 5.25 | % (a) | | | 05/01/2025 | | | | 307,464 | |
220,000 | | Ferrellgas Escrow LLC | | | 5.38 | % (a) | | | 04/01/2026 | | | | 219,076 | |
460,000 | | Flex Acquisition Company, Inc. | | | 6.88 | % (a) | | | 01/15/2025 | | | | 468,142 | |
130,000 | | Ford Motor Company | | | 9.00 | % | | | 04/22/2025 | | | | 157,612 | |
320,000 | | Ford Motor Company | | | 7.45 | % | | | 07/16/2031 | | | | 404,066 | |
545,000 | | Ford Motor Credit Company LLC | | | 3.38 | % | | | 11/13/2025 | | | | 554,946 | |
400,000 | | Ford Motor Credit Company LLC | | | 4.39 | % | | | 01/08/2026 | | | | 420,992 | |
365,000 | | Front Range BidCo, Inc. | | | 4.00 | % (a) | | | 03/01/2027 | | | | 359,089 | |
315,000 | | Front Range BidCo, Inc. | | | 6.13 | % (a) | | | 03/01/2028 | | | | 323,811 | |
590,000 | | Frontdoor, Inc. | | | 6.75 | % (a) | | | 08/15/2026 | | | | 629,087 | |
120,000 | | Frontier Communications Corporation | | | 8.50 | % (g) | | | 04/15/2021 | | | | 79,500 | |
220,000 | | Frontier Communications Corporation | | | 7.13 | % (g) | | | 01/15/2023 | | | | 142,862 | |
85,000 | | Frontier Communications Corporation | | | 5.88 | % (a) | | | 10/15/2027 | | | | 90,259 | |
165,000 | | Frontier Communications Corporation | | | 5.00 | % (a) | | | 05/01/2028 | | | | 168,342 | |
105,000 | | Frontier Communications Corporation | | | 6.75 | % (a) | | | 05/01/2029 | | | | 110,940 | |
110,000 | | Full House Resorts, Inc. | | | 8.25 | % (a) | | | 02/15/2028 | | | | 117,458 | |
430,000 | | Gates Global LLC | | | 6.25 | % (a) | | | 01/15/2026 | | | | 451,143 | |
250,000 | | GCI LLC | | | 4.75 | % (a) | | | 10/15/2028 | | | | 256,406 | |
660,000 | | Genting New York LLC | | | 3.30 | % (a) | | | 02/15/2026 | | | | 660,330 | |
348,989 | | Global Aircraft Leasing Company (7.25% PIK) | | | 6.50 | % (a) | | | 09/15/2024 | | | | 335,117 | |
475,000 | | Gogo Intermediate Holdings LLC | | | 9.88 | % (a) | | | 05/01/2024 | | | | 500,828 | |
240,000 | | Golden Entertainment, Inc. | | | 7.63 | % (a) | | | 04/15/2026 | | | | 256,012 | |
470,000 | | Golden Nugget, Inc. | | | 6.75 | % (a) | | | 10/15/2024 | | | | 475,837 | |
185,000 | | Golden Nugget, Inc. | | | 8.75 | % (a) | | | 10/01/2025 | | | | 195,869 | |
125,000 | | GrafTech Finance, Inc. | | | 4.63 | % (a) | | | 12/15/2028 | | | | 126,094 | |
225,000 | | Gray Television, Inc. | | | 7.00 | % (a) | | | 05/15/2027 | | | | 244,969 | |
305,000 | | Griffon Corporation | | | 5.75 | % | | | 03/01/2028 | | | | 324,825 | |
350,000 | | Group 1 Automotive, Inc. | | | 4.00 | % (a) | | | 08/15/2028 | | | | 348,250 | |
220,000 | | GTT Communications, Inc. | | | 7.88 | % (a) | | | 12/31/2024 | | | | 37,125 | |
400,000 | | Gulfport Energy Corporation | | | 6.38 | % (g) | | | 05/15/2025 | | | | 361,250 | |
374,000 | | Hess Midstream Operations LP | | | 5.63 | % (a) | | | 02/15/2026 | | | | 385,921 | |
115,000 | | Hess Midstream Operations LP | | | 5.13 | % (a) | | | 06/15/2028 | | | | 116,552 | |
225,000 | | Hexion, Inc. | | | 7.88 | % (a) | | | 07/15/2027 | | | | 242,353 | |
425,000 | | HilCorporationEnergy LP | | | 6.25 | % (a) | | | 11/01/2028 | | | | 438,547 | |
195,000 | | Hillman Group, Inc. | | | 6.38 | % (a) | | | 07/15/2022 | | | | 195,366 | |
230,000 | | Hill-Rom Holdings, Inc. | | | 4.38 | % (a) | | | 09/15/2027 | | | | 237,475 | |
15,000 | | Hilton Domestic Operating Company, Inc. | | | 5.38 | % (a) | | | 05/01/2025 | | | | 15,825 | |
20,000 | | Hilton Domestic Operating Company, Inc. | | | 5.75 | % (a) | | | 05/01/2028 | | | | 21,563 | |
600,000 | | Horizon Pharma USA, Inc. | | | 5.50 | % (a) | | | 08/01/2027 | | | | 641,514 | |
585,000 | | IAA, Inc. | | | 5.50 | % (a) | | | 06/15/2027 | | | | 614,616 | |
300,000 | | Icahn Enterprises LP | | | 5.25 | % | | | 05/15/2027 | | | | 310,500 | |
55,000 | | iHeartCommunications, Inc. | | | 8.38 | % | | | 05/01/2027 | | | | 59,056 | |
175,000 | | iHeartCommunications, Inc. | | | 5.25 | % (a) | | | 08/15/2027 | | | | 180,302 | |
325,000 | | Illuminate Buyer LLC | | | 9.00 | % (a) | | | 07/01/2028 | | | | 366,129 | |
260,000 | | Indigo Natural Resources LLC | | | 5.38 | % (a) | | | 02/01/2029 | | | | 256,642 | |
335,000 | | Installed Building Products, Inc. | | | 5.75 | % (a) | | | 02/01/2028 | | | | 351,268 | |
510,000 | | IRB Holding Corporation | | | 6.75 | % (a) | | | 02/15/2026 | | | | 528,487 | |
145,000 | | Iron Mountain, Inc. | | | 4.88 | % (a) | | | 09/15/2029 | | | | 146,950 | |
350,000 | | Iron Mountain, Inc. | | | 4.50 | % (a) | | | 02/15/2031 | | | | 346,447 | |
235,000 | | iStar, Inc. | | | 4.75 | % | | | 10/01/2024 | | | | 244,912 | |
125,000 | | Jaguar Holding Company | | | 5.00 | % (a) | | | 06/15/2028 | | | | 130,344 | |
165,000 | | JBS Finance, Inc. | | | 5.50 | % (a) | | | 01/15/2030 | | | | 182,944 | |
455,000 | | JELD-WEN, Inc. | | | 4.63 | % (a) | | | 12/15/2025 | | | | 462,346 | |
315,000 | | KAR Auction Services, Inc. | | | 5.13 | % (a) | | | 06/01/2025 | | | | 321,079 | |
345,000 | | Kraft Heinz Foods Company | | | 5.00 | % | | | 07/15/2035 | | | | 397,687 | |
935,000 | | Kraft Heinz Foods Company | | | 5.20 | % | | | 07/15/2045 | | | | 1,083,709 | |
510,000 | | Kraton Polymers LLC | | | 4.25 | % (a) | | | 12/15/2025 | | | | 512,550 | |
335,000 | | Kratos Defense & Security Solutions, Inc. | | | 6.50 | % (a) | | | 11/30/2025 | | | | 353,179 | |
300,000 | | LBM Acquisition LLC | | | 6.25 | % (a) | | | 01/15/2029 | | | | 309,375 | |
155,000 | | LD Holdings Group LLC | | | 6.50 | % (a) | | | 11/01/2025 | | | | 162,750 | |
165,000 | | LD Holdings Group LLC | | | 6.13 | % (a) | | | 04/01/2028 | | | | 167,458 | |
220,000 | | Legends Hospitality Holding Company LLC | | | 5.00 | % (a) | | | 02/01/2026 | | | | 224,125 | |
115,000 | | Level 3 Financing, Inc. | | | 3.75 | % (a) | | | 07/15/2029 | | | | 112,688 | |
240,000 | | LifePoint Health, Inc. | | | 4.38 | % (a) | | | 02/15/2027 | | | | 235,800 | |
195,000 | | LifePoint Health, Inc. | | | 5.38 | % (a) | | | 01/15/2029 | | | | 192,319 | |
360,000 | | Lions Gate Capital Holdings LLC | | | 6.38 | % (a) | | | 02/01/2024 | | | | 371,477 | |
550,000 | | Lions Gate Capital Holdings LLC | | | 5.50 | % (a) | | | 04/15/2029 | | | | 551,435 | |
680,000 | | Live Nation Entertainment, Inc. | | | 5.63 | % (a) | | | 03/15/2026 | | | | 707,268 | |
130,000 | | Live Nation Entertainment, Inc. | | | 6.50 | % (a) | | | 05/15/2027 | | | | 144,466 | |
200,000 | | Logan Merger Sub, Inc. | | | 5.50 | % (a) | | | 09/01/2027 | | | | 209,626 | |
245,000 | | LSF9 Atlantis Holdings LLC | | | 7.75 | % (a) | | | 02/15/2026 | | | | 251,328 | |
285,000 | | M/I Homes, Inc. | | | 4.95 | % | | | 02/01/2028 | | | | 295,687 | |
440,000 | | Marriott Ownership Resorts, Inc. | | | 6.50 | % | | | 09/15/2026 | | | | 460,282 | |
470,000 | | Masonite International Corporation | | | 5.75 | % (a) | | | 09/15/2026 | | | | 490,473 | |
120,000 | | Match Group, Inc. | | | 4.63 | % (a) | | | 06/01/2028 | | | | 122,836 | |
360,000 | | Matterhorn Merger Sub LLC | | | 8.50 | % (a) | | | 06/01/2026 | | | | 369,549 | |
430,000 | | MGM Growth Properties Operating Partnership LP | | | 5.75 | % | | | 02/01/2027 | | | | 474,720 | |
305,000 | | MGM Resorts International | | | 6.75 | % | | | 05/01/2025 | | | | 329,095 | |
335,000 | | MGM Resorts International | | | 5.75 | % | | | 06/15/2025 | | | | 365,778 | |
275,000 | | Mileage Plus Holdings LLC | | | 6.50 | % (a) | | | 06/20/2027 | | | | 301,812 | |
290,000 | | Moss Creek Resources Holdings, Inc. | | | 7.50 | % (a) | | | 01/15/2026 | | | | 234,052 | |
425,000 | | MPH Acquisition Holdings LLC | | | 5.75 | % (a) | | | 11/01/2028 | | | | 414,906 | |
210,000 | | MPT Operating Partnership LP | | | 5.00 | % | | | 10/15/2027 | | | | 221,294 | |
225,000 | | Murphy Oil USA, Inc. | | | 4.75 | % | | | 09/15/2029 | | | | 236,771 | |
240,000 | | Nabors Industries Ltd. | | | 7.25 | % (a) | | | 01/15/2026 | | | | 199,650 | |
210,000 | | National FINL Partners Corporation | | | 6.88 | % (a) | | | 08/15/2028 | | | | 218,137 | |
50,000 | | Nationstar Mortgage Holdings, Inc. | | | 6.00 | % (a) | | | 01/15/2027 | | | | 51,961 | |
240,000 | | Nationstar Mortgage Holdings, Inc. | | | 5.50 | % (a) | | | 08/15/2028 | | | | 241,422 | |
640,000 | | Navient Corporation | | | 6.50 | % | | | 06/15/2022 | | | | 672,877 | |
225,000 | | Navient Corporation | | | 5.00 | % | | | 03/15/2027 | | | | 225,873 | |
365,000 | | NCL Corporation, Ltd. | | | 3.63 | % (a) | | | 12/15/2024 | | | | 345,153 | |
255,000 | | NCL Corporation, Ltd. | | | 5.88 | % (a) | | | 03/15/2026 | | | | 257,932 | |
275,000 | | NESCO Holdings II, Inc. | | | 5.50 | % (a) | | | 04/15/2029 | | | | 282,439 | |
245,000 | | Nexstar Broadcasting, Inc. | | | 5.63 | % (a) | | | 07/15/2027 | | | | 257,173 | |
35,000 | | NFP Corporation | | | 7.00 | % (a) | | | 05/15/2025 | | | | 37,669 | |
415,000 | | NGL Energy Operating LLC | | | 7.50 | % (a) | | | 02/01/2026 | | | | 427,191 | |
250,000 | | NGL Energy Partners LP | | | 7.50 | % | | | 04/15/2026 | | | | 213,594 | |
185,000 | | Novelis Corporation | | | 4.75 | % (a) | | | 01/30/2030 | | | | 191,026 | |
685,000 | | NRG Energy, Inc. | | | 3.63 | % (a) | | | 02/15/2031 | | | | 669,159 | |
590,000 | | NuStar Logistics LP | | | 6.00 | % | | | 06/01/2026 | | | | 637,082 | |
155,000 | | Occidental Petroleum Corporation | | | 8.00 | % | | | 07/15/2025 | | | | 178,220 | |
500,000 | | Occidental Petroleum Corporation | | | 3.50 | % | | | 08/15/2029 | | | | 469,775 | |
355,000 | | Occidental Petroleum Corporation | | | 6.63 | % | | | 09/01/2030 | | | | 399,481 | |
360,000 | | Occidental Petroleum Corporation | | | 6.13 | % | | | 01/01/2031 | | | | 398,187 | |
70,000 | | OPE KAG Finance Sub, Inc. | | | 7.88 | % (a) | | | 07/31/2023 | | | | 70,000 | |
29,000 | | Ortho Clinical Diagnostics, Inc. | | | 7.38 | % (a) | | | 06/01/2025 | | | | 31,232 | |
229,000 | | Ortho-Clinical Diagnostics, Inc. | | | 7.25 | % (a) | | | 02/01/2028 | | | | 251,336 | |
255,000 | | Ovintiv, Inc. | | | 7.38 | % | | | 11/01/2031 | | | | 324,736 | |
335,000 | | Panther BF Aggregator LP | | | 6.25 | % (a) | | | 05/15/2026 | | | | 356,202 | |
240,000 | | Panther BF Aggregator LP | | | 8.50 | % (a) | | | 05/15/2027 | | | | 258,696 | |
405,000 | | Par Petroleum Finance Corporation | | | 7.75 | % (a) | | | 12/15/2025 | | | | 411,581 | |
475,000 | | Parsley Energy LLC | | | 5.63 | % (a) | | | 10/15/2027 | | | | 515,969 | |
125,000 | | PBF Holding Company LLC | | | 6.00 | % | | | 02/15/2028 | | | | 92,578 | |
132,000 | | Peabody Energy Corporation (6.00% + 2.50% PIK) | | | 8.50 | % (a) | | | 12/31/2024 | | | | 55,440 | |
460,000 | | Penn National Gaming, Inc. | | | 5.63 | % (a) | | | 01/15/2027 | | | | 477,195 | |
310,000 | | PennyMac Financial Services, Inc. | | | 5.38 | % (a) | | | 10/15/2025 | | | | 321,718 | |
165,000 | | PennyMac Financial Services, Inc. | | | 4.25 | % (a) | | | 02/15/2029 | | | | 158,194 | |
595,000 | | Performance Food Group, Inc. | | | 5.50 | % (a) | | | 10/15/2027 | | | | 623,316 | |
750,000 | | PetSmart, Inc. | | | 4.75 | % (a) | | | 02/15/2028 | | | | 767,970 | |
500,000 | | PetSmart, Inc. | | | 7.75 | % (a) | | | 02/15/2029 | | | | 541,850 | |
340,000 | | PG&E Corporation | | | 5.00 | % | | | 07/01/2028 | | | | 359,652 | |
148,000 | | PIC AU Holdings LLC | | | 10.00 | % (a) | | | 12/31/2024 | | | | 136,530 | |
435,000 | | Pike Corporation | | | 5.50 | % (a) | | | 09/01/2028 | | | | 443,700 | |
275,000 | | Pilgrim’s Pride Corporation | | | 5.88 | % (a) | | | 09/30/2027 | | | | 295,061 | |
105,000 | | Post Holdings, Inc. | | | 5.50 | % (a) | | | 12/15/2029 | | | | 112,568 | |
420,000 | | Post Holdings, Inc. | | | 4.63 | % (a) | | | 04/15/2030 | | | | 421,575 | |
255,000 | | Prime Security Services Borrower LLC | | | 6.25 | % (a) | | | 01/15/2028 | | | | 265,812 | |
175,000 | | Providence Service Corporation | | | 5.88 | % (a) | | | 11/15/2025 | | | | 184,516 | |
20,000 | | Rackspace Technology Global, Inc. | | | 5.38 | % (a) | | | 12/01/2028 | | | | 20,374 | |
350,000 | | Radiate Finance, Inc. | | | 4.50 | % (a) | | | 09/15/2026 | | | | 354,813 | |
75,000 | | Radiate Finance, Inc. | | | 6.50 | % (a) | | | 09/15/2028 | | | | 79,337 | |
325,000 | | Radiology Partners, Inc. | | | 9.25 | % (a) | | | 02/01/2028 | | | | 354,656 | |
175,000 | | Rattler Midstream LP | | | 5.63 | % (a) | | | 07/15/2025 | | | | 183,049 | |
105,000 | | Real Hero Merger Sub 2, Inc. | | | 6.25 | % (a) | | | 02/01/2029 | | | | 108,544 | |
185,000 | | Realogy Group LLC | | | 7.63 | % (a) | | | 06/15/2025 | | | | 202,263 | |
190,000 | | Realogy Group LLC | | | 5.75 | % (a) | | | 01/15/2029 | | | | 187,625 | |
215,000 | | Rent-A-Center, Inc. | | | 6.38 | % (a) | | | 02/15/2029 | | | | 228,438 | |
228,000 | | Resideo Funding, Inc. | | | 6.13 | % (a) | | | 11/01/2026 | | | | 240,747 | |
295,000 | | RP Escrow Issuer LLC | | | 5.25 | % (a) | | | 12/15/2025 | | | | 306,063 | |
120,000 | | Sabre Global, Inc. | | | 9.25 | % (a) | | | 04/15/2025 | | | | 143,250 | |
360,000 | | Schweitzer-Mauduit International, Inc. | | | 6.88 | % (a) | | | 10/01/2026 | | | | 382,882 | |
465,000 | | Science Applications International Corporation | | | 4.88 | % (a) | | | 04/01/2028 | | | | 481,494 | |
410,000 | | Scientific Games International, Inc. | | | 5.00 | % (a) | | | 10/15/2025 | | | | 425,150 | |
175,000 | | Scientific Games International, Inc. | | | 8.25 | % (a) | | | 03/15/2026 | | | | 187,986 | |
335,000 | | Scotts Miracle-Gro Company | | | 4.50 | % | | | 10/15/2029 | | | | 346,425 | |
240,000 | | Scripps Escrow, Inc. | | | 5.88 | % (a) | | | 07/15/2027 | | | | 248,700 | |
90,000 | | Scripps Escrow, Inc. | | | 3.88 | % (a) | | | 01/15/2029 | | | | 88,594 | |
130,000 | | Seagate HDD Cayman | | | 3.38 | % (a) | | | 07/15/2031 | | | | 125,151 | |
410,000 | | SEG Holding LLC | | | 5.63 | % (a) | | | 10/15/2028 | | | | 429,988 | |
685,000 | | Select Medical Corporation | | | 6.25 | % (a) | | | 08/15/2026 | | | | 729,046 | |
425,000 | | Silgan Holdings, Inc. | | | 4.13 | % | | | 02/01/2028 | | | | 437,674 | |
260,000 | | Sirius XM Radio, Inc. | | | 5.50 | % (a) | | | 07/01/2029 | | | | 281,613 | |
135,000 | | Sirius XM Radio, Inc. | | | 4.13 | % (a) | | | 07/01/2030 | | | | 135,324 | |
525,000 | | Six Flags Entertainment Corporation | | | 4.88 | % (a) | | | 07/31/2024 | | | | 530,906 | |
175,000 | | Six Flags Theme Parks, Inc. | | | 7.00 | % (a) | | | 07/01/2025 | | | | 189,547 | |
285,000 | | Spectrum Brands, Inc. | | | 5.00 | % (a) | | | 10/01/2029 | | | | 301,388 | |
270,000 | | Spectrum Brands, Inc. | | | 3.88 | % (a) | | | 03/15/2031 | | | | 264,938 | |
210,000 | | Springleaf Finance Corporation | | | 6.88 | % | | | 03/15/2025 | | | | 239,253 | |
60,000 | | Springleaf Finance Corporation | | | 7.13 | % | | | 03/15/2026 | | | | 69,276 | |
95,000 | | Springleaf Finance Corporation | | | 6.63 | % | | | 01/15/2028 | | | | 107,825 | |
245,000 | | Staples, Inc. | | | 7.50 | % (a) | | | 04/15/2026 | | | | 258,781 | |
115,000 | | Staples, Inc. | | | 10.75 | % (a) | | | 04/15/2027 | | | | 113,706 | |
425,000 | | Stevens Holding Company, Inc. | | | 6.13 | % (a) | | | 10/01/2026 | | | | 457,326 | |
470,000 | | SunCoke Energy Partners Finance Corporation | | | 7.50 | % (a) | | | 06/15/2025 | | | | 489,094 | |
430,000 | | Sunoco LP | | | 5.50 | % | | | 02/15/2026 | | | | 442,810 | |
230,000 | | Sunoco LP | | | 6.00 | % | | | 04/15/2027 | | | | 240,925 | |
100,000 | | Sunoco LP | | | 4.50 | % (a) | | | 05/15/2029 | | | | 99,813 | |
180,000 | | Targa Resources Partners Finance Corporation | | | 6.50 | % | | | 07/15/2027 | | | | 196,052 | |
385,000 | | Targa Resources Partners Finance Corporation | | | 4.88 | % (a) | | | 02/01/2031 | | | | 390,679 | |
509,000 | | Tempo Acquisition LLC | | | 6.75 | % (a) | | | 06/01/2025 | | | | 520,771 | |
165,000 | | Tempur Sealy International, Inc. | | | 4.00 | % (a) | | | 04/15/2029 | | | | 164,588 | |
410,000 | | Tenet Healthcare Corporation | | | 4.88 | % (a) | | | 01/01/2026 | | | | 426,810 | |
435,000 | | Tenet Healthcare Corporation | | | 6.25 | % (a) | | | 02/01/2027 | | | | 459,908 | |
175,000 | | Tenet Healthcare Corporation | | | 5.13 | % (a) | | | 11/01/2027 | | | | 183,435 | |
475,000 | | Tenet Healthcare Corporation | | | 6.13 | % (a) | | | 10/01/2028 | | | | 496,375 | |
270,000 | | Tenneco, Inc. | | | 5.13 | % (a) | | | 04/15/2029 | | | | 266,963 | |
125,000 | | Terrier Media Buyer, Inc. | | | 8.88 | % (a) | | | 12/15/2027 | | | | 134,741 | |
510,000 | | T-Mobile USA, Inc. | | | 3.38 | % | | | 04/15/2029 | | | | 514,781 | |
120,000 | | T-Mobile USA, Inc. | | | 2.88 | % | | | 02/15/2031 | | | | 116,130 | |
275,000 | | Townsquare Media, Inc. | | | 6.88 | % (a) | | | 02/01/2026 | | | | 293,391 | |
70,000 | | TransDigm, Inc. | | | 8.00 | % (a) | | | 12/15/2025 | | | | 76,300 | |
610,000 | | TransDigm, Inc. | | | 6.25 | % (a) | | | 03/15/2026 | | | | 647,488 | |
305,000 | | TransDigm, Inc. | | | 6.38 | % | | | 06/15/2026 | | | | 315,866 | |
285,000 | | TransDigm, Inc. | | | 5.50 | % | | | 11/15/2027 | | | | 295,440 | |
435,000 | | Transocean Poseidon Ltd. | | | 6.88 | % (a) | | | 02/01/2027 | | | | 402,890 | |
270,000 | | Transocean Proteus Ltd. | | | 6.25 | % (a) | | | 12/01/2024 | | | | 257,175 | |
111,000 | | Transocean, Inc. | | | 11.50 | % (a) | | | 01/30/2027 | | | | 95,373 | |
305,000 | | Trident TPI Holdings, Inc. | | | 6.63 | % (a) | | | 11/01/2025 | | | | 311,449 | |
260,000 | | Triton Water Holdings, Inc. | | | 6.25 | % (a) | | | 04/01/2029 | | | | 265,363 | |
120,000 | | Triumph Group, Inc. | | | 6.25 | % (a) | | | 09/15/2024 | | | | 122,214 | |
205,000 | | Triumph Group, Inc. | | | 7.75 | % | | | 08/15/2025 | | | | 206,538 | |
65,000 | | Tronox, Inc. | | | 4.63 | % (a) | | | 03/15/2029 | | | | 65,163 | |
535,000 | | Twin River Worldwide Holdings, Inc. | | | 6.75 | % (a) | | | 06/01/2027 | | | | 574,793 | |
295,000 | | Uber Technologies, Inc. | | | 8.00 | % (a) | | | 11/01/2026 | | | | 319,891 | |
160,000 | | Uber Technologies, Inc. | | | 7.50 | % (a) | | | 09/15/2027 | | | | 176,933 | |
310,000 | | United Natural Foods, Inc. | | | 6.75 | % (a) | | | 10/15/2028 | | | | 331,700 | |
205,000 | | Uniti Group LP | | | 6.50 | % (a) | | | 02/15/2029 | | | | 202,694 | |
225,000 | | Univision Communications, Inc. | | | 6.63 | % (a) | | | 06/01/2027 | | | | 240,705 | |
25,000 | | US Foods, Inc. | | | 6.25 | % (a) | | | 04/15/2025 | | | | 26,833 | |
220,000 | | US Foods, Inc. | | | 4.75 | % (a) | | | 02/15/2029 | | | | 220,275 | |
465,000 | | USA Compression Partners LP | | | 6.88 | % | | | 09/01/2027 | | | | 479,736 | |
538,000 | | Verscend Escrow Corporation | | | 9.75 | % (a) | | | 08/15/2026 | | | | 577,863 | |
255,000 | | ViaSat, Inc. | | | 6.50 | % (a) | | | 07/15/2028 | | | | 268,924 | |
85,000 | | Viking Cruises Ltd. | | | 13.00 | % (a) | | | 05/15/2025 | | | | 100,088 | |
605,000 | | Viking Cruises Ltd. | | | 5.88 | % (a) | | | 09/15/2027 | | | | 592,522 | |
130,000 | | Vine Oil & Gas Finance Corporation | | | 8.75 | % (a) | | | 04/15/2023 | | | | 139,035 | |
300,000 | | Viper Energy Partners LP | | | 5.38 | % (a) | | | 11/01/2027 | | | | 312,563 | |
285,000 | | Vizient, Inc. | | | 6.25 | % (a) | | | 05/15/2027 | | | | 303,471 | |
295,000 | | Waste Pro, Inc. | | | 5.50 | % (a) | | | 02/15/2026 | | | | 302,863 | |
14,000 | | Weatherford International Ltd. | | | 11.00 | % (a) | | | 12/01/2024 | | | | 13,466 | |
280,000 | | Western Midstream Operating LP | | | 4.35 | % | | | 02/01/2025 | | | | 290,245 | |
290,000 | | Western Midstream Operating LP | | | 5.30 | % | | | 02/01/2030 | | | | 315,292 | |
165,000 | | WeWork Companies, Inc. | | | 7.88 | % (a) | | | 05/01/2025 | | | | 163,763 | |
365,000 | | William Carter Company | | | 5.63 | % (a) | | | 03/15/2027 | | | | 386,216 | |
213,000 | | Wolverine Escrow LLC | | | 9.00 | % (a) | | | 11/15/2026 | | | | 213,197 | |
335,000 | | WPX Energy, Inc. | | | 5.25 | % | | | 10/15/2027 | | | | 357,515 | |
130,000 | | WPX Energy, Inc. | | | 5.88 | % | | | 06/15/2028 | | | | 143,464 | |
101,000 | | WPX Energy, Inc. | | | 4.50 | % | | | 01/15/2030 | | | | 108,907 | |
220,000 | | Wyndham Hotels & Resorts | | | 4.38 | % (a) | | | 08/15/2028 | | | | 222,943 | |
180,000 | | XHR LP | | | 6.38 | % (a) | | | 08/15/2025 | | | | 190,463 | |
120,000 | | Yum! Brands, Inc. | | | 7.75 | % (a) | | | 04/01/2025 | | | | 131,400 | |
285,000 | | Yum! Brands, Inc. | | | 4.75 | % (a) | | | 01/15/2030 | | | | 301,758 | |
| | | | | | | | | | | | | | |
Total US Corporate Bonds (Cost $94,275,165) | | | | | | | | | | | 97,183,671 | |
| | | | | | | | | | | | | | |
US Government and Agency Mortgage Backed Obligations—3.6% | | | | | | | | | | | | |
5,933,084 | | Federal Home Loan Mortgage Corporation Pass-Thru, Series K722-X1 | | | 1.31 | % (e)(j) | | | 03/25/2023 | | | | 109,176 | |
7,100,000 | | Federal Home Loan Mortgage Corporation, Series 2020-DNA2-B1 (1 Month LIBOR USD + 2.50%, 2.50% Floor) | | | 2.61 | % (a) | | | 02/25/2050 | | | | 6,990,215 | |
1,546,892 | | Federal Home Loan Mortgage Corporation, Series 3926-HS (-1 x 1 Month LIBOR USD + 6.45%, 6.45% Cap) | | | 6.34 | % (j)(l) | | | 09/15/2041 | | | | 301,813 | |
170,523 | | Federal Home Loan Mortgage Corporation, Series 4390-NY | | | 3.00 | % | | | 06/15/2040 | | | | 173,174 | |
396,615 | | Federal Home Loan Mortgage Corporation, Series 4471-GA | | | 3.00 | % | | | 02/15/2044 | | | | 416,049 | |
129,612 | | Federal National Mortgage Association, Series 2015-59-A | | | 3.00 | % | | | 06/25/2041 | | | | 130,168 | |
14,009,357 | | Federal National Mortgage Association, Series 2017-11-SK (-1 x 1 Month LIBOR USD + 6.05%, 6.05% Cap) | | | 5.94 | % (j)(l) | | | 03/25/2047 | | | | 3,133,364 | |
13,417,453 | | Federal National Mortgage Association, Series 2020-54-AS (-1 x 1 Month LIBOR USD + 6.15%, 6.15% Cap) | | | 6.04 | % (j)(l) | | | 08/25/2050 | | | | 3,094,389 | |
67,618,907 | | Government National Mortgage Association, Series 2013-155-IB | | | 0.01 | % (e)(j) | | | 09/16/2053 | | | | 458,923 | |
16,012,015 | | Government National Mortgage Association, Series 2019-128-KS (-1 x 1 Month LIBOR USD + 2.85%, 2.85% Cap) | | | 2.74 | % (j)(l) | | | 10/20/2049 | | | | 1,146,588 | |
9,302,187 | | Government National Mortgage Association, Series 2020-104-SB (-1 x 1 Month LIBOR USD + 6.15%, 6.15% Cap) | | | 6.04 | % (j)(l) | | | 07/20/2050 | | | | 2,156,309 | |
27,991,596 | | Government National Mortgage Association, Series 2020-115-SA (-1 x 1 Month LIBOR USD + 4.20%, 4.20% Cap) | | | 4.09 | % (j)(l) | | | 08/20/2050 | | | | 4,022,127 | |
19,527,556 | | Government National Mortgage Association, Series 2020-115-YS (-1 x 1 Month LIBOR USD + 4.20%, 4.20% Cap) | | | 4.09 | % (j)(l) | | | 08/20/2050 | | | | 3,113,991 | |
61,828,969 | | Government National Mortgage Association, Series 2020-129-SA (-1 x 1 Month LIBOR USD + 3.75%, 3.75% Cap) | | | 3.64 | % (j)(l) | | | 09/20/2050 | | | | 5,894,656 | |
50,708,607 | | Government National Mortgage Association, Series 2020-146-IJ | | | 2.50 | % (j) | | | 10/20/2050 | | | | 5,557,572 | |
20,881,940 | | Government National Mortgage Association, Series 2020-189-SU (-1 x 1 Month LIBOR USD + 6.30%, 6.30% Cap) | | | 6.19 | % (j)(l) | | | 12/20/2050 | | | | 4,738,371 | |
11,357,041 | | Government National Mortgage Association, Series 2021-1-SH (-1 x 1 Month LIBOR USD + 6.30%, 6.30% Cap) | | | 6.19 | % (j)(l) | | | 01/20/2051 | | | | 2,694,373 | |
| | | | | | | | | | | | | | |
Total US Government and Agency Mortgage Backed Obligations (Cost $47,316,304) | | | | | | | | 44,131,258 | |
| | | | | | | | | | | | | | |
Affiliated Mutual Funds—3.8% | | | | | | | | | | | | |
4,606,536 | | DoubleLine Global Bond Fund (Class I) | | | | | | | | | | | 47,032,734 | |
| | | | | | | | | | | | | | |
Total Affiliated Mutual Funds (Cost $46,429,210) | | | | | | | | | | | 47,032,734 | |
| | | | | | | | | | | | | | |
Common Stocks—0.1% | | | | | | | | | | | | |
15,858 | | Foresight Equity (b) (m) | | | | | | | | | | | 280,842 | |
5,568 | | Frontera Energy Corporation (m) | | | | | | | | | | | 28,399 | |
9,088 | | McDermott International Ltd. (m) | | | | | | | | | | | 7,270 | |
1,869 | | Oasis Petroleum, Inc. | | | | | | | | | | | 111,000 | |
5,789 | | Tapstone Energy Holdings III LLC (b) (m) | | | | | | | | | | | 13,315 | |
3,927 | | Whiting Petroleum Corporation (m) | | | | | | | | | | | 139,208 | |
| | | | | | | | | | | | | | |
Total Common Stocks (Cost $840,548) | | | | | | | | | | | 580,034 | |
| | | | | | | | | | | | | | |
Warrants—0.0% | | | | | | | | | | | | |
29,269 | | OAS S.A., Expiration 5/16/2039, Strike Price BRL 1.00 (b) | | | | | | | | | | | — | |
| | | | | | | | | | | | | | |
Total Warrants (Cost $–) | | | | | | | | | | | — | |
| | | | | | | | | | | | | | |
Short Term Investments—7.0% | | | | | | | | | | | | |
28,807,858 | | First American Government Obligations Fund—Class U | | | 0.04 | % (n) | | | | | | | 28,807,858 | |
28,807,858 | | JP Morgan U.S. Government Money Market Fund—Institutional Share Class | | | 0.04 | % (n) | | | | | | | 28,807,858 | |
28,807,858 | | Morgan Stanley Institutional Liquidity Funds Government Portfolio—Institutional Share Class | | | 0.03 | % (n) | | | | | | | 28,807,858 | |
| | | | | | | | | | | | | | |
Total Short Term Investments (Cost $86,423,574) | | | | | | | | | | | 86,423,574 | |
| | | | | | | | | | | | | | |
Total Investments—102.2% (Cost $1,288,556,549) | | | | | | | | | | | 1,269,971,841 | |
Liabilities in Excess of Other Assets—(2.2)% | | | | | | | | | | | (27,042,484 | ) |
| | | | | | | | | | | | | | |
NET ASSETS—100.0% | | | | | | | | | | $ | 1,242,929,357 | |
| | | | | | | | | | | | | | |
PIK A payment-in-kind security in which the issuer may make interest or dividend payments in cash or additional securities. These additional securities generally have the same terms as the original holdings.
A summary of the DoubleLine Flexible Income Fund’s investments in affiliated mutual funds for the year ended March 31, 2021 is as follows:
To the Board of Trustees of DoubleLine Funds Trust and Shareholders of DoubleLine Total Return Bond Fund, DoubleLine Core Fixed Income Fund, DoubleLine Shiller Enhanced CAPE®, and DoubleLine Flexible Income Fund
We have audited the accompanying statements of assets and liabilities, including the schedules of investments - summary, of DoubleLine Total Return Bond Fund, DoubleLine Core Fixed Income Fund, DoubleLine Shiller Enhanced CAPE®, and DoubleLine Flexible Income Fund (four of the funds constituting DoubleLine Funds Trust, herein collectively referred to as the “Funds”) as of March 31, 2021, the related statements of operations for the year ended March 31, 2021, the statements of changes in net assets for each of the two years in the period ended March 31, 2021, including the related notes, and the financial highlights for each of the periods indicated therein (included in Item 1 of this Form N-CSR) and the schedules of investments (included in Item 6 of this Form N-CSR) as of March 31, 2021 (collectively referred to as the “financial statements”). In our opinion, the financial statements present fairly, in all material respects, the financial position of each of the Funds as of March 31, 2021, the results of each of their operations for the year then ended, the changes in each of their net assets for each of the two years in the period ended March 31, 2021 and each of the financial highlights for each of the periods indicated therein in conformity with accounting principles generally accepted in the United States of America.
These financial statements are the responsibility of the Funds’ management. Our responsibility is to express an opinion on the Funds’ financial statements based on our audits. We are a public accounting firm registered with the Public Company Accounting Oversight Board (United States) (PCAOB) and are required to be independent with respect to the Funds in accordance with the U.S. federal securities laws and the applicable rules and regulations of the Securities and Exchange Commission and the PCAOB.
We conducted our audits of these financial statements in accordance with the standards of the PCAOB. Those standards require that we plan and perform the audits to obtain reasonable assurance about whether the financial statements are free of material misstatement, whether due to error or fraud.
Our audits included performing procedures to assess the risks of material misstatement of the financial statements, whether due to error or fraud, and performing procedures that respond to those risks. Such procedures included examining, on a test basis, evidence regarding the amounts and disclosures in the financial statements. Our audits also included evaluating the accounting principles used and significant estimates made by management, as well as evaluating the overall presentation of the financial statements. Our procedures included confirmation of securities owned as of March 31, 2021 by correspondence with the custodian and brokers; when replies were not received from brokers, we performed other auditing procedures. We believe that our audits provide a reasonable basis for our opinions.
We have served as the auditor of one or more investment companies in the DoubleLine Investment Company Complex since 2010.
There have been no material changes to the procedures by which shareholders may recommend nominees to the registrant’s board of trustees.
(4) Change in the registrant’s independent public accountant. There was no change in the registrant’s independent public accountant for the period covered by this report.
Pursuant to the requirements of the Securities Exchange Act of 1934 and the Investment Company Act of 1940, the registrant has duly caused this report to be signed on its behalf by the undersigned, thereunto duly authorized.
Pursuant to the requirements of the Securities Exchange Act of 1934 and the Investment Company Act of 1940, this report has been signed below by the following persons on behalf of the registrant and in the capacities and on the dates indicated.