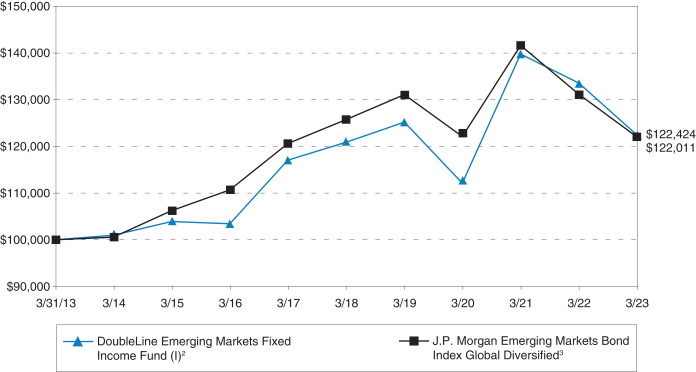
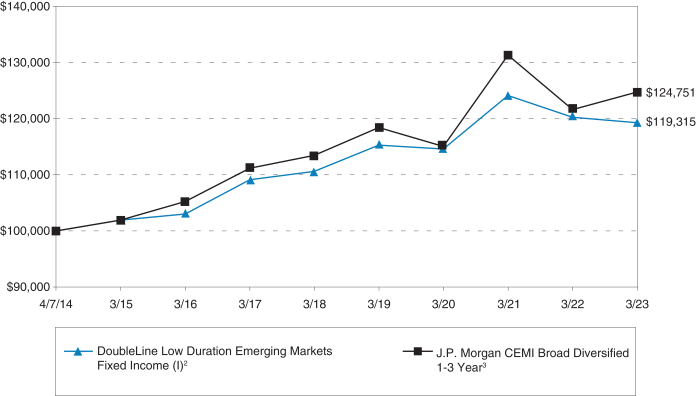
position relative to the index in African countries, the worst-performing region in the index, contributed to performance. Avoiding certain sovereign credits that became distressed over the period, including Bolivia, Ecuador and Pakistan, also contributed to performance.
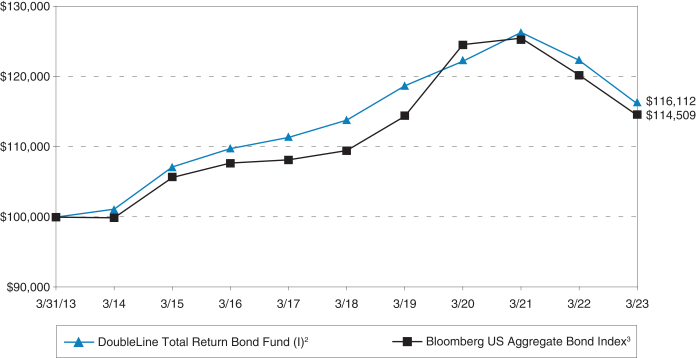
emerging markets debt. In the face of steeply rising Treasury yields over the period, the Fund’s floating-rate exposure in bank loans and CLOs also contributed to performance. Agency MBS and emerging markets bonds were the biggest detractors from Fund performance.
Opinions expressed herein are as of March 31, 2023, and are subject to change at any time, are not guaranteed and should not be considered investment advice. This report is for the information of shareholders of the Funds. It may also be used as sales literature when preceded or accompanied by the current prospectus.
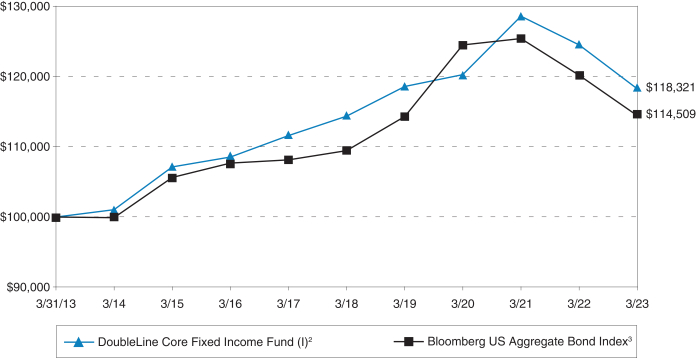
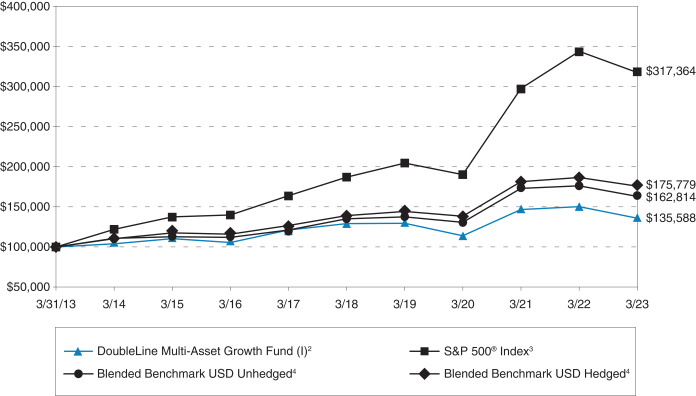
The performance information shown assumes the reinvestment of all dividends and distributions. Investment performance reflects management fees and other fund expenses, including any applicable fee waivers that are in effect with respect to a particular Fund. In the absence of such waivers, total return would be reduced. Returns over 1 year are average annual returns. Performance data quoted represents past performance; past performance does not guarantee future results and does not reflect the deduction of any taxes a shareholder would pay on fund distributions or the sale of fund shares. The investment return and principal value of an investment will fluctuate so that an investor’s shares, when redeemed, may be worth more or less than the original cost. Current performance of the Fund may be lower or higher than the performance quoted. The Funds’ gross and net expense ratios shown are from the most recent prospectus and may change over time. See the financial highlights section of the financial statements for more recent expense ratios. The Funds’ gross and net expense ratios also include “acquired fund fees and expenses,” which are expenses incurred indirectly as a result of a Fund’s investments in one or more underlying funds, including ETFs and money market funds. Because these costs are indirect, the expense ratios will not correlate to the expense ratios in the Funds’ financial statements, since financial statements only include direct costs of the Funds and not indirect costs of investing in the underlying funds. Performance data current to the most recent month-end may be obtained by calling 1 (877) DLINE 11 / 1 (877) 354-6311 or by visiting www.doubleline.com.
Fund holdings and sector allocations are subject to change at any time and are not recommendations to buy or sell any security. Please refer to the Schedules of Investments for a complete list of Fund holdings as of period end.
and political, economic and currency risks and differences in accounting methods. These risks are greater for investments in emerging markets. Investments in lower rated and non-rated securities present a greater risk of loss to principal and interest than higher rated securities. Commodity-linked derivative instruments may involve additional costs and risks such as changes in commodity index volatility or factors affecting a particular industry or commodity, such as drought, floods, weather, livestock disease, embargoes, tariffs and international economic, political and regulatory developments. Investing in derivatives could result in losing more than the amount invested. Derivatives involve risks different from, and in certain cases, greater than the risks presented by more traditional investments. Derivatives may involve certain costs and risks such as liquidity, interest rate, market, credit, management and the risk that a position could not be closed when most advantageous. Investing in derivatives could lose more than the amount invested. Equities may decline in value due to both real and perceived general market, economic, and industry conditions. Exchange-traded fund investments involve additional risks such as the market price trading at a discount to its net asset value, an active secondary trading market may not develop or be maintained, or trading may be halted by the exchange in which they trade, which may impact a fund’s ability to sell its shares. Floating rate loans and other floating rate investments are subject to credit risk, interest rate risk, counterparty risk and financial services risks, among others. In addition, the Funds may invest in other asset classes and investments such as, among others, REITs, credit default swaps, short sales, derivatives and smaller companies which include additional risks. Investment strategies may not achieve the desired results due to implementation lag, other timing factors, portfolio management decision-making, economic or market conditions or other unanticipated factors. Additional principal risks for the Funds can be found in the prospectus.
Credit ratings from Moody’s Investor Services, Inc. (“Moody’s”) range from the highest rating of Aaa for bonds of the highest quality that offer the lowest degree of investment risk to the lowest rating of C for the lowest rated class of bonds. Credit ratings from S&P Global Ratings (“S&P”) range from the highest rating of AAA for bonds of the highest quality that offer the lowest degree of investment risk to the lowest rating of D for bonds that are in default. In limited situations when the rating agency has not issued a formal rating, the rating agency will classify the security as nonrated.
Credit ratings are determined from the highest available credit rating from any Nationally Recognized Statistical Rating Organization (“NRSRO”, generally S&P, Moody’s and Fitch Ratings, Inc.). DoubleLine chooses to display credit ratings using S&P’s rating convention, although the rating itself might be sourced from another NRSRO.
The reference and link to any websites in this Annual Report have been provided as a convenience, and the information contained on such website is not incorporated by reference into this Annual Report.
Barclays Capital Inc. and its affiliates (“Barclays”) is not the issuer, sponsor or promoter of DoubleLine Shiller Enhanced CAPE® or DoubleLine Shiller Enhanced International CAPE® (together, in this paragraph, the “Funds”) and Barclays has no responsibilities, obligations or duties to investors in the Funds. The Shiller Barclays CAPE® US Sector TR USD Index and Shiller Barclays CAPE® Europe Sector Net TR NoC USD Index (each an “Index” and together the “Indices”) consist of the respective trademarks of Barclays Bank PLC and trademarks owned by or licensed to RSBB-I, LLC and Barclays Bank PLC and that are licensed for use by DoubleLine Funds Trust as the issuer of the Funds (the “Issuer”). Barclays’ only relationship with the Issuer in respect of the Indices is the licensing of these trademarks and the Indices which are determined, composed and calculated by Barclays without regard to the Issuer or the Funds or the owners of the Funds. Additionally, DoubleLine Capital LP may for the Funds execute transaction(s) with Barclays in or relating to the Funds’ respective Index in connection with which investors of one of the Funds acquire shares of their respective Fund from DoubleLine Funds Trust and investors neither acquire any interest in that Fund’s respective Index nor enter into any relationship of any kind whatsoever with Barclays upon making an investment in that Fund. The Funds are not sponsored, endorsed, sold or promoted by Barclays. Barclays does not make any representation or warranty, express or implied regarding the advisability of investing in the Funds or the advisability of investing in securities generally or the ability of the Indices to track corresponding or relative market performance. Barclays has not passed on the legality or suitability of the Funds’ names or the Indices with respect to any person or entity. Barclays is not responsible for and has not participated in the determination of the timing of, prices of, or quantities of the shares of the Funds to be issued. Barclays has no obligation to take the needs of the Issuer or the owners of the Funds or any other third party into consideration in determining, composing or calculating the Indices. Barclays has no obligation or liability in connection with administration, marketing or trading of the Funds. The licensing agreement between DoubleLine Funds Trust and Barclays is solely for the benefit of the Funds and Barclays and not for the benefit of the owners of the Funds, investors or other third parties.
BARCLAYS SHALL HAVE NO LIABILITY TO THE ISSUER, INVESTORS OR TO OTHER THIRD PARTIES FOR THE USE OF THE DOUBLELINE SHILLER ENHANCED CAPE® AND DOUBLELINE SHILLER ENHANCED INTERNATIONAL CAPE® NAMES, OR THE QUALITY, ACCURACY AND/OR COMPLETENESS OF THE SHILLER BARCLAYS CAPE® US SECTOR TR USD INDEX OR SHILLER BARCLAYS CAPE® EUROPE SECTOR NET TR NOC USD INDEX OR ANY DATA INCLUDED THEREIN OR FOR INTERRUPTIONS IN THE DELIVERY OF THE SHILLER BARCLAYS CAPE® US SECTOR TR USD INDEX OR SHILLER BARCLAYS CAPE® EUROPE SECTOR NET TR NOC USD INDEX. BARCLAYS MAKES NO WARRANTY, EXPRESS OR IMPLIED, AS TO RESULTS TO BE OBTAINED BY THE ISSUER, THE INVESTORS OR ANY OTHER PERSON OR ENTITY FROM THE USE OF THE SHILLER BARCLAYS CAPE® US SECTOR TR USD INDEX OR SHILLER BARCLAYS CAPE® EUROPE SECTOR NET TR NOC USD INDEX OR ANY DATA INCLUDED THEREIN. BARCLAYS MAKES NO EXPRESS OR IMPLIED WARRANTIES, AND HEREBY EXPRESSLY DISCLAIMS ALL WARRANTIES OF MERCHANTABILITY OR FITNESS FOR A PARTICULAR PURPOSE OR USE WITH RESPECT TO DOUBLELINE SHILLER ENHANCED CAPE® AND DOUBLELINE SHILLER ENHANCED INTERNATIONAL CAPE® NAMES, THE SHILLER BARCLAYS CAPE® US SECTOR TR USD INDEX OR SHILLER BARCLAYS CAPE® EUROPE SECTOR NET TR NOC USD INDEX OR ANY DATA INCLUDED THEREIN. BARCLAYS RESERVES THE RIGHT TO CHANGE THE METHODS OF CALCULATION OR PUBLICATION, OR TO CEASE THE CALCULATION OR PUBLICATION OF THE SHILLER BARCLAYS CAPE® US SECTOR TR USD INDEX AND SHILLER BARCLAYS CAPE® EUROPE SECTOR NET TR NOC USD INDEX, AND BARCLAYS SHALL NOT BE LIABLE FOR ANY MISCALCULATION OF OR ANY INCORRECT, DELAYED OR INTERRUPTED PUBLICATION WITH RESPECT TO ANY OF THE SHILLER BARCLAYS CAPE® US SECTOR TR USD INDEX AND SHILLER BARCLAYS CAPE® EUROPE SECTOR NET TR NOC USD INDEX. BARCLAYS SHALL NOT BE LIABLE FOR ANY DAMAGES, INCLUDING, WITHOUT LIMITATION, ANY SPECIAL, INDIRECT OR CONSEQUENTIAL DAMAGES, OR ANY LOST PROFITS AND EVEN IF ADVISED OF THE POSSIBILITY OF SUCH, RESULTING FROM THE USE OF THE SHILLER BARCLAYS CAPE® US SECTOR TR USD INDEX OR SHILLER BARCLAYS CAPE® EUROPE SECTOR NET TR NOC USD INDEX OR ANY DATA INCLUDED THEREIN OR WITH RESPECT TO THE DOUBLELINE SHILLER ENHANCED CAPE® OR DOUBLELINE SHILLER ENHANCED INTERNATIONAL CAPE®.
None of the information supplied by Barclays Bank PLC and used in this publication may be reproduced in any manner without the prior written permission of Barclays Capital, the investment banking division of Barclays Bank PLC. Barclays Bank PLC is registered in England No. 1026167. Registered office 1 Churchill Place London E14 5HP.
The DoubleLine Floating Rate Fund is not sponsored, endorsed, sold or promoted by Morningstar, Inc., or any of its affiliated companies (all such entities, collectively, “Morningstar Entities”) or the Loan Syndications and Trading Association (“LSTA”). The Morningstar Entities and LSTA make no representation or warranty, express or implied, to the owners of the DoubleLine Floating Rate Fund or any member of the public regarding the advisability of investing in leveraged loans generally or in the DoubleLine Floating Rate Fund in particular or the ability of the LSTA/Morningstar Leveraged Loan Index to track general leveraged loan market performance. The Morningstar Entities’ only relationship to the DoubleLine Floating Rate Fund is the licensing of certain service marks and service names of Morningstar and of the LSTA/Morningstar Leveraged Loan Index which is determined, composed and calculated by the Morningstar Entities without regard to DoubleLine or the DoubleLine Floating Rate Fund. The Morningstar Entities have no obligation to take the needs of DoubleLine or the owners of the DoubleLine Floating Rate Fund into consideration in determining, composing or calculating the LSTA/Morningstar Leveraged Loan Index. The Morningstar Entities and LSTA are not responsible for and have not participated in the determination of the prices and amount of the DoubleLine Floating Rate Fund or the timing of the issuance or sale of the DoubleLine Floating Rate Fund or in the determination or calculation of the equation by which the DoubleLine Floating Rate Fund is converted into cash. The Morningstar Entities and LSTA have no obligation or liability in connection with the administration, marketing or trading of the DoubleLine Floating Rate Fund.
THE MORNINGSTAR ENTITIES AND LSTA DO NOT GUARANTEE THE ACCURACY AND/OR THE COMPLETENESS OF THE LSTA/MORNINGSTAR LEVERAGED LOAN INDEX OR ANY DATA INCLUDED THEREIN AND HAVE NO LIABILITY FOR ANY ERRORS, OMISSIONS, OR INTERRUPTIONS THEREIN. THE MORNINGSTAR ENTITIES AND LSTA MAKE NO WARRANTY, EXPRESS OR IMPLIED, AS TO RESULTS TO BE OBTAINED BY DOUBLELINE, OWNERS OR USERS OF THE DOUBLELINE FLOATING RATE FUND, OR ANY OTHER PERSON OR ENTITY FROM THE USE OF THE LSTA/ MORNINGSTAR LEVERAGED LOAN INDEX OR ANY DATA INCLUDED THEREIN. THE MORNINGSTAR ENTITIES AND LSTA MAKE NO EXPRESS OR IMPLIED WARRANTIES, AND EXPRESSLY DISCLAIM ALL WARRANTIES OF MERCHANTABILITY OR FITNESS FOR A PARTICULAR PURPOSE OR USE WITH RESPECT TO THE LSTA/MORNINGSTAR LEVERAGED LOAN INDEX OR ANY DATA INCLUDED THEREIN. WITHOUT LIMITING ANY OF THE FOREGOING, IN NO EVENT SHALL THE MORNINGSTAR ENTITIES OR LSTA HAVE ANY LIABILITY FOR ANY SPECIAL, PUNITIVE, INDIRECT, OR CONSEQUENTIAL DAMAGES (INCLUDING LOST PROFITS), EVEN IF NOTIFIED OF THE POSSIBILITY OF SUCH DAMAGES.
THIS FUND IS NOT SPONSORED, ENDORSED, SOLD OR PROMOTED BY MORGAN STANLEY CAPITAL GROUP INC. (“MORGAN STANLEY”). NEITHER MORGAN STANLEY NOR ANY OF ITS OR ITS AFFILIATES’ AGENTS (INCLUDING CALCULATION AGENTS), DATA PROVIDERS (WHICH FOR PURPOSES OF THIS DISCLAIMER INCLUDES WITHOUT LIMITATION ICE DATA, LLP, CHICAGO MERCANTILE EXCHANGE INC., AND THE LONDON METAL EXCHANGE) OR ANY THIRD PARTY PROVIDING SERVICES IN CONNECTION WITH THE INDEX MAKES ANY REPRESENTATION OR WARRANTY, EXPRESS OR IMPLIED, REGARDING THE ADVISABILITY OF INVESTING IN THIS FUND OR THE ABILITY OF THE MORGAN STANLEY BFMCISM (THE “INDEX”) TO TRACK MARKET PERFORMANCE. THE INDEX IS THE EXCLUSIVE PROPERTY OF MORGAN STANLEY. MORGAN STANLEY AND THE INDEX ARE SERVICE MARKS OF MORGAN STANLEY AND/OR A MORGAN STANLEY AFFILIATE AND HAVE BEEN LICENSED TO DOUBLELINE ALTERNATIVES LP FOR USE FOR CERTAIN PURPOSES BY DOUBLELINE ALTERNATIVES LP (“LICENSEE”). MORGAN STANLEY HAS NO OBLIGATION TO TAKE THE NEEDS OF THE LICENSEE, ISSUER OR OWNERS OF THIS FUND INTO CONSIDERATION IN DETERMINING, COMPOSING OR CALCULATING THE INDEX. NEITHER MORGAN STANLEY NOR ANY OF ITS OR ITS AFFILIATES’ AGENTS (INCLUDING CALCULATION AGENTS), DATA PROVIDERS OR ANY THIRD PARTY PROVIDING SERVICES IN CONNECTION WITH THE INDEX IS RESPONSIBLE FOR AND HAS NOT PARTICIPATED IN THE DETERMINATION OF THE TIMING OF, PRICES AT, OR QUANTITIES OF THIS FUND OR ITS ASSETS OR IN THE DETERMINATION OR CALCULATION OF THE EQUATION BY WHICH THIS FUND IS REDEEMABLE. NEITHER MORGAN STANLEY NOR ANY OF ITS OR ITS AFFILIATES’ AGENTS (INCLUDING CALCULATION AGENTS), DATA PROVIDERS OR ANY THIRD PARTY PROVIDING SERVICES IN CONNECTION WITH THE INDEX HAS OR WILL HAVE ANY OBLIGATION OR LIABILITY TO OWNERS OF THIS FUND IN CONNECTION WITH THE ADMINISTRATION, MARKETING OR TRADING OF THIS FUND.
ALTHOUGH MORGAN STANLEY OR ITS AGENTS OR SERVICE PROVIDERS SHALL OBTAIN INFORMATION FOR INCLUSION IN OR FOR USE IN THE CALCULATION OF THE INDEX FROM SOURCES WHICH MORGAN STANLEY CONSIDERS RELIABLE, NEITHER MORGAN STANLEY NOR ANY OF ITS OR ITS AFFILIATES’ AGENTS (INCLUDING CALCULATION AGENTS), DATA PROVIDERS OR ANY THIRD PARTY PROVIDING SERVICES IN CONNECTION WITH THE INDEX GUARANTEES THE ACCURACY AND/OR THE COMPLETENESS OF THE INDEX OR ANY DATA INCLUDED THEREIN. NEITHER MORGAN STANLEY NOR ANY OF ITS OR ITS AFFILIATES’ AGENTS (INCLUDING CALCULATION AGENTS), DATA PROVIDERS OR ANY THIRD PARTY PROVIDING SERVICES IN CONNECTION WITH THE INDEX MAKES ANY WARRANTY, EXPRESS OR IMPLIED, AS TO RESULTS TO BE OBTAINED BY LICENSEE, LICENSEE’S CUSTOMERS AND COUNTERPARTIES, OWNERS OF OR INVESTORS IN THE FUND, OR ANY OTHER PERSON OR ENTITY FROM THE USE OF THE INDEX OR ANY DATA INCLUDED THEREIN IN CONNECTION WITH THE RIGHTS LICENSED HEREUNDER OR FOR ANY OTHER USE. NEITHER MORGAN STANLEY NOR ANY OF ITS OR ITS AFFILIATES’ AGENTS (INCLUDING CALCULATION AGENTS), DATA PROVIDERS OR ANY THIRD PARTY PROVIDING SERVICES IN CONNECTION WITH THE INDEX MAKES ANY EXPRESS OR IMPLIED WARRANTIES, AND DO HEREBY EXPRESSLY DISCLAIM ALL WARRANTIES OF MERCHANTABILITY OR FITNESS FOR A PARTICULAR PURPOSE WITH RESPECT TO THE INDEX OR ANY DATA INCLUDED THEREIN. WITHOUT LIMITING ANY OF THE FOREGOING, IN NO EVENT SHALL MORGAN STANLEY OR ANY AGENT OF MORGAN STANLEY OR ANY MORGAN STANLEY AFFILIATE (INCLUDING CALCULATION AGENTS), DATA PROVIDERS OR ANY THIRD PARTY PROVIDING SERVICES IN CONNECTION WITH THE INDEX HAVE ANY LIABILITY FOR ANY DIRECT, INDIRECT, SPECIAL, PUNITIVE, CONSEQUENTIAL OR ANY OTHER DAMAGES (INCLUDING LOST PROFITS) EVEN IF NOTIFIED OF THE POSSIBILITY OF SUCH DAMAGES.
NO PURCHASER, SELLER OR HOLDER OF THIS SECURITY, OR ANY OTHER PERSON OR ENTITY, SHOULD USE OR REFER TO ANY MORGAN STANLEY TRADE NAME, TRADEMARK OR SERVICE MARK TO SPONSOR, ENDORSE, MARKET OR PROMOTE THIS PRODUCT WITHOUT FIRST CONTACTING MORGAN STANLEY TO DETERMINE WHETHER MORGAN STANLEY’S PERMISSION IS REQUIRED. UNDER NO CIRCUMSTANCES MAY ANY PERSON OR ENTITY CLAIM ANY AFFILIATION WITH MORGAN STANLEY WITHOUT THE PRIOR WRITTEN PERMISSION OF MORGAN STANLEY.
The DigitalBridge Fundamental US Real Estate Index (the “Index”) has been licensed by Barclays for use by DoubleLine Alternatives LP. DigitalBridge is a registered trademark of DigitalBridge Operating Company, LLC or its affiliates and has been sub-licensed for use for certain purposes by DoubleLine Alternatives LP. DoubleLine Real Estate and Income Fund (the “Fund”) is not sponsored, endorsed, sold, or promoted by DigitalBridge Operating Company, LLC or any of its affiliates. Neither DigitalBridge Operating Company, LLC nor any of its affiliates make any representation or warranty, express or implied, to the owners of the Fund or any member of the public regarding the advisability of investing in securities generally or in the Fund particularly or the ability of the Index to track market performance. DigitalBridge Operating Company, LLC’s and its affiliates’ only relationship to DoubleLine Alternatives LP with respect to the Index is through the sublicensing of certain rules incorporated in the Index and certain trademarks, service marks, and/or trade names owned by DigitalBridge Operating Company, LLC and its affiliates through Barclays and/or its affiliates to DoubleLine Alternatives LP. The Index is not determined, composed, or calculated by DigitalBridge Operating Company, LLC. Neither DigitalBridge Operating Company, LLC nor its affiliates are responsible for and have not participated in the determination of the prices or amount of shares of the Fund or the timing of the issuance or sale of shares of the Fund or in the determination or calculation of the equation by which shares of the Fund are to be converted into cash, surrendered, or redeemed, as the case may be. DigitalBridge Operating Company, LLC and its affiliates have no obligation or liability in connection with the administration, marketing, or trading of the Fund. There is no assurance that investment products based on the Index shall accurately track index performance or provide positive investment returns. DigitalBridge Operating Company, LLC and its affiliates are not investment advisors with respect to investors in the Fund. Inclusion of a security within an index is not a recommendation by DigitalBridge Operating Company, LLC or its affiliates to buy, sell, or hold such security, nor is it considered to be investment advice.
NEITHER DIGITALBRIDGE OPERATING COMPANY, LLC NOR ITS AFFILIATES GUARANTEE THE ADEQUACY, ACCURACY, TIMELINESS, AND/OR COMPLETENESS OF THE INDEX, ANY DATA RELATED THERETO, OR ANY COMMUNICATIONS, INCLUDING BUT NOT LIMITED TO, ORAL, WRITTEN, OR ELECTRONIC COMMUNICATIONS WITH RESPECT THERETO AND LICENSOR AND ITS AFFILIATES SHALL NOT BE SUBJECT TO ANY DAMAGES OR LIABILITY FOR ANY ERRORS, OMISSIONS, OR DELAYS THEREIN. DIGITALBRIDGE OPERATING COMPANY, LLC AND ITS AFFILIATES MAKE NO EXPRESS OR IMPLIED WARRANTIES, AND EXPRESSLY DISCLAIM ALL WARRANTIES OF MERCHANTABILITY, FITNESS FOR A PARTICULAR PURPOSE, OR USE, OR AS TO RESULTS TO BE OBTAINED BY DOUBLELINE ALTERNATIVES LP, INVESTORS IN THE FUND, OR ANY OTHER PERSON OR ENTITY FROM THE USE OF THE INDEX OR WITH RESPECT TO ANY DATA RELATED THERETO. WITHOUT LIMITING ANY OF THE FOREGOING, IN NO EVENT WHATSOEVER SHALL LICENSOR OR ITS AFFILIATES BE LIABLE, WHETHER IN CONTRACT, TORT, STRICT LIABILITY, OR OTHERWISE, FOR ANY INDIRECT, SPECIAL, INCIDENTAL, PUNITIVE, OR CONSEQUENTIAL DAMAGES OR FOR LOSS OF PROFITS, TRADING LOSSES, LOST TIME, OR GOODWILL, EVEN IF THEY HAVE BEEN ADVISED OF THE POSSIBILITY OF SUCH DAMAGES.
Neither Barclays nor the Index Sponsor, as defined below, make any representation or warranty, express or implied, to DoubleLine Real Estate and Income Fund (the “Fund”) or any member of the public regarding the advisability of investing in transactions generally or other instruments or related derivatives or in the Index particularly or the ability of the Barclays indices, including without limitation, the Index, to track the performance of any market or underlying assets or data. Neither Barclays nor the Index Sponsor has any obligation to take the needs of the Fund into consideration in determining, composing or calculating the Index.
Barclays’ indices are administered, calculated and published by the Index Sponsor. The Index Sponsor role is performed by Barclays Index Administration (“BINDA”), a distinct function within the Investment Bank of Barclays Bank PLC. As the administrator of the Barclays family of indices, BINDA operates independently from Barclays Investment Bank’s sales, trading, structuring and banking departments. Notwithstanding the foregoing, potential conflicts of interest may exist where: (i) Barclays acts in multiple capacities with respect to a particular Barclays index, including but not limited to functioning as index sponsor, index administrator, calculation agent, licensing agent, and/or publisher; (ii) sales, trading or structuring desks in Barclays Investment Bank launch products linked to the performance of a Barclays index, which are typically hedged by Barclays’ trading desks. In hedging an index, a trading desk may purchase or sell constituents of that index. These purchases or sales may affect the prices of the index constituents which could in turn affect the level of that index; and (iii) Barclays may use price contributions from trading desks in Barclays Investment Bank as a pricing source for a Barclays index. Barclays has in place policies and governance procedures (including separation of reporting lines) that are designed to avoid or otherwise appropriately manage such conflicts of interest and ensure the independence of BINDA and the integrity of Barclays indices. Where permitted and subject to appropriate restrictions, BINDA personnel regularly interact with trading and structuring desk personnel in Barclays Investment Bank regarding current market conditions and prices although decisions made by BINDA are independent and not influenced by trading and structuring desk personnel. Additional information about Barclays indices together with copies of the BINDA IOSCO Compliance Statement and Control Framework are available at: https://indices.barclays/IM/21/en/indices/static/aboutbinda.app.
The Index Sponsor is under no obligation to continue the calculation, publication and dissemination of the Index or the level of the Index. While the Index Sponsor currently employs the methodology ascribed to the Index (and application of such methodology shall be conclusive and binding), no assurance can be given that market, regulatory, juridical, financial, fiscal or other circumstances (including, but not limited to, any changes to or any suspension or termination of or any other events affecting any constituent within the Index) will not arise that would, in the view of the Index Sponsor, necessitate an adjustment, modification or change of such methodology. In certain circumstances, the Index Sponsor may suspend or terminate the Index.
BARCLAYS AND THE INDEX SPONSOR DO NOT GUARANTEE, AND SHALL HAVE NO LIABILITY TO THE PURCHASERS OR TRADERS, AS THE CASE MAY BE, OF THE FUND OR TO THIRD PARTIES FOR, THE QUALITY, ACCURACY AND/OR COMPLETENESS OF THE BARCLAYS INDICES, OR ANY DATA INCLUDED THEREIN, OR FOR INTERRUPTIONS IN THE DELIVERY OF THE BARCLAYS INDICES. BARCLAYS AND THE INDEX SPONSOR MAKE NO EXPRESS OR IMPLIED WARRANTIES, AND HEREBY EXPRESSLY DISCLAIM ALL WARRANTIES OF MERCHANTABILITY OR FITNESS FOR A PARTICULAR PURPOSE OR USE WITH RESPECT TO THE BARCLAYS INDICES, INCLUDING WITHOUT LIMITATION, THE INDEX, OR ANY DATA INCLUDED THEREIN. WITHOUT LIMITING ANY OF THE FOREGOING, IN NO EVENT SHALL BARCLAYS OR THE INDEX SPONSOR HAVE ANY LIABILITY FOR ANY SPECIAL, PUNITIVE, INDIRECT, OR CONSEQUENTIAL DAMAGES (INCLUDING LOST PROFITS), EVEN IF NOTIFIED OF THE POSSIBILITY OF SUCH DAMAGES SAVE TO THE EXTENT THAT SUCH EXCLUSION OF LIABILITY IS PROHIBITED BY LAW.
This material is confidential and distributed to intended recipients only and may not be reproduced (in whole or in part) or transmitted to any other person. The information contained in this material is for general reference purposes only and should not be construed or used as an offer, solicitation or recommendation to buy or sell any securities or investment.
For the avoidance of doubt the Index and/or any account, transaction or product using the information relating to the Index, is not sponsored, endorsed, sold, or promoted by any provider of the underlying data (the “Reference Assets”) comprised in the Index (each a “Reference Asset Sponsor”) and no Reference Asset Sponsor makes any representation whatsoever, whether express or implied, either as to the results to be obtained from the use of the relevant Reference Asset or the index and/or the levels at which the relevant Reference Asset or the Index stands at any particular time on any particular date or otherwise. No Reference Asset Sponsor shall be liable (whether in negligence or otherwise) to any person for any error in a Reference Asset and/or in the Index and a Reference Asset Sponsor is under no obligation to advise any person of any error therein. No Reference Asset Sponsor is making any representation whatsoever, whether express or implied, as to the advisability of purchasing or assuming any risk in connection with the DoubleLine Multi-Asset Trend Fund managed by DoubleLine; or any product or investment strategy referencing the DoubleLine Multi-Asset Trend Fund managed by DoubleLine. No Reference Asset Sponsor shall have any liability for any act or failure to act by the Index Sponsor in connection with the calculation, adjustment or maintenance of the Index. None of the Reference Asset Sponsors or their affiliates have any affiliation with or control over the Index or the Index Sponsor or any control over the computation, composition or dissemination of the Index.
The Index Sponsor and the Index Calculation Agent shall not be held liable for any modification or change in the methodology used in calculating the index or any index components thereof (the “BNP Paribas Indices”). The Index Sponsor and the Index Calculation Agent are under no obligation to continue the calculation, publication or dissemination of the BNP Paribas Indices and shall not be held liable for any suspension or interruption in the calculation of any BNP Paribas Indices. The Index Sponsor and the Index Calculation Agent decline any liability in connection with the level of any BNP Paribas Index at any given time. None of BNP Paribas, the Index Sponsor, the Index Calculation Agent nor any of their affiliates shall be held liable for any loss whatsoever, directly or indirectly related to any BNP Paribas Index.
BNP Paribas, the Index Sponsor and the Index Calculation Agent do not guarantee the accuracy or completeness of the methodology or rules of the BNP Paribas Indices (the “BNP Paribas Index Rules”) or the calculation methods, any errors or omissions in computing or disseminating the BNP Paribas Indices, or for any use thereof, and the Index Sponsor and the Index Calculation Agent shall have no liability for any errors or omissions therein.
The BNP Paribas Index Rules are based on certain assumptions, certain pricing models and calculation methods adopted by the Index Sponsor and have certain inherent limitations. Information prepared on the basis of different models, calculation methods or assumptions may yield different results. Numerous factors may affect the analysis, which may or may not be taken into account. Therefore, the analysis of information may vary significantly from analysis obtained from other sources or market participants.
BNP Paribas, the Index Sponsor and Index Calculation Agent do not make any representation whatsoever, either as to the results to be obtained from the use of the BNP Paribas Indices, the levels of any BNP Paribas Index at any time or any use of any Index Component or the price, level or rate of any Index Component at any time.
The market data used to calculate the level of any BNP Paribas Index may be furnished by third party sources and is believed to be reliable; however, BNP Paribas, the Index Sponsor and the Index Calculation Agent make no representation or guarantee with respect to, and are under no obligation to verify, the accuracy and completeness thereof.
An investment cannot be made directly in an index. The performance of any index mentioned in this commentary has not been adjusted for ongoing management, distribution and operating expenses applicable to mutual fund investments.
The index descriptions provided herein are based on information provided on the respective index provider’s website or from other third-party sources. The Funds and DoubleLine have not verified these index descriptions and disclaim responsibility for their accuracy and completeness.
This commentary may include statements that constitute “forward-looking statements” under the U.S. securities laws. Forward-looking statements include, among other things, projections, estimates, and information about possible or future results related to a Fund and market or regulatory developments. The views expressed above are not guarantees of future performance or economic results and involve certain risks, uncertainties and assumptions that could cause actual outcomes and results to differ materially from the views expressed herein.
DoubleLine has no obligation to provide revised assessments in the event of changed circumstances. While we have gathered this information from sources believed to be reliable, DoubleLine cannot guarantee the accuracy of the information provided. Securities discussed are not recommendations and are presented as examples of issue selection or portfolio management processes. They have been picked for comparison or illustration purposes only. No security presented within is either offered for sale or purchase. DoubleLine reserves the right to change its investment perspective and outlook without notice as market conditions dictate or as additional information becomes available.
Investment strategies may not achieve the desired results due to implementation lag, other timing factors, portfolio management decision making, economic or market conditions or other unanticipated factors. The views and forecasts expressed in this material are as of the date indicated, are subject to change without notice, may not come to pass and do not represent a recommendation or offer of any particular security, strategy, or investment. Past performance is no guarantee of future results.
The DoubleLine Funds are distributed by Quasar Distributors, LLC.
Short term performance, in particular, is not a good indication of the fund’s future performance, and an investment should not be made based solely on returns.
A summary of the DoubleLine Core Fixed Income Fund’s investments in affiliated mutual funds for the period ended March 31, 2023 is as follows:
A summary of the DoubleLine Multi-Asset Growth Fund’s investments in affiliated mutual funds for the period ended March 31, 2023 is as follows:
A summary of the DoubleLine Multi-Asset Trend Fund’s investments in affiliated mutual funds for the period ended March 31, 2023 is as follows:
DoubleLine Funds Trust, a Delaware statutory trust (the “Trust”), is an open-end investment management company registered under the Investment Company Act of 1940, as amended (the “1940 Act”). The Trust consists of 19 funds, the DoubleLine Total Return Bond Fund, DoubleLine Core Fixed Income Fund, DoubleLine Emerging Markets Fixed Income Fund, DoubleLine Multi-Asset Growth Fund, DoubleLine Low Duration Bond Fund, DoubleLine Floating Rate Fund, DoubleLine Shiller Enhanced CAPE®, DoubleLine Flexible Income Fund, DoubleLine Low Duration Emerging Markets Fixed Income Fund, DoubleLine Long Duration Total Return Bond Fund, DoubleLine Strategic Commodity Fund, DoubleLine Global Bond Fund, DoubleLine Infrastructure Income Fund, DoubleLine Shiller Enhanced International CAPE®, DoubleLine Real Estate and Income Fund, DoubleLine Emerging Markets Local Currency Bond Fund, DoubleLine Income Fund and DoubleLine Multi-Asset Trend Fund (each, a “Fund” and, collectively, the “Funds”), along with DoubleLine Selective Credit Fund. For financial information related to the DoubleLine Selective Credit Fund, please refer to the DoubleLine Selective Credit Fund’s separate annual report.
Each Fund is classified as a diversified fund under the 1940 Act, except the DoubleLine Global Bond Fund and the DoubleLine Emerging Markets Local Currency Bond Fund which are classified as non-diversified funds. Currently under the 1940 Act, a diversified fund generally may not, with respect to 75% of its total assets, invest more than 5% of its total assets in the securities of any one issuer or own more than 10% of the outstanding voting securities of such issuer (except, in each case, U.S. Government securities, cash, cash items and the securities of other investment companies). The remaining 25% of a fund’s total assets is not subject to this limitation.
The Funds’ investment objectives and dates each share class commenced operations are as follows:
The fiscal year end for the Funds is March 31, and the period covered by these financial statements is for the period ended March 31, 2023 (the “period end”).
Each Fund is an investment company that applies the accounting and reporting guidance issued in Topic 946, “Financial Services— Investment Companies”, by the Financial Accounting Standards Board (“FASB”). The following is a summary of the significant accounting policies of the Funds. These policies are in conformity with accounting principles generally accepted in the United States of America (“US GAAP”).
Valuations for domestic and foreign fixed income securities are normally determined on the basis of evaluations provided by independent pricing services. Vendors typically value such securities based on one or more inputs described in the following table which is not intended to be a complete list. The table provides examples of inputs that are commonly relevant for valuing particular classes of fixed income securities in which the Funds are authorized to invest. However, these classifications are not exclusive, and any of the inputs may be used to value any other class of fixed-income securities. Securities that use similar valuation techniques and inputs as described in the following table are categorized as Level 2 of the fair value hierarchy. To the extent the significant inputs are unobservable, the values generally would be categorized as Level 3. Assets and liabilities may be transferred between levels.
Investments in registered open-end management investment companies will be valued based upon the net asset value (“NAV”) of such investments and are categorized as Level 1 of the fair value hierarchy.
Common stocks, exchange-traded funds and financial derivative instruments, such as futures contracts or options contracts, that are traded on a national securities or commodities exchange, are typically valued at the last reported sales price, in the case of common stocks and exchange-traded funds, or, in the case of futures contracts or options contracts, the settlement price determined by the relevant exchange. To the extent these securities are actively traded and valuation adjustments are not applied, they are categorized as Level 1 of the fair value hierarchy.
Over-the-counter financial derivative instruments, such as forward currency exchange contracts, options contracts, or swap agreements, derive their values from underlying asset prices, indices, reference rates, other inputs or a combination of these factors. These instruments are normally valued on the basis of valuations obtained from counterparties, published index closing levels or evaluated prices supplied by independent pricing services, some or all of which may be based on market data from trading on exchanges that closed significantly before the time as of which a Fund calculates its NAV. Forward foreign currency contracts are generally valued based on rates provided by independent data providers. Exchange traded futures and options on futures are generally valued at the settlement price determined by the relevant exchange on which they principally trade, and exchange traded options are generally valued at the last trade price on the exchange on which they principally trade. A Fund does not normally take into account trading, clearances or settlements that take place after the close of the principal exchange or market on which such securities are traded. Depending on the instrument and the terms of the transaction, the value of the derivative instruments can be estimated by a pricing service provider using a series of techniques, such as simulation pricing models. The pricing models use issuer details and other inputs that are observed from actively quoted markets such as indices, spreads, interest rates, curves, dividends and exchange rates. Derivatives that use similar valuation techniques and inputs as described above are normally categorized as Level 2 of the fair value hierarchy.
The Board of Trustees (the “Board”) has adopted a pricing and valuation policy for use by each Fund and its Valuation Designee (as defined below) in calculating each Fund’s NAV. Pursuant to Rule 2a-5 under the 1940 Act, each Fund has designated its primary investment adviser, either DoubleLine Capital LP (“DoubleLine Capital”) or DoubleLine Alternatives LP (“DoubleLine Alternatives”) (each, an “Adviser” and collectively, the “Advisers”), as applicable, as the “Valuation Designee” to perform all of the fair value determinations as well as to perform all of the responsibilities that may be performed by the Valuation Designee in accordance with Rule 2a-5. Each Adviser, as Valuation Designee, is authorized to make all necessary determinations of the fair values of portfolio securities and other assets for which market quotations are not readily available or if it is deemed that the prices obtained from brokers and dealers or independent pricing services are unreliable.
The following is a summary of the fair valuations according to the inputs used to value the Funds’ investments as of March 31, 2023:
The following is a reconciliation of investments in which significant unobservable inputs (Level 3) were used in determining fair value:
The following is a summary of quantitative information about Level 3 Fair Value Measurements:
The Funds may be subject to a nondeductible 4% excise tax calculated as a percentage of certain undistributed amounts of net investment income and net capital gains.
The Funds have adopted financial reporting rules that require the Funds to analyze all open tax years, as defined by the applicable statute of limitations, for all major jurisdictions. Open tax years 2020-2022 (Federal) and 2019-2022 (CA/DE) for the Funds are those that are open for exam by taxing authorities to the extent that each Fund operated within those respective tax years. As of March 31, 2023, the Funds have no examinations in progress.
Management has analyzed the Funds’ tax positions, and has concluded that no liability should be recorded related to uncertain tax positions expected to be taken on the tax return for the fiscal year ended March 31, 2023. The Funds identify their major tax jurisdictions as U.S. Federal, the State of Delaware and the State of Florida. The Funds are not aware of any tax positions for which it is reasonably possible that the total amounts of unrecognized tax benefits will significantly change in the next twelve months.
Each Fund’s tax returns are subject to examination by relevant tax authorities until expiration of the applicable statute of limitations, which is generally three years after the filing of the tax return but which can be extended to six years in certain circumstances.
Income and capital gain distributions are determined in accordance with income tax regulations which may differ from US GAAP. Permanent book and tax basis differences relating to shareholder distributions will result in reclassifications between paid-in capital, undistributed (accumulated) net investment income (loss), and/or undistributed (accumulated) realized gain (loss).
Undistributed (accumulated) net investment income or loss may include temporary book and tax basis differences which will reverse in a subsequent period. Any taxable income or capital gain remaining at fiscal year end is distributed in the following year.
Distributions from investment companies will be classified as investment income or realized gains in the Statements of Operations based on the U.S. income tax characteristics of the distribution if such information is available. In cases where the tax characteristics are not available, such distributions are generally classified as investment income.
The Funds are obligated to fund these commitments at the borrower’s discretion. At the end of the period, the Funds maintained with their custodian liquid investments having an aggregate value at least equal to the par value of their respective unfunded loan commitments and bridge loans.
As of March 31, 2023, the relationship of the Subsidiary to each respective Fund was as follows:
The Advisers provide the Funds with investment management services under Investment Management Agreements (the “Agreements”). Under the Agreements, each Adviser manages the investment of the assets of the applicable Fund, places orders for the purchase and sale of its portfolio securities and is responsible for providing certain resources to assist with the day-to-day management of the Trust’s business affairs. As compensation for its services, each Adviser is entitled to a monthly fee at the annual rates of the average daily net assets of the Funds (the “Advisory Fee”) in the following table. Each Adviser has arrangements with DoubleLine Group LP to provide personnel and other resources to the Funds. On December 11, 2018, DoubleLine Alternatives, the investment adviser of the DoubleLine Real Estate and Income Fund, engaged DoubleLine Capital to serve as sub- adviser to the DoubleLine Real Estate and Income Fund to manage its investment in debt instruments. On February 18, 2021, DoubleLine Alternatives, the investment adviser of the DoubleLine Multi-Asset Trend Fund, engaged DoubleLine Capital to serve as sub-adviser to the DoubleLine Multi-Asset Trend Fund to manage its investment in debt instruments. Effective as of July 29, 2022, DoubleLine Alternatives became the investment adviser to DoubleLine Shiller Enhanced CAPE® and DoubleLine Capital became the sub-adviser to the Fund. Prior to July 29, 2022, DoubleLine Capital was the sole investment adviser to DoubleLine Shiller Enhanced CAPE®.
Each Adviser has contractually agreed to limit certain of the Funds’ ordinary operating expenses so that its ratio of such expenses to average net assets will not exceed the following ratios (the “Expense Caps”). For the purposes of the expense limitation agreement between each Adviser and the applicable Funds, “ordinary operating expenses” excludes taxes, commissions, mark-ups, litigation expenses, indemnification expenses, interest expenses, acquired fund fees and expenses, and any extraordinary expenses. Each
applicable Fund’s expense limitation is expected to apply until at least July 31, 2024. Each applicable expense limitation may be terminated during the term only by a majority vote of the disinterested Trustees of the Board.
Other than as described above, to the extent that an Adviser waives its investment advisory fee and/or reimburses a Fund for other ordinary operating expenses, it may seek reimbursement of a portion or all of such amounts at any time within three fiscal years after the fiscal year in which such amounts were waived or reimbursed. Each Fund must pay its current ordinary operating expenses before each Adviser is entitled to any recoupment. Any such recoupment would be subject to review by the Board and will be subject to the Fund’s expense limitations in place when the fees were waived or the expenses were reimbursed.
Each Adviser, as applicable, contractually waived a portion of its fees or reimbursed certain operating expenses and may recapture a portion of the amounts no later than the dates as stated in the following table:
If a Fund invested in other investment vehicles sponsored by an Adviser (“other DoubleLine Funds”) during the period, such Adviser waived its advisory fee to the Fund in an amount equal to the advisory fees paid to the Adviser by the other DoubleLine Funds in respect of Fund assets so invested. Accordingly, the Adviser waived the following fees for the year ended March 31, 2023:
As of March 31, 2023, greater than 5% of the following DoubleLine Funds was held by other DoubleLine Funds as follows:
DoubleLine Capital LP and certain DoubleLine affiliated advisers provide investment advisory, sub-advisory, or consulting services to a variety of investors, including investment program sponsors, separate accounts, and mutual funds sponsored by third parties (collectively “third-party accounts”). Those services may result, directly or indirectly, in investments by the third-party accounts in one or more of the Funds. At times, the third-party accounts’ investments, individually or in the aggregate, may represent material interests in one or more of the Funds. The third-party accounts’ transaction activity in a Fund may cause a Fund to incur material transaction costs, to realize taxable gains distributable to shareholders, and/or to buy or sell assets at a time when the Fund might not otherwise do so, each of which may adversely affect a Fund’s performance. See the description of Large Shareholder Risk in the Principal Risks Note for more information. Records available to the Funds reflect that greater than 25% of the following Funds were held by third-party accounts as of March 31, 2023:
Class N shares and Class A shares of the Funds make payments under a distribution plan (the “Distribution Plan”) adopted pursuant to Rule 12b-1 under the 1940 Act. Pursuant to the Distribution Plan, each Fund compensates the Fund’s distributor for distribution and related services at an annual rate equal to 0.25% of the average daily net assets of the Fund attributable to its Class N and
Class A shares. The fees may be used to pay the Fund’s distributor for distribution services and sales support services provided in connection with Class N and Class A shares.
The Class A shares of DoubleLine Multi-Asset Growth Fund have a maximum sales charge imposed on purchases of 4.25% of the offering price and a maximum contingent deferred sales charge of 0.75% that applies to purchases of $1 million or more of Class A shares if the shares are redeemed within 18 months of purchase.
The DoubleLine Floating Rate Fund imposes redemption fees. Redemption fees are paid to and retained by the Fund to limit the opportunity to market time the Fund and to help offset estimated portfolio transaction costs and other related costs incurred by the Fund as a result of short-term trading. Subject to the exceptions discussed in the Fund’s prospectus, the DoubleLine Floating Rate Fund will apply a redemption fee equal to 1% of the value of any shares redeemed within 90 calendar days of purchase.
Investment transactions (excluding short-term investments) for the year ended March 31, 2023 were as follows:
The Funds designated as long-term capital gain dividend, pursuant to Internal Revenue Code Section 852(b)(3), the amount necessary to reduce the earnings and profits of the Funds related to net capital gain to zero.
The cost basis of investments for U.S. federal income tax purposes as of March 31, 2023, was as follows:
As of March 31, 2023, the components of accumulated earnings (losses) for income tax purposes were as follows:
Under the Regulated Investment Company Modernization Act of 2010, capital losses incurred by the Funds after January 1, 2011 will not be subject to expiration. In addition, such losses must be utilized prior to the losses incurred in the years preceding enactment.
Additionally, US GAAP requires that certain components of net assets relating to permanent differences be reclassified between financial and tax reporting. These reclassifications have no effect on net assets or NAV per share. The permanent differences primarily relate to paydown losses, accretion of discount on certain debt instruments, foreign currency gains (losses), consent fee income, prior period adjustments, net operating losses and deconsolidation of foreign subsidiaries. For the period ended March 31, 2023, the following table shows the reclassifications made:
If a Fund estimates that a portion of its regular distributions to shareholders may be comprised of amounts from sources other than net investment income, as determined in accordance with such Fund’s policies and practices, the Fund will notify shareholders of the estimated composition of such distribution through a Section 19 Notice. For these purposes, each Fund estimates the source or sources from which a distribution is paid, to the close of the period as of which it is paid, in reference to its expected tax character. It is important to note that differences exist between a Fund’s daily internal accounting records and practices, the Fund’s financial statements presented in accordance with US GAAP, and recordkeeping practices under income tax regulations. It is possible that a Fund may not issue a Section 19 Notice in situations where such Fund’s financial statements prepared later and in accordance with US GAAP might later report that the sources of those distributions included capital gains and/or a return of capital. Please visit https://doubleline.com/mutual-funds/ for the most recent Section 19 Notice, if applicable. Information provided to you on a Section 19 notice is an estimate only and subject to change; final determination of a distribution’s tax character will be reported on Form 1099 DIV sent to shareholders for the calendar year.
Trustees who are not affiliated with each Adviser and its affiliates receive fees from the Trust. These trustees may elect to defer the cash payment of part or all of their compensation. These deferred amounts, which remain as liabilities of the Funds, are treated as if invested in shares of Funds designated by each Trustee or other funds managed by each Adviser and its affiliates. These amounts represent general unsecured liabilities of each Fund and vary according to the total returns of the selected funds. Trustees Fees in the Statements of Operations include current fees (either paid in cash or deferred) and any increase (decrease) in the value of the deferred amounts. Certain trustees and officers of the Funds are also officers of each Adviser; such trustees and officers are not compensated by the Funds.
The following disclosures provide information on the Funds’ use of derivatives and certain related risks. The location and fair value amounts of these instruments on the Statements of Assets and Liabilities and the realized gains and losses and changes in unrealized gains and losses on the Statements of Operations, each categorized by type of derivative contract, are included in the following tables.
The average volume of derivative activity for the year ended March 31, 2023 is as follows:
exercised or closed are added to the amounts paid or offset against the proceeds on the underlying investment transaction to determine the realized gain or loss and are recorded in net realized gain (loss) on investments on the Statements of Operations. When a Fund writes (i.e., sells) an option it receives a premium in return for bearing the risk of the change in value of an underlying instrument during the term off the option. Writing put options tends to increase a Fund’s exposure to the risk that the value of the underlying instrument will depreciate. Writing call options tends to decrease a Fund’s ability to benefit from appreciation in the value in the underlying instrument. When a Fund writes a call or put, an amount equal to the premium received is recorded as a liability on the Fund’s Statement of Assets and Liabilities and marked-to-market to reflect the current value of the option written.
Premiums received from writing options which expire are treated as realized gains and are recorded in net realized gain (loss) on written options on the Statements of Operations. Premiums received from writing options which are exercised or closed are added to the proceeds or offset against amounts paid on the underlying instrument to determine the realized gain or loss when the underlying instrument is sold and are recorded in net realized gain (loss) on written options on the Statements of Operations. A Fund as a writer of an option has no control over whether the underlying instrument may be sold (call) or purchased (put), and as a result bears the market risk of an unfavorable change in the price of the instrument underlying the written option. There is the risk that the market for options contracts may be illiquid and that a Fund may not be able to close out or sell an option at a particular time or at an anticipated price.
Statements of Operations. Futures contracts involve, to varying degrees, risk of loss in excess of the variation margin disclosed on the Statements of Assets and Liabilities.
If a Fund is a seller of protection and a credit event occurs, as defined under the terms of that particular swap agreement, the Fund typically will either (i) pay to the buyer of protection an amount equal to the notional amount of the swap and take delivery of the referenced obligation, other deliverable obligations or the affected securities in the referenced index or (ii) pay a net settlement amount in the form of cash or securities equal to the notional amount of the swap less the recovery value of the referenced obligation or the affected securities in the referenced index. If a Fund is a buyer of protection and a credit event occurs, as defined under the terms of that particular swap agreement, the Fund typically will either (i) receive from the seller of protection an amount equal to the notional amount of the swap and deliver the referenced obligation, other deliverable obligations or the affected securities in the referenced index or (ii) receive a net settlement amount in the form of cash or securities equal to the notional amount of the swap less the recovery value of the referenced obligation or the affected securities in the referenced index. Recovery values are typically estimated by market makers considering either industry standard recovery rates or entity specific factors and considerations until a credit event occurs. An index credit default swap references all the names in the index, and if there is a default with respect to a single name in the index, the credit event is generally settled based on that name’s weight in the index.
Credit default swaps are considered to have credit risk related contingent features since they require payment by the protection seller to the protection buyer upon occurrence of a defined credit event. A Fund’s maximum risk of loss from counterparty risk, as the protection buyer, is the fair value of the contract, which may be mitigated by the posting of collateral by the counterparty to a Fund to cover a Fund’s exposure to the counterparty. Upfront premiums (received) paid including accretion (amortization) less any collateral held at the counterparty are reflected in deposit at broker for swaps on the Statements of Assets and Liabilities. The marked-to-market value less a financing rate, if any, is included in net unrealized appreciation (depreciation) on swaps on the Statements of Assets and Liabilities. At termination or maturity of the swap, the cumulative marked-to-market on the value less a financing rate, if any, is recorded in realized gain (loss) on swaps on the Statements of Operations.
The Funds’ derivative instrument holdings are summarized in the following tables.
The effect of derivative instruments on the Statements of Assets and Liabilities as of March 31, 2023 was as follows:
The effect of derivative instruments on the Statements of Operations for the year ended March 31, 2023 was as follows:
The Funds are subject to various Master Netting Arrangements, which govern the terms of certain transactions with select counterparties. The Master Netting Arrangements are intended to allow the Funds to close out and net their total exposure to a counterparty in the event of a default with respect to all the transactions governed under a single agreement with a counterparty. The Master Netting Arrangements also specify collateral posting arrangements at pre-arranged exposure levels. Under the Master Netting Arrangements, collateral is routinely transferred if the total net exposure to certain transactions (net of existing collateral already in place) governed under the relevant Master Netting Arrangement with a counterparty in a given account exceeds a specified threshold depending on the counterparty and the type of Master Netting Arrangement.
As of March 31, 2023, the Funds held the following derivative instruments that were subject to offsetting on the Statements of Assets and Liabilities:
The Funds may make loans directly to borrowers and may acquire or invest in loans made by others (“loans”). The Funds may acquire a loan interest directly by acting as a member of the original lending syndicate. Alternatively, the Funds may acquire some or all of the interest of a bank or other lending institution in a loan to a particular borrower by means of a novation, an assignment or a participation. The loans in which the Funds may invest include those that pay fixed rates of interest and those that pay floating rates—i.e., rates that adjusted periodically by reference to a base lending rate, plus a spread. These base lending rates are primarily the London Interbank Offered Rate (LIBOR) or the Secured Overnight Financing Rate (SOFR) and secondarily, the prime rate offered by one or more major United States banks (the Prime Rate). Base lending rates may be subject to a floor, or minimum rate. Rates for SOFR are generally 1 or 3-month tenors and may also be subject to a credit spread adjustment. The Funds may purchase and sell interests in bank loans on a when-issued and delayed delivery basis, with payment delivery scheduled for a future date.
Securities purchased on a delayed delivery basis are marked-to-market daily and no income accrues to the Funds prior to the date the Funds actually take delivery of such securities. These transactions are subject to market fluctuations and are subject, among other risks, to the risk that the value at delivery may be more or less than the trade purchase price.
U.S. Bank, N.A. (the “Bank”) has made available to the Trust, excluding the DoubleLine Emerging Markets Local Currency Bond Fund, (the “DoubleLine Funds”) an uncommitted $725,000,000 credit facility for short term liquidity in connection with shareholder redemptions. Under the terms of the credit facility, borrowings for each DoubleLine Fund are limited to one-third of the total assets (including the amount borrowed) of such DoubleLine Fund. Fifty percent of the credit facility is available to all of the DoubleLine Funds, on a first come, first served basis. The remaining 50% of the credit facility is allocated among the DoubleLine Funds in accordance with procedures adopted by the Board. Borrowings under this credit facility bear interest at the greater of 0.00% or the Bank’s prime rate less 1.00%.
The Bank has also made available to the DoubleLine Floating Rate Fund a committed $50,000,000 credit facility. Borrowings under this credit facility bear interest at the greater of 0.00% or the Bank’s prime rate less 1.00%.
State Street Bank and Trust Company has made available to the DoubleLine Emerging Markets Local Currency Bond Fund an uncommitted $30,000,000 credit facility with an annual non-refundable facility fee of $50,000. Under the terms of the credit
facility, borrowings are limited to 15% of the Fund’s total assets. Borrowings under this credit facility bear interest at 0.10% plus 1.25% plus the greater of the Federal Funds Rate or the Overnight Bank Funding Rate as in effect on that day.
For the year ended March 31, 2023, the Funds’ credit facility activity is as follows:
As of March 31, 2023, shareholders affiliated with the Funds and/or Advisers (other than other DoubleLine Funds) owned shares of the Funds as follows:
Investment activities of these shareholders could have a material affect on each Fund. See the description of Large Shareholder Risk in the following Principal Risks Note. For information on greater than 5% holders of certain Funds by other DoubleLine Funds, see Note 3 on Related and Other Party Transactions.
The Funds may invest in to-be-announced securities (“TBAs”). TBAs is a term that is generally used to describe forward-settling mortgage-backed securities. These TBAs are generally issued by U.S. Government Agencies or U.S. Government Sponsored Entities such as Freddie Mac, Fannie Mae and Ginnie Mae. The actual mortgage-backed security that will be delivered to the buyer at the time TBAs trades are entered is not known, however, the terms of the acceptable pools of loans that will comprise the mortgage- backed security are determined at the time the trade is entered into (coupon rate, maturity, credit quality, etc.). Investment in TBAs will generally increase the Fund’s exposure to interest rate risk and could also expose the Fund to counterparty default risk. In order to mitigate counterparty default risk, the Fund only enters TBAs with counterparties for which the risk of default is determined to be remote.
Below are summaries of some, but not all, of the principal risks of investing in one or more of the Funds, each of which could adversely affect a Fund’s NAV, yield and total return. Each risk listed below does not necessarily apply to each Fund, and you should read each Fund’s prospectus carefully for a description of the principal risks associated with investing in a particular Fund.
ICE Benchmark Administration, the administrator of LIBOR, ceased publication of most LIBOR settings on a representative basis at the end of 2021 and is expected to cease publication of a majority of the U.S. dollar LIBOR settings on a representative basis after June 30, 2023. There remains uncertainty regarding the future utilization of LIBOR and the nature of any replacement rate. As such, the potential effect of a transition away from LIBOR on a Fund or the financial instruments in which a Fund invests cannot yet be determined.
In June 2022, the FASB issued Accounting Standards Update 2022-03, which amends Fair Value Measurement (Topic 820): Fair Value Measurement of Equity Securities Subject to Contractual Sale Restrictions (“ASU 2022-03”). ASU 2022-03 clarifies guidance for fair value measurement of an equity security subject to a contractual sale restriction and establishes new disclosure requirements for such equity securities. ASU 2022-03 is effective for fiscal years beginning after December 15, 2023 and for interim periods within those fiscal years, with early adoption permitted. Management is currently evaluating the impact of these amendments on the Funds’ financial statements.
In preparing these financial statements, the Funds have evaluated events and transactions for potential recognition or disclosure through the date the financial statements were issued. The Funds have determined there are no subsequent events that would need to be disclosed in the Funds’ financial statements.
To the Board of Trustees of DoubleLine Funds Trust and Shareholders of each of the eighteen funds indicated in the table below
We have audited the accompanying statements of assets and liabilities, including the schedules of investments, of each of the funds indicated in the table below (eighteen of the funds constituting DoubleLine Funds Trust, hereafter collectively referred to as the “Funds”) as of March 31, 2023, the related statements of operations for the year ended March 31, 2023, the statements of changes in net assets for each of the two years in the period ended March 31, 2023, including the related notes, and the financial highlights for each of the periods indicated therein (collectively referred to as the “financial statements”). In our opinion, the financial statements present fairly, in all material respects, the financial position of each of the Funds as of March 31, 2023, the results of each of their operations for the year then ended, the changes in each of their net assets for each of the two years in the period ended March 31, 2023 and each of the financial highlights for each of the periods indicated therein, in conformity with accounting principles generally accepted in the United States of America.
These financial statements are the responsibility of the Fund’s management. Our responsibility is to express an opinion on the Funds’ financial statements based on our audits. We are a public accounting firm registered with the Public Company Accounting Oversight Board (United States) (PCAOB) and are required to be independent with respect to the Funds in accordance with the U.S. federal securities laws and the applicable rules and regulations of the Securities and Exchange Commission and the PCAOB.
We conducted our audits of these financial statements in accordance with the standards of the PCAOB. Those standards require that we plan and perform the audit to obtain reasonable assurance about whether the financial statements are free of material misstatement, whether due to error or fraud.
Our audits included performing procedures to assess the risks of material misstatement of the financial statements, whether due to error or fraud, and performing procedures that respond to those risks. Such procedures included examining, on a test basis,
evidence regarding the amounts and disclosures in the financial statements. Our audits also included evaluating the accounting principles used and significant estimates made by management, as well as evaluating the overall presentation of the financial statements. Our procedures included confirmation of securities owned as of March 31, 2023 by correspondence with the custodian and brokers; when replies were not received from brokers, we performed other auditing procedures. We believe that our audits provide a reasonable basis for our opinions.
We have served as the auditor of one or more investment companies in the DoubleLine Investment Company Complex since 2010.
PricewaterhouseCoopers LLP, 601 South Figueroa Street, Los Angeles, California 90017
As a shareholder of the Funds, you incur two basic types of costs: (1) transaction costs, including sales charges (loads) on purchase payments, reinvested dividends, or other distributions; redemption fees; and exchange fees; and (2) ongoing costs, including management fees; distribution (12b-1) fees and other Fund expenses.
This Example is intended to help you understand your ongoing costs (in dollars) of investing in each Fund and to compare these costs with the ongoing costs of investing in other mutual funds. The Example is based on an investment of $1,000 invested at the beginning of the period and held for the entire period October 1, 2022 through March 31, 2023. Expenses paid during the period are equal to the net annualized expense ratio for the class, multiplied by the average account value over the period, multiplied by 182/365 (to reflect the one-half year period).
The actual return columns in the following table provide information about account values based on actual returns and actual expenses. You may use the information in these columns, together with the amount you invested, to estimate the expenses that you paid over the period. Simply divide your account value by $1,000 (for example, an $8,600 account value divided by $1,000 = 8.6), then multiply the result by the number in the respective line under the heading entitled “Expenses Paid During Period” to estimate the expenses you paid on your account during this period. In addition to the expenses shown below in the table, as a shareholder you will be assessed fees for outgoing wire transfers, returned checks and stop payment orders at prevailing rates charged by the funds’ transfer agent, U.S. Bancorp Fund Services, LLC (doing business as U.S. Bank Global Fund Services). Currently, if you request a redemption be made by wire, a $15.00 fee is charged by the Fund’s transfer agent. You will be charged a redemption fee equal to 1.00% of the net amount of the redemption if you redeem shares that have been held for 90 days or less in the DoubleLine Floating Rate Fund. An Individual Retirement Account (“IRA”) will be charged a $15.00 annual maintenance fee. The transfer agent charges a transaction fee of $25.00 on returned checks and stop payment orders. If you paid a transaction fee, you would add the fee amount to the expenses paid on your account this period to obtain your total expenses paid.
The hypothetical return columns in the following table provide information about hypothetical account values and hypothetical expenses based on a Fund’s actual expense ratio and an assumed rate of return of 5% per year before expenses, which is not a Fund’s actual return. The hypothetical account values and expenses may not be used to estimate the actual ending account balance or expenses you paid for the period. You may use this information to compare the ongoing costs of investing in a Fund and other funds. To do so, compare this 5% hypothetical example with the 5% hypothetical examples that appear in the shareholder reports of the other funds. Please note that the expenses shown in the table are meant to highlight your ongoing costs only and do not reflect the transaction fees discussed above. Therefore, those columns are useful in comparing ongoing costs only, and will not help you determine the relative total costs of owning different funds. In addition, if these transactional costs were included, your costs would have been higher.
At a meeting held in February 2023 (the “February Meeting”), the Boards of Trustees (the “Board” or the “Trustees”) of the DoubleLine open-end mutual funds and closed-end funds listed above (the “Funds”) approved the continuation of the investment advisory and sub-advisory agreements (the “Advisory Agreements”) between DoubleLine and those Funds. That included approval by the Trustees who are not “interested persons” (as defined in the Investment Company Act of 1940, as amended (the “1940 Act”)) of the Funds (the “Independent Trustees”) voting separately. When used in this summary, “DoubleLine” or “Management” refers collectively to DoubleLine Capital LP and/or to DoubleLine Alternatives LP, as appropriate in the context.
The Trustees’ determination to approve the continuation of each Advisory Agreement was made on the basis of each Trustee’s business judgment after an evaluation of all of the relevant information provided to the Trustees, including information provided for their consideration at their February Meeting and at meetings held in preparation for the February Meeting with management and representatives of Strategic Insight, an independent third-party provider of investment company data (“Strategic Insight”), and additional information requested by the Independent Trustees. The Independent Trustees also met outside the presence of management prior to the February Meeting to consider the materials and information related to the proposed continuation of the Advisory Agreements.
The Trustees also meet regularly with investment advisory, compliance, risk management, operational, and other personnel from DoubleLine and regularly review detailed information, presented both orally and in writing, regarding the services performed by DoubleLine for the benefit of the Funds, DoubleLine’s investment program for each Fund, the performance of each Fund, the fees and expenses of each Fund, and the operations of each Fund. In considering whether to approve the continuation of the Advisory Agreements, the Trustees took into account information presented to them over the course of the past year.
This summary describes a number, but not necessarily all, of the most important factors considered by the Board and the Independent Trustees. Individual Trustees may have given different weights to certain factors and assigned various degrees of materiality to information received in connection with the approval process. No single factor was determined to be decisive or controlling. In all their deliberations, the Independent Trustees were advised by independent counsel.
The Trustees considered the nature, extent, and quality of the services, including the expertise and experience of investment personnel, provided and expected to be provided by DoubleLine to each Fund. In this regard, the Trustees considered that DoubleLine provides a full investment program for the Funds and noted DoubleLine’s representation that it seeks to provide attractive returns with a strong emphasis on risk management. The Board considered in particular the difficulty of managing debt-related portfolios, noting that managing such portfolios requires a portfolio management team to balance a number of factors,
which may include, among others, securities of varying maturities and durations, actual and anticipated interest rate changes and market volatility, prepayments, collateral management, counterparty management, pay-downs, credit events, workouts, and net new issuances. In their evaluation of the services provided by DoubleLine and the Funds’ contractual relationships with DoubleLine, the Trustees considered generally the long-term performance record of the firm’s portfolio management personnel, including, among others, Mr. Jeffrey Gundlach, and the strong historical investor interest in products managed by DoubleLine.
The Trustees reviewed reports prepared by Strategic Insight (the “Strategic Insight Reports”) that compared, among other information, each Fund’s net management fee rate and net total expense ratio (Class I shares with respect to the open-end Funds) against the net management fee rate and net total expense ratio of a group of peers selected by Strategic Insight, and each Fund’s performance records (Class I shares with respect to the open-end Funds) for the one-year, three-year (where applicable), and five-year (where applicable) periods ended October 31, 2022, against the performance records of those funds in each Fund’s Morningstar category and the performance of the Fund’s broad-based benchmark index. In preparation for the February Meeting, the Independent Trustees met with Strategic Insight representatives twice to review the comparative information set out in the Strategic Insight Reports, the methodologies used by Strategic Insight in compiling those reports and selecting the peer groups used within those reports, and the considerations for evaluating the comparative information presented in those reports. The Independent Trustees also considered the information Strategic Insight provided regarding the challenges Strategic Insight encountered in assembling appropriate peer groups for a number of the Funds due to, among other factors, the limited number of possible peer funds with substantially similar principal investment strategies, investment approaches and/or advisory fee structures for certain of the Funds. Where applicable, the Trustees also received information from DoubleLine, including regarding factors to consider in evaluating a Fund’s performance relative to its peer groups and the factors that contributed to the underperformance of certain Funds relative to their peer groups or benchmark indices.
With respect to DoubleLine Real Estate and Income Fund, the Trustees considered that the Fund has very few assets and that DoubleLine was receiving no management fee from the Fund but rather was subsidizing its expenses.
On the basis of all of these factors, the Trustees determined that the historical performance records of the Funds, and the factors cited by Management in respect of underperforming Funds, were consistent with the continuance of the Advisory Agreement(s) for each of the Funds
The Trustees considered the portion of the Strategic Insight Reports covering the open-end Funds’ net management fees and net total expenses relative to their expense peer groups. The Trustees considered DoubleLine’s pricing policy for its advisory fees and that DoubleLine does not seek to be a lowest cost provider, nor does it have a policy to set its advisory fees below the median of a Fund’s peers, but rather seeks to set fees at a competitive level that reflects DoubleLine’s demonstrated significant expertise and experience in the investment strategies that if offers.
On the basis of these considerations and others and in the exercise of their business judgment, the Trustees determined to approve the Agreements for the proposed additional one-year term.
As to DoubleLine Income Solutions Fund (“DSL”), the Trustees noted that the Fund’s net total expense ratio (excluding investment related expenses) was below the median of its expense peer group on both a net assets and a total managed assets basis and that its net management fee rate was above, though near, the median of its expense group on both a net assets and a total managed assets basis. The Trustees considered DoubleLine’s statement that, although the Fund has outperformed its benchmark index and a number of its peer funds over various periods in the past, the Fund’s recent underperformance due to the recent market volatility has had the effect of reducing the Fund’s average annual returns compared to peers and the benchmark over longer time periods. The Trustees considered DoubleLine’s description of the factors leading to the Fund’s substantial underperformance in recent periods, its confirmation that it has remained consistent in its approach to managing the Fund, and factors that lead DoubleLine to expect improved performance in coming periods.
As to DoubleLine Opportunistic Credit Fund (“DBL”), the Trustees noted that DBL’s net management fees were in the second quartile of the Fund’s expense group on a net assets basis and in the fourth quartile of the expense group on a total managed assets basis. The Trustees also noted that DBL’s net total expense ratio was shown in the Strategic Insight Report to be in the third quartile of the Fund’s expense group on a net assets basis and in the fourth quartile of the expense group on a total managed assets basis.
In no case were the Fund’s net management fees or net total expenses the highest among its peers. The Trustees considered DoubleLine’s statement that, although the Fund performed in the fourth quartile for the three- and five-year periods, the Fund’s performance improved for the one-year period, with the Fund performing in the third-quartile of its Morningstar peer group. The Trustees also noted that the Fund outperformed its benchmark index for the one-, three-, and five-year periods shown in the Strategic Insight Report. The Trustees considered DoubleLine’s description of the factors leading to the Fund’s substantial underperformance and factors that have led to the recent improvement of the Fund’s relative perfomance and to DoubleLine’s expectation that performance will continue to improve.
As to DoubleLine Yield Opportunities Fund (“DLY”), the Trustees noted that DLY was only relatively recently organized and that it has only a limited operating history. The Trustees noted that while the Fund performed in the fourth quartile for the one-year period of its Morningstar peer group, it outperformed its benchmark index for the one-year period shown in the Strategic Insight Report and for the life of the Fund. They considered the factors cited by DoubleLine for the Fund’s underperformance, including in particular the high level of volatility in fixed-income markets in the periods since the Fund’s organization. In considering the fees and expenses of the Fund, the Trustees took into account DoubleLine’s statement that the Fund’s terms at its initial offering differed from many closed-end funds that came to market before it in that DoubleLine, as the Fund’s sponsor, bore all of the Fund’s initial organizational and offering expenses and that the Fund has a limited life, and that funds offered pursuant to such arrangements tend to pay higher advisory fees than funds whose sponsors do not bear those organizational and offering expenses and the related risks. The Trustees considered that Strategic Insight had developed an expense group comprising Funds with similar fee and expense arrangements. The Trustees noted that the Fund’s net advisory fees, though above the median of its peers both on a net assets and a total managed assets basis, was not the highest of its expense group. The Trustees considered similarly that the Fund’s net total expense ratio was above the median of the Fund’s expense peer group on both a net assets and a total managed assets basis, though not the highest of its expense group.
The Trustees noted that each of DSL, DBL, and DLY had employed leverage during some or all of the periods shown in the Strategic Insight Reports, and considered information from DoubleLine that they receive quarterly showing that each Fund earned a positive spread on its investment leverage, after taking into account any expenses related to the leverage, including incremental management fees.
The Trustees considered information provided by DoubleLine relating to its historical and continuing commitment to hire the necessary personnel and to invest in technology enhancements to support DoubleLine’s ability to provide services to the Funds. The Trustees concluded that it appeared that DoubleLine continued to have sufficient quality and depth of personnel, resources, and investment methods to continue to provide services of the same nature and quality as DoubleLine has historically provided to the Funds.
generally are less extensive than those required of DoubleLine to serve the Funds, because, where DoubleLine serves as a sub-adviser, many of the sponsorship, operational, and compliance responsibilities related to the advisory function are retained by the primary adviser.
The Trustees reviewed information as to general estimates of DoubleLine’s profitability with respect to each Fund, taking into account, among other things, information about both the direct and the indirect benefits to DoubleLine from managing the Funds. The Trustees considered information provided by DoubleLine as to the methods it uses, and the assumptions it makes, in calculating its profitability. The Trustees considered representations from DoubleLine that its compensation program, which is comprised of several components, including base salary, discretionary bonus and potential equity participation in DoubleLine, enables DoubleLine to attract, retain, and motivate highly qualified and experienced employees. The Trustees noted that DoubleLine experienced significant profitability in respect of certain of the Funds, but noted that in those cases it would be appropriate to consider that profitability in light of various other considerations such as the nature, extent, and quality of the services provided by DoubleLine, the relative long-term performance of the relevant Funds, the consistency and transparency of the Funds’ investment operations over time, and the competitiveness of the management fees and total operating expenses of the Funds. The Trustees separately considered in this respect information provided by DoubleLine regarding its reinvestment in its business to accommodate changing regulatory requirements and to maintain its ability to provide high-quality services to the Funds.
In their evaluation of economies of scale, the Trustees considered, among other things, the pricing of the Funds and DoubleLine’s reported profitability, and that a number of the open-end Funds had achieved significant size. They noted also that none of the Funds has breakpoints in its advisory fee schedule, though the Trustees considered management’s view that the fee schedules for the Funds remained consistent with DoubleLine’s original pricing philosophy of proposing an initial management fee rate that generally, when taking into account expense limitations (where applicable), reflects reasonably foreseeable economies of scale. In this regard, the Trustees noted also that the information provided by Strategic Insight supported the view that the net management fees of the largest open-end Funds remained competitively priced. The Trustees separately noted that DoubleLine had agreed to continue in place the expense limitation arrangements for a number of the Funds at current levels for an additional one-year period, with the prospect of recouping any waived fees or reimbursed expenses at a later date. In evaluating economies of scale more generally, the Trustees also noted ongoing changes to the regulatory environment, which required DoubleLine to re-invest in its business and infrastructure. Based on these factors and others, the Trustees concluded that it was not necessary at the present time to implement breakpoints for any of the Funds, although they would continue to consider the question periodically in the future.
With regard to DSL, DBL, and DLY, the Trustees noted that these Funds have not increased in assets significantly from their initial offerings due principally to their status as closed-end investment companies and that there were therefore no substantial increases in economies of scale realized with respect to these Funds since their inception. The Trustees noted DoubleLine’s view that the levels of its profitability in respect of DSL, DBL, and DLY are appropriate in light of the investment it has made in these Funds, the quality of the investment management and other teams provided by it, and its continued investments in its own business.
On the basis of these considerations as well as others and in the exercise of their business judgment, the Trustees determined that they were satisfied with the nature, extent, and quality of the services provided to each Fund under its Advisory Agreement(s); that it appeared that the management fees paid by each Fund to DoubleLine were generally within the range of management fees paid by its peer funds, and generally reasonable in light of the services provided, the quality of the portfolio management teams, and each Fund’s performance to date; that the fees paid by each Fund did not appear inappropriate in light of the fee schedules charged to DoubleLine’s other clients with substantially similar investment strategies (where applicable) in light of the differences in the services provided and the risks borne by DoubleLine; that the profitability of each Fund to DoubleLine did not appear excessive or such as to preclude continuation of the Fund’s Advisory Agreement(s); that absence of breakpoints in any Fund’s management fee did not render that Fund’s fee unreasonable or inappropriate under the circumstances, although the Trustees would continue to consider the topic over time; and that it would be appropriate to approve each Advisory Agreement for an additional one-year period.
The Funds have adopted a liquidity risk management program. The program’s principal objectives include mitigating the risk that a Fund is unable to meet its redemption obligations timely and supporting each Fund’s compliance with its limits on investments in illiquid assets. For the fiscal year ended March 31, 2023, the program administrator determined that the program supported each Fund’s ability to meet reasonably foreseeable redemption requests, reduced the risk of significant dilution from redemptions and supported the Adviser’s management of each Fund’s liquidity profile. The program includes a number of elements that support the assessment and management of liquidity risk, including the periodic classification and re-classification of a Fund’s investments into groupings based on the Adviser’s view of their liquidity. There can be no assurance that the program will achieve its objectives. Please refer to your Fund’s prospectus for more information regarding the Fund’s exposure to liquidity risk and other risks to which an investment in the Fund may be subject.
For the fiscal year ended March 31, 2023, certain dividends paid by the Funds may be subject to a maximum tax rate of 15% (20% for taxpayers with taxable income greater than $459,750 for single individuals and $517,200 for married couples filing jointly), as provided for by the Jobs and Growth Tax Relief Reconciliation Act of 2003 and The Tax Cuts and Jobs Act of 2017. The percentage of dividends declared from ordinary income designated as qualified dividend income was as follows:
For corporate shareholders, the percent of ordinary income distributions qualifying for the corporate dividends received deduction for the fiscal year ended March 31, 2023 was as follows:
The percentage of taxable ordinary income distributions that are designated as short-term capital gain distributions under Internal Revenue Section 871(k)(2)(c) for the fiscal year ended March 31, 2023 for each Fund was as follows:
The percentage of taxable ordinary income distributions that are designated as interest related dividends under Internal Revenue Section 871(k)(1)(c) for the fiscal year ended March 31, 2023 for each Fund was as follows:
For the fiscal year ended March 31, 2023, each Fund earned foreign source income and paid foreign taxes, which each intend to pass through to its shareholders pursuant to Section 853 of the Internal Revenue Code as follows:
Shareholders are advised to consult their own tax adviser with respect to the tax consequences of their investment in the Funds.
Each of the following Trustees is an interested person of the Trust as defined in the 1940 Act because they are officers of the Adviser and hold direct or indirect ownership interests in DoubleLine Capital LP and DoubleLine Alternatives LP. Additionally, Mr. Redell is an officer of the Trust.
Information about how a Fund voted proxies relating to portfolio securities held during the most recent twelve month period ended June 30th is available no later than the following August 31st without charge, upon request, by calling 877-DLine11 (877-354-6311) and on the SEC’s website at www.sec.gov.
A description of the Funds’ proxy voting policies and procedures is available (i) without charge, upon request, by calling 877-DLine11 (877-354-6311); and (ii) on the SEC’s website at www.sec.gov.
It is the policy of the Trust to provide certain unaudited information regarding the portfolio composition of the Funds as of each month-end to shareholders and others upon request to the Funds, beginning on the 15th calendar day after the end of the month (or, if not a business day, the next business day thereafter).
Shareholders and others who wish to obtain portfolio holdings for a particular month may make a request by contacting the Funds at no charge at 877-DLine11 (877-354-6311) between the hours of 7:00 a.m. and 5:00 p.m. Pacific time, Monday through Friday, beginning on the 15th day following the end of that month (or, if not a business day, the next business day thereafter). Requests for portfolio holdings may be made on a monthly basis pursuant to this procedure, or standing requests for portfolio holdings may be accepted.
The Trust is required to file its complete schedule of portfolio holdings with the SEC for its first and third fiscal quarters on Part F of Form N-PORT. When available, Part F of Form N-PORT is available on the SEC website at www.sec.gov.
This report includes summary Schedules of Investments for the DoubleLine Total Return Bond Fund, DoubleLine Core Fixed Income Fund, DoubleLine Shiller Enhanced CAPE® and DoubleLine Flexible Income Fund. A complete Schedule of Investments for each Fund may be obtained, without charge, upon request, by calling 877-DLine11 (877-354-6311) and on the SEC website at www.sec.gov.
In an effort to conserve resources, the Funds intend to reduce the number of duplicate Prospectuses and Annual and Semi-Annual Reports you receive by sending only one copy of each to addresses where we reasonably believe two or more accounts are from the same family. If you would like to discontinue householding of your accounts, please call toll-free 877-DLine11 (877-354-6311) to request individual copies of these documents. We will begin sending individual copies thirty days after receiving your request to stop householding.
This notice provides information about how DoubleLine (“we,” “our” and “us”) collects, discloses, and protects your personal information, and how you might choose to limit our ability to disclose certain information about you. Please read this notice carefully.
All financial companies need to disclose customers’ personal information to run their everyday businesses, to appropriately tailor the services offered (where applicable), and to comply with our regulatory obligations. Accordingly, information, confidential and proprietary, plays an important role in the success of our business. However, we recognize that you have entrusted us with your personal and financial data, and we recognize our obligation to keep this information secure. Maintaining your privacy is important to us, and we hold ourselves to a high standard in its safekeeping and use. Most importantly, DoubleLine does not sell its customers’ non-public personal information to any third parties. DoubleLine uses its customers’ non-public personal information primarily to complete financial transactions that its customers request (where applicable), to make its customers aware of other financial products and services offered by a DoubleLine affiliated company, and to satisfy obligations we owe to regulatory bodies.
Websites maintained by DoubleLine or its service providers may use a variety of technologies to collect information that help DoubleLine and its service providers understand how the website is used. Information collected from your web browser (including small files stored on your device that are commonly referred to as “cookies”) allow the websites to recognize your web browser and help to personalize and improve your user experience and enhance navigation of the website. You can change your cookie preferences by changing the setting on your web browser to delete or reject cookies. If you delete or reject cookies, some website pages may not function properly. Our websites may contain links that are maintained or controlled by third parties with privacy policies that may differ, in some cases significantly, from the privacy policies described in this notice. Please read the privacy policies of such third parties and understand that accessing their websites is at your own risk. Please contact your DoubleLine representative if you would like to receive more information about the privacy policies of third parties.
We also use web analytics services, which currently include but are not limited to Google Analytics and Adobe Analytics. Such web analytics services use cookies and similar technologies to evaluate visitor’s use of the domain, compile statistical reports on domain activity, and provide other services related to our websites. For more information about Google Analytics, or to opt out of Google Analytics, please go to https://tools.google.com/dlpage/gaoptout. For more information about Adobe Analytics, or to opt out of Adobe Analytics, please go to: http://www.adobe.com/privacy/opt-out.html.
We will limit access to your personal account information to those agents and vendors who need to know that information to provide products and services to you. We do not share your information to nonaffiliated third parties for marketing purposes. We maintain physical, electronic, and procedural safeguards to guard your non-public personal information.
DoubleLine collects and uses information that identifies, describes, references, links or relates to, or is associated with, a particular consumer or device (“Personal Information”). Personal Information we collect from our customers and consumers is covered under the Gramm-Leach-Bliley Act (“GLBA”) and is therefore excluded from the scope of the California Consumer Privacy Act, as amended by the California Privacy Rights Act (together, “CCPA”).
However, for California residents who are not DoubleLine customers or consumers, as those terms are defined by GLBA, the personal information we collect about you is subject to the CCPA. As such, you have privacy rights with respect to your personal information. Please review the following applicable California privacy notice that is available at https://www.doubleline.com, or by contacting us at Privacy@DoubleLine.com or at 1 (800) 285-1545.
CA Privacy Notice for Website Visitors, Media Subscribers and Business Representatives
If you reside in the EEA, we may transfer your personal information outside the EEA, and will ensure that it is protected and transferred in a manner consistent with legal requirements applicable to the information. This can be done in a number of different ways, for instance:
In other circumstances, the law may permit us to otherwise transfer your personal information outside the EEA. In all cases, however, any transfer of your personal information will be compliant with applicable data protection law.
If you are a natural person, please review this notice as it applies to you directly. If you are a legal representative of a corporate or entity investor that provides us with any personal information about individuals (i.e., natural persons), you agree to furnish a copy of this notice to each such individual or otherwise advise them of its content.
Any international transfer of personal information will be compliant with the requirements of the Data Protection Act, 2017 of the Cayman Islands.
DoubleLine is concerned about the privacy of children. Our website and our services are not targeted at individuals under 18 years of age, and we do not knowingly collect any personal information from an individual under 18. If we learn that a child under the
age of 13 (or such higher age as required by applicable law) has submitted personally identifiable information online without parental consent, we will take all reasonable measures to delete such information from its databases and to not use such information for any purpose (except where necessary to protect the safety of the child or others as required or allowed by law). If you become aware of any personally identifiable information, we have collected from children under 13 (or such higher age as required by applicable law), please contact us at Privacy@DoubleLine.com or at 1 (800) 285-1545. We do not sell or share any personal information and have no actual knowledge about selling or sharing personal information of individuals under the age of 16.
We will undertake commercially reasonable efforts to protect the personal information that we hold with appropriate security measures.
Depending on your country of domicile or applicable law, you may have the following rights in respect of the personal information about you that we process:
Although you have the right to request that your personal information be deleted at any time, applicable laws or regulatory requirements may prohibit us from doing so. In addition, if you invest in a DoubleLine fund through a financial intermediary, DoubleLine may not have access to personal information about you.
If you wish to exercise any of the rights set out above, please contact us at Privacy@DoubleLine.com or at 1 (800) 285-1545.
DoubleLine reserves the right to modify its privacy policy at any time, but in the event that there is a change that affects the content of this notice materially, DoubleLine will promptly inform its customers of such changes in accordance with applicable law.
U.S. Bancorp Fund Services, LLC
P.O. Box 701
U.S. Bank, N.A.
(b) Not applicable.
The Registrant has adopted a code of ethics that applies to the Registrant’s principal executive officer and principal financial officer. The Registrant has not made any substantive amendments to its code of ethics during the period covered by this report. The Registrant has not granted any waivers from any provisions of the code of ethics during the period covered by this report. A copy of the Registrant’s Code of Ethics is filed herewith.
The Registrant’s board of trustees has determined that there is at least one audit committee financial expert serving on its audit committee. Raymond B. Woolson is the “audit committee financial expert” and is considered to be “independent” as each term is defined in Item 3 of Form N-CSR.
The Registrant has engaged its principal accountant to perform audit services, audit-related services, tax services and other services during the past two fiscal years. “Audit services” refer to performing an audit of the Registrant’s annual financial statements or services that are normally provided by the accountant in connection with statutory and regulatory filings or engagements for those fiscal years. “Audit-related services” refer to the assurance and related services by the principal accountant that are reasonably related to the performance of the audit. “Tax services” refer to professional services rendered by the principal accountant for tax compliance, tax advice, and tax planning. There were no “Other services” provided by the principal accountant. The following table details the aggregate fees billed or expected to be billed for each of the last two fiscal years for audit fees, audit-related fees, tax fees and other fees by the principal accountant.
(f) All of the principal accountant’s hours spent on auditing the Registrant’s financial statements were attributed to work performed by full-time permanent employees of the principal accountant.
(h) The audit committee of the board of trustees/directors has considered whether the provision of non-audit services that were rendered to the Registrant’s investment adviser is compatible with maintaining the principal accountant’s independence and has concluded that the provision of such non-audit services by the accountant has not compromised the accountant’s independence.
(i) The Registrant has not been identified by the U.S. Securities and Exchange Commission as having filed an annual report issued by a registered public accounting firm branch or office that is located in a foreign jurisdiction where the Public Company Accounting Oversight Board is unable to inspect or completely investigate because of a position taken by an authority in that jurisdiction.
(j) The Registrant is not a foreign issuer.
Please note that the Registrant has included a summary schedule of portfolio securities of the DoubleLine Total Return Bond Fund, DoubleLine Core Fixed Income Fund, DoubleLine Shiller Enhanced CAPE, and DoubleLine Flexible Income Fund in its annual report to shareholders, a copy of which is included under Item 1, for this reporting period. The DoubleLine Total Return Bond Fund’s, DoubleLine Core Fixed Income Fund’s, DoubleLine Shiller Enhanced CAPE’s, and DoubleLine Flexible Income Fund’s complete schedule of investments in securities of unaffiliated issuers as of the close of this period as set forth in Section 210.12-12 of Regulation S-X is set forth below:
| | | | | | | | | | | | | | |
Principal Amount $/Shares | | Security Description | | Rate | | | Maturity | | | Value $ | |
Asset Backed Obligations - 4.6% | |
3,596,243 | | AASET Ltd., Series 2018-1A-B | | | 5.44 | % (b)(h) | | | 01/16/2038 | | | | 1,932,312 | |
12,939,019 | | AASET Ltd., Series 2020-1A-A | | | 3.35 | % (h) | | | 01/16/2040 | | | | 10,696,208 | |
12,950,000 | | Aligned Data Centers Issuer LLC, Series 2021-1A-A2 | | | 1.94 | % (h) | | | 08/15/2046 | | | | 11,443,300 | |
11,550,000 | | Aligned Data Centers Issuer LLC, Series 2021-1A-B | | | 2.48 | % (h) | | | 08/15/2046 | | | | 10,012,292 | |
2,097,609 | | Aqua Finance Trust, Series 2017-A-A | | | 3.72 | % (h) | | | 11/15/2035 | | | | 2,072,126 | |
21,285,000 | | Bojangles Issuer LLC, Series 2020-1A-A2 | | | 3.83 | % (h) | | | 10/20/2050 | | | | 19,468,855 | |
3,037,906 | | Business Jet Securities LLC, Series 2020-1A-A | | | 2.98 | % (h) | | | 11/15/2035 | | | | 2,886,214 | |
9,812,500 | | Cajun Global LLC, Series 2021-1-A2 | | | 3.93 | % (h) | | | 11/20/2051 | | | | 8,456,336 | |
13,718,250 | | CAL Funding Ltd., Series 2020-1A-A | | | 2.22 | % (h) | | | 09/25/2045 | | | | 12,199,844 | |
15,000,000 | | CANON, Series 2021-0001 | | | 3.50 | % (b) | | | 11/05/2023 | | | | 14,925,000 | |
20,064,605 | | Carbon Level Mitigation Trust, Series 2021-3-CERT | | | 2.01 | % (a)(h) | | | 09/08/2051 | | | | 15,857,218 | |
12,508,841 | | Castlelake Aircraft Structured Trust, Series 2017-1R-A | | | 2.74 | % (h) | | | 08/15/2041 | | | | 11,297,435 | |
12,976,250 | | CLI Funding LLC, Series 2020-1A-A | | | 2.08 | % (h) | | | 09/18/2045 | | | | 11,454,975 | |
33,086,347 | | CLMTE, Series 2022-3 | | | 0.23 | % (h) | | | 11/21/2052 | | | | 24,071,508 | |
12,059,288 | | Coinstar Funding LLC, Series 2017-1A-A2 | | | 5.22 | % (h) | | | 04/25/2047 | | | | 9,289,548 | |
2,572,743 | | Commonbond Student Loan Trust, Series 2016-A-A1 | | | 3.32 | % (h) | | | 05/25/2040 | | | | 2,430,133 | |
4,129,132 | | Credit Suisse ABS Trust, Series 2020-AT1-A | | | 2.61 | % (h) | | | 10/15/2026 | | | | 4,017,546 | |
39,300,000 | | DataBank Issuer, Series 2021-1A-A2 | | | 2.06 | % (h) | | | 02/27/2051 | | | | 34,929,329 | |
31,000,000 | | DataBank Issuer, Series 2021-2A-A2 | | | 2.40 | % (h) | | | 10/25/2051 | | | | 27,026,730 | |
3,350,000 | | DataBank Issuer, Series 2021-2A-B | | | 2.79 | % (h) | | | 10/25/2051 | | | | 2,890,413 | |
28,390,625 | | DB Master Finance LLC, Series 2021-1A-A23 | | | 2.79 | % (h) | | | 11/20/2051 | | | | 23,008,648 | |
6,000,000 | | Diamond Issuer, Series 2021-1A-B | | | 2.70 | % (h) | | | 11/20/2051 | | | | 5,048,792 | |
17,945,304 | | Dividend Solar Loans LLC, Series 2019-1-A | | | 3.67 | % (h) | | | 08/22/2039 | | | | 16,222,289 | |
29,593,478 | | ECAF Ltd., Series 2015-1A-A2 | | | 4.95 | % (h) | | | 06/15/2040 | | | | 19,247,569 | |
2,321,111 | | Falcon Aerospace Ltd., Series 2017-1-A | | | 4.58 | % (h) | | | 02/15/2042 | | | | 2,044,351 | |
1,864,706 | | Foundation Finance Trust, Series 2019-1A-A | | | 3.86 | % (h) | | | 11/15/2034 | | | | 1,831,402 | |
10,366,921 | | GAIA Aviation Ltd., Series 2019-1-A | | | 3.97 | % (h)(k) | | | 12/15/2044 | | | | 8,743,918 | |
24,105,776 | | Global SC Finance SRL, Series 2020-1A-A | | | 2.17 | % (h) | | | 10/17/2040 | | | | 21,893,379 | |
2,262,738 | | HERO Funding Trust, Series 2016-3A-A2 | | | 3.91 | % (h) | | | 09/20/2042 | | | | 2,145,551 | |
5,984,705 | | HERO Funding Trust, Series 2016-4A-A2 | | | 4.29 | % (h) | | | 09/20/2047 | | | | 5,745,081 | |
14,150,479 | | Horizon Aircraft Finance Ltd., Series 2019-1-A | | | 3.72 | % (h) | | | 07/15/2039 | | | | 12,008,351 | |
37,240,000 | | Jack in the Box Funding LLC, Series 2019-1A-A23 | | | 4.97 | % (h) | | | 08/25/2049 | | | | 33,996,344 | |
5,508,375 | | Jersey Mike’s Funding, Series 2019-1A-A2 | | | 4.43 | % (h) | | | 02/15/2050 | | | | 5,134,378 | |
20,812,000 | | Jimmy Johns Funding LLC, Series 2017-1A-A2II | | | 4.85 | % (h) | | | 07/30/2047 | | | | 19,553,607 | |
8,798,013 | | JOL Air Ltd., Series 2019-1-A | | | 3.97 | % (h) | | | 04/15/2044 | | | | 7,402,551 | |
57,592,803 | | Labrador Aviation Finance Ltd., Series 2016-1A-A1 | | | 4.30 | % (h) | | | 01/15/2042 | | | | 47,306,325 | |
1,583,754 | | Loanpal Solar Loan Ltd., Series 2021-1GS-B | | | 2.84 | % (h) | | | 01/20/2048 | | | | 1,196,527 | |
12,538,765 | | Lunar Aircraft Ltd., Series 2020-1A-A | | | 3.38 | % (h) | | | 02/15/2045 | | | | 10,875,047 | |
1,123,100 | | Lunar Structured Aircraft Portfolio Notes, Series 2021-1-B | | | 3.43 | % (h) | | | 10/15/2046 | | | | 938,944 | |
33,020,775 | | ME Funding LLC, Series 2019-1-A2 | | | 6.45 | % (h) | | | 07/30/2049 | | | | 32,393,595 | |
13,599,582 | | Mosaic Solar Loan Trust, Series 2017-2A-A | | | 3.82 | % (h) | | | 06/22/2043 | | | | 12,645,600 | |
8,122,100 | | Mosaic Solar Loan Trust, Series 2018-1A-A | | | 4.01 | % (h) | | | 06/22/2043 | | | | 7,611,283 | |
10,571,401 | | Mosaic Solar Loan Trust, Series 2018-2GS-A | | | 4.20 | % (h) | | | 02/22/2044 | | | | 9,865,094 | |
1,759,933 | | Mosaic Solar Loan Trust, Series 2019-1A-A | | | 4.37 | % (h) | | | 12/21/2043 | | | | 1,659,125 | |
23,000,000 | | Navient Private Education Loan Trust, Series 2017-A-B | | | 3.91 | % (h) | | | 12/16/2058 | | | | 21,780,547 | |
11,000,000 | | Navient Private Education Loan Trust, Series 2018-BA-B | | | 4.13 | % (h) | | | 12/15/2059 | | | | 10,035,578 | |
11,868,303 | | Navigator Aircraft Ltd., Series 2021-1-B | | | 3.57 | % (h)(k) | | | 11/15/2046 | | | | 9,914,804 | |
14,491,875 | | Neighborly Issuer LLC, Series 2021-1A-A2 | | | 3.58 | % (h) | | | 04/30/2051 | | | | 12,368,788 | |
3,819,751 | | Oxford Finance Funding LLC, Series 2019-1A-A2 | | | 4.46 | % (h) | | | 02/15/2027 | | | | 3,794,695 | |
35,104,992 | | Pioneer Aircraft Finance Ltd., Series 2019-1-A | | | 3.97 | % (h) | | | 06/15/2044 | | | | 30,571,112 | |
12,529,125 | | Primrose Funding LLC, Series 2019-1A-A2 | | | 4.48 | % (h) | | | 07/30/2049 | | | | 11,790,860 | |
29,581,274 | | Project Silver, Series 2019-1-A | | | 3.97 | % (h) | | | 07/15/2044 | | | | 25,222,473 | |
168,817 | | Prosper Pass-Thru Trust, Series 2019-ST1-A | | | 4.50 | % (h) | | | 07/15/2025 | | | | 169,132 | |
30,632,333 | | Purewest Funding LLC, Series 2021-1-A1 | | | 4.09 | % (h) | | | 12/22/2036 | | | | 29,254,810 | |
14,114,446 | | Raptor Aircraft Finance LLC, Series 2019-1-A | | | 4.21 | % (h) | | | 08/23/2044 | | | | 11,413,519 | |
37,913,988 | | Regional Ltd., Series 2021-1A-A | | | 5.75 | % | | | 04/15/2041 | | | | 34,035,463 | |
7,442,050 | | Renew, Series 2017-2A-A | | | 3.22 | % (h) | | | 09/22/2053 | | | | 6,378,367 | |
36,846,202 | | Research-Driven Pagaya Motor Asset Trust, Series 2021-2A-A | | | 2.65 | % (h) | | | 03/25/2030 | | | | 32,783,909 | |
36,515,965 | | Sapphire Aviation Finance Ltd., Series 2020-1A-A | | | 3.23 | % (h) | | | 03/15/2040 | | | | 30,240,660 | |
9,351,338 | | Sapphire Aviation Finance Ltd., Series 2020-1A-B | | | 4.34 | % (h) | | | 03/15/2040 | | | | 6,497,114 | |
17,705,625 | | SEB Funding LLC, Series 2021-1A-A2 | | | 4.97 | % (h) | | | 01/30/2052 | | | | 15,552,734 | |
4,076,800 | | ServiceMaster Funding LLC, Series 2020-1-A2II | | | 3.34 | % (h) | | | 01/30/2051 | | | | 3,234,605 | |
20,622,318 | | Shenton Aircraft Investment Ltd., Series 2015-1A-A | | | 4.75 | % (h) | | | 10/15/2042 | | | | 16,933,068 | |
2,571,075 | | Sierra Timeshare Receivables Funding LLC, Series 2021-2A-C | | | 1.95 | % (h) | | | 09/20/2038 | | | | 2,327,127 | |
3,085,290 | | Sierra Timeshare Receivables Funding LLC, Series 2021-2A-D | | | 3.23 | % (h) | | | 09/20/2038 | | | | 2,789,408 | |
5,313,041 | | SLM Private Credit Student Loan Trust, Series 2006-A-A5 (3 Month LIBOR USD + 0.29%) | | | 5.16 | % | | | 06/15/2039 | | | | 4,945,253 | |
4,111,384 | | SLM Private Credit Student Loan Trust, Series 2006-B-A5 (3 Month LIBOR USD + 0.27%) | | | 5.14 | % | | | 12/15/2039 | | | | 3,810,348 | |
49,354,029 | | SoFi Alternative Consumer Loan Program, Series 2021-2-A | | | 1.25 | % (h) | | | 08/15/2030 | | | | 47,053,539 | |
500,000 | | SoFi Alternative Consumer Loan Program, Series 2021-2-R1 | | | 0.00 | % (b)(h)(i) | | | 08/15/2030 | | | | 10,102,557 | |
13,196,524 | | SoFi Alternative Trust, Series 2021-1-PT2 | �� | | 9.72 | % (a)(h) | | | 05/25/2030 | | | | 12,996,293 | |
54,655,798 | | SoFi Alternative Trust, Series 2021-3-A | | | 1.50 | % (h) | | | 11/15/2030 | | | | 51,968,809 | |
950,000 | | SoFi Alternative Trust, Series 2021-3-R1 | | | 0.00 | % (b)(h)(i) | | | 11/15/2030 | | | | 24,125,927 | |
20,000,000 | | SoFi Professional Loan Program LLC, Series 2017-E-B | | | 3.49 | % (h) | | | 11/26/2040 | | | | 19,110,280 | |
13,000,000 | | SoFi Professional Loan Program LLC, Series 2017-E-C | | | 4.16 | % (h) | | | 11/26/2040 | | | | 11,707,901 | |
22,800,000 | | SoFi Professional Loan Program LLC, Series 2018-A-B | | | 3.61 | % (h) | | | 02/25/2042 | | | | 20,729,172 | |
18,000,000 | | SoFi Professional Loan Program Trust, Series 2018-B-BFX | | | 3.83 | % (h) | | | 08/25/2047 | | | | 16,360,646 | |
22,014,944 | | Sprite Ltd., Series 2021-1-A | | | 3.75 | % (h) | | | 11/15/2046 | | | | 19,910,998 | |
5,750,000 | | Stack Infrastructure Issuer LLC, Series 2020-1A-A2 | | | 1.89 | % (h) | | | 08/25/2045 | | | | 5,261,665 | |
16,796,966 | | Start Ltd., Series 2018-1-A | | | 4.09 | % (h) | | | 05/15/2043 | | | | 14,615,695 | |
3,872,506 | | Stonepeak ABS, Series 2021-1A-A | | | 2.68 | % (h) | | | 02/28/2033 | | | | 3,509,892 | |
7,324,871 | | Stonepeak ABS, Series 2021-1A-B | | | 3.82 | % (h) | | | 02/28/2033 | | | | 6,572,717 | |
38,974,185 | | Sunbird Engine Finance LLC, Series 2020-1A-A | | | 3.67 | % (h) | | | 02/15/2045 | | | | 34,279,004 | |
12,611,460 | | Sunnova Helios Issuer LLC, Series 2018-1A-A | | | 4.87 | % (h) | | | 07/20/2048 | | | | 11,532,013 | |
12,257,581 | | Sunnova Helios Issuer LLC, Series 2019-AA-A | | | 3.75 | % (h) | | | 06/20/2046 | | | | 10,951,645 | |
12,972,652 | | Sunnova Helios Issuer LLC, Series 2021-C-B | | | 2.33 | % (h) | | | 10/20/2048 | | | | 10,546,796 | |
29,471,835 | | Sunnova Helios Sol Issuer LLC, Series 2020-2A-A | | | 2.73 | % (h) | | | 11/01/2055 | | | | 23,153,981 | |
7,455,625 | | Taco Bell Funding LLC, Series 2021-1A-A23 | | | 2.54 | % (h) | | | 08/25/2051 | | | | 5,893,399 | |
5,233,750 | | Taco Bell Funding LLC, Series 2021-1A-A2I | | | 1.95 | % (h) | | | 08/25/2051 | | | | 4,567,251 | |
14,750,000 | | TAL Advantage LLC, Series 2020-1A-A | | | 2.05 | % (h) | | | 09/20/2045 | | | | 13,178,873 | |
3,134,375 | | TAL Advantage LLC, Series 2020-1A-B | | | 3.29 | % (h) | | | 09/20/2045 | | | | 2,777,296 | |
9,289,723 | | Textainer Marine Containers Ltd., Series 2020-1A-A | | | 2.73 | % (h) | | | 08/21/2045 | | | | 8,570,434 | |
8,161,675 | | Textainer Marine Containers Ltd., Series 2020-2A-A | | | 2.10 | % (h) | | | 09/20/2045 | | | | 7,268,806 | |
2,658,798 | | Textainer Marine Containers Ltd., Series 2020-2A-B | | | 3.34 | % (h) | | | 09/20/2045 | | | | 2,335,268 | |
22,706,667 | | Textainer Marine Containers Ltd., Series 2021-3A-A | | | 1.94 | % (h) | | | 08/20/2046 | | | | 19,143,443 | |
4,211,296 | | Upgrade Master Credit Pass-Thru Trust, Series 2021-PT1-A | | | 25.41 | % (a)(h) | | | 08/15/2027 | | | | 3,385,873 | |
189,926 | | Upgrade Master Pass-Thru Trust, Series 2019-ST2-A | | | 3.90 | % (h) | | | 09/15/2025 | | | | 189,824 | |
7,206,618 | | Upgrade Master Pass-Thru Trust, Series 2021-PT1-A | | | 15.69 | % (a)(h) | | | 04/15/2027 | | | | 7,028,096 | |
6,155,802 | | Upgrade Master Pass-Thru Trust, Series 2021-PT3-A | | | 14.42 | % (a)(h) | | | 07/15/2027 | | | | 5,963,483 | |
3,680,481 | | Upgrade Master Pass-Thru Trust, Series 2021-PT4-A | | | 10.51 | % (a)(h) | | | 08/15/2027 | | | | 3,539,239 | |
10,612,898 | | Upgrade Master Pass-Thru Trust, Series 2021-PT5-A | | | 15.91 | % (a)(h) | | | 10/15/2027 | | | | 10,339,659 | |
6,719,536 | | Upstart Pass-Through Trust, Series 2020-ST5-A | | | 3.00 | % (h) | | | 12/20/2026 | | | | 6,436,436 | |
5,595,889 | | Upstart Pass-Through Trust, Series 2021-ST1-A | | | 2.75 | % (h) | | | 02/20/2027 | | | | 5,346,754 | |
2,937,366 | | Upstart Securitization Trust, Series 2020-2-A | | | 2.31 | % (h) | | | 11/20/2030 | | | | 2,874,436 | |
3,712,084 | | Upstart Securitization Trust, Series 2021-3-A | | | 0.83 | % (h) | | | 07/20/2031 | | | | 3,652,416 | |
10,000,000 | | Upstart Securitization Trust, Series 2021-3-B | | | 1.66 | % (h) | | | 07/20/2031 | | | | 9,521,223 | |
7,500,000 | | Upstart Securitization Trust, Series 2021-3-C | | | 3.28 | % (h) | | | 07/20/2031 | | | | 6,624,973 | |
32,425,000 | | Vantage Data Centers LLC, Series 2020-2A-A2 | | | 1.99 | % (h) | | | 09/15/2045 | | | | 27,506,598 | |
54,400,000 | | Vault DI Issuer LLC, Series 2021-1A-A2 | | | 2.80 | % (h) | | | 07/15/2046 | | | | 46,820,051 | |
17,158,948 | | Vivint Solar Financing LLC, Series 2018-1A-A | | | 4.73 | % (h) | | | 04/30/2048 | | | | 15,571,450 | |
16,918,959 | | VR Funding LLC, Series 2020-1A-A | | | 2.79 | % (h) | | | 11/15/2050 | | | | 14,520,015 | |
11,480,386 | | Waterfall Commercial Mortgage Trust, Series 2015-SBC5-A | | | 4.10 | % (a)(h) | | | 01/14/2026 | | | | 11,296,940 | |
19,057,500 | | Wendy’s Funding LLC, Series 2019-1A-A2II | | | 4.08 | % (h) | | | 06/15/2049 | | | | 17,442,895 | |
44,340,695 | | Willis Engine Structured Trust, Series 2020-A-A | | | 3.23 | % (h) | | | 03/15/2045 | | | | 32,550,947 | |
10,368,750 | | Wingstop Funding LLC, Series 2020-1A-A2 | | | 2.84 | % (h) | | | 12/05/2050 | | | | 9,130,807 | |
10,100,554 | | Zephyrus Capital Aviation Partners Ltd., Series 2018-1-A | | | 4.61 | % (h) | | | 10/15/2038 | | | | 8,574,916 | |
| | | | | | | | | | | | | | |
Total Asset Backed Obligations (Cost $1,735,003,548) | | | | | | | | | | | 1,538,260,778 | |
| | | | | | | | | | | | | | |
Collateralized Loan Obligations - 3.3% | |
2,000,000 | | Anchorage Capital Ltd., Series 2014-3RA-B (3 Month LIBOR USD + 1.50%) | | | 6.30 | % (h) | | | 01/28/2031 | | | | 1,931,120 | |
20,000,000 | | Anchorage Capital Ltd., Series 2018-10A-A1A (3 Month LIBOR USD + 1.20%, 1.20% Floor) | | | 5.99 | % (h) | | | 10/15/2031 | | | | 19,785,334 | |
3,000,000 | | Apidos, Series 2013-12A-CR (3 Month LIBOR USD + 1.80%) | | | 6.59 | % (h) | | | 04/15/2031 | | | | 2,882,671 | |
5,000,000 | | BlueMountain Ltd., Series 2018-2A-B (3 Month LIBOR USD + 1.70%, 1.70% Floor) | | | 6.56 | % (h) | | | 08/15/2031 | | | | 4,828,316 | |
16,500,000 | | Capital Four Ltd., Series 2021-1A-A (3 Month LIBOR USD + 1.21%, 1.21% Floor) | | | 6.00 | % (h) | | | 01/18/2035 | | | | 16,053,587 | |
18,500,000 | | Carlyle Global Market Strategies Ltd., Series 2022-2A-A2 (Secured Overnight Financing Rate 3 Month + 2.00%, 2.00% Floor) | | | 6.64 | % (h) | | | 04/20/2035 | | | | 17,812,407 | |
10,000,000 | | Cathedral Lake Ltd., Series 2021-8A-A1 (3 Month LIBOR USD + 1.22%, 1.22% Floor) | | | 6.03 | % (h) | | | 01/20/2035 | | | | 9,758,579 | |
11,500,000 | | CIFC Funding Ltd., Series 2022-3A-B (Secured Overnight Financing Rate 3 Month + 2.00%, 2.00% Floor) | | | 6.65 | % (h) | | | 04/21/2035 | | | | 11,133,934 | |
3,500,000 | | Dryden Ltd., Series 2017-53A-B (3 Month LIBOR USD + 1.40%) | | | 6.19 | % (h) | | | 01/15/2031 | | | | 3,424,732 | |
25,500,000 | | Elevation Ltd., Series 2018-9A-A1 (3 Month LIBOR USD + 1.12%, 1.12% Floor) | | | 5.91 | % (h) | | | 07/15/2031 | | | | 25,127,213 | |
13,000,000 | | Franklin Park Place LLC, Series 2022-1A-A (Secured Overnight Financing Rate 3 Month + 1.40%, 1.40% Floor) | | | 6.06 | % (h) | | | 04/14/2035 | | | | 12,748,176 | |
58,370,000 | | Greywolf Ltd., Series 2018-1A-A1 (Secured Overnight Financing Rate 3 Month + 1.29%) | | | 5.96 | % (h) | | | 04/26/2031 | | | | 57,761,989 | |
2,033,689 | | Halcyon Loan Advisors Funding Ltd., Series 2014-2A-D (3 Month LIBOR USD + 5.00%) | | | 9.80 | % (b)(h) | | | 04/28/2025 | | | | 485,961 | |
5,000,777 | | Halcyon Loan Advisors Funding Ltd., Series 2014-3A-D (3 Month LIBOR USD + 3.65%) | | | 8.47 | % (h) | | | 10/22/2025 | | | | 4,853,792 | |
13,000,000 | | Halsey Point Ltd., Series 2019-1A-B1 (3 Month LIBOR USD + 2.20%, 2.20% Floor) | | | 7.01 | % (h) | | | 01/20/2033 | | | | 12,760,748 | |
28,915,345 | | Harbourview LLC, Series 7RA-A1 (3 Month LIBOR USD + 1.13%, 1.13% Floor) | | | 5.92 | % (h) | | | 07/18/2031 | | | | 28,533,874 | |
10,000,000 | | Highbridge Loan Management Ltd., Series 7A-2015-BR (3 Month LIBOR USD + 1.18%) | | | 6.04 | % (h) | | | 03/15/2027 | | | | 10,010,890 | |
6,000,000 | | Jamestown Ltd., Series 2018-11A-A2 (3 Month LIBOR USD + 1.70%) | | | 6.49 | % (h) | | | 07/14/2031 | | | | 5,790,534 | |
53,922,114 | | Jamestown Ltd., Series 2018-6RA-A1 (3 Month LIBOR USD + 1.15%, 1.15% Floor) | | | 5.97 | % (h) | | | 04/25/2030 | | | | 53,361,059 | |
5,000,000 | | Jamestown Ltd., Series 2018-6RA-A2A (3 Month LIBOR USD + 1.78%, 1.78% Floor) | | | 6.60 | % (h) | | | 04/25/2030 | | | | 4,850,487 | |
4,500,000 | | Jamestown Ltd., Series 2019-1A-A2 (3 Month LIBOR USD + 2.15%, 2.15% Floor) | | | 6.96 | % (h) | | | 04/20/2032 | | | | 4,391,947 | |
15,000,000 | | LCM LP, Series 17A-A2RR (3 Month LIBOR USD + 1.15%, 1.15% Floor) | | | 5.94 | % (h) | | | 10/15/2031 | | | | 14,745,246 | |
12,500,000 | | Marble Point Ltd., Series 2020-2A-A1R (3 Month LIBOR USD + 1.21%, 1.21% Floor) | | | 6.00 | % (h) | | | 10/15/2034 | | | | 12,196,464 | |
55,000,000 | | Marble Point Ltd., Series 2021-2A-A (3 Month LIBOR USD + 1.20%, 1.20% Floor) | | | 6.02 | % (h) | | | 07/25/2034 | | | | 53,580,758 | |
50,000,000 | | Marble Point Ltd., Series 2021-4A-A1 (3 Month LIBOR USD + 1.21%, 1.21% Floor) | | | 6.03 | % (h) | | | 01/22/2035 | | | | 48,629,355 | |
54,500,000 | | MidOcean Credit, Series 2018-9A-A1 (3 Month LIBOR USD + 1.15%, 1.15% Floor) | | | 5.96 | % (h) | | | 07/20/2031 | | | | 53,714,039 | |
67,919,994 | | MKS Ltd., Series 2017-1A-AR (3 Month LIBOR USD + 1.00%, 1.00% Floor) | | | 5.81 | % (h) | | | 07/20/2030 | | | | 66,937,001 | |
61,250,000 | | MKS Ltd., Series 2017-2A-A (3 Month LIBOR USD + 1.19%, 1.19% Floor) | | | 6.00 | % (h) | | | 01/20/2031 | | | | 60,677,974 | |
39,136,756 | | MP Ltd., Series 2013-1A-AR (3 Month LIBOR USD + 1.25%) | | | 6.06 | % (h) | | | 10/20/2030 | | | | 38,778,960 | |
30,000,000 | | Nassau Ltd., Series 2018-IA-A (3 Month LIBOR USD + 1.15%) | | | 5.94 | % (h) | | | 07/15/2031 | | | | 29,394,687 | |
25,860,959 | | Northwoods Capital Ltd., Series 2018-11BA-A1 (3 Month LIBOR USD + 1.10%, 1.10% Floor) | | | 5.90 | % (h) | | | 04/19/2031 | | | | 25,565,092 | |
75,000,000 | | OFSI Fund Ltd., Series 2018-1A-A (3 Month LIBOR USD + 1.15%, 1.15% Floor) | | | 5.94 | % (h) | | | 07/15/2031 | | | | 73,934,100 | |
8,000,000 | | Prudential PLC, Series 2018-1A-A (3 Month LIBOR USD + 1.15%) | | | 5.94 | % (h) | | | 07/15/2031 | | | | 7,897,889 | |
2,500,000 | | Regatta Funding Ltd., Series 2018-1A-B (3 Month LIBOR USD + 1.65%) | | | 6.44 | % (h) | | | 07/17/2031 | | | | 2,444,702 | |
25,000,000 | | Sound Point Ltd., Series 2013-3RA-A (3 Month LIBOR USD + 1.15%, 1.15% Floor) | | | 5.94 | % (h) | | | 04/18/2031 | | | | 24,662,855 | |
18,000,000 | | Sound Point Ltd., Series 2018-2A-C (3 Month LIBOR USD + 1.95%) | | | 6.77 | % (h) | | | 07/26/2031 | | | | 16,976,452 | |
28,000,000 | | Sound Point Ltd., Series 2018-3A-A1A (3 Month LIBOR USD + 1.18%, 1.18% Floor) | | | 6.00 | % (h) | | | 10/26/2031 | | | | 27,628,518 | |
25,250,000 | | Sound Point Ltd., Series 2020-2A-AR (3 Month LIBOR USD + 1.18%, 1.18% Floor) | | | 6.00 | % (h) | | | 10/25/2034 | | | | 24,649,285 | |
13,839,148 | | Steele Creek Ltd., Series 2014-1RA-A (3 Month LIBOR USD + 1.07%, 1.07% Floor) | | | 5.89 | % (h) | | | 04/21/2031 | | | | 13,721,115 | |
34,000,000 | | Steele Creek Ltd., Series 2016-1A-AR (3 Month LIBOR USD + 1.12%, 1.12% Floor) | | | 5.99 | % (h) | | | 06/15/2031 | | | | 33,465,513 | |
10,000,000 | | Steele Creek Ltd., Series 2019-1A-BR (3 Month LIBOR USD + 1.80%, 1.80% Floor) | | | 6.59 | % (h) | | | 04/15/2032 | | | | 9,572,665 | |
4,000,000 | | THL Credit Wind River Ltd., Series 2013-2A-CR (3 Month LIBOR USD + 2.00%) | | | 6.79 | % (h) | | | 10/18/2030 | | | | 3,786,898 | |
20,000,000 | | THL Credit Wind River Ltd., Series 2014-2A-AR (3 Month LIBOR USD + 1.14%, 1.14% Floor) | | | 5.93 | % (h) | | | 01/15/2031 | | | | 19,749,450 | |
20,000,000 | | Trimaran CAVU LLC, Series 2021-3A-A (3 Month LIBOR USD + 1.21%, 1.21% Floor) | | | 6.00 | % (h) | | | 01/18/2035 | | | | 19,453,298 | |
15,000,000 | | Unity-Peace Park Ltd., Series 2022-1A-B (Secured Overnight Financing Rate 3 Month + 2.00%, 2.00% Floor) | | | 6.64 | % (h) | | | 04/20/2035 | | | | 14,478,010 | |
60,500,000 | | Vibrant Ltd., Series 2018-10A-A1 (3 Month LIBOR USD + 1.20%, 1.20% Floor) | | | 6.01 | % (h) | | | 10/20/2031 | | | | 60,044,502 | |
40,500,000 | | Wellfleet Ltd., Series 2018-2A-A1 (3 Month LIBOR USD + 1.20%, 1.20% Floor) | | | 6.01 | % (h) | | | 10/20/2031 | | | | 39,943,915 | |
| | | | | | | | | | | | | | |
Total Collateralized Loan Obligations (Cost $1,122,185,722) | | | | | | | | | | | 1,104,916,093 | |
| | | | | | | | | | | | | | |
Non-Agency Commercial Mortgage Backed Obligations - 7.7% | |
7,949,000 | | 20 Times Square Trust, Series 2018-20TS-F | | | 3.10 | % (a)(h) | | | 05/15/2035 | | | | 6,120,294 | |
5,856,000 | | 20 Times Square Trust, Series 2018-20TS-G | | | 3.10 | % (a)(h) | | | 05/15/2035 | | | | 4,124,169 | |
2,010,000 | | ACRE Commercial Mortgage Ltd., Series 2021-FL4-B (1 Month LIBOR USD + 1.40%, 1.40% Floor) | | | 6.16 | % (h) | | | 12/18/2037 | | | | 1,951,563 | |
11,551,000 | | Alen Mortgage Trust, Series 2021-ACEN-E (1 Month LIBOR USD + 4.00%, 4.00% Floor) | | | 8.68 | % (h) | | | 04/15/2034 | | | | 8,370,291 | |
21,947,000 | | Arbor Multifamily Mortgage Securities Trust, Series 2021-MF3-XB | | | 0.49 | % (a)(c)(h) | | | 10/15/2054 | | | | 759,059 | |
2,531,000 | | Arbor Realty Ltd., Series 2020-FL1-AS (Secured Overnight Financing Rate 1 Month + 1.51%, 1.40% Floor) | | | 6.34 | % (h) | | | 02/15/2035 | | | | 2,511,921 | |
6,300,000 | | Arbor Realty Ltd., Series 2021-FL1-B (1 Month LIBOR USD + 1.50%, 1.50% Floor) | | | 6.31 | % (h) | | | 12/15/2035 | | | | 6,044,415 | |
10,001,000 | | Atrium Hotel Portfolio Trust, Series 2018-ATRM-A (1 Month LIBOR USD + 0.95%, 0.95% Floor) | | | 5.63 | % (h) | | | 06/15/2035 | | | | 9,638,047 | |
35,435,000 | | BAMLL Commercial Mortgage Securities Trust, Series 2020-BOC-D | | | 3.18 | % (a)(h) | | | 01/15/2032 | | | | 28,568,292 | |
7,505,000 | | BAMLL Commercial Mortgage Securities Trust, Series 2020-BOC-E | | | 3.18 | % (a)(h) | | | 01/15/2032 | | | | 5,681,471 | |
46,112,103 | | Bank of America Merrill Lynch Commercial Mortgage Trust, Series 2015-UBS7-XA | | | 0.75 | % (a)(c) | | | 09/15/2048 | | | | 687,112 | |
2,121,000 | | Bank of America Merrill Lynch Commercial Mortgage Trust, Series 2016-UB10-C | | | 4.84 | % (a) | | | 07/15/2049 | | | | 1,920,854 | |
3,554,000 | | BANK, Series 2017-BNK4-C | | | 4.37 | % (a) | | | 05/15/2050 | | | | 2,979,208 | |
32,391,966 | | BANK, Series 2017-BNK4-XA | | | 1.34 | % (a)(c) | | | 05/15/2050 | | | | 1,358,121 | |
4,916,000 | | BANK, Series 2017-BNK5-B | | | 3.90 | % (a) | | | 06/15/2060 | | | | 4,395,752 | |
1,960,000 | | BANK, Series 2017-BNK5-C | | | 4.19 | % (a) | | | 06/15/2060 | | | | 1,681,546 | |
73,900,109 | | BANK, Series 2017-BNK5-XA | | | 0.95 | % (a)(c) | | | 06/15/2060 | | | | 2,248,152 | |
144,971,847 | | BANK, Series 2018-BN10-XA | | | 0.69 | % (a)(c) | | | 02/15/2061 | | | | 3,978,361 | |
91,198,905 | | BANK, Series 2019-BN16-XA | | | 0.94 | % (a)(c) | | | 02/15/2052 | | | | 3,733,866 | |
43,097,000 | | BANK, Series 2019-BN19-AS | | | 3.45 | % | | | 08/15/2061 | | | | 37,629,525 | |
1,099,000 | | BANK, Series 2019-BN20-AS | | | 3.24 | % (a) | | | 09/15/2062 | | | | 946,406 | |
5,000,000 | | BANK, Series 2019-BN21-C | | | 3.52 | % (a) | | | 10/17/2052 | | | | 3,775,968 | |
62,007,000 | | BANK, Series 2020-BN30-XB | | | 0.72 | % (a)(c) | | | 12/15/2053 | | | | 2,724,154 | |
112,743,000 | | BANK, Series 2021-BN35-XB | | | 0.59 | % (a)(c) | | | 06/15/2064 | | | | 4,563,769 | |
175,255,778 | | Barclays Commercial Mortgage Trust, Series 2019-C4-XA | | | 1.55 | % (a)(c) | | | 08/15/2052 | | | | 12,361,035 | |
73,613,095 | | Barclays Commercial Mortgage Trust, Series 2019-C5-XA | | | 0.88 | % (a)(c) | | | 11/15/2052 | | | | 2,773,373 | |
1,867,413 | | BBCMS Mortgage Trust, Series 2018-BXH-A (1 Month LIBOR USD + 1.00%, 1.00% Floor) | | | 5.68 | % (h) | | | 10/15/2037 | | | | 1,804,235 | |
45,454,000 | | BBCMS Mortgage Trust, Series 2018-CBM-A (1 Month LIBOR USD + 1.00%, 1.00% Floor) | | | 5.68 | % (h) | | | 07/15/2037 | | | | 44,464,953 | |
15,385,000 | | BBCMS Mortgage Trust, Series 2018-CBM-E (1 Month LIBOR USD + 3.55%, 3.55% Floor) | | | 8.23 | % (h) | | | 07/15/2037 | | | | 14,324,780 | |
5,775,000 | | BBCMS Mortgage Trust, Series 2018-TALL-F (1 Month LIBOR USD + 3.24%, 3.24% Floor) | | | 8.07 | % (h) | | | 03/15/2037 | | | | 3,076,113 | |
11,799,000 | | BBCMS Mortgage Trust, Series 2020-C6-F5TB | | | 3.69 | % (a)(h) | | | 02/15/2053 | | | | 8,033,429 | |
12,497,250 | | BBCMS Mortgage Trust, Series 2020-C6-F5TC | | | 3.69 | % (a)(h) | | | 02/15/2053 | | | | 8,174,296 | |
93,719,055 | | BBCMS Mortgage Trust, Series 2020-C6-XA | | | 1.05 | % (a)(c) | | | 02/15/2053 | | | | 4,857,159 | |
34,040,000 | | BBCMS Mortgage Trust, Series 2021-C11-XB | | | 0.97 | % (a)(c) | | | 09/15/2054 | | | | 2,315,040 | |
136,379,834 | | BBCMS Mortgage Trust, Series 2021-C9-XA | | | 1.62 | % (a)(c) | | | 02/15/2054 | | | | 12,286,282 | |
68,467,000 | | BBCMS Mortgage Trust, Series 2021-C9-XB | | | 0.99 | % (a)(c) | | | 02/15/2054 | | | | 4,295,503 | |
4,125,000 | | BDS Ltd., Series 2019-FL4-B (1 Month LIBOR USD + 1.75%, 1.75% Floor) | | | 6.46 | % (h) | | | 08/15/2036 | | | | 4,105,744 | |
37,023,869 | | Benchmark Mortgage Trust, Series 2018-B7-XA | | | 0.43 | % (a)(c) | | | 05/15/2053 | | | | 607,802 | |
28,371,052 | | Benchmark Mortgage Trust, Series 2018-B8-XA | | | 0.63 | % (a)(c) | | | 01/15/2052 | | | | 754,471 | |
79,524,188 | | Benchmark Mortgage Trust, Series 2019-B9-XA | | | 1.03 | % (a)(c) | | | 03/15/2052 | | | | 3,681,485 | |
75,194,142 | | Benchmark Mortgage Trust, Series 2020-B16-XA | | | 1.04 | % (a)(c) | | | 02/15/2053 | | | | 3,688,310 | |
75,277,584 | | Benchmark Mortgage Trust, Series 2020-B17-XA | | | 1.42 | % (a)(c) | | | 03/15/2053 | | | | 4,456,162 | |
13,462,000 | | Benchmark Mortgage Trust, Series 2020-B18-AGND | | | 3.74 | % (h) | | | 07/15/2053 | | | | 11,959,054 | |
2,432,000 | | Benchmark Mortgage Trust, Series 2020-B18-AGNE | | | 3.76 | % (h) | | | 07/15/2053 | | | | 2,116,096 | |
91,104,794 | | Benchmark Mortgage Trust, Series 2020-B18-XA | | | 1.79 | % (a)(c) | | | 07/15/2053 | | | | 6,985,014 | |
238,045,406 | | Benchmark Mortgage Trust, Series 2020-B19-XA | | | 1.77 | % (a)(c) | | | 09/15/2053 | | | | 18,266,605 | |
70,839,465 | | Benchmark Mortgage Trust, Series 2020-B22-XA | | | 1.52 | % (a)(c) | | | 01/15/2054 | | | | 6,270,065 | |
276,099,000 | | Benchmark Mortgage Trust, Series 2020-IG1-XA | | | 0.51 | % (a)(c) | | | 09/15/2043 | | | | 7,054,053 | |
232,721,221 | | Benchmark Mortgage Trust, Series 2021-B24-XA | | | 1.15 | % (a)(c) | | | 03/15/2054 | | | | 14,307,212 | |
121,470,979 | | Benchmark Mortgage Trust, Series 2021-B28-XA | | | 1.28 | % (a)(c) | | | 08/15/2054 | | | | 8,864,114 | |
59,609,000 | | Benchmark Mortgage Trust, Series 2021-B28-XB | | | 0.95 | % (a)(c) | | | 08/15/2054 | | | | 3,916,246 | |
66,420,000 | | Benchmark Mortgage Trust, Series 2021-B29-XB | | | 0.70 | % (a)(c) | | | 09/15/2054 | | | | 3,211,088 | |
364,692,920 | | Benchmark Mortgage Trust, Series 2021-B30-XA | | | 0.81 | % (a)(c) | | | 11/15/2054 | | | | 19,208,850 | |
30,009,000 | | BF Mortgage Trust, Series 2019-NYT-D (1 Month LIBOR USD + 2.00%, 2.00% Floor) | | | 6.68 | % (h) | | | 12/15/2035 | | | | 25,686,921 | |
672,000 | | BFLD, Series 2019-DPLO-B (Secured Overnight Financing Rate 1 Month + 1.45%, 1.45% Floor) | | | 6.28 | % (h) | | | 10/15/2034 | | | | 659,932 | |
14,537,000 | | BHMS Mortgage Trust, Series 2018-ATLS-A (1 Month LIBOR USD + 1.25%, 1.25% Floor) | | | 5.93 | % (h) | | | 07/15/2035 | | | | 14,003,601 | |
22,680,000 | | Braemar Hotels & Resorts Trust, Series 2018-PRME-A (1 Month LIBOR USD + 0.82%, 0.82% Floor) | | | 5.50 | % (h) | | | 06/15/2035 | | | | 21,818,121 | |
9,834,000 | | BSPRT Issuer Ltd., Series 2021-FL6-A (1 Month LIBOR USD + 1.10%, 1.10% Floor) | | | 5.78 | % (h) | | | 03/15/2036 | | | | 9,599,793 | |
516,361 | | BX Trust, Series 2018-EXCL-C (1 Month LIBOR USD + 1.98%, 1.98% Floor) | | | 6.66 | % (h) | | | 09/15/2037 | | | | 506,396 | |
5,160,000 | | BX Trust, Series 2019-IMC-F (1 Month LIBOR USD + 2.90%, 2.90% Floor) | | | 7.58 | % (h) | | | 04/15/2034 | | | | 4,901,413 | |
173,184,000 | | BX Trust, Series 2019-OC11-E | | | 3.94 | % (a)(h) | | | 12/09/2041 | | | | 137,926,387 | |
326,679,000 | | BX Trust, Series 2019-OC11-XB | | | 0.18 | % (a)(c)(h) | | | 12/09/2041 | | | | 4,046,573 | |
20,042,935 | | BX Trust, Series 2021-SOAR-J (1 Month LIBOR USD + 3.75%, 3.75% Floor) | | | 8.44 | % (h) | | | 06/15/2038 | | | | 18,481,248 | |
3,450,000 | | BX Trust, Series 2021-VIEW-F (1 Month LIBOR USD + 3.93%, 3.93% Floor) | | | 8.61 | % (h) | | | 06/15/2036 | | | | 3,082,272 | |
56,748,000 | | BX Trust, Series 2021-VOLT-E (1 Month LIBOR USD + 2.00%, 2.00% Floor) | | | 6.68 | % (h) | | | 09/15/2036 | | | | 53,085,257 | |
14,745,000 | | BX Trust, Series 2021-VOLT-F (1 Month LIBOR USD + 2.40%, 2.40% Floor) | | | 7.08 | % (h) | | | 09/15/2036 | | | | 13,611,685 | |
4,653,036 | | BX Trust, Series 2021-XL2-E (1 Month LIBOR USD + 1.85%, 1.85% Floor) | | | 6.53 | % (h) | | | 10/15/2038 | | | | 4,339,732 | |
63,812,612 | | California Housing Finance, Series 2021-2-X | | | 0.78 | % (a)(c) | | | 03/25/2035 | | | | 3,419,080 | |
71,379,713 | | CD Commercial Mortgage Trust, Series 2017-CD4-XA | | | 1.23 | % (a)(c) | | | 05/10/2050 | | | | 2,738,440 | |
5,723,000 | | CD Commercial Mortgage Trust, Series 2017-CD6-B | | | 3.91 | % (a) | | | 11/13/2050 | | | | 5,071,092 | |
5,175,000 | | CD Commercial Mortgage Trust, Series 2017-CD6-C | | | 4.23 | % (a) | | | 11/13/2050 | | | | 4,312,140 | |
42,823,613 | | CD Commercial Mortgage Trust, Series 2017-CD6-XA | | | 0.88 | % (a)(c) | | | 11/13/2050 | | | | 1,142,855 | |
7,155,000 | | CFCRE Commercial Mortgage Trust, Series 2016-C4-C | | | 4.84 | % (a) | | | 05/10/2058 | | | | 6,504,952 | |
77,142,122 | | CFCRE Commercial Mortgage Trust, Series 2016-C4-XA | | | 1.61 | % (a)(c) | | | 05/10/2058 | | | | 2,816,899 | |
5,000,000 | | CFCRE Commercial Mortgage Trust, Series 2016-C6-C | | | 4.19 | % (a) | | | 11/10/2049 | | | | 4,194,509 | |
5,275,000 | | CHCP Ltd., Series 2021-FL1-B (Secured Overnight Financing Rate 1 Month + 1.76%, 1.65% Floor) | | | 6.42 | % (h) | | | 02/15/2038 | | | | 5,018,049 | |
128,537,548 | | Citigroup Commercial Mortgage Trust, Series 2014-GC19-XA | | | 1.09 | % (a)(c) | | | 03/11/2047 | | | | 705,825 | |
66,284,184 | | Citigroup Commercial Mortgage Trust, Series 2014-GC21-XA | | | 1.12 | % (a)(c) | | | 05/10/2047 | | | | 554,898 | |
159,515,214 | | Citigroup Commercial Mortgage Trust, Series 2014-GC25-XA | | | 0.94 | % (a)(c) | | | 10/10/2047 | | | | 1,631,458 | |
9,978,000 | | Citigroup Commercial Mortgage Trust, Series 2015-GC27-C | | | 4.42 | % (a) | | | 02/10/2048 | | | | 9,207,557 | |
3,685,000 | | Citigroup Commercial Mortgage Trust, Series 2015-GC27-D | | | 4.42 | % (a)(h) | | | 02/10/2048 | | | | 3,107,002 | |
165,250,676 | | Citigroup Commercial Mortgage Trust, Series 2015-GC27-XA | | | 1.31 | % (a)(c) | | | 02/10/2048 | | | | 2,889,458 | |
14,310,000 | | Citigroup Commercial Mortgage Trust, Series 2015-GC33-C | | | 4.57 | % (a) | | | 09/10/2058 | | | | 12,728,762 | |
156,578,627 | | Citigroup Commercial Mortgage Trust, Series 2015-GC33-XA | | | 0.87 | % (a)(c) | | | 09/10/2058 | | | | 2,653,006 | |
96,208,267 | | Citigroup Commercial Mortgage Trust, Series 2016-C1-XA | | | 1.82 | % (a)(c) | | | 05/10/2049 | | | | 4,273,465 | |
193,586,891 | | Citigroup Commercial Mortgage Trust, Series 2016-GC36-XA | | | 1.21 | % (a)(c) | | | 02/10/2049 | | | | 5,037,073 | |
33,183,734 | | Citigroup Commercial Mortgage Trust, Series 2016-GC37-XA | | | 1.65 | % (a)(c) | | | 04/10/2049 | | | | 1,248,986 | |
92,005,003 | | Citigroup Commercial Mortgage Trust, Series 2016-P3-XA | | | 1.66 | % (a)(c) | | | 04/15/2049 | | | | 3,058,587 | |
52,593,375 | | Citigroup Commercial Mortgage Trust, Series 2016-P4-XA | | | 1.89 | % (a)(c) | | | 07/10/2049 | | | | 2,402,223 | |
85,671,563 | | Citigroup Commercial Mortgage Trust, Series 2016-P5-XA | | | 1.38 | % (a)(c) | | | 10/10/2049 | | | | 3,158,899 | |
223,425,827 | | Citigroup Commercial Mortgage Trust, Series 2017-B1-XA | | | 0.74 | % (a)(c) | | | 08/15/2050 | | | | 5,890,220 | |
38,463,137 | | Citigroup Commercial Mortgage Trust, Series 2017-P7-XA | | | 1.11 | % (a)(c) | | | 04/14/2050 | | | | 1,328,471 | |
3,625,000 | | Citigroup Commercial Mortgage Trust, Series 2020-420K-D | | | 3.31 | % (a)(h) | | | 11/10/2042 | | | | 2,759,518 | |
7,800,000 | | Citigroup Commercial Mortgage Trust, Series 2020-420K-E | | | 3.31 | % (a)(h) | | | 11/10/2042 | | | | 5,757,610 | |
23,804,000 | | Citigroup Commercial Mortgage Trust, Series 2020-555-E | | | 3.50 | % (a)(h) | | | 12/10/2041 | | | | 17,665,932 | |
4,175,000 | | Citigroup Commercial Mortgage Trust, Series 2020-555-F | | | 3.50 | % (a)(h) | | | 12/10/2041 | | | | 2,991,302 | |
2,853,000 | | Citigroup Commercial Mortgage Trust, Series 2020-GC46-B | | | 3.15 | % (a) | | | 02/15/2053 | | | | 2,197,571 | |
15,203,734 | | CLNC Ltd., Series 2019-FL1-A (Secured Overnight Financing Rate 1 Month + 1.36%, 1.25% Floor) | | | 6.06 | % (h) | | | 08/20/2035 | | | | 15,028,085 | |
32,731,000 | | CLNC Ltd., Series 2019-FL1-AS (Secured Overnight Financing Rate 1 Month + 1.66%, 1.55% Floor) | | | 6.36 | % (h) | | | 08/20/2035 | | | | 31,784,387 | |
29,797,989 | | CLNC Ltd., Series 2019-FL1-B (Secured Overnight Financing Rate 1 Month + 2.01%, 1.90% Floor) | | | 6.71 | % (h) | | | 08/20/2035 | | | | 28,960,129 | |
11,847,607 | | Commercial Mortgage Pass-Through Trust, Series 2012-CR3-XA | | | 1.23 | % (a)(c) | | | 10/15/2045 | | | | 118 | |
86,513,737 | | Commercial Mortgage Pass-Through Trust, Series 2013-CR10-XA | | | 0.59 | % (a)(c) | | | 08/10/2046 | | | | 21,222 | |
162,552,946 | | Commercial Mortgage Pass-Through Trust, Series 2013-CR12-XA | | | 1.13 | % (a)(c) | | | 10/10/2046 | | | | 408,528 | |
843,000 | | Commercial Mortgage Pass-Through Trust, Series 2013-CR13-C | | | 4.88 | % (a) | | | 11/10/2046 | | | | 782,374 | |
4,345,000 | | Commercial Mortgage Pass-Through Trust, Series 2014-CR16-C | | | 4.90 | % (a) | | | 04/10/2047 | | | | 3,920,451 | |
7,635,000 | | Commercial Mortgage Pass-Through Trust, Series 2014-CR19-C | | | 4.70 | % (a) | | | 08/10/2047 | | | | 6,867,369 | |
25,400,000 | | Commercial Mortgage Pass-Through Trust, Series 2014-CR20-C | | | 4.46 | % (a) | | | 11/10/2047 | | | | 22,174,672 | |
89,335,547 | | Commercial Mortgage Pass-Through Trust, Series 2014-UBS3-XA | | | 1.05 | % (a)(c) | | | 06/10/2047 | | | | 660,895 | |
833,000 | | Commercial Mortgage Pass-Through Trust, Series 2015-3BP-F | | | 3.24 | % (a)(h) | | | 02/10/2035 | | | | 689,299 | |
149,011,825 | | Commercial Mortgage Pass-Through Trust, Series 2015-CR22-XA | | | 0.82 | % (a)(c) | | | 03/10/2048 | | | | 1,850,757 | |
5,360,000 | | Commercial Mortgage Pass-Through Trust, Series 2015-CR23-C | | | 4.30 | % (a) | | | 05/10/2048 | | | | 4,935,083 | |
74,716,056 | | Commercial Mortgage Pass-Through Trust, Series 2015-CR26-XA | | | 0.90 | % (a)(c) | | | 10/10/2048 | | | | 1,293,791 | |
17,822,000 | | Commercial Mortgage Pass-Through Trust, Series 2015-DC1-C | | | 4.30 | % (a) | | | 02/10/2048 | | | | 15,006,693 | |
266,355,276 | | Commercial Mortgage Pass-Through Trust, Series 2015-DC1-XA | | | 0.98 | % (a)(c) | | | 02/10/2048 | | | | 3,438,141 | |
1,403,000 | | Commercial Mortgage Pass-Through Trust, Series 2016-DC2-C | | | 4.66 | % (a) | | | 02/10/2049 | | | | 1,265,407 | |
5,524,000 | | Commercial Mortgage Pass-Through Trust, Series 2017-PANW-E | | | 3.81 | % (a)(h) | | | 10/10/2029 | | | | 4,888,293 | |
5,248,500 | | Commercial Mortgage Pass-Through Trust, Series 2018-COR3-C | | | 4.56 | % (a) | | | 05/10/2051 | | | | 4,350,558 | |
18,570,000 | | Commercial Mortgage Pass-Through Trust, Series 2018-HCLV-A (1 Month LIBOR USD + 1.10%, 1.00% Floor) | | | 5.78 | % (h) | | | 09/15/2033 | | | | 17,612,917 | |
16,681,499 | | Credit Suisse Mortgage Capital Certificates, Series 2019-ICE4-E (1 Month LIBOR USD + 2.15%, 2.15% Floor) | | | 6.83 | % (h) | | | 05/15/2036 | | | | 16,163,623 | |
4,606,000 | | CSAIL Commercial Mortgage Trust, Series 2015-C1-C | | | 4.26 | % (a) | | | 04/15/2050 | | | | 3,482,220 | |
13,360,000 | | CSAIL Commercial Mortgage Trust, Series 2015-C2-AS | | | 3.85 | % (a) | | | 06/15/2057 | | | | 12,653,483 | |
9,205,000 | | CSAIL Commercial Mortgage Trust, Series 2015-C3-B | | | 4.11 | % (a) | | | 08/15/2048 | | | | 8,292,993 | |
2,299,000 | | CSAIL Commercial Mortgage Trust, Series 2015-C4-C | | | 4.56 | % (a) | | | 11/15/2048 | | | | 2,080,730 | |
276,244,341 | | CSAIL Commercial Mortgage Trust, Series 2015-C4-XA | | | 0.81 | % (a)(c) | | | 11/15/2048 | | | | 4,511,733 | |
9,425,000 | | CSAIL Commercial Mortgage Trust, Series 2016-C5-C | | | 4.64 | % (a) | | | 11/15/2048 | | | | 8,595,772 | |
35,762,243 | | CSAIL Commercial Mortgage Trust, Series 2016-C6-XA | | | 1.86 | % (a)(c) | | | 01/15/2049 | | | | 1,550,479 | |
11,020,000 | | CSAIL Commercial Mortgage Trust, Series 2016-C7-B | | | 4.33 | % (a) | | | 11/15/2049 | | | | 9,866,213 | |
132,703,719 | | CSAIL Commercial Mortgage Trust, Series 2017-C8-XA | | | 1.10 | % (a)(c) | | | 06/15/2050 | | | | 4,701,122 | |
4,399,000 | | CSAIL Commercial Mortgage Trust, Series 2017-CX10-B | | | 3.89 | % (a) | | | 11/15/2050 | | | | 3,893,193 | |
3,356,000 | | CSAIL Commercial Mortgage Trust, Series 2017-CX10-C | | | 4.18 | % (a) | | | 11/15/2050 | | | | 2,837,253 | |
77,707,836 | | CSAIL Commercial Mortgage Trust, Series 2017-CX10-XA | | | 0.75 | % (a)(c) | | | 11/15/2050 | | | | 1,954,997 | |
1,677,000 | | CSAIL Commercial Mortgage Trust, Series 2018-C14-C | | | 4.92 | % (a) | | | 11/15/2051 | | | | 1,396,188 | |
15,894,000 | | CSAIL Commercial Mortgage Trust, Series 2019-C16-B | | | 3.88 | % | | | 06/15/2052 | | | | 13,643,143 | |
26,115,369 | | CSAIL Commercial Mortgage Trust, Series 2019-C17-XA | | | 1.35 | % (a)(c) | | | 09/15/2052 | | | | 1,553,872 | |
7,924,000 | | CSAIL Commercial Mortgage Trust, Series 2019-C18-B | | | 3.59 | % | | | 12/15/2052 | | | | 6,623,352 | |
246,060,725 | | CSAIL Commercial Mortgage Trust, Series 2019-C18-XA | | | 1.05 | % (a)(c) | | | 12/15/2052 | | | | 11,146,920 | |
196,860,155 | | CSAIL Commercial Mortgage Trust, Series 2020-C19-XA | | | 1.11 | % (a)(c) | | | 03/15/2053 | | | | 11,002,140 | |
81,465,000 | | CSAIL Commercial Mortgage Trust, Series 2020-C19-XB | | | 0.08 | % (a)(c) | | | 03/15/2053 | | | | 469,344 | |
147,561,481 | | CSMC Trust, Series 2014-USA-X1 | | | 0.54 | % (a)(c)(h) | | | 09/15/2037 | | | | 1,495,108 | |
3,799,000 | | CSMC Trust, Series 2017-CALI-E | | | 3.78 | % (a)(h) | | | 11/10/2032 | | | | 2,146,437 | |
6,050,000 | | CSMC Trust, Series 2017-CALI-F | | | 3.78 | % (a)(h) | | | 11/10/2032 | | | | 1,270,504 | |
12,164,000 | | CSMC Trust, Series 2017-CHOP-D (1 Month LIBOR USD + 1.90%, 1.90% Floor) | | | 6.58 | % (h) | | | 07/15/2032 | | | | 11,101,905 | |
16,671,000 | | CSMC Trust, Series 2017-CHOP-E (1 Month LIBOR USD + 3.30%, 3.30% Floor) | | | 7.98 | % (h) | | | 07/15/2032 | | | | 15,193,489 | |
4,847,000 | | CSMC Trust, Series 2017-TIME-A | | | 3.65 | % (h) | | | 11/13/2039 | | | | 4,119,528 | |
32,384,445 | | CSMC Trust, Series 2020-NET-A | | | 2.26 | % (h) | | | 08/15/2037 | | | | 29,151,033 | |
3,894,000 | | CSMC Trust, Series 2020-NET-B | | | 2.82 | % (h) | | | 08/15/2037 | | | | 3,532,718 | |
142,322,564 | | CSMC Trust, Series 2020-NET-X | | | 1.26 | % (a)(c)(h) | | | 08/15/2037 | | | | 3,526,184 | |
1,961,542 | | CSWF Trust, Series 2018-TOP-G (1 Month LIBOR USD + 3.25%, 3.25% Floor) | | | 7.93 | % (h) | | | 08/15/2035 | | | | 1,878,628 | |
5,903,500 | | CSWF Trust, Series 2021-B33-A1 | | | 3.05 | % (h) | | | 10/10/2043 | | | | 5,076,018 | |
23,397,500 | | CSWF Trust, Series 2021-B33-A2 | | | 3.17 | % (h) | | | 10/10/2043 | | | | 18,707,139 | |
4,887,333 | | CSWF Trust, Series 2021-B33-B | | | 3.64 | % (a)(h) | | | 10/10/2043 | | | | 3,756,034 | |
109,000,000 | | CSWF Trust, Series 2021-B33-X | | | 0.50 | % (a)(c)(h) | | | 10/10/2043 | | | | 3,506,018 | |
7,447,000 | | DBGS Mortgage Trust, Series 2018-5BP-D (1 Month LIBOR USD + 1.50%, 1.35% Floor) | | | 6.18 | % (h) | | | 06/15/2033 | | | | 6,529,300 | |
5,161,000 | | DBJPM Mortgage Trust, Series 2016-C1-B | | | 4.20 | % (a) | | | 05/10/2049 | | | | 4,516,470 | |
104,474,216 | | DBJPM Mortgage Trust, Series 2016-C1-XA | | | 1.37 | % (a)(c) | | | 05/10/2049 | | | | 3,231,304 | |
59,711,593 | | DBJPM Mortgage Trust, Series 2020-C9-XA | | | 1.71 | % (a)(c) | | | 09/15/2053 | | | | 4,032,676 | |
5,750,000 | | DOLP Trust, Series 2021-NYC-E | | | 3.70 | % (a)(h) | | | 05/10/2041 | | | | 3,484,168 | |
11,475,000 | | DOLP Trust, Series 2021-NYC-F | | | 3.70 | % (a)(h) | | | 05/10/2041 | | | | 6,643,752 | |
6,520,000 | | Fontainebleau Miami Beach Trust, Series 2019-FBLU-G | | | 3.96 | % (a)(h) | | | 12/10/2036 | | | | 5,877,053 | |
1,479,905 | | FREMF Mortgage Trust, Series 2017-KF34-B (1 Month LIBOR USD + 2.70%, 2.55% Floor) | | | 7.37 | % (h) | | | 08/25/2024 | | | | 1,469,205 | |
1,255,078 | | FS Rialto, Series 2019-FL1-A (1 Month LIBOR USD + 1.20%, 1.20% Floor) | | | 5.93 | % (h) | | | 12/16/2036 | | | | 1,248,128 | |
38,881,000 | | Great Wolf Trust, Series 2019-WOLF-E (Secured Overnight Financing Rate 1 Month + 2.85%, 2.85% Floor) | | | 7.67 | % (h) | | | 12/15/2036 | | | | 37,485,763 | |
35,048,000 | | Great Wolf Trust, Series 2019-WOLF-F (Secured Overnight Financing Rate 1 Month + 3.25%, 3.25% Floor) | | | 8.07 | % (h) | | | 12/15/2036 | | | | 33,384,233 | |
25,725,000 | | Greystone Commercial Real Estate Notes, Series 2019-FL2-B (1 Month LIBOR USD + 1.60%, 1.60% Floor) | | | 6.28 | % (h) | | | 09/15/2037 | | | | 24,917,647 | |
14,873,000 | | Greystone Commercial Real Estate Notes, Series 2019-FL2-C (1 Month LIBOR USD + 2.00%, 2.00% Floor) | | | 6.68 | % (h) | | | 09/15/2037 | | | | 14,449,491 | |
6,083,000 | | Greystone Commercial Real Estate Notes, Series 2021-FL3-B (Secured Overnight Financing Rate 1 Month + 1.76%, 1.65% Floor) | | | 6.59 | % (h) | | | 07/15/2039 | | | | 5,796,326 | |
3,443,000 | | GS Mortgage Securities Corporation Trust, Series 2018-GS10-WLSA | | | 4.58 | % (a)(h) | | | 03/10/2033 | | | | 3,241,020 | |
6,834,000 | | GS Mortgage Securities Corporation Trust, Series 2018-GS10-WLSB | | | 4.58 | % (a)(h) | | | 03/10/2033 | | | | 5,995,437 | |
9,287,000 | | GS Mortgage Securities Corporation Trust, Series 2018-GS10-WLSC | | | 4.58 | % (a)(h) | | | 03/10/2033 | | | | 7,847,347 | |
8,990,000 | | GS Mortgage Securities Corporation Trust, Series 2018-GS10-WLSD | | | 4.58 | % (a)(h) | | | 03/10/2033 | | | | 7,336,556 | |
11,236,750 | | GS Mortgage Securities Corporation Trust, Series 2018-GS10-WLSE | | | 4.58 | % (a)(h) | | | 03/10/2033 | | | | 8,907,981 | |
16,399,000 | | GS Mortgage Securities Corporation Trust, Series 2018-LUAU-A (1 Month LIBOR USD + 1.00%, 1.00% Floor) | | | 5.68 | % (h) | | | 11/15/2032 | | | | 16,018,081 | |
15,571,000 | | GS Mortgage Securities Corporation Trust, Series 2018-TWR-A (1 Month LIBOR USD + 1.15%, 0.90% Floor) | | | 5.83 | % (h) | | | 07/15/2031 | | | | 13,795,906 | |
3,897,000 | | GS Mortgage Securities Corporation Trust, Series 2018-TWR-D (1 Month LIBOR USD + 1.85%, 1.60% Floor) | | | 6.53 | % (h) | | | 07/15/2031 | | | | 2,971,463 | |
11,950,000 | | GS Mortgage Securities Corporation Trust, Series 2018-TWR-E (1 Month LIBOR USD + 2.35%, 2.10% Floor) | | | 7.03 | % (h) | | | 07/15/2031 | | | | 8,771,300 | |
11,242,000 | | GS Mortgage Securities Corporation Trust, Series 2018-TWR-F (1 Month LIBOR USD + 3.05%, 2.80% Floor) | | | 7.73 | % (h) | | | 07/15/2031 | | | | 7,813,190 | |
4,648,000 | | GS Mortgage Securities Corporation Trust, Series 2018-TWR-G (1 Month LIBOR USD + 4.17%, 3.93% Floor) | | | 8.86 | % (h) | | | 07/15/2031 | | | | 2,788,800 | |
7,561,000 | | GS Mortgage Securities Corporation Trust, Series 2020-UPTN-D | | | 3.25 | % (a)(h) | | | 02/10/2037 | | | | 6,505,085 | |
6,760,500 | | GS Mortgage Securities Corporation Trust, Series 2020-UPTN-F | | | 3.25 | % (a)(h) | | | 02/10/2037 | | | | 5,692,724 | |
56,900,000 | | GS Mortgage Securities Corporation Trust, Series 2021-1HTL-A (1 Month LIBOR USD + 3.48%, 3.48% Floor) | | | 8.20 | % (h) | | | 10/15/2023 | | | | 56,109,431 | |
3,280,000 | | GS Mortgage Securities Corporation Trust, Series 2021-ARDN-E (1 Month LIBOR USD + 3.35%, 3.35% Floor) | | | 8.03 | % (h) | | | 11/15/2036 | | | | 3,109,140 | |
16,787,000 | | GS Mortgage Securities Corporation Trust, Series 2021-ARDN-G (1 Month LIBOR USD + 5.00%, 5.00% Floor) | | | 9.68 | % (h) | | | 11/15/2036 | | | | 15,307,902 | |
597,367 | | GS Mortgage Securities Trust, Series 2011-GC3-X | | | 0.00 | % (a)(c)(h) | | | 03/10/2044 | | | | 6 | |
4,000,000 | | GS Mortgage Securities Trust, Series 2015-GC28-C | | | 4.31 | % (a) | | | 02/10/2048 | | | | 3,680,462 | |
196,666,079 | | GS Mortgage Securities Trust, Series 2015-GC28-XA | | | 0.97 | % (a)(c) | | | 02/10/2048 | | | | 2,551,723 | |
201,250,448 | | GS Mortgage Securities Trust, Series 2015-GC32-XA | | | 0.71 | % (a)(c) | | | 07/10/2048 | | | | 2,647,570 | |
148,377,932 | | GS Mortgage Securities Trust, Series 2015-GC34-XA | | | 1.20 | % (a)(c) | | | 10/10/2048 | | | | 3,613,611 | |
64,385,076 | | GS Mortgage Securities Trust, Series 2015-GS1-XA | | | 0.76 | % (a)(c) | | | 11/10/2048 | | | | 1,071,535 | |
40,016,963 | | GS Mortgage Securities Trust, Series 2016-GS2-XA | | | 1.73 | % (a)(c) | | | 05/10/2049 | | | | 1,635,537 | |
259,292,569 | | GS Mortgage Securities Trust, Series 2016-GS3-XA | | | 1.20 | % (a)(c) | | | 10/10/2049 | | | | 8,312,427 | |
48,337,995 | | GS Mortgage Securities Trust, Series 2016-GS4-XA | | | 0.57 | % (a)(c) | | | 11/10/2049 | | | | 798,810 | |
180,909,690 | | GS Mortgage Securities Trust, Series 2017-GS7-XA | | | 1.08 | % (a)(c) | | | 08/10/2050 | | | | 6,563,747 | |
98,700,000 | | GS Mortgage Securities Trust, Series 2017-GS7-XB | | | 0.33 | % (a)(c) | | | 08/10/2050 | | | | 1,337,543 | |
195,511,648 | | GS Mortgage Securities Trust, Series 2018-GS9-XA | | | 0.42 | % (a)(c) | | | 03/10/2051 | | | | 3,367,864 | |
60,376,163 | | GS Mortgage Securities Trust, Series 2019-GC38-XA | | | 0.95 | % (a)(c) | | | 02/10/2052 | | | | 2,576,776 | |
16,964,304 | | GS Mortgage Securities Trust, Series 2019-GC39-XA | | | 1.13 | % (a)(c) | | | 05/10/2052 | | | | 763,943 | |
180,966,846 | | GS Mortgage Securities Trust, Series 2020-GC45-XA | | | 0.67 | % (a)(c) | | | 02/13/2053 | | | | 5,802,756 | |
55,802,957 | | GS Mortgage Securities Trust, Series 2020-GSA2-XA | | | 1.72 | % (a)(c)(h) | | | 12/12/2053 | | | | 5,123,627 | |
5,692,000 | | Hilton USA Trust, Series 2016-SFP-A | | | 2.83 | % (h) | | | 11/05/2035 | | | | 5,365,528 | |
5,949,647 | | JP Morgan Chase Commercial Mortgage Securities Trust, Series 2007-CB18-X | | | 0.66 | % (a)(c) | | | 06/12/2047 | | | | 60 | |
761,319 | | JP Morgan Chase Commercial Mortgage Securities Trust, Series 2007-CB20-X1 | | | 0.00 | % (a)(c)(h) | | | 02/12/2051 | | | | 1 | |
9,535,000 | | JP Morgan Chase Commercial Mortgage Securities Trust, Series 2014-C20-B | | | 4.40 | % (a) | | | 07/15/2047 | | | | 8,716,545 | |
51,337,598 | | JP Morgan Chase Commercial Mortgage Securities Trust, Series 2015-JP1-XA | | | 0.89 | % (a)(c) | | | 01/15/2049 | | | | 1,020,504 | |
11,745,000 | | JP Morgan Chase Commercial Mortgage Securities Trust, Series 2018-BCON-E | | | 3.76 | % (a)(h) | | | 01/05/2031 | | | | 11,728,378 | |
9,343,000 | | JP Morgan Chase Commercial Mortgage Securities Trust, Series 2018-MINN-E (1 Month LIBOR USD + 2.75%, 3.50% Floor) | | | 7.43 | % (h) | | | 11/15/2035 | | | | 8,029,507 | |
5,831,000 | | JP Morgan Chase Commercial Mortgage Securities Trust, Series 2018-WPT-EFX | | | 5.36 | % (a)(h) | | | 07/05/2033 | | | | 4,584,624 | |
6,097,000 | | JP Morgan Chase Commercial Mortgage Securities Trust, Series 2018-WPT-FFX | | | 5.36 | % (a)(h) | | | 07/05/2033 | | | | 4,591,041 | |
7,366,000 | | JP Morgan Chase Commercial Mortgage Securities Trust, Series 2020-ACE-C | | | 3.69 | % (a)(h) | | | 01/10/2037 | | | | 6,170,535 | |
40,424,000 | | JP Morgan Chase Commercial Mortgage Securities Trust, Series 2020-NNN-EFX | | | 3.97 | % (h) | | | 01/16/2037 | | | | 32,944,566 | |
1,900,000 | | JP Morgan Chase Commercial Mortgage Securities Trust, Series 2021-MHC-E (1 Month LIBOR USD + 2.45%, 2.45% Floor) | | | 7.13 | % (h) | | | 04/15/2038 | | | | 1,791,787 | |
59,674,194 | | JPMBB Commercial Mortgage Securities Trust, Series 2014-C18-XA | | | 0.66 | % (a)(c) | | | 02/15/2047 | | | | 172,811 | |
4,787,000 | | JPMBB Commercial Mortgage Securities Trust, Series 2014-C21-C | | | 4.64 | % (a) | | | 08/15/2047 | | | | 4,203,606 | |
154,492,503 | | JPMBB Commercial Mortgage Securities Trust, Series 2014-C25-XA | | | 0.81 | % (a)(c) | | | 11/15/2047 | | | | 1,527,684 | |
158,755,110 | | JPMBB Commercial Mortgage Securities Trust, Series 2014-C26-XA | | | 0.93 | % (a)(c) | | | 01/15/2048 | | | | 1,778,613 | |
13,992,000 | | JPMBB Commercial Mortgage Securities Trust, Series 2015-C27-C | | | 4.30 | % (a) | | | 02/15/2048 | | | | 12,707,790 | |
10,425,000 | | JPMBB Commercial Mortgage Securities Trust, Series 2015-C27-D | | | 3.80 | % (a)(h) | | | 02/15/2048 | | | | 7,174,680 | |
10,663,088 | | JPMBB Commercial Mortgage Securities Trust, Series 2015-C28-C | | | 4.14 | % (a) | | | 10/15/2048 | | | | 9,798,843 | |
29,436,648 | | JPMBB Commercial Mortgage Securities Trust, Series 2015-C28-XA | | | 0.94 | % (a)(c) | | | 10/15/2048 | | | | 376,562 | |
28,761,533 | | JPMBB Commercial Mortgage Securities Trust, Series 2015-C29-XA | | | 0.56 | % (a)(c) | | | 05/15/2048 | | | | 272,665 | |
123,827,783 | | JPMBB Commercial Mortgage Securities Trust, Series 2015-C30-XA | | | 0.43 | % (a)(c) | | | 07/15/2048 | | | | 1,029,752 | |
23,865,000 | | JPMBB Commercial Mortgage Securities Trust, Series 2015-C32-C | | | 4.66 | % (a) | | | 11/15/2048 | | | | 16,125,678 | |
55,820,277 | | JPMBB Commercial Mortgage Securities Trust, Series 2015-C32-XA | | | 1.11 | % (a)(c) | | | 11/15/2048 | | | | 887,241 | |
7,394,000 | | JPMBB Commercial Mortgage Securities Trust, Series 2016-C1-C | | | 4.74 | % (a) | | | 03/17/2049 | | | | 6,711,599 | |
18,619,396 | | JPMBB Commercial Mortgage Securities Trust, Series 2016-C1-XA | | | 1.21 | % (a)(c) | | | 03/17/2049 | | | | 451,645 | |
1,725,000 | | JPMCC Commercial Mortgage Securities Trust, Series 2017-JP5-C | | | 3.76 | % (a) | | | 03/15/2050 | | | | 1,335,865 | |
89,467,885 | | JPMCC Commercial Mortgage Securities Trust, Series 2019-COR5-XA | | | 1.47 | % (a)(c) | | | 06/13/2052 | | | | 5,432,615 | |
105,529,839 | | JPMDB Commercial Mortgage Securities Trust, Series 2016-C2-XA | | | 1.49 | % (a)(c) | | | 06/15/2049 | | | | 3,619,621 | |
140,503,659 | | JPMDB Commercial Mortgage Securities Trust, Series 2017-C5-XA | | | 0.89 | % (a)(c) | | | 03/15/2050 | | | | 3,573,795 | |
181,590,350 | | JPMDB Commercial Mortgage Securities Trust, Series 2017-C7-XA | | | 0.83 | % (a)(c) | | | 10/15/2050 | | | | 5,077,175 | |
1,844,000 | | JPMDB Commercial Mortgage Securities Trust, Series 2018-C8-C | | | 4.81 | % (a) | | | 06/15/2051 | | | | 1,582,448 | |
13,604,000 | | JPMDB Commercial Mortgage Securities Trust, Series 2019-COR6-AS | | | 3.41 | % (a) | | | 11/13/2052 | | | | 11,742,984 | |
1,435,000 | | JPMDB Commercial Mortgage Securities Trust, Series 2020-COR7-B | | | 3.29 | % (a) | | | 05/13/2053 | | | | 1,159,234 | |
279,243,765 | | JPMDB Commercial Mortgage Securities Trust, Series 2020-COR7-XA | | | 1.65 | % (a)(c) | | | 05/13/2053 | | | | 19,239,449 | |
7,875,000 | | KKR Industrial Portfolio Trust, Series 2021-KDIP-F (Secured Overnight Financing Rate 1 Month + 2.16%, 2.16% Floor) | | | 6.99 | % (h) | | | 12/15/2037 | | | | 7,265,330 | |
13,713,000 | | LCCM Trust, Series 2021-FL3-A (1 Month LIBOR USD + 1.45%, 1.45% Floor) | | | 6.13 | % (h) | | | 11/15/2038 | | | | 13,427,824 | |
8,882,559 | | LMREC, Inc., Series 2019-CRE3-A (1 Month LIBOR USD + 1.40%, 1.40% Floor) | | | 6.20 | % (h) | | | 12/22/2035 | | | | 8,879,024 | |
34,112,530 | | LoanCore Issuer Ltd., Series 2019-CRE2-AS (1 Month LIBOR USD + 1.50%, 1.50% Floor) | | | 6.18 | % (h) | | | 05/15/2036 | | | | 34,175,263 | |
12,625,000 | | LoanCore Issuer Ltd., Series 2019-CRE2-B (1 Month LIBOR USD + 1.70%, 1.70% Floor) | | | 6.38 | % (h) | | | 05/15/2036 | | | | 12,564,122 | |
1,360,000 | | LSTAR Commercial Mortgage Trust, Series 2015-3-D | �� | | 3.15 | % (a)(h) | | | 04/20/2048 | | | | 1,222,509 | |
16,270,226 | | LSTAR Commercial Mortgage Trust, Series 2017-5-X | | | 0.79 | % (a)(c)(h) | | | 03/10/2050 | | | | 309,377 | |
25,000,000 | | M360 Ltd., Series 2021-CRE3-A (1 Month LIBOR USD + 1.50%, 1.50% Floor) | | | 6.25 | % (h) | | | 11/22/2038 | | | | 24,557,125 | |
7,162,000 | | M360 Ltd., Series 2021-CRE3-B (1 Month LIBOR USD + 2.25%, 2.25% Floor) | | | 7.00 | % (h) | | | 11/22/2038 | | | | 6,997,883 | |
5,731,000 | | Manhattan West Mortgage Trust, Series 2020-1MW-C | | | 2.33 | % (a)(h) | | | 09/10/2039 | | | | 4,541,330 | |
16,683,436 | | Med Trust, Series 2021-MDLN-G (1 Month LIBOR USD + 5.25%, 5.25% Floor) | | | 9.94 | % (h) | | | 11/15/2038 | | | | 15,298,931 | |
4,706,450 | | MF1 Multifamily Housing Mortgage Loan Trust, Series 2021-FL5-A (Secured Overnight Financing Rate 1 Month + 0.96%, 0.85% Floor) | | | 5.62 | % (h) | | | 07/15/2036 | | | | 4,623,932 | |
10,000,000 | | MF1 Multifamily Housing Mortgage Loan Trust, Series 2021-FL5-AS (Secured Overnight Financing Rate 1 Month + 1.31%, 1.20% Floor) | | | 5.97 | % (h) | | | 07/15/2036 | | | | 9,693,280 | |
12,625,000 | | MFT Trust, Series 2020-ABC-A | | | 3.36 | % (h) | | | 02/10/2042 | | | | 9,235,211 | |
5,326,000 | | MFT Trust, Series 2020-ABC-B | | | 3.48 | % (a)(h) | | | 02/10/2042 | | | | 3,731,220 | |
4,220,000 | | MHC Commercial Mortgage Trust, Series 2021-MHC-A (1 Month LIBOR USD + 0.80%, 0.80% Floor) | | | 5.48 | % (h) | | | 04/15/2038 | | | | 4,086,461 | |
1,000,000 | | MKT Mortgage Trust, Series 2020-525M-F | | | 2.94 | % (a)(h) | | | 02/12/2040 | | | | 537,198 | |
11,129,584 | | Morgan Stanley Bank of America Merrill Lynch Trust, Series 2012-CKSV-CK | | | 4.16 | % (a)(h) | | | 10/15/2030 | | | | 7,354,858 | |
88,774,781 | | Morgan Stanley Bank of America Merrill Lynch Trust, Series 2013-C12-XA | | | 0.66 | % (a)(c) | | | 10/15/2046 | | | | 71,171 | |
13,450,000 | | Morgan Stanley Bank of America Merrill Lynch Trust, Series 2014-C18-C | | | 4.48 | % (a) | | | 10/15/2047 | | | | 12,528,220 | |
6,693,500 | | Morgan Stanley Bank of America Merrill Lynch Trust, Series 2014-C19-C | | | 4.00 | % | | | 12/15/2047 | | | | 6,050,334 | |
5,457,500 | | Morgan Stanley Bank of America Merrill Lynch Trust, Series 2015-C20-C | | | 4.45 | % (a) | | | 02/15/2048 | | | | 5,075,424 | |
166,480,383 | | Morgan Stanley Bank of America Merrill Lynch Trust, Series 2015-C20-XA | | | 1.24 | % (a)(c) | | | 02/15/2048 | | | | 2,482,472 | |
14,422,000 | | Morgan Stanley Bank of America Merrill Lynch Trust, Series 2015-C27-C | | | 4.50 | % (a) | | | 12/15/2047 | | | | 12,877,632 | |
131,080,228 | | Morgan Stanley Bank of America Merrill Lynch Trust, Series 2016-C28-XA | | | 1.15 | % (a)(c) | | | 01/15/2049 | | | | 3,244,327 | |
7,564,000 | | Morgan Stanley Bank of America Merrill Lynch Trust, Series 2016-C31-C | | | 4.27 | % (a) | | | 11/15/2049 | | | | 5,971,376 | |
40,017,322 | | Morgan Stanley Bank of America Merrill Lynch Trust, Series 2017-C33-XA | | | 1.25 | % (a)(c) | | | 05/15/2050 | | | | 1,489,921 | |
15,693,772 | | Morgan Stanley Capital Trust, Series 2006-HQ10-X1 | | | 0.03 | % (a)(c)(h) | | | 11/12/2041 | | | | 126,793 | |
7,137,000 | | Morgan Stanley Capital Trust, Series 2015-UBS8-B | | | 4.32 | % (a) | | | 12/15/2048 | | | | 6,209,196 | |
23,986,210 | | Morgan Stanley Capital Trust, Series 2015-UBS8-XA | | | 0.85 | % (a)(c) | | | 12/15/2048 | | | | 423,419 | |
15,461,000 | | Morgan Stanley Capital Trust, Series 2017-ASHF-E (1 Month LIBOR USD + 3.28%, 3.15% Floor) | | | 7.96 | % (h) | | | 11/15/2034 | | | | 14,221,878 | |
5,023,000 | | Morgan Stanley Capital Trust, Series 2017-ASHF-F (1 Month LIBOR USD + 4.48%, 4.35% Floor) | | | 9.16 | % (h) | | | 11/15/2034 | | | | 4,583,015 | |
140,650,637 | | Morgan Stanley Capital Trust, Series 2017-H1-XA | | | 1.32 | % (a)(c) | | | 06/15/2050 | | | | 4,974,433 | |
4,661,000 | | Morgan Stanley Capital Trust, Series 2017-HR2-C | | | 4.32 | % (a) | | | 12/15/2050 | | | | 3,990,201 | |
8,000,000 | | Morgan Stanley Capital Trust, Series 2018-MP-E | | | 4.28 | % (a)(h) | | | 07/11/2040 | | | | 5,777,768 | |
5,305,000 | | Morgan Stanley Capital Trust, Series 2019-H7-AS | | | 3.52 | % | | | 07/15/2052 | | | | 4,663,447 | |
77,293,745 | | Morgan Stanley Capital Trust, Series 2019-L2-XA | | | 1.00 | % (a)(c) | | | 03/15/2052 | | | | 3,496,213 | |
3,845,000 | | Morgan Stanley Capital Trust, Series 2019-L3-AS | | | 3.49 | % | | | 11/15/2052 | | | | 3,354,522 | |
156,393,581 | | Morgan Stanley Capital Trust, Series 2019-L3-XA | | | 0.64 | % (a)(c) | | | 11/15/2052 | | | | 5,006,393 | |
3,355,000 | | Morgan Stanley Capital Trust, Series 2019-NUGS-D (1 Month LIBOR USD + 1.80%, 3.30% Floor) | | | 6.48 | % (h) | | | 12/15/2036 | | | | 2,644,743 | |
1,315,000 | | Morgan Stanley Capital Trust, Series 2019-PLND-B (1 Month LIBOR USD + 1.30%, 1.30% Floor) | | | 5.98 | % (h) | | | 05/15/2036 | | | | 1,237,560 | |
6,002,000 | | Morgan Stanley Capital Trust, Series 2019-PLND-E (1 Month LIBOR USD + 2.15%, 2.15% Floor) | | | 6.83 | % (h) | | | 05/15/2036 | | | | 4,856,223 | |
2,200,000 | | Morgan Stanley Capital Trust, Series 2020-HR8-B | | | 2.70 | % | | | 07/15/2053 | | | | 1,675,245 | |
24,004,000 | | Morgan Stanley Capital Trust, Series 2020-L4-B | | | 3.08 | % | | | 02/15/2053 | | | | 19,248,147 | |
286,683,821 | | Morgan Stanley Capital Trust, Series 2020-L4-XA | | | 1.07 | % (a)(c) | | | 02/15/2053 | | | | 16,927,705 | |
4,353,603 | | Morgan Stanley Capital Trust, Series 2021-ILP-A (1 Month LIBOR USD + 0.78%, 0.78% Floor) | | | 5.46 | % (h) | | | 11/15/2023 | | | | 4,183,117 | |
17,924,725 | | Morgan Stanley Capital Trust, Series 2021-ILP-D (1 Month LIBOR USD + 1.58%, 1.58% Floor) | | | 6.26 | % (h) | | | 11/15/2023 | | | | 16,538,951 | |
10,779,000 | | Morgan Stanley Capital Trust, Series 2021-L6-C | | | 3.46 | % (a) | | | 06/15/2054 | | | | 7,813,785 | |
7,794,000 | | MRCD Mortgage Trust, Series 2019-PARK-F | | | 2.72 | % (h) | | | 12/15/2036 | | | | 6,457,995 | |
32,926,000 | | MRCD Mortgage Trust, Series 2019-PARK-G | | | 2.72 | % (h) | | | 12/15/2036 | | | | 18,259,564 | |
1,060,091 | | MSCG Trust, Series 2018-SELF-F (1 Month LIBOR USD + 3.05%, 3.05% Floor) | | | 7.74 | % (h) | | | 10/15/2037 | | | | 986,420 | |
6,056,876 | | Natixis Commercial Mortgage Securities Trust, Series 2018-FL1-A (1 Month LIBOR USD + 0.95%, 0.95% Floor) | | | 5.63 | % (h) | | | 06/15/2035 | | | | 5,869,690 | |
13,188,800 | | Natixis Commercial Mortgage Securities Trust, Series 2020-2PAC-D | | | 3.75 | % (h) | | | 12/15/2038 | | | | 12,011,121 | |
3,167,783 | | NLY Commercial Mortgage Trust, Series 2019-FL2-AS (1 Month LIBOR USD + 1.60%, 1.60% Floor) | | | 6.28 | % (h) | | | 02/15/2036 | | | | 3,090,397 | |
3,725,000 | | NLY Commercial Mortgage Trust, Series 2019-FL2-B (1 Month LIBOR USD + 1.90%, 1.90% Floor) | | | 6.58 | % (h) | | | 02/15/2036 | | | | 3,514,538 | |
4,425,000 | | NLY Commercial Mortgage Trust, Series 2019-FL2-C (1 Month LIBOR USD + 2.35%, 2.35% Floor) | | | 7.03 | % (h) | | | 02/15/2036 | | | | 4,153,305 | |
7,357,491 | | OPG Trust, Series 2021-PORT-D (1 Month LIBOR USD + 1.13%, 1.13% Floor) | | | 5.82 | % (h) | | | 10/15/2036 | | | | 6,840,571 | |
226,329 | | PFP Ltd., Series 2021-7-A (1 Month LIBOR USD + 0.85%, 0.85% Floor) | | | 5.53 | % (h) | | | 04/14/2038 | | | | 223,144 | |
37,079,000 | | SLG Office Trust, Series 2021-OVA-F | | | 2.85 | % (h) | | | 07/15/2041 | | | | 24,781,468 | |
4,300,344 | | SMR Mortgage Trust, Series 2022-IND-G (Secured Overnight Financing Rate 1 Month + 7.50%, 7.50% Floor) | | | 12.33 | % (h) | | | 02/15/2039 | | | | 3,639,592 | |
2,985,000 | | Soho Trust, Series 2021-SOHO-B | | | 2.70 | % (a)(h) | | | 08/10/2038 | | | | 2,067,950 | |
1,629,000 | | SREIT Trust, Series 2021-IND-F (1 Month LIBOR USD + 2.54%, 2.54% Floor) | | | 7.22 | % (h) | | | 10/15/2038 | | | | 1,447,726 | |
56,592,000 | | SREIT Trust, Series 2021-IND-G (1 Month LIBOR USD + 3.27%, 3.27% Floor) | | | 7.95 | % (h) | | | 10/15/2038 | | | | 50,614,906 | |
5,300,000 | | SREIT Trust, Series 2021-MFP-E (1 Month LIBOR USD + 2.03%, 2.03% Floor) | | | 6.71 | % (h) | | | 11/15/2038 | | | | 4,930,921 | |
10,245,586 | | TRTX Issuer Ltd., Series 2019-FL3-AS (Secured Overnight Financing Rate 1 Month + 1.56%, 1.45% Floor) | | | 6.31 | % (h) | | | 10/15/2034 | | | | 10,088,829 | |
12,261,000 | | TRTX Issuer Ltd., Series 2021-FL4-A (1 Month LIBOR USD + 1.20%, 1.20% Floor) | | | 5.91 | % (h) | | | 03/15/2038 | | | | 12,057,639 | |
24,581,368 | | TTAN, Series 2021-MHC-F (1 Month LIBOR USD + 2.90%, 2.90% Floor) | | | 7.59 | % (h) | | | 03/15/2038 | | | | 22,999,970 | |
8,000,000 | | UBS Commercial Mortgage Trust, Series 2017-C1-C | | | 4.44 | % | | | 06/15/2050 | | | | 6,775,909 | |
83,565,597 | | UBS Commercial Mortgage Trust, Series 2017-C1-XA | | | 1.52 | % (a)(c) | | | 06/15/2050 | | | | 4,019,539 | |
1,154,000 | | UBS Commercial Mortgage Trust, Series 2017-C2-C | | | 4.30 | % (a) | | | 08/15/2050 | | | | 978,926 | |
6,857,000 | | UBS Commercial Mortgage Trust, Series 2017-C3-B | | | 4.09 | % (a) | | | 08/15/2050 | | | | 5,974,214 | |
10,628,177 | | UBS Commercial Mortgage Trust, Series 2017-C3-XA | | | 1.12 | % (a)(c) | | | 08/15/2050 | | | | 336,358 | |
3,561,000 | | UBS Commercial Mortgage Trust, Series 2017-C4-B | | | 4.24 | % (a) | | | 10/15/2050 | | | | 3,208,810 | |
2,886,000 | | UBS Commercial Mortgage Trust, Series 2017-C6-C | | | 4.62 | % (a) | | | 12/15/2050 | | | | 2,468,710 | |
1,500,000 | | UBS Commercial Mortgage Trust, Series 2018-C9-C | | | 4.95 | % (a) | | | 03/15/2051 | | | | 1,306,554 | |
39,527,005 | | UBS Commercial Mortgage Trust, Series 2018-C9-XA | | | 0.92 | % (a)(c) | | | 03/15/2051 | | | | 1,475,674 | |
8,350,000 | | UBS Commercial Mortgage Trust, Series 2019-C17-AS | | | 3.20 | % | | | 10/15/2052 | | | | 7,006,051 | |
14,858,000 | | UBS Commercial Mortgage Trust, Series 2019-C18-AS | | | 3.38 | % (a) | | | 12/15/2052 | | | | 12,844,823 | |
9,705,000 | | UBS Commercial Mortgage Trust, Series 2019-C18-B | | | 3.68 | % (a) | | | 12/15/2052 | | | | 8,142,390 | |
4,346,710 | | Wells Fargo Commercial Mortgage Trust, Series 2014-LC18-B | | | 3.96 | % | | | 12/15/2047 | | | | 4,103,179 | |
11,460,000 | | Wells Fargo Commercial Mortgage Trust, Series 2015-C26-C | | | 4.07 | % (a) | | | 02/15/2048 | | | | 10,547,574 | |
338,224,618 | | Wells Fargo Commercial Mortgage Trust, Series 2015-C26-XA | | | 1.19 | % (a)(c) | | | 02/15/2048 | | | | 5,730,168 | |
3,187,500 | | Wells Fargo Commercial Mortgage Trust, Series 2015-C27-C | | | 3.89 | % | | | 02/15/2048 | | | | 2,763,111 | |
183,975,698 | | Wells Fargo Commercial Mortgage Trust, Series 2015-C27-XA | | | 0.84 | % (a)(c) | | | 02/15/2048 | | | | 2,216,870 | |
9,701,000 | | Wells Fargo Commercial Mortgage Trust, Series 2015-C31-C | | | 4.60 | % (a) | | | 11/15/2048 | | | | 8,736,523 | |
119,376,142 | | Wells Fargo Commercial Mortgage Trust, Series 2015-C31-XA | | | 0.95 | % (a)(c) | | | 11/15/2048 | | | | 2,326,390 | |
222,043,638 | | Wells Fargo Commercial Mortgage Trust, Series 2015-LC20-XA | | | 1.29 | % (a)(c) | | | 04/15/2050 | | | | 4,037,508 | |
3,000,000 | | Wells Fargo Commercial Mortgage Trust, Series 2015-LC22-C | | | 4.55 | % (a) | | | 09/15/2058 | | | | 2,737,613 | |
8,438,000 | | Wells Fargo Commercial Mortgage Trust, Series 2015-NXS2-C | | | 4.28 | % (a) | | | 07/15/2058 | | | | 7,521,451 | |
83,761,608 | | Wells Fargo Commercial Mortgage Trust, Series 2015-P2-XA | | | 0.93 | % (a)(c) | | | 12/15/2048 | | | | 1,712,313 | |
10,085,000 | | Wells Fargo Commercial Mortgage Trust, Series 2016-C32-C | | | 4.73 | % (a) | | | 01/15/2059 | | | | 9,181,235 | |
4,250,000 | | Wells Fargo Commercial Mortgage Trust, Series 2016-C34-B | | | 4.09 | % | | | 06/15/2049 | | | | 3,741,530 | |
5,888,000 | | Wells Fargo Commercial Mortgage Trust, Series 2016-C34-C | | | 5.06 | % (a) | | | 06/15/2049 | | | | 4,625,650 | |
5,890,000 | | Wells Fargo Commercial Mortgage Trust, Series 2016-LC24-C | | | 4.43 | % (a) | | | 10/15/2049 | | | | 5,134,934 | |
2,155,000 | | Wells Fargo Commercial Mortgage Trust, Series 2016-NXS6-C | | | 4.39 | % (a) | | | 11/15/2049 | | | | 1,878,469 | |
99,793,597 | | Wells Fargo Commercial Mortgage Trust, Series 2016-NXS6-XA | | | 1.58 | % (a)(c) | | | 11/15/2049 | | | | 3,961,007 | |
187,721,392 | | Wells Fargo Commercial Mortgage Trust, Series 2017-C39-XA | | | 1.10 | % (a)(c) | | | 09/15/2050 | | | | 6,601,129 | |
8,014,000 | | Wells Fargo Commercial Mortgage Trust, Series 2017-C41-C | | | 4.49 | % (a) | | | 11/15/2050 | | | | 6,752,644 | |
1,904,000 | | Wells Fargo Commercial Mortgage Trust, Series 2017-C42-C | | | 4.30 | % (a) | | | 12/15/2050 | | | | 1,585,134 | |
48,908,667 | | Wells Fargo Commercial Mortgage Trust, Series 2017-C42-XA | | | 0.86 | % (a)(c) | | | 12/15/2050 | | | | 1,608,836 | |
1,758,000 | | Wells Fargo Commercial Mortgage Trust, Series 2017-RC1-C | | | 4.59 | % | | | 01/15/2060 | | | | 1,539,754 | |
142,309,245 | | Wells Fargo Commercial Mortgage Trust, Series 2018-C43-XA | | | 0.59 | % (a)(c) | | | 03/15/2051 | | | | 3,387,074 | |
74,577,311 | | Wells Fargo Commercial Mortgage Trust, Series 2019-C50-XA | | | 1.41 | % (a)(c) | | | 05/15/2052 | | | | 4,461,021 | |
3,193,000 | | Wells Fargo Commercial Mortgage Trust, Series 2019-C51-B | | | 3.84 | % (a) | | | 06/15/2052 | | | | 2,733,005 | |
48,130,708 | | Wells Fargo Commercial Mortgage Trust, Series 2019-C51-XA | | | 1.33 | % (a)(c) | | | 06/15/2052 | | | | 2,744,365 | |
24,972,000 | | Wells Fargo Commercial Mortgage Trust, Series 2019-C52-AS | | | 3.14 | % | | | 08/15/2052 | | | | 21,118,204 | |
77,052,702 | | Wells Fargo Commercial Mortgage Trust, Series 2019-C52-XA | | | 1.60 | % (a)(c) | | | 08/15/2052 | | | | 5,534,511 | |
5,000,000 | | Wells Fargo Commercial Mortgage Trust, Series 2019-C53-C | | | 3.58 | % (a) | | | 10/15/2052 | | | | 3,856,524 | |
141,714,224 | | Wells Fargo Commercial Mortgage Trust, Series 2019-C54-XA | | | 0.83 | % (a)(c) | | | 12/15/2052 | | | | 5,950,113 | |
28,088,000 | | Wells Fargo Commercial Mortgage Trust, Series 2020-C55-AS | | | 2.94 | % | | | 02/15/2053 | | | | 23,638,417 | |
52,886,315 | | Wells Fargo Commercial Mortgage Trust, Series 2020-C55-XB | | | 0.81 | % (a)(c) | | | 02/15/2053 | | | | 2,394,999 | |
160,598,786 | | Wells Fargo Commercial Mortgage Trust, Series 2020-C56-XA | | | 1.40 | % (a)(c) | | | 06/15/2053 | | | | 10,354,045 | |
93,253,429 | | Wells Fargo Commercial Mortgage Trust, Series 2020-C58-XA | | | 1.82 | % (a)(c) | | | 07/15/2053 | | | | 9,248,157 | |
174,030,808 | | Wells Fargo Commercial Mortgage Trust, Series 2021-C61-XA | | | 1.37 | % (a)(c) | | | 11/15/2054 | | | | 12,976,416 | |
2,022,574 | | Wells Fargo Commercial Mortgage Trust, Series 2021-SAVE-C (1 Month LIBOR USD + 1.80%, 1.80% Floor) | | | 6.48 | % (h) | | | 02/15/2040 | | | | 1,845,735 | |
659,041 | | Wells Fargo Commercial Mortgage Trust, Series 2021-SAVE-D (1 Month LIBOR USD + 2.50%, 2.50% Floor) | | | 7.18 | % (h) | | | 02/15/2040 | | | | 590,046 | |
1,658,965 | | Wells Fargo Commercial Mortgage Trust, Series 2021-SAVE-E (1 Month LIBOR USD + 3.65%, 3.65% Floor) | | | 8.33 | % (h) | | | 02/15/2040 | | | | 1,472,495 | |
84,909,945 | | WF-RBS Commercial Mortgage Trust, Series 2013-C18-XA | | | 0.70 | % (a)(c) | | | 12/15/2046 | | | | 260,054 | |
100,762,024 | | WF-RBS Commercial Mortgage Trust, Series 2014-C19-XA | | | 0.96 | % (a)(c) | | | 03/15/2047 | | | | 515,247 | |
10,000,000 | | WF-RBS Commercial Mortgage Trust, Series 2014-C21-B | | | 4.21 | % (a) | | | 08/15/2047 | | | | 9,318,400 | |
3,147,000 | | WF-RBS Commercial Mortgage Trust, Series 2014-C21-C | | | 4.23 | % (a) | | | 08/15/2047 | | | | 2,651,916 | |
159,958,615 | | WF-RBS Commercial Mortgage Trust, Series 2014-C25-XA | | | 0.79 | % (a)(c) | | | 11/15/2047 | | | | 1,555,502 | |
| | | | | | | | | | | | | | |
Total Non-Agency Commercial Mortgage Backed Obligations (Cost $3,430,510,206) | | | | | | | | | | | 2,620,162,465 | |
| | | | | | | | | | | | | | |
Non-Agency Residential Collateralized Mortgage Obligations - 26.9% | |
89,834,527 | | ABFC Trust, Series 2007-WMC1-A1A (1 Month LIBOR USD + 1.25%, 1.25% Floor) | | | 6.10 | % | | | 06/25/2037 | | | | 62,380,709 | |
12,875,000 | | Accredited Mortgage Loan Trust, Series 2006-1-M2 (1 Month LIBOR USD + 0.34%, 0.34% Floor) | | | 1.15 | % | | | 04/25/2036 | | | | 9,184,552 | |
13,085,000 | | Accredited Mortgage Loan Trust, Series 2006-2-M2 (1 Month LIBOR USD + 0.29%, 0.29% Floor) | | | 5.14 | % | | | 09/25/2036 | | | | 9,662,217 | |
1,561,590 | | ACE Securities Corporation Home Equity Loan Trust, Series 2007-ASP1-A2C (1 Month LIBOR USD + 0.52%, 0.52% Floor) | | | 5.37 | % | | | 03/25/2037 | | | | 694,153 | |
11,067,863 | | ACE Securities Corporation Home Equity Loan Trust, Series 2007-HE1-A2B (1 Month LIBOR USD + 0.24%, 0.24% Floor) | | | 5.09 | % | | | 01/25/2037 | | | | 6,434,874 | |
2,579,072 | | ACE Securities Corporation Home Equity Loan Trust, Series 2007-HE1-A2C (1 Month LIBOR USD + 0.34%, 0.34% Floor) | | | 5.19 | % | | | 01/25/2037 | | | | 1,499,462 | |
2,417,881 | | ACE Securities Corporation Home Equity Loan Trust, Series 2007-HE1-A2D (1 Month LIBOR USD + 0.50%, 0.50% Floor) | | | 5.35 | % | | | 01/25/2037 | | | | 1,405,708 | |
73,044,842 | | ACE Securities Corporation Home Equity Loan Trust, Series 2007-WM1-A1A (1 Month LIBOR USD + 0.14%, 0.14% Floor) | | | 4.99 | % | | | 11/25/2036 | | | | 24,040,087 | |
4,025,863 | | ACE Securities Corporation Home Equity Loan Trust, Series 2007-WM1-A2A (1 Month LIBOR USD + 0.07%, 0.07% Floor) | | | 4.92 | % | | | 11/25/2036 | | | | 1,680,698 | |
4,352,271 | | ACE Securities Corporation Home Equity Loan Trust, Series 2007-WM1-A2D (1 Month LIBOR USD + 0.22%, 0.22% Floor) | | | 5.07 | % | | | 11/25/2036 | | | | 1,842,024 | |
2,852,333 | | ACE Securities Corporation Home Equity Loan Trust, Series 2007-WM2-A2C (1 Month LIBOR USD + 0.28%, 0.28% Floor) | | | 5.13 | % | | | 02/25/2037 | | | | 1,229,338 | |
2,500,528 | | ACE Securities Corporation Home Equity Loan Trust, Series 2007-WM2-A2D (1 Month LIBOR USD + 0.37%, 0.37% Floor) | | | 5.22 | % | | | 02/25/2037 | | | | 1,077,687 | |
3,015,394 | | Adjustable Rate Mortgage Trust, Series 2004-4-CB1 (1 Month LIBOR USD + 1.15%, 1.15% Floor, 10.00% Cap) | | | 6.00 | % | | | 03/25/2035 | | | | 2,414,983 | |
597,189 | | Adjustable Rate Mortgage Trust, Series 2005-10-3A31 | | | 3.29 | % (a) | | | 01/25/2036 | | | | 535,017 | |
19,465,137 | | Adjustable Rate Mortgage Trust, Series 2005-11-4A1 | | | 3.77 | % (a) | | | 02/25/2036 | | | | 11,731,595 | |
1,650,752 | | Adjustable Rate Mortgage Trust, Series 2005-4-2A1 | | | 4.29 | % (a) | | | 08/25/2035 | | | | 1,520,589 | |
137,202 | | Adjustable Rate Mortgage Trust, Series 2005-7-3A1 | | | 3.80 | % (a) | | | 10/25/2035 | | | | 129,798 | |
4,193,249 | | Adjustable Rate Mortgage Trust, Series 2005-8-3A21 | | | 3.61 | % (a) | | | 11/25/2035 | | | | 3,192,055 | |
11,377,014 | | Adjustable Rate Mortgage Trust, Series 2006-1-2A1 | | | 4.60 | % (a) | | | 03/25/2036 | | | | 6,675,778 | |
6,922,198 | | Adjustable Rate Mortgage Trust, Series 2006-2-3A1 | | | 4.57 | % (a) | | | 05/25/2036 | | | | 5,979,980 | |
10,289,180 | | Adjustable Rate Mortgage Trust, Series 2006-2-5A1 | | | 4.45 | % (a) | | | 05/25/2036 | | | | 2,739,704 | |
5,291,186 | | Adjustable Rate Mortgage Trust, Series 2007-1-3A1 | | | 4.38 | % (a) | | | 03/25/2037 | | | | 4,480,749 | |
899,804 | | Adjustable Rate Mortgage Trust, Series 2007-3-1A1 | | | 4.29 | % (a)(h) | | | 11/25/2037 | | | | 850,527 | |
242,851 | | Aegis Asset Backed Securities Corporation Mortgage Pass-Through Certificates, Series 2003-2-M2 (1 Month LIBOR USD + 2.55%, 2.55% Floor) | | | 7.40 | % | | | 11/25/2033 | | | | 212,387 | |
800,034 | | Aegis Asset Backed Securities Corporation Mortgage Pass-Through Certificates, Series 2004-1-M2 (1 Month LIBOR USD + 2.03%, 2.03% Floor) | | | 6.88 | % | | | 04/25/2034 | | | | 711,687 | |
617,792 | | Aegis Asset Backed Securities Corporation Mortgage Pass-Through Certificates, Series 2004-2-M2 (1 Month LIBOR USD + 1.95%, 1.95% Floor) | | | 6.80 | % | | | 06/25/2034 | | | | 582,016 | |
4,989,984 | | Aegis Asset Backed Securities Trust, Series 2004-6-M2 (1 Month LIBOR USD + 1.00%, 1.00% Floor, 15.00% Cap) | | | 5.85 | % | | | 03/25/2035 | | | | 4,626,811 | |
9,782,433 | | Aegis Asset Backed Securities Trust, Series 2006-1-A2 (1 Month LIBOR USD + 0.17%, 0.17% Floor, 12.00% Cap) | | | 5.02 | % | | | 01/25/2037 | | | | 7,333,419 | |
36,134,436 | | Ajax Master Trust, Series 2016-1-PC | | | 4.81 | % (a)(h) | | | 01/01/2057 | | | | 27,924,753 | |
38,141,980 | | Ajax Master Trust, Series 2016-2-PC | | | 3.72 | % (a)(h) | | | 10/25/2056 | | | | 27,302,601 | |
45,762,130 | | Ajax Master Trust, Series 2017-1-PC | | | 3.40 | % (a)(b)(h) | | | 06/25/2057 | | | | 34,935,039 | |
17,347,198 | | AJAX Mortgage Loan Trust, Series 2020-D-A | | | 2.25 | % (h)(k) | | | 06/25/2060 | | | | 16,653,371 | |
15,494,509 | | AlphaFlow Transitional Mortgage Trust, Series 2021-WL1-A1 | | | 3.28 | % (h)(k) | | | 01/25/2026 | | | | 15,277,923 | |
3,227,207 | | American Home Mortgage Assets Trust, Series 2006-2-2A1 (1 Month LIBOR USD + 0.38%, 0.38% Floor) | | | 5.23 | % | | | 09/25/2046 | | | | 2,646,017 | |
2,983,082 | | American Home Mortgage Investment Trust, Series 2005-4-3A1 (1 Month LIBOR USD + 0.60%, 0.60% Floor, 11.00% Cap) | | | 5.45 | % | | | 11/25/2045 | | | | 2,084,858 | |
13,132,546 | | American Home Mortgage Investment Trust, Series 2005-4-5A (6 Month LIBOR USD + 1.75%, 1.75% Floor, 11.00% Cap) | | | 7.02 | % | | | 11/25/2045 | | | | 6,008,163 | |
2,146,383 | | American Home Mortgage Investment Trust, Series 2006-2-3A4 | | | 7.10 | % | | | 06/25/2036 | | | | 369,993 | |
7,248,123 | | American Home Mortgage Investment Trust, Series 2007-A-13A1 | | | 6.60 | % (h) | | | 01/25/2037 | | | | 1,422,619 | |
6,862,903 | | Ameriquest Mortgage Securities Trust, Series 2004-FR1-M1 | | | 3.93 | % | | | 05/25/2034 | | | | 6,604,890 | |
108,292,944 | | Ameriquest Mortgage Securities Trust, Series 2006-M3-A1 (1 Month LIBOR USD + 0.18%, 0.18% Floor) | | | 5.02 | % | | | 10/25/2036 | | | | 59,524,592 | |
5,193,001 | | Amortizing Residential Collateral Trust, Series 2002-BC7-M1 (1 Month LIBOR USD + 1.20%, 1.20% Floor) | | | 6.05 | % | | | 10/25/2032 | | | | 3,966,835 | |
41,588,000 | | AMSR Trust, Series 2019-SFR1-E | | | 3.47 | % (h) | | | 01/19/2039 | | | | 38,012,534 | |
30,156,000 | | AMSR Trust, Series 2020-SFR4-G1 | | | 4.00 | % (h) | | | 11/17/2037 | | | | 27,636,044 | |
10,000,000 | | AMSR Trust, Series 2020-SFR5-F | | | 2.69 | % (h) | | | 11/17/2037 | | | | 8,952,881 | |
6,500,000 | | AMSR Trust, Series 2021-SFR3-E1 | | | 2.33 | % (h) | | | 10/17/2038 | | | | 5,631,753 | |
11,000,000 | | AMSR Trust, Series 2021-SFR3-E2 | | | 2.43 | % (h) | | | 10/17/2038 | | | | 9,522,049 | |
18,500,000 | | AMSR Trust, Series 2021-SFR3-F | | | 3.23 | % (h) | | | 10/17/2038 | | | | 16,163,609 | |
6,500,000 | | AMSR Trust, Series 2021-SFR4-D | | | 2.77 | % (h) | | | 12/17/2038 | | | | 5,709,013 | |
10,500,000 | | AMSR Trust, Series 2021-SFR4-E1 | | | 2.97 | % (h) | | | 12/17/2038 | | | | 9,077,449 | |
9,177,878 | | Angel Oak Mortgage Trust LLC, Series 2019-2-M1 | | | 4.07 | % (a)(h) | | | 03/25/2049 | | | | 9,031,307 | |
9,121,000 | | Angel Oak Mortgage Trust LLC, Series 2021-7-M1 | | | 3.26 | % (a)(h) | | | 10/25/2066 | | | | 5,836,020 | |
9,652,851 | | Argent Securities Trust, Series 2004-W11-M6 (1 Month LIBOR USD + 1.88%, 1.88% Floor) | | | 6.72 | % | | | 11/25/2034 | | | | 7,751,296 | |
12,599,495 | | Argent Securities Trust, Series 2006-W5-A1A (1 Month LIBOR USD + 0.30%, 0.30% Floor) | | | 5.15 | % | | | 06/25/2036 | | | | 8,317,149 | |
1,641,246 | | Asset Backed Securities Corporation Home Equity Loan Trust, Series 2004-HE3-M2 (1 Month LIBOR USD + 1.68%, 1.68% Floor) | | | 6.53 | % | | | 06/25/2034 | | | | 1,591,017 | |
19,895,841 | | Asset Backed Securities Corporation Home Equity Loan Trust, Series 2006-HE7-A1 (1 Month LIBOR USD + 0.14%, 0.14% Floor) | | | 4.07 | % | | | 11/25/2036 | | | | 17,684,796 | |
464,061 | | Banc of America Alternative Loan Trust, Series 2005-10-4A1 | | | 5.75 | % | | | 11/25/2035 | | | | 287,948 | |
2,334,349 | | Banc of America Alternative Loan Trust, Series 2005-11-2CB1 | | | 6.00 | % | | | 12/25/2035 | | | | 2,105,289 | |
1,698,515 | | Banc of America Alternative Loan Trust, Series 2006-2-1CB1 | | | 6.00 | % | | | 03/25/2036 | | | | 1,527,029 | |
2,074,767 | | Banc of America Alternative Loan Trust, Series 2006-2-3CB1 | | | 6.50 | % | | | 03/25/2036 | | | | 1,834,036 | |
508,874 | | Banc of America Alternative Loan Trust, Series 2006-5-CB14 (1 Month LIBOR USD + 1.10%, 6.00% Floor, 6.00% Cap) | | | 6.00 | % | | | 06/25/2046 | | | | 449,378 | |
1,152,560 | | Banc of America Alternative Loan Trust, Series 2006-6-CB3 | | | 6.00 | % | | | 07/25/2046 | | | | 976,869 | |
8,223,736 | | Banc of America Alternative Loan Trust, Series 2006-7-A4 | | | 6.50 | % | | | 10/25/2036 | | | | 2,419,167 | |
1,579,740 | | Banc of America Alternative Loan Trust, Series 2006-8-1A1 (-1 x 1 Month LIBOR USD + 6.50%, 6.50% Cap) | | | 1.65 | % (c)(d) | | | 11/25/2036 | | | | 138,692 | |
563,010 | | Banc of America Alternative Loan Trust, Series 2006-8-1A2 (1 Month LIBOR USD + 0.45%, 0.45% Floor, 7.00% Cap) | | | 5.30 | % | | | 11/25/2036 | | | | 443,325 | |
2,770,432 | | Banc of America Alternative Loan Trust, Series 2006-9-1CB1 | | | 6.00 | % | | | 01/25/2037 | | | | 2,396,868 | |
461,789 | | Banc of America Alternative Loan Trust, Series 2007-2-2A1 | | | 6.00 | % | | | 06/25/2037 | | | | 383,109 | |
2,400,330 | | Banc of America Funding Trust, Series 2006-2-3A1 | | | 6.00 | % | | | 03/25/2036 | | | | 2,149,744 | |
74,290 | | Banc of America Funding Trust, Series 2006-2-4A1 (-3 x 1 Month LIBOR USD + 22.80%, 22.80% Cap) | | | 8.26 | % (d) | | | 03/25/2036 | | | | 73,028 | |
178,993 | | Banc of America Funding Trust, Series 2006-2-6A2 | | | 5.50 | % | | | 03/25/2036 | | | | 173,363 | |
289,437 | | Banc of America Funding Trust, Series 2006-3-1A1 | | | 6.00 | % | | | 03/25/2036 | | | | 262,559 | |
225,567 | | Banc of America Funding Trust, Series 2006-3-6A1 | | | 6.38 | % (a) | | | 03/25/2036 | | | | 225,532 | |
1,324,474 | | Banc of America Funding Trust, Series 2006-6-1A7 | | | 6.25 | % | | | 08/25/2036 | | | | 1,117,341 | |
513,213 | | Banc of America Funding Trust, Series 2006-7-T2A5 | | | 6.54 | % | | | 10/25/2036 | | | | 439,200 | |
2,418,932 | | Banc of America Funding Trust, Series 2006-7-T2A8 | | | 6.41 | % | | | 10/25/2036 | | | | 2,070,204 | |
624,210 | | Banc of America Funding Trust, Series 2006-8T2-A8 | | | 6.10 | % | | | 10/25/2036 | | | | 548,079 | |
278,725 | | Banc of America Funding Trust, Series 2006-B-7A1 | | | 3.68 | % (a) | | | 03/20/2036 | | | | 224,655 | |
4,187,107 | | Banc of America Funding Trust, Series 2006-D-6A1 | | | 3.44 | % (a) | | | 05/20/2036 | | | | 3,220,744 | |
128,983 | | Banc of America Funding Trust, Series 2006-H-3A1 | | | 3.88 | % (a) | | | 09/20/2046 | | | | 104,867 | |
46,291,959 | | Banc of America Funding Trust, Series 2006-H-5A1 (1 Month LIBOR USD + 0.36%, 0.36% Floor, 10.50% Cap) | | | 5.12 | % | | | 10/20/2036 | | | | 17,488,852 | |
494,776 | | Banc of America Funding Trust, Series 2007-1-TA10 | | | 6.34 | % | | | 01/25/2037 | | | | 442,187 | |
678,201 | | Banc of America Funding Trust, Series 2007-3-TA1B | | | 5.83 | % (a) | | | 04/25/2037 | | | | 588,068 | |
1,154,208 | | Banc of America Funding Trust, Series 2007-5-1A1 | | | 5.50 | % | | | 07/25/2037 | | | | 912,905 | |
818,844 | | Banc of America Funding Trust, Series 2009-R14A-3A (-2 x 1 Month LIBOR USD + 16.57%, 5.50% Floor, 16.57% Cap) | | | 5.80 | % (d)(h) | | | 06/26/2035 | | | | 758,740 | |
1,088,107 | | Banc of America Funding Trust, Series 2009-R15A-4A2 | | | 5.75 | % (a)(h) | | | 12/26/2036 | | | | 921,988 | |
625,012 | | Banc of America Funding Trust, Series 2010-R1-3A (-2 x 1 Month LIBOR USD + 14.28%, 6.00% Floor, 14.28% Cap) | | | 7.13 | % (d)(h) | | | 07/26/2036 | | | | 596,900 | |
5,379,773 | | Banc of America Funding Trust, Series 2014-R6-3A2 | | | 4.89 | % (a)(b)(e)(h) | | | 10/26/2036 | | | | 4,565,822 | |
12,760,425 | | Banc of America Funding Trust, Series 2014-R8-A2 (1 Month LIBOR USD + 0.24%, 0.24% Floor) | | | 5.09 | % (h) | | | 06/26/2036 | | | | 10,651,527 | |
20,909,406 | | Banc of America Funding Trust, Series 2015-R2-4A2 (1 Month LIBOR USD + 0.17%, 0.17% Floor) | | | 3.81 | % (h) | | | 09/29/2036 | | | | 16,462,910 | |
1,325,318 | | Banc of America Mortgage Trust, Series 2006-1-A9 | | | 6.00 | % | | | 05/25/2036 | | | | 1,114,847 | |
159,356 | | Banc of America Mortgage Trust, Series 2007-1-2A5 | | | 5.75 | % | | | 01/25/2037 | | | | 132,280 | |
3,448,090 | | Banc of America Mortgage Trust, Series 2007-3-2A8 | | | 7.00 | % | | | 09/25/2037 | | | | 2,939,482 | |
5,975,340 | | BankUnited Trust, Series 2005-1-2A1 | | | 4.07 | % (a) | | | 09/25/2045 | | | | 5,195,850 | |
837,226 | | Bayview Commercial Asset Trust, Series 2007-3-A2 (1 Month LIBOR USD + 0.29%) | | | 5.14 | % (h) | | | 07/25/2037 | | | | 748,245 | |
2,708,642 | | Bayview Financial Mortgage Pass-Through Trust, Series 2006-C-2A4 (1 Month LIBOR USD + 0.42%) | | | 5.25 | % | | | 11/28/2036 | | | | 2,286,124 | |
24,385,265 | | BCAP LLC Trust, Series 2007-AA2-11A (1 Month LIBOR USD + 0.38%, 0.38% Floor) | | | 5.23 | % (h) | | | 05/25/2047 | | | | 23,916,858 | |
2,051,817 | | BCAP LLC Trust, Series 2007-AA2-2A7 | | | 6.00 | % | | | 04/25/2037 | | | | 1,061,983 | |
2,221,341 | | BCAP LLC Trust, Series 2007-AA2-2A8 | | | 5.75 | % | | | 04/25/2037 | | | | 1,112,649 | |
10,224,912 | | BCAP LLC Trust, Series 2008-RR3-A1B | | | 6.69 | % (a)(h) | | | 10/25/2036 | | | | 3,080,674 | |
1,523,604 | | BCAP LLC Trust, Series 2009-RR13-18A2 | | | 5.75 | % (a)(h) | | | 07/26/2037 | | | | 833,443 | |
2,633,219 | | BCAP LLC Trust, Series 2009-RR4-4A2 | | | 5.75 | % (a)(h) | | | 02/26/2036 | | | | 1,271,940 | |
6,490,972 | | BCAP LLC Trust, Series 2010-RR6-7A10 | | | 6.00 | % (a)(h) | | | 02/26/2037 | | | | 2,920,725 | |
634,243 | | Bear Stearns Adjustable Rate Mortgage Trust, Series 2005-12-13A1 | | | 4.41 | % (a) | | | 02/25/2036 | | | | 470,097 | |
2,459,209 | | Bear Stearns Adjustable Rate Mortgage Trust, Series 2006-4-4A1 | | | 3.94 | % (a) | | | 10/25/2046 | | | | 1,986,844 | |
3,008,912 | | Bear Stearns Adjustable Rate Mortgage Trust, Series 2007-1-2A1 | | | 4.35 | % (a) | | | 02/25/2047 | | | | 2,568,269 | |
817,169 | | Bear Stearns Adjustable Rate Mortgage Trust, Series 2007-1-3A1 | | | 3.88 | % (a) | | | 02/25/2047 | | | | 748,793 | |
10,459,954 | | Bear Stearns Adjustable Rate Mortgage Trust, Series 2007-2-2A1 (12 Month LIBOR USD + 1.88%, 1.88% Floor, 11.15% Cap) | | | 6.66 | % | | | 12/25/2046 | | | | 8,254,361 | |
236,487 | | Bear Stearns ALT-A Trust, Series 2004-11-2A3 | | | 4.67 | % (a) | | | 11/25/2034 | | | | 232,436 | |
4,920,801 | | Bear Stearns ALT-A Trust, Series 2006-1-11A1 (1 Month LIBOR USD + 0.48%, 0.48% Floor, 11.50% Cap) | | | 5.33 | % | | | 02/25/2036 | | | | 4,776,766 | |
13,894,484 | | Bear Stearns ALT-A Trust, Series 2006-3-21A1 | | | 3.67 | % (a) | | | 05/25/2036 | | | | 10,544,538 | |
4,076,647 | | Bear Stearns ALT-A Trust, Series 2006-5-1A1 (1 Month LIBOR USD + 0.34%, 0.34% Floor, 11.50% Cap) | | | 5.19 | % | | | 08/25/2036 | | | | 3,279,286 | |
6,733,688 | | Bear Stearns ALT-A Trust, Series 2006-6-2A1 | | | 3.69 | % (a) | | | 11/25/2036 | | | | 3,125,200 | |
3,226,481 | | Bear Stearns ALT-A Trust, Series 2006-8-2A1 | | | 3.68 | % (a) | | | 08/25/2046 | | | | 2,243,675 | |
5,788,933 | | Bear Stearns ALT-A Trust, Series 2007-1-1A1 (1 Month LIBOR USD + 0.32%, 0.32% Floor, 11.50% Cap) | | | 5.17 | % | | | 01/25/2047 | | | | 4,478,056 | |
2,631,926 | | Bear Stearns Asset Backed Securities Trust, Series 2004-AC4-A2 | | | 5.50 | % | | | 08/25/2034 | | | | 2,630,382 | |
6,067,957 | | Bear Stearns Asset Backed Securities Trust, Series 2005-AC2-1A | | | 5.75 | % | | | 04/25/2035 | | | | 5,226,410 | |
1,979,301 | | Bear Stearns Asset Backed Securities Trust, Series 2005-AC2-2A1 | | | 5.75 | % | | | 04/25/2035 | | | | 1,842,688 | |
28,973,967 | | Bear Stearns Asset Backed Securities Trust, Series 2005-AC6-22A | | | 5.19 | % (a) | | | 09/25/2035 | | | | 23,611,039 | |
4,868,201 | | Bear Stearns Asset Backed Securities Trust, Series 2005-AC7-A4 | | | 6.00 | % | | | 10/25/2035 | | | | 3,297,080 | |
7,839,562 | | Bear Stearns Asset Backed Securities Trust, Series 2006-AC1-1A1 | | | 6.25 | % | | | 02/25/2036 | | | | 4,157,429 | |
1,289,182 | | Bear Stearns Asset Backed Securities Trust, Series 2006-AC5-A1 | | | 6.75 | % | | | 12/25/2036 | | | | 1,265,846 | |
2,364,204 | | Bear Stearns Asset Backed Securities Trust, Series 2007-HE2-2A3 (1 Month LIBOR USD + 0.16%, 0.16% Floor) | | | 5.01 | % | | | 02/25/2037 | | | | 2,338,057 | |
24,557,053 | | Bear Stearns Asset Backed Securities Trust, Series 2007-HE4-2A (1 Month LIBOR USD + 0.22%, 0.22% Floor) | | | 5.07 | % | | | 05/25/2037 | | | | 22,086,628 | |
12,707,892 | | Bear Stearns Asset Backed Securities Trust, Series 2007-HE6-2A (1 Month LIBOR USD + 1.05%, 1.05% Floor) | | | 5.90 | % | | | 08/25/2037 | | | | 10,494,097 | |
1,140,350 | | Bear Stearns Asset Backed Securities Trust, Series 2007-SD1-1A2A | | | 6.00 | % | | | 10/25/2036 | | | | 613,013 | |
1,288,446 | | Bear Stearns Asset Backed Securities Trust, Series 2007-SD1-1A3A | | | 6.50 | % | | | 10/25/2036 | | | | 701,153 | |
1,597,865 | | Bear Stearns Asset Backed Securities Trust, Series 2007-SD1-23A1 | | | 4.38 | % (a) | | | 10/25/2036 | | | | 1,135,638 | |
6,431,156 | | Bear Stearns Mortgage Funding Trust, Series 2006-AR3-2A1 (1 Month LIBOR USD + 0.40%, 0.40% Floor, 10.50% Cap) | | | 5.25 | % | | | 11/25/2036 | | | | 5,475,547 | |
3,056,094 | | Bear Stearns Mortgage Funding Trust, Series 2006-AR4-A2 (1 Month LIBOR USD + 0.18%, 0.18% Floor, 10.50% Cap) | | | 5.21 | % | | | 12/25/2037 | | | | 2,672,746 | |
6,883,869 | | Bear Stearns Mortgage Funding Trust, Series 2007-AR3-22A1 (1 Month LIBOR USD + 0.32%, 0.32% Floor, 10.50% Cap) | | | 5.17 | % | | | 04/25/2037 | | | | 6,630,527 | |
7,696,211 | | BNC Mortgage Loan Trust, Series 2006-2-A4 (1 Month LIBOR USD + 0.32%, 0.32% Floor) | | | 5.17 | % | | | 11/25/2036 | | | | 7,436,710 | |
5,926,840 | | BNC Mortgage Loan Trust, Series 2007-1-A4 (1 Month LIBOR USD + 0.16%, 0.16% Floor) | | | 5.01 | % | | | 03/25/2037 | | | | 5,466,645 | |
5,859,161 | | BNC Mortgage Loan Trust, Series 2007-4-A4 (1 Month LIBOR USD + 1.50%, 1.50% Floor) | | | 6.35 | % | | | 11/25/2037 | | | | 4,751,656 | |
24,137,424 | | BNPP Mortgage Securities LLC Trust, Series 2009-1-B1 | | | 6.00 | % (h) | | | 08/27/2037 | | | | 12,878,841 | |
100,200,000 | | CAFL Issuer LLC, Series 2021-RTL1-A1 | | | 2.24 | % (h)(k) | | | 03/28/2029 | | | | 91,953,740 | |
12,750,000 | | CAFL Issuer LLC, Series 2021-RTL1-A2 | | | 3.10 | % (h)(k) | | | 03/28/2029 | | | | 11,629,730 | |
4,320,219 | | Carrington Mortgage Loan Trust, Series 2006-FRE2-A2 (1 Month LIBOR USD + 0.12%, 0.12% Floor, 12.50% Cap) | | | 4.97 | % | | | 10/25/2036 | | | | 3,336,423 | |
20,831,557 | | Carrington Mortgage Loan Trust, Series 2006-FRE2-A3 (1 Month LIBOR USD + 0.16%, 0.16% Floor, 12.50% Cap) | | | 5.01 | % | | | 10/25/2036 | | | | 16,099,100 | |
6,411,795 | | Carrington Mortgage Loan Trust, Series 2006-FRE2-A4 (1 Month LIBOR USD + 0.25%, 0.25% Floor, 12.50% Cap) | | | 5.10 | % | | | 10/25/2036 | | | | 4,958,909 | |
4,621,657 | | Carrington Mortgage Loan Trust, Series 2006-NC3-A3 (1 Month LIBOR USD + 0.15%, 0.15% Floor, 12.50% Cap) | | | 5.00 | % | | | 08/25/2036 | | | | 4,342,622 | |
43,234,273 | | Carrington Mortgage Loan Trust, Series 2006-NC4-A3 (1 Month LIBOR USD + 0.16%, 0.16% Floor, 12.50% Cap) | | | 5.01 | % | | | 10/25/2036 | | | | 41,482,109 | |
25,286,755 | | Carrington Mortgage Loan Trust, Series 2006-NC5-A3 (1 Month LIBOR USD + 0.15%, 0.15% Floor, 14.50% Cap) | | | 5.00 | % | | | 01/25/2037 | | | | 21,582,581 | |
13,962,193 | | Carrington Mortgage Loan Trust, Series 2007-RFC1-A3 (1 Month LIBOR USD + 0.14%, 0.14% Floor, 14.50% Cap) | | | 4.99 | % | | | 12/25/2036 | | | | 13,297,780 | |
17,542,970 | | Cascade MH Asset Trust, Series 2019-MH1-A | | | 4.00 | % (a)(h) | | | 11/25/2044 | | | | 16,569,156 | |
2,750,000 | | Centex Home Equity Loan Trust, Series 2004-A-AF5 | | | 5.43 | % | | | 01/25/2034 | | | | 2,634,880 | |
2,709,872 | | Chase Mortgage Finance Trust, Series 2005-A1-2A4 | | | 3.94 | % (a) | | | 12/25/2035 | | | | 2,459,241 | |
7,097,678 | | Chase Mortgage Finance Trust, Series 2006-S1-A5 | | | 6.50 | % | | | 05/25/2036 | | | | 3,524,183 | |
6,773,665 | | Chase Mortgage Finance Trust, Series 2006-S2-1A9 | | | 6.25 | % | | | 10/25/2036 | | | | 3,030,397 | |
4,627,580 | | Chase Mortgage Finance Trust, Series 2006-S3-1A2 | | | 6.00 | % | | | 11/25/2036 | | | | 2,147,349 | |
13,247,711 | | Chase Mortgage Finance Trust, Series 2006-S4-A8 | | | 6.00 | % | | | 12/25/2036 | | | | 6,460,124 | |
2,926,602 | | Chase Mortgage Finance Trust, Series 2007-A2-6A4 | | | 4.02 | % (a) | | | 07/25/2037 | | | | 2,477,829 | |
3,914,663 | | Chase Mortgage Finance Trust, Series 2007-S1-A7 | | | 6.00 | % | | | 02/25/2037 | | | | 1,613,239 | |
2,290,898 | | Chase Mortgage Finance Trust, Series 2007-S3-1A5 | | | 6.00 | % | | | 05/25/2037 | | | | 1,122,233 | |
1,078,243 | | Chase Mortgage Finance Trust, Series 2007-S3-2A1 | | | 5.50 | % | | | 05/25/2037 | | | | 11 | |
2,150,152 | | Chase Mortgage Finance Trust, Series 2007-S5-1A18 | | | 6.00 | % | | | 07/25/2037 | | | | 1,060,639 | |
5,096,068 | | ChaseFlex Trust Multi-Class Mortgage Pass-Through Certificates, Series 2007-M1-2F4 | | | 4.12 | % (k) | | | 08/25/2037 | | | | 4,378,505 | |
5,300,364 | | ChaseFlex Trust Multi-Class Mortgage Pass-Through Certificates, Series 2007-M1-2F5 | | | 4.12 | % (k) | | | 08/25/2037 | | | | 4,553,595 | |
1,445,850 | | ChaseFlex Trust, Series 2005-1-3A1 | | | 6.00 | % | | | 02/25/2035 | | | | 1,231,590 | |
118,329 | | ChaseFlex Trust, Series 2006-1-A5 | | | 4.46 | % (a) | | | 06/25/2036 | | | | 109,879 | |
2,507,486 | | ChaseFlex Trust, Series 2006-2-A2B (1 Month LIBOR USD + 0.20%, 0.20% Floor, 11.50% Cap) | | | 4.74 | % | | | 09/25/2036 | | | | 2,028,045 | |
3,207,672 | | ChaseFlex Trust, Series 2007-1-1A1 | | | 6.50 | % | | | 02/25/2037 | | | | 1,256,623 | |
478,954 | | CHL Mortgage Pass-Through Trust, Series 2003-60-4A1 | | | 4.21 | % (a) | | | 02/25/2034 | | | | 444,695 | |
12,001,857 | | CHL Mortgage Pass-Through Trust, Series 2005-17-2A1 | | | 5.50 | % | | | 09/25/2035 | | | | 6,139,331 | |
2,459,943 | | CHL Mortgage Pass-Through Trust, Series 2005-18-A1 | | | 5.50 | % | | | 10/25/2035 | | | | 1,450,057 | |
2,027,087 | | CHL Mortgage Pass-Through Trust, Series 2005-20-A5 | | | 5.50 | % | | | 10/25/2035 | | | | 1,318,537 | |
1,503,171 | | CHL Mortgage Pass-Through Trust, Series 2005-20-A8 | | | 5.25 | % | | | 10/25/2035 | | | | 974,380 | |
6,774,853 | | CHL Mortgage Pass-Through Trust, Series 2005-23-A1 | | | 5.50 | % | | | 11/25/2035 | | | | 3,927,974 | |
1,367,631 | | CHL Mortgage Pass-Through Trust, Series 2005-24-A8 | | | 5.50 | % | | | 11/25/2035 | | | | 809,182 | |
2,239,376 | | CHL Mortgage Pass-Through Trust, Series 2005-26-1A12 | | | 5.50 | % | | | 11/25/2035 | | | | 1,452,204 | |
428,439 | | CHL Mortgage Pass-Through Trust, Series 2005-27-2A1 | | | 5.50 | % | | | 12/25/2035 | | | | 194,614 | |
904,703 | | CHL Mortgage Pass-Through Trust, Series 2005-28-A7 | | | 5.25 | % | | | 11/01/2035 | | | | 523,147 | |
7,494,121 | | CHL Mortgage Pass-Through Trust, Series 2005-HYB1-4A1 | | | 3.78 | % (a) | | | 03/25/2035 | | | | 6,673,031 | |
256,047 | | CHL Mortgage Pass-Through Trust, Series 2005-HYB8-1A1 | | | 3.62 | % (a) | | | 12/20/2035 | | | | 221,442 | |
7,124,138 | | CHL Mortgage Pass-Through Trust, Series 2005-HYB8-4A1 | | | 3.87 | % (a) | | | 12/20/2035 | | | | 5,907,038 | |
750,640 | | CHL Mortgage Pass-Through Trust, Series 2005-J3-2A4 | | | 4.50 | % | | | 09/25/2035 | | | | 653,548 | |
689,027 | | CHL Mortgage Pass-Through Trust, Series 2005-J4-A5 | | | 5.50 | % | | | 11/25/2035 | | | | 560,369 | |
4,577,060 | | CHL Mortgage Pass-Through Trust, Series 2006-14-A5 | | | 6.25 | % | | | 09/25/2036 | | | | 2,210,526 | |
3,227,885 | | CHL Mortgage Pass-Through Trust, Series 2006-16-2A1 | | | 6.50 | % | | | 11/25/2036 | | | | 1,246,107 | |
6,661,941 | | CHL Mortgage Pass-Through Trust, Series 2006-1-A2 | | | 6.00 | % | | | 03/25/2036 | | | | 3,829,376 | |
1,361,720 | | CHL Mortgage Pass-Through Trust, Series 2006-20-1A21 | | | 6.00 | % | | | 02/25/2037 | | | | 722,600 | |
16,863,775 | | CHL Mortgage Pass-Through Trust, Series 2006-8-1A3 | | | 6.00 | % | | | 05/25/2036 | | | | 10,922,718 | |
194,168 | | CHL Mortgage Pass-Through Trust, Series 2006-J3-A4 | | | 5.50 | % | | | 05/25/2036 | | | | 188,261 | |
3,841,142 | | CHL Mortgage Pass-Through Trust, Series 2007-10-A7 | | | 6.00 | % | | | 07/25/2037 | | | | 1,917,431 | |
13,374,335 | | CHL Mortgage Pass-Through Trust, Series 2007-11-A1 | | | 6.00 | % | | | 08/25/2037 | | | | 6,777,600 | |
6,554,434 | | CHL Mortgage Pass-Through Trust, Series 2007-12-A9 | | | 5.75 | % | | | 08/25/2037 | | | | 3,625,947 | |
2,827,189 | | CHL Mortgage Pass-Through Trust, Series 2007-13-A1 | | | 6.00 | % | | | 08/25/2037 | | | | 1,502,557 | |
4,632,505 | | CHL Mortgage Pass-Through Trust, Series 2007-13-A10 | | | 6.00 | % | | | 08/25/2037 | | | | 2,462,023 | |
3,686,746 | | CHL Mortgage Pass-Through Trust, Series 2007-15-1A1 | | | 6.25 | % | | | 09/25/2037 | | | | 2,408,253 | |
514,954 | | CHL Mortgage Pass-Through Trust, Series 2007-15-1A16 | | | 6.25 | % | | | 09/25/2037 | | | | 336,378 | |
1,483,247 | | CHL Mortgage Pass-Through Trust, Series 2007-15-1A2 | | | 6.25 | % | | | 09/25/2037 | | | | 968,381 | |
1,811,623 | | CHL Mortgage Pass-Through Trust, Series 2007-15-1A29 | | | 6.25 | % | | | 09/25/2037 | | | | 1,183,329 | |
2,764,205 | | CHL Mortgage Pass-Through Trust, Series 2007-17-1A2 | | | 6.00 | % | | | 10/25/2037 | | | | 2,127,935 | |
427,810 | | CHL Mortgage Pass-Through Trust, Series 2007-18-1A1 | | | 6.00 | % | | | 11/25/2037 | | | | 242,933 | |
37,594,253 | | CHL Mortgage Pass-Through Trust, Series 2007-21-1A1 | | | 6.25 | % | | | 02/25/2038 | | | | 19,688,689 | |
1,348,316 | | CHL Mortgage Pass-Through Trust, Series 2007-2-A2 | | | 6.00 | % | | | 03/25/2037 | | | | 667,709 | |
3,534,269 | | CHL Mortgage Pass-Through Trust, Series 2007-3-A1 | | | 6.00 | % | | | 04/25/2037 | | | | 1,881,044 | |
1,361,172 | | CHL Mortgage Pass-Through Trust, Series 2007-3-A12 | | | 6.00 | % | | | 04/25/2037 | | | | 724,456 | |
3,162,829 | | CHL Mortgage Pass-Through Trust, Series 2007-4-1A39 | | | 6.00 | % | | | 05/25/2037 | | | | 1,524,963 | |
1,208,520 | | CHL Mortgage Pass-Through Trust, Series 2007-5-A2 | | | 5.75 | % | | | 05/25/2037 | | | | 646,394 | |
4,357,351 | | CHL Mortgage Pass-Through Trust, Series 2007-7-A1 | | | 6.00 | % | | | 06/25/2037 | | | | 2,401,946 | |
1,958,252 | | CHL Mortgage Pass-Through Trust, Series 2007-7-A11 | | | 5.50 | % | | | 06/25/2037 | | | | 1,024,792 | |
1,306,185 | | CHL Mortgage Pass-Through Trust, Series 2007-7-A2 | | | 5.75 | % | | | 06/25/2037 | | | | 701,787 | |
4,315,549 | | CHL Mortgage Pass-Through Trust, Series 2007-8-1A4 | | | 6.00 | % | | | 01/25/2038 | | | | 2,100,225 | |
2,264,784 | | CHL Mortgage Pass-Through Trust, Series 2007-8-1A5 | | | 5.44 | % | | | 01/25/2038 | | | | 1,027,245 | |
3,670,725 | | CHL Mortgage Pass-Through Trust, Series 2007-8-1A8 | | | 6.00 | % | | | 01/25/2038 | | | | 1,786,412 | |
5,258,352 | | CHL Mortgage Pass-Through Trust, Series 2007-8-1A9 (1 Month LIBOR USD + 6.00%, 4.00% Floor, 6.00% Cap) | | | 6.00 | % | | | 01/25/2038 | | | | 2,687,649 | |
5,373,443 | | CHL Mortgage Pass-Through Trust, Series 2007-9-A1 | | | 5.75 | % | | | 07/25/2037 | | | | 2,727,723 | |
707,187 | | CHL Mortgage Pass-Through Trust, Series 2007-9-A11 | | | 5.75 | % | | | 07/25/2037 | | | | 358,990 | |
3,958,195 | | CHL Mortgage Pass-Through Trust, Series 2007-HY1-1A1 | | | 3.75 | % (a) | | | 04/25/2037 | | | | 3,483,966 | |
9,081,274 | | CHL Mortgage Pass-Through Trust, Series 2007-HYB1-2A1 | | | 3.75 | % (a) | | | 03/25/2037 | | | | 7,578,902 | |
15,713,071 | | CHL Mortgage Pass-Through Trust, Series 2007-J1-2A1 | | | 6.00 | % | | | 02/25/2037 | | | | 6,541,543 | |
387,802 | | CHL Mortgage Pass-Through Trust, Series 2007-J3-A1 (1 Month LIBOR USD + 0.50%, 0.50% Floor, 6.00% Cap) | | | 5.35 | % | | | 07/25/2037 | | | | 123,983 | |
1,939,010 | | CHL Mortgage Pass-Through Trust, Series 2007-J3-A2 (-1 x 1 Month LIBOR USD + 5.50%, 5.50% Cap) | | | 0.65 | % (c)(d) | | | 07/25/2037 | | | | 236,260 | |
634,691 | | Citicorp Mortgage Securities Trust, Series 2006-7-1A1 | | | 6.00 | % | | | 12/25/2036 | | | | 537,993 | |
2,036,135 | | Citicorp Mortgage Securities, Inc., Series 2005-1-1A4 | | | 5.50 | % | | | 02/25/2035 | | | | 1,919,248 | |
155,000 | | Citicorp Residential Mortgage Trust, Series 2006-2-A5 | | | 4.91 | % | | | 09/25/2036 | | | | 154,275 | |
1,276,463 | | Citigroup Mortgage Loan Trust, Inc., Series 2005-5-2A2 | | | 5.75 | % | | | 08/25/2035 | | | | 895,302 | |
456,071 | | Citigroup Mortgage Loan Trust, Inc., Series 2005-9-21A1 | | | 5.50 | % | | | 11/25/2035 | | | | 417,839 | |
1,127,766 | | Citigroup Mortgage Loan Trust, Inc., Series 2006-4-2A1A | | | 6.00 | % | | | 12/25/2035 | | | | 1,078,221 | |
4,568,195 | | Citigroup Mortgage Loan Trust, Inc., Series 2006-AR3-1A1A | | | 3.56 | % (a) | | | 06/25/2036 | | | | 4,055,503 | |
2,311,009 | | Citigroup Mortgage Loan Trust, Inc., Series 2006-FX1-A6 | | | 5.85 | % (k) | | | 10/25/2036 | | | | 1,528,806 | |
9,139,063 | | Citigroup Mortgage Loan Trust, Inc., Series 2006-WF1-A2D | | | 4.61 | % | | | 03/25/2036 | | | | 4,446,239 | |
9,282,826 | | Citigroup Mortgage Loan Trust, Inc., Series 2006-WF2-A2D | | | 6.66 | % | | | 05/25/2036 | | | | 3,464,065 | |
1,648,975 | | Citigroup Mortgage Loan Trust, Inc., Series 2007-10-1A1A | | | 5.16 | % (a) | | | 04/25/2037 | | | | 1,489,002 | |
532,763 | | Citigroup Mortgage Loan Trust, Inc., Series 2007-12-2A1 | | | 6.50 | % (a)(h) | | | 10/25/2036 | | | | 292,354 | |
14,905,614 | | Citigroup Mortgage Loan Trust, Inc., Series 2007-9-1A1 | | | 5.75 | % (h) | | | 04/25/2047 | | | | 8,750,927 | |
658,472 | | Citigroup Mortgage Loan Trust, Inc., Series 2007-9-2A2 | | | 6.50 | % (a)(h) | | | 05/25/2037 | | | | 596,205 | |
43,270,756 | | Citigroup Mortgage Loan Trust, Inc., Series 2007-AMC2-A1 (1 Month LIBOR USD + 0.14%, 0.14% Floor) | | | 4.99 | % (h) | | | 01/25/2037 | | | | 39,189,550 | |
1,564,324 | | Citigroup Mortgage Loan Trust, Inc., Series 2007-AMC3-A2D (1 Month LIBOR USD + 0.35%, 0.35% Floor) | | | 5.20 | % | | | 03/25/2037 | | | | 1,275,313 | |
182,626 | | Citigroup Mortgage Loan Trust, Inc., Series 2007-AR5-1A3A | | | 4.10 | % (a) | | | 04/25/2037 | | | | 180,359 | |
2,028,133 | | Citigroup Mortgage Loan Trust, Inc., Series 2007-AR8-1A1A | | | 3.50 | % (a) | | | 08/25/2047 | | | | 1,755,085 | |
3,557,491 | | Citigroup Mortgage Loan Trust, Inc., Series 2007-OPX1-A3A | | | 5.97 | % (k) | | | 01/25/2037 | | | | 1,768,058 | |
7,841,991 | | Citigroup Mortgage Loan Trust, Inc., Series 2007-OPX1-A5A | | | 5.76 | % (k) | | | 01/25/2037 | | | | 3,900,361 | |
3,090,768 | | Citigroup Mortgage Loan Trust, Inc., Series 2010-7-9A4 | | | 6.00 | % (a)(h) | | | 10/25/2037 | | | | 2,693,084 | |
15,893,834 | | Citigroup Mortgage Loan Trust, Inc., Series 2010-8-7A4 | | | 6.00 | % (a)(b)(h) | | | 06/25/2037 | | | | 13,998,772 | |
20,051,256 | | Citigroup Mortgage Loan Trust, Inc., Series 2021-JL1-A | | | 2.75 | % (a)(h) | | | 02/27/2062 | | | | 18,285,619 | |
3,614,133 | | Citigroup Mortgage Loan Trust, Series 2007-OPX1-A2 (1 Month LIBOR USD + 0.20%, 0.20% Floor) | | | 5.05 | % | | | 01/25/2037 | | | | 1,687,807 | |
2,883,187 | | Citigroup Mortgage Loan Trust, Series 2014-8-3A2 | | | 6.00 | % (a)(b)(h) | | | 03/25/2037 | | | | 2,484,767 | |
113,672,271 | | Citigroup Mortgage Loan Trust, Series 2019-A-PT1 | | | 3.92 | % (h) | | | 10/25/2058 | | | | 95,702,515 | |
172,318,407 | | Citigroup Mortgage Loan Trust, Series 2019-D-PT1 | | | 3.41 | % (a)(h) | | | 04/25/2064 | | | | 142,268,162 | |
222,169,188 | | Citigroup Mortgage Loan Trust, Series 2020-RP1-A1 | | | 1.50 | % (a)(h) | | | 08/25/2064 | | | | 196,580,163 | |
26,293,400 | | Citigroup Mortgage Loan Trust, Series 2020-RP1-M1 | | | 2.00 | % (a)(h) | | | 08/25/2064 | | | | 20,732,956 | |
22,116,950 | | Citigroup Mortgage Loan Trust, Series 2020-RP1-M2 | | | 2.50 | % (a)(h) | | | 08/25/2064 | | | | 17,451,824 | |
18,676,200 | | Citigroup Mortgage Loan Trust, Series 2020-RP1-M3 | | | 2.75 | % (a)(h) | | | 08/25/2064 | | | | 14,308,067 | |
49,064,248 | | Citigroup Mortgage Loan Trust, Series 2020-RP1-PT5 | | | 7.23 | % (a)(h) | | | 08/25/2064 | | | | 37,049,385 | |
292,488,016 | | Citigroup Mortgage Loan Trust, Series 2021-RP2-A1 | | | 1.75 | % (a)(h) | | | 03/25/2065 | | | | 265,836,245 | |
34,186,100 | | Citigroup Mortgage Loan Trust, Series 2021-RP2-M1 | | | 3.25 | % (a)(h) | | | 03/25/2065 | | | | 30,174,717 | |
28,635,750 | | Citigroup Mortgage Loan Trust, Series 2021-RP2-M2 | | | 3.40 | % (a)(h) | | | 03/25/2065 | | | | 24,530,008 | |
26,589,300 | | Citigroup Mortgage Loan Trust, Series 2021-RP2-M3 | | | 3.40 | % (a)(h) | | | 03/25/2065 | | | | 21,810,357 | |
78,057,061 | | Citigroup Mortgage Loan Trust, Series 2021-RP2-PT1 | | | 6.14 | % (a)(h) | | | 03/25/2065 | | | | 74,462,768 | |
1,612,743 | | CitiMortgage Alternative Loan Trust, Series 2006-A1-1A5 | | | 5.50 | % | | | 04/25/2036 | | | | 1,454,794 | |
1,818,265 | | CitiMortgage Alternative Loan Trust, Series 2006-A2-A2 | | | 6.00 | % | | | 05/25/2036 | | | | 1,640,742 | |
1,878,245 | | CitiMortgage Alternative Loan Trust, Series 2006-A3-1A13 | | | 6.00 | % | | | 07/25/2036 | | | | 1,686,273 | |
1,413,621 | | CitiMortgage Alternative Loan Trust, Series 2006-A4-1A8 | | | 6.00 | % | | | 09/25/2036 | | | | 1,269,308 | |
424,218 | | CitiMortgage Alternative Loan Trust, Series 2006-A5-2A1 | | | 5.50 | % | | | 08/25/2044 | | | | 409,183 | |
1,610,976 | | CitiMortgage Alternative Loan Trust, Series 2006-A5-3A3 | | | 6.00 | % | | | 10/25/2036 | | | | 1,344,965 | |
4,556,369 | | CitiMortgage Alternative Loan Trust, Series 2006-A6-1A2 (1 Month LIBOR USD + 0.50%, 6.00% Floor, 6.00% Cap) | | | 6.00 | % | | | 11/25/2036 | | | | 4,108,788 | |
2,225,272 | | CitiMortgage Alternative Loan Trust, Series 2007-A1-1A5 | | | 6.00 | % | | | 01/25/2037 | | | | 1,995,518 | |
1,084,967 | | CitiMortgage Alternative Loan Trust, Series 2007-A1-1A7 | | | 6.00 | % | | | 01/25/2037 | | | | 972,947 | |
2,941,920 | | CitiMortgage Alternative Loan Trust, Series 2007-A1-1A8 (1 Month LIBOR USD + 0.60%, 0.60% Floor, 6.00% Cap) | | | 5.45 | % | | | 01/25/2037 | | | | 2,417,777 | |
2,776,028 | | CitiMortgage Alternative Loan Trust, Series 2007-A1-1A9 (-1 x 1 Month LIBOR USD + 5.40%, 5.40% Cap) | | | 0.55 | % (c)(d) | | | 01/25/2037 | | | | 124,580 | |
2,299,203 | | CitiMortgage Alternative Loan Trust, Series 2007-A3-1A1 | | | 6.00 | % (f) | | | 03/25/2037 | | | | 2,095,298 | |
5,291,201 | | CitiMortgage Alternative Loan Trust, Series 2007-A3-1A3 (-1 x 1 Month LIBOR USD + 5.40%, 5.40% Cap) | | | 0.55 | % (c)(d) | | | 03/25/2037 | | | | 309,220 | |
2,073,508 | | CitiMortgage Alternative Loan Trust, Series 2007-A3-1A4 | | | 5.75 | % | | | 03/25/2037 | | | | 1,886,121 | |
3,707,929 | | CitiMortgage Alternative Loan Trust, Series 2007-A4-1A3 (1 Month LIBOR USD + 0.33%, 0.33% Floor, 7.00% Cap) | | | 5.18 | % | | | 04/25/2037 | | | | 3,076,808 | |
3,707,929 | | CitiMortgage Alternative Loan Trust, Series 2007-A4-1A4 (-1 x 1 Month LIBOR USD + 6.67%, 6.67% Cap) | | | 1.82 | % (c)(d) | | | 04/25/2037 | | | | 309,803 | |
3,926,888 | | CitiMortgage Alternative Loan Trust, Series 2007-A4-1A5 | | | 5.75 | % | | | 04/25/2037 | | | | 3,566,778 | |
519,013 | | CitiMortgage Alternative Loan Trust, Series 2007-A5-1A11 | | | 6.00 | % | | | 05/25/2037 | | | | 474,619 | |
6,842,815 | | CitiMortgage Alternative Loan Trust, Series 2007-A5-1A8 | | | 6.00 | % | | | 05/25/2037 | | | | 6,257,513 | |
218,141 | | CitiMortgage Alternative Loan Trust, Series 2007-A8-A1 | | | 6.00 | % | | | 10/25/2037 | | | | 192,901 | |
14,812,000 | | COLT Mortgage Loan Trust, Series 2021-5-M1 | | | 3.26 | % (a)(h) | | | 11/26/2066 | | | | 10,168,734 | |
4,294,000 | | COLT Mortgage Loan Trust, Series 2021-HX1-B1 | | | 3.11 | % (a)(h) | | | 10/25/2066 | | | | 2,694,430 | |
4,130,000 | | COLT Mortgage Loan Trust, Series 2021-HX1-B2 | | | 3.86 | % (a)(h) | | | 10/25/2066 | | | | 2,550,932 | |
6,000,000 | | COLT Mortgage Loan Trust, Series 2021-HX1-M1 | | | 2.36 | % (a)(h) | | | 10/25/2066 | | | | 3,690,204 | |
12,393,947 | | COLT Mortgage Loan Trust, Series 2022-4-A1 | | | 4.30 | % (a)(h) | | | 03/25/2067 | | | | 11,891,915 | |
9,000,000 | | CoreVest American Finance Trust, Series 2020-3-D | | | 2.95 | % (a)(h) | | | 08/15/2053 | | | | 7,017,790 | |
26,508,473 | | Countrywide Alternative Loan Trust, Series 2004-36CB-1A1 | | | 6.00 | % | | | 02/25/2035 | | | | 19,818,236 | |
5,637,400 | | Countrywide Alternative Loan Trust, Series 2005-13CB-A1 (1 Month LIBOR USD + 0.50%, 0.50% Floor, 5.50% Cap) | | | 5.35 | % | | | 05/25/2035 | | | | 4,570,585 | |
2,574,939 | | Countrywide Alternative Loan Trust, Series 2005-13CB-A3 | | | 5.50 | % | | | 05/25/2035 | | | | 2,210,918 | |
2,247,773 | | Countrywide Alternative Loan Trust, Series 2005-20CB-2A1 (1 Month LIBOR USD + 0.50%, 0.50% Floor, 5.50% Cap) | | | 5.35 | % | | | 07/25/2035 | | | | 1,373,285 | |
4,589,203 | | Countrywide Alternative Loan Trust, Series 2005-20CB-2A2 (-1 x 1 Month LIBOR USD + 5.00%, 5.00% Cap) | | | 0.15 | % (c)(d) | | | 07/25/2035 | | | | 229,841 | |
1,476,054 | | Countrywide Alternative Loan Trust, Series 2005-26CB-A11 (-2 x 1 Month LIBOR USD + 13.05%, 13.05% Cap) | | | 4.27 | % (d) | | | 07/25/2035 | | | | 1,138,684 | |
2,009,492 | | Countrywide Alternative Loan Trust, Series 2005-28CB-1A2 (1 Month LIBOR USD + 0.75%, 0.75% Floor, 5.50% Cap) | | | 5.50 | % | | | 08/25/2035 | | | | 1,612,501 | |
991,969 | | Countrywide Alternative Loan Trust, Series 2005-28CB-3A6 | | | 6.00 | % | | | 08/25/2035 | | | | 483,240 | |
5,653,369 | | Countrywide Alternative Loan Trust, Series 2005-32T1-A9 | | | 5.50 | % | | | 08/25/2035 | | | | 3,386,165 | |
2,169,266 | | Countrywide Alternative Loan Trust, Series 2005-46CB-A14 | | | 5.50 | % | | | 10/25/2035 | | | | 1,577,569 | |
1,098,991 | | Countrywide Alternative Loan Trust, Series 2005-46CB-A20 | | | 5.50 | % | | | 10/25/2035 | | | | 799,226 | |
3,772,392 | | Countrywide Alternative Loan Trust, Series 2005-48T1-A2 | | | 5.50 | % | | | 11/25/2035 | | | | 2,385,514 | |
1,326,342 | | Countrywide Alternative Loan Trust, Series 2005-54CB-3A4 | | | 5.50 | % | | | 11/25/2035 | | | | 774,554 | |
29,074,381 | | Countrywide Alternative Loan Trust, Series 2005-55CB-1A1 | | | 5.50 | % | | | 11/25/2035 | | | | 20,330,371 | |
11,930,210 | | Countrywide Alternative Loan Trust, Series 2005-57CB-1A1 | | | 5.50 | % | | | 12/25/2035 | | | | 8,929,296 | |
297,921 | | Countrywide Alternative Loan Trust, Series 2005-60T1-A7 (-7 x 1 Month LIBOR USD + 35.93%, 35.93% Cap) | | | 0.40 | % (d) | | | 12/25/2035 | | | | 225,597 | |
349,448 | | Countrywide Alternative Loan Trust, Series 2005-64CB-1A14 | | | 5.50 | % | | | 12/25/2035 | | | | 311,624 | |
5,071,803 | | Countrywide Alternative Loan Trust, Series 2005-64CB-1A4 | | | 5.50 | % | | | 12/25/2035 | | | | 4,522,828 | |
993,982 | | Countrywide Alternative Loan Trust, Series 2005-73CB-1A5 (1 Month LIBOR USD + 0.80%, 0.80% Floor, 5.50% Cap) | | | 5.50 | % | | | 01/25/2036 | | | | 925,741 | |
2,500,654 | | Countrywide Alternative Loan Trust, Series 2005-73CB-1A6 (-1 x 1 Month LIBOR USD + 4.70%, 4.70% Cap) | | | 0.00 | % (c)(d) | | | 01/25/2036 | | | | 78,048 | |
29,549,887 | | Countrywide Alternative Loan Trust, Series 2005-77T1-1A1 | | | 6.00 | % | | | 02/25/2036 | | | | 15,350,744 | |
446,267 | | Countrywide Alternative Loan Trust, Series 2005-79CB-A5 | | | 5.50 | % | | | 01/25/2036 | | | | 274,261 | |
17,398,027 | | Countrywide Alternative Loan Trust, Series 2005-80CB-4A1 | | | 6.00 | % | | | 02/25/2036 | | | | 9,098,745 | |
19,055,950 | | Countrywide Alternative Loan Trust, Series 2005-85CB-1A1 | �� | | 6.00 | % | | | 02/25/2036 | | | | 8,875,535 | |
1,272,440 | | Countrywide Alternative Loan Trust, Series 2005-85CB-2A6 (-4 x 1 Month LIBOR USD + 21.63%, 21.63% Cap) | | | 3.87 | % (d) | | | 02/25/2036 | | | | 1,065,030 | |
883,399 | | Countrywide Alternative Loan Trust, Series 2005-86CB-A5 | | | 5.50 | % | | | 02/25/2036 | | | | 538,558 | |
1,241,000 | | Countrywide Alternative Loan Trust, Series 2005-J10-1A11 | | | 5.50 | % | | | 10/25/2035 | | | | 881,697 | |
282,422 | | Countrywide Alternative Loan Trust, Series 2005-J10-1A13 (1 Month LIBOR USD + 0.70%, 0.70% Floor, 5.50% Cap) | | | 5.50 | % | | | 10/25/2035 | | | | 179,208 | |
132,299 | | Countrywide Alternative Loan Trust, Series 2005-J10-1A15 | | | 5.50 | % | | | 10/25/2035 | | | | 93,995 | |
364,701 | | Countrywide Alternative Loan Trust, Series 2005-J11-1A3 | | | 5.50 | % | | | 11/25/2035 | | | | 218,938 | |
209,851 | | Countrywide Alternative Loan Trust, Series 2005-J11-6A1 | | | 6.50 | % | | | 09/25/2032 | | | | 195,635 | |
392,994 | | Countrywide Alternative Loan Trust, Series 2005-J13-2A5 (1 Month LIBOR USD + 0.48%, 0.48% Floor, 5.50% Cap) | | | 5.33 | % | | | 11/25/2035 | | | | 251,521 | |
785,988 | | Countrywide Alternative Loan Trust, Series 2005-J13-2A6 (-1 x 1 Month LIBOR USD + 5.02%, 5.02% Cap) | | | 0.17 | % (c)(d) | | | 11/25/2035 | | | | 49,791 | |
3,490,514 | | Countrywide Alternative Loan Trust, Series 2005-J1-5A3 | | | 5.50 | % | | | 02/25/2035 | | | | 3,282,130 | |
16,327 | | Countrywide Alternative Loan Trust, Series 2005-J1-7A1 | | | 5.50 | % | | | 12/25/2023 | | | | 14,584 | |
463,659 | | Countrywide Alternative Loan Trust, Series 2005-J2-1A5 (1 Month LIBOR USD + 0.50%, 0.50% Floor, 5.50% Cap) | | | 5.35 | % | | | 04/25/2035 | | | | 360,231 | |
1,426,642 | | Countrywide Alternative Loan Trust, Series 2005-J2-1A6 (-1 x 1 Month LIBOR USD + 5.00%, 5.00% Cap) | | | 0.15 | % (c)(d) | | | 04/25/2035 | | | | 52,546 | |
2,867,504 | | Countrywide Alternative Loan Trust, Series 2005-J3-2A8 (1 Month LIBOR USD + 0.30%, 0.30% Floor, 5.50% Cap) | | | 5.15 | % | | | 05/25/2035 | | | | 2,223,005 | |
2,867,504 | | Countrywide Alternative Loan Trust, Series 2005-J3-2A9 (-1 x 1 Month LIBOR USD + 5.20%, 5.20% Cap) | | | 0.35 | % (c)(d) | | | 05/25/2035 | | | | 153,523 | |
2,612,348 | | Countrywide Alternative Loan Trust, Series 2006-12CB-A3 (1 Month LIBOR USD + 5.75%, 5.75% Floor) | | | 5.75 | % | | | 05/25/2036 | | | | 1,389,925 | |
3,219,652 | | Countrywide Alternative Loan Trust, Series 2006-12CB-A8 | | | 6.00 | % | | | 05/25/2036 | | | | 1,765,209 | |
10,754,287 | | Countrywide Alternative Loan Trust, Series 2006-13T1-A1 | | | 6.00 | % | | | 05/25/2036 | | | | 5,558,756 | |
27,643,003 | | Countrywide Alternative Loan Trust, Series 2006-15CB-A1 | | | 6.50 | % | | | 06/25/2036 | | | | 14,023,729 | |
2,715,988 | | Countrywide Alternative Loan Trust, Series 2006-16CB-A7 | | | 6.00 | % | | | 06/25/2036 | | | | 1,556,942 | |
712,255 | | Countrywide Alternative Loan Trust, Series 2006-18CB-A12 (1 Month LIBOR USD + 0.60%, 0.60% Floor, 6.00% Cap) | | | 5.45 | % | | | 07/25/2036 | | | | 313,693 | |
712,255 | | Countrywide Alternative Loan Trust, Series 2006-18CB-A13 (-1 x 1 Month LIBOR USD + 5.50%, 5.50% Cap) | | | 0.65 | % (c)(d) | | | 07/25/2036 | | | | 67,124 | |
3,507,945 | | Countrywide Alternative Loan Trust, Series 2006-19CB-A12 (1 Month LIBOR USD + 0.40%, 0.40% Floor, 6.00% Cap) | | | 5.25 | % | | | 08/25/2036 | | | | 1,743,682 | |
4,756,985 | | Countrywide Alternative Loan Trust, Series 2006-19CB-A13 (-1 x 1 Month LIBOR USD + 5.60%, 5.60% Cap) | | | 0.75 | % (c)(d) | | | 08/25/2036 | | | | 489,998 | |
732,241 | | Countrywide Alternative Loan Trust, Series 2006-19CB-A15 | | | 6.00 | % | | | 08/25/2036 | | | | 452,973 | |
4,110,873 | | Countrywide Alternative Loan Trust, Series 2006-23CB-2A3 | | | 6.50 | % | | | 08/25/2036 | | | | 1,460,120 | |
1,305,472 | | Countrywide Alternative Loan Trust, Series 2006-24CB-A11 | | | 5.75 | % | | | 08/25/2036 | | | | 743,261 | |
3,820,955 | | Countrywide Alternative Loan Trust, Series 2006-24CB-A14 (-1 x 1 Month LIBOR USD + 7.15%, 7.15% Cap) | | | 2.30 | % (c)(d) | | | 08/25/2036 | | | | 723,460 | |
3,063,908 | | Countrywide Alternative Loan Trust, Series 2006-24CB-A22 | | | 6.00 | % | | | 08/25/2036 | | | | 1,790,259 | |
3,288,494 | | Countrywide Alternative Loan Trust, Series 2006-24CB-A5 (1 Month LIBOR USD + 0.60%, 0.06% Floor, 6.00% Cap) | | | 5.45 | % | | | 08/25/2036 | | | | 1,533,572 | |
1,458,844 | | Countrywide Alternative Loan Trust, Series 2006-26CB-A17 | | | 6.25 | % | | | 09/25/2036 | | | | 814,784 | |
1,872,550 | | Countrywide Alternative Loan Trust, Series 2006-26CB-A9 | | | 6.50 | % | | | 09/25/2036 | | | | 1,070,525 | |
2,603,329 | | Countrywide Alternative Loan Trust, Series 2006-29T1-1A2 | | | 6.25 | % | | | 10/25/2036 | | | | 1,587,406 | |
374,596 | | Countrywide Alternative Loan Trust, Series 2006-29T1-2A12 (-7 x 1 Month LIBOR USD + 46.15%, 46.15% Cap) | | | 14.66 | % (d) | | | 10/25/2036 | | | | 560,714 | |
229,448 | | Countrywide Alternative Loan Trust, Series 2006-29T1-2A23 (-4 x 1 Month LIBOR USD + 33.37%, 33.37% Cap) | | | 12.37 | % (d) | | | 10/25/2036 | | | | 272,813 | |
1,922,541 | | Countrywide Alternative Loan Trust, Series 2006-2CB-A9 | | | 6.00 | % | | | 03/25/2036 | | | | 906,049 | |
2,584,076 | | Countrywide Alternative Loan Trust, Series 2006-30T1-1A2 | | | 6.25 | % | | | 11/25/2036 | | | | 2,011,069 | |
2,082,593 | | Countrywide Alternative Loan Trust, Series 2006-32CB-A1 (1 Month LIBOR USD + 0.67%, 0.67% Floor, 6.00% Cap) | | | 5.52 | % | | | 11/25/2036 | | | | 1,095,675 | |
3,473,766 | | Countrywide Alternative Loan Trust, Series 2006-32CB-A2 (-1 x 1 Month LIBOR USD + 5.33%, 5.33% Cap) | | | 0.48 | % (c)(d) | | | 11/25/2036 | | | | 322,054 | |
7,743,360 | | Countrywide Alternative Loan Trust, Series 2006-36T2-2A1 | | | 6.25 | % | | | 12/25/2036 | | | | 3,592,133 | |
625,026 | | Countrywide Alternative Loan Trust, Series 2006-36T2-2A4 | | | 6.25 | % | | | 12/25/2036 | | | | 289,949 | |
815,232 | | Countrywide Alternative Loan Trust, Series 2006-39CB-1A10 | | | 6.00 | % | | | 01/25/2037 | | | | 663,486 | |
13,279,975 | | Countrywide Alternative Loan Trust, Series 2006-39CB-2A2 (-1 x 1 Month LIBOR USD + 6.55%, 6.55% Cap) | | | 1.70 | % (c)(d) | | | 01/25/2037 | | | | 1,063,282 | |
4,522,458 | | Countrywide Alternative Loan Trust, Series 2006-39CB-2A4 (1 Month LIBOR USD + 0.45%, 0.45% Floor, 7.00% Cap) | | | 5.30 | % | | | 01/25/2037 | | | | 585,991 | |
1,264,231 | | Countrywide Alternative Loan Trust, Series 2006-40T1-1A11 | | | 6.00 | % | | | 01/25/2037 | | | | 878,947 | |
2,151,804 | | Countrywide Alternative Loan Trust, Series 2006-40T1-1A4 (-1 x 1 Month LIBOR USD + 5.45%, 5.45% Cap) | | | 0.60 | % (c)(d) | | | 01/25/2037 | | | | 207,805 | |
2,856,285 | | Countrywide Alternative Loan Trust, Series 2006-41CB-1A10 | | | 6.00 | % | | | 01/25/2037 | | | | 1,648,695 | |
6,985,541 | | Countrywide Alternative Loan Trust, Series 2006-41CB-1A15 (-1 x 1 Month LIBOR USD + 5.40%, 5.40% Cap) | | | 0.55 | % (c)(d) | | | 01/25/2037 | | | | 878,368 | |
6,985,541 | | Countrywide Alternative Loan Trust, Series 2006-41CB-1A2 (1 Month LIBOR USD + 0.60%, 0.60% Floor, 6.00% Cap) | | | 5.45 | % | | | 01/25/2037 | | | | 3,141,640 | |
3,007,729 | | Countrywide Alternative Loan Trust, Series 2006-41CB-1A9 | | | 6.00 | % | | | 01/25/2037 | | | | 1,736,111 | |
3,628,458 | | Countrywide Alternative Loan Trust, Series 2006-42-1A1 (1 Month LIBOR USD + 0.60%, 0.60% Floor, 6.00% Cap) | | | 5.45 | % | | | 01/25/2047 | | | | 1,605,769 | |
3,628,458 | | Countrywide Alternative Loan Trust, Series 2006-42-1A2 (-1 x 1 Month LIBOR USD + 5.40%, 5.40% Cap) | | | 0.55 | % (c)(d) | | | 01/25/2047 | | | | 483,214 | |
2,416,364 | | Countrywide Alternative Loan Trust, Series 2006-42-1A3 | | | 6.00 | % | | | 01/25/2047 | | | | 1,461,289 | |
2,742,094 | | Countrywide Alternative Loan Trust, Series 2006-43CB-1A12 | | | 5.75 | % | | | 02/25/2037 | | | | 1,544,695 | |
9,486,990 | | Countrywide Alternative Loan Trust, Series 2006-43CB-1A6 | | | 6.00 | % | | | 02/25/2037 | | | | 5,485,525 | |
9,729,136 | | Countrywide Alternative Loan Trust, Series 2006-45T1-1A1 (1 Month LIBOR USD + 0.50%, 6.00% Floor, 6.00% Cap) | | | 6.00 | % | | | 02/25/2037 | | | | 3,774,679 | |
3,138,431 | | Countrywide Alternative Loan Trust, Series 2006-45T1-1A4 (1 Month LIBOR USD + 0.60%, 0.60% Floor, 6.00% Cap) | | | 5.45 | % | | | 02/25/2037 | | | | 709,570 | |
3,138,431 | | Countrywide Alternative Loan Trust, Series 2006-45T1-1A5 (-1 x 1 Month LIBOR USD + 5.40%, 5.40% Cap) | | | 0.55 | % (c)(d) | | | 02/25/2037 | | | | 328,437 | |
1,335,624 | | Countrywide Alternative Loan Trust, Series 2006-45T1-2A2 | | | 6.00 | % | | | 02/25/2037 | | | | 761,573 | |
5,623,277 | | Countrywide Alternative Loan Trust, Series 2006-4CB-1A1 | | | 6.00 | % | | | 04/25/2036 | | | | 3,074,650 | |
638,249 | | Countrywide Alternative Loan Trust, Series 2006-6CB-1A4 | | | 5.50 | % | | | 05/25/2036 | | | | 533,104 | |
4,258,422 | | Countrywide Alternative Loan Trust, Series 2006-7CB-1A14 | | | 6.00 | % | | | 05/25/2036 | | | | 2,505,532 | |
7,425,919 | | Countrywide Alternative Loan Trust, Series 2006-7CB-1A16 | | | 6.00 | % | | | 05/25/2036 | | | | 4,369,196 | |
2,275,302 | | Countrywide Alternative Loan Trust, Series 2006-7CB-1A6 | | | 6.00 | % | | | 05/25/2036 | | | | 1,338,722 | |
2,304,452 | | Countrywide Alternative Loan Trust, Series 2006-7CB-1A9 | | | 6.00 | % | | | 05/25/2036 | | | | 1,355,873 | |
815,025 | | Countrywide Alternative Loan Trust, Series 2006-9T1-A11 | | | 6.00 | % | | | 05/25/2036 | | | | 337,903 | |
1,940,011 | | Countrywide Alternative Loan Trust, Series 2006-J1-1A10 | | | 5.50 | % | | | 02/25/2036 | | | | 1,408,418 | |
3,936,209 | | Countrywide Alternative Loan Trust, Series 2006-J1-1A3 | | | 5.50 | % | | | 02/25/2036 | | | | 2,857,626 | |
820,492 | | Countrywide Alternative Loan Trust, Series 2006-J4-2A2 | | | 6.00 | % | | | 07/25/2036 | | | | 517,947 | |
1,017,530 | | Countrywide Alternative Loan Trust, Series 2006-J7-1A1 | | | 6.25 | % | | | 11/25/2036 | | | | 504,364 | |
30,691,671 | | Countrywide Alternative Loan Trust, Series 2006-OA21-A1 (1 Month LIBOR USD + 0.19%, 0.19% Floor) | | | 4.95 | % | | | 03/20/2047 | | | | 25,003,181 | |
2,841,059 | | Countrywide Alternative Loan Trust, Series 2006-OA7-1A2 (12 Month US Treasury Average + 0.94%, 0.94% Floor) | | | 4.08 | % | | | 06/25/2046 | | | | 2,365,392 | |
587,199 | | Countrywide Alternative Loan Trust, Series 2007-11T1-A24 (-6 x 1 Month LIBOR USD + 39.90%, 39.90% Cap) | | | 10.83 | % (d) | | | 05/25/2037 | | | | 665,434 | |
9,547,200 | | Countrywide Alternative Loan Trust, Series 2007-12T1-A11 | | | 6.00 | % | | | 06/25/2037 | | | | 4,759,057 | |
8,729,817 | | Countrywide Alternative Loan Trust, Series 2007-15CB-A1 | | | 6.00 | % | | | 07/25/2037 | | | | 5,696,555 | |
5,206,072 | | Countrywide Alternative Loan Trust, Series 2007-15CB-A2 | | | 5.75 | % | | | 07/25/2037 | | | | 3,277,434 | |
6,245,400 | | Countrywide Alternative Loan Trust, Series 2007-15CB-A5 | | | 5.75 | % | | | 07/25/2037 | | | | 3,931,734 | |
7,407,225 | | Countrywide Alternative Loan Trust, Series 2007-16CB-2A1 (1 Month LIBOR USD + 0.45%, 0.45% Floor, 7.00% Cap) | | | 5.30 | % | | | 08/25/2037 | | | | 2,842,475 | |
2,144,947 | | Countrywide Alternative Loan Trust, Series 2007-16CB-2A2 (-8 x 1 Month LIBOR USD + 54.58%, 54.58% Cap) | | | 14.21 | % (d) | | | 08/25/2037 | | | | 3,375,215 | |
2,633,379 | | Countrywide Alternative Loan Trust, Series 2007-16CB-4A7 | | | 6.00 | % | | | 08/25/2037 | | | | 2,077,517 | |
4,960,984 | | Countrywide Alternative Loan Trust, Series 2007-17CB-1A10 (-5 x 1 Month LIBOR USD + 29.90%, 29.90% Cap) | | | 7.61 | % (d) | | | 08/25/2037 | | | | 5,030,112 | |
747,333 | | Countrywide Alternative Loan Trust, Series 2007-18CB-2A25 | | | 6.00 | % | | | 08/25/2037 | | | | 469,638 | |
597,772 | | Countrywide Alternative Loan Trust, Series 2007-19-1A10 (-6 x 1 Month LIBOR USD + 39.00%, 39.00% Cap) | | | 9.93 | % (d) | | | 08/25/2037 | | | | 727,238 | |
10,713,834 | | Countrywide Alternative Loan Trust, Series 2007-19-1A34 | | | 6.00 | % | | | 08/25/2037 | | | | 5,601,095 | |
8,785,968 | | Countrywide Alternative Loan Trust, Series 2007-19-1A4 | | | 6.00 | % | | | 08/25/2037 | | | | 4,593,224 | |
26,975,101 | | Countrywide Alternative Loan Trust, Series 2007-19-2A1 | | | 6.50 | % | | | 08/25/2037 | | | | 11,972,685 | |
2,699,733 | | Countrywide Alternative Loan Trust, Series 2007-21CB-2A2 (-4 x 1 Month LIBOR USD + 28.40%, 28.40% Cap) | | | 9.02 | % (d) | | | 09/25/2037 | | | | 2,537,855 | |
18,057,085 | | Countrywide Alternative Loan Trust, Series 2007-22-2A16 | | | 6.50 | % | | | 09/25/2037 | | | | 7,699,790 | |
6,944,422 | | Countrywide Alternative Loan Trust, Series 2007-23CB-A3 (1 Month LIBOR USD + 0.50%, 0.50% Floor, 7.00% Cap) | | | 5.35 | % | | | 09/25/2037 | | | | 3,099,849 | |
9,855,575 | | Countrywide Alternative Loan Trust, Series 2007-23CB-A4 (-1 x 1 Month LIBOR USD + 6.50%, 6.50% Cap) | | | 1.65 | % (c)(d) | | | 09/25/2037 | | | | 1,761,537 | |
1,004,532 | | Countrywide Alternative Loan Trust, Series 2007-24-A2 (-6 x 1 Month LIBOR USD + 41.70%, 41.70% Cap) | | | 12.63 | % (d) | | | 10/25/2037 | | | | 1,142,401 | |
2,008,640 | | Countrywide Alternative Loan Trust, Series 2007-24-A3 (-1 x 1 Month LIBOR USD + 6.95%, 6.95% Cap) | | | 2.10 | % (c)(d) | | | 10/25/2037 | | | | 409,584 | |
3,295,179 | | Countrywide Alternative Loan Trust, Series 2007-24-A4 (1 Month LIBOR USD + 0.70%, 0.70% Floor, 7.00% Cap) | | | 5.55 | % | | | 10/25/2037 | | | | 777,616 | |
4,358,443 | | Countrywide Alternative Loan Trust, Series 2007-24-A6 (1 Month LIBOR USD + 1.00%, 1.00% Floor, 7.00% Cap) | | | 5.85 | % | | | 10/25/2037 | | | | 1,102,499 | |
3,248,450 | | Countrywide Alternative Loan Trust, Series 2007-2CB-1A4 (1 Month LIBOR USD + 1.00%, 5.75% Floor, 100.00% Cap) | | | 5.75 | % | | | 03/25/2037 | | | | 1,879,469 | |
15,342,616 | | Countrywide Alternative Loan Trust, Series 2007-4CB-2A1 | | | 7.00 | % | | | 03/25/2037 | | | | 1,674,803 | |
3,613,643 | | Countrywide Alternative Loan Trust, Series 2007-5CB-1A18 (-1 x 1 Month LIBOR USD + 5.65%, 5.65% Cap) | | | 0.80 | % (c)(d) | | | 04/25/2037 | | | | 498,637 | |
3,613,643 | | Countrywide Alternative Loan Trust, Series 2007-5CB-1A23 (1 Month LIBOR USD + 0.55%, 0.55% Floor, 6.00% Cap) | | | 5.40 | % | | | 04/25/2037 | | | | 1,605,948 | |
14,393,066 | | Countrywide Alternative Loan Trust, Series 2007-5CB-1A31 | | | 5.50 | % | | | 04/25/2037 | | | | 7,956,457 | |
5,809,043 | | Countrywide Alternative Loan Trust, Series 2007-5CB-2A1 | | | 6.00 | % | | | 04/25/2037 | | | | 2,806,183 | |
4,822,293 | | Countrywide Alternative Loan Trust, Series 2007-6-A1 | | | 5.75 | % | | | 04/25/2047 | | | | 2,789,981 | |
5,287,683 | | Countrywide Alternative Loan Trust, Series 2007-6-A4 | | | 5.75 | % | | | 04/25/2047 | | | | 3,059,236 | |
1,327,119 | | Countrywide Alternative Loan Trust, Series 2007-7T2-A8 | | | 6.00 | % | | | 04/25/2037 | | | | 625,169 | |
240,171 | | Countrywide Alternative Loan Trust, Series 2007-8CB-A12 (-6 x 1 Month LIBOR USD + 40.20%, 40.20% Cap) | | | 11.13 | % (d) | | | 05/25/2037 | | | | 269,247 | |
256,379 | | Countrywide Alternative Loan Trust, Series 2007-8CB-A8 (-6 x 1 Month LIBOR USD + 40.08%, 40.08% Cap) | | | 11.01 | % (d) | | | 05/25/2037 | | | | 286,155 | |
398,322 | | Countrywide Alternative Loan Trust, Series 2007-9T1-1A4 (1 Month LIBOR USD + 0.50%, 0.50% Floor, 6.00% Cap) | | | 5.35 | % | | | 05/25/2037 | | | | 153,677 | |
398,322 | | Countrywide Alternative Loan Trust, Series 2007-9T1-1A5 (-1 x 1 Month LIBOR USD + 5.50%, 5.50% Cap) | | | 0.65 | % (c)(d) | | | 05/25/2037 | | | | 42,209 | |
1,407,133 | | Countrywide Alternative Loan Trust, Series 2007-9T1-2A1 | | | 6.00 | % | | | 05/25/2037 | | | | 692,123 | |
20,441,982 | | Countrywide Alternative Loan Trust, Series 2007-HY2-1A | | | 3.98 | % (a) | | | 03/25/2047 | | | | 17,163,348 | |
19,976,504 | | Countrywide Alternative Loan Trust, Series 2007-HY4-4A1 | | | 3.67 | % (a) | | | 06/25/2037 | | | | 17,111,760 | |
20,321,737 | | Countrywide Asset Backed Certificates, Series 2006-25-1A (1 Month LIBOR USD + 0.14%, 0.14% Floor) | | | 4.99 | % | | | 06/25/2047 | | | | 18,592,865 | |
5,857,799 | | Countrywide Asset Backed Certificates, Series 2006-26-1A (1 Month LIBOR USD + 0.14%, 0.14% Floor) | | | 4.99 | % | | | 06/25/2037 | | | | 5,356,872 | |
21,575,536 | | Countrywide Asset Backed Certificates, Series 2007-4-A5 | | | 4.46 | % (k) | | | 04/25/2047 | | | | 15,877,720 | |
11,390,847 | | Countrywide Asset Backed Certificates, Series 2007-BC1-1A (1 Month LIBOR USD + 0.14%, 0.14% Floor) | | | 4.99 | % | | | 05/25/2037 | | | | 10,400,113 | |
2,027,496 | | Credit Suisse First Boston Mortgage Securities Corporation, Series 2005-10-5A4 | | | 5.50 | % | | | 11/25/2035 | | | | 1,541,256 | |
426,806 | | Credit Suisse First Boston Mortgage Securities Corporation, Series 2005-10-5A5 | | | 5.50 | % | | | 11/25/2035 | | | | 324,448 | |
4,116,608 | | Credit Suisse First Boston Mortgage Securities Corporation, Series 2005-11-2A1 | | | 6.00 | % | | | 12/25/2035 | | | | 3,045,167 | |
5,551,407 | | Credit Suisse First Boston Mortgage Securities Corporation, Series 2005-12-5A1 | | | 5.25 | % | | | 01/25/2036 | | | | 4,837,989 | |
9,678,679 | | Credit Suisse First Boston Mortgage Securities Corporation, Series 2005-12-7A1 | | | 7.00 | % | | | 01/25/2036 | | | | 1,567,766 | |
2,501,082 | | Credit Suisse First Boston Mortgage Securities Corporation, Series 2005-8-3A10 | | | 5.50 | % | | | 09/25/2035 | | | | 2,169,013 | |
3,569,621 | | Credit Suisse First Boston Mortgage Securities Corporation, Series 2005-8-7A1 | | | 7.00 | % | | | 09/25/2035 | | | | 1,792,699 | |
8,303,241 | | Credit Suisse Mortgage Capital Certificates, Series 2009-11R-4A1 | | | 7.00 | % (a)(h) | | | 09/26/2037 | | | | 2,455,613 | |
5,778,095 | | Credit Suisse Mortgage Capital Certificates, Series 2009-12R-5A1 | | | 6.00 | % (b)(h) | | | 06/27/2036 | | | | 3,208,107 | |
7,448,710 | | Credit Suisse Mortgage Capital Certificates, Series 2012-10R-4A2 | | | 3.68 | % (a)(h) | | | 08/26/2046 | | | | 5,208,359 | |
30,365,494 | | Credit Suisse Mortgage Capital Certificates, Series 2021-RPL9-A1 | | | 2.44 | % (a)(h) | | | 02/25/2061 | | | | 28,432,120 | |
70,579,096 | | Credit Suisse Mortgage-Backed Trust, Series 2017-RPL2-CERT | | | 0.00 | % (a)(b)(h) | | | 02/25/2056 | | | | 52,473,977 | |
4,227,000 | | Credit Suisse Mortgage-Backed Trust, Series 2020-AFC1-B1 | | | 3.45 | % (a)(h) | | | 02/25/2050 | | | | 3,009,339 | |
9,394,125 | | Credit Suisse Mortgage-Backed Trust, Series 2020-RPL1-CERT | | | 3.23 | % (a)(h) | | | 01/25/2046 | | | | 7,685,017 | |
8,411,458 | | Credit-Based Asset Servicing and Securitization LLC, Series 2006-CB4-AV3 (1 Month LIBOR USD + 0.30%, 0.30% Floor) | | | 3.18 | % | | | 05/25/2036 | | | | 5,470,131 | |
3,963,183 | | CSAB Mortgage Backed Trust, Series 2006-3-A4B | | | 6.61 | % | | | 11/25/2036 | | | | 667,340 | |
2,298,202 | | CSAB Mortgage Backed Trust, Series 2006-4-A6A | | | 6.18 | % | | | 12/25/2036 | | | | 476,526 | |
8,406,984 | | CSAB Mortgage Backed Trust, Series 2007-1-1A1A | | | 5.90 | % (a) | | | 05/25/2037 | | | | 2,192,572 | |
776,887 | | CSMC Mortgage-Backed Trust, Series 2005-1R-2A5 | | | 5.75 | % (h) | | | 12/26/2035 | | | | 556,666 | |
11,281,244 | | CSMC Mortgage-Backed Trust, Series 2006-1-2A1 | | | 6.00 | % | | | 02/25/2036 | | | | 3,828,666 | |
2,338,043 | | CSMC Mortgage-Backed Trust, Series 2006-2-5A1 (1 Month LIBOR USD + 0.70%, 0.70% Floor, 6.00% Cap) | | | 5.55 | % | | | 03/25/2036 | | | | 782,853 | |
13,068,583 | | CSMC Mortgage-Backed Trust, Series 2006-2-5A2 (-1 x 1 Month LIBOR USD + 5.30%, 5.30% Cap) | | | 0.45 | % (c)(d) | | | 03/25/2036 | | | | 1,211,286 | |
2,722,168 | | CSMC Mortgage-Backed Trust, Series 2006-2-5A3 | | | 6.25 | % | | | 03/25/2036 | | | | 1,244,048 | |
7,367,274 | | CSMC Mortgage-Backed Trust, Series 2006-2-5A4 | | | 6.00 | % | | | 03/25/2036 | | | | 3,254,521 | |
1,138,804 | | CSMC Mortgage-Backed Trust, Series 2006-3-4A3 | | | 5.50 | % | | | 04/25/2036 | | | | 835,345 | |
688,436 | | CSMC Mortgage-Backed Trust, Series 2006-3-4A4 | | | 5.50 | % | | | 04/25/2036 | | | | 504,987 | |
2,431,308 | | CSMC Mortgage-Backed Trust, Series 2006-4-1A8 (1 Month LIBOR USD + 1.00%, 6.00% Floor, 6.00% Cap) | | | 6.00 | % | | | 05/25/2036 | | | | 1,462,207 | |
20,280,070 | | CSMC Mortgage-Backed Trust, Series 2006-4-4A1 | | | 7.00 | % | | | 05/25/2036 | | | | 5,219,940 | |
7,094,686 | | CSMC Mortgage-Backed Trust, Series 2006-4-6A1 | | | 6.00 | % | | | 05/25/2036 | | | | 3,066,450 | |
6,871,044 | | CSMC Mortgage-Backed Trust, Series 2006-6-1A4 | | | 6.00 | % | | | 07/25/2036 | | | | 3,671,201 | |
10,035,754 | | CSMC Mortgage-Backed Trust, Series 2006-6-3A1 | | | 7.00 | % | | | 07/25/2036 | | | | 1,613,799 | |
113,952 | | CSMC Mortgage-Backed Trust, Series 2006-7-3A11 | | | 6.00 | % | | | 08/25/2036 | | | | 47,222 | |
1,576,857 | | CSMC Mortgage-Backed Trust, Series 2006-7-7A5 | | | 6.00 | % | | | 08/25/2036 | | | | 1,253,813 | |
2,411,842 | | CSMC Mortgage-Backed Trust, Series 2006-9-2A1 | | | 5.50 | % | | | 11/25/2036 | | | | 2,088,844 | |
9,389,727 | | CSMC Mortgage-Backed Trust, Series 2006-9-3A1 | | | 6.00 | % | | | 11/25/2036 | | | | 8,096,679 | |
3,553,863 | | CSMC Mortgage-Backed Trust, Series 2006-9-4A1 | | | 6.00 | % | | | 11/25/2036 | | | | 2,300,130 | |
1,437,029 | | CSMC Mortgage-Backed Trust, Series 2006-9-6A14 | | | 6.00 | % | | | 11/25/2036 | | | | 1,239,339 | |
233,473 | | CSMC Mortgage-Backed Trust, Series 2006-9-6A15 (-6 x 1 Month LIBOR USD + 39.90%, 39.90% Cap) | | | 12.20 | % (d) | | | 11/25/2036 | | | | 305,618 | |
8,413,117 | | CSMC Mortgage-Backed Trust, Series 2007-1-1A4 | | | 6.13 | % (a) | | | 02/25/2037 | | | | 2,155,504 | |
5,453,663 | | CSMC Mortgage-Backed Trust, Series 2007-1-3A1 | | | 6.00 | % | | | 02/25/2057 | | | | 966,405 | |
2,989,103 | | CSMC Mortgage-Backed Trust, Series 2007-1-5A14 | | | 6.00 | % | | | 02/25/2037 | | | | 1,797,478 | |
27,237 | | CSMC Mortgage-Backed Trust, Series 2007-2-2A1 | | | 5.00 | % | | | 03/25/2037 | | | | 21,712 | |
5,172,094 | | CSMC Mortgage-Backed Trust, Series 2007-3-2A10 | | | 6.00 | % | | | 04/25/2037 | | | | 2,061,306 | |
2,486,878 | | CSMC Mortgage-Backed Trust, Series 2007-5-2A5 | | | 5.00 | % | | | 08/25/2037 | | | | 2,052,580 | |
24,060,900 | | CSMC Mortgage-Backed Trust, Series 2007-5-3A19 | | | 6.00 | % | | | 08/25/2037 | | | | 18,513,238 | |
10,611,782 | | CSMC Mortgage-Backed Trust, Series 2007-5-3A9 | | | 6.00 | % | | | 08/25/2037 | | | | 8,165,806 | |
2,446,912 | | CSMC Mortgage-Backed Trust, Series 2008-2R-1A1 | | | 6.00 | % (b)(h) | | | 07/25/2037 | | | | 1,913,911 | |
11,164 | | CSMC Trust, Series 2009-1R-4A2 | | | 3.26 | % (a)(h) | | | 07/20/2035 | | | | 12,900 | |
1,599,980 | | CSMC Trust, Series 2010-13R-1A2 | | | 5.50 | % (a)(h) | | | 12/26/2035 | | | | 1,362,563 | |
23,098,537 | | CSMC Trust, Series 2010-17R-6A1 | | | 3.26 | % (a)(h) | | | 06/26/2037 | | | | 21,854,593 | |
7,073,567 | | CSMC Trust, Series 2010-4R-3A17 | | | 6.00 | % (a)(b)(h) | | | 06/26/2037 | | | | 6,197,208 | |
3,492,393 | | CSMC Trust, Series 2010-4R-8A17 | | | 6.00 | % (a)(b)(h) | | | 06/26/2037 | | | | 3,067,514 | |
8,827,666 | | CSMC Trust, Series 2010-7R-1A17 | | | 6.00 | % (a)(h) | | | 01/26/2037 | | | | 4,992,547 | |
9,025,787 | | CSMC Trust, Series 2013-9R-A1 | | | 3.00 | % (a)(h) | | | 05/27/2043 | | | | 7,749,223 | |
7,785,636 | | CSMC Trust, Series 2019-RPL6-CERT | | | 0.00 | % (a)(h) | | | 11/25/2058 | | | | 6,792,065 | |
185,127,764 | | CSMC Trust, Series 2019-RPL6-PT1 | | | 3.91 | % (a)(h) | | | 11/25/2058 | | | | 160,356,022 | |
179,692,655 | | CSMC Trust, Series 2020-RPL1-PT1 | | | 3.34 | % (a)(h) | | | 10/25/2069 | | | | 143,046,908 | |
15,777,612 | | CSMC Trust, Series 2021-JR1-A1 | | | 2.47 | % (a)(h) | | | 09/27/2066 | | | | 15,198,708 | |
14,307,474 | | CSMC Trust, Series 2021-JR2-A1 | | | 2.22 | % (a)(h) | | | 11/25/2061 | | | | 13,652,591 | |
7,469,850 | | CSMC Trust, Series 2021-NQM1-B1 | | | 2.83 | % (a)(h) | | | 05/25/2065 | | | | 4,711,797 | |
6,225,825 | | CSMC Trust, Series 2021-NQM5-M1 | | | 2.17 | % (a)(h) | | | 05/25/2066 | | | | 3,234,249 | |
3,180,040 | | CSMC Trust, Series 2021-NQM6-B1 | | | 3.29 | % (a)(h) | | | 07/25/2066 | | | | 1,760,413 | |
7,445,317 | | CSMC Trust, Series 2021-NQM6-M1 | | | 2.58 | % (a)(h) | | | 07/25/2066 | | | | 4,174,008 | |
17,544,000 | | CWABS Asset-Backed Certificates Trust, Series 2005-11-MF1 | | | 5.35 | % (a) | | | 02/25/2036 | | | | 14,960,042 | |
1,887,962 | | CWABS Asset-Backed Certificates Trust, Series 2005-4-AF5B | | | 5.65 | % | | | 10/25/2035 | | | | 1,864,237 | |
7,976,255 | | Deutsche ALT-A Securities, Inc. Mortgage Loan Trust, Series 2005-4-A5 | | | 5.50 | % (a) | | | 09/25/2035 | | | | 7,099,209 | |
258,856 | | Deutsche ALT-A Securities, Inc. Mortgage Loan Trust, Series 2005-5-1A6 (-7 x 1 Month LIBOR USD + 35.93%, 35.93% Cap) | | | 0.40 | % (d) | | | 11/25/2035 | | | | 355,924 | |
503,713 | | Deutsche ALT-A Securities, Inc. Mortgage Loan Trust, Series 2005-5-2A1 (1 Month LIBOR USD + 0.20%, 0.20% Floor, 5.50% Cap) | | | 5.05 | % | | | 11/25/2035 | | | | 238,051 | |
1,520,260 | | Deutsche ALT-A Securities, Inc. Mortgage Loan Trust, Series 2005-5-2A2 (-1 x 1 Month LIBOR USD + 5.30%, 5.30% Cap) | | | 0.45 | % (c)(d) | | | 11/25/2035 | | | | 70,397 | |
5,174,296 | | Deutsche ALT-A Securities, Inc. Mortgage Loan Trust, Series 2005-6-2A1 | | | 5.50 | % | | | 12/25/2035 | | | | 4,479,904 | |
13,271,484 | | Deutsche ALT-A Securities, Inc. Mortgage Loan Trust, Series 2007-2-2A1 (1 Month LIBOR USD + 0.30%, 0.30% Floor) | | | 5.15 | % | | | 09/25/2047 | | | | 10,966,020 | |
15,806,293 | | Deutsche ALT-A Securities, Inc. Mortgage Loan Trust, Series 2007-OA3-A2 (1 Month LIBOR USD + 0.25%, 0.25% Floor) | | | 5.10 | % | | | 07/25/2047 | | | | 13,522,200 | |
3,281,056 | | Deutsche ALT-B Securities, Inc. Mortgage Loan Trust, Series 2006-AB1-A1C | | | 5.67 | % (a) | | | 02/25/2036 | | | | 3,044,098 | |
420,714 | | Deutsche ALT-B Securities, Inc. Mortgage Loan Trust, Series 2006-AB2-A2 | | | 4.81 | % (a) | | | 06/25/2036 | | | | 365,202 | |
736,269 | | Deutsche ALT-B Securities, Inc. Mortgage Loan Trust, Series 2006-AB4-A1A | | | 6.01 | % (a) | | | 10/25/2036 | | | | 657,196 | |
10,281,383 | | Deutsche ALT-B Securities, Inc. Mortgage Loan Trust, Series 2006-AB4-A2 | | | 5.65 | % (a) | | | 10/25/2036 | | | | 9,179,796 | |
732,425 | | Deutsche ALT-B Securities, Inc. Mortgage Loan Trust, Series 2006-AB4-A3 | | | 5.90 | % (a) | | | 10/25/2036 | | | | 653,821 | |
1,068,740 | | Deutsche ALT-B Securities, Inc. Mortgage Loan Trust, Series 2006-AB4-A3A1 | | | 5.90 | % (a) | | | 10/25/2036 | | | | 952,215 | |
2,112,259 | | Deutsche ALT-B Securities, Inc. Mortgage Loan Trust, Series 2006-AB4-A6A1 | | | 6.37 | % | | | 10/25/2036 | | | | 1,878,938 | |
3,910,025 | | Deutsche Mortgage & Asset Receiving Corporation, Series 2014-RS1-3A2 (1 Month LIBOR USD + 0.40%, 0.40% Floor, 7.00% Cap) | | | 4.12 | % (b)(h) | | | 10/27/2036 | | | | 3,197,817 | |
4,546,877 | | Deutsche Mortgage Securities, Inc., Series 2006-PR1-3A1 (-1 x 1 Month LIBOR USD + 12.12%, 12.12% Cap) | | | 5.57 | % (d)(h) | | | 04/15/2036 | | | | 4,213,677 | |
1,557,841 | | Deutsche Mortgage Securities, Inc., Series 2006-PR1-4AI1 (-1 x 1 Month LIBOR USD + 12.11%, 12.11% Cap) | | | 5.55 | % (d)(h) | | | 04/15/2036 | | | | 1,441,588 | |
2,537,386 | | Deutsche Mortgage Securities, Inc., Series 2006-PR1-4AI2 (-2 x 1 Month LIBOR USD + 14.60%, 14.61% Cap) | | | 5.66 | % (d)(h) | | | 04/15/2036 | | | | 2,337,173 | |
321,982 | | Deutsche Mortgage Securities, Inc., Series 2006-PR1-5AI1 (-3 x 1 Month LIBOR USD + 19.35%, 19.35% Cap) | | | 5.30 | % (d)(h) | | | 04/15/2036 | | | | 296,723 | |
2,826,700 | | Deutsche Mortgage Securities, Inc., Series 2006-PR1-5AI3 (-1 x 1 Month LIBOR USD + 12.57%, 12.57% Cap) | | | 6.01 | % (d)(h) | | | 04/15/2036 | | | | 2,510,477 | |
46,823,481 | | Deutsche Mortgage Securities, Inc., Series 2006-PR1-5AI4 (-1 x 1 Month LIBOR USD + 12.12%, 12.12% Cap) | | | 5.57 | % (d)(h) | | | 04/15/2036 | | | | 41,498,251 | |
10,737,278 | | Equifirst Loan Securitization Trust, Series 2007-1-A2B (1 Month LIBOR USD + 0.19%, 0.19% Floor) | | | 5.04 | % | | | 04/25/2037 | | | | 9,161,428 | |
22,750,000 | | FBR Securitization Trust, Series 2005-2-M4 (1 Month LIBOR USD + 0.93%, 0.93% Floor, 14.00% Cap) | | | 5.78 | % | | | 09/25/2035 | | | | 19,528,696 | |
5,500,000 | | FBR Securitization Trust, Series 2005-5-M3 (1 Month LIBOR USD + 0.74%, 0.74% Floor, 14.00% Cap) | | | 5.58 | % | | | 11/25/2035 | | | | 4,909,556 | |
75,600,000 | | Federal Home Loan Mortgage Corporation STACR REMIC Trust, Series 2022-DNA3-M1B (Secured Overnight Financing Rate 30 Day Average + 2.90%) | | | 7.46 | % (h) | | | 04/25/2042 | | | | 75,132,195 | |
3,411,212 | | Fieldstone Mortgage Investment Trust, Series 2007-1-2A2 (1 Month LIBOR USD + 0.27%, 0.27% Floor, 12.25% Cap) | | | 5.16 | % | | | 04/25/2047 | | | | 2,378,399 | |
20,673,780 | | Figure Line of Credit Trust, Series 2020-1-A | | | 4.04 | % (a)(h) | | | 09/25/2049 | | | | 19,771,761 | |
7,485,652 | | First Franklin Mortgage Loan Trust, Series 2006-FF8-M1 (1 Month LIBOR USD + 0.38%, 0.38% Floor) | | | 5.22 | % | | | 07/25/2036 | | | | 6,909,199 | |
4,000,000 | | First Franklin Mortgage Loan Trust, Series 2006-FF9-2A4 (1 Month LIBOR USD + 0.50%, 0.50% Floor) | | | 5.35 | % | | | 06/25/2036 | | | | 3,491,916 | |
18,416,005 | | First Franklin Mortgage Loan Trust, Series 2007-FF2-A1 (1 Month LIBOR USD + 0.14%, 0.14% Floor) | | | 4.99 | % | | | 03/25/2037 | | | | 10,110,904 | |
21,924,384 | | First Franklin Mortgage Loan Trust, Series 2007-FF2-A2C (1 Month LIBOR USD + 0.15%, 0.15% Floor) | | | 5.00 | % | | | 03/25/2037 | | | | 10,771,996 | |
2,972,576 | | First Horizon Alternative Mortgage Securities Trust, Series 2005-AA4-1A1 | | | 4.08 | % (a) | | | 05/25/2035 | | | | 1,596,172 | |
3,466,489 | | First Horizon Alternative Mortgage Securities Trust, Series 2005-FA8-1A4 | | | 5.50 | % | | | 11/25/2035 | | | | 1,835,578 | |
258,593 | | First Horizon Alternative Mortgage Securities Trust, Series 2005-FA8-2A1 | | | 5.00 | % | | | 02/25/2050 | | | | 257,293 | |
1,138,505 | | First Horizon Alternative Mortgage Securities Trust, Series 2006-AA3-A1 | | | 4.45 | % (a) | | | 06/25/2036 | | | | 890,311 | |
1,938,472 | | First Horizon Alternative Mortgage Securities Trust, Series 2006-FA1-1A12 | | | 6.00 | % | | | 04/25/2036 | | | | 995,383 | |
6,504,781 | | First Horizon Alternative Mortgage Securities Trust, Series 2006-FA1-1A3 | | | 5.75 | % | | | 04/25/2036 | | | | 3,213,571 | |
1,234,436 | | First Horizon Alternative Mortgage Securities Trust, Series 2006-FA2-1A5 | | | 6.00 | % | | | 05/25/2036 | | | | 556,174 | |
1,947,026 | | First Horizon Alternative Mortgage Securities Trust, Series 2006-FA8-1A5 | | | 6.00 | % | | | 02/25/2037 | | | | 862,708 | |
2,946,472 | | First Horizon Alternative Mortgage Securities Trust, Series 2006-RE1-A1 | | | 5.50 | % (a) | | | 05/25/2035 | | | | 2,017,131 | |
10,628,076 | | First Horizon Alternative Mortgage Securities Trust, Series 2007-FA3-A3 | | | 6.00 | % | | | 06/25/2037 | | | | 4,456,869 | |
546,869 | | First Horizon Alternative Mortgage Securities Trust, Series 2007-FA3-A4 | | | 6.00 | % | | | 06/25/2037 | | | | 229,329 | |
611,663 | | First Horizon Alternative Mortgage Securities Trust, Series 2007-FA4-1A13 | | | 6.25 | % | | | 08/25/2037 | | | | 273,833 | |
1,888,250 | | First Horizon Alternative Mortgage Securities Trust, Series 2007-FA4-1A4 | | | 6.25 | % | | | 08/25/2037 | | | | 845,344 | |
1,073,585 | | First Horizon Alternative Mortgage Securities Trust, Series 2007-FA4-1A5 | | | 6.25 | % | | | 08/25/2037 | | | | 480,630 | |
928,245 | | First Horizon Mortgage Pass-Through Trust, Series 2006-1-1A2 | | | 6.00 | % | | | 05/25/2036 | | | | 461,111 | |
1,532,056 | | First Horizon Mortgage Pass-Through Trust, Series 2007-4-1A1 | | | 6.00 | % | | | 08/25/2037 | | | | 658,714 | |
9,000,000 | | FirstKey Homes Trust, Series 2020-SFR1-E | | | 2.79 | % (h) | | | 08/17/2037 | | | | 8,274,738 | |
18,000,000 | | FirstKey Homes Trust, Series 2020-SFR2-D | | | 1.97 | % (h) | | | 10/19/2037 | | | | 16,179,793 | |
26,225,000 | | FirstKey Homes Trust, Series 2020-SFR2-E | | | 2.67 | % (h) | | | 10/19/2037 | | | | 23,836,812 | |
16,350,000 | | FirstKey Homes Trust, Series 2021-SFR1-E1 | | | 2.39 | % (h) | | | 08/17/2038 | | | | 13,946,877 | |
11,500,000 | | FirstKey Homes Trust, Series 2021-SFR1-E2 | | | 2.49 | % (h) | | | 08/17/2038 | | | | 9,754,048 | |
8,000,000 | | FirstKey Homes Trust, Series 2021-SFR2-D | | | 2.06 | % (h) | | | 09/17/2038 | | | | 6,927,515 | |
8,000,000 | | FirstKey Homes Trust, Series 2021-SFR2-E1 | | | 2.26 | % (h) | | | 09/17/2038 | | | | 6,856,818 | |
8,000,000 | | FirstKey Homes Trust, Series 2021-SFR2-E2 | | | 2.36 | % (h) | | | 09/17/2038 | | | | 6,827,385 | |
34,891,000 | | FirstKey Homes Trust, Series 2021-SFR3-B | | | 2.44 | % (h) | | | 12/17/2038 | | | | 31,042,198 | |
29,584,000 | | FirstKey Homes Trust, Series 2021-SFR3-C | | | 2.54 | % (h) | | | 12/17/2038 | | | | 26,285,227 | |
22,626,000 | | FirstKey Homes Trust, Series 2021-SFR3-D | | | 2.79 | % (h) | | | 12/17/2038 | | | | 20,120,085 | |
45,314,000 | | FirstKey Homes Trust, Series 2021-SFR3-E1 | | | 2.99 | % (h) | | | 12/17/2038 | | | | 39,724,930 | |
25,293,000 | | FirstKey Homes Trust, Series 2021-SFR3-E2 | | | 3.08 | % (h) | | | 12/17/2038 | | | | 22,180,800 | |
10,174,000 | | FirstKey Homes Trust, Series 2021-SFR3-F1 | | | 3.58 | % (h) | | | 12/17/2038 | | | | 8,808,166 | |
62,350,000 | | FMC GMSR Issuer Trust, Series 2020-GT1-A | | | 4.45 | % (a)(h) | | | 01/25/2026 | | | | 57,326,248 | |
72,500,000 | | FMC GMSR Issuer Trust, Series 2021-GT1-A | | | 3.62 | % (a)(h) | | | 07/25/2026 | | | | 62,355,930 | |
64,820,000 | | FMC GMSR Issuer Trust, Series 2021-GT2-A | | | 3.85 | % (a)(h) | | | 10/25/2026 | | | | 55,735,367 | |
118,622,712 | | Fremont Home Loan Trust, Series 2006-D-1A1 (1 Month LIBOR USD + 0.14%, 0.14% Floor) | | | 4.99 | % | | | 11/25/2036 | | | | 70,709,136 | |
7,750,000 | | FRTKL, Series 2021-SFR1-E1 | | | 2.37 | % (h) | | | 09/17/2038 | | | | 6,565,789 | |
6,650,000 | | FRTKL, Series 2021-SFR1-E2 | | | 2.52 | % (h) | | | 09/17/2038 | | | | 5,600,190 | |
2,751,000 | | GCAT Trust, Series 2019-NQM3-M1 | | | 3.45 | % (a)(h) | | | 11/25/2059 | | | | 2,157,526 | |
7,096,000 | | GCAT Trust, Series 2021-NQM2-M1 | | | 2.54 | % (a)(h) | | | 05/25/2066 | | | | 4,393,066 | |
8,405,000 | | GCAT Trust, Series 2021-NQM6-B1 | | | 4.42 | % (a)(h) | | | 08/25/2066 | | | | 5,697,489 | |
32,779,839 | | GE-WMC Mortgage Securities Trust, Series 2006-1-A2B (1 Month LIBOR USD + 0.30%, 0.30% Floor) | | | 5.15 | % | | | 08/25/2036 | | | | 14,332,493 | |
1,862,898 | | GMACM Mortgage Loan Trust, Series 2005-AR5-3A1 | | | 3.88 | % (a) | | | 09/19/2035 | | | | 1,557,637 | |
21,535,545 | | GreenPoint Mortgage Funding Trust, Series 2005-AR3-2A1 (1 Month LIBOR USD + 0.52%, 0.52% Floor, 10.50% Cap) | | | 5.37 | % | | | 08/25/2045 | | | | 7,642,530 | |
18,161,621 | | GreenPoint Mortgage Funding Trust, Series 2007-AR2-1A3 (1 Month LIBOR USD + 0.24%, 0.24% Floor) | | | 5.09 | % | | | 04/25/2047 | | | | 15,583,911 | |
893,496 | | GS Mortgage Securities Corporation Trust, Series 2008-2R-1A1 | | | 3.86 | % (a)(h) | | | 09/25/2036 | | | | 330,070 | |
114,552,960 | | GS Mortgage-Backed Securities Trust, Series 2020-RPL2-A1 | | | 1.75 | % (a)(h) | | | 05/25/2060 | | | | 98,214,706 | |
12,540,000 | | GS Mortgage-Backed Securities Trust, Series 2020-RPL2-M1 | | | 2.25 | % (a)(h) | | | 05/25/2060 | | | | 10,024,611 | |
10,237,000 | | GS Mortgage-Backed Securities Trust, Series 2020-RPL2-M2 | | | 2.75 | % (a)(h) | | | 05/25/2060 | | | | 7,953,553 | |
9,341,000 | | GS Mortgage-Backed Securities Trust, Series 2020-RPL2-M3 | | | 3.00 | % (a)(h) | | | 05/25/2060 | | | | 7,058,428 | |
31,826,217 | | GS Mortgage-Backed Securities Trust, Series 2020-RPL2-PT4 | | | 6.67 | % (f)(h) | | | 05/25/2060 | | | | 30,657,527 | |
110,618 | | GSAA Home Equity Trust, Series 2005-12-AF3 | | | 5.07 | % (a) | | | 09/25/2035 | | | | 75,566 | |
7,909,999 | | GSAA Home Equity Trust, Series 2006-10-AF3 | | | 5.98 | % (a) | | | 06/25/2036 | | | | 2,131,020 | |
5,661,322 | | GSAA Home Equity Trust, Series 2006-10-AF4 | | | 6.80 | % | | | 06/25/2036 | | | | 1,521,371 | |
10,929,573 | | GSAA Home Equity Trust, Series 2006-15-AF4 | | | 6.46 | % | | | 09/25/2036 | | | | 3,162,274 | |
1,670,453 | | GSAA Home Equity Trust, Series 2006-18-AF3A | | | 5.77 | % (a) | | | 11/25/2036 | | | | 505,579 | |
3,902,051 | | GSAA Home Equity Trust, Series 2006-18-AF6 | | | 6.18 | % | | | 11/25/2036 | | | | 985,758 | |
7,366,425 | | GSAA Home Equity Trust, Series 2006-19-A1 (1 Month LIBOR USD + 0.18%, 0.18% Floor) | | | 5.03 | % | | | 12/25/2036 | | | | 2,034,923 | |
3,983,251 | | GSAA Home Equity Trust, Series 2007-10-A1A | | | 6.00 | % | | | 11/25/2037 | | | | 2,476,637 | |
2,522,239 | | GSAA Home Equity Trust, Series 2007-10-A2A | | | 6.50 | % | | | 11/25/2037 | | | | 1,169,893 | |
5,751,438 | | GSAA Home Equity Trust, Series 2007-7-A5 (1 Month LIBOR USD + 0.56%, 0.56% Floor) | | | 5.41 | % | | | 07/25/2037 | | | | 2,933,144 | |
16,224,395 | | GSAMP Trust, Series 2006-HE6-A3 (1 Month LIBOR USD + 0.30%, 0.30% Floor) | | | 5.15 | % | | | 08/25/2036 | | | | 12,878,426 | |
6,945,385 | | GSAMP Trust, Series 2007-H1-A2B (1 Month LIBOR USD + 0.40%, 0.40% Floor) | | | 5.25 | % | | | 01/25/2047 | | | | 3,649,613 | |
6,726,138 | | GSMPS Mortgage Loan Trust, Series 2005-RP2-1AF (1 Month LIBOR USD + 0.35%, 0.35% Floor) | | | 5.20 | % (h) | | | 03/25/2035 | | | | 5,872,384 | |
6,726,138 | | GSMPS Mortgage Loan Trust, Series 2005-RP2-1AS | | | 0.00 | % (a)(c)(h) | | | 03/25/2035 | | | | 126,009 | |
4,348,925 | | GSMPS Mortgage Loan Trust, Series 2005-RP3-1AF (1 Month LIBOR USD + 0.35%, 0.35% Floor, 9.50% Cap) | | | 5.20 | % (h) | | | 09/25/2035 | | | | 3,699,889 | |
4,348,925 | | GSMPS Mortgage Loan Trust, Series 2005-RP3-1AS | | | 0.00 | % (a)(c)(h) | | | 09/25/2035 | | | | 71,269 | |
16,422,098 | | GSMPS Mortgage Loan Trust, Series 2006-RP1-1AF1 (1 Month LIBOR USD + 0.35%, 0.35% Floor, 9.15% Cap) | | | 5.20 | % (h) | | | 01/25/2036 | | | | 13,339,448 | |
16,422,098 | | GSMPS Mortgage Loan Trust, Series 2006-RP1-1AS | | | 0.00 | % (a)(c)(h) | | | 01/25/2036 | | | | 304,784 | |
17,199,806 | | GSMSC Resecuritization Trust, Series 2014-3R-2B (1 Month LIBOR USD + 0.18%, 0.18% Floor) | | | 4.80 | % (h) | | | 09/26/2036 | | | | 10,327,396 | |
727,900 | | GSR Mortgage Loan Trust, Series 2005-1F-1A2 | | | 5.50 | % | | | 02/25/2035 | | | | 687,802 | |
1,704,623 | | GSR Mortgage Loan Trust, Series 2005-1F-3A3 | | | 6.00 | % | | | 01/25/2035 | | | | 1,525,914 | |
218,348 | | GSR Mortgage Loan Trust, Series 2005-6F-3A5 | | | 6.00 | % | | | 07/25/2035 | | | | 208,397 | |
2,299,191 | | GSR Mortgage Loan Trust, Series 2005-6F-3A9 (-1 x 1 Month LIBOR USD + 6.90%, 6.90% Cap) | | | 2.05 | % (c)(d) | | | 07/25/2035 | | | | 205,239 | |
136,481 | | GSR Mortgage Loan Trust, Series 2005-6F-4A1 (1 Month LIBOR USD + 0.50%, 0.50% Floor, 6.00% Cap) | | | 5.35 | % | | | 07/25/2035 | | | | 130,599 | |
110,461 | | GSR Mortgage Loan Trust, Series 2005-7F-3A1 (1 Month LIBOR USD + 0.50%, 0.50% Floor, 6.00% Cap) | | | 5.35 | % | | | 09/25/2035 | | | | 107,416 | |
6,976,869 | | GSR Mortgage Loan Trust, Series 2005-8F-3A5 | | | 6.00 | % | | | 11/25/2035 | | | | 3,035,487 | |
1,670,972 | | GSR Mortgage Loan Trust, Series 2005-8F-4A1 | | | 6.00 | % | | | 11/25/2035 | | | | 709,497 | |
186,377 | | GSR Mortgage Loan Trust, Series 2006-1F-1A2 | | | 5.50 | % | | | 02/25/2036 | | | | 308,158 | |
345,192 | | GSR Mortgage Loan Trust, Series 2006-2F-2A3 | | | 5.75 | % | | | 02/25/2036 | | | | 308,349 | |
1,561,603 | | GSR Mortgage Loan Trust, Series 2006-2F-3A3 | | | 6.00 | % | | | 02/25/2036 | | | | 826,011 | |
1,875,479 | | GSR Mortgage Loan Trust, Series 2006-2F-3A6 | | | 6.00 | % | | | 02/25/2036 | | | | 992,037 | |
17,082,497 | | GSR Mortgage Loan Trust, Series 2006-5F-3A1 | | | 6.50 | % | | | 06/25/2036 | | | | 8,145,452 | |
4,396,506 | | GSR Mortgage Loan Trust, Series 2006-6F-2A3 | | | 6.00 | % | | | 07/25/2036 | | | | 2,683,557 | |
3,670,473 | | GSR Mortgage Loan Trust, Series 2006-7F-3A4 | | | 6.25 | % | | | 08/25/2036 | | | | 1,327,362 | |
9,684,311 | | GSR Mortgage Loan Trust, Series 2006-9F-4A1 | | | 6.50 | % | | | 10/25/2036 | | | | 4,617,301 | |
28,008,092 | | GSR Mortgage Loan Trust, Series 2006-OA1-3A1 | | | 3.77 | % (f) | | | 08/25/2046 | | | | 6,319,421 | |
198,711 | | GSR Mortgage Loan Trust, Series 2007-1F-2A2 | | | 5.50 | % | | | 01/25/2037 | | | | 399,972 | |
582,071 | | GSR Mortgage Loan Trust, Series 2007-4F-1A1 | | | 5.00 | % | | | 07/25/2037 | | | | 838,329 | |
12,625,870 | | GSR Mortgage Loan Trust, Series 2007-4F-3A11 | | | 6.00 | % | | | 07/25/2037 | | | | 8,329,319 | |
41,782,715 | | GSR Mortgage Loan Trust, Series 2007-OA1-1A1 (1 Month LIBOR USD + 0.23%, 0.23% Floor) | | | 5.08 | % | | | 05/25/2037 | | | | 22,708,739 | |
287,674 | | Harborview Mortgage Loan Trust, Series 2005-14-3A1A | | | 4.37 | % (a) | | | 12/19/2035 | | | | 269,669 | |
5,225,443 | | Harborview Mortgage Loan Trust, Series 2005-2-1A (1 Month LIBOR USD + 0.52%, 0.52% Floor) | | | 5.28 | % | | | 05/19/2035 | | | | 1,729,965 | |
21,715,548 | | Harborview Mortgage Loan Trust, Series 2005-8-1A1A (1 Month LIBOR USD + 0.62%, 0.62% Floor, 11.00% Cap) | | | 5.38 | % | | | 09/19/2035 | | | | 11,275,199 | |
41,446,843 | | Harborview Mortgage Loan Trust, Series 2005-8-2A1A (12 Month US Treasury Average + 1.55%, 1.55% Floor) | | | 4.69 | % | | | 09/19/2035 | | | | 20,014,519 | |
3,929,869 | | Harborview Mortgage Loan Trust, Series 2006-10-2A1A (1 Month LIBOR USD + 0.18%, 0.18% Floor) | | | 4.78 | % | | | 11/19/2036 | | | | 3,404,823 | |
4,349,111 | | Harborview Mortgage Loan Trust, Series 2006-11-A1A (1 Month LIBOR USD + 0.34%, 0.34% Floor) | | | 5.10 | % | | | 12/19/2036 | | | | 3,728,022 | |
32,180,958 | | Harborview Mortgage Loan Trust, Series 2006-14-1A1A (1 Month LIBOR USD + 0.36%, 0.36% Floor) | | | 5.12 | % | | | 01/25/2047 | | | | 28,680,539 | |
5,617,857 | | Harborview Mortgage Loan Trust, Series 2006-4-1A2A (1 Month LIBOR USD + 0.38%, 0.38% Floor) | | | 5.14 | % | | | 05/19/2046 | | | | 2,846,642 | |
57,914,288 | | Harborview Mortgage Loan Trust, Series 2006-8-1A1 (1 Month LIBOR USD + 0.40%) | | | 4.98 | % | | | 07/21/2036 | | | | 29,822,731 | |
7,274,727 | | Harborview Mortgage Loan Trust, Series 2006-BU1-1A1A (1 Month LIBOR USD + 0.42%, 0.42% Floor, 10.50% Cap) | | | 5.18 | % | | | 02/19/2046 | | | | 6,006,419 | |
14,338,289 | | Harborview Mortgage Loan Trust, Series 2007-7-1A1 (1 Month LIBOR USD + 2.00%, 10.50% Cap) | | | 5.85 | % | | | 10/25/2037 | | | | 11,465,227 | |
445,639 | | Home Equity Asset Trust, Series 2003-3-M1 (1 Month LIBOR USD + 1.29%, 1.29% Floor) | | | 6.14 | % | | | 08/25/2033 | | | | 432,056 | |
112,448 | | Home Equity Asset Trust, Series 2004-7-M2 (1 Month LIBOR USD + 0.99%, 0.99% Floor) | | | 5.84 | % | | | 01/25/2035 | | | | 112,305 | |
12,182,000 | | Home Equity Mortgage Loan Asset-Backed Trust, Series 2006-B-2A4 (1 Month LIBOR USD + 0.56%, 0.56% Floor) | | | 5.41 | % | | | 06/25/2036 | | | | 10,561,256 | |
8,528,139 | | Home Equity Mortgage Loan Asset-Backed Trust, Series 2006-D-2A4 (1 Month LIBOR USD + 0.24%, 0.24% Floor) | | | 5.09 | % | | | 11/25/2036 | | | | 6,800,652 | |
8,070,567 | | Home Equity Mortgage Loan Asset-Backed Trust, Series 2007-B-1A1 (1 Month LIBOR USD + 0.19%, 0.19% Floor) | | | 5.04 | % | | | 07/25/2037 | | | | 3,264,372 | |
8,070,567 | | Home Equity Mortgage Loan Asset-Backed Trust, Series 2007-B-1A2 (1 Month LIBOR USD + 0.19%, 0.19% Floor) | | | 5.04 | % | | | 07/25/2037 | | | | 3,264,372 | |
3,687,594 | | Home Partners of America Trust, Series 2019-2-C | | | 3.02 | % (h) | | | 10/19/2039 | | | | 3,275,036 | |
3,922,972 | | Home Partners of America Trust, Series 2019-2-D | | | 3.12 | % (h) | | | 10/19/2039 | | | | 3,450,796 | |
7,384,419 | | Home Partners of America Trust, Series 2019-2-E | | | 3.32 | % (h) | | | 10/19/2039 | | | | 6,385,842 | |
389,465 | | HomeBanc Mortgage Trust, Series 2005-1-M2 (1 Month LIBOR USD + 0.74%, 0.74% Floor, 11.50% Cap) | | | 5.58 | % | | | 03/25/2035 | | | | 316,290 | |
10,350,000 | | HomeBanc Mortgage Trust, Series 2005-3-M5 (1 Month LIBOR USD + 1.85%, 1.85% Floor, 11.50% Cap) | | | 6.69 | % | | | 07/25/2035 | | | | 8,768,458 | |
13,161,000 | | Homeward Opportunities Fund Trust, Series 2020-1-B1 | | | 5.74 | % (a)(h) | | | 11/25/2059 | | | | 12,820,826 | |
13,276,000 | | Homeward Opportunities Fund Trust, Series 2020-1-B2 | | | 5.89 | % (a)(h) | | | 11/25/2059 | | | | 12,843,743 | |
28,994,000 | | Homeward Opportunities Fund Trust, Series 2020-2-B2 | | | 5.49 | % (a)(h) | | | 05/25/2065 | | | | 25,968,175 | |
23,886,853 | | Homeward Opportunities Fund Trust, Series 2020-BPL1-A1 | | | 3.23 | % (h)(k) | | | 08/25/2025 | | | | 23,823,830 | |
18,928,073 | | HSI Asset Loan Obligation Trust, Series 2007-2-3A6 | | | 6.00 | % | | | 09/25/2037 | | | | 6,889,305 | |
13,943,577 | | HSI Asset Loan Obligation Trust, Series 2007-WF1-A3 | | | 4.49 | % | | | 12/25/2036 | | | | 4,746,989 | |
28,356,772 | | HSI Asset Securitization Corporation Trust, Series 2006-HE1-1A1 (1 Month LIBOR USD + 0.28%, 0.28% Floor) | | | 5.13 | % | | | 10/25/2036 | | | | 9,432,730 | |
14,210,545 | | HSI Asset Securitization Corporation Trust, Series 2007-NC1-A2 (1 Month LIBOR USD + 0.14%, 0.14% Floor) | | | 4.99 | % | | | 04/25/2037 | | | | 9,728,920 | |
61,607,268 | | HSI Asset Securitization Corporation Trust, Series 2007-NC1-A3 (1 Month LIBOR USD + 0.18%, 0.18% Floor) | | | 5.03 | % | | | 04/25/2037 | | | | 42,335,208 | |
234,861 | | Impac CMB Trust, Series 2002-9F-A1 | | | 5.22 | % | | | 12/25/2032 | | | | 228,963 | |
10,315,595 | | Impac Secured Assets Trust, Series 2007-3-A1B (1 Month LIBOR USD + 0.48%, 0.48% Floor, 11.50% Cap) | | | 5.33 | % | | | 09/25/2037 | | | | 8,227,000 | |
27,076,571 | | Imperial Fund Mortgage Trust, Series 2021-NQM4-A1 | | | 2.09 | % (a)(h) | | | 01/25/2057 | | | | 22,901,020 | |
14,000,392 | | Imperial Fund Mortgage Trust, Series 2021-NQM4-A2 | | | 2.30 | % (a)(h) | | | 01/25/2057 | | | | 11,582,232 | |
10,669,974 | | Imperial Fund Mortgage Trust, Series 2021-NQM4-A3 | | | 2.45 | % (a)(h) | | | 01/25/2057 | | | | 8,762,876 | |
3,202,295 | | IndyMac IMJA Mortgage Loan Trust, Series 2007-A1-A1 | | | 6.00 | % | | | 08/25/2037 | | | | 1,367,717 | |
2,344,330 | | IndyMac IMJA Mortgage Loan Trust, Series 2007-A1-A7 | | | 6.00 | % | | | 08/25/2037 | | | | 1,001,276 | |
7,339,746 | | IndyMac IMJA Mortgage Loan Trust, Series 2007-A2-1A1 | | | 6.00 | % | | | 10/25/2037 | | | | 3,786,694 | |
11,143,892 | | IndyMac IMJA Mortgage Loan Trust, Series 2007-A2-2A3 | | | 6.50 | % | | | 10/25/2037 | | | | 6,266,355 | |
18,077,843 | | IndyMac IMJA Mortgage Loan Trust, Series 2007-A2-3A1 | | | 7.00 | % | | | 10/25/2037 | | | | 5,723,418 | |
15,418,841 | | IndyMac IMJA Mortgage Loan Trust, Series 2007-A3-A1 | | | 6.25 | % | | | 11/25/2037 | | | | 7,344,468 | |
12,629,253 | | IndyMac IMJA Mortgage Loan Trust, Series 2007-A4-A1 | | | 6.25 | % | | | 02/25/2038 | | | | 4,370,982 | |
29,130,254 | | IndyMac IMSC Mortgage Loan Trust, Series 2007-F1-2A1 | | | 6.50 | % | | | 06/25/2037 | | | | 8,257,853 | |
255,044 | | IndyMac IMSC Mortgage Loan Trust, Series 2007-F2-1A2 | | | 6.00 | % | | | 07/25/2037 | | | | 189,292 | |
25,175,498 | | IndyMac IMSC Mortgage Loan Trust, Series 2007-F2-2A1 | | | 6.50 | % | | | 07/25/2037 | | | | 8,387,245 | |
2,965,453 | | IndyMac IMSC Mortgage Loan Trust, Series 2007-HOA1-A11 (1 Month LIBOR USD + 0.36%, 0.36% Floor) | | | 5.21 | % | | | 07/25/2047 | | | | 1,994,093 | |
792,948 | | IndyMac INDA Mortgage Loan Trust, Series 2006-AR2-1A1 | | | 3.58 | % (a) | | | 09/25/2036 | | | | 525,783 | |
891,708 | | IndyMac INDA Mortgage Loan Trust, Series 2006-AR2-4A1 | | | 3.55 | % (a) | | | 09/25/2036 | | | | 745,456 | |
8,156,585 | | IndyMac INDA Mortgage Loan Trust, Series 2006-AR3-1A1 | | | 3.67 | % (a) | | | 12/25/2036 | | | | 6,745,157 | |
3,136,350 | | IndyMac INDA Mortgage Loan Trust, Series 2007-AR1-3A1 | | | 2.83 | % (a) | | | 03/25/2037 | | | | 2,588,875 | |
2,331,255 | | IndyMac INDA Mortgage Loan Trust, Series 2007-AR3-3A1 | | | 3.09 | % (a) | | | 07/25/2037 | | | | 1,999,732 | |
5,767,653 | | IndyMac INDX Mortgage Loan Trust, Series 2005-AR15-A1 | | | 3.50 | % (a) | | | 09/25/2035 | | | | 4,652,628 | |
2,282,387 | | IndyMac INDX Mortgage Loan Trust, Series 2006-AR7-3A1 | | | 3.34 | % (a) | | | 05/25/2036 | | | | 1,834,431 | |
1,926,719 | | IndyMac INDX Mortgage Loan Trust, Series 2007-AR13-2A1 | | | 3.48 | % (a) | | | 07/25/2037 | | | | 1,506,574 | |
4,922,421 | | IndyMac INDX Mortgage Loan Trust, Series 2007-AR21-8A1 | | | 3.68 | % (a) | | | 09/25/2037 | | | | 4,554,828 | |
5,151,743 | | JP Morgan Alternative Loan Trust, Series 2005-S1-2A11 | | | 6.00 | % | | | 12/25/2035 | | | | 3,582,651 | |
1,651,539 | | JP Morgan Alternative Loan Trust, Series 2005-S1-2A9 | | | 6.00 | % | | | 12/25/2035 | | | | 1,148,522 | |
3,407,664 | | JP Morgan Alternative Loan Trust, Series 2006-A2-1A1 (1 Month LIBOR USD + 0.36%, 0.36% Floor, 11.50% Cap) | | | 5.21 | % | | | 05/25/2036 | | | | 2,752,552 | |
2,208,752 | | JP Morgan Alternative Loan Trust, Series 2006-S1-1A8 | | | 5.75 | % | | | 03/25/2036 | | | | 1,242,809 | |
2,901,031 | | JP Morgan Alternative Loan Trust, Series 2006-S2-A4 | | | 6.69 | % | | | 05/25/2036 | | | | 2,872,802 | |
6,710,386 | | JP Morgan Alternative Loan Trust, Series 2006-S4-A4 | | | 6.46 | % | | | 12/25/2036 | | | | 6,439,754 | |
2,179,200 | | JP Morgan Mortgage Acquisition Corporation, Series 2005-WMC1-M4 (1 Month LIBOR USD + 0.90%, 0.90% Floor) | | | 5.75 | % | | | 09/25/2035 | | | | 1,843,543 | |
5,854,090 | | JP Morgan Mortgage Acquisition Trust, Series 2006-CH2-AF3 | | | 5.46 | % (k) | | | 09/25/2029 | | | | 3,639,807 | |
10,670,937 | | JP Morgan Mortgage Acquisition Trust, Series 2006-HE3-A1 (1 Month LIBOR USD + 0.28%, 0.28% Floor) | | | 4.52 | % | | | 11/25/2036 | | | | 9,419,554 | |
22,843,292 | | JP Morgan Mortgage Acquisition Trust, Series 2006-RM1-A3 (1 Month LIBOR USD + 0.24%, 0.24% Floor) | | | 5.09 | % | | | 08/25/2036 | | | | 10,260,033 | |
21,112,788 | | JP Morgan Mortgage Acquisition Trust, Series 2006-RM1-A4 (1 Month LIBOR USD + 0.36%, 0.36% Floor) | | | 5.21 | % | | | 08/25/2036 | | | | 9,543,438 | |
2,999,372 | | JP Morgan Mortgage Acquisition Trust, Series 2006-WF1-A5 | | | 6.91 | % | | | 07/25/2036 | | | | 872,565 | |
4,385,039 | | JP Morgan Mortgage Acquisition Trust, Series 2006-WMC4-A1A (1 Month LIBOR USD + 0.13%, 0.13% Floor) | | | 4.98 | % | | | 12/25/2036 | | | | 2,578,441 | |
35,550,679 | | JP Morgan Mortgage Acquisition Trust, Series 2006-WMC4-A1B (1 Month LIBOR USD + 0.23%, 0.23% Floor) | | | 5.08 | % | | | 12/25/2036 | | | | 2,805,908 | |
15,565,867 | | JP Morgan Mortgage Acquisition Trust, Series 2007-CH1-AF5 | | | 4.60 | % | | | 11/25/2036 | | | | 15,188,994 | |
9,690,000 | | JP Morgan Mortgage Acquisition Trust, Series 2007-CH3-M2 (1 Month LIBOR USD + 0.32%, 0.32% Floor) | | | 5.17 | % | | | 03/25/2037 | | | | 7,905,413 | |
130,149 | | JP Morgan Mortgage Trust, Series 2005-A6-5A1 | | | 3.96 | % (a) | | | 08/25/2035 | | | | 127,803 | |
3,674,251 | | JP Morgan Mortgage Trust, Series 2005-S1-1A2 | | | 6.50 | % | | | 01/25/2035 | | | | 3,713,086 | |
375,196 | | JP Morgan Mortgage Trust, Series 2005-S2-2A13 | | | 5.50 | % | | | 09/25/2035 | | | | 308,030 | |
1,051,629 | | JP Morgan Mortgage Trust, Series 2006-S2-3A3 | | | 6.00 | % | | | 07/25/2036 | | | | 458,184 | |
3,397,507 | | JP Morgan Mortgage Trust, Series 2006-S2-3A5 | | | 6.25 | % | | | 07/25/2036 | | | | 1,619,360 | |
1,786,086 | | JP Morgan Mortgage Trust, Series 2006-S3-1A2 | | | 6.00 | % | | | 08/25/2036 | | | | 776,669 | |
7,423,570 | | JP Morgan Mortgage Trust, Series 2006-S3-1A21 (1 Month LIBOR USD + 0.38%, 0.38% Floor, 7.50% Cap) | | | 5.23 | % | | | 08/25/2036 | | | | 1,101,689 | |
7,423,570 | | JP Morgan Mortgage Trust, Series 2006-S3-1A22 (-1 x 1 Month LIBOR USD + 7.12%, 7.12% Cap) | | | 2.27 | % (c)(d) | | | 08/25/2036 | | | | 1,376,788 | |
832,270 | | JP Morgan Mortgage Trust, Series 2006-S3-1A9 | | | 6.00 | % | | | 08/25/2036 | | | | 361,908 | |
5,697,542 | | JP Morgan Mortgage Trust, Series 2006-S4-A3 | | | 6.00 | % | | | 01/25/2037 | | | | 2,469,903 | |
2,372,738 | | JP Morgan Mortgage Trust, Series 2006-S4-A5 | | | 6.00 | % | | | 01/25/2037 | | | | 1,034,158 | |
5,560,342 | | JP Morgan Mortgage Trust, Series 2006-S4-A8 (1 Month LIBOR USD + 0.38%, 0.38% Floor, 7.00% Cap) | | | 5.23 | % | | | 01/25/2037 | | | | 1,698,204 | |
5,560,342 | | JP Morgan Mortgage Trust, Series 2006-S4-A9 (-1 x 1 Month LIBOR USD + 6.62%, 6.62% Cap) | | | 1.77 | % (c)(d) | | | 01/25/2037 | | | | 1,073,109 | |
647,431 | | JP Morgan Mortgage Trust, Series 2007-A2-2A1 | | | 4.15 | % (a) | | | 04/25/2037 | | | | 472,488 | |
2,552,330 | | JP Morgan Mortgage Trust, Series 2007-A3-3A2M | | | 3.63 | % (a) | | | 05/25/2037 | | | | 2,243,583 | |
6,178,560 | | JP Morgan Mortgage Trust, Series 2007-S1-2A6 | | | 6.00 | % | | | 03/25/2037 | | | | 2,801,427 | |
1,731,490 | | JP Morgan Mortgage Trust, Series 2007-S3-1A1 | | | 5.50 | % | | | 08/25/2037 | | | | 878,412 | |
4,003,785 | | JP Morgan Mortgage Trust, Series 2007-S3-1A35 | | | 6.00 | % | | | 08/25/2037 | | | | 2,236,185 | |
1,704,150 | | JP Morgan Mortgage Trust, Series 2007-S3-1A64 | | | 7.50 | % | | | 08/25/2037 | | | | 687,439 | |
673,837 | | JP Morgan Mortgage Trust, Series 2007-S3-1A9 | | | 6.00 | % | | | 08/25/2037 | | | | 371,214 | |
3,691,681 | | JP Morgan Mortgage Trust, Series 2007-S3-1A96 | | | 6.00 | % | | | 08/25/2037 | | | | 2,034,054 | |
4,208,183 | | JP Morgan Mortgage Trust, Series 2007-S3-1A97 | | | 6.00 | % | | | 08/25/2037 | | | | 2,318,685 | |
5,006,849 | | JP Morgan Resecuritization Trust, Series 2009-4-3A2 | | | 6.00 | % (a)(h) | | | 02/26/2037 | | | | 2,598,490 | |
16,378,412 | | JP Morgan Resecuritization Trust, Series 2009-7-7A1 | | | 7.00 | % (a)(h) | | | 09/27/2037 | | | | 7,418,009 | |
8,090,704 | | JP Morgan Resecuritization Trust, Series 2010-1-1A4 | | | 6.00 | % (h) | | | 02/26/2037 | | | | 4,017,838 | |
5,115,515 | | JP Morgan Resecuritization Trust, Series 2010-1-2A11 | | | 7.00 | % (a)(h) | | | 01/26/2037 | | | | 2,477,565 | |
124,515,191 | | Legacy Mortgage Asset Trust, Series 2019-RPL3-PT1 | | | 0.00 | % (h) | | | 06/25/2058 | | | | 109,937,687 | |
26,865,978 | | Legacy Mortgage Asset Trust, Series 2020-GS1-A2 | | | 7.00 | % (e)(h)(k) | | | 10/25/2059 | | | | 22,645,408 | |
26,264,000 | | Legacy Mortgage Asset Trust, Series 2020-GS2-A2 | | | 7.00 | % (h)(k) | | | 03/25/2060 | | | | 24,021,054 | |
24,000,000 | | Legacy Mortgage Asset Trust, Series 2021-GS4-A2 | | | 3.55 | % (h)(k) | | | 11/25/2060 | | | | 21,215,616 | |
4,885,069 | | Lehman Mortgage Trust, Series 2005-2-2A3B | | | 5.94 | % | | | 08/25/2035 | | | | 4,383,543 | |
1,636,527 | | Lehman Mortgage Trust, Series 2005-2-3A5 | | | 5.50 | % | | | 12/25/2035 | | | | 927,750 | |
1,006,836 | | Lehman Mortgage Trust, Series 2005-2-5A5 | | | 5.75 | % | | | 12/25/2035 | | | | 718,753 | |
1,853,929 | | Lehman Mortgage Trust, Series 2005-3-2A1 | | | 6.00 | % | | | 01/25/2036 | | | | 1,575,178 | |
157,721 | | Lehman Mortgage Trust, Series 2005-3-2A3 | | | 5.50 | % | | | 01/25/2036 | | | | 128,039 | |
847,305 | | Lehman Mortgage Trust, Series 2005-3-2A7 | | | 6.00 | % | | | 01/25/2036 | | | | 719,843 | |
819,130 | | Lehman Mortgage Trust, Series 2005-4-2A3A | | | 5.50 | % | | | 10/25/2035 | | | | 878,690 | |
7,252,178 | | Lehman Mortgage Trust, Series 2005-9N-2A1 (12 Month US Treasury Average + 1.06%, 1.06% Floor) | | | 4.20 | % | | | 02/25/2036 | | | | 6,082,591 | |
946,481 | | Lehman Mortgage Trust, Series 2006-1-1A1 (1 Month LIBOR USD + 0.75%, 0.75% Floor, 5.50% Cap) | | | 5.50 | % | | | 02/25/2036 | | | | 398,609 | |
2,839,442 | | Lehman Mortgage Trust, Series 2006-1-1A2 (-1 x 1 Month LIBOR USD + 4.75%, 4.75% Cap) | | | 0.00 | % (c)(d) | | | 02/25/2036 | | | | 233,607 | |
1,986,125 | | Lehman Mortgage Trust, Series 2006-1-3A1 (1 Month LIBOR USD + 0.75%, 0.75% Floor, 5.50% Cap) | | | 5.50 | % | | | 02/25/2036 | | | | 1,407,242 | |
1,986,125 | | Lehman Mortgage Trust, Series 2006-1-3A2 (-1 x 1 Month LIBOR USD + 4.75%, 4.75% Cap) | | | 0.00 | % (b)(c)(d) | | | 02/25/2036 | | | | 81,143 | |
1,279,644 | | Lehman Mortgage Trust, Series 2006-1-3A4 | | | 5.50 | % | | | 02/25/2036 | | | | 954,984 | |
48,739 | | Lehman Mortgage Trust, Series 2006-17-1A2 (1 Month LIBOR USD + 0.34%, 0.34% Floor) | | | 5.19 | % | | | 08/25/2046 | | | | 139,635 | |
6,123,238 | | Lehman Mortgage Trust, Series 2006-3-A3 (1 Month LIBOR USD + 0.60%, 0.60% Floor) | | | 5.45 | % | | | 03/25/2036 | | | | 5,807,160 | |
1,533,705 | | Lehman Mortgage Trust, Series 2006-4-1A3 (-1 x 1 Month LIBOR USD + 5.40%, 5.40% Cap) | | | 0.55 | % (c)(d) | | | 08/25/2036 | | | | 114,776 | |
974,789 | | Lehman Mortgage Trust, Series 2006-4-1A4 | | | 6.00 | % | | | 08/25/2036 | | | | 795,602 | |
6,819,378 | | Lehman Mortgage Trust, Series 2006-5-1A1A (1 Month LIBOR USD + 0.42%, 0.42% Floor) | | | 5.27 | % | | | 04/25/2036 | | | | 5,768,244 | |
5,458,845 | | Lehman Mortgage Trust, Series 2006-5-2A1 (1 Month LIBOR USD + 0.35%, 0.35% Floor, 7.50% Cap) | | | 5.20 | % | | | 09/25/2036 | | | | 791,476 | |
11,370,715 | | Lehman Mortgage Trust, Series 2006-5-2A2 (-1 x 1 Month LIBOR USD + 7.15%, 7.15% Cap) | | | 2.30 | % (c)(d) | | | 09/25/2036 | | | | 1,509,573 | |
38,953 | | Lehman Mortgage Trust, Series 2006-5-2A4A | | | 6.39 | % | | | 04/25/2036 | | | | 51,489 | |
6,019,087 | | Lehman Mortgage Trust, Series 2006-6-3A9 | | | 5.50 | % | | | 10/25/2036 | | | | 4,234,034 | |
266,241 | | Lehman Mortgage Trust, Series 2006-6-4A5 | | | 6.00 | % | | | 12/25/2036 | | | | 257,594 | |
2,779,036 | | Lehman Mortgage Trust, Series 2006-7-2A2 (1 Month LIBOR USD + 0.45%, 0.45% Floor, 7.00% Cap) | | | 5.30 | % | | | 11/25/2036 | | | | 675,226 | |
10,312,889 | | Lehman Mortgage Trust, Series 2006-7-2A5 (-1 x 1 Month LIBOR USD + 6.55%, 6.55% Cap) | | | 1.70 | % (c)(d) | | | 11/25/2036 | | | | 1,267,837 | |
1,704,888 | | Lehman Mortgage Trust, Series 2006-9-1A19 (-5 x 1 Month LIBOR USD + 30.68%, 30.68% Cap) | | | 8.39 | % (d) | | | 01/25/2037 | | | | 1,765,840 | |
1,852,655 | | Lehman Mortgage Trust, Series 2006-9-1A5 (1 Month LIBOR USD + 0.60%, 0.60% Floor, 5.75% Cap) | | | 5.45 | % | | | 01/25/2037 | | | | 995,102 | |
5,538,572 | | Lehman Mortgage Trust, Series 2006-9-1A6 (-1 x 1 Month LIBOR USD + 5.15%, 5.15% Cap) | | | 0.30 | % (c)(d) | | | 01/25/2037 | | | | 381,519 | |
3,435,300 | | Lehman Mortgage Trust, Series 2006-9-2A1 (1 Month LIBOR USD + 0.38%, 0.38% Floor, 7.00% Cap) | | | 5.23 | % | | | 01/25/2037 | | | | 716,337 | |
6,193,594 | | Lehman Mortgage Trust, Series 2006-9-2A2 (-1 x 1 Month LIBOR USD + 6.62%, 6.62% Cap) | | | 1.77 | % (c)(d) | | | 01/25/2037 | | | | 694,590 | |
8,244,448 | | Lehman Mortgage Trust, Series 2006-GP3-1A1 (1 Month LIBOR USD + 0.40%, 0.40% Floor) | | | 5.25 | % | | | 06/25/2046 | | | | 7,322,030 | |
5,822,291 | | Lehman Mortgage Trust, Series 2007-10-2A1 | | | 6.50 | % | | | 01/25/2038 | | | | 1,789,688 | |
19,847,920 | | Lehman Mortgage Trust, Series 2007-1-1A1 (1 Month LIBOR USD + 0.21%, 0.21% Floor) | | | 5.06 | % (h) | | | 06/25/2037 | | | | 14,471,063 | |
5,480,881 | | Lehman Mortgage Trust, Series 2007-1-2A1 | | | 7.00 | % (a) | | | 02/25/2037 | | | | 5,376,955 | |
5,822,490 | | Lehman Mortgage Trust, Series 2007-1-2A4 (1 Month LIBOR USD + 0.30%, 0.30% Floor) | | | 5.15 | % (h) | | | 06/25/2037 | | | | 4,126,944 | |
10,101,479 | | Lehman Mortgage Trust, Series 2007-12N-1A3A (1 Month LIBOR USD + 0.40%, 0.40% Floor) | | | 5.25 | % | | | 07/25/2047 | | | | 9,441,130 | |
10,396,304 | | Lehman Mortgage Trust, Series 2007-15N-4A1 (1 Month LIBOR USD + 0.90%, 0.90% Floor) | | | 5.75 | % | | | 08/25/2047 | | | | 8,372,978 | |
1,438,371 | | Lehman Mortgage Trust, Series 2007-2-1A1 | | | 5.75 | % | | | 02/25/2037 | | | | 1,014,747 | |
2,484,840 | | Lehman Mortgage Trust, Series 2007-4-2A11 (1 Month LIBOR USD + 0.33%, 0.33% Floor, 7.00% Cap) | | | 5.18 | % | | | 05/25/2037 | | | | 694,952 | |
10,906,759 | | Lehman Mortgage Trust, Series 2007-4-2A8 (-1 x 1 Month LIBOR USD + 6.67%, 6.67% Cap) | | | 1.82 | % (c)(d) | | | 05/25/2037 | | | | 1,382,476 | |
743,640 | | Lehman Mortgage Trust, Series 2007-4-2A9 (1 Month LIBOR USD + 0.33%, 0.33% Floor, 7.00% Cap) | | | 5.18 | % | | | 05/25/2037 | | | | 161,003 | |
6,532,250 | | Lehman Mortgage Trust, Series 2007-5-11A1 | | | 4.60 | % (a) | | | 06/25/2037 | | | | 4,075,361 | |
684,585 | | Lehman Mortgage Trust, Series 2007-5-4A3 (-6 x 1 Month LIBOR USD + 40.08%, 40.08% Cap) | | | 11.01 | % (d) | | | 08/25/2036 | | | | 904,347 | |
629,747 | | Lehman Mortgage Trust, Series 2007-5-7A3 | | | 7.50 | % | | | 10/25/2036 | | | | 276,068 | |
96,740 | | Lehman Mortgage Trust, Series 2007-6-1A8 | | | 6.00 | % | | | 07/25/2037 | | | | 79,461 | |
5,546,451 | | Lehman Mortgage Trust, Series 2007-9-2A2 | | | 6.50 | % | | | 10/25/2037 | | | | 1,831,197 | |
3,268,147 | | Lehman Mortgage Trust, Series 2008-2-1A6 | | | 6.00 | % | | | 03/25/2038 | | | | 1,155,041 | |
9,300,000 | | LHOME Mortgage Trust, Series 2021-RTL1-A2 | | | 2.86 | % (a)(h) | | | 02/25/2026 | | | | 8,554,738 | |
92,000,000 | | LHOME Mortgage Trust, Series 2021-RTL2-A1 | | | 2.09 | % (h)(k) | | | 06/25/2026 | | | | 88,613,038 | |
13,639,646 | | Long Beach Mortgage Loan Trust, Series 2006-2-2A4 (1 Month LIBOR USD + 0.58%, 0.58% Floor) | | | 5.43 | % | | | 03/25/2046 | | | | 5,014,227 | |
48,331,701 | | Long Beach Mortgage Loan Trust, Series 2006-3-2A3 (1 Month LIBOR USD + 0.36%, 0.36% Floor) | | | 5.21 | % | | | 05/25/2046 | | | | 16,026,739 | |
4,926,857 | | Long Beach Mortgage Loan Trust, Series 2006-3-2A4 (1 Month LIBOR USD + 0.54%, 0.54% Floor) | | | 5.39 | % | | | 05/25/2046 | | | | 1,637,551 | |
15,470,046 | | Long Beach Mortgage Loan Trust, Series 2006-5-2A4 (1 Month LIBOR USD + 0.48%, 0.48% Floor) | | | 5.33 | % | | | 06/25/2036 | | | | 7,455,905 | |
26,651,142 | | Long Beach Mortgage Loan Trust, Series 2006-6-1A (1 Month LIBOR USD + 0.29%, 0.29% Floor) | | | 5.14 | % | | | 07/25/2036 | | | | 19,257,614 | |
11,639,107 | | Long Beach Mortgage Loan Trust, Series 2006-WL1-M2 (1 Month LIBOR USD + 0.68%, 0.68% Floor) | | | 5.52 | % | | | 01/25/2046 | | | | 10,091,059 | |
2,669,816 | | Luminent Mortgage Trust, Series 2005-1-A1 (1 Month LIBOR USD + 0.52%, 0.52% Floor, 11.50% Cap) | | | 5.37 | % | | | 11/25/2035 | | | | 2,509,370 | |
2,377,018 | | MASTR Adjustable Rate Mortgages Trust, Series 2005-2-2A1 | | | 3.38 | % (a) | | | 03/25/2035 | | | | 2,060,656 | |
754,880 | | MASTR Adjustable Rate Mortgages Trust, Series 2005-6-5A1 | | | 2.87 | % (a) | | | 07/25/2035 | | | | 636,746 | |
5,085,951 | | MASTR Adjustable Rate Mortgages Trust, Series 2007-1-2A1 | | | 3.76 | % (a) | | | 11/25/2036 | | | | 2,891,880 | |
6,651,000 | | MASTR Alternative Loans Trust, Series 2004-9-M2 | | | 6.26 | % | | | 08/25/2034 | | | | 5,269,945 | |
1,111,612 | | MASTR Alternative Loans Trust, Series 2005-2-3A1 | | | 6.00 | % | | | 03/25/2035 | | | | 989,196 | |
62,885 | | MASTR Alternative Loans Trust, Series 2005-5-2A3 | | | 5.50 | % | | | 07/25/2025 | | | | 59,615 | |
6,678,809 | | MASTR Alternative Loans Trust, Series 2005-5-3A1 | | | 5.75 | % | | | 08/25/2035 | | | | 3,599,930 | |
1,563,758 | | MASTR Alternative Loans Trust, Series 2005-6-1A5 | | | 5.50 | % | | | 12/25/2035 | | | | 1,126,015 | |
1,290,887 | | MASTR Alternative Loans Trust, Series 2006-3-1A2 | | | 6.25 | % | | | 07/25/2036 | | | | 769,112 | |
773,789 | | MASTR Alternative Loans Trust, Series 2007-1-1A5 | | | 5.75 | % | | | 10/25/2036 | | | | 720,183 | |
3,703,707 | | MASTR Alternative Loans Trust, Series 2007-1-2A7 | | | 6.00 | % | | | 10/25/2036 | | | | 1,170,864 | |
2,338,446 | | MASTR Asset Backed Securities Trust, Series 2003-OPT1-M3 (1 Month LIBOR USD + 4.13%, 4.13% Floor) | | | 8.97 | % | | | 12/25/2032 | | | | 2,164,797 | |
6,669,932 | | MASTR Asset Backed Securities Trust, Series 2006-AM2-A3 (1 Month LIBOR USD + 0.34%, 0.34% Floor) | | | 5.19 | % | | | 06/25/2036 | | | | 5,812,013 | |
10,345,672 | | MASTR Asset Backed Securities Trust, Series 2007-HE1-A3 (1 Month LIBOR USD + 0.21%, 0.21% Floor) | | | 5.06 | % | | | 05/25/2037 | | | | 9,743,934 | |
13,467,157 | | MASTR Asset Backed Securities Trust, Series 2007-WMC1-A1 (1 Month LIBOR USD + 0.15%, 0.15% Floor) | | | 4.99 | % | | | 01/25/2037 | | | | 3,931,120 | |
1,660,394 | | MASTR Asset Securitization Trust, Series 2006-1-1A4 | | | 5.75 | % | | | 05/25/2036 | | | | 1,152,913 | |
1,101,042 | | MASTR Asset Securitization Trust, Series 2006-2-1A11 (1 Month LIBOR USD + 6.00%, 6.00% Floor) | | | 6.00 | % | | | 06/25/2036 | | | | 733,589 | |
2,634,287 | | MASTR Asset Securitization Trust, Series 2007-1-1A3 | | | 6.25 | % | | | 11/25/2037 | | | | 1,198,144 | |
13,584,301 | | MASTR Resecuritization Trust, Series 2008-1-A1 | | | 6.00 | % (a)(b)(h) | | | 09/27/2037 | | | | 9,652,897 | |
7,064,518 | | MASTR Resecuritization Trust, Series 2008-4-A1 | | | 6.00 | % (a)(h) | | | 06/27/2036 | | | | 5,711,112 | |
1,228,459 | | MASTR Seasoned Securitization Trust, Series 2005-2-1A4 | | | 6.00 | % | | | 10/25/2032 | | | | 1,204,397 | |
481,891 | | MASTR Seasoned Securitization Trust, Series 2005-2-2A1 (1 Month LIBOR USD + 0.40%, 0.40% Floor, 7.50% Cap) | | | 5.25 | % | | | 10/25/2032 | | | | 451,221 | |
20,511,980 | | Merrill Lynch Alternative Note Asset Trust, Series 2007-A3-A2A (1 Month LIBOR USD + 0.22%, 0.22% Floor) | | | 5.07 | % | | | 04/25/2037 | | | | 8,188,553 | |
10,518,934 | | Merrill Lynch Alternative Note Asset Trust, Series 2007-A3-A2B (1 Month LIBOR USD + 0.42%, 0.42% Floor) | | | 5.27 | % | | | 04/25/2037 | | | | 4,280,258 | |
14,579,367 | | Merrill Lynch Alternative Note Asset Trust, Series 2007-A3-A2C (1 Month LIBOR USD + 0.64%, 0.64% Floor) | | | 5.49 | % | | | 04/25/2037 | | | | 6,019,657 | |
13,022,682 | | Merrill Lynch Alternative Note Asset Trust, Series 2007-F1-2A4 (1 Month LIBOR USD + 0.32%, 0.32% Floor, 7.00% Cap) | | | 5.17 | % | | | 03/25/2037 | | | | 3,445,153 | |
13,022,682 | | Merrill Lynch Alternative Note Asset Trust, Series 2007-F1-2A5 (-1 x 1 Month LIBOR USD + 6.68%, 6.68% Cap) | | | 1.83 | % (c)(d) | | | 03/25/2037 | | | | 2,155,984 | |
29,074,952 | | Merrill Lynch Alternative Note Asset Trust, Series 2007-OAR5-1A1 | | | 2.91 | % (a) | | | 10/25/2047 | | | | 9,219,568 | |
2,380,568 | | Merrill Lynch First Franklin Mortgage Loan Trust, Series 2007-H1-1A2 (1 Month LIBOR USD + 3.50%, 3.50% Floor) | | | 8.35 | % | | | 10/25/2037 | | | | 2,156,981 | |
18,380,197 | | Merrill Lynch Mortgage Investors Trust, Series 2005-AR1-M2 (1 Month LIBOR USD + 1.01%, 1.01% Floor) | | | 5.85 | % | | | 06/25/2036 | | | | 15,613,108 | |
572,225 | | Merrill Lynch Mortgage Investors Trust, Series 2006-3-1A | | | 4.14 | % (a) | | | 10/25/2036 | | | | 543,029 | |
8,087,998 | | Merrill Lynch Mortgage Investors Trust, Series 2006-AR1-A2C (1 Month LIBOR USD + 0.32%, 0.32% Floor) | | | 5.17 | % (h) | | | 03/25/2037 | | | | 2,552,343 | |
771,969 | | Merrill Lynch Mortgage Investors Trust, Series 2006-F1-1A2 | | | 6.00 | % | | | 04/25/2036 | | | | 391,718 | |
23,341,348 | | Merrill Lynch Mortgage Investors Trust, Series 2006-FM1-A1 (1 Month LIBOR USD + 0.30%, 0.30% Floor) | | | 4.32 | % | | | 04/25/2037 | | | | 14,618,962 | |
10,576,139 | | Merrill Lynch Mortgage Investors Trust, Series 2006-HE3-A4 (1 Month LIBOR USD + 0.50%, 0.50% Floor) | | | 5.35 | % | | | 06/25/2037 | | | | 2,881,757 | |
7,618,656 | | Merrill Lynch Mortgage Investors Trust, Series 2006-HE4-A2B (1 Month LIBOR USD + 0.20%, 0.20% Floor) | | | 5.05 | % | | | 07/25/2037 | | | | 1,775,792 | |
79,803,061 | | Merrill Lynch Mortgage Investors Trust, Series 2007-HE2-A1 (1 Month LIBOR USD + 0.50%, 0.50% Floor) | | | 5.35 | % | | | 02/25/2037 | | | | 39,159,410 | |
8,712,454 | | Merrill Lynch Mortgage Investors Trust, Series 2007-HE3-A1 (1 Month LIBOR USD + 0.14%, 0.14% Floor) | | | 4.99 | % | | | 04/25/2047 | | | | 3,681,081 | |
7,433,049 | | Merrill Lynch Mortgage Investors Trust, Series 2007-HE3-A3 (1 Month LIBOR USD + 0.38%, 0.38% Floor) | | | 5.23 | % | | | 04/25/2047 | | | | 3,140,412 | |
3,113,402 | | Merrill Lynch Mortgage Investors Trust, Series 2007-HE3-A4 (1 Month LIBOR USD + 0.54%, 0.54% Floor) | | | 5.39 | % | | | 04/25/2047 | | | | 1,315,391 | |
53,227,139 | | Merrill Lynch Mortgage Investors Trust, Series 2007-MLN1-A1 (1 Month LIBOR USD + 0.25%, 0.25% Floor) | | | 5.10 | % | | | 03/25/2037 | | | | 42,797,424 | |
21,510,750 | | MFA Trust, Series 2021-NPL1-A1 | | | 2.36 | % (h)(k) | | | 03/25/2060 | | | | 20,419,991 | |
17,042,240 | | Morgan Stanley Capital Trust, Series 2006-HE7-A2C (1 Month LIBOR USD + 0.32%, 0.32% Floor) | | | 5.17 | % | | | 09/25/2036 | | | | 7,570,359 | |
22,614,503 | | Morgan Stanley Capital Trust, Series 2006-HE7-A2D (1 Month LIBOR USD + 0.46%, 0.46% Floor) | | | 5.31 | % | | | 09/25/2036 | | | | 10,087,258 | |
13,128,684 | | Morgan Stanley Capital Trust, Series 2006-NC2-M1 (1 Month LIBOR USD + 0.54%, 0.54% Floor) | | | 5.39 | % | | | 02/25/2036 | | | | 11,280,026 | |
5,797,447 | | Morgan Stanley Capital Trust, Series 2007-HE4-A1 (1 Month LIBOR USD + 0.13%, 0.13% Floor) | | | 4.98 | % (h) | | | 02/25/2037 | | | | 2,571,396 | |
25,942,820 | | Morgan Stanley Home Equity Loan Trust, Series 2007-1-A4 (1 Month LIBOR USD + 0.22%, 0.22% Floor) | | | 5.07 | % | | | 12/25/2036 | | | | 12,927,639 | |
5,160,667 | | Morgan Stanley IXIS Real Estate Capital Trust, Series 2006-2-AFPT (1 Month LIBOR USD + 0.07%, 0.07% Floor) | | | 4.92 | % | | | 11/25/2036 | | | | 1,708,643 | |
675,958 | | Morgan Stanley Mortgage Loan Trust, Series 2005-10-1A1 (1 Month LIBOR USD + 0.70%, 0.70% Floor, 5.75% Cap) | | | 5.55 | % | | | 12/25/2035 | | | | 427,612 | |
1,693,587 | | Morgan Stanley Mortgage Loan Trust, Series 2005-10-1A6 | | | 5.75 | % | | | 12/25/2035 | | | | 1,229,190 | |
1,952,273 | | Morgan Stanley Mortgage Loan Trust, Series 2005-10-2A1 | | | 5.31 | % (a) | | | 12/25/2035 | | | | 1,795,910 | |
4,607,819 | | Morgan Stanley Mortgage Loan Trust, Series 2006-11-1A6 | | | 6.73 | % | | | 08/25/2036 | | | | 920,683 | |
6,813,880 | | Morgan Stanley Mortgage Loan Trust, Series 2006-11-2A1 | | | 6.00 | % | | | 08/25/2036 | | | | 3,225,386 | |
6,807,406 | | Morgan Stanley Mortgage Loan Trust, Series 2006-16AX-2A2 (1 Month LIBOR USD + 0.34%, 0.34% Floor) | | | 5.19 | % | | | 11/25/2036 | | | | 2,056,031 | |
5,311,551 | | Morgan Stanley Mortgage Loan Trust, Series 2006-17XS-A3A | | | 6.15 | % | | | 10/25/2046 | | | | 1,645,326 | |
1,819,675 | | Morgan Stanley Mortgage Loan Trust, Series 2006-17XS-A6 | | | 6.08 | % | | | 10/25/2046 | | | | 458,911 | |
1,784,183 | | Morgan Stanley Mortgage Loan Trust, Series 2006-2-2A3 | | | 5.75 | % | | | 02/25/2036 | | | | 1,618,089 | |
15,638,285 | | Morgan Stanley Mortgage Loan Trust, Series 2006-7-3A | | | 5.15 | % (a) | | | 06/25/2036 | | | | 10,480,663 | |
1,584,006 | | Morgan Stanley Mortgage Loan Trust, Series 2006-7-4A4 | | | 6.00 | % | | | 06/25/2036 | | | | 874,089 | |
1,603,533 | | Morgan Stanley Mortgage Loan Trust, Series 2006-7-4A7 | | | 6.00 | % | | | 06/25/2036 | | | | 884,863 | |
2,874,976 | | Morgan Stanley Mortgage Loan Trust, Series 2007-13-6A1 | | | 6.00 | % | | | 10/25/2037 | | | | 1,728,974 | |
3,649,065 | | Morgan Stanley Mortgage Loan Trust, Series 2007-14AR-2A3 | | | 3.41 | % (a) | | | 10/25/2037 | | | | 2,229,522 | |
2,942,702 | | Morgan Stanley Mortgage Loan Trust, Series 2007-1XS-2A3 | | | 6.42 | % | | | 09/25/2046 | | | | 713,471 | |
1,965,863 | | Morgan Stanley Mortgage Loan Trust, Series 2007-1XS-2A4A | | | 6.58 | % | | | 09/25/2046 | | | | 568,966 | |
311,484 | | Morgan Stanley Mortgage Loan Trust, Series 2007-3XS-1A2A | | | 6.12 | % | | | 01/25/2047 | | | | 293,222 | |
5,339,023 | | Morgan Stanley Mortgage Loan Trust, Series 2007-3XS-2A3S | | | 6.36 | % | | | 01/25/2047 | | | | 2,076,351 | |
3,122,825 | | Morgan Stanley Mortgage Loan Trust, Series 2007-3XS-2A4S | | | 6.46 | % | | | 01/25/2047 | | | | 1,214,196 | |
4,096,977 | | Morgan Stanley Re-Remic Trust, Series 2010-R5-4B | | | 3.22 | % (h)(k) | | | 06/26/2036 | | | | 3,567,392 | |
6,613,864 | | Morgan Stanley Re-Remic Trust, Series 2010-R5-5B | | | 2.85 | % (h)(k) | | | 01/26/2037 | | | | 5,666,095 | |
9,866,135 | | Morgan Stanley Re-Remic Trust, Series 2010-R9-3C | | | 6.00 | % (a)(h) | | | 11/26/2036 | | | | 7,470,994 | |
187,636 | | Morgan Stanley Re-Remic Trust, Series 2011-R1-1A | | | 5.94 | % (a)(h) | | | 02/26/2037 | | | | 187,270 | |
7,574,313 | | Morgan Stanley Re-Remic Trust, Series 2012-R4-1B (1 Month LIBOR USD) | | | 3.28 | % (h) | | | 08/26/2036 | | | | 6,440,027 | |
6,571,823 | | Morgan Stanley Re-Remic Trust, Series 2013-R2-1B | | | 3.37 | % (a)(b)(h) | | | 10/26/2036 | | | | 5,402,108 | |
2,461,099 | | Morgan Stanley Resecuritization Trust, Series 2014-R7-B1 | | | 3.95 | % (a)(h) | | | 01/26/2051 | | | | 2,419,475 | |
4,817,953 | | Morgan Stanley Resecuritization Trust, Series 2014-R7-B2 | | | 3.95 | % (a)(e)(h) | | | 01/26/2051 | | | | 4,443,598 | |
22,538,683 | | Morgan Stanley Residential Mortgage Loan Trust, Series 2020-RPL1-A1 | | | 2.69 | % (a)(h) | | | 10/25/2060 | | | | 22,010,135 | |
9,717,097 | | New Century Alternative Mortgage Loan Trust, Series 2006-ALT1-AF3 | | | 6.17 | % (a) | | | 07/25/2036 | | | | 2,286,964 | |
12,267,502 | | New Century Alternative Mortgage Loan Trust, Series 2006-ALT2-AF5 | | | 4.64 | % | | | 10/25/2036 | | | | 2,534,694 | |
17,829,000 | | New Century Home Equity Loan Trust, Series 2005-4-M5 (1 Month LIBOR USD + 1.02%, 1.02% Floor, 12.50% Cap) | | | 5.87 | % | | | 09/25/2035 | | | | 15,272,079 | |
12,500,000 | | New Century Home Equity Loan Trust, Series 2006-1-A2C (1 Month LIBOR USD + 0.56%, 0.56% Floor, 12.50% Cap) | | | 5.41 | % | | | 05/25/2036 | | | | 10,669,441 | |
62,504,400 | | New Residential Mortgage Loan Trust, Series 2020-RPL1-M1 | | | 3.25 | % (a)(h) | | | 11/25/2059 | | | | 53,067,836 | |
16,345,550 | | New Residential Mortgage Loan Trust, Series 2020-RPL1-M2 | | | 3.50 | % (a)(h) | | | 11/25/2059 | | | | 13,599,637 | |
238,747 | | New York Mortgage Trust, Series 2005-2-A (1 Month LIBOR USD + 0.66%, 0.66% Floor, 10.50% Cap) | | | 5.18 | % | | | 08/25/2035 | | | | 208,791 | |
25,802 | | Nomura Asset Acceptance Corporation, Series 2005-AP1-2A5 | | | 5.36 | % | | | 02/25/2035 | | | | 25,003 | |
13,025,792 | | Nomura Asset Acceptance Corporation, Series 2006-AF1-1A2 | | | 6.16 | % (a) | | | 05/25/2036 | | | | 2,965,415 | |
2,647,074 | | Nomura Asset Acceptance Corporation, Series 2006-AF1-1A3 | | | 6.41 | % (a) | | | 05/25/2036 | | | | 602,075 | |
14,356,074 | | Nomura Asset Acceptance Corporation, Series 2006-AP1-A2 | | | 5.52 | % (a) | | | 01/25/2036 | | | | 4,654,556 | |
2,426,479 | | Nomura Asset Acceptance Corporation, Series 2006-AP1-A3 | | | 5.65 | % (a) | | | 01/25/2036 | | | | 786,436 | |
1,156,362 | | Nomura Asset Acceptance Corporation, Series 2006-WF1-A2 | | | 5.76 | % (a) | | | 06/25/2036 | | | | 329,027 | |
15,201,309 | | Nomura Home Equity Loan, Inc., Series 2006-AF1-A2 | | | 5.80 | % (k) | | | 10/25/2036 | | | | 3,765,284 | |
2,601,236 | | Nomura Home Equity Loan, Inc., Series 2007-1-1A1 | | | 6.56 | % | | | 02/25/2037 | | | | 756,160 | |
12,965,161 | | Nomura Home Equity Loan, Inc., Series 2007-1-1A3 | | | 6.49 | % | | | 02/25/2037 | | | | 3,769,591 | |
2,858,332 | | Nomura Resecuritization Trust, Series 2014-1R-6A7 | | | 6.56 | % (a)(h) | | | 08/26/2036 | | | | 2,238,856 | |
4,467,351 | | Nomura Resecuritization Trust, Series 2014-2R-4A9 | | | 6.37 | % (h)(k) | | | 07/26/2036 | | | | 3,867,278 | |
7,207,676 | | Nomura Resecuritization Trust, Series 2015-4R-5A2 (1 Month LIBOR USD + 0.43%, 0.43% Floor) | | | 2.60 | % (b)(e)(h) | | | 03/26/2036 | | | | 5,515,357 | |
13,936,736 | | NovaStar Mortgage Funding Trust, Series 2005-3-M4 (1 Month LIBOR USD + 0.89%, 0.89% Floor, 11.00% Cap) | | | 5.73 | % | | | 01/25/2036 | | | | 11,877,999 | |
7,706,452 | | NovaStar Mortgage Funding Trust, Series 2006-3-A2C (1 Month LIBOR USD + 0.32%, 0.32% Floor, 11.00% Cap) | | | 5.17 | % | | | 10/25/2036 | | | | 4,230,809 | |
51,366,326 | | NRZ Excess Spread-Collateralized Notes, Series 2020-PLS1-A | | | 3.84 | % (h) | | | 12/25/2025 | | | | 48,003,034 | |
54,004,909 | | NRZ Excess Spread-Collateralized Notes, Series 2021-FHT1-A | | | 3.10 | % (h) | | | 07/25/2026 | | | | 48,657,451 | |
9,694,000 | | OBX Trust, Series 2021-NQM3-M1 | | | 2.33 | % (a)(h) | | | 07/25/2061 | | | | 5,040,757 | |
794,166 | | Option One Mortgage Loan Trust, Series 2004-3-M3 (1 Month LIBOR USD + 0.98%, 0.98% Floor) | | | 5.82 | % | | | 11/25/2034 | | | | 766,264 | |
5,859,658 | | Option One Mortgage Loan Trust, Series 2007-1-2A3 (1 Month LIBOR USD + 0.14%, 0.14% Floor) | | | 4.99 | % | | | 01/25/2037 | | | | 3,413,481 | |
55,538,915 | | Option One Mortgage Loan Trust, Series 2007-6-1A1 (1 Month LIBOR USD + 0.19%, 0.19% Floor) | | | 5.04 | % | | | 07/25/2037 | | | | 45,141,369 | |
10,080,000 | | People’s Choice Home Loan Securities Trust, Series 2005-1-M5 (1 Month LIBOR USD + 1.50%, 1.50% Floor, 15.00% Cap) | | | 6.35 | % | | | 01/25/2035 | | | | 7,150,611 | |
3,187,991 | | PHH Alternative Mortgage Trust, Series 2007-1-1A1 (1 Month LIBOR USD + 0.32%, 0.32% Floor, 10.10% Cap) | | | 5.17 | % | | | 02/25/2037 | | | | 2,191,646 | |
7,211,078 | | PHH Alternative Mortgage Trust, Series 2007-2-2A1 | | | 6.00 | % | | | 05/25/2037 | | | | 6,132,261 | |
3,364,807 | | PHH Alternative Mortgage Trust, Series 2007-2-2A2 | | | 6.00 | % | | | 05/25/2037 | | | | 2,861,413 | |
205,104 | | PHH Alternative Mortgage Trust, Series 2007-2-3A1 | | | 6.00 | % | | | 05/25/2037 | | | | 180,101 | |
36,839,660 | | PMT Credit Risk Transfer Trust, Series 2019-2R-A (1 Month LIBOR USD + 2.75%, 2.75% Floor) | | | 7.60 | % (h) | | | 05/27/2023 | | | | 36,062,159 | |
9,464,977 | | PMT Credit Risk Transfer Trust, Series 2019-3R-A (1 Month LIBOR USD + 3.70%, 2.70% Floor) | | | 8.55 | % (h) | | | 10/27/2024 | | | | 9,161,976 | |
28,206,926 | | PMT Credit Risk Transfer Trust, Series 2020-1R-A (1 Month LIBOR USD + 2.35%, 2.35% Floor) | | | 8.20 | % (h) | | | 02/27/2025 | | | | 27,134,649 | |
70,798,070 | | PMT Credit Risk Transfer Trust, Series 2021-1R-A (1 Month LIBOR USD + 2.90%, 2.90% Floor) | | | 7.75 | % (h) | | | 02/27/2024 | | | | 68,735,708 | |
67,663,000 | | PMT Credit Risk Transfer Trust, Series 2021-FT1-A (1 Month LIBOR USD + 3.00%, 3.00% Floor) | | | 7.85 | % (h) | | | 03/25/2026 | | | | 67,276,570 | |
17,500,000 | | PNMAC GMSR Issuer Trust, Series 2018-FT1-A (1 Month LIBOR USD + 2.35%) | | | 6.97 | % (h) | | | 04/25/2023 | | | | 17,386,250 | |
1,200,000 | | PNMAC GMSR Issuer Trust, Series 2018-GT1-A (1 Month LIBOR USD + 2.85%, 2.85% Floor) | | | 7.70 | % (h) | | | 02/25/2025 | | | | 1,195,262 | |
124,366,743 | | PR Mortgage Loan Trust, Series 2014-1-APT | | | 5.89 | % (a)(h) | | | 10/25/2049 | | | | 114,217,273 | |
55,060,523 | | Pretium Mortgage Credit Partners LLC, Series 2021-NPL1-A1 | | | 2.24 | % (h)(k) | | | 09/27/2060 | | | | 52,495,820 | |
27,596,389 | | Pretium Mortgage Credit Partners LLC, Series 2021-NPL5-A1 | | | 2.49 | % (h)(k) | | | 10/25/2051 | | | | 26,056,196 | |
18,326,093 | | Pretium Mortgage Credit Partners LLC, Series 2021-RN2-A1 | | | 1.74 | % (h)(k) | | | 07/25/2051 | | | | 17,118,737 | |
33,311,012 | | Pretium Mortgage Credit Partners LLC, Series 2021-RN4-A1 | | | 2.49 | % (a)(h) | | | 10/25/2051 | | | | 31,425,955 | |
5,221,992 | | Prime Mortgage Trust, Series 2006-DR1-2A1 | | | 5.50 | % (h) | | | 05/25/2035 | | | | 4,587,912 | |
2,840,277 | | Prime Mortgage Trust, Series 2006-DR1-2A2 | | | 6.00 | % (h) | | | 05/25/2035 | | | | 2,341,763 | |
57,778,775 | | Progress Residential Trust, Series 2021-SFR10-E1 | | | 3.57 | % (h) | | | 12/17/2040 | | | | 48,400,350 | |
23,977,912 | | Progress Residential Trust, Series 2021-SFR10-E2 | | | 3.67 | % (h) | | | 12/17/2040 | | | | 19,954,689 | |
12,988,036 | | Progress Residential Trust, Series 2021-SFR10-F | | | 4.61 | % (h) | | | 12/17/2040 | | | | 10,804,192 | |
29,000,000 | | Progress Residential Trust, Series 2021-SFR2-E1 | | | 2.55 | % (h) | | | 04/19/2038 | | | | 25,284,514 | |
20,000,000 | | Progress Residential Trust, Series 2021-SFR2-E2 | | | 2.65 | % (h) | | | 04/19/2038 | | | | 17,395,152 | |
62,271,000 | | Progress Residential Trust, Series 2021-SFR2-F | | | 3.40 | % (h) | | | 04/19/2038 | | | | 54,141,384 | |
7,000,000 | | Progress Residential Trust, Series 2021-SFR5-E1 | | | 2.21 | % (h) | | | 07/17/2038 | | | | 5,984,146 | |
25,000,000 | | Progress Residential Trust, Series 2021-SFR8-E1 | | | 2.38 | % (h) | | | 10/17/2038 | | | | 21,246,655 | |
23,900,000 | | Progress Residential Trust, Series 2021-SFR8-E2 | | | 2.53 | % (h) | | | 10/17/2038 | | | | 20,262,461 | |
19,900,000 | | Progress Residential Trust, Series 2021-SFR8-F | | | 3.18 | % (h) | | | 10/17/2038 | | | | 16,867,867 | |
5,500,000 | | PRPM LLC, Series 2020-4-A2 | | | 3.44 | % (h)(k) | | | 10/25/2025 | | | | 5,376,842 | |
195,865,549 | | PRPM LLC, Series 2021-10-A1 | | | 2.49 | % (h)(k) | | | 10/25/2026 | | | | 181,545,564 | |
103,000,292 | | PRPM LLC, Series 2021-11-A1 | | | 2.49 | % (h)(k) | | | 11/25/2026 | | | | 97,720,724 | |
85,735,125 | | PRPM LLC, Series 2021-2-A1 | | | 2.12 | % (a)(h) | | | 03/25/2026 | | | | 81,281,683 | |
7,100,000 | | PRPM LLC, Series 2021-2-A2 | | | 3.77 | % (a)(h) | | | 03/25/2026 | | | | 6,329,991 | |
51,574,275 | | PRPM LLC, Series 2021-6-A1 | | | 1.79 | % (h)(k) | | | 07/25/2026 | | | | 47,770,868 | |
44,253,246 | | PRPM LLC, Series 2021-7-A1 | | | 1.87 | % (h)(k) | | | 08/25/2026 | | | | 41,432,668 | |
1,571,845 | | RAMP Trust, Series 2004-RS7-A3 | | | 4.31 | % (a) | | | 07/25/2034 | | | | 1,430,454 | |
9,079,876 | | RAMP Trust, Series 2006-RS2-A3A (1 Month LIBOR USD + 0.30%, 0.30% Floor, 14.00% Cap) | | | 5.45 | % | | | 03/25/2036 | | | | 8,733,314 | |
13,016,867 | | RAMP Trust, Series 2006-RS3-A4 (1 Month LIBOR USD + 0.30%, 0.30% Floor, 14.00% Cap) | | | 5.45 | % | | | 05/25/2036 | | | | 11,753,193 | |
12,716,265 | | RAMP Trust, Series 2006-RS6-A4 (1 Month LIBOR USD + 0.54%, 0.54% Floor) | | | 5.39 | % | | | 11/25/2036 | | | | 10,623,386 | |
12,419,815 | | RBSGC Structured Trust, Series 2008-B-A1 | | | 6.00 | % (h) | | | 06/25/2037 | | | | 10,924,993 | |
1,642,833 | | RBSSP Resecuritization Trust, Series 2009-12-17A2 | | | 3.99 | % (a)(h) | | | 10/25/2035 | | | | 1,579,565 | |
14,578,867 | | RBSSP Resecuritization Trust, Series 2009-12-20A2 | | | 4.06 | % (a)(h) | | | 12/25/2035 | | | | 12,007,305 | |
2,919,878 | | RBSSP Resecuritization Trust, Series 2010-4-7A2 | | | 6.00 | % (h) | | | 07/26/2037 | | | | 1,466,519 | |
56,716,112 | | Redwood Funding Trust, Series 2019-1-PT | | | 4.47 | % (h)(k) | | | 09/27/2024 | | | | 55,710,172 | |
5,365,067 | | Renaissance Home Equity Loan Trust, Series 2006-1-AF6 | | | 5.75 | % (k) | | | 05/25/2036 | | | | 2,538,696 | |
2,062,139 | | Renaissance Home Equity Loan Trust, Series 2006-2-AF5 | | | 6.25 | % (k) | | | 08/25/2036 | | | | 866,439 | |
17,385,181 | | Renaissance Home Equity Loan Trust, Series 2006-3-AF3 | | | 5.59 | % (k) | | | 11/25/2036 | | | | 6,034,534 | |
18,049,871 | | Renaissance Home Equity Loan Trust, Series 2006-3-AF4 | | | 5.81 | % (k) | | | 11/25/2036 | | | | 6,506,912 | |
2,933,947 | | Renaissance Home Equity Loan Trust, Series 2006-3-AF5 | | | 6.12 | % (k) | | | 11/25/2036 | | | | 1,111,261 | |
10,257,172 | | Renaissance Home Equity Loan Trust, Series 2006-4-AF4 | | | 5.47 | % (k) | | | 01/25/2037 | | | | 3,419,726 | |
20,198,460 | | Renaissance Home Equity Loan Trust, Series 2006-4-AF5 | | | 5.69 | % (k) | | | 01/25/2037 | | | | 6,993,888 | |
8,192,822 | | Renaissance Home Equity Loan Trust, Series 2007-1-AF1 | | | 5.74 | % (k) | | | 04/25/2037 | | | | 2,488,067 | |
5,779,950 | | Renaissance Home Equity Loan Trust, Series 2007-1-AF1Z | | | 5.35 | % (k) | | | 04/25/2037 | | | | 1,658,214 | |
3,486,895 | | Renaissance Home Equity Loan Trust, Series 2007-1-AF2 | | | 5.51 | % (k) | | | 04/25/2037 | | | | 1,017,717 | |
5,072,268 | | Renaissance Home Equity Loan Trust, Series 2007-1-AF3 | | | 5.61 | % (k) | | | 04/25/2037 | | | | 1,506,490 | |
2,781,357 | | Renaissance Home Equity Loan Trust, Series 2007-1-AF4 | | | 5.76 | % (k) | | | 04/25/2037 | | | | 847,385 | |
8,232,817 | | Renaissance Home Equity Loan Trust, Series 2007-1-AF5 | | | 5.91 | % (k) | | | 04/25/2037 | | | | 2,570,993 | |
17,696,892 | | Renaissance Home Equity Loan Trust, Series 2007-2-AF2 | | | 5.68 | % (k) | | | 06/25/2037 | | | | 5,377,365 | |
22,755,581 | | Renaissance Home Equity Loan Trust, Series 2007-2-AF5 | | | 6.20 | % (k) | | | 06/25/2037 | | | | 7,647,127 | |
897,262 | | Reperforming Loan REMIC Trust, Series 2004-R2-1AF1 (1 Month LIBOR USD + 0.42%, 0.42% Floor, 9.50% Cap) | | | 5.08 | % (h) | | | 11/25/2034 | | | | 844,830 | |
873,033 | | Reperforming Loan REMIC Trust, Series 2004-R2-1AS | | | 1.54 | % (a)(c)(h) | | | 11/25/2034 | | | | 46,894 | |
271,058 | | Reperforming Loan REMIC Trust, Series 2005-R1-1AF1 (1 Month LIBOR USD + 0.36%, 0.36% Floor, 9.50% Cap) | | | 5.21 | % (h) | | | 03/25/2035 | | | | 254,429 | |
269,174 | | Reperforming Loan REMIC Trust, Series 2005-R1-1AS | | | 1.62 | % (a)(c)(h) | | | 03/25/2035 | | | | 14,913 | |
15,265,559 | | Residential Accredit Loans, Inc., Series 2005-QA11-4A1 | | | 4.62 | % (a) | | | 10/25/2035 | | | | 10,846,826 | |
8,228,457 | | Residential Accredit Loans, Inc., Series 2005-QA13-2A1 | | | 4.65 | % (a) | | | 12/25/2035 | | | | 6,505,885 | |
5,970,858 | | Residential Accredit Loans, Inc., Series 2005-QA3-CB1 | | | 3.97 | % (a) | | | 03/25/2035 | | | | 2,354,602 | |
196,894 | | Residential Accredit Loans, Inc., Series 2005-QS12-A11 (-11 x 1 Month LIBOR USD + 51.15%, 51.15% Cap) | | | 0.00 | % (d) | | | 08/25/2035 | | | | 194,124 | |
774,433 | | Residential Accredit Loans, Inc., Series 2005-QS13-1A6 | | | 5.50 | % | | | 09/25/2035 | | | | 636,758 | |
1,585,248 | | Residential Accredit Loans, Inc., Series 2005-QS13-2A1 (1 Month LIBOR USD + 0.70%, 0.70% Floor, 5.75% Cap) | | | 5.55 | % | | | 09/25/2035 | | | | 1,244,279 | |
6,499,519 | | Residential Accredit Loans, Inc., Series 2005-QS13-2A2 (-1 x 1 Month LIBOR USD + 5.05%, 5.05% Cap) | | | 0.20 | % (c)(d) | | | 09/25/2035 | | | | 345,103 | |
4,900,028 | | Residential Accredit Loans, Inc., Series 2005-QS14-2A1 | | | 6.00 | % | | | 09/25/2035 | | | | 1,775,518 | |
1,292,285 | | Residential Accredit Loans, Inc., Series 2005-QS15-2A | | | 6.00 | % | | | 10/25/2035 | | | | 1,085,615 | |
1,544,362 | | Residential Accredit Loans, Inc., Series 2005-QS15-3A | | | 6.00 | % | | | 10/25/2035 | | | | 1,334,324 | |
1,461,871 | | Residential Accredit Loans, Inc., Series 2005-QS16-A1 (1 Month LIBOR USD + 0.70%, 0.70% Floor, 5.50% Cap) | | | 5.50 | % | | | 11/25/2035 | | | | 1,166,485 | |
1,461,618 | | Residential Accredit Loans, Inc., Series 2005-QS16-A2 (-1 x 1 Month LIBOR USD + 4.80%, 4.80% Cap) | | | 0.00 | % (c)(d) | | | 11/25/2035 | | | | 50,314 | |
835,513 | | Residential Accredit Loans, Inc., Series 2005-QS17-A1 | | | 6.00 | % | | | 12/25/2035 | | | | 717,442 | |
864,537 | | Residential Accredit Loans, Inc., Series 2005-QS17-A10 | | | 6.00 | % | | | 12/25/2035 | | | | 742,364 | |
2,421,495 | | Residential Accredit Loans, Inc., Series 2005-QS17-A11 | | | 6.00 | % | | | 12/25/2035 | | | | 2,079,298 | |
1,721,122 | | Residential Accredit Loans, Inc., Series 2005-QS17-A2 (1 Month LIBOR USD + 0.85%, 0.85% Floor, 6.00% Cap) | | | 5.70 | % | | | 12/25/2035 | | | | 1,349,610 | |
1,721,122 | | Residential Accredit Loans, Inc., Series 2005-QS17-A4 (-1 x 1 Month LIBOR USD + 5.15%, 5.15% Cap) | | | 0.30 | % (c)(d) | | | 12/25/2035 | | | | 75,551 | |
1,384,868 | | Residential Accredit Loans, Inc., Series 2005-QS17-A6 | | | 6.00 | % | | | 12/25/2035 | | | | 1,189,164 | |
607,140 | | Residential Accredit Loans, Inc., Series 2005-QS5-A3 | | | 5.70 | % | | | 04/25/2035 | | | | 597,909 | |
2,091,123 | | Residential Accredit Loans, Inc., Series 2006-QS10-A1 | | | 6.00 | % | | | 08/25/2036 | | | | 1,715,004 | |
643,041 | | Residential Accredit Loans, Inc., Series 2006-QS10-A4 | | | 5.75 | % | | | 08/25/2036 | | | | 519,805 | |
4,793,716 | | Residential Accredit Loans, Inc., Series 2006-QS11-1A1 | | | 6.50 | % | | | 08/25/2036 | | | | 3,877,747 | |
1,120,247 | | Residential Accredit Loans, Inc., Series 2006-QS12-1A1 | | | 6.50 | % | | | 09/25/2036 | | | | 543,447 | |
1,844,783 | | Residential Accredit Loans, Inc., Series 2006-QS12-2A18 | | | 5.75 | % | | | 09/25/2036 | | | | 1,461,915 | �� |
2,904,334 | | Residential Accredit Loans, Inc., Series 2006-QS14-A18 | | | 6.25 | % | | | 11/25/2036 | | | | 2,353,274 | |
1,305,233 | | Residential Accredit Loans, Inc., Series 2006-QS15-A1 | | | 6.50 | % | | | 10/25/2036 | | | | 1,117,201 | |
530,466 | | Residential Accredit Loans, Inc., Series 2006-QS16-A10 | | | 6.00 | % | | | 11/25/2036 | | | | 434,297 | |
1,886,253 | | Residential Accredit Loans, Inc., Series 2006-QS16-A11 | | | 6.00 | % | | | 11/25/2036 | | | | 1,548,397 | |
1,503,522 | | Residential Accredit Loans, Inc., Series 2006-QS16-A7 | | | 6.00 | % | | | 11/25/2036 | | | | 1,230,947 | |
595,008 | | Residential Accredit Loans, Inc., Series 2006-QS16-A8 | | | 6.00 | % | | | 11/25/2036 | | | | 487,139 | |
235,456 | | Residential Accredit Loans, Inc., Series 2006-QS16-A9 | | | 6.00 | % | | | 11/25/2036 | | | | 192,770 | |
1,094,334 | | Residential Accredit Loans, Inc., Series 2006-QS17-A4 | | | 6.00 | % | | | 12/25/2036 | | | | 879,754 | |
6,079,644 | | Residential Accredit Loans, Inc., Series 2006-QS17-A5 | | | 6.00 | % | | | 12/25/2036 | | | | 4,887,533 | |
649,834 | | Residential Accredit Loans, Inc., Series 2006-QS1-A6 (-8 x 1 Month LIBOR USD + 42.86%, 42.86% Cap) | | | 5.71 | % (d) | | | 01/25/2036 | | | | 659,896 | |
4,355,819 | | Residential Accredit Loans, Inc., Series 2006-QS3-1A11 | | | 6.00 | % | | | 03/25/2036 | | | | 3,693,339 | |
1,050,386 | | Residential Accredit Loans, Inc., Series 2006-QS4-A8 (-790 x 1 Month LIBOR USD + 5143.00%, 0.10% Floor, 8.00% Cap) | | | 8.00 | % (d) | | | 04/25/2036 | | | | 912,322 | |
4,154,509 | | Residential Accredit Loans, Inc., Series 2006-QS4-A9 | | | 6.00 | % | | | 04/25/2036 | | | | 3,275,306 | |
2,597,246 | | Residential Accredit Loans, Inc., Series 2006-QS5-A3 | | | 6.00 | % | | | 05/25/2036 | | | | 2,095,731 | |
7,740,771 | | Residential Accredit Loans, Inc., Series 2006-QS5-A4 | | | 6.00 | % | | | 05/25/2036 | | | | 6,246,068 | |
1,309,229 | | Residential Accredit Loans, Inc., Series 2006-QS6-1A16 | | | 6.00 | % | | | 06/25/2036 | | | | 1,073,610 | |
1,899,407 | | Residential Accredit Loans, Inc., Series 2006-QS6-1A2 | | | 6.00 | % | | | 06/25/2036 | | | | 1,557,575 | |
3,716,630 | | Residential Accredit Loans, Inc., Series 2006-QS8-A1 | | | 6.00 | % | | | 08/25/2036 | | | | 3,041,507 | |
6,445,178 | | Residential Accredit Loans, Inc., Series 2006-QS8-A5 (-1 x 1 Month LIBOR USD + 5.55%, 5.55% Cap) | | | 0.70 | % (c)(d) | | | 08/25/2036 | | | | 573,984 | |
2,339,689 | | Residential Accredit Loans, Inc., Series 2006-QS9-1A6 (-1 x 1 Month LIBOR USD + 5.30%, 5.30% Cap) | | | 0.45 | % (c)(d) | | | 07/25/2036 | | | | 144,850 | |
22,297,348 | | Residential Accredit Loans, Inc., Series 2007-QA5-1A1 | | | 5.61 | % (a) | | | 09/25/2037 | | | | 14,963,984 | |
24,942,967 | | Residential Accredit Loans, Inc., Series 2007-QH5-AII (1 Month LIBOR USD + 0.46%, 0.46% Floor) | | | 5.31 | % | | | 06/25/2037 | | | | 9,849,409 | |
10,053,547 | | Residential Accredit Loans, Inc., Series 2007-QH7-2A1 (1 Month LIBOR USD + 0.60%, 0.60% Floor) | | | 5.45 | % | | | 08/25/2037 | | | | 8,493,097 | |
23,688,832 | | Residential Accredit Loans, Inc., Series 2007-QS10-A1 | | | 6.50 | % | | | 09/25/2037 | | | | 18,999,164 | |
2,417,970 | | Residential Accredit Loans, Inc., Series 2007-QS11-A1 | | | 7.00 | % | | | 10/25/2037 | | | | 1,885,562 | |
7,929,982 | | Residential Accredit Loans, Inc., Series 2007-QS1-1A2 (-1 x 1 Month LIBOR USD + 5.45%, 5.45% Cap) | | | 0.60 | % (c)(d) | | | 01/25/2037 | | | | 509,763 | |
798,237 | | Residential Accredit Loans, Inc., Series 2007-QS1-1A4 | | | 6.00 | % | | | 01/25/2037 | | | | 620,504 | |
1,955,016 | | Residential Accredit Loans, Inc., Series 2007-QS1-2A10 | | | 6.00 | % | | | 01/25/2037 | | | | 1,488,820 | |
2,669,021 | | Residential Accredit Loans, Inc., Series 2007-QS2-A6 | | | 6.25 | % | | | 01/25/2037 | | | | 2,173,150 | |
13,421,406 | | Residential Accredit Loans, Inc., Series 2007-QS3-A1 | | | 6.50 | % | | | 02/25/2037 | | | | 11,190,799 | |
2,140,127 | | Residential Accredit Loans, Inc., Series 2007-QS3-A4 | | | 6.25 | % | | | 02/25/2037 | | | | 1,756,267 | |
3,518,387 | | Residential Accredit Loans, Inc., Series 2007-QS4-3A3 | | | 6.00 | % | | | 03/25/2037 | | | | 2,953,827 | |
1,420,005 | | Residential Accredit Loans, Inc., Series 2007-QS5-A1 | | | 5.50 | % | | | 03/25/2037 | | | | 1,090,975 | |
585,810 | | Residential Accredit Loans, Inc., Series 2007-QS5-A5 (1 Month LIBOR USD + 0.30%, 0.30% Floor, 7.00% Cap) | | | 5.15 | % | | | 03/25/2037 | | | | 414,643 | |
1,945,608 | | Residential Accredit Loans, Inc., Series 2007-QS5-A8 (-1 x 1 Month LIBOR USD + 6.70%, 6.70% Cap) | | | 1.85 | % (c)(d) | | | 03/25/2037 | | | | 188,376 | |
1,583,370 | | Residential Accredit Loans, Inc., Series 2007-QS6-A102 | | | 5.75 | % | | | 04/25/2037 | | | | 1,250,618 | |
509,100 | | Residential Accredit Loans, Inc., Series 2007-QS6-A13 (-8 x 1 Month LIBOR USD + 55.00%, 55.00% Cap) | | | 14.62 | % (d) | | | 04/25/2037 | | | | 570,230 | |
2,267,262 | | Residential Accredit Loans, Inc., Series 2007-QS6-A45 | | | 5.75 | % | | | 04/25/2037 | | | | 1,790,786 | |
3,613,315 | | Residential Accredit Loans, Inc., Series 2007-QS6-A6 | | | 6.25 | % | | | 04/25/2037 | | | | 2,937,559 | |
249,560 | | Residential Accredit Loans, Inc., Series 2007-QS6-A77 (-8 x 1 Month LIBOR USD + 55.83%, 55.83% Cap) | | | 15.46 | % (d) | | | 04/25/2037 | | | | 285,319 | |
5,393,697 | | Residential Accredit Loans, Inc., Series 2007-QS7-2A1 | | | 6.75 | % | | | 06/25/2037 | | | | 2,312,228 | |
13,876,844 | | Residential Accredit Loans, Inc., Series 2007-QS9-A33 | | | 6.50 | % | | | 07/25/2037 | | | | 11,276,088 | |
3,860,296 | | Residential Asset Securities Corporation, Series 2005-KS4-M5 (1 Month LIBOR USD + 1.20%, 1.80% Floor) | | | 6.65 | % | | | 05/25/2035 | | | | 3,617,784 | |
8,028,278 | | Residential Asset Securities Corporation, Series 2007-EMX1-A13 (1 Month LIBOR USD + 0.20%, 0.20% Floor, 14.00% Cap) | | | 5.05 | % | | | 01/25/2037 | | | | 7,852,726 | |
4,544,457 | | Residential Asset Securitization Trust, Series 2005-A11-2A4 | | | 6.00 | % | | | 10/25/2035 | | | | 2,264,722 | |
1,543,098 | | Residential Asset Securitization Trust, Series 2005-A12-A7 (-1 x 1 Month LIBOR USD + 5.00%, 5.00% Cap) | | | 0.15 | % (c)(d) | | | 11/25/2035 | | | | 120,657 | |
1,569,341 | | Residential Asset Securitization Trust, Series 2005-A12-A8 (1 Month LIBOR USD + 0.55%, 0.55% Floor, 5.50% Cap) | | | 5.40 | % | | | 11/25/2035 | | | | 713,880 | |
1,649,909 | | Residential Asset Securitization Trust, Series 2005-A15-1A7 | | | 6.00 | % | | | 02/25/2036 | | | | 1,554,422 | |
6,973,827 | | Residential Asset Securitization Trust, Series 2005-A15-5A3 | | | 5.75 | % | | | 02/25/2036 | | | | 2,839,573 | |
7,081,171 | | Residential Asset Securitization Trust, Series 2005-A16-A1 | | | 5.00 | % | | | 02/25/2036 | | | | 2,862,456 | |
2,942,164 | | Residential Asset Securitization Trust, Series 2005-A8CB-A11 | | | 6.00 | % | | | 07/25/2035 | | | | 1,911,259 | |
2,974,240 | | Residential Asset Securitization Trust, Series 2005-A8CB-A2 (-1 x 1 Month LIBOR USD + 5.00%, 5.00% Cap) | | | 0.15 | % (c)(d) | | | 07/25/2035 | | | | 165,113 | |
4,916,476 | | Residential Asset Securitization Trust, Series 2006-A10-A5 | | | 6.50 | % | | | 09/25/2036 | | | | 1,815,407 | |
646,450 | | Residential Asset Securitization Trust, Series 2006-A1-1A3 | | | 6.00 | % | | | 04/25/2036 | | | | 314,323 | |
6,980,990 | | Residential Asset Securitization Trust, Series 2006-A12-A1 | | | 6.25 | % | | | 11/25/2036 | | | | 2,845,727 | |
7,263,578 | | Residential Asset Securitization Trust, Series 2006-A13-A1 | | | 6.25 | % | | | 12/25/2036 | | | | 2,756,735 | |
10,289,843 | | Residential Asset Securitization Trust, Series 2006-A1-3A2 | | | 6.00 | % | | | 04/25/2036 | | | | 5,093,390 | |
14,025,160 | | Residential Asset Securitization Trust, Series 2006-A14C-2A6 (1 Month LIBOR USD + 0.45%, 0.45% Floor, 7.00% Cap) | | | 5.30 | % | | | 12/25/2036 | | | | 2,721,675 | |
30,951,425 | | Residential Asset Securitization Trust, Series 2006-A14C-2A7 (-1 x 1 Month LIBOR USD + 6.55%, 6.55% Cap) | | | 1.70 | % (c)(d) | | | 12/25/2036 | | | | 5,086,805 | |
5,462,973 | | Residential Asset Securitization Trust, Series 2006-A2-A11 | | | 6.00 | % | | | 01/25/2046 | | | | 2,396,920 | |
3,803,897 | | Residential Asset Securitization Trust, Series 2006-A2-A4 | | | 6.00 | % | | | 01/25/2046 | | | | 1,661,236 | |
3,161,396 | | Residential Asset Securitization Trust, Series 2006-A2-A9 | | | 6.00 | % | | | 01/25/2046 | | | | 1,380,644 | |
2,269,471 | | Residential Asset Securitization Trust, Series 2006-A8-1A1 | | | 6.00 | % | | | 08/25/2036 | | | | 1,523,752 | |
4,547,599 | | Residential Asset Securitization Trust, Series 2006-R1-A1 (-4 x 1 Month LIBOR USD + 28.40%, 28.40% Cap) | | | 9.02 | % (b)(d) | | | 01/25/2046 | | | | 4,862,125 | |
19,262,060 | | Residential Asset Securitization Trust, Series 2007-A2-1A2 | | | 6.00 | % | | | 04/25/2037 | | | | 11,393,875 | |
723,090 | | Residential Asset Securitization Trust, Series 2007-A3-1A2 (-8 x 1 Month LIBOR USD + 46.38%, 46.38% Cap) | | | 9.24 | % (d) | | | 04/25/2037 | | | | 928,440 | |
22,879,678 | | Residential Asset Securitization Trust, Series 2007-A5-1A4 (-1 x 1 Month LIBOR USD + 6.10%, 6.10% Cap) | | | 1.25 | % (c)(d) | | | 05/25/2037 | | | | 1,410,079 | |
5,878,898 | | Residential Asset Securitization Trust, Series 2007-A5-1A6 (1 Month LIBOR USD + 0.40%, 0.40% Floor, 6.50% Cap) | | | 5.25 | % | | | 05/25/2037 | | | | 637,932 | |
4,115,722 | | Residential Asset Securitization Trust, Series 2007-A5-2A3 | | | 6.00 | % | | | 05/25/2037 | | | | 2,426,483 | |
1,803,711 | | Residential Asset Securitization Trust, Series 2007-A5-2A5 | | | 6.00 | % | | | 05/25/2037 | | | | 1,063,404 | |
7,626,110 | | Residential Asset Securitization Trust, Series 2007-A6-1A2 | | | 6.00 | % | | | 06/25/2037 | | | | 4,616,915 | |
7,744,622 | | Residential Asset Securitization Trust, Series 2007-A7-A1 | | | 6.00 | % | | | 07/25/2037 | | | | 2,981,398 | |
34,065,822 | | Residential Asset Securitization Trust, Series 2007-A7-A2 | | | 6.00 | % | | | 07/25/2037 | | | | 13,114,105 | |
15,093,847 | | Residential Asset Securitization Trust, Series 2007-A7-A6 | | | 6.00 | % | | | 07/25/2037 | | | | 5,810,583 | |
3,808,724 | | Residential Funding Mortgage Securities Trust, Series 2006-S10-1A1 | | | 6.00 | % | | | 10/25/2036 | | | | 3,094,120 | |
1,177,346 | | Residential Funding Mortgage Securities Trust, Series 2006-S5-A12 | | | 6.00 | % | | | 06/25/2036 | | | | 995,423 | |
80,606 | | Residential Funding Mortgage Securities Trust, Series 2006-S5-A15 | | | 6.00 | % | | | 06/25/2036 | | | | 68,151 | |
2,363,797 | | Residential Funding Mortgage Securities Trust, Series 2006-S9-A1 | | | 6.25 | % | | | 09/25/2036 | | | | 1,905,280 | |
2,887,318 | | Residential Funding Mortgage Securities Trust, Series 2007-S1-A7 | | | 6.00 | % | | | 01/25/2037 | | | | 2,324,385 | |
1,430,517 | | Residential Funding Mortgage Securities Trust, Series 2007-S2-A1 | | | 6.00 | % | | | 02/25/2037 | | | | 1,141,913 | |
1,611,635 | | Residential Funding Mortgage Securities Trust, Series 2007-S2-A4 | | | 6.00 | % | | | 02/25/2037 | | | | 1,286,491 | |
3,008,738 | | Residential Funding Mortgage Securities Trust, Series 2007-S2-A5 | | | 6.00 | % | | | 02/25/2037 | | | | 2,401,731 | |
470,166 | | Residential Funding Mortgage Securities Trust, Series 2007-S2-A9 | | | 6.00 | % | | | 02/25/2037 | | | | 375,310 | |
1,628,002 | | Residential Funding Mortgage Securities Trust, Series 2007-S3-1A4 | | | 6.00 | % | | | 03/25/2037 | | | | 1,176,664 | |
1,488,365 | | Residential Funding Mortgage Securities Trust, Series 2007-S4-A1 | | | 6.00 | % | | | 04/25/2037 | | | | 1,166,426 | |
833,528 | | Residential Funding Mortgage Securities Trust, Series 2007-S4-A2 | | | 6.00 | % | | | 04/25/2037 | | | | 653,230 | |
11,025,785 | | Residential Funding Mortgage Securities Trust, Series 2007-S5-A1 | | | 6.00 | % | | | 05/25/2037 | | | | 9,205,115 | |
3,195,316 | | Residential Funding Mortgage Securities Trust, Series 2007-S5-A8 | | | 6.00 | % | | | 05/25/2037 | | | | 2,668,619 | |
1,330,577 | | Residential Funding Mortgage Securities Trust, Series 2007-S6-2A4 | | | 6.00 | % | | | 06/25/2037 | | | | 1,010,242 | |
8,360,893 | | Residential Funding Mortgage Securities Trust, Series 2007-S7-A20 | | | 6.00 | % | | | 07/25/2037 | | | | 6,523,561 | |
4,168,012 | | Residential Funding Mortgage Securities Trust, Series 2007-S8-1A1 | | | 6.00 | % | | | 09/25/2037 | | | | 2,955,508 | |
292,445 | | Residential Funding Mortgage Securities Trust, Series 2007-SA1-4A | | | 4.56 | % (a) | | | 02/25/2037 | | | | 280,849 | |
2,732,095 | | Residential Funding Mortgage Securities Trust, Series 2007-SA2-2A1 | | | 4.53 | % (a) | | | 04/25/2037 | | | | 2,103,016 | |
6,300,000 | | Residential Mortgage Loan Trust, Series 2020-2-M1 | | | 3.57 | % (a)(h) | | | 05/25/2060 | | | | 5,303,974 | |
38,110,350 | | RSFR, Series 2020-1-PT | | | 5.71 | % (h)(k) | | | 02/17/2025 | | | | 34,114,518 | |
66,197,364 | | RSFR, Series 2021-1-PT | | | 4.75 | % (h)(k) | | | 06/19/2026 | | | | 58,682,639 | |
3,647,791 | | Securitized Asset Backed Receivables LLC Trust, Series 2006-NC3-A2B (1 Month LIBOR USD + 0.30%, 0.30% Floor) | | | 5.15 | % | | | 09/25/2036 | | | | 1,330,775 | |
5,740,352 | | Securitized Asset Backed Receivables LLC Trust, Series 2007-BR3-A2A (1 Month LIBOR USD + 0.07%, 0.07% Floor) | | | 4.92 | % | | | 04/25/2037 | | | | 3,810,637 | |
5,610,297 | | Securitized Asset Backed Receivables LLC Trust, Series 2007-BR3-A2B (1 Month LIBOR USD + 0.22%, 0.22% Floor) | | | 5.07 | % | | | 04/25/2037 | | | | 3,724,652 | |
15,220,319 | | Securitized Asset Backed Receivables LLC Trust, Series 2007-BR4-A2B (1 Month LIBOR USD + 0.20%, 0.20% Floor) | | | 5.05 | % | | | 05/25/2037 | | | | 9,179,093 | |
194,735,773 | | Securitized Mortgage Asset Loan Trust, Series 2015-1-PC | | | 4.29 | % (a)(h) | | | 02/25/2054 | | | | 166,557,059 | |
60,607 | | Sequoia Mortgage Trust, Series 2003-4-2A1 (1 Month LIBOR USD + 0.70%, 0.70% Floor, 11.50% Cap) | | | 5.46 | % | | | 07/20/2033 | | | | 54,170 | |
4,090,795 | | SG Mortgage Securities Trust, Series 2006-FRE1-A1A (1 Month LIBOR USD + 0.34%, 0.34% Floor) | | | 5.19 | % | | | 02/25/2036 | | | | 3,987,746 | |
2,478,818 | | SG Mortgage Securities Trust, Series 2006-FRE1-A2C (1 Month LIBOR USD + 0.54%, 0.54% Floor) | | | 5.39 | % | | | 02/25/2036 | | | | 1,435,697 | |
11,174,524 | | Soundview Home Loan Trust, Series 2007-NS1-M1 (1 Month LIBOR USD + 0.35%, 0.35% Floor) | | | 5.20 | % | | | 01/25/2037 | | | | 9,809,233 | |
3,423,565 | | Soundview Home Loan Trust, Series 2007-OPT1-2A2 (1 Month LIBOR USD + 0.15%, 0.15% Floor) | | | 5.00 | % | | | 06/25/2037 | | | | 2,324,527 | |
6,015,872 | | Soundview Home Loan Trust, Series 2007-OPT3-1A1 (1 Month LIBOR USD + 0.17%, 0.17% Floor) | | | 5.02 | % | | | 08/25/2037 | | | | 5,077,144 | |
19,022,838 | | Soundview Home Loan Trust, Series 2007-OPT4-1A1 (1 Month LIBOR USD + 1.00%, 1.00% Floor) | | | 5.85 | % | | | 09/25/2037 | | | | 13,346,558 | |
42,788,624 | | Soundview Home Loan Trust, Series 2007-WM1W-2A1 (1 Month LIBOR USD + 0.18%, 0.18% Floor) | | | 4.29 | % (b) | | | 02/25/2037 | | | | 33,238,220 | |
3,926,983 | | Specialty Underwriting & Residential Finance Trust, Series 2006-BC2-A2B | | | 4.17 | % | | | 02/25/2037 | | | | 1,561,151 | |
13,703,562 | | Specialty Underwriting & Residential Finance Trust, Series 2007-AB1-A2C (1 Month LIBOR USD + 0.25%, 0.25% Floor) | | | 5.10 | % | | | 03/25/2037 | | | | 7,599,837 | |
9,826,000 | | Spruce Hill Mortgage Loan Trust, Series 2020-SH1-M1 | | | 3.22 | % (a)(h) | | | 01/28/2050 | | | | 9,272,018 | |
3,661,796 | | STARM Mortgage Loan Trust, Series 2007-2-1A1 | | | 4.18 | % (a) | | | 04/25/2037 | | | | 1,623,415 | |
1,486,916 | | STARM Mortgage Loan Trust, Series 2007-3-1A1 | | | 3.10 | % (a) | | | 06/25/2037 | | | | 1,001,468 | |
6,329,000 | | Starwood Mortgage Residential Trust, Series 2021-1-B2 | | | 4.52 | % (a)(h) | | | 05/25/2065 | | | | 4,523,168 | |
5,000,000 | | Starwood Mortgage Residential Trust, Series 2021-2-B1 | | | 2.75 | % (a)(h) | | | 05/25/2065 | | | | 3,448,287 | |
7,110,000 | | Starwood Mortgage Residential Trust, Series 2021-2-B2 | | | 3.00 | % (a)(h) | | | 05/25/2065 | | | | 4,405,841 | |
9,103,000 | | Starwood Mortgage Residential Trust, Series 2021-5-M1 | | | 3.25 | % (a)(h) | | | 09/25/2066 | | | | 5,855,660 | |
1,296,213 | | Structured Adjustable Rate Mortgage Loan Trust, Series 2005-22-4A1 | | | 4.26 | % (a) | | | 12/25/2035 | | | | 1,126,679 | |
2,386,247 | | Structured Adjustable Rate Mortgage Loan Trust, Series 2006-12-2A1 | | | 4.18 | % (a) | | | 01/25/2037 | | | | 1,798,430 | |
7,429,112 | | Structured Adjustable Rate Mortgage Loan Trust, Series 2006-1-8A1 | | | 4.49 | % (a) | | | 02/25/2036 | | | | 4,527,617 | |
1,719,161 | | Structured Adjustable Rate Mortgage Loan Trust, Series 2006-8-4A4 | | | 3.91 | % (a) | | | 09/25/2036 | | | | 1,519,001 | |
6,972,617 | | Structured Adjustable Rate Mortgage Loan Trust, Series 2007-7-1A1 (1 Month LIBOR USD + 0.60%, 0.60% Floor) | | | 5.45 | % | | | 08/25/2037 | | | | 5,721,265 | |
73,308,141 | | Structured Asset Investment Loan Trust, Series 2006-3-A1 (1 Month LIBOR USD + 0.16%, 0.16% Floor) | | | 5.01 | % | | | 06/25/2036 | | | | 45,754,484 | |
8,293,021 | | Structured Asset Investment Loan Trust, Series 2006-4-A1 (1 Month LIBOR USD + 0.17%, 0.17% Floor) | | | 5.02 | % | | | 07/25/2036 | | | | 4,933,227 | |
20,800,000 | | Structured Asset Investment Loan Trust, Series 2006-4-A5 (1 Month LIBOR USD + 0.31%, 0.31% Floor) | | | 5.16 | % | | | 07/25/2036 | | | | 6,922,700 | |
9,040,905 | | Structured Asset Mortgage Investments Trust, Series 2006-AR3-12A2 (1 Month LIBOR USD + 0.40%, 0.40% Floor, 10.50% Cap) | | | 5.25 | % | | | 05/25/2036 | | | | 6,837,159 | |
809,731 | | Structured Asset Securities Corporation, Series 2003-24A-1A3 | | | 5.35 | % (a) | | | 07/25/2033 | | | | 775,676 | |
8,611,177 | | Structured Asset Securities Corporation, Series 2005-5-3A1 | | | 6.00 | % | | | 04/25/2035 | | | | 4,959,025 | |
68,487,305 | | Structured Asset Securities Corporation, Series 2006-BC4-A1 (1 Month LIBOR USD + 0.32%, 0.32% Floor) | | | 5.17 | % | | | 12/25/2036 | | | | 41,949,659 | |
12,690,512 | | Structured Asset Securities Corporation, Series 2006-BC4-A4 (1 Month LIBOR USD + 0.34%, 0.34% Floor) | | | 5.19 | % | | | 12/25/2036 | | | | 12,230,740 | |
51,811,899 | | Structured Asset Securities Corporation, Series 2007-4-1A3 (-1 x 1 Month LIBOR USD + 6.25%, 6.25% Cap) | | | 1.40 | % (c)(d)(h) | | | 03/28/2045 | | | | 3,588,565 | |
20,127,500 | | Structured Asset Securities Corporation, Series 2007-BC4-M1 (1 Month LIBOR USD + 0.50%, 0.50% Floor) | | | 5.35 | % | | | 11/25/2037 | | | | 14,601,634 | |
13,587,182 | | Structured Asset Securities Corporation, Series 2007-MN1A-A4 (1 Month LIBOR USD + 0.24%, 0.24% Floor) | | | 5.09 | % (h) | | | 01/25/2037 | | | | 8,648,240 | |
15,868,310 | | Structured Asset Securities Corporation, Series 2007-RF1-1A (1 Month LIBOR USD + 0.19%, 0.19% Floor) | | | 5.04 | % (h) | | | 03/25/2037 | | | | 12,766,606 | |
222,979 | | SunTrust Alternative Loan Trust, Series 2005-1F-2A3 | | | 5.75 | % | | | 12/25/2035 | | | | 203,545 | |
455,728 | | SunTrust Alternative Loan Trust, Series 2006-1F-1A3 | | | 6.00 | % | | | 04/25/2036 | | | | 215,979 | |
11,037,395 | | Terwin Mortgage Trust, Series 2006-7-2A3 (1 Month LIBOR USD + 0.54%, 0.54% Floor) | | | 5.39 | % (h) | | | 08/25/2037 | | | | 4,786,298 | |
151,208 | | Thornburg Mortgage Securities Trust, Series 2003-6-A2 (1 Month LIBOR USD + 1.00%, 1.00% Floor, 11.50% Cap) | | | 5.85 | % | | | 12/25/2033 | | | | 140,495 | |
2,947,886 | | Thornburg Mortgage Securities Trust, Series 2004-4-5A | | | 2.75 | % (a) | | | 12/25/2044 | | | | 2,403,225 | |
4,353,389 | | Thornburg Mortgage Securities Trust, Series 2007-1-A1 (12 Month LIBOR USD + 1.30%, 0.11% Floor, 10.75% Cap) | | | 6.41 | % | | | 03/25/2037 | | | | 3,788,734 | |
1,494,250 | | Thornburg Mortgage Securities Trust, Series 2007-1-A2A (12 Month LIBOR USD + 1.30%, 0.11% Floor, 10.75% Cap) | | | 6.41 | % | | | 03/25/2037 | | | | 1,241,080 | |
30,000,000 | | Toorak Mortgage Corporation Ltd., Series 2021-1-A1 | | | 2.24 | % (h)(k) | | | 06/25/2024 | | | | 28,387,968 | |
5,000,000 | | Tricon American Homes Trust, Series 2019-SFR1-E | | | 3.40 | % (h) | | | 03/17/2038 | | | | 4,571,191 | |
8,900,000 | | Tricon American Homes Trust, Series 2020-SFR1-D | | | 2.55 | % (h) | | | 07/17/2038 | | | | 8,084,514 | |
1,600,000 | | Tricon American Homes Trust, Series 2020-SFR1-E | | | 3.54 | % (h) | | | 07/17/2038 | | | | 1,496,130 | |
16,000,000 | | Tricon Residential Trust, Series 2021-SFR1-B | | | 2.24 | % (h) | | | 07/17/2038 | | | | 14,433,450 | |
13,250,000 | | Tricon Residential Trust, Series 2021-SFR1-C | | | 2.34 | % (h) | | | 07/17/2038 | | | | 11,920,047 | |
5,250,000 | | Tricon Residential Trust, Series 2021-SFR1-D | | | 2.59 | % (h) | | | 07/17/2038 | | | | 4,712,132 | |
10,000,000 | | Tricon Residential Trust, Series 2021-SFR1-E2 | | | 2.89 | % (h) | | | 07/17/2038 | | | | 8,837,472 | |
11,300,000 | | Tricon Residential Trust, Series 2021-SFR1-F | | | 3.69 | % (h) | | | 07/17/2038 | | | | 9,987,612 | |
3,503,242 | | TVC Mortgage Trust, Series 2020-RTL1-A1 | | | 3.47 | % (h) | | | 09/25/2024 | | | | 3,496,108 | |
4,812,732 | | VCAT LLC, Series 2021-NPL3-A1 | | | 1.74 | % (h)(k) | | | 05/25/2051 | | | | 4,481,445 | |
21,637,036 | | VCAT LLC, Series 2021-NPL4-A1 | | | 1.87 | % (h)(k) | | | 08/25/2051 | | | | 20,125,767 | |
34,676,998 | | VCAT LLC, Series 2021-NPL5-A1 | | | 1.87 | % (h)(k) | | | 08/25/2051 | | | | 32,067,606 | |
15,029,419 | | VCAT LLC, Series 2021-NPL6-A1 | | | 1.92 | % (h)(k) | | | 09/25/2051 | | | | 13,975,260 | |
8,707,879 | | Velocity Commercial Capital Loan Trust, Series 2017-2-AFX | | | 3.07 | % (a)(h) | | | 11/25/2047 | | | | 8,215,274 | |
10,703,648 | | Velocity Commercial Capital Loan Trust, Series 2018-2-A | | | 4.05 | % (a)(h) | | | 10/26/2048 | | | | 10,290,840 | |
28,245,412 | | Velocity Commercial Capital Loan Trust, Series 2019-1-A | | | 3.76 | % (a)(h) | | | 03/25/2049 | | | | 26,552,232 | |
2,708,439 | | Velocity Commercial Capital Loan Trust, Series 2019-1-M4 | | | 4.61 | % (a)(h) | | | 03/25/2049 | | | | 2,112,057 | |
10,575,363 | | Velocity Commercial Capital Loan Trust, Series 2019-2-A | | | 3.13 | % (a)(h) | | | 07/25/2049 | | | | 9,896,045 | |
3,851,477 | | Velocity Commercial Capital Loan Trust, Series 2019-2-M1 | | | 3.26 | % (a)(h) | | | 07/25/2049 | | | | 3,410,623 | |
2,398,467 | | Velocity Commercial Capital Loan Trust, Series 2020-1-M4 | | | 3.54 | % (a)(h) | | | 02/25/2050 | | | | 1,920,755 | |
6,100,000 | | Verus Securitization Trust, Series 2021-3-M1 | | | 2.40 | % (a)(h) | | | 06/25/2066 | | | | 3,974,414 | |
4,588,000 | | Verus Securitization Trust, Series 2021-4-B1 | | | 3.05 | % (a)(h) | | | 07/25/2066 | | | | 2,819,436 | |
2,300,000 | | Verus Securitization Trust, Series 2021-4-B2 | | | 3.81 | % (a)(h) | | | 07/25/2066 | | | | 1,428,680 | |
2,500,000 | | Verus Securitization Trust, Series 2021-4-M1 | | | 2.20 | % (a)(h) | | | 07/25/2066 | | | | 1,488,562 | |
6,651,000 | | Verus Securitization Trust, Series 2021-5-B1 | | | 3.04 | % (a)(h) | | | 09/25/2066 | | | | 3,907,967 | |
9,255,000 | | Verus Securitization Trust, Series 2021-5-M1 | | | 2.33 | % (a)(h) | | | 09/25/2066 | | | | 5,770,383 | |
15,759,784 | | VOLT LLC, Series 2021-CF1-A1 | | | 1.99 | % (h)(k) | | | 08/25/2051 | | | | 14,370,379 | |
13,295,743 | | VOLT LLC, Series 2021-CF2-A1 | | | 2.49 | % (h)(k) | | | 11/27/2051 | | | | 11,943,949 | |
24,076,766 | | VOLT LLC, Series 2021-NPL1-A1 | | | 1.89 | % (h)(k) | | | 02/27/2051 | | | | 22,130,923 | |
7,563,735 | | VOLT LLC, Series 2021-NPL2-A1 | | | 1.89 | % (h)(k) | | | 02/27/2051 | | | | 6,987,309 | |
65,214,185 | | VOLT LLC, Series 2021-NPL3-A1 | | | 2.24 | % (h)(k) | | | 02/27/2051 | | | | 61,329,389 | |
8,931,940 | | VOLT LLC, Series 2021-NPL5-A1 | | | 2.12 | % (h)(k) | | | 03/27/2051 | | | | 8,429,876 | |
27,819,806 | | VOLT LLC, Series 2021-NPL6-A1 | | | 2.24 | % (h)(k) | | | 04/25/2051 | | | | 25,694,242 | |
2,075,274 | | VOLT LLC, Series 2021-NPL9-A1 | | | 1.99 | % (h)(k) | | | 05/25/2051 | | | | 1,911,101 | |
6,346,025 | | Voyager Trust, Series 2009-1-SAC3 | | | 2.94 | % (a)(h) | | | 02/25/2038 | | | | 4,548,617 | |
1,203,201 | | Washington Mutual Asset-Backed Certificates Trust, Series 2006-HE2-A4 (1 Month LIBOR USD + 0.48%, 0.48% Floor) | | | 5.33 | % | | | 05/25/2036 | | | | 924,117 | |
19,581,107 | | Washington Mutual Asset-Backed Certificates Trust, Series 2007-HE2-2A2 (1 Month LIBOR USD + 0.22%, 0.22% Floor) | | | 5.07 | % | | | 02/25/2037 | | | | 5,760,045 | |
3,853,488 | | Washington Mutual Mortgage Pass-Through Certificates Trust, Series 2005-1-2A | | | 6.00 | % | | | 03/25/2035 | | | | 3,184,964 | |
1,065,635 | | Washington Mutual Mortgage Pass-Through Certificates Trust, Series 2005-4-5A1 | | | 5.50 | % | | | 06/25/2035 | | | | 909,762 | |
411,549 | | Washington Mutual Mortgage Pass-Through Certificates Trust, Series 2005-5-CB12 (-11 x 1 Month LIBOR USD + 50.60%, 50.60% Cap) | | | 0.00 | % (d) | | | 07/25/2035 | | | | 408,573 | |
1,332,697 | | Washington Mutual Mortgage Pass-Through Certificates Trust, Series 2005-5-CB6 (1 Month LIBOR USD + 0.60%, 0.60% Floor, 7.50% Cap) | | | 5.45 | % | | | 07/25/2035 | | | | 1,125,857 | |
308,879 | | Washington Mutual Mortgage Pass-Through Certificates Trust, Series 2005-6-2A7 | | | 5.50 | % | | | 08/25/2035 | | | | 261,727 | |
3,996,981 | | Washington Mutual Mortgage Pass-Through Certificates Trust, Series 2005-7-2CB6 (1 Month LIBOR USD + 1.45%, 1.45% Floor, 6.00% Cap) | | | 6.00 | % | | | 08/25/2035 | | | | 3,769,455 | |
363,362 | | Washington Mutual Mortgage Pass-Through Certificates Trust, Series 2005-7-2CB7 (-11 x 1 Month LIBOR USD + 50.05%, 50.05% Cap) | | | 0.00 | % (d) | | | 08/25/2035 | | | | 354,075 | |
2,290,710 | | Washington Mutual Mortgage Pass-Through Certificates Trust, Series 2005-7-3CB | | | 6.50 | % | | | 08/25/2035 | | | | 1,870,528 | |
5,079,533 | | Washington Mutual Mortgage Pass-Through Certificates Trust, Series 2005-8-1A2 | | | 5.50 | % | | | 10/25/2035 | | | | 4,783,265 | |
4,559,652 | | Washington Mutual Mortgage Pass-Through Certificates Trust, Series 2005-9-2A2 | | | 5.50 | % | | | 11/25/2035 | | | | 4,202,325 | |
1,221,470 | | Washington Mutual Mortgage Pass-Through Certificates Trust, Series 2005-9-CX | | | 5.50 | % (c) | | | 11/25/2035 | | | | 219,019 | |
4,796,965 | | Washington Mutual Mortgage Pass-Through Certificates Trust, Series 2005-AR19-B1 (1 Month LIBOR USD + 1.05%, 1.05% Floor, 10.50% Cap) | | | 5.90 | % | | | 12/25/2045 | | | | 3,895,024 | |
4,403,842 | | Washington Mutual Mortgage Pass-Through Certificates Trust, Series 2006-1-2CB1 | | | 7.00 | % | | | 02/25/2036 | | | | 3,402,763 | |
1,534,351 | | Washington Mutual Mortgage Pass-Through Certificates Trust, Series 2006-1-3A1 | | | 5.75 | % | | | 02/25/2036 | | | | 1,354,454 | |
775,621 | | Washington Mutual Mortgage Pass-Through Certificates Trust, Series 2006-1-3A2 | | | 5.75 | % | | | 02/25/2036 | | | | 702,099 | |
659,159 | | Washington Mutual Mortgage Pass-Through Certificates Trust, Series 2006-1-3A7 | | | 5.75 | % | | | 02/25/2036 | | | | 596,922 | |
2,024,873 | | Washington Mutual Mortgage Pass-Through Certificates Trust, Series 2006-3-3CB4 | | | 6.00 | % | | | 04/25/2036 | | | | 1,673,648 | |
1,170,426 | | Washington Mutual Mortgage Pass-Through Certificates Trust, Series 2006-5-1A8 | | | 5.75 | % | | | 07/25/2036 | | | | 858,246 | |
2,562,123 | | Washington Mutual Mortgage Pass-Through Certificates Trust, Series 2006-5-2CB1 | | | 6.00 | % | | | 07/25/2036 | | | | 1,793,360 | |
4,653,893 | | Washington Mutual Mortgage Pass-Through Certificates Trust, Series 2006-5-2CB6 | | | 6.00 | % | | | 07/25/2036 | | | | 3,257,497 | |
13,238,668 | | Washington Mutual Mortgage Pass-Through Certificates Trust, Series 2006-5-3A3 | | | 6.72 | % | | | 07/25/2036 | | | | 3,361,903 | |
5,516,876 | | Washington Mutual Mortgage Pass-Through Certificates Trust, Series 2006-5-3A5 | | | 6.95 | % | | | 07/25/2036 | | | | 1,399,936 | |
7,860,715 | | Washington Mutual Mortgage Pass-Through Certificates Trust, Series 2006-8-A4 | | | 4.17 | % | | | 10/25/2036 | | | | 3,016,027 | |
2,884,781 | | Washington Mutual Mortgage Pass-Through Certificates Trust, Series 2006-9-A7 | | | 4.29 | % | | | 10/25/2036 | | | | 938,233 | |
6,054,370 | | Washington Mutual Mortgage Pass-Through Certificates Trust, Series 2006-AR10-1A1 | | | 3.75 | % (a) | | | 09/25/2036 | | | | 5,246,713 | |
3,893,422 | | Washington Mutual Mortgage Pass-Through Certificates Trust, Series 2006-AR10-A1 (1 Month LIBOR USD + 0.20%, 0.20% Floor) | | | 5.05 | % | | | 12/25/2036 | | | | 1,947,192 | |
5,845,826 | | Washington Mutual Mortgage Pass-Through Certificates Trust, Series 2006-AR15-1A (12 Month US Treasury Average + 0.84%, 0.84% Floor) | | | 3.98 | % | | | 11/25/2046 | | | | 4,876,497 | |
5,564,873 | | Washington Mutual Mortgage Pass-Through Certificates Trust, Series 2006-AR4-2A (12 Month US Treasury Average + 0.95%, 0.95% Floor) | | | 4.09 | % | | | 06/25/2046 | | | | 3,994,542 | |
4,956,089 | | Washington Mutual Mortgage Pass-Through Certificates Trust, Series 2006-AR5-4A (12 Month US Treasury Average + 0.99%, 0.99% Floor) | | | 4.13 | % | | | 06/25/2046 | | | | 3,778,565 | |
3,330,160 | | Washington Mutual Mortgage Pass-Through Certificates Trust, Series 2006-AR5-A12B (12 Month US Treasury Average + 0.98%, 0.98% Floor) | | | 4.12 | % | | | 06/25/2046 | | | | 2,932,593 | |
480,014 | | Washington Mutual Mortgage Pass-Through Certificates Trust, Series 2006-AR6-2A3 | | | 3.74 | % (a) | | | 08/25/2036 | | | | 401,587 | |
7,477,610 | | Washington Mutual Mortgage Pass-Through Certificates Trust, Series 2007-2-1A6 | | | 6.00 | % | | | 04/25/2037 | | | | 6,129,252 | |
2,319,574 | | Washington Mutual Mortgage Pass-Through Certificates Trust, Series 2007-3-A2 | | | 6.00 | % | | | 04/25/2037 | | | | 1,997,908 | |
3,214,452 | | Washington Mutual Mortgage Pass-Through Certificates Trust, Series 2007-3-A3 | | | 6.00 | % | | | 04/25/2037 | | | | 2,768,347 | |
2,267,801 | | Washington Mutual Mortgage Pass-Through Certificates Trust, Series 2007-4-1A1 | | | 5.50 | % | | | 06/25/2037 | | | | 2,123,908 | |
168,921 | | Washington Mutual Mortgage Pass-Through Certificates Trust, Series 2007-5-A11 (-6 x 1 Month LIBOR USD + 39.48%, 39.48% Cap) | | | 10.41 | % (d) | | | 06/25/2037 | | | | 196,313 | |
4,223,013 | | Washington Mutual Mortgage Pass-Through Certificates Trust, Series 2007-5-A6 | | | 6.00 | % | | | 06/25/2037 | | | | 3,823,839 | |
7,860,861 | | Washington Mutual Mortgage Pass-Through Certificates Trust, Series 2007-HE1-2A2 (1 Month LIBOR USD + 0.11%, 0.11% Floor) | | | 4.96 | % | | | 01/25/2037 | | | | 3,547,849 | |
14,913,823 | | Washington Mutual Mortgage Pass-Through Certificates Trust, Series 2007-HE4-1A (1 Month LIBOR USD + 0.17%, 0.17% Floor) | | | 5.02 | % | | | 07/25/2047 | | | | 10,626,570 | |
4,957,089 | | Washington Mutual Mortgage Pass-Through Certificates Trust, Series 2007-HY3-4A1 | | | 3.61 | % (a) | | | 03/25/2037 | | | | 4,396,764 | |
7,641,196 | | Washington Mutual Mortgage Pass-Through Certificates Trust, Series 2007-HY5-1A1 | | | 3.00 | % (a) | | | 05/25/2037 | | | | 6,395,983 | |
5,811,595 | | Washington Mutual Mortgage Pass-Through Certificates Trust, Series 2007-OC1-A2 (1 Month LIBOR USD + 0.24%, 0.24% Floor) | | | 5.09 | % | | | 01/25/2047 | | | | 4,988,335 | |
533,591 | | Wells Fargo Alternative Loan Trust, Series 2007-PA1-A10 | | | 6.00 | % | | | 03/25/2037 | | | | 464,014 | |
2,342,879 | | Wells Fargo Alternative Loan Trust, Series 2007-PA1-A3 | | | 6.00 | % | | | 03/25/2037 | | | | 2,037,384 | |
2,020,074 | | Wells Fargo Alternative Loan Trust, Series 2007-PA1-A5 | | | 6.00 | % | | | 03/25/2037 | | | | 1,756,671 | |
3,310,800 | | Wells Fargo Alternative Loan Trust, Series 2007-PA1-A6 | | | 6.00 | % | | | 03/25/2037 | | | | 2,879,095 | |
12,748,698 | | Wells Fargo Alternative Loan Trust, Series 2007-PA2-1A1 | | | 6.00 | % | | | 06/25/2037 | | | | 11,532,527 | |
2,268,794 | | Wells Fargo Alternative Loan Trust, Series 2007-PA2-3A1 (1 Month LIBOR USD + 0.35%, 0.35% Floor, 7.00% Cap) | | | 5.20 | % | | | 06/25/2037 | | | | 1,585,452 | |
3,342,285 | | Wells Fargo Alternative Loan Trust, Series 2007-PA2-3A2 (-1 x 1 Month LIBOR USD + 6.65%, 6.65% Cap) | | | 1.80 | % (c)(d) | | | 06/25/2037 | | | | 226,704 | |
264,186 | | Wells Fargo Alternative Loan Trust, Series 2007-PA3-1A4 | | | 5.75 | % | | | 07/25/2037 | | | | 215,917 | |
4,438,307 | | Wells Fargo Alternative Loan Trust, Series 2007-PA3-2A1 | | | 6.00 | % | | | 07/25/2037 | | | | 3,810,933 | |
1,763,368 | | Wells Fargo Alternative Loan Trust, Series 2007-PA3-2A4 | | | 6.00 | % | | | 07/25/2037 | | | | 1,514,108 | |
3,072,383 | | Wells Fargo Alternative Loan Trust, Series 2007-PA3-3A1 | | | 6.25 | % | | | 07/25/2037 | | | | 2,619,146 | |
23,701,239 | | Wells Fargo Alternative Loan Trust, Series 2007-PA5-1A1 | | | 6.25 | % | | | 11/25/2037 | | | | 20,386,497 | |
4,671,123 | | Wells Fargo Alternative Loan Trust, Series 2007-PA6-A1 | | | 4.29 | % (a) | | | 12/28/2037 | | | | 4,181,124 | |
1,590,046 | | Wells Fargo Mortgage Backed Securities Trust, Series 2006-AR12-1A1 | | | 4.09 | % (a) | | | 09/25/2036 | | | | 1,406,930 | |
819,384 | | Wells Fargo Mortgage Backed Securities Trust, Series 2006-AR13-A2 | | | 4.28 | % (a) | | | 09/25/2036 | | | | 753,510 | |
824,224 | | Wells Fargo Mortgage Backed Securities Trust, Series 2006-AR4-2A1 | | | 4.64 | % (a) | | | 04/25/2036 | | | | 763,924 | |
1,263,003 | | Wells Fargo Mortgage Backed Securities Trust, Series 2007-7-A1 | | | 6.00 | % | | | 06/25/2037 | | | | 1,153,143 | |
87,839 | | Wells Fargo Mortgage Backed Securities Trust, Series 2007-7-A32 | | | 5.75 | % | | | 06/25/2037 | | | | 79,307 | |
2,844,191 | | Wells Fargo Mortgage Backed Securities Trust, Series 2007-7-A34 | | | 6.00 | % | | | 06/25/2037 | | | | 2,596,792 | |
770,346 | | Wells Fargo Mortgage Backed Securities Trust, Series 2007-7-A36 | | | 6.00 | % | | | 06/25/2037 | | | | 703,318 | |
261,982 | | Wells Fargo Mortgage Backed Securities Trust, Series 2007-7-A43 (1 Month LIBOR USD + 0.50%, 0.50% Floor, 7.00% Cap) | | | 5.35 | % | | | 06/25/2037 | | | | 222,849 | |
715,730 | | Wells Fargo Mortgage Backed Securities Trust, Series 2007-7-A49 | | | 6.00 | % | | | 06/25/2037 | | | | 653,473 | |
303,002 | | Wells Fargo Mortgage Backed Securities Trust, Series 2007-7-A8 (1 Month LIBOR USD + 0.50%, 0.50% Floor, 7.00% Cap) | | | 5.35 | % | | | 06/25/2037 | | | | 257,741 | |
136,690 | | Wells Fargo Mortgage Backed Securities Trust, Series 2007-7-A9 (-6 x 1 Month LIBOR USD + 39.00%, 39.00% Cap) | | | 9.93 | % (d) | | | 06/25/2037 | | | | 163,993 | |
11,337,413 | | Wells Fargo Mortgage Backed Securities Trust, Series 2007-AR9-A1 | | | 4.49 | % (a) | | | 12/28/2037 | | | | 9,754,966 | |
| | | | | | | | | | | | | | |
Total Non-Agency Residential Collateralized Mortgage Obligations (Cost $11,199,354,623) | | | | | | | | | | | 9,093,451,563 | |
| | | | | | | | | | | | | | |
US Government and Agency Mortgage Backed Obligations - 45.9% | |
2,095,071 | | Federal Home Loan Mortgage Corporation Pass-Thru, Pool C03490 | | | 4.50 | % | | | 08/01/2040 | | | | 2,111,231 | |
15,467,288 | | Federal Home Loan Mortgage Corporation Pass-Thru, Pool C91388 | | | 3.50 | % | | | 02/01/2032 | | | | 15,247,497 | |
7,948,394 | | Federal Home Loan Mortgage Corporation Pass-Thru, Pool C91403 | | | 3.50 | % | | | 03/01/2032 | | | | 7,835,436 | |
8,001,379 | | Federal Home Loan Mortgage Corporation Pass-Thru, Pool C91413 | | | 3.50 | % | | | 12/01/2031 | | | | 7,887,686 | |
4,082,772 | | Federal Home Loan Mortgage Corporation Pass-Thru, Pool C91417 | | | 3.50 | % | | | 01/01/2032 | | | | 4,024,761 | |
16,332,844 | | Federal Home Loan Mortgage Corporation Pass-Thru, Pool C91447 | | | 3.50 | % | | | 05/01/2032 | | | | 16,100,688 | |
20,424,461 | | Federal Home Loan Mortgage Corporation Pass-Thru, Pool C91594 | | | 3.00 | % | | | 01/01/2033 | | | | 19,288,675 | |
6,154,197 | | Federal Home Loan Mortgage Corporation Pass-Thru, Pool C91596 | | | 3.00 | % | | | 02/01/2033 | | | | 5,811,944 | |
2,938,208 | | Federal Home Loan Mortgage Corporation Pass-Thru, Pool D98901 | | | 3.50 | % | | | 01/01/2032 | | | | 2,896,458 | |
6,501,801 | | Federal Home Loan Mortgage Corporation Pass-Thru, Pool D98923 | | | 3.50 | % | | | 01/01/2032 | | | | 6,409,424 | |
8,064,557 | | Federal Home Loan Mortgage Corporation Pass-Thru, Pool D99724 | | | 3.00 | % | | | 11/01/2032 | | | | 7,616,167 | |
7,130,999 | | Federal Home Loan Mortgage Corporation Pass-Thru, Pool G01840 | | | 5.00 | % | | | 07/01/2035 | | | | 7,297,024 | |
1,425,169 | | Federal Home Loan Mortgage Corporation Pass-Thru, Pool G04817 | | | 5.00 | % | | | 09/01/2038 | | | | 1,458,423 | |
5,593,445 | | Federal Home Loan Mortgage Corporation Pass-Thru, Pool G07801 | | | 4.00 | % | | | 10/01/2044 | | | | 5,470,878 | |
11,862,579 | | Federal Home Loan Mortgage Corporation Pass-Thru, Pool G07862 | | | 4.00 | % | | | 01/01/2044 | | | | 11,625,785 | |
12,853,777 | | Federal Home Loan Mortgage Corporation Pass-Thru, Pool G07905 | | | 4.00 | % | | | 01/01/2042 | | | | 12,605,298 | |
26,127,456 | | Federal Home Loan Mortgage Corporation Pass-Thru, Pool G08534 | | | 3.00 | % | | | 06/01/2043 | | | | 24,149,860 | |
8,471,877 | | Federal Home Loan Mortgage Corporation Pass-Thru, Pool G08537 | | | 3.00 | % | | | 07/01/2043 | | | | 7,830,632 | |
15,655,362 | | Federal Home Loan Mortgage Corporation Pass-Thru, Pool G08614 | | | 3.00 | % | | | 11/01/2044 | | | | 14,469,743 | |
17,838,997 | | Federal Home Loan Mortgage Corporation Pass-Thru, Pool G08619 | | | 3.00 | % | | | 12/01/2044 | | | | 16,476,891 | |
23,171,963 | | Federal Home Loan Mortgage Corporation Pass-Thru, Pool G08622 | | | 3.00 | % | | | 01/01/2045 | | | | 21,398,310 | |
43,723,294 | | Federal Home Loan Mortgage Corporation Pass-Thru, Pool G08626 | | | 3.00 | % | | | 02/01/2045 | | | | 40,385,685 | |
22,105,325 | | Federal Home Loan Mortgage Corporation Pass-Thru, Pool G08631 | | | 3.00 | % | | | 03/01/2045 | | | | 20,404,207 | |
62,494,321 | | Federal Home Loan Mortgage Corporation Pass-Thru, Pool G08635 | | | 3.00 | % | | | 04/01/2045 | | | | 57,672,117 | |
18,684,760 | | Federal Home Loan Mortgage Corporation Pass-Thru, Pool G08640 | | | 3.00 | % | | | 05/01/2045 | | | | 17,239,122 | |
99,886,393 | | Federal Home Loan Mortgage Corporation Pass-Thru, Pool G08648 | | | 3.00 | % | | | 06/01/2045 | | | | 92,137,488 | |
19,125,805 | | Federal Home Loan Mortgage Corporation Pass-Thru, Pool G08653 | | | 3.00 | % | | | 07/01/2045 | | | | 17,638,092 | |
11,159,493 | | Federal Home Loan Mortgage Corporation Pass-Thru, Pool G08658 | | | 3.00 | % | | | 08/01/2045 | | | | 10,289,116 | |
12,597,328 | | Federal Home Loan Mortgage Corporation Pass-Thru, Pool G08670 | | | 3.00 | % | | | 10/01/2045 | | | | 11,609,567 | |
148,266,660 | | Federal Home Loan Mortgage Corporation Pass-Thru, Pool G08675 | | | 3.00 | % | | | 11/01/2045 | | | | 136,641,126 | |
60,950,320 | | Federal Home Loan Mortgage Corporation Pass-Thru, Pool G08680 | | | 3.00 | % | | | 12/01/2045 | | | | 56,133,314 | |
25,681,364 | | Federal Home Loan Mortgage Corporation Pass-Thru, Pool G08686 | | | 3.00 | % | | | 01/01/2046 | | | | 23,651,700 | |
57,493,878 | | Federal Home Loan Mortgage Corporation Pass-Thru, Pool G08692 | | | 3.00 | % | | | 02/01/2046 | | | | 52,949,895 | |
18,046,326 | | Federal Home Loan Mortgage Corporation Pass-Thru, Pool G08705 | | | 3.00 | % | | | 05/01/2046 | | | | 16,601,368 | |
20,922,414 | | Federal Home Loan Mortgage Corporation Pass-Thru, Pool G08715 | | | 3.00 | % | | | 08/01/2046 | | | | 19,234,148 | |
1,105,584 | | Federal Home Loan Mortgage Corporation Pass-Thru, Pool G08800 | | | 3.50 | % | | | 02/01/2048 | | | | 1,044,115 | |
12,249,847 | | Federal Home Loan Mortgage Corporation Pass-Thru, Pool G16072 | | | 3.00 | % | | | 02/01/2032 | | | | 11,726,264 | |
24,875,942 | | Federal Home Loan Mortgage Corporation Pass-Thru, Pool G60251 | | | 3.50 | % | | | 10/01/2045 | | | | 23,549,902 | |
65,227,009 | | Federal Home Loan Mortgage Corporation Pass-Thru, Pool G60393 | | | 3.50 | % | | | 01/01/2046 | | | | 61,709,684 | |
9,574,347 | | Federal Home Loan Mortgage Corporation Pass-Thru, Pool J22834 | | | 2.50 | % | | | 03/01/2028 | | | | 9,219,871 | |
22,749,036 | | Federal Home Loan Mortgage Corporation Pass-Thru, Pool Q13637 | | | 3.00 | % | | | 11/01/2042 | | | | 21,027,582 | |
22,941,348 | | Federal Home Loan Mortgage Corporation Pass-Thru, Pool Q13638 | | | 3.00 | % | | | 11/01/2042 | | | | 21,205,300 | |
39,735,711 | | Federal Home Loan Mortgage Corporation Pass-Thru, Pool Q16672 | | | 3.00 | % | | | 03/01/2043 | | | | 36,728,251 | |
2,637,734 | | Federal Home Loan Mortgage Corporation Pass-Thru, Pool Q23595 | | | 4.00 | % | | | 12/01/2043 | | | | 2,599,935 | |
3,131,461 | | Federal Home Loan Mortgage Corporation Pass-Thru, Pool Q24052 | | | 4.00 | % | | | 01/01/2044 | | | | 3,086,588 | |
2,608,813 | | Federal Home Loan Mortgage Corporation Pass-Thru, Pool Q24172 | | | 4.00 | % | | | 01/01/2044 | | | | 2,571,429 | |
2,758,775 | | Federal Home Loan Mortgage Corporation Pass-Thru, Pool Q24979 | | | 4.00 | % | | | 02/01/2044 | | | | 2,711,703 | |
10,495,649 | | Federal Home Loan Mortgage Corporation Pass-Thru, Pool Q31596 | | | 3.50 | % | | | 02/01/2045 | | | | 9,949,167 | |
4,464,719 | | Federal Home Loan Mortgage Corporation Pass-Thru, Pool Q32861 | | | 3.50 | % | | | 04/01/2045 | | | | 4,228,104 | |
10,902,336 | | Federal Home Loan Mortgage Corporation Pass-Thru, Pool Q32921 | | | 3.50 | % | | | 04/01/2045 | | | | 10,317,773 | |
11,839,153 | | Federal Home Loan Mortgage Corporation Pass-Thru, Pool Q39502 | | | 3.50 | % | | | 03/01/2046 | | | | 11,200,699 | |
25,781,698 | | Federal Home Loan Mortgage Corporation Pass-Thru, Pool Q44073 | | | 3.00 | % | | | 09/01/2046 | | | | 23,673,265 | |
16,017,462 | | Federal Home Loan Mortgage Corporation Pass-Thru, Pool QU7965 | | | 2.00 | % | | | 09/01/2051 | | | | 12,947,563 | |
14,472,237 | | Federal Home Loan Mortgage Corporation Pass-Thru, Pool QU7970 | | | 2.00 | % | | | 09/01/2051 | | | | 11,698,350 | |
51,880,733 | | Federal Home Loan Mortgage Corporation Pass-Thru, Pool RA3515 | | | 2.50 | % | | | 09/01/2050 | | | | 44,876,494 | |
21,965,854 | | Federal Home Loan Mortgage Corporation Pass-Thru, Pool RA4218 | | | 2.50 | % | | | 12/01/2050 | | | | 18,994,965 | |
16,696,911 | | Federal Home Loan Mortgage Corporation Pass-Thru, Pool RA4968 | | | 2.50 | % | | | 04/01/2046 | | | | 14,662,981 | |
63,664,703 | | Federal Home Loan Mortgage Corporation Pass-Thru, Pool RA5267 | | | 3.00 | % | | | 05/01/2051 | | | | 57,356,482 | |
190,299,174 | | Federal Home Loan Mortgage Corporation Pass-Thru, Pool RA7642 | | | 4.50 | % | | | 08/01/2052 | | | | 186,799,795 | |
86,859,653 | | Federal Home Loan Mortgage Corporation Pass-Thru, Pool RA7672 | | | 4.50 | % | | | 07/01/2052 | | | | 85,264,673 | |
142,548,502 | | Federal Home Loan Mortgage Corporation Pass-Thru, Pool RA7784 | | | 4.50 | % | | | 08/01/2052 | | | | 139,923,566 | |
60,277,869 | | Federal Home Loan Mortgage Corporation Pass-Thru, Pool RB0714 | | | 2.00 | % | | | 12/01/2041 | | | | 51,364,025 | |
78,792,643 | | Federal Home Loan Mortgage Corporation Pass-Thru, Pool RB5089 | | | 1.50 | % | | | 12/01/2040 | | | | 65,444,942 | |
8,760,947 | | Federal Home Loan Mortgage Corporation Pass-Thru, Pool RB5106 | | | 2.50 | % | | | 03/01/2041 | | | | 7,824,730 | |
90,039,647 | | Federal Home Loan Mortgage Corporation Pass-Thru, Pool RB5110 | | | 1.50 | % | | | 05/01/2041 | | | | 75,104,399 | |
58,159,275 | | Federal Home Loan Mortgage Corporation Pass-Thru, Pool RB5131 | | | 2.00 | % | | | 10/01/2041 | | | | 50,055,741 | |
16,882,822 | | Federal Home Loan Mortgage Corporation Pass-Thru, Pool SD0035 | | | 3.00 | % | | | 04/01/2047 | | | | 15,592,702 | |
35,047,675 | | Federal Home Loan Mortgage Corporation Pass-Thru, Pool SD0699 | | | 2.00 | % | | | 11/01/2050 | | | | 29,613,850 | |
48,725,064 | | Federal Home Loan Mortgage Corporation Pass-Thru, Pool SD0715 | | | 2.00 | % | | | 09/01/2051 | | | | 41,020,407 | |
61,645,121 | | Federal Home Loan Mortgage Corporation Pass-Thru, Pool SD1914 | | | 4.00 | % | | | 10/01/2052 | | | | 59,042,572 | |
26,235,786 | | Federal Home Loan Mortgage Corporation Pass-Thru, Pool SD1966 | | | 4.00 | % | | | 11/01/2052 | | | | 25,132,672 | |
69,449,717 | | Federal Home Loan Mortgage Corporation Pass-Thru, Pool SD2120 | | | 3.00 | % | | | 10/01/2051 | | | | 62,644,993 | |
42,170,749 | | Federal Home Loan Mortgage Corporation Pass-Thru, Pool SD2386 | | | 3.50 | % | | | 06/01/2052 | | | | 39,303,290 | |
213,885,568 | | Federal Home Loan Mortgage Corporation Pass-Thru, Pool SD7534 | | | 2.50 | % | | | 02/01/2051 | | | | 188,113,978 | |
89,211,325 | | Federal Home Loan Mortgage Corporation Pass-Thru, Pool SD8152 | | | 3.00 | % | | | 06/01/2051 | | | | 80,388,985 | |
3,405,883 | | Federal Home Loan Mortgage Corporation Pass-Thru, Pool SD8168 | | | 3.00 | % | | | 09/01/2051 | | | | 3,067,110 | |
9,838,833 | | Federal Home Loan Mortgage Corporation Pass-Thru, Pool SD8169 | | | 3.50 | % | | | 09/01/2051 | | | | 9,152,613 | |
41,872,815 | | Federal Home Loan Mortgage Corporation Pass-Thru, Pool SD8214 | | | 3.50 | % | | | 05/01/2052 | | | | 38,950,122 | |
41,940,880 | | Federal Home Loan Mortgage Corporation Pass-Thru, Pool SE9043 | | | 2.00 | % | | | 09/01/2051 | | | | 33,902,336 | |
993,968 | | Federal Home Loan Mortgage Corporation Pass-Thru, Pool T60392 | | | 4.00 | % | | | 10/01/2041 | | | | 947,448 | |
1,675,737 | | Federal Home Loan Mortgage Corporation Pass-Thru, Pool T60681 | | | 4.00 | % | | | 05/01/2042 | | | | 1,600,221 | |
5,731,446 | | Federal Home Loan Mortgage Corporation Pass-Thru, Pool T60782 | | | 3.50 | % | | | 07/01/2042 | | | | 5,313,018 | |
6,742,437 | | Federal Home Loan Mortgage Corporation Pass-Thru, Pool T60853 | | | 3.50 | % | | | 09/01/2042 | | | | 6,247,084 | |
6,942,418 | | Federal Home Loan Mortgage Corporation Pass-Thru, Pool T60854 | | | 3.50 | % | | | 09/01/2042 | | | | 6,432,387 | |
1,066,862 | | Federal Home Loan Mortgage Corporation Pass-Thru, Pool T65110 | | | 3.50 | % | | | 10/01/2042 | | | | 988,497 | |
7,001,495 | | Federal Home Loan Mortgage Corporation Pass-Thru, Pool T65492 | | | 3.00 | % | | | 06/01/2048 | | | | 6,350,469 | |
563,702 | | Federal Home Loan Mortgage Corporation Pass-Thru, Pool T69016 | | | 5.00 | % | | | 06/01/2041 | | | | 561,623 | |
12,007,404 | | Federal Home Loan Mortgage Corporation Pass-Thru, Pool T69050 | | | 3.50 | % | | | 05/01/2046 | | | | 11,218,771 | |
137,878 | | Federal Home Loan Mortgage Corporation Pass-Thru, Pool U60299 | | | 4.00 | % | | | 11/01/2040 | | | | 134,416 | |
1,379,910 | | Federal Home Loan Mortgage Corporation Pass-Thru, Pool U99125 | | | 3.00 | % | | | 01/01/2043 | | | | 1,276,132 | |
23,528,815 | | Federal Home Loan Mortgage Corporation Pass-Thru, Pool U99193 | | | 3.50 | % | | | 03/01/2044 | | | | 22,337,629 | |
53,867,517 | | Federal Home Loan Mortgage Corporation Pass-Thru, Pool V81821 | | | 3.00 | % | | | 08/01/2045 | | | | 49,699,825 | |
15,527,782 | | Federal Home Loan Mortgage Corporation Pass-Thru, Pool V82117 | | | 3.00 | % | | | 12/01/2045 | | | | 14,307,035 | |
12,912,278 | | Federal Home Loan Mortgage Corporation Pass-Thru, Pool V82209 | | | 3.50 | % | | | 02/01/2046 | | | | 12,215,923 | |
7,076,032 | | Federal Home Loan Mortgage Corporation Pass-Thru, Pool V82248 | | | 3.50 | % | | | 03/01/2046 | | | | 6,694,434 | |
83,584,649 | | Federal Home Loan Mortgage Corporation Pass-Thru, Pool Z40117 | | | 3.00 | % | | | 04/01/2045 | | | | 77,257,099 | |
6,989,904 | | Federal Home Loan Mortgage Corporation Pass-Thru, Pool ZS4750 | | | 3.00 | % | | | 01/01/2048 | | | | 6,375,245 | |
15,356,469 | | Federal Home Loan Mortgage Corporation Pass-Thru, Pool ZT1827 | | | 3.00 | % | | | 07/01/2047 | | | | 14,074,283 | |
447,461 | | Federal Home Loan Mortgage Corporation REMICS, Series 2519-ZD | | | 5.50 | % | | | 11/15/2032 | | | | 453,748 | |
243,626 | | Federal Home Loan Mortgage Corporation REMICS, Series 2596-ZL | | | 5.00 | % | | | 04/15/2033 | | | | 246,591 | |
161,542 | | Federal Home Loan Mortgage Corporation REMICS, Series 2684-ZN | | | 4.00 | % | | | 10/15/2033 | | | | 157,657 | |
1,067,106 | | Federal Home Loan Mortgage Corporation REMICS, Series 2750-ZT | | | 5.00 | % | | | 02/15/2034 | | | | 1,081,104 | |
2,864,468 | | Federal Home Loan Mortgage Corporation REMICS, Series 2825-PZ | | | 5.50 | % | | | 07/15/2034 | | | | 2,939,668 | |
1,728,147 | | Federal Home Loan Mortgage Corporation REMICS, Series 2898-JZ | | | 5.00 | % | | | 12/15/2034 | | | | 1,747,268 | |
4,235,605 | | Federal Home Loan Mortgage Corporation REMICS, Series 2899-AZ | | | 5.00 | % | | | 12/15/2034 | | | | 4,262,047 | |
2,234,545 | | Federal Home Loan Mortgage Corporation REMICS, Series 2909-Z | | | 5.00 | % | | | 12/15/2034 | | | | 2,249,500 | |
4,553,376 | | Federal Home Loan Mortgage Corporation REMICS, Series 2932-Z | | | 5.00 | % | | | 02/15/2035 | | | | 4,589,543 | |
1,803,143 | | Federal Home Loan Mortgage Corporation REMICS, Series 3002-SN (-1 x 1 Month LIBOR USD + 6.50%, 6.50% Cap) | | | 1.82 | % (c)(d) | | | 07/15/2035 | | | | 142,168 | |
1,132,102 | | Federal Home Loan Mortgage Corporation REMICS, Series 3030-SL (-1 x 1 Month LIBOR USD + 6.10%, 6.10% Cap) | | | 1.42 | % (c)(d) | | | 09/15/2035 | | | | 79,448 | |
415,508 | | Federal Home Loan Mortgage Corporation REMICS, Series 3045-DI (-1 x 1 Month LIBOR USD + 6.73%, 6.73% Cap) | | | 2.05 | % (c)(d) | | | 10/15/2035 | | | | 37,526 | |
2,959,929 | | Federal Home Loan Mortgage Corporation REMICS, Series 3116-Z | | | 5.50 | % | | | 02/15/2036 | | | | 3,036,985 | |
488,187 | | Federal Home Loan Mortgage Corporation REMICS, Series 3117-ZN | | | 4.50 | % | | | 02/15/2036 | | | | 468,723 | |
1,444,961 | | Federal Home Loan Mortgage Corporation REMICS, Series 3174-PZ | | | 5.00 | % | | | 01/15/2036 | | | | 1,469,566 | |
373,159 | | Federal Home Loan Mortgage Corporation REMICS, Series 3187-JZ | | | 5.00 | % | | | 07/15/2036 | | | | 379,712 | |
1,046,581 | | Federal Home Loan Mortgage Corporation REMICS, Series 3188-ZK | | | 5.00 | % | | | 07/15/2036 | | | | 1,054,529 | |
1,628,331 | | Federal Home Loan Mortgage Corporation REMICS, Series 3203-SE (-1 x 1 Month LIBOR USD + 6.50%, 6.50% Cap) | | | 1.82 | % (c)(d) | | | 08/15/2036 | | | | 127,694 | |
2,150,379 | | Federal Home Loan Mortgage Corporation REMICS, Series 3203-Z | | | 5.00 | % | | | 07/15/2036 | | | | 2,173,995 | |
3,407,291 | | Federal Home Loan Mortgage Corporation REMICS, Series 3203-ZC | | | 5.00 | % | | | 07/15/2036 | | | | 3,444,710 | |
2,208,263 | | Federal Home Loan Mortgage Corporation REMICS, Series 3261-SA (-1 x 1 Month LIBOR USD + 6.43%, 6.43% Cap) | | | 1.75 | % (c)(d) | | | 01/15/2037 | | | | 184,422 | |
2,039,300 | | Federal Home Loan Mortgage Corporation REMICS, Series 3275-SC (-1 x 1 Month LIBOR USD + 6.08%, 6.08% Cap) | | | 1.40 | % (c)(d) | | | 02/15/2037 | | | | 141,460 | |
409,934 | | Federal Home Loan Mortgage Corporation REMICS, Series 3315-HZ | | | 6.00 | % | | | 05/15/2037 | | | | 419,719 | |
1,573,117 | | Federal Home Loan Mortgage Corporation REMICS, Series 3326-GS (-1 x 1 Month LIBOR USD + 6.65%, 6.65% Cap) | | | 1.97 | % (c)(d) | | | 06/15/2037 | | | | 136,012 | |
365,978 | | Federal Home Loan Mortgage Corporation REMICS, Series 3351-ZC | | | 5.50 | % | | | 07/15/2037 | | | | 370,012 | |
4,707,195 | | Federal Home Loan Mortgage Corporation REMICS, Series 3355-BI (-1 x 1 Month LIBOR USD + 6.05%, 6.05% Cap) | | | 1.37 | % (c)(d) | | | 08/15/2037 | | | | 356,019 | |
197,402 | | Federal Home Loan Mortgage Corporation REMICS, Series 3369-Z | | | 6.00 | % | | | 09/15/2037 | | | | 203,831 | |
548,314 | | Federal Home Loan Mortgage Corporation REMICS, Series 3405-ZG | | | 5.50 | % | | | 01/15/2038 | | | | 553,533 | |
272,494 | | Federal Home Loan Mortgage Corporation REMICS, Series 3417-SI (-1 x 1 Month LIBOR USD + 6.18%, 6.18% Cap) | | | 1.50 | % (c)(d) | | | 02/15/2038 | | | | 18,352 | |
945,112 | | Federal Home Loan Mortgage Corporation REMICS, Series 3423-GS (-1 x 1 Month LIBOR USD + 5.65%, 5.65% Cap) | | | 0.97 | % (c)(d) | | | 03/15/2038 | | | | 55,023 | |
155,197 | | Federal Home Loan Mortgage Corporation REMICS, Series 3423-SG (-1 x 1 Month LIBOR USD + 5.65%, 5.65% Cap) | | | 0.97 | % (c)(d) | | | 03/15/2038 | | | | 8,715 | |
230,231 | | Federal Home Loan Mortgage Corporation REMICS, Series 3451-S (-1 x 1 Month LIBOR USD + 6.03%, 6.03% Cap) | | | 1.35 | % (c)(d) | | | 02/15/2037 | | | | 16,478 | |
239,854 | | Federal Home Loan Mortgage Corporation REMICS, Series 3455-SC (-1 x 1 Month LIBOR USD + 6.06%, 6.06% Cap) | | | 1.38 | % (c)(d) | | | 06/15/2038 | | | | 13,541 | |
69,989 | | Federal Home Loan Mortgage Corporation REMICS, Series 3473-SM (-1 x 1 Month LIBOR USD + 6.07%, 6.07% Cap) | | | 1.39 | % (c)(d) | | | 07/15/2038 | | | | 5,380 | |
1,668,196 | | Federal Home Loan Mortgage Corporation REMICS, Series 3484-SE (-1 x 1 Month LIBOR USD + 5.85%, 5.85% Cap) | | | 1.17 | % (c)(d) | | | 08/15/2038 | | | | 99,822 | |
2,382,641 | | Federal Home Loan Mortgage Corporation REMICS, Series 3519-SD (-1 x 1 Month LIBOR USD + 5.55%, 5.55% Cap) | | | 0.87 | % (c)(d) | | | 02/15/2038 | | | | 123,595 | |
748,075 | | Federal Home Loan Mortgage Corporation REMICS, Series 3524-LB | | | 3.33 | % (a)(c)(g) | | | 06/15/2038 | | | | 715,503 | |
57,233 | | Federal Home Loan Mortgage Corporation REMICS, Series 3530-GZ | | | 4.50 | % | | | 05/15/2039 | | | | 52,785 | |
2,249,338 | | Federal Home Loan Mortgage Corporation REMICS, Series 3541-EI (-1 x 1 Month LIBOR USD + 6.75%, 6.75% Cap) | | | 2.07 | % (c)(d) | | | 06/15/2039 | | | | 225,126 | |
141,890 | | Federal Home Loan Mortgage Corporation REMICS, Series 3545-SA (-1 x 1 Month LIBOR USD + 6.15%, 6.15% Cap) | | | 1.47 | % (c)(d) | | | 06/15/2039 | | | | 11,512 | |
59,026 | | Federal Home Loan Mortgage Corporation REMICS, Series 3549-SA (-1 x 1 Month LIBOR USD + 5.80%, 5.80% Cap) | | | 1.12 | % (c)(d) | | | 07/15/2039 | | | | 4,643 | |
2,754,122 | | Federal Home Loan Mortgage Corporation REMICS, Series 3577-LS (-1 x 1 Month LIBOR USD + 7.20%, 7.20% Cap) | | | 2.52 | % (c)(d) | | | 08/15/2035 | | | | 305,869 | |
816,854 | | Federal Home Loan Mortgage Corporation REMICS, Series 3582-SA (-1 x 1 Month LIBOR USD + 6.00%, 6.00% Cap) | | | 1.32 | % (c)(d) | | | 10/15/2049 | | | | 74,559 | |
865,512 | | Federal Home Loan Mortgage Corporation REMICS, Series 3583-GB | | | 4.50 | % | | | 10/15/2039 | | | | 857,163 | |
1,567,175 | | Federal Home Loan Mortgage Corporation REMICS, Series 3616-SG (-1 x 1 Month LIBOR USD + 6.35%, 6.35% Cap) | | | 1.67 | % (c)(d) | | | 03/15/2032 | | | | 89,709 | |
2,493,375 | | Federal Home Loan Mortgage Corporation REMICS, Series 3626-AZ | | | 5.50 | % | | | 08/15/2036 | | | | 2,572,347 | |
3,656,894 | | Federal Home Loan Mortgage Corporation REMICS, Series 3641-Z | | | 5.50 | % | | | 02/15/2036 | | | | 3,771,373 | |
3,293,184 | | Federal Home Loan Mortgage Corporation REMICS, Series 3654-ZB | | | 5.50 | % | | | 11/15/2037 | | | | 3,394,101 | |
8,042,407 | | Federal Home Loan Mortgage Corporation REMICS, Series 3666-VZ | | | 5.50 | % | | | 08/15/2036 | | | | 8,288,683 | |
403,821 | | Federal Home Loan Mortgage Corporation REMICS, Series 3667-SB (-1 x 1 Month LIBOR USD + 6.45%, 6.45% Cap) | | | 1.77 | % (c)(d) | | | 05/15/2040 | | | | 31,706 | |
3,041,376 | | Federal Home Loan Mortgage Corporation REMICS, Series 3702-SG (-1 x 1 Month LIBOR USD + 6.05%, 6.05% Cap) | | | 1.37 | % (c)(d) | | | 08/15/2032 | | | | 126,405 | |
1,387,319 | | Federal Home Loan Mortgage Corporation REMICS, Series 3704-EI | | | 5.00 | % (c) | | | 12/15/2036 | | | | 233,672 | |
1,456,817 | | Federal Home Loan Mortgage Corporation REMICS, Series 3712-SG (-5 x 1 Month LIBOR USD + 25.00%, 25.00% Cap) | | | 1.69 | % (d) | | | 08/15/2040 | | | | 1,455,473 | |
1,978,799 | | Federal Home Loan Mortgage Corporation REMICS, Series 3724-CM | | | 5.50 | % | | | 06/15/2037 | | | | 2,056,649 | |
6,336,477 | | Federal Home Loan Mortgage Corporation REMICS, Series 3726-SA (-1 x 1 Month LIBOR USD + 6.05%, 6.05% Cap) | | | 1.37 | % (c)(d) | | | 09/15/2040 | | | | 595,089 | |
186,682 | | Federal Home Loan Mortgage Corporation REMICS, Series 3741-SC (-2 x 1 Month LIBOR USD + 10.00%, 10.00% Cap) | | | 0.63 | % (d) | | | 10/15/2040 | | | | 156,840 | |
4,674,509 | | Federal Home Loan Mortgage Corporation REMICS, Series 3752-BS (-2 x 1 Month LIBOR USD + 10.00%, 10.00% Cap) | | | 0.68 | % (d) | | | 11/15/2040 | | | | 3,697,174 | |
14,154,951 | | Federal Home Loan Mortgage Corporation REMICS, Series 3768-ZX | | | 5.00 | % | | | 12/15/2040 | | | | 14,215,190 | |
1,984,230 | | Federal Home Loan Mortgage Corporation REMICS, Series 3771-AL | | | 4.00 | % | | | 12/15/2030 | | | | 1,957,395 | |
5,299,997 | | Federal Home Loan Mortgage Corporation REMICS, Series 3779-BY | | | 3.50 | % | | | 12/15/2030 | | | | 5,158,619 | |
13,813,391 | | Federal Home Loan Mortgage Corporation REMICS, Series 3779-DZ | | | 4.50 | % (e) | | | 12/15/2040 | | | | 13,898,156 | |
5,944,174 | | Federal Home Loan Mortgage Corporation REMICS, Series 3779-LB | | | 4.00 | % | | | 12/15/2030 | | | | 5,863,788 | |
1,433,943 | | Federal Home Loan Mortgage Corporation REMICS, Series 3779-YA | | | 3.50 | % | | | 12/15/2030 | | | | 1,395,692 | |
4,925,846 | | Federal Home Loan Mortgage Corporation REMICS, Series 3783-AC | | | 4.00 | % | | | 01/15/2031 | | | | 4,859,458 | |
2,984,617 | | Federal Home Loan Mortgage Corporation REMICS, Series 3786-SG (-2 x 1 Month LIBOR USD + 9.50%, 9.50% Cap) | | | 0.13 | % (d) | | | 01/15/2041 | | | | 2,199,154 | |
4,135,038 | | Federal Home Loan Mortgage Corporation REMICS, Series 3788-AY | | | 3.50 | % | | | 01/15/2031 | | | | 4,023,204 | |
482,493 | | Federal Home Loan Mortgage Corporation REMICS, Series 3790-Z | | | 4.00 | % | | | 01/15/2041 | | | | 462,566 | |
10,851,588 | | Federal Home Loan Mortgage Corporation REMICS, Series 3800-VZ | | | 4.50 | % | | | 02/15/2041 | | | | 10,789,169 | |
1,378,508 | | Federal Home Loan Mortgage Corporation REMICS, Series 3803-ZM | | | 4.00 | % | | | 02/15/2041 | | | | 1,327,448 | |
17,219,762 | | Federal Home Loan Mortgage Corporation REMICS, Series 3806-CZ | | | 5.50 | % | | | 07/15/2034 | | | | 17,649,278 | |
5,685,696 | | Federal Home Loan Mortgage Corporation REMICS, Series 3808-DB | | | 3.50 | % | | | 02/15/2031 | | | | 5,531,243 | |
4,806,672 | | Federal Home Loan Mortgage Corporation REMICS, Series 3812-EY | | | 3.50 | % | | | 02/15/2031 | | | | 4,676,159 | |
1,464,562 | | Federal Home Loan Mortgage Corporation REMICS, Series 3818-CZ | | | 4.50 | % | | | 03/15/2041 | | | | 1,467,834 | |
3,706,482 | | Federal Home Loan Mortgage Corporation REMICS, Series 3819-ZU | | | 5.50 | % | | | 07/15/2034 | | | | 3,799,878 | |
11,902,604 | | Federal Home Loan Mortgage Corporation REMICS, Series 3824-EY | | | 3.50 | % | | | 03/15/2031 | | | | 11,579,206 | |
3,350,433 | | Federal Home Loan Mortgage Corporation REMICS, Series 3828-SW (-3 x 1 Month LIBOR USD + 13.20%, 13.20% Cap) | | | 0.00 | % (d) | | | 02/15/2041 | | | | 2,588,454 | |
4,400,916 | | Federal Home Loan Mortgage Corporation REMICS, Series 3829-VZ | | | 4.00 | % | | | 03/15/2041 | | | | 4,198,866 | |
8,225,305 | | Federal Home Loan Mortgage Corporation REMICS, Series 3843-PZ | | | 5.00 | % | | | 04/15/2041 | | | | 8,466,877 | |
11,740,339 | | Federal Home Loan Mortgage Corporation REMICS, Series 3863-ZA | | | 5.50 | % | | | 08/15/2034 | | | | 12,037,524 | |
3,926,739 | | Federal Home Loan Mortgage Corporation REMICS, Series 3870-PB | | | 4.50 | % | | | 06/15/2041 | | | | 3,897,631 | |
17,987,625 | | Federal Home Loan Mortgage Corporation REMICS, Series 3871-LZ | | | 5.50 | % | | | 06/15/2041 | | | | 18,571,920 | |
5,404,926 | | Federal Home Loan Mortgage Corporation REMICS, Series 3872-BA | | | 4.00 | % | | | 06/15/2041 | | | | 5,328,828 | |
2,782,465 | | Federal Home Loan Mortgage Corporation REMICS, Series 3877-EY | | | 4.50 | % | | | 06/15/2041 | | | | 2,606,771 | |
908,895 | | Federal Home Loan Mortgage Corporation REMICS, Series 3877-GY | | | 4.50 | % | | | 06/15/2041 | | | | 840,453 | |
7,834,341 | | Federal Home Loan Mortgage Corporation REMICS, Series 3877-ZU | | | 4.50 | % | | | 06/15/2041 | | | | 7,794,105 | |
2,405,083 | | Federal Home Loan Mortgage Corporation REMICS, Series 3900-SB (-1 x 1 Month LIBOR USD + 5.97%, 5.97% Cap) | | | 1.29 | % (c)(d) | | | 07/15/2041 | | | | 185,398 | |
10,016,197 | | Federal Home Loan Mortgage Corporation REMICS, Series 3901-VZ | | | 4.00 | % | | | 07/15/2041 | | | | 9,577,066 | |
16,774,047 | | Federal Home Loan Mortgage Corporation REMICS, Series 3910-GZ | | | 5.00 | % | | | 08/15/2041 | | | | 17,255,499 | |
2,384,230 | | Federal Home Loan Mortgage Corporation REMICS, Series 3910-ZE | | | 5.00 | % | | | 10/15/2034 | | | | 2,398,316 | |
3,465,899 | | Federal Home Loan Mortgage Corporation REMICS, Series 3919-KL | | | 4.50 | % | | | 09/15/2041 | | | | 3,444,018 | |
11,737,289 | | Federal Home Loan Mortgage Corporation REMICS, Series 3919-ZJ | | | 4.00 | % | | | 09/15/2041 | | | | 11,557,690 | |
596,196 | | Federal Home Loan Mortgage Corporation REMICS, Series 3942-JZ | | | 4.00 | % | | | 10/15/2041 | | | | 571,234 | |
3,694,427 | | Federal Home Loan Mortgage Corporation REMICS, Series 3944-AZ | | | 4.00 | % | | | 10/15/2041 | | | | 3,539,509 | |
1,454,946 | | Federal Home Loan Mortgage Corporation REMICS, Series 3946-SM (-3 x 1 Month LIBOR USD + 14.70%, 14.70% Cap) | | | 0.65 | % (d) | | | 10/15/2041 | | | | 1,249,570 | |
10,624,183 | | Federal Home Loan Mortgage Corporation REMICS, Series 3969-AB | | | 4.00 | % | | | 10/15/2033 | | | | 10,368,092 | |
1,977,029 | | Federal Home Loan Mortgage Corporation REMICS, Series 3982-AZ | | | 3.50 | % | | | 01/15/2042 | | | | 1,802,056 | |
46,028,188 | | Federal Home Loan Mortgage Corporation REMICS, Series 3990-ZA | | | 3.50 | % | | | 01/15/2042 | | | | 43,213,352 | |
2,822,886 | | Federal Home Loan Mortgage Corporation REMICS, Series 3999-EZ | | | 4.00 | % | | | 02/15/2042 | | | | 2,703,395 | |
19,683,890 | | Federal Home Loan Mortgage Corporation REMICS, Series 3999-ZB | | | 4.00 | % | | | 02/15/2042 | | | | 18,823,808 | |
33,664,791 | | Federal Home Loan Mortgage Corporation REMICS, Series 4016-KZ | | | 4.00 | % | | | 03/15/2042 | | | | 32,796,317 | |
17,995 | | Federal Home Loan Mortgage Corporation REMICS, Series 4050-BC | | | 2.00 | % | | | 05/15/2041 | | | | 17,956 | |
489,258 | | Federal Home Loan Mortgage Corporation REMICS, Series 4050-ND | | | 2.50 | % | | | 09/15/2041 | | | | 474,277 | |
66,436,971 | | Federal Home Loan Mortgage Corporation REMICS, Series 4084-TZ | | | 4.00 | % | | | 07/15/2042 | | | | 63,497,195 | |
45,045,290 | | Federal Home Loan Mortgage Corporation REMICS, Series 4097-ZA | | | 3.50 | % | | | 08/15/2042 | | | | 42,492,542 | |
46,824,925 | | Federal Home Loan Mortgage Corporation REMICS, Series 4109-GE | | | 4.50 | % | | | 10/15/2041 | | | | 47,057,378 | |
13,472,139 | | Federal Home Loan Mortgage Corporation REMICS, Series 4116-AP | | | 1.35 | % | | | 08/15/2042 | | | | 11,715,433 | |
3,802,170 | | Federal Home Loan Mortgage Corporation REMICS, Series 4121-AV | | | 3.00 | % | | | 12/15/2035 | | | | 3,642,147 | |
16,538,386 | | Federal Home Loan Mortgage Corporation REMICS, Series 4160-HP | | | 2.50 | % | | | 01/15/2033 | | | | 15,618,218 | |
17,348,709 | | Federal Home Loan Mortgage Corporation REMICS, Series 4162-ZJ | | | 3.00 | % | | | 02/15/2033 | | | | 16,256,603 | |
49,569,126 | | Federal Home Loan Mortgage Corporation REMICS, Series 4174-Z | | | 3.50 | % (e) | | | 03/15/2043 | | | | 47,358,363 | |
75,277,041 | | Federal Home Loan Mortgage Corporation REMICS, Series 4179-AZ | | | 4.00 | % | | | 01/15/2041 | | | | 72,797,159 | |
9,433,238 | | Federal Home Loan Mortgage Corporation REMICS, Series 4183-ZB | | | 3.00 | % (e) | | | 03/15/2043 | | | | 7,635,978 | |
3,359,987 | | Federal Home Loan Mortgage Corporation REMICS, Series 4186-ZJ | | | 3.00 | % (e) | | | 03/15/2033 | | | | 3,069,219 | |
9,565,847 | | Federal Home Loan Mortgage Corporation REMICS, Series 4189-ML | | | 3.00 | % | | | 04/15/2038 | | | | 8,924,131 | |
40,143,373 | | Federal Home Loan Mortgage Corporation REMICS, Series 4212-US (-1 x 1 Month LIBOR USD + 5.40%, 5.40% Cap) | | | 0.00 | % (d) | | | 06/15/2043 | | | | 28,863,090 | |
19,309,604 | | Federal Home Loan Mortgage Corporation REMICS, Series 4223-US (-1 x 1 Month LIBOR USD + 5.43%, 5.43% Cap) | | | 0.00 | % (d) | | | 07/15/2043 | | | | 14,219,921 | |
24,689,417 | | Federal Home Loan Mortgage Corporation REMICS, Series 4223-ZV | | | 4.00 | % | | | 07/15/2043 | | | | 24,292,589 | |
5,572,998 | | Federal Home Loan Mortgage Corporation REMICS, Series 4229-TZ | | | 3.00 | % | | | 06/15/2043 | | | | 5,140,225 | |
30,681,549 | | Federal Home Loan Mortgage Corporation REMICS, Series 4229-ZA | | | 4.00 | % | | | 07/15/2043 | | | | 30,086,747 | |
8,852,526 | | Federal Home Loan Mortgage Corporation REMICS, Series 4249-CS (-1 x 1 Month LIBOR USD + 4.65%, 4.65% Cap) | | | 1.15 | % (d) | | | 09/15/2043 | | | | 6,745,282 | |
22,093,818 | | Federal Home Loan Mortgage Corporation REMICS, Series 4250-BZ | | | 3.00 | % | | | 09/15/2033 | | | | 20,766,614 | |
9,846,357 | | Federal Home Loan Mortgage Corporation REMICS, Series 4267-BZ | | | 4.00 | % | | | 10/15/2040 | | | | 9,629,599 | |
24,525,869 | | Federal Home Loan Mortgage Corporation REMICS, Series 4283-ZL | | | 3.00 | % | | | 08/15/2033 | | | | 23,302,322 | |
20,108,510 | | Federal Home Loan Mortgage Corporation REMICS, Series 4355-ZX | | | 4.00 | % | | | 05/15/2044 | | | | 19,636,121 | |
17,459,228 | | Federal Home Loan Mortgage Corporation REMICS, Series 4376-GZ | | | 3.00 | % (e) | | | 08/15/2044 | | | | 15,603,324 | |
55,507,108 | | Federal Home Loan Mortgage Corporation REMICS, Series 4377-LZ | | | 3.00 | % (e) | | | 08/15/2044 | | | | 49,767,284 | |
1,680,342 | | Federal Home Loan Mortgage Corporation REMICS, Series 4379-KA | | | 3.00 | % | | | 08/15/2044 | | | | 1,582,571 | |
167,963 | | Federal Home Loan Mortgage Corporation REMICS, Series 4384-A | | | 3.00 | % | | | 12/15/2040 | | | | 167,474 | |
30,341,106 | | Federal Home Loan Mortgage Corporation REMICS, Series 4384-ZY | | | 3.00 | % (e) | | | 09/15/2044 | | | | 27,297,056 | |
153,774,084 | | Federal Home Loan Mortgage Corporation REMICS, Series 4390-NZ | | | 3.00 | % (e) | | | 09/15/2044 | | | | 137,882,932 | |
13,018,248 | | Federal Home Loan Mortgage Corporation REMICS, Series 4408-PB | | | 3.00 | % | | | 04/15/2044 | | | | 12,347,832 | |
16,987,040 | | Federal Home Loan Mortgage Corporation REMICS, Series 4427-CE | | | 3.00 | % | | | 02/15/2034 | | | | 16,459,472 | |
7,678,281 | | Federal Home Loan Mortgage Corporation REMICS, Series 4427-PS (-1 x 1 Month LIBOR USD + 5.60%, 5.60% Cap) | | | 0.92 | % (c)(d) | | | 07/15/2044 | | | | 406,173 | |
7,676,713 | | Federal Home Loan Mortgage Corporation REMICS, Series 4429-HA | | | 3.00 | % | | | 04/15/2034 | | | | 7,415,540 | |
29,303,050 | | Federal Home Loan Mortgage Corporation REMICS, Series 4434-LZ | | | 3.00 | % (e) | | | 02/15/2045 | | | | 25,535,765 | |
1,142,828 | | Federal Home Loan Mortgage Corporation REMICS, Series 4438-B | | | 3.00 | % | | | 10/15/2043 | | | | 1,093,016 | |
10,956,793 | | Federal Home Loan Mortgage Corporation REMICS, Series 4441-VZ | | | 3.00 | % (e) | | | 02/15/2045 | | | | 9,505,167 | |
529,620 | | Federal Home Loan Mortgage Corporation REMICS, Series 4444-CH | | | 3.00 | % | | | 01/15/2041 | | | | 527,817 | |
31,851,141 | | Federal Home Loan Mortgage Corporation REMICS, Series 4444-CZ | | | 3.00 | % (e) | | | 02/15/2045 | | | | 27,945,494 | |
22,871,748 | | Federal Home Loan Mortgage Corporation REMICS, Series 4447-YZ | | | 4.00 | % | | | 08/15/2043 | | | | 22,271,728 | |
42,362,438 | | Federal Home Loan Mortgage Corporation REMICS, Series 4463-ZC | | | 3.00 | % | | | 04/15/2045 | | | | 38,912,437 | |
31,692,481 | | Federal Home Loan Mortgage Corporation REMICS, Series 4467-ZA | | | 3.00 | % (e) | | | 04/15/2045 | | | | 28,833,701 | |
15,378,406 | | Federal Home Loan Mortgage Corporation REMICS, Series 4471-BA | | | 3.00 | % | | | 12/15/2041 | | | | 14,934,828 | |
13,372,375 | | Federal Home Loan Mortgage Corporation REMICS, Series 4471-BC | | | 3.00 | % | | | 12/15/2041 | | | | 12,986,660 | |
41,095,766 | | Federal Home Loan Mortgage Corporation REMICS, Series 4471-GA | | | 3.00 | % | | | 02/15/2044 | | | | 38,675,386 | |
56,265,051 | | Federal Home Loan Mortgage Corporation REMICS, Series 4483-CA | | | 3.00 | % | | | 06/15/2044 | | | | 53,531,408 | |
28,822,681 | | Federal Home Loan Mortgage Corporation REMICS, Series 4483-PA | | | 2.50 | % | | | 06/15/2045 | | | | 27,049,138 | |
8,097,784 | | Federal Home Loan Mortgage Corporation REMICS, Series 4492-GZ | | | 3.50 | % | | | 07/15/2045 | | | | 7,486,397 | |
796,499 | | Federal Home Loan Mortgage Corporation REMICS, Series 4498-PD | | | 2.50 | % | | | 08/15/2042 | | | | 784,878 | |
6,238,728 | | Federal Home Loan Mortgage Corporation REMICS, Series 4500-GO | | | 0.00 | % (g) | | | 08/15/2045 | | | | 4,878,930 | |
11,062,097 | | Federal Home Loan Mortgage Corporation REMICS, Series 4504-CA | | | 3.00 | % | | | 04/15/2044 | | | | 10,577,807 | |
19,469,692 | | Federal Home Loan Mortgage Corporation REMICS, Series 4527-GA | | | 3.00 | % | | | 02/15/2044 | | | | 18,491,856 | |
40,124,103 | | Federal Home Loan Mortgage Corporation REMICS, Series 4533-AB | | | 3.00 | % | | | 06/15/2044 | | | | 38,164,590 | |
36,483,939 | | Federal Home Loan Mortgage Corporation REMICS, Series 4543-HG | | | 2.70 | % | | | 04/15/2044 | | | | 34,487,311 | |
56,463,748 | | Federal Home Loan Mortgage Corporation REMICS, Series 4573-CA | | | 3.00 | % | | | 11/15/2044 | | | | 53,682,174 | |
11,532,014 | | Federal Home Loan Mortgage Corporation REMICS, Series 4573-DA | | | 3.00 | % | | | 03/15/2045 | | | | 10,994,534 | |
11,904,221 | | Federal Home Loan Mortgage Corporation REMICS, Series 4588-DA | | | 3.00 | % | | | 02/15/2044 | | | | 11,418,745 | |
7,318,562 | | Federal Home Loan Mortgage Corporation REMICS, Series 4629-KA | | | 3.00 | % | | | 03/15/2045 | | | | 7,054,396 | |
37,323,718 | | Federal Home Loan Mortgage Corporation REMICS, Series 4636-DZ | | | 3.50 | % (e) | | | 12/15/2046 | | | | 34,885,520 | |
27,053,716 | | Federal Home Loan Mortgage Corporation REMICS, Series 4679-VZ | | | 3.50 | % (e) | | | 02/15/2047 | | | | 25,243,184 | |
6,329,549 | | Federal Home Loan Mortgage Corporation REMICS, Series 4744-KA | | | 3.00 | % | | | 08/15/2046 | | | | 6,001,311 | |
21,534,000 | | Federal Home Loan Mortgage Corporation REMICS, Series 4759-NL | | | 3.00 | % | | | 02/15/2048 | | | | 18,710,791 | |
5,774,909 | | Federal Home Loan Mortgage Corporation REMICS, Series 4791-IO | | | 3.00 | % (c) | | | 05/15/2048 | | | | 887,625 | |
31,317,933 | | Federal Home Loan Mortgage Corporation REMICS, Series 4791-JT | | | 3.00 | % | | | 05/15/2048 | | | | 27,904,642 | |
4,750,003 | | Federal Home Loan Mortgage Corporation REMICS, Series 4791-LI | | | 3.00 | % (c) | | | 05/15/2048 | | | | 585,319 | |
4,750,003 | | Federal Home Loan Mortgage Corporation REMICS, Series 4791-LO | | | 0.00 | % (g) | | | 05/15/2048 | | | | 3,768,302 | |
18,628,738 | | Federal Home Loan Mortgage Corporation REMICS, Series 4791-PO | | | 0.00 | % (g) | | | 05/15/2048 | | | | 14,632,527 | |
13,323,724 | | Federal Home Loan Mortgage Corporation REMICS, Series 4792-A | | | 3.00 | % | | | 05/15/2048 | | | | 11,871,216 | |
8,181,251 | | Federal Home Loan Mortgage Corporation REMICS, Series 4793-C | | | 3.00 | % | | | 06/15/2048 | | | | 7,567,494 | |
7,991,746 | | Federal Home Loan Mortgage Corporation REMICS, Series 4795-AO | | | 0.00 | % (g) | | | 05/15/2048 | | | | 6,141,028 | |
6,413,469 | | Federal Home Loan Mortgage Corporation REMICS, Series 4801-OG | | | 0.00 | % (g) | | | 06/15/2048 | | | | 4,962,316 | |
12,514,124 | | Federal Home Loan Mortgage Corporation REMICS, Series 4901-BD | | | 3.00 | % | | | 07/25/2049 | | | | 11,759,005 | |
25,905,961 | | Federal Home Loan Mortgage Corporation REMICS, Series 4924-ST (-1 x 1 Month LIBOR USD + 6.00%, 6.00% Cap) | | | 1.15 | % (c)(d) | | | 08/25/2048 | | | | 2,467,978 | |
12,651,219 | | Federal Home Loan Mortgage Corporation REMICS, Series 5004-LS (-1 x 1 Month LIBOR USD + 6.15%, 6.15% Cap) | | | 1.30 | % (c)(d) | | | 07/25/2050 | | | | 1,755,452 | |
13,479,952 | | Federal Home Loan Mortgage Corporation REMICS, Series 5023-YI | | | 3.00 | % (c) | | | 10/25/2050 | | | | 2,130,256 | |
6,454,176 | | Federal Home Loan Mortgage Corporation REMICS, Series 5062-PA | | | 1.25 | % | | | 01/25/2051 | | | | 5,024,160 | |
13,388,459 | | Federal Home Loan Mortgage Corporation REMICS, Series 5081-MI | | | 2.50 | % (c) | | | 03/25/2051 | | | | 1,848,437 | |
53,760,055 | | Federal Home Loan Mortgage Corporation REMICS, Series 5105-NH | | | 2.00 | % | | | 02/25/2037 | | | | 48,140,119 | |
8,644,370 | | Federal Home Loan Mortgage Corporation REMICS, Series 5112-SC (-1 x Secured Overnight Financing Rate 30 Day Average + 2.50%, 2.50% Cap) | | | 0.00 | % (c)(d) | | | 06/25/2051 | | | | 185,296 | |
20,716,675 | | Federal Home Loan Mortgage Corporation REMICS, Series 5117-D | | | 2.00 | % | | | 06/25/2051 | | | | 18,455,508 | |
43,718,502 | | Federal Home Loan Mortgage Corporation REMICS, Series 5126-AH | | | 2.00 | % | | | 02/25/2037 | | | | 39,148,283 | |
72,358,994 | | Federal Home Loan Mortgage Corporation REMICS, Series 5130-IO | | | 3.50 | % (c) | | | 08/25/2051 | | | | 14,167,153 | |
12,921,195 | | Federal Home Loan Mortgage Corporation REMICS, Series 5140-B | | | 2.00 | % | | | 05/25/2040 | | | | 11,275,916 | |
27,399,441 | | Federal Home Loan Mortgage Corporation REMICS, Series 5145-SB (-1 x Secured Overnight Financing Rate 30 Day Average + 2.60%, 2.60% Cap) | | | 0.00 | % (c)(d) | | | 09/25/2051 | | | | 482,973 | |
50,056,691 | | Federal Home Loan Mortgage Corporation REMICS, Series 5157-EI | | | 3.00 | % (c) | | | 10/25/2051 | | | | 6,840,993 | |
12,051,003 | | Federal Home Loan Mortgage Corporation REMICS, Series 5159-CD | | | 1.50 | % | | | 07/25/2041 | | | | 10,398,513 | |
45,116,496 | | Federal Home Loan Mortgage Corporation REMICS, Series 5160-S (-1 x Secured Overnight Financing Rate 30 Day Average + 3.74%, 3.74% Cap) | | | 0.00 | % (c)(d) | | | 08/25/2050 | | | | 1,797,698 | |
25,846,482 | | Federal Home Loan Mortgage Corporation REMICS, Series 5175-CZ | | | 2.50 | % (e) | | | 09/25/2051 | | | | 15,322,223 | |
24,995,976 | | Federal Home Loan Mortgage Corporation REMICS, Series R003-ZA | | | 5.50 | % | | | 10/15/2035 | | | | 25,758,581 | |
74,046,028 | | Federal Home Loan Mortgage Corporation, Pool Z40206 | | | 3.50 | % | | | 02/01/2047 | | | | 70,055,834 | |
9,138,047 | | Federal Home Loan Mortgage Corporation, Series 2015-SC02-1A | | | 3.00 | % | | | 09/25/2045 | | | | 8,145,905 | |
4,877,914 | | Federal Home Loan Mortgage Corporation, Series 2016-SC01-1A | | | 3.00 | % | | | 07/25/2046 | | | | 4,329,191 | |
1,408,789 | | Federal Home Loan Mortgage Corporation, Series 2021-MN1-M1 (Secured Overnight Financing Rate 30 Day Average + 2.00%) | | | 6.48 | % (h) | | | 01/25/2051 | | | | 1,324,902 | |
1,250,000 | | Federal Home Loan Mortgage Corporation, Series 2021-MN1-M2 (Secured Overnight Financing Rate 30 Day Average + 3.75%) | | | 8.23 | % (h) | | | 01/25/2051 | | | | 1,091,812 | |
12,474,029 | | Federal Home Loan Mortgage Corporation, Series 267-30 | | | 3.00 | % | | | 08/15/2042 | | | | 11,540,961 | |
8,902,687 | | Federal Home Loan Mortgage Corporation, Series 274-30 | | | 3.00 | % | | | 08/15/2042 | | | | 8,421,631 | |
35,833,707 | | Federal Home Loan Mortgage Corporation, Series 280-30 | | | 3.00 | % | | | 09/15/2042 | | | | 33,727,090 | |
6,273,216 | | Federal Home Loan Mortgage Corporation, Series 284-300 | | | 3.00 | % | | | 10/15/2042 | | | | 5,843,769 | |
5,536,187 | | Federal Home Loan Mortgage Corporation, Series 326-300 | | | 3.00 | % | | | 03/15/2044 | | | | 5,120,495 | |
38,140,341 | | Federal Home Loan Mortgage Corporation, Series 357-200 | | | 2.00 | % | | | 09/15/2047 | | | | 33,862,699 | |
12,698,870 | | Federal Home Loan Mortgage Corporation, Series 358-300 | | | 3.00 | % | | | 10/15/2047 | | | | 11,818,873 | |
28,450,153 | | Federal Home Loan Mortgage Corporation, Series 4857-J | | | 3.40 | % | | | 01/15/2049 | | | | 27,172,221 | |
43,074,423 | | Federal Home Loan Mortgage Corporation, Series 5007-IP | | | 3.00 | % (c) | | | 07/25/2050 | | | | 6,994,955 | |
28,215,529 | | Federal Home Loan Mortgage Corporation, Series 5059-ID | | | 3.00 | % (c) | | | 01/25/2051 | | | | 4,276,346 | |
34,143,557 | | Federal Home Loan Mortgage Corporation, Series 5077-CI | | | 3.50 | % (c) | | | 02/25/2051 | | | | 6,245,799 | |
18,221,518 | | Federal Home Loan Mortgage Corporation, Series 5160-ZY | | | 3.00 | % (e) | | | 10/25/2050 | | | | 13,477,850 | |
33,532,999 | | Federal Home Loan Mortgage Corporation, Series 5171-GI | | | 3.00 | % (c) | | | 12/25/2051 | | | | 5,427,447 | |
29,327,579 | | Federal Home Loan Mortgage Corporation, Series 5181-IL | | | 3.00 | % (c) | | | 01/25/2052 | | | | 4,764,025 | |
68,678,214 | | Federal Home Loan Mortgage Corporation, Series 5209-IO | | | 3.00 | % (c) | | | 10/25/2051 | | | | 10,989,050 | |
82,158,182 | | Federal Home Loan Mortgage Corporation, Series 5279-IO | | | 3.00 | % (c) | | | 03/25/2051 | | | | 13,224,345 | |
20,865,033 | | Federal Home Loan Mortgage Corporation, Series 5299-ZA | | | 3.00 | % (e) | | | 03/25/2052 | | | | 15,950,879 | |
23,235,899 | | Federal National Mortgage Association Pass-Thru, Pool BM7154 | | | 0.00 | % (f) | | | 03/01/2053 | | | | 22,852,564 | |
3,260,000 | | Federal National Mortgage Association Pass-Thru, Pool BS7503 | | | 4.87 | % | | | 04/01/2031 | | | | 3,359,384 | |
3,508,880 | | Federal National Mortgage Association Pass-Thru, Pool 555743 | | | 5.00 | % | | | 09/01/2033 | | | | 3,586,608 | |
2,545,112 | | Federal National Mortgage Association Pass-Thru, Pool 735382 | | | 5.00 | % | | | 04/01/2035 | | | | 2,601,564 | |
4,281,414 | | Federal National Mortgage Association Pass-Thru, Pool 735402 | | | 5.00 | % | | | 04/01/2035 | | | | 4,376,378 | |
2,853,866 | | Federal National Mortgage Association Pass-Thru, Pool 735484 | | | 5.00 | % | | | 05/01/2035 | | | | 2,917,175 | |
1,200,369 | | Federal National Mortgage Association Pass-Thru, Pool 735667 | | | 5.00 | % | | | 07/01/2035 | | | | 1,226,977 | |
968,897 | | Federal National Mortgage Association Pass-Thru, Pool 735893 | | | 5.00 | % | | | 10/01/2035 | | | | 990,410 | |
2,365,337 | | Federal National Mortgage Association Pass-Thru, Pool 745275 | | | 5.00 | % | | | 02/01/2036 | | | | 2,417,876 | |
102,591 | | Federal National Mortgage Association Pass-Thru, Pool 888695 | | | 5.00 | % | | | 08/01/2037 | | | | 104,870 | |
591,208 | | Federal National Mortgage Association Pass-Thru, Pool 888968 | | | 5.00 | % | | | 08/01/2035 | | | | 601,483 | |
4,720,807 | | Federal National Mortgage Association Pass-Thru, Pool 890549 | | | 4.00 | % | | | 11/01/2043 | | | | 4,648,212 | |
5,505,562 | | Federal National Mortgage Association Pass-Thru, Pool 890565 | | | 3.00 | % | | | 11/01/2043 | | | | 5,083,634 | |
323,852 | | Federal National Mortgage Association Pass-Thru, Pool 931104 | | | 5.00 | % | | | 05/01/2039 | | | | 329,422 | |
69,377 | | Federal National Mortgage Association Pass-Thru, Pool 975116 | | | 5.00 | % | | | 05/01/2038 | | | | 70,921 | |
941,501 | | Federal National Mortgage Association Pass-Thru, Pool 986864 | | | 6.50 | % | | | 08/01/2038 | | | | 1,009,252 | |
580,929 | | Federal National Mortgage Association Pass-Thru, Pool 987316 | | | 6.50 | % | | | 09/01/2038 | | | | 611,405 | |
4,722,280 | | Federal National Mortgage Association Pass-Thru, Pool 995203 | | | 5.00 | % | | | 07/01/2035 | | | | 4,799,509 | |
7,912,070 | | Federal National Mortgage Association Pass-Thru, Pool 995849 | | | 5.00 | % | | | 08/01/2036 | | | | 8,087,495 | |
6,412,288 | | Federal National Mortgage Association Pass-Thru, Pool AB2123 | | | 4.00 | % | | | 01/01/2031 | | | | 6,266,598 | |
134,733 | | Federal National Mortgage Association Pass-Thru, Pool AB2370 | | | 4.50 | % | | | 09/01/2035 | | | | 130,586 | |
450,591 | | Federal National Mortgage Association Pass-Thru, Pool AB3713 | | | 4.00 | % | | | 10/01/2031 | | | | 440,358 | |
3,331,630 | | Federal National Mortgage Association Pass-Thru, Pool AB3796 | | | 3.50 | % | | | 11/01/2031 | | | | 3,280,792 | |
718,969 | | Federal National Mortgage Association Pass-Thru, Pool AB3850 | | | 4.00 | % | | | 11/01/2041 | | | | 677,883 | |
547,936 | | Federal National Mortgage Association Pass-Thru, Pool AB3923 | | | 4.00 | % | | | 11/01/2041 | | | | 515,938 | |
12,180,978 | | Federal National Mortgage Association Pass-Thru, Pool AB4167 | | | 3.50 | % | | | 01/01/2032 | | | | 11,995,040 | |
10,174,644 | | Federal National Mortgage Association Pass-Thru, Pool AB4261 | | | 3.50 | % | | | 01/01/2032 | | | | 10,019,331 | |
1,618,135 | | Federal National Mortgage Association Pass-Thru, Pool AB5084 | | | 3.50 | % | | | 05/01/2032 | | | | 1,593,435 | |
4,459,685 | | Federal National Mortgage Association Pass-Thru, Pool AB5156 | | | 3.50 | % | | | 05/01/2032 | | | | 4,391,631 | |
6,457,972 | | Federal National Mortgage Association Pass-Thru, Pool AB5212 | | | 3.50 | % | | | 05/01/2032 | | | | 6,359,395 | |
4,120,794 | | Federal National Mortgage Association Pass-Thru, Pool AB5243 | | | 4.00 | % | | | 05/01/2042 | | | | 3,885,236 | |
8,661,356 | | Federal National Mortgage Association Pass-Thru, Pool AB5911 | | | 3.00 | % | | | 08/01/2032 | | | | 8,171,117 | |
3,197,222 | | Federal National Mortgage Association Pass-Thru, Pool AB6280 | | | 3.00 | % | | | 09/01/2042 | | | | 2,953,526 | |
4,358,866 | | Federal National Mortgage Association Pass-Thru, Pool AB6349 | | | 3.00 | % | | | 10/01/2032 | | | | 4,112,222 | |
12,326,734 | | Federal National Mortgage Association Pass-Thru, Pool AB6750 | | | 3.00 | % | | | 10/01/2032 | | | | 11,628,653 | |
6,517,531 | | Federal National Mortgage Association Pass-Thru, Pool AB6751 | | | 3.00 | % | | | 10/01/2032 | | | | 6,148,599 | |
33,847,888 | | Federal National Mortgage Association Pass-Thru, Pool AB6854 | | | 3.00 | % | | | 11/01/2042 | | | | 31,252,127 | |
25,827,503 | | Federal National Mortgage Association Pass-Thru, Pool AB7077 | | | 3.00 | % | | | 11/01/2042 | | | | 23,846,751 | |
19,971,546 | | Federal National Mortgage Association Pass-Thru, Pool AB7344 | | | 3.00 | % | | | 12/01/2032 | | | | 18,840,526 | |
10,922,893 | | Federal National Mortgage Association Pass-Thru, Pool AB7776 | | | 3.00 | % | | | 02/01/2043 | | | | 10,090,224 | |
12,461,032 | | Federal National Mortgage Association Pass-Thru, Pool AB7877 | | | 3.00 | % | | | 02/01/2043 | | | | 11,511,108 | |
5,799,023 | | Federal National Mortgage Association Pass-Thru, Pool AB8418 | | | 3.00 | % | | | 02/01/2033 | | | | 5,470,503 | |
8,780,476 | | Federal National Mortgage Association Pass-Thru, Pool AB8520 | | | 3.00 | % | | | 02/01/2033 | | | | 8,282,988 | |
10,545,683 | | Federal National Mortgage Association Pass-Thru, Pool AB8703 | | | 3.00 | % | | | 03/01/2038 | | | | 9,685,914 | |
4,542,195 | | Federal National Mortgage Association Pass-Thru, Pool AB8858 | | | 3.00 | % | | | 04/01/2033 | | | | 4,285,093 | |
8,970,844 | | Federal National Mortgage Association Pass-Thru, Pool AB9020 | | | 3.00 | % | | | 04/01/2038 | | | | 8,239,878 | |
7,142,466 | | Federal National Mortgage Association Pass-Thru, Pool AB9197 | | | 3.00 | % | | | 05/01/2033 | | | | 6,737,871 | |
22,306,249 | | Federal National Mortgage Association Pass-Thru, Pool AB9406 | | | 3.00 | % | | | 05/01/2033 | | | | 21,042,243 | |
4,204,889 | | Federal National Mortgage Association Pass-Thru, Pool AB9409 | | | 3.00 | % | | | 05/01/2033 | | | | 3,966,778 | |
193,465 | | Federal National Mortgage Association Pass-Thru, Pool AD2177 | | | 4.50 | % | | | 06/01/2030 | | | | 192,032 | |
334,248 | | Federal National Mortgage Association Pass-Thru, Pool AD6438 | | | 5.00 | % | | | 06/01/2040 | | | | 340,891 | |
213,533 | | Federal National Mortgage Association Pass-Thru, Pool AD7859 | | | 5.00 | % | | | 06/01/2040 | | | | 218,282 | |
2,697,460 | | Federal National Mortgage Association Pass-Thru, Pool AH0607 | | | 4.00 | % | | | 12/01/2040 | | | | 2,642,501 | |
137,137 | | Federal National Mortgage Association Pass-Thru, Pool AH1140 | | | 4.50 | % | | | 12/01/2040 | | | | 133,740 | |
1,852,407 | | Federal National Mortgage Association Pass-Thru, Pool AH4437 | | | 4.00 | % | | | 01/01/2041 | | | | 1,746,562 | |
716,295 | | Federal National Mortgage Association Pass-Thru, Pool AH7309 | | | 4.00 | % | | | 02/01/2031 | | | | 700,034 | |
1,198,955 | | Federal National Mortgage Association Pass-Thru, Pool AH9323 | | | 4.00 | % | | | 04/01/2026 | | | | 1,192,700 | |
490,433 | | Federal National Mortgage Association Pass-Thru, Pool AI9831 | | | 4.00 | % | | | 09/01/2041 | | | | 465,702 | |
802,987 | | Federal National Mortgage Association Pass-Thru, Pool AJ1265 | | | 4.00 | % | | | 09/01/2041 | | | | 769,006 | |
55,160 | | Federal National Mortgage Association Pass-Thru, Pool AJ1399 | | | 4.00 | % | | | 09/01/2041 | | | | 52,005 | |
1,547,662 | | Federal National Mortgage Association Pass-Thru, Pool AJ1467 | | | 4.00 | % | | | 10/01/2041 | | | | 1,459,220 | |
2,098,193 | | Federal National Mortgage Association Pass-Thru, Pool AJ3392 | | | 4.00 | % | | | 10/01/2041 | | | | 1,995,507 | |
1,106,195 | | Federal National Mortgage Association Pass-Thru, Pool AJ3854 | | | 4.00 | % | | | 10/01/2041 | | | | 1,042,966 | |
5,163,386 | | Federal National Mortgage Association Pass-Thru, Pool AJ4118 | | | 4.00 | % | | | 11/01/2041 | | | | 4,868,342 | |
1,333,524 | | Federal National Mortgage Association Pass-Thru, Pool AJ4131 | | | 4.00 | % | | | 10/01/2041 | | | | 1,257,309 | |
533,400 | | Federal National Mortgage Association Pass-Thru, Pool AJ5172 | | | 4.00 | % | | | 11/01/2041 | | | | 506,423 | |
7,950,645 | | Federal National Mortgage Association Pass-Thru, Pool AJ5322 | | | 4.00 | % | | | 11/01/2041 | | | | 7,788,594 | |
2,858,031 | | Federal National Mortgage Association Pass-Thru, Pool AJ7677 | | | 3.50 | % | | | 12/01/2041 | | | | 2,645,495 | |
1,004,707 | | Federal National Mortgage Association Pass-Thru, Pool AJ8334 | | | 4.00 | % | | | 12/01/2041 | | | | 947,225 | |
9,622,448 | | Federal National Mortgage Association Pass-Thru, Pool AK0713 | | | 3.50 | % | | | 01/01/2032 | | | | 9,475,637 | |
1,458,603 | | Federal National Mortgage Association Pass-Thru, Pool AK4039 | | | 4.00 | % | | | 02/01/2042 | | | | 1,375,219 | |
2,870,493 | | Federal National Mortgage Association Pass-Thru, Pool AK4763 | | | 4.00 | % | | | 02/01/2042 | | | | 2,706,507 | |
1,138,722 | | Federal National Mortgage Association Pass-Thru, Pool AK9438 | | | 4.00 | % | | | 03/01/2042 | | | | 1,073,642 | |
1,759,792 | | Federal National Mortgage Association Pass-Thru, Pool AK9439 | | | 4.00 | % | | | 03/01/2042 | | | | 1,659,225 | |
503,774 | | Federal National Mortgage Association Pass-Thru, Pool AK9446 | | | 4.50 | % | | | 03/01/2042 | | | | 498,488 | |
49,435,543 | | Federal National Mortgage Association Pass-Thru, Pool AL3699 | | | 3.00 | % | | | 06/01/2043 | | | | 45,178,999 | |
26,132,624 | | Federal National Mortgage Association Pass-Thru, Pool AL3883 | | | 3.00 | % | | | 07/01/2043 | | | | 24,140,659 | |
503,388 | | Federal National Mortgage Association Pass-Thru, Pool AL4292 | | | 4.50 | % | | | 04/01/2026 | | | | 504,639 | |
4,393,132 | | Federal National Mortgage Association Pass-Thru, Pool AL4312 | | | 4.00 | % | | | 10/01/2043 | | | | 4,325,562 | |
9,616,895 | | Federal National Mortgage Association Pass-Thru, Pool AL6075 | | | 3.50 | % | | | 09/01/2053 | | | | 8,849,647 | |
18,245,318 | | Federal National Mortgage Association Pass-Thru, Pool AL6076 | | | 3.00 | % | | | 06/01/2053 | | | | 16,436,357 | |
24,274,780 | | Federal National Mortgage Association Pass-Thru, Pool AL6141 | | | 4.00 | % | | | 04/01/2042 | | | | 23,787,683 | |
23,121,125 | | Federal National Mortgage Association Pass-Thru, Pool AL6325 | | | 3.00 | % | | | 10/01/2044 | | | | 21,348,822 | |
7,447,415 | | Federal National Mortgage Association Pass-Thru, Pool AL6486 | | | 4.50 | % | | | 02/01/2045 | | | | 7,450,725 | |
22,877,188 | | Federal National Mortgage Association Pass-Thru, Pool AL6538 | | | 4.50 | % | | | 06/01/2044 | | | | 23,028,557 | |
22,360,740 | | Federal National Mortgage Association Pass-Thru, Pool AL8304 | | | 3.50 | % | | | 03/01/2046 | | | | 21,146,324 | |
11,091,424 | | Federal National Mortgage Association Pass-Thru, Pool AL9220 | | | 3.00 | % | | | 06/01/2045 | | | | 10,241,276 | |
19,215,797 | | Federal National Mortgage Association Pass-Thru, Pool AL9445 | | | 3.00 | % | | | 07/01/2031 | | | | 18,427,109 | |
4,963,949 | | Federal National Mortgage Association Pass-Thru, Pool AO2980 | | | 4.00 | % | | | 05/01/2042 | | | | 4,680,217 | |
13,910,718 | | Federal National Mortgage Association Pass-Thru, Pool AP4787 | | | 3.50 | % | | | 09/01/2042 | | | | 12,876,251 | |
10,720,406 | | Federal National Mortgage Association Pass-Thru, Pool AP4789 | | | 3.50 | % | | | 09/01/2042 | | | | 9,923,137 | |
6,706,555 | | Federal National Mortgage Association Pass-Thru, Pool AQ5541 | | | 3.00 | % | | | 12/01/2042 | | | | 6,192,199 | |
6,664,167 | | Federal National Mortgage Association Pass-Thru, Pool AR9856 | | | 3.00 | % | | | 04/01/2043 | | | | 6,153,003 | |
6,407,783 | | Federal National Mortgage Association Pass-Thru, Pool AS1927 | | | 4.50 | % | | | 03/01/2044 | | | | 6,410,628 | |
7,027,126 | | Federal National Mortgage Association Pass-Thru, Pool AS2038 | | | 4.50 | % | | | 03/01/2044 | | | | 7,030,245 | |
4,117,748 | | Federal National Mortgage Association Pass-Thru, Pool AS2517 | | | 4.50 | % | | | 05/01/2044 | | | | 4,119,576 | |
1,958,445 | | Federal National Mortgage Association Pass-Thru, Pool AS2551 | | | 4.50 | % | | | 06/01/2044 | | | | 1,961,130 | |
2,053,551 | | Federal National Mortgage Association Pass-Thru, Pool AS2765 | | | 4.50 | % | | | 07/01/2044 | | | | 2,056,368 | |
9,736,556 | | Federal National Mortgage Association Pass-Thru, Pool AS3201 | | | 3.00 | % | | | 08/01/2034 | | | | 9,184,624 | |
4,724,308 | | Federal National Mortgage Association Pass-Thru, Pool AS3456 | | | 3.00 | % | | | 10/01/2034 | | | | 4,444,862 | |
9,639,450 | | Federal National Mortgage Association Pass-Thru, Pool AS3666 | | | 3.00 | % | | | 10/01/2034 | | | | 9,069,141 | |
30,843,344 | | Federal National Mortgage Association Pass-Thru, Pool AS3961 | | | 3.00 | % | | | 12/01/2044 | | | | 28,452,807 | |
12,101,352 | | Federal National Mortgage Association Pass-Thru, Pool AS4154 | | | 3.00 | % | | | 12/01/2044 | | | | 11,155,955 | |
7,863,787 | | Federal National Mortgage Association Pass-Thru, Pool AS4212 | | | 3.00 | % | | | 01/01/2035 | | | | 7,398,566 | |
11,588,771 | | Federal National Mortgage Association Pass-Thru, Pool AS4281 | | | 3.00 | % | | | 01/01/2035 | | | | 10,903,113 | |
8,762,311 | | Federal National Mortgage Association Pass-Thru, Pool AS4345 | | | 3.50 | % | | | 01/01/2045 | | | | 8,338,018 | |
11,395,505 | | Federal National Mortgage Association Pass-Thru, Pool AS4360 | | | 3.00 | % | | | 01/01/2035 | | | | 10,721,137 | |
70,336,197 | | Federal National Mortgage Association Pass-Thru, Pool AS4625 | | | 3.00 | % | | | 03/01/2045 | | | | 64,841,501 | |
27,455,038 | | Federal National Mortgage Association Pass-Thru, Pool AS4645 | | | 3.00 | % | | | 03/01/2045 | | | | 25,315,938 | |
11,962,023 | | Federal National Mortgage Association Pass-Thru, Pool AS4779 | | | 3.00 | % | | | 04/01/2035 | | | | 11,254,167 | |
9,758,296 | | Federal National Mortgage Association Pass-Thru, Pool AS4780 | | | 3.00 | % | | | 04/01/2035 | | | | 9,180,897 | |
12,578,140 | | Federal National Mortgage Association Pass-Thru, Pool AS4840 | | | 3.00 | % | | | 04/01/2035 | | | | 11,833,419 | |
8,703,284 | | Federal National Mortgage Association Pass-Thru, Pool AS4881 | | | 3.00 | % | | | 05/01/2035 | | | | 8,188,295 | |
14,176,072 | | Federal National Mortgage Association Pass-Thru, Pool AS7473 | | | 3.00 | % | | | 07/01/2046 | | | | 12,846,315 | |
29,993,717 | | Federal National Mortgage Association Pass-Thru, Pool AS7661 | | | 3.00 | % | | | 08/01/2046 | | | | 27,180,163 | |
19,419,561 | | Federal National Mortgage Association Pass-Thru, Pool AS8056 | | | 3.00 | % | | | 10/01/2046 | | | | 17,805,962 | |
27,282,207 | | Federal National Mortgage Association Pass-Thru, Pool AS8111 | | | 3.00 | % | | | 10/01/2041 | | | | 25,140,721 | |
16,846,220 | | Federal National Mortgage Association Pass-Thru, Pool AS8269 | | | 3.00 | % | | | 11/01/2046 | | | | 15,440,355 | |
14,208,122 | | Federal National Mortgage Association Pass-Thru, Pool AS8306 | | | 3.00 | % | | | 11/01/2041 | | | | 13,119,310 | |
16,686,910 | | Federal National Mortgage Association Pass-Thru, Pool AS8356 | | | 3.00 | % | | | 11/01/2046 | | | | 15,121,588 | |
13,602,467 | | Federal National Mortgage Association Pass-Thru, Pool AX9696 | | | 3.00 | % | | | 07/01/2045 | | | | 12,327,483 | |
17,198,045 | | Federal National Mortgage Association Pass-Thru, Pool AY3974 | | | 3.00 | % | | | 03/01/2045 | | | | 15,847,319 | |
6,106,522 | | Federal National Mortgage Association Pass-Thru, Pool AY4295 | | | 3.00 | % | | | 02/01/2045 | | | | 5,533,773 | |
423,748 | | Federal National Mortgage Association Pass-Thru, Pool AY4296 | | | 3.00 | % | | | 01/01/2045 | | | | 383,997 | |
2,786,556 | | Federal National Mortgage Association Pass-Thru, Pool AY5471 | | | 3.00 | % | | | 03/01/2045 | | | | 2,525,176 | |
5,986,529 | | Federal National Mortgage Association Pass-Thru, Pool AZ0576 | | | 3.50 | % | | | 04/01/2042 | | | | 5,585,949 | |
8,481,318 | | Federal National Mortgage Association Pass-Thru, Pool BC0785 | | | 3.50 | % | | | 04/01/2046 | | | | 8,015,343 | |
16,313,771 | | Federal National Mortgage Association Pass-Thru, Pool BC9003 | | | 3.00 | % | | | 11/01/2046 | | | | 14,958,242 | |
8,371,375 | | Federal National Mortgage Association Pass-Thru, Pool BC9081 | | | 3.00 | % | | | 12/01/2046 | | | | 7,678,829 | |
80,609,984 | | Federal National Mortgage Association Pass-Thru, Pool BF0314 | | | 3.00 | % | | | 01/01/2053 | | | | 73,444,233 | |
67,338,808 | | Federal National Mortgage Association Pass-Thru, Pool BF0353 | | | 3.00 | % | | | 05/01/2053 | | | | 61,352,333 | |
36,068,788 | | Federal National Mortgage Association Pass-Thru, Pool BF0391 | | | 3.00 | % | | | 09/01/2053 | | | | 32,872,562 | |
20,862,429 | | Federal National Mortgage Association Pass-Thru, Pool BK8257 | | | 1.50 | % | | | 12/01/2050 | | | | 15,948,327 | |
18,991,303 | | Federal National Mortgage Association Pass-Thru, Pool BK8267 | | | 2.50 | % | | | 12/01/2050 | | | | 16,621,310 | |
41,043,676 | | Federal National Mortgage Association Pass-Thru, Pool BM5112 | | | 3.00 | % | | | 11/01/2033 | | | | 39,291,039 | |
19,004,269 | | Federal National Mortgage Association Pass-Thru, Pool BM5299 | | | 3.00 | % | | | 12/01/2046 | | | | 17,425,174 | |
29,215,736 | | Federal National Mortgage Association Pass-Thru, Pool BM5633 | | | 3.00 | % | | | 07/01/2047 | | | | 26,766,804 | |
4,337,044 | | Federal National Mortgage Association Pass-Thru, Pool BM5834 | | | 3.00 | % | | | 04/01/2048 | | | | 3,930,138 | |
48,461,136 | | Federal National Mortgage Association Pass-Thru, Pool BM6779 | | | 2.00 | % | | | 08/01/2051 | | | | 39,184,865 | |
8,360,728 | | Federal National Mortgage Association Pass-Thru, Pool BQ6432 | | | 2.00 | % | | | 08/01/2051 | | | | 6,760,404 | |
16,560,083 | | Federal National Mortgage Association Pass-Thru, Pool BQ6564 | | | 2.00 | % | | | 09/01/2051 | | | | 13,390,211 | |
27,529,677 | | Federal National Mortgage Association Pass-Thru, Pool BS4319 | | | 2.35 | % | | | 01/01/2039 | | | | 20,969,645 | |
7,863,000 | | Federal National Mortgage Association Pass-Thru, Pool BS7410 | | | 5.48 | % | | | 01/01/2033 | | | | 8,165,457 | |
10,467,000 | | Federal National Mortgage Association Pass-Thru, Pool BS8014 | | | 4.84 | % | | | 03/01/2033 | | | | 10,664,466 | |
19,846,936 | | Federal National Mortgage Association Pass-Thru, Pool BT1777 | | | 2.50 | % | | | 06/01/2051 | | | | 17,335,274 | |
1,610,347 | | Federal National Mortgage Association Pass-Thru, Pool BT6556 | | | 2.00 | % | | | 07/01/2051 | | | | 1,302,089 | |
8,282,142 | | Federal National Mortgage Association Pass-Thru, Pool CA0862 | | | 3.50 | % | | | 09/01/2047 | | | | 7,821,912 | |
6,032,977 | | Federal National Mortgage Association Pass-Thru, Pool CA3898 | | | 3.00 | % | | | 07/01/2034 | | | | 5,754,963 | |
4,514,729 | | Federal National Mortgage Association Pass-Thru, Pool CA4413 | | | 3.00 | % | | | 10/01/2049 | | | | 3,973,671 | |
40,634,103 | | Federal National Mortgage Association Pass-Thru, Pool CA7235 | | | 2.50 | % | | | 10/01/2050 | | | | 35,154,442 | |
12,989,580 | | Federal National Mortgage Association Pass-Thru, Pool CA7671 | | | 2.50 | % | | | 11/01/2040 | | | | 11,602,124 | |
22,568,698 | | Federal National Mortgage Association Pass-Thru, Pool CA7789 | | | 2.50 | % | | | 11/01/2040 | | | | 20,158,048 | |
17,522,379 | | Federal National Mortgage Association Pass-Thru, Pool CB0189 | | | 3.00 | % | | | 04/01/2051 | | | | 15,789,725 | |
3,728,647 | | Federal National Mortgage Association Pass-Thru, Pool CB1648 | | | 2.00 | % | | | 09/01/2051 | | | | 3,014,933 | |
14,239,651 | | Federal National Mortgage Association Pass-Thru, Pool CB3332 | | | 3.50 | % | | | 04/01/2052 | | | | 13,324,456 | |
86,021,843 | | Federal National Mortgage Association Pass-Thru, Pool CB3618 | | | 4.00 | % | | | 05/01/2052 | | | | 82,405,403 | |
28,155,320 | | Federal National Mortgage Association Pass-Thru, Pool CB3786 | | | 4.00 | % | | | 06/01/2052 | | | | 26,966,096 | |
97,530,553 | | Federal National Mortgage Association Pass-Thru, Pool CB4291 | | | 5.00 | % | | | 08/01/2052 | | | | 97,497,433 | |
48,105,989 | | Federal National Mortgage Association Pass-Thru, Pool CB4613 | | | 4.50 | % | | | 09/01/2052 | | | | 47,220,123 | |
48,942,800 | | Federal National Mortgage Association Pass-Thru, Pool FM1000 | | | 3.00 | % | | | 04/01/2047 | | | | 44,738,960 | |
25,971,352 | | Federal National Mortgage Association Pass-Thru, Pool FM4347 | | | 2.50 | % | | | 09/01/2050 | | | | 22,479,233 | |
46,247,527 | | Federal National Mortgage Association Pass-Thru, Pool FM4752 | | | 2.50 | % | | | 11/01/2050 | | | | 40,476,284 | |
51,200,148 | | Federal National Mortgage Association Pass-Thru, Pool FM4792 | | | 2.50 | % | | | 11/01/2050 | | | | 44,295,626 | |
28,839,102 | | Federal National Mortgage Association Pass-Thru, Pool FM4913 | | | 2.50 | % | | | 11/01/2050 | | | | 24,947,785 | |
36,157,352 | | Federal National Mortgage Association Pass-Thru, Pool FM5150 | | | 2.00 | % | | | 12/01/2050 | | | | 30,034,660 | |
5,457,128 | | Federal National Mortgage Association Pass-Thru, Pool FM6864 | | | 1.50 | % | | | 04/01/2041 | | | | 4,551,991 | |
68,898,363 | | Federal National Mortgage Association Pass-Thru, Pool FM7557 | | | 3.50 | % | | | 03/01/2050 | | | | 64,999,999 | |
68,696,136 | | Federal National Mortgage Association Pass-Thru, Pool FM8104 | | | 3.00 | % | | | 07/01/2051 | | | | 61,942,016 | |
29,844,322 | | Federal National Mortgage Association Pass-Thru, Pool FM8158 | | | 2.50 | % | | | 07/01/2051 | | | | 26,248,276 | |
68,689,841 | | Federal National Mortgage Association Pass-Thru, Pool FM8215 | | | 2.50 | % | | | 03/01/2051 | | | | 60,118,524 | |
50,949,039 | | Federal National Mortgage Association Pass-Thru, Pool FM8304 | | | 4.00 | % | | | 07/01/2049 | | | | 49,466,464 | |
66,442,060 | | Federal National Mortgage Association Pass-Thru, Pool FM8435 | | | 2.50 | % | | | 09/01/2051 | | | | 58,127,326 | |
74,433,564 | | Federal National Mortgage Association Pass-Thru, Pool FM8769 | | | 2.50 | % | | | 09/01/2051 | | | | 65,075,000 | |
38,127,853 | | Federal National Mortgage Association Pass-Thru, Pool FM8780 | | | 2.50 | % | | | 09/01/2051 | | | | 33,283,334 | |
10,850,321 | | Federal National Mortgage Association Pass-Thru, Pool FM9422 | | | 2.00 | % | | | 01/01/2051 | | | | 9,014,116 | |
31,281,504 | | Federal National Mortgage Association Pass-Thru, Pool FM9490 | | | 2.00 | % | | | 11/01/2051 | | | | 26,161,400 | |
19,514,921 | | Federal National Mortgage Association Pass-Thru, Pool FM9846 | | | 2.50 | % | | | 12/01/2051 | | | | 16,852,247 | |
148,894,209 | | Federal National Mortgage Association Pass-Thru, Pool FM9958 | | | 3.50 | % | | | 11/01/2051 | | | | 139,102,058 | |
86,359,950 | | Federal National Mortgage Association Pass-Thru, Pool FM9993 | | | 3.50 | % | | | 07/01/2051 | | | | 81,102,943 | |
37,044,302 | | Federal National Mortgage Association Pass-Thru, Pool FS0009 | | | 3.50 | % | | | 11/01/2051 | | | | 34,508,951 | |
58,691,629 | | Federal National Mortgage Association Pass-Thru, Pool FS1472 | | | 3.50 | % | | | 11/01/2050 | | | | 55,089,774 | |
17,494,313 | | Federal National Mortgage Association Pass-Thru, Pool FS2588 | | | 4.50 | % | | | 08/01/2052 | | | | 17,200,558 | |
16,436,997 | | Federal National Mortgage Association Pass-Thru, Pool FS2837 | | | 4.00 | % | | | 09/01/2052 | | | | 15,745,893 | |
781,721 | | Federal National Mortgage Association Pass-Thru, Pool MA0264 | | | 4.50 | % | | | 12/01/2029 | | | | 782,047 | |
2,791,506 | | Federal National Mortgage Association Pass-Thru, Pool MA0353 | | | 4.50 | % | | | 03/01/2030 | | | | 2,792,672 | |
568,588 | | Federal National Mortgage Association Pass-Thru, Pool MA0406 | | | 4.50 | % | | | 05/01/2030 | | | | 568,826 | |
37,888 | | Federal National Mortgage Association Pass-Thru, Pool MA0445 | | | 5.00 | % | | | 06/01/2040 | | | | 37,516 | |
71,486 | | Federal National Mortgage Association Pass-Thru, Pool MA0468 | | | 5.00 | % | | | 07/01/2040 | | | | 70,783 | |
844,141 | | Federal National Mortgage Association Pass-Thru, Pool MA0534 | | | 4.00 | % | | | 10/01/2030 | | | | 824,976 | |
191,958 | | Federal National Mortgage Association Pass-Thru, Pool MA0587 | | | 4.00 | % | | | 12/01/2030 | | | | 187,599 | |
4,959,297 | | Federal National Mortgage Association Pass-Thru, Pool MA0616 | | | 4.00 | % | | | 01/01/2031 | | | | 4,846,659 | |
1,135,166 | | Federal National Mortgage Association Pass-Thru, Pool MA0896 | | | 4.00 | % | | | 11/01/2041 | | | | 1,070,747 | |
37,352,348 | | Federal National Mortgage Association Pass-Thru, Pool MA0919 | | | 3.50 | % | | | 12/01/2031 | | | | 36,782,298 | |
15,927,637 | | Federal National Mortgage Association Pass-Thru, Pool MA0949 | | | 3.50 | % | | | 01/01/2032 | | | | 15,684,548 | |
18,664,812 | | Federal National Mortgage Association Pass-Thru, Pool MA0976 | | | 3.50 | % | | | 02/01/2032 | | | | 18,380,009 | |
9,592,382 | | Federal National Mortgage Association Pass-Thru, Pool MA1010 | | | 3.50 | % | | | 03/01/2032 | | | | 9,446,000 | |
1,950,155 | | Federal National Mortgage Association Pass-Thru, Pool MA1039 | | | 3.50 | % | | | 04/01/2042 | | | | 1,805,500 | |
12,887,850 | | Federal National Mortgage Association Pass-Thru, Pool MA1059 | | | 3.50 | % | | | 05/01/2032 | | | | 12,691,160 | |
1,140,867 | | Federal National Mortgage Association Pass-Thru, Pool MA1068 | | | 3.50 | % | | | 05/01/2042 | | | | 1,056,034 | |
28,067,880 | | Federal National Mortgage Association Pass-Thru, Pool MA1084 | | | 3.50 | % | | | 06/01/2032 | | | | 27,639,441 | |
3,378,518 | | Federal National Mortgage Association Pass-Thru, Pool MA1093 | | | 3.50 | % | | | 06/01/2042 | | | | 3,127,158 | |
1,993,136 | | Federal National Mortgage Association Pass-Thru, Pool MA1094 | | | 4.00 | % | | | 06/01/2042 | | | | 1,879,218 | |
17,252,370 | | Federal National Mortgage Association Pass-Thru, Pool MA1107 | | | 3.50 | % | | | 07/01/2032 | | | | 16,856,168 | |
28,298,888 | | Federal National Mortgage Association Pass-Thru, Pool MA1117 | | | 3.50 | % | | | 07/01/2042 | | | | 26,199,575 | |
32,008,974 | | Federal National Mortgage Association Pass-Thru, Pool MA1136 | | | 3.50 | % | | | 08/01/2042 | | | | 29,626,937 | |
12,242,802 | | Federal National Mortgage Association Pass-Thru, Pool MA1138 | | | 3.50 | % | | | 08/01/2032 | | | | 11,936,350 | |
9,230,668 | | Federal National Mortgage Association Pass-Thru, Pool MA1179 | | | 3.50 | % | | | 09/01/2042 | | | | 8,543,517 | |
2,315,215 | | Federal National Mortgage Association Pass-Thru, Pool MA1201 | | | 3.50 | % | | | 10/01/2032 | | | | 2,257,062 | |
15,502,715 | | Federal National Mortgage Association Pass-Thru, Pool MA1209 | | | 3.50 | % | | | 10/01/2042 | | | | 14,349,747 | |
15,426,501 | | Federal National Mortgage Association Pass-Thru, Pool MA1237 | | | 3.00 | % | | | 11/01/2032 | | | | 14,562,258 | |
1,392,202 | | Federal National Mortgage Association Pass-Thru, Pool MA1242 | | | 3.50 | % | | | 11/01/2042 | | | | 1,289,121 | |
8,790,790 | | Federal National Mortgage Association Pass-Thru, Pool MA1338 | | | 3.00 | % | | | 02/01/2033 | | | | 8,292,852 | |
35,177,093 | | Federal National Mortgage Association Pass-Thru, Pool MA1366 | | | 3.00 | % | | | 03/01/2033 | | | | 33,184,405 | |
21,007,370 | | Federal National Mortgage Association Pass-Thru, Pool MA1401 | | | 3.00 | % | | | 04/01/2033 | | | | 19,817,250 | |
36,839,539 | | Federal National Mortgage Association Pass-Thru, Pool MA1459 | | | 3.00 | % | | | 06/01/2033 | | | | 34,752,061 | |
4,697,033 | | Federal National Mortgage Association Pass-Thru, Pool MA1490 | | | 3.00 | % | | | 07/01/2033 | | | | 4,430,861 | |
23,396,548 | | Federal National Mortgage Association Pass-Thru, Pool MA2018 | | | 3.50 | % | | | 09/01/2034 | | | | 22,808,080 | |
5,324,745 | | Federal National Mortgage Association Pass-Thru, Pool MA2114 | | | 3.50 | % | | | 12/01/2044 | | | | 4,928,849 | |
4,227,579 | | Federal National Mortgage Association Pass-Thru, Pool MA2151 | | | 3.50 | % | | | 01/01/2045 | | | | 3,913,305 | |
13,959,119 | | Federal National Mortgage Association Pass-Thru, Pool MA2164 | | | 3.50 | % | | | 02/01/2035 | | | | 13,607,930 | |
10,441,478 | | Federal National Mortgage Association Pass-Thru, Pool MA2166 | | | 3.50 | % | | | 02/01/2045 | | | | 9,667,970 | |
10,827,279 | | Federal National Mortgage Association Pass-Thru, Pool MA2248 | | | 3.00 | % | | | 04/01/2045 | | | | 9,812,359 | |
35,163,614 | | Federal National Mortgage Association Pass-Thru, Pool MA2259 | | | 3.00 | % | | | 05/01/2035 | | | | 33,082,819 | |
15,557,290 | | Federal National Mortgage Association Pass-Thru, Pool MA2270 | | | 3.00 | % | | | 05/01/2045 | | | | 14,098,164 | |
14,938,293 | | Federal National Mortgage Association Pass-Thru, Pool MA2621 | | | 3.50 | % | | | 05/01/2046 | | | | 13,826,359 | |
16,593,134 | | Federal National Mortgage Association Pass-Thru, Pool MA2649 | | | 3.00 | % | | | 06/01/2046 | | | | 15,036,537 | |
15,288,611 | | Federal National Mortgage Association Pass-Thru, Pool MA2650 | | | 3.50 | % | | | 06/01/2046 | | | | 14,150,671 | |
5,150,683 | | Federal National Mortgage Association Pass-Thru, Pool MA2673 | | | 3.00 | % | | | 07/01/2046 | | | | 4,667,493 | |
19,103,925 | | Federal National Mortgage Association Pass-Thru, Pool MA2711 | | | 3.00 | % | | | 08/01/2046 | | | | 17,311,819 | |
1,801,089 | | Federal National Mortgage Association Pass-Thru, Pool MA2743 | | | 3.00 | % | | | 09/01/2046 | | | | 1,592,005 | |
42,447,786 | | Federal National Mortgage Association Pass-Thru, Pool MA2806 | | | 3.00 | % | | | 11/01/2046 | | | | 39,052,038 | |
13,651,985 | | Federal National Mortgage Association Pass-Thru, Pool MA2833 | | | 3.00 | % | | | 12/01/2046 | | | | 12,559,135 | |
17,193,930 | | Federal National Mortgage Association Pass-Thru, Pool MA2895 | | | 3.00 | % | | | 02/01/2047 | | | | 15,746,596 | |
10,238,845 | | Federal National Mortgage Association Pass-Thru, Pool MA3614 | | | 3.50 | % | | | 03/01/2049 | | | | 9,633,270 | |
2,368,675 | | Federal National Mortgage Association Pass-Thru, Pool MA3894 | | | 4.00 | % | | | 09/01/2031 | | | | 2,314,830 | |
37,249,682 | | Federal National Mortgage Association Pass-Thru, Pool MA4100 | | | 2.00 | % | | | 08/01/2050 | | | | 30,941,111 | |
79,022,485 | | Federal National Mortgage Association Pass-Thru, Pool MA4191 | | | 2.00 | % | | | 11/01/2050 | | | | 63,994,481 | |
98,266,483 | | Federal National Mortgage Association Pass-Thru, Pool MA4306 | | | 2.50 | % | | | 04/01/2051 | | | | 84,824,679 | |
52,523,723 | | Federal National Mortgage Association Pass-Thru, Pool MA4340 | | | 2.00 | % | | | 05/01/2051 | | | | 42,469,908 | |
81,373,468 | | Federal National Mortgage Association Pass-Thru, Pool MA4701 | | | 4.50 | % | | | 08/01/2052 | | | | 79,803,730 | |
48,244,040 | | Federal National Mortgage Association Pass-Thru, Pool MA4733 | | | 4.50 | % | | | 09/01/2052 | | | | 47,312,134 | |
35,460,306 | | Federal National Mortgage Association Pass-Thru, Series 2022-18-DZ | | | 3.50 | % (e) | | | 04/25/2052 | | | | 28,363,777 | |
322,409 | | Federal National Mortgage Association REMICS, Series 2002-70-QZ | | | 5.50 | % | | | 11/25/2032 | | | | 331,148 | |
453,977 | | Federal National Mortgage Association REMICS, Series 2002-75-ZG | | | 5.50 | % | | | 11/25/2032 | | | | 459,682 | |
6,537,320 | | Federal National Mortgage Association REMICS, Series 2003-129-ZT | | | 5.50 | % | | | 01/25/2034 | | | | 6,700,810 | |
1,147,992 | | Federal National Mortgage Association REMICS, Series 2003-29-ZL | | | 5.00 | % | | | 04/25/2033 | | | | 1,156,252 | |
549,852 | | Federal National Mortgage Association REMICS, Series 2003-64-ZG | | | 5.50 | % | | | 07/25/2033 | | | | 557,810 | |
4,553,811 | | Federal National Mortgage Association REMICS, Series 2003-84-PZ | | | 5.00 | % | | | 09/25/2033 | | | | 4,577,216 | |
754,181 | | Federal National Mortgage Association REMICS, Series 2004-46-PJ (-1 x 1 Month LIBOR USD + 6.00%, 6.00% Cap) | | | 1.15 | % (c)(d) | | | 03/25/2034 | | | | 12,950 | |
1,323,133 | | Federal National Mortgage Association REMICS, Series 2004-51-XP (-1 x 1 Month LIBOR USD + 7.70%, 7.70% Cap) | | | 2.85 | % (c)(d) | | | 07/25/2034 | | | | 103,948 | |
43,473 | | Federal National Mortgage Association REMICS, Series 2005-107-EG | | | 4.50 | % | | | 01/25/2026 | | | | 42,753 | |
244,368 | | Federal National Mortgage Association REMICS, Series 2005-37-ZK | | | 4.50 | % | | | 05/25/2035 | | | | 241,396 | |
2,245,848 | | Federal National Mortgage Association REMICS, Series 2005-87-SG (-1 x 1 Month LIBOR USD + 6.70%, 6.70% Cap) | | | 1.85 | % (c)(d) | | | 10/25/2035 | | | | 225,725 | |
1,973,910 | | Federal National Mortgage Association REMICS, Series 2006-101-SA (-1 x 1 Month LIBOR USD + 6.58%, 6.58% Cap) | | | 1.73 | % (c)(d) | | | 10/25/2036 | | | | 198,368 | |
779,033 | | Federal National Mortgage Association REMICS, Series 2006-123-LI (-1 x 1 Month LIBOR USD + 6.32%, 6.32% Cap) | | | 1.47 | % (c)(d) | | | 01/25/2037 | | | | 77,629 | |
284,123 | | Federal National Mortgage Association REMICS, Series 2006-16-HZ | | | 5.50 | % | | | 03/25/2036 | | | | 288,117 | |
3,213,335 | | Federal National Mortgage Association REMICS, Series 2006-56-SM (-1 x 1 Month LIBOR USD + 6.75%, 6.75% Cap) | | | 1.90 | % (c)(d) | | | 07/25/2036 | | | | 267,671 | |
260,054 | | Federal National Mortgage Association REMICS, Series 2006-93-SN (-1 x 1 Month LIBOR USD + 6.60%, 6.60% Cap) | | | 1.75 | % (c)(d) | | | 10/25/2036 | | | | 21,873 | |
4,220,141 | | Federal National Mortgage Association REMICS, Series 2007-109-VZ | | | 5.00 | % | | | 10/25/2035 | | | | 4,252,554 | |
469,942 | | Federal National Mortgage Association REMICS, Series 2007-116-BI (-1 x 1 Month LIBOR USD + 6.25%, 6.25% Cap) | | | 1.40 | % (c)(d) | | | 05/25/2037 | | | | 30,194 | |
3,236,830 | | Federal National Mortgage Association REMICS, Series 2007-14-PS (-1 x 1 Month LIBOR USD + 6.81%, 6.81% Cap) | | | 1.96 | % (c)(d) | | | 03/25/2037 | | | | 336,036 | |
1,536,444 | | Federal National Mortgage Association REMICS, Series 2007-30-OI (-1 x 1 Month LIBOR USD + 6.44%, 6.44% Cap) | | | 1.59 | % (c)(d) | | | 04/25/2037 | | | | 143,605 | |
186,564 | | Federal National Mortgage Association REMICS, Series 2007-30-SI (-1 x 1 Month LIBOR USD + 6.11%, 6.11% Cap) | | | 1.26 | % (c)(d) | | | 04/25/2037 | | | | 10,742 | |
1,356,856 | | Federal National Mortgage Association REMICS, Series 2007-32-SG (-1 x 1 Month LIBOR USD + 6.10%, 6.10% Cap) | | | 1.25 | % (c)(d) | | | 04/25/2037 | | | | 101,756 | |
1,297,074 | | Federal National Mortgage Association REMICS, Series 2007-57-SX (-1 x 1 Month LIBOR USD + 6.62%, 6.62% Cap) | | | 1.77 | % (c)(d) | | | 10/25/2036 | | | | 117,044 | |
2,090,241 | | Federal National Mortgage Association REMICS, Series 2007-60-VZ | | | 6.00 | % | | | 07/25/2037 | | | | 2,168,762 | |
1,369,801 | | Federal National Mortgage Association REMICS, Series 2007-71-GZ | | | 6.00 | % | | | 07/25/2047 | | | | 1,497,632 | |
1,612,134 | | Federal National Mortgage Association REMICS, Series 2007-75-ID (-1 x 1 Month LIBOR USD + 5.87%, 5.87% Cap) | | | 1.02 | % (c)(d) | | | 08/25/2037 | | | | 137,513 | |
199,551 | | Federal National Mortgage Association REMICS, Series 2007-9-SD (-1 x 1 Month LIBOR USD + 6.65%, 6.65% Cap) | | | 1.80 | % (c)(d) | | | 03/25/2037 | | | | 13,825 | |
1,638,540 | | Federal National Mortgage Association REMICS, Series 2008-29-ZA | | | 4.50 | % | | | 04/25/2038 | | | | 1,620,460 | |
3,377,028 | | Federal National Mortgage Association REMICS, Series 2008-48-BE | | | 5.00 | % | | | 06/25/2034 | | | | 3,412,992 | |
293,517 | | Federal National Mortgage Association REMICS, Series 2008-48-SD (-1 x 1 Month LIBOR USD + 6.00%, 6.00% Cap) | | | 1.15 | % (c)(d) | | | 06/25/2037 | | | | 20,871 | |
116,864 | | Federal National Mortgage Association REMICS, Series 2008-53-LI (-1 x 1 Month LIBOR USD + 6.15%, 6.15% Cap) | | | 1.30 | % (c)(d) | | | 07/25/2038 | | | | 8,813 | |
287,872 | | Federal National Mortgage Association REMICS, Series 2008-57-SE (-1 x 1 Month LIBOR USD + 6.00%, 6.00% Cap) | | | 1.15 | % (c)(d) | | | 02/25/2037 | | | | 18,891 | |
416,105 | | Federal National Mortgage Association REMICS, Series 2008-5-MS (-1 x 1 Month LIBOR USD + 6.25%, 6.25% Cap) | | | 1.40 | % (c)(d) | | | 02/25/2038 | | | | 29,292 | |
310,573 | | Federal National Mortgage Association REMICS, Series 2008-61-SC (-1 x 1 Month LIBOR USD + 6.00%, 6.00% Cap) | | | 1.15 | % (c)(d) | | | 07/25/2038 | | | | 21,915 | |
199,397 | | Federal National Mortgage Association REMICS, Series 2008-62-SC (-1 x 1 Month LIBOR USD + 6.00%, 6.00% Cap) | | | 1.15 | % (c)(d) | | | 07/25/2038 | | | | 12,559 | |
877,039 | | Federal National Mortgage Association REMICS, Series 2008-65-SA (-1 x 1 Month LIBOR USD + 6.00%, 6.00% Cap) | | | 1.15 | % (c)(d) | | | 08/25/2038 | | | | 70,036 | |
160,700 | | Federal National Mortgage Association REMICS, Series 2008-81-LP | | | 5.50 | % | | | 09/25/2038 | | | | 164,827 | |
1,900,620 | | Federal National Mortgage Association REMICS, Series 2009-106-EZ | | | 4.50 | % | | | 01/25/2040 | | | | 1,846,335 | |
271,300 | | Federal National Mortgage Association REMICS, Series 2009-111-SE (-1 x 1 Month LIBOR USD + 6.25%, 6.25% Cap) | | | 1.40 | % (c)(d) | | | 01/25/2040 | | | | 28,247 | |
228,259 | | Federal National Mortgage Association REMICS, Series 2009-16-MZ | | | 5.00 | % | | | 03/25/2029 | | | | 227,276 | |
807,965 | | Federal National Mortgage Association REMICS, Series 2009-42-SI (-1 x 1 Month LIBOR USD + 6.00%, 6.00% Cap) | | | 1.15 | % (c)(d) | | | 06/25/2039 | | | | 57,501 | |
624,536 | | Federal National Mortgage Association REMICS, Series 2009-42-SX (-1 x 1 Month LIBOR USD + 6.00%, 6.00% Cap) | | | 1.15 | % (c)(d) | | | 06/25/2039 | | | | 48,272 | |
284,191 | | Federal National Mortgage Association REMICS, Series 2009-47-SA (-1 x 1 Month LIBOR USD + 6.10%, 6.10% Cap) | | | 1.25 | % (c)(d) | | | 07/25/2039 | | | | 21,874 | |
204,839 | | Federal National Mortgage Association REMICS, Series 2009-48-WS (-1 x 1 Month LIBOR USD + 5.95%, 5.95% Cap) | | | 1.10 | % (c)(d) | | | 07/25/2039 | | | | 16,342 | |
2,225,987 | | Federal National Mortgage Association REMICS, Series 2009-49-S (-1 x 1 Month LIBOR USD + 6.75%, 6.75% Cap) | | | 1.90 | % (c)(d) | | | 07/25/2039 | | | | 146,987 | |
225,019 | | Federal National Mortgage Association REMICS, Series 2009-51-BZ | | | 4.50 | % | | | 07/25/2039 | | | | 222,388 | |
620,305 | | Federal National Mortgage Association REMICS, Series 2009-54-EZ | | | 5.00 | % | | | 07/25/2039 | | | | 616,835 | |
280,254 | | Federal National Mortgage Association REMICS, Series 2009-70-SA (-1 x 1 Month LIBOR USD + 5.80%, 5.80% Cap) | | | 0.95 | % (c)(d) | | | 09/25/2039 | | | | 22,566 | |
1,236,919 | | Federal National Mortgage Association REMICS, Series 2009-80-PM | | | 4.50 | % | | | 10/25/2039 | | | | 1,238,006 | |
1,366,199 | | Federal National Mortgage Association REMICS, Series 2009-83-Z | | | 4.50 | % | | | 10/25/2039 | | | | 1,338,328 | |
5,485,100 | | Federal National Mortgage Association REMICS, Series 2009-85-ES (-1 x 1 Month LIBOR USD + 7.23%, 7.23% Cap) | | | 2.38 | % (c)(d) | | | 01/25/2036 | | | | 442,487 | |
8,444,698 | | Federal National Mortgage Association REMICS, Series 2009-85-JS (-1 x 1 Month LIBOR USD + 6.75%, 6.75% Cap) | | | 1.90 | % (c)(d) | | | 10/25/2039 | | | | 970,521 | |
464,925 | | Federal National Mortgage Association REMICS, Series 2009-90-IB (-1 x 1 Month LIBOR USD + 5.72%, 5.72% Cap) | | | 0.87 | % (c)(d) | | | 04/25/2037 | | | | 22,937 | |
356,667 | | Federal National Mortgage Association REMICS, Series 2009-94-BC | | | 5.00 | % | | | 11/25/2039 | | | | 355,889 | |
6,570,550 | | Federal National Mortgage Association REMICS, Series 2010-101-SA (-1 x 1 Month LIBOR USD + 4.48%, 4.48% Cap) | | | 0.00 | % (c)(d) | | | 09/25/2040 | | | | 314,423 | |
2,908,193 | | Federal National Mortgage Association REMICS, Series 2010-101-ZC | | | 4.50 | % | | | 09/25/2040 | | | | 2,882,165 | |
6,130,085 | | Federal National Mortgage Association REMICS, Series 2010-101-ZH | | | 4.50 | % | | | 07/25/2040 | | | | 6,085,018 | |
2,081,952 | | Federal National Mortgage Association REMICS, Series 2010-10-SA (-1 x 1 Month LIBOR USD + 6.35%, 6.35% Cap) | | | 1.50 | % (c)(d) | | | 02/25/2040 | | | | 178,437 | |
648,018 | | Federal National Mortgage Association REMICS, Series 2010-10-ZA | | | 4.50 | % | | | 02/25/2040 | | | | 626,881 | |
727,287 | | Federal National Mortgage Association REMICS, Series 2010-111-S (-1 x 1 Month LIBOR USD + 5.95%, 5.95% Cap) | | | 1.10 | % (c)(d) | | | 10/25/2050 | | | | 77,735 | |
1,013,540 | | Federal National Mortgage Association REMICS, Series 2010-116-Z | | | 4.00 | % | | | 10/25/2040 | | | | 961,140 | |
254,499 | | Federal National Mortgage Association REMICS, Series 2010-117-SA (-1 x 1 Month LIBOR USD + 4.50%, 4.50% Cap) | | | 0.00 | % (c)(d) | | | 10/25/2040 | | | | 8,775 | |
760,092 | | Federal National Mortgage Association REMICS, Series 2010-120-KD | | | 4.00 | % | | | 10/25/2040 | | | | 720,593 | |
6,556,463 | | Federal National Mortgage Association REMICS, Series 2010-121-SD (-1 x 1 Month LIBOR USD + 4.50%, 4.50% Cap) | | | 0.00 | % (c)(d) | | | 10/25/2040 | | | | 325,051 | |
242,685 | | Federal National Mortgage Association REMICS, Series 2010-126-SU (-11 x 1 Month LIBOR USD + 55.00%, 55.00% Cap) | | | 3.72 | % (d) | | | 11/25/2040 | | | | 299,442 | |
178,693 | | Federal National Mortgage Association REMICS, Series 2010-126-SX (-3 x 1 Month LIBOR USD + 15.00%, 15.00% Cap) | | | 1.01 | % (d) | | | 11/25/2040 | | | | 160,399 | |
1,116,563 | | Federal National Mortgage Association REMICS, Series 2010-128-HZ | | | 4.00 | % | | | 11/25/2040 | | | | 1,081,016 | |
778,928 | | Federal National Mortgage Association REMICS, Series 2010-132-Z | | | 4.50 | % | | | 11/25/2040 | | | | 737,535 | |
88,008 | | Federal National Mortgage Association REMICS, Series 2010-137-VS (-3 x 1 Month LIBOR USD + 15.00%, 15.00% Cap) | | | 1.01 | % (d) | | | 12/25/2040 | | | | 80,760 | |
4,631,944 | | Federal National Mortgage Association REMICS, Series 2010-142-AZ | | | 4.00 | % | | | 12/25/2040 | | | | 4,431,704 | |
1,735,617 | | Federal National Mortgage Association REMICS, Series 2010-148-SA (-1 x 1 Month LIBOR USD + 6.65%, 6.65% Cap) | | | 1.80 | % (c)(d) | | | 01/25/2026 | | | | 30,941 | |
7,645,773 | | Federal National Mortgage Association REMICS, Series 2010-150-ZA | | | 4.00 | % | | | 01/25/2041 | | | | 7,216,472 | |
3,484,849 | | Federal National Mortgage Association REMICS, Series 2010-16-SA (-1 x 1 Month LIBOR USD + 5.45%, 5.45% Cap) | | | 0.60 | % (c)(d) | | | 03/25/2040 | | | | 228,015 | |
1,350,167 | | Federal National Mortgage Association REMICS, Series 2010-21-DZ | | | 5.00 | % | | | 03/25/2040 | | | | 1,361,294 | |
552,741 | | Federal National Mortgage Association REMICS, Series 2010-21-KS (-1 x 1 Month LIBOR USD + 4.95%, 4.95% Cap) | | | 0.10 | % (c)(d) | | | 03/25/2040 | | | | 10,061 | |
32,703 | | Federal National Mortgage Association REMICS, Series 2010-2-GS (-1 x 1 Month LIBOR USD + 6.45%, 6.45% Cap) | | | 1.60 | % (c)(d) | | | 12/25/2049 | | | | 113 | |
935,410 | | Federal National Mortgage Association REMICS, Series 2010-2-MS (-1 x 1 Month LIBOR USD + 6.25%, 6.25% Cap) | | | 1.40 | % (c)(d) | | | 02/25/2050 | | | | 99,717 | |
705,122 | | Federal National Mortgage Association REMICS, Series 2010-31-SA (-1 x 1 Month LIBOR USD + 5.00%, 5.00% Cap) | | | 0.15 | % (c)(d) | | | 04/25/2040 | | | | 26,573 | |
700,540 | | Federal National Mortgage Association REMICS, Series 2010-34-PS (-1 x 1 Month LIBOR USD + 4.93%, 4.93% Cap) | | | 0.08 | % (c)(d) | | | 04/25/2040 | | | | 39,873 | |
209,229 | | Federal National Mortgage Association REMICS, Series 2010-35-ES (-1 x 1 Month LIBOR USD + 6.45%, 6.45% Cap) | | | 1.60 | % (c)(d) | | | 04/25/2040 | | | | 7,955 | |
111,134 | | Federal National Mortgage Association REMICS, Series 2010-35-SV (-1 x 1 Month LIBOR USD + 6.45%, 6.45% Cap) | | | 1.60 | % (c)(d) | | | 04/25/2040 | | | | 2,504 | |
551,202 | | Federal National Mortgage Association REMICS, Series 2010-46-MS (-1 x 1 Month LIBOR USD + 4.95%, 4.95% Cap) | | | 0.10 | % (c)(d) | | | 05/25/2040 | | | | 44,501 | |
3,736,547 | | Federal National Mortgage Association REMICS, Series 2010-49-ZW | | | 4.50 | % | | | 05/25/2040 | | | | 3,462,452 | |
991,988 | | Federal National Mortgage Association REMICS, Series 2010-4-SK (-1 x 1 Month LIBOR USD + 6.23%, 6.23% Cap) | | | 1.38 | % (c)(d) | | | 02/25/2040 | | | | 63,851 | |
302,795 | | Federal National Mortgage Association REMICS, Series 2010-58-ES (-3 x 1 Month LIBOR USD + 12.47%, 12.47% Cap) | | | 0.01 | % (d) | | | 06/25/2040 | | | | 265,562 | |
2,624,275 | | Federal National Mortgage Association REMICS, Series 2010-59-MS (-1 x 1 Month LIBOR USD + 5.77%, 5.77% Cap) | | | 0.92 | % (c)(d) | | | 06/25/2040 | | | | 213,303 | |
3,299,194 | | Federal National Mortgage Association REMICS, Series 2010-59-SC (-1 x 1 Month LIBOR USD + 5.00%, 5.00% Cap) | | | 0.15 | % (c)(d) | | | 01/25/2040 | | | | 173,707 | |
215,138 | | Federal National Mortgage Association REMICS, Series 2010-60-VZ | | | 5.00 | % | | | 10/25/2039 | | | | 220,860 | |
195,160 | | Federal National Mortgage Association REMICS, Series 2010-61-EL | | | 4.50 | % | | | 06/25/2040 | | | | 194,291 | |
3,077,781 | | Federal National Mortgage Association REMICS, Series 2010-64-EZ | | | 5.00 | % | | | 06/25/2040 | | | | 3,100,594 | |
7,247,862 | | Federal National Mortgage Association REMICS, Series 2010-64-FC (1 Month LIBOR USD + 0.50%, 0.50% Floor, 7.00% Cap) | | | 5.35 | % | | | 06/25/2040 | | | | 7,155,468 | |
8,860,326 | | Federal National Mortgage Association REMICS, Series 2010-76-ZK | | | 4.50 | % | | | 07/25/2040 | | | | 8,857,029 | |
2,029,588 | | Federal National Mortgage Association REMICS, Series 2010-79-CZ | | | 4.00 | % | | | 07/25/2040 | | | | 1,929,042 | |
7,806,380 | | Federal National Mortgage Association REMICS, Series 2010-79-VZ | | | 4.50 | % | | | 07/25/2040 | | | | 7,807,252 | |
934,943 | | Federal National Mortgage Association REMICS, Series 2010-84-ZC | | | 4.50 | % | | | 08/25/2040 | | | | 928,690 | |
1,869,881 | | Federal National Mortgage Association REMICS, Series 2010-84-ZD | | | 4.50 | % | | | 08/25/2040 | | | | 1,857,376 | |
2,596,115 | | Federal National Mortgage Association REMICS, Series 2010-84-ZG | | | 4.50 | % | | | 08/25/2040 | | | | 2,598,642 | |
214,013 | | Federal National Mortgage Association REMICS, Series 2010-90-SA (-1 x 1 Month LIBOR USD + 5.85%, 5.85% Cap) | | | 1.00 | % (c)(d) | | | 08/25/2040 | | | | 13,504 | |
743,651 | | Federal National Mortgage Association REMICS, Series 2010-94-Z | | | 4.50 | % | | | 08/25/2040 | | | | 738,461 | |
3,982,944 | | Federal National Mortgage Association REMICS, Series 2010-99-SG (-5 x 1 Month LIBOR USD + 25.00%, 25.00% Cap) | | | 1.69 | % (d) | | | 09/25/2040 | | | | 4,180,712 | |
430,095 | | Federal National Mortgage Association REMICS, Series 2010-9-DS (-1 x 1 Month LIBOR USD + 5.30%, 0.50% Floor, 5.30% Cap) | | | 0.50 | % (c)(d) | | | 02/25/2040 | | | | 21,778 | |
13,723,186 | | Federal National Mortgage Association REMICS, Series 2011-106-LZ | | | 3.50 | % | | | 10/25/2041 | | | | 13,012,484 | |
520,021 | | Federal National Mortgage Association REMICS, Series 2011-110-LS (-2 x 1 Month LIBOR USD + 10.10%, 10.10% Cap) | | | 0.78 | % (d) | | | 11/25/2041 | | | | 413,758 | |
1,656,556 | | Federal National Mortgage Association REMICS, Series 2011-111-CZ | | | 4.00 | % | | | 11/25/2041 | | | | 1,585,107 | |
4,450,315 | | Federal National Mortgage Association REMICS, Series 2011-111-EZ | | | 5.00 | % | | | 11/25/2041 | | | | 4,501,388 | |
876,136 | | Federal National Mortgage Association REMICS, Series 2011-111-VZ | | | 4.00 | % | | | 11/25/2041 | | | | 838,458 | |
30,000,000 | | Federal National Mortgage Association REMICS, Series 2011-131-PB | | | 4.50 | % | | | 12/25/2041 | | | | 30,137,730 | |
9,174,092 | | Federal National Mortgage Association REMICS, Series 2011-16-AL | | | 3.50 | % | | | 03/25/2031 | | | | 8,915,699 | |
18,748,615 | | Federal National Mortgage Association REMICS, Series 2011-17-NY | | | 3.50 | % | | | 03/25/2031 | | | | 18,218,698 | |
383,788 | | Federal National Mortgage Association REMICS, Series 2011-17-SA (-1 x 1 Month LIBOR USD + 6.47%, 6.47% Cap) | | | 1.62 | % (c)(d) | | | 03/25/2041 | | | | 24,024 | |
1,761,043 | | Federal National Mortgage Association REMICS, Series 2011-25-KY | | | 3.00 | % | | | 04/25/2026 | | | | 1,714,780 | |
1,706,852 | | Federal National Mortgage Association REMICS, Series 2011-27-BS (-2 x 1 Month LIBOR USD + 9.00%, 9.00% Cap) | | | 0.00 | % (d) | | | 04/25/2041 | | | | 1,423,404 | |
19,753,341 | | Federal National Mortgage Association REMICS, Series 2011-29-AL | | | 3.50 | % | | | 04/25/2031 | | | | 19,195,473 | |
3,383,936 | | Federal National Mortgage Association REMICS, Series 2011-2-GZ | | | 4.00 | % | | | 02/25/2041 | | | | 3,237,596 | |
7,277,459 | | Federal National Mortgage Association REMICS, Series 2011-32-ZG | | | 4.00 | % | | | 04/25/2041 | | | | 7,110,955 | |
1,271,980 | | Federal National Mortgage Association REMICS, Series 2011-36-VZ | | | 4.50 | % | | | 05/25/2041 | | | | 1,189,232 | |
3,769,115 | | Federal National Mortgage Association REMICS, Series 2011-37-Z | | | 4.50 | % | | | 05/25/2041 | | | | 3,777,578 | |
5,279,387 | | Federal National Mortgage Association REMICS, Series 2011-38-BZ | | | 4.00 | % | | | 05/25/2041 | | | | 5,101,585 | |
1,474,848 | | Federal National Mortgage Association REMICS, Series 2011-39-CB | | | 3.00 | % | | | 05/25/2026 | | | | 1,435,275 | |
3,783,516 | | Federal National Mortgage Association REMICS, Series 2011-39-ZD | | | 4.00 | % | | | 02/25/2041 | | | | 3,619,948 | |
1,165,796 | | Federal National Mortgage Association REMICS, Series 2011-40-LZ | | | 4.50 | % | | | 05/25/2041 | | | | 1,159,620 | |
1,866,829 | | Federal National Mortgage Association REMICS, Series 2011-42-MZ | | | 4.50 | % | | | 05/25/2041 | | | | 1,853,387 | |
11,179,319 | | Federal National Mortgage Association REMICS, Series 2011-45-ZA | | | 4.00 | % | | | 05/25/2031 | | | | 10,813,633 | |
3,409,150 | | Federal National Mortgage Association REMICS, Series 2011-45-ZB | | | 4.50 | % | | | 05/25/2041 | | | | 3,147,998 | |
9,938,689 | | Federal National Mortgage Association REMICS, Series 2011-51-FJ (1 Month LIBOR USD + 0.45%, 0.45% Floor, 7.00% Cap) | | | 5.30 | % | | | 06/25/2041 | | | | 9,770,144 | |
711,329 | | Federal National Mortgage Association REMICS, Series 2011-59-MA | | | 4.50 | % | | | 07/25/2041 | | | | 699,135 | |
2,682,529 | | Federal National Mortgage Association REMICS, Series 2011-60-EL | | | 3.00 | % | | | 07/25/2026 | | | | 2,611,088 | |
6,752,131 | | Federal National Mortgage Association REMICS, Series 2011-64-DB | | | 4.00 | % | | | 07/25/2041 | | | | 6,591,333 | |
4,383,602 | | Federal National Mortgage Association REMICS, Series 2011-77-Z | | | 3.50 | % | | | 08/25/2041 | | | | 3,988,561 | |
28,712,123 | | Federal National Mortgage Association REMICS, Series 2011-99-CZ | | | 4.50 | % | | | 10/25/2041 | | | | 28,719,855 | |
14,854,243 | | Federal National Mortgage Association REMICS, Series 2012-104-Z | | | 3.50 | % | | | 09/25/2042 | | | | 14,064,238 | |
2,257,410 | | Federal National Mortgage Association REMICS, Series 2012-111-LB | | | 3.50 | % | | | 05/25/2041 | | | | 2,167,169 | |
14,123,544 | | Federal National Mortgage Association REMICS, Series 2012-111-MJ | | | 4.00 | % | | | 04/25/2042 | | | | 13,488,041 | |
16,862,779 | | Federal National Mortgage Association REMICS, Series 2012-122-DB | | | 3.00 | % | | | 11/25/2042 | | | | 15,639,334 | |
13,604,182 | | Federal National Mortgage Association REMICS, Series 2012-132-KH | | | 1.75 | % | | | 12/25/2032 | | | | 12,396,347 | |
13,958,142 | | Federal National Mortgage Association REMICS, Series 2012-144-PT | | | 3.98 | % (a) | | | 11/25/2049 | | | | 13,686,313 | |
4,666,408 | | Federal National Mortgage Association REMICS, Series 2012-14-BZ | | | 4.00 | % | | | 03/25/2042 | | | | 4,496,580 | |
27,997,729 | | Federal National Mortgage Association REMICS, Series 2012-15-PZ | | | 4.00 | % | | | 03/25/2042 | | | | 26,631,720 | |
10,359,964 | | Federal National Mortgage Association REMICS, Series 2012-20-ZT | | | 3.50 | % | | | 03/25/2042 | | | | 9,758,726 | |
36,527,883 | | Federal National Mortgage Association REMICS, Series 2012-30-DZ | | | 4.00 | % | | | 04/25/2042 | | | | 35,156,090 | |
19,228,564 | | Federal National Mortgage Association REMICS, Series 2012-31-Z | | | 4.00 | % | | | 04/25/2042 | | | | 18,535,442 | |
8,157,200 | | Federal National Mortgage Association REMICS, Series 2012-70-FY (1 Month LIBOR USD + 0.45%, 0.45% Floor, 7.00% Cap) | | | 5.30 | % | | | 07/25/2042 | | | | 8,013,009 | |
28,612,295 | | Federal National Mortgage Association REMICS, Series 2012-74-Z | | | 4.00 | % | | | 07/25/2042 | | | | 27,884,035 | |
282,549 | | Federal National Mortgage Association REMICS, Series 2012-80-EA | | | 2.00 | % | | | 04/25/2042 | | | | 270,230 | |
18,918,055 | | Federal National Mortgage Association REMICS, Series 2012-86-ZC | | | 3.50 | % | | | 08/25/2042 | | | | 17,991,327 | |
34,110,989 | | Federal National Mortgage Association REMICS, Series 2012-96-VZ | | | 3.50 | % | | | 09/25/2042 | | | | 32,289,796 | |
7,937,105 | | Federal National Mortgage Association REMICS, Series 2012-98-BG | | | 4.50 | % | | | 08/25/2040 | | | | 7,935,943 | |
14,894,987 | | Federal National Mortgage Association REMICS, Series 2012-99-QE | | | 3.00 | % | | | 09/25/2042 | | | | 13,813,716 | |
10,321,830 | | Federal National Mortgage Association REMICS, Series 2013-100-PJ | | | 3.00 | % | | | 03/25/2043 | | | | 9,718,808 | |
21,824,155 | | Federal National Mortgage Association REMICS, Series 2013-130-ZE | | | 3.00 | % | | | 01/25/2044 | | | | 20,069,192 | |
26,603,760 | | Federal National Mortgage Association REMICS, Series 2013-133-ZT | | | 3.00 | % (e) | | | 01/25/2039 | | | | 24,567,952 | |
6,774,935 | | Federal National Mortgage Association REMICS, Series 2013-41-ZH | | | 3.00 | % (e) | | | 05/25/2033 | | | | 6,250,246 | |
5,692,246 | | Federal National Mortgage Association REMICS, Series 2013-51-HS (-1 x 1 Month LIBOR USD + 5.40%, 5.40% Cap) | | | 0.00 | % (d) | | | 04/25/2043 | | | | 4,346,110 | |
994,109 | | Federal National Mortgage Association REMICS, Series 2013-58-SC (-2 x 1 Month LIBOR USD + 6.00%, 6.00% Cap) | | | 0.00 | % (d) | | | 06/25/2043 | | | | 579,589 | |
1,751,524 | | Federal National Mortgage Association REMICS, Series 2013-81-ZQ | | | 3.00 | % (e) | | | 08/25/2043 | | | | 1,281,958 | |
6,703,398 | | Federal National Mortgage Association REMICS, Series 2013-82-SH (-1 x 1 Month LIBOR USD + 6.05%, 6.05% Cap) | | | 1.20 | % (c)(d) | | | 12/25/2042 | | | | 499,954 | |
23,954,290 | | Federal National Mortgage Association REMICS, Series 2014-12-GZ | | | 3.50 | % | | | 03/25/2044 | | | | 22,662,347 | |
14,762,065 | | Federal National Mortgage Association REMICS, Series 2014-21-GZ | | | 3.00 | % | | | 04/25/2044 | | | | 13,576,264 | |
33,204,951 | | Federal National Mortgage Association REMICS, Series 2014-37-ZY | | | 2.50 | % (e) | | | 07/25/2044 | | | | 28,914,510 | |
23,263,623 | | Federal National Mortgage Association REMICS, Series 2014-39-ZA | | | 3.00 | % | | | 07/25/2044 | | | | 21,485,389 | |
107,594 | | Federal National Mortgage Association REMICS, Series 2014-46-NZ | | | 3.00 | % (e) | | | 06/25/2043 | | | | 81,079 | |
65,427,517 | | Federal National Mortgage Association REMICS, Series 2014-60-EZ | | | 3.00 | % (e) | | | 10/25/2044 | | | | 58,550,771 | |
46,184,365 | | Federal National Mortgage Association REMICS, Series 2014-61-ZV | | | 3.00 | % (e) | | | 10/25/2044 | | | | 41,342,618 | |
38,947,286 | | Federal National Mortgage Association REMICS, Series 2014-64-NZ | | | 3.00 | % (e) | | | 10/25/2044 | | | | 34,966,768 | |
13,714,051 | | Federal National Mortgage Association REMICS, Series 2014-67-DZ | | | 3.00 | % (e) | | | 10/25/2044 | | | | 12,375,917 | |
43,841,630 | | Federal National Mortgage Association REMICS, Series 2014-68-MZ | | | 3.00 | % (e) | | | 11/25/2044 | | | | 39,237,329 | |
24,749,060 | | Federal National Mortgage Association REMICS, Series 2014-77-VZ | | | 3.00 | % (e) | | | 11/25/2044 | | | | 22,251,808 | |
734,822 | | Federal National Mortgage Association REMICS, Series 2014-82-YA | | | 3.00 | % | | | 04/25/2041 | | | | 728,341 | |
31,784,290 | | Federal National Mortgage Association REMICS, Series 2014-84-KZ | | | 3.00 | % (e) | | | 12/25/2044 | | | | 28,488,625 | |
1,781,451 | | Federal National Mortgage Association REMICS, Series 2014-95-NA | | | 3.00 | % | | | 04/25/2041 | | | | 1,771,145 | |
6,205,223 | | Federal National Mortgage Association REMICS, Series 2015-11-A | | | 3.00 | % | | | 05/25/2034 | | | | 5,985,845 | |
6,666,413 | | Federal National Mortgage Association REMICS, Series 2015-21-G | | | 3.00 | % | | | 02/25/2042 | | | | 6,545,261 | |
5,268,735 | | Federal National Mortgage Association REMICS, Series 2015-42-CA | | | 3.00 | % | | | 03/25/2044 | | | | 5,010,385 | |
21,730,951 | | Federal National Mortgage Association REMICS, Series 2015-49-A | | | 3.00 | % | | | 03/25/2044 | | | | 20,601,796 | |
10,511,958 | | Federal National Mortgage Association REMICS, Series 2015-52-GZ | | | 3.00 | % (e) | | | 07/25/2045 | | | | 9,481,432 | |
5,936,702 | | Federal National Mortgage Association REMICS, Series 2015-88-AC | | | 3.00 | % | | | 04/25/2043 | | | | 5,744,007 | |
43,241,752 | | Federal National Mortgage Association REMICS, Series 2015-88-BA | | | 3.00 | % | | | 04/25/2044 | | | | 41,132,588 | |
3,119,674 | | Federal National Mortgage Association REMICS, Series 2015-94-MA | | | 3.00 | % | | | 01/25/2046 | | | | 2,849,868 | |
13,149,602 | | Federal National Mortgage Association REMICS, Series 2016-2-JA | | | 2.50 | % | | | 02/25/2046 | | | | 12,467,925 | |
27,636,362 | | Federal National Mortgage Association REMICS, Series 2016-32-LA | | | 3.00 | % | | | 10/25/2044 | | | | 26,276,476 | |
19,278,743 | | Federal National Mortgage Association REMICS, Series 2016-72-PA | | | 3.00 | % | | | 07/25/2046 | | | | 17,813,038 | |
2,572,754 | | Federal National Mortgage Association REMICS, Series 2016-74-PA | | | 3.00 | % | | | 12/25/2044 | | | | 2,508,985 | |
2,368,883 | | Federal National Mortgage Association REMICS, Series 2016-79-EP | | | 3.00 | % | | | 01/25/2044 | | | | 2,299,586 | |
6,669,061 | | Federal National Mortgage Association REMICS, Series 2016-81-PA | | | 3.00 | % | | | 02/25/2044 | | | | 6,466,452 | |
10,551,081 | | Federal National Mortgage Association REMICS, Series 2018-21-IO | | | 3.00 | % (c) | | | 04/25/2048 | | | | 1,613,721 | |
17,426,843 | | Federal National Mortgage Association REMICS, Series 2018-21-PO | | | 0.00 | % (g) | | | 04/25/2048 | | | | 13,578,989 | |
43,601,535 | | Federal National Mortgage Association REMICS, Series 2018-27-AO | | | 0.00 | % (g) | | | 05/25/2048 | | | | 33,997,804 | |
12,732,898 | | Federal National Mortgage Association REMICS, Series 2018-33-A | | | 3.00 | % | | | 05/25/2048 | | | | 11,644,015 | |
14,922,631 | | Federal National Mortgage Association REMICS, Series 2018-38-JB | | | 3.00 | % | | | 06/25/2048 | | | | 13,766,397 | |
32,079,508 | | Federal National Mortgage Association REMICS, Series 2018-7-CD | | | 3.00 | % | | | 02/25/2048 | | | | 29,530,650 | |
23,221,934 | | Federal National Mortgage Association REMICS, Series 2018-85-PO | | | 0.00 | % (g) | | | 12/25/2048 | | | | 17,657,515 | |
5,567,333 | | Federal National Mortgage Association REMICS, Series 2019-48-AZ | | | 3.50 | % | | | 09/25/2049 | | | | 5,250,437 | |
5,645,460 | | Federal National Mortgage Association REMICS, Series 2019-64-D | | | 2.50 | % | | | 11/25/2049 | | | | 5,009,360 | |
16,597,146 | | Federal National Mortgage Association REMICS, Series 2019-69-DS (-1 x 1 Month LIBOR USD + 6.00%, 6.00% Cap) | | | 1.15 | % (c)(d) | | | 12/25/2049 | | | | 1,899,253 | |
45,324,360 | | Federal National Mortgage Association REMICS, Series 2019-78-ZB | | | 3.00 | % | | | 01/25/2050 | | | | 40,984,680 | |
35,621,029 | | Federal National Mortgage Association REMICS, Series 2020-47-GL | | | 2.00 | % | | | 05/25/2046 | | | | 30,999,696 | |
12,456,103 | | Federal National Mortgage Association REMICS, Series 2020-54-AS (-1 x 1 Month LIBOR USD + 6.15%, 6.15% Cap) | | | 1.30 | % (c)(d) | | | 08/25/2050 | | | | 1,564,296 | |
7,147,451 | | Federal National Mortgage Association REMICS, Series 2020-61-DC | | | 1.50 | % | | | 09/25/2060 | | | | 5,757,485 | |
74,025,481 | | Federal National Mortgage Association REMICS, Series 2020-62-JD | | | 1.25 | % | | | 09/25/2050 | | | | 57,872,270 | |
18,738,549 | | Federal National Mortgage Association REMICS, Series 2020-70-IK | | | 3.50 | % (c) | | | 10/25/2050 | | | | 3,429,271 | |
23,202,708 | | Federal National Mortgage Association REMICS, Series 2020-97-EI | | | 2.00 | % (c) | | | 01/25/2051 | | | | 2,843,608 | |
18,731,976 | | Federal National Mortgage Association REMICS, Series 2021-13-AK | | | 2.00 | % | | | 01/25/2049 | | | | 16,493,505 | |
9,997,981 | | Federal National Mortgage Association REMICS, Series 2021-1-PA | | | 1.00 | % | | | 11/25/2050 | | | | 7,852,714 | |
15,079,614 | | Federal National Mortgage Association REMICS, Series 2021-21-DK | | | 2.00 | % | | | 07/25/2043 | | | | 13,257,400 | |
15,190,694 | | Federal National Mortgage Association REMICS, Series 2021-29-BA | | | 1.25 | % | | | 05/25/2041 | | | | 13,323,811 | |
4,105,829 | | Federal National Mortgage Association REMICS, Series 2021-29-CG | | | 1.25 | % | | | 05/25/2041 | | | | 3,602,483 | |
44,891,402 | | Federal National Mortgage Association REMICS, Series 2021-3-KI | | | 2.50 | % (c) | | | 02/25/2051 | | | | 6,218,936 | |
31,723,963 | | Federal National Mortgage Association REMICS, Series 2021-58-SA (-1 x Secured Overnight Financing Rate 30 Day Average + 2.65%, 2.65% Cap) | | | 0.00 | % (c)(d) | | | 09/25/2051 | | | | 598,479 | |
6,440,009 | | Federal National Mortgage Association REMICS, Series 2021-61-KZ | | | 2.50 | % (e) | | | 09/25/2051 | | | | 4,043,114 | |
90,200,732 | | Federal National Mortgage Association REMICS, Series 2021-70-S (-1 x Secured Overnight Financing Rate 30 Day Average + 3.75%, 3.75% Cap) | | | 0.00 | % (c)(d) | | | 10/25/2049 | | | | 3,667,129 | |
83,740,952 | | Federal National Mortgage Association REMICS, Series 2022-3-EZ | | | 2.00 | % (e) | | | 01/25/2052 | | | | 50,848,905 | |
56,886,751 | | Federal National Mortgage Association REMICS, Series 2022-3-NZ | | | 2.00 | % (e) | | | 02/25/2052 | | | | 34,539,820 | |
82,658,259 | | Federal National Mortgage Association REMICS, Series 2022-3-Z | | | 2.00 | % (e) | | | 02/25/2052 | | | | 50,018,256 | |
17,712,183 | | Federal National Mortgage Association REMICS, Series 2022-4-LG | | | 3.00 | % | | | 02/25/2052 | | | | 16,433,428 | |
128,700,396 | | Federal National Mortgage Association REMICS, Series 2023-2-IO | | | 3.00 | % (c) | | | 12/25/2051 | | | | 20,845,526 | |
16,354,643 | | Federal National Mortgage Association, Pool 387898 | | | 3.71 | % | | | 08/01/2030 | | | | 15,802,894 | |
25,134,138 | | Federal National Mortgage Association, Pool AM8510 | | | 3.15 | % | | | 05/01/2035 | | | | 22,948,628 | |
28,292,749 | | Federal National Mortgage Association, Pool AM8950 | | | 3.14 | % | | | 06/01/2040 | | | | 25,649,595 | |
4,625,692 | | Federal National Mortgage Association, Pool AN5480 | | | 3.43 | % | | | 06/01/2037 | | | | 4,350,880 | |
217,500,000 | | Federal National Mortgage Association, Pool AN6680 | | | 3.37 | % | | | 11/01/2047 | | | | 174,465,417 | |
5,500,000 | | Federal National Mortgage Association, Pool AN7330 | | | 3.26 | % | | | 12/01/2037 | | | | 4,851,630 | |
10,026,000 | | Federal National Mortgage Association, Pool AN7452 | | | 3.12 | % | | | 11/01/2032 | | | | 9,200,818 | |
20,700,000 | | Federal National Mortgage Association, Pool AN8121 | | | 3.16 | % | | | 01/01/2035 | | | | 18,384,279 | |
44,231,073 | | Federal National Mortgage Association, Pool BL0870 | | | 4.28 | % | | | 12/01/2048 | | | | 39,615,615 | |
5,000,000 | | Federal National Mortgage Association, Pool BL2303 | | | 3.36 | % | | | 05/01/2031 | | | | 4,738,825 | |
8,860,000 | | Federal National Mortgage Association, Pool BL4038 | | | 2.98 | % | | | 09/01/2034 | | | | 7,851,268 | |
13,075,000 | | Federal National Mortgage Association, Pool BL4198 | | | 2.31 | % | | | 10/01/2031 | | | | 11,364,250 | |
63,966,000 | | Federal National Mortgage Association, Pool BL4808 | | | 2.80 | % | | | 11/01/2039 | | | | 51,947,099 | |
17,125,000 | | Federal National Mortgage Association, Pool BL5256 | | | 2.28 | % | | | 02/01/2032 | | | | 14,787,276 | |
30,200,000 | | Federal National Mortgage Association, Pool BL5315 | | | 2.44 | % | | | 01/01/2032 | | | | 26,307,991 | |
8,190,000 | | Federal National Mortgage Association, Pool BL5840 | | | 2.73 | % | | | 02/01/2035 | | | | 6,886,309 | |
6,547,730 | | Federal National Mortgage Association, Pool BL6639 | | | 2.66 | % | | | 05/01/2050 | | | | 5,024,081 | |
16,912,784 | | Federal National Mortgage Association, Pool BL6689 | | | 2.19 | % | | | 05/01/2032 | | | | 14,469,842 | |
28,785,015 | | Federal National Mortgage Association, Pool BL6913 | | | 1.96 | % | | | 05/01/2035 | | | | 22,928,644 | |
36,488,000 | | Federal National Mortgage Association, Pool BL7110 | | | 1.76 | % | | | 07/01/2035 | | | | 28,321,331 | |
3,568,101 | | Federal National Mortgage Association, Pool BL7331 | | | 2.23 | % | | | 07/01/2040 | | | | 2,557,433 | |
20,400,000 | | Federal National Mortgage Association, Pool BL7424 | | | 1.65 | % | | | 08/01/2035 | | | | 15,434,431 | |
40,000,000 | | Federal National Mortgage Association, Pool BL8165 | | | 1.35 | % | | | 09/01/2032 | | | | 31,466,643 | |
32,000,000 | | Federal National Mortgage Association, Pool BL8269 | | | 1.51 | % | | | 09/01/2035 | | | | 24,261,956 | |
17,000,000 | | Federal National Mortgage Association, Pool BL8977 | | | 1.20 | % | | | 11/01/2030 | | | | 13,700,648 | |
48,643,000 | | Federal National Mortgage Association, Pool BL9056 | | | 1.78 | % | | | 11/01/2035 | | | | 36,077,067 | |
10,901,978 | | Federal National Mortgage Association, Pool BL9284 | | | 2.23 | % | | | 12/01/2050 | | | | 7,519,684 | |
53,000,000 | | Federal National Mortgage Association, Pool BL9576 | | | 2.24 | % | | | 12/01/2050 | | | | 34,890,089 | |
171,164,366 | | Federal National Mortgage Association, Pool BM6831 | | | 1.93 | % (a) | | | 10/01/2033 | | | | 138,850,052 | |
177,343,292 | | Federal National Mortgage Association, Pool BM6857 | | | 1.83 | % (a) | | | 12/01/2031 | | | | 147,587,692 | |
48,883,000 | | Federal National Mortgage Association, Pool BS2496 | | | 1.88 | % | | | 09/01/2033 | | | | 39,430,173 | |
5,592,000 | | Federal National Mortgage Association, Pool BS2500 | | | 1.81 | % | | | 06/01/2030 | | | | 4,774,685 | |
15,354,250 | | Federal National Mortgage Association, Pool BS2568 | | | 2.20 | % | | | 09/01/2046 | | | | 11,629,361 | |
3,000,000 | | Federal National Mortgage Association, Pool BS2580 | | | 2.15 | % | | | 08/01/2033 | | | | 2,484,031 | |
22,000,000 | | Federal National Mortgage Association, Pool BS2805 | | | 1.81 | % | | | 09/01/2033 | | | | 17,789,988 | |
9,975,000 | | Federal National Mortgage Association, Pool BS2834 | | | 2.24 | % | | | 08/01/2041 | | | | 6,948,248 | |
39,850,000 | | Federal National Mortgage Association, Pool BS3020 | | | 1.96 | % | | | 09/01/2033 | | | | 32,143,995 | |
34,043,000 | | Federal National Mortgage Association, Pool BS3101 | | | 1.91 | % | | | 09/01/2033 | | | | 27,700,437 | |
2,595,000 | | Federal National Mortgage Association, Pool BS3163 | | | 1.75 | % | | | 08/01/2030 | | | | 2,202,118 | |
19,880,000 | | Federal National Mortgage Association, Pool BS3192 | | | 2.03 | % | | | 09/01/2036 | | | | 14,992,229 | |
16,125,000 | | Federal National Mortgage Association, Pool BS3314 | | | 1.83 | % | | | 10/01/2033 | | | | 13,040,402 | |
21,000,000 | | Federal National Mortgage Association, Pool BS3345 | | | 2.16 | % | | | 10/01/2036 | | | | 16,463,335 | |
48,402,000 | | Federal National Mortgage Association, Pool BS3363 | | | 1.97 | % | | | 12/01/2035 | | | | 37,252,620 | |
25,042,000 | | Federal National Mortgage Association, Pool BS3426 | | | 1.76 | % | | | 11/01/2031 | | | | 20,237,019 | |
12,048,000 | | Federal National Mortgage Association, Pool BS3431 | | | 1.83 | % | | | 11/01/2033 | | | | 9,694,699 | |
6,536,000 | | Federal National Mortgage Association, Pool BS3434 | | | 1.83 | % | | | 11/01/2033 | | | | 5,259,342 | |
32,694,000 | | Federal National Mortgage Association, Pool BS3442 | | | 2.12 | % | | | 10/01/2036 | | | | 25,102,786 | |
49,716,000 | | Federal National Mortgage Association, Pool BS3458 | | | 1.98 | % | | | 10/01/2033 | | | | 40,955,287 | |
11,900,000 | | Federal National Mortgage Association, Pool BS3514 | | | 2.08 | % | | | 10/01/2033 | | | | 9,647,895 | |
43,652,000 | | Federal National Mortgage Association, Pool BS3833 | | | 2.09 | % | | | 12/01/2033 | | | | 35,989,022 | |
7,339,000 | | Federal National Mortgage Association, Pool BS3955 | | | 2.30 | % | | | 12/01/2036 | | | | 5,735,148 | |
46,000,000 | | Federal National Mortgage Association, Pool BS3974 | | | 1.94 | % | | | 01/01/2032 | | | | 38,275,162 | |
43,600,000 | | Federal National Mortgage Association, Pool BS4020 | | | 1.91 | % | | | 12/01/2031 | | | | 36,247,680 | |
21,200,000 | | Federal National Mortgage Association, Pool BS4110 | | | 2.13 | % | | | 01/01/2034 | | | | 17,580,210 | |
48,972,000 | | Federal National Mortgage Association, Pool BS4111 | | | 1.98 | % | | | 01/01/2032 | | | | 41,203,263 | |
46,000,000 | | Federal National Mortgage Association, Pool BS4125 | | | 2.32 | % | | | 12/01/2031 | | | | 39,198,009 | |
21,024,000 | | Federal National Mortgage Association, Pool BS4177 | | | 1.94 | % | | | 12/01/2031 | | | | 17,783,940 | |
12,500,000 | | Federal National Mortgage Association, Pool BS4213 | | | 2.46 | % | | | 12/01/2036 | | | | 10,116,498 | |
18,199,000 | | Federal National Mortgage Association, Pool BS4225 | | | 2.36 | % | | | 01/01/2037 | | | | 14,420,540 | |
20,000,000 | | Federal National Mortgage Association, Pool BS4273 | | | 1.93 | % | | | 12/01/2031 | | | | 16,851,187 | |
33,675,000 | | Federal National Mortgage Association, Pool BS4276 | | | 2.03 | % | | | 01/01/2032 | | | | 28,508,112 | |
43,878,000 | | Federal National Mortgage Association, Pool BS4296 | | | 1.80 | % | | | 01/01/2032 | | | | 36,030,992 | |
51,025,000 | | Federal National Mortgage Association, Pool BS4306 | | | 1.92 | % | | | 01/01/2032 | | | | 41,528,690 | |
60,975,000 | | Federal National Mortgage Association, Pool BS4328 | | | 1.88 | % | | | 02/01/2032 | | | | 50,358,128 | |
19,170,000 | | Federal National Mortgage Association, Pool BS4330 | | | 1.92 | % | | | 01/01/2034 | | | | 15,411,087 | |
30,761,000 | | Federal National Mortgage Association, Pool BS4333 | | | 1.89 | % | | | 01/01/2032 | | | | 25,199,483 | |
12,000,000 | | Federal National Mortgage Association, Pool BS4334 | | | 2.01 | % | | | 01/01/2034 | | | | 9,618,240 | |
18,569,549 | | Federal National Mortgage Association, Pool BS4359 | | | 1.99 | % | | | 01/01/2032 | | | | 15,825,829 | |
21,800,000 | | Federal National Mortgage Association, Pool BS4360 | | | 2.14 | % | | | 01/01/2037 | | | | 16,830,896 | |
92,763,174 | | Federal National Mortgage Association, Pool BS4383 | | | 2.07 | % | | | 01/01/2032 | | | | 79,591,929 | |
69,169,000 | | Federal National Mortgage Association, Pool BS4410 | | | 1.93 | % | | | 01/01/2032 | | | | 57,775,446 | |
53,950,000 | | Federal National Mortgage Association, Pool BS4453 | | | 1.96 | % | | | 01/01/2032 | | | | 44,463,049 | |
51,688,000 | | Federal National Mortgage Association, Pool BS4524 | | | 2.02 | % | | | 01/01/2032 | | | | 42,737,855 | |
41,850,000 | | Federal National Mortgage Association, Pool BS4736 | | | 2.00 | % | | | 02/01/2032 | | | | 34,239,029 | |
24,500,000 | | Federal National Mortgage Association, Pool BS4737 | | | 2.00 | % | | | 02/01/2032 | | | | 20,044,354 | |
20,155,000 | | Federal National Mortgage Association, Pool BS4951 | | | 2.63 | % | | | 04/01/2032 | | | | 17,396,341 | |
24,762,678 | | Federal National Mortgage Association, Pool BS6649 | | | 3.89 | % | | | 10/01/2032 | | | | 23,693,331 | |
139,849,000 | | Federal National Mortgage Association, Pool BS6912 | | | 4.33 | % | | | 12/01/2032 | | | | 138,610,261 | |
41,050,000 | | Federal National Mortgage Association, Pool BS7329 | | | 5.41 | % | | | 12/01/2032 | | | | 42,629,613 | |
11,270,008 | | Federal National Mortgage Association, Pool BV8021 | | | 4.50 | % | | | 08/01/2052 | | | | 11,074,761 | |
61,408,802 | | Federal National Mortgage Association, Pool CB4391 | | | 4.50 | % | | | 08/01/2052 | | | | 60,377,658 | |
5,481,140 | | Federal National Mortgage Association, Series 2003-W17-1A7 | | | 5.75 | % | | | 08/25/2033 | | | | 5,604,038 | |
1,721,874 | | Federal National Mortgage Association, Series 2004-W10-A6 | | | 5.75 | % | | | 08/25/2034 | | | | 1,738,871 | |
65,599,035 | | Federal National Mortgage Association, Series 2014-M11-1A | | | 3.16 | % (a) | | | 08/25/2024 | | | | 63,747,752 | |
206,552,086 | | Federal National Mortgage Association, Series 2019-M16-X | | | 1.18 | % (a)(c) | | | 07/25/2031 | | | | 13,015,425 | |
487,990,597 | | Federal National Mortgage Association, Series 2019-M18-X | | | 0.71 | % (a)(c) | | | 08/25/2029 | | | | 14,892,497 | |
212,026,243 | | Federal National Mortgage Association, Series 2019-M24-2XA | | | 1.14 | % (a)(c) | | | 03/25/2031 | | | | 13,206,924 | |
263,873,446 | | Federal National Mortgage Association, Series 2019-M24-XA | | | 1.25 | % (a)(c) | | | 03/25/2029 | | | | 15,188,213 | |
370,632,693 | | Federal National Mortgage Association, Series 2020-M10-X2 | | | 1.72 | % (a)(c) | | | 12/25/2030 | | | | 30,019,432 | |
192,135,890 | | Federal National Mortgage Association, Series 2020-M10-X8 | | | 0.72 | % (a)(c) | | | 12/25/2027 | | | | 4,197,843 | |
79,130,702 | | Federal National Mortgage Association, Series 2020-M13-X2 | | | 1.23 | % (a)(c) | | | 09/25/2030 | | | | 2,824,056 | |
511,417,001 | | Federal National Mortgage Association, Series 2020-M15-X1 | | | 1.47 | % (a)(c) | | | 09/25/2031 | | | | 29,305,984 | |
18,465,583 | | Federal National Mortgage Association, Series 2020-M17-X1 | | | 1.36 | % (a)(c) | | | 01/25/2028 | | | | 810,659 | |
122,032,414 | | Federal National Mortgage Association, Series 2020-M27-X1 | | | 0.87 | % (a)(c) | | | 03/25/2031 | | | | 5,216,507 | |
163,208,089 | | Federal National Mortgage Association, Series 2020-M54-X | | | 1.52 | % (a)(c) | | | 12/25/2033 | | | | 13,283,751 | |
53,237,500 | | Federal National Mortgage Association, Series 2020-M7-X2 | | | 1.24 | % (a)(c) | | | 03/25/2031 | | | | 3,555,419 | |
11,260,016 | | Federal National Mortgage Association, Series 2021-M12-2A1 | | | 2.13 | % (a) | | | 05/25/2033 | | | | 9,957,621 | |
934,583,950 | | Federal National Mortgage Association, Series 2021-M14-X | | | 0.98 | % (a)(c) | | | 10/25/2031 | | | | 39,600,191 | |
182,220,575 | | Federal National Mortgage Association, Series 2021-M3-X2 | | | 0.98 | % (a)(c) | | | 08/25/2033 | | | | 8,087,988 | |
22,840,091 | | Federal National Mortgage Association, Series 2021-M5-A1 | | | 1.46 | % (a) | | | 01/25/2033 | | | | 20,434,458 | |
714,338,768 | | Federal National Mortgage Association, Series 2022-M2-X | | | 0.39 | % (a)(c) | | | 01/25/2032 | | | | 18,668,672 | |
23,002,247 | | Federal National Mortgage Association, Series 2022-M4-A1X | | | 2.46 | % (a) | | | 05/25/2030 | | | | 20,910,089 | |
3,044,846 | | Federal National Mortgage Association, Series 400-S4 (-1 x 1 Month LIBOR USD + 5.45%, 5.45% Cap) | | | 0.60 | % (c)(d) | | | 11/25/2039 | | | | 213,993 | |
30,635,416 | | Federal National Mortgage Association, Series 412-A3 | | | 3.00 | % | | | 08/25/2042 | | | | 27,759,585 | |
25,360,390 | | Government National Mortgage Association Pass-Thru, Pool 786510 | | | 3.00 | % | | | 02/20/2052 | | | | 22,616,236 | |
28,796,221 | | Government National Mortgage Association Pass-Thru, Pool 785310 | | | 2.50 | % | | | 02/20/2051 | | | | 25,274,339 | |
44,949,080 | | Government National Mortgage Association Pass-Thru, Pool 785346 | | | 2.00 | % | | | 03/20/2051 | | | | 37,179,466 | |
13,321,403 | | Government National Mortgage Association Pass-Thru, Pool 785350 | | | 2.00 | % | | | 01/20/2051 | | | | 11,034,780 | |
26,612,004 | | Government National Mortgage Association Pass-Thru, Pool 785374 | | | 2.50 | % | | | 03/20/2051 | | | | 23,437,960 | |
93,044,155 | | Government National Mortgage Association Pass-Thru, Pool 785401 | | | 2.50 | % | | | 10/20/2050 | | | | 79,619,675 | |
132,323,522 | | Government National Mortgage Association Pass-Thru, Pool 785412 | | | 2.50 | % | | | 03/20/2051 | | | | 116,145,379 | |
30,305,012 | | Government National Mortgage Association Pass-Thru, Pool 785595 | | | 2.50 | % | | | 03/20/2051 | | | | 26,676,479 | |
57,091,598 | | Government National Mortgage Association Pass-Thru, Pool 785609 | | | 2.50 | % | | | 08/20/2051 | | | | 50,185,383 | |
14,451,504 | | Government National Mortgage Association Pass-Thru, Pool 785638 | | | 2.50 | % | | | 08/20/2051 | | | | 12,685,085 | |
33,275,307 | | Government National Mortgage Association Pass-Thru, Pool 785639 | | | 2.50 | % | | | 08/20/2051 | | | | 29,204,844 | |
13,600,322 | | Government National Mortgage Association Pass-Thru, Pool 785680 | | | 2.50 | % | | | 10/20/2051 | | | | 11,938,502 | |
10,476,197 | | Government National Mortgage Association Pass-Thru, Pool CB2017 | | | 2.50 | % | | | 03/20/2051 | | | | 9,196,027 | |
10,164,921 | | Government National Mortgage Association Pass-Thru, Pool CB4182 | | | 2.50 | % | | | 03/20/2051 | | | | 8,921,278 | |
2,897,962 | | Government National Mortgage Association Pass-Thru, Pool CB5487 | | | 2.50 | % | | | 03/20/2051 | | | | 2,486,893 | |
8,942,364 | | Government National Mortgage Association Pass-Thru, Pool CB9135 | | | 2.50 | % | | | 04/20/2051 | | | | 7,915,052 | |
7,964,181 | | Government National Mortgage Association Pass-Thru, Pool CH0426 | | | 2.50 | % | | | 02/20/2052 | | | | 6,780,190 | |
6,589,072 | | Government National Mortgage Association Pass-Thru, Pool CI0294 | | | 2.50 | % | | | 01/20/2052 | | | | 5,609,555 | |
28,426,542 | | Government National Mortgage Association Pass-Thru, Pool CI6428 | | | 2.50 | % | | | 01/20/2052 | | | | 24,201,616 | |
596,884 | | Government National Mortgage Association Pass-Thru, Pool MA2511 | | | 3.50 | % | | | 01/20/2045 | | | | 555,904 | |
11,419,627 | | Government National Mortgage Association Pass-Thru, Pool MA7255 | | | 2.50 | % | | | 03/20/2051 | | | | 10,065,365 | |
36,002,530 | | Government National Mortgage Association REMICS, Series 2021-49-NI | | | 2.50 | % | | | 03/20/2051 | | | | 4,511,758 | |
28,531,474 | | Government National Mortgage Association, Series 2021-125-IO | | | 3.00 | % | | | 06/20/2051 | | | | 3,735,309 | |
4,996,681 | | Government National Mortgage Association, Series 2003-67-SP (-1 x 1 Month LIBOR USD + 7.10%, 7.10% Cap) | | | 2.50 | % (c)(d) | | | 08/20/2033 | | | | 191,401 | |
2,063,201 | | Government National Mortgage Association, Series 2003-86-ZK | | | 5.00 | % | | | 10/20/2033 | | | | 2,071,169 | |
1,244,916 | | Government National Mortgage Association, Series 2004-49-Z | | | 6.00 | % | | | 06/20/2034 | | | | 1,277,124 | |
2,289,184 | | Government National Mortgage Association, Series 2004-83-CS (-1 x 1 Month LIBOR USD + 6.08%, 6.08% Cap) | | | 1.32 | % (c)(d) | | | 10/20/2034 | | | | 120,908 | |
576,683 | | Government National Mortgage Association, Series 2005-21-Z | | | 5.00 | % | | | 03/20/2035 | | | | 583,387 | |
6,223,120 | | Government National Mortgage Association, Series 2005-39-ZB | | | 5.00 | % | | | 07/20/2034 | | | | 6,286,534 | |
438,860 | | Government National Mortgage Association, Series 2006-24-CX (-7 x 1 Month LIBOR USD + 39.97%, 39.97% Cap) | | | 5.05 | % (d) | | | 05/20/2036 | | | | 460,625 | |
2,266,057 | | Government National Mortgage Association, Series 2007-26-SJ (-1 x 1 Month LIBOR USD + 4.69%, 4.69% Cap) | | | 0.00 | % (c)(d) | | | 04/20/2037 | | | | 25,937 | |
2,365,899 | | Government National Mortgage Association, Series 2008-2-SM (-1 x 1 Month LIBOR USD + 6.50%, 6.50% Cap) | | | 1.77 | % (c)(d) | | | 01/16/2038 | | | | 182,372 | |
4,069,587 | | Government National Mortgage Association, Series 2008-42-AI (-1 x 1 Month LIBOR USD + 7.69%, 7.69% Cap) | | | 2.96 | % (c)(d) | | | 05/16/2038 | | | | 527,138 | |
1,472,544 | | Government National Mortgage Association, Series 2008-43-SH (-1 x 1 Month LIBOR USD + 6.34%, 6.34% Cap) | | | 1.57 | % (c)(d) | | | 05/20/2038 | | | | 38,086 | |
1,696,646 | | Government National Mortgage Association, Series 2008-51-SC (-1 x 1 Month LIBOR USD + 6.25%, 6.25% Cap) | | | 1.49 | % (c)(d) | | | 06/20/2038 | | | | 101,860 | |
1,359,137 | | Government National Mortgage Association, Series 2008-51-SE (-1 x 1 Month LIBOR USD + 6.25%, 6.25% Cap) | | | 1.52 | % (c)(d) | | | 06/16/2038 | | | | 100,053 | |
485,055 | | Government National Mortgage Association, Series 2008-82-SM (-1 x 1 Month LIBOR USD + 6.05%, 6.05% Cap) | | | 1.29 | % (c)(d) | | | 09/20/2038 | | | | 12,245 | |
843,607 | | Government National Mortgage Association, Series 2008-83-SD (-1 x 1 Month LIBOR USD + 6.56%, 6.56% Cap) | | | 1.83 | % (c)(d) | | | 11/16/2036 | | | | 33,499 | |
3,382,455 | | Government National Mortgage Association, Series 2009-106-VZ | | | 4.50 | % | | | 11/20/2039 | | | | 3,336,063 | |
2,841,981 | | Government National Mortgage Association, Series 2009-10-NS (-1 x 1 Month LIBOR USD + 6.65%, 6.65% Cap) | | | 1.92 | % (c)(d) | | | 02/16/2039 | | | | 256,531 | |
615,777 | | Government National Mortgage Association, Series 2009-24-SN (-1 x 1 Month LIBOR USD + 6.10%, 6.10% Cap) | | | 1.34 | % (c)(d) | | | 09/20/2038 | | | | 17,775 | |
2,027,440 | | Government National Mortgage Association, Series 2009-32-ZE | | | 4.50 | % | | | 05/16/2039 | | | | 2,009,483 | |
10,911,812 | | Government National Mortgage Association, Series 2009-35-DZ | | | 4.50 | % | | | 05/20/2039 | | | | 10,783,357 | |
9,082 | | Government National Mortgage Association, Series 2009-41-ZQ | | | 4.50 | % (e) | | | 06/16/2039 | | | | 8,965 | |
1,431,283 | | Government National Mortgage Association, Series 2009-48-Z | | | 5.00 | % | | | 06/16/2039 | | | | 1,428,047 | |
126,132 | | Government National Mortgage Association, Series 2009-50-KP | | | 4.50 | % | | | 06/20/2039 | | | | 124,639 | |
856,529 | | Government National Mortgage Association, Series 2009-69-TS (-1 x 1 Month LIBOR USD + 6.20%, 6.20% Cap) | | | 1.47 | % (c)(d) | | | 04/16/2039 | | | | 32,223 | |
1,553,943 | | Government National Mortgage Association, Series 2009-75-GZ | | | 4.50 | % | | | 09/20/2039 | | | | 1,535,973 | |
561,498 | | Government National Mortgage Association, Series 2009-87-IG (-1 x 1 Month LIBOR USD + 6.74%, 6.74% Cap) | | | 1.98 | % (c)(d) | | | 03/20/2037 | | | | 7,646 | |
7,861,194 | | Government National Mortgage Association, Series 2010-106-PS (-1 x 1 Month LIBOR USD + 6.05%, 6.05% Cap) | | | 1.29 | % (c)(d) | | | 03/20/2040 | | | | 225,608 | |
3,045,343 | | Government National Mortgage Association, Series 2010-1-SA (-1 x 1 Month LIBOR USD + 5.75%, 5.75% Cap) | | | 1.02 | % (c)(d) | | | 01/16/2040 | | | | 203,437 | |
2,721,187 | | Government National Mortgage Association, Series 2010-25-ZB | | | 4.50 | % | | | 02/16/2040 | | | | 2,706,452 | |
22,607,922 | | Government National Mortgage Association, Series 2010-26-QS (-1 x 1 Month LIBOR USD + 6.25%, 6.25% Cap) | | | 1.49 | % (c)(d) | | | 02/20/2040 | | | | 2,341,844 | |
1,954,012 | | Government National Mortgage Association, Series 2010-42-AY | | | 5.00 | % | | | 11/20/2039 | | | | 1,976,881 | |
1,864,201 | | Government National Mortgage Association, Series 2010-42-ES (-1 x 1 Month LIBOR USD + 5.68%, 5.68% Cap) | | | 0.92 | % (c)(d) | | | 04/20/2040 | | | | 142,656 | |
567,778 | | Government National Mortgage Association, Series 2010-61-AS (-1 x 1 Month LIBOR USD + 6.55%, 6.55% Cap) | | | 1.79 | % (c)(d) | | | 09/20/2039 | | | | 29,423 | |
5,892,162 | | Government National Mortgage Association, Series 2010-62-SB (-1 x 1 Month LIBOR USD + 5.75%, 5.75% Cap) | | | 0.99 | % (c)(d) | | | 05/20/2040 | | | | 454,207 | |
6,677,883 | | Government National Mortgage Association, Series 2010-62-ZG | | | 5.50 | % | | | 05/16/2040 | | | | 6,846,629 | |
2,896,531 | | Government National Mortgage Association, Series 2011-18-SN (-2 x 1 Month LIBOR USD + 9.50%, 9.50% Cap) | | | 0.00 | % (d) | | | 12/20/2040 | | | | 2,394,216 | |
2,900,196 | | Government National Mortgage Association, Series 2011-18-YS (-2 x 1 Month LIBOR USD + 9.50%, 9.50% Cap) | | | 0.00 | % (d) | | | 12/20/2040 | | | | 2,371,118 | |
818,475 | | Government National Mortgage Association, Series 2011-69-OC | | | 0.00 | % (g) | | | 05/20/2041 | | | | 691,437 | |
8,265,240 | | Government National Mortgage Association, Series 2011-69-SB (-1 x 1 Month LIBOR USD + 5.35%, 5.35% Cap) | | | 0.59 | % (c)(d) | | | 05/20/2041 | | | | 590,223 | |
8,168,755 | | Government National Mortgage Association, Series 2011-71-ZA | | | 4.50 | % | | | 02/20/2041 | | | | 8,073,339 | |
3,166,499 | | Government National Mortgage Association, Series 2011-72-AS (-1 x 1 Month LIBOR USD + 5.38%, 5.38% Cap) | | | 0.62 | % (c)(d) | | | 05/20/2041 | | | | 228,810 | |
2,486,214 | | Government National Mortgage Association, Series 2011-72-SK (-1 x 1 Month LIBOR USD + 6.15%, 6.15% Cap) | | | 1.39 | % (c)(d) | | | 05/20/2041 | | | | 180,859 | |
8,256,023 | | Government National Mortgage Association, Series 2013-116-LS (-1 x 1 Month LIBOR USD + 6.15%, 6.15% Cap) | | | 1.39 | % (c)(d) | | | 08/20/2043 | | | | 847,012 | |
11,973,367 | | Government National Mortgage Association, Series 2013-136-CS (-1 x 1 Month LIBOR USD + 6.20%, 6.20% Cap) | | | 1.47 | % (c)(d) | | | 09/16/2043 | | | | 1,003,945 | |
19,460,362 | | Government National Mortgage Association, Series 2013-182-WZ | | | 2.50 | % | | | 12/20/2043 | | | | 17,592,401 | |
59,987,577 | | Government National Mortgage Association, Series 2013-182-ZW | | | 2.50 | % | | | 12/20/2043 | | | | 55,166,879 | |
4,412,237 | | Government National Mortgage Association, Series 2013-186-SG (-1 x 1 Month LIBOR USD + 6.25%, 6.25% Cap) | | | 1.52 | % (c)(d) | | | 02/16/2043 | | | | 246,157 | |
5,645,282 | | Government National Mortgage Association, Series 2013-26-MS (-1 x 1 Month LIBOR USD + 6.25%, 6.25% Cap) | | | 1.49 | % (c)(d) | | | 02/20/2043 | | | | 627,779 | |
3,976,521 | | Government National Mortgage Association, Series 2013-34-PL | | | 3.00 | % | | | 03/20/2042 | | | | 3,862,394 | |
9,772,844 | | Government National Mortgage Association, Series 2014-163-PS (-1 x 1 Month LIBOR USD + 5.60%, 5.60% Cap) | | | 0.84 | % (c)(d) | | | 11/20/2044 | | | | 794,248 | |
10,627,475 | | Government National Mortgage Association, Series 2014-167-SA (-1 x 1 Month LIBOR USD + 5.60%, 5.60% Cap) | | | 0.84 | % (c)(d) | | | 11/20/2044 | | | | 883,053 | |
17,965,522 | | Government National Mortgage Association, Series 2014-21-SE (-1 x 1 Month LIBOR USD + 5.55%, 5.55% Cap) | | | 0.79 | % (c)(d) | | | 02/20/2044 | | | | 1,387,217 | |
11,013,339 | | Government National Mortgage Association, Series 2014-39-SK (-1 x 1 Month LIBOR USD + 6.20%, 6.20% Cap) | | | 1.44 | % (c)(d) | | | 03/20/2044 | | | | 1,102,835 | |
11,974,775 | | Government National Mortgage Association, Series 2014-59-DS (-1 x 1 Month LIBOR USD + 6.25%, 6.25% Cap) | | | 1.52 | % (c)(d) | | | 04/16/2044 | | | | 1,169,633 | |
11,303,504 | | Government National Mortgage Association, Series 2016-108-SM (-1 x 1 Month LIBOR USD + 6.10%, 6.10% Cap) | | | 1.34 | % (c)(d) | | | 08/20/2046 | | | | 1,355,624 | |
23,178,638 | | Government National Mortgage Association, Series 2019-122-IO | | | 1.00 | % (a)(c) | | | 07/16/2061 | | | | 1,509,741 | |
21,387,906 | | Government National Mortgage Association, Series 2020-104-AI | | | 3.00 | % (c) | | | 07/20/2050 | | | | 3,003,454 | |
5,872,735 | | Government National Mortgage Association, Series 2020-104-EI | | | 3.00 | % (c) | | | 07/20/2050 | | | | 865,105 | |
11,563,837 | | Government National Mortgage Association, Series 2020-112-LS (-1 x Secured Overnight Financing Rate 30 Day Average + 6.20%, 6.20% Cap) | | | 1.64 | % (c)(d) | | | 08/20/2050 | | | | 1,570,680 | |
45,430,141 | | Government National Mortgage Association, Series 2020-115-IG | | | 2.50 | % (c) | | | 08/20/2050 | | | | 6,343,665 | |
21,929,902 | | Government National Mortgage Association, Series 2020-138-IC | | | 3.50 | % (c) | | | 08/20/2050 | | | | 3,650,458 | |
160,570,996 | | Government National Mortgage Association, Series 2020-140-ES (-1 x 1 Month LIBOR USD + 6.30%, 6.30% Cap) | | | 1.54 | % (c)(d) | | | 09/20/2050 | | | | 21,910,860 | |
41,255,315 | | Government National Mortgage Association, Series 2020-140-SG (-1 x 1 Month LIBOR USD + 6.35%, 6.35% Cap) | | | 1.59 | % (c)(d) | | | 09/20/2050 | | | | 5,575,371 | |
53,404,318 | | Government National Mortgage Association, Series 2020-146-CI | | | 2.50 | % (c) | | | 10/20/2050 | | | | 6,479,444 | |
35,438,206 | | Government National Mortgage Association, Series 2020-146-EI | | | 2.50 | % (c) | | | 10/20/2050 | | | | 4,914,400 | |
28,158,850 | | Government National Mortgage Association, Series 2020-146-KI | | | 2.50 | % (c) | | | 10/20/2050 | | | | 3,714,783 | |
38,942,073 | | Government National Mortgage Association, Series 2020-148-JL | | | 1.00 | % | | | 10/20/2050 | | | | 29,890,911 | |
21,081,106 | | Government National Mortgage Association, Series 2020-151-MI | | | 2.50 | % (c) | | | 10/20/2050 | | | | 2,828,387 | |
66,714,677 | | Government National Mortgage Association, Series 2020-152-IO | | | 0.59 | % (a)(c) | | | 12/16/2062 | | | | 3,459,476 | |
48,990,912 | | Government National Mortgage Association, Series 2020-160-IA | | | 2.50 | % (c) | | | 10/20/2050 | | | | 6,702,290 | |
12,029,956 | | Government National Mortgage Association, Series 2020-160-IM | | | 2.50 | % (c) | | | 10/20/2050 | | | | 1,591,433 | |
38,580,473 | | Government National Mortgage Association, Series 2020-162-QS (-1 x 1 Month LIBOR USD + 6.30%, 6.30% Cap) | | | 1.54 | % (c)(d) | | | 10/20/2050 | | | | 4,827,814 | |
55,779,119 | | Government National Mortgage Association, Series 2020-166-SM (-1 x 1 Month LIBOR USD + 6.30%, 6.30% Cap) | | | 1.54 | % (c)(d) | | | 11/20/2050 | | | | 7,528,586 | |
17,694,336 | | Government National Mortgage Association, Series 2020-167-BI | | | 2.50 | % (c) | | | 11/20/2050 | | | | 2,286,094 | |
35,728,522 | | Government National Mortgage Association, Series 2020-167-IA | | | 2.50 | % (c) | | | 11/20/2050 | | | | 4,633,821 | |
85,023,445 | | Government National Mortgage Association, Series 2020-167-JI | | | 2.50 | % (c) | | | 11/20/2050 | | | | 11,843,638 | |
16,111,523 | | Government National Mortgage Association, Series 2020-167-NS (-1 x 1 Month LIBOR USD + 6.30%, 6.30% Cap) | | | 1.54 | % (c)(d) | | | 11/20/2050 | | | | 1,950,743 | |
29,812,165 | | Government National Mortgage Association, Series 2020-167-YK | | | 1.20 | % | | | 11/20/2050 | | | | 23,239,450 | |
91,662,062 | | Government National Mortgage Association, Series 2020-173-MI | | | 2.50 | % (c) | | | 11/20/2050 | | | | 12,222,760 | |
41,240,014 | | Government National Mortgage Association, Series 2020-175-SC (-1 x 1 Month LIBOR USD + 6.30%, 6.30% Cap) | | | 1.54 | % (c)(d) | | | 11/20/2050 | | | | 5,780,637 | |
30,474,977 | | Government National Mortgage Association, Series 2020-181-AI | | | 2.50 | % (c) | | | 12/20/2050 | | | | 3,963,865 | |
52,838,861 | | Government National Mortgage Association, Series 2020-181-BI | | | 2.50 | % (c) | | | 12/20/2050 | | | | 7,350,218 | |
33,392,217 | | Government National Mortgage Association, Series 2020-181-SA (-1 x 1 Month LIBOR USD + 6.30%, 6.30% Cap) | | | 1.54 | % (c)(d) | | | 12/20/2050 | | | | 3,949,438 | |
30,118,705 | | Government National Mortgage Association, Series 2020-181-YM | | | 1.17 | % | | | 12/20/2050 | | | | 23,443,328 | |
71,121,878 | | Government National Mortgage Association, Series 2020-185-AI | | | 2.50 | % (c) | | | 12/20/2050 | | | | 9,749,401 | |
55,640,373 | | Government National Mortgage Association, Series 2020-185-KI | | | 2.50 | % (c) | | | 12/20/2050 | | | | 7,119,892 | |
51,599,319 | | Government National Mortgage Association, Series 2020-187-AI | | | 2.50 | % (c) | | | 12/20/2050 | | | | 6,644,073 | |
5,976,438 | | Government National Mortgage Association, Series 2020-188-DI | | | 2.50 | % (c) | | | 12/20/2050 | | | | 834,415 | |
29,940,285 | | Government National Mortgage Association, Series 2020-188-GI | | | 2.00 | % (c) | | | 12/20/2050 | | | | 3,296,348 | |
44,455,408 | | Government National Mortgage Association, Series 2020-188-IQ | | | 3.00 | % (c) | | | 10/20/2050 | | | | 6,674,508 | |
98,007,930 | | Government National Mortgage Association, Series 2020-188-KI | | | 2.50 | % (c) | | | 12/20/2050 | | | | 13,668,931 | |
39,909,484 | | Government National Mortgage Association, Series 2020-188-NS (-1 x 1 Month LIBOR USD + 6.30%, 6.30% Cap) | | | 1.54 | % (c)(d) | | | 12/20/2050 | | | | 4,724,010 | |
40,727,654 | | Government National Mortgage Association, Series 2020-195-IX | | | 1.13 | % (a)(c) | | | 12/16/2062 | | | | 3,088,215 | |
9,661,840 | | Government National Mortgage Association, Series 2020-79-KG | | | 1.30 | % | | | 06/20/2050 | | | | 7,833,205 | |
19,087,411 | | Government National Mortgage Association, Series 2020-98-SA (-1 x 1 Month LIBOR USD + 6.15%, 6.15% Cap) | | | 1.39 | % (c)(d) | | | 07/20/2050 | | | | 2,229,070 | |
119,689,687 | | Government National Mortgage Association, Series 2021-100-IO | | | 0.97 | % (a)(c) | | | 06/16/2063 | | | | 8,472,534 | |
69,502,261 | | Government National Mortgage Association, Series 2021-107-QI | | | 2.50 | % (c) | | | 06/20/2051 | | | | 9,730,469 | |
67,900,805 | | Government National Mortgage Association, Series 2021-10-IO | | | 0.99 | % (a)(c) | | | 05/16/2063 | | | | 4,928,003 | |
132,792,192 | | Government National Mortgage Association, Series 2021-110-IO | | | 0.87 | % (a)(c) | | | 11/16/2063 | | | | 9,181,053 | |
27,375,131 | | Government National Mortgage Association, Series 2021-114-SB (-1 x 1 Month LIBOR USD + 2.60%, 2.60% Cap) | | | 0.00 | % (c)(d) | | | 06/20/2051 | | | | 291,882 | |
49,475,686 | | Government National Mortgage Association, Series 2021-116-IA | | | 2.50 | % (c) | | | 06/20/2051 | | | | 6,908,587 | |
50,147,150 | | Government National Mortgage Association, Series 2021-116-XI | | | 3.50 | % (c) | | | 03/20/2051 | | | | 8,114,666 | |
23,836,698 | | Government National Mortgage Association, Series 2021-117-IJ | | | 3.50 | % (c) | | | 06/20/2051 | | | | 3,568,673 | |
18,600,373 | | Government National Mortgage Association, Series 2021-117-SH (-1 x 1 Month LIBOR USD + 6.30%, 6.30% Cap) | | | 1.54 | % (c)(d) | | | 07/20/2051 | | | | 1,850,304 | |
126,539,467 | | Government National Mortgage Association, Series 2021-122-SA (-1 x Secured Overnight Financing Rate 30 Day Average + 2.60%, 2.60% Cap) | | | 0.00 | % (c)(d) | | | 07/20/2051 | | | | 1,191,787 | |
247,744,689 | | Government National Mortgage Association, Series 2021-12-IO | | | 0.97 | % (a)(c) | | | 03/16/2063 | | | | 17,073,573 | |
67,467,466 | | Government National Mortgage Association, Series 2021-135-GI | | | 3.00 | % (c) | | | 08/20/2051 | | | | 9,776,852 | |
86,672,726 | | Government National Mortgage Association, Series 2021-135-SK (-1 x 1 Month LIBOR USD + 6.30%, 6.30% Cap) | | | 1.54 | % (c)(d) | | | 08/20/2051 | | | | 9,315,853 | |
69,374,312 | | Government National Mortgage Association, Series 2021-136-EI | | | 3.00 | % (c) | | | 08/20/2051 | | | | 10,060,052 | |
42,920,530 | | Government National Mortgage Association, Series 2021-138-IL | | | 3.00 | % (c) | | | 08/20/2051 | | | | 6,061,306 | |
42,381,566 | | Government National Mortgage Association, Series 2021-138-KI | | | 3.00 | % (c) | | | 08/20/2051 | | | | 6,483,663 | |
67,765,651 | | Government National Mortgage Association, Series 2021-138-PS (-1 x Secured Overnight Financing Rate 30 Day Average + 3.75%, 3.75% Cap) | | | 0.00 | % (c)(d) | | | 08/20/2051 | | | | 1,422,984 | |
16,643,750 | | Government National Mortgage Association, Series 2021-139-BI | | | 3.50 | % (c) | | | 08/20/2051 | | | | 2,457,105 | |
53,943,892 | | Government National Mortgage Association, Series 2021-140-IJ | | | 3.00 | % (c) | | | 08/20/2051 | | | | 8,335,739 | |
34,201,526 | | Government National Mortgage Association, Series 2021-142-IO | | | 3.00 | % (c) | | | 08/20/2051 | | | | 5,129,473 | |
114,205,749 | | Government National Mortgage Association, Series 2021-143-IO | | | 0.97 | % (a)(c) | | | 10/16/2063 | | | | 8,011,442 | |
86,954,546 | | Government National Mortgage Association, Series 2021-144-IO | | | 0.82 | % (a)(c) | | | 04/16/2063 | | | | 5,662,889 | |
69,666,920 | | Government National Mortgage Association, Series 2021-151-IO | | | 0.92 | % (a)(c) | | | 04/16/2063 | | | | 4,917,739 | |
31,820,447 | | Government National Mortgage Association, Series 2021-155-IE | | | 3.00 | % (c) | | | 09/20/2051 | | | | 4,893,301 | |
89,124,331 | | Government National Mortgage Association, Series 2021-155-KI | | | 4.00 | % (c) | | | 09/20/2051 | | | | 13,544,046 | |
41,867,247 | | Government National Mortgage Association, Series 2021-155-S (-1 x Secured Overnight Financing Rate 30 Day Average + 3.20%, 3.20% Cap) | | | 0.00 | % (c)(d) | | | 09/20/2051 | | | | 803,361 | |
43,292,603 | | Government National Mortgage Association, Series 2021-155-SG (-1 x 1 Month LIBOR USD + 6.30%, 6.30% Cap) | | | 1.54 | % (c)(d) | | | 09/20/2051 | | | | 5,969,799 | |
51,252,080 | | Government National Mortgage Association, Series 2021-158-IO | | | 3.00 | % (c) | | | 09/20/2051 | | | | 7,766,110 | |
69,112,979 | | Government National Mortgage Association, Series 2021-158-IV | | | 2.50 | % (c) | | | 09/20/2051 | | | | 9,642,843 | |
30,202,402 | | Government National Mortgage Association, Series 2021-15-BI | | | 2.50 | % (c) | | | 01/20/2051 | | | | 4,043,344 | |
27,257,980 | | Government National Mortgage Association, Series 2021-160-IA | | | 3.00 | % (c) | | | 09/20/2051 | | | | 4,015,362 | |
86,701,059 | | Government National Mortgage Association, Series 2021-160-SQ (-1 x Secured Overnight Financing Rate 30 Day Average + 2.65%, 3.00% Cap) | | | 0.00 | % (c)(d) | | | 09/20/2051 | | | | 1,736,752 | |
39,358,037 | | Government National Mortgage Association, Series 2021-160-WI | | | 2.50 | % (c) | | | 09/20/2051 | | | | 5,100,369 | |
46,685,041 | | Government National Mortgage Association, Series 2021-160-XI | | | 3.00 | % (c) | | | 09/20/2051 | | | | 6,808,042 | |
47,986,115 | | Government National Mortgage Association, Series 2021-161-KI | | | 3.50 | % (c) | | | 09/20/2051 | | | | 7,948,315 | |
89,847,158 | | Government National Mortgage Association, Series 2021-161-UI | | | 3.00 | % (c) | | | 09/20/2051 | | | | 13,228,179 | |
30,161,064 | | Government National Mortgage Association, Series 2021-162-DI | | | 3.00 | % (c) | | | 09/20/2051 | | | | 4,513,166 | |
15,475,488 | | Government National Mortgage Association, Series 2021-170-IO | | | 0.99 | % (a)(c) | | | 05/16/2063 | | | | 1,142,930 | |
16,424,850 | | Government National Mortgage Association, Series 2021-175-IN | | | 2.50 | % (c) | | | 07/20/2051 | | | | 2,271,370 | |
57,252,244 | | Government National Mortgage Association, Series 2021-175-IU | | | 2.50 | % (c) | | | 09/20/2051 | | | | 7,719,629 | |
49,364,771 | | Government National Mortgage Association, Series 2021-176-TI | | | 4.00 | % (c) | | | 10/20/2051 | | | | 7,288,916 | |
131,316,615 | | Government National Mortgage Association, Series 2021-177-IA | | | 2.50 | % (c) | | | 10/20/2051 | | | | 17,497,821 | |
59,990,633 | | Government National Mortgage Association, Series 2021-180-IO | | | 0.90 | % (a)(c) | | | 11/16/2063 | | | | 4,342,890 | |
70,688,697 | | Government National Mortgage Association, Series 2021-184-IO | | | 0.88 | % (a)(c) | | | 12/16/2061 | | | | 4,769,430 | |
29,869,472 | | Government National Mortgage Association, Series 2021-188-IA | | | 3.00 | % (c) | | | 10/20/2051 | | | | 4,217,265 | |
51,722,910 | | Government National Mortgage Association, Series 2021-188-IN | | | 2.50 | % (c) | | | 10/20/2051 | | | | 7,266,562 | |
37,243,423 | | Government National Mortgage Association, Series 2021-188-IT | | | 2.50 | % (c) | | | 10/20/2051 | | | | 4,994,641 | |
25,524,647 | | Government National Mortgage Association, Series 2021-191-BI | | | 2.50 | % (c) | | | 10/20/2051 | | | | 3,576,570 | |
51,154,961 | | Government National Mortgage Association, Series 2021-191-CI | | | 2.50 | % (c) | | | 10/20/2051 | | | | 7,179,660 | |
31,624,873 | | Government National Mortgage Association, Series 2021-192-AI | | | 3.00 | % (c) | | | 10/20/2051 | | | | 4,774,132 | |
130,416,219 | | Government National Mortgage Association, Series 2021-193-FW (Secured Overnight Financing Rate 30 Day Average + 0.45%, 0.45% Floor, 3.00% Cap) | | | 3.00 | % | | | 11/20/2051 | | | | 115,219,769 | |
135,624,187 | | Government National Mortgage Association, Series 2021-193-SW (-1 x Secured Overnight Financing Rate 30 Day Average + 2.55%, 2.55% Cap) | | | 0.00 | % (c)(d) | | | 11/20/2051 | | | | 1,421,843 | |
77,495,337 | | Government National Mortgage Association, Series 2021-196-IO | | | 2.50 | % (c) | | | 11/20/2051 | | | | 10,903,501 | |
88,132,415 | | Government National Mortgage Association, Series 2021-1-EI | | | 2.00 | % (c) | | | 01/20/2051 | | | | 8,207,102 | |
89,217,911 | | Government National Mortgage Association, Series 2021-200-IO | | | 0.88 | % (a)(c) | | | 11/16/2063 | | | | 6,350,647 | |
27,646,214 | | Government National Mortgage Association, Series 2021-205-DI | | | 2.50 | % (c) | | | 11/20/2051 | | | | 3,549,080 | |
187,663,293 | | Government National Mortgage Association, Series 2021-208-IO | | | 0.75 | % (a)(c) | | | 06/16/2064 | | | | 11,040,776 | |
34,290,399 | | Government National Mortgage Association, Series 2021-20-IO | | | 1.14 | % (a)(c) | | | 08/16/2062 | | | | 2,603,001 | |
185,926,585 | | Government National Mortgage Association, Series 2021-210-IO | | | 0.98 | % (a)(c) | | | 05/16/2062 | | | | 13,600,288 | |
53,244,678 | | Government National Mortgage Association, Series 2021-211-IO | | | 0.97 | % (a)(c) | | | 01/16/2063 | | | | 3,842,503 | |
36,916,288 | | Government National Mortgage Association, Series 2021-213-IH | | | 3.00 | % (c) | | | 12/20/2051 | | | | 5,319,585 | |
10,132,365 | | Government National Mortgage Association, Series 2021-226-TI | | | 2.50 | % (c) | | | 12/20/2051 | | | | 1,423,995 | |
272,483,359 | | Government National Mortgage Association, Series 2021-22-IO | | | 0.98 | % (a)(c) | | | 05/16/2063 | | | | 18,937,512 | |
82,609,915 | | Government National Mortgage Association, Series 2021-24-XI | | | 2.00 | % (c) | | | 02/20/2051 | | | | 8,803,425 | |
34,772,158 | | Government National Mortgage Association, Series 2021-24-YD | | | 1.20 | % | | | 02/20/2051 | | | | 27,109,073 | |
12,366,177 | | Government National Mortgage Association, Series 2021-25-EI | | | 2.50 | % (c) | | | 02/20/2051 | | | | 1,549,930 | |
63,399,605 | | Government National Mortgage Association, Series 2021-2-IO | | | 0.87 | % (a)(c) | | | 06/16/2063 | | | | 4,086,174 | |
23,175,976 | | Government National Mortgage Association, Series 2021-30-IB | | | 2.50 | % (c) | | | 02/20/2051 | | | | 3,237,028 | |
27,831,799 | | Government National Mortgage Association, Series 2021-30-WI | | | 2.50 | % (c) | | | 02/20/2051 | | | | 3,878,712 | |
28,406,419 | | Government National Mortgage Association, Series 2021-35-IO | | | 0.99 | % (a)(c) | | | 12/16/2062 | | | | 2,061,050 | |
33,740,883 | | Government National Mortgage Association, Series 2021-40-IO | | | 0.82 | % (a)(c) | | | 02/16/2063 | | | | 2,174,418 | |
606,487,424 | | Government National Mortgage Association, Series 2021-45-IO | | | 0.81 | % (a)(c) | | | 04/16/2063 | | | | 37,685,188 | |
51,406,186 | | Government National Mortgage Association, Series 2021-49-QI | | | 2.50 | % (c) | | | 03/20/2049 | | | | 5,122,755 | |
24,677,189 | | Government National Mortgage Association, Series 2021-52-IO | | | 0.72 | % (a)(c) | | | 04/16/2063 | | | | 1,350,504 | |
209,961,669 | | Government National Mortgage Association, Series 2021-60-IO | | | 0.83 | % (a)(c) | | | 05/16/2063 | | | | 13,177,425 | |
240,799,975 | | Government National Mortgage Association, Series 2021-65-IO | | | 0.88 | % (a)(c) | | | 08/16/2063 | | | | 15,885,454 | |
182,911,543 | | Government National Mortgage Association, Series 2021-70-IO | | | 0.71 | % (a)(c) | | | 04/16/2063 | | | | 10,618,802 | |
166,218,295 | | Government National Mortgage Association, Series 2021-71-IO | | | 0.87 | % (a)(c) | | | 10/16/2062 | | | | 10,857,795 | |
162,579,660 | | Government National Mortgage Association, Series 2021-72-IO | | | 0.57 | % (a)(c) | | | 01/16/2061 | | | | 8,187,788 | |
101,997,249 | | Government National Mortgage Association, Series 2021-74-CI | | | 3.00 | % (c) | | | 12/20/2050 | | | | 14,788,132 | |
108,438,164 | | Government National Mortgage Association, Series 2021-77-SJ (-1 x 1 Month LIBOR USD + 3.75%, 3.75% Cap) | | | 0.00 | % (c)(d) | | | 05/20/2051 | | | | 4,426,175 | |
12,576,080 | | Government National Mortgage Association, Series 2021-78-IC | | | 4.00 | % (c) | | | 05/20/2051 | | | | 2,049,263 | |
45,373,117 | | Government National Mortgage Association, Series 2021-7-IP | | | 3.50 | % (c) | | | 07/20/2050 | | | | 7,290,634 | |
99,413,460 | | Government National Mortgage Association, Series 2021-7-KI | | | 2.50 | % (c) | | | 01/20/2051 | | | | 13,993,031 | |
57,820,486 | | Government National Mortgage Association, Series 2021-7-MI | | | 2.50 | % (c) | | | 01/20/2051 | | | | 8,121,454 | |
60,195,369 | | Government National Mortgage Association, Series 2021-80-IO | | | 0.90 | % (a)(c) | | | 12/16/2062 | | | | 4,322,238 | |
317,979,379 | | Government National Mortgage Association, Series 2021-85-IO | | | 0.68 | % (a)(c) | | | 03/16/2063 | | | | 18,076,778 | |
52,561,633 | | Government National Mortgage Association, Series 2021-87-ET | | | 2.00 | % | | | 05/20/2051 | | | | 44,763,390 | |
48,917,056 | | Government National Mortgage Association, Series 2021-96-TS (-1 x Secured Overnight Financing Rate 30 Day Average + 3.25%, 3.25% Cap) | | | 0.00 | % (c)(d) | | | 06/20/2051 | | | | 1,137,948 | |
37,163,586 | | Government National Mortgage Association, Series 2021-97-SH (-1 x 1 Month LIBOR USD + 3.75%, 3.75% Cap) | | | 0.00 | % (c)(d) | | | 06/20/2051 | | | | 1,534,990 | |
119,806,351 | | Government National Mortgage Association, Series 2021-98-IG | | | 3.00 | % (c) | | | 06/20/2051 | | | | 18,137,819 | |
27,410,279 | | Government National Mortgage Association, Series 2021-98-MI | | | 2.50 | % (c) | | | 06/20/2051 | | | | 3,837,828 | |
29,928,166 | | Government National Mortgage Association, Series 2021-98-SB (-1 x 1 Month LIBOR USD + 6.30%, 6.30% Cap) | | | 1.54 | % (c)(d) | | | 06/20/2051 | | | | 3,235,756 | |
76,880,981 | | Government National Mortgage Association, Series 2021-98-ST (-1 x Secured Overnight Financing Rate 30 Day Average + 2.73%, 2.73% Cap) | | | 0.00 | % (c)(d) | | | 03/20/2051 | | | | 1,174,272 | |
9,653,112 | | Government National Mortgage Association, Series 2021-98-SW (-1 x 1 Month LIBOR USD + 6.30%, 6.30% Cap) | | | 1.54 | % (c)(d) | | | 06/20/2051 | | | | 1,101,187 | |
42,228,483 | | Government National Mortgage Association, Series 2021-99-IO | | | 0.59 | % (a)(c) | | | 05/16/2061 | | | | 2,172,157 | |
64,368,527 | | Government National Mortgage Association, Series 2021-9-AI | | | 2.00 | % (c) | | | 01/20/2051 | | | | 6,637,966 | |
111,885,527 | | Government National Mortgage Association, Series 2021-9-MI | | | 2.50 | % (c) | | | 01/20/2051 | | | | 14,990,915 | |
88,161,194 | | Government National Mortgage Association, Series 2022-141-IO | | | 0.78 | % (a)(c) | | | 06/16/2064 | | | | 6,460,479 | |
116,693,335 | | Government National Mortgage Association, Series 2022-14-IO | | | 0.66 | % (a)(c) | | | 12/01/2061 | | | | 6,476,223 | |
97,599,738 | | Government National Mortgage Association, Series 2022-158-IO | | | 0.88 | % (a)(c) | | | 08/16/2064 | | | | 7,832,847 | |
62,615,832 | | Government National Mortgage Association, Series 2022-167-IO | | | 0.82 | % (a)(c) | | | 08/16/2065 | | | | 4,394,072 | |
135,100,710 | | Government National Mortgage Association, Series 2022-169-IO | | | 0.88 | % (a)(c) | | | 01/16/2062 | | | | 10,709,785 | |
93,186,997 | | Government National Mortgage Association, Series 2022-188-IO | | | 2.50 | % (c) | | | 02/20/2051 | | | | 12,963,933 | |
81,371,595 | | Government National Mortgage Association, Series 2022-202-IO | | | 0.72 | % (a)(c) | | | 10/16/2063 | | | | 5,642,664 | |
97,970,245 | | Government National Mortgage Association, Series 2022-207-IO | | | 3.00 | % (c) | | | 08/20/2051 | | | | 14,840,885 | |
22,686,399 | | Government National Mortgage Association, Series 2022-218-IB | | | 3.00 | % (c) | | | 07/20/2050 | | | | 3,253,060 | |
60,217,318 | | Government National Mortgage Association, Series 2022-218-IO | | | 3.50 | % (c) | | | 01/20/2052 | | | | 10,306,320 | |
75,645,267 | | Government National Mortgage Association, Series 2022-21-IO | | | 0.78 | % (a)(c) | | | 10/16/2063 | | | | 4,935,997 | |
147,508,081 | | Government National Mortgage Association, Series 2022-27-IO | | | 0.75 | % (a)(c) | | | 03/16/2064 | | | | 9,064,962 | |
94,825,441 | | Government National Mortgage Association, Series 2022-35-IO | | | 0.55 | % (a)(c) | | | 10/16/2063 | | | | 5,254,050 | |
145,777,420 | | Government National Mortgage Association, Series 2022-38-IO | | | 0.72 | % (a)(c) | | | 04/16/2064 | | | | 8,859,389 | |
422,210,132 | | Government National Mortgage Association, Series 2022-39-IO | | | 0.62 | % (a)(c) | | | 01/16/2064 | | | | 25,180,655 | |
124,633,656 | | Government National Mortgage Association, Series 2022-42-IO | | | 0.67 | % (a)(c) | | | 12/16/2063 | | | | 7,302,722 | |
22,562,879 | | Government National Mortgage Association, Series 2022-44-TY | | | 2.00 | % | | | 12/20/2051 | | | | 18,276,413 | |
61,053,787 | | Government National Mortgage Association, Series 2022-48-IO | | | 0.71 | % (a)(c) | | | 01/16/2064 | | | | 3,927,541 | |
67,560,558 | | Government National Mortgage Association, Series 2022-49-IO | | | 0.76 | % (a)(c) | | | 03/16/2064 | | | | 4,184,539 | |
127,564,620 | | Government National Mortgage Association, Series 2022-54-IO | | | 0.59 | % (a)(c) | | | 10/16/2063 | | | | 6,828,687 | |
79,963,258 | | Government National Mortgage Association, Series 2022-62-IO | | | 0.62 | % (a)(c) | | | 06/16/2064 | | | | 4,543,984 | |
211,521,970 | | Government National Mortgage Association, Series 2022-71-IO | | | 0.55 | % (a)(c) | | | 06/16/2064 | | | | 10,300,951 | |
98,904,728 | | Government National Mortgage Association, Series 2022-73-IO | | | 0.56 | % (a)(c) | | | 07/16/2064 | | | | 5,570,314 | |
53,110,157 | | Government National Mortgage Association, Series 2022-78-IO | | | 3.00 | % (c) | | | 08/20/2051 | | | | 7,726,163 | |
53,395,936 | | Government National Mortgage Association, Series 2022-83-IO | | | 2.50 | % (c) | | | 11/20/2051 | | | | 7,027,941 | |
128,082,367 | | Government National Mortgage Association, Series 2022-86-IO | | | 0.53 | % (a)(c) | | | 10/16/2063 | | | | 6,349,991 | |
195,134,059 | | Government National Mortgage Association, Series 2022-8-IO | | | 0.85 | % (a)(c) | | | 09/16/2063 | | | | 13,496,213 | |
98,885,320 | | Government National Mortgage Association, Series 2022-91-IO | | | 0.43 | % (a)(c) | | | 07/16/2064 | | | | 4,723,445 | |
64,805,697 | | Government National Mortgage Association, Series 2022-9-EI | | | 3.00 | % (c) | | | 01/20/2052 | | | | 8,276,899 | |
74,074,074 | | Government National Mortgage Association, Series 2023-50-IO | | | 0.86 | % (a)(c) | | | 07/16/2064 | | | | 5,296,741 | |
16,000,000 | | Seasoned Credit Risk Transfer Trust, Series 2020-1-MB | | | 2.50 | % | | | 08/25/2059 | | | | 12,185,587 | |
10,000,000 | | Seasoned Credit Risk Transfer Trust, Series 2020-2-MB | | | 2.00 | % | | | 11/25/2059 | | | | 7,213,153 | |
17,358,426 | | Seasoned Credit Risk Transfer Trust, Series 2020-2-MT | | | 2.00 | % | | | 11/25/2059 | | | | 14,629,449 | |
35,000,000 | | Seasoned Credit Risk Transfer Trust, Series 2022-2-MB | | | 3.00 | % | | | 04/25/2062 | | | | 26,574,496 | |
| | | | | | | | | | | | | | |
Total US Government and Agency Mortgage Backed Obligations (Cost $17,320,498,958) | | | | | | | | | | | 15,515,956,591 | |
| | | | | | | | | | | | | | |
US Government and Agency Obligations - 8.1% | |
54,900,000 | | Tennessee Valley Authority | | | 4.25 | % | | | 09/15/2065 | | | | 51,721,153 | |
530,000,000 | | United States Treasury Notes | | | 3.50 | % | | | 02/15/2033 | | | | 530,869,528 | |
1,280,000,000 | | United States Treasury Notes | | | 3.00 | % | | | 08/15/2052 | | | | 1,124,800,000 | |
1,050,000,000 | | United States Treasury Notes | | | 3.63 | % | | | 02/15/2053 | | | | 1,042,699,224 | |
| | | | | | | | | | | | | | |
Total US Government and Agency Obligations (Cost $2,806,018,732) | | | | | | | | | | | 2,750,089,905 | |
| | | | | | | | | | | | | | |
Short Term Investments - 2.8% | |
320,938,393 | | First American Government Obligations Fund - Class U | | | 4.66 | % (j) | | | | | | | 320,938,393 | |
320,938,393 | | JP Morgan U.S. Government Money Market Fund - Institutional Share Class | | | 4.73 | % (j) | | | | | | | 320,938,393 | |
320,938,393 | | Morgan Stanley Institutional Liquidity Funds Government Portfolio - Institutional Share Class | | | 4.74 | % (j) | | | | | | | 320,938,393 | |
| | | | | | | | | | | | | | |
Total Short Term Investments (Cost $962,815,179) | | | | | | | | | | | 962,815,179 | |
| | | | | | | | | | | | | | |
Total Investments - 99.3% (Cost $38,576,386,968) | | | | | | | | | | | 33,585,652,574 | |
Other Assets in Excess of Liabilities - 0.7% | | | | | | | | | | | 232,647,216 | |
| | | | | | | | | | | | | | |
NET ASSETS - 100.0% | | | | | | | | | | $ | 33,818,299,790 | |
| | | | | | | | | | | | | | |
| | | | | | | | | | | | | | |
Principal Amount $/Shares | | Security Description | | Rate | | | Maturity | | | Value $ | |
Asset Backed Obligations - 3.7% | |
3,002,309 | | AASET Ltd., Series 2021-2A-B | | | 3.54 | % (f) | | | 01/15/2047 | | | | 2,293,587 | |
3,630,297 | | Business Jet Securities LLC, Series 2020-1A-A | | | 2.98 | % (f) | | | 11/15/2035 | | | | 3,449,026 | |
5,000,000 | | CANON, Series 2021-0001 | | | 3.50 | % (b) | | | 11/05/2023 | | | | 4,975,000 | |
20,823,409 | | Carbon Level Mitigation Trust, Series 2021-5-CERT | | | 0.61 | % (f) | | | 10/13/2051 | | | | 16,298,878 | |
8,799,505 | | Castlelake Aircraft Structured Trust, Series 2021-1A-A | | | 3.47 | % (f) | | | 01/15/2046 | | | | 8,109,263 | |
3,000,000 | | Diamond Infrastructure Funding LLC, Series 2021-1A-C | | | 3.48 | % (f) | | | 04/15/2049 | | | | 2,404,674 | |
7,000,000 | | Exeter Automobile Receivables Trust, Series 2021-1A-D | | | 1.08 | % | | | 11/16/2026 | | | | 6,651,543 | |
8,500,000 | | Exeter Automobile Receivables Trust, Series 2021-1A-E | | | 2.21 | % (f) | | | 02/15/2028 | | | | 7,896,994 | |
1,470,582 | | HERO Funding Trust, Series 2016-1A-A | | | 4.05 | % (f) | | | 09/20/2041 | | | | 1,421,131 | |
1,779,594 | | Horizon Aircraft Finance Ltd., Series 2019-2-A | | | 3.43 | % (f) | | | 11/15/2039 | | | | 1,424,340 | |
14,210,421 | | ITE Rail Fund Levered LP, Series 2021-1A-A | | | 2.25 | % (f) | | | 02/28/2051 | | | | 12,232,118 | |
14,000,000 | | LendingPoint Asset Securitization Trust, Series 2021-A-C | | | 2.75 | % (f) | | | 12/15/2028 | | | | 13,463,927 | |
11,563,542 | | MACH 1 Cayman Ltd., Series 2019-1-A | | | 3.47 | % (f) | | | 10/15/2039 | | | | 9,722,141 | |
1,036,864 | | Mosaic Solar Loan Trust, Series 2018-1A-A | | | 4.01 | % (f) | | | 06/22/2043 | | | | 971,653 | |
1,491,188 | | Mosaic Solar Loan Trust, Series 2019-2A-B | | | 3.28 | % (f) | | | 09/20/2040 | | | | 1,324,118 | |
7,500,000 | | Navient Private Education Loan Trust, Series 2018-A-B | | | 3.68 | % (f) | | | 02/18/2042 | | | | 7,100,137 | |
4,642,635 | | NP SPE LLC, Series 2016-1A-A1 | | | 4.16 | % (f) | | | 04/20/2046 | | | | 4,481,896 | |
4,982,952 | | NP SPE LLC, Series 2019-1A-A2 | | | 3.24 | % (f) | | | 09/20/2049 | | | | 4,552,619 | |
9,788,724 | | Pagaya AI Debt Selection Trust, Series 2021-2-NOTE | | | 3.00 | % (f) | | | 01/25/2029 | | | | 9,346,830 | |
19,350,000 | | Primrose Funding LLC, Series 2019-1A-A2 | | | 4.48 | % (f) | | | 07/30/2049 | | | | 18,209,823 | |
3,253,898 | | Sapphire Aviation Finance Ltd., Series 2020-1A-A | | | 3.23 | % (f) | | | 03/15/2040 | | | | 2,694,712 | |
4,987,500 | | SEB Funding LLC, Series 2021-1A-A2 | | | 4.97 | % (f) | | | 01/30/2052 | | | | 4,381,052 | |
967,500 | | SERVPRO Master Issuer LLC, Series 2019-1A-A2 | | | 3.88 | % (f) | | | 10/25/2049 | | | | 887,473 | |
1,144,519 | | Shenton Aircraft Investment Ltd., Series 2015-1A-A | | | 4.75 | % (f) | | | 10/15/2042 | | | | 939,769 | |
7,257,945 | | SoFi Alternative Consumer Loan Program, Series 2021-2-A | | | 1.25 | % (f) | | | 08/15/2030 | | | | 6,919,638 | |
75,000 | | SoFi Alternative Consumer Loan Program, Series 2021-2-R1 | | | 0.00 | % (b)(f)(o) | | | 08/15/2030 | | | | 1,515,384 | |
5,557,928 | | SoFi Alternative Trust, Series 2021-1-PT1 | | | 9.72 | % (a)(f) | | | 05/25/2030 | | | | 5,473,597 | |
5,000,000 | | SoFi Professional Loan Program LLC, Series 2017-B-BFX | | | 3.70 | % (a)(f) | | | 05/25/2040 | | | | 4,790,730 | |
2,000,000 | | SoFi Professional Loan Program LLC, Series 2017-C-C | | | 4.21 | % (a)(f) | | | 07/25/2040 | | | | 1,785,440 | |
2,624,526 | | Start Ltd., Series 2018-1-A | | | 4.09 | % (f) | | | 05/15/2043 | | | | 2,283,702 | |
1,899,435 | | START Ltd., Series 2019-1-A | | | 4.09 | % (f) | | | 03/15/2044 | | | | 1,658,965 | |
4,203,820 | | Sunnova Helios Issuer LLC, Series 2018-1A-A | | | 4.87 | % (f) | | | 07/20/2048 | | | | 3,844,004 | |
5,000,974 | | Sunnova Helios Sol Issuer LLC, Series 2020-1A-A | | | 3.35 | % (f) | | | 02/01/2055 | | | | 4,293,400 | |
4,537,446 | | Sunrun Atlas Issuer LLC, Series 2019-2-A | | | 3.61 | % (f) | | | 02/01/2055 | | | | 4,052,025 | |
2,711,874 | | Upgrade Master Credit Pass-Thru Trust, Series 2021-ST3-A | | | 2.50 | % (f) | | | 07/15/2027 | | | | 2,646,946 | |
1,538,950 | | Upgrade Master Pass-Thru Trust, Series 2021-PT3-A | | | 14.42 | % (a)(f) | | | 07/15/2027 | | | | 1,490,871 | |
6,418,810 | | Upgrade Master Pass-Thru Trust, Series 2021-PT4-A | | | 10.51 | % (a)(f) | | | 08/15/2027 | | | | 6,172,482 | |
2,835,037 | | Upstart Pass-Through Trust, Series 2021-ST2-A | | | 2.50 | % (f) | | | 04/20/2027 | | | | 2,698,115 | |
545,511 | | Upstart Securitization Trust, Series 2020-2-A | | | 2.31 | % (f) | | | 11/20/2030 | | | | 533,824 | |
17,250,000 | | Upstart Securitization Trust, Series 2021-2-C | | | 3.61 | % (f) | | | 06/20/2031 | | | | 15,320,631 | |
584,653 | | Upstart Securitization Trust, Series 2021-3-A | | | 0.83 | % (f) | | | 07/20/2031 | | | | 575,256 | |
6,000,000 | | Upstart Securitization Trust, Series 2021-3-C | | | 3.28 | % (f) | | | 07/20/2031 | | | | 5,299,979 | |
12,450,000 | | Upstart Securitization Trust, Series 2021-4-B | | | 1.84 | % (f) | | | 09/20/2031 | | | | 11,585,335 | |
15,550,000 | | Upstart Securitization Trust, Series 2021-4-C | | | 3.19 | % (f) | | | 09/20/2031 | | | | 12,891,054 | |
4,500,000 | | US Auto Funding LLC, Series 2021-1A-C | | | 2.20 | % (f) | | | 05/15/2026 | | | | 4,307,165 | |
8,000,000 | | Vantage Data Centers LLC, Series 2020-2A-A2 | | | 1.99 | % (f) | | | 09/15/2045 | | | | 6,786,516 | |
10,747,685 | | Vivint Solar Financing LLC, Series 2020-1A-A | | | 2.21 | % (f) | | | 07/31/2051 | | | | 8,459,729 | |
10,613,703 | | WAVE LLC, Series 2019-1-A | | | 3.60 | % (f) | | | 09/15/2044 | | | | 8,896,968 | |
| | | | | | | | | | | | | | |
Total Asset Backed Obligations (Cost $297,759,124) | | | | | | | | | | | 269,514,460 | |
| | | | | | | | | | | | | | |
Bank Loans - 3.1% | |
1,315,000 | | AAdvantage Loyalty IP Ltd., Senior Secured First Lien Term Loan (3 Month LIBOR USD + 4.75%, 0.75% Floor) | | | 9.56 | % | | | 04/20/2028 | | | | 1,337,283 | |
760,375 | | Acrisure LLC, Senior Secured First Lien Term Loan (1 Month LIBOR USD + 4.25%, 0.5% Floor) | | | 9.09 | % | | | 02/16/2027 | | | | 747,068 | |
677,083 | | Acuris Finance, Inc., Senior Secured First Lien Term Loan (3 Month Secured Overnight Financing Rate + 4.00%, 0.50% Floor) | | | 9.05 | % | | | 02/16/2028 | | | | 655,644 | |
1,853,692 | | AI Aqua Merger Sub, Inc., Senior Secured First Lien Term Loan (1 Month Secured Overnight Financing Rate + 3.75%, 0.50% Floor) | | | 8.48 | % | | | 07/31/2028 | | | | 1,794,615 | |
843,625 | | Air Canada, Senior Secured First Lien Term Loan (3 Month LIBOR USD + 3.50%, 0.75% Floor) | | | 8.37 | % | | | 08/11/2028 | | | | 843,363 | |
321,954 | | Air Methods Corporation, Senior Secured First Lien Term Loan (3 Month LIBOR USD + 3.50%, 1.00% Floor) | | | 8.66 | % | | | 04/22/2024 | | | | 202,964 | |
488,227 | | Alliance Laundry Systems LLC, Senior Secured First Lien Term Loan (3 Month LIBOR USD + 3.50%, 0.75% Floor) | | | 8.31 | % | | | 10/08/2027 | | | | 484,870 | |
341,659 | | Alliant Holdings Intermediate LLC (1 Month Secured Overnight Financing Rate + 3.50%, 0.50% Floor) | | | 8.35 | % | | | 11/05/2027 | | | | 338,630 | |
861,875 | | Alliant Holdings Intermediate LLC, Senior Secured First Lien Term Loan (1 Month LIBOR USD + 3.50%, 0.50% Floor) | | | 8.28 | % | | | 11/05/2027 | | | | 854,334 | |
1,679,957 | | Allied Universal Holdco LLC, Senior Secured First Lien Term Loan (1 Month Secured Overnight Financing Rate + 3.75%, 0.50% Floor) | | | 8.66 | % | | | 05/12/2028 | | | | 1,597,916 | |
1,523,926 | | Almonde, Inc., Senior Secured First Lien Term Loan (3 Month LIBOR USD + 3.50%, 1.00% Floor) | | | 8.33 | % | | | 06/13/2024 | | | | 1,430,449 | |
450,000 | | Almonde, Inc., Senior Secured Second Lien Term Loan (3 Month LIBOR USD + 7.25%, 1.00% Floor) | | | 12.08 | % | | | 06/16/2025 | | | | 365,319 | |
980,949 | | Alterra Mountain Company, Senior Secured First Lien Term Loan (1 Month LIBOR USD + 3.50%, 0.50% Floor) | | | 8.34 | % | | | 08/17/2028 | | | | 979,722 | |
265,235 | | AMC Entertainment Holdings, Inc., Senior Secured First Lien Term Loan (1 Month LIBOR USD + 3.00%) | | | 7.68 | % | | | 04/22/2026 | | | | 194,119 | |
1,100,059 | | American Airlines, Inc., Senior Secured First Lien Term Loan (6 Month LIBOR USD + 3.50%) | | | 8.26 | % | | | 01/29/2027 | | | | 1,076,287 | |
920,700 | | American Tire Distributors, Inc., Senior Secured First Lien Term Loan (3 Month LIBOR USD + 6.25%, 0.75% Floor) | | | 11.07 | % | | | 10/20/2028 | | | | 811,754 | |
689,866 | | American Trailer World Corporation, Senior Secured First Lien Term Loan (1 Month Secured Overnight Financing Rate + 3.75%, 0.75% Floor) | | | 8.66 | % | | | 03/03/2028 | | | | 604,495 | |
1,340,343 | | AmWINS Group, Inc., Senior Secured First Lien Term Loan (1 Month LIBOR USD + 2.25%, 0.75% Floor) | | | 7.09 | % | | | 02/22/2028 | | | | 1,326,477 | |
| | Applied Systems, Inc. | | | | | | | | | | | | |
85,086 | | (1 Month LIBOR USD + 5.50%, 0.75% Floor) | | | 10.91 | % | | | 09/17/2027 | | | | 85,246 | |
1,174,914 | | (3 Month LIBOR USD + 6.75%, 0.75% Floor) | | | 11.33 | % | | | 09/17/2027 | | | | 1,177,117 | |
2,487,667 | | Applied Systems, Inc. (3 Month Secured Overnight Financing Rate + 4.50%, 0.50% Floor) | | | 9.40 | % | | | 09/19/2026 | | | | 2,487,667 | |
| | APX Group, Inc., Senior Secured First Lien Term Loan | | | | | | | | | | | | |
600 | | (Prime Rate + 2.25%, 0.50% Floor) | | | 10.25 | % | | | 07/10/2028 | | | | 598 | |
1,063,200 | | (3 Month LIBOR USD + 3.25%, 0.50% Floor) | | | 8.25 | % | | | 07/10/2028 | | | | 1,060,069 | |
1,349,548 | | Ascend Learning LLC, Senior Secured First Lien Term Loan (1 Month Secured Overnight Financing Rate + 3.50%, 0.50% Floor) | | | 8.41 | % | | | 12/11/2028 | | | | 1,249,297 | |
351,328 | | Ascend Learning LLC, Senior Secured Second Lien Term Loan (1 Month Secured Overnight Financing Rate + 5.75%, 0.50% Floor) | | | 10.47 | % | | | 12/10/2029 | | | | 305,362 | |
1,859,391 | | AssuredPartners, Inc., Senior Secured First Lien Term Loan (1 Month LIBOR USD + 3.50%) | | | 8.34 | % | | | 02/12/2027 | | | | 1,844,748 | |
589,050 | | AssuredPartners, Inc., Senior Secured First Lien Term Loan (1 Month Secured Overnight Financing Rate + 3.50%,0.50% Floor) | | | 8.31 | % | | | 02/12/2027 | | | | 583,896 | |
870,992 | | Astra Acquisition Corporation, Senior Secured First Lien Term Loan (1 Month LIBOR USD + 5.25%, 0.50% Floor) | | | 10.09 | % | | | 10/25/2028 | | | | 756,134 | |
894,785 | | Astra Acquisition Corporation, Senior Secured Second Lien Term Loan (1 Month LIBOR USD + 8.88%, 0.75% Floor) | | | 13.51 | % | | | 10/25/2029 | | | | 666,615 | |
1,018,061 | | Asurion LLC, Senior Secured First Lien Term Loan (1 Month LIBOR USD + 3.25%) | | | 8.09 | % | | | 12/23/2026 | | | | 947,164 | |
295,000 | | Asurion LLC, Senior Secured Second Lien Term Loan (1 Month LIBOR USD + 5.25%) | | | 10.09 | % | | | 01/31/2028 | | | | 246,841 | |
485,000 | | Asurion LLC, Senior Secured Second Lien Term Loan (1 Month LIBOR USD + 5.25%) | | | 10.09 | % | | | 01/19/2029 | | | | 402,793 | |
607,638 | | Aveanna Healthcare LLC, Senior Secured First Lien Term Loan (3 Month LIBOR USD + 3.75%, 0.50% Floor) | | | 8.70 | % | | | 07/17/2028 | | | | 518,878 | |
385,415 | | Aveanna Healthcare LLC, Senior Secured Second Lien Term Loan (1 Month LIBOR USD + 7.00%, 0.50% Floor) | | | 11.95 | % | | | 12/10/2029 | | | | 240,884 | |
736,313 | | Axalta Coating Systems US Holdings, Inc. (1 Month Secured Overnight Financing Rate + 3.00%, 0.50% Floor) | | | 7.90 | % | | | 12/20/2029 | | | | 738,308 | |
1,936,270 | | Bausch & Lomb Corporation, Senior Secured First Lien Term Loan (3 Month Secured Overnight Financing Rate + 3.25%, 0.50% Floor) | | | 8.46 | % | | | 05/10/2027 | | | | 1,885,172 | |
797,213 | | BCP Renaissance Parent LLC, Senior Secured First Lien Term Loan (3 Month Secured Overnight Financing Rate + 3.50%, 1.00% Floor) | | | 8.40 | % | | | 11/02/2026 | | | | 792,231 | |
207,900 | | BCPE Empire Holdings, Inc., Senior Secured First Lien Term Loan (1 Month Secured Overnight Financing Rate + 4.63%, 0.50% Floor) | | | 9.53 | % | | | 06/11/2026 | | | | 206,043 | |
1,327,119 | | Blackstone CQP Holdco LP, Senior Secured First Lien Term Loan (3 Month LIBOR USD + 3.50%, 0.50% Floor) | | | 8.66 | % | | | 06/05/2028 | | | | 1,318,997 | |
145,108 | | Bright Bidco B.V., Senior Secured First Lien Term Loan (3 Month Secured Overnight Financing Rate + 1.00% + 1.00% PIK, 1.00% Floor) | | | 5.68 | % | | | 10/29/2027 | | | | 123,704 | |
1,139,422 | | Brookfield WEC Holdings, Inc., Senior Secured First Lien Term Loan (1 Month LIBOR USD + 2.75%, 0.50% Floor) | | | 7.59 | % | | | 08/01/2025 | | | | 1,135,275 | |
186,136 | | Brown Group Holding LLC, Senior Secured First Lien Term Loan (1 Month Secured Overnight Financing Rate + 2.50%, 0.50% Floor) | | | 7.41 | % | | | 06/07/2028 | | | | 184,779 | |
330,000 | | Caesars Entertainment, Inc. (1 Month Secured Overnight Financing Rate + 3.25%, 0.50% Floor) | | | 8.16 | % | | | 02/06/2030 | | | | 328,899 | |
212,300 | | Calpine Corporation, Senior Secured First Lien Term Loan (1 Month LIBOR USD + 2.00%) | | | 6.84 | % | | | 08/12/2026 | | | | 211,297 | |
1,571,710 | | Carnival Corporation, Senior Secured First Lien Term Loan (1 Month LIBOR USD + 3.25%, 0.75% Floor) | | | 8.09 | % | | | 10/18/2028 | | | | 1,539,294 | |
1,691,472 | | Castle US Holding Corporation, Senior Secured First Lien Term Loan (1 Month LIBOR USD + 3.75%) | | | 8.59 | % | | | 01/29/2027 | | | | 1,117,285 | |
2,107,900 | | Castlelake Aviation LLC, Senior Secured First Lien Term Loan (3 Month LIBOR USD + 2.75%, 0.50% Floor) | | | 7.62 | % | | | 10/22/2026 | | | | 2,090,605 | |
1,346,299 | | Cengage Learning, Inc., Senior Secured First Lien Term Loan (6 Month LIBOR USD + 4.75%, 1.00% Floor) | | | 9.88 | % | | | 07/14/2026 | | | | 1,252,906 | |
882,788 | | Central Parent, Inc. (3 Month Secured Overnight Financing Rate + 4.25%, 0.50% Floor) | | | 9.15 | % | | | 07/06/2029 | | | | 881,432 | |
1,041,509 | | Charter Communications Operating LLC, Senior Secured First Lien Term Loan (1 Month Secured Overnight Financing Rate + 1.75%) | | | 6.56 | % | | | 02/01/2027 | | | | 1,033,536 | |
1,234,800 | | Charter Next Generation, Inc., Senior Secured First Lien Term Loan (1 Month Secured Overnight Financing Rate + 3.75%, 0.75% Floor) | | | 8.67 | % | | | 12/01/2027 | | | | 1,221,588 | |
183,381 | | Cincinnati Bell, Inc., Senior Secured First Lien Term Loan (1 Month Secured Overnight Financing Rate + 3.25%, 0.50% Floor) | | | 8.16 | % | | | 11/22/2028 | | | | 179,858 | |
1,352,003 | | Clear Channel Outdoor Holdings, Inc., Senior Secured First Lien Term Loan (3 Month LIBOR USD + 3.50%) | | | 8.33 | % | | | 08/21/2026 | | | | 1,263,000 | |
942,335 | | ClubCorp Holdings, Inc., Senior Secured First Lien Term Loan (1 Month LIBOR USD + 2.75%) | | | 7.59 | % | | | 09/18/2024 | | | | 902,286 | |
781,221 | | CMG Media Corporation, Senior Secured First Lien Term Loan (3 Month LIBOR USD + 3.50%) | | | 8.66 | % | | | 12/17/2026 | | | | 694,506 | |
136,297 | | Columbus McKinnon Corporation, Senior Secured First Lien Term Loan (3 Month LIBOR USD + 2.75%, 0.50% Floor) | | | 7.94 | % | | | 05/15/2028 | | | | 135,700 | |
1,401,029 | | Compass Power Generation LLC, Senior Secured First Lien Term Loan (1 Month Secured Overnight Financing Rate + 4.25%, 1.00% Floor) | | | 9.17 | % | | | 04/16/2029 | | | | 1,397,968 | |
512,391 | | Conair Holdings LLC, Senior Secured First Lien Term Loan (3 Month LIBOR USD + 3.75%, 0.50% Floor) | | | 8.91 | % | | | 05/17/2028 | | | | 471,400 | |
649,900 | | Connect US Finco LLC, Senior Secured First Lien Term Loan (1 Month LIBOR USD + 3.50%, 1.00% Floor) | | | 8.14 | % | | | 12/11/2026 | | | | 646,855 | |
999,375 | | Conservice Midco LLC, Senior Secured First Lien Term Loan (1 Month LIBOR USD + 4.25%) | | | 9.09 | % | | | 05/13/2027 | | | | 984,594 | |
686,519 | | Constant Contact, Inc., Senior Secured First Lien Term Loan (3 Month LIBOR USD + 4.00%, 0.75% Floor) | | | 8.81 | % | | | 02/10/2028 | | | | 650,189 | |
797,113 | | Corelogic, Inc., Senior Secured First Lien Term Loan (1 Month LIBOR USD + 3.50%, 0.50% Floor) | | | 8.38 | % | | | 06/02/2028 | | | | 682,389 | |
649,073 | | Cornerstone Building Brands, Inc., Senior Secured First Lien Term Loan (1 Month LIBOR USD + 3.75%, 0.50% Floor) | | | 8.59 | % | | | 10/16/2028 | | | | 601,204 | |
434,784 | | Cyanco Intermediate Corporation, Senior Secured First Lien Term Loan (1 Month LIBOR USD + 3.50%) | | | 8.34 | % | | | 03/17/2025 | | | | 424,131 | |
1,291,340 | | Cyxtera DC Holdings, Inc., Senior Secured First Lien Term Loan (3 Month LIBOR USD + 3.00%, 1.00% Floor) | | | 7.82 | % | | | 05/01/2024 | | | | 1,056,212 | |
989,221 | | DCert Buyer, Inc., Senior Secured First Lien Term Loan (6 Month Secured Overnight Financing Rate + 4.00%) | | | 8.70 | % | | | 10/16/2026 | | | | 970,831 | |
330,000 | | DCert Buyer, Inc., Senior Secured Second Lien Term Loan (6 Month Secured Overnight Financing Rate + 7.00%) | | | 11.70 | % | | | 02/19/2029 | | | | 306,808 | |
1,233,171 | | Deerfield Dakota Holding LLC, Senior Secured First Lien Term Loan (3 Month Secured Overnight Financing Rate + 3.75%, 1.00% Floor) | | | 8.56 | % | | | 04/09/2027 | | | | 1,197,205 | |
1,450,000 | | Delta 2 Luxembourg SARL (1 Month Secured Overnight Financing Rate + 3.25%, 0.50% Floor) | | | 8.06 | % | | | 01/15/2030 | | | | 1,452,422 | |
866,999 | | DexKo Global, Inc., Senior Secured First Lien Term Loan (3 Month LIBOR USD + 3.75%, 0.50% Floor) | | | 8.91 | % | | | 10/04/2028 | | | | 814,437 | |
1,250,216 | | DG Investment Intermediate Holdings, Inc., Senior Secured First Lien Term Loan (1 Month Secured Overnight Financing Rate + 3.75%, 0.75% Floor) | | | 8.56 | % | | | 03/31/2028 | | | | 1,216,966 | |
250,000 | | DG Investment Intermediate Holdings, Inc., Senior Secured Second Lien Term Loan (1 Month LIBOR USD + 6.75%, 0.75% Floor) | | | 11.59 | % | | | 03/30/2029 | | | | 221,199 | |
2,498,375 | | Diamond (BC) B.V., Senior Secured First Lien Term Loan (3 Month LIBOR USD + 2.75%, 0.50% Floor) | | | 7.58 | % | | | 09/29/2028 | | | | 2,492,329 | |
708,901 | | Diamond Sports Group LLC, Senior Secured Second Lien Term Loan (3 Month Secured Overnight Financing Rate + 3.40%) | | | 8.03 | % (c) | | | 08/24/2026 | | | | 40,613 | |
1,369,804 | | DirectTV Financing LLC, Senior Secured First Lien Term Loan (1 Month LIBOR USD + 5.00%, 0.75% Floor) | | | 9.84 | % | | | 08/02/2027 | | | | 1,321,395 | |
461,697 | | Dynasty Acquisition Company, Inc., Senior Secured First Lien Term Loan (1 Month Secured Overnight Financing Rate + 3.50%) | | | 8.41 | % | | | 04/06/2026 | | | | 452,362 | |
858,757 | | Dynasty Acquisition Company, Inc., Senior Secured First Lien Term Loan (1 Month Secured Overnight Financing Rate + 3.50%) | | | 8.41 | % | | | 04/06/2026 | | | | 841,393 | |
1,133,550 | | Echo Global Logistics, Inc., Senior Secured First Lien Term Loan (1 Month LIBOR USD + 3.50%, 0.50% Floor) | | | 8.34 | % | | | 11/24/2028 | | | | 1,102,173 | |
646,329 | | EG America LLC, Senior Secured First Lien Delayed-Draw Term Loan (1 Month LIBOR USD + 4.25%, 0.50% Floor) | | | 9.09 | % | | | 03/31/2026 | | | | 620,314 | |
801,442 | | EG Group Limited, Senior Secured First Lien Term Loan (1 Month LIBOR USD + 4.00%) | | | 8.84 | % | | | 02/06/2025 | | | | 769,071 | |
866,806 | | Eisner Advisory Group LLC, Senior Secured First Lien Term Loan (1 Month Secured Overnight Financing Rate + 5.25%, 0.75% Floor) | | | 10.17 | % | | | 07/28/2028 | | | | 867,890 | |
546,000 | | Element Materials Technology Group, Inc. (3 Month Secured Overnight Financing Rate + 4.25%, 0.50% Floor) | | | 9.25 | % | | | 06/22/2029 | | | | 540,881 | |
252,000 | | Element Materials Technology Group, Inc. (3 Month Secured Overnight Financing Rate + 4.25%, 0.50% Floor) | | | 9.25 | % | | | 06/22/2029 | | | | 249,638 | |
710,167 | | Endurance International Group, Inc., Senior Secured First Lien Term Loan (1 Month LIBOR USD + 3.50%, 0.75% Floor) | | | 8.22 | % | | | 02/10/2028 | | | | 665,782 | |
1,124,901 | | Envision Healthcare Corporation, Senior Secured First Lien Term Loan (3 Month Secured Overnight Financing Rate + 3.75%, 1.00% Floor) | | | 8.65 | % | | | 03/31/2027 | | | | 192,358 | |
460,270 | | Envision Healthcare Corporation, Senior Secured First Lien Term Loan (3 Month Secured Overnight Financing Rate + 4.25%, 1.00% Floor) | | | 9.15 | % | | | 03/31/2027 | | | | 117,369 | |
474,088 | | Everi Holdings, Inc. Senior Secured First Lien Term Loan (1 Month LIBOR USD + 2.50%, 0.50% Floor) | | | 7.34 | % | | | 08/03/2028 | | | | 473,533 | |
1,003,377 | | EW Scripps Company, Senior Secured First Lien Term Loan (1 Month Secured Overnight Financing Rate + 2.56%, 0.75% Floor) | | | 7.48 | % | | | 05/01/2026 | | | | 980,726 | |
811,777 | | Exgen Renewables LLC, Senior Secured First Lien Term Loan (3 Month LIBOR USD + 2.50%, 1.00% Floor) | | | 7.46 | % | | | 12/15/2027 | | | | 808,904 | |
1,331,326 | | Fertitta Entertainment LLC, Senior Secured First Lien Term Loan (1 Month Secured Overnight Financing Rate + 4.00%, 0.50% Floor) | | | 8.81 | % | | | 01/29/2029 | | | | 1,313,779 | |
1,192,950 | | FINThrive Software Intermediate Holdings, Inc., Senior Secured First Lien Term Loan (1 Month LIBOR USD + 4.00%, 0.50% Floor) | | | 8.84 | % | | | 12/18/2028 | | | | 1,113,917 | |
1,127,777 | | First Advantage Holdings LLC, Senior Secured First Lien Term Loan (1 Month LIBOR USD + 2.75%) | | | 7.59 | % | | | 01/29/2027 | | | | 1,123,373 | |
489,605 | | Foresight Energy LLC, Senior Secured First Lien Term Loan (3 Month LIBOR USD + 8.00%, 1.50% Floor) | | | 13.16 | % (b) | | | 06/30/2027 | | | | 489,605 | |
1,178,040 | | Freeport LNG Investments LLP, Senior Secured First Lien Term Loan (3 Month LIBOR USD + 3.50%, 0.50% Floor) | | | 8.31 | % | | | 12/21/2028 | | | | 1,143,960 | |
1,682,930 | | Garda World Security Corporation, Senior Secured First Lien Term Loan (1 Month Secured Overnight Financing Rate + 4.25%) | | | 9.11 | % | | | 10/30/2026 | | | | 1,669,265 | |
900,475 | | Garda World Security Corporation, Senior Secured First Lien Term Loan (1 Month Secured Overnight Financing Rate + 4.25%) | | | 9.01 | % | | | 02/01/2029 | | | | 875,154 | |
333,325 | | Gates Global LLC (1 Month Secured Overnight Financing Rate + 3.50%, 0.50% Floor) | | | 8.31 | % | | | 11/16/2029 | | | | 333,040 | |
| | Getty Images, Inc., Senior Secured First Lien Term Loan | | | | | | | | | | | | |
881,782 | | (3 Month Secured Overnight Financing Rate + 4.50%) | | | 9.40 | % | | | 02/19/2026 | | | | 882,514 | |
54,701 | | (1 Month Secured Overnight Financing Rate + 4.50%) | | | 9.41 | % | | | 02/19/2026 | | | | 54,746 | |
625,942 | | GIP II Blue Holding LP, Senior Secured First Lien Term Loan (3 Month LIBOR USD + 4.50%, 1.00% Floor) | | | 9.66 | % | | | 09/29/2028 | | | | 623,792 | |
590,739 | | Global Medical Response, Inc., Senior Secured First Lien Term Loan (1 Month LIBOR USD + 4.25%, 1.00% Floor) | | | 9.20 | % | | | 03/14/2025 | | | | 417,948 | |
704,954 | | Global Medical Response, Inc., Senior Secured First Lien Term Loan (3 Month LIBOR USD + 4.25%, 1.00% Floor) | | | 9.24 | % | | | 10/02/2025 | | | | 499,344 | |
294,263 | | Go Daddy Operating Company LLC (1 Month Secured Overnight Financing Rate + 3.25%) | | | 8.06 | % | | | 11/09/2029 | | | | 294,463 | |
979,261 | | Gogo Intermediate Holdings LLC, Senior Secured First Lien Term Loan (3 Month Secured Overnight Financing Rate + 3.75%, 0.75% Floor) | | | 8.70 | % | | | 04/28/2028 | | | | 973,753 | |
279,131 | | Grab Holdings, Inc., Senior Secured First Lien Term Loan (1 Month LIBOR USD + 4.50%, 1.00% Floor) | | | 9.35 | % | | | 01/29/2026 | | | | 278,642 | |
1,585,000 | | Gray Television, Inc., Senior Secured First Lien Term Loan | | | 7.80 | % (d) | | | 11/30/2028 | | | | 1,545,383 | |
1,608,120 | | Great Outdoors Group LLC, Senior Secured First Lien Term Loan (1 Month LIBOR USD + 3.75%, 0.75% Floor) | | | 8.59 | % | | | 03/06/2028 | | | | 1,590,036 | |
1,924,447 | | Greeneden US Holdings LLC, Senior Secured First Lien Term Loan (1 Month LIBOR USD + 4.00%, 0.75% Floor) | | | 8.84 | % | | | 12/01/2027 | | | | 1,899,939 | |
380,400 | | Greystone Select Financial LLC, Senior Secured First Lien Term Loan (3 Month LIBOR USD + 5.00%, 0.75% Floor) | | | 9.80 | % | | | 06/16/2028 | | | | 357,576 | |
527,037 | | Grinding Media, Inc., Senior Secured First Lien Term Loan (1 Month LIBOR USD + 4.00%, 0.75% Floor) | | | 8.70 | % | | | 10/12/2028 | | | | 498,050 | |
817,442 | | Heartland Dental LLC, Senior Secured First Lien Term Loan (1 Month LIBOR USD + 4.00%) | | | 8.84 | % | | | 04/30/2025 | | | | 771,121 | |
1,915,961 | | H-Food Holdings LLC, Senior Secured First Lien Term Loan (1 Month LIBOR USD + 3.69%) | | | 8.53 | % | | | 05/23/2025 | | | | 1,653,264 | |
1,317,960 | | Hightower Holding LLC, Senior Secured First Lien Term Loan (3 Month LIBOR USD + 4.00%, 0.75% Floor) | | | 8.82 | % | | | 04/21/2028 | | | | 1,248,767 | |
1,068,200 | | Horizon Therapeutics USA, Inc., Senior Secured First Lien Term Loan (1 Month LIBOR USD + 1.75%, 0.50% Floor) | | | 6.56 | % | | | 03/15/2028 | | | | 1,067,447 | |
1,397,231 | | Hunter Douglas Holding B.V., Senior Secured First Lien Term Loan (3 Month Secured Overnight Financing Rate + 3.50%, 0.50% Floor) | | | 8.37 | % | | | 02/26/2029 | | | | 1,261,504 | |
619,663 | | Hyland Software, Inc., Senior Secured Second Lien Term Loan (1 Month LIBOR USD + 6.25%, 0.75% Floor) | | | 11.09 | % | | | 07/07/2025 | | | | 594,877 | |
596,490 | | ICON Luxembourg SARL Senior Secured First Lien Term Loan (3 Month Secured Overnight Financing Rate + 2.25%, 0.50% Floor) | | | 7.41 | % | | | 07/03/2028 | | | | 595,786 | |
999,768 | | IHeartCommunications, Inc., Senior Secured First Lien Term Loan (1 Month LIBOR USD + 3.00%) | | | 7.84 | % | | | 05/01/2026 | | | | 889,243 | |
485,000 | | INEOS US Finance LLC (1 Month Secured Overnight Financing Rate + 3.50%) | | | 8.41 | % | | | 02/19/2030 | | | | 483,181 | |
1,846,350 | | Informatica LLC, Senior Secured First Lien Term Loan (1 Month LIBOR USD + 2.75%) | | | 7.63 | % | | | 10/27/2028 | | | | 1,836,343 | |
1,742,342 | | Intelsat Jackson Holdings S.A., Senior Secured First Lien Term Loan (3 Month Secured Overnight Financing Rate + 4.25%, 0.50% Floor) | | | 9.08 | % | | | 02/01/2029 | | | | 1,727,820 | |
1,136,973 | | ION Trading Technologies SARL Senior Secured First Lien Term Loan (3 Month LIBOR USD + 4.75%) | | | 9.91 | % | | | 03/31/2028 | | | | 1,075,155 | |
340,000 | | IRB Holding Corporation, Senior Secured First Lien Term Loan (1 Month Secured Overnight Financing Rate + 3.00%, 0.75% Floor) | | | 7.69 | % | | | 12/15/2027 | | | | 334,876 | |
1,004,081 | | Iron Mountain Information Management LLC, Senior Secured First Lien Term Loan (1 Month LIBOR USD + 1.75%) | | | 6.59 | % | | | 01/02/2026 | | | | 1,000,316 | |
375,638 | | Ivanti Software, Inc., Senior Secured First Lien Term Loan (3 Month LIBOR USD + 4.25%, 0.75% Floor) | | | 9.21 | % | | | 12/01/2027 | | | | 309,802 | |
2,232,029 | | Jazz Pharmaceuticals, Inc., Senior Secured First Lien Term Loan (1 Month LIBOR USD + 3.50%, 0.50% Floor) | | | 8.34 | % | | | 05/05/2028 | | | | 2,226,215 | |
1,580,925 | | Jo-Ann Stores LLC, Senior Secured First Lien Term Loan (3 Month LIBOR USD + 4.75%, 0.75% Floor) | | | 9.57 | % | | | 07/07/2028 | | | | 886,108 | |
1,956,590 | | Kenan Advantage Group, Inc., Senior Secured First Lien Term Loan (1 Month LIBOR USD + 3.75%, 0.75% Floor) | | | 8.59 | % | | | 03/24/2026 | | | | 1,945,995 | |
699,882 | | Kestrel Bidco, Inc., Senior Secured First Lien Term Loan (1 Month Secured Overnight Financing Rate + 3.00%, 1.00% Floor) | | | 7.86 | % | | | 12/11/2026 | | | | 672,572 | |
938,125 | | KKR Apple Bidco LLC, Senior Secured First Lien Term Loan (1 Month LIBOR USD + 2.75%, 0.50% Floor) | | | 7.59 | % | | | 09/22/2028 | | | | 930,418 | |
1,345,833 | | Kronos Acquisition Holdings, Inc., Senior Secured First Lien Term Loan (3 Month LIBOR USD + 3.75%, 0.50% Floor) | | | 8.70 | % | | | 12/22/2026 | | | | 1,296,858 | |
768,300 | | LaserShip, Inc., Senior Secured First Lien Term Loan (3 Month LIBOR USD + 4.50%, 0.75% Floor) | | | 9.66 | % | | | 05/08/2028 | | | | 658,817 | |
240,000 | | LaserShip, Inc., Senior Secured Second Lien Term Loan (6 Month LIBOR USD + 7.50%, 0.75% Floor) | | | 12.66 | % | | | 04/30/2029 | | | | 157,200 | |
694,493 | | LBM Acquisition LLC, Senior Secured First Lien Term Loan (1 Month LIBOR USD + 3.75%, 0.75% Floor) | | | 8.59 | % | | | 12/17/2027 | | | | 656,404 | |
426,508 | | Lions Gate Capital Holdings LLC, Senior Secured First Lien Term Loan (1 Month LIBOR USD + 2.25%) | | | 7.09 | % | | | 03/24/2025 | | | | 420,820 | |
763,056 | | LogMeIn, Inc., Senior Secured First Lien Term Loan (1 Month LIBOR USD + 4.75%) | | | 9.38 | % | | | 08/31/2027 | | | | 439,814 | |
995,170 | | Lumen Technologies, Inc., Senior Secured First Lien Term Loan (1 Month Secured Overnight Financing Rate + 2.25%) | | | 7.17 | % | | | 03/15/2027 | | | | 661,166 | |
1,394,896 | | Lummus Technology Holdings LLC, Senior Secured First Lien Term Loan (1 Month LIBOR USD + 3.50%) | | | 8.34 | % | | | 06/30/2027 | | | | 1,373,324 | |
1,537,613 | | Madison IAQ LLC, Senior Secured First Lien Term Loan (6 Month LIBOR USD + 3.25%, 0.50% Floor) | | | 8.30 | % | | | 06/21/2028 | | | | 1,467,075 | |
358,133 | | Maravai Intermediate Holdings LLC, Senior Secured First Lien Term Loan (3 Month Secured Overnight Financing Rate + 3.00%, 0.50% Floor) | | | 7.63 | % | | | 10/19/2027 | | | | 357,014 | |
875,821 | | Marriott Ownership Resorts, Inc., Senior Secured First Lien Term Loan (1 Month LIBOR USD + 1.75%) | | | 6.59 | % | | | 08/29/2025 | | | | 874,179 | |
1,952,281 | | Mavis Tire Express Services Topco Corporation, Senior Secured First Lien Term Loan (1 Month Secured Overnight Financing Rate + 4.00%, 0.75% Floor) | | | 8.92 | % | | | 05/04/2028 | | | | 1,919,024 | |
535,676 | | McAfee Corporation, Senior Secured First Lien Term Loan (1 Month Secured Overnight Financing Rate + 3.75%, 0.50% Floor) | | | 8.52 | % | | | 03/01/2029 | | | | 505,276 | |
2,673,000 | | Medline Borrower LP, Senior Secured First Lien Term Loan (1 Month LIBOR USD + 3.25%, 0.50% Floor) | | | 8.09 | % | | | 10/23/2028 | | | | 2,609,730 | |
482,003 | | Messer Industries GMBH, Senior Secured First Lien Term Loan (3 Month LIBOR USD + 2.50%) | | | 7.23 | % | | | 03/02/2026 | | | | 481,576 | |
1,064,656 | | MIC Glen LLC, Senior Secured First Lien Term Loan (2 Month LIBOR USD + 3.50%, 0.50% Floor) | | | 8.34 | % | | | 07/21/2028 | | | | 1,034,180 | |
539,416 | | Michaels Stores, Inc., Senior Secured First Lien Term Loan (3 Month LIBOR USD + 4.25%, 0.75% Floor) | | | 9.41 | % | | | 04/14/2028 | | | | 496,632 | |
1,523,756 | | Milano Acquisition Corporation, Senior Secured First Lien Term Loan (3 Month Secured Overnight Financing Rate + 4.00%, 0.75% Floor) | | | 9.00 | % | | | 10/01/2027 | | | | 1,458,996 | |
922,250 | | Mileage Plus Holdings LLC, Senior Secured First Lien Term Loan (3 Month LIBOR USD + 5.25%, 1.00% Floor) | | | 10.21 | % | | | 06/21/2027 | | | | 958,624 | |
1,219,048 | | Minotaur Acquisition, Inc., Senior Secured First Lien Term Loan (1 Month Secured Overnight Financing Rate + 4.75%) | | | 9.66 | % | | | 03/27/2026 | | | | 1,188,139 | |
1,355,003 | | Mitchell International, Inc., Senior Secured First Lien Term Loan (3 Month LIBOR USD + 3.75%, 0.50% Floor) | | | 8.50 | % | | | 10/16/2028 | | | | 1,284,556 | |
220,000 | | Mitchell International, Inc., Senior Secured Second Lien Term Loan (1 Month LIBOR USD + 6.50%, 0.50% Floor) | | | 11.34 | % | | | 10/15/2029 | | | | 192,225 | |
377,559 | | Nascar Holdings LLC, Senior Secured First Lien Term Loan (1 Month LIBOR USD + 2.50%) | | | 7.34 | % | | | 10/19/2026 | | | | 378,150 | |
517,961 | | NCR Corporation, Senior Secured First Lien Term Loan (3 Month LIBOR USD + 2.50%) | | | 7.33 | % | | | 08/28/2026 | | | | 511,917 | |
802,429 | | NEP Group, Inc., Senior Secured First Lien Term Loan (1 Month LIBOR USD + 3.25%) | | | 8.09 | % | | | 10/20/2025 | | | | 749,601 | |
1,076,375 | | Olympus Water US Holding Corporation, Senior Secured First Lien Term Loan (3 Month LIBOR USD + 3.75%, 0.50% Floor) | | | 8.94 | % | | | 11/09/2028 | | | | 1,022,562 | |
1,580,278 | | OneDigital Borrower LLC, Senior Secured First Lien Term Loan (1 Month Secured Overnight Financing Rate + 4.25%, 0.50% Floor) | | | 9.16 | % | | | 11/16/2027 | | | | 1,524,968 | |
2,114,512 | | Organon & Company, Senior Secured First Lien Term Loan (3 Month LIBOR USD + 3.00%, 0.50% Floor) | | | 8.00 | % | | | 06/02/2028 | | | | 2,116,268 | |
1,315,573 | | Oryx Midstream Services Permian Basin LLC (1 Month Secured Overnight Financing Rate + 3.25%, 0.50% Floor) | | | 8.06 | % | | | 10/05/2028 | | | | 1,295,346 | |
383,000 | | Outcomes Group Holdings, Inc., Senior Secured First Lien Term Loan (1 Month LIBOR USD + 3.25%) | | | 8.09 | % | | | 10/24/2025 | | | | 373,624 | |
1,335,900 | | Packaging Coordinators Midco, Inc., Senior Secured First Lien Term Loan (3 Month LIBOR USD + 3.50%, 0.75% Floor) | | | 8.23 | % | | | 11/30/2027 | | | | 1,308,708 | |
1,683,470 | | Packers Holdings LLC, Senior Secured First Lien Term Loan (1 Month Secured Overnight Financing Rate + 3.25%, 0.75% Floor) | | | 8.09 | % | | | 03/06/2028 | | | | 1,527,404 | |
1,091,882 | | PAI HoldCo, Inc., Senior Secured First Lien Term Loan (3 Month LIBOR USD + 3.75%, 0.75% Floor) | | | 8.58 | % | | | 10/28/2027 | | | | 1,027,396 | |
275,000 | | Par Petroleum LLC (3 Month Secured Overnight Financing Rate + 4.25%, 0.50% Floor) | | | 9.24 | % | | | 02/28/2030 | | | | 270,417 | |
705,100 | | Park River Holdings, Inc., Senior Secured First Lien Term Loan (3 Month LIBOR USD + 3.25%, 0.75% Floor) | | | 8.00 | % | | | 12/28/2027 | | | | 651,118 | |
461,152 | | PCI Gaming Authority, Senior Secured First Lien Term Loan (1 Month LIBOR USD + 2.50%) | | | 7.34 | % | | | 05/29/2026 | | | | 461,249 | |
1,728,522 | | PECF USS Intermediate Holding Corporation, Senior Secured First Lien Term Loan (1 Month LIBOR USD + 4.25%, 0.50% Floor) | | | 9.09 | % | | | 12/15/2028 | | | | 1,464,499 | |
155,499 | | Pediatric Associates Holding Company LLC, Senior Secured First Lien Delayed-Draw Term Loan (1 Month LIBOR USD + 3.25%, 0.50% Floor) | | | 8.09 | % | | | 12/29/2028 | | | | 152,437 | |
1,203,632 | | Pediatric Associates Holding Company LLC, Senior Secured First Lien Term Loan (1 Month LIBOR USD + 3.25%, 0.50% Floor) | | | 8.09 | % | | | 12/29/2028 | | | | 1,179,932 | |
451,588 | | Penn National Gaming, Inc., Senior Secured First Lien Term Loan (1 Month Secured Overnight Financing Rate + 2.75%, 0.50% Floor) | | | 7.66 | % | | | 05/03/2029 | | | | 451,222 | |
2,340,828 | | Peraton Corporation, Senior Secured First Lien Term Loan (1 Month LIBOR USD + 3.75%, 0.75% Floor) | | | 8.59 | % | | | 02/01/2028 | | | | 2,316,449 | |
650,088 | | Perrigo Investments LLC, Senior Secured First Lien Term Loan (1 Month Secured Overnight Financing Rate + 2.25%, 0.50% Floor) | | | 7.16 | % | | | 04/20/2029 | | | | 646,837 | |
2,425,786 | | PetSmart, Inc., Senior Secured First Lien Term Loan (1 Month Secured Overnight Financing Rate + 3.75%, 0.75% Floor) | | | 8.66 | % | | | 02/11/2028 | | | | 2,410,128 | |
1,199,688 | | PetVet Care Centers LLC, Senior Secured First Lien Term Loan (1 Month LIBOR USD + 3.50%, 0.75% Floor) | | | 8.34 | % | | | 02/14/2025 | | | | 1,161,298 | |
1,265,677 | | PG&E Corporation, Senior Secured First Lien Term Loan (1 Month LIBOR USD + 3.00%, 0.50% Floor) | | | 7.88 | % | | | 06/23/2025 | | | | 1,264,297 | |
467,974 | | Phoenix Services International LLC, Senior Secured First Lien Delayed-Draw Term Loan (1 Month Secured Overnight Financing Rate + 12.00%, 2.00% Floor or 10.00% PIK) | | | 16.81 | % | | | 05/29/2023 | | | | 433,815 | |
221,418 | | Phoenix Services International LLC, Senior Secured First Lien Term Loan (1 Month Secured Overnight Financing Rate + 12.00%, 2.00% Floor or 10.00% PIK) | | | 16.81 | % | | | 05/29/2023 | | | | 213,115 | |
1,639,148 | | Phoenix Services International LLC, Senior Secured First Lien Term Loan (3 Month LIBOR USD + 3.75%, 1.00% Floor) | | | 6.67 | % (c) | | | 03/03/2025 | | | | 172,365 | |
489,041 | | Pike Corporation, Senior Secured First Lien Term Loan (1 Month LIBOR USD + 3.00%) | | | 7.85 | % | | | 01/21/2028 | | | | 486,290 | |
1,560,000 | | Pilot Travel Centers LLC, Senior Secured First Lien Term Loan (1 Month Secured Overnight Financing Rate + 2.00%) | | | 6.91 | % | | | 08/04/2028 | | | | 1,556,747 | |
897,750 | | Playa Resorts Holdings B.V. (1 Month Secured Overnight Financing Rate + 4.25%, 0.50% Floor) | | | 8.99 | % | | | 01/05/2029 | | | | 893,890 | |
721,375 | | PMHC, Inc., Senior Secured First Lien Term Loan (3 Month Secured Overnight Financing Rate + 4.25%, 0.50% Floor) | | | 9.08 | % | | | 04/23/2029 | | | | 637,778 | |
578,200 | | PointClickCare Technologies, Inc., Senior Secured First Lien Term Loan (1 Month LIBOR USD + 3.00%, 0.75% Floor) | | | 7.88 | % | | | 12/29/2027 | | | | 570,973 | |
899,573 | | Polar US Borrower LLC, Senior Secured First Lien Term Loan (6 Month Secured Overnight Financing Rate + 4.75%) | | | 9.02 | % | | | 10/15/2025 | | | | 752,907 | |
573,948 | | Polaris Newco LLC, Senior Secured First Lien Term Loan (3 Month LIBOR USD + 4.00%, 0.50% Floor) | | | 9.16 | % | | | 06/02/2028 | | | | 525,002 | |
432,300 | | PQ Corporation, Senior Secured First Lien Term Loan (3 Month LIBOR USD + 2.50%, 0.50% Floor) | | | 7.33 | % | | | 06/09/2028 | | | | 429,598 | |
158,019 | | PRA Health Sciences, Inc., Senior Secured First Lien Term Loan (3 Month LIBOR USD + 2.25%, 0.50% Floor) | | | 7.00 | % | | | 07/03/2028 | | | | 157,833 | |
1,572,188 | | Pregis Topco LLC, Senior Secured First Lien Term Loan (1 Month Secured Overnight Financing Rate + 3.75%) | | | 8.67 | % | | | 07/31/2026 | | | | 1,537,599 | |
| | Pretium PKG Holdings, Inc., Senior Secured First Lien Term Loan | | | | | | | | | | | | |
911,141 | | (3 Month LIBOR USD + 4.00%, 0.50% Floor) | | | 8.79 | % | | | 10/02/2028 | | | | 732,329 | |
298,547 | | (3 Month LIBOR USD + 4.00%, 0.50% Floor) | | | 9.01 | % | | | 10/02/2028 | | | | 239,957 | |
| | Pretium PKG Holdings, Inc., Senior Secured Second Lien Term Loan | | | | | | | | | | | | |
137,500 | | (3 Month LIBOR USD + 6.75%, 0.50% Floor) | | | 11.54 | % | | | 09/30/2029 | | | | 88,201 | |
137,500 | | (3 Month LIBOR USD + 6.75%, 0.50% Floor) | | | 11.76 | % | | | 09/30/2029 | | | | 88,201 | |
1,114,876 | | Prometric Holdings, Inc., Senior Secured First Lien Term Loan (1 Month LIBOR USD + 3.00%, 1.00% Floor) | | | 7.85 | % | | | 01/29/2025 | | | | 1,047,286 | |
1,441,750 | | Proofpoint, Inc., Senior Secured First Lien Term Loan (1 Month LIBOR USD + 3.25%, 0.50% Floor) | | | 8.09 | % | | | 08/31/2028 | | | | 1,412,511 | |
1,612,328 | | Pug LLC, Senior Secured First Lien Term Loan (1 Month LIBOR USD + 3.50%) | | | 8.34 | % | | | 02/12/2027 | | | | 1,177,008 | |
539,550 | | QUIKRETE Holdings, Inc., Senior Secured First Lien Term Loan (1 Month LIBOR USD + 3.00%) | | | 7.84 | % | | | 03/18/2029 | | | | 534,060 | |
701,862 | | Radiate Holdco LLC, Senior Secured First Lien Term Loan (1 Month LIBOR USD + 3.25%, 0.75% Floor) | | | 8.09 | % | | | 09/25/2026 | | | | 577,187 | |
1,897,214 | | Radiology Partners, Inc., Senior Secured First Lien Term Loan (1 Month LIBOR USD + 4.25%) | | | 8.88 | % | | | 07/09/2025 | | | | 1,538,517 | |
1,227,585 | | RegionalCare Hospital Partners Holdings, Inc., Senior Secured First Lien Term Loan (3 Month LIBOR USD + 3.75%) | | | 8.58 | % | | | 11/14/2025 | | | | 1,172,344 | |
1,507,301 | | Renaissance Holding Corporation, Senior Secured First Lien Term Loan (1 Month LIBOR USD + 3.25%) | | | 8.09 | % | | | 05/30/2025 | | | | 1,468,556 | |
671,277 | | Rent-A-Center, Inc., Senior Secured First Lien Term Loan (3 Month LIBOR USD + 3.25%, 0.50% Floor) | | | 8.13 | % | | | 02/17/2028 | | | | 666,242 | |
110,237 | | Rentpath, Inc., Senior Secured First Lien Term Loan (Prime Rate + 0.00%) | | | 3.25 | % | | | 04/25/2024 | | | | 1,654 | |
1,329,750 | | Restoration Hardware, Inc., Senior Secured First Lien Term Loan (1 Month LIBOR USD + 2.50%, 0.50% Floor) | | | 7.34 | % | | | 10/20/2028 | | | | 1,248,635 | |
873,400 | | Scientific Games International, Inc., Senior Secured First Lien Term Loan (1 Month Secured Overnight Financing Rate + 3.00%, 0.50% Floor) | | | 7.96 | % | | | 04/16/2029 | | | | 868,120 | |
532,955 | | Securus Technologies Holdings, Inc., Senior Secured First Lien Term Loan (3 Month LIBOR USD + 4.50%, 1.00% Floor) | | | 9.66 | % | | | 11/01/2024 | | | | 382,664 | |
1,145,790 | | Sinclair Television Group, Inc., Senior Secured First Lien Term Loan (1 Month LIBOR USD + 2.50%) | | | 7.35 | % | | | 09/30/2026 | | | | 1,054,127 | |
937,044 | | Six Flags Theme Parks, Inc., Senior Secured First Lien Term Loan (1 Month LIBOR USD + 1.75%) | | | 6.60 | % | | | 04/17/2026 | | | | 926,896 | |
859,750 | | SkyMiles IP Ltd., Senior Secured First Lien Term Loan (3 Month LIBOR USD + 3.75%, 1.00% Floor) | | | 8.56 | % | | | 10/20/2027 | | | | 892,425 | |
1,396,500 | | SMG US Midco, Inc., Senior Secured First Lien Term Loan (3 Month LIBOR USD + 2.50%) | | | 7.33 | % | | | 01/23/2025 | | | | 1,385,677 | |
2,414,703 | | Sophia LP, Senior Secured First Lien Term Loan (3 Month LIBOR USD + 3.50%, 0.50% Floor) | | | 8.66 | % | | | 10/07/2027 | | | | 2,390,568 | |
1,376,932 | | Southern Veterinary Partners LLC, Senior Secured First Lien Term Loan (1 Month LIBOR USD + 4.00%, 1.00% Floor) | | | 8.84 | % | | | 10/05/2027 | | | | 1,330,460 | |
1,203,767 | | Spin Holdco, Inc., Senior Secured First Lien Term Loan (3 Month LIBOR USD + 4.00%, 0.75% Floor) | | | 8.99 | % | | | 03/06/2028 | | | | 1,015,461 | |
447,750 | | Spirit AeroSystems, Inc. (3 Month Secured Overnight Financing Rate + 4.50%, 0.50% Floor) | | | 9.18 | % | | | 01/15/2027 | | | | 447,974 | |
1,938,445 | | SRS Distribution, Inc., Senior Secured First Lien Term Loan (1 Month LIBOR USD + 3.50%, 0.50% Floor) | | | 8.34 | % | | | 06/02/2028 | | | | 1,876,899 | |
1,024,298 | | Staples, Inc., Senior Secured First Lien Term Loan (3 Month LIBOR USD + 5.00%) | | | 9.81 | % | | | 04/16/2026 | | | | 945,668 | |
898,179 | | Stars Group Holdings B.V., Senior Secured First Lien Term Loan (3 Month LIBOR USD + 2.25%) | | | 7.41 | % | | | 07/21/2026 | | | | 898,789 | |
446,292 | | Sunshine Luxembourg SARL Senior Secured First Lien Term Loan (3 Month LIBOR USD + 3.75%, 0.75% Floor) | | | 8.91 | % | | | 10/01/2026 | | | | 442,702 | |
702,860 | | SWF Holdings Corporation, Senior Secured First Lien Term Loan (1 Month LIBOR USD + 4.00%, 0.75% Floor) | | | 8.75 | % | | | 10/06/2028 | | | | 593,916 | |
815,475 | | Tecta America Corporation, Senior Secured First Lien Term Loan (1 Month Secured Overnight Financing Rate + 4.00%, 0.75% Floor) | | | 8.92 | % | | | 04/06/2028 | | | | 801,612 | |
588,821 | | Telesat Canada, Senior Secured First Lien Term Loan (3 Month LIBOR USD + 2.75%) | | | 7.58 | % | | | 12/07/2026 | | | | 309,867 | |
853,901 | | Tempo Acquisition LLC, Senior Secured First Lien Term Loan (1 Month Secured Overnight Financing Rate + 3.00%, 0.50% Floor) | | | 7.81 | % | | | 08/31/2028 | | | | 854,170 | |
391,050 | | The Dun & Bradstreet Corporation, Senior Secured First Lien Term Loan (1 Month Secured Overnight Financing Rate + 3.25%) | | | 8.04 | % | | | 01/18/2029 | | | | 389,339 | |
1,098,078 | | The Edelman Financial Engines Centre LLC, Senior Secured First Lien Term Loan (1 Month LIBOR USD + 3.75%, 0.75% Floor) | | | 8.59 | % | | | 04/07/2028 | | | | 1,061,188 | |
497,662 | | The Edelman Financial Engines Centre LLC, Senior Secured Second Lien Term Loan (1 Month LIBOR USD + 6.75%) | | | 11.59 | % | | | 07/20/2026 | | | | 467,927 | |
678,031 | | Tiger Acquisition LLC, Senior Secured First Lien Term Loan (1 Month Secured Overnight Financing Rate + 3.25%, 0.50% Floor) | | | 8.16 | % | | | 06/01/2028 | | | | 661,081 | |
1,227,622 | | Titan Acquisition Limited, Senior Secured First Lien Term Loan (6 Month LIBOR USD + 3.00%) | | | 8.15 | % | | | 03/28/2025 | | | | 1,167,524 | |
1,515,433 | | Trans Union LLC, Senior Secured First Lien Term Loan (1 Month LIBOR USD + 2.25%, 0.50% Floor) | | | 7.09 | % | | | 12/01/2028 | | | | 1,506,591 | |
1,557,998 | | TransDigm, Inc. (3 Month Secured Overnight Financing Rate + 3.25%) | | | 8.15 | % | | | 08/24/2028 | | | | 1,555,661 | |
1,287,551 | | Travelport Finance (Luxembourg) SARL Senior Secured First Lien Term Loan (1 Month LIBOR USD + 8.75%, 1.00% Floor) | | | 13.59 | % | | | 02/28/2025 | | | | 1,323,609 | |
282,070 | | Traverse Midstream Partners LLC, Senior Secured First Lien Term Loan (3 Month Secured Overnight Financing Rate + 3.75%, 0.50% Floor) | | | 8.73 | % | | | 02/16/2028 | | | | 278,192 | |
1,147,654 | | TricorBraun Holdings, Inc., Senior Secured First Lien Term Loan (1 Month LIBOR USD + 3.25%, 0.50% Floor) | | | 8.09 | % | | | 03/03/2028 | | | | 1,123,267 | |
305,525 | | Trident TPI Holdings, Inc., Senior Secured First Lien Term Loan (3 Month LIBOR USD + 4.00%, 0.50% Floor) | | | 9.16 | % | | | 09/15/2028 | | | | 296,121 | |
1,720,157 | | Triton Water Holdings, Inc., Senior Secured First Lien Term Loan (3 Month LIBOR USD + 3.50%, 0.50% Floor) | | | 8.66 | % | | | 03/31/2028 | | | | 1,550,833 | |
| | Uber Technologies | | | | | | | | | | | | |
213,402 | | (3 Month Secured Overnight Financing Rate + 2.75%) | | | 7.87 | % | | | 03/04/2030 | | | | 213,219 | |
494,823 | | (3 Month Secured Overnight Financing Rate + 2.75%) | | | 7.66 | % | | | 03/04/2030 | | | | 494,397 | |
92,633 | | UKG, Inc., Senior Secured First Lien Term Loan (3 Month LIBOR USD + 3.75%) | | | 8.58 | % | | | 05/04/2026 | | | | 91,313 | |
395,000 | | UKG, Inc., Senior Secured Second Lien Term Loan (3 Month LIBOR USD + 5.25%, 0.50% Floor) | | | 10.03 | % | | | 05/03/2027 | | | | 380,583 | |
547,561 | | Ultra Clean Holdings, Inc., Senior Secured First Lien Term Loan (1 Month LIBOR USD + 3.75%) | | | 8.59 | % | | | 08/27/2025 | | | | 548,672 | |
2,040,681 | | United Airlines, Inc., Senior Secured First Lien Term Loan (3 Month LIBOR USD + 3.75%, 0.75% Floor) | | | 8.57 | % | | | 04/21/2028 | | | | 2,030,733 | |
411,110 | | United Natural Foods, Inc., Senior Secured First Lien Term Loan (1 Month Secured Overnight Financing Rate + 3.25%) | | | 8.17 | % | | | 10/22/2025 | | | | 411,880 | |
324,113 | | Univar Solutions USA, Inc., Senior Secured First Lien Term Loan (1 Month LIBOR USD + 2.00%) | | | 6.84 | % | | | 07/01/2026 | | | | 324,315 | |
272,938 | | Univision Communications, Inc., Senior Secured First Lien Term Loan (3 Month Secured Overnight Financing Rate + 4.25%, 0.50% Floor) | | | 9.15 | % | | | 06/24/2029 | | | | 271,505 | |
129,675 | | Vantage Specialty Chemicals, Inc. (1 Month Secured Overnight Financing Rate + 4.75%, 0.50% Floor) | | | 9.60 | % | | | 10/26/2026 | | | | 124,909 | |
2,389,489 | | Verscend Holding Corporation, Senior Secured First Lien Term Loan (1 Month LIBOR USD + 4.00%) | | | 8.84 | % | | | 08/27/2025 | | | | 2,390,241 | |
723,975 | | Viad Corporation, Senior Secured First Lien Term Loan (1 Month Secured Overnight Financing Rate + 5.00%, 0.50% Floor) | | | 9.92 | % | | | 07/31/2028 | | | | 693,206 | |
881,575 | | Victoria’s Secret & Company, Senior secured First Lien Term Loan (3 Month LIBOR USD + 3.25%, 0.50% Floor) | | | 8.24 | % | | | 08/02/2028 | | | | 874,963 | |
1,545,610 | | Vistra Operations Company LLC, Senior Secured First Lien Term Loan (1 Month LIBOR USD + 1.75%) | | | 6.46 | % | | | 12/31/2025 | | | | 1,539,435 | |
10,095 | | VT Topco, Inc., Senior Secured First Lien Delayed-Draw Term Loan (1 Month LIBOR USD + 3.75%, 0.75% Floor) | | | 8.59 | % | | | 08/01/2025 | | | | 9,974 | |
354,112 | | VT Topco, Inc., Senior Secured First Lien Term Loan (1 Month LIBOR USD + 3.75%, 0.75% Floor) | | | 8.59 | % | | | 08/01/2025 | | | | 349,863 | |
622,125 | | Walker & Dunlop, Inc., Senior Secured First Lien Term Loan (1 Month Secured Overnight Financing Rate + 2.25%, 0.50% Floor) | | | 7.16 | % | | | 12/15/2028 | | | | 611,238 | |
995,287 | | Wand NewCo, Inc., Senior Secured First Lien Term Loan (1 Month LIBOR USD + 2.75%) | | | 7.59 | % | | | 02/05/2026 | | | | 978,904 | |
698,709 | | WaterBridge Midstream Operating LLC, Senior Secured First Lien Term Loan (6 Month LIBOR USD + 5.75%, 1.00% Floor) | | | 10.57 | % | | | 06/22/2026 | | | | 688,281 | |
1,259,063 | | Whatabrands LLC, Senior Secured First Lien Term Loan (1 Month LIBOR USD + 3.25%, 0.50% Floor) | | | 8.09 | % | | | 08/03/2028 | | | | 1,247,699 | |
1,555,000 | | WMG Acquisition Corporation, Senior Secured First Lien Term Loan (1 Month LIBOR USD + 2.13%) | | | 6.97 | % | | | 01/20/2028 | | | | 1,541,658 | |
623,672 | | WWEX UNI TopCo Holdings LLC, Senior Secured First Lien Term Loan (3 Month Secured Overnight Financing Rate + 4.00%, 0.75% Floor) | | | 9.17 | % | | | 07/26/2028 | | | | 605,742 | |
692,145 | | Zayo Group Holdings, Inc., Senior Secured First Lien Term Loan (1 Month LIBOR USD + 3.00%) | | | 7.84 | % | | | 03/09/2027 | | | | 566,143 | |
1,031,915 | | Zebra Buyer LLC, Senior Secured First Lien Term Loan (3 Month LIBOR USD + 3.00%, 0.50% Floor) | | | 7.75 | % | | | 11/01/2028 | | | | 1,030,625 | |
850,000 | | Ziggo Financing Partnership, Senior Secured First Lien Term Loan (1 Month LIBOR USD + 2.50%) | | | 7.18 | % | | | 04/28/2028 | | | | 841,147 | |
| | | | | | | | | | | | | | |
Total Bank Loans (Cost $237,000,997) | | | | | | | | | | | 225,353,978 | |
| | | | | | | | | | | | | | |
Collateralized Loan Obligations - 3.8% | |
1,000,000 | | AIMCO Ltd., Series 2018-AA-D (3 Month LIBOR USD + 2.55%) | | | 7.34 | % (f) | | | 04/17/2031 | | | | 919,322 | |
3,500,000 | | Aimco Ltd., Series 2020-11A-AR (3 Month LIBOR USD + 1.13%, 1.13% Floor) | | | 5.92 | % (f) | | | 10/17/2034 | | | | 3,417,517 | |
5,000,000 | | Anchorage Capital Ltd., Series 2021-19A-A (3 Month LIBOR USD + 1.21%, 1.21% Floor) | | | 6.00 | % (f) | | | 10/15/2034 | | | | 4,886,982 | |
1,000,000 | | Apidos, Series 2013-12A-DR (3 Month LIBOR USD + 2.60%) | | | 7.39 | % (f) | | | 04/15/2031 | | | | 916,742 | |
5,000,000 | | Atrium Corporation, Series 9A-DR (3 Month LIBOR USD + 3.60%) | | | 8.55 | % (f) | | | 05/28/2030 | | | | 4,710,872 | |
3,400,000 | | Babson Ltd., Series 2015-IA-DR (3 Month LIBOR USD + 2.60%, 2.60% Floor) | | | 7.41 | % (f) | | | 01/20/2031 | | | | 3,127,958 | |
500,000 | | Bain Capital Credit Ltd., Series 2017-2A-DR2 (3 Month LIBOR USD + 3.10%, 3.10% Floor) | | | 7.92 | % (f) | | | 07/25/2034 | | | | 444,146 | |
1,000,000 | | Bain Capital Credit Ltd., Series 2022-3A-D (Secured Overnight Financing Rate 3 Month + 3.70%, 3.70% Floor) | | | 8.36 | % (f) | | | 07/17/2035 | | | | 876,280 | |
2,500,000 | | Barings Ltd., Series 2015-2A-DR (3 Month LIBOR USD + 2.95%) | | | 7.76 | % (f) | | | 10/20/2030 | | | | 2,293,047 | |
2,000,000 | | Barings Ltd., Series 2018-1A-C (3 Month LIBOR USD + 2.60%) | | | 7.39 | % (f) | | | 04/15/2031 | | | | 1,782,608 | |
5,100,000 | | Barings Ltd., Series 2018-3A-D (3 Month LIBOR USD + 2.90%) | | | 7.71 | % (f) | | | 07/20/2029 | | | | 4,745,447 | |
2,000,000 | | Barings Ltd., Series 2018-4A-D (3 Month LIBOR USD + 2.90%, 2.90% Floor) | | | 7.69 | % (f) | | | 10/15/2030 | | | | 1,886,024 | |
3,000,000 | | Barings Ltd., Series 2019-1A-DR (3 Month LIBOR USD + 3.65%, 3.65% Floor) | | | 8.44 | % (f) | | | 04/15/2036 | | | | 2,781,811 | |
2,250,000 | | Barings Ltd., Series 2019-2A-CR (3 Month LIBOR USD + 3.40%, 3.40% Floor) | | | 8.19 | % (f) | | | 04/15/2036 | | | | 2,063,823 | |
5,000,000 | | Barings Ltd., Series 2020-1A-DR (3 Month LIBOR USD + 3.20%, 3.20% Floor) | | | 7.99 | % (f) | | | 10/15/2036 | | | | 4,635,466 | |
1,000,000 | | Barings Ltd., Series 2021-2A-D (3 Month LIBOR USD + 3.15%, 3.15% Floor) | | | 7.94 | % (f) | | | 07/15/2034 | | | | 930,315 | |
4,000,000 | | BlueMountain Ltd., Series 2015-3A-CR (3 Month LIBOR USD + 2.60%) | | | 7.41 | % (f) | | | 04/20/2031 | | | | 3,475,640 | |
2,000,000 | | BlueMountain Ltd., Series 2016-3A-DR (3 Month LIBOR USD + 3.10%, 3.10% Floor) | | | 7.96 | % (f) | | | 11/15/2030 | | | | 1,759,037 | |
2,400,000 | | BlueMountain Ltd., Series 2017-2A-C (3 Month LIBOR USD + 3.00%) | | | 7.81 | % (f) | | | 10/20/2030 | | | | 2,039,506 | |
1,000,000 | | Buckhorn Park Ltd., Series 2019-1A-DR (3 Month LIBOR USD + 3.10%, 3.10% Floor) | | | 7.89 | % (f) | | | 07/18/2034 | | | | 892,799 | |
2,500,000 | | Canyon Capital Ltd., Series 2012-1RA-D (3 Month LIBOR USD + 3.00%) | | | 7.79 | % (f) | | | 07/15/2030 | | | | 2,225,024 | |
2,750,000 | | Canyon Capital Ltd., Series 2014-1A-CR (3 Month LIBOR USD + 2.75%, 2.75% Floor) | | | 7.55 | % (f) | | | 01/30/2031 | | | | 2,404,920 | |
3,000,000 | | Canyon Capital Ltd., Series 2016-1A-DR (3 Month LIBOR USD + 2.80%) | | | 7.59 | % (f) | | | 07/15/2031 | | | | 2,593,710 | |
2,500,000 | | Canyon Capital Ltd., Series 2021-1A-D (3 Month LIBOR USD + 3.10%, 3.10% Floor) | | | 7.89 | % (f) | | | 04/15/2034 | | | | 2,186,709 | |
1,000,000 | | Canyon Capital Ltd., Series 2021-3A-D (3 Month LIBOR USD + 3.05%, 3.05% Floor) | | | 7.84 | % (f) | | | 07/15/2034 | | | | 869,813 | |
5,000,000 | | Carlyle Global Market Strategies Ltd., Series 2016-3A-DRR (3 Month LIBOR USD + 3.30%, 3.30% Floor) | | | 8.11 | % (f) | | | 07/20/2034 | | | | 4,614,019 | |
9,000,000 | | Carlyle Global Market Strategies Ltd., Series 2021-9A-D (3 Month LIBOR USD + 3.20%, 3.20% Floor) | | | 8.01 | % (f) | | | 10/20/2034 | | | | 8,308,066 | |
6,000,000 | | Cathedral Lake Ltd., Series 2021-8A-C (3 Month LIBOR USD + 2.62%, 2.62% Floor) | | | 7.43 | % (f) | | | 01/20/2035 | | | | 5,857,855 | |
5,000,000 | | Cathedral Lake Ltd., Series 2021-8A-D1 (3 Month LIBOR USD + 3.42%, 3.42% Floor) | | | 8.23 | % (f) | | | 01/20/2035 | | | | 4,373,381 | |
1,000,000 | | CIFC Funding Ltd., Series 2018-3A-D (3 Month LIBOR USD + 2.85%) | | | 7.64 | % (f) | | | 07/18/2031 | | | | 945,195 | |
9,500,000 | | Columbia Cent Ltd., Series 2018-27A-DR (3 Month LIBOR USD + 3.83%, 3.83% Floor) | | | 8.65 | % (f) | | | 01/25/2035 | | | | 8,089,095 | |
3,250,000 | | Cook Park Ltd., Series 2018-1A-D (3 Month LIBOR USD + 2.60%) | | | 7.39 | % (f) | | | 04/17/2030 | | | | 2,864,507 | |
2,000,000 | | Dryden Ltd., Series 2018-57A-D (3 Month LIBOR USD + 2.55%, 2.55% Floor) | | | 7.41 | % (f) | | | 05/15/2031 | | | | 1,784,810 | |
3,000,000 | | Dryden Senior Loan Fund, Series 2015-40A-DR (3 Month LIBOR USD + 3.10%, 3.10% Floor) | | | 7.96 | % (f) | | | 08/15/2031 | | | | 2,798,770 | |
2,006,000 | | Dryden Senior Loan Fund, Series 2016-42A-DR (3 Month LIBOR USD + 2.93%) | | | 7.72 | % (f) | | | 07/15/2030 | | | | 1,792,247 | |
2,200,000 | | Dryden Senior Loan Fund, Series 2016-43A-DR3 (3 Month LIBOR USD + 3.25%, 3.25% Floor) | | | 8.06 | % (f) | | | 04/20/2034 | | | | 2,016,340 | |
2,250,000 | | Fillmore Park Ltd., Series 2018-1A-D (3 Month LIBOR USD + 2.90%) | | | 7.69 | % (f) | | | 07/15/2030 | | | | 2,076,805 | |
2,000,000 | | Gilbert Park Ltd., Series 2017-1A-D (3 Month LIBOR USD + 2.95%) | | | 7.74 | % (f) | | | 10/15/2030 | | | | 1,829,034 | |
4,000,000 | | Gilbert Park Ltd., Series 2017-1A-E (3 Month LIBOR USD + 6.40%) | | | 11.19 | % (f) | | | 10/15/2030 | | | | 3,275,586 | |
3,500,000 | | Goldentree Loan Opportunities Ltd., Series 2015-11A-DR2 (3 Month LIBOR USD + 2.40%) | | | 7.19 | % (f) | | | 01/18/2031 | | | | 3,364,178 | |
1,500,233 | | Halcyon Loan Advisors Funding Ltd., Series 2014-3A-D (3 Month LIBOR USD + 3.65%) | | | 8.47 | % (f) | | | 10/22/2025 | | | | 1,456,138 | |
5,000,000 | | Hayfin Ltd., Series 2018-9A-BR (3 Month LIBOR USD + 1.80%, 1.80% Floor) | | | 6.60 | % (f) | | | 04/28/2031 | | | | 4,860,081 | |
1,000,000 | | Hayfin Ltd., Series 2019-1A-B1R (3 Month LIBOR USD + 1.85%, 1.85% Floor) | | | 6.65 | % (f) | | | 04/28/2031 | | | | 970,073 | |
1,500,000 | | Highbridge Loan Management Ltd., Series 13A-18-D (3 Month LIBOR USD + 3.00%, 3.00% Floor) | | | 7.79 | % (f) | | | 10/15/2030 | | | | 1,378,605 | |
2,500,000 | | Highbridge Loan Management Ltd., Series 8A-2016-DR (3 Month LIBOR USD + 2.90%, 2.90% Floor) | | | 7.71 | % (f) | | | 07/20/2030 | | | | 2,239,934 | |
4,000,000 | | LCM LP, Series 14A-DR (3 Month LIBOR USD + 2.75%) | | | 7.56 | % (f) | | | 07/20/2031 | | | | 3,359,274 | |
2,000,000 | | LCM LP, Series 19A-D (3 Month LIBOR USD + 3.45%, 3.45% Floor) | | | 8.24 | % (f) | | | 07/15/2027 | | | | 1,965,570 | |
2,000,000 | | LCM LP, Series 20A-DR (3 Month LIBOR USD + 2.80%) | | | 7.61 | % (f) | | | 10/20/2027 | | | | 1,956,696 | |
2,000,000 | | LCM LP, Series 25A-D (3 Month LIBOR USD + 3.45%) | | | 8.26 | % (f) | | | 07/20/2030 | | | | 1,738,453 | |
3,250,000 | | LCM LP, Series 28A-D (3 Month LIBOR USD + 2.95%, 2.95% Floor) | | | 7.76 | % (f) | | | 10/20/2030 | | | | 2,740,643 | |
4,000,000 | | LCM LP, Series 30A-DR (3 Month LIBOR USD + 3.00%, 3.00% Floor) | | | 7.81 | % (f) | | | 04/20/2031 | | | | 3,500,990 | |
4,000,000 | | Magnetite Ltd., Series 2015-14RA-D (3 Month LIBOR USD + 2.85%) | | | 7.64 | % (f) | | | 10/18/2031 | | | | 3,785,868 | |
1,500,000 | | Magnetite Ltd., Series 2016-18A-DR (3 Month LIBOR USD + 2.70%) | | | 7.56 | % (f) | | | 11/15/2028 | | | | 1,437,287 | |
2,000,000 | | Magnetite Ltd., Series 2019-23A-DR (3 Month LIBOR USD + 3.05%, 3.05% Floor) | | | 7.87 | % (f) | | | 01/25/2035 | | | | 1,855,137 | |
2,000,000 | | Neuberger Berman Loan Advisers Ltd., Series 2019-32A-DR (3 Month LIBOR USD + 2.70%, 2.70% Floor) | | | 7.50 | % (f) | | | 01/20/2032 | | | | 1,862,325 | |
6,000,000 | | Oak Hill Credit Funding Ltd., Series 2014-10RA-D1R (3 Month LIBOR USD + 3.05%, 3.05% Floor) | | | 7.86 | % (f) | | | 04/20/2034 | | | | 5,718,849 | |
5,600,000 | | Octagon Investment Partners Ltd., Series 2012-1A-CRR (3 Month LIBOR USD + 3.90%, 3.90% Floor) | | | 8.69 | % (f) | | | 07/15/2029 | | | | 4,983,302 | |
2,000,000 | | Octagon Investment Partners Ltd., Series 2013-1A-DR (3 Month LIBOR USD + 3.00%, 3.00% Floor) | | | 7.79 | % (f) | | | 07/17/2030 | | | | 1,775,267 | |
2,000,000 | | Octagon Investment Partners Ltd., Series 2013-1A-DR2 (3 Month LIBOR USD + 2.50%) | | | 7.32 | % (f) | | | 01/25/2031 | | | | 1,683,477 | |
2,250,000 | | Octagon Investment Partners Ltd., Series 2014-1A-CR3 (3 Month LIBOR USD + 2.75%, 2.75% Floor) | | | 7.62 | % (f) | | | 02/14/2031 | | | | 2,066,756 | |
2,500,000 | | Octagon Investment Partners Ltd., Series 2014-1A-ERR (3 Month LIBOR USD + 5.45%, 5.45% Floor) | | | 10.27 | % (f) | | | 01/22/2030 | | | | 2,048,500 | |
10,000,000 | | Octagon Investment Partners Ltd., Series 2016-1A-DR (3 Month LIBOR USD + 2.95%) | | | 7.74 | % (f) | | | 07/15/2030 | | | | 8,831,453 | |
5,460,000 | | Octagon Investment Partners Ltd., Series 2017-1A-CR (3 Month LIBOR USD + 3.30%) | | | 8.11 | % (f) | | | 03/17/2030 | | | | 4,851,973 | |
1,760,000 | | Octagon Investment Partners Ltd., Series 2017-1A-D (3 Month LIBOR USD + 6.20%) | | | 11.01 | % (f) | | | 03/17/2030 | | | | 1,454,751 | |
1,500,000 | | Octagon Investment Partners Ltd., Series 2018-18A-C (3 Month LIBOR USD + 2.70%) | | | 7.49 | % (f) | | | 04/16/2031 | | | | 1,330,188 | |
2,500,000 | | Octagon Investment Partners Ltd., Series 2018-2A-C (3 Month LIBOR USD + 2.85%) | | | 7.67 | % (f) | | | 07/25/2030 | | | | 2,238,316 | |
3,500,000 | | Octagon Investment Partners Ltd., Series 2019-1A-DR (3 Month LIBOR USD + 3.35%, 3.35% Floor) | | | 8.16 | % (f) | | | 01/20/2035 | | | | 3,118,998 | |
5,000,000 | | Race Point Ltd., Series 2013-8A-DR2 (3 Month LIBOR USD + 3.50%, 3.50% Floor) | | | 8.42 | % (f) | | | 02/20/2030 | | | | 4,403,794 | |
3,500,000 | | Sound Point Ltd., Series 2016-2A-DR (3 Month LIBOR USD + 3.85%, 3.85% Floor) | | | 8.66 | % (f) | | | 10/20/2028 | | | | 3,436,944 | |
9,000,000 | | Sound Point Ltd., Series 2016-3A-DR (3 Month LIBOR USD + 3.65%, 3.65% Floor) | | | 8.47 | % (f) | | | 01/23/2029 | | | | 8,826,332 | |
7,000,000 | | Sound Point Ltd., Series 2019-2A-DR (3 Month LIBOR USD + 3.30%, 3.30% Floor) | | | 8.09 | % (f) | | | 07/15/2034 | | | | 6,003,909 | |
7,000,000 | | Sound Point Ltd., Series 2019-3A-DR (3 Month LIBOR USD + 3.50%, 3.50% Floor) | | | 8.32 | % (f) | | | 10/25/2034 | | | | 5,992,755 | |
2,000,000 | | Sound Point Ltd., Series 2020-1A-DR (3 Month LIBOR USD + 3.35%, 3.35% Floor) | | | 8.16 | % (f) | | | 07/20/2034 | | | | 1,737,156 | |
4,000,000 | | Sound Point Ltd., Series 2020-3A-D (3 Month LIBOR USD + 3.65%, 3.65% Floor) | | | 8.47 | % (f) | | | 01/25/2032 | | | | 3,591,130 | |
1,250,000 | | Sound Point Ltd., Series 2021-3A-D (3 Month LIBOR USD + 3.25%, 3.25% Floor) | | | 8.07 | % (f) | | | 10/25/2034 | | | | 1,093,173 | |
1,000,000 | | Sound Point Ltd., Series 2021-4A-D (3 Month LIBOR USD + 3.40%, 3.40% Floor) | | | 8.22 | % (f) | | | 10/25/2034 | | | | 872,645 | |
10,000,000 | | Steward Park Ltd., Series 2015-1A-DR (3 Month LIBOR USD + 2.60%, 2.60% Floor) | | | 7.39 | % (f) | | | 01/15/2030 | | | | 8,860,582 | |
3,000,000 | | Symphony Ltd., Series 2015-16A-DR (3 Month LIBOR USD + 3.05%, 3.05% Floor) | | | 7.84 | % (f) | | | 10/15/2031 | | | | 2,697,746 | |
2,250,000 | | THL Credit Wind River Ltd., Series 2014-1A-DRR (3 Month LIBOR USD + 3.00%, 3.00% Floor) | | | 7.79 | % (f) | | | 07/18/2031 | | | | 1,883,229 | |
1,000,000 | | THL Credit Wind River Ltd., Series 2014-2A-ER (3 Month LIBOR USD + 5.75%, 5.75% Floor) | | | 10.54 | % (b)(f) | | | 01/15/2031 | | | | 725,741 | |
4,000,000 | | THL Credit Wind River Ltd., Series 2014-3A-DR2 (3 Month LIBOR USD + 3.40%, 3.40% Floor) | | | 8.22 | % (f) | | | 10/22/2031 | | | | 3,366,171 | |
3,000,000 | | THL Credit Wind River Ltd., Series 2017-1A-DR (3 Month LIBOR USD + 3.72%, 3.72% Floor) | | | 8.51 | % (f) | | | 04/18/2036 | | | | 2,555,492 | |
4,000,000 | | THL Credit Wind River Ltd., Series 2017-3A-DR (3 Month LIBOR USD + 3.85%, 3.85% Floor) | | | 8.64 | % (f) | | | 04/15/2035 | | | | 3,576,510 | |
4,000,000 | | THL Credit Wind River Ltd., Series 2018-1A-D (3 Month LIBOR USD + 2.90%) | | | 7.69 | % (f) | | | 07/15/2030 | | | | 3,504,173 | |
2,500,000 | | THL Credit Wind River Ltd., Series 2018-2A-D (3 Month LIBOR USD + 3.00%) | | | 7.79 | % (f) | | | 07/15/2030 | | | | 2,137,101 | |
10,000,000 | | Trimaran CAVU LLC, Series 2021-3A-D (3 Month LIBOR USD + 3.78%, 3.78% Floor) | | | 8.57 | % (f) | | | 01/18/2035 | | | | 9,019,974 | |
1,000,000 | | Upland Ltd., Series 2016-1A-CR (3 Month LIBOR USD + 2.90%) | | | 7.71 | % (f) | | | 04/20/2031 | | | | 897,306 | |
3,000,000 | | Voya Ltd., Series 2014-1A-CR2 (Secured Overnight Financing Rate 3 Month + 3.06%) | | | 7.69 | % (f) | | | 04/18/2031 | | | | 2,605,952 | |
3,000,000 | | Voya Ltd., Series 2017-3A-CR (3 Month LIBOR USD + 3.15%) | | | 7.96 | % (f) | | | 04/20/2034 | | | | 2,696,719 | |
4,000,000 | | Voya Ltd., Series 2018-2A-D (3 Month LIBOR USD + 2.75%, 2.75% Floor) | | | 7.54 | % (f) | | | 07/15/2031 | | | | 3,538,393 | |
5,000,000 | | Wellfleet Ltd., Series 2019-XA-A1R (3 Month LIBOR USD + 1.17%) | | | 5.98 | % (f) | | | 07/20/2032 | | | | 4,894,785 | |
| | | | | | | | | | | | | | |
Total Collateralized Loan Obligations (Cost $306,182,899) | | | | | | | | | | | 276,982,022 | |
| | | | | | | | | | | | | | |
Foreign Corporate Bonds - 5.8% | |
263,000 | | 1375209 B.C. Ltd. | | | 9.00 | % (f) | | | 01/30/2028 | | | | 261,027 | |
1,300,000 | | Adani Electricity Mumbai Ltd. | | | 3.95 | % | | | 02/12/2030 | | | | 928,652 | |
500,000 | | Adani Electricity Mumbai Ltd. | | | 3.87 | % | | | 07/22/2031 | | | | 347,430 | |
1,372,500 | | Adani International Container Terminal Private Ltd. | | | 3.00 | % (f) | | | 02/16/2031 | | | | 1,047,139 | |
2,928,000 | | Adani International Container Terminal Private Ltd. | | | 3.00 | % | | | 02/16/2031 | | | | 2,233,896 | |
1,000,000 | | Adani Ports & Special Economic Zone Ltd. | | | 4.00 | % | | | 07/30/2027 | | | | 796,000 | |
214,000 | | Adani Ports & Special Economic Zone Ltd. | | | 4.20 | % | | | 08/04/2027 | | | | 169,809 | |
1,700,000 | | Adani Ports & Special Economic Zone Ltd. | | | 4.38 | % | | | 07/03/2029 | | | | 1,286,149 | |
700,000 | | Adani Ports & Special Economic Zone Ltd. | | | 3.10 | % | | | 02/02/2031 | | | | 451,544 | |
4,500,000 | | AES Andres B.V. | | | 5.70 | % (f) | | | 05/04/2028 | | | | 3,952,800 | |
3,200,000 | | AI Candelaria Spain S.A. | | | 5.75 | % (f) | | | 06/15/2033 | | | | 2,272,000 | |
900,000 | | AI Candelaria Spain S.A. | | | 5.75 | % | | | 06/15/2033 | | | | 639,000 | |
800,000 | | Altice Financing S.A. | | | 5.00 | % (f) | | | 01/15/2028 | | | | 651,280 | |
1,305,000 | | Altice France Holding S.A. | | | 6.00 | % (f) | | | 02/15/2028 | | | | 834,025 | |
1,660,000 | | Altice France Holding S.A. | | | 5.50 | % (f) | | | 10/15/2029 | | | | 1,270,823 | |
540,000 | | Anheuser-Busch InBev Worldwide, Inc. | | | 4.90 | % | | | 02/01/2046 | | | | 528,414 | |
12,018,000 | | Anheuser-Busch InBev Worldwide, Inc. | | | 4.60 | % | | | 04/15/2048 | | | | 11,353,777 | |
340,000 | | ARD Finance S.A. (7.25% PIK) | | | 6.50 | % (f) | | | 06/30/2027 | | | | 260,508 | |
7,697,000 | | Australia & New Zealand Banking Group Ltd. (5 Year CMT Rate + 1.70%) (5 Year CMT Rate + 1.70%) | | | 2.57 | % (f) | | | 11/25/2035 | | | | 5,946,035 | |
1,066,595 | | Avation Capital S.A. (9.00% PIK) | | | 8.25 | % (f) | | | 10/31/2026 | | | | 923,642 | |
9,225,000 | | Avolon Holdings Funding Ltd. | | | 3.25 | % (f) | | | 02/15/2027 | | | | 8,195,613 | |
1,000,000 | | Banco Continental SAECA | | | 2.75 | % | | | 12/10/2025 | | | | 888,630 | |
2,400,000 | | Banco Davivienda S.A. (10 Year CMT Rate + 5.10%) | | | 6.65 | % (f)(g) | | | 04/22/2031 | | | | 1,660,800 | |
500,000 | | Banco de Credito del Peru S.A. (5 Year CMT Rate + 2.45%) | | | 3.25 | % | | | 09/30/2031 | | | | 431,843 | |
1,200,000 | | Banco de Credito del Peru S.A. (5 Year CMT Rate + 3.00%) | | | 3.13 | % | | | 07/01/2030 | | | | 1,081,217 | |
500,000 | | Banco de Credito del Peru S.A. (5 Year CMT Rate + 3.00%) | | | 3.13 | % (f) | | | 07/01/2030 | | | | 450,507 | |
900,000 | | Banco do Brasil S.A. (10 Year CMT Rate + 6.36%) | | | 9.00 | % (g) | | | 06/18/2024 | | | | 886,725 | |
300,000 | | Banco Industrial S.A. (5 Year CMT Rate + 4.44%) | | | 4.88 | % | | | 01/29/2031 | | | | 277,377 | |
4,555,000 | | Banco Internacional del Peru S.A.A. Interbank (5 Year CMT Rate + 3.71%) | | | 4.00 | % | | | 07/08/2030 | | | | 4,182,128 | |
700,000 | | Banco Latinoamericano de Comercio Exterior S.A. | | | 2.38 | % | | | 09/14/2025 | | | | 644,695 | |
550,000 | | Banco Mercantil del Norte S.A. (10 Year CMT Rate + 5.03%) | | | 6.63 | % (g) | | | 01/24/2032 | | | | 444,125 | |
3,700,000 | | Banco Mercantil del Norte S.A. (10 Year CMT Rate + 5.35%) | | | 7.63 | % (g) | | | 01/10/2028 | | | | 3,277,275 | |
2,521,000 | | Banco Mercantil del Norte S.A. (10 Year CMT Rate + 5.47%) | | | 7.50 | % (f)(g) | | | 06/27/2029 | | | | 2,181,716 | |
300,000 | | Banco Mercantil del Norte S.A. (10 Year CMT Rate + 5.47%) | | | 7.50 | % (g) | | | 06/27/2029 | | | | 259,625 | |
600,000 | | Banco Santander Mexico S.A. Institucion de Banca Multiple Grupo Financiero Santand (5 Year CMT Rate + 3.00%) | | | 5.95 | % | | | 10/01/2028 | | | | 587,387 | |
1,000,000 | | Bancolombia S.A. (5 Year CMT Rate + 2.94%) | | | 4.63 | % | | | 12/18/2029 | | | | 840,995 | |
2,500,000 | | Bangkok Bank PCL (5 Year CMT Rate + 4.73%) | | | 5.00 | % (g) | | | 09/23/2025 | | | | 2,278,171 | |
2,000,000 | | Banistmo S.A. | | | 4.25 | % | | | 07/31/2027 | | | | 1,832,405 | |
4,100,000 | | Bank Hapoalim B.M. | | | 3.26 | % (a)(f) | | | 01/21/2032 | | | | 3,425,550 | |
1,050,000 | | Bank Leumi (5 Year CMT Rate + 1.63%) | | | 3.28 | % (f) | | | 01/29/2031 | | | | 916,534 | |
9,226,000 | | Bank of Montreal (5 Year Swap Rate USD + 1.43%) | | | 3.80 | % | | | 12/15/2032 | | | | 8,336,952 | |
12,510,000 | | Bank of Nova Scotia (5 Year CMT Rate + 2.05%) | | | 4.59 | % | | | 05/04/2037 | | | | 11,037,792 | |
10,485,000 | | Barclays PLC (3 Month LIBOR USD + 1.38%) | | | 6.25 | % | | | 05/16/2024 | | | | 10,449,377 | |
13,550,000 | | BAT Capital Corporation | | | 3.46 | % | | | 09/06/2029 | | | | 11,990,239 | |
400,000 | | BBVA Bancomer S.A. (5 Year CMT Rate + 2.65%) | | | 5.13 | % | | | 01/18/2033 | | | | 342,512 | |
500,000 | | BBVA Bancomer S.A. (5 Year CMT Rate + 3.00%) | | | 5.35 | % | | | 11/12/2029 | | | | 469,861 | |
800,000 | | BBVA Bancomer S.A. (5 Year CMT Rate + 4.31%) | | | 5.88 | % | | | 09/13/2034 | | | | 699,360 | |
1,775,000 | | Bell Telephone Company of Canada | | | 3.65 | % | | | 08/15/2052 | | | | 1,374,526 | |
1,050,278 | | Bioceanico Sovereign Certificate Ltd. | | | 0.00 | % | | | 06/05/2034 | | | | 706,042 | |
12,430,000 | | BNP Paribas S.A. (Secured Overnight Financing Rate + 1.51%) | | | 3.05 | % (f) | | | 01/13/2031 | | | | 10,667,910 | |
1,205,000 | | Bombardier, Inc. | | | 7.88 | % (f) | | | 04/15/2027 | | | | 1,221,019 | |
6,480,000 | | BPCE S.A. | | | 1.00 | % (f) | | | 01/20/2026 | | | | 5,779,751 | |
1,400,000 | | Braskem Idesa SAPI | | | 6.99 | % | | | 02/20/2032 | | | | 1,057,835 | |
2,300,000 | | Braskem Netherlands Finance B.V. (5 Year CMT Rate + 8.22%) | | | 8.50 | % | | | 01/23/2081 | | | | 2,292,525 | |
2,800,000 | | C&W Senior Financing | | | 6.88 | % | | | 09/15/2027 | | | | 2,507,327 | |
2,450,000 | | CAP S.A. | | | 3.90 | % | | | 04/27/2031 | | | | 1,891,685 | |
2,100,000 | | CAP S.A. | | | 3.90 | % (f) | | | 04/27/2031 | | | | 1,621,444 | |
4,685,000 | | CCL Industries, Inc. | | | 3.05 | % (f) | | | 06/01/2030 | | | | 3,986,062 | |
300,000 | | Cemex S.A.B. de C.V. (5 Year CMT Rate + 4.91%) | | | 9.13 | % (f)(g) | | | 03/14/2028 | | | | 300,811 | |
1,000,000 | | CEMEX, S.A.B de C.V. (5 Year CMT Rate + 4.53%) | | | 5.13 | % (g) | | | 06/08/2026 | | | | 896,200 | |
5,000,000 | | Chile Electricity PEC S.p.A. | | | 0.00 | % (f) | | | 01/25/2028 | | | | 3,757,759 | |
4,325,000 | | CI Financial Corporation | | | 4.10 | % | | | 06/15/2051 | | | | 2,624,638 | |
5,185,000 | | Commonwealth Bank of Australia | | | 4.32 | % (f) | | | 01/10/2048 | | | | 3,982,218 | |
1,100,000 | | Corporacion Financiera de Desarrollo S.A. (3 Month LIBOR USD + 5.61%) | | | 5.25 | % | | | 07/15/2029 | | | | 1,063,524 | |
1,181,000 | | Cosan Overseas Ltd. | | | 8.25 | % (g) | | | 05/05/2023 | | | | 1,176,329 | |
200,000 | | Cosan Overseas Ltd. | | | 7.00 | % | | | 01/20/2027 | | | | 200,499 | |
5,400,000 | | Credito Real S.A.B. de C.V. (5 Year CMT Rate + 7.03%) | | | 9.13 | % (c)(g) | | | 11/29/2027 | | | | 148,500 | |
1,000,000 | | CT Trust | | | 5.13 | % | | | 02/03/2032 | | | | 837,500 | |
2,300,000 | | DBS Group Holdings Ltd. (5 Year CMT Rate + 1.10%) | | | 1.82 | % | | | 03/10/2031 | | | | 2,075,810 | |
1,252,207 | | Digicel Group Holdings Ltd. (5.00% + 3.00% PIK) | | | 8.00 | % (f) | | | 04/01/2025 | | | | 501,997 | |
1,809,487 | | Digicel Group Holdings Ltd. (7.00% PIK) | | | 7.00 | % (f)(g) | | | 04/17/2023 | | | | 210,516 | |
900,000 | | Ecopetrol S.A. | | | 5.88 | % | | | 05/28/2045 | | | | 625,500 | |
9,200,000 | | Ecopetrol S.A. | | | 5.88 | % | | | 11/02/2051 | | | | 6,228,400 | |
1,660,000 | | eG Global Finance PLC | | | 8.50 | % (f) | | | 10/30/2025 | | | | 1,556,059 | |
4,700,000 | | EIG Pearl Holdings SARL | | | 3.55 | % | | | 08/31/2036 | | | | 4,033,493 | |
300,000 | | EIG Pearl Holdings SARL | | | 4.39 | % | | | 11/30/2046 | | | | 237,644 | |
2,388,960 | | Empresa Electrica Cochrane S.p.A. | | | 5.50 | % | | | 05/14/2027 | | | | 2,203,947 | |
5,900,000 | | Empresas Publicas de Medellin ESP | | | 4.25 | % | | | 07/18/2029 | | | | 4,522,017 | |
2,000,000 | | Empresas Publicas de Medellin ESP | | | 4.38 | % | | | 02/15/2031 | | | | 1,443,615 | |
6,030,000 | | Enbridge, Inc. | | | 3.40 | % | | | 08/01/2051 | | | | 4,259,392 | |
819,000 | | Fideicomiso P.A. Pacifico Tres | | | 8.25 | % | | | 01/15/2035 | | | | 731,960 | |
1,000,000 | | Freeport Indonesia PT | | | 5.32 | % (f) | | | 04/14/2032 | | | | 936,091 | |
1,900,000 | | Freeport Indonesia PT | | | 6.20 | % | | | 04/14/2052 | | | | 1,743,231 | |
750,000 | | Freeport-McMoRan, Inc. | | | 4.38 | % | | | 08/01/2028 | | | | 703,792 | |
400,000 | | Freeport-McMoRan, Inc. | | | 5.25 | % | | | 09/01/2029 | | | | 392,617 | |
3,000,000 | | Freeport-McMoRan, Inc. | | | 4.63 | % | | | 08/01/2030 | | | | 2,837,184 | |
2,661,300 | | Galaxy Pipeline Assets Bidco Ltd. | | | 2.16 | % (f) | | | 03/31/2034 | | | | 2,295,155 | |
1,400,000 | | Galaxy Pipeline Assets Bidco Ltd. | | | 2.63 | % | | | 03/31/2036 | | | | 1,153,319 | |
2,659,580 | | Galaxy Pipeline Assets Bidco Ltd. | | | 2.94 | % | | | 09/30/2040 | | | | 2,160,872 | |
2,050,000 | | Garda World Security Corporation | | | 4.63 | % (f) | | | 02/15/2027 | | | | 1,842,677 | |
930,000 | | Garda World Security Corporation | | | 6.00 | % (f) | | | 06/01/2029 | | | | 740,545 | |
5,843,000 | | Glencore Funding LLC | | | 1.63 | % (f) | | | 04/27/2026 | | | | 5,292,046 | |
5,525,000 | | Glencore Funding LLC | | | 3.38 | % (f) | | | 09/23/2051 | | | | 3,851,910 | |
300,000 | | Gran Tierra Energy International Holdings Ltd. | | | 6.25 | % (f) | | | 02/15/2025 | | | | 254,574 | |
2,900,000 | | Gran Tierra Energy International Holdings Ltd. | | | 6.25 | % | | | 02/15/2025 | | | | 2,460,886 | |
3,500,000 | | Gran Tierra Energy, Inc. | | | 7.75 | % (f) | | | 05/23/2027 | | | | 2,744,875 | |
1,485,000 | | Grifols Escrow Issuer S.A. | | | 4.75 | % (f) | | | 10/15/2028 | | | | 1,219,200 | |
819,513 | | Guara Notre SARL | | | 5.20 | % | | | 06/15/2034 | | | | 706,375 | |
12,830,000 | | HSBC Holdings PLC (3 Month LIBOR USD + 1.38%) | | | 6.53 | % | | | 09/12/2026 | | | | 12,726,382 | |
3,801,900 | | Hunt Oil Company of Peru LLC Sucursal Del Peru | | | 6.38 | % | | | 06/01/2028 | | | | 3,587,334 | |
885,000 | | Intelsat Jackson Holdings S.A. | | | 6.50 | % (f) | | | 03/15/2030 | | | | 813,519 | |
1,278,180 | | Interoceanica Finance Ltd. | | | 0.00 | % | | | 11/30/2025 | | | | 1,191,903 | |
1,192,690 | | Invepar Holdings | | | 0.00 | % (b)(c) | | | 12/30/2028 | | | | - | |
2,400,000 | | Inversiones La Construccion S.A. | | | 4.75 | % | | | 02/07/2032 | | | | 1,910,816 | |
1,150,500 | | JSW Hydro Energy Ltd. | | | 4.13 | % (f) | | | 05/18/2031 | | | | 955,671 | |
2,200,000 | | JSW Steel Ltd. | | | 5.05 | % | | | 04/05/2032 | | | | 1,802,933 | |
1,000,000 | | Korea Development Bank | | | 1.63 | % | | | 01/19/2031 | | | | 814,312 | |
5,000,000 | | Korea Development Bank | | | 2.00 | % | | | 10/25/2031 | | | | 4,131,466 | |
865,000 | | Kronos Acquisition Holdings, Inc. | | | 5.00 | % (f) | | | 12/31/2026 | | | | 792,025 | |
1,864,182 | | Lima Metro Finance Ltd. | | | 5.88 | % | | | 07/05/2034 | | | | 1,795,915 | |
11,890,000 | | Lloyds Banking Group PLC (3 Month LIBOR USD + 1.21%) | | | 3.57 | % | | | 11/07/2028 | | | | 10,882,543 | |
5,955,120 | | LLPL Capital Pte Ltd. | | | 6.88 | % (f) | | | 02/04/2039 | | | | 5,285,257 | |
16,230,000 | | Macquarie Group Ltd. (Secured Overnight Financing Rate + 1.53%) | | | 2.87 | % (f) | | | 01/14/2033 | | | | 13,160,009 | |
1,340,000 | | Mattamy Group Corporation | | | 4.63 | % (f) | | | 03/01/2030 | | | | 1,167,570 | |
3,623,443 | | MC Brazil Downstream Trading SARL | | | 7.25 | % | | | 06/30/2031 | | | | 2,850,744 | |
500,000 | | MEGlobal Canada ULC | | | 5.00 | % | | | 05/18/2025 | | | | 495,545 | |
1,200,000 | | Mercury Chile Holdco LLC | | | 6.50 | % (f) | | | 01/24/2027 | | | | 1,134,000 | |
2,550,000 | | Mexarrend SAPI de C.V. | | | 10.25 | % (c)(f) | | | 07/24/2024 | | | | 545,917 | |
1,367,000 | | Mexico Generadora de Energia S. de R.L. | | | 5.50 | % | | | 12/06/2032 | | | | 1,317,207 | |
180,000 | | Millicom International Cellular S.A. | | | 5.13 | % | | | 01/15/2028 | | | | 160,954 | |
6,600,000 | | Minejesa Capital B.V. | | | 5.63 | % | | | 08/10/2037 | | | | 5,179,900 | |
1,050,000 | | Mong Duong Finance Holdings B.V. | | | 5.13 | % | | | 05/07/2029 | | | | 892,223 | |
850,000 | | Movida Europe S.A. | | | 5.25 | % | | | 02/08/2031 | | | | 619,013 | |
1,200,000 | | Multibank, Inc. | | | 7.75 | % (f) | | | 02/03/2028 | | | | 1,202,280 | |
1,295,028 | | MV24 Capital B.V. | | | 6.75 | % | | | 06/01/2034 | | | | 1,194,275 | |
8,705,000 | | National Australia Bank Ltd. | | | 2.99 | % (f) | | | 05/21/2031 | | | | 7,004,336 | |
6,580,000 | | NatWest Markets PLC | | | 0.80 | % (f) | | | 08/12/2024 | | | | 6,160,642 | |
1,100,000 | | Network i2i Ltd. (5 Year CMT Rate + 3.39%) | | | 3.98 | % (g) | | | 03/03/2026 | | | | 968,591 | |
450,000 | | Network i2i Ltd. (5 Year CMT Rate + 4.27%) | | | 5.65 | % (g) | | | 01/15/2025 | | | | 429,750 | |
6,205,000 | | NXP B.V. | | | 3.88 | % | | | 06/18/2026 | | | | 5,995,869 | |
2,000,000 | | Oleoducto Central S.A. | | | 4.00 | % | | | 07/14/2027 | | | | 1,712,271 | |
628,000 | | Orazul Energy Peru S.A. | | | 5.63 | % | | | 04/28/2027 | | | | 556,019 | |
500,000 | | Oversea-Chinese Banking Corporation Ltd. (5 Year CMT Rate + 1.58%) | | | 1.83 | % (f) | | | 09/10/2030 | | | | 458,927 | |
2,500,000 | | Oversea-Chinese Banking Corporation Ltd. (5 Year CMT Rate + 1.58%) | | | 1.83 | % | | | 09/10/2030 | | | | 2,294,637 | |
1,300,000 | | Parkland Corporation | | | 4.50 | % (f) | | | 10/01/2029 | | | | 1,156,701 | |
950,000 | | Parkland Corporation | | | 4.63 | % (f) | | | 05/01/2030 | | | | 845,961 | |
3,600,000 | | Petrobras Global Finance B.V. | | | 6.75 | % | | | 06/03/2050 | | | | 3,182,310 | |
2,691,000 | | Petroleos del Peru S.A. | | | 4.75 | % | | | 06/19/2032 | | | | 2,003,207 | |
1,200,000 | | Petroleos del Peru S.A. | | | 5.63 | % | | | 06/19/2047 | | | | 778,200 | |
1,030,000 | | Primo Water Holdings, Inc. | | | 4.38 | % (f) | | | 04/30/2029 | | | | 899,999 | |
1,600,000 | | Reliance Industries Ltd. | | | 2.88 | % | | | 01/12/2032 | | | | 1,331,217 | |
14,010,000 | | Renesas Electronics Corporation | | | 2.17 | % (f) | | | 11/25/2026 | | | | 12,431,406 | |
1,498,500 | | Rutas 2 and 7 Finance Ltd. | | | 0.00 | % | | | 09/30/2036 | | | | 948,364 | |
2,500,000 | | Sasol Financing USA LLC | | | 5.50 | % | | | 03/18/2031 | | | | 2,093,259 | |
5,175,144 | | SCC Power PLC (4.00% + 4.00% PIK) | | | 8.00 | % (f) | | | 12/31/2028 | | | | 1,857,877 | |
2,803,202 | | SCC Power PLC (4.00% or 4.00% PIK) | | | 4.00 | % (f) | | | 05/17/2032 | | | | 204,332 | |
1,010,000 | | Seaspan Corporation | | | 5.50 | % (f) | | | 08/01/2029 | | | | 788,778 | |
1,400,000 | | Shinhan Financial Group Company Ltd. (5 Year CMT Rate + 2.06%) | | | 2.88 | % (f)(g) | | | 05/12/2026 | | | | 1,183,280 | |
200,000 | | Simpar Europe S.A. | | | 5.20 | % | | | 01/26/2031 | | | | 146,342 | |
1,455,000 | | Superior Plus LP | | | 4.50 | % (f) | | | 03/15/2029 | | | | 1,300,919 | |
350,000 | | Sydney Airport Finance Company Pty Ltd. | | | 3.63 | % (f) | | | 04/28/2026 | | | | 337,358 | |
300,000 | | Telefonica Moviles Chile S.A. | | | 3.54 | % (f) | | | 11/18/2031 | | | | 239,502 | |
620,000 | | Telesat LLC | | | 4.88 | % (f) | | | 06/01/2027 | | | | 321,792 | |
614,000 | | Telesat LLC | | | 6.50 | % (f) | | | 10/15/2027 | | | | 196,480 | |
700,000 | | Temasek Financial Ltd. | | | 1.00 | % | | | 10/06/2030 | | | | 559,664 | |
5,900,000 | | Temasek Financial Ltd. | | | 1.00 | % (f) | | | 10/06/2030 | | | | 4,717,172 | |
1,000,000 | | Titan Acquisition Ltd. | | | 7.75 | % (f) | | | 04/15/2026 | | | | 838,520 | |
1,000,000 | | TK Elevator US Newco, Inc. | | | 5.25 | % (f) | | | 07/15/2027 | | | | 945,405 | |
14,840,000 | | Toronto-Dominion Bank | | | 4.69 | % | | | 09/15/2027 | | | | 14,699,402 | |
500,000 | | Transelec S.A. | | | 3.88 | % | | | 01/12/2029 | | | | 462,153 | |
7,966,000 | | TSMC Global Ltd. | | | 1.25 | % (f) | | | 04/23/2026 | | | | 7,205,912 | |
923,278 | | UEP Penonome S.A. | | | 6.50 | % | | | 10/01/2038 | | | | 695,031 | |
4,708,720 | | UEP Penonome S.A. | | | 6.50 | % (f) | | | 10/01/2038 | | | | 3,544,659 | |
9,700,000 | | Unifin Financiera S.A.B. de C.V. (5 Year CMT Rate + 6.31%) | | | 8.88 | % (c)(g) | | | 01/29/2025 | | | | 137,934 | |
2,000,000 | | United Overseas Bank Ltd. (5 Year CMT Rate + 1.23%) | | | 2.00 | % | | | 10/14/2031 | | | | 1,773,397 | |
1,500,000 | | United Overseas Bank Ltd. (5 Year CMT Rate + 1.52%) | | | 1.75 | % | | | 03/16/2031 | | | | 1,345,987 | |
300,000 | | UPL Corporation Ltd. | | | 4.50 | % | | | 03/08/2028 | | | | 265,744 | |
3,350,000 | | UPL Corporation Ltd. | | | 4.63 | % | | | 06/16/2030 | | | | 2,835,730 | |
5,600,000 | | Vedanta Resources Finance PLC | | | 9.25 | % (f) | | | 04/23/2026 | | | | 3,363,560 | |
3,100,000 | | Vedanta Resources Ltd. | | | 6.13 | % | | | 08/09/2024 | | | | 1,840,500 | |
5,720,000 | | Volkswagen Group of America Finance LLC | | | 4.25 | % (f) | | | 11/13/2023 | | | | 5,679,570 | |
1,500,000 | | VTR Comunicaciones S.p.A. | | | 5.13 | % | | | 01/15/2028 | | | | 927,762 | |
1,702,000 | | VTR Finance NV | | | 6.38 | % | | | 07/15/2028 | | | | 689,310 | |
8,070,000 | | Weir Group PLC | | | 2.20 | % (f) | | | 05/13/2026 | | | | 7,275,513 | |
8,200,000 | | Westpac Banking Corporation (5 Year CMT Rate + 1.53%) | | | 3.02 | % | | | 11/18/2036 | | | | 6,431,291 | |
| | | | | | | | | | | | | | |
Total Foreign Corporate Bonds (Cost $509,779,154) | | | | | | | | | | | 422,955,419 | |
| | | | | | | | | | | | | | |
Foreign Government Bonds, Foreign Agencies and Foreign Government Sponsored Corporations - 1.3% | |
1,751,000 | | Banco Nacional de Comercio Exterior (5 Year CMT Rate + 2.00%) | | | 2.72 | % | | | 08/11/2031 | | | | 1,479,309 | |
10,305,000 | | BOC Aviation Ltd. (3 Month LIBOR USD + 1.13%) | | | 6.26 | % (f) | | | 09/26/2023 | | | | 10,303,535 | |
5,700,000 | | Brazilian Government International Bond | | | 5.63 | % | | | 02/21/2047 | | | | 4,814,371 | |
1,500,000 | | Chile Government International Bond | | | 3.50 | % | | | 01/25/2050 | | | | 1,126,552 | |
11,900,000 | | Chile Government International Bond | | | 3.10 | % | | | 01/22/2061 | | | | 7,780,311 | |
2,500,000 | | Colombia Government International Bond | | | 5.00 | % | | | 06/15/2045 | | | | 1,753,668 | |
11,150,000 | | Colombia Government International Bond | | | 4.13 | % | | | 05/15/2051 | | | | 6,898,301 | |
4,100,000 | | Dominican Republic International Bond | | | 4.88 | % (f) | | | 09/23/2032 | | | | 3,491,696 | |
5,800,000 | | Indonesia Government International Bond | | | 3.70 | % | | | 10/30/2049 | | | | 4,612,585 | |
17,270,000 | | Mexico Government International Bond | | | 3.75 | % | | | 01/11/2028 | | | | 16,586,386 | |
3,500,000 | | Mexico Government International Bond | | | 2.66 | % | | | 05/24/2031 | | | | 2,929,678 | |
9,200,000 | | Mexico Government International Bond | | | 4.28 | % | | | 08/14/2041 | | | | 7,540,687 | |
3,000,000 | | Mexico Government International Bond | | | 4.40 | % | | | 02/12/2052 | | | | 2,351,547 | |
5,535,000 | | NBN Company Ltd. | | | 1.45 | % (f) | | | 05/05/2026 | | | | 5,006,387 | |
4,600,000 | | Panama Government International Bond | | | 2.25 | % | | | 09/29/2032 | | | | 3,536,847 | |
200,000 | | Panama Government International Bond | | | 4.30 | % | | | 04/29/2053 | | | | 147,233 | |
1,900,000 | | Panama Government International Bond | | | 4.50 | % | | | 04/01/2056 | | | | 1,418,838 | |
5,800,000 | | Panama Government International Bond | | | 3.87 | % | | | 07/23/2060 | | | | 3,815,814 | |
900,000 | | Perusahaan Penerbit SBSN Indonesia III | | | 3.80 | % | | | 06/23/2050 | | | | 722,357 | |
2,000,000 | | Philippine Government International Bond | | | 3.70 | % | | | 02/02/2042 | | | | 1,640,249 | |
3,100,000 | | Philippine Government International Bond | | | 2.95 | % | | | 05/05/2045 | | | | 2,240,311 | |
800,000 | | Philippine Government International Bond | | | 2.65 | % | | | 12/10/2045 | | | | 550,150 | |
2,800,000 | | Republic of South Africa Government Bond | | | 4.30 | % | | | 10/12/2028 | | | | 2,518,390 | |
7,500,000 | | Saudi Government International Bond | | | 3.45 | % | | | 02/02/2061 | | | | 5,320,373 | |
| | | | | | | | | | | | | | |
Total Foreign Government Bonds, Foreign Agencies and Foreign Government Sponsored Corporations (Cost $121,195,881) | | | | | | | | | | | 98,585,575 | |
| | | | | | | | | | | | | | |
Municipal Bonds - 0.1% | |
4,430,000 | | State of California | | | 7.55 | % | | | 04/01/2039 | | | | 5,746,682 | |
| | | | | | | | | | | | | | |
Total Municipal Bonds (Cost $6,240,186) | | | | | | | | | | | 5,746,682 | |
| | | | | | | | | | | | | | |
Non-Agency Commercial Mortgage Backed Obligations - 5.4% | |
22,775,500 | | Arbor Multifamily Mortgage Securities Trust, Series 2021-MF2-XB | | | 0.75 | % (a)(f)(h) | | | 06/15/2054 | | | | 1,168,627 | |
2,638,666 | | BAMLL Commercial Mortgage Securities Trust, Series 2016-ISQ-C | | | 3.61 | % (a)(f) | | | 08/14/2034 | | | | 2,084,405 | |
5,515,000 | | Bank of America Merrill Lynch Commercial Mortgage Trust, Series 2015-UBS7-C | | | 4.34 | % (a) | | | 09/15/2048 | | | | 4,689,638 | |
4,123,978 | | BANK, Series 2017-BNK8-XA | | | 0.71 | % (a)(h) | | | 11/15/2050 | | | | 109,537 | |
1,005,000 | | BANK, Series 2020-BN28-AS | | | 2.14 | % | | | 03/15/2063 | | | | 782,410 | |
4,009,000 | | BANK, Series 2021-BN35-A5 | | | 2.29 | % | | | 06/15/2064 | | | | 3,249,649 | |
3,109,000 | | BANK, Series 2021-BN37-C | | | 3.11 | % (a) | | | 11/15/2064 | | | | 2,161,344 | |
11,034,000 | | BANK, Series 2022-BNK39-AS | | | 3.18 | % | | | 02/15/2055 | | | | 8,900,027 | |
2,682,000 | | BANK, Series 2022-BNK39-E | | | 2.50 | % (f) | | | 02/15/2055 | | | | 1,228,734 | |
4,526,000 | | BBCMS Mortgage Trust, Series 2021-C12-A5 | | | 2.69 | % | | | 11/15/2054 | | | | 3,767,728 | |
5,364,000 | | BBCMS Mortgage Trust, Series 2022-C14-A5 | | | 2.95 | % (a) | | | 02/15/2055 | | | | 4,548,089 | |
5,785,000 | | BBCMS Mortgage Trust, Series 2022-C16-A5 | | | 4.60 | % (a) | | | 06/15/2055 | | | | 5,581,900 | |
4,598,000 | | Benchmark Mortgage Trust, Series 2020-B18-AGNF | | | 4.14 | % (f) | | | 07/15/2053 | | | | 3,953,340 | |
4,549,000 | | Benchmark Mortgage Trust, Series 2020-B19-AS | | | 2.15 | % | | | 09/15/2053 | | | | 3,498,630 | |
1,091,000 | | Benchmark Mortgage Trust, Series 2020-B19-C | | | 3.21 | % | | | 09/15/2053 | | | | 794,840 | |
89,954,742 | | Benchmark Mortgage Trust, Series 2021-B28-XA | | | 1.28 | % (a)(h) | | | 08/15/2054 | | | | 6,564,276 | |
10,350,000 | | Benchmark Mortgage Trust, Series 2022-B32-AS | | | 3.41 | % (a) | | | 01/15/2055 | | | | 8,631,589 | |
4,600,000 | | BPR Trust, Series 2022-OANA-A (Secured Overnight Financing Rate 1 Month + 1.90%, 1.90% Floor) | | | 6.73 | % (f) | | | 04/15/2037 | | | | 4,431,069 | |
11,798,000 | | BX Trust, Series 2019-OC11-E | | | 3.94 | % (a)(f) | | | 12/09/2041 | | | | 9,396,108 | |
7,065,276 | | BX Trust, Series 2021-XL2-E (1 Month LIBOR USD + 1.85%, 1.85% Floor) | | | 6.53 | % (f) | | | 10/15/2038 | | | | 6,589,548 | |
4,955,000 | | CD Commercial Mortgage Trust, Series 2017-CD4-C | | | 4.35 | % (a) | | | 05/10/2050 | | | | 3,907,650 | |
2,106,902 | | CFCRE Commercial Mortgage Trust, Series 2016-C6-A2 | | | 2.95 | % | | | 11/10/2049 | | | | 1,950,750 | |
3,267,000 | | CFCRE Commercial Mortgage Trust, Series 2017-C8-B | | | 4.20 | % (a) | | | 06/15/2050 | | | | 2,812,487 | |
1,898,500 | | Citigroup Commercial Mortgage Trust, Series 2015-GC27-D | | | 4.42 | % (a)(f) | | | 02/10/2048 | | | | 1,600,717 | |
3,153,934 | | Citigroup Commercial Mortgage Trust, Series 2015-GC27-XA | | | 1.31 | % (a)(h) | | | 02/10/2048 | | | | 55,147 | |
4,470,000 | | Citigroup Commercial Mortgage Trust, Series 2016-GC36-D | | | 2.85 | % (f) | | | 02/10/2049 | | | | 2,334,239 | |
36,935,047 | | Citigroup Commercial Mortgage Trust, Series 2016-P3-XA | | | 1.66 | % (a)(h) | | | 04/15/2049 | | | | 1,227,858 | |
38,897,201 | | Citigroup Commercial Mortgage Trust, Series 2016-P4-XA | | | 1.89 | % (a)(h) | | | 07/10/2049 | | | | 1,776,645 | |
66,760,723 | | Citigroup Commercial Mortgage Trust, Series 2016-P5-XA | | | 1.38 | % (a)(h) | | | 10/10/2049 | | | | 2,461,615 | |
13,720,000 | | Citigroup Commercial Mortgage Trust, Series 2017-C4-B | | | 4.10 | % (a) | | | 10/12/2050 | | | | 12,295,071 | |
4,534,000 | | Citigroup Commercial Mortgage Trust, Series 2019-GC41-B | | | 3.20 | % | | | 08/10/2056 | | | | 3,653,139 | |
8,478,000 | | Citigroup Commercial Mortgage Trust, Series 2020-555-F | | | 3.50 | % (a)(f) | | | 12/10/2041 | | | | 6,074,314 | |
7,003,000 | | Citigroup Commercial Mortgage Trust, Series 2020-555-G | | | 3.50 | % (a)(f) | | | 12/10/2041 | | | | 4,755,216 | |
10,383,000 | | Citigroup Commercial Mortgage Trust, Series 2022-GC48-A5 | | | 4.58 | % (a) | | | 05/15/2054 | | | | 10,093,332 | |
1,857,021 | | Commercial Mortgage Pass-Through Trust, Series 2012-CR3-XA | | | 1.23 | % (a)(h) | | | 10/15/2045 | | | | 19 | |
1,815,000 | | Commercial Mortgage Pass-Through Trust, Series 2014-CR16-B | | | 4.58 | % | | | 04/10/2047 | | | | 1,742,369 | |
3,325,000 | | Commercial Mortgage Pass-Through Trust, Series 2015-CR25-B | | | 4.52 | % (a) | | | 08/10/2048 | | | | 3,142,681 | |
50,225,730 | | Commercial Mortgage Pass-Through Trust, Series 2015-CR26-XA | | | 0.90 | % (a)(h) | | | 10/10/2048 | | | | 869,714 | |
4,310,000 | | Commercial Mortgage Pass-Through Trust, Series 2015-LC21-C | | | 4.33 | % (a) | | | 07/10/2048 | | | | 3,954,455 | |
43,384,404 | | Commercial Mortgage Pass-Through Trust, Series 2016-DC2-XA | | | 0.93 | % (a)(h) | | | 02/10/2049 | | | | 894,461 | |
3,461,000 | | CSAIL Commercial Mortgage Trust, Series 2016-C6-D | | | 4.92 | % (a)(f) | | | 01/15/2049 | | | | 2,517,082 | |
35,827,707 | | CSAIL Commercial Mortgage Trust, Series 2016-C6-XA | | | 1.86 | % (a)(h) | | | 01/15/2049 | | | | 1,553,317 | |
6,000,000 | | CSAIL Commercial Mortgage Trust, Series 2018-C14-C | | | 4.92 | % (a) | | | 11/15/2051 | | | | 4,995,304 | |
400,000 | | CSAIL Commercial Mortgage Trust, Series 2018-CX12-B | | | 4.61 | % (a) | | | 08/15/2051 | | | | 356,726 | |
9,269,000 | | CSAIL Commercial Mortgage Trust, Series 2019-C16-B | | | 3.88 | % | | | 06/15/2052 | | | | 7,956,354 | |
62,758,443 | | CSAIL Commercial Mortgage Trust, Series 2020-C19-XA | | | 1.11 | % (a)(h) | | | 03/15/2053 | | | | 3,507,450 | |
6,269,000 | | CSMC Trust, Series 2020-NET-C | | | 3.53 | % (f) | | | 08/15/2037 | | | | 5,702,501 | |
7,968,667 | | CSWF Trust, Series 2021-B33-B | | | 3.64 | % (a)(f) | | | 10/10/2043 | | | | 6,124,113 | |
3,731,000 | | CSWF Trust, Series 2021-B33-C | | | 3.64 | % (a)(f) | | | 10/10/2043 | | | | 2,635,420 | |
4,475,000 | | DBJPM Mortgage Trust, Series 2016-C1-C | | | 3.32 | % (a) | | | 05/10/2049 | | | | 3,701,765 | |
51,741,243 | | DBJPM Mortgage Trust, Series 2016-C1-XA | | | 1.37 | % (a)(h) | | | 05/10/2049 | | | | 1,600,315 | |
4,550,000 | | DOLP Trust, Series 2021-NYC-D | | | 3.70 | % (a)(f) | | | 05/10/2041 | | | | 2,986,659 | |
5,000,000 | | DOLP Trust, Series 2021-NYC-E | | | 3.70 | % (a)(f) | | | 05/10/2041 | | | | 3,029,711 | |
2,588,000 | | GS Mortgage Securities Corporation Trust, Series 2018-RIVR-C (1 Month LIBOR USD + 1.25%, 1.25% Floor) | | | 5.93 | % (f) | | | 07/15/2035 | | | | 1,991,621 | |
380,821 | | GS Mortgage Securities Trust, Series 2011-GC5-XA | | | 0.00 | % (a)(f)(h) | | | 08/10/2044 | | | | 4 | |
6,484,000 | | GS Mortgage Securities Trust, Series 2014-GC26-D | | | 4.52 | % (a)(f) | | | 11/10/2047 | | | | 3,935,898 | |
2,635,000 | | GS Mortgage Securities Trust, Series 2015-GC32-B | | | 4.40 | % (a) | | | 07/10/2048 | | | | 2,489,559 | |
92,192,039 | | GS Mortgage Securities Trust, Series 2015-GS1-XA | | | 0.76 | % (a)(h) | | | 11/10/2048 | | | | 1,534,315 | |
1,825,000 | | GS Mortgage Securities Trust, Series 2016-GS2-C | | | 4.70 | % (a) | | | 05/10/2049 | | | | 1,649,919 | |
44,349,851 | | GS Mortgage Securities Trust, Series 2016-GS2-XA | | | 1.73 | % (a)(h) | | | 05/10/2049 | | | | 1,812,627 | |
1,070,000 | | GS Mortgage Securities Trust, Series 2019-GC42-A3 | | | 2.75 | % | | | 09/10/2052 | | | | 927,323 | |
50,756,963 | | JP Morgan Chase Commercial Mortgage Securities Trust, Series 2015-JP1-XA | | | 0.89 | % (a)(h) | | | 01/15/2049 | | | | 1,008,962 | |
6,690,000 | | JP Morgan Chase Commercial Mortgage Securities Trust, Series 2018-BCON-E | | | 3.76 | % (a)(f) | | | 01/05/2031 | | | | 6,680,532 | |
7,958,000 | | JP Morgan Chase Commercial Mortgage Securities Trust, Series 2020-LOOP-E | | | 3.86 | % (a)(f) | | | 12/05/2038 | | | | 5,547,454 | |
32,623,705 | | JPMBB Commercial Mortgage Securities Trust, Series 2014-C18-XA | | | 0.66 | % (a)(h) | | | 02/15/2047 | | | | 94,475 | |
2,766,125 | | JPMBB Commercial Mortgage Securities Trust, Series 2014-C23-C | | | 4.48 | % (a) | | | 09/15/2047 | | | | 2,586,403 | |
8,204,658 | | JPMBB Commercial Mortgage Securities Trust, Series 2014-C23-D | | | 3.98 | % (a)(f) | | | 09/15/2047 | | | | 6,937,819 | |
40,710,746 | | JPMBB Commercial Mortgage Securities Trust, Series 2014-C25-XA | | | 0.81 | % (a)(h) | | | 11/15/2047 | | | | 402,564 | |
1,684,000 | | JPMBB Commercial Mortgage Securities Trust, Series 2015-C27-B | | | 3.90 | % | | | 02/15/2048 | | | | 1,582,461 | |
12,131,110 | | JPMBB Commercial Mortgage Securities Trust, Series 2015-C27-D | | | 3.80 | % (a)(f) | | | 02/15/2048 | | | | 8,348,857 | |
4,987,000 | | JPMBB Commercial Mortgage Securities Trust, Series 2015-C29-C | | | 4.19 | % (a) | | | 05/15/2048 | | | | 4,448,865 | |
47,843,897 | | JPMBB Commercial Mortgage Securities Trust, Series 2015-C30-XA | | | 0.43 | % (a)(h) | | | 07/15/2048 | | | | 397,870 | |
37,223,082 | | JPMBB Commercial Mortgage Securities Trust, Series 2015-C31-XA | | | 0.81 | % (a)(h) | | | 08/15/2048 | | | | 591,210 | |
4,138,000 | | JPMBB Commercial Mortgage Securities Trust, Series 2015-C32-C | | | 4.66 | % (a) | | | 11/15/2048 | | | | 2,796,064 | |
1,000,000 | | JPMCC Commercial Mortgage Securities Trust, Series 2019-COR4-C | | | 4.94 | % (a) | | | 03/10/2052 | | | | 850,007 | |
7,675,000 | | JPMDB Commercial Mortgage Securities Trust, Series 2016-C2-AS | | | 3.48 | % | | | 06/15/2049 | | | | 7,105,576 | |
44,917,306 | | JPMDB Commercial Mortgage Securities Trust, Series 2016-C2-XA | | | 1.49 | % (a)(h) | | | 06/15/2049 | | | | 1,540,641 | |
5,425,000 | | LSTAR Commercial Mortgage Trust, Series 2016-4-C | | | 4.61 | % (a)(f) | | | 03/10/2049 | | | | 4,986,103 | |
4,500,000 | | MKT Mortgage Trust, Series 2020-525M-F | | | 2.94 | % (a)(f) | | | 02/12/2040 | | | | 2,417,389 | |
3,000,000 | | Morgan Stanley Bank of America Merrill Lynch Trust, Series 2014-C18-C | | | 4.48 | % (a) | | | 10/15/2047 | | | | 2,794,399 | |
26,356,193 | | Morgan Stanley Bank of America Merrill Lynch Trust, Series 2015-C20-XA | | | 1.24 | % (a)(h) | | | 02/15/2048 | | | | 393,010 | |
75,089,000 | | Morgan Stanley Bank of America Merrill Lynch Trust, Series 2015-C23-XB | | | 0.14 | % (a)(f)(h) | | | 07/15/2050 | | | | 284,910 | |
44,167,492 | | Morgan Stanley Bank of America Merrill Lynch Trust, Series 2016-C30-XA | | | 1.35 | % (a)(h) | | | 09/15/2049 | | | | 1,519,790 | |
6,364,000 | | Morgan Stanley Bank of America Merrill Lynch Trust, Series 2017-C33-B | | | 4.11 | % | | | 05/15/2050 | | | | 5,698,201 | |
5,238,000 | | Morgan Stanley Bank of America Merrill Lynch Trust, Series 2017-C34-D | | | 2.70 | % (f) | | | 11/15/2052 | | | | 3,136,620 | |
24,313,064 | | Morgan Stanley Capital Trust, Series 2016-UB11-XA | | | 1.44 | % (a)(h) | | | 08/15/2049 | | | | 930,155 | |
2,108,000 | | Natixis Commercial Mortgage Securities Trust, Series 2018-FL1-C (1 Month LIBOR USD + 2.20%, 2.20% Floor) | | | 6.88 | % (f) | | | 06/15/2035 | | | | 1,832,163 | |
1,789,000 | | SG Commercial Mortgage Securities Trust, Series 2016-C5-B | | | 3.93 | % | | | 10/10/2048 | | | | 1,521,261 | |
44,329,957 | | SG Commercial Mortgage Securities Trust, Series 2016-C5-XA | | | 1.88 | % (a)(h) | | | 10/10/2048 | | | | 1,850,594 | |
10,336,000 | | SLG Office Trust, Series 2021-OVA-E | | | 2.85 | % (f) | | | 07/15/2041 | | | | 7,514,723 | |
9,660,000 | | SLG Office Trust, Series 2021-OVA-F | | | 2.85 | % (f) | | | 07/15/2041 | | | | 6,456,188 | |
8,911,000 | | UBS Commercial Mortgage Trust, Series 2017-C1-B | | | 4.04 | % | | | 06/15/2050 | | | | 7,780,314 | |
2,491,000 | | UBS Commercial Mortgage Trust, Series 2017-C6-B | | | 4.15 | % (a) | | | 12/15/2050 | | | | 2,214,361 | |
1,450,000 | | UBS Commercial Mortgage Trust, Series 2017-C7-B | | | 4.29 | % (a) | | | 12/15/2050 | | | | 1,305,343 | |
6,958,000 | | UBS Commercial Mortgage Trust, Series 2017-C7-C | | | 4.59 | % (a) | | | 12/15/2050 | | | | 5,992,710 | |
559,000 | | UBS Commercial Mortgage Trust, Series 2018-C10-C | | | 5.05 | % (a) | | | 05/15/2051 | | | | 479,280 | |
7,293,000 | | UBS Commercial Mortgage Trust, Series 2018-C11-C | | | 4.88 | % (a) | | | 06/15/2051 | | | | 5,999,610 | |
2,896,000 | | UBS Commercial Mortgage Trust, Series 2018-C12-C | | | 4.94 | % (a) | | | 08/15/2051 | | | | 2,489,265 | |
2,189,160 | | UBS-Barclays Commercial Mortgage Trust, Series 2013-C5-B | | | 3.65 | % (a)(f) | | | 03/10/2046 | | | | 2,130,513 | |
7,795,924 | | UBS-Barclays Commercial Mortgage Trust, Series 2013-C5-C | | | 3.89 | % (a)(f) | | | 03/10/2046 | | | | 5,648,134 | |
1,374,000 | | UBS-Barclays Commercial Mortgage Trust, Series 2013-C5-D | | | 3.89 | % (a)(f) | | | 03/10/2046 | | | | 868,999 | |
92,468 | | Wachovia Bank Commercial Mortgage Trust, Series 2006-C29-IO | | | 0.00 | % (a)(h) | | | 11/15/2048 | | | | 45 | |
4,891,000 | | Wells Fargo Commercial Mortgage Trust, Series 2015-C31-C | | | 4.60 | % (a) | | | 11/15/2048 | | | | 4,404,735 | |
37,838,649 | | Wells Fargo Commercial Mortgage Trust, Series 2015-NXS1-XA | | | 1.07 | % (a)(h) | | | 05/15/2048 | | | | 579,987 | |
50,379,224 | | Wells Fargo Commercial Mortgage Trust, Series 2015-P2-XA | | | 0.93 | % (a)(h) | | | 12/15/2048 | | | | 1,029,887 | |
7,687,000 | | Wells Fargo Commercial Mortgage Trust, Series 2016-C35-B | | | 3.44 | % | | | 07/15/2048 | | | | 6,580,120 | |
58,567,007 | | Wells Fargo Commercial Mortgage Trust, Series 2016-NXS6-XA | | | 1.58 | % (a)(h) | | | 11/15/2049 | | | | 2,324,642 | |
2,638,000 | | Wells Fargo Commercial Mortgage Trust, Series 2018-C45-C | | | 4.73 | % | | | 06/15/2051 | | | | 2,257,496 | |
7,228,000 | | Wells Fargo Commercial Mortgage Trust, Series 2018-C46-C | | | 5.00 | % (a) | | | 08/15/2051 | | | | 6,049,271 | |
5,000,000 | | Wells Fargo Commercial Mortgage Trust, Series 2018-C47-C | | | 4.93 | % (a) | | | 09/15/2061 | | | | 4,308,799 | |
6,546,000 | | Wells Fargo Commercial Mortgage Trust, Series 2018-C48-C | | | 5.14 | % (a) | | | 01/15/2052 | | | | 5,418,908 | |
20,775,711 | | Wells Fargo Commercial Mortgage Trust, Series 2019-C49-XA | | | 1.26 | % (a)(h) | | | 03/15/2052 | | | | 1,119,713 | |
10,776,000 | | Wells Fargo Commercial Mortgage Trust, Series 2019-C50-C | | | 4.35 | % | | | 05/15/2052 | | | | 8,693,147 | |
2,705,000 | | Wells Fargo Commercial Mortgage Trust, Series 2020-C55-B | | | 3.14 | % | | | 02/15/2053 | | | | 2,179,440 | |
5,510,000 | | Wells Fargo Commercial Mortgage Trust, Series 2020-C58-B | | | 2.70 | % | | | 07/15/2053 | | | | 4,199,601 | |
118,941,283 | | Wells Fargo Commercial Mortgage Trust, Series 2021-C59-XA | | | 1.53 | % (a)(h) | | | 04/15/2054 | | | | 10,113,030 | |
2,436,000 | | Wells Fargo Commercial Mortgage Trust, Series 2021-C61-C | | | 3.31 | % | | | 11/15/2054 | | | | 1,727,124 | |
56,137,538 | | WF-RBS Commercial Mortgage Trust, Series 2014-C21-XA | | | 1.00 | % (a)(h) | | | 08/15/2047 | | | | 622,122 | |
41,011,631 | | WF-RBS Commercial Mortgage Trust, Series 2014-C22-XA | | | 0.78 | % (a)(h) | | | 09/15/2057 | | | | 316,179 | |
| | | | | | | | | | | | | | |
Total Non-Agency Commercial Mortgage Backed Obligations (Cost $537,335,498) | | | | | | | | | | | 397,829,391 | |
| | | | | | | | | | | | | | |
Non-Agency Residential Collateralized Mortgage Obligations - 11.4% | |
6,229,510 | | Adjustable Rate Mortgage Trust, Series 2007-1-4A1 | | | 5.10 | % (a) | | | 03/25/2037 | | | | 4,391,893 | |
20,233 | | Adjustable Rate Mortgage Trust, Series 2007-3-1A1 | | | 4.29 | % (a)(f) | | | 11/25/2037 | | | | 19,125 | |
3,542,154 | | AJAX Mortgage Loan Trust, Series 2020-A-A | | | 2.38 | % (e)(f) | | | 12/25/2059 | | | | 3,498,232 | |
859,042 | | AJAX Mortgage Loan Trust, Series 2020-D-A | | | 2.25 | % (e)(f) | | | 06/25/2060 | | | | 824,683 | |
3,873,627 | | AlphaFlow Transitional Mortgage Trust, Series 2021-WL1-A1 | | | 3.28 | % (e)(f) | | | 01/25/2026 | | | | 3,819,481 | |
3,100,000 | | AMSR Trust, Series 2019-SFR1-E | | | 3.47 | % (f) | | | 01/19/2039 | | | | 2,833,482 | |
10,000,000 | | AMSR Trust, Series 2021-SFR1-F | | | 3.60 | % (a)(f) | | | 06/17/2038 | | | | 8,370,574 | |
3,000,000 | | AMSR Trust, Series 2021-SFR2-E1 | | | 2.48 | % (f) | | | 08/17/2038 | | | | 2,579,383 | |
2,500,000 | | AMSR Trust, Series 2021-SFR2-E2 | | | 2.58 | % (f) | | | 08/17/2038 | | | | 2,137,255 | |
4,500,000 | | AMSR Trust, Series 2021-SFR2-F1 | | | 3.28 | % (f) | | | 08/17/2038 | | | | 3,915,657 | |
2,000,000 | | AMSR Trust, Series 2021-SFR2-F2 | | | 3.67 | % (f) | | | 08/17/2038 | | | | 1,740,145 | |
11,199,693 | | Argent Securities Trust, Series 2006-M1-A2C (1 Month LIBOR USD + 0.30%, 0.30% Floor) | | | 5.15 | % | | | 07/25/2036 | | | | 3,018,820 | |
14,261,307 | | Argent Securities Trust, Series 2006-M1-A2D (1 Month LIBOR USD + 0.48%, 0.48% Floor) | | | 5.33 | % | | | 07/25/2036 | | | | 3,843,775 | |
130,737 | | Banc of America Funding Trust, Series 2005-G-A3 | | | 2.35 | % (a) | | | 10/20/2035 | | | | 86,861 | |
117,142 | | Banc of America Funding Trust, Series 2006-2-6A2 | | | 5.50 | % | | | 03/25/2036 | | | | 113,457 | |
86,614 | | Banc of America Funding Trust, Series 2006-6-1A2 | | | 6.25 | % | | | 08/25/2036 | | | | 73,069 | |
249,377 | | Bear Stearns Asset Backed Securities Trust, Series 2007-SD1-1A3A | | | 6.50 | % | | | 10/25/2036 | | | | 135,707 | |
9,100,000 | | CAFL Issuer LLC, Series 2021-RTL1-A1 | | | 2.24 | % (e)(f) | | | 03/28/2029 | | | | 8,351,088 | |
6,059,407 | | Carrington Mortgage Loan Trust, Series 2006-NC5-A3 (1 Month LIBOR USD + 0.15%, 0.15% Floor, 14.50% Cap) | | | 5.00 | % | | | 01/25/2037 | | | | 5,171,785 | |
1,303,390 | | Chase Mortgage Finance Trust, Series 2007-A2-6A4 | | | 4.02 | % (a) | | | 07/25/2037 | | | | 1,103,525 | |
797,834 | | Chase Mortgage Finance Trust, Series 2007-S3-2A1 | | | 5.50 | % | | | 05/25/2037 | | | | 8 | |
171,112 | | CHL Mortgage Pass-Through Trust, Series 2005-28-A7 | | | 5.25 | % | | | 11/01/2035 | | | | 98,946 | |
406,955 | | CHL Mortgage Pass-Through Trust, Series 2007-10-A5 | | | 6.00 | % | | | 07/25/2037 | | | | 203,145 | |
168,715 | | CHL Mortgage Pass-Through Trust, Series 2007-15-1A16 | | | 6.25 | % | | | 09/25/2037 | | | | 110,208 | |
425,239 | | CHL Mortgage Pass-Through Trust, Series 2007-3-A17 | | | 6.00 | % | | | 04/25/2037 | | | | 226,325 | |
6,953,000 | | CIM Trust, Series 2020-R2-M2 | | | 3.00 | % (a)(f) | | | 10/25/2059 | | | | 5,544,682 | |
24,599 | | Citicorp Mortgage Securities, Inc., Series 2005-1-1A4 | | | 5.50 | % | | | 02/25/2035 | | | | 23,187 | |
42,311 | | Citicorp Residential Mortgage Trust, Series 2006-2-A5 | | | 4.91 | % | | | 09/25/2036 | | | | 42,113 | |
4,081,257 | | Citigroup Mortgage Loan Trust, Series 2007-OPX1-A1A (1 Month LIBOR USD + 0.07%, 0.07% Floor) | | | 4.92 | % | | | 01/25/2037 | | | | 1,743,395 | |
26,925,819 | | Citigroup Mortgage Loan Trust, Series 2019-A-PT1 | | | 3.92 | % (f) | | | 10/25/2058 | | | | 22,669,280 | |
48,544,062 | | Citigroup Mortgage Loan Trust, Series 2021-RP2-A1 | | | 1.75 | % (a)(f) | | | 03/25/2065 | | | | 44,120,684 | |
5,674,000 | | Citigroup Mortgage Loan Trust, Series 2021-RP2-M1 | | | 3.25 | % (a)(f) | | | 03/25/2065 | | | | 5,008,215 | |
4,752,000 | | Citigroup Mortgage Loan Trust, Series 2021-RP2-M2 | | | 3.40 | % (a)(f) | | | 03/25/2065 | | | | 4,070,667 | |
4,413,000 | | Citigroup Mortgage Loan Trust, Series 2021-RP2-M3 | | | 3.40 | % (a)(f) | | | 03/25/2065 | | | | 3,619,844 | |
12,955,241 | | Citigroup Mortgage Loan Trust, Series 2021-RP2-PT1 | | | 6.14 | % (a)(f) | | | 03/25/2065 | | | | 12,358,691 | |
59,548 | | CitiMortgage Alternative Loan Trust, Series 2006-A2-A2 | | | 6.00 | % | | | 05/25/2036 | | | | 53,734 | |
36,569 | | CitiMortgage Alternative Loan Trust, Series 2006-A5-3A3 | | | 6.00 | % | | | 10/25/2036 | | | | 30,531 | |
243,564 | | CitiMortgage Alternative Loan Trust, Series 2007-A1-1A7 | | | 6.00 | % | | | 01/25/2037 | | | | 218,417 | |
7,363,002 | | CitiMortgage Alternative Loan Trust, Series 2007-A2-1A5 | | | 6.00 | % | | | 02/25/2037 | | | | 6,592,583 | |
3,563,970 | | CitiMortgage Alternative Loan Trust, Series 2007-A5-1A10 | | | 5.75 | % | | | 05/25/2037 | | | | 3,215,771 | |
1,000,000 | | CoreVest American Finance Trust, Series 2020-4-E | | | 3.38 | % (f) | | | 12/15/2052 | | | | 770,377 | |
66,997 | | Countrywide Alternative Loan Trust, Series 2005-20CB-1A1 | | | 5.50 | % | | | 07/25/2035 | | | | 53,573 | |
130,373 | | Countrywide Alternative Loan Trust, Series 2005-28CB-3A6 | | | 6.00 | % | | | 08/25/2035 | | | | 63,512 | |
13,000,805 | | Countrywide Alternative Loan Trust, Series 2005-37T1-A5 (1 Month LIBOR USD + 0.45%, 0.45% Floor, 5.50% Cap) | | | 5.30 | % | | | 09/25/2035 | | | | 7,936,717 | |
477,538 | | Countrywide Alternative Loan Trust, Series 2005-46CB-A22 | | | 5.25 | % | | | 10/25/2035 | | | | 341,304 | |
7,457,011 | | Countrywide Alternative Loan Trust, Series 2005-49CB-A2 | | | 5.50 | % | | | 11/25/2035 | | | | 5,120,717 | |
70,606 | | Countrywide Alternative Loan Trust, Series 2005-J10-1A13 (1 Month LIBOR USD + 0.70%, 0.70% Floor, 5.50% Cap) | | | 5.50 | % | | | 10/25/2035 | | | | 44,802 | |
256,290 | | Countrywide Alternative Loan Trust, Series 2006-26CB-A9 | | | 6.50 | % | | | 09/25/2036 | | | | 146,519 | |
6,139,265 | | Countrywide Alternative Loan Trust, Series 2006-42-1A8 | | | 6.00 | % | | | 01/25/2047 | | | | 3,712,702 | |
974,139 | | Countrywide Alternative Loan Trust, Series 2007-12T1-A1 | | | 6.00 | % | | | 06/25/2037 | | | | 485,586 | |
6,168,185 | | Countrywide Alternative Loan Trust, Series 2007-12T1-A3 | | | 6.00 | % | | | 06/25/2037 | | | | 3,074,696 | |
1,033,566 | | Countrywide Alternative Loan Trust, Series 2007-16CB-2A1 (1 Month LIBOR USD + 0.45%, 0.45% Floor, 7.00% Cap) | | | 5.30 | % | | | 08/25/2037 | | | | 396,624 | |
299,295 | | Countrywide Alternative Loan Trust, Series 2007-16CB-2A2 (-8 x 1 Month LIBOR USD + 54.58%, 54.58% Cap) | | | 14.21 | % (i) | | | 08/25/2037 | | | | 470,960 | |
56,375 | | Countrywide Alternative Loan Trust, Series 2007-17CB-1A10 (-5 x 1 Month LIBOR USD + 29.90%, 29.90% Cap) | | | 7.61 | % (i) | | | 08/25/2037 | | | | 57,160 | |
260,660 | | Countrywide Alternative Loan Trust, Series 2007-18CB-2A17 | | | 6.00 | % | | | 08/25/2037 | | | | 163,804 | |
1,359,674 | | Countrywide Alternative Loan Trust, Series 2007-23CB-A3 (1 Month LIBOR USD + 0.50%, 0.50% Floor, 7.00% Cap) | | | 5.35 | % | | | 09/25/2037 | | | | 606,931 | |
1,335,648 | | Countrywide Alternative Loan Trust, Series 2007-23CB-A4 (-1 x 1 Month LIBOR USD + 6.50%, 6.50% Cap) | | | 1.65 | % (h)(i) | | | 09/25/2037 | | | | 238,727 | |
718,388 | | Countrywide Alternative Loan Trust, Series 2007-4CB-2A1 | | | 7.00 | % | | | 03/25/2037 | | | | 78,419 | |
5,898,069 | | Countrywide Alternative Loan Trust, Series 2007-8CB-A1 | | | 5.50 | % | | | 05/25/2037 | | | | 3,336,851 | |
5,075,612 | | Countrywide Alternative Loan Trust, Series 2007-OA8-2A1 (1 Month LIBOR USD + 0.36%, 0.36% Floor) | | | 5.21 | % | | | 06/25/2047 | | | | 3,666,209 | |
57,953 | | Credit Suisse First Boston Mortgage Securities Corporation, Series 2005-10-5A5 | | | 5.50 | % | | | 11/25/2035 | | | | 44,055 | |
644,018 | | Credit Suisse First Boston Mortgage Securities Corporation, Series 2005-8-1A3 | | | 5.25 | % | | | 09/25/2035 | | | | 537,441 | |
3,035,094 | | Credit Suisse Mortgage Capital Certificates, Series 2009-3R-19A2 | | | 6.00 | % (f) | | | 01/27/2038 | | | | 1,454,036 | |
7,205,868 | | Credit-Based Asset Servicing and Securitization LLC, Series 2007-RP1-A (1 Month LIBOR USD + 0.31%, 0.31% Floor) | | | 4.93 | % (f) | | | 05/25/2046 | | | | 5,893,391 | |
2,364,895 | | CSMC Mortgage-Backed Trust, Series 2006-4-6A1 | | | 6.00 | % | | | 05/25/2036 | | | | 1,022,150 | |
19,564 | | CSMC Mortgage-Backed Trust, Series 2006-4-7A1 | | | 5.50 | % | | | 09/25/2056 | | | | 10,818 | |
61,763 | | CSMC Mortgage-Backed Trust, Series 2007-1-3A1 | | | 6.00 | % | | | 02/25/2057 | | | | 10,945 | |
10,721 | | CSMC Mortgage-Backed Trust, Series 2007-2-2A1 | | | 5.00 | %�� | | | 03/25/2037 | | | | 8,546 | |
726,239 | | CSMC Trust, Series 2010-4R-3A17 | | | 6.00 | % (a)(b)(f) | | | 06/26/2037 | | | | 636,264 | |
31,037,014 | | CSMC Trust, Series 2020-RPL1-PT1 | | | 3.34 | % (a)(f) | | | 10/25/2069 | | | | 24,707,459 | |
9,035,400 | | CSMC Trust, Series 2020-RPL4-M1 | | | 2.50 | % (f) | | | 01/25/2060 | | | | 6,796,061 | |
3,227,279 | | CSMC Trust, Series 2021-JR1-A1 | | | 2.47 | % (a)(f) | | | 09/27/2066 | | | | 3,108,865 | |
7,093,197 | | Deutsche Alt-A Securities Mortgage Loan Trust, Series 2007-OA1-A1 (1 Month LIBOR USD + 0.15%, 0.15% Floor) | | | 5.00 | % | | | 02/25/2047 | | | | 4,145,052 | |
4,866,605 | | Deutsche ALT-A Securities, Inc. Mortgage Loan Trust, Series 2005-6-2A1 | | | 5.50 | % | | | 12/25/2035 | | | | 4,213,505 | |
4,500,323 | | Deutsche ALT-A Securities, Inc. Mortgage Loan Trust, Series 2005-AR2-2A1 | | | 3.89 | % (a) | | | 10/25/2035 | | | | 3,616,850 | |
420,092 | | Deutsche Mortgage Securities, Inc., Series 2006-PR1-3A1 (-1 x 1 Month LIBOR USD + 12.12%, 12.12% Cap) | | | 5.57 | % (f)(i) | | | 04/15/2036 | | | | 389,307 | |
44,183 | | Deutsche Mortgage Securities, Inc., Series 2006-PR1-4AI2 (-2 x 1 Month LIBOR USD + 14.60%, 14.61% Cap) | | | 5.66 | % (f)(i) | | | 04/15/2036 | | | | 40,697 | |
763,130 | | Deutsche Mortgage Securities, Inc., Series 2006-PR1-5AI4 (-1 x 1 Month LIBOR USD + 12.12%, 12.12% Cap) | | | 5.57 | % (f)(i) | | | 04/15/2036 | | | | 676,339 | |
15,984,000 | | First Franklin Mortgage Loan Trust, Series 2006-FF15-A6 (1 Month LIBOR USD + 0.31%, 0.31% Floor) | | | 5.16 | % | | | 11/25/2036 | | | | 13,076,394 | |
11,030,681 | | First Franklin Mortgage Loan Trust, Series 2007-FF2-A1 (1 Month LIBOR USD + 0.14%, 0.14% Floor) | | | 4.99 | % | | | 03/25/2037 | | | | 6,056,154 | |
201,213 | | First Horizon Alternative Mortgage Securities Trust, Series 2006-FA2-1A5 | | | 6.00 | % | | | 05/25/2036 | | | | 90,656 | |
2,663,593 | | First Horizon Alternative Mortgage Securities Trust, Series 2006-FA8-1A1 | | | 6.25 | % | | | 02/25/2037 | | | | 1,220,850 | |
37,753 | | First Horizon Alternative Mortgage Securities Trust, Series 2006-RE1-A1 | | | 5.50 | % (a) | | | 05/25/2035 | | | | 25,845 | |
16,440,000 | | FMC GMSR Issuer Trust, Series 2021-GT2-A | | | 3.85 | % (a)(f) | | | 10/25/2026 | | | | 14,135,906 | |
6,944,000 | | GCAT Trust, Series 2021-NQM6-M1 | | | 3.41 | % (a)(f) | | | 08/25/2066 | | | | 4,833,073 | |
1,398,156 | | GMACM Mortgage Loan Trust, Series 2006-J1-A6 | | | 5.75 | % | | | 04/25/2036 | | | | 1,204,864 | |
7,546,000 | | GS Mortgage-Backed Securities Trust, Series 2020-NQM1-M1 | | | 3.29 | % (a)(f) | | | 09/27/2060 | | | | 6,068,772 | |
7,679 | | GSAA Home Equity Trust, Series 2005-7-AF5 | | | 5.11 | % | | | 05/25/2035 | | | | 7,454 | |
952,379 | | GSAA Home Equity Trust, Series 2007-10-A1A | | | 6.00 | % | | | 11/25/2037 | | | | 592,154 | |
947,320 | | GSAA Home Equity Trust, Series 2007-10-A2A | | | 6.50 | % | | | 11/25/2037 | | | | 439,396 | |
1,479,875 | | GSR Mortgage Loan Trust, Series 2006-3F-4A1 | | | 6.00 | % | | | 03/25/2036 | | | | 1,312,250 | |
22,702,102 | | GSR Mortgage Loan Trust, Series 2006-OA1-1A1 (1 Month LIBOR USD + 0.44%, 0.44% Floor) | | | 5.29 | % | | | 08/25/2046 | | | | 5,436,599 | |
82,465 | | GSR Mortgage Loan Trust, Series 2007-1F-2A2 | | | 5.50 | % | | | 01/25/2037 | | | | 165,988 | |
11,246,942 | | Harborview Mortgage Loan Trust, Series 2005-7-2A1 (1 Month LIBOR USD + 0.57%, 0.57% Floor, 11.00% Cap) | | | 5.33 | % | | | 06/19/2045 | | | | 6,998,961 | |
2,560,764 | | Home Partners of America Trust, Series 2021-1-D | | | 2.48 | % (f) | | | 09/17/2041 | | | | 2,086,967 | |
1,177,083 | | Home Partners of America Trust, Series 2021-1-E | | | 2.58 | % (f) | | | 09/17/2041 | | | | 938,284 | |
1,324,653 | | Home Partners of America Trust, Series 2021-1-F | | | 3.33 | % (f) | | | 09/17/2041 | | | | 1,028,019 | |
5,250,000 | | Homeward Opportunities Fund Trust, Series 2020-2-M1 | | | 3.90 | % (a)(f) | | | 05/25/2065 | | | | 4,550,605 | |
3,282,163 | | Homeward Opportunities Fund Trust, Series 2020-BPL1-A1 | | | 3.23 | % (e)(f) | | | 08/25/2025 | | | | 3,273,503 | |
22,685,417 | | HSI Asset Securitization Corporation Trust, Series 2006-HE1-1A1 (1 Month LIBOR USD + 0.28%, 0.28% Floor) | | | 5.13 | % | | | 10/25/2036 | | | | 7,546,184 | |
10,038,878 | | HSI Asset Securitization Corporation Trust, Series 2007-NC1-A3 (1 Month LIBOR USD + 0.18%, 0.18% Floor) | | | 5.03 | % | | | 04/25/2037 | | | | 6,898,504 | |
25,280,305 | | Impac Secured Assets Trust, Series 2006-5-1A1C (1 Month LIBOR USD + 0.54%, 0.54% Floor, 11.50% Cap) | | | 5.39 | % | | | 02/25/2037 | | | | 22,451,545 | |
2,728,000 | | Imperial Fund Mortgage Trust, Series 2021-NQM4-M1 | | | 3.45 | % (a)(f) | | | 01/25/2057 | | | | 1,913,498 | |
1,439,735 | | IndyMac IMSC Mortgage Loan Trust, Series 2007-HOA1-A11 (1 Month LIBOR USD + 0.36%, 0.36% Floor) | | | 5.21 | % | | | 07/25/2047 | | | | 968,138 | |
1,431,724 | | IndyMac IMSC Mortgage Loan Trust, Series 2007-HOA1-A24 (1 Month LIBOR USD + 0.62%, 0.62% Floor) | | | 5.47 | % | | | 07/25/2047 | | | | 1,036,639 | |
3,152,400 | | JP Morgan Alternative Loan Trust, Series 2005-A2-1M1 (1 Month LIBOR USD + 0.69%, 0.69% Floor, 11.50% Cap) | | | 5.54 | % | | | 01/25/2036 | | | | 2,975,580 | |
74,385 | | JP Morgan Alternative Loan Trust, Series 2006-S2-A4 | | | 6.69 | % | | | 05/25/2036 | | | | 73,662 | |
2,869,635 | | JP Morgan Alternative Loan Trust, Series 2006-S3-A4 | | | 6.81 | % | | | 08/25/2036 | | | | 2,690,493 | |
37,061 | | JP Morgan Alternative Loan Trust, Series 2006-S3-A6 | | | 6.62 | % | | | 08/25/2036 | | | | 35,406 | |
35,842 | | JP Morgan Alternative Loan Trust, Series 2006-S4-A6 | | | 6.21 | % | | | 12/25/2036 | | | | 34,771 | |
13,906,079 | | JP Morgan Mortgage Acquisition Trust, Series 2006-WMC2-A5 (1 Month LIBOR USD + 0.50%, 0.50% Floor) | | | 5.35 | % | | | 07/25/2036 | | | | 6,392,654 | |
16,334,017 | | JP Morgan Mortgage Acquisition Trust, Series 2006-WMC3-A4 (1 Month LIBOR USD + 0.30%, 0.30% Floor) | | | 5.15 | % | | | 08/25/2036 | | | | 11,842,300 | |
13,497,555 | | JP Morgan Mortgage Acquisition Trust, Series 2006-WMC4-A5 (1 Month LIBOR USD + 0.21%, 0.21% Floor) | | | 5.06 | % | | | 12/25/2036 | | | | 7,257,183 | |
2,342,071 | | JP Morgan Mortgage Trust, Series 2006-S1-2A9 | | | 6.50 | % | | | 04/25/2036 | | | | 2,356,964 | |
164,294 | | JP Morgan Mortgage Trust, Series 2007-S3-1A7 | | | 6.00 | % | | | 08/25/2037 | | | | 90,509 | |
23,658,793 | | Legacy Mortgage Asset Trust, Series 2019-RPL3-PT1 | | | 0.00 | % (f) | | | 06/25/2058 | | | | 20,888,961 | |
7,000,000 | | Legacy Mortgage Asset Trust, Series 2021-GS3-A2 | | | 0.00 | % (e)(f) | | | 07/25/2061 | | | | 6,148,822 | |
3,457,909 | | Lehman Mortgage Trust, Series 2005-9N-1A1 (1 Month LIBOR USD + 0.27%, 0.27% Floor) | | | 5.12 | % | | | 02/25/2036 | | | | 2,973,716 | |
371,647 | | Lehman Mortgage Trust, Series 2006-3-1A5 | | | 6.00 | % | | | 07/25/2036 | | | | 188,735 | |
25,783 | | Lehman Mortgage Trust, Series 2006-9-1A19 (-5 x 1 Month LIBOR USD + 30.68%, 30.68% Cap) | | | 8.39 | % (i) | | | 01/25/2037 | | | | 26,705 | |
506,286 | | Lehman Mortgage Trust, Series 2007-10-2A1 | | | 6.50 | % | | | 01/25/2038 | | | | 155,625 | |
3,654,314 | | Lehman Mortgage Trust, Series 2007-1-1A2 (1 Month LIBOR USD + 0.32%, 0.32% Floor) | | | 5.17 | % | | | 02/25/2037 | | | | 3,473,587 | |
9,604,107 | | Lehman Mortgage Trust, Series 2007-15N-3A1 (1 Month LIBOR USD + 0.25%, 0.25% Floor) | | | 5.10 | % | | | 08/25/2047 | | | | 7,646,906 | |
90,486 | | Lehman Mortgage Trust, Series 2007-2-1A1 | | | 5.75 | % | | | 02/25/2037 | | | | 63,837 | |
9,359,243 | | Lehman Mortgage Trust, Series 2007-3-2A3 (1 Month LIBOR USD + 0.48%, 0.48% Floor) | | | 5.33 | % | | | 03/25/2037 | | | | 8,354,017 | |
4,200,000 | | LHOME Mortgage Trust, Series 2021-RTL1-A2 | | | 2.86 | % (a)(f) | | | 02/25/2026 | | | | 3,863,430 | |
35,180,081 | | Long Beach Mortgage Loan Trust, Series 2006-2-2A3 (1 Month LIBOR USD + 0.38%, 0.38% Floor) | | | 5.23 | % | | | 03/25/2046 | | | | 12,847,421 | |
13,560,421 | | Long Beach Mortgage Loan Trust, Series 2006-3-2A3 (1 Month LIBOR USD + 0.36%, 0.36% Floor) | | | 5.21 | % | | | 05/25/2046 | | | | 4,496,621 | |
15,730,054 | | Long Beach Mortgage Loan Trust, Series 2006-6-2A3 (1 Month LIBOR USD + 0.30%, 0.30% Floor) | | | 5.15 | % | | | 07/25/2036 | | | | 6,423,177 | |
73,761 | | MASTR Alternative Loans Trust, Series 2005-2-3A1 | | | 6.00 | % | | | 03/25/2035 | | | | 65,638 | |
4,700,841 | | MASTR Alternative Loans Trust, Series 2006-1-A5 | | | 6.00 | % | | | 02/25/2036 | | | | 2,380,226 | |
32,352 | | MASTR Alternative Loans Trust, Series 2007-1-2A7 | | | 6.00 | % | | | 10/25/2036 | | | | 10,228 | |
12,395,405 | | MASTR Asset Backed Securities Trust, Series 2005-NC2-A3 (1 Month LIBOR USD + 0.50%, 0.50% Floor) | | | 5.35 | % | | | 11/25/2035 | | | | 7,081,177 | |
772,661 | | MASTR Asset Securitization Trust, Series 2006-2-1A11 (1 Month LIBOR USD + 6.00%, 6.00% Floor) | | | 6.00 | % | | | 06/25/2036 | | | | 514,799 | |
1,652,118 | | Merrill Lynch Alternative Note Asset Trust, Series 2007-F1-2A8 | | | 6.00 | % | | | 03/25/2037 | | | | 661,681 | |
8,966,657 | | Merrill Lynch Alternative Note Asset Trust, Series 2007-OAR4-A1 (1 Month LIBOR USD + 0.50%, 0.50% Floor) | | | 5.35 | % | | | 08/25/2037 | | | | 7,488,896 | |
5,786,163 | | Merrill Lynch Mortgage Investors Trust, Series 2007-MLN1-A1 (1 Month LIBOR USD + 0.25%, 0.25% Floor) | | | 5.10 | % | | | 03/25/2037 | | | | 4,652,380 | |
3,229,539 | | MFA Trust, Series 2021-NPL1-A1 | | | 2.36 | % (e)(f) | | | 03/25/2060 | | | | 3,065,777 | |
7,752,800 | | Morgan Stanley Capital Trust, Series 2006-HE5-A2C (1 Month LIBOR USD + 0.28%, 0.28% Floor) | | | 5.13 | % | | | 08/25/2036 | | | | 4,057,058 | |
19,538 | | Morgan Stanley Mortgage Loan Trust, Series 2004-1-1A1 | | | 5.00 | % | | | 11/25/2033 | | | | 14,796 | |
469,170 | | Morgan Stanley Mortgage Loan Trust, Series 2005-7-7A4 | | | 5.50 | % | | | 11/25/2035 | | | | 433,050 | |
1,668,084 | | Morgan Stanley Mortgage Loan Trust, Series 2006-7-3A | | | 5.15 | % (a) | | | 06/25/2036 | | | | 1,117,937 | |
26,624,301 | | Morgan Stanley Mortgage Loan Trust, Series 2007-2AX-2A2 (1 Month LIBOR USD + 0.32%, 0.32% Floor) | | | 5.17 | % | | | 12/25/2036 | | | | 10,473,678 | |
7,927,954 | | Morgan Stanley Mortgage Loan Trust, Series 2007-7AX-2A1 (1 Month LIBOR USD + 0.24%, 0.24% Floor) | | | 5.09 | % | | | 04/25/2037 | | | | 2,288,555 | |
172,892 | | Morgan Stanley Re-Remic Trust, Series 2010-R6-5C | | | 5.75 | % (a)(f) | | | 05/26/2037 | | | | 151,293 | |
2,326,275 | | Morgan Stanley Residential Mortgage Loan Trust, Series 2020-RPL1-A1 | | | 2.69 | % (a)(f) | | | 10/25/2060 | | | | 2,271,722 | |
15,867,593 | | MortgageIT Securities Corp Mortgage Loan Trust, Series 2007-1-2A11 (1 Month LIBOR USD + 0.44%, 0.44% Floor) | | | 5.29 | % | | | 06/25/2047 | | | | 12,042,113 | |
6,000,000 | | New Century Home Equity Loan Trust, Series 2005-B-M2 (1 Month LIBOR USD + 0.74%, 0.74% Floor) | | | 5.58 | % | | | 10/25/2035 | | | | 4,832,645 | |
165,400 | | Nomura Asset Acceptance Corporation, Series 2006-AP1-A2 | | | 5.52 | % (a) | | | 01/25/2036 | | | | 53,626 | |
513,533 | | Nomura Home Equity Loan, Inc., Series 2006-AF1-A2 | | | 5.80 | % (e) | | | 10/25/2036 | | | | 127,199 | |
867,079 | | Nomura Home Equity Loan, Inc., Series 2007-1-1A1 | | | 6.56 | % | | | 02/25/2037 | | | | 252,053 | |
7,103,122 | | NRPL Trust, Series 2019-3A-A1 | | | 6.00 | % (e)(f) | | | 07/25/2059 | | | | 7,103,619 | |
4,062,609 | | NRZ Excess Spread-Collateralized Notes, Series 2020-PLS1-A | | | 3.84 | % (f) | | | 12/25/2025 | | | | 3,796,604 | |
31,996 | | Option One Mortgage Loan Trust, Series 2004-3-M3 (1 Month LIBOR USD + 0.98%, 0.98% Floor) | | | 5.82 | % | | | 11/25/2034 | | | | 30,872 | |
18,241,378 | | Option One Mortgage Loan Trust, Series 2007-6-1A1 (1 Month LIBOR USD + 0.19%, 0.19% Floor) | | | 5.04 | % | | | 07/25/2037 | | | | 14,826,375 | |
1,856,864 | | PMT Credit Risk Transfer Trust, Series 2019-3R-A (1 Month LIBOR USD + 3.70%, 2.70% Floor) | | | 8.55 | % (f) | | | 10/27/2024 | | | | 1,797,421 | |
4,041,107 | | PMT Credit Risk Transfer Trust, Series 2020-1R-A (1 Month LIBOR USD + 2.35%, 2.35% Floor) | | | 8.20 | % (f) | | | 02/27/2025 | | | | 3,887,485 | |
15,000,000 | | PMT Credit Risk Transfer Trust, Series 2021-FT1-A (1 Month LIBOR USD + 3.00%, 3.00% Floor) | | | 7.85 | % (f) | | | 03/25/2026 | | | | 14,914,333 | |
5,647,097 | | PR Mortgage Loan Trust, Series 2014-1-APT | | | 5.89 | % (a)(f) | | | 10/25/2049 | | | | 5,186,242 | |
5,445,468 | | Pretium Mortgage Credit Partners LLC, Series 2021-RN2-A1 | | | 1.74 | % (e)(f) | | | 07/25/2051 | | | | 5,086,710 | |
3,404,000 | | Progress Residential Trust, Series 2021-SFR6-E2 | | | 2.53 | % (f) | | | 07/17/2038 | | | | 2,971,878 | |
4,666,000 | | Progress Residential Trust, Series 2021-SFR6-F | | | 3.42 | % (f) | | | 07/17/2038 | | | | 4,052,352 | |
5,100,000 | | Progress Residential Trust, Series 2021-SFR8-F | | | 3.18 | % (f) | | | 10/17/2038 | | | | 4,322,921 | |
3,849,530 | | PRPM LLC, Series 2021-3-A1 | | | 1.87 | % (e)(f) | | | 04/25/2026 | | | | 3,691,094 | |
3,472,178 | | PRPM LLC, Series 2021-7-A1 | | | 1.87 | % (e)(f) | | | 08/25/2026 | | | | 3,250,871 | |
1,923,398 | | PRPM LLC, Series 2021-9-A1 | | | 2.36 | % (e)(f) | | | 10/25/2026 | | | | 1,824,775 | |
11,500,000 | | RAMP Trust, Series 2006-NC1-M2 (1 Month LIBOR USD + 0.40%, 0.40% Floor, 14.00% Cap) | | | 5.45 | % | | | 01/25/2036 | | | | 9,100,367 | |
6,268,290 | | RBSGC Mortgage Loan Trust, Series 2005-A-3A | | | 6.00 | % | | | 04/25/2035 | | | | 2,763,598 | |
20,881,708 | | Redwood Funding Trust, Series 2019-1-PT | | | 4.47 | % (e)(f) | | | 09/27/2024 | | | | 20,511,342 | |
129,037 | | Residential Accredit Loans, Inc., Series 2005-QS14-3A3 | | | 6.00 | % | | | 09/25/2035 | | | | 113,228 | |
169,967 | | Residential Accredit Loans, Inc., Series 2006-QS10-A4 | | | 5.75 | % | | | 08/25/2036 | | | | 137,393 | |
1,854,676 | | Residential Accredit Loans, Inc., Series 2006-QS10-A9 | | | 6.50 | % | | | 08/25/2036 | | | | 1,564,784 | |
1,851,328 | | Residential Accredit Loans, Inc., Series 2006-QS4-A10 | | | 6.00 | % | | | 04/25/2036 | | | | 1,459,539 | |
369,353 | | Residential Accredit Loans, Inc., Series 2006-QS6-1A15 | | | 6.00 | % | | | 06/25/2036 | | | | 302,881 | |
575 | | Residential Accredit Loans, Inc., Series 2006-QS6-2A1 | | | 6.00 | % | | | 12/25/2023 | | | | - | |
19,788,694 | | Residential Accredit Loans, Inc., Series 2007-QH5-AII (1 Month LIBOR USD + 0.46%, 0.46% Floor) | | | 5.31 | % | | | 06/25/2037 | | | | 7,814,104 | |
636,943 | | Residential Accredit Loans, Inc., Series 2007-QS3-A4 | | | 6.25 | % | | | 02/25/2037 | | | | 522,698 | |
2,332,243 | | Residential Accredit Loans, Inc., Series 2007-QS9-A33 | | | 6.50 | % | | | 07/25/2037 | | | | 1,895,141 | |
159,801 | | Residential Asset Securitization Trust, Series 2005-A10-A3 | | | 5.50 | % | | | 09/25/2035 | | | | 82,890 | |
227,223 | | Residential Asset Securitization Trust, Series 2005-A11-2A4 | | | 6.00 | % | | | 10/25/2035 | | | | 113,236 | |
1,618,626 | | Residential Asset Securitization Trust, Series 2006-A6-1A1 | | | 6.50 | % | | | 07/25/2036 | | | | 501,244 | |
111,826 | | Residential Asset Securitization Trust, Series 2006-R1-A1 (-4 x 1 Month LIBOR USD + 28.40%, 28.40% Cap) | | | 9.02 | % (b)(i) | | | 01/25/2046 | | | | 119,560 | |
40,603 | | Residential Funding Mortgage Securities Trust, Series 2006-S10-1A2 | | | 6.00 | % | | | 10/25/2036 | | | | 32,985 | |
402,909 | | Residential Funding Mortgage Securities Trust, Series 2007-S2-A4 | | | 6.00 | % | | | 02/25/2037 | | | | 321,623 | |
325,600 | | Residential Funding Mortgage Securities Trust, Series 2007-S3-1A4 | | | 6.00 | % | | | 03/25/2037 | | | | 235,333 | |
5,154,000 | | Residential Mortgage Loan Trust, Series 2020-1-M1 | | | 3.24 | % (a)(f) | | | 01/26/2060 | | | | 4,330,455 | |
7,695,758 | | Saxon Asset Securities Trust, Series 2005-2-M4 (1 Month LIBOR USD + 0.95%, 0.95% Floor, 11.50% Cap) | | | 5.79 | % | | | 10/25/2035 | | | | 4,914,967 | |
15,336,272 | | Securitized Asset Backed Receivables LLC Trust, Series 2007-BR3-A1 (1 Month LIBOR USD + 0.16%, 0.16% Floor, 100.00% Cap) | | | 5.01 | % (f) | | | 04/25/2037 | | | | 10,703,225 | |
19,952,415 | | Securitized Asset Backed Receivables LLC Trust, Series 2007-BR3-A2A (1 Month LIBOR USD + 0.07%, 0.07% Floor) | | | 4.92 | % | | | 04/25/2037 | | | | 13,245,078 | |
14,153,179 | | Securitized Asset Backed Receivables LLC Trust, Series 2007-BR3-A2B (1 Month LIBOR USD + 0.22%, 0.22% Floor) | | | 5.07 | % | | | 04/25/2037 | | | | 9,396,233 | |
2,545,920 | | Securitized Asset Backed Receivables LLC Trust, Series 2007-BR3-A2C (1 Month LIBOR USD + 0.28%, 0.28% Floor) | | | 5.13 | % | | | 04/25/2037 | | | | 1,690,208 | |
20,084,980 | | Securitized Asset Backed Receivables LLC Trust, Series 2007-HE1-A2C (1 Month LIBOR USD + 0.32%, 0.32% Floor) | | | 5.17 | % | | | 12/25/2036 | | | | 4,624,828 | |
24,422,145 | | Securitized Mortgage Asset Loan Trust, Series 2015-1-PC | | | 4.29 | % (a)(f) | | | 02/25/2054 | | | | 20,888,205 | |
3,611,410 | | Sequoia Mortgage Trust, Series 2007-3-2AA1 | | | 3.23 | % (a) | | | 07/20/2037 | | | | 2,841,290 | |
6,726,717 | | Soundview Home Loan Trust, Series 2007-OPT4-1A1 (1 Month LIBOR USD + 1.00%, 1.00% Floor) | | | 5.85 | % | | | 09/25/2037 | | | | 4,719,513 | |
5,910,000 | | Starwood Mortgage Residential Trust, Series 2020-1-B1 | | | 3.73 | % (a)(f) | | | 02/25/2050 | | | | 4,731,390 | |
11,027,026 | | Structured Asset Investment Loan Trust, Series 2006-BNC3-A1 (1 Month LIBOR USD + 0.18%, 0.18% Floor) | | | 5.03 | % | | | 09/25/2036 | | | | 6,939,587 | |
776,944 | | Structured Asset Securities Corporation, Series 2005-RF1-A (1 Month LIBOR USD + 0.35%, 0.35% Floor) | | | 5.20 | % (f) | | | 03/25/2035 | | | | 718,974 | |
776,944 | | Structured Asset Securities Corporation, Series 2005-RF1-AIO | | | 0.00 | % (a)(f)(h) | | | 03/25/2035 | | | | 12,989 | |
6,094,940 | | VCAT LLC, Series 2021-NPL4-A1 | | | 1.87 | % (e)(f) | | | 08/25/2051 | | | | 5,669,230 | |
7,514,710 | | VCAT LLC, Series 2021-NPL6-A1 | | | 1.92 | % (e)(f) | | | 09/25/2051 | | | | 6,987,630 | |
1,199,174 | | Velocity Commercial Capital Loan Trust, Series 2018-1-M1 | | | 3.91 | % (f) | | | 04/25/2048 | | | | 1,093,744 | |
580,104 | | Velocity Commercial Capital Loan Trust, Series 2018-1-M2 | | | 4.26 | % (f) | | | 04/25/2048 | | | | 517,354 | |
363,729 | | Velocity Commercial Capital Loan Trust, Series 2018-1-M3 | | | 4.41 | % (f) | | | 04/25/2048 | | | | 300,831 | |
1,999,883 | | Velocity Commercial Capital Loan Trust, Series 2019-1-M1 | | | 3.94 | % (a)(f) | | | 03/25/2049 | | | | 1,789,994 | |
813,817 | | Velocity Commercial Capital Loan Trust, Series 2019-1-M2 | | | 4.01 | % (a)(f) | | | 03/25/2049 | | | | 699,549 | |
751,506 | | Velocity Commercial Capital Loan Trust, Series 2019-1-M3 | | | 4.12 | % (a)(f) | | | 03/25/2049 | | | | 601,023 | |
3,151,957 | | VOLT LLC, Series 2021-CF1-A1 | | | 1.99 | % (e)(f) | | | 08/25/2051 | | | | 2,874,076 | |
1,850,010 | | VOLT LLC, Series 2021-CF2-A1 | | | 2.49 | % (e)(f) | | | 11/27/2051 | | | | 1,661,917 | |
7,292,938 | | VOLT LLC, Series 2021-NP12-A1 | | | 2.73 | % (e)(f) | | | 12/26/2051 | | | | 6,718,559 | |
1,332,604 | | VOLT LLC, Series 2021-NPL1-A1 | | | 1.89 | % (e)(f) | | | 02/27/2051 | | | | 1,224,905 | |
4,396,395 | | VOLT LLC, Series 2021-NPL5-A1 | | | 2.12 | % (e)(f) | | | 03/27/2051 | | | | 4,149,273 | |
4,287,107 | | VOLT LLC, Series 2021-NPL6-A1 | | | 2.24 | % (e)(f) | | | 04/25/2051 | | | | 3,959,552 | |
76,508 | | Washington Mutual Mortgage Pass-Through Certificates Trust, Series 2005-1-2A | | | 6.00 | % | | | 03/25/2035 | | | | 63,235 | |
394,582 | | Washington Mutual Mortgage Pass-Through Certificates Trust, Series 2006-1-3A1 | | | 5.75 | % | | | 02/25/2036 | | | | 348,319 | |
1,164,101 | | Washington Mutual Mortgage Pass-Through Certificates Trust, Series 2006-2-4CB | | | 6.00 | % | | | 03/25/2036 | | | | 1,104,745 | |
7,294,386 | | Washington Mutual Mortgage Pass-Through Certificates Trust, Series 2006-8-A5 | | | 4.17 | % | | | 10/25/2036 | | | | 2,797,969 | |
3,241,691 | | Washington Mutual Mortgage Pass-Through Certificates Trust, Series 2006-8-A6 | | | 4.17 | % | | | 10/25/2036 | | | | 1,244,412 | |
4,556,417 | | Washington Mutual Mortgage Pass-Through Certificates Trust, Series 2006-AR13-1A (12 Month US Treasury Average + 0.88%, 0.88% Floor) | | | 4.02 | % | | | 10/25/2046 | | | | 3,736,376 | |
1,415,251 | | Washington Mutual Mortgage Pass-Through Certificates Trust, Series 2006-AR19-2A (12 Month US Treasury Average + 1.25%, 1.25% Floor) | | | 4.39 | % | | | 01/25/2047 | | | | 1,226,122 | |
7,305,430 | | Washington Mutual Mortgage Pass-Through Certificates Trust, Series 2007-2-1A2 | | | 6.00 | % | | | 04/25/2037 | | | | 6,010,006 | |
5,123,584 | | Washington Mutual Mortgage Pass-Through Certificates Trust, Series 2007-2-1A3 | | | 6.00 | % | | | 04/25/2037 | | | | 4,215,052 | |
683,471 | | Washington Mutual Mortgage Pass-Through Certificates Trust, Series 2007-3-A6 | | | 6.00 | % | | | 04/25/2037 | | | | 584,101 | |
54,364 | | Washington Mutual Mortgage Pass-Through Certificates Trust, Series 2007-5-A11 (-6 x 1 Month LIBOR USD + 39.48%, 39.48% Cap) | | | 10.41 | % (i) | | | 06/25/2037 | | | | 63,180 | |
6,501,869 | | Washington Mutual Mortgage Pass-Through Certificates Trust, Series 2007-5-A3 | | | 7.00 | % | | | 06/25/2037 | | | | 5,592,869 | |
4,748,274 | | Washington Mutual Mortgage Pass-Through Certificates Trust, Series 2007-HY7-2A1 | | | 3.37 | % (a) | | | 07/25/2037 | | | | 3,900,789 | |
350,707 | | Wells Fargo Alternative Loan Trust, Series 2007-PA5-1A1 | | | 6.25 | % | | | 11/25/2037 | | | | 301,659 | |
9,278 | | Wells Fargo Mortgage Backed Securities Trust, Series 2005-AR14-A6 | | | 4.07 | % (a) | | | 08/25/2035 | | | | 8,659 | |
413,358 | | Wells Fargo Mortgage Backed Securities Trust, Series 2006-7-2A1 | | | 6.00 | % | | | 06/25/2036 | | | | 349,212 | |
20,662 | | Wells Fargo Mortgage Backed Securities Trust, Series 2007-7-A1 | | | 6.00 | % | | | 06/25/2037 | | | | 18,865 | |
| | | | | | | | | | | | | | |
Total Non-Agency Residential Collateralized Mortgage Obligations (Cost $993,384,245) | | | | | | | | | | | 827,656,852 | |
| | | | | | | | | | | | | | |
US Corporate Bonds - 15.2% | | | | | | | | | | | | |
12,386,000 | | AbbVie, Inc. | | | 4.70 | % | | | 05/14/2045 | | | | 11,615,467 | |
1,865,000 | | Academy Ltd. | | | 6.00 | % (f) | | | 11/15/2027 | | | | 1,821,391 | |
2,050,000 | | Acuris Finance, Inc. | | | 5.00 | % (f) | | | 05/01/2028 | | | | 1,611,946 | |
1,670,000 | | AdaptHealth LLC | | | 5.13 | % (f) | | | 03/01/2030 | | | | 1,418,364 | |
1,235,000 | | Advanced Drainage Systems, Inc. | | | 5.00 | % (f) | | | 09/30/2027 | | | | 1,175,176 | |
610,000 | | Advanced Drainage Systems, Inc. | | | 6.38 | % (f) | | | 06/15/2030 | | | | 598,415 | |
1,105,000 | | AEP Transmission Company LLC | | | 5.40 | % | | | 03/15/2053 | | | | 1,152,761 | |
930,000 | | Aethon United Finance Corporation | | | 8.25 | % (f) | | | 02/15/2026 | | | | 913,460 | |
3,245,000 | | Agree LP | | | 2.60 | % | | | 06/15/2033 | | | | 2,563,923 | |
3,596,000 | | Air Lease Corporation | | | 1.88 | % | | | 08/15/2026 | | | | 3,189,648 | |
286,000 | | Air Methods Corporation | | | 8.00 | % (c)(f) | | | 05/15/2025 | | | | 18,660 | |
4,870,000 | | Alexandria Real Estate Equities, Inc. | | | 3.00 | % | | | 05/18/2051 | | | | 3,031,690 | |
1,215,000 | | Alexandria Real Estate Equities, Inc. | | | 5.15 | % | | | 04/15/2053 | | | | 1,115,226 | |
1,125,000 | | Alliant Holdings Intermediate LLC | | | 6.75 | % (f) | | | 10/15/2027 | | | | 1,044,506 | |
1,120,000 | | Allied Universal Holdco LLC | | | 6.63 | % (f) | | | 07/15/2026 | | | | 1,077,440 | |
975,000 | | Allied Universal Holdco LLC | | | 6.00 | % (f) | | | 06/01/2029 | | | | 728,915 | |
385,000 | | AMC Entertainment Holdings, Inc. | | | 7.50 | % (f) | | | 02/15/2029 | | | | 266,372 | |
1,990,000 | | American Airlines, Inc. | | | 5.75 | % (f) | | | 04/20/2029 | | | | 1,910,999 | |
2,186,950 | | American Airlines, Inc. | | | 3.95 | % | | | 07/11/2030 | | | | 1,913,581 | |
600,000 | | American Axle & Manufacturing, Inc. | | | 5.00 | % | | | 10/01/2029 | | | | 507,426 | |
11,385,000 | | American Express Company | | | 3.95 | % | | | 08/01/2025 | | | | 11,171,118 | |
5,780,000 | | Amgen, Inc. | | | 5.25 | % | | | 03/02/2030 | | | | 5,913,698 | |
4,985,000 | | Amgen, Inc. | | | 5.65 | % | | | 03/02/2053 | | | | 5,192,958 | |
1,040,000 | | AmWINS Group, Inc. | | | 4.88 | % (f) | | | 06/30/2029 | | | | 921,768 | |
989,000 | | Antero Midstream Partners LP | | | 5.75 | % (f) | | | 03/01/2027 | | | | 967,539 | |
995,000 | | Antero Resources Corporation | | | 5.38 | % (f) | | | 03/01/2030 | | | | 926,718 | |
4,650,000 | | Anthem, Inc. | | | 2.38 | % | | | 01/15/2025 | | | | 4,453,611 | |
1,535,000 | | Arconic Corporation | | | 6.13 | % (f) | | | 02/15/2028 | | | | 1,511,449 | |
300,000 | | Ardagh Packaging Finance, Inc. | | | 5.25 | % (f) | | | 04/30/2025 | | | | 295,783 | |
5,320,000 | | Arrow Electronics, Inc. | | | 3.88 | % | | | 01/12/2028 | | | | 5,052,903 | |
845,000 | | Ashton Woods Finance Company | | | 4.63 | % (f) | | | 04/01/2030 | | | | 696,702 | |
885,000 | | ASP Unifrax Holdings, Inc. | | | 5.25 | % (f) | | | 09/30/2028 | | | | 708,266 | |
1,410,000 | | AssuredPartners, Inc. | | | 5.63 | % (f) | | | 01/15/2029 | | | | 1,220,122 | |
3,990,000 | | AT&T, Inc. | | | 2.75 | % | | | 06/01/2031 | | | | 3,440,215 | |
15,295,000 | | AT&T, Inc. | | | 3.50 | % | | | 09/15/2053 | | | | 11,124,030 | |
7,805,000 | | AT&T, Inc. | | | 3.55 | % | | | 09/15/2055 | | | | 5,612,376 | |
11,705,000 | | Athene Global Funding | | | 5.31 | % (d)(f) | | | 08/19/2024 | | | | 11,484,803 | |
10,105,000 | | Aviation Capital Group LLC | | | 1.95 | % (f) | | | 09/20/2026 | | | | 8,757,026 | |
3,700,000 | | Bank Leumi (Secured Overnight Financing Rate + 1.75%) | | | 4.83 | % | | | 07/22/2026 | | | | 3,660,317 | |
13,470,000 | | Bank of America Corporation (5 Year CMT Rate + 1.20%) | | | 2.48 | % | | | 09/21/2036 | | | | 10,239,062 | |
3,995,000 | | Bank of America Corporation (Secured Overnight Financing Rate + 1.11%) | | | 3.84 | % | | | 04/25/2025 | | | | 3,923,650 | |
4,985,000 | | Bank of America Corporation (Secured Overnight Financing Rate + 1.21%) | | | 2.57 | % | | | 10/20/2032 | | | | 4,077,769 | |
585,000 | | Bausch Health Companies, Inc. | | | 6.13 | % (f) | | | 02/01/2027 | | | | 379,209 | |
1,290,000 | | Bausch Health Companies, Inc. | | | 4.88 | % (f) | | | 06/01/2028 | | | | 762,261 | |
467,000 | | Bausch Health Companies, Inc. | | | 11.00 | % (f) | | | 09/30/2028 | | | | 345,972 | |
93,000 | | Bausch Health Companies, Inc. | | | 14.00 | % (f) | | | 10/15/2030 | | | | 52,820 | |
1,140,000 | | BCPE Empire Holdings, Inc. | | | 7.63 | % (f) | | | 05/01/2027 | | | | 1,042,701 | |
5,260,000 | | Becton Dickinson & Company | | | 4.69 | % | | | 02/13/2028 | | | | 5,284,762 | |
7,380,000 | | Berkshire Hathaway Energy Company | | | 4.60 | % | | | 05/01/2053 | | | | 6,740,832 | |
4,540,000 | | Berkshire Hathaway Finance Corporation | | | 2.85 | % | | | 10/15/2050 | | | | 3,209,419 | |
3,190,000 | | Berkshire Hathaway Finance Corporation | | | 3.85 | % | | | 03/15/2052 | | | | 2,677,114 | |
3,650,000 | | Berry Global, Inc. | | | 1.65 | % | | | 01/15/2027 | | | | 3,198,964 | |
6,984,000 | | Boeing Company | | | 2.95 | % | | | 02/01/2030 | | | | 6,169,832 | |
4,155,000 | | Boeing Company | | | 3.75 | % | | | 02/01/2050 | | | | 3,152,642 | |
125,000 | | Boxer Parent Company, Inc. | | | 7.13 | % (f) | | | 10/02/2025 | | | | 124,559 | |
5,665,000 | | BP Capital Markets America, Inc. | | | 2.94 | % | | | 06/04/2051 | | | | 3,936,176 | |
6,070,000 | | BP Capital Markets America, Inc. | | | 3.00 | % | | | 03/17/2052 | | | | 4,287,768 | |
3,065,000 | | Brighthouse Financial Global Funding | | | 1.00 | % (f) | | | 04/12/2024 | | | | 2,929,051 | |
3,885,000 | | Brighthouse Financial Global Funding | | | 2.00 | % (f) | | | 06/28/2028 | | | | 3,291,574 | |
10,845,000 | | Broadcom, Inc. | | | 3.42 | % (f) | | | 04/15/2033 | | | | 9,081,800 | |
13,010,000 | | Brooklyn Union Gas Company | | | 4.49 | % (f) | | | 03/04/2049 | | | | 10,573,326 | |
1,270,000 | | Builders FirstSource, Inc. | | | 4.25 | % (f) | | | 02/01/2032 | | | | 1,107,807 | |
1,495,000 | | Caesars Entertainment, Inc. | | | 4.63 | % (f) | | | 10/15/2029 | | | | 1,308,925 | |
70,000 | | Caesars Entertainment, Inc. | | | 7.00 | % (f) | | | 02/15/2030 | | | | 71,289 | |
1,100,000 | | Callon Petroleum Company | | | 7.50 | % (f) | | | 06/15/2030 | | | | 1,035,061 | |
890,000 | | Calpine Corporation | | | 4.50 | % (f) | | | 02/15/2028 | | | | 826,649 | |
555,000 | | Calpine Corporation | | | 5.13 | % (f) | | | 03/15/2028 | | | | 508,885 | |
600,000 | | Calpine Corporation | | | 4.63 | % (f) | | | 02/01/2029 | | | | 518,873 | |
3,335,000 | | Capital One Financial Corporation (Secured Overnight Financing Rate + 2.16%) | | | 4.99 | % | | | 07/24/2026 | | | | 3,217,509 | |
1,915,000 | | Carnival Corporation | | | 5.75 | % (f) | | | 03/01/2027 | | | | 1,573,010 | |
1,465,000 | | Carnival Corporation | | | 9.88 | % (f) | | | 08/01/2027 | | | | 1,510,444 | |
11,515,000 | | Carrier Global Corporation | | | 3.38 | % | | | 04/05/2040 | | | | 9,169,142 | |
525,000 | | Carvana Corporation | | | 5.63 | % (f) | | | 10/01/2025 | | | | 363,710 | |
749,000 | | Castle US Holding Corporation | | | 9.50 | % (f) | | | 02/15/2028 | | | | 307,921 | |
650,000 | | Catalent Pharma Solutions, Inc. | | | 3.50 | % (f) | | | 04/01/2030 | | | | 571,824 | |
2,520,000 | | CCO Holdings LLC | | | 4.75 | % (f) | | | 03/01/2030 | | | | 2,186,100 | |
1,275,000 | | CCO Holdings LLC | | | 4.50 | % (f) | | | 08/15/2030 | | | | 1,078,822 | |
1,200,000 | | CCO Holdings LLC | | | 4.75 | % (f) | | | 02/01/2032 | | | | 1,009,329 | |
565,000 | | CCO Holdings LLC | | | 4.25 | % (f) | | | 01/15/2034 | | | | 442,500 | |
1,830,000 | | Cedar Fair LP | | | 5.25 | % | | | 07/15/2029 | | | | 1,708,113 | |
1,520,000 | | Cengage Learning, Inc. | | | 9.50 | % (f) | | | 06/15/2024 | | | | 1,471,056 | |
9,845,000 | | Centene Corporation | | | 2.50 | % | | | 03/01/2031 | | | | 7,981,341 | |
6,180,000 | | CF Industries, Inc. | | | 5.38 | % | | | 03/15/2044 | | | | 5,590,799 | |
5,701,000 | | Charter Communications Operating LLC | | | 4.91 | % | | | 07/23/2025 | | | | 5,646,406 | |
6,490,000 | | Charter Communications Operating LLC | | | 3.50 | % | | | 03/01/2042 | | | | 4,390,441 | |
1,219,000 | | Chesapeake Energy Corporation | | | 5.88 | % (f) | | | 02/01/2029 | | | | 1,161,798 | |
12,650,000 | | Citigroup, Inc. (3 Month LIBOR USD + 1.10%) | | | 5.98 | % | | | 05/17/2024 | | | | 12,650,468 | |
2,815,000 | | Citigroup, Inc. (Secured Overnight Financing Rate + 0.69%) | | | 2.01 | % | | | 01/25/2026 | | | | 2,652,592 | |
2,255,000 | | Citigroup, Inc. (Secured Overnight Financing Rate + 1.28%) | | | 3.07 | % | | | 02/24/2028 | | | | 2,098,729 | |
770,000 | | Clarivate Science Holdings Corporation | | | 4.88 | % (f) | | | 07/01/2029 | | | | 697,116 | |
460,000 | | Clean Harbors, Inc. | | | 5.13 | % (f) | | | 07/15/2029 | | | | 439,097 | |
465,000 | | Clear Channel Outdoor Holdings, Inc. | | | 7.50 | % (f) | | | 06/01/2029 | | | | 330,894 | |
1,265,000 | | Clearway Energy Operating LLC | | | 4.75 | % (f) | | | 03/15/2028 | | | | 1,209,479 | |
2,450,000 | | CNX Midstream Partners LP | | | 4.75 | % (f) | | | 04/15/2030 | | | | 2,110,185 | |
1,210,000 | | CNX Resources Corporation | | | 6.00 | % (f) | | | 01/15/2029 | | | | 1,132,802 | |
425,000 | | CNX Resources Corporation | | | 7.38 | % (f) | | | 01/15/2031 | | | | 419,112 | |
4,005,000 | | Comcast Corporation | | | 3.95 | % | | | 10/15/2025 | | | | 3,961,665 | |
6,015,000 | | Comcast Corporation | | | 3.40 | % | | | 04/01/2030 | | | | 5,626,824 | |
725,000 | | CommScope Technologies LLC | | | 5.00 | % (f) | | | 03/15/2027 | | | | 530,990 | |
855,000 | | CommScope, Inc. | | | 4.75 | % (f) | | | 09/01/2029 | | | | 713,497 | |
805,000 | | Community Health Systems, Inc. | | | 6.00 | % (f) | | | 01/15/2029 | | | | 681,746 | |
1,110,000 | | Community Health Systems, Inc. | | | 4.75 | % (f) | | | 02/15/2031 | | | | 820,623 | |
745,000 | | Consolidated Communications, Inc. | | | 5.00 | % (f) | | | 10/01/2028 | | | | 506,811 | |
3,495,000 | | Constellation Brands, Inc. | | | 3.15 | % | | | 08/01/2029 | | | | 3,197,202 | |
2,995,000 | | Constellation Brands, Inc. | | | 2.88 | % | | | 05/01/2030 | | | | 2,628,718 | |
6,750,000 | | Continental Resources, Inc. | | | 2.27 | % (f) | | | 11/15/2026 | | | | 6,000,890 | |
623,000 | | Cornerstone Building Brands, Inc. | | | 6.13 | % (f) | | | 01/15/2029 | | | | 445,375 | |
5,495,000 | | Corporate Office Properties LP | | | 2.90 | % | | | 12/01/2033 | | | | 3,838,537 | |
740,000 | | Coty, Inc. | | | 6.50 | % (f) | | | 04/15/2026 | | | | 737,057 | |
1,240,000 | | Coty, Inc. | | | 5.00 | % (f) | | | 04/15/2026 | | | | 1,197,521 | |
3,085,000 | | CQP Holdco LP | | | 5.50 | % (f) | | | 06/15/2031 | | | | 2,776,562 | |
13,045,000 | | Crown Castle International Corporation | | | 3.65 | % | | | 09/01/2027 | | | | 12,380,588 | |
1,185,000 | | CSC Holdings LLC | | | 6.50 | % (f) | | | 02/01/2029 | | | | 985,230 | |
1,315,000 | | CSC Holdings LLC | | | 5.75 | % (f) | | | 01/15/2030 | | | | 693,662 | |
1,050,000 | | CSI Compressco LP | | | 7.50 | % (f) | | | 04/01/2025 | | | | 1,001,448 | |
14,115,000 | | CSX Corporation | | | 3.80 | % | | | 11/01/2046 | | | | 11,613,284 | |
1,225,000 | | CVR Nitrogen Finance Corporation | | | 6.13 | % (f) | | | 06/15/2028 | | | | 1,087,316 | |
3,105,000 | | CVS Health Corporation | | | 5.13 | % | | | 02/21/2030 | | | | 3,148,474 | |
410,000 | | Dana, Inc. | | | 5.38 | % | | | 11/15/2027 | | | | 383,023 | |
965,000 | | Dana, Inc. | | | 5.63 | % | | | 06/15/2028 | | | | 907,389 | |
285,000 | | Dana, Inc. | | | 4.25 | % | | | 09/01/2030 | | | | 228,763 | |
547,000 | | Dealer Tire LLC | | | 8.00 | % (f) | | | 02/01/2028 | | | | 491,605 | |
11,376,000 | | Dick’s Sporting Goods, Inc. | | | 3.15 | % | | | 01/15/2032 | | | | 9,356,640 | |
3,330,000 | | Dick’s Sporting Goods, Inc. | | | 4.10 | % | | | 01/15/2052 | | | | 2,372,194 | |
3,000,000 | | Digital Realty Trust LP | | | 3.60 | % | | | 07/01/2029 | | | | 2,697,658 | |
860,000 | | DirectTV Financing LLC | | | 5.88 | % (f) | | | 08/15/2027 | | | | 779,728 | |
8,380,000 | | Discover Financial Services | | | 4.10 | % | | | 02/09/2027 | | | | 7,937,621 | |
345,000 | | DISH DBS Corporation | | | 5.88 | % | | | 11/15/2024 | | | | 308,016 | |
1,275,000 | | DISH DBS Corporation | | | 5.75 | % (f) | | | 12/01/2028 | | | | 953,859 | |
620,000 | | DISH DBS Corporation | | | 5.13 | % | | | 06/01/2029 | | | | 330,820 | |
3,180,000 | | Dollar General Corporation | | | 4.25 | % | | | 09/20/2024 | | | | 3,143,336 | |
10,358,000 | | Dollar Tree, Inc. | | | 4.00 | % | | | 05/15/2025 | | | | 10,170,778 | |
1,570,000 | | Dollar Tree, Inc. | | | 3.38 | % | | | 12/01/2051 | | | | 1,109,878 | |
440,000 | | Dornoch Debt Merger Sub, Inc. | | | 6.63 | % (f) | | | 10/15/2029 | | | | 297,388 | |
5,585,000 | | DTE Energy Company | | | 4.22 | % (e) | | | 11/01/2024 | | | | 5,525,662 | |
4,400,000 | | DTE Energy Company | | | 2.95 | % | | | 03/01/2030 | | | | 3,874,233 | |
1,265,000 | | Duke Energy Carolinas LLC | | | 2.85 | % | | | 03/15/2032 | | | | 1,101,048 | |
3,840,000 | | Duke Energy Corporation | | | 4.30 | % | | | 03/15/2028 | | | | 3,768,676 | |
10,910,000 | | Duke Energy Corporation | | | 3.95 | % | | | 08/15/2047 | | | | 8,688,728 | |
2,075,000 | | Dun & Bradstreet Corporation | | | 5.00 | % (f) | | | 12/15/2029 | | | | 1,798,996 | |
1,435,000 | | Elevance Health, Inc. | | | 4.55 | % | | | 05/15/2052 | | | | 1,297,580 | |
596,000 | | Embarq Corporation | | | 8.00 | % | | | 06/01/2036 | | | | 251,175 | |
325,000 | | Emergent BioSolutions, Inc. | | | 3.88 | % (f) | | | 08/15/2028 | | | | 158,980 | |
620,000 | | Encompass Health Corporation | | | 4.50 | % | | | 02/01/2028 | | | | 578,547 | |
215,000 | | Encompass Health Corporation | | | 4.75 | % | | | 02/01/2030 | | | | 195,714 | |
1,430,000 | | Encompass Health Corporation | | | 4.63 | % | | | 04/01/2031 | | | | 1,250,535 | |
495,000 | | Endo Luxembourg Finance Company SARL | | | 6.13 | % (f) | | | 04/01/2029 | | | | 366,612 | |
865,000 | | Energizer Holdings, Inc. | | | 6.50 | % (f) | | | 12/31/2027 | | | | 840,886 | |
5,905,000 | | Energy Transfer LP | | | 4.75 | % | | | 01/15/2026 | | | | 5,835,561 | |
4,090,000 | | Energy Transfer LP | | | 4.40 | % | | | 03/15/2027 | | | | 3,976,976 | |
6,675,000 | | Energy Transfer LP | | | 5.00 | % | | | 05/15/2044 | | | | 5,708,118 | |
3,785,000 | | Entergy Corporation | | | 2.80 | % | | | 06/15/2030 | | | | 3,278,514 | |
1,235,000 | | EQM Midstream Partners LP | | | 4.75 | % (f) | | | 01/15/2031 | | | | 1,026,767 | |
6,985,000 | | Equinix, Inc. | | | 1.80 | % | | | 07/15/2027 | | | | 6,082,967 | |
1,470,000 | | EverArc Escrow SARL | | | 5.00 | % (f) | | | 10/30/2029 | | | | 1,222,040 | |
3,710,000 | | Exelon Corporation | | | 5.15 | % | | | 03/15/2028 | | | | 3,777,868 | |
2,330,000 | | Exelon Corporation | | | 4.10 | % | | | 03/15/2052 | | | | 1,919,151 | |
3,335,000 | | Expedia Group, Inc. | | | 5.00 | % | | | 02/15/2026 | | | | 3,322,567 | |
5,961,000 | | Expedia Group, Inc. | | | 3.80 | % | | | 02/15/2028 | | | | 5,651,900 | |
2,229,000 | | Expedia Group, Inc. | | | 3.25 | % | | | 02/15/2030 | | | | 1,934,249 | |
968,000 | | Expedia Group, Inc. | | | 2.95 | % | | | 03/15/2031 | | | | 808,614 | |
5,580,000 | | Exxon Mobil Corporation | | | 4.23 | % | | | 03/19/2040 | | | | 5,231,752 | |
990,000 | | Ferrellgas LP | | | 5.38 | % (f) | | | 04/01/2026 | | | | 928,066 | |
1,580,000 | | Fertitta Entertainment LLC | | | 6.75 | % (f) | | | 01/15/2030 | | | | 1,301,335 | |
4,065,000 | | Ford Motor Company | | | 3.25 | % | | | 02/12/2032 | | | | 3,200,645 | |
1,600,000 | | Ford Motor Credit Company LLC | | | 4.39 | % | | | 01/08/2026 | | | | 1,520,352 | |
1,200,000 | | Ford Motor Credit Company LLC | | | 4.95 | % | | | 05/28/2027 | | | | 1,146,360 | |
1,670,000 | | Ford Motor Credit Company LLC | | | 3.63 | % | | | 06/17/2031 | | | | 1,378,310 | |
6,550,000 | | Fortinet, Inc. | | | 1.00 | % | | | 03/15/2026 | | | | 5,882,542 | |
845,000 | | Fortress Transportation and Infrastructure Investors LLC | | | 5.50 | % (f) | | | 05/01/2028 | | | | 771,958 | |
390,000 | | Frontier Communications Holdings LLC | | | 5.88 | % (f) | | | 10/15/2027 | | | | 354,900 | |
800,000 | | Frontier Communications Holdings LLC | | | 5.00 | % (f) | | | 05/01/2028 | | | | 695,104 | |
100,392 | | Frontier Communications Holdings LLC | | | 5.88 | % | | | 11/01/2029 | | | | 76,656 | |
560,000 | | Full House Resorts, Inc. | | | 8.25 | % (f) | | | 02/15/2028 | | | | 510,104 | |
1,295,000 | | Gap, Inc. | | | 3.88 | % (f) | | | 10/01/2031 | | | | 899,727 | |
7,115,000 | | General Motors Financial Company, Inc. | | | 2.40 | % | | | 10/15/2028 | | | | 6,091,558 | |
7,365,000 | | General Motors Financial Company, Inc. | | | 3.10 | % | | | 01/12/2032 | | | | 6,007,248 | |
6,360,000 | | Georgia Power Company | | | 2.20 | % | | | 09/15/2024 | | | | 6,108,888 | |
14,594,000 | | Georgia Power Company | | | 3.25 | % | | | 03/15/2051 | | | | 10,466,447 | |
1,955,000 | | Global Access, Inc. | | | 5.00 | % (f) | | | 07/15/2029 | | | | 1,742,229 | |
1,913,912 | | Global Aircraft Leasing Company (7.25% PIK) | | | 6.50 | % (f) | | | 09/15/2024 | | | | 1,729,048 | |
5,670,000 | | Global Payments, Inc. | | | 4.95 | % | | | 08/15/2027 | | | | 5,606,446 | |
13,448,000 | | Goldman Sachs Group, Inc. (3 Month LIBOR USD + 1.17%) | | | 6.03 | % | | | 05/15/2026 | | | | 13,344,487 | |
4,340,000 | | Goldman Sachs Group, Inc. (Secured Overnight Financing Rate + 0.82%) | | | 5.63 | % | | | 09/10/2027 | | | | 4,232,596 | |
1,510,000 | | Goodyear Tire & Rubber Company | | | 5.25 | % | | | 07/15/2031 | | | | 1,305,939 | |
615,000 | | GrafTech Finance, Inc. | | | 4.63 | % (f) | | | 12/15/2028 | | | | 513,586 | |
1,105,000 | | Griffon Corporation | | | 5.75 | % | | | 03/01/2028 | | | | 1,026,020 | |
665,000 | | Group 1 Automotive, Inc. | | | 4.00 | % (f) | | | 08/15/2028 | | | | 586,331 | |
635,971 | | Gulfport Energy Corporation | | | 8.00 | % (f) | | | 05/17/2026 | | | | 630,374 | |
2,797,000 | | Halliburton Company | | | 2.92 | % | | | 03/01/2030 | | | | 2,494,004 | |
8,750,000 | | HCA, Inc. | | | 5.38 | % | | | 02/01/2025 | | | | 8,759,304 | |
6,120,000 | | HCA, Inc. | | | 4.13 | % | | | 06/15/2029 | | | | 5,738,963 | |
5,405,000 | | Health Care Service Corporation and Mutual Legal Reserve Company | | | 3.20 | % (f) | | | 06/01/2050 | | | | 3,934,121 | |
1,580,000 | | Helios Software Holdings, Inc. | | | 4.63 | % (f) | | | 05/01/2028 | | | | 1,285,326 | |
370,000 | | Hertz Corporation | | | 5.00 | % (f) | | | 12/01/2029 | | | | 306,856 | |
1,075,000 | | Hess Midstream Operations LP | | | 5.13 | % (f) | | | 06/15/2028 | | | | 1,021,639 | |
1,710,000 | | Hess Midstream Operations LP | | | 4.25 | % (f) | | | 02/15/2030 | | | | 1,529,244 | |
1,355,000 | | Hess Midstream Operations LP | | | 5.50 | % (f) | | | 10/15/2030 | | | | 1,261,987 | |
4,410,000 | | Hewlett Packard Enterprise Company | | | 5.90 | % | | | 10/01/2024 | | | | 4,466,953 | |
1,200,000 | | H-Food Holdings LLC | | | 8.50 | % (f) | | | 06/01/2026 | | | | 743,820 | |
975,000 | | Hightower Holding LLC | | | 6.75 | % (f) | | | 04/15/2029 | | | | 830,764 | |
1,797,000 | | Hilcorp Energy LP | | | 6.25 | % (f) | | | 11/01/2028 | | | | 1,707,651 | |
315,000 | | Hilcorp Energy LP | | | 5.75 | % (f) | | | 02/01/2029 | | | | 290,364 | |
7,239,000 | | Host Hotels & Resorts LP | | | 2.90 | % | | | 12/15/2031 | | | | 5,657,875 | |
12,910,000 | | Hyundai Capital America | | | 2.65 | % (f) | | | 02/10/2025 | | | | 12,319,234 | |
1,260,000 | | Icahn Enterprises LP | | | 5.25 | % | | | 05/15/2027 | | | | 1,183,795 | |
230,000 | | iHeartCommunications, Inc. | | | 8.38 | % | | | 05/01/2027 | | | | 167,535 | |
595,000 | | iHeartCommunications, Inc. | | | 5.25 | % (f) | | | 08/15/2027 | | | | 486,984 | |
1,115,000 | | II-VI, Inc. | | | 5.00 | % (f) | | | 12/15/2029 | | | | 1,013,256 | |
845,000 | | Illuminate Buyer LLC | | | 9.00 | % (f) | | | 07/01/2028 | | | | 749,866 | |
1,435,000 | | Installed Building Products, Inc. | | | 5.75 | % (f) | | | 02/01/2028 | | | | 1,323,244 | |
5,111,000 | | Invitation Homes Operating Partnership LP | | | 2.70 | % | | | 01/15/2034 | | | | 3,918,129 | |
1,380,000 | | Iron Mountain, Inc. | | | 4.88 | % (f) | | | 09/15/2029 | | | | 1,241,834 | |
850,000 | | Iron Mountain, Inc. | | | 4.50 | % (f) | | | 02/15/2031 | | | | 731,255 | |
4,165,000 | | Jacobs Engineering Group, Inc. | | | 5.90 | % | | | 03/01/2033 | | | | 4,174,125 | |
750,000 | | JELD-WEN, Inc. | | | 4.63 | % (f) | | | 12/15/2025 | | | | 696,581 | |
4,420,000 | | JPMorgan Chase & Company (Secured Overnight Financing Rate + 0.92%) | | | 2.60 | % | | | 02/24/2026 | | | | 4,191,610 | |
5,210,000 | | JPMorgan Chase & Company (Secured Overnight Financing Rate + 1.02%) | | | 2.07 | % | | | 06/01/2029 | | | | 4,524,398 | |
7,365,000 | | JPMorgan Chase & Company (Secured Overnight Financing Rate + 1.25%) | | | 2.58 | % | | | 04/22/2032 | | | | 6,202,467 | |
7,100,000 | | JPMorgan Chase & Company (Secured Overnight Financing Rate + 1.26%) | | | 2.96 | % | | | 01/25/2033 | | | | 6,076,712 | |
1,295,000 | | JPMorgan Chase & Company (Secured Overnight Financing Rate + 1.99%) | | | 4.85 | % | | | 07/25/2028 | | | | 1,293,766 | |
8,800,000 | | JPMorgan Chase & Company (Secured Overnight Financing Rate + 2.04%) | | | 2.52 | % | | | 04/22/2031 | | | | 7,528,160 | |
10,144,000 | | Kinder Morgan Energy Partners LP | | | 6.95 | % | | | 01/15/2038 | | | | 11,347,361 | |
6,820,000 | | Kraft Heinz Foods Company | | | 4.38 | % | | | 06/01/2046 | | | | 5,947,622 | |
1,300,000 | | Leeward Renewable Energy Operations LLC | | | 4.25 | % (f) | | | 07/01/2029 | | | | 1,133,862 | |
745,000 | | Legacy LifePoint Health LLC | | | 4.38 | % (f) | | | 02/15/2027 | | | | 610,032 | |
1,015,000 | | Legends Hospitality Holding Company LLC | | | 5.00 | % (f) | | | 02/01/2026 | | | | 909,318 | |
530,000 | | Level 3 Financing, Inc. | | | 3.75 | % (f) | | | 07/15/2029 | | | | 283,269 | |
624,000 | | Level 3 Financing, Inc. | | | 0.00 | % (f) | | | 05/15/2030 | | | | 599,820 | |
1,260,000 | | LFS Topco LLC | | | 5.88 | % (f) | | | 10/15/2026 | | | | 1,099,463 | |
375,000 | | LifePoint Health, Inc. | | | 5.38 | % (f) | | | 01/15/2029 | | | | 229,688 | |
550,000 | | Lions Gate Capital Holdings LLC | | | 5.50 | % (f) | | | 04/15/2029 | | | | 362,219 | |
3,760,000 | | Lowe’s Companies, Inc. | | | 4.40 | % | | | 09/08/2025 | | | | 3,743,686 | |
3,775,000 | | Lowe’s Companies, Inc. | | | 5.63 | % | | | 04/15/2053 | | | | 3,793,116 | |
975,000 | | LSF9 Atlantis Holdings LLC | | | 7.75 | % (f) | | | 02/15/2026 | | | | 886,641 | |
535,000 | | Lumen Technologies, Inc. | | | 4.00 | % (f) | | | 02/15/2027 | | | | 353,590 | |
1,235,000 | | M/I Homes, Inc. | | | 4.95 | % | | | 02/01/2028 | | | | 1,143,985 | |
1,030,000 | | Madison IAQ LLC | | | 4.13 | % (f) | | | 06/30/2028 | | | | 892,098 | |
1,010,000 | | Madison IAQ LLC | | | 5.88 | % (f) | | | 06/30/2029 | | | | 781,225 | |
6,065,000 | | Magallanes, Inc. | | | 3.76 | % (f) | | | 03/15/2027 | | | | 5,716,714 | |
4,829,000 | | Marathon Petroleum Corporation | | | 5.13 | % | | | 12/15/2026 | | | | 4,877,139 | |
6,580,000 | | Marriott International, Inc. | | | 3.13 | % | | | 06/15/2026 | | | | 6,220,596 | |
7,175,000 | | Marriott International, Inc. | | | 2.75 | % | | | 10/15/2033 | | | | 5,814,006 | |
10,955,000 | | Marvell Technology, Inc. | | | 4.20 | % | | | 06/22/2023 | | | | 10,909,061 | |
6,750,000 | | Massachusetts Mutual Life Insurance Company | | | 3.20 | % (f) | | | 12/01/2061 | | | | 4,375,939 | |
1,085,000 | | Match Group Holdings LLC | | | 5.00 | % (f) | | | 12/15/2027 | | | | 1,028,759 | |
6,465,000 | | McDonald’s Corporation | | | 4.45 | % | | | 03/01/2047 | | | | 5,929,246 | |
1,085,000 | | McGraw-Hill Education, Inc. | | | 5.75 | % (f) | | | 08/01/2028 | | | | 945,225 | |
1,700,000 | | Medline Borrower LP | | | 5.25 | % (f) | | | 10/01/2029 | | | | 1,476,565 | |
6,260,000 | | Meta Platforms, Inc. | | | 3.85 | % | | | 08/15/2032 | | | | 5,863,421 | |
6,820,000 | | Meta Platforms, Inc. | | | 4.45 | % | | | 08/15/2052 | | | | 6,007,640 | |
1,130,000 | | Metis Merger Sub LLC | | | 6.50 | % (f) | | | 05/15/2029 | | | | 942,217 | |
5,880,000 | | MetLife, Inc. | | | 5.25 | % | | | 01/15/2054 | | | | 5,736,867 | |
830,000 | | Michaels Companies, Inc. | | | 5.25 | % (f) | | | 05/01/2028 | | | | 692,610 | |
660,000 | | Michaels Companies, Inc. | | | 7.88 | % (f) | | | 05/01/2029 | | | | 462,624 | |
1,238,000 | | Midwest Gaming Borrower LLC | | | 4.88 | % (f) | | | 05/01/2029 | | | | 1,077,653 | |
1,380,000 | | Minerva Merger Sub, Inc. | | | 6.50 | % (f) | | | 02/15/2030 | | | | 1,120,228 | |
1,480,000 | | ModivCare Escrow Issuer, Inc. | | | 5.00 | % (f) | | | 10/01/2029 | | | | 1,258,156 | |
4,660,000 | | Monongahela Power Company | | | 5.40 | % (f) | | | 12/15/2043 | | | | 4,735,390 | |
2,430,000 | | Morgan Stanley (Secured Overnight Financing Rate + 1.29%) | | | 2.94 | % | | | 01/21/2033 | | | | 2,060,523 | |
13,579,000 | | Morgan Stanley (Secured Overnight Financing Rate + 1.36%) | | | 2.48 | % | | | 09/16/2036 | | | | 10,324,770 | |
4,590,000 | | Morgan Stanley (Secured Overnight Financing Rate + 1.61%) | | | 4.21 | % | | | 04/20/2028 | | | | 4,459,509 | |
4,330,000 | | Morgan Stanley (Secured Overnight Financing Rate + 1.67%) | | | 4.68 | % | | | 07/17/2026 | | | | 4,276,866 | |
342,000 | | Moss Creek Resources Holdings, Inc. | | | 7.50 | % (f) | | | 01/15/2026 | | | | 317,533 | |
940,000 | | Murphy Oil USA, Inc. | | | 4.75 | % | | | 09/15/2029 | | | | 857,468 | |
1,020,000 | | Nabors Industries Ltd. | | | 7.25 | % (f) | | | 01/15/2026 | | | | 973,830 | |
1,635,000 | | Nasdaq, Inc. | | | 3.95 | % | | | 03/07/2052 | | | | 1,272,686 | |
1,845,000 | | National Rural Utilities Cooperative Finance Corporation | | | 5.45 | % | | | 10/30/2025 | | | | 1,880,564 | |
1,460,000 | | Nationstar Mortgage Holdings, Inc. | | | 5.75 | % (f) | | | 11/15/2031 | | | | 1,134,096 | |
955,000 | | Navient Corporation | | | 5.00 | % | | | 03/15/2027 | | | | 842,396 | |
1,185,000 | | NCL Corporation Ltd. | | | 5.88 | % (f) | | | 03/15/2026 | | | | 1,009,798 | |
830,000 | | NCL Corporation Ltd. | | | 8.38 | % (f) | | | 02/01/2028 | | | | 833,592 | |
6,163,000 | | NetApp, Inc. | | | 1.88 | % | | | 06/22/2025 | | | | 5,749,601 | |
2,670,000 | | Netflix, Inc. | | | 4.88 | % | | | 04/15/2028 | | | | 2,659,053 | |
765,000 | | Netflix, Inc. | | | 5.38 | % (f) | | | 11/15/2029 | | | | 777,909 | |
550,000 | | Netflix, Inc. | | | 4.88 | % (f) | | | 06/15/2030 | | | | 548,114 | |
505,000 | | News Corporation | | | 5.13 | % (f) | | | 02/15/2032 | | | | 474,190 | |
4,950,000 | | NextEra Energy Capital Holdings, Inc. | | | 4.26 | % | | | 09/01/2024 | | | | 4,906,383 | |
845,000 | | NFP Corporation | | | 4.88 | % (f) | | | 08/15/2028 | | | | 763,263 | |
795,000 | | NGL Energy Operating LLC | | | 7.50 | % (f) | | | 02/01/2026 | | | | 767,798 | |
410,000 | | NGL Energy Partners LP | | | 7.50 | % | | | 04/15/2026 | | | | 355,019 | |
2,988,000 | | NGPL PipeCo LLC | | | 3.25 | % (f) | | | 07/15/2031 | | | | 2,538,638 | |
8,995,000 | | Northrop Grumman Corporation | | | 5.15 | % | | | 05/01/2040 | | | | 9,112,692 | |
4,395,000 | | NRG Energy, Inc. | | | 2.00 | % (f) | | | 12/02/2025 | | | | 3,961,964 | |
1,585,000 | | NRG Energy, Inc. | | | 3.63 | % (f) | | | 02/15/2031 | | | | 1,272,690 | |
1,650,000 | | NuStar Logistics LP | | | 6.00 | % | | | 06/01/2026 | | | | 1,619,434 | |
940,000 | | Oasis Petroleum, Inc. | | | 6.38 | % (f) | | | 06/01/2026 | | | | 932,184 | |
1,075,000 | | Occidental Petroleum Corporation | | | 6.63 | % | | | 09/01/2030 | | | | 1,133,141 | |
1,570,000 | | Occidental Petroleum Corporation | | | 6.13 | % | | | 01/01/2031 | | | | 1,630,469 | |
650,000 | | Occidental Petroleum Corporation | | | 6.45 | % | | | 09/15/2036 | | | | 684,125 | |
660,000 | | Occidental Petroleum Corporation | | | 6.60 | % | | | 03/15/2046 | | | | 694,650 | |
1,885,000 | | Olympus Water US Holding Corporation | | | 4.25 | % (f) | | | 10/01/2028 | | | | 1,561,694 | |
750,000 | | Olympus Water US Holding Corporation | | | 6.25 | % (f) | | | 10/01/2029 | | | | 555,837 | |
850,000 | | OneMain Finance Corporation | | | 6.88 | % | | | 03/15/2025 | | | | 824,500 | |
280,000 | | OneMain Finance Corporation | | | 7.13 | % | | | 03/15/2026 | | | | 269,444 | |
825,000 | | OneMain Finance Corporation | | | 5.38 | % | | | 11/15/2029 | | | | 694,898 | |
3,330,000 | | ONEOK, Inc. | | | 3.40 | % | | | 09/01/2029 | | | | 2,971,152 | |
3,265,000 | | Oracle Corporation | | | 6.25 | % | | | 11/09/2032 | | | | 3,513,464 | |
2,280,000 | | Oracle Corporation | | | 3.80 | % | | | 11/15/2037 | | | | 1,895,703 | |
8,865,000 | | Oracle Corporation | | | 3.85 | % | | | 04/01/2060 | | | | 6,197,270 | |
1,455,000 | | Organon & Company | | | 5.13 | % (f) | | | 04/30/2031 | | | | 1,292,880 | |
1,800,000 | | Owens & Minor, Inc. | | | 6.63 | % (f) | | | 04/01/2030 | | | | 1,547,370 | |
6,272,000 | | Owens Corning | | | 4.40 | % | | | 01/30/2048 | | | | 5,242,976 | |
7,693,000 | | Pacific Gas and Electric Company | | | 2.50 | % | | | 02/01/2031 | | | | 6,238,959 | |
6,622,000 | | Packaging Corporation of America | | | 3.40 | % | | | 12/15/2027 | | | | 6,297,716 | |
875,000 | | Park Intermediate Holdings LLC | | | 4.88 | % (f) | | | 05/15/2029 | | | | 753,782 | |
3,325,000 | | Parker-Hannifin Corporation | | | 4.25 | % | | | 09/15/2027 | | | | 3,264,924 | |
335,000 | | PBF Holding Company LLC | | | 6.00 | % | | | 02/15/2028 | | | | 322,421 | |
455,000 | | PECF USS Intermediate Holding Corporation | | | 8.00 | % (f) | | | 11/15/2029 | | | | 302,709 | |
2,085,000 | | Penn National Gaming, Inc. | | | 5.63 | % (f) | | | 01/15/2027 | | | | 1,960,181 | |
940,000 | | Penn National Gaming, Inc. | | | 4.13 | % (f) | | | 07/01/2029 | | | | 784,764 | |
1,575,000 | | PennyMac Financial Services, Inc. | | | 4.25 | % (f) | | | 02/15/2029 | | | | 1,255,700 | |
6,000,000 | | Penske Truck Leasing Company LP | | | 4.20 | % (f) | | | 04/01/2027 | | | | 5,749,504 | |
4,055,000 | | PepsiCo, Inc. | | | 3.60 | % | | | 02/18/2028 | | | | 3,980,822 | |
1,175,000 | | Performance Food Group, Inc. | | | 4.25 | % (f) | | | 08/01/2029 | | | | 1,056,392 | |
1,095,000 | | PetSmart, Inc. | | | 7.75 | % (f) | | | 02/15/2029 | | | | 1,076,035 | |
1,465,000 | | Phillips 66 | | | 4.95 | % | | | 12/01/2027 | | | | 1,472,214 | |
1,200,000 | | Pike Corporation | | | 5.50 | % (f) | | | 09/01/2028 | | | | 1,051,272 | |
1,862,000 | | Pioneer Natural Resources Company | | | 1.90 | % | | | 08/15/2030 | | | | 1,516,981 | |
430,000 | | Post Holdings, Inc. | | | 5.50 | % (f) | | | 12/15/2029 | | | | 405,692 | |
303,000 | | Post Holdings, Inc. | | | 4.63 | % (f) | | | 04/15/2030 | | | | 271,836 | |
690,000 | | Premier Entertainment Sub LLC | | | 5.63 | % (f) | | | 09/01/2029 | | | | 510,169 | |
805,000 | | Prime Security Services Borrower LLC | | | 6.25 | % (f) | | | 01/15/2028 | | | | 753,432 | |
1,290,000 | | Public Service Enterprise Group, Inc. (Secured Overnight Financing Rate + 1.09%) | | | 4.76 | % | | | 01/26/2027 | | | | 1,275,001 | |
340,000 | | Radiate Holdco LLC | | | 4.50 | % (f) | | | 09/15/2026 | | | | 266,393 | |
745,000 | | Radiology Partners, Inc. | | | 9.25 | % (f) | | | 02/01/2028 | | | | 412,652 | |
6,795,000 | | Raytheon Technologies Corporation | | | 3.03 | % | | | 03/15/2052 | | | | 4,927,762 | |
960,000 | | Realogy Group LLC | | | 5.25 | % (f) | | | 04/15/2030 | | | | 700,589 | |
2,865,000 | | Regal Rexnord Corporation | | | 6.05 | % (f) | | | 02/15/2026 | | | | 2,880,530 | |
530,000 | | RegionalCare Hospital Partners Holdings, Inc. / LifePoint Health, Inc. | | | 9.75 | % (f) | | | 12/01/2026 | | | | 429,187 | |
445,000 | | Rent-A-Center, Inc. | | | 6.38 | % (f) | | | 02/15/2029 | | | | 374,210 | |
650,000 | | Roller Bearing Company of America, Inc. | | | 4.38 | % (f) | | | 10/15/2029 | | | | 581,204 | |
1,475,000 | | Royal Caribbean Cruises Ltd. | | | 5.50 | % (f) | | | 08/31/2026 | | | | 1,381,640 | |
205,000 | | Royal Caribbean Cruises Ltd. | | | 7.25 | % (f) | | | 01/15/2030 | | | | 206,466 | |
7,545,000 | | Royalty Pharma PLC | | | 2.15 | % | | | 09/02/2031 | | | | 5,967,475 | |
8,560,000 | | Royalty Pharma PLC | | | 3.30 | % | | | 09/02/2040 | | | | 6,212,373 | |
580,000 | | RP Escrow Issuer LLC | | | 5.25 | % (f) | | | 12/15/2025 | | | | 440,034 | |
5,975,000 | | Ryder System, Inc. | | | 5.65 | % | | | 03/01/2028 | | | | 6,059,231 | |
4,293,000 | | Sabine Pass Liquefaction LLC | | | 5.00 | % | | | 03/15/2027 | | | | 4,280,979 | |
1,595,000 | | Sabra Health Care LP | | | 3.20 | % | | | 12/01/2031 | | | | 1,171,602 | |
1,705,000 | | San Diego Gas & Electric Company | | | 5.35 | % | | | 04/01/2053 | | | | 1,758,797 | |
3,060,000 | | Santander Holdings USA, Inc. (Secured Overnight Financing Rate + 1.25%) | | | 2.49 | % | | | 01/06/2028 | | | | 2,649,196 | |
3,025,000 | | Santander Holdings USA, Inc. (Secured Overnight Financing Rate + 2.36%) | | | 6.50 | % | | | 03/09/2029 | | | | 3,024,904 | |
880,000 | | Schweitzer-Mauduit International, Inc. | | | 6.88 | % (f) | | | 10/01/2026 | | | | 806,122 | |
1,535,000 | | Scientific Games Holdings LP | | | 6.63 | % (f) | | | 03/01/2030 | | | | 1,357,913 | |
1,450,000 | | Scotts Miracle-Gro Company | | | 4.50 | % | | | 10/15/2029 | | | | 1,248,346 | |
350,000 | | Scripps Escrow, Inc. | | | 5.88 | % (f) | | | 07/15/2027 | | | | 258,125 | |
580,000 | | Scripps Escrow, Inc. | | | 3.88 | % (f) | | | 01/15/2029 | | | | 455,844 | |
1,250,000 | | SEG Holding LLC | | | 5.63 | % (f) | | | 10/15/2028 | | | | 1,188,115 | |
1,075,000 | | Select Medical Corporation | | | 6.25 | % (f) | | | 08/15/2026 | | | | 1,043,830 | |
1,100,000 | | Sirius XM Radio, Inc. | | | 5.50 | % (f) | | | 07/01/2029 | | | | 1,002,326 | |
690,000 | | Sirius XM Radio, Inc. | | | 4.13 | % (f) | | | 07/01/2030 | | | | 564,855 | |
11,508,000 | | Smithfield Foods, Inc. | | | 4.25 | % (f) | | | 02/01/2027 | | | | 10,720,129 | |
1,640,000 | | Sonic Automotive, Inc. | | | 4.63 | % (f) | | | 11/15/2029 | | | | 1,375,789 | |
5,365,000 | | Southern Company (5 Year CMT Rate + 2.92%) | | | 3.75 | % | | | 09/15/2051 | | | | 4,513,789 | |
4,595,000 | | Southwestern Electric Power Company | | | 3.25 | % | | | 11/01/2051 | | | | 3,206,276 | |
1,215,000 | | Southwestern Energy Company | | | 5.38 | % | | | 02/01/2029 | | | | 1,146,541 | |
1,350,000 | | Southwestern Energy Company | | | 4.75 | % | | | 02/01/2032 | | | | 1,194,007 | |
1,230,000 | | Spectrum Brands, Inc. | | | 5.00 | % (f) | | | 10/01/2029 | | | | 1,069,045 | |
975,000 | | SRS Distribution, Inc. | | | 4.63 | % (f) | | | 07/01/2028 | | | | 867,233 | |
745,000 | | SRS Distribution, Inc. | | | 6.13 | % (f) | | | 07/01/2029 | | | | 629,525 | |
1,090,000 | | Staples, Inc. | | | 7.50 | % (f) | | | 04/15/2026 | | | | 956,039 | |
480,000 | | Staples, Inc. | | | 10.75 | % (f) | | | 04/15/2027 | | | | 348,636 | |
950,000 | | Station Casinos LLC | | | 4.63 | % (f) | | | 12/01/2031 | | | | 803,192 | |
1,470,000 | | Suburban Propane Partners LP | | | 5.00 | % (f) | | | 06/01/2031 | | | | 1,286,213 | |
1,550,000 | | SunCoke Energy, Inc. | | | 4.88 | % (f) | | | 06/30/2029 | | | | 1,351,335 | |
635,000 | | Sunoco LP | | | 6.00 | % | | | 04/15/2027 | | | | 627,696 | |
475,000 | | Sunoco LP | | | 4.50 | % | | �� | 05/15/2029 | | | | 436,603 | |
510,000 | | SWF Escrow Issuer Corporation | | | 6.50 | % (f) | | | 10/01/2029 | | | | 314,390 | |
10,715,000 | | Synchrony Financial | | | 3.95 | % | | | 12/01/2027 | | | | 9,089,181 | |
950,000 | | Tenet Healthcare Corporation | | | 6.25 | % | | | 02/01/2027 | | | | 935,275 | |
835,000 | | Tenet Healthcare Corporation | | | 6.13 | % | | | 10/01/2028 | | | | 801,053 | |
1,500,000 | | Tenet Healthcare Corporation | | | 6.13 | % (f) | | | 06/15/2030 | | | | 1,481,100 | |
1,710,000 | | Texas Instruments, Inc. | | | 5.00 | % | | | 03/14/2053 | | | | 1,806,076 | |
4,310,000 | | The Interpublic Group of Companies, Inc. | | | 5.40 | % | | | 10/01/2048 | | | | 4,156,370 | |
6,395,000 | | T-Mobile USA, Inc. | | | 2.25 | % | | | 02/15/2026 | | | | 5,953,494 | |
6,410,000 | | T-Mobile USA, Inc. | | | 3.40 | % | | | 10/15/2052 | | | | 4,621,448 | |
460,000 | | Townsquare Media, Inc. | | | 6.88 | % (f) | | | 02/01/2026 | | | | 435,579 | |
1,720,000 | | TransDigm, Inc. | | | 5.50 | % | | | 11/15/2027 | | | | 1,623,685 | |
1,044,063 | | Transocean Poseidon Ltd. | | | 6.88 | % (f) | | | 02/01/2027 | | | | 1,024,434 | |
1,320,000 | | Trident TPI Holdings, Inc. | | | 6.63 | % (f) | | | 11/01/2025 | | | | 1,222,221 | |
4,546,000 | | Triton Container International Ltd | | | 3.25 | % | | | 03/15/2032 | | | | 3,593,526 | |
2,385,000 | | Triton Container International Ltd. | | | 1.15 | % (f) | | | 06/07/2024 | | | | 2,244,060 | |
1,045,000 | | Triton Water Holdings, Inc. | | | 6.25 | % (f) | | | 04/01/2029 | | | | 830,785 | |
5,290,000 | | Truist Financial Corporation (Secured Overnight Financing Rate + 1.44%) | | | 4.87 | % | | | 01/26/2029 | | | | 5,162,869 | |
1,255,000 | | United Airlines, Inc. | | | 4.63 | % (f) | | | 04/15/2029 | | | | 1,136,806 | |
770,000 | | United Natural Foods, Inc. | | | 6.75 | % (f) | | | 10/15/2028 | | | | 716,339 | |
7,215,000 | | UnitedHealth Group, Inc. | | | 5.05 | % | | | 04/15/2053 | | | | 7,302,562 | |
2,645,000 | | UnitedHealth Group, Inc. | | | 4.95 | % | | | 05/15/2062 | | | | 2,578,359 | |
430,000 | | Uniti Group LP / Uniti Group Finance, Inc. / CSL Capital LLC | | | 10.50 | % (f) | | | 02/15/2028 | | | | 417,487 | |
1,000,000 | | Univision Communications, Inc. | | | 4.50 | % (f) | | | 05/01/2029 | | | | 841,165 | |
980,000 | | USA Compression Partners LP | | | 6.88 | % | | | 09/01/2027 | | | | 937,424 | |
2,420,000 | | Verizon Communications, Inc. | | | 3.88 | % | | | 03/01/2052 | | | | 1,960,785 | |
4,350,000 | | Viatris, Inc. | | | 1.65 | % | | | 06/22/2025 | | | | 3,991,621 | |
1,265,000 | | Victoria’s Secret Company | | | 4.63 | % (f) | | | 07/15/2029 | | | | 1,026,383 | |
440,000 | | Viking Cruises Ltd. | | | 13.00 | % (f) | | | 05/15/2025 | | | | 465,150 | |
3,150,000 | | Viking Cruises Ltd. | | | 5.88 | % (f) | | | 09/15/2027 | | | | 2,715,615 | |
2,525,000 | | Virginia Electric and Power Company | | | 3.75 | % | | | 05/15/2027 | | | | 2,451,811 | |
475,000 | | Virtusa Corporation | | | 7.13 | % (f) | | | 12/15/2028 | | | | 373,749 | |
6,718,000 | | VMware, Inc. | | | 2.20 | % | | | 08/15/2031 | | | | 5,322,730 | |
2,505,000 | | Vornado Realty LP | | | 2.15 | % | | | 06/01/2026 | | | | 2,009,646 | |
6,735,000 | | Warnermedia Holdings, Inc. | | | 4.05 | % (f) | | | 03/15/2029 | | | | 6,269,753 | |
1,660,000 | | WASH Multifamily Acquisition, Inc. | | | 5.75 | % (f) | | | 04/15/2026 | | | | 1,572,618 | |
755,000 | | Weatherford International Ltd. | | | 6.50 | % (f) | | | 09/15/2028 | | | | 757,005 | |
940,000 | | Weatherford International Ltd. | | | 8.63 | % (f) | | | 04/30/2030 | | | | 962,522 | |
5,375,000 | | Wells Fargo & Company (3 Month LIBOR USD + 1.17%) | | | 3.20 | % | | | 06/17/2027 | | | | 5,058,289 | |
5,720,000 | | Wells Fargo & Company (Secured Overnight Financing Rate + 1.98%) | | | 4.81 | % | | | 07/25/2028 | | | | 5,652,938 | |
6,085,000 | | Wells Fargo & Company (Secured Overnight Financing Rate 3 Month + 1.43%) | | | 2.88 | % | | | 10/30/2030 | | | | 5,292,014 | |
1,400,000 | | Western Midstream Operating LP | | | 4.30 | % | | | 02/01/2030 | | | | 1,275,750 | |
365,000 | | Wheel Pros, Inc. | | | 6.50 | % (f) | | | 05/15/2029 | | | | 166,075 | |
11,311,000 | | Willis North America, Inc. | | | 4.50 | % | | | 09/15/2028 | | | | 10,957,661 | |
2,835,000 | | Workday, Inc. | | | 3.70 | % | | | 04/01/2029 | | | | 2,660,119 | |
1,020,000 | | WR Grace Holdings LLC | | | 5.63 | % (f) | | | 08/15/2029 | | | | 867,000 | |
10,922,000 | | WRKCo, Inc. | | | 3.75 | % | | | 03/15/2025 | | | | 10,601,155 | |
1,215,000 | | Wyndham Hotels & Resorts, Inc. | | | 4.38 | % (f) | | | 08/15/2028 | | | | 1,120,446 | |
1,270,000 | | XHR LP | | | 4.88 | % (f) | | | 06/01/2029 | | | | 1,078,424 | |
| | | | | | | | | | | | | | |
Total US Corporate Bonds (Cost $1,246,576,338) | | | | | | | | | | | 1,109,209,857 | |
| | | | | | | | | | | | | | |
US Government and Agency Mortgage Backed Obligations - 19.2% | |
266,973 | | Federal Home Loan Mortgage Corporation Pass-Thru, Pool G01840 | | | 5.00 | % | | | 07/01/2035 | | | | 273,189 | |
141,177 | | Federal Home Loan Mortgage Corporation Pass-Thru, Pool G04817 | | | 5.00 | % | | | 09/01/2038 | | | | 144,471 | |
5,573,603 | | Federal Home Loan Mortgage Corporation Pass-Thru, Pool G08537 | | | 3.00 | % | | | 07/01/2043 | | | | 5,151,732 | |
3,036,326 | | Federal Home Loan Mortgage Corporation Pass-Thru, Pool G08622 | | | 3.00 | % | | | 01/01/2045 | | | | 2,803,916 | |
2,923,082 | | Federal Home Loan Mortgage Corporation Pass-Thru, Pool G08686 | | | 3.00 | % | | | 01/01/2046 | | | | 2,692,063 | |
10,873,276 | | Federal Home Loan Mortgage Corporation Pass-Thru, Pool G08701 | | | 3.00 | % | | | 04/01/2046 | | | | 9,978,986 | |
708,695 | | Federal Home Loan Mortgage Corporation Pass-Thru, Pool G08737 | | | 3.00 | % | | | 12/01/2046 | | | | 649,971 | |
6,502,300 | | Federal Home Loan Mortgage Corporation Pass-Thru, Pool G61645 | | | 4.00 | % | | | 10/01/2048 | | | | 6,330,197 | |
1,025,030 | | Federal Home Loan Mortgage Corporation Pass-Thru, Pool N70081 | | | 5.50 | % | | | 07/01/2038 | | | | 1,025,647 | |
5,225,549 | | Federal Home Loan Mortgage Corporation Pass-Thru, Pool Q33789 | | | 3.50 | % | | | 06/01/2045 | | | | 4,961,608 | |
12,248,380 | | Federal Home Loan Mortgage Corporation Pass-Thru, Pool QE7537 | | | 4.50 | % | | | 08/01/2052 | | | | 12,023,336 | |
25,754,200 | | Federal Home Loan Mortgage Corporation Pass-Thru, Pool RA7672 | | | 4.50 | % | | | 07/01/2052 | | | | 25,281,283 | |
15,823,310 | | Federal Home Loan Mortgage Corporation Pass-Thru, Pool SD0035 | | | 3.00 | % | | | 04/01/2047 | | | | 14,614,154 | |
8,443,147 | | Federal Home Loan Mortgage Corporation Pass-Thru, Pool SD0699 | | | 2.00 | % | | | 11/01/2050 | | | | 7,134,114 | |
29,684,643 | | Federal Home Loan Mortgage Corporation Pass-Thru, Pool SD1743 | | | 4.00 | % | | | 10/01/2052 | | | | 28,576,593 | |
29,423,311 | | Federal Home Loan Mortgage Corporation Pass-Thru, Pool SD1966 | | | 4.00 | % | | | 11/01/2052 | | | | 28,186,174 | |
39,138,899 | | Federal Home Loan Mortgage Corporation Pass-Thru, Pool SD2263 | | | 4.00 | % | | | 12/01/2052 | | | | 37,482,683 | |
63,850,622 | | Federal Home Loan Mortgage Corporation Pass-Thru, Pool SD7538 | | | 2.00 | % | | | 04/01/2051 | | | | 53,755,171 | |
11,179,380 | | Federal Home Loan Mortgage Corporation Pass-Thru, Pool SD8174 | | | 3.00 | % | | | 10/01/2051 | | | | 10,065,380 | |
25,275,391 | | Federal Home Loan Mortgage Corporation Pass-Thru, Pool SD8221 | | | 3.50 | % | | | 06/01/2052 | | | | 23,511,130 | |
866,502 | | Federal Home Loan Mortgage Corporation Pass-Thru, Pool T60854 | | | 3.50 | % | | | 09/01/2042 | | | | 802,844 | |
141,849 | | Federal Home Loan Mortgage Corporation Pass-Thru, Pool U60299 | | | 4.00 | % | | | 11/01/2040 | | | | 138,287 | |
3,809,042 | | Federal Home Loan Mortgage Corporation Pass-Thru, Pool V83144 | | | 4.00 | % | | | 04/01/2047 | | | | 3,714,282 | |
11,517,352 | | Federal Home Loan Mortgage Corporation Pass-Thru, Pool ZT1827 | | | 3.00 | % | | | 07/01/2047 | | | | 10,555,713 | |
32,188 | | Federal Home Loan Mortgage Corporation REMICS, Series 2692-SC (-2 x 1 Month LIBOR USD + 13.29%, 13.29% Cap) | | | 3.92 | % (i) | | | 07/15/2033 | | | | 32,136 | |
868,494 | | Federal Home Loan Mortgage Corporation REMICS, Series 2722-PS (-1 x 1 Month LIBOR USD + 9.89%, 9.89% Cap) | | | 4.68 | % (i) | | | 12/15/2033 | | | | 879,856 | |
36,797 | | Federal Home Loan Mortgage Corporation REMICS, Series 2750-ZT | | | 5.00 | % | | | 02/15/2034 | | | | 37,279 | |
81,961 | | Federal Home Loan Mortgage Corporation REMICS, Series 3002-SN (-1 x 1 Month LIBOR USD + 6.50%, 6.50% Cap) | | | 1.82 | % (h)(i) | | | 07/15/2035 | | | | 6,462 | |
40,824 | | Federal Home Loan Mortgage Corporation REMICS, Series 3045-DI (-1 x 1 Month LIBOR USD + 6.73%, 6.73% Cap) | | | 2.05 | % (h)(i) | | | 10/15/2035 | | | | 3,687 | |
133,197 | | Federal Home Loan Mortgage Corporation REMICS, Series 3116-Z | | | 5.50 | % | | | 02/15/2036 | | | | 136,664 | |
10,503 | | Federal Home Loan Mortgage Corporation REMICS, Series 3117-ZN | | | 4.50 | % | | | 02/15/2036 | | | | 10,084 | |
151,435 | | Federal Home Loan Mortgage Corporation REMICS, Series 3203-ZC | | | 5.00 | % | | | 07/15/2036 | | | | 153,098 | |
41,618 | | Federal Home Loan Mortgage Corporation REMICS, Series 3275-SC (-1 x 1 Month LIBOR USD + 6.08%, 6.08% Cap) | | | 1.40 | % (h)(i) | | | 02/15/2037 | | | | 2,887 | |
94,067 | | Federal Home Loan Mortgage Corporation REMICS, Series 3382-SB (-1 x 1 Month LIBOR USD + 6.00%, 6.00% Cap) | | | 1.32 | % (h)(i) | | | 11/15/2037 | | | | 6,145 | |
116,844 | | Federal Home Loan Mortgage Corporation REMICS, Series 3384-S (-1 x 1 Month LIBOR USD + 6.39%, 6.39% Cap) | | | 1.71 | % (h)(i) | | | 11/15/2037 | | | | 6,957 | |
58,586 | | Federal Home Loan Mortgage Corporation REMICS, Series 3417-SX (-1 x 1 Month LIBOR USD + 6.18%, 6.18% Cap) | | | 1.50 | % (h)(i) | | | 02/15/2038 | | | | 4,100 | |
15,918 | | Federal Home Loan Mortgage Corporation REMICS, Series 3423-GS (-1 x 1 Month LIBOR USD + 5.65%, 5.65% Cap) | | | 0.97 | % (h)(i) | | | 03/15/2038 | | | | 927 | |
15,918 | | Federal Home Loan Mortgage Corporation REMICS, Series 3423-SG (-1 x 1 Month LIBOR USD + 5.65%, 5.65% Cap) | | | 0.97 | % (h)(i) | | | 03/15/2038 | | | | 894 | |
61,653 | | Federal Home Loan Mortgage Corporation REMICS, Series 3524-LB | | | 3.33 | % (a)(h)(k) | | | 06/15/2038 | | | | 58,968 | |
33,679 | | Federal Home Loan Mortgage Corporation REMICS, Series 3562-WS (-1 x 1 Month LIBOR USD + 4.95%, 4.95% Cap) | | | 0.27 | % (h)(i) | | | 08/15/2039 | | | | 1,628 | |
106,546 | | Federal Home Loan Mortgage Corporation REMICS, Series 3582-SA (-1 x 1 Month LIBOR USD + 6.00%, 6.00% Cap) | | | 1.32 | % (h)(i) | | | 10/15/2049 | | | | 9,725 | |
95,705 | | Federal Home Loan Mortgage Corporation REMICS, Series 3616-SG (-1 x 1 Month LIBOR USD + 6.35%, 6.35% Cap) | | | 1.67 | % (h)(i) | | | 03/15/2032 | | | | 5,478 | |
448,807 | | Federal Home Loan Mortgage Corporation REMICS, Series 3626-AZ | | | 5.50 | % | | | 08/15/2036 | | | | 463,023 | |
172,930 | | Federal Home Loan Mortgage Corporation REMICS, Series 3666-SC (-1 x 1 Month LIBOR USD + 5.77%, 5.77% Cap) | | | 1.09 | % (h)(i) | | | 05/15/2040 | | | | 12,743 | |
115,974 | | Federal Home Loan Mortgage Corporation REMICS, Series 3666-VZ | | | 5.50 | % | | | 08/15/2036 | | | | 119,525 | |
1,241,600 | | Federal Home Loan Mortgage Corporation REMICS, Series 3779-DZ | | | 4.50 | % (j) | | | 12/15/2040 | | | | 1,249,218 | |
573,577 | | Federal Home Loan Mortgage Corporation REMICS, Series 3779-YA | | | 3.50 | % | | | 12/15/2030 | | | | 558,277 | |
162,797 | | Federal Home Loan Mortgage Corporation REMICS, Series 3786-SG (-2 x 1 Month LIBOR USD + 9.50%, 9.50% Cap) | | | 0.13 | % (i) | | | 01/15/2041 | | | | 119,954 | |
101,340 | | Federal Home Loan Mortgage Corporation REMICS, Series 3792-SE (-2 x 1 Month LIBOR USD + 9.86%, 9.86% Cap) | | | 0.49 | % (i) | | | 01/15/2041 | | | | 80,746 | |
453,152 | | Federal Home Loan Mortgage Corporation REMICS, Series 3806-CZ | | | 5.50 | % | | | 07/15/2034 | | | | 464,455 | |
365,349 | | Federal Home Loan Mortgage Corporation REMICS, Series 3808-DB | | | 3.50 | % | | | 02/15/2031 | | | | 355,424 | |
532,568 | | Federal Home Loan Mortgage Corporation REMICS, Series 3818-CZ | | | 4.50 | % | | | 03/15/2041 | | | | 533,758 | |
459,827 | | Federal Home Loan Mortgage Corporation REMICS, Series 3819-ZU | | | 5.50 | % | | | 07/15/2034 | | | | 471,414 | |
1,252,886 | | Federal Home Loan Mortgage Corporation REMICS, Series 3824-EY | | | 3.50 | % | | | 03/15/2031 | | | | 1,218,844 | |
251,282 | | Federal Home Loan Mortgage Corporation REMICS, Series 3828-SW (-3 x 1 Month LIBOR USD + 13.20%, 13.20% Cap) | | | 0.00 | % (i) | | | 02/15/2041 | | | | 194,134 | |
757,441 | | Federal Home Loan Mortgage Corporation REMICS, Series 3863-ZA | | | 5.50 | % | | | 08/15/2034 | | | | 776,614 | |
2,009,625 | | Federal Home Loan Mortgage Corporation REMICS, Series 3889-VZ | | | 4.00 | % | | | 07/15/2041 | | | | 1,924,693 | |
2,025,539 | | Federal Home Loan Mortgage Corporation REMICS, Series 3910-GZ | | | 5.00 | % | | | 08/15/2041 | | | | 2,083,676 | |
756,899 | | Federal Home Loan Mortgage Corporation REMICS, Series 3972-AZ | | | 3.50 | % | | | 12/15/2041 | | | | 689,444 | |
8,003,335 | | Federal Home Loan Mortgage Corporation REMICS, Series 4165-ZT | | | 3.00 | % (j) | | | 02/15/2043 | | | | 6,709,245 | |
2,271,501 | | Federal Home Loan Mortgage Corporation REMICS, Series 4291-MS (-1 x 1 Month LIBOR USD + 5.90%, 5.90% Cap) | | | 1.22 | % (h)(i) | | | 01/15/2054 | | | | 193,416 | |
8,196,376 | | Federal Home Loan Mortgage Corporation REMICS, Series 4413-AZ | | | 3.50 | % | | | 11/15/2044 | | | | 7,751,925 | |
2,399,292 | | Federal Home Loan Mortgage Corporation REMICS, Series 4471-BA | | | 3.00 | % | | | 12/15/2041 | | | | 2,330,086 | |
11,741,648 | | Federal Home Loan Mortgage Corporation REMICS, Series 4471-GA | | | 3.00 | % | | | 02/15/2044 | | | | 11,050,110 | |
13,675,577 | | Federal Home Loan Mortgage Corporation REMICS, Series 4542-AC | | | 2.70 | % | | | 01/15/2045 | | | | 12,871,303 | |
34,934,000 | | Federal Home Loan Mortgage Corporation REMICS, Series 5138-HM | | | 2.00 | % | | | 04/25/2051 | | | | 27,268,708 | |
9,507,186 | | Federal Home Loan Mortgage Corporation REMICS, Series 5148-BZ | | | 2.50 | % (j) | | | 10/25/2051 | | | | 5,910,495 | |
13,936,055 | | Federal Home Loan Mortgage Corporation REMICS, Series 5195-ZN | | | 2.50 | % (j) | | | 02/25/2052 | | | | 9,650,211 | |
172,505 | | Federal Home Loan Mortgage Corporation REMICS, Series R003-ZA | | | 5.50 | % | | | 10/15/2035 | | | | 177,768 | |
51,450 | | Federal National Mortgage Association Pass-Thru, Pool 555743 | | | 5.00 | % | | | 09/01/2033 | | | | 52,590 | |
42,419 | | Federal National Mortgage Association Pass-Thru, Pool 735382 | | | 5.00 | % | | | 04/01/2035 | | | | 43,359 | |
357,693 | | Federal National Mortgage Association Pass-Thru, Pool 735383 | | | 5.00 | % | | | 04/01/2035 | | | | 365,627 | |
178,392 | | Federal National Mortgage Association Pass-Thru, Pool 735402 | | | 5.00 | % | | | 04/01/2035 | | | | 182,349 | |
242,862 | | Federal National Mortgage Association Pass-Thru, Pool 735484 | | | 5.00 | % | | | 05/01/2035 | | | | 248,249 | |
53,975 | | Federal National Mortgage Association Pass-Thru, Pool 931104 | | | 5.00 | % | | | 05/01/2039 | | | | 54,904 | |
303,057 | | Federal National Mortgage Association Pass-Thru, Pool 995203 | | | 5.00 | % | | | 07/01/2035 | | | | 308,013 | |
264,941 | | Federal National Mortgage Association Pass-Thru, Pool AB2123 | | | 4.00 | % | | | 01/01/2031 | | | | 258,921 | |
26,012 | | Federal National Mortgage Association Pass-Thru, Pool AB2370 | | | 4.50 | % | | | 09/01/2035 | | | | 25,211 | |
5,464 | | Federal National Mortgage Association Pass-Thru, Pool AD2177 | | | 4.50 | % | | | 06/01/2030 | | | | 5,424 | |
429,777 | | Federal National Mortgage Association Pass-Thru, Pool AH7309 | | | 4.00 | % | | | 02/01/2031 | | | | 420,020 | |
4,491,746 | | Federal National Mortgage Association Pass-Thru, Pool AL9238 | | | 3.00 | % | | | 10/01/2041 | | | | 4,130,457 | |
1,155,664 | | Federal National Mortgage Association Pass-Thru, Pool AL9445 | | | 3.00 | % | | | 07/01/2031 | | | | 1,108,231 | |
6,431,480 | | Federal National Mortgage Association Pass-Thru, Pool AS4645 | | | 3.00 | % | | | 03/01/2045 | | | | 5,930,386 | |
8,233,844 | | Federal National Mortgage Association Pass-Thru, Pool AS7661 | | | 3.00 | % | | | 08/01/2046 | | | | 7,461,470 | |
3,675,012 | | Federal National Mortgage Association Pass-Thru, Pool AS7724 | | | 2.50 | % | | | 08/01/2046 | | | | 3,227,483 | |
11,941,521 | | Federal National Mortgage Association Pass-Thru, Pool BC9081 | | | 3.00 | % | | | 12/01/2046 | | | | 10,953,624 | |
8,313,793 | | Federal National Mortgage Association Pass-Thru, Pool BD8013 | | | 2.50 | % | | | 09/01/2046 | | | | 7,301,419 | |
2,082,538 | | Federal National Mortgage Association Pass-Thru, Pool BM4094 | | | 3.00 | % | | | 03/01/2043 | | | | 1,922,962 | |
12,078,991 | | Federal National Mortgage Association Pass-Thru, Pool BM6089 | | | 3.50 | % | | | 12/01/2044 | | | | 11,454,854 | |
28,186,281 | | Federal National Mortgage Association Pass-Thru, Pool CB3127 | | | 3.50 | % | | | 03/01/2052 | | | | 26,374,539 | |
9,621,198 | | Federal National Mortgage Association Pass-Thru, Pool CB4613 | | | 4.50 | % | | | 09/01/2052 | | | | 9,444,025 | |
36,816,067 | | Federal National Mortgage Association Pass-Thru, Pool CB4794 | | | 4.50 | % | | | 10/01/2052 | | | | 36,138,117 | |
11,081,981 | | Federal National Mortgage Association Pass-Thru, Pool FM1000 | | | 3.00 | % | | | 04/01/2047 | | | | 10,130,117 | |
33,065,077 | | Federal National Mortgage Association Pass-Thru, Pool FM2310 | | | 3.00 | % | | | 01/01/2048 | | | | 30,181,716 | |
17,611,056 | | Federal National Mortgage Association Pass-Thru, Pool FM4575 | | | 2.50 | % | | | 10/01/2050 | | | | 15,442,036 | |
11,094,331 | | Federal National Mortgage Association Pass-Thru, Pool FM6061 | | | 2.00 | % | | | 02/01/2051 | | | | 9,298,888 | |
30,892,653 | | Federal National Mortgage Association Pass-Thru, Pool FM8214 | | | 4.00 | % | | | 05/01/2049 | | | | 30,003,944 | |
7,266,360 | | Federal National Mortgage Association Pass-Thru, Pool FM8664 | | | 3.00 | % | | | 10/01/2046 | | | | 6,673,378 | |
24,661,715 | | Federal National Mortgage Association Pass-Thru, Pool FM8972 | | | 4.00 | % | | | 06/01/2049 | | | | 24,027,493 | |
5,966,804 | | Federal National Mortgage Association Pass-Thru, Pool FM9846 | | | 2.50 | % | | | 12/01/2051 | | | | 5,152,675 | |
57,533,718 | | Federal National Mortgage Association Pass-Thru, Pool FM9993 | | | 3.50 | % | | | 07/01/2051 | | | | 54,031,457 | |
42,485,774 | | Federal National Mortgage Association Pass-Thru, Pool FS1472 | | | 3.50 | % | | | 11/01/2050 | | | | 39,878,459 | |
10,898,842 | | Federal National Mortgage Association Pass-Thru, Pool FS3708 | | | 5.00 | % | | | 01/01/2053 | | | | 10,893,911 | |
187,613 | | Federal National Mortgage Association Pass-Thru, Pool MA0264 | | | 4.50 | % | | | 12/01/2029 | | | | 187,691 | |
126,812 | | Federal National Mortgage Association Pass-Thru, Pool MA0353 | | | 4.50 | % | | | 03/01/2030 | | | | 126,865 | |
4,575 | | Federal National Mortgage Association Pass-Thru, Pool MA0468 | | | 5.00 | % | | | 07/01/2040 | | | | 4,530 | |
2,417,895 | | Federal National Mortgage Association Pass-Thru, Pool MA2151 | | | 3.50 | % | | | 01/01/2045 | | | | 2,238,151 | |
1,082,728 | | Federal National Mortgage Association Pass-Thru, Pool MA2248 | | | 3.00 | % | | | 04/01/2045 | | | | 981,236 | |
1,866,826 | | Federal National Mortgage Association Pass-Thru, Pool MA2621 | | | 3.50 | % | | | 05/01/2046 | | | | 1,727,869 | |
4,033,977 | | Federal National Mortgage Association Pass-Thru, Pool MA2649 | | | 3.00 | % | | | 06/01/2046 | | | | 3,655,551 | |
1,661,054 | | Federal National Mortgage Association Pass-Thru, Pool MA2711 | | | 3.00 | % | | | 08/01/2046 | | | | 1,505,233 | |
10,637,067 | | Federal National Mortgage Association Pass-Thru, Pool MA2806 | | | 3.00 | % | | | 11/01/2046 | | | | 9,786,120 | |
71,146,369 | | Federal National Mortgage Association Pass-Thru, Pool MA4326 | | | 2.50 | % | | | 05/01/2051 | | | | 61,502,014 | |
14,239,294 | | Federal National Mortgage Association Pass-Thru, Pool MA4709 | | | 5.00 | % | | | 07/01/2052 | | | | 14,217,762 | |
909,873 | | Federal National Mortgage Association REMICS, Series 2005-20-QH | | | 5.00 | % | | | 03/25/2035 | | | | 920,924 | |
164,601 | | Federal National Mortgage Association REMICS, Series 2006-101-SA (-1 x 1 Month LIBOR USD + 6.58%, 6.58% Cap) | | | 1.73 | % (h)(i) | | | 10/25/2036 | | | | 16,542 | |
68,612 | | Federal National Mortgage Association REMICS, Series 2006-56-SM (-1 x 1 Month LIBOR USD + 6.75%, 6.75% Cap) | | | 1.90 | % (h)(i) | | | 07/25/2036 | | | | 5,715 | |
50,607 | | Federal National Mortgage Association REMICS, Series 2007-116-BI (-1 x 1 Month LIBOR USD + 6.25%, 6.25% Cap) | | | 1.40 | % (h)(i) | | | 05/25/2037 | | | | 3,252 | |
677,387 | | Federal National Mortgage Association REMICS, Series 2007-30-FS (-5 x 1 Month LIBOR USD + 29.83%, 29.83% Cap) | | | 7.39 | % (i) | | | 04/25/2037 | | | | 717,755 | |
263,390 | | Federal National Mortgage Association REMICS, Series 2007-30-OI (-1 x 1 Month LIBOR USD + 6.44%, 6.44% Cap) | | | 1.59 | % (h)(i) | | | 04/25/2037 | | | | 24,618 | |
39,826 | | Federal National Mortgage Association REMICS, Series 2008-29-ZA | | | 4.50 | % | | | 04/25/2038 | | | | 39,386 | |
13,293 | | Federal National Mortgage Association REMICS, Series 2008-62-SC (-1 x 1 Month LIBOR USD + 6.00%, 6.00% Cap) | | | 1.15 | % (h)(i) | | | 07/25/2038 | | | | 837 | |
170,180 | | Federal National Mortgage Association REMICS, Series 2009-111-EZ | | | 5.00 | % | | | 01/25/2040 | | | | 170,815 | |
4,788 | | Federal National Mortgage Association REMICS, Series 2009-111-SE (-1 x 1 Month LIBOR USD + 6.25%, 6.25% Cap) | | | 1.40 | % (h)(i) | | | 01/25/2040 | | | | 498 | |
26,259 | | Federal National Mortgage Association REMICS, Series 2009-16-MZ | | | 5.00 | % | | | 03/25/2029 | | | | 26,146 | |
24,099 | | Federal National Mortgage Association REMICS, Series 2009-48-WS (-1 x 1 Month LIBOR USD + 5.95%, 5.95% Cap) | | | 1.10 | % (h)(i) | | | 07/25/2039 | | | | 1,923 | |
49,494 | | Federal National Mortgage Association REMICS, Series 2009-62-PS (-1 x 1 Month LIBOR USD + 6.10%, 6.10% Cap) | | | 1.25 | % (h)(i) | | | 08/25/2039 | | | | 1,925 | |
451,394 | | Federal National Mortgage Association REMICS, Series 2009-77-ZA | | | 4.50 | % | | | 10/25/2039 | | | | 446,223 | |
121,440 | | Federal National Mortgage Association REMICS, Series 2009-83-Z | | | 4.50 | % | | | 10/25/2039 | | | | 118,962 | |
33,251 | | Federal National Mortgage Association REMICS, Series 2010-101-ZH | | | 4.50 | % | | | 07/25/2040 | | | | 33,007 | |
149,315 | | Federal National Mortgage Association REMICS, Series 2010-112-ZA | | | 4.00 | % | | | 10/25/2040 | | | | 142,840 | |
65,929 | | Federal National Mortgage Association REMICS, Series 2010-121-SD (-1 x 1 Month LIBOR USD + 4.50%, 4.50% Cap) | | | 0.00 | % (h)(i) | | | 10/25/2040 | | | | 3,269 | |
29,336 | | Federal National Mortgage Association REMICS, Series 2010-137-VS (-3 x 1 Month LIBOR USD + 15.00%, 15.00% Cap) | | | 1.01 | % (i) | | | 12/25/2040 | | | | 26,920 | |
20,739 | | Federal National Mortgage Association REMICS, Series 2010-31-SA (-1 x 1 Month LIBOR USD + 5.00%, 5.00% Cap) | | | 0.15 | % (h)(i) | | | 04/25/2040 | | | | 782 | |
13,559 | | Federal National Mortgage Association REMICS, Series 2010-34-PS (-1 x 1 Month LIBOR USD + 4.93%, 4.93% Cap) | | | 0.08 | % (h)(i) | | | 04/25/2040 | | | | 772 | |
84,355 | | Federal National Mortgage Association REMICS, Series 2010-35-SP (-1 x 1 Month LIBOR USD + 6.35%, 6.35% Cap) | | | 1.50 | % (h)(i) | | | 04/25/2050 | | | | 8,460 | |
5,119 | | Federal National Mortgage Association REMICS, Series 2010-35-SV (-1 x 1 Month LIBOR USD + 6.45%, 6.45% Cap) | | | 1.60 | % (h)(i) | | | 04/25/2040 | | | | 115 | |
557,230 | | Federal National Mortgage Association REMICS, Series 2010-37-MY | | | 4.50 | % | | | 04/25/2040 | | | | 556,355 | |
110,711 | | Federal National Mortgage Association REMICS, Series 2010-59-SC (-1 x 1 Month LIBOR USD + 5.00%, 5.00% Cap) | | | 0.15 | % (h)(i) | | | 01/25/2040 | | | | 5,829 | |
192,333 | | Federal National Mortgage Association REMICS, Series 2010-60-VZ | | | 5.00 | % | | | 10/25/2039 | | | | 197,448 | |
84,814 | | Federal National Mortgage Association REMICS, Series 2010-64-EZ | | | 5.00 | % | | | 06/25/2040 | | | | 85,443 | |
123,648 | | Federal National Mortgage Association REMICS, Series 2010-7-PE | | | 5.00 | % | | | 02/25/2040 | | | | 126,646 | |
40,908 | | Federal National Mortgage Association REMICS, Series 2010-90-GS (-1 x 1 Month LIBOR USD + 6.00%, 6.00% Cap) | | | 1.15 | % (h)(i) | | | 08/25/2040 | | | | 3,020 | |
26,553 | | Federal National Mortgage Association REMICS, Series 2010-99-SG (-5 x 1 Month LIBOR USD + 25.00%, 25.00% Cap) | | | 1.69 | % (i) | | | 09/25/2040 | | | | 27,871 | |
1,198,828 | | Federal National Mortgage Association REMICS, Series 2011-141-PZ | | | 4.00 | % | | | 01/25/2042 | | | | 1,163,743 | |
245,572 | | Federal National Mortgage Association REMICS, Series 2011-25-KY | | | 3.00 | % | | | 04/25/2026 | | | | 239,121 | |
352,738 | | Federal National Mortgage Association REMICS, Series 2011-29-AL | | | 3.50 | % | | | 04/25/2031 | | | | 342,776 | |
493,353 | | Federal National Mortgage Association REMICS, Series 2011-59-MA | | | 4.50 | % | | | 07/25/2041 | | | | 484,896 | |
18,003,636 | | Federal National Mortgage Association REMICS, Series 2013-6-ZB | | | 3.00 | % (j) | | | 02/25/2043 | | | | 16,509,467 | |
5,753,040 | | Federal National Mortgage Association REMICS, Series 2017-46-ZL | | | 3.50 | % (j) | | | 06/25/2057 | | | | 4,852,040 | |
857,987 | | Federal National Mortgage Association REMICS, Series 2017-86-MA | | | 3.00 | % | | | 04/25/2046 | | | | 816,552 | |
10,551,081 | | Federal National Mortgage Association REMICS, Series 2018-21-IO | | | 3.00 | % (h) | | | 04/25/2048 | | | | 1,613,721 | |
16,600,360 | | Federal National Mortgage Association REMICS, Series 2018-21-PO | | | 0.00 | % (k) | | | 04/25/2048 | | | | 12,934,994 | |
8,592,109 | | Federal National Mortgage Association REMICS, Series 2018-35-IO | | | 3.00 | % (h) | | | 05/25/2048 | | | | 1,460,386 | |
32,961,528 | | Federal National Mortgage Association REMICS, Series 2018-35-PO | | | 0.00 | % (k) | | | 05/25/2048 | | | | 24,297,119 | |
32,751,259 | | Federal National Mortgage Association REMICS, Series 2020-49-ZD | | | 2.00 | % (j) | | | 07/25/2050 | | | | 21,866,519 | |
18,441,600 | | Federal National Mortgage Association REMICS, Series 2021-48-NS (-1 x Secured Overnight Financing Rate 30 Day Average + 3.65%, 3.65% Cap) | | | 0.00 | % (h)(i) | | | 08/25/2051 | | | | 752,876 | |
9,473,966 | | Federal National Mortgage Association REMICS, Series 2022-12-MZ | | | 3.00 | % (j) | | | 03/25/2052 | | | | 6,954,512 | |
25,725,350 | | Federal National Mortgage Association REMICS, Series 2022-28-Z | | | 2.50 | % (j) | | | 02/25/2052 | | | | 19,131,184 | |
15,126,117 | | Federal National Mortgage Association REMICS, Series 2022-31-GZ | | | 2.00 | % (j) | | | 03/25/2052 | | | | 10,828,102 | |
66,901,332 | | Federal National Mortgage Association REMICS, Series 2022-3-ZW | | | 2.00 | % (j) | | | 02/25/2052 | | | | 40,887,639 | |
23,051,406 | | Federal National Mortgage Association REMICS, Series 2022-40-AZ | | | 2.00 | % (j) | | | 08/25/2050 | | | | 15,794,100 | |
17,450,500 | | Federal National Mortgage Association, Pool BL2643 | | | 3.39 | % | | | 07/01/2034 | | | | 16,036,712 | |
39,950,000 | | Federal National Mortgage Association, Pool BL4421 | | | 2.14 | % | | | 10/01/2029 | | | | 35,476,642 | |
25,972,000 | | Federal National Mortgage Association, Pool BL4424 | | | 2.14 | % | | | 10/01/2029 | | | | 23,063,813 | |
28,707,000 | | Federal National Mortgage Association, Pool BL4425 | | | 2.14 | % | | | 10/01/2029 | | | | 25,492,564 | |
32,930,000 | | Federal National Mortgage Association, Pool BL4592 | | | 2.28 | % | | | 11/01/2029 | | | | 29,345,129 | |
18,090,000 | | Federal National Mortgage Association, Pool BL5484 | | | 2.26 | % | | | 01/01/2030 | | | | 16,060,439 | |
4,878,511 | | Federal National Mortgage Association, Pool BL9284 | | | 2.23 | % | | | 12/01/2050 | | | | 3,364,973 | |
36,599,790 | | Federal National Mortgage Association, Pool BS4941 | | | 2.46 | % | | | 04/01/2032 | | | | 31,743,297 | |
140,542 | | Federal National Mortgage Association, Series 2003-W17-1A7 | | | 5.75 | % | | | 08/25/2033 | | | | 143,693 | |
103,802 | | Federal National Mortgage Association, Series 400-S4 (-1 x 1 Month LIBOR USD + 5.45%, 5.45% Cap) | | | 0.60 | % (h)(i) | | | 11/25/2039 | | | | 7,295 | |
7,824,819 | | Federal Seasoned Credit Risk Transfer Trust, Series 2018-2-HV | | | 3.00 | % (a) | | | 11/25/2057 | | | | 7,101,618 | |
14,204,499 | | Federal Seasoned Credit Risk Transfer Trust, Series 2019-4-M55D | | | 4.00 | % | | | 02/25/2059 | | | | 13,617,429 | |
2,250,073 | | Government National Mortgage Association, Series 2014-118-SA (-1 x 1 Month LIBOR USD + 6.20%, 6.20% Cap) | | | 1.44 | % (h)(i) | | | 08/20/2044 | | | | 261,891 | |
92,413 | | Government National Mortgage Association, Series 2003-67-SP (-1 x 1 Month LIBOR USD + 7.10%, 7.10% Cap) | | | 2.50 | % (h)(i) | | | 08/20/2033 | | | | 3,540 | |
48,505 | | Government National Mortgage Association, Series 2008-82-SM (-1 x 1 Month LIBOR USD + 6.05%, 6.05% Cap) | | | 1.29 | % (h)(i) | | | 09/20/2038 | | | | 1,225 | |
645,094 | | Government National Mortgage Association, Series 2009-32-ZE | | | 4.50 | % | | | 05/16/2039 | | | | 639,381 | |
694,388 | | Government National Mortgage Association, Series 2009-35-DZ | | | 4.50 | % | | | 05/20/2039 | | | | 686,214 | |
679,850 | | Government National Mortgage Association, Series 2009-75-GZ | | | 4.50 | % | | | 09/20/2039 | | | | 671,988 | |
882,944 | | Government National Mortgage Association, Series 2009-75-HZ | | | 5.00 | % | | | 09/20/2039 | | | | 889,128 | |
2,270,684 | | Government National Mortgage Association, Series 2010-113-SM (-1 x 1 Month LIBOR USD + 6.05%, 6.05% Cap) | | | 1.29 | % (h)(i) | | | 09/20/2040 | | | | 237,530 | |
94,068 | | Government National Mortgage Association, Series 2010-25-ZB | | | 4.50 | % | | | 02/16/2040 | | | | 93,559 | |
1,186,536 | | Government National Mortgage Association, Series 2011-45-GZ | | | 4.50 | % | | | 03/20/2041 | | | | 1,145,022 | |
3,914,677 | | Government National Mortgage Association, Series 2011-71-ZA | | | 4.50 | % | | | 02/20/2041 | | | | 3,868,951 | |
2,540,503 | | Government National Mortgage Association, Series 2013-117-MS (-1 x 1 Month LIBOR USD + 6.15%, 6.15% Cap) | | | 1.39 | % (h)(i) | | | 02/20/2043 | | | | 115,822 | |
2,063,433 | | Government National Mortgage Association, Series 2013-122-SB (-1 x 1 Month LIBOR USD + 6.10%, 6.10% Cap) | | | 1.37 | % (h)(i) | | | 08/16/2043 | | | | 211,065 | |
3,032,652 | | Government National Mortgage Association, Series 2014-102-TS (-1 x 1 Month LIBOR USD + 5.60%, 5.60% Cap) | | | 0.84 | % (h)(i) | | | 07/20/2044 | | | | 262,467 | |
2,571,512 | | Government National Mortgage Association, Series 2014-118-PS (-1 x 1 Month LIBOR USD + 6.20%, 6.20% Cap) | | | 1.44 | % (h)(i) | | | 08/20/2044 | | | | 299,304 | |
16,928,517 | | Government National Mortgage Association, Series 2020-61-IA | | | 3.00 | % (h) | | | 05/20/2050 | | | | 2,418,438 | |
12,169,396 | | Government National Mortgage Association, Series 2021-117-ID | | | 3.50 | % (h) | | | 06/20/2051 | | | | 2,024,360 | |
26,501,795 | | Government National Mortgage Association, Series 2021-155-UI | | | 4.50 | % (h) | | | 09/20/2051 | | | | 4,340,968 | |
19,920,353 | | Government National Mortgage Association, Series 2021-214-IG | | | 2.50 | % (h) | | | 12/20/2051 | | | | 2,818,051 | |
17,299,851 | | Government National Mortgage Association, Series 2022-83-GZ | | | 3.00 | % (j) | | | 05/20/2052 | | | | 14,283,830 | |
35,547,105 | | Government National Mortgage Association Pass-Thru | | | 3.00 | % | | | 02/20/2052 | | | | 32,224,475 | |
11,861,499 | | Government National Mortgage Association Pass-Thru, Pool 784415 | | | 3.50 | % | | | 04/20/2047 | | | | 11,299,572 | |
45,277,776 | | Government National Mortgage Association Pass-Thru, Pool 785662 | | | 2.50 | % | | | 10/20/2051 | | | | 38,884,578 | |
28,897,737 | | Government National Mortgage Association Pass-Thru, Pool 785713 | | | 2.50 | % | | | 10/20/2051 | | | | 25,366,027 | |
13,510,460 | | Government National Mortgage Association Pass-Thru, Pool 785764 | | | 2.50 | % | | | 11/20/2051 | | | | 11,857,685 | |
11,135,776 | | Government National Mortgage Association Pass-Thru, Pool 786227 | | | 3.00 | % | | | 04/20/2052 | | | | 10,098,279 | |
| | | | | | | | | | | | | | |
Total US Government and Agency Mortgage Backed Obligations (Cost $1,551,072,051) | | | | | | | | | | | 1,396,599,437 | |
| | | | | | | | | | | | | | |
US Government and Agency Obligations - 20.9% | |
200,900,000 | | United States Treasury Notes | | | 4.50 | % | | | 11/30/2024 | | | | 201,724,004 | |
3,650,000 | | United States Treasury Notes | | | 4.25 | % | | | 12/31/2024 | | | | 3,653,778 | |
1,450,000 | | United States Treasury Notes | | | 4.13 | % | | | 01/31/2025 | | | | 1,449,774 | |
6,550,000 | | United States Treasury Notes | | | 4.63 | % | | | 02/28/2025 | | | | 6,614,221 | |
5,450,000 | | United States Treasury Notes | | | 3.88 | % | | | 01/15/2026 | | | | 5,452,342 | |
188,450,000 | | United States Treasury Notes | | | 4.00 | % | | | 02/15/2026 | | | | 189,252,384 | |
4,150,000 | | United States Treasury Notes | | | 2.75 | % | | | 07/31/2027 | | | | 3,997,617 | |
5,350,000 | | United States Treasury Notes | | | 4.13 | % | | | 09/30/2027 | | | | 5,451,984 | |
225,600,000 | | United States Treasury Notes | | | 3.88 | % | | | 12/31/2027 | | | | 228,019,032 | |
7,500,000 | | United States Treasury Notes | | | 3.50 | % | | | 01/31/2028 | | | | 7,461,914 | |
5,100,000 | | United States Treasury Notes | | | 3.50 | % | | | 01/31/2030 | | | | 5,080,078 | |
123,700,000 | | United States Treasury Notes | | | 4.00 | % | | | 02/28/2030 | | | | 126,985,781 | |
4,000,000 | | United States Treasury Notes | | | 3.63 | % | | | 03/31/2030 | | | | 4,015,936 | |
220,400,000 | | United States Treasury Notes | | | 2.88 | % | | | 05/15/2032 | | | | 209,793,250 | |
52,100,000 | | United States Treasury Notes | | | 3.50 | % | | | 02/15/2033 | | | | 52,185,476 | |
56,300,000 | | United States Treasury Notes | | | 2.25 | % | | | 05/15/2041 | | | | 44,759,600 | |
82,400,000 | | United States Treasury Notes | | | 3.25 | % | | | 05/15/2042 | | | | 76,071,937 | |
7,050,000 | | United States Treasury Notes | | | 3.88 | % | | | 02/15/2043 | | | | 7,114,441 | |
46,800,000 | | United States Treasury Notes | | | 2.88 | % | | | 05/15/2052 | | | | 40,055,133 | |
52,800,000 | | United States Treasury Notes | | | 4.00 | % | | | 11/15/2052 | | | | 56,050,500 | |
246,500,000 | | United States Treasury Notes | | | 3.63 | % | | | 02/15/2053 | | | | 244,786,056 | |
| | | | | | | | | | | | | | |
Total US Government and Agency Obligations (Cost $1,518,088,678) | | | | | | | | | | | 1,519,975,238 | |
| | | | | | | | | | | | | | |
Affiliated Mutual Funds - 6.1% | |
12,929,742 | | DoubleLine Global Bond Fund (Class I) (l) | | | | | | | | | | | 109,385,620 | |
32,972,257 | | DoubleLine Infrastructure Income Fund (Class I) | | | | | | | | | | | 298,398,929 | |
5,000,000 | | DoubleLine Long Duration Total Return Bond Fund (Class I) | | | | | | | | | | | 35,750,000 | |
| | | | | | | | | | | | | | |
Total Affiliated Mutual Funds (Cost $504,557,903) | | | | | | | | | | | 443,534,549 | |
| | | | | | | | | | | | | | |
Common Stocks - 0.0% (n) | |
4,329 | | Bright Bidco B.V. (b)(l) | | | | | | | | | | | 75,757 | |
70,094 | | Foresight Equity (b)(l) | | | | | | | | | | | 782,245 | |
14,821 | | Intelsat Emergence S.A. (b)(l) | | | | | | | | | | | 414,988 | |
| | | | | | | | | | | | | | |
Total Common Stocks (Cost $2,522,340) | | | | | | | | | | | 1,272,990 | |
| | | | | | | | | | | | | | |
Escrow Notes - 0.0% (n) | |
1,585,000 | | GCB Intelsat Jackson(b)(l) | | | | | | | | | | | - | |
1,695,000 | | Gulfport Energy Corporation (l) | | | | | | | | | | | 3,187 | |
| | | | | | | | | | | | | | |
Total Escrow Notes (Cost $-) | | | | | | | | | | | 3,187 | |
| | | | | | | | | | | | | | |
Rights - 0.0% (n) | |
1,552 | | Intelsat Jackson Holdings Ltd. - Series A (b)(l) | | | | | | | | | | | 12,416 | |
1,552 | | Intelsat Jackson Holdings Ltd. - Series B (b)(l) | | | | | | | | | | | 13,192 | |
| | | | | | | | | | | | | | |
Total Rights (Cost $-) | | | | | | | | | | | 25,608 | |
| | | | | | | | | | | | | | |
Warrants - 0.0% (n) | |
31,063 | | Avation PLC, Expiration 10/21/2026, Strike Price GBP 0.54 (l) | | | | | | | | | | | 23,950 | |
995,158 | | OAS S.A., Expiration 5/16/2039, Strike Price BRL 1.00 (b)(l) | | | | | | | | | | | - | |
| | | | | | | | | | | | | | |
Total Warrants (Cost $-) | | | | | | | | | | | 23,950 | |
| | | | | | | | | | | | | | |
Short Term Investments - 3.6% | |
34,192,241 | | First American Government Obligations Fund - Class U | | | 4.66 | % (m) | | | | | | | 34,192,241 | |
34,192,241 | | JP Morgan U.S. Government Money Market Fund - Institutional Share Class | | | 4.73 | % (m) | | | | | | | 34,192,241 | |
34,192,241 | | Morgan Stanley Institutional Liquidity Funds Government Portfolio - Institutional Share Class | | | 4.74 | % (m) | | | | | | | 34,192,241 | |
158,000,000 | | United States Treasury Bills | | | 0.00 | % | | | 05/18/2023 | | | | 157,076,687 | |
1,500,000 | | United States Treasury Bills | | | 0.00 | % | | | 07/11/2023 | | | | 1,480,726 | |
| | | | | | | | | | | | | | |
Total Short Term Investments (Cost $261,097,893) | | | | | | | | | | | 261,134,136 | |
| | | | | | | | | | | | | | |
Total Investments - 99.6% (Cost $8,092,793,187) | | | | | | | | | | | 7,256,403,331 | |
Other Assets in Excess of Liabilities - 0.4% | | | | | | | | | | | 25,805,128 | |
| | | | | | | | | | | | | | |
NET ASSETS - 100.0% | | | | | | | | | | $ | 7,282,208,459 | |
| | | | | | | | | | | | | | |
A summary of the DoubleLine Core Fixed Income Fund’s investments in affiliated mutual funds for the period ended March 31, 2023 is as follows:
| | | | | | | | | | | | | | |
Principal Amount $/Shares | | Security Description | | Rate | | | Maturity | | | Value $ | |
Asset Backed Obligations - 7.2% | |
6,000,000 | | Affirm Asset Securitization Trust, Series 2021-B-A | | | 1.03 | % (k) | | | 08/17/2026 | | | | 5,738,333 | |
4,200,000 | | Affirm Asset Securitization Trust, Series 2021-B-B | | | 1.24 | % (k) | | | 08/17/2026 | | | | 3,915,068 | |
6,000,000 | | Aligned Data Centers Issuer LLC, Series 2021-1A-A2 | | | 1.94 | % (k) | | | 08/15/2046 | | | | 5,301,915 | |
4,000,000 | | Amur Equipment Finance Receivables LLC, Series 2021-1A-D | | | 2.30 | % (k) | | | 11/22/2027 | | | | 3,698,482 | |
1,687,962 | | Arivo Acceptance Auto Loan Receivables Trust, Series 2021-1A-A | | | 1.19 | % (k) | | | 01/15/2027 | | | | 1,636,289 | |
3,555,949 | | Business Jet Securities LLC, Series 2021-1A-A | | | 2.16 | % (k) | | | 04/15/2036 | | | | 3,270,019 | |
9,548,438 | | CAL Funding Ltd., Series 2020-1A-A | | | 2.22 | % (k) | | | 09/25/2045 | | | | 8,491,568 | |
2,984,834 | | Castlelake Aircraft Structured Trust, Series 2019-1A-A | | | 3.97 | % (k) | | | 04/15/2039 | | | | 2,670,337 | |
889,646 | | College Avenue Student Loans LLC, Series 2017-A-B | | | 4.50 | % (k) | | | 11/26/2046 | | | | 812,502 | |
2,259,724 | | Credit Suisse ABS Trust, Series 2020-AT1-A | | | 2.61 | % (k) | | | 10/15/2026 | | | | 2,198,657 | |
2,140,805 | | Diamond Resorts Owner Trust, Series 2021-1A-C | | | 2.70 | % (k) | | | 11/21/2033 | | | | 1,966,403 | |
1,494,236 | | DRB Prime Student Loan Trust, Series 2017-A-B | | | 3.10 | % (a)(k) | | | 05/27/2042 | | | | 1,484,854 | |
5,000,000 | | Exeter Automobile Receivables Trust, Series 2021-1A-D | | | 1.08 | % | | | 11/16/2026 | | | | 4,751,103 | |
10,000,000 | | Exeter Automobile Receivables Trust, Series 2021-1A-E | | | 2.21 | % (k) | | | 02/15/2028 | | | | 9,290,581 | |
2,490,000 | | ExteNet LLC, Series 2019-1A-A2 | | | 3.20 | % (k) | | | 07/26/2049 | | | | 2,370,944 | |
1,356,150 | | Foundation Finance Trust, Series 2019-1A-A | | | 3.86 | % (k) | | | 11/15/2034 | | | | 1,331,929 | |
10,000,000 | | Genesis Sales Finance Master Trust, Series 2021-AA-C | | | 1.65 | % (k) | | | 12/21/2026 | | | | 9,300,894 | |
3,614,059 | | Global SC Finance SRL, Series 2020-1A-A | | | 2.17 | % (k) | | | 10/17/2040 | | | | 3,282,366 | |
882,349 | | HERO Funding Trust, Series 2016-1A-A | | | 4.05 | % (k) | | | 09/20/2041 | | | | 852,679 | |
16,906,138 | | Horizon Aircraft Finance Ltd., Series 2019-2-A | | | 3.43 | % (k) | | | 11/15/2039 | | | | 13,531,234 | |
4,424,700 | | Jack in the Box Funding LLC, Series 2019-1A-A2II | | | 4.48 | % (k) | | | 08/25/2049 | | | | 4,167,565 | |
11,525,250 | | Jimmy Johns Funding LLC, Series 2017-1A-A2II | | | 4.85 | % (k) | | | 07/30/2047 | | | | 10,828,378 | |
515,396 | | Laurel Road Prime Student Loan Trust, Series 2017-B-CFX | | | 3.61 | % (k) | | | 08/25/2042 | | | | 459,540 | |
6,632,389 | | Lendbuzz Securitization Trust, Series 2022-1A-A | | | 4.22 | % (k) | | | 05/17/2027 | | | | 6,407,334 | |
7,188,588 | | Loanpal Solar Loan Ltd., Series 2020-3GS-A | | | 2.47 | % (k) | | | 12/20/2047 | | | | 5,679,798 | |
4,548,950 | | Loanpal Solar Loan Ltd., Series 2021-1GS-A | | | 2.29 | % (k) | | | 01/20/2048 | | | | 3,601,944 | |
7,740,000 | | ME Funding LLC, Series 2019-1-A2 | | | 6.45 | % (k) | | | 07/30/2049 | | | | 7,592,990 | |
730,165 | | Mosaic Solar Loan Trust, Series 2017-1A-A | | | 4.45 | % (k) | | | 06/20/2042 | | | | 702,602 | |
5,665,812 | | Mosaic Solar Loan Trust, Series 2020-2A-B | | | 2.21 | % (k) | | | 08/20/2046 | | | | 4,860,987 | |
4,500,000 | | Navient Private Education Loan Trust, Series 2018-A-B | | | 3.68 | % (k) | | | 02/18/2042 | | | | 4,260,082 | |
6,584,302 | | Pagaya AI Debt Selection Trust, Series 2021-2-NOTE | | | 3.00 | % (k) | | | 01/25/2029 | | | | 6,287,066 | |
7,499,116 | | Pagaya AI Debt Selection Trust, Series 2021-5-B | | | 2.63 | % (k) | | | 08/15/2029 | | | | 6,899,144 | |
8,498,998 | | Pagaya AI Debt Selection Trust, Series 2021-5-C | | | 3.93 | % (k) | | | 08/15/2029 | | | | 7,324,900 | |
16,647,798 | | Pagaya AI Debt Selection Trust, Series 2022-1-B | | | 3.34 | % (k) | | | 10/15/2029 | | | | 15,125,074 | |
9,189,700 | | Purewest Funding LLC, Series 2021-1-A1 | | | 4.09 | % (k) | | | 12/22/2036 | | | | 8,776,443 | |
7,000,000 | | Santander Drive Auto Receivables Trust, Series 2020-4-D | | | 1.48 | % | | | 01/15/2027 | | | | 6,740,488 | |
16,269,489 | | Sapphire Aviation Finance Ltd., Series 2020-1A-A | | | 3.23 | % (k) | | | 03/15/2040 | | | | 13,473,561 | |
2,056,860 | | Sierra Timeshare Receivables Funding LLC, Series 2021-2A-C | | | 1.95 | % (k) | | | 09/20/2038 | | | | 1,861,702 | |
15,513,858 | | SoFi Alternative Consumer Loan Program, Series 2021-2-A | | | 1.25 | % (k) | | | 08/15/2030 | | | | 14,790,726 | |
12,505,338 | | SoFi Alternative Trust, Series 2021-1-PT1 | | | 9.72 | % (a)(k) | | | 05/25/2030 | | | | 12,315,594 | |
26,075,370 | | SoFi Alternative Trust, Series 2021-3-A | | | 1.50 | % (k) | | | 11/15/2030 | | | | 24,793,453 | |
98,640 | | SoFi Professional Loan Program LLC, Series 2017-A-A2B | | | 2.40 | % (k) | | | 03/26/2040 | | | | 98,050 | |
2,624,526 | | Start Ltd., Series 2018-1-A | | | 4.09 | % (k) | | | 05/15/2043 | | | | 2,283,702 | |
5,925,000 | | Taco Bell Funding LLC, Series 2021-1A-A2I | | | 1.95 | % (k) | | | 08/25/2051 | | | | 5,170,473 | |
3,392,500 | | TAL Advantage LLC, Series 2020-1A-A | | | 2.05 | % (k) | | | 09/20/2045 | | | | 3,031,141 | |
8,000,000 | | Theorem Funding Trust, Series 2021-1A-B | | | 1.84 | % (k) | | | 12/15/2027 | | | | 7,578,558 | |
9,843,787 | | Thunderbolt Aircraft Lease Ltd., Series 2018-A-A | | | 4.15 | % (k)(l) | | | 09/15/2038 | | | | 8,279,865 | |
6,234,375 | | TIF Funding LLC, Series 2021-1A-A | | | 1.65 | % (k) | | | 02/20/2046 | | | | 5,267,587 | |
3,847,376 | | Upgrade Master Pass-Thru Trust, Series 2021-PT3-A | | | 14.42 | % (a)(k) | | | 07/15/2027 | | | | 3,727,176 | |
2,150,252 | | Upstart Pass-Through Trust, Series 2020-ST5-A | | | 3.00 | % (k) | | | 12/20/2026 | | | | 2,059,660 | |
3,797,799 | | Upstart Pass-Through Trust, Series 2020-ST6-A | | | 3.00 | % (k) | | | 01/20/2027 | | | | 3,628,708 | |
1,769,412 | | Upstart Pass-Through Trust, Series 2021-ST3-A | | | 2.00 | % (k) | | | 05/20/2027 | | | | 1,666,718 | |
1,439,298 | | Upstart Securitization Trust, Series 2021-1-B | | | 1.89 | % (k) | | | 03/20/2031 | | | | 1,421,250 | |
7,170,000 | | Upstart Securitization Trust, Series 2021-2-B | | | 1.75 | % (k) | | | 06/20/2031 | | | | 6,847,187 | |
3,000,000 | | Upstart Securitization Trust, Series 2021-3-B | | | 1.66 | % (k) | | | 07/20/2031 | | | | 2,856,367 | |
6,245,168 | | Willis Engine Structured Trust, Series 2020-A-A | | | 3.23 | % (k) | | | 03/15/2045 | | | | 4,584,641 | |
| | | | | | | | | | | | | | |
Total Asset Backed Obligations (Cost $342,205,880) | | | | | | | | | | | 311,346,611 | |
| | | | | | | | | | | | | | |
Bank Loans - 7.4% | |
12,362,707 | | 1011778 B.C. Unlimited Liability Company, Senior Secured First Lien Term Loan (1 Month LIBOR USD + 1.75%) | | | 6.59 | % | | | 11/19/2026 | | | | 12,264,857 | |
7,929,200 | | Ali Group North America Corporation, Senior Secured First Lien (1 Month Secured Overnight Financing Rate + 2.00%) | | | 6.92 | % | | | 07/30/2029 | | | | 7,828,103 | |
362,545 | | Alliance Laundry Systems LLC, Senior Secured First Lien Term Loan (3 Month LIBOR USD + 3.50%, 0.75% Floor) | | | 8.31 | % | | | 10/08/2027 | | | | 360,052 | |
315,000 | | Almonde, Inc., Senior Secured Second Lien Term Loan (3 Month LIBOR USD + 7.25%, 1.00% Floor) | | | 12.08 | % | | | 06/16/2025 | | | | 255,723 | |
339,500 | | American Airlines, Inc., Senior Secured First Lien Term Loan (6 Month LIBOR USD + 3.50%) | | | 8.26 | % | | | 01/29/2027 | | | | 332,163 | |
1,270,009 | | Api Group DE, Inc., Senior Secured First Lien Term Loan (1 Month LIBOR USD + 0.00%) | | | 4.84 | % | | | 10/01/2026 | | | | 1,270,803 | |
1,725,000 | | Aramark Services, Inc., Senior Secured First Lien Term Loan (1 Month LIBOR USD + 1.75%) | | | 6.59 | % | | | 03/11/2025 | | | | 1,723,387 | |
694,713 | | Aramark Services, Inc., Senior Secured First Lien Term Loan (1 Month LIBOR USD + 1.75%) | | | 6.59 | % | | | 01/15/2027 | | | | 687,769 | |
10,134,142 | | Asplundh Tree Expert LLC, Senior Secured First Lien Term Loan (1 Month LIBOR USD + 1.75%) | | | 6.59 | % | | | 09/07/2027 | | | | 10,096,139 | |
8,838,275 | | Avantor Funding, Inc., Senior Secured First Lien Term Loan (1 Month LIBOR USD + 2.25%, 0.50% Floor) | | | 7.09 | % | | | 11/08/2027 | | | | 8,843,136 | |
4,716,250 | | Axalta Coating Systems US Holdings, Inc. (1 Month Secured Overnight Financing Rate + 3.00%, 0.50% Floor) | | | 7.90 | % | | | 12/20/2029 | | | | 4,729,031 | |
6,028,965 | | Berry Global, Inc., Senior Secured First Lien Term Loan (1 Month LIBOR USD + 1.75%) | | | 6.51 | % | | | 07/01/2026 | | | | 6,015,792 | |
5,042,154 | | Cable One, Inc., Senior Secured First Lien Term Loan (1 Month LIBOR USD + 2.00%) | | | 6.84 | % | | | 05/03/2028 | | | | 4,931,856 | |
2,903,391 | | Calpine Corporation, Senior Secured First Lien Term Loan (1 Month LIBOR USD + 2.00%) | | | 6.85 | % | | | 04/06/2026 | | | | 2,889,977 | |
154,400 | | Calpine Corporation, Senior Secured First Lien Term Loan (1 Month LIBOR USD + 2.00%) | | | 6.84 | % | | | 08/12/2026 | | | | 153,670 | |
6,226,451 | | Calpine Corporation, Senior Secured First Lien Term Loan (1 Month LIBOR USD + 2.50%) | | | 7.35 | % | | | 12/16/2027 | | | | 6,207,990 | |
4,425,960 | | Catalent Pharma Solutions, Inc., Senior Secured First Lien Term Loan (1 Month LIBOR USD + 2.00%, 0.50% Floor) | | | 6.81 | % | | | 02/22/2028 | | | | 4,399,957 | |
11,984,710 | | Charter Communications Operating LLC, Senior Secured First Lien Term Loan (1 Month Secured Overnight Financing Rate + 1.75%) | | | 6.56 | % | | | 02/01/2027 | | | | 11,892,967 | |
3,796,938 | | Clean Harbors, Inc., Senior Secured First Lien Term Loan (1 Month LIBOR USD + 2.00%) | | | 6.84 | % | | | 10/09/2028 | | | | 3,818,295 | |
431,650 | | Connect US Finco LLC, Senior Secured First Lien Term Loan (1 Month LIBOR USD + 3.50%, 1.00% Floor) | | | 8.14 | % | | | 12/11/2026 | | | | 429,628 | |
672,750 | | Conservice Midco LLC, Senior Secured First Lien Term Loan (1 Month LIBOR USD + 4.25%) | | | 9.09 | % | | | 05/13/2027 | | | | 662,800 | |
456,966 | | Cyanco Intermediate Corporation, Senior Secured First Lien Term Loan (1 Month LIBOR USD + 3.50%) | | | 8.34 | % | | | 03/17/2025 | | | | 445,771 | |
1,156,142 | | Cyxtera DC Holdings, Inc., Senior Secured First Lien Term Loan (3 Month LIBOR USD + 3.00%, 1.00% Floor) | | | 7.82 | % | | | 05/01/2024 | | | | 945,632 | |
406,413 | | Diamond Sports Group LLC, Senior Secured Second Lien Term Loan (3 Month Secured Overnight Financing Rate + 3.40%) | | | 8.03 | % (b) | | | 08/24/2026 | | | | 23,283 | |
5,935,172 | | Elanco Animal Health, Inc., Senior Secured First Lien Term Loan (1 Month LIBOR USD + 1.75%) | | | 6.41 | % | | | 07/30/2027 | | | | 5,815,964 | |
1,750,184 | | Element Solutions, Inc., Senior Secured First Lien Term Loan (1 Month Secured Overnight Financing Rate + 2.00%) | | | 6.81 | % | | | 01/30/2026 | | | | 1,750,341 | |
8,951,958 | | Energizer Holdings, Inc., Senior Secured First Lien Term Loan (1 Month Secured Overnight Financing Rate + 2.25%, 0.50% Floor) | | | 7.12 | % | | | 12/22/2027 | | | | 8,901,604 | |
622,670 | | Exgen Renewables LLC, Senior Secured First Lien Term Loan (3 Month LIBOR USD + 2.50%, 1.00% Floor) | | | 7.46 | % | | | 12/15/2027 | | | | 620,466 | |
697,366 | | First Advantage Holdings LLC, Senior Secured First Lien Term Loan (1 Month LIBOR USD + 2.75%) | | | 7.59 | % | | | 01/29/2027 | | | | 694,643 | |
12,431,228 | | Fleetcor Technologies Operating Company LLC, Senior Secured First Lien Term Loan (1 Month LIBOR USD + 1.75%) | | | 6.59 | % | | | 04/28/2028 | | | | 12,381,503 | |
3,771,136 | | Focus Financial Partners LLC, Senior Secured First Lien Term Loan (1 Month Secured Overnight Financing Rate + 2.50%, 0.50% Floor) | | | 7.31 | % | | | 06/30/2028 | | | | 3,720,640 | |
1,716,463 | | Froneri US, Inc., Senior Secured First Lien Term Loan (3 Month LIBOR USD + 2.25%) | | | 7.41 | % | | | 01/29/2027 | | | | 1,696,157 | |
383,133 | | Generac Power Systems, Inc., Senior Secured First Lien Term Loan (1 Month Secured Overnight Financing Rate + 1.75%) | | | 6.52 | % | | | 12/11/2026 | | | | 382,454 | |
11,307,130 | | Go Daddy Operating Company LLC (1 Month Secured Overnight Financing Rate + 3.25%) | | | 8.06 | % | | | 11/09/2029 | | | | 11,314,819 | |
991,950 | | Go Daddy Operating Company LLC, Senior Secured First Lien Term Loan (1 Month LIBOR USD + 2.00%) | | | 6.84 | % | | | 08/10/2027 | | | | 990,363 | |
2,378,074 | | Gray Television, Inc. (1 Month Secured Overnight Financing Rate + 2.50%) | | | 7.36 | % | | | 01/02/2026 | | | | 2,342,414 | |
1,420,886 | | Hilton Worldwide Finance LLC, Senior Secured First Lien Term Loan (1 Month Secured Overnight Financing Rate + 1.75%) | | | 6.64 | % | | | 06/22/2026 | | | | 1,421,625 | |
10,126,884 | | Horizon Therapeutics USA, Inc., Senior Secured First Lien Term Loan (1 Month LIBOR USD + 1.75%, 0.50% Floor) | | | 6.56 | % | | | 03/15/2028 | | | | 10,119,745 | |
451,053 | | Hyland Software, Inc., Senior Secured Second Lien Term Loan (1 Month LIBOR USD + 6.25%, 0.75% Floor) | | | 11.09 | % | | | 07/07/2025 | | | | 433,010 | |
8,024,444 | | ICON Luxembourg SARL, Senior Secured First Lien Term Loan (3 Month Secured Overnight Financing Rate + 2.25%, 0.50% Floor) | | | 7.41 | % | | | 07/03/2028 | | | | 8,014,975 | |
| | ICU Medical, Inc., Senior Secured First Lien Term Loan | | | | | | | | | | | | |
1,559,448 | | (3 Month Secured Overnight Financing Rate + 2.50%, 0.50% Floor) | | | 7.23 | % | | | 01/08/2029 | | | | 1,543,207 | |
212,652 | | (1 Month Secured Overnight Financing Rate + 2.50%, 0.50% Floor) | | | 7.22 | % | | | 01/08/2029 | | | | 210,437 | |
663,931 | | IHeartCommunications, Inc., Senior Secured First Lien Term Loan (1 Month LIBOR USD + 3.00%) | | | 7.84 | % | | | 05/01/2026 | | | | 590,534 | |
12,382,297 | | IQVIA, Inc., Senior Secured First Lien Term Loan (1 Month LIBOR USD + 1.75%) | | | 6.59 | % | | | 06/11/2025 | | | | 12,391,026 | |
13,104,411 | | Iron Mountain Information Management LLC, Senior Secured First Lien Term Loan (1 Month LIBOR USD + 1.75%) | | | 6.59 | % | | | 01/02/2026 | | | | 13,055,269 | |
4,634,217 | | KFC Holding Company, Senior Secured First Lien Term Loan (1 Month LIBOR USD + 1.75%) | | | 6.51 | % | | | 03/15/2028 | | | | 4,620,709 | |
426,949 | | Lions Gate Capital Holdings LLC, Senior Secured First Lien Term Loan (1 Month LIBOR USD + 2.25%) | | | 7.09 | % | | | 03/24/2025 | | | | 421,256 | |
264,123 | | Maravai Intermediate Holdings LLC, Senior Secured First Lien Term Loan (3 Month Secured Overnight Financing Rate + 3.00%, 0.50% Floor) | | | 7.63 | % | | | 10/19/2027 | | | | 263,298 | |
2,048,872 | | Marriott Ownership Resorts, Inc., Senior Secured First Lien Term Loan (1 Month LIBOR USD + 1.75%) | | | 6.59 | % | | | 08/29/2025 | | | | 2,045,030 | |
340,498 | | Nascar Holdings LLC, Senior Secured First Lien Term Loan (1 Month LIBOR USD + 2.50%) | | | 7.34 | % | | | 10/19/2026 | | | | 341,031 | |
465,206 | | NCR Corporation, Senior Secured First Lien Term Loan (3 Month LIBOR USD + 2.50%) | | | 7.33 | % | | | 08/28/2026 | | | | 459,777 | |
11,103,709 | | NortonLifeLock, Inc., Senior Secured First Lien (1 Month Secured Overnight Financing Rate + 2.00%, 0.50% Floor) | | | 6.91 | % | | | 09/12/2029 | | | | 11,007,939 | |
485,100 | | PAI HoldCo, Inc., Senior Secured First Lien Term Loan (3 Month LIBOR USD + 3.75%, 0.75% Floor) | | | 8.58 | % | | | 10/28/2027 | | | | 456,450 | |
481,378 | | PCI Gaming Authority, Senior Secured First Lien Term Loan (1 Month LIBOR USD + 2.50%) | | | 7.34 | % | | | 05/29/2026 | | | | 481,479 | |
114,101 | | Phoenix Services International LLC (1 Month Secured Overnight Financing Rate + 12.00%, 2.00% Floor) | | | 16.81 | % | | | 05/29/2023 | | | | 105,777 | |
53,989 | | Phoenix Services International LLC, Senior Secured First Lien Term Loan (1 Month Secured Overnight Financing Rate + 2.00% or 10.00% PIK, 2.00% Floor) | | | 16.81 | % | | | 05/29/2023 | | | | 51,964 | |
399,675 | | Phoenix Services International LLC, Senior Secured First Lien Term Loan (3 Month LIBOR USD + 3.75%, 1.00% Floor) | | | 2.92 | % (b) | | | 03/03/2025 | | | | 42,028 | |
12,391,935 | | Pilot Travel Centers LLC, Senior Secured First Lien Term Loan (1 Month Secured Overnight Financing Rate + 2.00%) | | | 6.91 | % | | | 08/04/2028 | | | | 12,366,098 | |
445,900 | | PointClickCare Technologies, Inc., Senior Secured First Lien Term Loan (1 Month LIBOR USD + 3.00%, 0.75% Floor) | | | 7.88 | % | | | 12/29/2027 | | | | 440,326 | |
2,125,794 | | PRA Health Sciences, Inc., Senior Secured First Lien Term Loan (3 Month LIBOR USD + 2.25%, 0.50% Floor) | | | 7.00 | % | | | 07/03/2028 | | | | 2,123,286 | |
112,512 | | Rentpath, Inc., Senior Secured First Lien Term Loan (Prime Rate + 0.00%) | | | 3.25 | % | | | 04/25/2024 | | | | 1,688 | |
12,361,174 | | Reynolds Consumer Products LLC, Senior Secured First Lien Term Loan (1 Month Secured Overnight Financing Rate + 1.75%) | | | 6.47 | % | | | 02/04/2027 | | | | 12,286,698 | |
1,824,034 | | Select Medical Corporation, Senior Secured First Lien Term Loan (1 Month LIBOR USD + 2.50%) | | | 7.35 | % | | | 03/06/2025 | | | | 1,820,386 | |
10,365,000 | | Setanta Aircraft Leasing DAC, Senior Secured First Lien Term Loan (3 Month LIBOR USD + 2.00%) | | | 7.16 | % | | | 11/02/2028 | | | | 10,376,661 | |
612,750 | | SkyMiles IP Ltd., Senior Secured First Lien Term Loan (3 Month LIBOR USD + 3.75%, 1.00% Floor) | | | 8.56 | % | | | 10/20/2027 | | | | 636,038 | |
1,388,713 | | SMG US Midco, Inc., Senior Secured First Lien Term Loan (3 Month LIBOR USD + 2.50%) | | | 7.33 | % | | | 01/23/2025 | | | | 1,377,950 | |
1,877,631 | | Sound Inpatient Physicians, Inc., Senior Secured First Lien Term Loan (3 Month LIBOR USD + 3.00%) | | | 7.83 | % | | | 06/27/2025 | | | | 1,479,217 | |
3,889,615 | | SS&C Technologies, Inc., Senior Secured First Lien Term Loan (1 Month LIBOR USD + 1.75%) | | | 6.59 | % | | | 04/16/2025 | | | | 3,885,006 | |
7,259,929 | | Standard Industries, Inc., Senior Secured First Lien Term Loan (1 Month Secured Overnight Financing Rate + 2.25%, 0.50% Floor) | | | 7.12 | % | | | 09/22/2028 | | | | 7,233,176 | |
11,864,904 | | Stars Group Holdings B.V., Senior Secured First Lien Term Loan (3 Month LIBOR USD + 2.25%) | | | 7.41 | % | | | 07/21/2026 | | | | 11,872,972 | |
392,931 | | Sunshine Luxembourg SARL, Senior Secured First Lien Term Loan (3 Month LIBOR USD + 3.75%, 0.75% Floor) | | | 8.91 | % | | | 10/01/2026 | | | | 389,770 | |
6,785,474 | | Trans Union LLC, Senior Secured First Lien Term Loan (1 Month LIBOR USD + 1.75%) | | | 6.59 | % | | | 11/13/2026 | | | | 6,749,137 | |
3,964,254 | | Trans Union LLC, Senior Secured First Lien Term Loan (1 Month LIBOR USD + 2.25%, 0.50% Floor) | | | 7.09 | % | | | 12/01/2028 | | | | 3,941,123 | |
165,919 | | United Natural Foods, Inc., Senior Secured First Lien Term Loan (1 Month Secured Overnight Financing Rate + 3.25%) | | | 8.17 | % | | | 10/22/2025 | | | | 166,230 | |
2,863,988 | | Univar Solutions USA, Inc., Senior Secured First Lien Term Loan (1 Month LIBOR USD + 1.75%) | | | 6.59 | % | | | 06/02/2028 | | | | 2,865,777 | |
333,788 | | Univar Solutions USA, Inc., Senior Secured First Lien Term Loan (1 Month LIBOR USD + 2.00%) | | | 6.84 | % | | | 07/01/2026 | | | | 333,996 | |
2,183,125 | | US Foods, Inc., Senior Secured First Lien Term Loan (1 Month LIBOR USD + 2.00%) | | | 6.91 | % | | | 09/14/2026 | | | | 2,176,073 | |
454,690 | | Victory Capital Holdings, Inc., Senior Secured First Lien Term Loan (3 Month Secured Overnight Financing Rate + 2.25%) | | | 6.95 | % | | | 07/01/2026 | | | | 452,758 | |
2,694,290 | | Virgin Media Bristol LLC, Senior Secured First Lien Term Loan (1 Month LIBOR USD + 2.50%) | | | 7.18 | % | | | 01/31/2028 | | | | 2,656,569 | |
| | Vistra Operations Company LLC, Senior Secured First Lien Term Loan | | | | | | | | | | | | |
2,468,688 | | (1 Month LIBOR USD + 1.75%) | | | 6.46 | % | | | 12/31/2025 | | | | 2,458,826 | |
9,893,074 | | (1 Month LIBOR USD + 1.75%) | | | 6.59 | % | | | 12/31/2025 | | | | 9,853,551 | |
2,182,375 | | Walker & Dunlop, Inc., Senior Secured First Lien Term Loan (1 Month Secured Overnight Financing Rate + 2.25%, 0.50% Floor) | | | 7.16 | % | | | 12/15/2028 | | | | 2,144,183 | |
10,162,934 | | WMG Acquisition Corporation, Senior Secured First Lien Term Loan (1 Month LIBOR USD + 2.13%) | | | 6.97 | % | | | 01/20/2028 | | | | 10,075,736 | |
235,000 | | Ziggo Financing Partnership, Senior Secured First Lien Term Loan (1 Month LIBOR USD + 2.50%) | | | 7.18 | % | | | 04/28/2028 | | | | 232,552 | |
| | | | | | | | | | | | | | |
Total Bank Loans (Cost $321,736,048) | | | | | | | | | | | 320,292,498 | |
| | | | | | | | | | | | | | |
Collateralized Loan Obligations - 17.2% | |
27,000,000 | | 37 Capital, Series 2021-1A-A (3 Month LIBOR USD + 1.20%, 1.20% Floor) | | | 5.99 | % (k) | | | 10/15/2034 | | | | 26,330,503 | |
12,250,000 | | Allegro Ltd., Series 2018-1A-A (3 Month LIBOR USD + 1.10%, 1.10% Floor) | | | 5.89 | % (k) | | | 06/13/2031 | | | | 12,064,616 | |
2,203,793 | | Anchorage Capital Ltd., Series 2014-3RA-A (3 Month LIBOR USD + 1.05%) | | | 5.85 | % (k) | | | 01/28/2031 | | | | 2,175,205 | |
23,000,000 | | Anchorage Capital Ltd., Series 2021-19A-A (3 Month LIBOR USD + 1.21%, 1.21% Floor) | | | 6.00 | % (k) | | | 10/15/2034 | | | | 22,480,117 | |
2,000,000 | | Atlas Senior Loan Fund Ltd., Series 2018-11A-B (3 Month LIBOR USD + 1.65%) | | | 6.47 | % (k) | | | 07/26/2031 | | | | 1,916,843 | |
10,000,000 | | Bain Capital Credit Ltd., Series 2019-1A-AR (3 Month LIBOR USD + 1.13%) | | | 5.93 | % (k) | | | 04/19/2034 | | | | 9,757,194 | |
29,500,000 | | Battalion Ltd., Series 2017-11A-AR (3 Month LIBOR USD + 1.15%, 1.15% Floor) | | | 5.97 | % (k) | | | 04/24/2034 | | | | 28,619,407 | |
10,000,000 | | Battalion Ltd., Series 2021-20A-A (3 Month LIBOR USD + 1.18%, 1.18% Floor) | | | 5.97 | % (k) | | | 07/15/2034 | | | | 9,752,684 | |
14,000,000 | | Benefit Street Partners Ltd., Series 2021-24A-A (3 Month LIBOR USD + 1.17%, 1.17% Floor) | | | 5.98 | % (k) | | | 10/20/2034 | | | | 13,654,056 | |
10,500,000 | | Bridge Street Ltd., Series 2021-1A-A1A (3 Month LIBOR USD + 1.23%, 1.23% Floor) | | | 6.04 | % (k) | | | 07/20/2034 | | | | 10,290,519 | |
9,850,000 | | Cathedral Lake Ltd., Series 2021-7RA-A (3 Month LIBOR USD + 1.31%, 1.31% Floor) | | | 6.10 | % (k) | | | 01/15/2032 | | | | 9,755,561 | |
20,000,000 | | Cathedral Lake Ltd., Series 2021-8A-A1 (3 Month LIBOR USD + 1.22%, 1.22% Floor) | | | 6.03 | % (k) | | | 01/20/2035 | | | | 19,517,158 | |
20,000,000 | | CBAM Ltd., Series 2017-2A-AR (3 Month LIBOR USD + 1.19%, 1.19% Floor) | | | 5.98 | % (k) | | | 07/17/2034 | | | | 19,453,470 | |
10,350,000 | | CFIP Ltd., Series 2017-1A-AR (3 Month LIBOR USD + 1.23%, 1.23% Floor) | | | 6.02 | % (k) | | | 10/18/2034 | | | | 10,095,966 | |
1,800,000 | | CIFC Funding Ltd., Series 2014-5A-BR2 (3 Month LIBOR USD + 1.80%, 1.80% Floor) | | | 6.59 | % (k) | | | 10/17/2031 | | | | 1,753,640 | |
25,000,000 | | CQS Ltd., Series 2021-1A-A (3 Month LIBOR USD + 1.22%, 1.22% Floor) | | | 6.03 | % (k) | | | 01/20/2035 | | | | 24,352,480 | |
11,000,000 | | CQS Ltd., Series 2021-1A-B (3 Month LIBOR USD + 1.88%, 1.88% Floor) | | | 6.69 | % (k) | | | 01/20/2035 | | | | 10,564,423 | |
25,000,000 | | Dryden Ltd., Series 2020-85A-AR (3 Month LIBOR USD + 1.15%, 1.15% Floor) | | | 5.94 | % (k) | | | 10/15/2035 | | | | 24,373,485 | |
20,000,000 | | Elevation Ltd., Series 2018-9A-A1 (3 Month LIBOR USD + 1.12%, 1.12% Floor) | | | 5.91 | % (k) | | | 07/15/2031 | | | | 19,707,618 | |
13,500,000 | | Gulf Stream Meridian Ltd., Series 2021-IIIA-A1 (3 Month LIBOR USD + 1.32%, 1.32% Floor) | | | 6.11 | % (k) | | | 04/15/2034 | | | | 13,228,352 | |
127,268 | | Halcyon Loan Advisors Funding Ltd., Series 2013-2A-D (3 Month LIBOR USD + 3.80%) | | | 8.61 | % (k) | | | 08/01/2025 | | | | 109,108 | |
9,500,000 | | Hayfin Ltd., Series 2018-8A-A (3 Month LIBOR USD + 1.12%, 1.12% Floor) | | | 5.93 | % (k) | | | 04/20/2031 | | | | 9,327,583 | |
6,500,000 | | Hayfin Ltd., Series 2018-8A-B (3 Month LIBOR USD + 1.48%, 1.48% Floor) | | | 6.29 | % (k) | | | 04/20/2031 | | | | 6,268,380 | |
15,000,000 | | Jamestown Ltd., Series 2016-9A-A1RR (3 Month LIBOR USD + 1.24%, 1.24% Floor) | | | 6.06 | % (k) | | | 07/25/2034 | | | | 14,677,560 | |
10,000,000 | | LCM LP, Series 17A-A2RR (3 Month LIBOR USD + 1.15%, 1.15% Floor) | | | 5.94 | % (k) | | | 10/15/2031 | | | | 9,830,164 | |
14,000,000 | | Logan Ltd., Series 2022-1A-B (Secured Overnight Financing Rate 3 Month + 2.05%, 2.05% Floor) | | | 6.70 | % (k) | | | 04/21/2035 | | | | 13,647,736 | |
3,000,000 | | Madison Park Funding Ltd., Series 2017-26A-BR (3 Month LIBOR USD + 1.60%) | | | 6.40 | % (k) | | | 07/29/2030 | | | | 2,949,752 | |
8,625,000 | | Marathon Ltd., Series 2017-9A-A2 (3 Month LIBOR USD + 1.75%) | | | 6.54 | % (k) | | | 04/15/2029 | | | | 8,492,450 | |
25,000,000 | | Marble Point Ltd., Series 2018-2A-A1R (3 Month LIBOR USD + 1.28%, 1.28% Floor) | | | 6.09 | % (k) | | | 01/20/2032 | | | | 24,617,312 | |
29,500,000 | | Marble Point Ltd., Series 2020-1A-A (3 Month LIBOR USD + 1.30%, 1.30% Floor) | | | 6.11 | % (k) | | | 04/20/2033 | | | | 28,858,493 | |
25,000,000 | | Marble Point Ltd., Series 2021-2A-A (3 Month LIBOR USD + 1.20%, 1.20% Floor) | | | 6.02 | % (k) | | | 07/25/2034 | | | | 24,354,890 | |
23,000,000 | | Marble Point Ltd., Series 2021-3A-A1 (3 Month LIBOR USD + 1.24%, 1.24% Floor) | | | 6.03 | % (k) | | | 10/17/2034 | | | | 22,296,888 | |
24,085,104 | | MKS Ltd., Series 2017-1A-AR (3 Month LIBOR USD + 1.00%, 1.00% Floor) | | | 5.81 | % (k) | | | 07/20/2030 | | | | 23,736,525 | |
6,500,000 | | MKS Ltd., Series 2017-2A-A (3 Month LIBOR USD + 1.19%, 1.19% Floor) | | | 6.00 | % (k) | | | 01/20/2031 | | | | 6,439,295 | |
10,000,000 | | MP Ltd., Series 2015-2A-ARR (3 Month LIBOR USD + 1.20%, 1.20% Floor) | | | 6.00 | % (k) | | | 04/28/2034 | | | | 9,696,101 | |
22,600,000 | | Nassau Ltd., Series 2018-IA-A (3 Month LIBOR USD + 1.15%) | | | 5.94 | % (k) | | | 07/15/2031 | | | | 22,143,998 | |
8,838,031 | | Northwoods Capital Ltd., Series 2017-16A-A (3 Month LIBOR USD + 1.27%) | | | 6.13 | % (k) | | | 11/15/2030 | | | | 8,764,107 | |
15,000,000 | | OFSI Fund Ltd., Series 2018-1A-A (3 Month LIBOR USD + 1.15%, 1.15% Floor) | | | 5.94 | % (k) | | | 07/15/2031 | | | | 14,786,820 | |
17,500,000 | | Palmer Square Ltd., Series 2021-2A-A (3 Month LIBOR USD + 1.15%, 1.15% Floor) | | | 5.94 | % (k) | | | 07/15/2034 | | | | 17,058,503 | |
15,000,000 | | Park Avenue Institutional Advisers Ltd., Series 2016-1A-A1R (3 Month LIBOR USD + 1.20%) | | | 6.12 | % (k) | | | 08/23/2031 | | | | 14,794,918 | |
14,000,000 | | Sandstone Peak Ltd., Series 2021-1A-A1 (3 Month LIBOR USD + 1.22%, 1.22% Floor) | | | 6.01 | % (k) | | | 10/15/2034 | | | | 13,679,131 | |
25,000,000 | | Sound Point Ltd., Series 2019-2A-AR (3 Month LIBOR USD + 1.17%, 1.17% Floor) | | | 5.96 | % (k) | | | 07/15/2034 | | | | 24,218,392 | |
11,000,000 | | Steele Creek Ltd., Series 2019-1A-BR (3 Month LIBOR USD + 1.80%, 1.80% Floor) | | | 6.59 | % (k) | | | 04/15/2032 | | | | 10,529,931 | |
18,000,000 | | Steele Creek Ltd., Series 2019-2A-AR (3 Month LIBOR USD + 1.17%, 1.17% Floor) | | | 5.96 | % (k) | | | 07/15/2032 | | | | 17,658,826 | |
9,000,000 | | Steele Creek Ltd., Series 2019-2A-BR (3 Month LIBOR USD + 1.85%, 1.85% Floor) | | | 6.64 | % (k) | | | 07/15/2032 | | | | 8,654,183 | |
20,000,000 | | Trimaran CAVU LLC, Series 2021-3A-A (3 Month LIBOR USD + 1.21%, 1.21% Floor) | | | 6.00 | % (k) | | | 01/18/2035 | | | | 19,453,298 | |
10,000,000 | | Venture Ltd., Series 2018-34A-A (3 Month LIBOR USD + 1.23%, 1.23% Floor) | | | 6.02 | % (k) | | | 10/15/2031 | | | | 9,849,294 | |
17,500,000 | | Wellfleet Ltd., Series 2020-1A-A1A (3 Month LIBOR USD + 1.31%, 1.31% Floor) | | | 6.10 | % (k) | | | 04/15/2033 | | | | 17,190,483 | |
15,990,000 | | Wellfleet Ltd., Series 2020-2A-AR (3 Month LIBOR USD + 1.22%, 1.22% Floor) | | | 6.01 | % (k) | | | 07/15/2034 | | | | 15,592,167 | |
25,000,000 | | Whitebox Ltd., Series 2021-3A-A1 (3 Month LIBOR USD + 1.22%, 1.22% Floor) | | | 6.01 | % (k) | | | 10/15/2034 | | | | 24,470,903 | |
6,000,000 | | Whitehorse Ltd., Series 2018-12A-A (3 Month LIBOR USD + 1.25%, 1.25% Floor) | | | 6.04 | % (k) | | | 10/15/2031 | | | | 5,923,804 | |
| | | | | | | | | | | | | | |
Total Collateralized Loan Obligations (Cost $756,776,030) | | | | | | | | | | | 739,914,292 | |
| | | | | | | | | | | | | | |
Foreign Corporate Bonds - 6.3% | |
1,605,825 | | Adani International Container Terminal Private Ltd. | | | 3.00 | % | | | 02/16/2031 | | | | 1,225,152 | |
2,600,000 | | Adani Ports & Special Economic Zone Ltd. | | | 3.38 | % | | | 07/24/2024 | | | | 2,408,900 | |
1,500,000 | | Adani Ports & Special Economic Zone Ltd. | | | 4.00 | % | | | 07/30/2027 | | | | 1,194,000 | |
4,305,000 | | AerCap Global Aviation Trust | | | 1.75 | % | | | 10/29/2024 | | | | 4,013,850 | |
3,850,000 | | AES Andes S.A. (5 Year CMT Rate + 4.92%) | | | 6.35 | % | | | 10/07/2079 | | | | 3,591,170 | |
4,425,831 | | AI Candelaria Spain S.A. | | | 7.50 | % | | | 12/15/2028 | | | | 4,042,621 | |
1,145,000 | | Avolon Holdings Funding Ltd. | | | 5.13 | % (k) | | | 10/01/2023 | | | | 1,134,791 | |
3,100,000 | | Banco Bilbao Vizcaya Argentaria Colombia S.A. | | | 4.88 | % | | | 04/21/2025 | | | | 2,962,826 | |
1,850,000 | | Banco Continental SAECA | | | 2.75 | % (k) | | | 12/10/2025 | | | | 1,643,965 | |
1,000,000 | | Banco Continental SAECA | | | 2.75 | % | | | 12/10/2025 | | | | 888,630 | |
5,700,000 | | Banco de Credito del Peru S.A. (5 Year CMT Rate + 2.45%) | | | 3.25 | % (k) | | | 09/30/2031 | | | | 4,923,012 | |
200,000 | | Banco de Credito del Peru S.A. (5 Year CMT Rate + 2.45%) | | | 3.25 | % | | | 09/30/2031 | | | | 172,737 | |
3,550,000 | | Banco de Credito del Peru S.A. (5 Year CMT Rate + 3.00%) | | | 3.13 | % | | | 07/01/2030 | | | | 3,198,601 | |
3,350,000 | | Banco Internacional del Peru S.A.A. Interbank (5 Year CMT Rate + 3.71%) | | | 4.00 | % | | | 07/08/2030 | | | | 3,075,769 | |
800,000 | | Banco Latinoamericano de Comercio Exterior S.A. | | | 2.38 | % | | | 09/14/2025 | | | | 736,794 | |
200,000 | | Banco Latinoamericano de Comercio Exterior S.A. | | | 2.38 | % (k) | | | 09/14/2025 | | | | 184,198 | |
2,200,000 | | Banco Mercantil del Norte S.A. (5 Year CMT Rate + 4.64%) | | | 5.88 | % (d) | | | 01/24/2027 | | | | 1,875,500 | |
3,600,000 | | Bancolombia S.A. (5 Year CMT Rate + 2.93%) | | | 6.91 | % | | | 10/18/2027 | | | | 3,296,700 | |
3,580,000 | | Bancolombia S.A. (5 Year CMT Rate + 2.94%) | | | 4.63 | % | | | 12/18/2029 | | | | 3,010,762 | |
4,800,000 | | Bank Hapoalim B.M. | | | 3.26 | % (a)(k) | | | 01/21/2032 | | | | 4,010,400 | |
4,050,000 | | Bank Leumi (5 Year CMT Rate + 1.63%) | | | 3.28 | % (k) | | | 01/29/2031 | | | | 3,535,205 | |
4,070,000 | | Bank of Montreal | | | 1.50 | % | | | 01/10/2025 | | | | 3,829,487 | |
2,015,000 | | Bank of Nova Scotia | | | 4.75 | % | | | 02/02/2026 | | | | 2,007,327 | |
4,150,000 | | Barclays PLC (1 Year CMT Rate + 0.80%) | | | 1.01 | % | | | 12/10/2024 | | | | 4,000,234 | |
2,080,000 | | BAT Capital Corporation | | | 2.79 | % | | | 09/06/2024 | | | | 2,006,311 | |
2,420,000 | | BAT International Finance PLC | | | 1.67 | % | | | 03/25/2026 | | | | 2,203,711 | |
200,000 | | BBVA Banco Continental S.A. (5 Year CMT Rate + 2.75%) | | | 5.25 | % | | | 09/22/2029 | | | | 192,982 | |
3,730,000 | | BBVA Bancomer S.A. (5 Year CMT Rate + 3.00%) | | | 5.35 | % | | | 11/12/2029 | | | | 3,505,166 | |
136,993 | | Bioceanico Sovereign Certificate Ltd. | | | 0.00 | % | | | 06/05/2034 | | | | 92,092 | |
3,980,000 | | BNP Paribas S.A. (3 Month LIBOR USD + 2.24%) | | | 4.71 | % (k) | | | 01/10/2025 | | | | 3,936,013 | |
4,155,000 | | BPCE S.A. | | | 2.38 | % (k) | | | 01/14/2025 | | | | 3,905,229 | |
4,800,000 | | Braskem Netherlands Finance B.V. (5 Year CMT Rate + 8.22%) | | | 8.50 | % | | | 01/23/2081 | | | | 4,784,400 | |
1,000,000 | | Camposol S.A. | | | 6.00 | % | | | 02/03/2027 | | | | 550,920 | |
2,560,000 | | Canadian Imperial Bank of Commerce | | | 0.45 | % | | | 06/22/2023 | | | | 2,531,927 | |
2,450,000 | | Canadian Imperial Bank of Commerce | | | 3.95 | % | | | 08/04/2025 | | | | 2,382,433 | |
4,280,000 | | Canadian Pacific Railway Company | | | 1.35 | % | | | 12/02/2024 | | | | 4,034,291 | |
700,000 | | Cencosud S.A. | | | 5.15 | % | | | 02/12/2025 | | | | 699,286 | |
5,600,000 | | Chile Electricity PEC S.p.A. | | | 0.00 | % (k) | | | 01/25/2028 | | | | 4,208,690 | |
4,000,000 | | Commonwealth Bank of Australia (Secured Overnight Financing Rate + 0.40%) | | | 4.94 | % (k) | | | 07/07/2025 | | | | 3,950,700 | |
2,850,000 | | Corporacion Financiera de Desarrollo S.A. (3 Month LIBOR USD + 5.61%) | | | 5.25 | % | | | 07/15/2029 | | | | 2,755,494 | |
800,000 | | Cosan Overseas Ltd. | | | 7.00 | % | | | 01/20/2027 | | | | 801,996 | |
1,100,000 | | CSN Steel S.L. | | | 7.63 | % | | | 04/17/2026 | | | | 1,101,226 | |
2,445,000 | | Daimler Trucks Finance North America LLC | | | 1.63 | % (k) | | | 12/13/2024 | | | | 2,315,129 | |
6,800,000 | | DBS Group Holdings Ltd. (5 Year CMT Rate + 1.10%) | | | 1.82 | % | | | 03/10/2031 | | | | 6,137,177 | |
517,764 | | Digicel Group Holdings Ltd. (5.00% + 3.00% PIK) | | | 8.00 | % (k) | | | 04/01/2025 | | | | 207,566 | |
201,586 | | Digicel Group Holdings Ltd. (7.00% PIK) | | | 7.00 | % (d)(k) | | | 04/17/2023 | | | | 23,453 | |
3,000,000 | | Ecopetrol S.A. | | | 4.13 | % | | | 01/16/2025 | | | | 2,920,805 | |
1,248,085 | | Empresa Electrica Angamos S.A. | | | 4.88 | % | | | 05/25/2029 | | | | 1,126,709 | |
2,256,240 | | Empresa Electrica Cochrane S.p.A. | | | 5.50 | % | | | 05/14/2027 | | | | 2,081,505 | |
100,000 | | Enbridge, Inc. | | | 4.00 | % | | | 10/01/2023 | | | | 99,261 | |
2,149,000 | | Enbridge, Inc. | | | 0.55 | % | | | 10/04/2023 | | | | 2,092,970 | |
1,960,000 | | Enbridge, Inc. | | | 2.50 | % | | | 02/14/2025 | | | | 1,877,992 | |
1,300,000 | | Equate Petrochemical B.V. | | | 4.25 | % | | | 11/03/2026 | | | | 1,264,186 | |
4,588,235 | | Fenix Power Peru S.A. | | | 4.32 | % | | | 09/20/2027 | | | | 4,235,500 | |
2,550,000 | | Freeport Indonesia PT | | | 4.76 | % | | | 04/14/2027 | | | | 2,493,678 | |
1,550,000 | | Freeport Indonesia PT | | | 4.76 | % (k) | | | 04/14/2027 | | | | 1,515,765 | |
700,000 | | Freeport-McMoRan, Inc. | | | 4.13 | % | | | 03/01/2028 | | | | 659,778 | |
3,646,850 | | Galaxy Pipeline Assets Bidco Ltd. | | | 1.75 | % | | | 09/30/2027 | | | | 3,400,445 | |
3,911,000 | | Glencore Funding LLC | | | 4.00 | % (k) | | | 04/16/2025 | | | | 3,819,131 | |
4,093,974 | | GNL Quintero S.A. | | | 4.63 | % | | | 07/31/2029 | | | | 3,924,443 | |
275,000 | | Gold Fields Orogen Holdings BVI Ltd. | | | 5.13 | % | | | 05/15/2024 | | | | 274,102 | |
2,000,000 | | Grupo de Inversiones Suramericana S.A. | | | 5.50 | % | | | 04/29/2026 | | | | 1,897,490 | |
728,456 | | Guara Notre SARL | | | 5.20 | % | | | 06/15/2034 | | | | 627,889 | |
3,995,000 | | HSBC Holdings PLC (Secured Overnight Financing Rate + 0.58%) | | | 1.16 | % | | | 11/22/2024 | | | | 3,877,893 | |
1,660,600 | | Hunt Oil Company of Peru LLC Sucursal Del Peru | | | 6.38 | % | | | 06/01/2028 | | | | 1,566,882 | |
1,000,000 | | Indonesia Asahan Aluminium Persero PT | | | 4.75 | % | | | 05/15/2025 | | | | 985,959 | |
2,836,000 | | Inkia Energy Ltd. | | | 5.88 | % | | | 11/09/2027 | | | | 2,618,033 | |
547,791 | | Interoceanica Finance Ltd. | | | 0.00 | % | | | 11/30/2025 | | | | 510,815 | |
35,034 | | Invepar Holdings | | | 0.00 | % (b)(c) | | | 12/30/2028 | | | | – | |
5,450,000 | | Itau Unibanco Holding S.A. (5 Year CMT Rate + 3.45%) | | | 3.88 | % | | | 04/15/2031 | | | | 4,848,013 | |
1,850,000 | | JDE Peet’s NV | | | 0.80 | % (k) | | | 09/24/2024 | | | | 1,724,931 | |
1,000,000 | | Korea Development Bank | | | 0.80 | % | | | 04/27/2026 | | | | 891,801 | |
3,800,000 | | Korea Development Bank | | | 1.00 | % | | | 09/09/2026 | | | | 3,371,316 | |
2,300,000 | | Korea Hydro & Nuclear Power Company Ltd. | | | 1.25 | % (k) | | | 04/27/2026 | | | | 2,063,986 | |
3,000,000 | | Korea Southern Power Company Ltd. | | | 0.75 | % (k) | | | 01/27/2026 | | | | 2,680,555 | |
3,500,000 | | KT Corporation | | | 1.00 | % | | | 09/01/2025 | | | | 3,191,252 | |
4,280,000 | | Lloyds Banking Group PLC (1 Year CMT Rate + 0.55%) | | | 0.70 | % | | | 05/11/2024 | | | | 4,253,244 | |
400,000 | | MEGlobal Canada ULC | | | 5.00 | % | | | 05/18/2025 | | | | 396,436 | |
4,400,000 | | MEGlobal Canada ULC | | | 5.00 | % (k) | | | 05/18/2025 | | | | 4,360,796 | |
600,000 | | Mercury Chile Holdco LLC | | | 6.50 | % | | | 01/24/2027 | | | | 567,000 | |
1,500,000 | | Mercury Chile Holdco LLC | | | 6.50 | % (k) | | | 01/24/2027 | | | | 1,417,500 | |
810,000 | | Millicom International Cellular S.A. | | | 6.63 | % | | | 10/15/2026 | | | | 774,931 | |
2,205,000 | | Millicom International Cellular S.A. | | | 5.13 | % | | | 01/15/2028 | | | | 1,971,689 | |
6,300,000 | | Minejesa Capital B.V. | | | 4.63 | % | | | 08/10/2030 | | | | 5,566,603 | |
4,846,000 | | Mitsubishi UFJ Financial Group, Inc. (3 Month LIBOR USD + 0.86%) | | | 5.68 | % | | | 07/26/2023 | | | | 4,844,459 | |
3,880,000 | | Mizuho Financial Group, Inc. (Secured Overnight Financing Rate + 0.96%) | | | 5.70 | % | | | 05/22/2026 | | | | 3,813,526 | |
750,000 | | Mong Duong Finance Holdings B.V. | | | 5.13 | % | | | 05/07/2029 | | | | 637,302 | |
800,000 | | Multibank, Inc. | | | 7.75 | % (k) | | | 02/03/2028 | | | | 801,520 | |
1,199,100 | | MV24 Capital B.V. | | | 6.75 | % | | | 06/01/2034 | | | | 1,105,810 | |
3,940,000 | | NatWest Group PLC (3 Month LIBOR USD + 1.55%) | | | 6.68 | % | | | 06/25/2024 | | | | 3,937,112 | |
750,000 | | ONGC Videsh Ltd. | | | 4.63 | % | | | 07/15/2024 | | | | 743,261 | |
700,000 | | ONGC Videsh Vankorneft Pte Ltd. | | | 3.75 | % | | | 07/27/2026 | | | | 665,945 | |
2,500,000 | | Orazul Energy Peru S.A. | | | 5.63 | % | | | 04/28/2027 | | | | 2,213,450 | |
400,000 | | Orbia Advance Corporation S.A.B. de C.V. | | | 1.88 | % | | | 05/11/2026 | | | | 356,651 | |
6,600,000 | | Oversea-Chinese Banking Corporation Ltd. (5 Year CMT Rate + 1.58%) | | | 1.83 | % | | | 09/10/2030 | | | | 6,057,843 | |
1,900,000 | | Oversea-Chinese Banking Corporation Ltd. (5 Year CMT Rate + 1.58%) | | | 1.83 | % (k) | | | 09/10/2030 | | | | 1,743,925 | |
700,000 | | Periama Holdings LLC | | | 5.95 | % | | | 04/19/2026 | | | | 663,446 | |
1,000,000 | | Pertamina Persero PT | | | 1.40 | % | | | 02/09/2026 | | | | 915,506 | |
200,000 | | Petrobras Global Finance B.V. | | | 7.38 | % | | | 01/17/2027 | | | | 206,249 | |
2,025,000 | | Royal Bank of Canada | | | 5.14 | % (f) | | | 01/20/2026 | | | | 1,987,537 | |
5,716,000 | | Sable International Finance Ltd. | | | 5.75 | % | | | 09/07/2027 | | | | 5,330,574 | |
1,650,000 | | Sasol Financing USA LLC | | | 4.38 | % | | | 09/18/2026 | | | | 1,493,365 | |
2,900,000 | | Sociedad Quimica y Minera de Chile S.A. | | | 4.38 | % | | | 01/28/2025 | | | | 2,851,928 | |
4,055,000 | | Sumitomo Mitsui Trust Bank Ltd. | | | 0.80 | % (k) | | | 09/12/2023 | | | | 3,971,564 | |
6,500,000 | | TNB Global Ventures Capital BHD | | | 3.24 | % | | | 10/19/2026 | | | | 6,120,725 | |
3,040,000 | | Toronto-Dominion Bank | | | 0.70 | % | | | 09/10/2024 | | | | 2,859,699 | |
2,820,000 | | TransCanada PipeLines Ltd. | | | 6.20 | % | | | 03/09/2026 | | | | 2,840,436 | |
1,500,000 | | Transportadora de Gas del Peru S.A. | | | 4.25 | % | | | 04/30/2028 | | | | 1,438,343 | |
4,045,000 | | UBS Group AG (1 Year CMT Rate + 0.83%) | | | 1.01 | % (k) | | | 07/30/2024 | | | | 3,965,168 | |
7,900,000 | | United Overseas Bank Ltd. (5 Year CMT Rate + 1.52%) | | | 1.75 | % | | | 03/16/2031 | | | | 7,088,868 | |
1,300,000 | | UPL Corporation Ltd. | | | 4.50 | % | | | 03/08/2028 | | | | 1,151,558 | |
1,500,000 | | Vedanta Resources Ltd. | | | 7.13 | % | | | 05/31/2023 | | | | 1,395,237 | |
200,000 | | Vedanta Resources Ltd. | | | 6.13 | % | | | 08/09/2024 | | | | 118,742 | |
2,825,000 | | Volkswagen Group of America Finance LLC | | | 0.88 | % (k) | | | 11/22/2023 | | | | 2,747,873 | |
4,445,000 | | VTR Comunicaciones S.p.A. | | | 5.13 | % | | | 01/15/2028 | | | | 2,749,269 | |
500,000 | | VTR Finance NV | | | 6.38 | % | | | 07/15/2028 | | | | 202,500 | |
| | | | | | | | | | | | | | |
Total Foreign Corporate Bonds (Cost $292,850,061) | | | | | | | | | | | 272,259,498 | |
| | | | | | | | | | | | | | |
Foreign Government Bonds, Foreign Agencies and Foreign Government Sponsored Corporations - 0.4% | |
2,700,000 | | Banco Nacional de Comercio Exterior (5 Year CMT Rate + 2.00%) | | | 2.72 | % | | | 08/11/2031 | | | | 2,281,060 | |
3,360,000 | | BOC Aviation Corporation | | | 1.63 | % (k) | | | 04/29/2024 | | | | 3,224,379 | |
9,600,000 | | Colombia Government International Bond | | | 4.50 | % | | | 01/28/2026 | | | | 9,226,199 | |
1,100,000 | | Perusahaan Perseroan Persero PT Perusahaan Listrik Negara | | | 4.13 | % | | | 05/15/2027 | | | | 1,054,350 | |
1,500,000 | | Republic of South Africa Government Bond | | | 4.88 | % | | | 04/14/2026 | | | | 1,458,949 | |
| | | | | | | | | | | | | | |
Total Foreign Government Bonds, Foreign Agencies and Foreign Government Sponsored Corporations (Cost $18,476,293) | | | | | | | | | | | 17,244,937 | |
| | | | | | | | | | | | | | |
Non-Agency Commercial Mortgage Backed Obligations - 12.0% | |
2,000,000 | �� | Alen Mortgage Trust, Series 2021-ACEN-B (1 Month LIBOR USD + 1.65%, 1.65% Floor) | | | 6.33 | % (k) | | | 04/15/2034 | | | | 1,708,715 | |
40,902,000 | | Arbor Multifamily Mortgage Securities Trust, Series 2020-MF1-XD | | | 0.55 | % (a)(g)(k) | | | 05/15/2053 | | | | 1,254,280 | |
112,931,419 | | Arbor Multifamily Mortgage Securities Trust, Series 2021-MF2-XA | | | 1.12 | % (a)(g)(k) | | | 06/15/2054 | | | | 7,388,154 | |
2,000,000 | | Arbor Realty Ltd., Series 2020-FL1-B (Secured Overnight Financing Rate 1 Month + 1.91%, 1.80% Floor) | | | 6.74 | % (k) | | | 02/15/2035 | | | | 1,978,782 | |
2,830,000 | | Arbor Realty Ltd., Series 2020-FL1-D (Secured Overnight Financing Rate 1 Month + 2.56%, 2.45% Floor) | | | 7.39 | % (k) | | | 02/15/2035 | | | | 2,742,477 | |
12,000,000 | | AREIT Trust, Series 2019-CRE3-C (Secured Overnight Financing Rate 1 Month + 2.01%, 1.90% Floor) | | | 6.67 | % (k) | | | 09/14/2036 | | | | 10,930,164 | |
1,251,000 | | AREIT Trust, Series 2019-CRE3-D (Secured Overnight Financing Rate 1 Month + 2.76%, 2.65% Floor) | | | 7.42 | % (k) | | | 09/14/2036 | | | | 1,112,961 | |
3,100,000 | | BAMLL Commercial Mortgage Securities Trust, Series 2021-JACX-C (1 Month LIBOR USD + 2.00%, 2.00% Floor) | | | 6.68 | % (k) | | | 09/15/2038 | | | | 2,808,612 | |
15,176,000 | | BBCMS Mortgage Trust, Series 2018-TALL-F (1 Month LIBOR USD + 3.24%, 3.24% Floor) | | | 8.07 | % (k) | | | 03/15/2037 | | | | 8,083,651 | |
11,001,000 | | BBCMS Mortgage Trust, Series 2019-BWAY-E (Secured Overnight Financing Rate 1 Month + 2.96%, 2.96% Floor) | | | 7.79 | % (k) | | | 11/15/2034 | | | | 4,818,460 | |
29,456,500 | | BBCMS Mortgage Trust, Series 2021-C10-XB | | | 1.02 | % (a)(g) | | | 07/15/2054 | | | | 1,864,016 | |
21,205,000 | | BBCMS Mortgage Trust, Series 2021-C10-XD | | | 1.70 | % (a)(g)(k) | | | 07/15/2054 | | | | 2,125,244 | |
6,840,228 | | BB-UBS Trust, Series 2012-TFT-TE | | | 3.56 | % (a)(c)(k) | | | 06/05/2030 | | | | 5,183,767 | |
8,000,000 | | BDS Ltd., Series 2021-FL10-A (1 Month LIBOR USD + 1.35%, 1.35% Floor) | | | 6.11 | % (k) | | | 12/16/2036 | | | | 7,897,352 | |
157,695,000 | | Benchmark Mortgage Trust, Series 2020-IG1-XA | | | 0.51 | % (a)(g) | | | 09/15/2043 | | | | 4,028,950 | |
165,041,500 | | BHMS Mortgage Trust, Series 2018-ATLS-XCP | | | 0.00 | % (a)(g)(k) | | | 07/15/2035 | | | | 1,650 | |
3,000,000 | | BPR Trust, Series 2021-TY-C (1 Month LIBOR USD + 1.70%, 1.70% Floor) | | | 6.38 | % (k) | | | 09/15/2038 | | | | 2,819,909 | |
8,040,000 | | BRSP Ltd., Series 2021-FL1-A (1 Month LIBOR USD + 1.15%, 1.15% Floor) | | | 5.91 | % (k) | | | 08/19/2038 | | | | 7,790,245 | |
13,968,000 | | BRSP Ltd., Series 2021-FL1-AS (1 Month LIBOR USD + 1.60%, 1.60% Floor) | | | 6.36 | % (k) | | | 08/19/2038 | | | | 13,348,757 | |
7,507,000 | | BSPRT Issuer Ltd., Series 2022-FL8-A (Secured Overnight Financing Rate 30 Day Average + 1.50%, 1.50% Floor) | | | 6.06 | % (k) | | | 02/15/2037 | | | | 7,345,567 | |
13,155,000 | | BSREP Commercial Mortgage Trust, Series 2021-DC-D (1 Month LIBOR USD + 1.90%, 1.90% Floor) | | | 6.59 | % (k) | | | 08/15/2038 | | | | 11,246,303 | |
101,539 | | BX Trust, Series 2018-EXCL-C (1 Month LIBOR USD + 1.98%, 1.98% Floor) | | | 6.66 | % (k) | | | 09/15/2037 | | | | 99,579 | |
2,915,000 | | BX Trust, Series 2021-VIEW-E (1 Month LIBOR USD + 3.60%, 3.60% Floor) | | | 8.28 | % (k) | | | 06/15/2036 | | | | 2,661,834 | |
6,029,069 | | Carbon Capital Commercial Mortgage Trust, Series 2019-FL2-B (1 Month LIBOR USD + 2.85%, 2.85% Floor) | | | 7.53 | % (k) | | | 10/15/2035 | | | | 5,006,096 | |
45,063,630 | | CD Commercial Mortgage Trust, Series 2017-CD3-XA | | | 0.96 | % (a)(g) | | | 02/10/2050 | | | | 1,284,453 | |
53,442,277 | | CD Commercial Mortgage Trust, Series 2017-CD4-XA | | | 1.23 | % (a)(g) | | | 05/10/2050 | | | | 2,050,281 | |
2,950,000 | | CD Commercial Mortgage Trust, Series 2017-CD6-C | | | 4.23 | % (a) | | | 11/13/2050 | | | | 2,458,128 | |
19,504,216 | | CFCRE Commercial Mortgage Trust, Series 2016-C4-XA | | | 1.61 | % (a)(g) | | | 05/10/2058 | | | | 712,210 | |
16,201,000 | | CFCRE Commercial Mortgage Trust, Series 2017-C8-XB | | | 0.90 | % (a)(g) | | | 06/15/2050 | | | | 510,299 | |
3,000,000 | | CHCP Ltd., Series 2021-FL1-AS (Secured Overnight Financing Rate 1 Month + 1.41%, 1.30% Floor) | | | 6.07 | % (k) | | | 02/15/2038 | | | | 2,879,859 | |
6,620,053 | | Citigroup Commercial Mortgage Trust, Series 2014-GC25-XA | | | 0.94 | % (a)(g) | | | 10/10/2047 | | | | 67,707 | |
4,416,243 | | Citigroup Commercial Mortgage Trust, Series 2015-GC27-XA | | | 1.31 | % (a)(g) | | | 02/10/2048 | | | | 77,219 | |
10,750,000 | | Citigroup Commercial Mortgage Trust, Series 2015-GC31-C | | | 4.04 | % (a) | | | 06/10/2048 | | | | 9,024,232 | |
17,601,114 | | Citigroup Commercial Mortgage Trust, Series 2016-GC36-XA | | | 1.21 | % (a)(g) | | | 02/10/2049 | | | | 457,976 | |
11,609,095 | | Citigroup Commercial Mortgage Trust, Series 2016-P3-XA | | | 1.66 | % (a)(g) | | | 04/15/2049 | | | | 385,929 | |
2,519,000 | | Citigroup Commercial Mortgage Trust, Series 2016-P4-B | | | 3.38 | % | | | 07/10/2049 | | | | 2,231,453 | |
11,909,012 | | Citigroup Commercial Mortgage Trust, Series 2016-P4-XA | | | 1.89 | % (a)(g) | | | 07/10/2049 | | | | 543,949 | |
11,233,543 | | Citigroup Commercial Mortgage Trust, Series 2017-P7-XA | | | 1.11 | % (a)(g) | | | 04/14/2050 | | | | 387,993 | |
19,958,000 | | CLNC Ltd., Series 2019-FL1-D (Secured Overnight Financing Rate 1 Month + 3.01%, 2.90% Floor) | | | 7.71 | % (k) | | | 08/20/2035 | | | | 19,039,593 | |
4,903,098 | | Commercial Mortgage Pass-Through Trust, Series 2013-CR10-XA | | | 0.59 | % (a)(g) | | | 08/10/2046 | | | | 1,203 | |
21,334,601 | | Commercial Mortgage Pass-Through Trust, Series 2013-CR12-XA | | | 1.13 | % (a)(g) | | | 10/10/2046 | | | | 53,618 | |
2,214,084 | | Commercial Mortgage Pass-Through Trust, Series 2014-CR17-XA | | | 0.95 | % (a)(g) | | | 05/10/2047 | | | | 14,701 | |
14,785,853 | | Commercial Mortgage Pass-Through Trust, Series 2015-CR22-XA | | | 0.82 | % (a)(g) | | | 03/10/2048 | | | | 183,643 | |
30,997,499 | | Commercial Mortgage Pass-Through Trust, Series 2015-CR25-XA | | | 0.80 | % (a)(g) | | | 08/10/2048 | | | | 480,830 | |
34,568,101 | | Commercial Mortgage Pass-Through Trust, Series 2015-CR27-XA | | | 0.91 | % (a)(g) | | | 10/10/2048 | | | | 630,761 | |
5,373,000 | | Commercial Mortgage Pass-Through Trust, Series 2015-DC1-C | | | 4.30 | % (a) | | | 02/10/2048 | | | | 4,524,237 | |
8,080,755 | | Commercial Mortgage Pass-Through Trust, Series 2015-DC1-XA | | | 0.98 | % (a)(g) | | | 02/10/2048 | | | | 104,307 | |
9,657,000 | | Commercial Mortgage Pass-Through Trust, Series 2015-LC21-B | | | 4.33 | % (a) | | | 07/10/2048 | | | | 9,125,750 | |
42,287,351 | | Commercial Mortgage Pass-Through Trust, Series 2015-LC21-XA | | | 0.65 | % (a)(g) | | | 07/10/2048 | | | | 482,021 | |
12,922,646 | | Commercial Mortgage Pass-Through Trust, Series 2016-DC2-XA | | | 0.93 | % (a)(g) | | | 02/10/2049 | | | | 266,427 | |
11,396,000 | | Commercial Mortgage Pass-Through Trust, Series 2018-HCLV-D (1 Month LIBOR USD + 2.28%, 2.18% Floor) | | | 6.96 | % (k) | | | 09/15/2033 | | | | 9,563,326 | |
25,431,217 | | CSAIL Commercial Mortgage Trust, Series 2015-C1-XA | | | 0.81 | % (a)(g) | | | 04/15/2050 | | | | 262,310 | |
2,907,046 | | CSAIL Commercial Mortgage Trust, Series 2016-C6-XA | | | 1.86 | % (a)(g) | | | 01/15/2049 | | | | 126,036 | |
122,764,292 | | CSAIL Commercial Mortgage Trust, Series 2021-C20-XA | | | 1.00 | % (a)(g) | | | 03/15/2054 | | | | 6,954,462 | |
9,873,828 | | CSMC Trust, Series 2014-USA-X1 | | | 0.54 | % (a)(g)(k) | | | 09/15/2037 | | | | 100,043 | |
6,295,000 | | CSMC Trust, Series 2020-NET-D | | | 3.70 | % (a)(k) | | | 08/15/2037 | | | | 5,642,203 | |
3,350,000 | | CSMC Trust, Series 2021-ADV-C (1 Month LIBOR USD + 2.30%, 2.30% Floor) | | | 6.99 | % (k) | | | 07/15/2038 | | | | 2,959,205 | |
16,359,816 | | DBJPM Mortgage Trust, Series 2016-C1-XA | | | 1.37 | % (a)(g) | | | 05/10/2049 | | | | 505,996 | |
2,433,468 | | FREMF Mortgage Trust, Series 2016-KF18-B (1 Month LIBOR USD + 5.50%, 5.50% Floor) | | | 10.17 | % (k) | | | 05/25/2026 | | | | 2,381,058 | |
124,762,277 | | FREMF Mortgage Trust, Series 2017-K67-X2B | | | 0.10 | % (g)(k) | | | 09/25/2049 | | | | 454,933 | |
1,401,628 | | FREMF Mortgage Trust, Series 2017-KF27-B (1 Month LIBOR USD + 4.35%, 4.35% Floor) | | | 9.02 | % (k) | | | 12/25/2026 | | | | 1,383,652 | |
2,481,119 | | FREMF Mortgage Trust, Series 2017-KF30-B (1 Month LIBOR USD + 3.25%, 3.25% Floor) | | | 7.92 | % (k) | | | 03/25/2027 | | | | 2,467,960 | |
845,940 | | FREMF Mortgage Trust, Series 2018-KF44-B (1 Month LIBOR USD + 2.15%, 2.15% Floor) | | | 6.82 | % (k) | | | 02/25/2025 | | | | 834,715 | |
1,225,145 | | FREMF Mortgage Trust, Series 2019-KF69-B (1 Month LIBOR USD + 2.30%, 2.30% Floor) | | | 6.97 | % (k) | | | 08/25/2029 | | | | 1,157,910 | |
3,250,000 | | FS Rialto, Series 2021-FL2-A (1 Month LIBOR USD + 1.22%, 1.22% Floor) | | | 5.95 | % (k) | | | 05/16/2038 | | | | 3,175,939 | |
10,700,000 | | Greystone Commercial Real Estate Notes, Series 2021-FL3-C (Secured Overnight Financing Rate 1 Month + 2.11%, 2.00% Floor) | | | 6.94 | % (k) | | | 07/15/2039 | | | | 10,027,505 | |
2,314,000 | | GS Mortgage Securities Corporation Trust, Series 2018-GS10-WLSD | | | 4.58 | % (a)(k) | | | 03/10/2033 | | | | 1,888,408 | |
2,893,000 | | GS Mortgage Securities Corporation Trust, Series 2018-GS10-WLSE | | | 4.58 | % (a)(k) | | | 03/10/2033 | | | | 2,293,438 | |
5,000,000 | | GS Mortgage Securities Corporation Trust, Series 2018-TWR-E (1 Month LIBOR USD + 2.35%, 2.10% Floor) | | | 7.03 | % (k) | | | 07/15/2031 | | | | 3,670,000 | |
5,000,000 | | GS Mortgage Securities Corporation Trust, Series 2018-TWR-F (1 Month LIBOR USD + 3.05%, 2.80% Floor) | | | 7.73 | % (k) | | | 07/15/2031 | | | | 3,475,000 | |
5,000,000 | | GS Mortgage Securities Corporation Trust, Series 2018-TWR-G (1 Month LIBOR USD + 4.17%, 3.93% Floor) | | | 8.86 | % (k) | | | 07/15/2031 | | | | 3,000,000 | |
10,950,000 | | GS Mortgage Securities Corporation Trust, Series 2021-ARDN-E (1 Month LIBOR USD + 3.35%, 3.35% Floor) | | | 8.03 | % (k) | | | 11/15/2036 | | | | 10,379,599 | |
3,407,776 | | GS Mortgage Securities Trust, Series 2014-GC24-XA | | | 0.70 | % (a)(g) | | | 09/10/2047 | | | | 24,701 | |
29,759,886 | | GS Mortgage Securities Trust, Series 2015-GC32-XA | | | 0.71 | % (a)(g) | | | 07/10/2048 | | | | 391,509 | |
8,527,764 | | GS Mortgage Securities Trust, Series 2015-GS1-XA | | | 0.76 | % (a)(g) | | | 11/10/2048 | | | | 141,924 | |
14,184,912 | | GS Mortgage Securities Trust, Series 2016-GS2-XA | | | 1.73 | % (a)(g) | | | 05/10/2049 | | | | 579,753 | |
24,785,428 | | GS Mortgage Securities Trust, Series 2016-GS3-XA | | | 1.20 | % (a)(g) | | | 10/10/2049 | | | | 794,574 | |
14,505,000 | | GSCG Trust, Series 2019-600C-E | | | 3.99 | % (a)(k) | | | 09/06/2034 | | | | 12,233,558 | |
6,339,000 | | JP Morgan Chase Commercial Mortgage Securities Trust, Series 2014-C20-B | | | 4.40 | % (a) | | | 07/15/2047 | | | | 5,794,880 | |
14,644,043 | | JP Morgan Chase Commercial Mortgage Securities Trust, Series 2015-JP1-XA | | | 0.89 | % (a)(g) | | | 01/15/2049 | | | | 291,099 | |
31,333,166 | | JP Morgan Chase Commercial Mortgage Securities Trust, Series 2016-JP4-XA | | | 0.58 | % (a)(g) | | | 12/15/2049 | | | | 508,327 | |
336,000 | | JP Morgan Chase Commercial Mortgage Securities Trust, Series 2018-WPT-CFX | | | 4.95 | % (k) | | | 07/05/2033 | | | | 281,736 | |
4,216,000 | | JP Morgan Chase Commercial Mortgage Securities Trust, Series 2019-UES-C | | | 4.34 | % (k) | | | 05/05/2032 | | | | 3,957,724 | |
4,314,000 | | JP Morgan Chase Commercial Mortgage Securities Trust, Series 2019-UES-D | | | 4.45 | % (a)(k) | | | 05/05/2032 | | | | 4,029,587 | |
5,040,000 | | JP Morgan Chase Commercial Mortgage Securities Trust, Series 2019-UES-E | | | 4.45 | % (a)(k) | | | 05/05/2032 | | | | 4,700,571 | |
5,287,000 | | JP Morgan Chase Commercial Mortgage Securities Trust, Series 2019-UES-F | | | 4.45 | % (a)(k) | | | 05/05/2032 | | | | 4,893,964 | |
5,775,000 | | JP Morgan Chase Commercial Mortgage Securities Trust, Series 2019-UES-G | | | 4.45 | % (a)(k) | | | 05/05/2032 | | | | 5,236,060 | |
11,575,000 | | JP Morgan Chase Commercial Mortgage Securities Trust, Series 2020-NNN-EFX | | | 3.97 | % (k) | | | 01/16/2037 | | | | 9,433,340 | |
6,273,797 | | JP Morgan Chase Commercial Mortgage Securities Trust, Series 2022-NLP-A (Secured Overnight Financing Rate 1 Month + 0.60%, 0.60% Floor) | | | 5.42 | % (k) | | | 04/15/2037 | | | | 5,927,391 | |
4,077,963 | | JPMBB Commercial Mortgage Securities Trust, Series 2014-C18-XA | | | 0.66 | % (a)(g) | | | 02/15/2047 | | | | 11,809 | |
1,500,000 | | JPMBB Commercial Mortgage Securities Trust, Series 2014-C23-B | | | 4.48 | % (a) | | | 09/15/2047 | | | | 1,418,024 | |
500,000 | | JPMBB Commercial Mortgage Securities Trust, Series 2014-C23-C | | | 4.48 | % (a) | | | 09/15/2047 | | | | 467,514 | |
4,240,000 | | JPMBB Commercial Mortgage Securities Trust, Series 2014-C23-D | | | 3.98 | % (a)(k) | | | 09/15/2047 | | | | 3,585,324 | |
16,201,187 | | JPMBB Commercial Mortgage Securities Trust, Series 2014-C25-XA | | | 0.81 | % (a)(g) | | | 11/15/2047 | | | | 160,204 | |
5,287,890 | | JPMBB Commercial Mortgage Securities Trust, Series 2015-C27-D | | | 3.80 | % (a)(k) | | | 02/15/2048 | | | | 3,639,225 | |
2,828,000 | | JPMBB Commercial Mortgage Securities Trust, Series 2015-C29-B | | | 4.12 | % (a) | | | 05/15/2048 | | | | 2,599,833 | |
13,197,399 | | JPMBB Commercial Mortgage Securities Trust, Series 2015-C29-XA | | | 0.56 | % (a)(g) | | | 05/15/2048 | | | | 125,114 | |
22,044,675 | | JPMBB Commercial Mortgage Securities Trust, Series 2015-C30-XA | | | 0.43 | % (a)(g) | | | 07/15/2048 | | | | 183,323 | |
9,383,970 | | JPMBB Commercial Mortgage Securities Trust, Series 2015-C31-XA | | | 0.81 | % (a)(g) | | | 08/15/2048 | | | | 149,045 | |
14,404,075 | | JPMBB Commercial Mortgage Securities Trust, Series 2015-C32-XA | | | 1.11 | % (a)(g) | | | 11/15/2048 | | | | 228,947 | |
7,942,000 | | KREF Ltd., Series 2021-FL2-B (1 Month LIBOR USD + 1.65%, 1.65% Floor) | | | 6.36 | % (k) | | | 02/15/2039 | | | | 7,413,102 | |
3,506,000 | | KREF Ltd., Series 2022-FL3-A (Secured Overnight Financing Rate 1 Month + 1.45%, 1.45% Floor) | | | 6.21 | % (k) | | | 02/17/2039 | | | | 3,457,309 | |
10,000,000 | | LCCM Trust, Series 2017-LC26-C | | | 4.71 | % (k) | | | 07/12/2050 | | | | 8,471,603 | |
6,367,000 | | LCCM Trust, Series 2021-FL3-AS (1 Month LIBOR USD + 1.80%, 1.80% Floor) | | | 6.48 | % (k) | | | 11/15/2038 | | | | 6,181,415 | |
2,400,000 | | LCCM Trust, Series 2021-FL3-B (1 Month LIBOR USD + 2.20%, 2.20% Floor) | | | 6.88 | % (k) | | | 11/15/2038 | | | | 2,258,134 | |
1,000,000 | | LoanCore Issuer Ltd., Series 2018-CRE1-C (1 Month LIBOR USD + 2.55%, 2.55% Floor) | | | 7.23 | % (k) | | | 05/15/2028 | | | | 1,006,192 | |
2,000,000 | | LoanCore Issuer Ltd., Series 2019-CRE2-B (1 Month LIBOR USD + 1.70%, 1.70% Floor) | | | 6.38 | % (k) | | | 05/15/2036 | | | | 1,990,356 | |
7,970,000 | | LoanCore Issuer Ltd., Series 2021-CRE5-A (1 Month LIBOR USD + 1.30%, 1.30% Floor) | | | 5.98 | % (k) | | | 07/15/2036 | | | | 7,810,186 | |
5,500,000 | | LoanCore Issuer Ltd., Series 2021-CRE6-A (1 Month LIBOR USD + 1.30%, 1.30% Floor) | | | 5.98 | % (k) | | | 11/15/2038 | | | | 5,378,829 | |
5,735,000 | | LoanCore Issuer Ltd., Series 2022-CRE7-A (Secured Overnight Financing Rate 30 Day Average + 1.55%, 1.55% Floor) | | | 6.11 | % (k) | | | 01/17/2037 | | | | 5,621,562 | |
6,170,357 | | LSTAR Commercial Mortgage Trust, Series 2016-4-XA | | | 1.69 | % (a)(g)(k) | | | 03/10/2049 | | | | 115,074 | |
64,084,973 | | LSTAR Commercial Mortgage Trust, Series 2017-5-X | | | 0.79 | % (a)(g)(k) | | | 03/10/2050 | | | | 1,218,569 | |
1,458,833 | | Merchants Bank of Indiana Multifamily Housing Mortgage Loan Trust, Series 2021-Q015-B (Secured Overnight Financing Rate 30 Day Average + 2.85%) | | | 7.41 | % (k) | | | 08/25/2024 | | | | 1,445,915 | |
5,150,000 | | MF1 Ltd., Series 2021-FL6-C (1 Month LIBOR USD + 1.85%, 1.85% Floor) | | | 6.56 | % (k) | | | 07/16/2036 | | | | 4,856,270 | |
3,890,000 | | MF1 Ltd., Series 2022-FL8-A (Secured Overnight Financing Rate 30 Day Average + 1.35%, 1.35% Floor) | | | 5.91 | % (k) | | | 02/19/2037 | | | | 3,799,004 | |
12,550,000 | | MF1 Ltd., Series 2022-FL8-AS (Secured Overnight Financing Rate 30 Day Average + 1.75%, 1.75% Floor) | | | 6.31 | % (k) | | | 02/19/2037 | | | | 12,139,431 | |
11,933,000 | | MFT Trust, Series 2020-ABC-D | | | 3.48 | % (a)(k) | | | 02/10/2042 | | | | 7,497,931 | |
3,575,000 | | MKT Mortgage Trust, Series 2020-525M-F | | | 2.94 | % (a)(k) | | | 02/12/2040 | | | | 1,920,481 | |
10,347,653 | | Morgan Stanley Bank of America Merrill Lynch Trust, Series 2012-CKSV-CK | | | 4.16 | % (a)(k) | | | 10/15/2030 | | | | 6,838,128 | |
2,219,370 | | Morgan Stanley Bank of America Merrill Lynch Trust, Series 2013-C12-XA | | | 0.66 | % (a)(g) | | | 10/15/2046 | | | | 1,779 | |
2,775,186 | | Morgan Stanley Bank of America Merrill Lynch Trust, Series 2014-C14-XA | | | 0.90 | % (a)(g) | | | 02/15/2047 | | | | 8,991 | |
500,000 | | Morgan Stanley Bank of America Merrill Lynch Trust, Series 2014-C18-C | | | 4.48 | % (a) | | | 10/15/2047 | | | | 465,733 | |
16,235,105 | | Morgan Stanley Bank of America Merrill Lynch Trust, Series 2016-C28-XA | | | 1.15 | % (a)(g) | | | 01/15/2049 | | | | 401,830 | |
711,000 | | Morgan Stanley Capital Trust, Series 2019-NUGS-F (1 Month LIBOR USD + 2.84%, 4.34% Floor) | | | 7.53 | % (k) | | | 12/15/2036 | | | | 482,607 | |
13,327,000 | | Morgan Stanley Capital Trust, Series 2019-PLND-E (1 Month LIBOR USD + 2.15%, 2.15% Floor) | | | 6.83 | % (k) | | | 05/15/2036 | | | | 10,782,886 | |
1,331,000 | | Morgan Stanley Capital Trust, Series 2019-PLND-F (1 Month LIBOR USD + 2.80%, 2.80% Floor) | | | 7.48 | % (k) | | | 05/15/2036 | | | | 879,152 | |
9,940,000 | | Natixis Commercial Mortgage Securities Trust, Series 2018-FL1-C (1 Month LIBOR USD + 2.20%, 2.20% Floor) | | | 6.88 | % (k) | | | 06/15/2035 | | | | 8,639,325 | |
8,191,000 | | Natixis Commercial Mortgage Securities Trust, Series 2020-2PAC-AMZ1 | | | 3.50 | % (a)(k) | | | 01/15/2037 | | | | 7,405,816 | |
4,742,000 | | Natixis Commercial Mortgage Securities Trust, Series 2020-2PAC-AMZ2 | | | 3.50 | % (a)(k) | | | 01/15/2037 | | | | 4,116,090 | |
1,500,000 | | SFO Commercial Mortgage Trust, Series 2021-555-C (1 Month LIBOR USD + 1.80%, 1.80% Floor) | | | 6.48 | % (k) | | | 05/15/2038 | | | | 1,251,857 | |
168,062,650 | | SLG Office Trust, Series 2021-OVA-X | | | 0.26 | % (a)(g)(k) | | | 07/15/2041 | | | | 2,671,524 | |
16,126,291 | | SMR Mortgage Trust, Series 2022-IND-A (Secured Overnight Financing Rate 1 Month + 1.65%, 1.65% Floor) | | | 6.48 | % (k) | | | 02/15/2039 | | | | 15,457,663 | |
459,000 | | STWD Ltd., Series 2019-FL1-C (Secured Overnight Financing Rate 1 Month + 2.06%, 1.95% Floor) | | | 6.72 | % (k) | | | 07/15/2038 | | | | 435,563 | |
8,744,000 | | STWD Ltd., Series 2019-FL1-D (Secured Overnight Financing Rate 1 Month + 2.46%, 2.35% Floor) | | | 7.12 | % (k) | | | 07/15/2038 | | | | 8,162,524 | |
6,400,000 | | STWD Ltd., Series 2021-FL2-A (1 Month LIBOR USD + 1.20%, 1.20% Floor) | | | 5.91 | % (k) | | | 04/18/2038 | | | | 6,200,160 | |
11,630,000 | | TRTX Issuer Ltd., Series 2022-FL5-A (Secured Overnight Financing Rate 30 Day Average + 1.65%, 1.65% Floor) | | | 6.21 | % (k) | | | 02/15/2039 | | | | 11,365,336 | |
1,500,000 | | UBS Commercial Mortgage Trust, Series 2017-C4-C | | | 4.54 | % (a) | | | 10/15/2050 | | | | 1,297,384 | |
76,832,680 | | UBS Commercial Mortgage Trust, Series 2018-C13-XA | | | 0.73 | % (a)(g) | | | 10/15/2051 | | | | 2,180,281 | |
6,009,000 | | UBS Commercial Mortgage Trust, Series 2018-C8-C | | | 4.69 | % (a) | | | 02/15/2051 | | | | 5,096,374 | |
1,067,000 | | UBS Commercial Mortgage Trust, Series 2018-C9-C | | | 4.95 | % (a) | | | 03/15/2051 | | | | 929,395 | |
1,488,824 | | VMC Finance LLC, Series 2019-FL3-D (1 Month LIBOR USD + 2.65%, 2.65% Floor) | | | 7.36 | % (k) | | | 09/15/2036 | | | | 1,361,332 | |
1,990,000 | | VMC Finance LLC, Series 2022-FL5-A (Secured Overnight Financing Rate 30 Day Average + 1.90%, 1.90% Floor) | | | 6.46 | % (k) | | | 02/18/2039 | | | | 1,967,189 | |
540,000 | | Wells Fargo Commercial Mortgage Trust, Series 2014-LC18-B | | | 3.96 | % | | | 12/15/2047 | | | | 509,746 | |
9,585,800 | | Wells Fargo Commercial Mortgage Trust, Series 2015-C27-XA | | | 0.84 | % (a)(g) | | | 02/15/2048 | | | | 115,507 | |
49,465,119 | | Wells Fargo Commercial Mortgage Trust, Series 2015-C30-XA | | | 0.88 | % (a)(g) | | | 09/15/2058 | | | | 837,395 | |
23,210,630 | | Wells Fargo Commercial Mortgage Trust, Series 2015-NXS2-XA | | | 0.60 | % (a)(g) | | | 07/15/2058 | | | | 257,427 | |
10,372,944 | | Wells Fargo Commercial Mortgage Trust, Series 2016-C33-XA | | | 1.57 | % (a)(g) | | | 03/15/2059 | | | | 371,762 | |
21,035,873 | | Wells Fargo Commercial Mortgage Trust, Series 2016-NXS6-XA | | | 1.58 | % (a)(g) | | | 11/15/2049 | | | | 834,956 | |
68,009,408 | | Wells Fargo Commercial Mortgage Trust, Series 2017-C38-XA | | | 0.97 | % (a)(g) | | | 07/15/2050 | | | | 2,114,195 | |
22,405,780 | | Wells Fargo Commercial Mortgage Trust, Series 2019-C52-XA | | | 1.60 | % (a)(g) | | | 08/15/2052 | | | | 1,609,353 | |
62,875,779 | | Wells Fargo Commercial Mortgage Trust, Series 2021-C59-XA | | | 1.53 | % (a)(g) | | | 04/15/2054 | | | | 5,346,038 | |
272,707 | | Wells Fargo Commercial Mortgage Trust, Series 2021-SAVE-D (1 Month LIBOR USD + 2.50%, 2.50% Floor) | | | 7.18 | % (k) | | | 02/15/2040 | | | | 244,157 | |
5,250,000 | | Wells Fargo Commercial Mortgage Trust, Series 2022-ONL-A | | | 3.86 | % (k) | | | 12/15/2039 | | | | 4,778,627 | |
2,101,343 | | WF-RBS Commercial Mortgage Trust, Series 2014-C19-XA | | | 0.96 | % (a)(g) | | | 03/15/2047 | | | | 10,745 | |
6,268,989 | | WF-RBS Commercial Mortgage Trust, Series 2014-C21-XA | | | 1.00 | % (a)(g) | | | 08/15/2047 | | | | 69,474 | |
| | | | | | | | | | | | | | |
Total Non-Agency Commercial Mortgage Backed Obligations (Cost $634,264,628) | | | | | | | | | | | 514,796,726 | |
| | | | | | | | | | | | | | |
Non-Agency Residential Collateralized Mortgage Obligations - 12.6% | |
5,077,429 | | ACE Securities Corporation Home Equity Loan Trust, Series 2006-CW1-A2D (1 Month LIBOR USD + 0.52%, 0.52% Floor) | | | 5.37 | % | | | 07/25/2036 | | | | 4,024,211 | |
7,275,256 | | ACE Securities Corporation Home Equity Loan Trust, Series 2007-WM1-A2B (1 Month LIBOR USD + 0.12%, 0.12% Floor) | | | 4.97 | % | | | 11/25/2036 | | | | 3,051,653 | |
4,996,484 | | Adjustable Rate Mortgage Trust, Series 2006-1-6A1 (1 Month LIBOR USD + 0.26%, 0.26% Floor) | | | 5.11 | % | | | 03/25/2036 | | | | 3,084,416 | |
4,846,690 | | AJAX Mortgage Loan Trust, Series 2021-C-A | | | 2.12 | % (k)(l) | | | 01/25/2061 | | | | 4,553,741 | |
2,338,224 | | American Home Mortgage Investment Trust, Series 2004-2-M1 (1 Month LIBOR USD + 0.90%, 0.90% Floor, 11.00% Cap) | | | 5.75 | % | | | 02/25/2044 | | | | 2,041,677 | |
6,000,000 | | Angel Oak Mortgage Trust LLC, Series 2019-1-M1 | | | 4.50 | % (a)(k) | | | 11/25/2048 | | | | 5,901,158 | |
2,503,339 | | Angel Oak Mortgage Trust LLC, Series 2020-2-A1A | | | 2.53 | % (a)(k) | | | 01/26/2065 | | | | 2,312,430 | |
465,267 | | Angel Oak Mortgage Trust LLC, Series 2020-6-A3 | | | 1.78 | % (a)(k) | | | 05/25/2065 | | | | 413,882 | |
7,940,622 | | Angel Oak Mortgage Trust LLC, Series 2021-7-A1 | | | 1.98 | % (a)(k) | | | 10/25/2066 | | | | 6,525,642 | |
1,103,970 | | Arroyo Mortgage Trust, Series 2019-1-A1 | | | 3.81 | % (a)(k) | | | 01/25/2049 | | | | 1,041,542 | |
609,611 | | Arroyo Mortgage Trust, Series 2019-2-A2 | | | 3.50 | % (a)(k) | | | 04/25/2049 | | | | 570,144 | |
4,525,257 | | Arroyo Mortgage Trust, Series 2019-3-A3 | | | 3.42 | % (a)(k) | | | 10/25/2048 | | | | 4,180,578 | |
1,065,067 | | Banc of America Funding Trust, Series 2006-7-T2A1 | | | 5.88 | % (a) | | | 10/25/2036 | | | | 911,894 | |
10,577,388 | | Banc of America Funding Trust, Series 2015-R2-4A2 (1 Month LIBOR USD + 0.17%, 0.17% Floor) | | | 3.81 | % (k) | | | 09/29/2036 | | | | 8,328,050 | |
2,170,225 | | Banc of America Funding Trust, Series 2015-R2-9A2 | | | 4.73 | % (f)(k) | | | 03/27/2036 | | | | 1,823,289 | |
1,108,151 | | Banc of America Mortgage Trust, Series 2005-I-2A5 | | | 3.84 | % (a) | | | 10/25/2035 | | | | 996,471 | |
2,403,581 | | Banc of America Mortgage Trust, Series 2007-3-1A1 | | | 6.00 | % | | | 09/25/2037 | | | | 2,100,094 | |
6,761,208 | | BCAP LLC Trust, Series 2009-RR4-7A2 | | | 6.00 | % (a)(k) | | | 03/26/2037 | | | | 2,910,559 | |
1,343,007 | | BCAP LLC Trust, Series 2012-RR1-3A4 | | | 5.50 | % (a)(k) | | | 10/26/2035 | | | | 908,125 | |
18,028 | | Bellemeade Ltd., Series 2018-3A-M1B (1 Month LIBOR USD + 1.85%, 1.85% Floor) | | | 6.70 | % (k) | | | 10/25/2028 | | | | 18,025 | |
17,678,569 | | BRAVO Residential Funding Trust, Series 2021-B-A1 | | | 2.12 | % (k)(l) | | | 04/01/2069 | | | | 16,781,836 | |
2,862,044 | | BRAVO Residential Funding Trust, Series 2021-NQM2-A3 | | | 1.44 | % (a)(k) | | | 03/25/2060 | | | | 2,692,381 | |
8,890,959 | | BRAVO Residential Funding Trust, Series 2022-RPL1-A1 | | | 2.75 | % (a)(k) | | | 09/25/2061 | | | | 7,870,336 | |
744,281 | | CHL Mortgage Pass-Through Trust, Series 2005-10-A2 | | | 5.50 | % | | | 05/25/2035 | | | | 615,612 | |
9,932,791 | | CHL Mortgage Pass-Through Trust, Series 2006-20-1A18 (1 Month LIBOR USD + 0.65%, 0.65% Floor, 6.00% Cap) | | | 5.50 | % | | | 02/25/2037 | | | | 3,926,831 | |
1,651,629 | | CHL Mortgage Pass-Through Trust, Series 2006-21-A10 | | | 5.75 | % | | | 02/25/2037 | | | | 817,774 | |
560,047 | | CHL Mortgage Pass-Through Trust, Series 2007-14-A15 | | | 6.50 | % | | | 09/25/2037 | | | | 331,203 | |
1,768,584 | | Citigroup Mortgage Loan Trust, Series 2020-EXP1-A1A | | | 1.80 | % (a)(k) | | | 05/25/2060 | | | | 1,612,392 | |
647,995 | | CitiMortgage Alternative Loan Trust, Series 2007-A5-1A10 | | | 5.75 | % | | | 05/25/2037 | | | | 584,686 | |
176,304 | | COLT Mortgage Loan Trust, Series 2020-3-A3 | | | 2.38 | % (a)(k) | | | 04/27/2065 | | | | 165,185 | |
3,133,349 | | COLT Mortgage Loan Trust, Series 2021-1R-A1 | | | 0.86 | % (a)(k) | | | 05/25/2065 | | | | 2,644,283 | |
5,769,903 | | COLT Mortgage Loan Trust, Series 2021-5-A1 | | | 1.73 | % (a)(k) | | | 11/26/2066 | | | | 4,879,617 | |
6,287,026 | | COLT Mortgage Loan Trust, Series 2022-2-A1 | | | 2.99 | % (k)(l) | | | 02/25/2067 | | | | 5,654,568 | |
313,865 | | Countrywide Alternative Loan Trust, Series 2005-23CB-A15 | | | 5.50 | % | | | 07/25/2035 | | | | 266,444 | |
1,067,837 | | Countrywide Alternative Loan Trust, Series 2005-28CB-1A6 | | | 5.50 | % | | | 08/25/2035 | | | | 923,718 | |
4,248,772 | | Countrywide Alternative Loan Trust, Series 2005-49CB-A6 | | | 5.50 | % | | | 11/25/2035 | | | | 2,917,625 | |
1,569,572 | | Countrywide Alternative Loan Trust, Series 2005-61-1A2 (1 Month LIBOR USD + 0.74%, 0.74% Floor) | | | 5.59 | % | | | 12/25/2035 | | | | 1,296,131 | |
7,644,981 | | Countrywide Alternative Loan Trust, Series 2005-62-1A1 (1 Month LIBOR USD + 0.60%, 0.60% Floor) | | | 5.45 | % | | | 12/25/2035 | | | | 5,571,755 | |
7,820,336 | | Countrywide Alternative Loan Trust, Series 2006-16CB-A5 | | | 6.00 | % | | | 06/25/2036 | | | | 4,483,013 | |
1,508,286 | | Countrywide Alternative Loan Trust, Series 2006-32CB-A21 | | | 5.50 | % | | | 11/25/2036 | | | | 906,751 | |
2,253,871 | | Countrywide Alternative Loan Trust, Series 2006-34-A6 | | | 6.25 | % | | | 11/25/2046 | | | | 1,153,979 | |
5,697,550 | | Countrywide Alternative Loan Trust, Series 2006-36T2-1A3 | | | 5.75 | % | | | 12/25/2036 | | | | 2,527,409 | |
1,413,632 | | Countrywide Alternative Loan Trust, Series 2006-J4-2A9 | | | 6.00 | % | | | 07/25/2036 | | | | 892,375 | |
1,548,465 | | Countrywide Alternative Loan Trust, Series 2006-J6-A5 | | | 6.00 | % | | | 09/25/2036 | | | | 860,624 | |
2,921,277 | | Countrywide Alternative Loan Trust, Series 2006-OA12-A1B (1 Month LIBOR USD + 0.19%, 0.19% Floor) | | | 4.95 | % | | | 09/20/2046 | | | | 2,816,999 | |
4,007,739 | | Countrywide Alternative Loan Trust, Series 2006-OA21-A1 (1 Month LIBOR USD + 0.19%, 0.19% Floor) | | | 4.95 | % | | | 03/20/2047 | | | | 3,264,932 | |
11,322,796 | | Countrywide Alternative Loan Trust, Series 2007-12T1-A11 | | | 6.00 | % | | | 06/25/2037 | | | | 5,644,150 | |
10,158,411 | | Countrywide Alternative Loan Trust, Series 2007-12T1-A5 | | | 6.00 | % | | | 06/25/2037 | | | | 5,063,731 | |
296,554 | | Countrywide Alternative Loan Trust, Series 2007-15CB-A7 | | | 6.00 | % | | | 07/25/2037 | | | | 191,276 | |
4,337,669 | | Countrywide Alternative Loan Trust, Series 2007-8CB-A1 | | | 5.50 | % | | | 05/25/2037 | | | | 2,454,050 | |
10,910,594 | | Countrywide Alternative Loan Trust, Series 2007-9T1-1A6 | | | 6.00 | % | | | 05/25/2037 | | | | 5,614,289 | |
2,452 | | Credit Suisse First Boston Mortgage Securities Corporation, Series 2004-8-6A1 | | | 4.50 | % | | | 04/25/2023 | | | | 1,530 | |
1,126,473 | | Credit Suisse First Boston Mortgage Securities Corporation, Series 2005-11-2A1 | | | 6.00 | % | | | 12/25/2035 | | | | 833,282 | |
52,624 | | Credit Suisse First Boston Mortgage Securities Corporation, Series 2005-11-8A5 | | | 6.00 | % | | | 12/25/2035 | | | | 42,350 | |
470,663 | | Credit Suisse First Boston Mortgage Securities Corporation, Series 2005-9-5A9 | | | 5.50 | % | | | 10/25/2035 | | | | 270,101 | |
43,044,077 | | Credit Suisse Mortgage-Backed Trust, Series 2019-RP10-A1 | | | 3.00 | % (a)(k) | | | 12/26/2059 | | | | 43,115,388 | |
8,643,155 | | CSMC Trust, Series 2009-8R-8A2 | | | 6.00 | % (a)(k) | | | 03/26/2037 | | | | 3,687,336 | |
473,111 | | CSMC Trust, Series 2011-12R-3A5 | | | 3.90 | % (a)(k) | | | 07/27/2036 | | | | 450,696 | |
7,201,358 | | CSMC Trust, Series 2020-RPL2-A12 | | | 3.46 | % (a)(k) | | | 02/25/2060 | | | | 7,221,164 | |
469,992 | | CSMC Trust, Series 2021-JR1-A1 | | | 2.47 | % (a)(k) | | | 09/27/2066 | | | | 452,747 | |
18,409,718 | | CSMC Trust, Series 2022-NQM1-A1 | | | 2.27 | % (a)(k) | | | 11/25/2066 | | | | 15,918,743 | |
6,923,675 | | Deutsche ALT-A Securities, Inc. Mortgage Loan Trust, Series 2006-AR4-A1 (1 Month LIBOR USD + 0.26%, 0.26% Floor) | | | 5.11 | % | | | 12/25/2036 | | | | 2,430,531 | |
4,594,288 | | Deutsche ALT-A Securities, Inc. Mortgage Loan Trust, Series 2006-AR4-A2 (1 Month LIBOR USD + 0.38%, 0.38% Floor, 10.50% Cap) | | | 5.23 | % | | | 12/25/2036 | | | | 1,608,381 | |
201,737 | | Deutsche ALT-A Securities, Inc. Mortgage Loan Trust, Series 2007-OA2-A1 (12 Month US Treasury Average + 0.77%, 0.77% Floor) | | | 3.91 | % | | | 04/25/2047 | | | | 169,275 | |
410,177 | | Deutsche ALT-B Securities, Inc. Mortgage Loan Trust, Series 2006-AB4-A1A | | | 6.01 | % (a) | | | 10/25/2036 | | | | 366,125 | |
361,189 | | Deutsche Mortgage & Asset Receiving Corporation, Series 2014-RS1-1A2 | | | 6.50 | % (a)(k) | | | 07/27/2037 | | | | 293,731 | |
4,867,871 | | GCAT Trust, Series 2020-3-A1 | | | 2.98 | % (k)(l) | | | 09/25/2025 | | | | 4,744,127 | |
3,574,173 | | GCAT Trust, Series 2020-NQM2-A1 | | | 1.56 | % (k)(l) | | | 04/25/2065 | | | | 3,244,595 | |
7,617,137 | | GCAT Trust, Series 2021-NQM4-A3 | | | 1.56 | % (a)(k) | | | 08/25/2066 | | | | 5,872,434 | |
102,888 | | GS Mortgage-Backed Securities Trust, Series 2019-SL1-A1 | | | 2.63 | % (a)(k) | | | 01/25/2059 | | | | 102,502 | |
5,357,976 | | GSAA Home Equity Trust, Series 2006-19-A3A (1 Month LIBOR USD + 0.48%, 0.48% Floor) | | | 5.33 | % | | | 12/25/2036 | | | | 2,134,136 | |
332,690 | | GSR Mortgage Loan Trust, Series 2006-2F-3A4 | | | 6.00 | % | | | 02/25/2036 | | | | 175,977 | |
2,349,009 | | Harborview Mortgage Loan Trust, Series 2006-1-2A1A (1 Month LIBOR USD + 0.48%, 0.48% Floor) | | | 5.24 | % | | | 03/19/2036 | | | | 2,036,525 | |
777,856 | | Impac Secured Assets Trust, Series 2006-5-1A1C (1 Month LIBOR USD + 0.54%, 0.54% Floor, 11.50% Cap) | | | 5.39 | % | | | 02/25/2037 | | | | 690,817 | |
699,490 | | IndyMac INDX Mortgage Loan Trust, Series 2006-AR5-2A1 | | | 3.15 | % (a) | | | 05/25/2036 | | | | 585,553 | |
32,935,956 | | JP Morgan Alternative Loan Trust, Series 2005-S1-1A4 | | | 6.00 | % | | | 12/25/2035 | | | | 13,731,379 | |
3,673,506 | | JP Morgan Alternative Loan Trust, Series 2007-S1-A2 (1 Month LIBOR USD + 0.68%, 0.68% Floor, 11.50% Cap) | | | 5.53 | % | | | 04/25/2047 | | | | 3,466,403 | |
11,497,546 | | JP Morgan Mortgage Acquisition Trust, Series 2006-WMC2-A5 (1 Month LIBOR USD + 0.50%, 0.50% Floor) | | | 5.35 | % | | | 07/25/2036 | | | | 5,285,446 | |
6,064,368 | | JP Morgan Resecuritization Trust, Series 2014-4-1C | | | 0.00 | % (a)(c)(k) | | | 01/26/2036 | | | | 1,870,737 | |
1,158,868 | | Legacy Mortgage Asset Trust, Series 2020-SL1-A | | | 2.73 | % (k)(l) | | | 01/25/2060 | | | | 1,142,863 | |
2,887,886 | | Legacy Mortgage Asset Trust, Series 2021-GS1-A1 | | | 1.89 | % (k)(l) | | | 10/25/2066 | | | | 2,687,646 | |
190,582 | | Lehman Mortgage Trust, Series 2006-1-1A3 | | | 5.50 | % | | | 02/25/2036 | | | | 99,394 | |
9,411,668 | | Lehman Mortgage Trust, Series 2007-15N-3A1 (1 Month LIBOR USD + 0.25%, 0.25% Floor) | | | 5.10 | % | | | 08/25/2047 | | | | 7,493,684 | |
16,466,874 | | Long Beach Mortgage Loan Trust, Series 2006-11-2A2 (1 Month LIBOR USD + 0.10%, 0.10% Floor) | | | 4.95 | % | | | 12/25/2036 | | | | 6,154,124 | |
9,924,516 | | Long Beach Mortgage Loan Trust, Series 2006-2-2A3 (1 Month LIBOR USD + 0.38%, 0.38% Floor) | | | 5.23 | % | | | 03/25/2046 | | | | 3,624,336 | |
70,041 | | MASTR Adjustable Rate Mortgages Trust, Series 2006-2-2A1 | | | 4.16 | % (a) | | | 04/25/2036 | | | | 39,012 | |
1,578,755 | | MASTR Adjustable Rate Mortgages Trust, Series 2006-OA2-4A1A (12 Month US Treasury Average + 0.85%, 0.85% Floor) | | | 3.99 | % | | | 12/25/2046 | | | | 1,356,472 | |
338,060 | | Merrill Lynch Alternative Note Asset Trust, Series 2007-F1-2A6 | | | 6.00 | % | | | 03/25/2037 | | | | 135,395 | |
1,196,355 | | Merrill Lynch Mortgage Investors Trust, Series 2006-AF1-AF2C | | | 6.25 | % | | | 08/25/2036 | | | | 552,158 | |
36,148,115 | | Merrill Lynch Mortgage Investors Trust, Series 2006-RM2-A1A (1 Month LIBOR USD + 0.37%, 0.37% Floor) | | | 5.22 | % | | | 05/25/2037 | | | | 10,439,583 | |
4,528,994 | | Merrill Lynch Mortgage Investors Trust, Series 2007-HE2-A2A (1 Month LIBOR USD + 0.24%, 0.24% Floor) | | | 5.09 | % | | | 02/25/2037 | | | | 1,347,909 | |
7,003,166 | | Merrill Lynch Mortgage Investors Trust, Series 2007-HE2-A2B (1 Month LIBOR USD + 0.42%, 0.42% Floor) | | | 5.27 | % | | | 02/25/2037 | | | | 2,084,553 | |
5,461,659 | | MFA Trust, Series 2021-NQM2-A3 | | | 1.47 | % (a)(k) | | | 11/25/2064 | | | | 4,453,031 | |
235,730 | | Morgan Stanley Mortgage Loan Trust, Series 2006-2-7A1 | | | 5.47 | % (a) | | | 02/25/2036 | | | | 141,823 | |
516,950 | | Morgan Stanley Residential Mortgage Loan Trust, Series 2020-RPL1-A1 | | | 2.69 | % (a)(k) | | | 10/25/2060 | | | | 504,827 | |
4,160,521 | | Nomura Resecuritization Trust, Series 2015-8R-4A4 | | | 4.06 | % (a)(k) | | | 11/25/2047 | | | | 3,387,195 | |
474,856 | | OBX Trust, Series 2020-EXP2-A3 | | | 2.50 | % (a)(k) | | | 05/25/2060 | | | | 396,207 | |
3,296,114 | | OBX Trust, Series 2021-NQM2-A3 | | | 1.56 | % (a)(k) | | | 05/25/2061 | | | | 2,568,333 | |
6,723,385 | | OBX Trust, Series 2022-NQM1-A1 | | | 2.31 | % (a)(k) | | | 11/25/2061 | | | | 5,777,449 | |
2,627,417 | | Pretium Mortgage Credit Partners LLC, Series 2021-NPL1-A1 | | | 2.24 | % (k)(l) | | | 09/27/2060 | | | | 2,505,033 | |
3,363,790 | | Pretium Mortgage Credit Partners LLC, Series 2021-NPL2-A1 | | | 1.99 | % (k)(l) | | | 06/27/2060 | | | | 3,151,905 | |
29,743,980 | | Pretium Mortgage Credit Partners LLC, Series 2021-NPL3-A1 | | | 1.87 | % (k)(l) | | | 07/25/2051 | | | | 27,655,090 | |
6,078,133 | | Pretium Mortgage Credit Partners LLC, Series 2021-RN1-A1 | | | 1.99 | % (k)(l) | | | 02/25/2061 | | | | 5,718,555 | |
5,984,030 | | Pretium Mortgage Credit Partners LLC, Series 2021-RN2-A1 | | | 1.74 | % (k)(l) | | | 07/25/2051 | | | | 5,589,792 | |
5,920,871 | | PRPM LLC, Series 2021-6-A1 | | | 1.79 | % (k)(l) | | | 07/25/2026 | | | | 5,484,229 | |
633,129 | | RBSSP Resecuritization Trust, Series 2009-2-3A2 (1 Month LIBOR USD + 0.50%, 0.50% Floor) | | | 5.12 | % (k) | | | 04/26/2035 | | | | 568,796 | |
533,245 | | Residential Accredit Loans, Inc., Series 2006-QS12-2A3 | | | 6.00 | % | | | 09/25/2036 | | | | 429,217 | |
1,400,030 | | Residential Accredit Loans, Inc., Series 2007-QS4-3A4 | | | 6.00 | % | | | 03/25/2037 | | | | 1,175,381 | |
1,743,381 | | Residential Accredit Loans, Inc., Series 2007-QS4-3A9 | | | 6.00 | % | | | 03/25/2037 | | | | 1,463,598 | |
1,168,001 | | Residential Accredit Loans, Inc., Series 2007-QS8-A3 (1 Month LIBOR USD + 0.60%, 0.60% Floor, 6.00% Cap) | | | 5.45 | % | | | 06/25/2037 | | | | 800,888 | |
768,824 | | Residential Accredit Loans, Inc., Series 2007-QS9-A33 | | | 6.50 | % | | | 07/25/2037 | | | | 624,733 | |
4,565,133 | | Residential Asset Securities Corporation, Series 2004-KS7-A2A (1 Month LIBOR USD + 0.58%, 0.58% Floor) | | | 5.43 | % | | | 08/25/2034 | | | | 4,187,076 | |
688,726 | | Residential Asset Securitization Trust, Series 2006-A2-A11 | | | 6.00 | % | | | 01/25/2046 | | | | 302,184 | |
2,104,795 | | Residential Asset Securitization Trust, Series 2006-A6-1A4 | | | 6.00 | % | | | 07/25/2036 | | | | 622,095 | |
4,441,215 | | Residential Funding Mortgage Securities Trust, Series 2007-S1-A1 (1 Month LIBOR USD + 0.60%, 0.60% Floor, 6.00% Cap) | | | 5.45 | % | | | 01/25/2037 | | | | 3,286,874 | |
5,394,000 | | Residential Mortgage Loan Trust, Series 2019-2-M1 | | | 3.86 | % (a)(k) | | | 05/25/2059 | | | | 5,134,930 | |
5,968,772 | | Securitized Asset Backed Receivables LLC Trust, Series 2006-WM3-A1 (1 Month LIBOR USD + 0.10%, 0.10% Floor) | | | 4.95 | % | | | 10/25/2036 | | | | 2,075,556 | |
1,584,031 | | Soundview Home Loan Trust, Series 2007-OPT3-2A3 (1 Month LIBOR USD + 0.18%, 0.18% Floor) | | | 5.03 | % | | | 08/25/2037 | | | | 1,520,767 | |
8,000,000 | | Starwood Mortgage Residential Trust, Series 2020-2-M1E | | | 3.00 | % (k) | | | 04/25/2060 | | | | 7,497,072 | |
1,235,241 | | Structured Adjustable Rate Mortgage Loan Trust, Series 2005-22-4A1 | | | 4.26 | % (a) | | | 12/25/2035 | | | | 1,073,682 | |
10,156,708 | | VCAT LLC, Series 2021-NPL1-A1 | | | 2.29 | % (k)(l) | | | 12/26/2050 | | | | 9,733,105 | |
12,189,879 | | VCAT LLC, Series 2021-NPL4-A1 | | | 1.87 | % (k)(l) | | | 08/25/2051 | | | | 11,338,460 | |
6,501,937 | | VCAT LLC, Series 2021-NPL5-A1 | | | 1.87 | % (k)(l) | | | 08/25/2051 | | | | 6,012,676 | |
3,280,001 | | Velocity Commercial Capital Loan Trust, Series 2020-1-M2 | | | 2.98 | % (a)(k) | | | 02/25/2050 | | | | 2,766,309 | |
2,641,687 | | Velocity Commercial Capital Loan Trust, Series 2021-1-M2 | | | 2.26 | % (a)(k) | | | 05/25/2051 | | | | 2,073,753 | |
1,986,015 | | Velocity Commercial Capital Loan Trust, Series 2021-2-M2 | | | 2.20 | % (a)(k) | | | 08/25/2051 | | | | 1,608,209 | |
284,203 | | Verus Securitization Trust, Series 2020-4-A3 | | | 2.32 | % (k)(l) | | | 05/25/2065 | | | | 265,614 | |
1,500,000 | | Verus Securitization Trust, Series 2020-INV1-A2 | | | 3.04 | % (a)(k) | | | 03/25/2060 | | | | 1,436,140 | |
16,006,596 | | Verus Securitization Trust, Series 2021-7-A1 | | | 1.83 | % (a)(k) | | | 10/25/2066 | | | | 13,631,754 | |
2,539,288 | | Verus Securitization Trust, Series 2021-R1-A3 | | | 1.26 | % (a)(k) | | | 10/25/2063 | | | | 2,301,741 | |
4,956,326 | | VOLT LLC, Series 2021-NP10-A1 | | | 1.99 | % (k)(l) | | | 05/25/2051 | | | | 4,549,108 | |
7,671,830 | | VOLT LLC, Series 2021-NP11-A1 | | | 1.87 | % (k)(l) | | | 08/25/2051 | | | | 7,038,020 | |
12,186,170 | | VOLT LLC, Series 2021-NPL1-A1 | | | 1.89 | % (k)(l) | | | 02/27/2051 | | | | 11,201,305 | |
1,124,780 | | VOLT LLC, Series 2021-NPL2-A1 | | | 1.89 | % (k)(l) | | | 02/27/2051 | | | | 1,039,061 | |
5,211,420 | | VOLT LLC, Series 2021-NPL5-A1 | | | 2.12 | % (k)(l) | | | 03/27/2051 | | | | 4,918,487 | |
2,993,408 | | VOLT LLC, Series 2021-NPL6-A1 | | | 2.24 | % (k)(l) | | | 04/25/2051 | | | | 2,764,697 | |
26,937,409 | | VOLT LLC, Series 2021-NPL8-A1 | | | 2.12 | % (k)(l) | | | 04/25/2051 | | | | 24,671,539 | |
6,501,324 | | Washington Mutual Asset-Backed Certificates Trust, Series 2006-HE5-2A2 (1 Month LIBOR USD + 0.18%, 0.18% Floor) | | | 4.43 | % | | | 10/25/2036 | | | | 2,476,865 | |
2,387,597 | | Washington Mutual Asset-Backed Certificates Trust, Series 2006-HE5-2A3 (1 Month LIBOR USD + 0.23%, 0.23% Floor) | | | 4.43 | % | | | 10/25/2036 | | | | 910,361 | |
1,047,771 | | Washington Mutual Mortgage Pass-Through Certificates Trust, Series 2005-8-2CB3 (1 Month LIBOR USD + 0.41%, 0.41% Floor, 5.50% Cap) | | | 5.26 | % | | | 10/25/2035 | | | | 957,979 | |
3,073,109 | | Washington Mutual Mortgage Pass-Through Certificates Trust, Series 2005-AR4-A5 | | | 3.33 | % (a) | | | 04/25/2035 | | | | 2,772,314 | |
2,931,228 | | Washington Mutual Mortgage Pass-Through Certificates Trust, Series 2006-AR10-2A1 | | | 3.60 | % (a) | | | 09/25/2036 | | | | 2,465,511 | |
10,988,917 | | Washington Mutual Mortgage Pass-Through Certificates Trust, Series 2006-AR18-1A1 | | | 3.16 | % (a) | | | 01/25/2037 | | | | 9,468,904 | |
1,698,677 | | Washington Mutual Mortgage Pass-Through Certificates Trust, Series 2007-HE4-2A3 (1 Month LIBOR USD + 0.17%, 0.17% Floor) | | | 5.02 | % | | | 07/25/2047 | | | | 1,025,385 | |
531,759 | | Wells Fargo Alternative Loan Trust, Series 2007-PA5-1A1 | | | 6.25 | % | | | 11/25/2037 | | | | 457,389 | |
2,040,867 | | Wells Fargo Mortgage Backed Securities Trust, Series 2007-15-A1 | | | 6.00 | % | | | 11/25/2037 | | | | 1,686,446 | |
6,877,124 | | Wells Fargo Mortgage Backed Securities Trust, Series 2007-AR6-A2 | | | 4.27 | % (a) | | | 10/25/2037 | | | | 6,010,293 | |
| | | | | | | | | | | | | | |
Total Non-Agency Residential Collateralized Mortgage Obligations (Cost $642,686,334) | | | | | | | | | | | 542,760,419 | |
| | | | | | | | | | | | | | |
US Corporate Bonds - 6.3% | | | | | | | | | | | | |
2,260,000 | | AbbVie, Inc. | | | 2.60 | % | | | 11/21/2024 | | | | 2,181,984 | |
4,030,000 | | Amazon.com, Inc. | | | 4.60 | % | | | 12/01/2025 | | | | 4,064,923 | |
165,000 | | American Express Company | | | 3.38 | % | | | 05/03/2024 | | | | 161,809 | |
595,000 | | American Express Company | | | 5.35 | % (f) | | | 11/04/2026 | | | | 583,505 | |
3,310,000 | | American Express Company (Secured Overnight Financing Rate + 0.93%) | | | 5.72 | % | | | 03/04/2025 | | | | 3,291,558 | |
2,010,000 | | Amgen, Inc. | | | 5.51 | % | | | 03/02/2026 | | | | 2,018,664 | |
1,960,000 | | Arrow Electronics, Inc. | | | 6.13 | % | | | 03/01/2026 | | | | 1,965,131 | |
2,515,000 | | AT&T, Inc. | | | 5.54 | % | | | 02/20/2026 | | | | 2,523,326 | |
6,015,000 | | Athene Global Funding | | | 5.47 | % (f)(k) | | | 05/24/2024 | | | | 5,921,842 | |
1,075,000 | | Avery Dennison Corporation | | | 0.85 | % | | | 08/15/2024 | | | | 1,016,447 | |
5,375,000 | | Bank of America Corporation (3 Month LIBOR USD + 0.97%) | | | 3.46 | % | | | 03/15/2025 | | | | 5,263,936 | |
1,380,000 | | Boeing Company | | | 4.51 | % | | | 05/01/2023 | | | | 1,379,541 | |
425,000 | | Boeing Company | | | 4.88 | % | | | 05/01/2025 | | | | 424,345 | |
1,970,000 | | Brighthouse Financial Global Funding | | | 0.60 | % (k) | | | 06/28/2023 | | | | 1,946,354 | |
1,821,000 | | Broadcom, Inc. | | | 3.15 | % | | | 11/15/2025 | | | | 1,743,242 | |
90,000 | | Broadcom, Inc. | | | 3.88 | % | | | 01/15/2027 | | | | 87,054 | |
4,100,000 | | Campbell Soup Company | | | 3.95 | % | | | 03/15/2025 | | | | 4,028,884 | |
1,935,000 | | Capital One Financial Corporation (Secured Overnight Financing Rate + 2.16%) | | | 4.99 | % | | | 07/24/2026 | | | | 1,866,831 | |
5,697,000 | | Cardinal Health, Inc. | | | 3.08 | % | | | 06/15/2024 | | | | 5,570,322 | |
3,120,000 | | Caterpillar Financial Services Corporation | | | 3.65 | % | | | 08/12/2025 | | | | 3,065,118 | |
3,986,000 | | Charles Schwab Corporation | | | 5.84 | % (f) | | | 03/03/2027 | | | | 3,801,858 | |
2,717,000 | | Citigroup, Inc. (3 Month LIBOR USD + 1.02%) | | | 5.99 | % | | | 06/01/2024 | | | | 2,716,217 | |
1,410,000 | | Citigroup, Inc. (Secured Overnight Financing Rate + 0.53%) | | | 1.28 | % | | | 11/03/2025 | | | | 1,318,123 | |
2,965,000 | | Citigroup, Inc. (Secured Overnight Financing Rate + 1.53%) | | | 3.29 | % | | | 03/17/2026 | | | | 2,843,596 | |
1,960,000 | | Constellation Brands, Inc. | | | 3.60 | % | | | 05/09/2024 | | | | 1,935,226 | |
2,030,000 | | CVS Health Corporation | | | 5.00 | % | | | 02/20/2026 | | | | 2,053,842 | |
2,162,000 | | Dell International LLC | | | 4.00 | % | | | 07/15/2024 | | | | 2,133,510 | |
1,900,000 | | Dollar General Corporation | | | 4.15 | % | | | 11/01/2025 | | | | 1,866,898 | |
3,693,000 | | Dollar Tree, Inc. | | | 4.00 | % | | | 05/15/2025 | | | | 3,626,249 | |
1,925,000 | | Duke Energy Corporation | | | 5.00 | % | | | 12/08/2025 | | | | 1,939,433 | |
6,000,000 | | Elevance Health, Inc. | | | 3.50 | % | | | 08/15/2024 | | | | 5,880,265 | |
2,495,000 | | Eli Lilly & Company | | | 5.00 | % | | | 02/27/2026 | | | | 2,518,183 | |
3,775,000 | | Energy Transfer LP | | | 5.88 | % | | | 01/15/2024 | | | | 3,774,509 | |
4,390,000 | | Entergy Corporation | | | 0.90 | % | | | 09/15/2025 | | | | 3,955,594 | |
4,140,000 | | Equinix, Inc. | | | 1.25 | % | | | 07/15/2025 | | | | 3,796,119 | |
3,959,000 | | Expedia Group, Inc. | | | 6.25 | % (k) | | | 05/01/2025 | | | | 4,010,922 | |
1,740,000 | | General Mills, Inc. | | | 4.00 | % | | | 04/17/2025 | | | | 1,717,365 | |
1,675,000 | | General Mills, Inc. | | | 5.24 | % | | | 11/18/2025 | | | | 1,680,339 | |
3,890,000 | | General Motors Financial Company, Inc. | | | 5.25 | % | | | 03/01/2026 | | | | 3,894,092 | |
4,105,000 | | Goldman Sachs Group, Inc. | | | 3.50 | % | | | 04/01/2025 | | | | 3,988,247 | |
3,862,000 | | HCA, Inc. | | | 5.00 | % | | | 03/15/2024 | | | | 3,840,337 | |
3,378,000 | | Hyatt Hotels Corporation | | | 1.30 | % | | | 10/01/2023 | | | | 3,307,497 | |
4,315,000 | | Hyundai Capital America | | | 1.00 | % (k) | | | 09/17/2024 | | | | 4,046,857 | |
1,785,000 | | Intel Corporation | | | 4.88 | % | | | 02/10/2026 | | | | 1,808,515 | |
2,955,000 | | John Deere Capital Corporation | | | 4.75 | % | | | 01/20/2028 | | | | 3,018,817 | |
4,040,000 | | JPMorgan Chase & Company | | | 3.90 | % | | | 07/15/2025 | | | | 3,977,850 | |
2,510,000 | | JPMorgan Chase & Company (Secured Overnight Financing Rate + 0.42%) | | | 0.56 | % | | | 02/16/2025 | | | | 2,406,604 | |
5,490,000 | | JPMorgan Chase & Company (Secured Overnight Financing Rate + 1.32%) | | | 5.97 | % | | | 04/26/2026 | | | | 5,471,849 | |
4,250,000 | | Keurig Dr Pepper, Inc. | | | 0.75 | % | | | 03/15/2024 | | | | 4,071,687 | |
2,030,000 | | Kinder Morgan, Inc. | | | 4.30 | % | | | 06/01/2025 | | | | 2,000,344 | |
1,110,000 | | Lowe’s Companies, Inc. | | | 4.40 | % | | | 09/08/2025 | | | | 1,105,184 | |
4,160,000 | | Magallanes, Inc. | | | 3.79 | % (k) | | | 03/15/2025 | | | | 4,030,825 | |
4,155,000 | | Marriott International, Inc. | | | 3.60 | % | | | 04/15/2024 | | | | 4,077,702 | |
3,990,000 | | Marsh & McLennan Companies, Inc. | | | 3.88 | % | | | 03/15/2024 | | | | 3,934,862 | |
440,000 | | McDonald’s Corporation | | | 3.35 | % | | | 04/01/2023 | | | | 440,000 | |
985,000 | | McDonald’s Corporation | | | 3.38 | % | | | 05/26/2025 | | | | 963,135 | |
2,515,000 | | McDonald’s Corporation | | | 1.45 | % | | | 09/01/2025 | | | | 2,343,262 | |
2,030,000 | | McKesson Corporation | | | 5.25 | % | | | 02/15/2026 | | | | 2,035,943 | |
4,166,000 | | Microchip Technology, Inc. | | | 0.97 | % | | | 02/15/2024 | | | | 4,000,481 | |
3,960,000 | | Morgan Stanley (Secured Overnight Financing Rate + 0.46%) | | | 5.11 | % | | | 01/25/2024 | | | | 3,948,906 | |
3,999,000 | | Morgan Stanley (Secured Overnight Financing Rate + 0.62%) | | | 0.73 | % | | | 04/05/2024 | | | | 3,997,846 | |
3,051,000 | | Mosaic Company | | | 4.25 | % | | | 11/15/2023 | | | | 3,019,279 | |
1,755,000 | | New York Life Global Funding | | | 3.60 | % (k) | | | 08/05/2025 | | | | 1,712,957 | |
1,350,000 | | NextEra Energy Capital Holdings, Inc. | | | 4.20 | % | | | 06/20/2024 | | | | 1,335,107 | |
685,000 | | NextEra Energy Capital Holdings, Inc. | | | 4.26 | % | | | 09/01/2024 | | | | 678,964 | |
3,350,000 | | Northrop Grumman Corporation | | | 2.93 | % | | | 01/15/2025 | | | | 3,245,358 | |
4,020,000 | | NVIDIA Corporation | | | 0.58 | % | | | 06/14/2024 | | | | 3,839,615 | |
3,080,000 | | Omnicom Group, Inc. | | | 3.65 | % | | | 11/01/2024 | | | | 3,019,395 | |
1,940,000 | | Oracle Corporation | | | 5.80 | % | | | 11/10/2025 | | | | 1,989,328 | |
1,055,000 | | Pacific Gas and Electric Company | | | 3.25 | % | | | 02/16/2024 | | | | 1,033,695 | |
2,800,000 | | Pacific Gas and Electric Company | | | 4.95 | % | | | 06/08/2025 | | | | 2,768,926 | |
1,895,000 | | Parker-Hannifin Corporation | | | 3.65 | % | | | 06/15/2024 | | | | 1,867,113 | |
4,085,000 | | Penske Truck Leasing Company LP | | | 2.70 | % (k) | | | 11/01/2024 | | | | 3,910,834 | |
1,515,000 | | Phillips 66 | | | 3.85 | % | | | 04/09/2025 | | | | 1,483,002 | |
510,000 | | Phillips 66 | | | 1.30 | % | | | 02/15/2026 | | | | 462,099 | |
2,185,000 | | Pioneer Natural Resources Company | | | 1.13 | % | | | 01/15/2026 | | | | 1,986,897 | |
2,975,000 | | Public Service Enterprise Group, Inc. | | | 0.84 | % | | | 11/08/2023 | | | | 2,890,515 | |
2,050,000 | | Public Service Enterprise Group, Inc. (Secured Overnight Financing Rate + 1.09%) | | | 4.76 | % | | | 01/26/2027 | | | | 2,026,164 | |
2,010,000 | | Raytheon Technologies Corporation | | | 5.00 | % | | | 02/27/2026 | | | | 2,041,452 | |
3,932,000 | | Republic Services, Inc. | | | 2.50 | % | | | 08/15/2024 | | | | 3,810,314 | |
4,045,000 | | Royalty Pharma PLC | | | 0.75 | % | | | 09/02/2023 | | | | 3,944,772 | |
1,810,000 | | Sabine Pass Liquefaction LLC | | | 5.63 | % | | | 03/01/2025 | | | | 1,822,219 | |
3,219,000 | | Simon Property Group LP | | | 2.00 | % | | | 09/13/2024 | | | | 3,075,874 | |
3,900,000 | | Southern California Edison Company | | | 5.69 | % (f) | | | 04/01/2024 | | | | 3,875,798 | |
1,985,000 | | Southern Company | | | 5.15 | % | | | 10/06/2025 | | | | 2,010,748 | |
845,000 | | Synchrony Financial | | | 4.38 | % | | | 03/19/2024 | | | | 812,509 | |
3,295,000 | | Synchrony Financial | | | 4.25 | % | | | 08/15/2024 | | | | 3,116,605 | |
1,910,000 | | Toyota Motor Credit Corporation | | | 3.65 | % | | | 08/18/2025 | | | | 1,868,601 | |
4,615,000 | | Triton Container International Ltd. | | | 0.80 | % (k) | | | 08/01/2023 | | | | 4,510,004 | |
2,003,000 | | Truist Financial Corporation (Secured Overnight Financing Rate + 0.40%) | | | 5.21 | % | | | 06/09/2025 | | | | 1,918,602 | |
1,425,000 | | Union Pacific Corporation | | | 4.75 | % | | | 02/21/2026 | | | | 1,443,016 | |
615,000 | | UnitedHealth Group, Inc. | | | 0.55 | % | | | 05/15/2024 | | | | 586,771 | |
1,885,000 | | UnitedHealth Group, Inc. | | | 3.70 | % | | | 05/15/2027 | | | | 1,845,457 | |
3,850,000 | | Verizon Communications, Inc. (3 Month LIBOR USD + 1.10%) | | | 5.96 | % | | | 05/15/2025 | | | | 3,859,023 | |
2,072,000 | | Viatris, Inc. | | | 1.65 | % | | | 06/22/2025 | | | | 1,901,296 | |
2,000,000 | | WEC Energy Group, Inc. | | | 4.75 | % | | | 01/09/2026 | | | | 2,002,068 | |
1,750,000 | | Wells Fargo & Company (Secured Overnight Financing Rate + 1.56%) | | | 4.54 | % | | | 08/15/2026 | | | | 1,719,365 | |
4,005,000 | | Wells Fargo & Company (Secured Overnight Financing Rate + 1.60%) | | | 1.65 | % | | | 06/02/2024 | | | | 3,979,519 | |
4,015,000 | | Welltower, Inc. | | | 3.63 | % | | | 03/15/2024 | | | | 3,930,952 | |
1,945,000 | | Workday, Inc. | | | 3.50 | % | | | 04/01/2027 | | | | 1,862,218 | |
4,135,000 | | Zimmer Biomet Holdings, Inc. | | | 1.45 | % | | | 11/22/2024 | | | | 3,909,994 | |
| | | | | | | | | | | | | | |
Total US Corporate Bonds (Cost $278,061,427) | | | | | | | | | | | 270,500,331 | |
| | | | | | | | | | | | | | |
US Government and Agency Mortgage Backed Obligations - 2.5% | | | | | | | | | | | | |
491,848 | | Federal Home Loan Mortgage Corporation Pass-Thru, Pool G08626 | | | 3.00 | % | | | 02/01/2045 | | | | 454,303 | |
484,058 | | Federal Home Loan Mortgage Corporation Pass-Thru, Pool G08631 | | | 3.00 | % | | | 03/01/2045 | | | | 446,807 | |
8,267,606 | | Federal Home Loan Mortgage Corporation Pass-Thru, Pool SB8119 | | | 2.00 | % | | | 09/01/2036 | | | | 7,468,673 | |
281,482 | | Federal Home Loan Mortgage Corporation REMICS, Series 3417-SM (-1 x 1 Month LIBOR USD + 6.28%, 6.28% Cap) | | | 1.60 | % (g)(h) | | | 02/15/2038 | | | | 26,419 | |
654,326 | | Federal Home Loan Mortgage Corporation REMICS, Series 4471-GA | | | 3.00 | % | | | 02/15/2044 | | | | 615,789 | |
9,092,609 | | Federal Home Loan Mortgage Corporation REMICS, Series 4954-LB | | | 2.50 | % | | | 02/25/2050 | | | | 8,059,105 | |
6,179,317 | | Federal Home Loan Mortgage Corporation REMICS, Series 5105-NH | | | 2.00 | % | | | 02/25/2037 | | | | 5,533,347 | |
932,715 | | Federal Home Loan Mortgage Corporation, Series 2021-MN1-M1 (Secured Overnight Financing Rate 30 Day Average + 2.00%) | | | 6.48 | % (k) | | | 01/25/2051 | | | | 877,177 | |
643,148 | | Federal National Mortgage Association Pass-Thru, Pool AS4645 | | | 3.00 | % | | | 03/01/2045 | | | | 593,039 | |
1,563,887 | | Federal National Mortgage Association Pass-Thru, Pool CB0302 | | | 1.50 | % | | | 05/01/2036 | | | | 1,377,414 | |
183,390 | | Federal National Mortgage Association Pass-Thru, Pool MA1200 | | | 3.00 | % | | | 10/01/2032 | | | | 173,007 | |
793,741 | | Federal National Mortgage Association Pass-Thru, Pool MA2270 | | | 3.00 | % | | | 05/01/2045 | | | | 719,296 | |
14,258,894 | | Federal National Mortgage Association Pass-Thru, Pool MA4176 | | | 2.00 | % | | | 11/01/2040 | | | | 12,344,270 | |
378,136 | | Federal National Mortgage Association REMICS, Series 2012-32-DA | | | 2.00 | % | | | 11/25/2026 | | | | 369,988 | |
17,806 | | Federal National Mortgage Association REMICS, Series 2013-40-KP | | | 3.50 | % | | | 04/25/2042 | | | | 17,723 | |
1,474,230 | | Federal National Mortgage Association REMICS, Series 2016-72-PA | | | 3.00 | % | | | 07/25/2046 | | | | 1,362,148 | |
7,134,635 | | Federal National Mortgage Association REMICS, Series 2019-25-SB (-1 x 1 Month LIBOR USD + 6.05%, 6.05% Cap) | | | 1.20 | % (g)(h) | | | 06/25/2049 | | | | 711,780 | |
5,561,861 | | Federal National Mortgage Association REMICS, Series 2019-43-FD (1 Month LIBOR USD + 0.40%, 0.40% Floor, 6.50% Cap) | | | 5.25 | % | | | 08/25/2049 | | | | 5,405,256 | |
5,556,206 | | Federal National Mortgage Association REMICS, Series 2020-39-MH | | | 3.00 | % | | | 06/25/2040 | | | | 5,062,619 | |
4,622,701 | | Federal National Mortgage Association REMICS, Series 2021-21-HG | | | 2.00 | % | | | 11/25/2047 | | | | 4,133,038 | |
8,761,524 | | Federal National Mortgage Association REMICS, Series 2021-29-CG | | | 1.25 | % | | | 05/25/2041 | | | | 7,687,423 | |
974,382 | | Federal National Mortgage Association, Pool AL2987 (12 Month LIBOR USD + 1.62%, 1.62% Floor, 7.30% Cap) | | | 3.87 | % | | | 11/01/2042 | | | | 979,835 | |
2,659,867 | | Federal National Mortgage Association, Pool AP7870 (12 Month LIBOR USD + 1.70%, 1.70% Floor, 7.55% Cap) | | | 3.95 | % | | | 07/01/2042 | | | | 2,703,274 | |
771,468 | | Federal National Mortgage Association, Pool BM3520 (12 Month LIBOR USD + 1.55%, 1.55% Floor, 7.02% Cap) | | | 3.50 | % | | | 05/01/2045 | | | | 774,029 | |
3,405,516 | | Federal National Mortgage Association, Pool BM4513 (12 Month LIBOR USD + 1.68%, 1.68% Floor, 7.75% Cap) | | | 4.13 | % | | | 05/01/2044 | | | | 3,455,075 | |
22,509,004 | | Federal National Mortgage Association, Series 2020-M49-1A1 | | | 1.26 | % (a) | | | 11/25/2030 | | | | 19,836,873 | |
10,024,341 | | Federal National Mortgage Association, Series 2021-M20-A1 | | | 1.84 | % (a) | | | 10/25/2031 | | | | 8,891,873 | |
8,617,654 | | Federal National Mortgage Association, Series 2022-M1S-A1 | | | 2.08 | % (a) | | | 11/25/2031 | | | | 7,766,600 | |
116,146 | | Government National Mortgage Association, Series 2016-136-UD | | | 3.00 | % | | | 04/20/2045 | | | | 115,243 | |
| | | | | | | | | | | | | | |
Total US Government and Agency Mortgage Backed Obligations (Cost $121,912,134) | | | | | | | | | | | 107,961,423 | |
| | | | | | | | | | | | | | |
US Government and Agency Obligations - 18.3% | | | | | | | | | | | | |
36,600,000 | | United States Treasury Notes | | | 4.38 | % | | | 10/31/2024 | | | | 36,649,325 | |
73,300,000 | | United States Treasury Notes | | | 4.50 | % (e) | | | 11/30/2024 | | | | 73,600,644 | |
74,000,000 | | United States Treasury Notes | | | 4.25 | % (e) | | | 12/31/2024 | | | | 74,076,602 | |
111,400,000 | | United States Treasury Notes | | | 4.13 | % (e) | | | 01/31/2025 | | | | 111,382,594 | |
138,200,000 | | United States Treasury Notes | | | 4.63 | % (e) | | | 02/28/2025 | | | | 139,555,008 | |
103,000,000 | | United States Treasury Notes | | | 3.88 | % | | | 03/31/2025 | | | | 102,637,852 | |
62,100,000 | | United States Treasury Notes | | | 4.50 | % | | | 11/15/2025 | | | | 63,027,862 | |
67,600,000 | | United States Treasury Notes | | | 3.88 | % (e) | | | 01/15/2026 | | | | 67,629,047 | |
63,400,000 | | United States Treasury Notes | | | 4.00 | % (e) | | | 02/15/2026 | | | | 63,669,945 | |
54,700,000 | | United States Treasury Notes | | | 4.63 | % | | | 03/15/2026 | | | | 55,949,980 | |
| | | | | | | | | | | | | | |
Total US Government and Agency Obligations (Cost $785,443,460) | | | | | | | | | | | 788,178,859 | |
| | | | | | | | | | | | | | |
Common Stocks - 0.0% (m) | | | | | | | | | | | | |
58,790 | | Foresight Equity (c)(i) | | | | | | | | | | | 656,098 | |
| | | | | | | | | | | | | | |
Total Common Stocks (Cost $851,127) | | | | | | | | | | | 656,098 | |
| | | | | | | | | | | | | | |
Warrants - 0.0% (m) | | | | | | | | | | | | |
| 29,232 | | OAS S.A., Expiration 5/16/2039, Strike Price BRL 1.00 (c)(i) | | | | | | | | | | | – | |
| | | | | | | | | | | | | | |
Total Warrants (Cost $–) | | | | | | | | | | | – | |
| | | | | | | | | | | | | | |
Short Term Investments - 10.6% | | | | | | | | | | | | |
66,325,465 | | First American Government Obligations Fund - Class U | | | 4.66 | % (j) | | | | | | | 66,325,465 | |
66,325,465 | | JP Morgan U.S. Government Money Market Fund - Institutional Share Class | | | 4.73 | % (j) | | | | | | | 66,325,465 | |
66,325,465 | | Morgan Stanley Institutional Liquidity Funds Government Portfolio - Institutional Share Class | | | 4.74 | % (j) | | | | | | | 66,325,465 | |
130,000,000 | | United States Treasury Bills | | | 0.00 | % | | | 07/25/2023 | | | | 128,095,911 | |
48,400,000 | | United States Treasury Bills | | | 0.00 | % | | | 01/25/2024 | | | | 46,640,584 | |
87,500,000 | | United States Treasury Bills | | | 0.00 | % | | | 02/22/2024 | | | | 83,998,632 | |
| | | | | | | | | | | | | | |
Total Short Term Investments (Cost $457,704,779) | | | | | | | | | | | 457,711,522 | |
| | | | | | | | | | | | | | |
Total Investments - 100.8% (Cost $4,652,968,201) | | | | | | | | | | | 4,343,623,214 | |
Liabilities in Excess of Other Assets - (0.8)% | | | | | | | | | | | (34,205,885 | ) |
| | | | | | | | | | | | | | |
NET ASSETS - 100.0% | | | | | | | | | | $ | 4,309,417,329 | |
| | | | | | | | | | | | | | |
| | | | | | | | | | | | | | |
Principal Amount $/Shares | | Security Description | | Rate | | | Maturity | | | Value $ | |
Asset Backed Obligations - 5.1% | |
5,000,000 | | Affirm Asset Securitization Trust, Series 2021-B-D | | | 2.54 | % (a) | | | 08/17/2026 | | | | 4,453,860 | |
650,000 | | Amur Equipment Finance Receivables LLC, Series 2021-1A-E | | | 4.13 | % (a) | | | 03/20/2028 | | | | 596,149 | |
513,000 | | Arivo Acceptance Auto Loan Receivables Trust, Series 2021-1A-C | | | 3.77 | % (a) | | | 03/15/2027 | | | | 463,476 | |
1,771,875 | | CAL Funding Ltd., Series 2020-1A-A | | | 2.22 | % (a) | | | 09/25/2045 | | | | 1,575,755 | |
787,500 | | CAL Funding Ltd., Series 2020-1A-B | | | 3.50 | % (a) | | | 09/25/2045 | | | | 698,111 | |
2,468,915 | | Castlelake Aircraft Securitization Trust, Series 2018-1-B | | | 5.30 | % (a) | | | 06/15/2043 | | | | 1,762,208 | |
930,785 | | Diamond Resorts Owner Trust, Series 2021-1A-D | | | 3.83 | % (a) | | | 11/21/2033 | | | | 848,631 | |
6,250,000 | | ExteNet LLC, Series 2019-1A-C | | | 5.22 | % (a) | | | 07/26/2049 | | | | 5,875,913 | |
890,352 | | GAIA Aviation Ltd., Series 2019-1-C | | | 7.00 | % (a)(k)(l) | | | 12/15/2044 | | | | 406,741 | |
1,855,212 | | Jersey Mike’s Funding, Series 2019-1A-A2 | | | 4.43 | % (a) | | | 02/15/2050 | | | | 1,729,250 | |
1,134,247 | | JOL Air Ltd., Series 2019-1-B | | | 4.95 | % (a) | | | 04/15/2044 | | | | 805,994 | |
1,146,105 | | Loanpal Solar Loan Ltd., Series 2021-1GS-C | | | 3.50 | % (a) | | | 01/20/2048 | | | | 731,020 | |
3,108,382 | | Lunar Structured Aircraft Portfolio Notes, Series 2021-1-C | | | 5.68 | % (a)(k) | | | 10/15/2046 | | | | 2,550,685 | |
1,281,651 | | Mosaic Solar Loan Trust, Series 2018-1A-C | | | 0.00 | % (a)(b) | | | 06/22/2043 | | | | 1,185,556 | |
5,499,701 | | Pagaya AI Debt Selection Trust, Series 2021-3-C | | | 3.27 | % (a) | | | 05/15/2029 | | | | 4,774,207 | |
1,350,000 | | Pagaya AI Debt Selection Trust, Series 2021-5-CERT | | | 0.00 | % (a)(c)(k) | | | 08/15/2029 | | | | 933,229 | |
4,308,408 | | Regional Ltd., Series 2021-1A-A | | | 5.75 | % | | | 04/15/2041 | | | | 3,867,666 | |
1,328,645 | | Textainer Marine Containers Ltd., Series 2020-2A-A | | | 2.10 | % (a) | | | 09/20/2045 | | | | 1,183,294 | |
1,750,000 | | Upstart Securitization Trust, Series 2021-3-C | | | 3.28 | % (a) | | | 07/20/2031 | | | | 1,545,827 | |
4,575,719 | | Vivint Solar Financing LLC, Series 2018-1A-A | | | 4.73 | % (a) | | | 04/30/2048 | | | | 4,152,387 | |
9,937,610 | | WAVE LLC, Series 2019-1-C | | | 6.41 | % (a)(k) | | | 09/15/2044 | | | | 4,514,875 | |
1,089,280 | | Willis Engine Structured Trust, Series 2018-A-A | | | 4.75 | % (a)(l) | | | 09/15/2043 | | | | 848,620 | |
2,777,652 | | Zephyrus Capital Aviation Partners Ltd., Series 2018-1-A | | | 4.61 | % (a) | | | 10/15/2038 | | | | 2,358,102 | |
| | | | | | | | | | | | | | |
Total Asset Backed Obligations (Cost $60,175,566) | | | | | | | | | | | 47,861,556 | |
| | | | | | | | | | | | | | |
Bank Loans - 7.1% | |
291,709 | | 1011778 B.C. Unlimited Liability Company, Senior Secured First Lien Term Loan (1 Month LIBOR USD + 1.75%) | | | 6.59 | % | | | 11/19/2026 | | | | 289,400 | |
225,000 | | AAdvantage Loyalty IP Ltd., Senior Secured First Lien Term Loan (3 Month LIBOR USD + 4.75%, 0.75% Floor) | | | 9.56 | % | | | 04/20/2028 | | | | 228,813 | |
187,625 | | Acrisure LLC, Senior Secured First Lien Term Loan (1 Month LIBOR USD + 4.25%, 0.50% Floor) | | | 9.09 | % | | | 02/16/2027 | | | | 184,342 | |
115,104 | | Acuris Finance US, Inc., Senior Secured First Lien Term Loan (3 Month Secured Overnight Financing Rate + 4.00%, 0.50% Floor) | | | 9.05 | % | | | 02/16/2028 | | | | 111,459 | |
373,379 | | Agiliti Health, Inc., Senior Secured First Lien Term Loan (1 Month LIBOR USD + 2.75%) | | | 7.44 | % | | | 01/05/2026 | | | | 372,912 | |
576,913 | | AI Aqua Merger Sub, Inc., Senior Secured First Lien Term Loan (1 Month Secured Overnight Financing Rate + 3.75%, 0.50% Floor) | | | 8.48 | % | | | 07/31/2028 | | | | 558,527 | |
233,238 | | Air Canada, Senior Secured First Lien Term Loan (3 Month LIBOR USD + 3.50%, 0.75% Floor) | | | 8.37 | % | | | 08/11/2028 | | | | 233,165 | |
94,939 | | Air Methods Corporation, Senior Secured First Lien Term Loan (3 Month LIBOR USD + 3.50%, 1.00% Floor) | | | 8.66 | % | | | 04/22/2024 | | | | 59,851 | |
700,700 | | AlixPartners LLP, Senior Secured First Lien Term Loan (1 Month LIBOR USD + 2.75%, 0.50% Floor) | | | 7.61 | % | | | 02/04/2028 | | | | 699,222 | |
258,128 | | Alliance Laundry Systems LLC, Senior Secured First Lien Term Loan (3 Month LIBOR USD + 3.50%, 0.75% Floor) | | | 8.31 | % | | | 10/08/2027 | | | | 256,353 | |
109,725 | | Alliant Holdings Intermediate LLC, Senior Secured First Lien Term Loan (1 Month Secured Overnight Financing Rate + 3.50%, 0.50% Floor) | | | 8.35 | % | | | 11/05/2027 | | | | 108,752 | |
475,885 | | Allied Universal Holdco LLC, Senior Secured First Lien Term Loan (1 Month Secured Overnight Financing Rate + 3.75%, 0.50% Floor) | | | 8.66 | % | | | 05/12/2028 | | | | 452,645 | |
365,085 | | Almonde, Inc., Senior Secured First Lien Term Loan (3 Month LIBOR USD + 3.50%, 1.00% Floor) | | | 8.33 | % | | | 06/13/2024 | | | | 342,691 | |
60,000 | | Almonde, Inc., Senior Secured Second Lien Term Loan (3 Month LIBOR USD + 7.25%, 1.00% Floor) | | | 12.08 | % | | | 06/16/2025 | | | | 48,709 | |
340,419 | | Alterra Mountain Company, Senior Secured First Lien Term Loan (1 Month LIBOR USD + 3.50%, 0.50% Floor) | | | 8.34 | % | | | 08/17/2028 | | | | 339,994 | |
82,436 | | AMC Entertainment Holdings, Inc., Senior Secured First Lien Term Loan (1 Month LIBOR USD + 3.00%) | | | 7.68 | % | | | 04/22/2026 | | | | 60,333 | |
308,717 | | American Airlines, Inc., Senior Secured First Lien Term Loan (6 Month LIBOR USD + 3.50%) | | | 8.26 | % | | | 01/29/2027 | | | | 302,046 | |
222,750 | | American Tire Distributors, Inc., Senior Secured First Lien Term Loan (3 Month LIBOR USD + 6.25%, 0.75% Floor) | | | 11.07 | % | | | 10/20/2028 | | | | 196,392 | |
171,637 | | American Trailer World Corporation, Senior Secured First Lien Term Loan (1 Month Secured Overnight Financing Rate + 3.75%, 0.75% Floor) | | | 8.66 | % | | | 03/03/2028 | | | | 150,397 | |
358,461 | | AmWINS Group LLC, Senior Secured First Lien Term Loan (1 Month LIBOR USD + 2.25%, 0.75% Floor) | | | 7.09 | % | | | 02/22/2028 | | | | 354,753 | |
| | Applied Systems, Inc. | | | | | | | | | | | | |
293,728 | | (3 Month Secured Overnight Financing Rate + 6.75%, 0.75% Floor) | | | 11.33 | % | | | 09/17/2027 | | | | 294,280 | |
21,272 | | (1 Month LIBOR USD + 5.50%, 0.75% Floor) | | | 10.91 | % | | | 09/17/2027 | | | | 21,311 | |
443,535 | | Applied Systems, Inc. (3 Month Secured Overnight Financing Rate + 4.50%, 0.50% Floor) | | | 9.40 | % | | | 09/19/2026 | | | | 443,535 | |
| | APX Group, Inc., Senior Secured First Lien Term Loan | | | | | | | | | | | | |
162,433 | | (3 Month LIBOR USD + 3.25%, 0.50% Floor) | | | 8.25 | % | | | 07/10/2028 | | | | 161,955 | |
92 | | (Prime Rate + 2.25%, 0.50% Floor) | | | 10.25 | % | | | 07/10/2028 | | | | 91 | |
426,082 | | Ascend Learning LLC, Senior Secured First Lien Term Loan (1 Month LIBOR USD + 3.50%, 0.50% Floor) | | | 8.41 | % | | | 12/11/2028 | | | | 394,431 | |
103,216 | | Ascend Learning LLC, Senior Secured Second Lien Term Loan (1 Month Secured Overnight Financing Rate + 5.75%, 0.50%) | | | 10.47 | % | | | 12/10/2029 | | | | 89,712 | |
524,138 | | AssuredPartners, Inc., Senior Secured First Lien Term Loan (1 Month LIBOR USD + 3.50%) | | | 8.34 | % | | | 02/12/2027 | | | | 520,011 | |
143,550 | | AssuredPartners, Inc., Senior Secured First Lien Term Loan (1 Month Secured Overnight Financing Rate + 3.50%, 0.50%) | | | 8.31 | % | | | 02/12/2027 | | | | 142,294 | |
234,126 | | Astra Acquisition Corporation, Senior Secured First Lien Term Loan (1 Month LIBOR USD + 5.25%, 0.50%) | | | 10.09 | % | | | 10/25/2028 | | | | 203,252 | |
145,016 | | Asurion LLC, Senior Secured First Lien Term Loan (1 Month LIBOR USD + 3.25%) | | | 8.09 | % | | | 12/23/2026 | | | | 134,917 | |
239,786 | | Asurion LLC, Senior Secured First Lien Term Loan (1 Month LIBOR USD + 3.25%) | | | 8.09 | % | | | 07/30/2027 | | | | 220,603 | |
50,000 | | Asurion LLC, Senior Secured Second Lien Term Loan (1 Month LIBOR USD + 5.25%) | | | 10.09 | % | | | 01/31/2028 | | | | 41,837 | |
165,000 | | Asurion LLC, Senior Secured Second Lien Term Loan (1 Month LIBOR USD + 5.25%) | | | 10.09 | % | | | 01/19/2029 | | | | 137,032 | |
164,441 | | Aveanna Healthcare LLC, Senior Secured First Lien Term Loan (3 Month LIBOR USD + 3.75%, 0.50% Floor) | | | 8.70 | % | | | 07/17/2028 | | | | 140,420 | |
118,610 | | Aveanna Healthcare LLC, Senior Secured Second Lien Term Loan (1 Month LIBOR USD + 7.00%, 0.50% Floor) | | | 11.95 | % | | | 12/10/2029 | | | | 74,131 | |
226,188 | | Axalta Coating Systems US Holdings, Inc., Senior Secured First Lien Term Loan (1 Month Secured Overnight Financing Rate + 3.00%, 0.50% Floor) | | | 7.90 | % | | | 12/20/2029 | | | | 226,800 | |
428,597 | | Bally’s Corporation, Senior Secured First Lien Term Loan (1 Month LIBOR USD + 3.25%, 0.50% Floor) | | | 7.96 | % | | | 10/02/2028 | | | | 410,155 | |
546,174 | | Bausch & Lomb Corporation, Senior Secured First Lien Term Loan (3 Month Secured Overnight Financing Rate + 3.25%, 0.50% Floor) | | | 8.46 | % | | | 05/10/2027 | | | | 531,760 | |
197,416 | | BCP Renaissance Parent LLC, Senior Secured First Lien Term Loan (3 Month Secured Overnight Financing Rate + 3.50%, 1.00% Floor) | | | 8.40 | % | | | 11/02/2026 | | | | 196,182 | |
54,450 | | BCPE Empire Holdings, Inc., Senior Secured First Lien Term Loan (1 Month Secured Overnight Financing Rate + 4.63%, 0.50% Floor) | | | 9.53 | % | | | 06/11/2026 | | | | 53,964 | |
751,613 | | Blackstone CQP Holdco LP, Senior Secured First Lien Term Loan (3 Month LIBOR USD + 3.50%, 0.50% Floor) | | | 8.66 | % | | | 06/05/2028 | | | | 747,013 | |
36,793 | | Bright Bidco B.V., Senior Secured First Lien Term Loan (3 Month Secured Overnight Financing Rate + 1.00% + 1.00% PIK, 1.00% Floor) | | | 5.68 | % | | | 10/29/2027 | | | | 31,366 | |
690,865 | | Brookfield WEC Holdings, Inc., Senior Secured First Lien Term Loan (1 Month LIBOR USD + 2.75%, 0.50% Floor) | | | 7.59 | % | | | 08/01/2025 | | | | 688,350 | |
391,132 | | Brown Group Holding LLC, Senior Secured First Lien Term Loan (1 Month Secured Overnight Financing Rate + 2.50%, 0.50% Floor) | | | 7.41 | % | | | 06/07/2028 | | | | 388,281 | |
100,000 | | Caesars Entertainment, Inc., Senior Secured First Lien Term Loan (1 Month Secured Overnight Financing Rate + 3.25%, 0.50% Floor) | | | 8.16 | % | | | 02/06/2030 | | | | 99,667 | |
48,250 | | Calpine Corporation, Senior Secured First Lien Term Loan (1 Month LIBOR USD + 2.00%) | | | 6.84 | % | | | 08/12/2026 | | | | 48,022 | |
283,446 | | Camelot U.S. Acquisition 1 Company, Senior Secured First Lien Term Loan (1 Month LIBOR USD + 3.00%) | | | 7.84 | % | | | 10/30/2026 | | | | 283,180 | |
480,271 | | Carnival Corporation, Senior Secured First Lien Term Loan (1 Month LIBOR USD + 3.25%, 0.75% Floor) | | | 8.09 | % | | | 10/18/2028 | | | | 470,365 | |
525,714 | | Castle US Holding Corporation, Senior Secured First Lien Term Loan (1 Month LIBOR USD + 3.75%) | | | 8.59 | % | | | 01/29/2027 | | | | 347,255 | |
514,774 | | Castlelake Aviation One LLC, Senior Secured First Lien Term Loan (3 Month LIBOR USD + 2.75%, 0.50% Floor) | | | 7.62 | % | | | 10/22/2026 | | | | 510,550 | |
426,370 | | Cengage Learning, Inc., Senior Secured First Lien Term Loan (6 Month LIBOR USD + 4.75%, 1.00% Floor) | | | 9.88 | % | | | 07/14/2026 | | | | 396,793 | |
234,413 | | Central Parent, Inc., Senior Secured First Lien Term Loan (3 Month Secured Overnight Financing Rate + 4.25%, 0.50% Floor) | | | 9.15 | % | | | 07/06/2029 | | | | 234,053 | |
256,675 | | Charter Communications Operating LLC, Senior Secured First Lien Term Loan (1 Month Secured Overnight Financing Rate + 1.75%) | | | 6.56 | % | | | 02/01/2027 | | | | 254,710 | |
196,000 | | Charter Next Generation, Inc., Senior Secured First Lien Term Loan (1 Month Secured Overnight Financing Rate + 3.75%, 0.75% Floor) | | | 8.67 | % | | | 12/01/2027 | | | | 193,903 | |
354,600 | | CHG Healthcare Services, Inc., Senior Secured First Lien Term Loan (1 Month LIBOR USD + 3.25%, 0.50% Floor) | | | 8.09 | % | | | 09/29/2028 | | | | 351,719 | |
43,355 | | Cincinnati Bell, Inc., Senior Secured First Lien Term Loan (1 Month Secured Overnight Financing Rate + 3.25%, 0.50% Floor) | | | 8.16 | % | | | 11/22/2028 | | | | 42,522 | |
753,360 | | Clarios Global LP, Senior Secured First Lien Term Loan (1 Month LIBOR USD + 3.25%) | | | 8.09 | % | | | 04/30/2026 | | | | 750,847 | |
114,550 | | Clear Channel Outdoor Holdings, Inc., Senior Secured First Lien Term Loan (3 Month LIBOR USD + 3.50%) | | | 8.33 | % | | | 08/21/2026 | | | | 107,010 | |
254,893 | | ClubCorp Holdings, Inc., Senior Secured First Lien Term Loan (1 Month LIBOR USD + 2.75%) | | | 7.59 | % | | | 09/18/2024 | | | | 244,060 | |
241,961 | | CMG Media Corporation, Senior Secured First Lien Term Loan (3 Month LIBOR USD + 3.50%) | | | 8.66 | % | | | 12/17/2026 | | | | 215,103 | |
427,431 | | CNT Holdings I Corporation, Senior Secured First Lien Term Loan (3 Month Secured Overnight Financing Rate + 3.50%, 0.75% Floor) | | | 8.13 | % | | | 11/08/2027 | | | | 421,447 | |
21,983 | | Columbus McKinnon Corporation, Senior Secured First Lien Term Loan (3 Month LIBOR USD + 2.75%, 0.50% Floor) | | | 7.94 | % | | | 05/15/2028 | | | | 21,887 | |
377,200 | | Compass Power Generation LLC, Senior Secured First Lien Term Loan (1 Month Secured Overnight Financing Rate + 4.25%, 1.00% Floor) | | | 9.17 | % | | | 04/16/2029 | | | | 376,376 | |
137,900 | | Conair Holdings LLC, Senior Secured First Lien Term Loan (3 Month LIBOR USD + 3.75%, 0.50% Floor) | | | 8.91 | % | | | 05/17/2028 | | | | 126,868 | |
87,300 | | Connect U.S. Finco LLC, Senior Secured First Lien Term Loan (1 Month LIBOR USD + 3.50%, 1.00% Floor) | | | 8.14 | % | | | 12/11/2026 | | | | 86,891 | |
136,500 | | Conservice Midco LLC, Senior Secured First Lien Term Loan (1 Month LIBOR USD + 4.25%) | | | 9.09 | % | | | 05/13/2027 | | | | 134,481 | |
194,560 | | Constant Contact, Inc., Senior Secured First Lien Term Loan (3 Month LIBOR USD + 4.00%, 0.75% Floor) | | | 8.81 | % | | | 02/10/2028 | | | | 184,264 | |
228,248 | | Corelogic, Inc., Senior Secured First Lien Term Loan (1 Month LIBOR USD + 3.50%, 0.50% Floor) | | | 8.38 | % | | | 06/02/2028 | | | | 195,398 | |
201,005 | | Cornerstone OnDemand, Inc., Senior Secured First Lien Term Loan (1 Month LIBOR USD + 3.75%, 0.50% Floor) | | | 8.59 | % | | | 10/16/2028 | | | | 186,181 | |
102,041 | | Cyanco Intermediate 2 Corporation, Senior Secured First Lien Term Loan (1 Month LIBOR USD + 3.50%) | | | 8.34 | % | | | 03/17/2025 | | | | 99,541 | |
356,320 | | Cyxtera DC Holdings, Inc., Senior Secured First Lien Term Loan (3 Month LIBOR USD + 3.00%, 1.00% Floor) | | | 7.82 | % | | | 05/01/2024 | | | | 291,441 | |
278,849 | | DCert Buyer, Inc., Senior Secured First Lien Term Loan (6 Month Secured Overnight Financing Rate + 4.00%) | | | 8.70 | % | | | 10/16/2026 | | | | 273,665 | |
95,000 | | DCert Buyer, Inc., Senior Secured Second Lien Term Loan (6 Month Secured Overnight Financing Rate + 7.00%) | | | 11.70 | % | | | 02/19/2029 | | | | 88,323 | |
388,219 | | Deerfield Dakota Holding LLC, Senior Secured First Lien Term Loan (3 Month Secured Overnight Financing Rate + 3.75%, 1.00% Floor) | | | 8.56 | % | | | 04/09/2027 | | | | 376,897 | |
415,000 | | Delta 2 Luxembourg SARL (1 Month Secured Overnight Financing Rate + 3.25%, 0.50% Floor) | | | 8.06 | % | | | 01/15/2030 | | | | 415,693 | |
245,573 | | DexKo Global, Inc., Senior Secured First Lien Term Loan (3 Month LIBOR USD + 3.75%, 0.50% Floor) | | | 8.91 | % | | | 10/04/2028 | | | | 230,685 | |
387,327 | | DG Investment Intermediate Holdings 2, Inc., Senior Secured First Lien Term Loan (1 Month Secured Overnight Financing Rate + 3.75%, 0.75% Floor) | | | 8.56 | % | | | 03/31/2028 | | | | 377,026 | |
45,000 | | DG Investment Intermediate Holdings 2, Inc., Senior Secured Second Lien Term Loan (1 Month LIBOR USD + 6.75%, 0.75% Floor) | | | 11.59 | % | | | 03/30/2029 | | | | 39,816 | |
617,188 | | Diamond (BC) B.V., Senior Secured First Lien Term Loan (3 Month LIBOR USD + 2.75%, 0.50% Floor) | | | 7.58 | % | | | 09/29/2028 | | | | 615,694 | |
121,344 | | Diamond Sports Group LLC, Senior Secured Second Lien Term Loan (3 Month Secured Overnight Financing Rate + 3.40%) | | | 8.03 | % (d) | | | 08/24/2026 | | | | 6,952 | |
385,542 | | DIRECTV Financing LLC, Senior Secured First Lien Term Loan (1 Month LIBOR USD + 5.00%, 0.75% Floor) | | | 9.84 | % | | | 08/02/2027 | | | | 371,917 | |
141,317 | | Dynasty Acquisition Company, Inc., Senior Secured First Lien Term Loan (1 Month Secured Overnight Financing Rate + 3.50%) | | | 8.41 | % | | | 04/06/2026 | | | | 138,460 | |
75,977 | | Dynasty Acquisition Company, Inc., Senior Secured First Lien Term Loan (1 Month Secured Overnight Financing Rate + 3.50%) | | | 8.41 | % | | | 04/06/2026 | | | | 74,441 | |
277,200 | | Echo Global Logistics, Inc., Senior Secured First Lien Term Loan (1 Month LIBOR USD + 3.50%, 0.50% Floor) | | | 8.34 | % | | | 11/24/2028 | | | | 269,527 | |
108,544 | | EG America LLC, Senior Secured First Lien Delayed-Draw Term Loan (1 Month LIBOR USD + 4.25%, 0.50% Floor) | | | 9.09 | % | | | 03/31/2026 | | | | 104,175 | |
184,348 | | EG Group Ltd., Senior Secured First Lien Term Loan (1 Month LIBOR USD + 4.00%) | | | 8.84 | % | | | 02/06/2025 | | | | 176,902 | |
211,777 | | Eisner Advisory Group LLC, Senior Secured First Lien Term Loan (1 Month Secured Overnight Financing Rate + 5.25%, 0.75% Floor) | | | 10.17 | % | | | 07/28/2028 | | | | 212,041 | |
67,725 | | Element Materials Technology Group US Holdings, Inc., Senior Secured First Lien Delayed-Draw Term Loan (3 Month Secured Overnight Financing Rate + 4.25%, 0.50% Floor) | | | 9.25 | % | | | 06/22/2029 | | | | 67,090 | |
146,738 | | Element Materials Technology Group US Holdings, Inc., Senior Secured First Lien Term Loan (3 Month Secured Overnight Financing Rate + 4.25%, 0.50% Floor) | | | 9.25 | % | | | 06/22/2029 | | | | 145,362 | |
202,281 | | Endurance International Group Holdings, Inc., Senior Secured First Lien Term Loan (1 Month LIBOR USD + 3.50%, 0.75% Floor) | | | 8.22 | % | | | 02/10/2028 | | | | 189,638 | |
153,271 | | Energizer Holdings, Inc., Senior Secured First Lien Term Loan (1 Month Secured Overnight Financing Rate + 2.25%, 0.50% Floor) | | | 7.12 | % | | | 12/22/2027 | | | | 152,409 | |
201,367 | | Envision Healthcare Corporation, Senior Secured First Lien Term Loan (3 Month Secured Overnight Financing Rate + 3.75%, 1.00% Floor) | | | 8.65 | % | | | 03/31/2027 | | | | 34,434 | |
82,392 | | Envision Healthcare Corporation, Senior Secured First Lien Term Loan (3 Month Secured Overnight Financing Rate + 4.25%, 1.00% Floor) | | | 9.15 | % | | | 03/31/2027 | | | | 21,010 | |
131,963 | | Everi Holdings, Inc., Senior Secured First Lien Term Loan (1 Month LIBOR USD + 2.50%, 0.50% Floor) | | | 7.34 | % | | | 08/03/2028 | | | | 131,808 | |
678,485 | | EW Scripps Company, Senior Secured First Lien Term Loan (1 Month Secured Overnight Financing Rate + 2.56%, 0.75% Floor) | | | 7.48 | % | | | 05/01/2026 | | | | 663,169 | |
133,759 | | Exgen Renewables IV LLC, Senior Secured First Lien Term Loan (3 Month LIBOR USD + 2.50%, 1.00% Floor) | | | 7.46 | % | | | 12/15/2027 | | | | 133,285 | |
331,650 | | Fertitta Entertainment LLC, Senior Secured First Lien Term Loan (1 Month Secured Overnight Financing Rate + 4.00%, 0.50% Floor) | | | 8.81 | % | | | 01/29/2029 | | | | 327,279 | |
295,299 | | Filtration Group Corporation, Senior Secured First Lien Term Loan (1 Month LIBOR USD + 3.00%) | | | 7.84 | % | | | 03/31/2025 | | | | 294,837 | |
292,050 | | FINThrive Software Intermediate Holdings, Inc., Senior Secured First Lien Term Loan (1 Month LIBOR USD + 4.00%, 0.50% Floor) | | | 8.84 | % | | | 12/18/2028 | | | | 272,702 | |
187,311 | | First Advantage Holdings LLC, Senior Secured First Lien Term Loan (1 Month LIBOR USD + 2.75%) | | | 7.59 | % | | | 01/29/2027 | | | | 186,579 | |
107,055 | | Foresight Energy LLC, Senior Secured First Lien Term Loan (3 Month LIBOR USD + 8.00%, 1.50% Floor) | | | 13.16 | % (k) | | | 06/30/2027 | | | | 107,055 | |
284,693 | | Freeport LNG Investments LLLP, Senior Secured First Lien Term Loan (3 Month LIBOR USD + 3.50%, 0.50% Floor) | | | 8.31 | % | | | 12/21/2028 | | | | 276,457 | |
455,000 | | Garda World Security Corporation, Senior Secured First Lien Term Loan (1 Month Secured Overnight Financing Rate + 4.25%) | | | 9.11 | % | | | 10/30/2026 | | | | 451,305 | |
223,875 | | Garda World Security Corporation, Senior Secured First Lien Term Loan (1 Month Secured Overnight Financing Rate + 4.25%) | | | 9.01 | % | | | 02/01/2029 | | | | 217,580 | |
94,525 | | Gates Global LLC, Senior Secured First Lien Term Loan (1 Month Secured Overnight Financing Rate + 3.50%, 0.50% Floor) | | | 8.31 | % | | | 11/16/2029 | | | | 94,444 | |
| | Getty Images, Inc., Senior Secured First Lien Term Loan | | | | | | | | | | | | |
161,637 | | (3 Month Secured Overnight Financing Rate + 4.50%) | | | 9.40 | % | | | 02/19/2026 | | | | 161,772 | |
10,027 | | (1 Month Secured Overnight Financing Rate + 4.50%) | | | 9.41 | % | | | 02/19/2026 | | | | 10,035 | |
154,554 | | GIP II Blue Holding LP, Senior Secured First Lien Term Loan (3 Month LIBOR USD + 4.50%, 1.00% Floor) | | | 9.66 | % | | | 09/29/2028 | | | | 154,023 | |
147,685 | | Global Medical Response, Inc., Senior Secured First Lien Term Loan (1 Month LIBOR USD + 4.25%, 1.00% Floor) | | | 9.20 | % | | | 03/14/2025 | | | | 104,487 | |
208,980 | | Global Medical Response, Inc., Senior Secured First Lien Term Loan (3 Month LIBOR USD + 4.25%, 1.00% Floor) | | | 9.24 | % | | | 10/02/2025 | | | | 148,028 | |
84,788 | | Go Daddy Operating Company LLC, Senior Secured First Lien Term Loan (1 Month Secured Overnight Financing Rate + 3.25%) | | | 8.06 | % | | | 11/09/2029 | | | | 84,845 | |
515,813 | | Gogo Intermediate Holdings LLC, Senior Secured First Lien Term Loan (3 Month Secured Overnight Financing Rate + 3.75%, 0.75% Floor) | | | 8.70 | % | | | 04/28/2028 | | | | 512,911 | |
174,653 | | Grab Holdings, Inc., Senior Secured First Lien Term Loan (1 Month LIBOR USD + 4.50%, 1.00% Floor) | | | 9.35 | % | | | 01/29/2026 | | | | 174,347 | |
456,913 | | Graham Packaging Company, Inc., Senior Secured First Lien Term Loan (1 Month LIBOR USD + 3.00%, 0.75% Floor) | | | 7.84 | % | | | 08/04/2027 | | | | 453,431 | |
601,856 | | Gray Television, Inc., Senior Secured First Lien Term Loan (1 Month Secured Overnight Financing Rate + 2.50%) | | | 7.36 | % | | | 01/02/2026 | | | | 592,831 | |
322,612 | | Great Outdoors Group LLC, Senior Secured First Lien Term Loan (1 Month LIBOR USD + 3.75%, 0.75% Floor) | | | 8.59 | % | | | 03/06/2028 | | | | 318,984 | |
450,345 | | Greeneden U.S. Holdings II LLC, Senior Secured First Lien Term Loan (1 Month LIBOR USD + 4.00%, 0.75% Floor) | | | 8.84 | % | | | 12/01/2027 | | | | 444,610 | |
68,277 | | Greystone Select Financial LLC, Senior Secured First Lien Term Loan (3 Month LIBOR USD + 5.00%, 0.75% Floor) | | | 9.80 | % | | | 06/16/2028 | | | | 64,180 | |
165,455 | | Grinding Media, Inc., Senior Secured First Lien Term Loan (1 Month LIBOR USD + 4.00%, 0.75% Floor) | | | 8.70 | % | | | 10/12/2028 | | | | 156,355 | |
225,800 | | Heartland Dental LLC, Senior Secured First Lien Term Loan (1 Month LIBOR USD + 4.00%) | | | 8.84 | % | | | 04/30/2025 | | | | 213,005 | |
537,512 | | H-Food Holdings LLC, Senior Secured First Lien Term Loan (1 Month LIBOR USD + 3.69%) | | | 8.53 | % | | | 05/23/2025 | | | | 463,814 | |
246,250 | | Hightower Holding LLC, Senior Secured First Lien Term Loan (3 Month LIBOR USD + 4.00%, 0.75% Floor) | | | 8.82 | % | | | 04/21/2028 | | | | 233,322 | |
181,300 | | Horizon Therapeutics USA, Inc., Senior Secured First Lien Term Loan (1 Month LIBOR USD + 1.75%, 0.50% Floor) | | | 6.56 | % | | | 03/15/2028 | | | | 181,172 | |
441,139 | | Hunter Douglas Holding B.V., Senior Secured First Lien Term Loan (3 Month Secured Overnight Financing Rate + 3.50%, 0.50% Floor) | | | 8.37 | % | | | 02/26/2029 | | | | 398,287 | |
128,959 | | Hyland Software, Inc., Senior Secured Second Lien Term Loan (1 Month LIBOR USD + 6.25%, 0.75% Floor) | | | 11.09 | % | | | 07/07/2025 | | | | 123,800 | |
166,329 | | ICON Luxembourg SARL, Senior Secured First Lien Term Loan (3 Month Secured Overnight Financing Rate + 2.25%, 0.50% Floor) | | | 7.41 | % | | | 07/03/2028 | | | | 166,133 | |
135,769 | | IHeartCommunications, Inc., Senior Secured First Lien Term Loan (1 Month LIBOR USD + 3.00%) | | | 7.84 | % | | | 05/01/2026 | | | | 120,760 | |
155,000 | | Ineos US Finance LLC, Senior Secured First Lien Term Loan (1 Month Secured Overnight Financing Rate + 3.50%) | | | 8.41 | % | | | 02/19/2030 | | | | 154,419 | |
436,664 | | Intelsat Jackson Holdings S.A., Senior Secured First Lien Term Loan (3 Month Secured Overnight Financing Rate + 4.25%, 0.50% Floor) | | | 9.08 | % | | | 02/01/2029 | | | | 433,024 | |
297,103 | | ION Trading Technologies SARL, Senior Secured First Lien Term Loan (3 Month LIBOR USD + 4.75%) | | | 9.91 | % | | | 03/31/2028 | | | | 280,950 | |
296,675 | | IRB Holding Corporation, Senior Secured First Lien Term Loan (1 Month Secured Overnight Financing Rate + 3.00%, 0.75% Floor) | | | 7.69 | % | | | 12/15/2027 | | | | 292,204 | |
583,503 | | Iron Mountain Information Management LLC, Senior Secured First Lien Term Loan (1 Month LIBOR USD + 1.75%) | | | 6.59 | % | | | 01/02/2026 | | | | 581,314 | |
116,518 | | Ivanti Software, Inc., Senior Secured First Lien Term Loan (3 Month LIBOR USD + 4.25%, 0.75% Floor) | | | 9.21 | % | | | 12/01/2027 | | | | 96,097 | |
398,577 | | Jazz Pharmaceuticals, Inc, Senior Secured First Lien Term Loan (1 Month LIBOR USD + 3.50%, 0.50% Floor) | | | 8.34 | % | | | 05/05/2028 | | | | 397,538 | |
389,075 | | Jo-Ann Stores LLC, Senior Secured First Lien Term Loan (3 Month LIBOR USD + 4.75%, 0.75% Floor) | | | 9.57 | % | | | 07/07/2028 | | | | 218,077 | |
515,059 | | Kenan Advantage Group, Inc., Senior Secured First Lien Term Loan (1 Month LIBOR USD + 3.75%, 0.75% Floor) | | | 8.59 | % | | | 03/24/2026 | | | | 512,270 | |
207,476 | | Kestrel Bidco, Inc., Senior Secured First Lien Term Loan (1 Month Secured Overnight Financing Rate + 3.00%, 1.00% Floor) | | | 7.86 | % | | | 12/11/2026 | | | | 199,381 | |
123,438 | | KKR Apple Bidco LLC, Senior Secured First Lien Term Loan (1 Month LIBOR USD + 2.75%, 0.50% Floor) | | | 7.59 | % | | | 09/22/2028 | | | | 122,423 | |
381,187 | | Kronos Acquisition Holdings, Inc., Senior Secured First Lien Term Loan (3 Month LIBOR USD + 3.75%, 0.50% Floor) | | | 8.70 | % | | | 12/22/2026 | | | | 367,316 | |
197,870 | | LBM Acquisition LLC, Senior Secured First Lien Term Loan (1 Month LIBOR USD + 3.75%, 0.75% Floor) | | | 8.59 | % | | | 12/17/2027 | | | | 187,018 | |
686,000 | | Leslie’s Poolmart, Inc., Senior Secured First Lien Term Loan (1 Month LIBOR USD + 2.50%, 0.50% Floor) | | | 7.34 | % | | | 03/09/2028 | | | | 677,531 | |
102,183 | | Lions Gate Capital Holdings LLC, Senior Secured First Lien Term Loan (1 Month LIBOR USD + 2.25%) | | | 7.09 | % | | | 03/24/2025 | | | | 100,820 | |
182,804 | | LogMeIn, Inc., Senior Secured First Lien Term Loan (1 Month LIBOR USD + 4.75%) | | | 9.38 | % | | | 08/31/2027 | | | | 105,366 | |
280,182 | | Lumen Technologies, Inc., Senior Secured First Lien Term Loan (1 Month Secured Overnight Financing Rate + 2.25%) | | | 7.17 | % | | | 03/15/2027 | | | | 186,146 | |
395,221 | | Lummus Technology Holdings V LLC, Senior Secured First Lien Term Loan (1 Month LIBOR USD + 3.50%) | | | 8.34 | % | | | 06/30/2027 | | | | 389,109 | |
722,138 | | Madison IAQ LLC, Senior Secured First Lien Term Loan (6 Month LIBOR USD + 3.25%, 0.50% Floor) | | | 8.30 | % | | | 06/21/2028 | | | | 689,009 | |
58,197 | | Maravai Intermediate Holdings LLC, Senior Secured First Lien Term Loan (3 Month Secured Overnight Financing Rate + 3.00%, 0.50% Floor) | | | 7.63 | % | | | 10/19/2027 | | | | 58,015 | |
542,552 | | Mavis Tire Express Services Topco Corporation, Senior Secured First Lien Term Loan (1 Month Secured Overnight Financing Rate + 4.00%, 0.75% Floor) | | | 8.92 | % | | | 05/04/2028 | | | | 533,310 | |
172,565 | | McAfee Corporation, Senior Secured First Lien Term Loan (1 Month Secured Overnight Financing Rate + 3.75%, 0.50% Floor) | | | 8.52 | % | | | 03/01/2029 | | | | 162,772 | |
653,400 | | Medline Borrower LP, Senior Secured First Lien Term Loan (1 Month LIBOR USD + 3.25%, 0.50% Floor) | | | 8.09 | % | | | 10/23/2028 | | | | 637,934 | |
264,939 | | Messer Industries GmbH, Senior Secured First Lien Term Loan (3 Month LIBOR USD + 2.50%) | | | 7.23 | % | | | 03/02/2026 | | | | 264,704 | |
98,125 | | MIC Glen LLC, Senior Secured First Lien Term Loan (2 Month LIBOR USD + 3.50%, 0.50% Floor) | | | 8.34 | % | | | 07/21/2028 | | | | 95,316 | |
134,880 | | Michaels Companies, Inc., Senior Secured First Lien Term Loan (3 Month LIBOR USD + 4.25%, 0.75% Floor) | | | 9.41 | % | | | 04/14/2028 | | | | 124,182 | |
476,758 | | Milano Acquisition Corporation, Senior Secured First Lien Term Loan (3 Month Secured Overnight Financing Rate + 4.00%, 0.75% Floor) | | | 9.00 | % | | | 10/01/2027 | | | | 456,496 | |
127,500 | | Mileage Plus Holdings LLC, Senior Secured First Lien Term Loan (3 Month LIBOR USD + 5.25%, 1.00% Floor) | | | 10.21 | % | | | 06/21/2027 | | | | 132,529 | |
381,110 | | Minotaur Acquisition, Inc., Senior Secured First Lien Term Loan (1 Month Secured Overnight Financing Rate + 4.75%) | | | 9.66 | % | | | 03/27/2026 | | | | 371,447 | |
281,198 | | Mirion Technologies (US), Inc., Senior Secured First Lien Term Loan (6 Month LIBOR USD + 2.75%, 0.50% Floor) | | | 7.48 | % | | | 10/20/2028 | | | | 279,660 | |
390,543 | | Mitchell International, Inc., Senior Secured First Lien Term Loan (3 Month LIBOR USD + 3.75%, 0.50% Floor) | | | 8.50 | % | | | 10/16/2028 | | | | 370,239 | |
55,000 | | Mitchell International, Inc., Senior Secured Second Lien Term Loan (1 Month LIBOR USD + 6.50%, 0.50% Floor) | | | 11.34 | % | | | 10/15/2029 | | | | 48,056 | |
350,563 | | Monogram Food Solutions LLC, Senior Secured First Lien Term Loan (1 Month LIBOR USD + 4.00%, 0.50% Floor) | | | 8.88 | % | | | 08/28/2028 | | | | 338,293 | |
83,387 | | NASCAR Holdings LLC, Senior Secured First Lien Term Loan (1 Month LIBOR USD + 2.50%) | | | 7.34 | % | | | 10/19/2026 | | | | 83,518 | |
514,258 | | Natgasoline LLC, Senior Secured First Lien Term Loan (1 Month LIBOR USD + 3.50%) | | | 8.19 | % | | | 11/14/2025 | | | | 509,116 | |
58,502 | | National Intergovernmental Purchasing Alliance Company, Senior Secured First Lien Term Loan (3 Month Secured Overnight Financing Rate + 3.50%) | | | 8.40 | % | | | 05/23/2025 | | | | 57,829 | |
115,103 | | NCR Corporation, Senior Secured First Lien Term Loan (3 Month LIBOR USD + 2.50%) | | | 7.33 | % | | | 08/28/2026 | | | | 113,759 | |
196,915 | | NEP Group, Inc., Senior Secured First Lien Term Loan (1 Month LIBOR USD + 3.25%) | | | 8.09 | % | | | 10/20/2025 | | | | 183,951 | |
266,625 | | Olympus Water US Holding Corporation, Senior Secured First Lien Term Loan (3 Month LIBOR USD + 3.75%, 0.50% Floor) | | | 8.94 | % | | | 11/09/2028 | | | | 253,295 | |
500,505 | | OneDigital Borrower LLC, Senior Secured First Lien Term Loan (1 Month Secured Overnight Financing Rate + 4.25%, 0.50% Floor) | | | 9.16 | % | | | 11/16/2027 | | | | 482,987 | |
377,138 | | Organon & Company, Senior Secured First Lien Term Loan (3 Month LIBOR USD + 3.00%, 0.50% Floor) | | | 8.00 | % | | | 06/02/2028 | | | | 377,451 | |
334,075 | | Oryx Midstream Services Permian Basin LLC, Senior Secured First Lien Term Loan (1 Month Secured Overnight Financing Rate + 3.25%, 0.50% Floor) | | | 8.06 | % | | | 10/05/2028 | | | | 328,938 | |
95,750 | | Outcomes Group Holdings, Inc., Senior Secured First Lien Term Loan (1 Month LIBOR USD + 3.25%) | | | 8.09 | % | | | 10/24/2025 | | | | 93,406 | |
420,329 | | Packaging Coordinators Midco, Inc., Senior Secured First Lien Term Loan (3 Month LIBOR USD + 3.50%, 0.75% Floor) | | | 8.23 | % | | | 11/30/2027 | | | | 411,773 | |
474,214 | | Packers Holdings LLC, Senior Secured First Lien Term Loan (1 Month Secured Overnight Financing Rate + 3.25%, 0.75% Floor) | | | 8.09 | % | | | 03/06/2028 | | | | 430,252 | |
263,306 | | PAI HoldCo, Inc., Senior Secured First Lien Term Loan (3 Month LIBOR USD + 3.75%, 0.75% Floor) | | | 8.58 | % | | | 10/28/2027 | | | | 247,755 | |
85,000 | | Par Petroleum LLC, Senior Secured First Lien Term Loan (3 Month Secured Overnight Financing Rate + 4.25%, 0.50% Floor) | | | 9.24 | % | | | 02/28/2030 | | | | 83,583 | |
201,411 | | Park River Holdings, Inc., Senior Secured First Lien Term Loan (3 Month LIBOR USD + 3.25%, 0.75% Floor) | | | 8.00 | % | | | 12/28/2027 | | | | 185,991 | |
101,130 | | PCI Gaming Authority, Senior Secured First Lien Term Loan (1 Month LIBOR USD + 2.50%) | | | 7.34 | % | | | 05/29/2026 | | | | 101,151 | |
512,855 | | PECF USS Intermediate Holding III Corporation, Senior Secured First Lien Term Loan (1 Month LIBOR USD + 4.25%, 0.50% Floor) | | | 9.09 | % | | | 12/15/2028 | | | | 434,519 | |
38,319 | | Pediatric Associates Holding Company LLC, Senior Secured First Lien Delayed-Draw Term Loan (1 Month LIBOR USD + 3.25%, 0.50% Floor) | | | 8.09 | % | | | 12/29/2028 | | | | 37,565 | |
296,609 | | Pediatric Associates Holding Company LLC, Senior Secured First Lien Term Loan (1 Month LIBOR USD + 3.25%, 0.50% Floor) | | | 8.09 | % | | | 12/29/2028 | | | | 290,769 | |
124,063 | | Penn National Gaming, Inc., Senior Secured First Lien Term Loan (1 Month Secured Overnight Financing Rate + 2.75%, 0.50% Floor) | | | 7.66 | % | | | 05/03/2029 | | | | 123,962 | |
658,526 | | Peraton Corporation, Senior Secured First Lien Term Loan (1 Month LIBOR USD + 3.75%, 0.75% Floor) | | | 8.59 | % | | | 02/01/2028 | | | | 651,668 | |
173,688 | | Perrigo Investments LLC, Senior Secured First Lien Term Loan (1 Month Secured Overnight Financing Rate + 2.25%, 0.50% Floor) | | | 7.16 | % | | | 04/20/2029 | | | | 172,819 | |
413,622 | | Petco Health and Wellness Company, Inc., Senior Secured First Lien Term Loan (3 Month Secured Overnight Financing Rate + 3.25%, 0.75% Floor) | | | 8.41 | % | | | 03/03/2028 | | | | 407,095 | |
206,850 | | PetSmart, Inc., Senior Secured First Lien Term Loan (1 Month Secured Overnight Financing Rate + 3.75%, 0.75% Floor) | | | 8.66 | % | | | 02/11/2028 | | | | 205,515 | |
290,122 | | PetVet Care Centers LLC, Senior Secured First Lien Term Loan (1 Month LIBOR USD + 3.50%, 0.75% Floor) | | | 8.34 | % | | | 02/14/2025 | | | | 280,838 | |
335,513 | | PG&E Corporation, Senior Secured First Lien Term Loan (1 Month LIBOR USD + 3.00%, 0.50% Floor) | | | 7.88 | % | | | 06/23/2025 | | | | 335,147 | |
695,800 | | Phoenix Guarantor, Inc., Senior Secured First Lien Term Loan (1 Month LIBOR USD + 3.50%) | | | 8.34 | % | | | 03/05/2026 | | | | 680,628 | |
115,340 | | Phoenix Services International LLC, Senior Secured First Lien Delayed-Draw Term Loan (1 Month Secured Overnight Financing Rate + 12.00%, 2.00% Floor) | | | 16.81 | % | | | 05/29/2023 | | | | 106,920 | |
54,572 | | Phoenix Services International LLC, Senior Secured First Lien Term Loan (1 Month Secured Overnight Financing Rate + 2.00% or 10.00% PIK, 2.00% Floor) | | | 16.81 | % | | | 05/29/2023 | | | | 52,526 | |
403,994 | | Phoenix Services International LLC, Senior Secured First Lien Term Loan (3 Month LIBOR USD + 3.75%, 1.00% Floor) | | | 6.67 | % (d) | | | 03/03/2025 | | | | 42,482 | |
259,350 | | Playa Resorts Holding BV, Senior Secured First Lien Term Loan (1 Month Secured Overnight Financing Rate + 4.25%, 0.50% Floor) | | | 8.99 | % | | | 01/05/2029 | | | | 258,235 | |
213,925 | | PMHC II, Inc., Senior Secured First Lien Term Loan (3 Month Secured Overnight Financing Rate + 4.25%, 0.50% Floor) | | | 9.08 | % | | | 04/23/2029 | | | | 189,134 | |
93,100 | | PointClickCare Technologies, Inc., Senior Secured First Lien Term Loan (1 Month LIBOR USD + 3.00%, 0.75% Floor) | | | 7.88 | % | | | 12/29/2027 | | | | 91,936 | |
266,674 | | Polar US Borrower LLC, Senior Secured First Lien Term Loan (6 Month Secured Overnight Financing Rate + 4.75%) | | | 9.02 | % | | | 10/15/2025 | | | | 223,195 | |
176,488 | | Polaris Newco LLC, Senior Secured First Lien Term Loan (3 Month LIBOR USD + 4.00%, 0.50% Floor) | | | 9.16 | % | | | 06/02/2028 | | | | 161,437 | |
73,688 | | PQ Corporation, Senior Secured First Lien Term Loan (3 Month LIBOR USD + 2.50%, 0.50% Floor) | | | 7.33 | % | | | 06/09/2028 | | | | 73,227 | |
44,063 | | PRA Health Sciences, Inc., Senior Secured First Lien Term Loan (3 Month LIBOR USD + 2.25%, 0.50% Floor) | | | 7.00 | % | | | 07/03/2028 | | | | 44,011 | |
266,063 | | Pregis Topco LLC, Senior Secured First Lien Term Loan (1 Month Secured Overnight Financing Rate + 3.75%) | | | 8.67 | % | | | 07/31/2026 | | | | 260,209 | |
| | Pretium PKG Holdings, Inc., Senior Secured First Lien Term Loan | | | | | | | | | | | | |
223,136 | | (3 Month LIBOR USD + 4.00%, 0.50% Floor) | | | 8.79 | % | | | 10/02/2028 | | | | 179,346 | |
73,114 | | (3 Month LIBOR USD + 4.00%, 0.50% Floor) | | | 9.01 | % | | | 10/02/2028 | | | | 58,765 | |
| | Pretium PKG Holdings, Inc., Senior Secured Second Lien Term Loan | | | | | | | | | | | | |
32,500 | | (3 Month LIBOR USD + 6.75%, 0.50% Floor) | | | 11.54 | % | | | 09/30/2029 | | | | 20,848 | |
32,500 | | (3 Month LIBOR USD + 6.75%, 0.50% Floor) | | | 11.76 | % | | | 09/30/2029 | | | | 20,848 | |
348,665 | | Prometric Holdings, Inc., Senior Secured First Lien Term Loan (1 Month LIBOR USD + 3.00%, 1.00% Floor) | | | 7.85 | % | | | 01/29/2025 | | | | 327,528 | |
691,250 | | Proofpoint, Inc., Senior Secured First Lien Term Loan (1 Month LIBOR USD + 3.25%, 0.50% Floor) | | | 8.09 | % | | | 08/31/2028 | | | | 677,231 | |
279,291 | | Pug LLC, Senior Secured First Lien Term Loan (1 Month LIBOR USD + 4.25%, 0.50% Floor) | | | 9.09 | % | | | 02/13/2027 | | | | 201,788 | |
208,780 | | Pug LLC, Senior Secured First Lien Term Loan (1 Month LIBOR USD + 3.50%) | | | 8.34 | % | | | 02/12/2027 | | | | 152,411 | |
574,200 | | QUIKRETE Holdings, Inc., Senior Secured First Lien Term Loan (1 Month LIBOR USD + 3.00%) | | | 7.84 | % | | | 03/18/2029 | | | | 568,358 | |
221,526 | | Radiate Holdco LLC, Senior Secured First Lien Term Loan (1 Month LIBOR USD + 3.25%, 0.75% Floor) | | | 8.09 | % | | | 09/25/2026 | | | | 182,175 | |
| | Radiology Partners, Inc., Senior Secured First Lien Term Loan | | | | | | | | | | | | |
367,093 | | (1 Month LIBOR USD + 4.25%) | | | 8.88 | % | | | 07/09/2025 | | | | 297,688 | |
145,000 | | (1 Month LIBOR USD + 4.25%) | | | 4.33 | % | | | 07/09/2025 | | | | 117,586 | |
271,621 | | RealPage, Inc., Senior Secured First Lien Term Loan (1 Month LIBOR USD + 3.00%, 0.50% Floor) | | | 7.84 | % | | | 04/24/2028 | | | | 264,107 | |
308,046 | | RegionalCare Hospital Partners Holdings, Inc., Senior Secured First Lien Term Loan (3 Month LIBOR USD + 3.75%) | | | 8.58 | % | | | 11/14/2025 | | | | 294,184 | |
333,963 | | Renaissance Holding Corporation, Senior Secured First Lien Term Loan (1 Month LIBOR USD + 3.25%) | | | 8.09 | % | | | 05/30/2025 | | | | 325,378 | |
116,541 | | Rent-A-Center, Inc., Senior Secured First Lien Term Loan (3 Month LIBOR USD + 3.25%, 0.50% Floor) | | | 8.13 | % | | | 02/17/2028 | | | | 115,667 | |
25,601 | | Rentpath, Inc., Senior Secured First Lien Term Loan (Prime Rate + 0.00%) | | | 3.25 | % | | | 04/25/2024 | | | | 384 | |
123,074 | | Reynolds Consumer Products LLC, Senior Secured First Lien Term Loan (1 Month Secured Overnight Financing Rate + 1.75%) | | | 6.47 | % | | | 02/04/2027 | | | | 122,333 | |
233,238 | | Scientific Games International, Inc., Senior Secured First Lien Term Loan (1 Month Secured Overnight Financing Rate + 3.00%, 0.50% Floor) | | | 7.96 | % | | | 04/16/2029 | | | | 231,828 | |
157,828 | | Securus Technologies Holdings, Inc., Senior Secured First Lien Term Loan (3 Month LIBOR USD + 4.50%, 1.00% Floor) | | | 9.66 | % | | | 11/01/2024 | | | | 113,321 | |
264,095 | | Sinclair Television Group, Inc., Senior Secured First Lien Term Loan (1 Month LIBOR USD + 2.50%) | | | 7.35 | % | | | 09/30/2026 | | | | 242,967 | |
203,575 | | Six Flags Theme Parks, Inc., Senior Secured First Lien Term Loan (1 Month LIBOR USD + 1.75%) | | | 6.60 | % | | | 04/17/2026 | | | | 201,370 | |
137,750 | | SkyMiles IP Ltd., Senior Secured First Lien Term Loan (3 Month LIBOR USD + 3.75%, 1.00% Floor) | | | 8.56 | % | | | 10/20/2027 | | | | 142,985 | |
304,242 | | SMG US Midco 2, Inc., Senior Secured First Lien Term Loan (3 Month LIBOR USD + 2.50%) | | | 7.33 | % | | | 01/23/2025 | | | | 301,884 | |
410,597 | | Sophia LP, Senior Secured First Lien Term Loan (3 Month LIBOR USD + 3.50%, 0.50% Floor) | | | 8.66 | % | | | 10/07/2027 | | | | 406,493 | |
710,000 | | Sotera Health Holdings LLC, Senior Secured First Lien Term Loan (3 Month LIBOR USD + 2.75%, 0.50% Floor) | | | 7.58 | % | | | 12/11/2026 | | | | 686,481 | |
469,552 | | Sound Inpatient Physicians, Inc., Senior Secured First Lien Term Loan (3 Month LIBOR USD + 3.00%) | | | 7.83 | % | | | 06/27/2025 | | | | 369,917 | |
429,142 | | Southern Veterinary Partners LLC, Senior Secured First Lien Term Loan (1 Month LIBOR USD + 4.00%, 1.00% Floor) | | | 8.84 | % | | | 10/05/2027 | | | | 414,658 | |
283,327 | | Spin Holdco, Inc., Senior Secured First Lien Term Loan (3 Month LIBOR USD + 4.00%, 0.75% Floor) | | | 8.99 | % | | | 03/06/2028 | | | | 239,006 | |
129,675 | | Spirit AeroSystems, Inc., Senior Secured First Lien Term Loan (3 Month Secured Overnight Financing Rate + 4.50%, 0.50% Floor) | | | 9.18 | % | | | 01/15/2027 | | | | 129,740 | |
547,974 | | SRS Distribution, Inc., Senior Secured First Lien Term Loan (1 Month LIBOR USD + 3.50%, 0.50% Floor) | | | 8.34 | % | | | 06/02/2028 | | | | 530,576 | |
290,507 | | Staples, Inc., Senior Secured First Lien Term Loan (3 Month LIBOR USD + 5.00%) | | | 9.81 | % | | | 04/16/2026 | | | | 268,206 | |
159,888 | | Stars Group Holdings B.V., Senior Secured First Lien Term Loan (3 Month LIBOR USD + 2.25%) | | | 7.41 | % | | | 07/21/2026 | | | | 159,996 | |
459,620 | | Sunshine Luxembourg VII SARL, Senior Secured First Lien Term Loan (3 Month LIBOR USD + 3.75%, 0.75% Floor) | | | 8.91 | % | | | 10/01/2026 | | | | 455,922 | |
207,668 | | SWF Holdings I Corporation, Senior Secured First Lien Term Loan (1 Month LIBOR USD + 4.00%, 0.75% Floor) | | | 8.75 | % | | | 10/06/2028 | | | | 175,480 | |
147,375 | | Tecta America Corporation, Senior Secured First Lien Term Loan (1 Month Secured Overnight Financing Rate + 4.00%, 0.75% Floor) | | | 8.92 | % | | | 04/06/2028 | | | | 144,870 | |
145,676 | | Telesat Canada, Senior Secured First Lien Term Loan (3 Month LIBOR USD + 2.75%) | | | 7.58 | % | | | 12/07/2026 | | | | 76,662 | |
207,375 | | Tempo Acquisition LLC, Senior Secured First Lien Term Loan (1 Month Secured Overnight Financing Rate + 3.00%, 0.50% Floor) | | | 7.81 | % | | | 08/31/2028 | | | | 207,440 | |
94,050 | | The Dun & Bradstreet Corporation, Senior Secured First Lien Term Loan (1 Month Secured Overnight Financing Rate + 3.25%) | | | 8.04 | % | | | 01/18/2029 | | | | 93,639 | |
312,682 | | The Edelman Financial Engines Centre LLC, Senior Secured First Lien Term Loan (1 Month LIBOR USD + 3.50%, 0.75% Floor) | | | 8.59 | % | | | 04/07/2028 | | | | 302,177 | |
154,180 | | The Edelman Financial Engines Centre LLC, Senior Secured Second Lien Term Loan (1 Month LIBOR USD + 6.75%) | | | 11.59 | % | | | 07/20/2026 | | | | 144,967 | |
200,791 | | Tiger Acquisition LLC, Senior Secured First Lien Term Loan (1 Month Secured Overnight Financing Rate + 3.25%, 0.50% Floor) | | | 8.16 | % | | | 06/01/2028 | | | | 195,771 | |
281,255 | | Titan Acquisition Ltd., Senior Secured First Lien Term Loan (6 Month LIBOR USD + 3.00%) | | | 8.15 | % | | | 03/28/2025 | | | | 267,486 | |
225,561 | | Trans Union LLC, Senior Secured First Lien Term Loan (1 Month LIBOR USD + 2.25%, 0.50% Floor) | | | 7.09 | % | | | 12/01/2028 | | | | 224,245 | |
340,000 | | Transdigm, Inc., Senior Secured First Lien Term Loan (3 Month Secured Overnight Financing Rate + 3.25%) | | | 8.15 | % | | | 08/24/2028 | | | | 339,490 | |
221,989 | | Travelport Finance (Luxembourg) SARL, Senior Secured First Lien Term Loan (1 Month LIBOR USD + 8.75%, 1.00% Floor) | | | 13.59 | % | | | 02/28/2025 | | | | 228,206 | |
87,539 | | Traverse Midstream Partners LLC, Senior Secured First Lien Term Loan (3 Month Secured Overnight Financing Rate + 3.75%, 0.50% Floor) | | | 8.73 | % | | | 02/16/2028 | | | | 86,335 | |
323,778 | | TricorBraun Holdings, Inc., Senior Secured First Lien Term Loan (1 Month LIBOR USD + 3.25%, 0.50% Floor) | | | 8.09 | % | | | 03/03/2028 | | | | 316,897 | |
83,773 | | Trident TPI Holdings, Inc., Senior Secured First Lien Term Loan (3 Month LIBOR USD + 4.00%, 0.50% Floor) | | | 9.16 | % | | | 09/15/2028 | | | | 81,195 | |
511,115 | | Triton Water Holdings, Inc., Senior Secured First Lien Term Loan (3 Month LIBOR USD + 3.50%, 0.50% Floor) | | | 8.66 | % | | | 03/31/2028 | | | | 460,803 | |
| | Uber Technologies | | | | | | | | | | | | |
153,325 | | (3 Month Secured Overnight Financing Rate + 2.75%) | | | 7.66 | % | | | 03/04/2030 | | | | 153,193 | |
66,125 | | (3 Month Secured Overnight Financing Rate + 2.75%) | | | 7.87 | % | | | 03/04/2030 | | | | 66,068 | |
353,249 | | UFC Holdings LLC, Senior Secured First Lien Term Loan (3 Month LIBOR USD + 2.75%, 0.75% Floor) | | | 7.57 | % | | | 04/29/2026 | | | | 351,787 | |
75,275 | | UKG, Inc., Senior Secured First Lien Term Loan (3 Month LIBOR USD + 3.75%) | | | 8.58 | % | | | 05/04/2026 | | | | 74,203 | |
95,000 | | UKG, Inc., Senior Secured Second Lien Term Loan (3 Month LIBOR USD + 5.25%, 0.50% Floor) | | | 10.03 | % | | | 05/03/2027 | | | | 91,532 | |
93,868 | | Ultra Clean Holdings, Inc., Senior Secured First Lien Term Loan (1 Month LIBOR USD + 3.75%) | | | 8.59 | % | | | 08/27/2025 | | | | 94,058 | |
575,242 | | United Airlines, Inc., Senior Secured First Lien Term Loan (3 Month LIBOR USD + 3.75%, 0.75% Floor) | | | 8.57 | % | | | 04/21/2028 | | | | 572,437 | |
246,936 | | United Natural Foods, Inc., Senior Secured First Lien Term Loan (1 Month Secured Overnight Financing Rate + 3.25%) | | | 8.17 | % | | | 10/22/2025 | | | | 247,399 | |
77,400 | | Univar Solutions USA, Inc., Senior Secured First Lien Term Loan (1 Month LIBOR USD + 2.00%) | | | 6.84 | % | | | 07/01/2026 | | | | 77,448 | |
74,438 | | Univision Communications, Inc., Senior Secured First Lien Term Loan (3 Month Secured Overnight Financing Rate + 4.25%, 0.50% Floor) | | | 9.15 | % | | | 06/24/2029 | | | | 74,047 | |
494,842 | | US Foods, Inc., Senior Secured First Lien Term Loan (1 Month LIBOR USD + 2.00%) | | | 6.91 | % | | | 09/14/2026 | | | | 493,243 | |
39,900 | | Vantage Specialty Chemicals, Inc., Senior Secured First Lien Term Loan (1 Month Secured Overnight Financing Rate + 4.75%, 0.50% Floor) | | | 9.60 | % | | | 10/26/2026 | | | | 38,434 | |
461,611 | | Verscend Holding Corporation, Senior Secured First Lien Term Loan (1 Month LIBOR USD + 4.00%) | | | 8.84 | % | | | 08/27/2025 | | | | 461,756 | |
201,925 | | Viad Corporation, Senior Secured First Lien Term Loan (1 Month Secured Overnight Financing Rate + 5.00%, 0.50% Floor) | | | 9.92 | % | | | 07/31/2028 | | | | 193,343 | |
246,250 | | Victoria’s Secret & Company, Senior Secured First Lien Term Loan (3 Month LIBOR USD + 3.25%, 0.50% Floor) | | | 8.24 | % | | | 08/02/2028 | | | | 244,403 | |
140,000 | | Virgin Media Bristol LLC, Senior Secured First Lien Term Loan (1 Month LIBOR USD + 3.25%) | | | 7.93 | % | | | 01/31/2029 | | | | 138,828 | |
2,548 | | VT Topco, Inc., Senior Secured First Lien Delayed-Draw Term Loan (1 Month LIBOR USD + 3.75%, 0.75% Floor) | | | 8.59 | % | | | 08/01/2025 | | | | 2,518 | |
89,390 | | VT Topco, Inc., Senior Secured First Lien Term Loan (1 Month LIBOR USD + 3.75%, 0.75% Floor) | | | 8.59 | % | | | 08/01/2025 | | | | 88,317 | |
312,962 | | Wand NewCo 3, Inc., Senior Secured First Lien Term Loan (1 Month LIBOR USD + 2.75%) | | | 7.59 | % | | | 02/05/2026 | | | | 307,811 | |
122,152 | | WaterBridge Midstream Operating LLC, Senior Secured First Lien Term Loan (6 Month LIBOR USD + 5.75%, 1.00% Floor) | | | 10.57 | % | | | 06/22/2026 | | | | 120,329 | |
350,563 | | Whatabrands LLC, Senior Secured First Lien Term Loan (1 Month LIBOR USD + 3.25%, 0.50% Floor) | | | 8.09 | % | | | 08/03/2028 | | | | 347,399 | |
193,224 | | WWEX UNI TopCo Holdings LLC, Senior Secured First Lien Term Loan (3 Month Secured Overnight Financing Rate + 4.00%, 0.75% Floor) | | | 9.17 | % | | | 07/26/2028 | | | | 187,669 | |
261,026 | | Zayo Group Holdings, Inc., Senior Secured First Lien Term Loan (1 Month LIBOR USD + 3.00%) | | | 7.84 | % | | | 03/09/2027 | | | | 213,507 | |
184,427 | | Zebra Buyer LLC, Senior Secured First Lien Term Loan (3 Month LIBOR USD + 3.00%, 0.50% Floor) | | | 7.75 | % | | | 11/01/2028 | | | | 184,197 | |
235,000 | | Ziggo Financing Partnership, Senior Secured First Lien Term Loan (1 Month LIBOR USD + 2.50%) | | | 7.18 | % | | | 04/28/2028 | | | | 232,551 | |
| | | | | | | | | | | | | | |
Total Bank Loans (Cost $70,500,988) | | | | | | | | | | | 67,294,434 | |
| | | | | | | | | | | | | | |
Collateralized Loan Obligations - 19.1% | |
2,000,000 | | AIMCO Ltd., Series 2021-15A-D (3 Month LIBOR USD + 2.90%, 2.90% Floor) | | | 7.69 | % (a) | | | 10/17/2034 | | | | 1,861,283 | |
2,000,000 | | Apidos, Series 2013-12A-DR (3 Month LIBOR USD + 2.60%, 0.00% Floor) | | | 7.39 | % (a) | | | 04/15/2031 | | | | 1,833,484 | |
2,500,000 | | Apidos, Series 2018-29A-C (3 Month LIBOR USD + 2.75%, 0.00% Floor) | | | 7.57 | % (a) | | | 07/25/2030 | | | | 2,315,492 | |
2,500,000 | | Atrium Corporation, Series 13A-D (3 Month LIBOR USD + 2.70%, 0.00% Floor) | | | 7.52 | % (a) | | | 11/21/2030 | | | | 2,314,000 | |
1,000,000 | | Atrium Corporation, Series 14A-D (3 Month LIBOR USD + 2.95%, 2.95% Floor) | | | 7.74 | % (a) | | | 08/23/2030 | | | | 934,698 | |
500,000 | | Bain Capital Credit Ltd., Series 2017-2A-DR2 (3 Month LIBOR USD + 3.10%, 3.10% Floor) | | | 7.92 | % (a) | | | 07/25/2034 | | | | 444,146 | |
1,250,000 | | Bain Capital Credit Ltd., Series 2021-7A-D (3 Month LIBOR USD + 3.25%, 3.25% Floor) | | | 8.07 | % (a) | | | 01/22/2035 | | | | 1,078,204 | |
1,737,500 | | Barings Ltd., Series 2015-2A-ER (3 Month LIBOR USD + 6.45%, 0.00% Floor) | | | 11.26 | % (a) | | | 10/20/2030 | | | | 1,421,996 | |
4,000,000 | | Barings Ltd., Series 2018-3A-D (3 Month LIBOR USD + 2.90%, 0.00% Floor) | | | 7.71 | % (a) | | | 07/20/2029 | | | | 3,721,919 | |
2,000,000 | | Barings Ltd., Series 2019-2A-CR (3 Month LIBOR USD + 3.40%, 3.40% Floor) | | | 8.19 | % (a) | | | 04/15/2036 | | | | 1,834,509 | |
2,000,000 | | Barings Ltd., Series 2020-1A-DR (3 Month LIBOR USD + 3.20%, 3.20% Floor) | | | 7.99 | % (a) | | | 10/15/2036 | | | | 1,854,186 | |
1,000,000 | | Barings Ltd., Series 2021-1A-E (3 Month LIBOR USD + 6.30%, 6.30% Floor) | | | 11.12 | % (a) | | | 04/25/2034 | | | | 917,222 | |
3,770,000 | | BlueMountain Ltd., Series 2013-2A-DR (3 Month LIBOR USD + 2.90%, 0.00% Floor) | | | 7.72 | % (a) | | | 10/22/2030 | | | | 3,302,674 | |
500,000 | | BlueMountain Ltd., Series 2015-3A-CR (3 Month LIBOR USD + 2.60%, 0.00% Floor) | | | 7.41 | % (a) | | | 04/20/2031 | | | | 434,455 | |
1,000,000 | | BlueMountain Ltd., Series 2016-3A-DR (3 Month LIBOR USD + 3.10%, 3.10% Floor) | | | 7.96 | % (a) | | | 11/15/2030 | | | | 879,519 | |
1,000,000 | | BlueMountain Ltd., Series 2017-2A-C (3 Month LIBOR USD + 3.00%, 0.00% Floor) | | | 7.81 | % (a) | | | 10/20/2030 | | | | 849,794 | |
1,000,000 | | Canyon Capital Ltd., Series 2012-1RA-D (3 Month LIBOR USD + 3.00%, 0.00% Floor) | | | 7.79 | % (a) | | | 07/15/2030 | | | | 890,010 | |
2,000,000 | | Canyon Capital Ltd., Series 2014-1A-CR (3 Month LIBOR USD + 2.75%, 2.75% Floor) | | | 7.55 | % (a) | | | 01/30/2031 | | | | 1,749,033 | |
3,000,000 | | Canyon Capital Ltd., Series 2020-2A-DR (3 Month LIBOR USD + 3.15%, 3.15% Floor) | | | 7.94 | % (a) | | | 10/15/2034 | | | | 2,611,914 | |
2,000,000 | | Canyon Capital Ltd., Series 2021-1A-D (3 Month LIBOR USD + 3.10%, 3.10% Floor) | | | 7.89 | % (a) | | | 04/15/2034 | | | | 1,749,367 | |
2,500,000 | | Canyon Capital Ltd., Series 2021-4A-D (3 Month LIBOR USD + 3.05%, 3.05% Floor) | | | 7.84 | % (a) | | | 10/15/2034 | | | | 2,180,629 | |
1,000,000 | | Canyon Capital Ltd., Series 2021-4A-E (3 Month LIBOR USD + 6.30%, 6.30% Floor) | | | 11.09 | % (a) | | | 10/15/2034 | | | | 858,226 | |
500,000 | | Carlyle Global Market Strategies Ltd., Series 2020-2A-CR (3 Month LIBOR USD + 3.20%, 3.20% Floor) | | | 8.02 | % (a) | | | 01/25/2035 | | | | 457,705 | |
3,500,000 | | Cathedral Lake Ltd., Series 2021-8A-C (3 Month LIBOR USD + 2.62%, 2.62% Floor) | | | 7.43 | % (a) | | | 01/20/2035 | | | | 3,417,082 | |
3,500,000 | | Cathedral Lake Ltd., Series 2021-8A-D1 (3 Month LIBOR USD + 3.42%, 3.42% Floor) | | | 8.23 | % (a) | | | 01/20/2035 | | | | 3,061,367 | |
1,500,000 | | Chenango Park Ltd., Series 2018-1A-C (3 Month LIBOR USD + 3.00%, 3.00% Floor) | | | 7.79 | % (a) | | | 04/15/2030 | | | | 1,326,537 | |
500,000 | | CIFC Funding Ltd., Series 2018-3A-D (3 Month LIBOR USD + 2.85%, 0.00% Floor) | | | 7.64 | % (a) | | | 07/18/2031 | | | | 472,598 | |
1,000,000 | | CIFC Funding Ltd., Series 2019-3A-CR (3 Month LIBOR USD + 3.05%, 3.05% Floor) | | | 7.84 | % (a) | | | 10/16/2034 | | | | 946,646 | |
1,000,000 | | CIFC Funding Ltd., Series 2020-3A-DR (3 Month LIBOR USD + 3.10%, 3.10% Floor) | | | 7.91 | % (a) | | | 10/20/2034 | | | | 926,082 | |
1,000,000 | | Dryden Ltd., Series 2019-68A-DR (3 Month LIBOR USD + 3.35%, 3.35% Floor) | | | 8.14 | % (a) | | | 07/15/2035 | | | | 900,952 | |
900,000 | | Dryden Ltd., Series 2020-77A-DR (3 Month LIBOR USD + 3.00%, 3.00% Floor) | | | 7.92 | % (a) | | | 05/20/2034 | | | | 803,805 | |
2,500,000 | | Dryden Senior Loan Fund, Series 2013-28A-B1LR (3 Month LIBOR USD + 3.15%, 0.00% Floor) | | | 8.01 | % (a) | | | 08/15/2030 | | | | 2,327,007 | |
3,000,000 | | Dryden Senior Loan Fund, Series 2015-37A-DR (3 Month LIBOR USD + 2.50%, 2.50% Floor) | | | 7.29 | % (a) | | | 01/15/2031 | | | | 2,633,662 | |
1,000,000 | | Dryden Senior Loan Fund, Series 2016-45A-DR (3 Month LIBOR USD + 3.15%, 3.15% Floor) | | | 7.94 | % (a) | | | 10/15/2030 | | | | 933,670 | |
1,000,000 | | Dryden Senior Loan Fund, Series 2017-50A-D (3 Month LIBOR USD + 3.25%, 3.25% Floor) | | | 8.04 | % (a) | | | 07/15/2030 | | | | 929,214 | |
2,500,000 | | Goldentree Loan Opportunities Ltd., Series 2016-12A-DR (3 Month LIBOR USD + 2.90%, 0.00% Floor) | | | 7.72 | % (a) | | | 07/21/2030 | | | | 2,363,377 | |
1,500,000 | | Greenwood Park Ltd., Series 2018-1A-D (3 Month LIBOR USD + 2.50%, 0.00% Floor) | | | 7.29 | % (a) | | | 04/15/2031 | | | | 1,332,889 | |
290,527 | | Halcyon Loan Advisors Funding Ltd., Series 2014-2A-D (3 Month LIBOR USD + 5.00%, 0.00% Floor) | | | 9.80 | % (a)(k) | | | 04/28/2025 | | | | 69,423 | |
500,000 | | Halcyon Loan Advisors Funding Ltd., Series 2018-1A-A2 (3 Month LIBOR USD + 1.80%, 1.80% Floor) | | | 6.61 | % (a) | | | 07/21/2031 | | | | 478,597 | |
2,000,000 | | Hayfin Ltd., Series 2018-8A-B (3 Month LIBOR USD + 1.48%, 1.48% Floor) | | | 6.29 | % (a) | | | 04/20/2031 | | | | 1,928,732 | |
1,500,000 | | Highbridge Loan Management Ltd., Series 13A-18-D (3 Month LIBOR USD + 3.00%, 3.00% Floor) | | | 7.79 | % (a) | | | 10/15/2030 | | | | 1,378,605 | |
2,000,000 | | Highbridge Loan Management Ltd., Series 2013-2A-CR (3 Month LIBOR USD + 2.90%, 0.00% Floor) | | | 7.71 | % (a) | | | 10/20/2029 | | | | 1,787,591 | |
3,175,000 | | LCM LP, Series 14A-DR (3 Month LIBOR USD + 2.75%, 0.00% Floor) | | | 7.56 | % (a) | | | 07/20/2031 | | | | 2,666,423 | |
1,250,000 | | LCM LP, Series 19A-E2 (3 Month LIBOR USD + 5.70%, 5.70% Floor) | | | 10.49 | % (a) | | | 07/15/2027 | | | | 1,144,963 | |
2,000,000 | | LCM LP, Series 20A-DR (3 Month LIBOR USD + 2.80%, 0.00% Floor) | | | 7.61 | % (a) | | | 10/20/2027 | | | | 1,956,696 | |
5,000,000 | | LCM LP, Series 26A-D (3 Month LIBOR USD + 2.50%, 2.50% Floor) | | | 7.31 | % (a) | | | 01/20/2031 | | | | 4,205,398 | |
1,500,000 | | LCM LP, Series 27A-D (3 Month LIBOR USD + 2.95%, 0.00% Floor) | | | 7.74 | % (a) | | | 07/16/2031 | | | | 1,262,666 | |
4,500,000 | | Madison Park Funding Ltd., Series 2015-18A-BR (3 Month LIBOR USD + 1.60%, 0.00% Floor) | | | 6.42 | % (a) | | | 10/21/2030 | | | | 4,409,767 | |
1,000,000 | | Madison Park Funding Ltd., Series 2018-30A-D (3 Month LIBOR USD + 2.50%, 2.50% Floor) | | | 7.29 | % (a) | | | 04/15/2029 | | | | 947,070 | |
1,000,000 | | Madison Park Funding Ltd., Series 2021-52A-D (3 Month LIBOR USD + 3.15%, 3.15% Floor) | | | 7.97 | % (a) | | | 01/22/2035 | | | | 903,063 | |
3,500,000 | | Magnetite Ltd., Series 2018-20A-D (3 Month LIBOR USD + 2.50%, 0.00% Floor) | | | 7.31 | % (a) | | | 04/20/2031 | | | | 3,282,769 | |
1,750,000 | | Magnetite Ltd., Series 2019-23A-DR (3 Month LIBOR USD + 3.05%, 3.05% Floor) | | | 7.87 | % (a) | | | 01/25/2035 | | | | 1,623,245 | |
1,000,000 | | Marathon Ltd., Series 2017-9A-A2 (3 Month LIBOR USD + 1.75%, 0.00% Floor) | | | 6.54 | % (a) | | | 04/15/2029 | | | | 984,632 | |
3,500,000 | | Marble Point Ltd., Series 2021-3A-D1 (3 Month LIBOR USD + 3.50%, 3.50% Floor) | | | 8.29 | % (a) | | | 10/17/2034 | | | | 3,262,081 | |
1,000,000 | | Myers Park Ltd., Series 2018-1A-D (3 Month LIBOR USD + 3.05%, 3.05% Floor) | | | 7.86 | % (a) | | | 10/20/2030 | | | | 899,221 | |
1,000,000 | | Neuberger Berman Loan Advisers Ltd., Series 2016-21A-DR2 (3 Month LIBOR USD + 3.30%, 3.30% Floor) | | | 8.11 | % (a) | | | 04/20/2034 | | | | 938,959 | |
4,000,000 | | Neuberger Berman Loan Advisers Ltd., Series 2017-16SA-DR (3 Month LIBOR USD + 2.90%, 2.90% Floor) | | | 7.69 | % (a) | | | 04/15/2034 | | | | 3,586,280 | |
1,500,000 | | Neuberger Berman Loan Advisers Ltd., Series 2017-25A-DR (3 Month LIBOR USD + 2.85%, 2.85% Floor) | | | 7.64 | % (a) | | | 10/18/2029 | | | | 1,390,175 | |
1,000,000 | | Neuberger Berman Loan Advisers Ltd., Series 2017-26A-D (3 Month LIBOR USD + 2.65%, 2.65% Floor) | | | 7.44 | % (a) | | | 10/18/2030 | | | | 921,851 | |
1,500,000 | | Neuberger Berman Loan Advisers Ltd., Series 2018-28A-D (3 Month LIBOR USD + 2.85%, 0.00% Floor) | | | 7.66 | % (a) | | | 04/20/2030 | | | | 1,389,882 | |
1,000,000 | | Neuberger Berman Loan Advisers Ltd., Series 2020-38A-DR (3 Month LIBOR USD + 3.00%, 3.00% Floor) | | | 7.81 | % (a) | | | 10/20/2035 | | | | 923,423 | |
4,500,000 | | Octagon Investment Partners Ltd., Series 2012-1A-CRR (3 Month LIBOR USD + 3.90%, 3.90% Floor) | | | 8.69 | % (a) | | | 07/15/2029 | | | | 4,004,439 | |
500,000 | | Octagon Investment Partners Ltd., Series 2014-1A-CR3 (3 Month LIBOR USD + 2.75%, 2.75% Floor) | | | 7.62 | % (a) | | | 02/14/2031 | | | | 459,279 | |
1,250,000 | | Octagon Investment Partners Ltd., Series 2017-1A-D (3 Month LIBOR USD + 6.20%, 0.00% Floor) | | | 11.01 | % (a) | | | 03/17/2030 | | | | 1,033,204 | |
2,000,000 | | Octagon Investment Partners Ltd., Series 2017-1A-DR (3 Month LIBOR USD + 3.40%, 3.40% Floor) | | | 8.21 | % (a) | | | 07/20/2030 | | | | 1,806,743 | |
4,000,000 | | Octagon Investment Partners Ltd., Series 2018-1A-C (3 Month LIBOR USD + 2.60%, 2.60% Floor) | | | 7.41 | % (a) | | | 01/20/2031 | | | | 3,542,411 | |
3,000,000 | | Octagon Investment Partners Ltd., Series 2018-2A-C (3 Month LIBOR USD + 2.85%, 0.00% Floor) | | | 7.67 | % (a) | | | 07/25/2030 | | | | 2,685,979 | |
500,000 | | Octagon Investment Partners Ltd., Series 2019-1A-ER (3 Month LIBOR USD + 7.00%, 7.00% Floor) | | | 11.81 | % (a) | | | 01/20/2035 | | | | 426,390 | |
1,000,000 | | Octagon Investment Partners Ltd., Series 2020-2A-DR (3 Month LIBOR USD + 3.30%, 3.30% Floor) | | | 8.09 | % (a) | | | 07/15/2036 | | | | 891,606 | |
2,500,000 | | OHA Credit Funding Ltd., Series 2021-16A-E (3 Month LIBOR USD + 6.10%, 6.10% Floor) | | | 10.89 | % (a) | | | 10/18/2034 | | | | 2,343,568 | |
500,000 | | Park Avenue Institutional Advisers Ltd., Series 2021-2A-D (3 Month LIBOR USD + 3.40%, 3.40% Floor) | | | 8.19 | % (a) | | | 07/15/2034 | | | | 452,186 | |
4,000,000 | | RR Ltd., Series 2018-4A-C (3 Month LIBOR USD + 2.95%, 0.00% Floor) | | | 7.74 | % (a) | | | 04/15/2030 | | | | 3,627,748 | |
2,000,000 | | Sound Point Ltd., Series 2015-2A-DRRR (3 Month LIBOR USD + 4.50%, 4.50% Floor) | | | 9.31 | % (a) | | | 07/20/2032 | | | | 1,701,629 | |
6,000,000 | | Sound Point Ltd., Series 2019-2A-DR (3 Month LIBOR USD + 3.30%, 3.30% Floor) | | | 8.09 | % (a) | | | 07/15/2034 | | | | 5,146,208 | |
1,000,000 | | Sound Point Ltd., Series 2020-1A-DR (3 Month LIBOR USD + 3.35%, 3.35% Floor) | | | 8.16 | % (a) | | | 07/20/2034 | | | | 868,578 | |
5,000,000 | | Sound Point Ltd., Series 2020-2A-DR (3 Month LIBOR USD + 3.35%, 3.35% Floor) | | | 8.17 | % (a) | | | 10/25/2034 | | | | 4,320,307 | |
3,375,000 | | Sound Point Ltd., Series 2021-4A-D (3 Month LIBOR USD + 3.40%, 3.40% Floor) | | | 8.22 | % (a) | | | 10/25/2034 | | | | 2,945,178 | |
1,750,000 | | Southwick Park LLC, Series 2019-4A-DR (3 Month LIBOR USD + 2.95%, 2.95% Floor) | | | 7.76 | % (a) | | | 07/20/2032 | | | | 1,608,408 | |
5,000,000 | | Steele Creek Ltd., Series 2019-2A-BR (3 Month LIBOR USD + 1.85%, 1.85% Floor) | | | 6.64 | % (a) | | | 07/15/2032 | | | | 4,807,880 | |
3,500,000 | | Steward Park Ltd., Series 2015-1A-DR (3 Month LIBOR USD + 2.60%, 2.60% Floor) | | | 7.39 | % (a) | | | 01/15/2030 | | | | 3,101,204 | |
1,500,000 | | Symphony Ltd., Series 2015-16A-DR (3 Month LIBOR USD + 3.05%, 3.05% Floor) | | | 7.84 | % (a) | | | 10/15/2031 | | | | 1,348,873 | |
2,000,000 | | THL Credit Wind River Ltd., Series 2013-2A-E1R (3 Month LIBOR USD + 6.75%, 0.00% Floor) | | | 11.54 | % (a) | | | 10/18/2030 | | | | 1,611,077 | |
2,000,000 | | THL Credit Wind River Ltd., Series 2014-1A-DRR (3 Month LIBOR USD + 3.00%, 3.00% Floor) | | | 7.79 | % (a) | | | 07/18/2031 | | | | 1,673,981 | |
4,000,000 | | THL Credit Wind River Ltd., Series 2014-2A-DR (3 Month LIBOR USD + 2.90%, 2.90% Floor) | | | 7.69 | % (a) | | | 01/15/2031 | | | | 3,395,935 | |
2,000,000 | | THL Credit Wind River Ltd., Series 2014-2A-ER (3 Month LIBOR USD + 5.75%, 5.75% Floor) | | | 10.54 | % (a)(k) | | | 01/15/2031 | | | | 1,451,482 | |
1,500,000 | | THL Credit Wind River Ltd., Series 2014-3A-DR2 (3 Month LIBOR USD + 3.40%, 3.40% Floor) | | | 8.22 | % (a) | | | 10/22/2031 | | | | 1,262,314 | |
2,000,000 | | THL Credit Wind River Ltd., Series 2017-1A-DR (3 Month LIBOR USD + 3.72%, 3.72% Floor) | | | 8.51 | % (a) | | | 04/18/2036 | | | | 1,703,661 | |
1,750,000 | | THL Credit Wind River Ltd., Series 2017-1A-ER (3 Month LIBOR USD + 7.06%, 7.06% Floor) | | | 11.85 | % (a) | | | 04/18/2036 | | | | 1,466,366 | |
1,500,000 | | THL Credit Wind River Ltd., Series 2017-4A-D (3 Month LIBOR USD + 2.65%, 0.00% Floor) | | | 7.57 | % (a) | | | 11/20/2030 | | | | 1,338,036 | |
1,500,000 | | THL Credit Wind River Ltd., Series 2018-1A-D (3 Month LIBOR USD + 2.90%, 0.00% Floor) | | | 7.69 | % (a) | | | 07/15/2030 | | | | 1,314,065 | |
3,500,000 | | THL Credit Wind River Ltd., Series 2018-2A-D (3 Month LIBOR USD + 3.00%, 0.00% Floor) | | | 7.79 | % (a) | | | 07/15/2030 | | | | 2,991,941 | |
500,000 | | THL Credit Wind River Ltd., Series 2021-3A-D (3 Month LIBOR USD + 3.35%, 3.35% Floor) | | | 8.16 | % (a) | | | 07/20/2033 | | | | 445,413 | |
1,000,000 | | THL Credit Wind River Ltd., Series 2021-4A-D (3 Month LIBOR USD + 3.20%, 3.20% Floor) | | | 8.01 | % (a) | | | 01/20/2035 | | | | 864,328 | |
1,500,000 | | TIAA Ltd., Series 2017-2A-B (3 Month LIBOR USD + 1.50%, 0.00% Floor) | | | 6.29 | % (a) | | | 01/16/2031 | | | | 1,442,713 | |
6,000,000 | | Trimaran CAVU LLC, Series 2019-1A-B (3 Month LIBOR USD + 2.20%, 2.20% Floor) | | | 7.01 | % (a) | | | 07/20/2032 | | | | 5,896,369 | |
500,000 | | Upland Ltd., Series 2016-1A-CR (3 Month LIBOR USD + 2.90%, 0.00% Floor) | | | 7.71 | % (a) | | | 04/20/2031 | | | | 448,653 | |
500,000 | | Vibrant Ltd., Series 2015-3A-A2RR (3 Month LIBOR USD + 1.85%, 0.00% Floor) | | | 6.66 | % (a) | | | 10/20/2031 | | | | 486,180 | |
3,900,000 | | Voya Ltd., Series 2013-1A-CR (3 Month LIBOR USD + 2.95%, 0.00% Floor) | | | 7.74 | % (a) | | | 10/15/2030 | | | | 3,409,575 | |
1,500,000 | | Voya Ltd., Series 2017-3A-CR (3 Month LIBOR USD + 3.15%, 0.00% Floor) | | | 7.96 | % (a) | | | 04/20/2034 | | | | 1,348,359 | |
| | | | | | | | | | | | | | |
Total Collateralized Loan Obligations (Cost $201,273,094) | | | | | | | | | | | 180,883,131 | |
| | | | | | | | | | | | | | |
Foreign Corporate Bonds - 6.7% | |
44,000 | | 1375209 B.C. Ltd. | | | 9.00 | % (a) | | | 01/30/2028 | | | | 43,670 | |
400,000 | | Adani Electricity Mumbai Ltd. | | | 3.95 | % | | | 02/12/2030 | | | | 285,739 | |
300,000 | | Adani Electricity Mumbai Ltd. | | | 3.87 | % | | | 07/22/2031 | | | | 208,458 | |
1,200,000 | | Adani International Container Terminal Private Ltd. | | | 3.00 | % | | | 02/16/2031 | | | | 915,531 | |
200,000 | | Adani Ports & Special Economic Zone Ltd. | | | 4.00 | % | | | 07/30/2027 | | | | 159,200 | |
200,000 | | Adani Ports & Special Economic Zone Ltd. | | | 4.20 | % | | | 08/04/2027 | | | | 158,700 | |
600,000 | | Adani Ports & Special Economic Zone Ltd. | | | 4.38 | % | | | 07/03/2029 | | | | 453,935 | |
400,000 | | Adani Ports & Special Economic Zone Ltd. | | | 3.10 | % | | | 02/02/2031 | | | | 258,025 | |
600,000 | | AES Andes S.A. (5 Year Swap Rate USD + 4.64%) | | | 7.13 | % (a) | | | 03/26/2079 | | | | 573,913 | |
1,000,000 | | AES Andres B.V. | | | 5.70 | % (a) | | | 05/04/2028 | | | | 878,400 | |
235,417 | | AI Candelaria Spain S.A. | | | 7.50 | % | | | 12/15/2028 | | | | 215,033 | |
500,000 | | AI Candelaria Spain S.A. | | | 5.75 | % | | | 06/15/2033 | | | | 355,000 | |
500,000 | | AI Candelaria Spain S.A. | | | 5.75 | % (a) | | | 06/15/2033 | | | | 355,000 | |
200,000 | | Altice Financing S.A. | | | 5.00 | % (a) | | | 01/15/2028 | | | | 162,820 | |
200,000 | | Altice France Holding S.A. | | | 6.00 | % (a) | | | 02/15/2028 | | | | 127,820 | |
255,000 | | Altice France Holding S.A. | | | 5.50 | % (a) | | | 10/15/2029 | | | | 195,217 | |
200,000 | | ARD Finance S.A. (7.25% PIK) | | | 6.50 | % (a) | | | 06/30/2027 | | | | 153,240 | |
205,742 | | Avation Capital S.A. (9.00% PIK) | | | 8.25 | % (a) | | | 10/31/2026 | | | | 178,167 | |
300,000 | | Banco Continental SAECA | | | 2.75 | % | | | 12/10/2025 | | | | 266,589 | |
600,000 | | Banco Davivienda S.A. (10 Year CMT Rate + 5.10%) | | | 6.65 | % (a)(e) | | | 04/22/2031 | | | | 415,200 | |
200,000 | | Banco de Credito del Peru S.A. (5 Year CMT Rate + 2.45%) | | | 3.25 | % | | | 09/30/2031 | | | | 172,737 | |
500,000 | | Banco de Credito del Peru S.A. (5 Year CMT Rate + 3.00%) | | | 3.13 | % | | | 07/01/2030 | | | | 450,507 | |
400,000 | | Banco do Brasil S.A. (10 Year CMT Rate + 4.40%) | | | 6.25 | % (e) | | | 04/15/2024 | | | | 363,700 | |
500,000 | | Banco do Brasil S.A. (10 Year CMT Rate + 6.36%) | | | 9.00 | % (e) | | | 06/18/2024 | | | | 492,625 | |
300,000 | | Banco GNB Sudameris S.A. (5 Year CMT Rate + 6.66%) | | | 7.50 | % | | | 04/16/2031 | | | | 224,637 | |
450,000 | | Banco Industrial S.A. (5 Year CMT Rate + 4.44%) | | | 4.88 | % | | | 01/29/2031 | | | | 416,066 | |
1,850,000 | | Banco Internacional del Peru S.A.A. Interbank (1 Year CMT Rate + 3.71%) | | | 4.00 | % | | | 07/08/2030 | | | | 1,698,559 | |
300,000 | | Banco Latinoamericano de Comercio Exterior S.A. | | | 2.38 | % | | | 09/14/2025 | | | | 276,298 | |
200,000 | | Banco Mercantil del Norte S.A. (10 Year CMT Rate + 5.03%) | | | 6.63 | % (e) | | | 01/24/2032 | | | | 161,500 | |
1,200,000 | | Banco Mercantil del Norte S.A. (10 Year CMT Rate + 5.35%) | | | 7.63 | % (e) | | | 01/10/2028 | | | | 1,062,900 | |
200,000 | | Banco Mercantil del Norte S.A. (10 Year CMT Rate + 5.47%) | | | 7.50 | % (e) | | | 06/27/2029 | | | | 173,083 | |
200,000 | | Banco Mercantil del Norte S.A. (10 Year CMT Rate + 5.47%) | | | 7.50 | % (a)(e) | | | 06/27/2029 | | | | 173,083 | |
200,000 | | Banco Santander Mexico S.A. Institucion de Banca Multiple Grupo Financiero Santand (5 Year CMT Rate + 3.00%) | | | 5.95 | % | | | 10/01/2028 | | | | 195,796 | |
500,000 | | Bancolombia S.A. (5 Year CMT Rate + 2.94%) | | | 4.63 | % | | | 12/18/2029 | | | | 420,497 | |
200,000 | | Bangkok Bank PCL (5 Year CMT Rate + 4.73%) | | | 5.00 | % (e) | | | 09/23/2025 | | | | 182,254 | |
800,000 | | Banistmo S.A. | | | 4.25 | % | | | 07/31/2027 | | | | 732,962 | |
1,276,000 | | Bank Hapoalim B.M. | | | 3.26 | % (a)(g) | | | 01/21/2032 | | | | 1,066,098 | |
400,000 | | Bank Leumi (5 Year CMT Rate + 1.63%) | | | 3.28 | % (a) | | | 01/29/2031 | | | | 349,156 | |
600,000 | | BBVA Bancomer S.A. (5 Year CMT Rate + 2.65%) | | | 5.13 | % | | | 01/18/2033 | | | | 513,768 | |
200,000 | | BBVA Bancomer S.A. (5 Year CMT Rate + 4.31%) | | | 5.88 | % | | | 09/13/2034 | | | | 174,840 | |
319,650 | | Bioceanico Sovereign Certificate Ltd. | | | 0.00 | % | | | 06/05/2034 | | | | 214,882 | |
195,000 | | Bombardier, Inc. | | | 7.88 | % (a) | | | 04/15/2027 | | | | 197,592 | |
450,000 | | Braskem Idesa SAPI | | | 6.99 | % | | | 02/20/2032 | | | | 340,018 | |
1,300,000 | | Braskem Netherlands Finance B.V. (5 Year CMT Rate + 8.22%) | | | 8.50 | % | | | 01/23/2081 | | | | 1,295,775 | |
850,000 | | C&W Senior Financing | | | 6.88 | % | | | 09/15/2027 | | | | 761,153 | |
600,000 | | CAP S.A. | | | 3.90 | % (a) | | | 04/27/2031 | | | | 463,270 | |
700,000 | | CAP S.A. | | | 3.90 | % | | | 04/27/2031 | | | | 540,481 | |
300,000 | | Cemex S.A.B. de C.V. (5 Year CMT Rate + 4.91%) | | | 9.13 | % (a)(e) | | | 03/14/2028 | | | | 300,811 | |
2,000,000 | | Chile Electricity PEC S.p.A. | | | 0.00 | % (a) | | | 01/25/2028 | | | | 1,503,104 | |
600,000 | | Corporacion Financiera de Desarrollo S.A. (3 Month LIBOR USD + 5.61%) | | | 5.25 | % | | | 07/15/2029 | | | | 580,104 | |
390,000 | | Cosan Overseas Ltd. | | | 8.25 | % (e) | | | 05/05/2023 | | | | 388,458 | |
600,000 | | Credito Real S.A.B. de C.V. (5 Year CMT Rate + 7.03%) | | | 9.13 | % (d)(e) | | | 11/29/2027 | | | | 16,500 | |
400,000 | | CT Trust | | | 5.13 | % | | | 02/03/2032 | | | | 335,000 | |
800,000 | | DBS Group Holdings Ltd. (5 Year CMT Rate + 1.10%) | | | 1.82 | % | | | 03/10/2031 | | | | 722,021 | |
334,346 | | Digicel Group Holdings Ltd. (5.00% + 3.00% PIK) | | | 8.00 | % (a) | | | 04/01/2025 | | | | 134,036 | |
344,666 | | Digicel Group Holdings Ltd. (7.00% PIK) | | | 7.00 | % (a)(e) | | | 04/17/2023 | | | | 40,098 | |
600,000 | | Ecopetrol S.A. | | | 4.63 | % | | | 11/02/2031 | | | | 462,173 | |
150,000 | | Ecopetrol S.A. | | | 5.88 | % | | | 05/28/2045 | | | | 104,250 | |
2,050,000 | | Ecopetrol S.A. | | | 5.88 | % | | | 11/02/2051 | | | | 1,387,850 | |
230,000 | | eG Global Finance PLC | | | 8.50 | % (a) | | | 10/30/2025 | | | | 215,599 | |
1,100,000 | | EIG Pearl Holdings SARL | | | 3.55 | % | | | 08/31/2036 | | | | 944,009 | |
338,000 | | Empresa de Transmision Electrica S.A. | | | 5.13 | % | | | 05/02/2049 | | | | 271,535 | |
621,500 | | Empresa Electrica Angamos S.A. | | | 4.88 | % | | | 05/25/2029 | | | | 561,059 | |
796,320 | | Empresa Electrica Cochrane S.p.A. | | | 5.50 | % | | | 05/14/2027 | | | | 734,649 | |
1,800,000 | | Empresas Publicas de Medellin ESP | | | 4.25 | % | | | 07/18/2029 | | | | 1,379,598 | |
400,000 | | Empresas Publicas de Medellin ESP | | | 4.38 | % | | | 02/15/2031 | | | | 288,723 | |
423,529 | | Fenix Power Peru S.A. | | | 4.32 | % | | | 09/20/2027 | | | | 390,969 | |
182,000 | | Fideicomiso P.A. Pacifico Tres | | | 8.25 | % | | | 01/15/2035 | | | | 162,658 | |
600,000 | | Freeport Indonesia PT | | | 5.32 | % (a) | | | 04/14/2032 | | | | 561,655 | |
400,000 | | Freeport Indonesia PT | | | 6.20 | % | | | 04/14/2052 | | | | 366,996 | |
300,000 | | Freeport-McMoRan, Inc. | | | 4.38 | % | | | 08/01/2028 | | | | 281,517 | |
1,000,000 | | Freeport-McMoRan, Inc. | | | 4.63 | % | | | 08/01/2030 | | | | 945,728 | |
832,194 | | Galaxy Pipeline Assets Bidco Ltd. | | | 2.16 | % (a) | | | 03/31/2034 | | | | 717,700 | |
869,877 | | Galaxy Pipeline Assets Bidco Ltd. | | | 2.94 | % | | | 09/30/2040 | | | | 706,763 | |
240,000 | | Garda World Security Corporation | | | 4.63 | % (a) | | | 02/15/2027 | | | | 215,728 | |
180,000 | | Garda World Security Corporation | | | 6.00 | % (a) | | | 06/01/2029 | | | | 143,331 | |
1,600,000 | | Gran Tierra Energy International Holdings Ltd. | | | 6.25 | % | | | 02/15/2025 | | | | 1,357,730 | |
200,000 | | Gran Tierra Energy, Inc. | | | 7.75 | % (a) | | | 05/23/2027 | | | | 156,850 | |
270,000 | | Grifols Escrow Issuer S.A. | | | 4.75 | % (a) | | | 10/15/2028 | | | | 221,673 | |
455,285 | | Guara Notre SARL | | | 5.20 | % | | | 06/15/2034 | | | | 392,431 | |
1,398,400 | | Hunt Oil Company of Peru LLC Sucursal Del Peru | | | 6.38 | % | | | 06/01/2028 | | | | 1,319,479 | |
300,000 | | Indonesia Asahan Aluminium Persero PT | | | 5.45 | % | | | 05/15/2030 | | | | 294,686 | |
150,000 | | Intelsat Jackson Holdings S.A. | | | 6.50 | % (a) | | | 03/15/2030 | | | | 137,885 | |
35,079 | | Invepar Holdings | | | 0.00 | % (d)(k) | | | 12/30/2028 | | | | – | |
726,000 | | Inversiones La Construccion S.A. | | | 4.75 | % | | | 02/07/2032 | | | | 578,022 | |
600,000 | | Itau Unibanco Holding S.A. (5 Year CMT Rate + 3.45%) | | | 3.88 | % | | | 04/15/2031 | | | | 533,726 | |
265,500 | | JSW Hydro Energy Ltd. | | | 4.13 | % (a) | | | 05/18/2031 | | | | 220,539 | |
300,000 | | JSW Steel Ltd. | | | 5.05 | % | | | 04/05/2032 | | | | 245,855 | |
1,400,000 | | Korea Development Bank | | | 1.63 | % | | | 01/19/2031 | | | | 1,140,037 | |
160,000 | | Kronos Acquisition Holdings, Inc. | | | 5.00 | % (a) | | | 12/31/2026 | | | | 146,502 | |
200,000 | | LG Chem Ltd. | | | 2.38 | % (a) | | | 07/07/2031 | | | | 164,708 | |
909,810 | | LLPL Capital Pte Ltd. | | | 6.88 | % (a) | | | 02/04/2039 | | | | 807,470 | |
827,100 | | LLPL Capital Pte Ltd. | | | 6.88 | % | | | 02/04/2039 | | | | 734,063 | |
330,000 | | Mattamy Group Corporation | | | 4.63 | % (a) | | | 03/01/2030 | | | | 287,536 | |
1,352,752 | | MC Brazil Downstream Trading SARL | | | 7.25 | % | | | 06/30/2031 | | | | 1,064,278 | |
600,000 | | Mexarrend SAPI de C.V. | | | 10.25 | % (a)(d) | | | 07/24/2024 | | | | 128,451 | |
410,100 | | Mexico Generadora de Energia S. de R.L. | | | 5.50 | % | | | 12/06/2032 | | | | 395,162 | |
2,500,000 | | Minejesa Capital B.V. | | | 5.63 | % | | | 08/10/2037 | | | | 1,962,083 | |
500,000 | | Mong Duong Finance Holdings B.V. | | | 5.13 | % | | | 05/07/2029 | | | | 424,868 | |
400,000 | | Movida Europe S.A. | | | 5.25 | % | | | 02/08/2031 | | | | 291,300 | |
400,000 | | Multibank, Inc. | | | 7.75 | % (a) | | | 02/03/2028 | | | | 400,760 | |
770,850 | | MV24 Capital B.V. | | | 6.75 | % | | | 06/01/2034 | | | | 710,878 | |
200,000 | | Network i2i Ltd. (5 Year CMT Rate + 4.27%) | | | 5.65 | % (e) | | | 01/15/2025 | | | | 191,000 | |
800,000 | | Oleoducto Central S.A. | | | 4.00 | % | | | 07/14/2027 | | | | 684,908 | |
252,000 | | Orazul Energy Peru S.A. | | | 5.63 | % | | | 04/28/2027 | | | | 223,116 | |
600,000 | | Oversea-Chinese Banking Corporation Ltd. (5 Year CMT Rate + 1.58%) | | | 1.83 | % | | | 09/10/2030 | | | | 550,713 | |
340,000 | | Parkland Corporation | | | 4.63 | % (a) | | | 05/01/2030 | | | | 302,765 | |
1,750,000 | | Petrobras Global Finance B.V. | | | 6.75 | % | | | 06/03/2050 | | | | 1,546,956 | |
900,000 | | Petroleos del Peru S.A. | | | 4.75 | % | | | 06/19/2032 | | | | 669,969 | |
400,000 | | Petroleos del Peru S.A. | | | 5.63 | % | | | 06/19/2047 | | | | 259,400 | |
900,000 | | Petroleos Mexicanos | | | 6.75 | % | | | 09/21/2047 | | | | 585,730 | |
160,000 | | Primo Water Holdings, Inc. | | | 4.38 | % (a) | | | 04/30/2029 | | | | 139,806 | |
560,000 | | Rutas 2 and 7 Finance Ltd. | | | 0.00 | % | | | 09/30/2036 | | | | 354,410 | |
600,000 | | Sasol Financing USA LLC | | | 5.50 | % | | | 03/18/2031 | | | | 502,382 | |
909,146 | | SCC Power PLC (4.00% + 4.00% PIK) | | | 8.00 | % (a) | | | 12/31/2028 | | | | 326,383 | |
492,454 | | SCC Power PLC (4.00% or 4.00% PIK) | | | 4.00 | % (a) | | | 05/17/2032 | | | | 35,896 | |
155,000 | | Seaspan Corporation | | | 5.50 | % (a) | | | 08/01/2029 | | | | 121,050 | |
500,000 | | Simpar Europe S.A. | | | 5.20 | % | | | 01/26/2031 | | | | 365,855 | |
250,000 | | Superior Plus LP | | | 4.50 | % (a) | | | 03/15/2029 | | | | 223,526 | |
500,000 | | Telefonica Moviles Chile S.A. | | | 3.54 | % (a) | | | 11/18/2031 | | | | 399,170 | |
115,000 | | Telesat LLC | | | 4.88 | % (a) | | | 06/01/2027 | | | | 59,687 | |
1,900,000 | | Temasek Financial Ltd. | | | 1.00 | % (a) | | | 10/06/2030 | | | | 1,519,089 | |
151,000 | | Tervita Corporation | | | 11.00 | % (a) | | | 12/01/2025 | | | | 162,431 | |
160,000 | | Titan Acquisition Ltd. | | | 7.75 | % (a) | | | 04/15/2026 | | | | 134,163 | |
450,000 | | TK Elevator US Newco, Inc. | | | 5.25 | % (a) | | | 07/15/2027 | | | | 425,432 | |
553,967 | | UEP Penonome S.A. | | | 6.50 | % (a) | | | 10/01/2038 | | | | 417,019 | |
738,623 | | UEP Penonome S.A. | | | 6.50 | % | | | 10/01/2038 | | | | 556,025 | |
2,800,000 | | Unifin Financiera S.A.B. de C.V. (5 Year CMT Rate + 6.31%) | | | 8.88 | % (d)(e) | | | 01/29/2025 | | | | 39,816 | |
700,000 | | United Overseas Bank Ltd. (5 Year CMT Rate + 1.23%) | | | 2.00 | % | | | 10/14/2031 | | | | 620,689 | |
562,000 | | United Overseas Bank Ltd. (5 Year CMT Rate + 1.52%) | | | 1.75 | % | | | 03/16/2031 | | | | 504,297 | |
800,000 | | UPL Corporation Ltd. | | | 4.63 | % | | | 06/16/2030 | | | | 677,189 | |
1,100,000 | | Vedanta Resources Finance PLC | | | 9.25 | % (a) | | | 04/23/2026 | | | | 660,699 | |
1,300,000 | | Vedanta Resources Ltd. | | | 6.13 | % | | | 08/09/2024 | | | | 771,823 | |
300,000 | | VTR Comunicaciones S.p.A. | | | 5.13 | % | | | 01/15/2028 | | | | 185,552 | |
700,000 | | VTR Finance NV | | | 6.38 | % | | | 07/15/2028 | | | | 283,500 | |
325,000 | | VZ Secured Financing B.V. | | | 5.00 | % (a) | | | 01/15/2032 | | | | 265,484 | |
| | | | | | | | | | | | | | |
Total Foreign Corporate Bonds (Cost $77,094,051) | | | | | | | | | | | 63,219,418 | |
| | | | | | | | | | | | | | |
Foreign Government Bonds, Foreign Agencies and Foreign Government Sponsored Corporations - 1.7% | |
1,100,000 | | Banco Nacional de Comercio Exterior (5 Year CMT Rate + 2.00%) | | | 2.72 | % | | | 08/11/2031 | | | | 929,321 | |
400,000 | | Brazilian Government International Bond | | | 5.00 | % | | | 01/27/2045 | | | | 315,338 | |
1,200,000 | | Brazilian Government International Bond | | | 5.63 | % | | | 02/21/2047 | | | | 1,013,552 | |
800,000 | | Chile Government International Bond | | | 3.50 | % | | | 01/25/2050 | | | | 600,828 | |
2,300,000 | | Chile Government International Bond | | | 3.10 | % | | | 01/22/2061 | | | | 1,503,758 | |
1,200,000 | | Colombia Government International Bond | | | 3.25 | % | | | 04/22/2032 | | | | 895,952 | |
500,000 | | Colombia Government International Bond | | | 5.00 | % | | | 06/15/2045 | | | | 350,734 | |
2,000,000 | | Colombia Government International Bond | | | 4.13 | % | | | 05/15/2051 | | | | 1,237,363 | |
500,000 | | Dominican Republic International Bond | | | 5.88 | % | | | 01/30/2060 | | | | 384,150 | |
800,000 | | Mexico Government International Bond | | | 2.66 | % | | | 05/24/2031 | | | | 669,641 | |
3,200,000 | | Mexico Government International Bond | | | 4.28 | % | | | 08/14/2041 | | | | 2,622,848 | |
1,000,000 | | Mexico Government International Bond | | | 4.40 | % | | | 02/12/2052 | | | | 783,849 | |
800,000 | | Panama Government International Bond | | | 4.30 | % | | | 04/29/2053 | | | | 588,930 | |
400,000 | | Panama Government International Bond | | | 4.50 | % | | | 04/01/2056 | | | | 298,703 | |
2,300,000 | | Panama Government International Bond | | | 3.87 | % | | | 07/23/2060 | | | | 1,513,167 | |
400,000 | | Philippine Government International Bond | | | 2.95 | % | | | 05/05/2045 | | | | 289,072 | |
400,000 | | Philippine Government International Bond | | | 2.65 | % | | | 12/10/2045 | | | | 275,075 | |
700,000 | | Republic of South Africa Government Bond | | | 4.30 | % | | | 10/12/2028 | | | | 629,597 | |
1,100,000 | | Saudi Government International Bond | | | 3.45 | % | | | 02/02/2061 | | | | 780,321 | |
| | | | | | | | | | | | | | |
Total Foreign Government Bonds, Foreign Agencies and Foreign Government Sponsored Corporations (Cost $20,589,637) | | | | | | | | | | | 15,682,199 | |
| | | | | | | | | | | | | | |
Non-Agency Commercial Mortgage Backed Obligations - 11.3% | |
15,358,349 | | Arbor Multifamily Mortgage Securities Trust, Series 2020-MF1-XA | | | 0.96 | % (a)(f)(g) | | | 05/15/2053 | | | | 771,190 | |
10,194,000 | | Arbor Multifamily Mortgage Securities Trust, Series 2021-MF3-XD | | | 1.18 | % (a)(f)(g) | | | 10/15/2054 | | | | 809,026 | |
1,017,000 | | AREIT Trust, Series 2019-CRE3-D (Secured Overnight Financing Rate 1 Month + 2.76%, 2.65% Floor) | | | 7.42 | % (a) | | | 09/14/2036 | | | | 904,781 | |
9,858,529 | | BANK, Series 2017-BNK5-XA | | | 0.95 | % (f)(g) | | | 06/15/2060 | | | | 299,911 | |
59,332,701 | | BANK, Series 2018-BN11-XA | | | 0.45 | % (f)(g) | | | 03/15/2061 | | | | 1,178,318 | |
1,958,000 | | BBCMS Mortgage Trust, Series 2018-CBM-E (1 Month LIBOR USD + 3.55%, 3.55% Floor) | | | 8.23 | % (a) | | | 07/15/2037 | | | | 1,823,069 | |
956,000 | | BBCMS Mortgage Trust, Series 2018-TALL-E (1 Month LIBOR USD + 2.44%, 2.44% Floor) | | | 7.27 | % (a) | | | 03/15/2037 | | | | 567,141 | |
1,675,000 | | BBCMS Mortgage Trust, Series 2019-BWAY-E (1 Month LIBOR USD + 2.85%, 2.85% Floor) | | | 7.79 | % (a) | | | 11/15/2034 | | | | 733,653 | |
1,297,629 | | BB-UBS Trust, Series 2012-TFT-TE | | | 3.56 | % (a)(g)(k) | | | 06/05/2030 | | | | 983,389 | |
1,216,000 | | BDS Ltd., Series 2019-FL4-B (1 Month LIBOR USD + 1.75%, 1.75% Floor) | | | 6.46 | % (a) | | | 08/15/2036 | | | | 1,210,324 | |
908,000 | | BDS Ltd., Series 2021-FL10-A (1 Month LIBOR USD + 1.35%, 1.35% Floor) | | | 6.11 | % (a) | | | 12/16/2036 | | | | 896,349 | |
56,266,542 | | Benchmark Mortgage Trust, Series 2022-B32-XA | | | 0.46 | % (a)(f)(g) | | | 01/15/2055 | | | | 1,317,954 | |
2,866,000 | | BPR Trust, Series 2021-TY-D (1 Month LIBOR USD + 2.35%, 2.35% Floor) | | | 7.03 | % (a) | | | 09/15/2038 | | | | 2,692,931 | |
1,575,000 | | BX Trust, Series 2019-CALM-E (Secured Overnight Financing Rate 1 Month + 2.11%, 2.11% Floor) | | | 6.94 | % (a) | | | 11/15/2032 | | | | 1,515,483 | |
1,800,000 | | BX Trust, Series 2019-IMC-D (1 Month LIBOR USD + 1.90%, 1.90% Floor) | | | 6.58 | % (a) | | | 04/15/2034 | | | | 1,704,770 | |
467,500 | | BX Trust, Series 2019-XL-G (Secured Overnight Financing Rate 1 Month + 2.41%, 2.41% Floor) | | | 7.24 | % (a) | | | 10/15/2036 | | | | 450,592 | |
2,820,000 | | BX Trust, Series 2021-VIEW-E (1 Month LIBOR USD + 3.60%, 3.60% Floor) | | | 8.28 | % (a) | | | 06/15/2036 | | | | 2,575,085 | |
1,119,631 | | Carbon Capital Commercial Mortgage Trust, Series 2019-FL2-B (1 Month LIBOR USD + 2.85%, 2.85% Floor) | | | 7.53 | % (a) | | | 10/15/2035 | | | | 929,660 | |
8,738,962 | | CD Commercial Mortgage Trust, Series 2017-CD3-XA | | | 0.96 | % (f)(g) | | | 02/10/2050 | | | | 249,088 | |
3,825,019 | | CFCRE Commercial Mortgage Trust, Series 2016-C4-XA | | | 1.61 | % (f)(g) | | | 05/10/2058 | | | | 139,673 | |
1,504,793 | | Citigroup Commercial Mortgage Trust, Series 2014-GC25-XA | | | 0.94 | % (f)(g) | | | 10/10/2047 | | | | 15,390 | |
6,444,135 | | Citigroup Commercial Mortgage Trust, Series 2016-C1-XA | | | 1.82 | % (f)(g) | | | 05/10/2049 | | | | 286,241 | |
2,202,404 | | Citigroup Commercial Mortgage Trust, Series 2016-P4-XA | | | 1.89 | % (f)(g) | | | 07/10/2049 | | | | 100,596 | |
1,216,000 | | CLNC Ltd., Series 2019-FL1-B (Secured Overnight Financing Rate 1 Month + 2.01%, 1.90% Floor) | | | 6.71 | % (a) | | | 08/20/2035 | | | | 1,181,809 | |
1,508,646 | | Commercial Mortgage Pass-Through Trust, Series 2013-CR10-XA | | | 0.59 | % (f)(g) | | | 08/10/2046 | | | | 370 | |
919,696 | | Commercial Mortgage Pass-Through Trust, Series 2014-CR17-XA | | | 0.95 | % (f)(g) | | | 05/10/2047 | | | | 6,107 | |
10,815,763 | | Commercial Mortgage Pass-Through Trust, Series 2015-CR25-XA | | | 0.80 | % (f)(g) | | | 08/10/2048 | | | | 167,773 | |
6,595,141 | | Commercial Mortgage Pass-Through Trust, Series 2015-CR27-XA | | | 0.91 | % (f)(g) | | | 10/10/2048 | | | | 120,341 | |
1,227,000 | | Commercial Mortgage Pass-Through Trust, Series 2015-DC1-C | | | 4.30 | % (g) | | | 02/10/2048 | | | | 1,033,173 | |
1,616,151 | | Commercial Mortgage Pass-Through Trust, Series 2015-DC1-XA | | | 0.98 | % (f)(g) | | | 02/10/2048 | | | | 20,861 | |
9,475,420 | | Commercial Mortgage Pass-Through Trust, Series 2015-LC21-XA | | | 0.65 | % (f)(g) | | | 07/10/2048 | | | | 108,008 | |
2,629,533 | | Commercial Mortgage Pass-Through Trust, Series 2016-DC2-XA | | | 0.93 | % (f)(g) | | | 02/10/2049 | | | | 54,213 | |
2,228,000 | | Commercial Mortgage Pass-Through Trust, Series 2018-HCLV-D (1 Month LIBOR USD + 2.28%, 2.18% Floor) | | | 6.96 | % (a) | | | 09/15/2033 | | | | 1,869,699 | |
2,253,015 | | CSAIL Commercial Mortgage Trust, Series 2015-C1-XA | | | 0.81 | % (f)(g) | | | 04/15/2050 | | | | 23,239 | |
42,471,111 | | CSAIL Commercial Mortgage Trust, Series 2018-CX12-XA | | | 0.57 | % (f)(g) | | | 08/15/2051 | | | | 956,577 | |
31,937,197 | | CSAIL Commercial Mortgage Trust, Series 2021-C20-XA | | | 1.00 | % (f)(g) | | | 03/15/2054 | | | | 1,809,207 | |
18,269,000 | | CSAIL Commercial Mortgage Trust, Series 2021-C20-XD | | | 1.46 | % (a)(f)(g) | | | 03/15/2054 | | | | 1,639,436 | |
1,974,822 | | CSMC Trust, Series 2014-USA-X1 | | | 0.54 | % (a)(f)(g) | | | 09/15/2037 | | | | 20,009 | |
1,768,000 | | ELP Commercial Mortgage Trust, Series 2021-ELP-C (1 Month LIBOR USD + 1.32%, 1.32% Floor) | | | 6.00 | % (a) | | | 11/15/2038 | | | | 1,675,557 | |
2,246,218 | | Extended Stay America Trust, Series 2021-ESH-D (1 Month LIBOR USD + 2.25%, 2.25% Floor) | | | 6.94 | % (a) | | | 07/15/2038 | | | | 2,145,004 | |
2,264,000 | | Fontainebleau Miami Beach Trust, Series 2019-FBLU-G | | | 3.96 | % (a)(g) | | | 12/10/2036 | | | | 2,040,744 | |
639,609 | | FREMF Mortgage Trust, Series 2016-KF18-B (1 Month LIBOR USD + 5.50%, 5.50% Floor) | | | 10.17 | % (a) | | | 05/25/2026 | | | | 625,834 | |
372,621 | | FREMF Mortgage Trust, Series 2017-KF27-B (1 Month LIBOR USD + 4.35%, 4.35% Floor) | | | 9.02 | % (a) | | | 12/25/2026 | | | | 367,842 | |
700,066 | | FREMF Mortgage Trust, Series 2017-KF30-B (1 Month LIBOR USD + 3.25%, 3.25% Floor) | | | 7.92 | % (a) | | | 03/25/2027 | | | | 696,353 | |
1,479,905 | | FREMF Mortgage Trust, Series 2017-KF34-B (1 Month LIBOR USD + 2.70%, 2.55% Floor) | | | 7.37 | % (a) | | | 08/25/2024 | | | | 1,469,205 | |
392,798 | | FREMF Mortgage Trust, Series 2018-KF44-B (1 Month LIBOR USD + 2.15%, 2.15% Floor) | | | 6.82 | % (a) | | | 02/25/2025 | | | | 387,586 | |
2,439,521 | | FREMF Mortgage Trust, Series 2019-KF71-C (1 Month LIBOR USD + 6.00%, 6.00% Floor) | | | 10.67 | % (a) | | | 10/25/2029 | | | | 2,317,641 | |
1,230,000 | | FS Rialto, Series 2021-FL3-A (1 Month LIBOR USD + 1.25%, 1.25% Floor) | | | 5.98 | % (a) | | | 11/16/2036 | | | | 1,213,523 | |
1,350,000 | | FS Rialto, Series 2022-FL4-AS (Secured Overnight Financing Rate 30 Day Average + 2.40%, 2.40% Floor) | | | 6.96 | % (a) | | | 01/19/2039 | | | | 1,310,909 | |
442,000 | | GS Mortgage Securities Corporation Trust, Series 2018-GS10-WLSD | | | 4.58 | % (a)(g) | | | 03/10/2033 | | | | 360,707 | |
553,000 | | GS Mortgage Securities Corporation Trust, Series 2018-GS10-WLSE | | | 4.58 | % (a)(g) | | | 03/10/2033 | | | | 438,393 | |
1,509,000 | | GS Mortgage Securities Corporation Trust, Series 2018-RIVR-E (1 Month LIBOR USD + 1.55%, 1.55% Floor) | | | 6.23 | % (a) | | | 07/15/2035 | | | | 991,621 | |
850,000 | | GS Mortgage Securities Corporation Trust, Series 2018-TWR-E (1 Month LIBOR USD + 2.35%, 2.10% Floor) | | | 7.03 | % (a) | | | 07/15/2031 | | | | 623,900 | |
850,000 | | GS Mortgage Securities Corporation Trust, Series 2018-TWR-F (1 Month LIBOR USD + 3.05%, 2.80% Floor) | | | 7.73 | % (a) | | | 07/15/2031 | | | | 590,750 | |
850,000 | | GS Mortgage Securities Corporation Trust, Series 2018-TWR-G (1 Month LIBOR USD + 4.17%, 3.93% Floor) | | | 8.86 | % (a) | | | 07/15/2031 | | | | 510,000 | |
7,012,038 | | GS Mortgage Securities Trust, Series 2014-GC24-XA | | | 0.70 | % (f)(g) | | | 09/10/2047 | | | | 50,827 | |
6,914,403 | | GS Mortgage Securities Trust, Series 2015-GS1-XA | | | 0.76 | % (f)(g) | | | 11/10/2048 | | | | 115,074 | |
5,311,651 | | GS Mortgage Securities Trust, Series 2016-GS2-XA | | | 1.73 | % (f)(g) | | | 05/10/2049 | | | | 217,093 | |
2,377,000 | | GSCG Trust, Series 2019-600C-E | | | 3.99 | % (a)(g) | | | 09/06/2034 | | | | 2,004,768 | |
1,376,000 | | JP Morgan Chase Commercial Mortgage Securities Trust, Series 2014-C20-C | | | 4.56 | % (g) | | | 07/15/2047 | | | | 1,179,289 | |
5,034,658 | | JP Morgan Chase Commercial Mortgage Securities Trust, Series 2016-JP4-XA | | | 0.58 | % (f)(g) | | | 12/15/2049 | | | | 81,679 | |
1,957,000 | | JP Morgan Chase Commercial Mortgage Securities Trust, Series 2018-WPT-EFX | | | 5.36 | % (a)(g) | | | 07/05/2033 | | | | 1,538,691 | |
2,555,000 | | JP Morgan Chase Commercial Mortgage Securities Trust, Series 2019-MFP-F (1 Month LIBOR USD + 3.00%, 3.00% Floor) | | | 7.68 | % (a) | | | 07/15/2036 | | | | 2,397,805 | |
766,000 | | JP Morgan Chase Commercial Mortgage Securities Trust, Series 2019-UES-C | | | 4.34 | % (a) | | | 05/05/2032 | | | | 719,074 | |
784,000 | | JP Morgan Chase Commercial Mortgage Securities Trust, Series 2019-UES-D | | | 4.45 | % (a)(g) | | | 05/05/2032 | | | | 732,312 | |
915,000 | | JP Morgan Chase Commercial Mortgage Securities Trust, Series 2019-UES-E | | | 4.45 | % (a)(g) | | | 05/05/2032 | | | | 853,378 | |
960,000 | | JP Morgan Chase Commercial Mortgage Securities Trust, Series 2019-UES-F | | | 4.45 | % (a)(g) | | | 05/05/2032 | | | | 888,634 | |
1,049,000 | | JP Morgan Chase Commercial Mortgage Securities Trust, Series 2019-UES-G | | | 4.45 | % (a)(g) | | | 05/05/2032 | | | | 951,104 | |
1,685,000 | | JP Morgan Chase Commercial Mortgage Securities Trust, Series 2020-NNN-EFX | | | 3.97 | % (a) | | | 01/16/2037 | | | | 1,373,234 | |
1,223,389 | | JPMBB Commercial Mortgage Securities Trust, Series 2014-C18-XA | | | 0.66 | % (f)(g) | | | 02/15/2047 | | | | 3,543 | |
2,973,000 | | JPMBB Commercial Mortgage Securities Trust, Series 2014-C21-C | | | 4.64 | % (g) | | | 08/15/2047 | | | | 2,610,679 | |
100,000 | | JPMBB Commercial Mortgage Securities Trust, Series 2014-C23-C | | | 4.48 | % (g) | | | 09/15/2047 | | | | 93,503 | |
1,115,000 | | JPMBB Commercial Mortgage Securities Trust, Series 2015-C29-C | | | 4.19 | % (g) | | | 05/15/2048 | | | | 994,683 | |
3,079,393 | | JPMBB Commercial Mortgage Securities Trust, Series 2015-C29-XA | | | 0.56 | % (f)(g) | | | 05/15/2048 | | | | 29,193 | |
4,118,520 | | JPMBB Commercial Mortgage Securities Trust, Series 2015-C31-XA | | | 0.81 | % (f)(g) | | | 08/15/2048 | | | | 65,414 | |
470,000 | | JPMBB Commercial Mortgage Securities Trust, Series 2015-C33-C | | | 4.62 | % (g) | | | 12/15/2048 | | | | 424,203 | |
1,780,000 | | KREF Ltd., Series 2021-FL2-A (1 Month LIBOR USD + 1.07%, 1.07% Floor) | | | 5.78 | % (a) | | | 02/15/2039 | | | | 1,733,074 | |
2,532,000 | | LCCM Trust, Series 2017-LC26-C | | | 4.71 | % (a) | | | 07/12/2050 | | | | 2,145,010 | |
2,398,313 | | LSTAR Commercial Mortgage Trust, Series 2016-4-XA | | | 1.69 | % (a)(f)(g) | | | 03/10/2049 | | | | 44,727 | |
12,087,272 | | LSTAR Commercial Mortgage Trust, Series 2017-5-X | | | 0.79 | % (a)(f)(g) | | | 03/10/2050 | | | | 229,838 | |
2,828,597 | | Med Trust, Series 2021-MDLN-G (1 Month LIBOR USD + 5.25%, 5.25% Floor) | | | 9.94 | % (a) | | | 11/15/2038 | | | | 2,593,860 | |
857,464 | | Merchants Bank of Indiana Multifamily Housing Mortgage Loan Trust, Series 2021-Q015-B (Secured Overnight Financing Rate 30 Day Average + 2.85%) | | | 7.41 | % (a) | | | 08/25/2024 | | | | 849,872 | |
2,200,000 | | MF1 Ltd., Series 2021-FL7-C (1 Month LIBOR USD + 2.05%, 2.05% Floor) | | | 6.81 | % (a) | | | 10/16/2036 | | | | 2,049,390 | |
2,538,000 | | MFT Trust, Series 2020-ABC-D | | | 3.48 | % (a)(g) | | | 02/10/2042 | | | | 1,594,716 | |
2,500,000 | | MKT Mortgage Trust, Series 2020-525M-F | | | 2.94 | % (a)(g) | | | 02/12/2040 | | | | 1,342,994 | |
100,000 | | Morgan Stanley Bank of America Merrill Lynch Trust, Series 2014-C18-C | | | 4.48 | % (g) | | | 10/15/2047 | | | | 93,147 | |
274,000 | | Morgan Stanley Bank of America Merrill Lynch Trust, Series 2015-C27-C | | | 4.50 | % (g) | | | 12/15/2047 | | | | 244,659 | |
393,000 | | Morgan Stanley Capital Trust, Series 2017-ASHF-D (1 Month LIBOR USD + 2.33%, 2.20% Floor) | | | 7.01 | % (a) | | | 11/15/2034 | | | | 364,255 | |
2,489,000 | | Morgan Stanley Capital Trust, Series 2019-NUGS-F (1 Month LIBOR USD + 2.84%, 4.34% Floor) | | | 7.53 | % (a) | | | 12/15/2036 | | | | 1,689,464 | |
2,284,679 | | MSCG Trust, Series 2018-SELF-F (1 Month LIBOR USD + 3.05%, 3.05% Floor) | | | 7.74 | % (a) | | | 10/15/2037 | | | | 2,125,906 | |
1,919,000 | | Natixis Commercial Mortgage Securities Trust, Series 2018-FL1-C (1 Month LIBOR USD + 2.20%, 2.20% Floor) | | | 6.88 | % (a) | | | 06/15/2035 | | | | 1,667,894 | |
1,183,000 | | Natixis Commercial Mortgage Securities Trust, Series 2020-2PAC-AMZ1 | | | 3.50 | % (a)(g) | | | 01/15/2037 | | | | 1,069,598 | |
685,000 | | Natixis Commercial Mortgage Securities Trust, Series 2020-2PAC-AMZ2 | | | 3.50 | % (a)(g) | | | 01/15/2037 | | | | 594,585 | |
639,000 | | Natixis Commercial Mortgage Securities Trust, Series 2020-2PAC-AMZ3 | | | 3.50 | % (a)(g) | | | 01/15/2037 | | | | 542,016 | |
1,500,000 | | One New York Plaza Trust, Series 2020-1NYP-C (1 Month LIBOR USD + 2.20%, 2.20% Floor) | | | 6.88 | % (a) | | | 01/15/2036 | | | | 1,381,392 | |
2,750,000 | | RLGH Trust, Series 2021-TROT-D (1 Month LIBOR USD + 1.71%, 1.71% Floor) | | | 6.40 | % (a) | | | 04/15/2036 | | | | 2,619,271 | |
2,874,000 | | Soho Trust, Series 2021-SOHO-B | | | 2.70 | % (a)(g) | | | 08/10/2038 | | | | 1,991,051 | |
2,889,000 | | SREIT Trust, Series 2021-IND-F (1 Month LIBOR USD + 2.54%, 2.54% Floor) | | | 7.22 | % (a) | | | 10/15/2038 | | | | 2,567,513 | |
961,000 | | STWD Ltd., Series 2019-FL1-D (Secured Overnight Financing Rate 1 Month + 2.46%, 2.35% Floor) | | | 7.12 | % (a) | | | 07/15/2038 | | | | 897,094 | |
295,805 | | TTAN, Series 2021-MHC-F (1 Month LIBOR USD + 2.90%, 2.90% Floor) | | | 7.59 | % (a) | | | 03/15/2038 | | | | 276,775 | |
1,097,000 | | UBS Commercial Mortgage Trust, Series 2018-C8-C | | | 4.69 | % (g) | | | 02/15/2051 | | | | 930,391 | |
12,773,849 | | UBS Commercial Mortgage Trust, Series 2018-C8-XA | | | 0.81 | % (f)(g) | | | 02/15/2051 | | | | 423,941 | |
1,321,442 | | VMC Finance LLC, Series 2019-FL3-D (1 Month LIBOR USD + 2.65%, 2.65% Floor) | | | 7.36 | % (a) | | | 09/15/2036 | | | | 1,208,283 | |
100,000 | | Wells Fargo Commercial Mortgage Trust, Series 2015-C27-C | | | 3.89 | % | | | 02/15/2048 | | | | 86,686 | |
400,000 | | Wells Fargo Commercial Mortgage Trust, Series 2015-C28-C | | | 4.08 | % (g) | | | 05/15/2048 | | | | 365,543 | |
9,496,870 | | Wells Fargo Commercial Mortgage Trust, Series 2015-C30-XA | | | 0.88 | % (f)(g) | | | 09/15/2058 | | | | 160,773 | |
4,920,813 | | Wells Fargo Commercial Mortgage Trust, Series 2015-C31-XA | | | 0.95 | % (f)(g) | | | 11/15/2048 | | | | 95,896 | |
1,841,104 | | Wells Fargo Commercial Mortgage Trust, Series 2015-NXS1-XA | | | 1.07 | % (f)(g) | | | 05/15/2048 | | | | 28,220 | |
6,330,172 | | Wells Fargo Commercial Mortgage Trust, Series 2015-NXS2-XA | | | 0.60 | % (f)(g) | | | 07/15/2058 | | | | 70,207 | |
1,881,388 | | Wells Fargo Commercial Mortgage Trust, Series 2016-C33-XA | | | 1.57 | % (f)(g) | | | 03/15/2059 | | | | 67,428 | |
3,598,876 | | Wells Fargo Commercial Mortgage Trust, Series 2016-NXS6-XA | | | 1.58 | % (f)(g) | | | 11/15/2049 | | | | 142,847 | |
13,727,781 | | Wells Fargo Commercial Mortgage Trust, Series 2017-C38-XA | | | 0.97 | % (f)(g) | | | 07/15/2050 | | | | 426,753 | |
2,423,000 | | Wells Fargo Commercial Mortgage Trust, Series 2017-C41-C | | | 4.49 | % (g) | | | 11/15/2050 | | | | 2,041,634 | |
1,986,906 | | Wells Fargo Commercial Mortgage Trust, Series 2017-RC1-XA | | | 1.38 | % (f)(g) | | | 01/15/2060 | | | | 86,661 | |
2,267,000 | | Wells Fargo Commercial Mortgage Trust, Series 2018-C47-C | | | 4.93 | % (g) | | | 09/15/2061 | | | | 1,953,609 | |
1,136,277 | | Wells Fargo Commercial Mortgage Trust, Series 2021-SAVE-D (1 Month LIBOR USD + 2.50%, 2.50% Floor) | | | 7.18 | % (a) | | | 02/15/2040 | | | | 1,017,321 | |
1,136,277 | | Wells Fargo Commercial Mortgage Trust, Series 2021-SAVE-E (1 Month LIBOR USD + 3.65%, 3.65% Floor) | | | 8.33 | % (a) | | | 02/15/2040 | | | | 1,008,558 | |
2,664,320 | | WF-RBS Commercial Mortgage Trust, Series 2014-C21-XA | | | 1.00 | % (f)(g) | | | 08/15/2047 | | | | 29,526 | |
| | | | | | | | | | | | | | |
Total Non-Agency Commercial Mortgage Backed Obligations (Cost $131,678,659) | | | | | | | | | | | 107,107,563 | |
| | | | | | | | | | | | | | |
Non-Agency Residential Collateralized Mortgage Obligations - 19.3% | |
2,978,468 | | ACE Securities Corporation Home Equity Loan Trust, Series 2007-HE1-A2A (1 Month LIBOR USD + 0.18%, 0.18% Floor) | | | 5.03 | % | | | 01/25/2037 | | | | 1,731,693 | |
1,208,940 | | ACE Securities Corporation Home Equity Loan Trust, Series 2007-HE1-A2D (1 Month LIBOR USD + 0.50%, 0.50% Floor) | | | 5.35 | % | | | 01/25/2037 | | | | 702,854 | |
1,000,000 | | AMSR Trust, Series 2020-SFR4-E1 | | | 2.21 | % (a) | | | 11/17/2037 | | | | 895,825 | |
5,122,000 | | AMSR Trust, Series 2021-SFR3-G | | | 3.80 | % (a) | | | 10/17/2038 | | | | 4,451,173 | |
8,151,692 | | APS Resecuritization Trust, Series 2015-3-1MZ (12 Month US Treasury Average + 0.96%, 0.96% Floor) | | | 3.75 | % (a) | | | 10/27/2046 | | | | 6,877,898 | |
1,647,688 | | Asset Backed Securities Corporation Home Equity Loan Trust, Series 2007-HE2-A4 (1 Month LIBOR USD + 0.23%, 0.23% Floor) | | | 5.08 | % | | | 05/25/2037 | | | | 1,133,344 | |
1,105,374 | | Bear Stearns Adjustable Rate Mortgage Trust, Series 2006-2-2A1 | | | 3.60 | % (g) | | | 07/25/2036 | | | | 924,639 | |
721,620 | | Bear Stearns ALT-A Trust, Series 2006-4-22A1 | | | 3.69 | % (g) | | | 08/25/2036 | | | | 528,634 | |
1,959,829 | | Chase Mortgage Finance Trust, Series 2007-S4-A4 (1 Month LIBOR USD + 0.60%, 0.60% Floor, 6.00% Cap) | | | 5.45 | % | | | 06/25/2037 | | | | 656,736 | |
132,047 | | CHL Mortgage Pass-Through Trust, Series 2005-HYB9-3A2A (12 Month LIBOR USD + 1.75%, 1.75% Floor, 11.00% Cap) | | | 5.91 | % | | | 02/20/2036 | | | | 108,444 | |
256,022 | | CHL Mortgage Pass-Through Trust, Series 2007-14-A15 | | | 6.50 | % | | | 09/25/2037 | | | | 151,407 | |
5,013,655 | | CHL Mortgage Pass-Through Trust, Series 2007-14-A19 | | | 6.00 | % | | | 09/25/2037 | | | | 2,805,010 | |
3,135,838 | | CHL Mortgage Pass-Through Trust, Series 2007-9-A13 | | | 5.75 | % | | | 07/25/2037 | | | | 1,591,847 | |
405,564 | | CHL Mortgage Pass-Through Trust, Series 2007-HY1-1A1 | | | 3.75 | % (g) | | | 04/25/2037 | | | | 356,974 | |
647,995 | | CitiMortgage Alternative Loan Trust, Series 2007-A5-1A10 | | | 5.75 | % | | | 05/25/2037 | | | | 584,686 | |
239,197 | | Countrywide Alternative Loan Trust, Series 2005-75CB-A3 | | | 5.50 | % | | | 01/25/2036 | | | | 170,153 | |
527,847 | | Countrywide Alternative Loan Trust, Series 2006-23CB-2A2 | | | 6.50 | % | | | 08/25/2036 | | | | 187,483 | |
3,319,643 | | Countrywide Alternative Loan Trust, Series 2006-6CB-2A10 | | | 6.00 | % | | | 05/25/2036 | | | | 1,460,515 | |
2,181,728 | | Countrywide Alternative Loan Trust, Series 2006-OA6-1A1A (1 Month LIBOR USD + 0.42%, 0.42% Floor) | | | 5.27 | % | | | 07/25/2046 | | | | 1,811,345 | |
296,554 | | Countrywide Alternative Loan Trust, Series 2007-15CB-A7 | | | 6.00 | % | | | 07/25/2037 | | | | 191,276 | |
476,938 | | Countrywide Alternative Loan Trust, Series 2008-1R-2A3 | | | 6.00 | % | | | 08/25/2037 | | | | 259,374 | |
417,272 | | Credit Suisse First Boston Mortgage Securities Corporation, Series 2005-10-6A9 | | | 5.50 | % | | | 11/25/2035 | | | | 188,379 | |
169,102 | | Credit Suisse First Boston Mortgage Securities Corporation, Series 2005-9-5A9 | | | 5.50 | % | | | 10/25/2035 | | | | 97,043 | |
278,311 | | CSAB Mortgage Backed Trust, Series 2006-2-A5A | | | 6.58 | % | | | 09/25/2036 | | | | 95,270 | |
709,667 | | CSMC Trust, Series 2011-12R-3A5 | | | 3.90 | % (a)(g) | | | 07/27/2036 | | | | 676,043 | |
7,700,000 | | CSMC Trust, Series 2020-RPL6-A2 | | | 3.35 | % (a)(g) | | | 03/25/2059 | | | | 6,693,273 | |
1,500,000 | | CSMC Trust, Series 2021-NQM6-B1 | | | 3.29 | % (a)(g) | | | 07/25/2066 | | | | 830,373 | |
190,496 | | Deutsche ALT-B Securities, Inc. Mortgage Loan Trust, Series 2006-AB4-A1A | | | 6.01 | % (g) | | | 10/25/2036 | | | | 170,038 | |
110,568 | | Deutsche Mortgage & Asset Receiving Corporation, Series 2014-RS1-1A2 | | | 6.50 | % (a)(g) | | | 07/27/2037 | | | | 89,918 | |
7,100,000 | | Federal Home Loan Mortgage Corporation STACR REMIC Trust, Series 2020-DNA2-B1 (1 Month LIBOR USD + 2.50%) | | | 7.35 | % (a) | | | 02/25/2050 | | | | 6,765,230 | |
6,452,000 | | FirstKey Homes Trust, Series 2021-SFR1-F1 | | | 3.24 | % (a) | | | 08/17/2038 | | | | 5,498,929 | |
8,000,000 | | FMC GMSR Issuer Trust, Series 2021-GT1-A | | | 3.62 | % (a)(g) | | | 07/25/2026 | | | | 6,880,654 | |
500,000 | | GCAT Trust, Series 2019-NQM3-B1 | | | 3.95 | % (a)(g) | | | 11/25/2059 | | | | 371,543 | |
6,461,369 | | Home Partners of America Trust, Series 2019-2-F | | | 3.87 | % (a) | | | 10/19/2039 | | | | 5,586,478 | |
777,856 | | Impac Secured Assets Trust, Series 2006-5-1A1C (1 Month LIBOR USD + 0.54%, 0.54% Floor, 11.50% Cap) | | | 5.39 | % | | | 02/25/2037 | | | | 690,817 | |
1,285,916 | | IndyMac INDX Mortgage Loan Trust, Series 2006-AR19-2A1 | | | 3.39 | % (g) | | | 08/25/2036 | | | | 1,039,736 | |
403,929 | | JP Morgan Mortgage Trust, Series 2005-S3-1A2 | | | 5.75 | % | | | 01/25/2036 | | | | 204,113 | |
310,653 | | JP Morgan Mortgage Trust, Series 2007-A2-4A1M | | | 3.79 | % (g) | | | 04/25/2037 | | | | 249,391 | |
3,300,000 | | Legacy Mortgage Asset Trust, Series 2021-GS1-A2 | | | 3.84 | % (a)(l) | | | 10/25/2066 | | | | 2,938,600 | |
108,904 | | Lehman Mortgage Trust, Series 2006-1-1A3 | | | 5.50 | % | | | 02/25/2036 | | | | 56,796 | |
5,459,711 | | Lehman Mortgage Trust, Series 2006-GP3-1A1 (1 Month LIBOR USD + 0.40%, 0.40% Floor) | | | 5.25 | % | | | 06/25/2046 | | | | 4,848,859 | |
3,000,000 | | LoanDepot GMSR Master Trust, Series 2018-GT1-A (1 Month LIBOR USD + 2.80%, 2.80% Floor) | | | 7.53 | % (a) | | | 10/16/2023 | | | | 2,546,281 | |
70,041 | | MASTR Adjustable Rate Mortgages Trust, Series 2006-2-2A1 | | | 4.16 | % (g) | | | 04/25/2036 | | | | 39,012 | |
263,616 | | Merrill Lynch Alternative Note Asset Trust, Series 2007-F1-2A7 | | | 6.00 | % | | | 03/25/2037 | | | | 105,579 | |
550,470 | | Merrill Lynch Mortgage Investors Trust, Series 2006-AF1-AF2C | | | 6.25 | % | | | 08/25/2036 | | | | 254,060 | |
16,147,132 | | Merrill Lynch Mortgage Investors Trust, Series 2006-HE6-A1 (1 Month LIBOR USD + 0.28%, 0.28% Floor) | | | 5.13 | % | | | 11/25/2037 | | | | 8,001,361 | |
4,778,516 | | Morgan Stanley Mortgage Loan Trust, Series 2005-7-3A1 | | | 4.71 | % (g) | | | 11/25/2035 | | | | 2,936,768 | |
80,416 | | Morgan Stanley Mortgage Loan Trust, Series 2005-7-4A1 | | | 5.50 | % | | | 11/25/2035 | | | | 53,588 | |
294,662 | | Morgan Stanley Mortgage Loan Trust, Series 2006-2-7A1 | | | 5.47 | % (g) | | | 02/25/2036 | | | | 177,279 | |
453,442 | | Morgan Stanley Mortgage Loan Trust, Series 2007-8XS-A1 | | | 5.75 | % (g) | | | 04/25/2037 | | | | 235,293 | |
7,747,516 | | Morgan Stanley Resecuritization Trust, Series 2013-R7-8B (12 Month US Treasury Average + 0.96%, 0.96% Floor) | | | 3.75 | % (a)(k) | | | 12/26/2046 | | | | 7,119,685 | |
1,438,833 | | New Century Home Equity Loan Trust, Series 2006-1-A2B (1 Month LIBOR USD + 0.36%, 0.36% Floor, 12.50% Cap) | | | 5.21 | % | | | 05/25/2036 | | | | 1,396,480 | |
3,600,000 | | New York Mortgage Trust, Series 2021-BPL1-A2 | | | 2.98 | % (a)(l) | | | 05/25/2026 | | | | 3,446,095 | |
10,063,408 | | NovaStar Mortgage Funding Trust, Series 2006-3-A2C (1 Month LIBOR USD + 0.32%, 0.32% Floor, 11.00% Cap) | | | 5.17 | % | | | 10/25/2036 | | | | 5,524,768 | |
5,550,803 | | PMT Credit Risk Transfer Trust, Series 2019-2R-A (1 Month LIBOR USD + 2.75%, 2.75% Floor) | | | 7.60 | % (a) | | | 05/27/2023 | | | | 5,433,654 | |
425,074 | | PMT Credit Risk Transfer Trust, Series 2019-3R-A (1 Month LIBOR USD + 3.70%, 2.70% Floor) | | | 8.55 | % (a) | | | 10/27/2024 | | | | 411,466 | |
500,000 | | PMT Credit Risk Transfer Trust, Series 2021-FT1-A (1 Month LIBOR USD + 3.00%, 3.00% Floor) | | | 7.85 | % (a) | | | 03/25/2026 | | | | 497,144 | |
3,100,000 | | Progress Residential Trust, Series 2019-SFR4-F | | | 3.68 | % (a) | | | 10/17/2036 | | | | 2,966,627 | |
1,100,000 | | Progress Residential Trust, Series 2021-SFR1-G | | | 3.86 | % (a) | | | 04/17/2038 | | | | 961,269 | |
7,500,000 | | Progress Residential Trust, Series 2021-SFR2-F | | | 3.40 | % (a) | | | 04/19/2038 | | | | 6,520,859 | |
8,100,000 | | Progress Residential Trust, Series 2021-SFR3-F | | | 3.44 | % (a) | | | 05/17/2026 | | | | 7,198,545 | |
3,000,000 | | PRPM LLC, Series 2021-2-A2 | | | 3.77 | % (a)(g) | | | 03/25/2026 | | | | 2,674,644 | |
286,132 | | Residential Accredit Loans, Inc., Series 2006-QS12-2A3 | | | 6.00 | % | | | 09/25/2036 | | | | 230,311 | |
1,498,835 | | Residential Asset Securitization Trust, Series 2005-A15-5A2 | | | 5.75 | % | | | 02/25/2036 | | | | 610,289 | |
344,363 | | Residential Asset Securitization Trust, Series 2006-A2-A11 | | | 6.00 | % | | | 01/25/2046 | | | | 151,092 | |
2,855,140 | | Residential Funding Mortgage Securities Trust, Series 2006-S8-A10 | | | 6.00 | % | | | 09/25/2036 | | | | 2,230,042 | |
5,750,000 | | Residential Mortgage Loan Trust, Series 2020-1-B1 | | | 3.95 | % (a)(g) | | | 01/26/2060 | | | | 4,369,721 | |
4,662,352 | | Soundview Home Loan Trust, Series 2007-OPT1-2A2 (1 Month LIBOR USD + 0.15%, 0.15% Floor) | | | 5.00 | % | | | 06/25/2037 | | | | 3,165,636 | |
1,116,000 | | Starwood Mortgage Residential Trust, Series 2019-INV1-B1 | | | 3.66 | % (a)(g) | | | 09/27/2049 | | | | 939,085 | |
609,386 | | Structured Adjustable Rate Mortgage Loan Trust, Series 2005-22-4A1 | | | 4.26 | % (g) | | | 12/25/2035 | | | | 529,683 | |
8,118,768 | | Structured Asset Securities Corporation, Series 2007-OSI-A4 (1 Month LIBOR USD + 0.20%, 0.20% Floor) | | | 5.05 | % | | | 06/25/2037 | | | | 5,390,484 | |
5,532,498 | | Structured Asset Securities Corporation, Series 2007-RF1-1A (1 Month LIBOR USD + 0.19%, 0.19% Floor) | | | 5.04 | % (a) | | | 03/25/2037 | | | | 4,451,086 | |
13,320,364 | | TBW Mortgage Backed Pass Through Trust, Series 2006-3-4A1 (1 Month LIBOR USD + 0.40%, 0.40% Floor, 7.50% Cap) | | | 5.25 | % | | | 07/25/2036 | | | | 1,254,842 | |
13,320,450 | | TBW Mortgage Backed Pass Through Trust, Series 2006-3-4A3 (-1 x 1 Month LIBOR USD + 7.10%, 7.10% Cap) | | | 2.25 | % (f)(h) | | | 07/25/2036 | | | | 814,442 | |
6,600,000 | | Toorak Mortgage Corporation Ltd., Series 2021-1-A2 | | | 3.10 | % (a)(l) | | | 06/25/2024 | | | | 6,050,710 | |
5,000,000 | | Tricon American Homes Trust, Series 2019-SFR1-F | | | 3.75 | % (a) | | | 03/17/2038 | | | | 4,568,503 | |
1,604,965 | | Velocity Commercial Capital Loan Trust, Series 2018-2-M2 | | | 4.51 | % (a)(g) | | | 10/26/2048 | | | | 1,417,726 | |
408,411 | | Velocity Commercial Capital Loan Trust, Series 2018-2-M3 | | | 4.72 | % (a)(g) | | | 10/26/2048 | | | | 348,955 | |
1,146,779 | | Velocity Commercial Capital Loan Trust, Series 2019-1-M5 | | | 5.70 | % (a)(g) | | | 03/25/2049 | | | | 905,392 | |
1,721,262 | | Velocity Commercial Capital Loan Trust, Series 2019-2-M4 | | | 3.99 | % (a)(g) | | | 07/25/2049 | | | | 1,482,036 | |
3,100,000 | | Verus Securitization Trust, Series 2019-INV3-B1 | | | 3.73 | % (a)(g) | | | 11/25/2059 | | | | 2,555,172 | |
2,600,000 | | Verus Securitization Trust, Series 2021-3-B1 | | | 3.20 | % (a)(g) | | | 06/25/2066 | | | | 1,666,982 | |
5,000,000 | | Verus Securitization Trust, Series 2021-7-B1 | | | 4.14 | % (a)(g) | | | 10/25/2066 | | | | 3,354,003 | |
3,000,000 | | Verus Securitization Trust, Series 2021-R2-B1 | | | 3.25 | % (a)(g) | | | 02/25/2064 | | | | 2,153,510 | |
529,137 | | Washington Mutual Mortgage Pass-Through Certificates Trust, Series 2006-2-4CB | | | 6.00 | % | | | 03/25/2036 | | | | 502,157 | |
787,114 | | Washington Mutual Mortgage Pass-Through Certificates Trust, Series 2007-HY6-2A2 | | | 3.15 | % (g) | | | 06/25/2037 | | | | 676,471 | |
253,218 | | Wells Fargo Alternative Loan Trust, Series 2007-PA5-1A1 | | | 6.25 | % | | | 11/25/2037 | | | | 217,804 | |
4,534,286 | | Wells Fargo Home Equity Asset-Backed Securities Trust, Series 2007-2-A4 (1 Month LIBOR USD + 0.30%, 0.30% Floor) | | | 5.45 | % | | | 04/25/2037 | | | | 3,034,281 | |
| | | | | | | | | | | | | | |
Total Non-Agency Residential Collateralized Mortgage Obligations (Cost $226,979,009) | | | | | | | | | | | 183,123,665 | |
| | | | | | | | | | | | | | |
US Corporate Bonds - 4.1% | |
425,000 | | Academy Ltd. | | | 6.00 | % (a) | | | 11/15/2027 | | | | 415,062 | |
275,000 | | Acuris Finance, Inc. | | | 5.00 | % (a) | | | 05/01/2028 | | | | 216,237 | |
260,000 | | AdaptHealth LLC | | | 5.13 | % (a) | | | 03/01/2030 | | | | 220,823 | |
255,000 | | Advanced Drainage Systems, Inc. | | | 6.38 | % (a) | | | 06/15/2030 | | | | 250,157 | |
215,000 | | Aethon United Finance Corporation | | | 8.25 | % (a) | | | 02/15/2026 | | | | 211,176 | |
55,000 | | Air Methods Corporation | | | 8.00 | % (a)(d) | | | 05/15/2025 | | | | 3,588 | |
185,000 | | Alliant Holdings Intermediate LLC | | | 6.75 | % (a) | | | 10/15/2027 | | | | 171,763 | |
260,000 | | Allied Universal Holdco LLC | | | 6.63 | % (a) | | | 07/15/2026 | | | | 250,120 | |
200,000 | | Allied Universal Holdco LLC | | | 6.00 | % (a) | | | 06/01/2029 | | | | 149,521 | |
70,000 | | AMC Entertainment Holdings, Inc. | | | 7.50 | % (a) | | | 02/15/2029 | | | | 48,431 | |
355,000 | | American Airlines, Inc. | | | 5.75 | % (a) | | | 04/20/2029 | | | | 340,907 | |
2,314,858 | | American Airlines, Inc. | | | 5.25 | % | | | 01/15/2024 | | | | 2,268,768 | |
100,000 | | American Axle & Manufacturing, Inc. | | | 5.00 | % | | | 10/01/2029 | | | | 84,571 | |
185,000 | | AmWINS Group, Inc. | | | 4.88 | % (a) | | | 06/30/2029 | | | | 163,968 | |
239,000 | | Antero Midstream Partners LP | | | 5.75 | % (a) | | | 03/01/2027 | | | | 233,814 | |
230,000 | | Antero Resources Corporation | | | 5.38 | % (a) | | | 03/01/2030 | | | | 214,216 | |
290,000 | | Arconic Corporation | | | 6.13 | % (a) | | | 02/15/2028 | | | | 285,551 | |
145,000 | | Ashton Woods Finance Company | | | 4.63 | % (a) | | | 04/01/2030 | | | | 119,552 | |
170,000 | | ASP Unifrax Holdings, Inc. | | | 5.25 | % (a) | | | 09/30/2028 | | | | 136,051 | |
250,000 | | AssuredPartners, Inc. | | | 5.63 | % (a) | | | 01/15/2029 | | | | 216,334 | |
100,000 | | Bausch Health Companies, Inc. | | | 6.13 | % (a) | | | 02/01/2027 | | | | 64,822 | |
220,000 | | Bausch Health Companies, Inc. | | | 4.88 | % (a) | | | 06/01/2028 | | | | 129,998 | |
78,000 | | Bausch Health Companies, Inc. | | | 11.00 | % (a) | | | 09/30/2028 | | | | 57,786 | |
15,000 | | Bausch Health Companies, Inc. | | | 14.00 | % (a) | | | 10/15/2030 | | | | 8,519 | |
250,000 | | BCPE Empire Holdings, Inc. | | | 7.63 | % (a) | | | 05/01/2027 | | | | 228,662 | |
150,000 | | Blue Racer Midstream LLC | | | 7.63 | % (a) | | | 12/15/2025 | | | | 148,635 | |
25,000 | | Boxer Parent Company, Inc. | | | 7.13 | % (a) | | | 10/02/2025 | | | | 24,912 | |
195,000 | | Builders FirstSource, Inc. | | | 4.25 | % (a) | | | 02/01/2032 | | | | 170,096 | |
225,000 | | Caesars Entertainment, Inc. | | | 4.63 | % (a) | | | 10/15/2029 | | | | 196,995 | |
15,000 | | Caesars Entertainment, Inc. | | | 7.00 | % (a) | | | 02/15/2030 | | | | 15,276 | |
190,000 | | Callon Petroleum Company | | | 7.50 | % (a) | | | 06/15/2030 | | | | 178,783 | |
210,000 | | Calpine Corporation | | | 4.50 | % (a) | | | 02/15/2028 | | | | 195,052 | |
210,000 | | Calpine Corporation | | | 4.63 | % (a) | | | 02/01/2029 | | | | 181,606 | |
340,000 | | Carnival Corporation | | | 5.75 | % (a) | | | 03/01/2027 | | | | 279,281 | |
250,000 | | Carnival Corporation | | | 9.88 | % (a) | | | 08/01/2027 | | | | 257,755 | |
145,000 | | Castle US Holding Corporation | | | 9.50 | % (a) | | | 02/15/2028 | | | | 59,611 | |
355,000 | | CCO Holdings LLC | | | 4.75 | % (a) | | | 03/01/2030 | | | | 307,962 | |
295,000 | | CCO Holdings LLC | | | 4.50 | % (a) | | | 08/15/2030 | | | | 249,610 | |
200,000 | | CCO Holdings LLC | | | 4.75 | % (a) | | | 02/01/2032 | | | | 168,221 | |
180,000 | | CCO Holdings LLC | | | 4.25 | % (a) | | | 01/15/2034 | | | | 140,973 | |
| 235,000 | | Cedar Fair LP | | | 5.25 | % | | | 07/15/2029 | | | | 219,348 | |
270,000 | | Chesapeake Energy Corporation | | | 5.88 | % (a) | | | 02/01/2029 | | | | 257,330 | |
135,000 | | Clarivate Science Holdings Corporation | | | 4.88 | % (a) | | | 07/01/2029 | | | | 122,222 | |
110,000 | | Clean Harbors, Inc. | | | 5.13 | % (a) | | | 07/15/2029 | | | | 105,001 | |
95,000 | | Clear Channel Outdoor Holdings, Inc. | | | 7.50 | % (a) | | | 06/01/2029 | | | | 67,602 | |
305,000 | | Clearway Energy Operating LLC | | | 4.75 | % (a) | | | 03/15/2028 | | | | 291,614 | |
260,000 | | CNX Midstream Partners LP | | | 4.75 | % (a) | | | 04/15/2030 | | | | 223,938 | |
185,000 | | CNX Resources Corporation | | | 6.00 | % (a) | | | 01/15/2029 | | | | 173,197 | |
75,000 | | CNX Resources Corporation | | | 7.38 | % (a) | | | 01/15/2031 | | | | 73,961 | |
150,000 | | CommScope Technologies LLC | | | 5.00 | % (a) | | | 03/15/2027 | | | | 109,860 | |
135,000 | | CommScope, Inc. | | | 4.75 | % (a) | | | 09/01/2029 | | | | 112,657 | |
140,000 | | Community Health Systems, Inc. | | | 6.00 | % (a) | | | 01/15/2029 | | | | 118,565 | |
200,000 | | Community Health Systems, Inc. | | | 4.75 | % (a) | | | 02/15/2031 | | | | 147,860 | |
140,000 | | Consolidated Communications, Inc. | | | 5.00 | % (a) | | | 10/01/2028 | | | | 95,240 | |
120,000 | | Cornerstone Building Brands, Inc. | | | 6.13 | % (a) | | | 01/15/2029 | | | | 85,787 | |
285,000 | | Coty, Inc. | | | 5.00 | % (a) | | | 04/15/2026 | | | | 275,237 | |
470,000 | | CQP Holdco LP | | | 5.50 | % (a) | | | 06/15/2031 | | | | 423,009 | |
230,000 | | CSC Holdings LLC | | | 6.50 | % (a) | | | 02/01/2029 | | | | 191,226 | |
245,000 | | CSC Holdings LLC | | | 5.75 | % (a) | | | 01/15/2030 | | | | 129,237 | |
180,000 | | CSI Compressco LP | | | 7.50 | % (a) | | | 04/01/2025 | | | | 171,677 | |
190,000 | | CVR Nitrogen Finance Corporation | | | 6.13 | % (a) | | | 06/15/2028 | | | | 168,645 | |
100,000 | | Dana, Inc. | | | 5.38 | % | | | 11/15/2027 | | | | 93,420 | |
65,000 | | Dana, Inc. | | | 4.25 | % | | | 09/01/2030 | | | | 52,174 | |
110,000 | | Dealer Tire LLC | | | 8.00 | % (a) | | | 02/01/2028 | | | | 98,860 | |
165,000 | | DirectTV Financing LLC | | | 5.88 | % (a) | | | 08/15/2027 | | | | 149,599 | |
60,000 | | DISH DBS Corporation | | | 5.88 | % | | | 11/15/2024 | | | | 53,568 | |
195,000 | | DISH DBS Corporation | | | 5.75 | % (a) | | | 12/01/2028 | | | | 145,884 | |
110,000 | | DISH DBS Corporation | | | 5.13 | % | | | 06/01/2029 | | | | 58,694 | |
80,000 | | Dornoch Debt Merger Sub, Inc. | | | 6.63 | % (a) | | | 10/15/2029 | | | | 54,070 | |
250,000 | | Dun & Bradstreet Corporation | | | 5.00 | % (a) | | | 12/15/2029 | | | | 216,746 | |
115,000 | | Embarq Corporation | | | 8.00 | % | | | 06/01/2036 | | | | 48,465 | |
55,000 | | Emergent BioSolutions, Inc. | | | 3.88 | % (a) | | | 08/15/2028 | | | | 26,904 | |
45,000 | | Encompass Health Corporation | | | 4.75 | % | | | 02/01/2030 | | | | 40,963 | |
145,000 | | Encompass Health Corporation | | | 4.63 | % | | | 04/01/2031 | | | | 126,802 | |
95,000 | | Endo Luxembourg Finance Company SARL | | | 6.13 | % (a) | | | 04/01/2029 | | | | 70,360 | |
160,000 | | Energizer Holdings, Inc. | | | 6.50 | % (a) | | | 12/31/2027 | | | | 155,540 | |
155,000 | | EQM Midstream Partners LP | | | 4.75 | % (a) | | | 01/15/2031 | | | | 128,865 | |
215,000 | | EverArc Escrow SARL | | | 5.00 | % (a) | | | 10/30/2029 | | | | 178,734 | |
180,000 | | Ferrellgas LP | | | 5.38 | % (a) | | | 04/01/2026 | | | | 168,739 | |
285,000 | | Fertitta Entertainment LLC | | | 6.75 | % (a) | | | 01/15/2030 | | | | 234,735 | |
630,000 | | Ford Motor Company | | | 3.25 | % | | | 02/12/2032 | | | | 496,041 | |
200,000 | | Ford Motor Credit Company LLC | | | 4.39 | % | | | 01/08/2026 | | | | 190,044 | |
200,000 | | Ford Motor Credit Company LLC | | | 4.95 | % | | | 05/28/2027 | | | | 191,060 | |
260,000 | | Ford Motor Credit Company LLC | | | 3.63 | % | | | 06/17/2031 | | | | 214,587 | |
170,000 | | Fortress Transportation and Infrastructure Investors LLC | | | 5.50 | % (a) | | | 05/01/2028 | | | | 155,305 | |
165,000 | | Frontier Communications Holdings LLC | | | 5.00 | % (a) | | | 05/01/2028 | | | | 143,365 | |
23,218 | | Frontier Communications Holdings LLC | | | 5.88 | % | | | 11/01/2029 | | | | 17,728 | |
110,000 | | Full House Resorts, Inc. | | | 8.25 | % (a) | | | 02/15/2028 | | | | 100,199 | |
200,000 | | Gap, Inc. | | | 3.88 | % (a) | | | 10/01/2031 | | | | 138,954 | |
320,000 | | Global Access, Inc. | | | 5.00 | % (a) | | | 07/15/2029 | | | | 285,173 | |
246,640 | | Global Aircraft Leasing Company (7.25% PIK) | | | 6.50 | % (a) | | | 09/15/2024 | | | | 222,817 | |
280,000 | | Goodyear Tire & Rubber Company | | | 5.25 | % | | | 07/15/2031 | | | | 242,161 | |
125,000 | | GrafTech Finance, Inc. | | | 4.63 | % (a) | | | 12/15/2028 | | | | 104,387 | |
210,000 | | Griffon Corporation | | | 5.75 | % | | | 03/01/2028 | | | | 194,990 | |
112,043 | | Gulfport Energy Corporation | | | 8.00 | % (a) | | | 05/17/2026 | | | | 111,057 | |
315,000 | | Helios Software Holdings, Inc. | | | 4.63 | % (a) | | | 05/01/2028 | | | | 256,252 | |
70,000 | | Hertz Corporation | | | 5.00 | % (a) | | | 12/01/2029 | | | | 58,054 | |
365,000 | | Hess Midstream Operations LP | | | 4.25 | % (a) | | | 02/15/2030 | | | | 326,418 | |
450,000 | | Hess Midstream Operations LP | | | 5.50 | % (a) | | | 10/15/2030 | | | | 419,110 | |
230,000 | | H-Food Holdings LLC | | | 8.50 | % (a) | | | 06/01/2026 | | | | 142,565 | |
220,000 | | Hightower Holding LLC | | | 6.75 | % (a) | | | 04/15/2029 | | | | 187,454 | |
470,000 | | Hilcorp Energy LP | | | 6.25 | % (a) | | | 11/01/2028 | | | | 446,631 | |
240,000 | | Icahn Enterprises LP | | | 5.25 | % | | | 05/15/2027 | | | | 225,485 | |
55,000 | | iHeartCommunications, Inc. | | | 8.38 | % | | | 05/01/2027 | | | | 40,063 | |
225,000 | | II-VI, Inc. | | | 5.00 | % (a) | | | 12/15/2029 | | | | 204,469 | |
165,000 | | Illuminate Buyer LLC | | | 9.00 | % (a) | | | 07/01/2028 | | | | 146,424 | |
335,000 | | Installed Building Products, Inc. | | | 5.75 | % (a) | | | 02/01/2028 | | | | 308,911 | |
145,000 | | Iron Mountain, Inc. | | | 4.88 | % (a) | | | 09/15/2029 | | | | 130,483 | |
350,000 | | Iron Mountain, Inc. | | | 4.50 | % (a) | | | 02/15/2031 | | | | 301,105 | |
130,000 | | JELD-WEN, Inc. | | | 4.63 | % (a) | | | 12/15/2025 | | | | 120,741 | |
200,000 | | Leeward Renewable Energy Operations LLC | | | 4.25 | % (a) | | | 07/01/2029 | | | | 174,440 | |
145,000 | | Legacy LifePoint Health LLC | | | 4.38 | % (a) | | | 02/15/2027 | | | | 118,731 | |
220,000 | | Legends Hospitality Holding Company LLC | | | 5.00 | % (a) | | | 02/01/2026 | | | | 197,094 | |
115,000 | | Level 3 Financing, Inc. | | | 3.75 | % (a) | | | 07/15/2029 | | | | 61,464 | |
110,000 | | Level 3 Financing, Inc. | | | 0.00 | % (a) | | | 05/15/2030 | | | | 105,737 | |
320,000 | | LFS Topco LLC | | | 5.88 | % (a) | | | 10/15/2026 | | | | 279,229 | |
75,000 | | LifePoint Health, Inc. | | | 5.38 | % (a) | | | 01/15/2029 | | | | 45,937 | |
110,000 | | Lions Gate Capital Holdings LLC | | | 5.50 | % (a) | | | 04/15/2029 | | | | 72,444 | |
195,000 | | LSF9 Atlantis Holdings LLC | | | 7.75 | % (a) | | | 02/15/2026 | | | | 177,328 | |
95,000 | | Lumen Technologies, Inc. | | | 4.00 | % (a) | | | 02/15/2027 | | | | 62,787 | |
285,000 | | M/I Homes, Inc. | | | 4.95 | % | | | 02/01/2028 | | | | 263,996 | |
160,000 | | Madison IAQ LLC | | | 4.13 | % (a) | | | 06/30/2028 | | | | 138,578 | |
160,000 | | Madison IAQ LLC | | | 5.88 | % (a) | | | 06/30/2029 | | | | 123,758 | |
200,000 | | McGraw-Hill Education, Inc. | | | 5.75 | % (a) | | | 08/01/2028 | | | | 174,235 | |
305,000 | | Medline Borrower LP | | | 5.25 | % (a) | | | 10/01/2029 | | | | 264,913 | |
200,000 | | Metis Merger Sub LLC | | | 6.50 | % (a) | | | 05/15/2029 | | | | 166,764 | |
150,000 | | Michaels Companies, Inc. | | | 5.25 | % (a) | | | 05/01/2028 | | | | 125,170 | |
130,000 | | Michaels Companies, Inc. | | | 7.88 | % (a) | | | 05/01/2029 | | | | 91,123 | |
335,000 | | Midwest Gaming Borrower LLC | | | 4.88 | % (a) | | | 05/01/2029 | | | | 291,610 | |
220,000 | | Minerva Merger Sub, Inc. | | | 6.50 | % (a) | | | 02/15/2030 | | | | 178,587 | |
230,000 | | ModivCare Escrow Issuer, Inc. | | | 5.00 | % (a) | | | 10/01/2029 | | | | 195,524 | |
60,000 | | Moss Creek Resources Holdings, Inc. | | | 7.50 | % (a) | | | 01/15/2026 | | | | 55,708 | |
225,000 | | Murphy Oil USA, Inc. | | | 4.75 | % | | | 09/15/2029 | | | | 205,245 | |
170,000 | | Nabors Industries Ltd. | | | 7.25 | % (a) | | | 01/15/2026 | | | | 162,305 | |
275,000 | | Nationstar Mortgage Holdings, Inc. | | | 5.75 | % (a) | | | 11/15/2031 | | | | 213,614 | |
150,000 | | Navient Corporation | | | 5.00 | % | | | 03/15/2027 | | | | 132,314 | |
255,000 | | NCL Corporation Ltd. | | | 5.88 | % (a) | | | 03/15/2026 | | | | 217,298 | |
155,000 | | NCL Corporation Ltd. | | | 8.38 | % (a) | | | 02/01/2028 | | | | 155,671 | |
85,000 | | News Corporation | | | 5.13 | % (a) | | | 02/15/2032 | | | | 79,814 | |
200,000 | | NFP Corporation | | | 4.88 | % (a) | | | 08/15/2028 | | | | 180,654 | |
200,000 | | NGL Energy Operating LLC | | | 7.50 | % (a) | | | 02/01/2026 | | | | 193,157 | |
70,000 | | NGL Energy Partners LP | | | 7.50 | % | | | 04/15/2026 | | | | 60,613 | |
300,000 | | NRG Energy, Inc. | | | 3.63 | % (a) | | | 02/15/2031 | | | | 240,888 | |
160,000 | | Oasis Petroleum, Inc. | | | 6.38 | % (a) | | | 06/01/2026 | | | | 158,670 | |
290,000 | | Occidental Petroleum Corporation | | | 6.13 | % | | | 01/01/2031 | | | | 301,169 | |
155,000 | | Occidental Petroleum Corporation | | | 6.60 | % | | | 03/15/2046 | | | | 163,137 | |
220,000 | | Olympus Water US Holding Corporation | | | 4.25 | % (a) | | | 10/01/2028 | | | | 182,267 | |
200,000 | | Olympus Water US Holding Corporation | | | 6.25 | % (a) | | | 10/01/2029 | | | | 148,223 | |
60,000 | | OneMain Finance Corporation | | | 7.13 | % | | | 03/15/2026 | | | | 57,738 | |
220,000 | | OneMain Finance Corporation | | | 6.63 | % | | | 01/15/2028 | | | | 201,916 | |
200,000 | | Organon & Company | | | 5.13 | % (a) | | | 04/30/2031 | | | | 177,716 | |
305,000 | | Owens & Minor, Inc. | | | 6.63 | % (a) | | | 04/01/2030 | | | | 262,193 | |
200,000 | | Park Intermediate Holdings LLC | | | 4.88 | % (a) | | | 05/15/2029 | | | | 172,293 | |
60,000 | | PBF Holding Company LLC | | | 6.00 | % | | | 02/15/2028 | | | | 57,747 | |
90,000 | | PECF USS Intermediate Holding Corporation | | | 8.00 | % (a) | | | 11/15/2029 | | | | 59,877 | |
300,000 | | Penn National Gaming, Inc. | | | 5.63 | % (a) | | | 01/15/2027 | | | | 282,041 | |
145,000 | | Penn National Gaming, Inc. | | | 4.13 | % (a) | | | 07/01/2029 | | | | 121,054 | |
245,000 | | PennyMac Financial Services, Inc. | | | 4.25 | % (a) | | | 02/15/2029 | | | | 195,331 | |
180,000 | | Performance Food Group, Inc. | | | 4.25 | % (a) | | | 08/01/2029 | | | | 161,830 | |
250,000 | | PetSmart, Inc. | | | 7.75 | % (a) | | | 02/15/2029 | | | | 245,670 | |
250,000 | | Pike Corporation | | | 5.50 | % (a) | | | 09/01/2028 | | | | 219,015 | |
105,000 | | Post Holdings, Inc. | | | 5.50 | % (a) | | | 12/15/2029 | | | | 99,064 | |
72,000 | | Post Holdings, Inc. | | | 4.63 | % (a) | | | 04/15/2030 | | | | 64,595 | |
130,000 | | Premier Entertainment Sub LLC | | | 5.63 | % (a) | | | 09/01/2029 | | | | 96,119 | |
165,000 | | Prime Security Services Borrower LLC | | | 6.25 | % (a) | | | 01/15/2028 | | | | 154,430 | |
70,000 | | Radiate Holdco LLC | | | 4.50 | % (a) | | | 09/15/2026 | | | | 54,846 | |
75,000 | | Radiate Holdco LLC | | | 6.50 | % (a) | | | 09/15/2028 | | | | 30,851 | |
140,000 | | Radiology Partners, Inc. | | | 9.25 | % (a) | | | 02/01/2028 | | | | 77,545 | |
125,000 | | Realogy Group LLC | | | 5.25 | % (a) | | | 04/15/2030 | | | | 91,223 | |
100,000 | | RegionalCare Hospital Partners Holdings, Inc. / LifePoint Health, Inc. | | | 9.75 | % (a) | | | 12/01/2026 | | | | 80,979 | |
90,000 | | Rent-A-Center, Inc. | | | 6.38 | % (a) | | | 02/15/2029 | | | | 75,683 | |
100,000 | | Roller Bearing Company of America, Inc. | | | 4.38 | % (a) | | | 10/15/2029 | | | | 89,416 | |
255,000 | | Royal Caribbean Cruises Ltd. | | | 5.50 | % (a) | | | 08/31/2026 | | | | 238,860 | |
40,000 | | Royal Caribbean Cruises Ltd. | | | 7.25 | % (a) | | | 01/15/2030 | | | | 40,286 | |
110,000 | | RP Escrow Issuer LLC | | | 5.25 | % (a) | | | 12/15/2025 | | | | 83,455 | |
165,000 | | Schweitzer-Mauduit International, Inc. | | | 6.88 | % (a) | | | 10/01/2026 | | | | 151,148 | |
220,000 | | Scientific Games Holdings LP | | | 6.63 | % (a) | | | 03/01/2030 | | | | 194,619 | |
220,000 | | Scientific Games International, Inc. | | | 7.25 | % (a) | | | 11/15/2029 | | | | 220,625 | |
65,000 | | Scripps Escrow, Inc. | | | 5.88 | % (a) | | | 07/15/2027 | | | | 47,938 | |
100,000 | | Scripps Escrow, Inc. | | | 3.88 | % (a) | | | 01/15/2029 | | | | 78,594 | |
225,000 | | SEG Holding LLC | | | 5.63 | % (a) | | | 10/15/2028 | | | | 213,861 | |
205,000 | | Select Medical Corporation | | | 6.25 | % (a) | | | 08/15/2026 | | | | 199,056 | |
260,000 | | Southwestern Energy Company | | | 5.38 | % | | | 02/01/2029 | | | | 245,350 | |
215,000 | | Southwestern Energy Company | | | 4.75 | % | | | 02/01/2032 | | | | 190,157 | |
285,000 | | Spectrum Brands, Inc. | | | 5.00 | % (a) | | | 10/01/2029 | | | | 247,706 | |
150,000 | | SRS Distribution, Inc. | | | 4.63 | % (a) | | | 07/01/2028 | | | | 133,421 | |
150,000 | | SRS Distribution, Inc. | | | 6.13 | % (a) | | | 07/01/2029 | | | | 126,750 | |
190,000 | | Staples, Inc. | | | 7.50 | % (a) | | | 04/15/2026 | | | | 166,649 | |
85,000 | | Staples, Inc. | | | 10.75 | % (a) | | | 04/15/2027 | | | | 61,738 | |
145,000 | | Station Casinos LLC | | | 4.63 | % (a) | | | 12/01/2031 | | | | 122,592 | |
280,000 | | Suburban Propane Partners LP | | | 5.00 | % (a) | | | 06/01/2031 | | | | 244,993 | |
240,000 | | SunCoke Energy, Inc. | | | 4.88 | % (a) | | | 06/30/2029 | | | | 209,239 | |
115,000 | | Sunoco LP | | | 6.00 | % | | | 04/15/2027 | | | | 113,677 | |
100,000 | | Sunoco LP | | | 4.50 | % | | | 05/15/2029 | | | | 91,917 | |
90,000 | | SWF Escrow Issuer Corporation | | | 6.50 | % (a) | | | 10/01/2029 | | | | 55,481 | |
165,000 | | Tenet Healthcare Corporation | | | 6.25 | % | | | 02/01/2027 | | | | 162,443 | |
145,000 | | Tenet Healthcare Corporation | | | 6.13 | % | | | 10/01/2028 | | | | 139,105 | |
250,000 | | Tenet Healthcare Corporation | | | 6.13 | % (a) | | | 06/15/2030 | | | | 246,850 | |
115,000 | | TMS International Corporation | | | 6.25 | % (a) | | | 04/15/2029 | | | | 88,795 | |
275,000 | | Townsquare Media, Inc. | | | 6.88 | % (a) | | | 02/01/2026 | | | | 260,400 | |
285,000 | | TransDigm, Inc. | | | 5.50 | % | | | 11/15/2027 | | | | 269,041 | |
182,813 | | Transocean Poseidon Ltd. | | | 6.88 | % (a) | | | 02/01/2027 | | | | 179,376 | |
305,000 | | Trident TPI Holdings, Inc. | | | 6.63 | % (a) | | | 11/01/2025 | | | | 282,407 | |
180,000 | | Triton Water Holdings, Inc. | | | 6.25 | % (a) | | | 04/01/2029 | | | | 143,102 | |
225,000 | | United Airlines, Inc. | | | 4.63 | % (a) | | | 04/15/2029 | | | | 203,810 | |
390,000 | | United Natural Foods, Inc. | | | 6.75 | % (a) | | | 10/15/2028 | | | | 362,821 | |
85,000 | | Uniti Group LP / Uniti Group Finance, Inc. / CSL Capital LLC | | | 10.50 | % (a) | | | 02/15/2028 | | | | 82,527 | |
230,000 | | Univision Communications, Inc. | | | 4.50 | % (a) | | | 05/01/2029 | | | | 193,468 | |
170,000 | | USA Compression Partners LP | | | 6.88 | % | | | 09/01/2027 | | | | 162,614 | |
300,000 | | Victoria’s Secret Company | | | 4.63 | % (a) | | | 07/15/2029 | | | | 243,411 | |
85,000 | | Viking Cruises Ltd. | | | 13.00 | % (a) | | | 05/15/2025 | | | | 89,859 | |
605,000 | | Viking Cruises Ltd. | | | 5.88 | % (a) | | | 09/15/2027 | | | | 521,571 | |
105,000 | | Virtusa Corporation | | | 7.13 | % (a) | | | 12/15/2028 | | | | 82,618 | |
230,000 | | WASH Multifamily Acquisition, Inc. | | | 5.75 | % (a) | | | 04/15/2026 | | | | 217,893 | |
120,000 | | Weatherford International Ltd. | | | 6.50 | % (a) | | | 09/15/2028 | | | | 120,319 | |
240,000 | | Weatherford International Ltd. | | | 8.63 | % (a) | | | 04/30/2030 | | | | 245,750 | |
70,000 | | Wheel Pros, Inc. | | | 6.50 | % (a) | | | 05/15/2029 | | | | 31,850 | |
190,000 | | WR Grace Holdings LLC | | | 5.63 | % (a) | | | 08/15/2029 | | | | 161,500 | |
380,000 | | XHR LP | | | 4.88 | % (a) | | | 06/01/2029 | | | | 322,678 | |
| | | | | | | | | | | | | | |
Total US Corporate Bonds (Cost $43,621,942) | | | | | | | | | | | 38,435,221 | |
| | | | | | | | | | | | | | |
US Government and Agency Mortgage Backed Obligations - 8.1% | |
10,309,961 | | Federal Home Loan Mortgage Corporation Pass-Thru, Series KF89-AS (Secured Overnight Financing Rate 30 Day Average + 0.37%) | | | 4.90 | % | | | 09/25/2030 | | | | 10,160,116 | |
685,893 | | Federal Home Loan Mortgage Corporation REMICS, Series 3926-HS (-1 x 1 Month LIBOR USD + 6.45%, 6.45% Cap) | | | 1.77 | % (f)(h) | | | 09/15/2041 | | | | 76,561 | |
234,833 | | Federal Home Loan Mortgage Corporation REMICS, Series 4471-GA | | | 3.00 | % | | | 02/15/2044 | | | | 221,002 | |
14,084,140 | | Federal Home Loan Mortgage Corporation REMICS, Series 4851-PF (1 Month LIBOR USD + 0.40%, 0.40% Floor, 6.50% Cap) | | | 5.08 | % | | | 08/15/2057 | | | | 13,817,909 | |
2,140,629 | | Federal Home Loan Mortgage Corporation REMICS, Series 4942-FB (1 Month LIBOR USD + 0.50%, 0.50% Floor, 6.00% Cap) | | | 5.18 | % | | | 04/15/2040 | | | | 2,091,303 | |
12,595,047 | | Federal Home Loan Mortgage Corporation REMICS, Series 4944-F (1 Month LIBOR USD + 0.45%, 0.45% Floor, 6.50% Cap) | | | 5.30 | % | | | 01/25/2050 | | | | 12,333,929 | |
1,596,465 | | Federal Home Loan Mortgage Corporation REMICS, Series 4981-GF (1 Month LIBOR USD + 0.40%, 0.40% Floor, 6.50% Cap) | | | 5.25 | % | | | 06/25/2050 | | | | 1,546,472 | |
11,613,784 | | Federal Home Loan Mortgage Corporation REMICS, Series 5142-QI | | | 3.00 | % (f) | | | 09/25/2051 | | | | 1,955,082 | |
6,903,215 | | Federal National Mortgage Association REMICS, Series 2013-12-FT (1 Month LIBOR USD + 0.35%, 0.35% Floor, 6.50% Cap) | | | 5.20 | % | | | 02/25/2043 | | | | 6,696,292 | |
8,840,185 | | Federal National Mortgage Association REMICS, Series 2017-11-SK (-1 x 1 Month LIBOR USD + 6.05%, 6.05% Cap) | | | 1.20 | % (f)(h) | | | 03/25/2047 | | | | 1,074,376 | |
4,669,042 | | Federal National Mortgage Association REMICS, Series 2018-86-MF (1 Month LIBOR USD + 0.30%, 0.30% Floor, 6.50% Cap) | | | 5.15 | % | | | 12/25/2048 | | | | 4,573,057 | |
8,482,794 | | Federal National Mortgage Association REMICS, Series 2020-54-AS (-1 x 1 Month LIBOR USD + 6.15%, 6.15% Cap) | | | 1.30 | % (f)(h) | | | 08/25/2050 | | | | 1,065,309 | |
9,598,670 | | Federal National Mortgage Association REMICS, Series 2021-32-AI | | | 3.00 | % (f) | | | 05/25/2046 | | | | 1,162,994 | |
5,638,800 | | Federal National Mortgage Association REMICS, Series 2022-43-FA (Secured Overnight Financing Rate 30 Day Average + 0.55%, 0.55% Floor, 6.00% Cap) | | | 5.11 | % | | | 07/25/2052 | | | | 5,493,655 | |
21,151,897 | | Federal National Mortgage Association, Series 2019-M7-X | | | 0.33 | % (f)(g) | | | 04/25/2029 | | | | 339,560 | |
22,051,656 | | Federal National Mortgage Association, Series 2021-M8-X | | | 0.25 | % (f)(g) | | | 11/25/2035 | | | | 489,275 | |
23,523,190 | | Government National Mortgage Association, Series 2013-155-IB | | | 0.18 | % (f)(g) | | | 09/16/2053 | | | | 94,495 | |
8,015,865 | | Government National Mortgage Association, Series 2019-128-KS (-1 x 1 Month LIBOR USD + 2.85%, 2.85% Cap) | | | 0.00 | % (f)(h) | | | 10/20/2049 | | | | 131,593 | |
7,228,535 | | Government National Mortgage Association, Series 2020-104-SB (-1 x 1 Month LIBOR USD + 6.15%, 6.15% Cap) | | | 1.39 | % (f)(h) | | | 07/20/2050 | | | | 972,129 | |
21,126,036 | | Government National Mortgage Association, Series 2020-115-SA (-1 x 1 Month LIBOR USD + 4.20%, 4.20% Cap) | | | 0.00 | % (f)(h) | | | 08/20/2050 | | | | 963,717 | |
15,574,859 | | Government National Mortgage Association, Series 2020-115-YS (-1 x 1 Month LIBOR USD + 4.20%, 4.20% Cap) | | | 0.00 | % (f)(h) | | | 08/20/2050 | | | | 672,831 | |
32,535,679 | | Government National Mortgage Association, Series 2020-129-SA (-1 x 1 Month LIBOR USD + 3.75%, 3.75% Cap) | | | 0.00 | % (f)(h) | | | 09/20/2050 | | | | 857,204 | |
38,010,053 | | Government National Mortgage Association, Series 2020-146-IJ | | | 2.50 | % (f) | | | 10/20/2050 | | | | 4,655,103 | |
15,318,301 | | Government National Mortgage Association, Series 2020-189-SU (-1 x 1 Month LIBOR USD + 6.30%, 6.30% Cap) | | | 1.54 | % (f)(h) | | | 12/20/2050 | | | | 2,234,366 | |
12,914,686 | | Government National Mortgage Association, Series 2021-193-DS (-1 x Secured Overnight Financing Rate 30 Day Average + 2.60%, 2.60% Cap) | | | 0.00 | % (f)(h) | | | 11/20/2051 | | | | 93,212 | |
8,703,477 | | Government National Mortgage Association, Series 2021-1-SH (-1 x 1 Month LIBOR USD + 6.30%, 6.30% Cap) | | | 1.54 | % (f)(h) | | | 01/20/2051 | | | | 1,009,503 | |
29,414,058 | | Government National Mortgage Association, Series 2021-35-IO | | | 0.99 | % (f)(g) | | | 12/16/2062 | | | | 2,134,161 | |
| | | | | | | | | | | | | | |
Total US Government and Agency Mortgage Backed Obligations (Cost $90,675,490) | | | | | | | | | | | 76,915,206 | |
| | | | | | | | | | | | | | |
US Government and Agency Obligations - 3.4% | |
20,000,000 | | United States Treasury Notes | | | 3.13 | % | | | 08/15/2025 | | | | 19,630,078 | |
13,000,000 | | United States Treasury Notes | | | 3.13 | % | | | 08/31/2027 | | | | 12,718,672 | |
| | | | | | | | | | | | | | |
Total US Government and Agency Obligations (Cost $31,897,596) | | | | | | | | | | | 32,348,750 | |
| | | | | | | | | | | | | | |
Common Stocks - 0.0% (m) | |
1,098 | | Bright Bidco B.V. (i)(k) | | | | | | | | | | | 19,221 | |
15,376 | | Foresight Equity (i)(k) | | | | | | | | | | | 171,595 | |
3,553 | | Intelsat Emergence S.A. (i)(k) | | | | | | | | | | | 99,484 | |
| | | | | | | | | | | | | | |
Total Common Stocks (Cost $591,657) | | | | | | | | | | | 290,300 | |
| | | | | | | | | | | | | | |
Escrow Notes - 0.0% (m) | |
380,000 | | GCB Intelsat Jackson (i)(k) | | | | | | | | | | | – | |
400,000 | | Gulfport Energy Corporation (i) | | | | | | | | | | | 752 | |
| | | | | | | | | | | | | | |
Total Escrow Notes (Cost $-) | | | | | | | | | | | 752 | |
| | | | | | | | | | | | | | |
Rights - 0.0% (m) | |
372 | | Intelsat Jackson Holdings Ltd. - Series A (i)(k) | | | | | | | | | | | 2,976 | |
372 | | Intelsat Jackson Holdings Ltd. - Series B (i)(k) | | | | | | | | | | | 3,162 | |
| | | | | | | | | | | | | | |
Total Rights (Cost $-) | | | | | | | | | | | 6,138 | |
| | | | | | | | | | | | | | |
Warrants - 0.0% (m) | |
3,500 | | Avation PLC, Expiration 10/21/2026, Strike Price GBP 0.54 (i) | | | | | | | | | | | 2,699 | |
29,269 | | OAS S.A., Expiration 5/16/2039, Strike Price BRL 1.00 (i)(k) | | | | | | | | | | | – | |
| | | | | | | | | | | | | | |
Total Warrants (Cost $-) | | | | | | | | | | | 2,699 | |
| | | | | | | | | | | | | | |
Short Term Investments - 12.4% | |
16,835,784 | | First American Government Obligations Fund - Class U | | | 4.66 | % (j) | | | | | | | 16,835,784 | |
16,835,784 | | JP Morgan U.S. Government Money Market Fund - Institutional Share Class | | | 4.73 | % (j) | | | | | | | 16,835,784 | |
16,835,784 | | Morgan Stanley Institutional Liquidity Funds Government Portfolio - Institutional Share Class | | | 4.74 | % (j) | | | | | | | 16,835,784 | |
16,400,000 | | United States Treasury Bills | | | 0.00 | % | | | 04/20/2023 | | | | 16,364,047 | |
26,700,000 | | United States Treasury Bills | | | 0.00 | % | | | 07/13/2023 | | | | 26,349,972 | |
20,000,000 | | United States Treasury Bills | | | 0.00 | % | | | 07/25/2023 | | | | 19,707,064 | |
5,000,000 | | United States Treasury Bills | | | 0.00 | % | | | 11/02/2023 | | | | 4,867,240 | |
| | | | | | | | | | | | | | |
Total Short Term Investments (Cost $117,890,403) | | | | | | | | | | | 117,795,675 | |
| | | | | | | | | | | | | | |
Total Investments - 98.3% (Cost $1,072,968,092) | | | | | | | | | | | 930,966,707 | |
Other Assets in Excess of Liabilities - 1.7% | | | | | | | | | | | 15,682,229 | |
| | | | | | | | | | | | | | |
NET ASSETS - 100.0% | | | | | | | | | | $ | 946,648,936 | |
| | | | | | | | | | | | | | |
We have audited the accompanying statements of assets and liabilities, including the schedules of investments – summary, of DoubleLine Total Return Bond Fund, DoubleLine Core Fixed Income Fund, DoubleLine Shiller Enhanced CAPE®, and DoubleLine Flexible Income Fund (four of the funds constituting DoubleLine Funds Trust, hereafter collectively referred to as the “Funds”) as of March 31, 2023, the related statements of operations for the year ended March 31, 2023, the statements of changes in net assets for each of the two years in the period ended March 31, 2023, including the related notes, and the financial highlights for each of the periods indicated therein (included in Item 1 of this Form N-CSR) and the schedule of investments (included in Item 6 of this Form N-CSR) as of March 31, 2023 (collectively referred to as the “financial statements”). In our opinion, the financial statements present fairly, in all material respects, the financial position of each of the Funds as of March 31, 2023, the results of each of their operations for the year then ended, the changes in each of their net assets for each of the two years in the period ended March 31, 2023, and each of the financial highlights for each of the periods indicated therein, in conformity with accounting principles generally accepted in the United States of America.
These financial statements are the responsibility of the Fund’s management. Our responsibility is to express an opinion on the Funds’ financial statements based on our audits. We are a public accounting firm registered with the Public Company Accounting Oversight Board (United States) (PCAOB) and are required to be independent with respect to the Fund in accordance with the U.S. federal securities laws and the applicable rules and regulations of the Securities and Exchange Commission and the PCAOB.
We conducted our audits of these financial statements in accordance with the standards of the PCAOB. Those standards require that we plan and perform the audit to obtain reasonable assurance about whether the financial statements are free of material misstatement, whether due to error or fraud.
Our audits included performing procedures to assess the risks of material misstatement of the financial statements, whether due to error or fraud, and performing procedures that respond to those risks. Such procedures included examining, on a test basis, evidence regarding the amounts and disclosures in the financial statements. Our audits also included evaluating the accounting principles used and significant estimates made by management, as well as evaluating the overall presentation of the financial statements. Our procedures included confirmation of securities owned as of March 31, 2023 by correspondence with the custodian and brokers; when replies were not received from brokers, we performed other auditing procedures. We believe that our audits provide a reasonable basis for our opinions.
We have served as the auditor of one or more investment companies in the DoubleLine Investment Company Complex since 2010.
PricewaterhouseCoopers LLP, 601 South Figueroa Street, Suite 900, Los Angeles, California 90017 T: (213) 356 6000, www.pwc.com/us
(b) Not Applicable.
There have been no material changes to the procedures by which shareholders may recommend nominees to the Registrant’s board of trustees.
(4) Change in the Registrant’s independent public accountant. There was no change in the Registrant’s independent public accountant for the period covered by this report.
Pursuant to the requirements of the Securities Exchange Act of 1934 and the Investment Company Act of 1940, the Registrant has duly caused this report to be signed on its behalf by the undersigned, thereunto duly authorized.
Pursuant to the requirements of the Securities Exchange Act of 1934 and the Investment Company Act of 1940, this report has been signed below by the following persons on behalf of the Registrant and in the capacities and on the dates indicated.